MASIMO CORP
10-Ks and 10-Qs
|
|
|
|
|
|
|
|
|
|
|
|
|
|
|
|
|
|
|
|
|
|
|
|
|
|
|
|
|
|
|
|
|
|
|
|
|
|
|
|
|
|
|
|
|
|
|
UNITED STATES
SECURITIES AND EXCHANGE COMMISSION
WASHINGTON, D.C. 20549
________________________________________________
FORM 10-K
________________________________________________________________________
(Mark One)
|
ý
|
ANNUAL REPORT PURSUANT TO SECTION 13 OR 15(D) OF THE SECURITIES EXCHANGE ACT OF 1934
|
For the fiscal year ended
December 31, 2016
or
|
¨
|
TRANSITION REPORT PURSUANT TO SECTION 13 OR 15(D) OF THE SECURITIES EXCHANGE ACT OF 1934
|
Commission File Number 001-33642
________________________________________________

|
Masimo Corporation
|
|
(Exact name of registrant as specified in its charter)
|
________________________________________________
|
Delaware
|
33-0368882
|
|
|
(State or Other Jurisdiction of Incorporation or Organization)
|
(I.R.S. Employer Identification Number)
|
|
|
52 Discovery, Irvine, California
|
92618
|
|
|
(Address of Principal Executive Offices)
|
(Zip Code)
|
|
(949) 297-7000
(Registrant’s telephone number, including area code)
_________________________________________________________
Securities registered pursuant to Section 12(b) of the Act:
|
Title of each class:
|
Name of each exchange on which registered:
|
|
|
Common Stock, par value $0.001
|
The NASDAQ Global Select Market
|
|
Securities registered pursuant to Section 12(g) of the Act: None
________________________________________________
Indicate by check mark if the registrant is a well-known seasoned issuer, as defined in Rule 405 of the Securities Act. Yes
ý
No
¨
Indicate by check mark if the registrant is not required to file reports pursuant to Section 13 or Section 15(d) of the Act. Yes
¨
No
ý
Indicate by check mark whether the registrant (1) has filed all reports required to be filed by Section 13 or 15(d) of the Securities Exchange Act of 1934 during the preceding 12 months (or for such shorter period that the registrant was required to file such reports), and (2) has been subject to such filing requirements for the past 90 days. Yes
ý
No
¨
Indicate by check mark whether the registrant has submitted electronically and posted on its corporate Web site, if any, every Interactive Data File required to be submitted and posted pursuant to Rule 405 of Regulation S-T during the preceding 12 months (or for such shorter period that the registrant was required to submit and post such files). Yes
ý
No
¨
Indicate by check mark if disclosure of delinquent filers pursuant to Item 405 of Regulation S-K is not contained herein, and will not be contained, to the best of the registrant’s knowledge, in definitive proxy or information statements incorporated by reference in Part III of this Form 10-K or any amendment to this Form 10-K.
ý
Indicate by check mark whether the registrant is a large accelerated filer, an accelerated filer, a non-accelerated filer or a smaller reporting company. See the definitions of “large accelerated filer,” “accelerated filer” and “smaller reporting company” in Rule 12b-2 of the Exchange Act (Check one).
|
Large accelerated filer
|
ý
|
Accelerated filer
|
¨
|
Non accelerated filer
|
¨
|
Smaller reporting company
|
¨
|
||||||||
|
|
(Do not check if a smaller reporting company)
|
||||||||||||||
Indicate by check mark whether the registrant is a shell company (as defined in Rule 12b-2 of the Exchange Act). Yes
¨
No
ý
The aggregate market value of the voting stock held by non-affiliates of the registrant, based upon the closing sale price of the common stock on July 2, 2016 the last business day of the registrant’s most recently completed second fiscal quarter, as reported on the NASDAQ Global Select Market, was approximately
$1,592.8 million
. Shares of stock held by officers, directors and 5 percent or more stockholders have been excluded in that such persons may be deemed to be affiliates. This determination of affiliate status is not necessarily a conclusive determination for other purposes. At
January 31, 2017
, the registrant had
50,419,060
shares of common stock outstanding.
DOCUMENTS INCORPORATED BY REFERENCE
Items 10, 11, 12, 13 and 14 of Part III of this Annual Report on Form 10-K incorporate information by reference from the registrant’s proxy statement for the registrant’s
2017
Annual Meeting of Stockholders to be filed with the Securities and Exchange Commission within 120 days after the close of the fiscal year covered by this annual report on Form 10-K.
MASIMO CORPORATION
FISCAL YEAR
2016
FORM 10-K ANNUAL REPORT
TABLE OF CONTENTS
|
Page
|
||
|
Item 1
|
||
|
Item 1A
|
||
|
Item 1B
|
||
|
Item 2
|
||
|
Item 3
|
||
|
Item 4
|
||
|
Item 5
|
||
|
Item 6
|
||
|
Item 7
|
||
|
Item 7A
|
||
|
Item 8
|
||
|
Item 9
|
||
|
Item 9A
|
||
|
Item 9B
|
||
|
Item 10
|
||
|
Item 11
|
||
|
Item 12
|
||
|
Item 13
|
||
|
Item 14
|
||
|
Item 15
|
||
|
Item 16
|
||
FORWARD-LOOKING STATEMENTS
This Annual Report on Form 10-K contains “forward-looking statements” that involve risks and uncertainties, as well as assumptions that, if they never materialize or prove incorrect, could cause our results to differ materially and adversely from those expressed or implied by such forward-looking statements. The forward-looking statements are contained principally in Item 1—“Business,” Item 1A—“Risk Factors” and Item 7—“Management’s Discussion and Analysis of Financial Condition and Results of Operations” but appear throughout this Annual Report on Form 10-K. Examples of forward-looking statements include, but are not limited to, any projection or expectation of earnings, revenue or other financial items; the plans, strategies and objectives of management for future operations; factors that may affect our operating results, including accounting and tax estimates; our success in pending litigation; new products or services; the demand for our products; our ability to consummate acquisitions and successfully integrate them into our operations; future capital expenditures; effects of current or future economic conditions or performance; industry trends and other matters that do not relate strictly to historical facts or statements of assumptions underlying any of the foregoing. These statements are often identified by the use of words such as “anticipate,” “believe,” “continue,” “could,” “estimate,” “expect,” “intend,” “may,” “ongoing,” “opportunity,” “plan,” “potential,” “predicts,” “seek,” “should,” “will,” or “would,” and similar expressions and variations or negatives of these words. These forward-looking statements are based on the expectations, estimates, projections, beliefs and assumptions of our management based on information currently available to management, all of which is subject to change. Such forward-looking statements are subject to risks, uncertainties and other factors that are difficult to predict and could cause our actual results and the timing of certain events to differ materially and adversely from future results expressed or implied by such forward-looking statements. Factors that could cause or contribute to such differences include, but are not limited to, those identified below, and those discussed under Item 1A—“Risk Factors” in this Annual Report on Form 10-K. Furthermore, such forward-looking statements speak only as of the date of this Annual Report on Form 10-K. We undertake no obligation to update or revise publicly any forward-looking statements to reflect events or circumstances after the date of such statements for any reason, except as otherwise required by law.
A non-GAAP financial measure for “Adjusted Product Gross Profit” is contained herein as a supplement to product gross profit, the corresponding financial measure prepared in accordance with U.S. generally accepted accounting principles (GAAP). Management has provided this information to assist investors in gaining a better understanding of the effects of the deconsolidation of Masimo’s variable interest entity, Cercacor, effective as of January 3, 2016, and the impact on period-to-period operating results. Investors should consider this non-GAAP financial measure in addition to, and not as a substitute for, or as superior to, product gross profit prepared in accordance with GAAP. A reconciliation of GAAP product gross profit to adjusted product gross profit is also contained herein.
|
ITEM 1.
|
BUSINESS
|
Overview
We are a global medical technology company that develops, manufactures and markets a variety of noninvasive monitoring technologies. We provide our products directly and through distributors and original equipment manufacturers (OEM) partners to hospitals, emergency medical service (EMS) providers, long-term care facilities, physician offices, veterinarians and consumers. Our mission is to improve patient outcomes and reduce the cost of care by taking noninvasive monitoring to new sites and applications
™
. We were incorporated in California in May 1989 and reincorporated in Delaware in May 1996.
Our core business is Measure-through Motion and Low Perfusion
™
pulse oximetry monitoring, known as Masimo Signal Extraction Technology
®
(SET
®
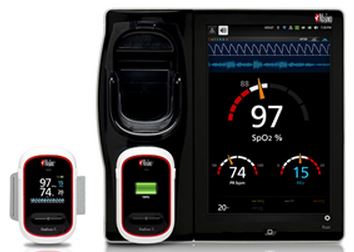
) pulse oximetry. Our product offerings have expanded significantly over the years to also include noninvasive monitoring of blood constituents with an optical signature, optical organ oximetry monitoring, electrical, brain function monitoring, acoustic respiration monitoring and exhaled gas monitoring. In addition, we have developed the Root
®
patient monitoring and connectivity platform, the Radical-7
®
bedside and portable patient monitor and the Radius-7
®
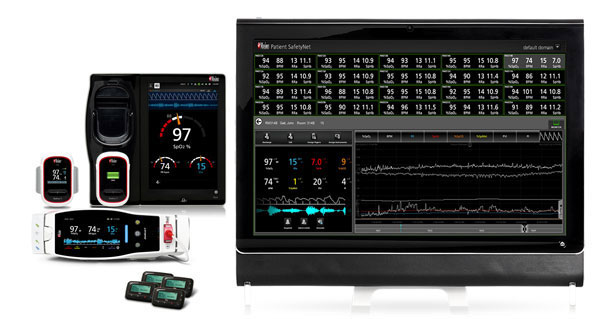
wearable wireless patient monitor. We have also developed the Patient SafetyNet
1
remote patient surveillance monitoring system, which currently allows up to
200
patients to be monitored and viewed simultaneously and remotely through a PC-based monitor or by care providers through their pagers, voice-over-IP phones or smartphones.
Our solutions and related products are based upon our proprietary Masimo SET
®
and rainbow
®
algorithms. These technologies are incorporated into a variety of product platforms depending on our customers’ specifications. In addition, we provide our technologies to OEMs in a form factor that is easy to integrate into their patient monitors, defibrillators, infant incubators and other devices.
____________________________
1
The use of the trademark Patient SafetyNet is under license from the University HealthSystem Consortium.
1
Our technology is supported by a substantial intellectual property portfolio that we have built through internal development and, to a lesser extent, acquisitions and license agreements. We have also exclusively licensed from Cercacor Laboratories, Inc. (Cercacor) the right to certain OEM rainbow
®
technologies and to incorporate certain rainbow
®
technology into our products intended to be used by professional caregivers, including, but not limited to, hospital caregivers and alternate care facility caregivers.
Conventional Pulse Oximetry
Pulse oximetry enables the noninvasive measurement of the oxygen saturation level of arterial blood, which delivers oxygen to the body’s tissues. Pulse oximetry also measures pulse rate, which, when measured by electrocardiogram (ECG), is called heart rate. Pulse oximeters use sensors attached to an extremity, typically the fingertip or certain core body sites. These sensors contain two light emitting diodes that transmit red and infrared light from one side of the extremity through the tissue to a photodetector on the other side of the extremity. The photodetector in the sensor measures the amount of red and infrared light absorbed by the tissue. A microprocessor then analyzes the changes in light absorption to provide a continuous, real-time measurement of the amount of oxygen in the patient’s arterial blood. Pulse oximeters typically give audio and visual alerts, or alarms, when the patient’s arterial blood oxygen saturation level or pulse rate falls outside of a user-designated range. As a result, clinicians have the opportunity to assess patients who may need immediate treatment to prevent the serious clinical consequences of hypoxemia, or low oxygen saturation levels, and hyperoxemia, or high oxygen levels.
As one of the most common measurements taken in and out of hospitals around the world, pulse oximetry has gained widespread clinical acceptance as a standard patient vital sign measurement because it can give clinicians a warning of low arterial blood oxygen saturation levels, known as hypoxemia. Monitoring of oxygen saturation is critical because hypoxemia can lead to a lack of oxygen in the body’s tissues, which can result in organ damage or death. Pulse oximeters are used primarily in critical care settings, including surgery, recovery rooms, intensive care units (ICUs), emergency departments, general care floors and alternative care settings, such as long-term care facilities, and for home monitoring of patients with chronic conditions.
Clinicians also use pulse oximeters to monitor oxygen saturation in premature babies to ensure that the saturation levels are targeted appropriately. In premature babies, oxygen saturation levels above clinically accepted limits may lead to a condition known as Retinopathy of Prematurity (ROP), which could lead to permanent eye damage or blindness if left untreated. By ensuring that oxygen saturation levels in babies remain within clinically accepted limits, clinicians believe they can lower the incidence of ROP.
Conventional pulse oximetry has limitations that can reduce its effectiveness and the quality of patient care. In particular, when using conventional pulse oximetry, oxygen saturation measurements can be distorted by motion artifact, or patient movement, and low perfusion, or low arterial blood flow at the measurement site. Motion artifact can cause conventional pulse oximeters to inaccurately measure the arterial blood oxygen saturation level, due mainly to the effect of movement induced pulsations of venous blood, which is at a lower oxygen saturation. Low perfusion can also cause conventional pulse oximeters to report inaccurate measurements or, in some cases, no measurement at all. Additionally, conventional pulse oximeters cannot distinguish oxygenated hemoglobin, or the component of red blood cells carrying oxygen, from dysfunctional hemoglobins, which are hemoglobins bound to with carbon monoxide (carboxyhemoglobin) or to nitric oxide (methemoglobin) in the blood, thereby reducing the oxygen carrying capacity of the blood. Furthermore, conventional pulse oximetry readings can also be impacted by bright light and electrical interference from the presence of electrical surgical equipment.
Independent research has shown that over 70% of the alarms outside the operating room are false when using conventional pulse oximetry. In addition, conventional pulse oximeters can fail to give accurate measurements in the operating room due to weak physiological signals or low perfusion. Manufacturers of conventional pulse oximeters have attempted to address some of these limitations with varying degrees of success. Some competing devices have attempted to minimize the observed effects of motion artifact by repeating the last measurement before motion artifact is detected, until a new, clean signal is detected and a new measurement can be displayed, known as freezing values. Other competing devices increase the averaging time during motion, known as long averaging, in an attempt to reduce the observed effect of motion on their measurements. Still other competing devices extend the audible alarm notification delay, which reduces the awareness of inaccurate measurements. These competing solutions, commonly referred to as “motion tolerant” or “alarm management” techniques, mask the limitations of conventional pulse oximetry. Several published studies have demonstrated that these also contribute to increased occurrences of undetected true alarms, or events where hypoxemia occurs, but is not detected by the pulse oximeter.
Conventional pulse oximetry technology also has several practical limitations. Because the technology cannot consistently measure oxygen saturation levels of arterial blood in the presence of motion artifact or low perfusion, conventional pulse oximetry is limited in non-critical care settings of the hospital, such as general care areas, where the hospital staff-to-patient ratio is significantly lower and the staff has lower tolerance for false alarms. In addition, two-wavelength pulse oximeters
2
cannot distinguish oxygenated hemoglobin from dyshemoglobin, including the most prevalent forms of carboxyhemoglobin and methemoglobin. As a result of these dyshemoglobins, pulse oximeters will report falsely high oxygen levels when they are present in the blood.
Masimo SET
®
Pulse Oximetry
Masimo SET
®
was designed to overcome the primary limitations of conventional pulse oximetry by maintaining accuracy in the presence of motion artifact, low perfusion and weak signal-to-noise situations. Our Masimo SET
®
platform, which became available to hospitals in the U.S. in 1998, is the basis of our pulse oximetry products and we believe represented the first significant technological advancement in pulse oximetry since its introduction in the early 1980s. Masimo SET
®
utilizes five signal processing algorithms, four of which are proprietary, in parallel to deliver high sensitivity and specificity in the measurement of arterial blood oxygen saturation levels. Sensitivity is the ability to detect true events and specificity is the ability to reject false alarms. One of our proprietary processing algorithms, Discrete Saturation Transform
®
, separates the signal from noise in real time through the use of adaptive filtering and an iterative sampling technique that tests each possible saturation value for validity. Masimo SET
®
signal processing can therefore identify the venous blood and other noise, isolate them, and extract the arterial signal.
The performance of Masimo SET
®
pulse oximetry has been evaluated in more than 100 independent studies and thousands of clinical evaluations. We believe that Masimo SET
®
is trusted by clinicians to safely monitor in excess of approximately 100 million patients each year and has been chosen as the primary, if not the only, pulse oximeter technology used by seventeen of the twenty hospitals on the U.S. News & World Report Best Hospitals Honor Roll for the 2016-2017 year. Compared to conventional pulse oximeters, during patient motion and low perfusion, Masimo SET® provides measurements when other pulse oximeters cannot, dramatically reduces false alarms (improved specificity), and accurately detects true alarms (improved sensitivity) that can indicate a hypoxic event in a patient. Clinical studies have shown that the use of Masimo SET
®
pulse oximetry in conjunction with modified clinical protocols has helped clinicians reduce retinopathy of prematurity in neonates and improve screening for newborns with critical congenital heart disease (CCHD). Clinical studies have also shown a reduction in rapid response activations and ICU transfers when Masimo SET
®
is used to monitor patients continuously in medical-surgical units. Additionally, researchers have studied and found reduced ventilator weaning time and arterial blood gas measurements in the ICU.
Our pulse oximetry technology is contained on a circuit board which is placed inside a standalone pulse oximetry monitor, placed inside OEM multiparameter monitors, or included as part of an external “Board-in-Cable” solution that is plugged into a port on an OEM or other device. All of these solutions use our proprietary single-patient-use or reusable sensors and cables. We sell our products to end users through our direct sales force and certain distributors, as well as to our OEM partners, for incorporation into their products. In 2013, we also began selling our pulse oximetry products in the consumer market. As of
December 31, 2016
, we estimate that the worldwide installed base of our pulse oximeters and OEM monitors that incorporate Masimo SET
®
and rainbow SET
™
was more than
1,504,000
units, excluding handheld devices. Our installed base is the primary driver for the recurring sales of our pulse oximeter and Pulse CO-Oximeter
®
sensors, most notably, single-patient adhesive sensors.
To complement our Masimo SET
®
platform, we have developed a wide range of proprietary single-patient (disposable) and multi-patient (reusable) sensors, cables and other accessories designed specifically to work with Masimo SET
®
software and hardware. Our single-patient use sensors offer several advantages over reusable sensors, including improved performance, cleanliness, increased comfort and greater reliability. In addition, our neonatal adhesive sensors have been designed to exhibit greater durability compared to competitive sensors. Although our technology platforms operate solely with our proprietary sensor lines, our sensors have the capability to work with certain competitive pulse oximetry monitors through the use of adapter cables.
Adhesive sensors are single-patient use items, but the U.S. Food and Drug Administration (FDA) allows third parties to reprocess pulse oximetry sensors. In response to some hospitals’ requests to implement environmentally friendly or “green” products, we offer sensor reprocessing as well as sensor recycling programs.
Masimo rainbow
SET
™
Platform
Since introducing Masimo SET
®
, we have continued to innovate by introducing noninvasive measurements that go beyond arterial blood oxygen saturation and pulse rate. In 2005, we introduced the Masimo rainbow SET
™
platform, leveraging our Masimo SET
®
technology and incorporating licensed rainbow
®
technology to enable real-time monitoring of additional noninvasive measurements. Our rainbow SET
™
platform includes our rainbow SET
™
Pulse CO-Oximetry products, which we believe are the first devices cleared by the FDA to noninvasively and continuously monitor additional hemoglobin species using multiple wavelengths of light, which was previously possible only through intermittent invasive procedures. In addition to monitoring oxygen saturation (SpO
2
), pulse rate (PR), perfusion index (Pi), Pleth Variability Index (PVi
®
) and Respiration Rate
3
from the Pleth (RRp
™
), rainbow
®
Pulse CO-Oximetry has the unique ability to measure and distinguish oxygenated hemoglobins from the dysfunctional hemoglobins that are incapable of transporting oxygen, carboxyhemoglobin saturation (SpCO
®
) and methemoglobin saturation (SpMet
®
), which allows for the noninvasive and continuous monitoring of total hemoglobin concentration (SpHb
®
). The Masimo rainbow SET
™
platform also allows for monitoring of arterial oxygen saturation, even under the presence of carboxyhemoglobin and methemoglobin, known as fractional arterial oxygen saturation (SpfO
2
™
) on certain sensors. Additionally, the rainbow SET
™
platform also allows for the calculation of Oxygen Content (SpOC
™
) and Oxygen Reserve Index
™
(ORi
™
). Although RRp
™
, SpfO
2
™
and ORi
™
have received CE Mark, they are not currently available for sale in the U.S.
We have also developed multi-wavelength sensors that have the ability to monitor multiple measurements with a single sensor. We believe that the use of Masimo rainbow
®
Pulse CO-Oximetry products will become widely adopted for the noninvasive monitoring of these measurements. We also believe that the addition of Acoustic Respiration Rate (RRa
®
) with our rainbow Acoustic Monitoring
®
technology for noninvasive and continuous monitoring will strengthen the clinical demand for the rainbow
®
platform, especially in the growing general floor market.
Products with our MX circuit board contain our Masimo SET
®
pulse oximetry technology as well as circuitry to support rainbow
®
measurements. At the time of purchase, or at any time in the future, our customers and our OEMs’ customers have the option of purchasing additional rainbow
®
software measurements, which will allow the customer to expand their patient monitoring systems to monitor incremental measurements with a cost-effective solution. To date, over
thirty-four
companies have released rainbow SET
™
equipped products or announced rainbow
®
integration plans.
SpHb
®
Hemoglobin is the oxygen-carrying component of red blood cells (RBCs). Hemoglobin measurement is one of the most frequent invasive laboratory measurements in the world, and is often measured as part of a complete blood count (CBC), which measures multiple other blood components. A low hemoglobin status is a condition called anemia. As a chronic disorder, anemia can be treated by iron supplements, diet changes or drugs that increase the production of RBCs. As an acute disorder, anemia due to bleeding requires either stoppage of the bleeding or a blood transfusion in order to sustain organ function and life.
SpHb
®
is available as a continuous monitor or a spot-check measurement. Continuous SpHb
®
monitoring provides real-time visibility into hemoglobin levels and the changes, or lack of changes, in hemoglobin levels, which can otherwise only be measured through intermittent, invasive blood testing. SpHb
®
monitoring is not intended to be used as the sole basis for making diagnosis or treatment decisions, but continuous SpHb
®
monitoring, may help clinicians trend hemoglobin in real time between invasive blood samples.
SpOC
™
SpOC
™
provides a more complete picture of a patient’s oxygenation status by combining noninvasive measurements of both hemoglobin and oxygen saturation levels into a single calculation.
SpCO
®
Carbon monoxide (CO) is a colorless, odorless and tasteless gas that is undetectable by humans and is often unknowingly inhaled from combustion fumes, or during fires by victims and first responders. CO poisoning is the leading cause of accidental poisoning death in the U.S., responsible for up to 50,000 emergency department visits and 500 unintentional deaths annually. CO, when bound to hemoglobin cells, prevents the hemoglobin cells from carrying oxygen, and elevated levels may cause severe neurological damage, permanent heart damage or death. Screening for elevated CO levels in the emergency department is critical as symptoms of CO poisoning in patients may be misdiagnosed because such symptoms are similar to the flu.
CO levels in the blood can be measured using a laboratory CO-Oximeter, which requires a patient or a patient’s blood sample to be transported to a hospital with laboratory CO-Oximetry capability. Additional delays occur if a patient needs hyperbaric oxygen therapy, which often requires transfer to yet another medical center with hyperbaric capability. Outside the hospital, laboratory measurements of carboxyhemoglobin are not considered feasible. Historically, this meant that CO levels in the blood could not be assessed in environments in which it would be very useful, such as in the home of a patient or in the medical evaluation of first responders exposed at the scene of a fire.
We believe that the greatest opportunity for SpCO
®
monitoring is in the EMS, fire and hospital emergency department settings, since elevated SpCO
®
levels may help indicate a need for invasive testing in patients with headaches. While SpCO
®
is not intended to replace invasive carboxyhemoglobin tests, when used with other clinical variables, SpCO
®
may help clinicians identify elevated CO levels and help determine additional test and treatment options. Over the past few years, multiple leading
4
emergency first responder associations, including the National Association of Emergency Medical Technicians, the National Association of EMS Educators, the International Association of Fire Fighters and the International Association of Fire Chiefs, have been educating their members on the benefits of noninvasive CO measurement when exposure is suspected or when an individual presents symptoms that could indicate elevated CO levels. In 2015, the National Fire Protection Association (NFPA), one of the world’s authoritative sources on fire prevention and public safety, released updated Fire Rehabilitation Standard 1584,
Standard on the Rehabilitation Process for Members During Emergency Operations and Training Exercises
, requiring firefighters exposed to smoke at incident scenes and during training to be assessed for elevated CO levels.
SpMet
®
Methemoglobin in the blood leads to a dangerous condition known as methemoglobinemia, which occurs as a reaction to some common drugs used in hospitals and outpatient procedures. Methemoglobinemia reduces the amount of oxygen bound to hemoglobin for delivery to tissues and forces normal hemoglobin to bind more tightly to oxygen, releasing less oxygen to the tissues. Methemoglobinemia may go unrecognized or diagnosed late, increasing risk to the patient. Commonly prescribed drugs can introduce methemoglobin into the blood and cause methemoglobinemia. Some of the 30 drugs that are known to cause methemoglobinemia are benzocaine, a local anesthetic, which is routinely used in procedures ranging from endoscopy to surgery; inhaled nitric oxide, routinely used in the Neonatal Intensive Care Unit; nitroglycerin, used to treat cardiac patients, and dapsone, used to treat infections for immune-deficient patients, such as HIV patients. Warnings, cautions and alerts regarding the clinical significance and prevalence of methemoglobinemia have been generated by the FDA, the Veterans Administration, the Institute for Safe Medication Practices and the National Academy of Clinical Biochemistry. The American Academy of Pediatrics recommends monitoring methemoglobin levels in infants who receive nitric oxide therapy.
While SpMet
®
is not intended to replace invasive methemoglobin tests, when used with other clinical variables, SpMet
®
may help clinicians identify elevated methemoglobin levels and help determine additional test and treatment options.
PVi
®
Pleth Variability Index (PVi
®
) is a measure of the dynamic changes in the Pi that occur during the respiratory cycle. The calculation is accomplished by measuring changes in Pi over a time interval where one or more complete respiratory cycles have occurred. PVi
®
is displayed as a percentage. The lower the number, the less variability there is in the Pi over a respiratory cycle. PVi
®
may show changes that reflect physiologic factors such as vascular tone, circulating blood volume and intrathoracic pressure excursions. When used with other clinical variables, PVi
®
may help clinicians assess fluid responsiveness in surgical and intensive care patients who are mechanically ventilated, and help determine other treatment options.
RRp
™
Respiration rate is defined as the number of breaths per minute. Changes in respiration rate provide an early warning sign of deterioration in patient condition. A low respiration rate is indicative of respiratory depression and high respiration rate is indicative of patient distress. Current methods to monitor respiration rate include end tidal CO
2
monitoring, which requires a nasal cannula to be inserted in the patient’s nose and therefore has low patient compliance, and impedance monitoring, which is considered unreliable. RRp
™
allows clinicians to noninvasively and continuously measure and monitor respiration rate using a standard Masimo SET
®
pulse oximetry or rainbow
®
Pulse CO-Oximeter
®
sensor. The RRp
™
measurement is determined by the variations in the plethysmograph waveform due to respiration, although the measurement is not possible in all patients or conditions and may not immediately indicate changes in respiration rate. RRp
™
has received CE Mark, but is not currently available for sale in the U.S. for medical use. RRp
™
is available in the U.S. as part of our MightySat
™
fingertip pulse oximeter for use by consumers for general health and wellness purposes.
RRa
®
Our sound-based monitoring technology, rainbow Acoustic Monitoring
®
(RAM
™
), enables RRa
®
and provides continuous and noninvasive monitoring of respiration rate. For patients requiring accurate and sensitive respiration rate monitoring, we believe that RRa
®
better detects pauses in breathing than respiration rate measurements from other capnography technologies. The RRa
®
measurement also provides an important visual indication of breathing through the displayed acoustic waveform. Multiple clinical studies have shown that the noninvasive measurement of RRa
®
provides as good or better respiration rate monitoring accuracy as end tidal CO
2
monitoring, and can reliably detect respiratory pause episodes, defined as a cessation of breathing for 30 seconds or more. When used with other clinical variables, RRa
®
may help clinicians assess respiratory depression and respiratory distress earlier and more often to help determine treatment options and potentially enable earlier interventions.
5
SpfO
2
™
Prior to our debut of SpfO
2
™
in October 2012, pulse oximeters could only measure and display functional oxygen saturation (SpO
2
). Therefore, when patients had elevated carboxyhemoglobin and/or elevated methemoglobin (negative reaction to more than 30 common drugs used in hospitals, like caines, nitrates and dapsone), the displayed
functional
oxygen saturation overestimated the actual oxygen saturation value. SpfO
2
™
, or
fractional
oxygen saturation, allows more precise arterial oxygenation assessment in patients with elevated dyshemoglobins, common throughout the hospital and pre-hospital setting, compared to
functional
oxygen saturation, and may also allow earlier interventions and more timely therapeutic decisions. SpfO
2
™
has received CE Mark, but is not currently available for sale in the U.S.
ORi
™
Oxygen Reserve Index
™
(ORi
™
) provides real-time visibility to oxygenation status in moderate hyperoxic range, which we define as a patient’s oxygen “reserve”. ORi
™
can be trended and has optional alarms to notify clinicians of changes in a patient’s oxygen reserve. When this technology is used with oxygen saturation (SpO
2
) monitoring, ORi
™
may extend the continuous and noninvasive visibility of a patient’s oxygen status into ranges previously unmonitored in this fashion. ORi
™
may also be of value in patients receiving supplemental oxygen, such as those in surgery, under conscious sedation, or in the ICU, as ORi
™
is represented as an “index” parameter with a unit-less scale between 0.00 and 1.00. Furthermore, ORi
™
may provide an advance warning of an impending hypoxic state, or an indication of an unintended hyperoxic state, when evaluated in conjunction with the partial pressure of oxygen (PaO
2
). In this way, ORi
™
may enable proactive interventions to avoid hypoxia and unintended hyperoxia. ORi
™
has received CE Mark, but is not currently available for sale in the U.S.
Noninvasive Measurements and Technologies
Following the introduction of our rainbow SET
™
platform, we have continued to expand our technology offerings by introducing additional noninvasive measurements and technologies to create new market opportunities in both the hospital and non-hospital care settings.
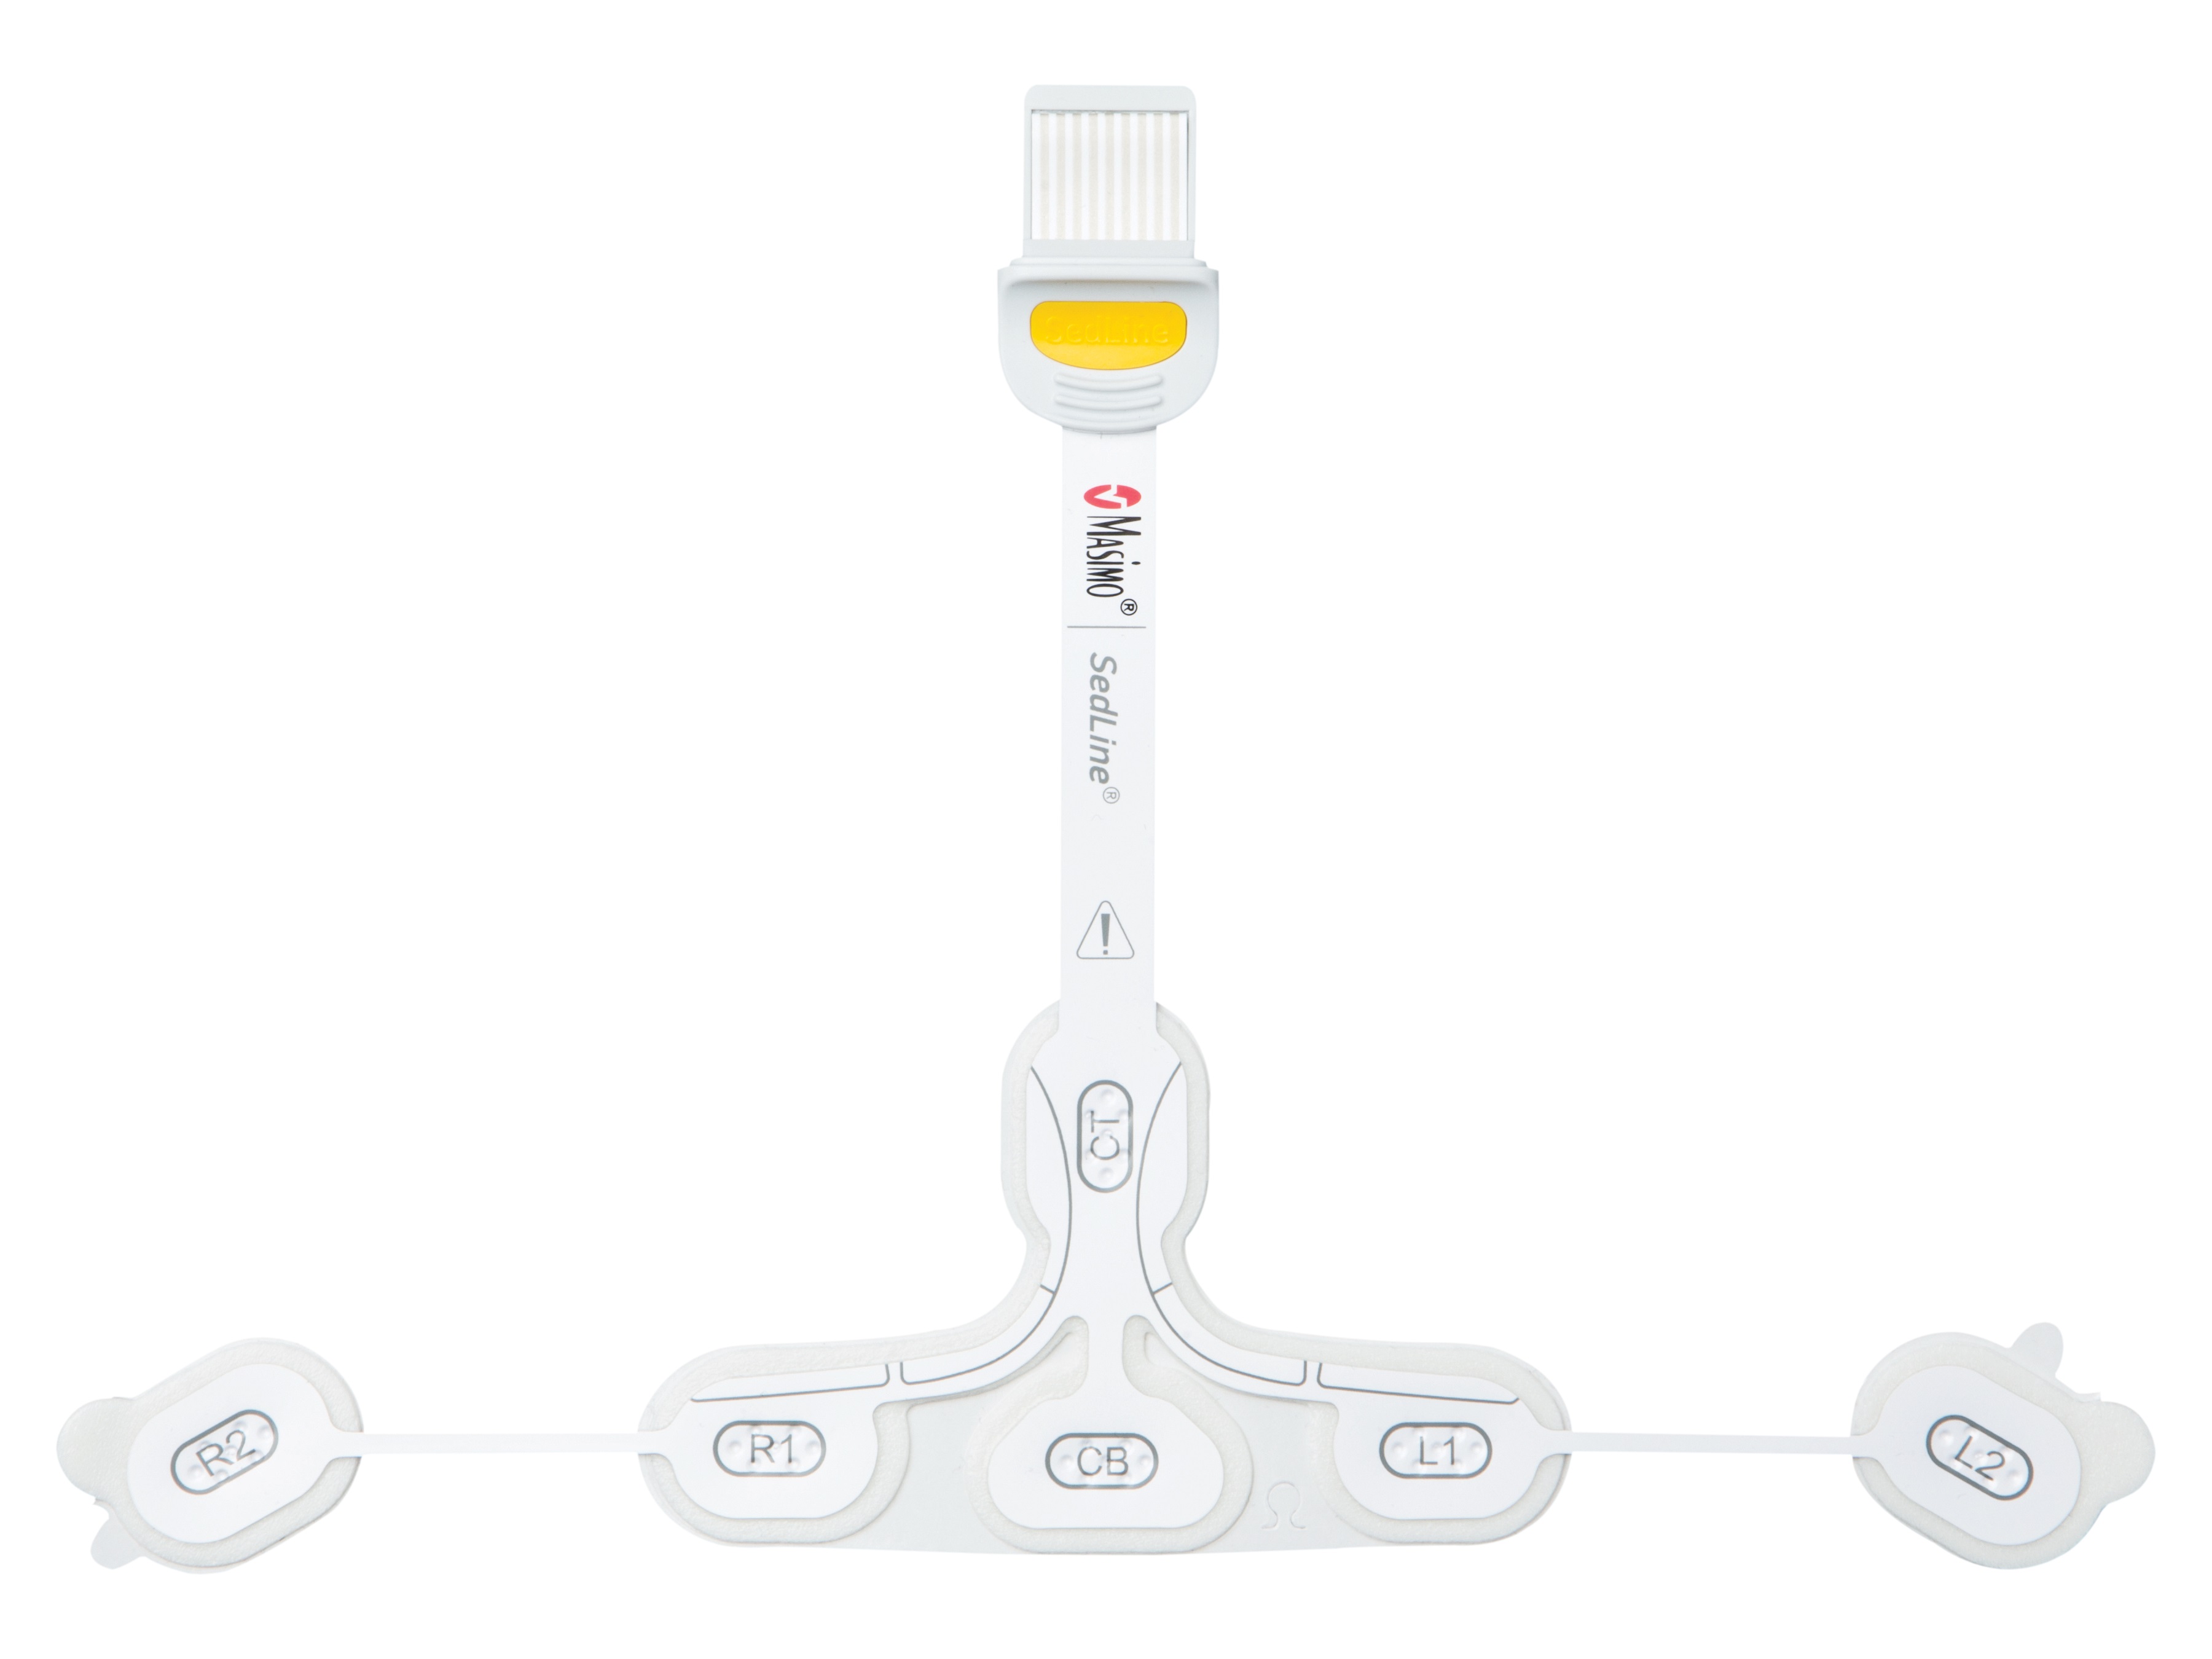
SedLine
®
Brain Function Monitoring
Brain function monitoring is most commonly used during surgery to help clinicians avoid over-titration and under-titration of anesthesia and sedation. SedLine
®
brain function monitoring technology measures the brain’s electrical activity by detecting EEG signals. In contrast to whole-scalp EEG monitoring, which is used for diagnostic purposes, this form of EEG monitoring is often referred to as processed EEG monitoring, or brain function monitoring. Brain function monitors display the patient’s EEG waveforms, but these may be difficult for clinicians to interpret, so the EEG signals are processed and displayed as a single number called Patient State Index (PSi) that gives a continuous, quantitative indication of the patient’s depth of anesthesia and sedation. Our SedLine
®
brain function monitoring technology can now be delivered through the Masimo Open Connect
™
(MOC-9
™
) connectivity port within our Root
®
patient monitoring and connectivity platform that integrates our rainbow
®
and SET
®
measurements with multiple additional parameters, such as SedLine
®
. In addition, our SedLine
®
brain function monitoring technology also displays raw EEG waveforms, the PSi trend and the Density Spectral Array view to allow clinicians to compare EEG power in both sides of the brain over time to facilitate the detection of asymmetrical activity and agent-specific effects on the EEG signal.
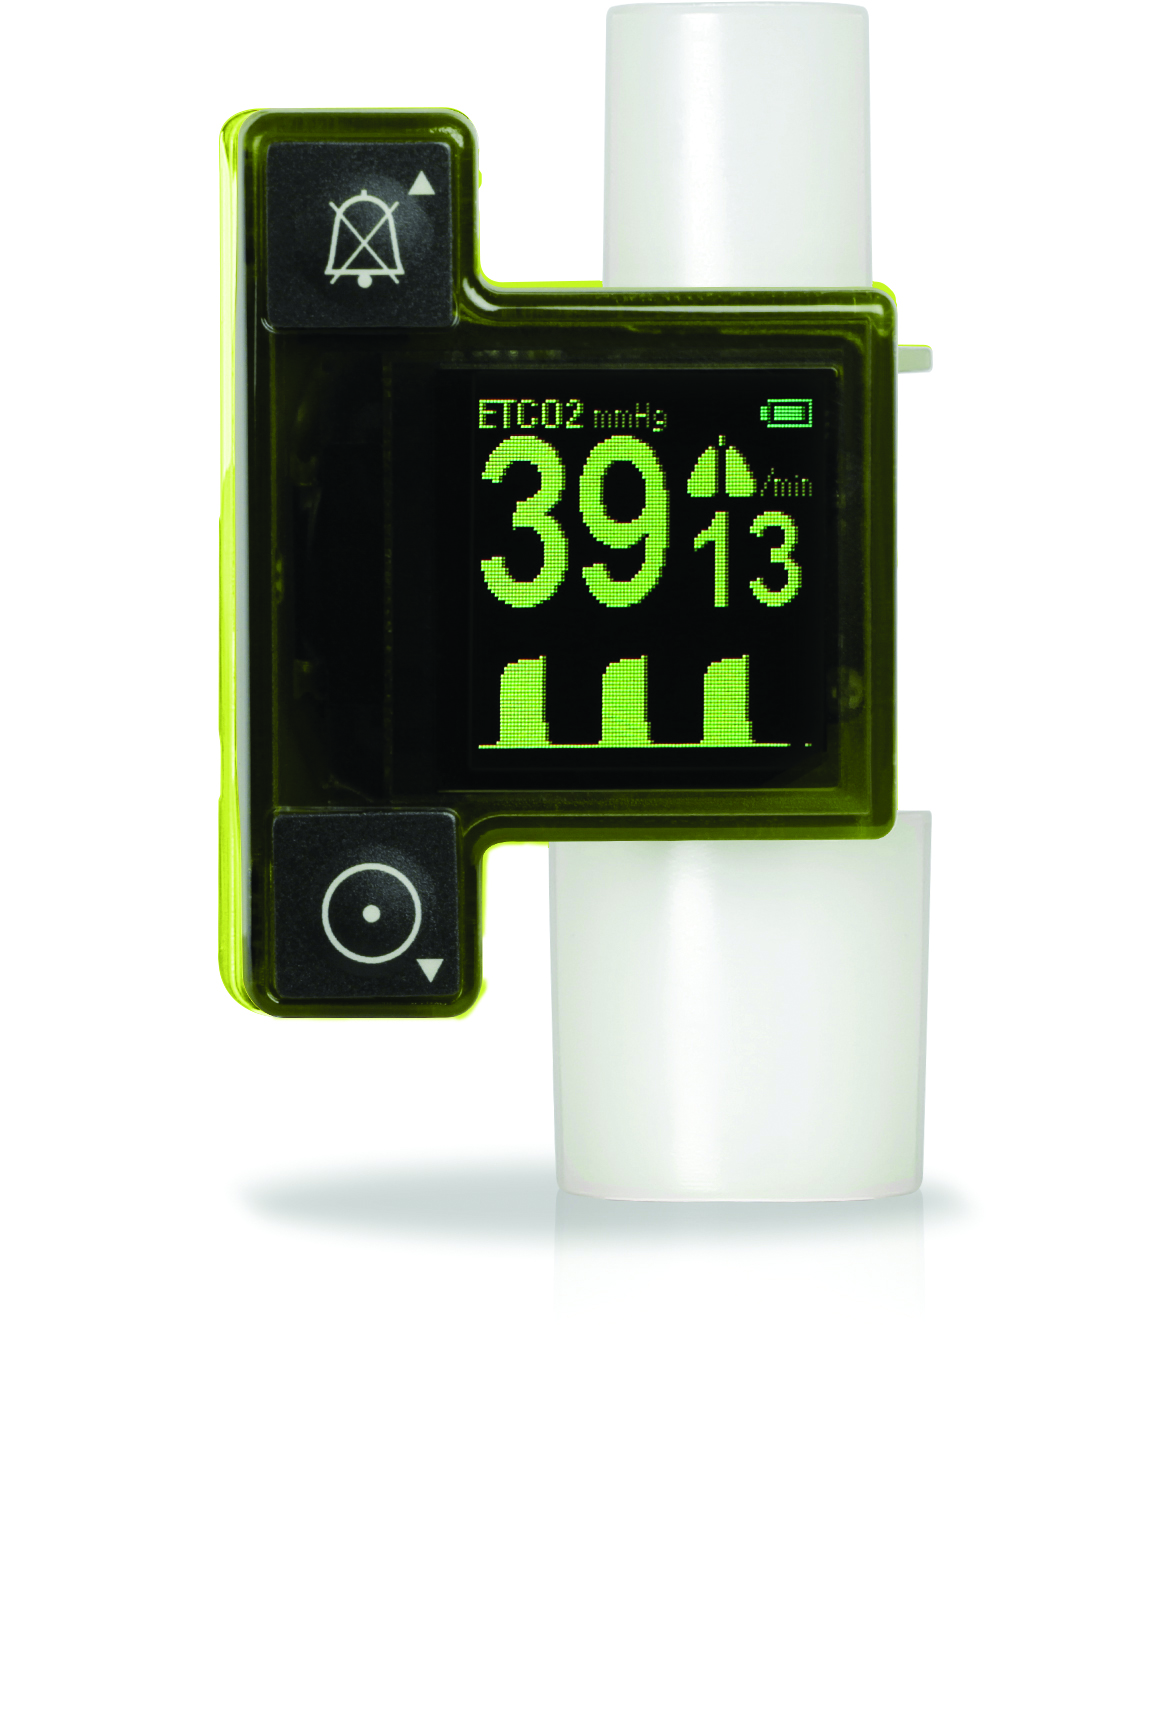
NomoLine
™
Capnography and Gas Monitoring
We offer a portfolio of capnography and gas monitoring products ranging from external “plug-in-and-measure” capnography and gas analyzers, integrated modules, and handheld capnograph and capnometer devices. These products have the ability to measure multiple expired gases, such as carbon dioxide (CO
2
), nitrous oxide (N
2
O), oxygen (O
2
) and other anesthetic agents. In the case of capnography, respiration rate is also calculated from the CO
2
waveform. These measurements are possible through either mainstream monitoring, which samples gases from a ventilated patient’s breathing circuit, or sidestream monitoring, which samples gases from a breathing circuit in mechanically ventilated patients or through a cannula or mask in spontaneously breathing patients. These capnography and gas measurements are standard-of-care in many hospital environments, such as operating rooms, procedural sedation and ICUs.
O
3
®
O
3
®
regional oximetry, also known as tissue oximetry and cerebral oximetry, uses near-infrared spectroscopy (NIRS) to provide continuous measurement of tissue oxygen saturation (rSO
2
) to help detect regional hypoxemia that pulse oximetry alone can miss. In addition, our Root
®
monitor and O
3
®
sensors can automate the differential analysis of regional to central oxygen saturation. O
3
®
monitoring is as simple as applying O
3
®
regional oximetry sensors to the forehead and connecting the O
3
®
MOC-9
™
module to any Root
®
monitor through one of its three MOC-9
™
ports. O
3
®
regional oximetry is currently intended for use with adults weighing 40 kg. (88 lbs.) or greater and has received CE Mark and FDA 510(k) clearance.
6
Patient SafetyNet
Our patient surveillance, remote monitoring and clinician notification solution, Patient SafetyNet, allows for monitoring of the oxygen saturation, pulse rate, perfusion index, hemoglobin, methemoglobin, and respiration rate of up to
200
patients simultaneously from a single server. Patient SafetyNet offers a rich user interface with trending, real-time waveform capability at the central station and remote notification via pager or smart phones. Patient SafetyNet also features the Adaptive Connectivity Engine
™
, which enables two-way, HL7 based connectivity to clinical/hospital information systems. The Adaptive Connectivity Engine
™
significantly reduces the time and complexity to integrate and validate custom HL7 implementations, and demonstrates our commitment to innovation that automates patient care with open, scalable, and standards-based connectivity architecture.
The Patient SafetyNet Series 5000
™
along with Iris
®
Connectivity and MyView
™
through the Root
®
patient monitoring and connectivity platform offers a new level of interoperability designed to enhance clinician workflows, and reduce the cost of care, from operating rooms to medical-surgical units. Patient SafetyNet Series 5000
™
with Iris
®
enables Root
®
to intake data from all devices connected to the patient, thereby acting as an in-room patient monitor and connectivity hub. Alarms and alerts for all devices are seamlessly forwarded to the patient’s clinician and all device data are effortlessly documented in the patient’s electronic medical record (EMR). The patient-centric user interface of the Patient SafetyNet Series 5000
™
displays near real-time data from all devices, providing a single unified dashboard of patient information. To simplify documentation of patient data, Root
®
enables clinicians to easily verify and send patient vitals, as well as all connected medical device information data, to the EMR directly from Root
®
. An interface between the Patient SafetyNet Series 5000
™
and the hospital admission, discharge and transfer (ADT) system allows clinicians to receive ADT information on Root
®
for positive patient identification at the bedside. Clinicians can also manually enter additional data on the Root
®
device, including temperature, blood pressure, level of consciousness, pain score and urine output.
In an article published in 2010 by Dartmouth-Hitchcock Medical Center, clinicians using Masimo SET
®
and Patient SafetyNet identified patient distress earlier, which decreased rapid response team activations, ICU transfers and ICU days. Hospitals and other care centers may determine that they can reduce their costs by moving less critically ill patients from the ICU to the general care areas where these patients can be continuously and accurately monitored in a more cost-effective manner. We believe that the advanced performance of the Masimo SET
®
platform coupled with reliable, cost-effective and easy-to-use wireless remote monitoring will allow hospitals to create continuous surveillance solutions on general care floors where patients are at risk of avoidable adverse events and where direct patient observation by skilled clinicians is cost prohibitive.
MyView
™
MyView
™
is a wireless, presence-detection system that enables clinicians to automatically display customized clinical profiles on Masimo devices, such as Root
®
, Radical-7
®
and the Patient SafetyNet View Station. When a clinician approaches the device, a clinician-worn MyView
™
badge signals the device to display a preselected set of parameters and waveforms tailored to the individual clinician’s preferences.
Third-Party Device Connectivity
Despite medical technology advances, the lack of device communication and integration creates risks to patient safety in hospitals around the world. Without device interoperability, critical patient information can go unnoticed, leaving clinicians unaware and patients at risk. Existing approaches for device interoperability require separate hardware, software and/or network infrastructure, which can clutter the patient room, increase complexity, burden IT management and increase costs. To address these challenges, we introduced Iris
®
connectivity in our Root
®
patient monitoring and connectivity platform. Iris
®
connectivity enables multiple standalone third-party devices such as intravenous pumps, ventilators, hospital beds and other patient monitors to connect through Root
®
, enabling display, notification and documentation to the EMR through Masimo Patient SafetyNet.
Masimo’s addition of Iris
®
connectivity in Root
®
and Patient SafetyNet provides multiple advantages to hospitals, including the following:
|
•
|
Allows standalone device information to be remotely viewed with Patient SafetyNet, transmitted through notification systems or sent to electronic health record systems to facilitate better patient care and meaningful use.
|
|
•
|
Designed to leverage existing network infrastructures and reduce costs while enhancing clinical workflows and decision support to improve patient safety, wherever the clinician is located.
|
|
•
|
Flexible and cost-effective platform, avoiding installation of costly, separate systems.
|
|
•
|
Brings all the data together to facilitate assessment and decision support.
|
7
Our Strategy
Since inception, our mission has been to develop noninvasive monitoring solutions that improve patient outcomes and reduce the cost of patient care. We intend to continue to grow our business and improve our market position by pursuing the following strategies:
|
•
|
Continue to Expand our Market Share in Pulse Oximetry.
We grew our product revenue to
$663.8 million
in
2016
from
$517.4 million
in
2013
, representing a three-year compound annual growth rate of
8.7%
. This growth can be attributed to continued expansion of our core SET
®
Pulse Oximeter customer base, higher revenues from rainbow
®
Pulse CO-Oximetry, NomoLine
™
capnography and other new technologies, and our expanding list of OEM partners. We supplement our direct sales to hospitals and other low acuity healthcare facilities through various U.S. and international distributors. Combined sales through our direct and distributor sales channels increased to
$574.8 million
, or
86.2%
of product revenue in
2016
, from
$438.8 million
, or
84.8%
of product revenue, in
2013
. As hospitals, physicians and providers are rewarded by payers based on the quality and value of the services (as opposed to the volume of fee-for-service transactions), we expect to see hospitals gravitate towards technologies like Masimo SET
®
that have a proven track record of improving patient care.
|
|
•
|
Expand the Pulse Oximetry Market to Other Patient Care Settings.
Many patients die due to opioid overdose in post-surgical wards. We believe the ability to continuously and accurately monitor patients outside of critical care settings, including the general, medical and surgical floors of the hospital, are currently unmet medical needs and have the potential to significantly improve patient care and increase the size of the pulse oximetry market. In addition, we believe the ability of Masimo SET
®
to accurately monitor and address the limitations of conventional pulse oximetry has enabled, and will continue to enable, us to expand into non-critical care settings, and therefore, significantly expand the market for our products. To further support our expansion into the general care areas, we market Patient SafetyNet, which enables continuous monitoring of up to
200
patients’ oxygen saturation, pulse rate and with rainbow SET
™
, noninvasive hemoglobin and respiration rate. We believe that Patient SafetyNet, when combined with Masimo SET
®
pulse oximetry and RAM
™
or capnography, offers a clinically proven cost-effective approach to continuous post-operative monitoring.
|
|
•
|
Expand the Use of rainbow
®
Technology in Hospital Settings.
We believe the noninvasive measurement of rainbow
®
Pulse CO-Oximetry (SpHb
®
, SpCO
®
, SpMet
®
, PVi
®
,
SpfO
2
™
, SPOC
™
and ORi
™
), rainbow Acoustic Monitoring
®
(RRa
®
), and the Halo Index
™
, as well as future measurements, will provide an excellent opportunity to help our customers improve patient care while reducing their overall cost of care.
|
|
•
|
Expand the Use of rainbow
®
Technology in Non-Hospital Settings.
We believe the noninvasive measurement of hemoglobin creates a significant opportunity in markets such as the physician office, emergency departments and blood donation centers and the noninvasive measurement of carboxyhemoglobin creates a significant opportunity in the fire/alternate care market.
|
|
•
|
Expand the Use of Root
®
in Hospital Settings.
We believe Root
®
represents a powerful new paradigm in patient monitoring because it enhances our rainbow
®
and SET
®
measurements with multiple specialty parameters (SedLine
®
brain function monitoring, O
3
®
regional oximetry, capnography and gas monitoring) and open-architecture Iris
®
connectivity in an integrated, clinician-centric hub. Our Iris
®
integration platform for Root
®
provides a conduit to the patient’s EMR for a range of clinical devices that may otherwise be unable to communicate their information. Iris
®
offers clinical utility and flexibility by collecting device information from all sources and making it available to clinicians in one networked place, akin to an airplane cockpit. Complementary innovations like the Radius-7
®
wearable, wireless monitor foster an environment of safety without sacrificing patient mobility or comfort. Patients on medical-surgical units can be monitored around the clock, and visit the common areas and labs, all while being continuously monitored. Root
®
is acuity-adaptable, very well equipped with connectivity capabilities and very competitively priced.
|
|
•
|
Utilize our Customer Base and OEM Relationships to Market our Masimo rainbow
SET
™
,
O
3
®
, SedLine
®
and Capnography Products Incorporating Licensed rainbow
®
Technology.
We are currently selling our rainbow SET
™
products through our direct sales force and distributors. We include our MX circuit boards in our pulse oximeters and sell them to our OEM partners, equipped with circuitry to support rainbow
®
Pulse CO-Oximetry measurements that can be activated at time of sale or through a subsequent software upgrade. We believe that, over time, the clinical need for these measurements along with our installed customer base will help drive the adoption of our rainbow
®
Pulse CO-Oximetry products.
|
|
•
|
Continue to Innovate and Maintain Our Technology Leadership Position.
We invented and pioneered the first pulse oximeter to accurately measure arterial blood oxygen saturation level and pulse rate in the presence of motion artifact and low perfusion. In addition, we launched our rainbow SET
™
platform that enabled what we believe is the first noninvasive monitoring of carboxyhemoglobin, methemoglobin and hemoglobin, as well as PVi
®
, all of which were previously only available with invasive and/or complicated testing. With our introduction of RRa
®
with rainbow Acoustic Monitoring
®
technology, we believe we have launched the first platform to enable noninvasive and continuous respiration monitoring through an easy-to-use single-patient adhesive acoustic sensor. More recently, we introduced ORi
™
, which we believe may provide advance warning of an impending hypoxic state, or an indication of an unintended hyperoxic state.
|
8
|
•
|
We plan to continue to innovate and develop new technologies and products, internally and through our collaboration with Cercacor, from whom we currently license certain rainbow
®
technologies.
|
Our future growth strategy is also closely tied to our focus on international expansion opportunities. Since 2007, we have been expanding our sales and marketing presence in Europe, Asia, Middle East, Canada and Latin America. We have accomplished this by both additional staffing and adding or expanding sales offices in many of these territories. By centralizing a portion of our international operations in Neuchatel, Switzerland, including sales management, marketing, customer support, planning, logistics and administrative functions, we believe we have developed a more efficient and scalable international organization that is capable of being even more responsive to the business needs of our international customers under one centralized management structure.
Operating Segment and Geographic Information
We operate in one business segment, using one measurement of profitability to manage our business. Sales and other financial information by geographic area is provided in Note 16 to our accompanying consolidated financial statements included in Part IV, Item 15(a) of this Annual Report on Form 10-K.
Our Products and Markets
We develop, manufacture and market patient monitoring technologies that incorporate a monitor or circuit board and sensors, including proprietary single-patient-use, reusable and rainbow ReSposable
®
sensors and patient cables. In addition, we offer remote alarm/monitoring solutions, software and connectivity solutions.
The following chart summarizes our principal product components and principal markets and methods of distribution:
|
Patient Monitoring Solutions:
|
||||||
|
Description:
|
Use:
|
Distribution Channel:
|
||||
|
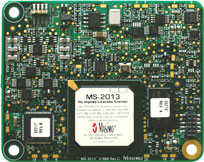
Circuit Boards and Modules
(e.g., MX-3
(shown below)
, MX-5, MS-2011, MS-2013
(shown below)
, MS-2040
(shown below)
, uSpO2
®
, SedLine
®
, ISA and IRMA)
|
||||||

|
|
• Signal processing apparatus for all Masimo technology platforms
• Mainstream and sidestream capnography and gas monitors
|
• Incorporated and sold to OEM partners who incorporate our circuit boards into their patient monitoring systems
|
|||
9
|
Description:
|
Use:
|
Distribution Channel:
|
||||
|
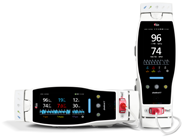
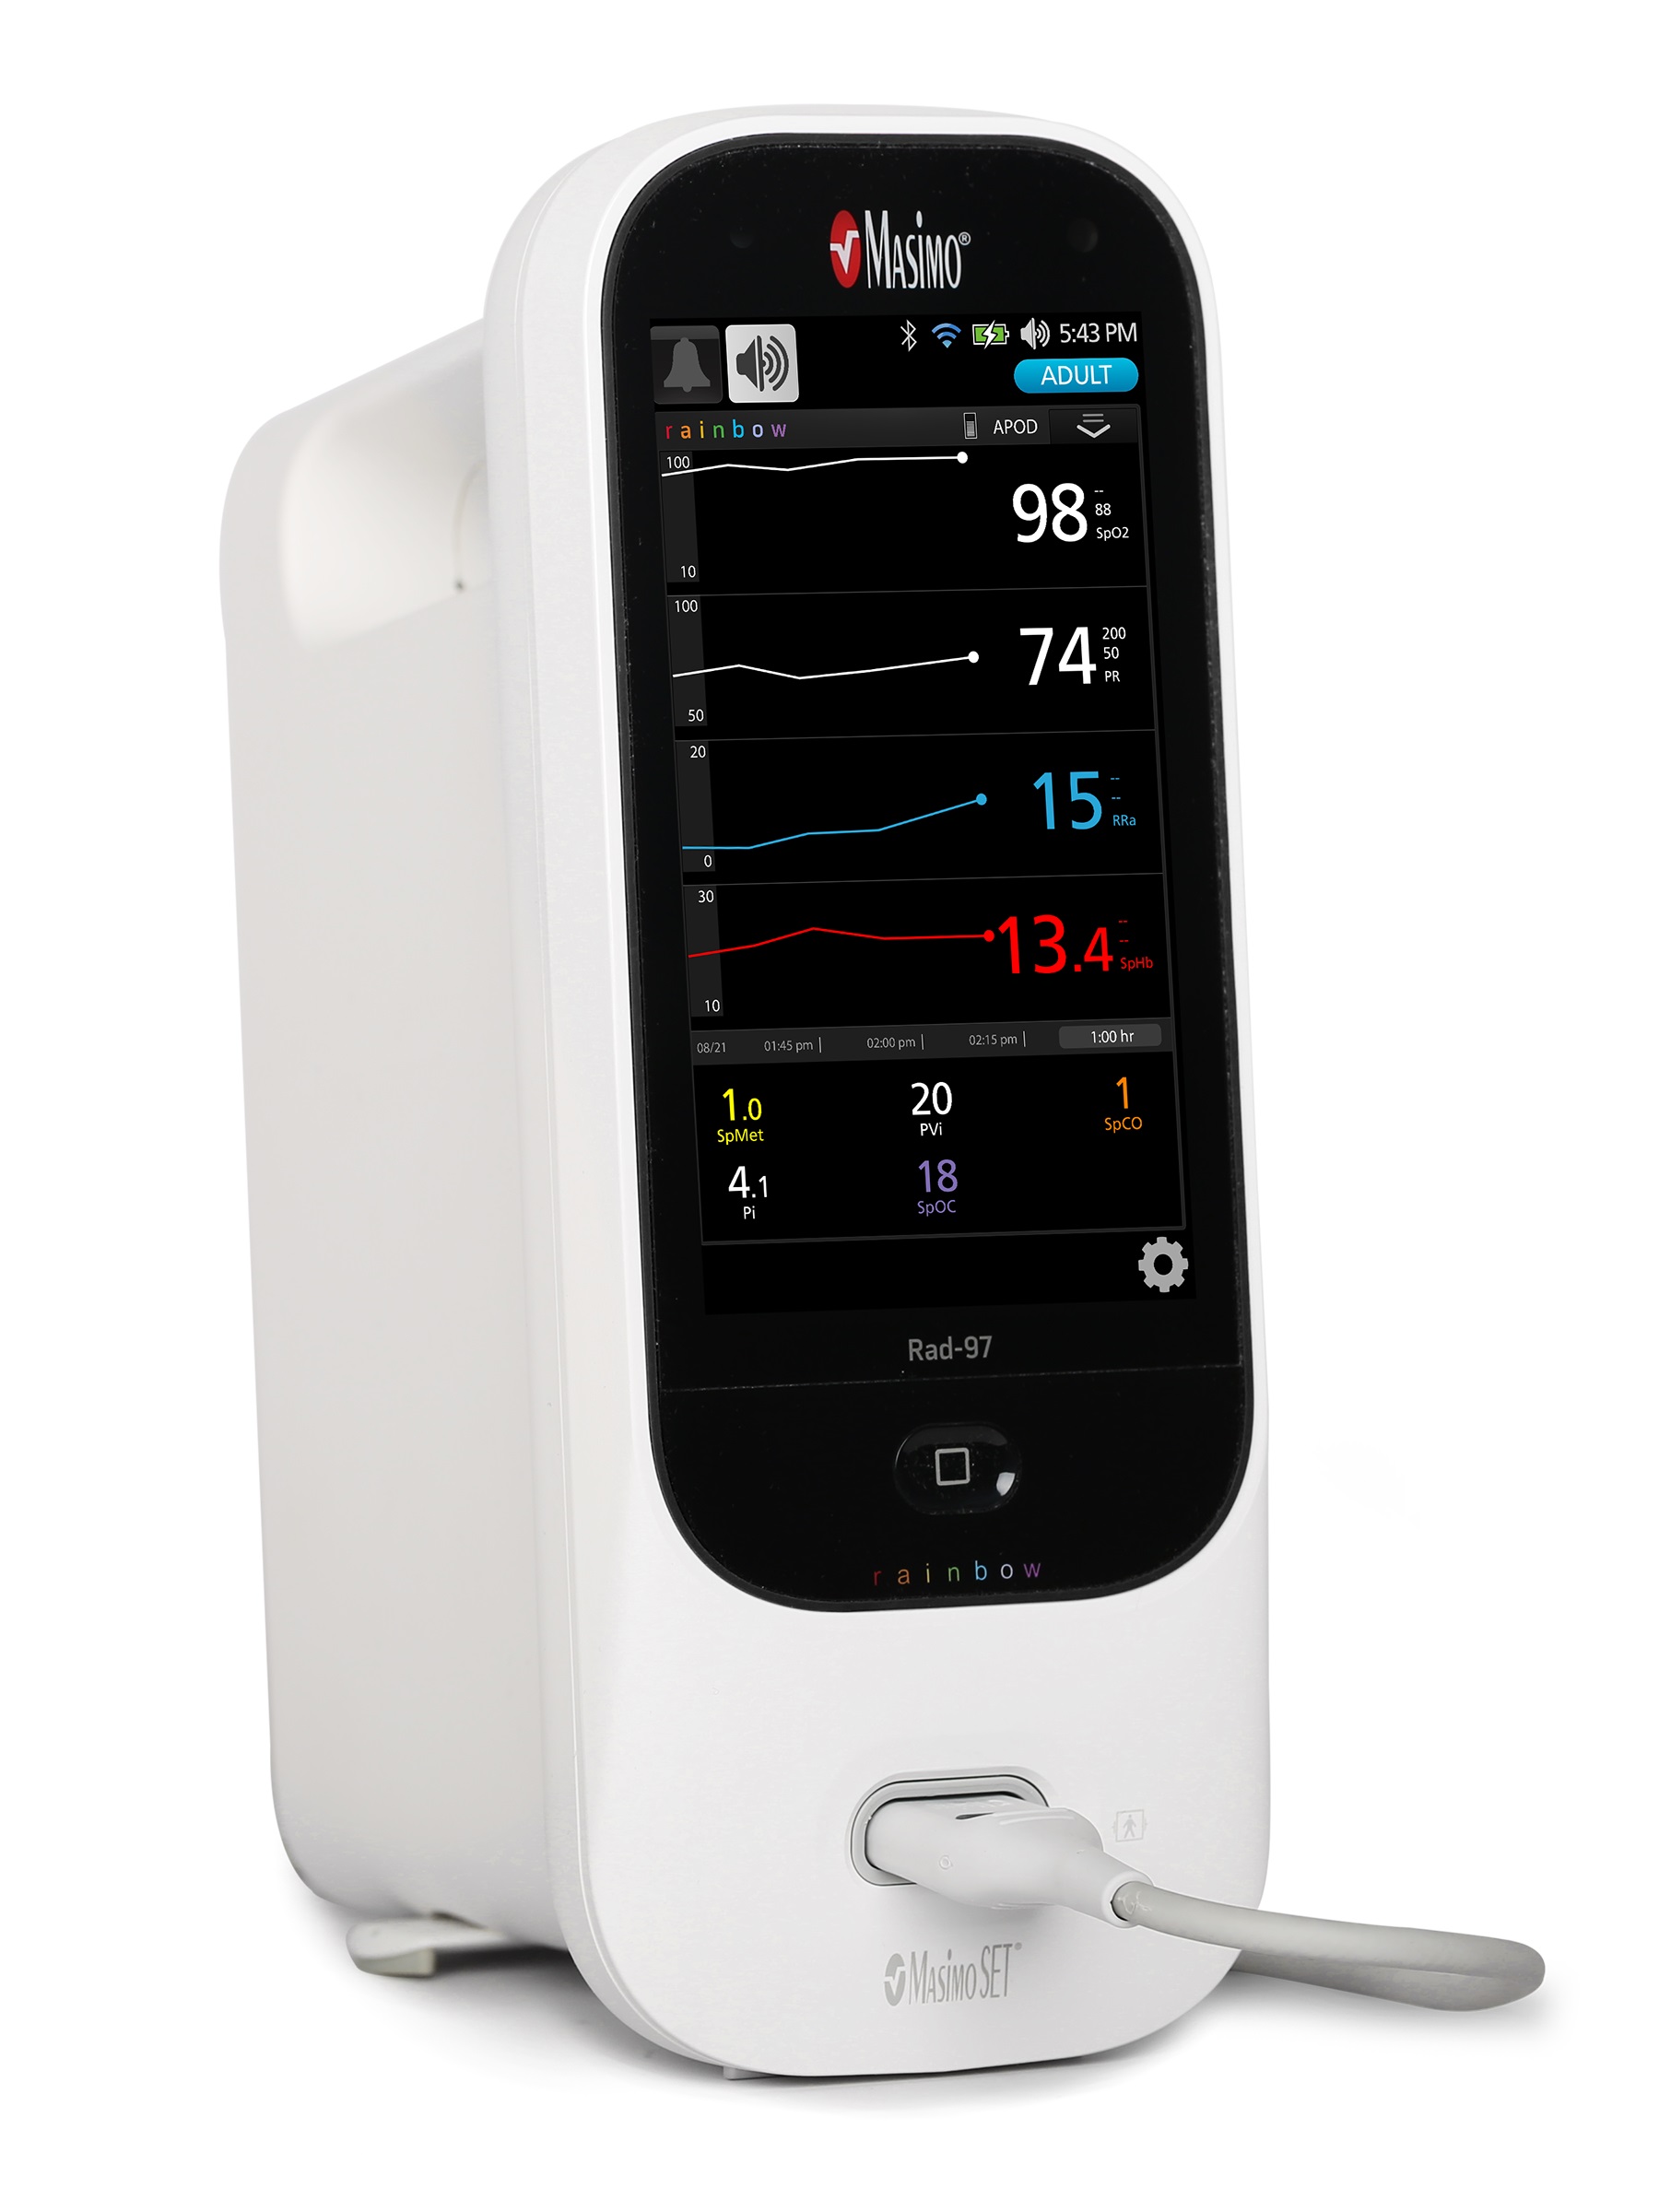
Monitors and Devices
(e.g., Radical-7
®
(shown below),
Pronto
®
, Rad-57
®
, Root
®
, Radius-7
®
, EMMA
™
and Rad-97
™
(shown below)
)
|
||||||
|
|
• Bedside, handheld and wireless monitoring devices that incorporate Masimo SET
®
with and without licensed Masimo rainbow SET
™
technology
• Compact and self-contained capnometer which monitors CO
2
concentration
|
• Sold directly to end-users and through distributors and in some cases to our OEM partners who sell to end-users
|
|||
|
Patient Monitoring and Connectivity Platform
(e.g., Root
®,
and Radius-7
®
(shown below)
,
)
|
||||||
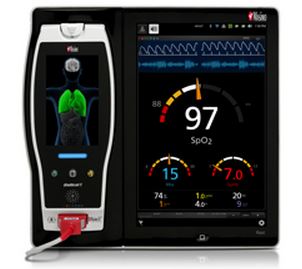
|
• Displays measurements from Masimo’s Radical-7
®
(connected) or Radius-7
®
(patient-worn)
• Provides additional specialty measurements from Masimo or third-party-developed apps through Masimo Open Connect (MOC)
• Ability to connect third-party devices such as IV pumps, ventilators, beds and other patient monitors to the electronic health record
|
• Sold directly to end-users and through distributors
|
||||
|
®
|
||||||
10
|
Description:
|
Use:
|
Distribution Channel:
|
||||
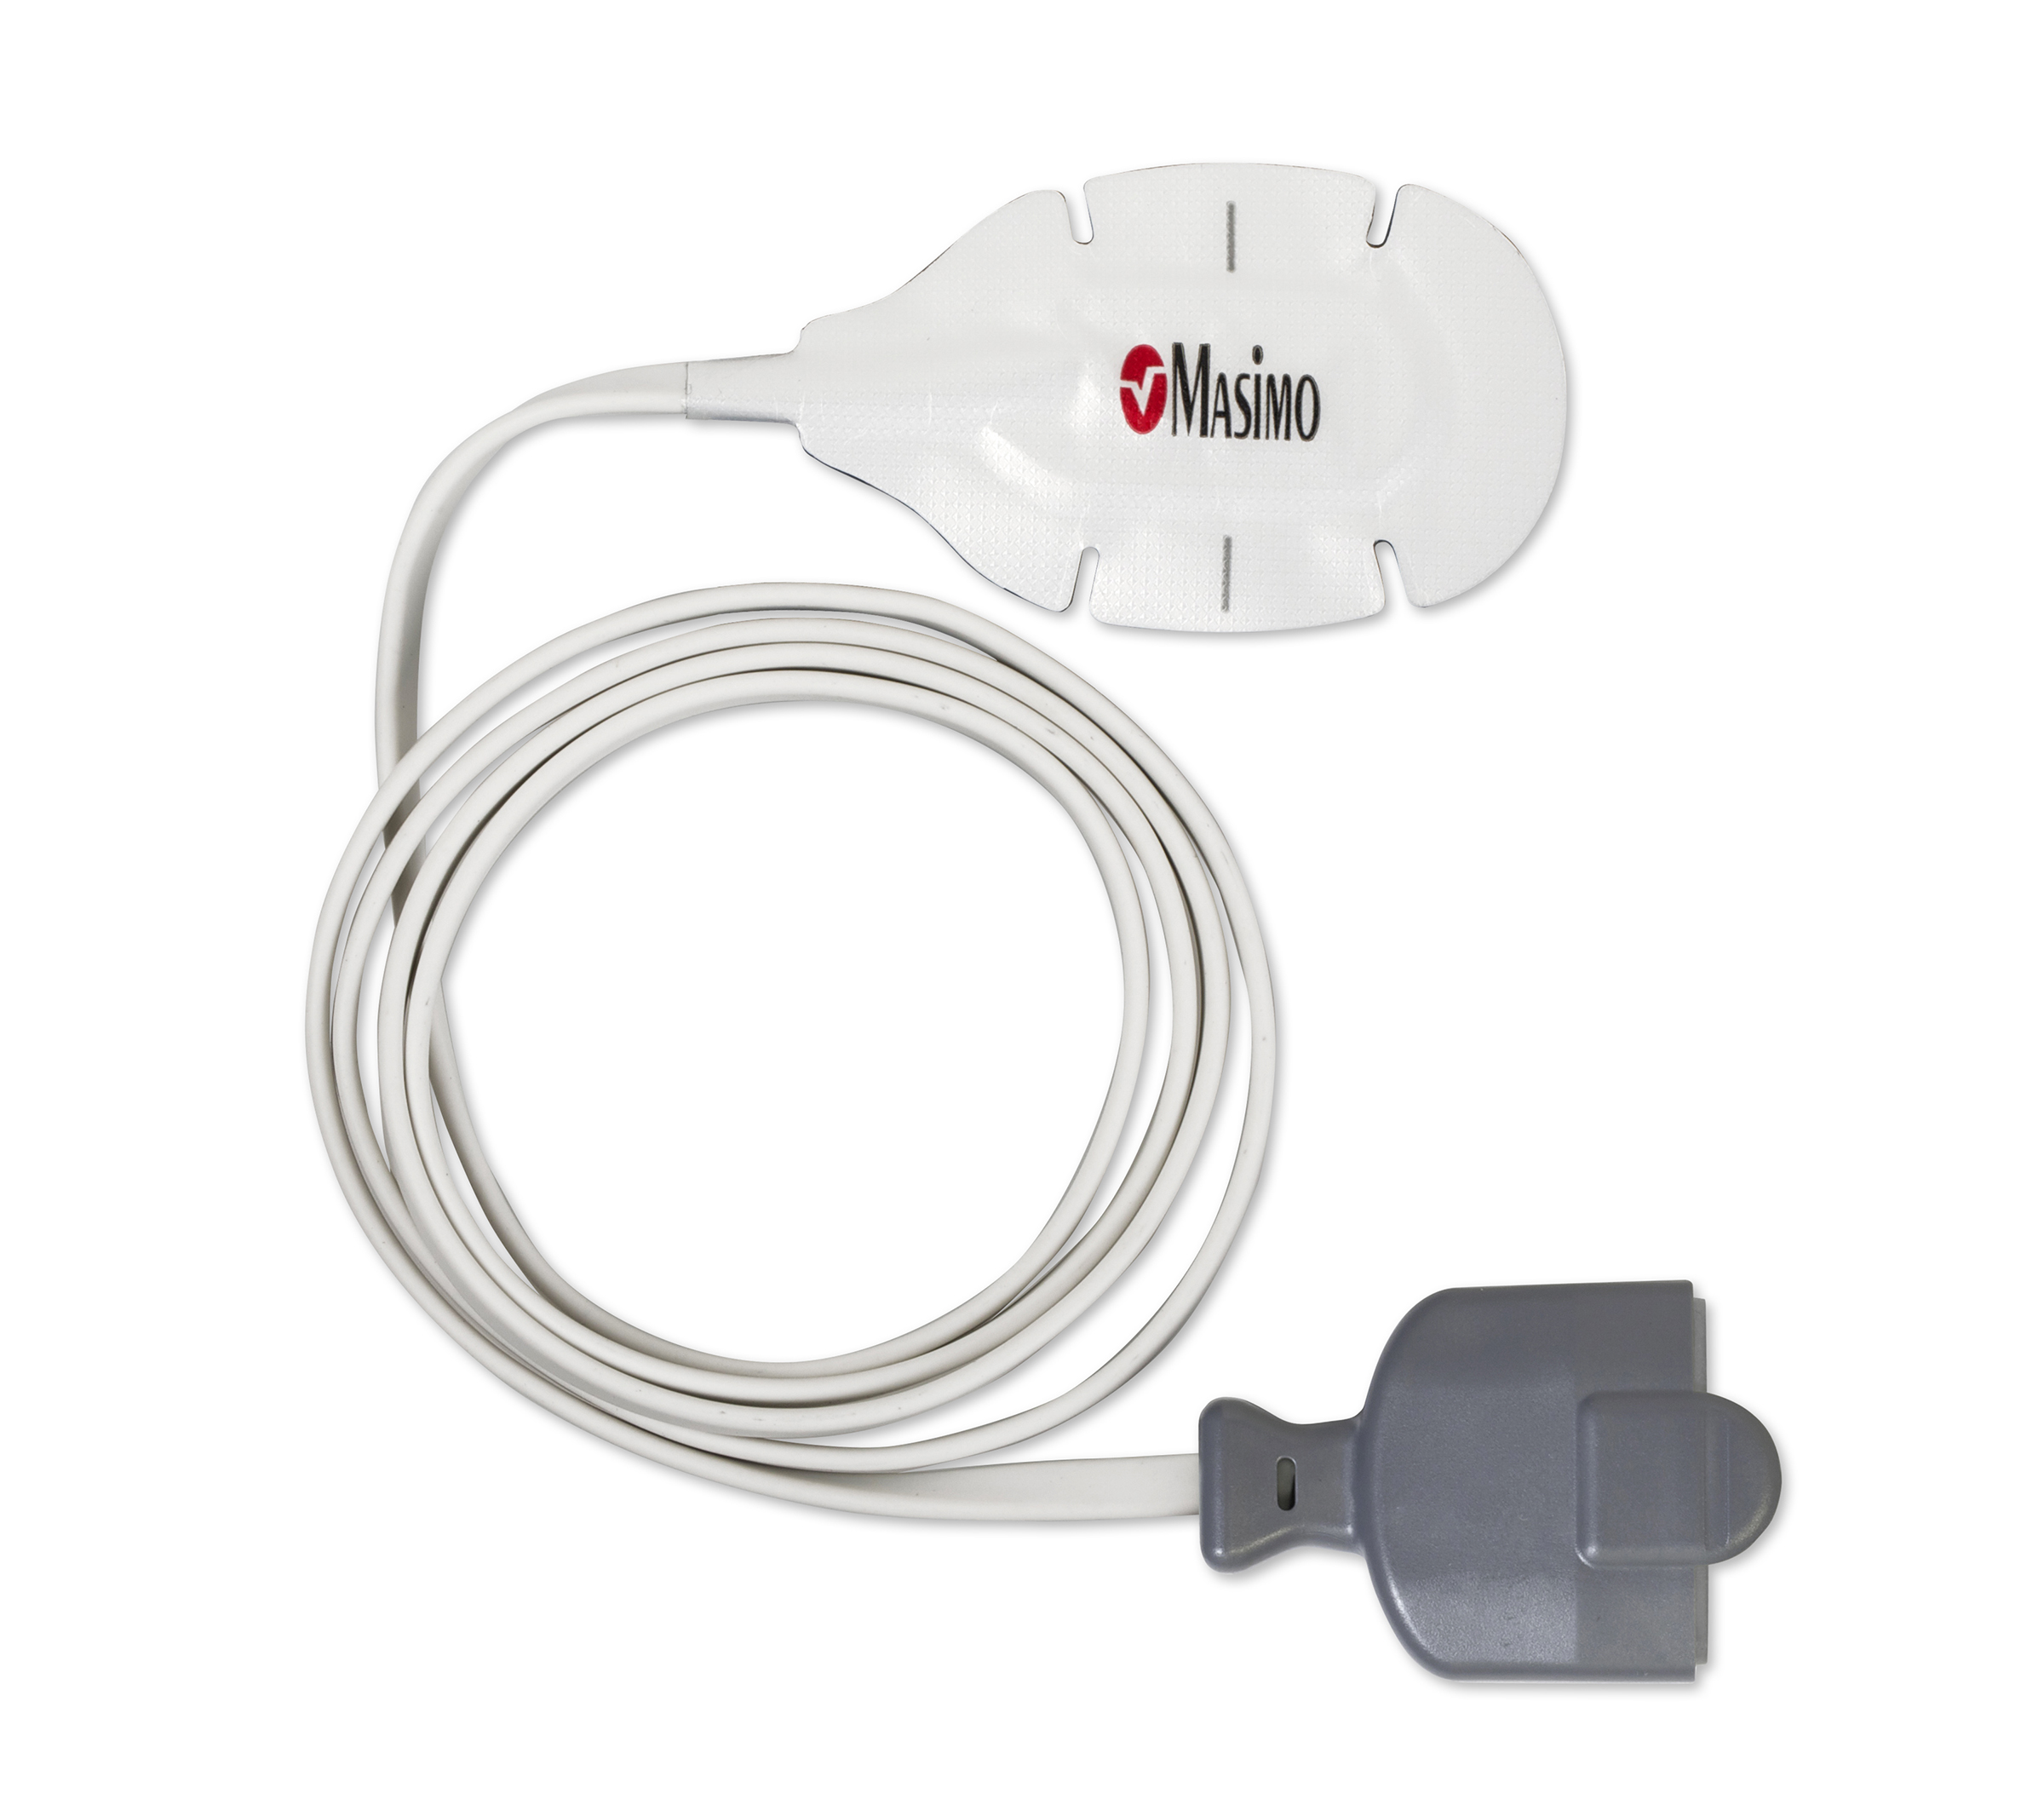
|
Sensors
(e.g., SET
®
, rainbow
®
Pulse CO-Oximetry, rainbow Acoustic
™
Sensors
™
, SedLine
®
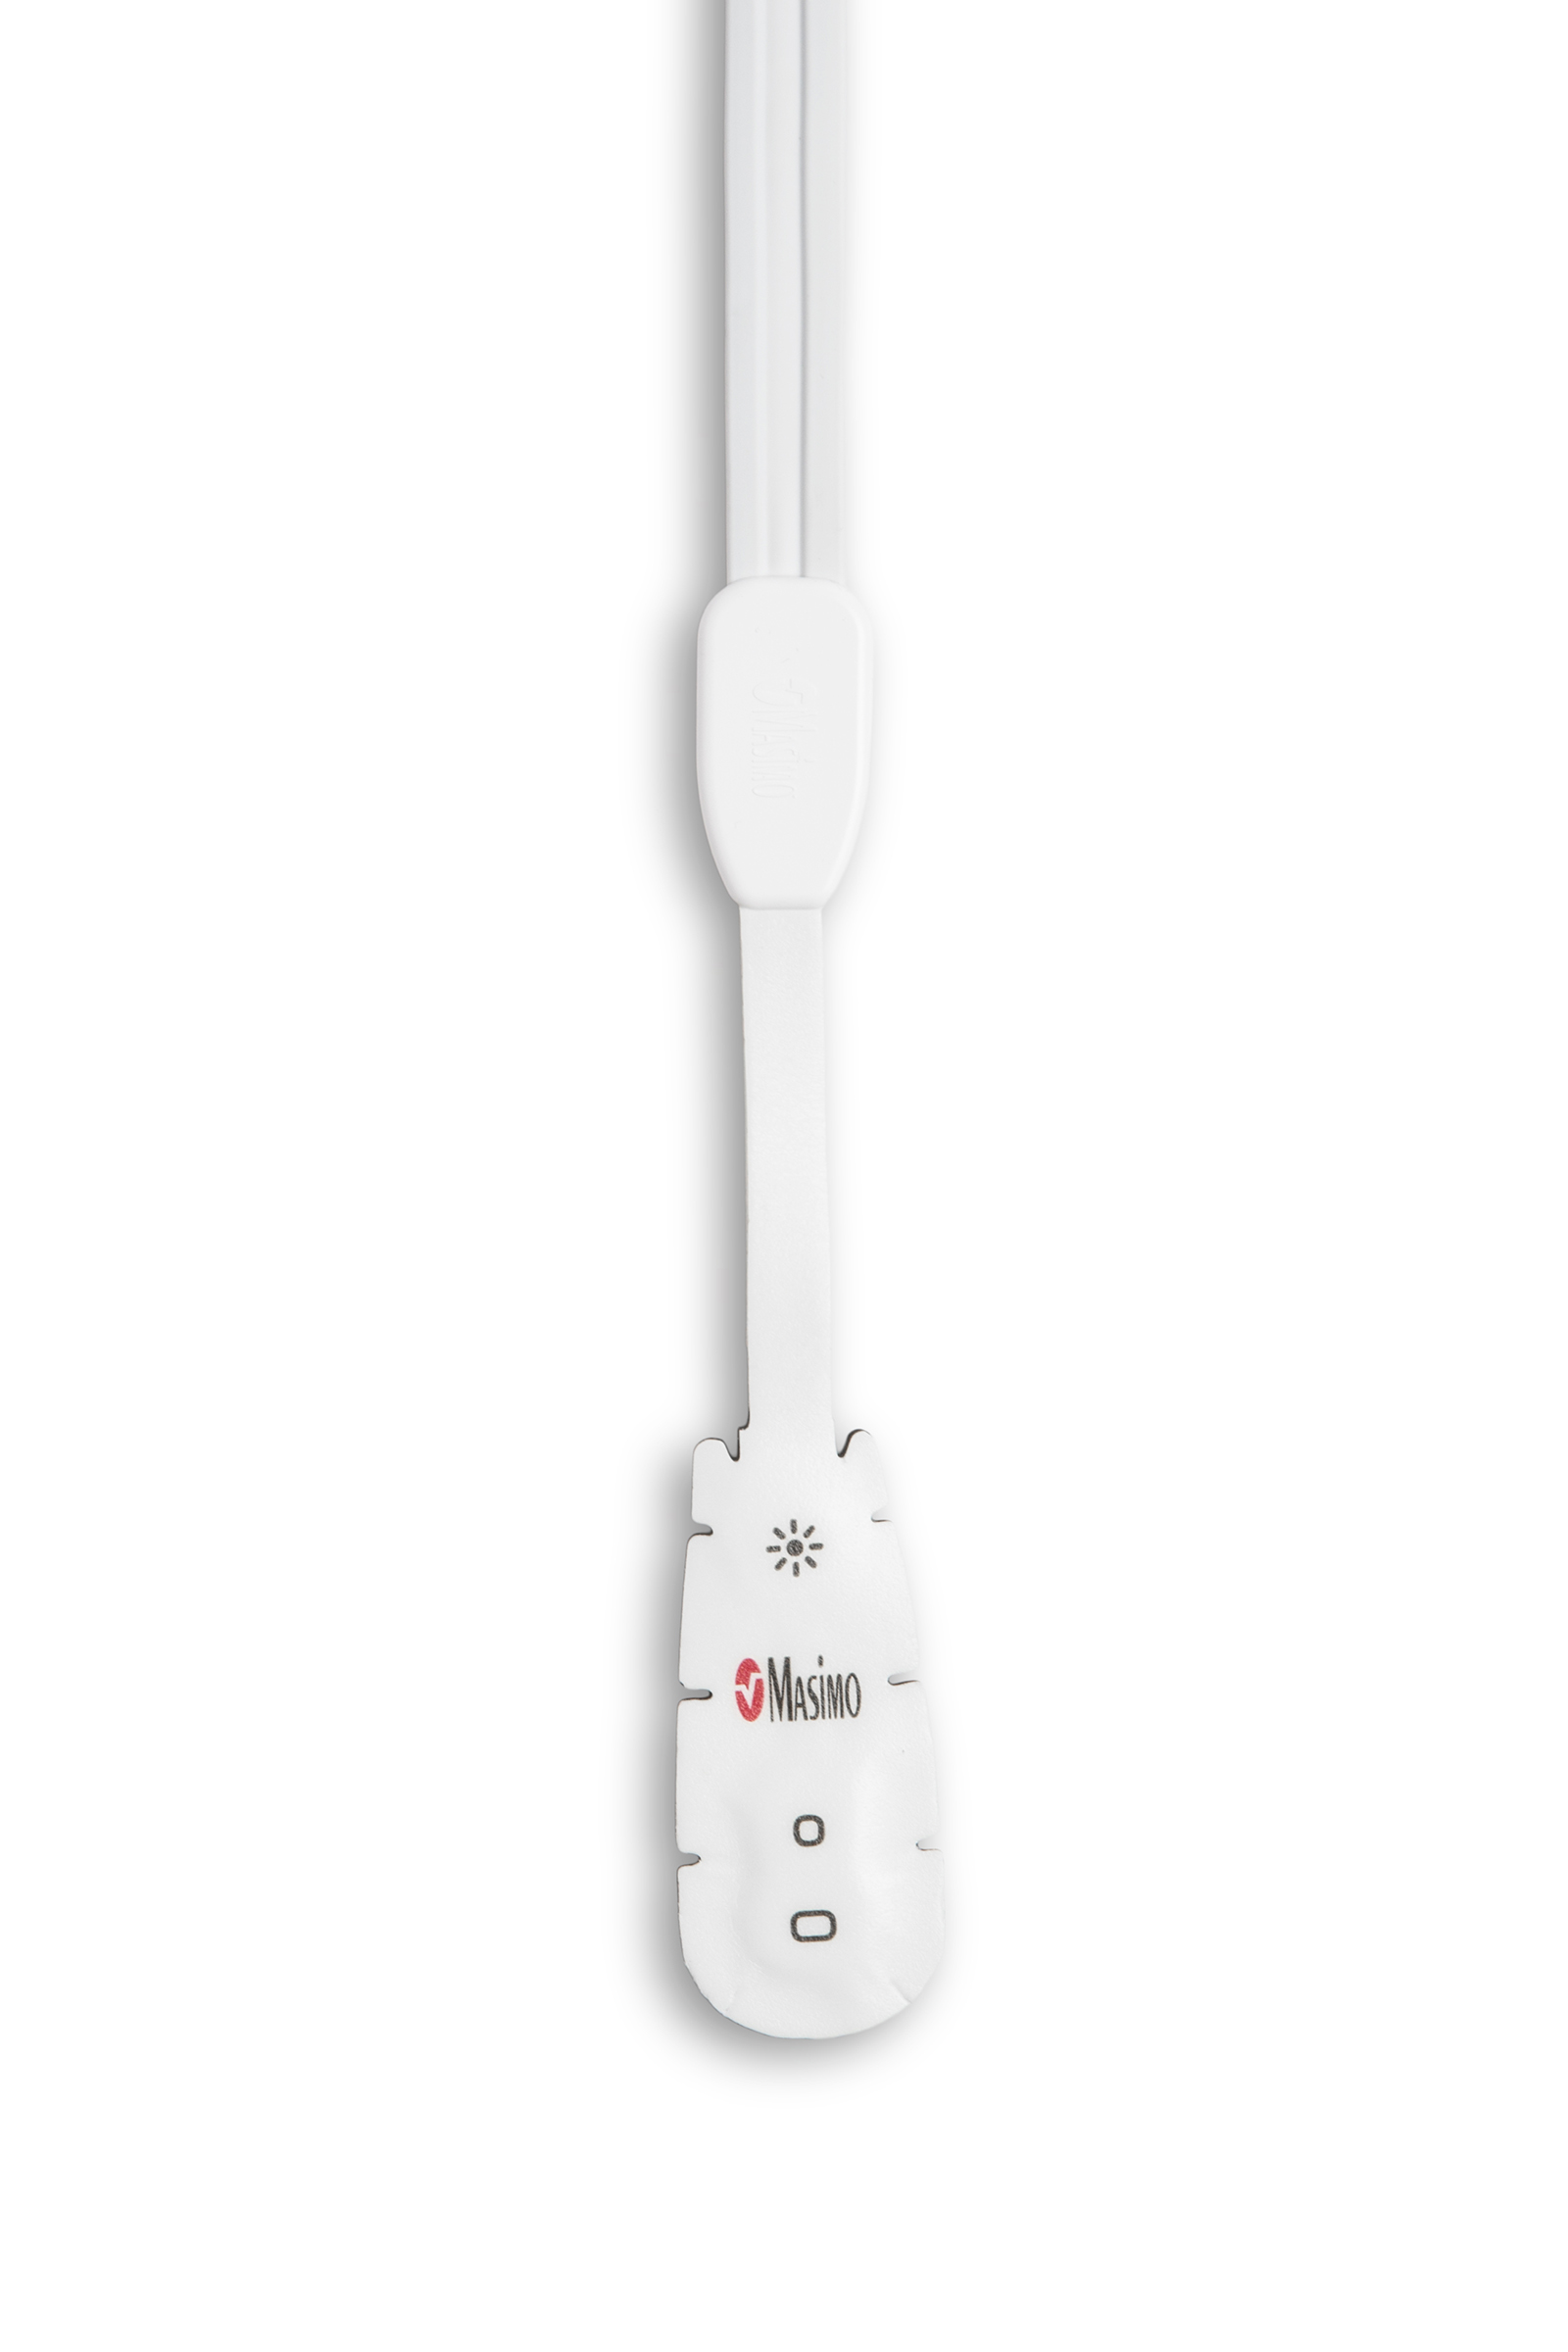
with Next Generation, TFA-1
™
and O
3
®
Pediatric
(last three shown below)
)
|
||||||
|
|
|
• Extensive line of both single-patient, reusable and rainbow ReSposable
®
sensors
• Patient cables, as well as adapter cables that enable the use of our sensors on certain competitive monitors
|
• Sold directly to end-users and through distributors and to OEM partners who sell to end-users
|
||
|
Line Filters and Mainstream Adapters
(e.g., gas disposables and capnography. (EMMA
™
C
apnometer
shown below
.
)
|
||||||
|
• Line of disposables to measure mainstream and sidestream capnography and gas parameters
|
• Sold directly to end-users and through distributors and to OEM partners who sell to end-users
|
||||
|
Remote Alarm and Monitoring Solutions
(e.g., Patient SafetyNet) |
||||||
|
• Network-linked, wired or wireless, multiple patient floor monitoring solutions
• Standalone wireless alarm notification solutions
|
• Sold directly to end-users
|
||||
11
|
Description:
|
Use:
|
Distribution Channel:
|
||||
|
Proprietary Measurements
(e.g., SpHb ® , SpCO ® , SpMet ® , PVi ® , RRa ® , ORi ™ , 3D Alarms ® and Adaptive Threshold Alarm) |
||||||

|
• Rainbow
®
measurements and other proprietary features sold to installed monitors
|
• Sold directly to end-users and through OEM partners who sell to end-users
|
||||
|
Connectivity
(e.g., Patient SafetyNet and Root ® with NIBPT ( shown below ) |
||||||
|
• Software and hardware enabling third-party devices to connect through Patient SafetyNet to clinicians and for documentation to the electronic health record
|
• Sold directly to end-users
|
||||
|
Consumer Monitoring Solutions:
|
||||||
|
Devices
(e.g. MightySat ™ Rx with RRp ™ ) |
||||||
|
• Pulse oximeter cable and sensor for use with an iPhone, iPad, iPod touch and select Android smart phones
|
• Sold directly to consumers through consumer retailers
|
||||
12
Circuit Boards
Masimo SET
®
MS Circuit Boards
. Our Masimo SET
®
MS circuit boards perform all signal processing and other pulse oximetry functions incorporating the Masimo SET
®
platform. Our MS circuit boards are included in our proprietary monitors for direct sale or sold to our OEM partners for incorporation into their monitors. Once incorporated into a pulse oximeter, the MS circuit boards perform all data acquisition processing and report the pulse oximetry levels to the host monitor. The circuit boards and related software interface directly with our proprietary sensors to calculate arterial blood oxygen saturation level and pulse rate. Our latest generation boards include the MS-2003, MS-2011, MS-2013 and MS-2040, with a typical power consumption of less than 45 milliwatts.
Masimo rainbow
SET
™
MX Circuit Boards.
Our next-generation circuit board is the foundation for our Masimo rainbow
®
Pulse CO-Oximetry and rainbow Acoustic Monitoring
®
platform, utilizing certain technology that is licensed from Cercacor. The MX circuit boards offer full functionality of our rainbow
®
technology for noninvasive measurements for total hemoglobin (SpHb
®
), oxygen content (SpOC
™
), carboxyhemoglobin (SpCO
®
), methemoglobin (SpMet
®
) and acoustic respiration rate (RRa
®
), in addition to providing Measure-through Motion and Low Perfusion
™
oxygen saturation (SpO2), pulse rate (PR) and Pi measurement capabilities of Masimo SET
®
pulse oximetry. Customers can choose to buy additional measurements beyond arterial blood oxygen saturation levels and pulse rate at the time of sale or at any time in the future through a field-installed software upgrade.
Our MX-5 OEM circuit board deploys a technology platform that utilizes approximately half the power of previously available rainbow
®
circuit boards to deliver rainbow
®
Pulse CO-Oximetry noninvasive measurement performance. In addition to the lower power demands compared to previous rainbow
®
technology boards, the MX-5 adds dynamic power utilization to scale the MX-5’s power draw based upon the combination of parameters being monitored to permit even longer battery run-times.
uSpO
2
®
Cable/Board.
Our SET
®
technology-in-a-cable contains the low power (MS-2040) technology in a reduced size, allowing it to be embedded into patient cables as part of the sensor connector. This allows for the ability to interface the uSpO
2
®
cable/board to monitoring devices externally via an existing communications port in instances where internal integration of a traditional Masimo SET
®
technology board is not feasible. The uSpO
2
®
cable/board provides full Masimo SET
®
Measure-through Motion and Low Perfusion
™
pulse oximetry found in our other products, with a typical power consumption of less than 45 milliwatts.
Monitors / Devices
Radical-7
®
.
The Radical-7
®
incorporates our MX circuit board, which enables rainbow SET
™
measurements, and offers three-in-one capability that can be used as:
|
•
|
a standalone device for bedside monitoring;
|
|
•
|
a detachable, battery-operated handheld unit for easy portable monitoring; and
|
|
•
|
a monitor interface via SatShare
®
, a proprietary technology allowing our products to work with certain competitor products, to upgrade existing conventional multiparameter patient monitors to Masimo SET
®
while displaying rainbow
®
measurements on the Radical-7
®
itself.
|
|
•
|
The Radical-7
®
is a wireless, touchscreen device, which is on an upgradeable rainbow SET
™
platform. With its wide-ranging flexibility, Radical-7
®
can continuously monitor a patient from the ambulatory environment, to the emergency room, to the operating room, to the general floor and on, until the patient is discharged. Radical-7
®
delivers the accuracy and reliability of Masimo rainbow SET
™
with multi-functionality, ease of use and a convenient upgrade path for existing monitors.
|
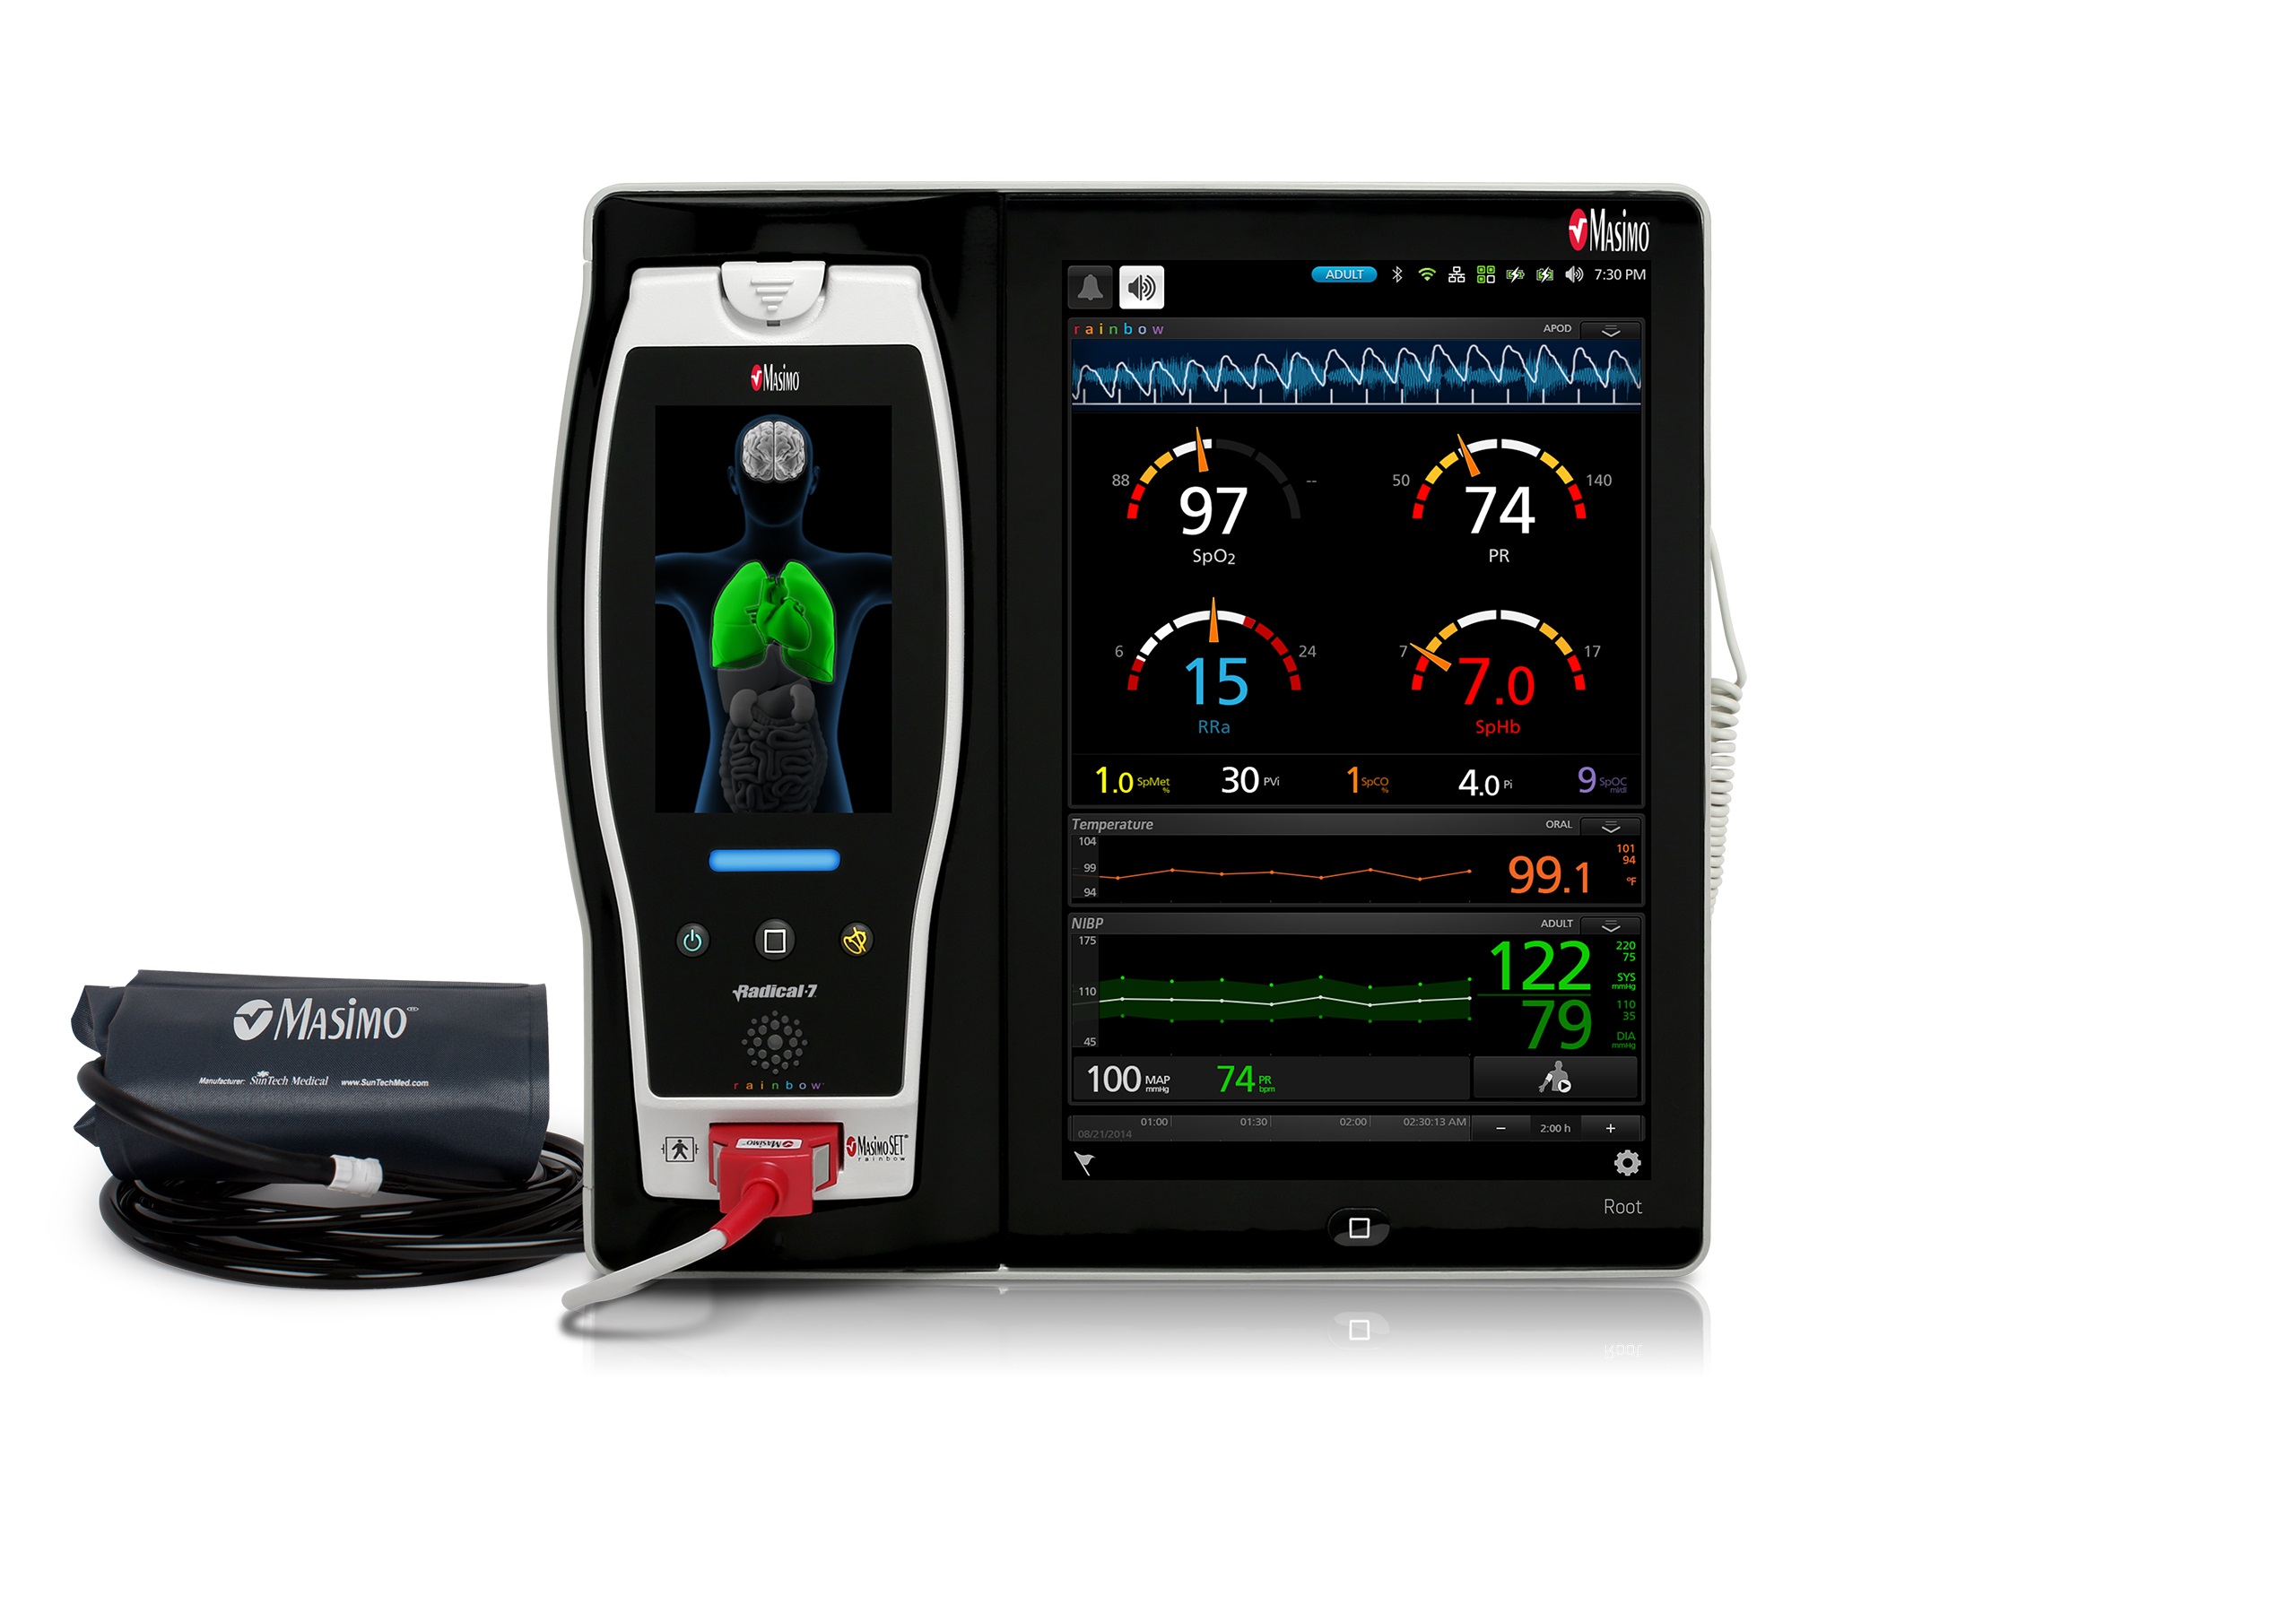
Root
®
. Root
®
is a powerful patient monitoring and connectivity platform that integrates our rainbow
®
and SET
®
measurements with multiple additional specialty measurements through Masimo Open Connect
™
(MOC-9
™
) in an integrated, clinician-centric platform. The first three MOC-9
™
technologies for Root
®
were Masimo-developed applications - SedLine
®
brain function monitoring, capnography and O
3
®
regional oximetry. Additional MOC-9
™
functionality is expected in the future through third-party development. In contrast to traditional OEM integrations, Masimo’s MOC-9
™
program allows third party developers to create their own external module or app, obtain the necessary regulatory approvals, and then gain access to the hospital or alternative care marketplace via the Root
®
platform by either selling their MOC-9
™
module or app directly to the hospital or alternative care provider. MOC-9
™
partner companies will then pay Masimo a royalty on the sales of their module or app. Masimo believes that the combination of the Root
®
platform and the MOC-9
™
measurement can help new and established medical technology companies do what the smart phone did for software developers; namely, integrate their solution on a highly featured, low priced, widely-available platform.
Iris
®
connectivity in the Root
®
device enables third party devices such as intravenous pumps and ventilators to connect through Root
®
, which enables display notification and documentation to the EMR through the Masimo Patient SafetyNet
application.
13
In June 2015, we announced the release of Root
®
with noninvasive blood pressure and temperature capabilities. Root
®
with noninvasive blood pressure from SunTech Medical
®
enables clinicians to measure arterial blood pressure for adult, pediatric and neonatal patients, with three distinct measurement modes: spot-check, automatic interval and stat interval. The temperature module from Welch Allyn
®
is designed to measure the temperature of adult, pediatric and neonatal patients. This product has received both CE Mark and FDA 510(k) clearance.
Our Root
®
platform with capnography, SedLine
®
brain function monitoring, wireless communication and Iris
®
connectivity for third-party medical devices has received FDA clearance. O
3
®
regional oximetry has received CE Mark and FDA 510(k) clearance.
Radius-7
®
.
Radius-7
®
for the Root
®
patient monitoring and connectivity platform is the first and only wearable, wireless monitor with our rainbow SET
™
technology, enabling early identification of clinical deterioration while offering patients continuous monitoring with freedom of movement. With rainbow SET
™
noninvasive measurements, Radius-7
®
with Root
®
can alert clinicians at the bedside or remotely, through Masimo Patient SafetyNet, of critical changes in a patient’s oxygen saturation and pulse rate, even during states of motion and low perfusion, as well as respiration through RRa
®
. Radius-7
®
with Root
®
has received both CE Mark and FDA 510(k) clearance.
SatShare
®
. Our SatShare
®
technology enables a conventional monitor to receive continuous measurement updates using Masimo SET
®
through a simple cable connection from the back of Radical-7
®
to the sensor input port of the conventional monitor. No software upgrades or new modules are necessary for the upgrade, which can be completed in minutes. SatShare
®
allows hospitals to standardize the technology and sensors used throughout the hospital while allowing them to gain more accurate monitoring capabilities and additional multi-functionality in a cost-effective manner. This technology has facilitated many hospital-wide conversions of previously installed competitor monitors to Masimo SET
®
. In addition, Masimo rainbow SET
™
measurements such as hemoglobin are available to clinicians on the Radical-7
®
itself while the device is being used in SatShare
®
mode.
Pronto
®
. The Pronto
®
is a handheld noninvasive multiparameter testing device that uses Masimo rainbow SET
™
technology to provide oxygen saturation, pulse rate, perfusion index and spot-checking of hemoglobin levels for both hospitals (i.e., emergency departments) and remote settings such as physician offices.
Rad-8
®
.
The Rad-8
®
is a bedside pulse oximeter featuring Masimo SET
®
(but without rainbow
®
capability) with a low cost design and streamlined feature set.
Rad-5
®
.
In addition to the bedside monitors, we have developed handheld pulse oximeters using Masimo SET
®
(but without rainbow
®
capability). Our Rad-5
®
and Rad-5v
®
handheld oximeters were the first dedicated handhelds with Masimo SET
®
.
Rad-57
®
.
The Rad-57
®
is a fully featured handheld Pulse CO-Oximeter
®
that provides continuous, noninvasive measurement of hemoglobin, carboxyhemoglobin and methemoglobin in addition to oxygen saturation, pulse rate and perfusion index. Its rugged and lightweight design makes it applicable for use in hospital and field settings, specifically for fire departments and emergency medical service units.
Rad-97
™
. The Rad-97
™
is a versatile standalone monitor that features a 1080p HD color display with user-friendly multi-touch navigation, and features Measure-through Motion and Low Perfusion
™
pulse oximetry, pulse rate, and perfusion index. Additional monitoring solutions such as the rainbow SET
™
measurements total hemoglobin, methemoglobin, acoustic respiration rate, carboxyhemoglobin, and oxygen content can be added on. The Rad-97
™
is the smallest Masimo bedside device currently capable of monitoring the full rainbow SET
™
platform. Rad-97
™
has received CE Mark.
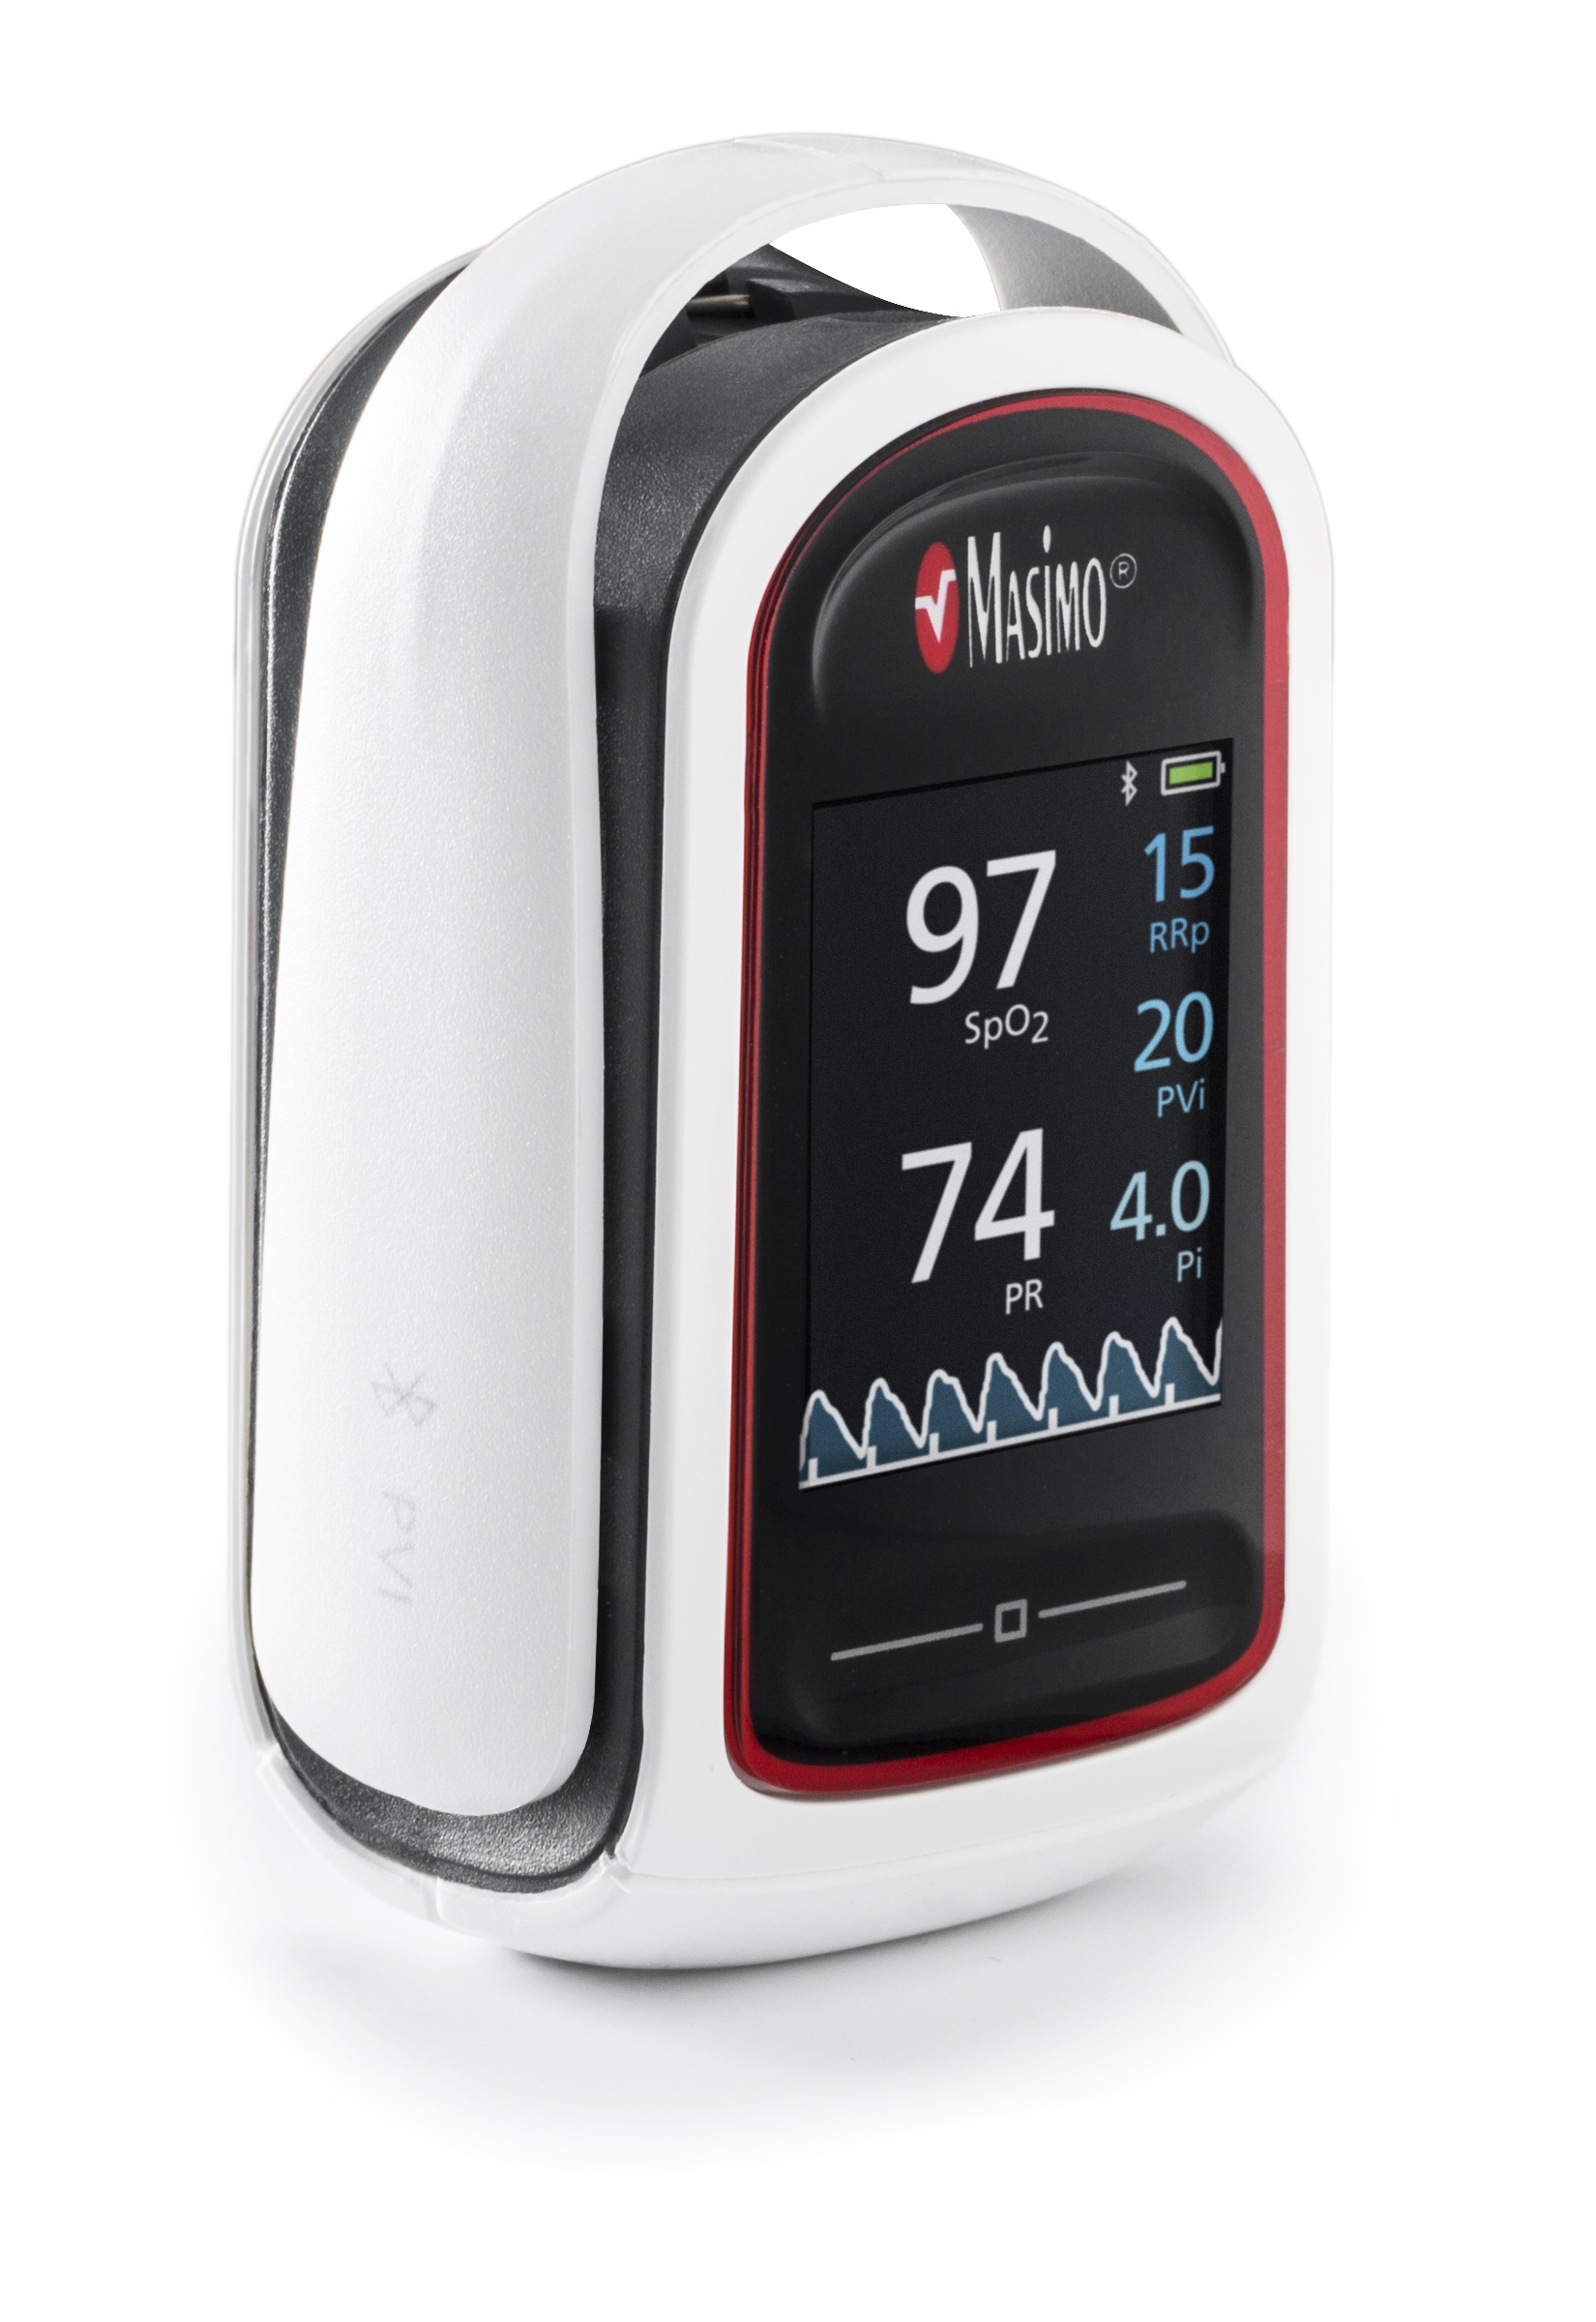
MightySat
™
Rx
. The MightySat
™
Rx is a fingertip pulse oximeter that incorporates Masimo SET
®
Measure-through Motion and Low Perfusion
™
technology. The MightySat
™
Rx has received CE Mark and FDA 510(k) clearance.
SedLine
®
MOC-9
™
Module.
The SedLine
®
monitor measures brain function on a continuous basis. The SedLine
®
MOC-9
™
module for Root
®
is an EEG-based brain function monitor that provides information about a patient’s response to anesthesia.
O
3
®
MOC-9
™
Module.
The
O
3
®
MOC-9
™
module for Root
®
uses near-infrared spectroscopy (NIRS) to detect regional hypoxemia by continuously measuring tissue oxygen saturation (rSO
2
), automating the differential analysis of regional to central oxygen saturation.
NomoLine
™
Capnography and Gas Monitoring.
Our gas analyzers, IRMA and ISA, and emergency capnometer (EMMA
™
), enable our customers to benefit from CO
2
, N
2
O, O
2
and anesthetic agent monitoring in many hospital environments.
uSpO
2
®
Cable/Board.
Our new SET
®
technology-in-a-cable contains our low power (MS-2040) technology in a reduced size, allowing it to be embedded into patient cables as part of the sensor connector.
14
Sensors
Sensors and Cables.
We have developed one of the broadest lines of single-patient-use (disposable), reusable and rainbow sensors and cables. In total, we have over 100 different types of sensors to meet virtually every clinical need. Masimo SET
®
sensors are uniquely designed to reduce interference from physiological and non-physiological noise. Our proprietary technology platforms operate only with our proprietary sensor lines. However, through the use of adapter cables, we can connect our sensors to certain competitor pulse oximetry monitors. We sell our sensors and cables to end-users directly or through our distributors and OEM partners.
Our single-patient-use sensors offer several advantages over reusable sensors, including improved performance, cleanliness, increased comfort and greater reliability. Our reusable sensors are primarily used for short-term, spot-check monitoring. Our rainbow ReSposable
®
sensors are expected to provide performance advantages for customers currently using reusable and reprocessed sensors.
SofTouch Sensors.
We have developed SofTouch sensors, designed with less adhesive or no adhesive at all for compromised skin conditions. These include single-patient sensors for newborns and multi-site reusable sensors for pediatrics and adults.
Trauma and Newborn Sensors.
We have developed two specialty sensor lines, specifically designed for trauma and resuscitation situations, as well as for newborns. These sensors contain an identifier that automatically sets the oximeter to monitor with maximum sensitivity and the shortest-averaging mode and allows for quick application, even in wet and slippery environments. Additionally, we introduced low-profile sensors to monitor oxygen saturation in newborns. The newly enhanced low-profile LNCS
®
and M-LNCS
™
Neo, NeoPt and Inf Sensors are smaller and thinner, making them significantly more comfortable for patients and easier to apply for healthcare workers.
Blue Sensors
®
.
We believe our Blue Sensors
®
are the first FDA-cleared sensors to accurately monitor arterial blood oxygen saturation levels in cyanotic infants and children with abnormally low oxygen saturation levels.
E1
®
Ear Sensor.
We believe that our E1
®
Ear Sensor was the first ever, single-patient-use ear sensor that is placed securely in the ear conchae, so clinicians can combine Masimo SET
®
performance and central monitoring to provide quick access and responsive assessment of oxygenation. The E1
®
Ear Sensor is designed for field emergency medical services utilization.
TFA-1
™
Adhesive Forehead Sensor.
We believe our TFA-1
™
forehead sensor can combine Masimo SET
®
performance and central monitoring to provide quick access and responsive assessment of oxygenation, for hospitals desiring forehead monitoring with a disposable sensor. Our TFA-1
™
forehead sensor has received FDA 510(k) clearance.
rainbow
®
Sensors.
We have developed proprietary, multi-wavelength sensors for use with our rainbow
®
Pulse CO-Oximetry products. In contrast to traditional sensors that only have the capability to monitor arterial blood oxygen saturation levels and pulse rate, our rainbow
®
sensors can also monitor carboxyhemoglobin, methemoglobin and hemoglobin. Our licensed rainbow SET
™
sensors are the only sensors that are compatible with our licensed rainbow SET
™
products. Rainbow
®
sensors are available in single-patient-use, rainbow
ReSposable
®
and reusable spot-check sensor types.
The rainbow
®
DCI-mini
®
is the first noninvasive hemoglobin (SpHb
®
) spot-check sensor for infants and small children (weight 3 to 30 kg). Paired with our handheld Pronto
®
device, the rainbow
®
DCI-mini
®
sensors are designed to help clinicians quickly and easily spot-check hemoglobin levels in infants and small children, which may facilitate the identification of anemia. The rainbow
®
DCI-mini
®
has received CE Mark in Japan, but is not currently available for sale in the U.S. or Europe.
rainbow Acoustic
™
Sensors.
We believe we were the first to market a continuous respiration rate monitoring technology based on an acoustic sensor placed on the patient’s neck. Our rainbow Acoustic
™
sensors detect the sounds associated with breathing and convert the sounds into continuous respiration rate using proprietary signal processing that is based on Masimo SET
®
.
In August 2016, we announced the RAS-45 a single-use adult and pediatric acoustic respiration sensor for rainbow Acoustic Monitoring
®
(RAM
™
) of respiration rate (RRa
®
). RAS-45 is designed to facilitate placement on and improve attachment to the neck operates with Masimo MX circuit boards to measure RRa and display the acoustic respiration wave form. RAS-45 can be used with patients who weigh more than 10kg. RAS-45 has received CE Mark.
SedLine
®
Sensor.
Used with the SedLine
®
MOC-9
™
module for the Root
®
patient monitor, the SedLine
®
sensor is a disposable sensor that collects EEG data for our SedLine
®
monitor.
rainbow
®
Universal ReSposable SuperSensor
™
.
This sensor, which is not currently available for sale in the U.S., is the first noninvasive sensor to provide simultaneous monitoring of SpHb
®
, SpCO
®
, SpMet
®
, SpfO
2
™
, SpOC
™
, Pi, PVi
®
and Measure-through Motion and Low Perfusion
™
arterial blood oxygen saturation (SpO
2
)
and pulse rate (PR).
15
O
3
®
Sensor.
Used with the O
3
®
MOC-9
™
module for the Root
®
patient monitor, each O
3
®
sensor contains four light-emitting diodes and two detectors to continuously measure rSO
2
.
Reprocessed Sensors.
We offer our customers choices for reducing pollution and waste in our world while also reducing costs, including Masimo Reprocessed Sensors, the only reprocessing solution that maintains new Masimo sensor performance specifications, and rainbow ReSposable
®
sensors, offering unprecedented sustainability with a lower carbon footprint and greater waste reduction than reprocessed or new sensors. Rainbow ReSposable
®
sensors offer equivalent performance and comfort to single-patient- use sensors and a similar sensor price-per-patient to mixed third-party reprocessed and new sensors.
Remote Alarm and Monitoring Solutions
Masimo Patient SafetyNet.
Patient SafetyNet is a remote monitoring and clinician notification system. It instantly routes bedside-generated alarms through a server to a qualified clinician’s handheld paging device in real-time. Each system can support up to
200
bedside monitors and can either be integrated into a hospital’s existing IT infrastructure or operate as a stand-alone wireless network.
Proprietary Measurements
All of our monitors shipped since January 2006, including Radical-7
®
and certain future OEM products, which incorporate the MX board will allow purchases of software for rainbow
®
measurements, as well as other future measurements or features that can be field-installed. Our current rainbow
®
measurements include ORi
™
, Pi, PR, PVi
®
, RRp
™
, SpHb
®
, SpO
2
, SpCO
®
, SpMet
®
, SpOC
™
and SpfO
2
™
, as well as rainbow Acoustic Monitoring
®
, RRa
®
Currently, clinicians monitor multiple clinical measurements on each patient and respond independently to each of the measurements. Halo Index
™
is a dynamic indicator that facilitates continuous global trending and assessment of multiple physiological measurements into a simple and comprehensive assessment within a single index to quantify changes in patient status, which is displayed on the Patient SafetyNet remote monitoring and notification system. Halo Index
™
has received CE Mark, but is not currently available for sale in the U.S. In the future, subject to receipt of regulatory clearance, we expect Halo Index
™
will also be available as part of our standalone devices and OEM boards. As more clinical evidence is collected on Halo Index
™
, its clinical utility in a variety of care areas and patient types will become more specific.
Eve
™
, a Newborn Screening Software Application for the Radical-7
®
Pulse CO-Oximeters
®
, is designed to help clinicians more effectively and efficiently screen newborns for critical congenital heart disease (CCHD). In the Radical-7
®
Pulse CO-Oximeter
®
, Eve
™
automates the screening steps with animated instruction, including sensor application, measurement selection and screening result determination. Eve
™
is intended to provide consistent application of the screening protocol to reduce method-and operator-induced variability and improve efficiency by automating the data capture and comparison between readings. Eve
™
has received CE Mark, but is currently not available for sale in the U.S.
X-Cal
®
Sensor and cable failures can prevent pulse oximeters from providing the patient safety advantages that continuous pulse oximetry monitoring is intended to provide. Our X-Cal
®
technology enhances patient safety and improves clinician efficiency by preserving system quality, performance and reliability and reducing the chances of bad or inferior sensors and cables being used on patients. X-Cal
®
technology enhances the benefits of Masimo’s pulse oximetry by incorporating the means to track the expected monitoring life of the pulse oximetry sensors and cables and provides appropriate user messaging on the host monitor.
X-Cal
®
addresses three common problems experienced by clinicians using an integrated Masimo system, including:
|
•
|
Patient safety may be compromised by using imitation Masimo sensors and cables because they are not produced with comparable components, do not provide proper shielding from ambient interferences, create electrostatic noise caused by motion, do not have our quality and performance controls, and are not tested or warranted to work within a Masimo system;
|
|
•
|
We design our sensors and cables to last well beyond their warranty period and customer feedback indicates our sensors and cables last significantly longer than competing products, but cable and sensor reliability may still be compromised when used beyond the life they were designed for, affecting patient care and causing clinicians and biomedical engineers to spend time troubleshooting intermittent cable and sensor issues; and
|
|
•
|
We believe that third-party reprocessed pulse oximetry sensors introduce challenges in the clinical environment due to potential quality issues. In fact, we believe that most third-party reprocessed sensors do not indicate that they are capable of performing in Measure-through Motion and Low Perfusion
™
conditions or neonatal applications, key performance requirements available with Masimo SET
®
sensors. Also, to the best of our knowledge, no third-party company has attempted to reprocess rainbow SET
™
sensors.
|
16
Connectivity
Iris
®
connectivity in Root
®
enables third-party devices such as intravenous pumps and ventilators to connect through Root
®
enabling display, notification and documentation to the EMR through Masimo Patient SafetyNet.
Consumer Products
Our
MightySat
™
fingertip pulse oximeter for personal use provides accurate oxygen saturation and pulse rate measurements and is designed for those who want accurate measurements even under extreme conditions. In addition to standard SpO
2
, PR and Pi measurements, MightySat
™
is also available with respiration rate (RRp
™
) and PVi
®
, a measure of the dynamic changes in the Pi that occur during one or more complete respiratory cycles. Changes in PVi
®
may indicate changes in hydration, breathing effort, perfusion, or other factors. MightySat
™
provides measurements in a compact, battery-powered design with a large color screen that can be rotated for real-time display of the pleth waveform as well as measurements. Bluetooth wireless functionality enables measurement display via a free, downloadable Masimo Personal Health app on iOS and Android mobile devices, as well as the ability to trend and communicate measurements, including the Apple Health Kit. MightySat
™
is available through consumer retailers and is intended for general health and wellness use only. MightySat
™
is not intended for medical use.
Cercacor Laboratories, Inc.
Cercacor is an independent entity spun-off from us to our stockholders in 1998. Joe Kiani, our Chairman and Chief Executive Officer, is also the Chairman and Chief Executive Officer of Cercacor. . We are a party to a cross-licensing agreement with Cercacor, which was amended and restated effective January 1, 2007 (the Cross-Licensing Agreement), which governs each party’s rights to certain intellectual property held by the two companies.
The following table outlines our rights under the Cross-Licensing Agreement relating to specific end user markets and the related technology applications of specific measurements.
|
End User Markets
|
||||
|
Measurements
|
Professional Caregiver and
Alternate Care Market
|
Patient and Pharmacist
|
||
|
Vital Signs
(1)
|
Masimo
(owns)
|
Cercacor
(non-exclusive license)
|
||
|
Non-Vital Signs
(2)
|
Masimo
(exclusive license)
|
Cercacor
(owns or exclusive license)
|
||
______________
|
(1)
|
Vital Signs measurements include, but are not limited to, SpO
2
, peripheral venous oxygen saturation, mixed venous oxygen saturation, fetal oximetry, sudden infant death syndrome, ECG, blood pressure (noninvasive blood pressure, invasive blood pressure and continuous noninvasive blood pressure), temperature, respiration rate, CO
2
, pulse rate, cardiac output, EEG, perfusion index, depth of anesthesia, cerebral oximetry, tissue oximetry and/or EMG, and associated features derived from these measurements, such as 3D alarms
®
, PVi
®
and other features.
|
|
(2)
|
Non-Vital Signs measurements include the body fluid constituents other than vital signs measurements and include, but are not limited to, carbon monoxide, methemoglobin, blood glucose, hemoglobin and bilirubin.
|
Our License to Cercacor.
We granted Cercacor an exclusive, perpetual and worldwide license, with sublicense rights, to use our Masimo SET
®
technology, including all improvements, for the monitoring of non-vital signs measurements and to develop and sell devices incorporating Masimo SET
®
for monitoring non-vital signs measurements in the “Cercacor Market”. The Cercacor Market consists of any product market in which a product is intended to be used by a patient or pharmacist rather than a professional medical caregiver regardless of the particular location of the sale, including sales to doctors, hospitals, alternate care market professionals or otherwise, provided the product is intended to be recommended, or resold, for use by the patient or pharmacist. We also granted Cercacor a non-exclusive, perpetual and worldwide license, with sublicense rights, to use Masimo SET
®
for the measurement of vital signs in the Cercacor Market. In exchange, Cercacor pays us a 10% royalty on the amount of vital signs sensors and accessories sold by Cercacor.
Cercacor’s License to us.
We exclusively license from Cercacor the right to make and distribute products in the “Masimo Market” that utilize rainbow
®
technology for the measurement of carbon monoxide, methemoglobin, fractional arterial oxygen saturation, and hemoglobin, which includes hematocrit. The Masimo Market consists of any product market where the product is intended to be used by a professional medical caregiver, including hospital caregivers, surgicenter caregivers, paramedic vehicle caregivers, doctors’ offices caregivers, alternate care facility caregivers and vehicles where alternative care services are provided. We also have the option to obtain exclusive licenses to make and distribute products in the Masimo Market that utilize rainbow
®
technology for the monitoring of other non-vital signs measurements, including blood glucose. We have 180 days after proof of feasibility to exercise the above-referenced option to obtain a license for the measurement of blood glucose
17
for an additional $2.5 million and licenses for other non-vital signs measurements for an additional $0.5 million each. The licenses are exclusive until the later of 20 years from the grant of the applicable license or the expiration of the last patent included in the rainbow
®
technology related to the applicable measurements. To date, we have developed and commercially released devices that measure carbon monoxide, methemoglobin and hemoglobin using licensed rainbow
®
technology. We also make and distribute products that monitor respiration rate via rainbow Acoustic Monitoring
®
, which is a Masimo-developed rainbow
®
technology and, therefore, is not required to be licensed from Cercacor. During the year ended December 28, 2013, we exercised our right to license from Cercacor five additional non-vital sign measurements for $0.5 million each, or $2.5 million in the aggregate. As the result of new data in fiscal 2015 related to these five additional non-vital sign measurements, we and Cercacor terminated these licenses during fiscal 2015, and Cercacor agreed to refund the amounts previously paid by us for these licenses.
Our license to rainbow
®
technology for these measurements in these markets is exclusive on the condition that we continue to pay Cercacor royalties on our products incorporating rainbow
®
technology, subject to certain minimum aggregate royalty thresholds, and that we use commercially reasonable efforts to develop or market products incorporating the licensed rainbow
®
technology. The royalty is up to 10% of the rainbow
®
royalty base, which includes handhelds, tabletop and multiparameter devices. Handheld products incorporating rainbow
®
technology carry a 10% royalty rate. For other products, only the proportional amount attributable to that portion of our devices used to monitor non-vital signs measurements, rather than to monitoring vital signs measurements, and sensors and accessories for measuring only non-vital sign parameters are included in the 10% rainbow
®
royalty base. For multiparameter devices, the rainbow
®
royalty base includes the percentage of the revenue based on the number of rainbow
®
-enabled measurements. For hospital contracts where we place equipment and enter into a sensor contract, we pay a royalty to Cercacor on the total sensor contract revenue based on the ratio of rainbow
®
enabled devices to total devices. During the year ended
December 31, 2016
and going forward, we are subject to certain specific annual minimum aggregate royalty payment obligations of $5.0 million per year.
Change in Control
. The Cross-Licensing Agreement provides that, upon a change in control:
|
•
|
if the surviving or acquiring entity ceases to use “Masimo” as a company name and trademark, all rights to the “Masimo” trademark will be assigned to Cercacor;
|
|
•
|
the option to license technology developed by Cercacor for use in blood glucose monitoring will be deemed automatically exercised and a $2.5 million license fee for this technology will become immediately payable to Cercacor; and
|
|
•
|
the minimum aggregate annual royalties payable to Cercacor for carbon monoxide, methemoglobin, fractional arterial oxygen saturation, hemoglobin and/or glucose will increase to $15.0 million per year until the exclusivity period of the agreement ends, plus up to $2.0 million for each additional measurement with no maximum ceiling for non-vital sign measurements.
|
For purposes of the Cross-Licensing Agreement, a change in control includes any of the following with respect to us or Cercacor:
|
•
|
the sale of all or substantially all of either company’s assets to a non-affiliated third-party;
|
|
•
|
the acquisition by a non-affiliated third-party of 50% or more of the voting power of either company;
|
|
•
|
Joe Kiani, our Chief Executive Officer and the Chief Executive Officer of Cercacor, resigns or is terminated from his position with either company; or
|
|
•
|
the merger or consolidation of either company with a non-affiliated third-party.
|
Ownership of Improvements
. Any improvements to Masimo SET
®
or rainbow
®
technology made by Cercacor, by us, or jointly by Cercacor with us or with any third-party that relates to non-vital signs monitoring, and any new technology acquired by Cercacor, is and will be owned by Cercacor. Any improvements to the Masimo SET
®
platform or rainbow
®
technology made by Cercacor, by us, or jointly by Cercacor with us or with any third-party that relates to vital signs monitoring, and any new technology acquired by us, is and will be owned by us. However, for both non-vital signs and vital signs monitoring, any improvements to the technology, excluding acquired technology, will be assigned to the other party and will be subject to the terms of the licenses granted under the Cross-Licensing Agreement. Any new non-vital signs monitoring technology utilizing Masimo SET
®
that we develop will be owned by Cercacor and will be subject to the same license and option fees as if it had been developed by Cercacor. Also, we will not be reimbursed by Cercacor for our expenses relating to the development of any such technology.
Other Agreements with Cercacor.
We have also entered into various other agreements with Cercacor, including an Administrative Services Agreement, a Consulting Services Agreement and a Sublease Agreement. See Note 4 to our accompanying consolidated financial statements included in Part IV, Item 15(a) of this Annual Report on Form 10-K for additional information on these agreements and other transactions with Cercacor.
18
As a result of recent changes in the capital structure of Cercacor, as well as certain of its contractual relationships with us, we completed a re-evaluation of the authoritative consolidation guidance during the year ended
December 31, 2016
and determined that, although Cercacor remains a variable interest entity, we are no longer its primary beneficiary. Based on such determination, we discontinued consolidating Cercacor within our consolidated financial statements effective as of January 3, 2016. However, Cercacor continues to be consolidated within our consolidated financial information for all periods prior to January 3, 2016. See Note 3 to our accompanying consolidated financial statements included in Part IV, Item 15(a) of this Annual Report on Form 10-K for additional information.
Government Regulation
As a global medical technology company, we are subject to significant government regulation, compliance requirements, fees and costs, both in the U.S. and abroad. These regulatory requirements subject our products and our business to numerous risks that are specifically discussed within “Risks Related to Our Regulatory Environment” under Part I, Item 1A
—
“Risk Factors” within this Annual Report on Form 10-K. A summary of certain critical aspects of our regulatory environment is included below.
U.S. Food and Drug Administration (FDA) Premarket Clearance and Approval Requirements
The FDA, along with other federal, state and local authorities, regulates our products and product-related activities. Pursuant to the U.S. Food, Drug, and Cosmetic Act (FDCA) and the regulations promulgated under that Act, the FDA regulates the design, development, clinical trials, testing, manufacture, packaging, labeling, storage, distribution and promotion of medical devices. We endeavor to ensure that our products and procedures remain in compliance with all applicable FDA regulations, but the regulations regarding the manufacture and sale of our products are subject to change. We cannot predict the effect, if any, that these changes might have on our business, financial condition and results of operations. Unless an exemption applies, each medical device that we wish to market in the U.S. must first receive from the FDA either 510(k) clearance, by filing a 510(k) premarket notification or premarket application (PMA) approval, after submitting a PMA. Alternatively, the device may be cleared through the
de novo
classification process by the FDA.
The FDA’s 510(k) clearance process usually takes from four to nine months, but it can take longer. The process of obtaining PMA approval or
de novo
classification is much more costly, lengthy and uncertain than the process of obtaining 510(k) clearance. We cannot be sure that 510(k) clearance, PMA approval or
de novo
classification will be obtained for any product we propose to market on a timely basis or at all. In addition, if the FDA discovers that an applicant has submitted false or misleading information, the FDA may refuse to review submissions until certain requirements are met pursuant to its Application Integrity Policy.
Although an applicant may initially choose whether to submit a 510(k) notification for clearance, a PMA for approval or a
de novo
request for classification, the FDA decides which pathway is appropriate based upon statutory criteria. These criteria include the level of risk that the agency perceives is associated with the device and a determination of whether the product is substantially equivalent to another legally marketed predicate device. Devices deemed to pose relatively less risk are placed in either Class I or II. In general, manufacturers are required to submit a premarket notification requesting 510(k) clearance for Class II devices unless an exemption applies.
Class I devices are those for which safety and effectiveness can be reasonably assured by adherence to the FDA’s general regulatory controls (General Controls) for medical devices, which include compliance with the applicable portions of the FDA’s Quality System Regulations (QSRs) facility registration and product listing, reporting of adverse medical events and malfunctions, and appropriate, truthful and non-misleading labeling, advertising and promotional materials. While most Class I devices are exempt from the 510(k) premarket notification process, some Class I devices also require 510(k) clearance by the FDA.
Class II devices are subject to the FDA’s General Controls, the FDA’s QSR, including the Design Control regulations, and any other special controls deemed necessary by the FDA to provide reasonable assurance of the safety and effectiveness of the device. Premarket review and clearance by the FDA for Class II devices is accomplished through the 510(k) premarket notification procedure. The majority of our current regulated devices are classified as Class II devices while only a few are classified as Class I devices.
Class III devices are those deemed by the FDA to pose the greatest risk, such as life-sustaining, life-supporting or implantable devices, or those devices deemed not substantially equivalent to a legally marketed predicate device. Due to the risk level associated with Class III devices, the FDA has determined that general and special controls alone are insufficient to assure the safety and effectiveness of the device. These Class III devices must be approved through the PMA approval process during which the manufacturer must provide reasonable assurance of safety and effectiveness for the intended use(s) of the device to the FDA’s satisfaction. A PMA application must be supported by valid scientific evidence, including extensive preclinical
19
(including bench tests and laboratory and animal studies) and clinical studies as well as information about the device and its components regarding, among other things, device design, manufacturing and labeling. Also during the review period, an advisory panel of experts from outside the FDA may be convened to review and evaluate the application and provide recommendations to the FDA as to the approvability of the device. As part of the PMA application review, the FDA will conduct a preapproval inspection of the manufacturing facility to ensure compliance with the FDA’s QSRs. If the FDA approves the PMA, it may place restrictions on the device or the labeling or require additional clinical studies, monitoring or other post-market requirements. If the FDA’s evaluation of the PMA application or the manufacturing facility is not favorable, the FDA may deny approval of the PMA application or issue a “not approvable” letter. The FDA may also require additional clinical trials, which can delay the PMA approval process by several years or otherwise make obtaining PMA approval infeasible. None of our products are currently approved under the PMA process.
To obtain 510(k) clearance, a company must submit a premarket notification demonstrating substantial equivalence between the proposed device and a legally marketed “predicate” device, which is defined as a legally marketed device, that (i) was legally marketed prior to May 28, 1976, for which the FDA has not yet called for submission of a PMA application; (ii) has been reclassified from Class III to Class II or Class I; (iii) has been cleared through the 510(k) premarket notification process; or (iv) has been previously determined to be exempt from the 510(k) process.. After a device receives 510(k) clearance, any modification that could significantly affect its safety or effectiveness, or that would constitute a major change or modification in its intended use, requires a new 510(k) clearance or could require a PMA approval or
de novo
classification. The FDA requires each manufacturer to make this determination in the first instance, but the FDA can review this decision. If the FDA disagrees with a manufacturer’s decision not to seek a new 510(k) clearance, PMA approval or
de novo
classification, the agency may retroactively require the manufacturer to seek 510(k) clearance, PMA approval or
de novo
classification. The FDA can also require the manufacturer to cease marketing and/or recall the modified device until 510(k) clearance, PMA approval or
de novo
classification is obtained.
A clinical trial may be required in support of a 510(k) submission and generally is required for a PMA application or
de novo
classification request. These trials generally require an Investigational Device Exemption (IDE) application approved in advance by the FDA for a specified number of patients, unless the proposed study is deemed to be exempt from the IDE requirements. In addition, if the study meets the requirements for a non-significant risk study, it may be eligible for compliance with “abbreviated” IDE requirements, which include a subset of the requirements applicable to significant risk medical devices studies. If a complete IDE is required, the IDE application must be supported by appropriate data, such as animal and laboratory testing results, protocols for the proposed investigation and other information demonstrating that the device is appropriate for use with humans in a clinical study. Clinical trials may begin if the IDE application is approved by the FDA and the appropriate institutional review boards (IRBs) at the clinical trial sites. Submission of an IDE application does not give assurance that the FDA will issue the IDE. If the IDE application is approved, there can be no assurance the FDA will determine that the data derived from the trials support the safety and effectiveness of the device or warrant the continuation of clinical trials. An IDE supplement must be submitted to and approved by the FDA before a sponsor or investigator may make a change to the investigational plan that may affect its scientific soundness, study indication or the rights, safety or welfare of human subjects. The trial must also comply with the FDA’s regulations, including the requirement that informed consent be obtained from each subject, and with clinical trial reporting regulations that require us to submit information on certain clinical trials to a database maintained by the National Institutes of Health. Even if a trial is completed, the results of clinical testing may not adequately demonstrate the safety and efficacy of the device or may otherwise not be sufficient to obtain FDA clearance or approval to market the product in the U.S.
We believe that our OEM partners may be required to obtain 510(k) premarket clearance from the FDA for certain of their products that incorporate Masimo SET
®
technology, Masimo rainbow SET
™
technology, Masimo Board-in-Cable technology or Masimo sensors. In order to facilitate our OEM partners in obtaining 510(k) clearance for their products that incorporate Masimo SET
®
or Masimo rainbow SET
™
boards and sensors, we grant our OEM partners a right to cross-reference the 510(k) submission files from our cleared Masimo SET
®
circuit boards, sensors, cables and notification systems.
We market our
MightySat
™
fingertip pulse oximeter for general health and wellness use. We are marketing this product in accordance with the FDA’s current policy and enforcement discretion which indicates that pulse oximeters that are not intended for medical purposes can be marketed directly to consumers without first obtaining 510(k) clearance. We cannot assure you that the FDA will not change its policy regarding the regulation of these products. If the FDA changes its policy, we may be required to seek 510(k) clearance to market this pulse oximeter. We also may be required to cease marketing and/or recall the product until we obtain a new 510(k) clearance.
The regulatory regime is subject to change by Congress or the FDA. For example, in December 2016, Congress enacted the 21st Century Cures Act (Cures Act), which contained several provisions related to the review and approval of new medical technologies. Along with other changes, the Cures Act established a statutory program for “breakthrough” devices, defined as devices intended to treat or diagnose a life-threatening or irreversibly debilitating disease and which represents a breakthrough
20
technology, has no approved/cleared alternatives, offers significant advantages over approved/cleared alternatives, or the availability of the device is in the best interest of patients. The FDA will apply additional resources to help speed the approval or clearance of devices that are designated as breakthrough devices. The Cures Act also included provisions related to the “least burdensome” principle and expanded the number of patients that could be treated using a device approved under a Humanitarian Device Exemption, among other provisions.
User Fees
Pursuant to the Medical Device User Fee and Modernization Act of 2002 (MDUFMA), the Medical Device User Fee Amendments of 2012 (MDUFA III) and provisions of the Food and Drug Administration Safety and Innovation Act (FDASIA), unless a specific exemption applies, both 510(k) submissions and PMA applications are subject to user fees. The PMA user fees are significantly higher. The current medical device user fee act expires later this year, and a new medical device user fee act is expected to be enacted in its place.
Pervasive and Continuing FDA Regulation
After a device is placed on the market, it continues to be subject to the FDA’s regulatory authority. The FDA regulatory requirements include:
|
•
|
product listing and establishment registration, which helps facilitate FDA inspections and other regulatory action;
|
|
•
|
unique device identification (UDI) registration, which identifies medical devices through their distribution and use;
|
|
•
|
QSRs and current good manufacturing practices, which requires manufacturers, including third-party manufacturers, to follow stringent design control, testing, change control, documentation and other quality assurance procedures during all aspects of the development and manufacturing process, including requirements for packaging, labeling and record keeping, complaint handling, corrective and preventive actions and internal auditing;
|
|
•
|
labeling control and advertising regulations, including FDA prohibitions against the promotion of products for uncleared, unapproved or off-label uses or indications;
|
|
•
|
clearance of product modifications that could significantly affect safety or efficacy or that would constitute a major change or modification in intended use of one of our cleared devices;
|
|
•
|
approval of product modifications that affect the safety or effectiveness of one of our future approved devices;
|
|
•
|
medical device reporting (MDR) regulations, which require that manufacturers comply with FDA requirements to report if their device may have caused or contributed to a death or serious injury, or if their device has malfunctioned in a way that would likely cause or contribute to a death or serious injury if the malfunction of the device or a similar device were to recur;
|
|
•
|
post-approval restrictions or conditions, including post-approval study commitments;
|
|
•
|
post-market surveillance requirements, which apply when necessary to protect the public health or to provide additional safety and effectiveness data for the device;
|
|
•
|
the FDA’s recall authority, whereby it can ask, or under certain conditions order, device manufacturers to recall from the market a product that is in violation of its conditions of approval, governing laws and/or regulations;
|
|
•
|
regulations pertaining to voluntary recalls; and
|
|
•
|
notices of corrections or removals.
|
We must also register with the FDA as a medical device manufacturer, list all products placed in commercial distribution and obtain all necessary state permits, licenses or other authorizations to operate our business. As a manufacturer, we are subject to announced and unannounced inspections by the FDA to determine our compliance with the FDA’s QSR and other regulations. Our OEM partners also are subject to inspection and market surveillance by the FDA to determine compliance with regulatory requirements.
If the FDA finds that we or one of our OEM partners have failed to comply with the FDA’s QSR, the agency can institute a wide variety of enforcement and other regulatory actions, including:
|
•
|
an FDA Form 483, which is issued by the FDA at the conclusion of an inspection when an investigator has observed any conditions that may constitute potential violations of the FDCA and related Acts;
|
|
•
|
a public warning letter that notifies a company of potential violations of the FDCA;
|
|
•
|
fines and monetary civil penalties against us and/or OEM partners;
|
|
•
|
delays in clearing or approving, or refusal to clear or approve, our products;
|
21
|
•
|
withdrawal or suspension of clearances and/or approvals of our products or those of our third-party suppliers by the FDA or other regulatory bodies;
|
|
•
|
product recall;
|
|
•
|
product detention or seizure;
|
|
•
|
interruption of production;
|
|
•
|
refusal to provide Certificates to Foreign Governments (CFGs), which may be necessary to permit the export of devices from the U.S. to other countries;
|
|
•
|
operating restrictions;
|
|
•
|
injunctions of future violations (including those agreed to in a consent decree); and
|
|
•
|
criminal prosecution.
|
The FDA also has the authority to request repair, replacement or refund of the cost of any medical device manufactured or distributed by us.
Advertising and Promotion
Advertising and promotion of medical devices, in addition to being regulated by the FDA, are also regulated by the Federal Trade Commission (FTC) and by federal and state regulatory and enforcement authorities, including the Department of Justice, the Office of Inspector General of the Department of Health and Human Services, and various state attorneys general. Although physicians are permitted to use their medical judgment to use medical devices for indications other than those cleared or approved by the FDA, we may not promote our products for such “off-label” uses and can only market our products for cleared or approved uses.
Promotional activities for FDA-regulated products of other companies have been the subject of FTC enforcement actions brought under healthcare reimbursement laws and consumer protection statutes. FTC enforcement actions often result in consent decrees that constrain future actions. In addition, under the federal Lanham Act and similar state laws, competitors and others can initiate litigation relating to advertising claims.
Import and Export Requirements
To import a device, the importer must file an entry notice and bond with the United States Bureau of Customs and Border Protection (CBP). All devices are subject to FDA examination before release from CBP. Any article that appears to be in violation of the FDCA may be refused admission and a notice of detention and hearing may be issued. If the FDA ultimately refuses admission, the CBP may issue a notice for redelivery and, if a company fails to redeliver the goods or otherwise satisfy CBP and the FDA with respect to their disposition, may assess liquidated damages for up to three times the value of the lot. The CBP also imposes its own regulatory requirements on the import of our products, including inspection and possible sanctions for noncompliance.
Products exported from the United States are subject to foreign countries’ import requirements and the exporting requirements of the FDA or European regulating bodies, as applicable. In particular, international sales of medical devices manufactured in the United States that are not approved or cleared by the FDA for use in the United States, or are banned or deviate from lawful performance standards, are subject to FDA export requirements.
Foreign countries often require, among other things, a CFG for export. To obtain a CFG, the device manufacturer must apply to the FDA. The FDA certifies that the product has been granted clearance or approval in the United States and that the manufacturing facilities were in compliance with the FDA’s QSR regulations at the time of the last FDA inspection.
Foreign Regulation Regarding Clearance and Approval
Many foreign countries in which we market or may market our products have regulatory bodies and restrictions similar to those of the FDA. International sales are subject to foreign government regulation, the requirements of which vary substantially from country to country. The time required to obtain approval by a foreign country may be longer or shorter than that required for FDA clearance and the requirements may differ.
In particular, marketing of medical devices in the European Union (EU) is subject to compliance with the Medical Devices Directive 93/92/EEC (MDD). A medical device may be placed on the market within the EU only if it conforms to certain “essential requirements” and bears the CE Mark. The most fundamental and essential requirement is that a medical device must be designed and manufactured in such a way that it will not compromise the clinical condition or safety of patients, or the safety
22
and health of users and others. In addition, the device must achieve the essential performance(s) intended by the manufacturer and be designed, manufactured and packaged in a suitable manner.
Manufacturers must demonstrate that their devices conform to the relevant essential requirements through a conformity assessment procedure. The nature of the assessment depends upon the classification of the device. The classification rules are mainly based on three criteria: the length of time the device is in contact with the body, the degree of invasiveness and the extent to which the device affects the anatomy. Conformity assessment procedures for all but the lowest risk classification of device involve a notified body. Notified bodies are often private entities and are authorized or licensed to perform such assessments by government authorities. Manufacturers usually have some flexibility to select conformity assessment procedures for a particular class of device and to reflect their circumstances, e.g., the likelihood that the manufacturer will make frequent modifications to its products. Conformity assessment procedures require an assessment of available clinical evidence, literature data for the product and post-market experience in respect of similar products already marketed. Notified bodies also may review the manufacturer’s quality systems. If satisfied that the product conforms to the relevant essential requirements, the notified body issues a certificate of conformity, which the manufacturer uses as a basis for its own declaration of conformity and application of the CE Mark. Application of the CE Mark allows the product to be distributed throughout the EU. We maintain CE Marking on all of our products that require such markings.
Other U.S. and Foreign Regulation
We and our OEM partners also must comply with numerous federal, state and local laws relating to matters such as safe working conditions, manufacturing practices, environmental protection, fire hazard control and hazardous substance disposal. We cannot be sure that we will not be required to incur significant costs to comply with these laws and regulations in the future or that these laws or regulations will not hurt our business, financial condition and results of operations. Unanticipated changes in existing regulatory requirements or adoption of new requirements could hurt our business, financial condition and results of operations.
The Physician Payment Sunshine Act (Sunshine Act), which was enacted by Congress as part of the Affordable Care Act (ACA) in 2010, requires medical device companies to track and publicly report, with limited exceptions, all payments and transfers of value to physicians and teaching hospitals in the U.S. Implementing regulations for these tracking and reporting obligations were finalized in 2013, and companies are now required to track payments made and to report such payments to the government by March 31 of each year. In addition, in December 2005, the International Electrotechnical Commission published a revised version of its standard for medical electrical equipment, IEC, 60601-1:2005 (3rd edition). In this publication, standards are listed as general requirements concerning basic safety and the essential performance of equipment. These new standards were required to be in place by June 1, 2012 in Europe and by December 31, 2013 in the U.S. for new submissions. Failure to adhere to this regulation will prevent us from using our equipment in our clinical trials.
In addition, the International Electrotechnical Commission published a revised version of its standard for medical electrical equipment, IEC 60601-1:2005 (3rd edition) lists general requirements concerning basic safety and the essential performance of equipment and forms a minimum regulatory requirement for our products across jurisdictions. For example, compliance with this and related standards is considered as part of the conformity assessment procedure for our products in the EU. Failure to adhere to this standard will prevent us from placing our equipment on the market or using it in our clinical trials in many jurisdictions around the world.
Medical Device Tax
In March 2010, the U.S. Congress adopted and President Obama signed into law comprehensive health care reform legislation. Among other initiatives, commencing January 1, 2013, these laws imposed significant new taxes on medical device makers in the form of a 2.3% excise tax on U.S. medical device sales, with certain exemptions. For the year ended
January 2, 2016
, we recorded
$6.9 million
in medical device taxes that were included in selling, general and administrative expenses. In December 2015, the U.S. Congress adopted and President Obama signed into law a bill that includes a two-year suspension of the medical device tax. Accordingly, the excise tax does not apply to the sale of taxable medical devices during the period of January 1, 2016 through December 31, 2017. However, such tax may be reimposed on medical device makers beginning on January 1, 2018 if such suspension is not extended or the medical device tax is not permanently repealed.
Conflict Minerals and Supply Chain
We are subject to SEC rules adopted pursuant to the Dodd-Frank Wall Street Reform and Consumer Protection Act concerning “conflict minerals” (generally tin, tantalum, tungsten and gold) and similar rules are under consideration by the European Union (EU). Certain of these conflict minerals are used in the manufacture of our products. Although the rules are being challenged in court, in their present form they require us to investigate the source of any conflict minerals necessary to the production or functionality of our products. If any such conflict minerals originated in the Democratic Republic of the Congo or adjoining
23
countries (the DRC region), we must undertake comprehensive due diligence to determine whether such minerals financed or benefited armed groups in the DRC region. Since our supply chain is complex, our ongoing compliance with these rules could affect the pricing, sourcing and availability of conflict minerals used in the manufacture of our products.
We are also subject to disclosure requirements regarding abusive labor practices in portions of our supply chain under the California Transparency in Supply Chains Act.
Environmental
Our manufacturing processes involve the use, generation and disposal of solid wastes, hazardous materials and hazardous wastes, including silicone adhesives, solder and solder paste, sealants, epoxies and various solvents such as methyl ethyl ketone, acetone and isopropyl alcohol. As such, we are subject to stringent federal, state and local laws relating to the protection of the environment, including those governing the use, handling and disposal of hazardous materials and wastes. Products that we sell in Europe are subject to regulation in EU markets under the Restriction of Hazardous Substances Directive (RoHS). RoHS prohibits companies from selling products which contain certain hazardous materials, including lead, mercury, cadmium, chromium, polybrominated biphenyls and polybrominated diphenyl ethers, in EU member states. In addition, the EU’s Regulation-Registration, Evaluation, Authorization, and Restriction of Chemicals Directive also restricts substances of very high concern in products.
Future environmental laws may require us to alter our manufacturing processes, thereby increasing our manufacturing costs. We believe that our products and manufacturing processes at our facilities comply in all material respects with applicable environmental laws and worker health and safety laws; however, the risk of environmental liabilities cannot be completely eliminated.
Health Care Fraud and Abuse
In the U.S., there are federal and state anti-kickback laws that generally prohibit the payment or receipt of kickbacks, bribes or other remuneration in exchange for the referral of patients or other health-related business. For example, the Federal Anti-Kickback Statute (42 U.S.C. § 1320a-7b(b)) prohibits anyone from, among other things, knowingly and willfully offering, paying, soliciting or receiving any bribe, kickback or other remuneration intended to induce the referral of patients for, or the purchase, order or recommendation of, health care products and services reimbursed by a federal health care program, including Medicare and Medicaid. Recognizing that the federal anti-kickback law is broad and potentially applicable to many commonplace arrangements, Congress and the Office of Inspector General within the Department of Health and Human Services (OIG) have created statutory “exceptions” and regulatory “safe harbors”. Exceptions and safe harbors exist for a number of arrangements relevant to our business, including, among other things, payments to bona fide employees, certain discount and rebate arrangements, and certain payment arrangements involving GPOs. Although an arrangement that fits into one or more of these exceptions or safe harbors is immune from prosecution, arrangements that do not fit squarely within an exception or safe harbor do not necessarily violate the law, but the OIG or other government enforcement authorities may examine the practice to determine whether it involves the sorts of abuses that the statute was designed to combat. Violations of this federal law can result in significant penalties, including imprisonment, monetary fines and assessments, and exclusion from Medicare, Medicaid and other federal health care programs. Exclusion of a manufacturer, like us, would preclude any federal health care program from paying for its products. In addition to the federal anti-kickback law, many states have their own laws that are analogous to the federal anti-kickback law, but may apply regardless of whether any federal or state health care program business is involved. Federal and state anti-kickback laws may affect our sales, marketing and promotional activities, educational programs, pricing and discount practices and policies, and relationships with health care providers by limiting the kinds of arrangements we may have with hospitals, alternate care market providers, GPOs, physicians, payers and others in a position to purchase or recommend our products.
Federal and state false claims laws prohibit anyone from presenting, or causing to be presented, claims for payment to third-party payers that are false or fraudulent. For example, the Federal Civil False Claims Act (31 U.S.C. § 3729 et seq.) imposes liability on any person or entity who, among other things, knowingly and willfully presents, or causes to be presented, a false or fraudulent claim for payment by a federal health care program, including Medicaid and Medicare. Some suits filed under the False Claims Act, known as “qui tam” actions, can be brought by a “whistleblower” or “relator” on behalf of the government and such individuals may share in any amounts paid by the entity to the government in fines or settlement. Manufacturers, like us, can be held liable under false claims laws, even if they do not submit claims to the government, where they are found to have caused submission of false claims by, among other things, providing incorrect coding or billing advice about their products to customers that file claims, or by engaging in kickback arrangements or off-label promotion with customers that file claims. A number of states also have false claims laws, and some of these laws may apply to claims for items or services reimbursed under Medicaid and/or commercial insurance. Sanctions under these federal and state fraud and abuse laws may include civil monetary penalties and criminal fines, exclusion from government health care programs and imprisonment.
24
The Health Insurance Portability and Accountability Act of 1996 (HIPAA) created new federal crimes, including health care fraud and false statements related to health care matters. The health care fraud statute prohibits, among other things, knowingly and willfully executing a scheme to defraud any health care benefit program, including those offered by private payers. The false statements statute prohibits, among other things, knowingly and willfully falsifying, concealing or covering up a material fact or making any materially false, fictitious or fraudulent statement in connection with the delivery of or payment for health care benefits, items or services. A violation of either statute is a felony and may result in fines, imprisonment and other significant penalties.
The Foreign Corrupt Practices Act of 1977 and similar worldwide anti-bribery laws in non-U.S. jurisdictions generally prohibit companies and their intermediaries from making improper payments to non-U.S. officials for the purpose of obtaining or retaining business.
Due to the breadth of some of these laws, it is possible that some of our current or future practices might be challenged under one or more of these laws. In addition, there can be no assurance that we would not be required to alter one or more of our practices to be in compliance with these laws. Evolving interpretations of current laws or the adoption of new federal or state laws or regulations could adversely affect many of the arrangements we have with customers and physicians. Therefore, our risk of being found in violation of these laws is increased by the fact that some of these laws are broad and open to interpretation.
Privacy and Security of Health Information
Numerous federal, state and international laws and regulations, including HIPAA, govern the collection, use and disclosure of patient-identifiable or protected health information (PHI). HIPAA applies to covered entities, which include most healthcare facilities that purchase and use our products, and their business associates. The HIPAA Privacy Rule restricts the use and disclosure of PHI, and requires covered entities and their business associates to safeguard that information and to provide certain rights to individuals with respect to that information. The HIPAA Security Rule establishes detailed requirements for safeguarding PHI transmitted or stored electronically. Although we are not a covered entity, we are sometimes deemed to be a business associate of covered entities due to activities that we perform for or on behalf of covered entities, such as training customers on the use of our products or investigating product performance. As business associates, we are subject to many of the requirements of HIPAA and could be directly subject to HIPAA civil and criminal enforcement and the associated penalties for violation of the Privacy, Security and Breach Notification Rules.
The HIPAA standards also apply to the use and disclosure of PHI for research and generally require the covered entity performing the research to obtain the written authorization of the research subject (or an appropriate waiver) before providing that subject’s PHI to sponsors like us for purposes related to the research. These covered entities also typically impose contractual limitations on our use and disclosure of the PHI they disclose to us. We may be required to make costly system modifications to comply with the privacy and security requirements that will be imposed on us and our failure to comply may result in liability and adversely affect our business.
Numerous other federal and state laws protect the confidentiality of PHI, including state medical privacy laws and federal and state consumer protection laws. These various laws in many cases are not preempted by the HIPAA rules and may be subject to varying interpretations by the courts and government agencies, creating complex compliance issues for us and our customers and potentially exposing us to additional expense, adverse publicity and liability. Other countries also have, or are developing, laws governing the collection, use and transmission of health information, and these laws could create liability for us or increase our cost of doing business.
Third-Party Reimbursement
Health care providers, including hospitals, that purchase our products generally rely on third-party payers, including the Medicare and Medicaid programs and private payers, including indemnity insurers and managed care plans, to cover and reimburse all or part of the cost of the products and the procedures in which they are used. As a result, demand for our products is dependent in part on the coverage and reimbursement policies of these payers. No uniform coverage or reimbursement policy for medical technology exists among all third-party payers, and coverage and reimbursement can differ significantly from payer to payer.
Centers for Medicare and Medicaid Services (CMS), the federal agency responsible for administering the Medicare program, along with its contractors, establish coverage and reimbursement policies for the Medicare program. Because a large percentage of our products are used in the treatment of elderly or disabled individuals who are Medicare beneficiaries, Medicare’s coverage and reimbursement policies are particularly significant to our business. In addition, private payers often follow the coverage and reimbursement policies of Medicare.
25
In general, Medicare will cover a medical product or procedure when the product or procedure is reasonable and necessary for the diagnosis or treatment of an illness or injury, or to improve the functioning of a malformed body part. Even if the medical product or procedure is considered medically necessary and coverage is available, Medicare may place restrictions on the circumstances where it provides coverage. For example, several Medicare local contractors have issued policies that restrict coverage for pulse oximetry in hospital inpatient and outpatient settings to a limited number of conditions, including limiting coverage to patients who (i) exhibit signs of acute respiratory dysfunction, (ii) have chronic lung disease, severe cardiopulmonary disease or neuromuscular disease involving the muscles of respiration, (iii) are under treatment with a medication with known pulmonary toxicity, or (iv) have sustained multiple trauma or complaints of acute chest pain.
Reimbursement for our products may vary not only by the type of payer involved but also based upon the setting in which the product is furnished and utilized. For example, Medicare payment may be made, in appropriate cases, for patient stays in the hospital inpatient and outpatient settings involving the use of our products. Medicare generally reimburses hospitals based upon prospectively determined amounts. For hospital inpatient stays, the prospective payment generally is determined by the patient’s condition and other patient data and procedures performed during the inpatient stay, using a classification system known as Medicare Severity Diagnosis-Related Groups (MS-DRGs). Prospective rates are adjusted for, among other things, regional differences, co-morbidity and complications. Hospitals generally do not receive separate Medicare reimbursement for the specific costs of purchasing our products for use in the inpatient setting. Rather, Medicare reimbursement for these costs is deemed to be included within the prospective payments made to hospitals for the inpatient services in which the products are utilized.
In contrast, some differences may be seen in the reimbursement for use of our products in hospital outpatient departments. In this setting, Medicare payments also are generally made under a prospective payment system based on the ambulatory payment classifications (APCs) under which individual items and procedures are categorized. Hospitals receive the applicable APC payment rate for the procedure regardless of the actual cost for such treatment. Some outpatient services such as oximetry services do not receive separate reimbursement. Rather, their reimbursement is deemed packaged into the APC for an associated procedure and the payment for that APC does not vary whether or not the packaged procedure is performed. Some procedures also are paid through Composite APCs, which are APCs that establish a payment rate that applies when a specific combination of services is provided. Reimbursement for certain pulse oximetry monitoring services, including those using our products, may be separately payable when they are the only service provided to the patient on that day, packaged if provided with certain critical care services, or reimbursed through a composite APC when provided in connection with certain other services.
Because payments through the Prospective Payment System in both the hospital inpatient and outpatient settings are based on predetermined rates and may be less than a hospital’s actual costs in furnishing care, hospitals have incentives to lower their operating costs by utilizing products that will reduce the length of inpatient stays, decrease labor or otherwise lower their costs. If hospitals cannot obtain adequate coverage and reimbursement for our products, or the procedures in which they are used, we cannot be certain that they will purchase our products, despite the clinical benefits and opportunity for cost savings that we believe can be derived from their use.
Our success with rainbow SET
™
technologies in U.S. settings of care with reimbursable monitoring procedures, such as hospital emergency departments, hospital procedure labs, and the physician office may largely depend on the ability of providers to receive reimbursement for such procedures. While private insurance payers generally follow Medicare coding and payment, we cannot be certain of this and, in many cases, cannot control the coverage or payment rates that private insurance payers put in place. In addition, the ACA, as well as the enactment of other legislation or regulations, could affect future payment for services involving the use of our products.
Our success in non-U.S. markets depends largely upon the availability of coverage and reimbursement from the third-party payers through which health care providers are paid in those markets. Health care payment systems in non-U.S. markets vary significantly by country, and include single-payer government managed systems, as well as systems in which private payers and government managed systems exist side-by-side. Our ability to achieve market acceptance or significant sales volume in international markets we enter will be dependent in large part on the availability of reimbursement for procedures performed using our products under health care payment systems in such markets.
Competition
The medical device industry is highly competitive and many of our competitors have substantially greater financial, technical, marketing and other resources than we do. While we regard any company that sells pulse oximeters as a potential customer, we also recognize that the companies selling pulse oximeters on an OEM basis and/or pulse oximetry sensors are also potential competitors. Our primary competitor, Medtronic plc (Medtronic, formerly Covidien Ltd.), currently holds a substantial share of the pulse oximetry market. Medtronic sells its own brand of Nellcor pulse oximeters to end-users, sells pulse oximetry modules
26
to other monitoring companies on an OEM basis, and licenses to certain OEMs the right to make their pulse oximetry platforms compatible with their sensors. We also face substantial competition from larger medical device companies, including companies that develop products that compete with our proprietary Masimo SET
®
and our OEM partners. We believe that a number of companies have announced products that claim to offer motion-tolerant accuracy. Based on those announcements and our investigations, we further believe that many of these products include technology that infringes our intellectual property rights. We have settled claims against some of these companies and intend to vigorously enforce and protect our proprietary rights with respect to the others whom we believe are infringing our technology.
We believe that the principal competitive factors in the market for pulse oximetry products include:
|
•
|
accurate monitoring during both patient motion and low perfusion;
|
|
•
|
ability to introduce other clinically beneficial measurements related to oxygenation and respiration, such as noninvasive and continuous hemoglobin and acoustic respiration rate;
|
|
•
|
competitive pricing, including bundling practices;
|
|
•
|
brand recognition and perception of innovation abilities;
|
|
•
|
sales and marketing capability;
|
|
•
|
access to hospitals which are members of GPOs;
|
|
•
|
recent proliferation of integrated delivery networks;
|
|
•
|
access to OEM partners; and
|
|
•
|
patent protection.
|
Seasonality
The healthcare business in the United States and overseas is typically subject to quarterly fluctuations in hospital and other alternative care admissions. Historically, our third fiscal quarter revenues have generally experienced a sequential decline from our second fiscal quarter revenues. We believe this is primarily due to the summer vacation season during which people tend to avoid elective procedures. Another factor affecting the seasonality of our quarterly revenues is the traditional “flu season” that often increases hospital and acute care facility admissions in the first and fourth calendar quarters. Because our non-sales variable operating expenses often do not fluctuate in the same manner as our quarterly product sales, this may cause fluctuations in our quarterly operating income that are disproportionate to fluctuations in our quarterly revenue.
Sales and Marketing
We have sales and marketing employees in the U.S. and abroad. We expect to moderately increase our worldwide sales and sales support organizations as we continue to expand our presence throughout both the U.S. and the world, including Europe, the Middle East, Asia, Latin America, Canada and Australia. We currently sell all of our medical products both directly to hospitals and the alternate care market via our sales force and certain distributors. We sell our non-medical/consumer products through e-commerce Internet sites such as Amazon.com.
The primary focus of our sales representatives is to facilitate the conversion of competitor accounts to our Masimo SET
®
and rainbow SET
™
pulse oximetry products, to expand the use of Masimo SET
®
and Patient SafetyNet on the general floor and to create and expand the use of rainbow
®
measurements in both critical care and non-critical care areas. In addition to sales representatives, we employ clinical specialists to work with our sales representatives to educate end-users on the benefits of Masimo SET
®
and assist with the introduction and implementation of our technology and products to their sites. Our sales and marketing strategy for pulse oximetry has been and will continue to be focused on building end-user awareness of the clinical and cost-saving benefits of our Masimo SET
®
platform. More recently, we have expanded this communication and educational role to include our Masimo rainbow
®
Pulse CO-Oximetry and rainbow Acoustic Monitoring
®
products, including hemoglobin, carboxyhemoglobin, methemoglobin, PVi
®
, acoustic respiration rate and Halo Index
™
.
For the year ended
December 31, 2016
, two just-in-time distributors, Owens & Minor and Cardinal Health, represented approximately
14.0%
and
12.8%
, respectively, of our total revenue. These were the only two customers that represented 10% or more of our revenue for the year ended
December 31, 2016
. Importantly, these two distributors take and fulfill orders from our direct customers, many of which have signed long-term sensor purchase agreements with us. As a result, in the event a specific just-in-time distributor is unable to fulfill these orders, the orders would be redirected to other distributors or fulfilled directly by us.
27
Additionally, we sell certain of our products through our OEM partners who both incorporate our boards into their monitors and resell our sensors to their customers’ installed base of Masimo SET
®
products. Our OEM agreements allow us to expand the availability of Masimo SET
®
through the sales and distribution channels of each OEM partner. To facilitate clinician awareness of Masimo SET
®
installations, all of our OEM partners have agreed to place the Masimo SET
®
logo prominently on their instruments.
In order to facilitate our U.S. direct sales to hospitals, we have signed contracts with what we believe to be the five largest national GPOs in the U.S., based on the total volume of negotiated purchases. In return for the GPOs putting our products on contract, we have agreed to pay the GPOs a percentage of our revenue from their member hospitals. In
2016
and
2015
, revenue from the sale of our pulse oximetry products to hospitals that are associated with GPOs amounted to
$375.0 million
and
$337.4 million
, respectively.
Our marketing efforts are designed to build end-user awareness through digital and print advertising, direct mail and trade shows. In addition, we distribute published clinical studies, provide product education for doctors, nurses, biomedical engineers and respiratory therapists and assist with product evaluations.
Intellectual Property
We believe that in order to maintain a competitive advantage in the marketplace, we must develop and maintain protection of the proprietary aspects of our technology. We rely on a combination of patent, trademark, trade secret, copyright and other intellectual property rights and measures to protect our intellectual property.
We have developed a patent portfolio internally, and, to a lesser extent, through acquisitions and licensing, that covers many aspects of our product offerings. As of
December 31, 2016
, we had
598
issued patents and
315
pending applications in the U.S., Europe, Japan, Australia, Canada and other countries throughout the world. Our issued U.S. patents have expiration dates (not including any patent term extensions) from 2018 to 2036. Additionally, as of
December 31, 2016
, we owned
68
U.S. registered trademarks and
234
foreign registered trademarks, as well as trade names that we use in conjunction with the sale of our products. Our trademarks are perpetually renewable.
Under the Cross-Licensing Agreement, we and Cercacor have agreed to allocate proprietary ownership of technology developed based on the functionality of the technology. We will have proprietary ownership, including ownership of all patents, copyrights and trade secrets, of all technology related to the noninvasive monitoring of vital signs measurements, and Cercacor will have proprietary ownership of all technology related to the noninvasive monitoring of non-vital signs measurements. We also rely upon trade secrets, continuing technological innovations and licensing opportunities to develop and maintain our competitive position. We seek to protect our trade secrets and proprietary know-how, in part, with confidentiality agreements with consultants, vendors and employees, although we cannot be certain that the agreements will not be breached or that we will have adequate remedies for any breach.
There are risks related to our intellectual property rights. For further detail on these risks, see “Risks Related to Our Intellectual Property” under Item 1A
—
“Risk Factors” in this on Form 10-K.
Research and Product Development
We believe that ongoing research and development efforts are essential to our success. Our research and development efforts focus primarily on continuing to enhance our technical expertise in pulse oximetry, expanding our noninvasive monitoring of other measurements and developing remote alarm and monitoring solutions.
Although we and Cercacor each have separate research and development projects, we collaborate with Cercacor on multiple research and development activities related to rainbow
®
technology and other technologies. Under the Cross-Licensing Agreement, the parties have agreed to allocate proprietary ownership of technology developed by either party based on the functionality of the technology. We will have proprietary rights to all technology related to the noninvasive measurement of vital signs measurements, and Cercacor will have proprietary ownership of all technology related to the noninvasive monitoring of non-vital signs measurements.
Our total research and development expenditures for fiscal year
2016
were
$59.4 million
. In fiscal year
2015
, our total research and development expenditures were
$56.6 million
, which included
$6.3 million
related to expenses incurred by Cercacor. We expect our research and development expenses to increase moderately in fiscal year
2017
and beyond as we expand our research and development staff, enhance our existing products and technologies and develop new products for market introduction.
28
Manufacturing
Our strategy is to manufacture products in-house when it is efficient and cost-effective for us to do so. We currently manufacture our bedside and handheld pulse oximeters, our full line of disposable and reusable sensors and most of our patient cables in-house. We maintain an approximate
15,000
square foot manufacturing area in our facility in Irvine, California, and an approximate
149,000
square foot manufacturing facility in Mexicali, Mexico, both of which are International Organization for Standardization (ISO) 13485:2012 certified. We also maintain an approximate
90,000
square foot facility in Hudson, New Hampshire, a portion of which is used to manufacture advanced light emitting diodes and other advanced component-level technologies. In addition, we maintain an ISO 13485:2012 certified facility approximating
16,400
square feet in Danderyd, Sweden, a portion of which is used to manufacture ultra-compact mainstream and sidestream capnography and gas monitoring technologies. We will continue to utilize third-party contract manufacturers for products and subassemblies that can be more efficiently manufactured by these parties, such as our circuit boards. We monitor our third-party manufacturers and perform inspections and product tests at various steps in the manufacturing cycle to ensure compliance with our specifications. We also do full functional testing of our circuit boards.
For raw materials, we and our contract manufacturers rely on sole source suppliers for some components, including digital signal processor chips and analog to digital converter chips. We and our contract manufacturers have taken steps to minimize the impact of a shortage or stoppage of shipments of digital signal processor chips or analog to digital converter chips, including maintaining a safety stock of inventory and designing software that may be easily ported to another digital signal processor chip. We believe that our sources of supply for components and raw materials are adequate. In the event of a delay or disruption in the supply of sole source components, we believe that we and our contract manufacturers will be able to locate additional sources of these sole source components on commercially reasonable terms and without experiencing material disruption in our business or operations.
We have agreements with certain major suppliers and each agreement provides for varying terms with respect to contract expiration, termination and pricing. Most of these agreements allow for termination upon specified notice, ranging from four to twelve months, to the non-terminating party. Certain of these agreements with our major suppliers allow for pricing adjustments, each agreement provides for annual pricing negotiation, and one agreement also guarantees us the most favorable pricing offered by the supplier to any of its other customers.
Employees
As of
December 31, 2016
, we had approximately
1,243
full-time employees and approximately
3,050
dedicated contract employees worldwide.
Address
Our principal executive offices are located at 52 Discovery, Irvine, California 92618, and our telephone number at that address is (949) 297-7000. Our website address is www.masimo.com. Our annual reports on Form 10-K, quarterly reports on Form 10-Q, proxy statements, current reports on Form 8-K and amendments to those reports filed or furnished pursuant to Section 13(a) or 15(d) of the Securities Exchange Act of 1934, as amended, are available free of charge at www.masimo.com as soon as reasonably practicable after electronically filing such reports with the SEC. Any information contained on, or that can be accessed through, our website is not incorporated by reference into, nor is it in any way a part of, this Annual Report on Form 10-K.
29
|
ITEM 1A.
|
RISK FACTORS
|
The following risk factors and other information included in this Annual Report on Form 10-K should be carefully considered. The risks and uncertainties described below are not the only ones we face. Additional risks and uncertainties not presently known to us or that we presently deem less significant may also impair our business operations. If any of the following risks come to fruition, our business, financial condition, results of operations and future growth prospects would likely be materially and adversely affected. In these circumstances, the market price of our common stock could decline, and you could lose all or part of your investment.
Risks Related to Our Revenues
We currently derive the majority of our revenue from our Masimo SET
®
platform, Masimo rainbow SET
™
platform and related products. If this technology and the related products do not continue to achieve market acceptance, our business, financial condition and results of operations would be adversely affected.
We are highly dependent upon the continued success and market acceptance of our proprietary Masimo SET
®
technology that serves as the basis of our primary product offerings. Continued market acceptance of products incorporating Masimo SET
®
will depend upon us continuing to provide evidence to the medical community that our products are cost-effective and offer significantly improved performance compared to conventional pulse oximeters. Health care providers that currently have significant investments in competitive pulse oximetry products may be reluctant to purchase our products. If hospitals and other health care providers do not believe our Masimo SET
®
platform is cost-effective, safe or more accurate or reliable than competitive pulse oximetry products, they may not buy our products in sufficient quantities to enable us to generate revenue growth from the sale of these products. In addition, allegations regarding the safety and effectiveness of our products, whether or not substantiated, may impair or impede the acceptance of our products. If we are unable to achieve additional market acceptance of our core technology or products incorporating Masimo SET
®
, we will not generate significant revenue growth from the sale of our products, which would adversely affect our business, financial condition and results of operations.
Some of our products, including those based on licensed rainbow
®
technology, are in development or have been recently introduced into the market and may not achieve market acceptance, which could limit our growth and adversely affect our business, financial condition and results of operations.
Products that we have introduced into the market in recent years, including, but not limited to, those based on rainbow
®
technology, a technology that we license, may not be accepted in the market. In general, our recent noninvasive measurement technologies are considered disruptive. These recent technologies have performance levels that we believe are acceptable for many clinical environments but may be insufficient in others. In addition, these technologies may perform better in some patients and settings than others. Over time, we hope to continue to improve the performance of these technologies and educate the clinical community on how to properly evaluate them. If we are successful in these endeavors, we expect these technologies will become more useful in more environments and will become more widely adopted. While this is the adoption pattern experienced historically with other new noninvasive measurements, such as regional oximetry, we are unable to guarantee that such adoption pattern will apply to our recent and future technologies.
Even if our customers recognize the benefits of our products, we cannot assure you that our customers will purchase them in quantities sufficient for us to be profitable or successful. We are continuing to invest in significant sales and marketing resources to achieve market acceptance of these products with no assurance of success.
The degree of market acceptance of these products will depend on a number of factors, including:
|
•
|
perceived clinical benefits from our products;
|
|
•
|
perceived cost effectiveness of our products;
|
|
•
|
perceived safety and effectiveness of our products;
|
|
•
|
reimbursement available through Centers for Medicare and Medicaid Services (CMS) programs for using some of our products; and
|
|
•
|
introduction and acceptance of competing products or technologies.
|
If our products do not gain market acceptance or if our customers prefer our competitors’ products, our potential revenue growth would be limited, which would adversely affect our business, financial condition and results of operations.
30
Our ability to commercialize new products, new or improved technologies and additional applications for Masimo SET
®
and our licensed rainbow
®
technology is limited to certain markets by our Cross-Licensing Agreement with Cercacor Laboratories, Inc. (Cercacor), which may impair our growth and adversely affect our business, financial condition and results of operations.
In May 1998, we spun off a newly-formed entity, Cercacor, and provided it rights to use Masimo SET
®
to commercialize non-vital signs monitoring applications, while we retained the rights to Masimo SET
®
to commercialize vital signs monitoring applications. On May 2, 1998, we entered into a cross-licensing agreement with Cercacor, which has been amended several times, most recently in an Amended and Restated Cross-Licensing Agreement, effective January 1, 2007 (the Cross-Licensing Agreement). Under the Cross-Licensing Agreement, we granted Cercacor:
|
•
|
an exclusive, perpetual and worldwide license, with sublicense rights, to use all Masimo SET
®
owned by us, including all improvements on this technology, for the monitoring of non-vital signs parameters and to develop and sell devices incorporating Masimo SET
®
for monitoring non-vital signs parameters in any product market in which a product is intended to be used by a patient or pharmacist rather than by a professional medical caregiver, which we refer to as the Cercacor Market; and
|
|
•
|
a non-exclusive, perpetual and worldwide license, with sublicense rights, to use all Masimo SET
®
for measurement of vital signs in the Cercacor Market.
|
Non-vital signs measurements consist of body fluid constituents other than vital signs measurements, including, but not limited to, carbon monoxide, methemoglobin, blood glucose, hemoglobin and bilirubin. Under the Cross-Licensing Agreement, we are only permitted to sell devices utilizing Masimo SET
®
for the monitoring of non-vital signs parameters in markets where the product is intended to be used by a professional medical caregiver, including, but not limited to, hospital caregivers and alternate care facility caregivers, rather than by a patient or pharmacist, which we refer to as the Masimo Market. Accordingly, our ability to commercialize new products, new or improved technologies and additional applications for Masimo SET
®
is limited. In particular, our inability to expand beyond the Masimo Market may limit our ability to maintain or increase our revenue and impair our growth.
Pursuant to the Cross-Licensing Agreement, we have licensed from Cercacor the right to make and distribute products in the Masimo Market that utilize rainbow
®
technology for certain noninvasive measurements. As a result, the opportunity to expand the market for our products incorporating rainbow
®
technology is also limited, which could limit our ability to maintain or increase our revenue and impair our growth.
We face competition from other companies, many of which have substantially greater resources than we do. If we do not successfully develop and commercialize enhanced or new products that remain competitive with products or alternative technologies developed by others, we could lose revenue opportunities and customers, and our ability to grow our business would be impaired, adversely affecting our financial condition and results of operations.
The medical device industry is intensely competitive and is significantly affected by new product introductions and other market activities of industry participants. A number of our competitors have substantially greater capital resources, larger customer bases, larger sales forces and greater geographic presence, have established stronger reputations with specific customers, and have built relationships with Group Purchasing Organizations (GPOs) that may be more effective than ours. Our Masimo SET
®
platform faces additional competition from companies developing products for use with third-party monitoring systems, as well as from companies that currently market their own pulse oximetry monitors.
Rapid product development and technological advances within the medical device industry place our products at risk of obsolescence. Our long-term success depends upon the development and successful commercialization of new products, new or improved technologies and additional applications for Masimo SET
®
and licensed rainbow
®
technology. The research and development process is time-consuming and costly and may not result in products or applications that we can successfully commercialize. In particular, we may not be able to successfully commercialize our products for applications other than arterial blood oxygen saturation and pulse rate monitoring, such as for respiration rate, hemoglobin, carboxyhemoglobin and methemoglobin monitoring.
If we do not successfully adapt our products and applications both within and outside these measurements, we could lose revenue opportunities and customers. Furthermore, one or more of our competitors may develop products that are substantially equivalent to our U.S. Food and Drug Administration (FDA) cleared products, or those of our original equipment manufacturer (OEM) partners, in which case a competitor of ours may use our products or those of our OEM partners as predicate devices to more quickly obtain FDA clearance of their competing products. Competition could result in pressure from our customers to reduce the price of our products and in fewer orders for our products, which could, in turn, cause a reduction in our revenues and product gross margins, thereby adversely impacting our business, financial condition and results of operations.
31
We depend on our domestic and international OEM partners for a portion of our revenue. If they do not devote sufficient resources to the promotion of products that use Masimo SET
®
and licensed rainbow
®
technology, our business would be harmed.
We are, and will continue to be, dependent upon our domestic and international OEM partners for a portion of our revenue through their marketing, selling and distribution of certain of their products that incorporate Masimo SET
®
and licensed rainbow
®
technology. Although we expect that our OEM partners will accept and actively market, sell and distribute products that incorporate licensed rainbow
®
technology, they may not elect, and have no contractual obligation, to do so. Because products that incorporate our technologies may represent a relatively small percentage of business for some of our OEM partners, they may have less incentive to promote these products over other products that do not incorporate these technologies. In addition, some of our OEM partners offer products that compete with ours and also may be involved in intellectual property disputes with us. Therefore, we cannot guarantee that our OEM partners, or any company that may acquire any of our OEM partners, will vigorously promote products incorporating Masimo SET
®
and licensed rainbow
®
technology. The failure of our OEM partners to successfully market, sell or distribute products incorporating these technologies, the termination of OEM agreements, the loss of OEM partners or the inability to enter into future OEM partnership agreements would have a material adverse effect on our business, financial condition and results of operations.
If we fail to maintain or develop relationships with GPOs, sales of our products would decline.
Our ability to sell our products to U.S. hospitals depends, in part, on our relationships with GPOs. Many existing and potential customers for our products are members of GPOs. GPOs negotiate beneficial pricing arrangements and contracts, which are sometimes exclusive, with medical supply manufacturers and distributors.
These negotiated prices are made available to a GPO’s affiliated hospitals and other members. If we are not one of the providers selected by a GPO, the GPO’s affiliated hospitals and other members may be less likely or unlikely to purchase our products. If a GPO has negotiated a strict sole source, market share compliance or bundling contract for another manufacturer’s products, we may be prohibited from making sales to members of such GPO for the duration of such contractual arrangement. For the years ended
December 31, 2016
,
January 2, 2016
and
January 3, 2015
, shipments of our pulse oximetry products to customers that are members of GPOs represented approximately
$375.0 million
,
$337.4 million
and
$309.9 million
, respectively, of our revenue from sales to U.S. hospitals. Our failure to renew our contracts with GPOs may cause us to lose market share and could have a material adverse effect on our business, financial condition and results of operations. In addition, if we are unable to develop new relationships with GPOs, our competitive position would likely suffer and our opportunities to grow our revenues and business would be harmed.
Certain GPOs are creating, coordinating and facilitating regional purchasing coalition (RPC) supply chain networks that include anti-competitive practices such as sole sourcing and bundling. These RPCs circumvent and potentially violate rules of conduct for GPOs and have the effect of reducing product purchasing decisions available to the hospitals that belong to these regional organizations. If the GPOs and RPCs are permitted to continue practices that limit, reduce or eliminate competition, we could lose customers who are no longer able to choose to purchase our products, resulting in lower sales that could adversely affect our business, financial condition and results of operations.
Inadequate levels of coverage or reimbursement from governmental or other third-party payers for our products, or for procedures using our products, may cause our revenue to decline.
Sales of our products depend in part on the reimbursement and coverage policies of governmental and private health care payers. The ability of our health care provider customers, including hospitals, to obtain adequate coverage and reimbursement for our products or the procedures in which our products are used may impact our customers’ purchasing decisions. Therefore, our customers’ inability to obtain adequate coverage and reimbursement for our products or reimbursement for the procedures in which our products are used would have a material adverse effect on our business.
Third-party payers have adopted, and are continuing to adopt, health care policies intended to curb rising health care costs. These policies include, among others:
|
•
|
controls on reimbursement for health care services and price controls on medical products and services;
|
|
•
|
limitations on coverage and reimbursement for new medical technologies and procedures; and
|
|
•
|
the introduction of managed care and prospective payment systems in which health care providers contract to provide comprehensive health care for a fixed reimbursement amount per person or per procedure.
|
We cannot guarantee that governmental or third-party payers will reimburse, or continue to reimburse, a customer for the cost of our products or the procedures in which our products are used. In fact, some payers have indicated that they are not willing to reimburse for certain of our products or for certain of the procedures in which our products are used. For example, some insurance carriers have issued policies denying coverage for transcutaneous hemoglobin measurement on the grounds that the
32
technology is investigational in the outpatient setting. Other payers are continuing to investigate our products to determine if they will provide reimbursement to our customers. While we are working with these payers to obtain reimbursement, we may not be successful. These trends could lead to pressure to reduce prices for our current and future products and could cause a decrease in the size of the market or a potential increase in competition that could have a material adverse effect on our business, financial condition and results of operations.
Our customers may reduce, delay or cancel purchases due to a variety of factors, such as lower hospital census levels or third-party guidelines, or may require that we reduce the price of our products, which could adversely affect our business, financial condition and results of operations.
Our customers are facing growing levels of uncertainties, including variations in overall hospital census for paying patients and the impact of such census variations on hospital budgets. As a result, many hospitals are reevaluating their entire cost structure, including the amount of capital they allocate to medical device technologies and products. Such developments could have a significant negative impact on our OEM customers who, due to their traditionally larger capital equipment sales model, could see declines in purchases from their hospital customers. This, in turn, could reduce our board sales to our OEM customers.
In addition, certain of our products, including our rainbow
®
measurements such as carbon monoxide, methemoglobin and hemoglobin, that are sold with upfront license fees and more complex and expensive sensors, could also be impacted by hospital budget reductions.
States and other local regulatory authorities may issue guidelines regarding the appropriate scope and use of our products from time to time. For example, some of our noninvasive monitoring devices may be subject to authorization by individual states as part of the Emergency Medical Services scope of practice procedures. Although a lack of inclusion into scope of practice procedures does not prohibit usage, it may limit adoption.
Additionally, as a result of the continued consolidation in the health care industry, we may experience decreasing prices for our products due to the potential increased market pricing power of our health care provider customers. If these and other competitive forces drive down the price of our products, and we are not able to counter that pressure with cost reductions to our existing products or the introduction of new higher priced products, our product gross profit margins will decline. This, in turn, could have a material adverse effect on our business, financial condition and results of operations.
The loss of any large customer or distributor, or any cancellation or delay of a significant purchase by a large customer, could reduce our net sales and harm our operating results.
We have a concentration of OEM, distribution and direct customers. We cannot provide any assurance that we will retain our current customers, groups of customers or distributors, or that we will be able to attract and retain additional customers in the future. If for any reason we were to lose our ability to sell to a specific group or class of customers, or through a distributor, we could experience a significant reduction in revenue, which would adversely impact our operating results. For the years ended
December 31, 2016
,
January 2, 2016
and
January 3, 2015
, we had sales through two just-in-time distributors, which in total represented approximately
26.8%
,
26.3%
and
25.1%
of our total revenue, respectively.
Some of our just-in-time distributors have been demanding higher fees, which we may be forced to pay in order to continue to offer products to our customers or which may force us to distribute our products directly to our customers. The loss of any large customer or distributor, or an increase in distributor fees, could have a material adverse effect on our business, financial condition and results of operations.
Imitation Masimo sensors and third-party medical device reprocessors that reprocess our single-patient-use sensors may harm our reputation. Also, these imitation and third-party reprocessed sensors, as well as genuine Masimo reprocessed sensors, are sold at lower prices than new Masimo sensors and could cause our revenue to decline, which may adversely affect our business, financial condition and results of operations.
We are aware that other organizations are manufacturing and selling imitation Masimo sensors. In addition, we are aware that certain medical device reprocessors have been collecting our used single-patient-use sensors from hospitals and then reprocessing, repackaging and reselling those sensors to hospitals. These imitation and third-party reprocessed sensors are sold at lower prices than new Masimo sensors.
Our experience with both these imitation sensors and third-party reprocessed sensors is that they provide inferior performance, increased sensor consumption, reduced comfort and a number of monitoring problems. Notwithstanding these limitations, some of our customers have indicated a willingness to consider purchasing some of their sensor requirements from these imitation manufacturers and third-party reprocessors in an effort to reduce their sensor costs. These imitation and reprocessed sensors have led and may continue to lead to confusion with our genuine Masimo products; have reduced and may continue to reduce our revenue; and, in some cases, have harmed and may continue to harm our reputation if customers conclude incorrectly that these imitation or reprocessed sensors are original Masimo sensors.
33
In addition, we have expended a significant amount of time and expense investigating issues caused by imitation and reprocessed sensors, troubleshooting problems stemming from such sensors, educating customers about why imitation and reprocessed sensors do not perform to their expectations, enforcing our proprietary rights against the imitation manufacturers and reprocessors, and enforcing our contractual rights under our customer contracts.
In response to these imitation sensors and third-party reprocessors, we offer to our customers our own Masimo reprocessed sensors, which we re-manufacture and test to ensure that they meet the same performance specifications as our new Masimo sensors. In addition, we have incorporated X-Cal
®
technology into certain products to ensure our customers get the performance they expect by using genuine Masimo sensors and that such sensors do not continue to be used beyond their useful life. We believe this technology will help ensure that hospitals, clinicians and, ultimately, their patients receive true Masimo measurement quality and performance, and will curtail some of the harm to us that results when customers experience performance and other problems with imitation and reprocessed sensors. However, some customers may object to the X-Cal
®
technology, potentially resulting in the loss of customers and revenues. In addition, reprocessed sensors sold by us are generally offered at a lower price and, therefore, may reduce certain customer demand for our new sensors. As a result, increased sales of genuine Masimo reprocessed sensors may result in lower revenues, which could negatively impact our business, financial condition and results of operations.
From time to time, we may carry out strategic initiatives that may not be viewed favorably by our customers, or that could negatively impact our business, financial condition and results of operations.
We expect to continue to carry out strategic initiatives and investments that we believe are necessary to grow our revenues and expand our business, both in the U.S. and abroad. For example, since 2013, we have made incremental investments in additional sales force resources whose primary focus is to work with hospitals to identify new opportunities for certain noninvasive measurement technologies. We also intend to continue to invest in international expansion programs designed to increase our worldwide presence and take advantage of market expansion opportunities around the world. Although we believe these initiatives and investments continue to be in the long-term best interests of Masimo and our stockholders, there are no assurances that such initiatives and investments will yield favorable results for us.
Accordingly, if these initiatives and investments are not viewed favorably by our customers, our business, financial condition and results of operations could be adversely affected.
Risks Related to Our Intellectual Property
If the patents we own or license, or our other intellectual property rights, do not adequately protect our technologies, we may lose market share to our competitors and be unable to operate our business profitably.
Our success depends significantly on our ability to protect our rights to the technologies used in our products, including Masimo SET
®
and licensed rainbow
®
technology. We rely on patent protection, trade secrets and a combination of copyright and trademark laws, as well as nondisclosure, confidentiality and other contractual arrangements, to protect our technology and rights. However, these legal means afford only limited protection and may not adequately protect our rights or permit us to gain or maintain any competitive advantage. In addition, we cannot be assured that any of our pending patent applications will result in the issuance of a patent to us. The PTO may deny or require a significant narrowing of claims in our pending patent applications, and patents issued as a result of the pending patent applications, if any, may not provide us with significant commercial protection or may not be issued in a form that is advantageous to us. We could also incur substantial costs in proceedings before the PTO.
As part of the Leahy-Smith America Invents Act (the Leahy-Smith Act), which was enacted in 2011, the PTO has introduced procedures that provide additional administrative pathways for third parties to challenge issued patents. IPR is one of these procedures. The number of IPR challenges filed is increasing, and in many cases, the PTO is canceling or significantly narrowing issued patent claims. Accordingly, even if a patent is granted by the PTO, there is a risk that it may not withstand an IPR challenge. IPR challenges could increase the uncertainties and costs associated with the maintenance, enforcement and defense of our issued and future patents and could have a material adverse effect on our business, financial condition and results of operations. In addition, recent case law has increased uncertainty regarding the availability of patent protection for certain technologies and the costs associated with obtaining patent protection for those technologies. Some of our patents related to our Masimo SET
®
algorithm technology began to expire in March 2011. Additionally, upon the expiration of other issued or licensed patents, we may lose some of our rights to exclude competitors from making, using, selling or importing products using the technology based on the expired patents. While we seek to offset potential losses relating to important expiring patents by securing additional patents on commercially desirable improvements, there can be no assurance that we will be successful in securing such additional patents, or that such additional patents will adequately offset the effect of expiring patents. For example, the U.S. Supreme Court has ruled on several patent cases in recent years, either narrowing the scope of patent protection available in certain circumstances or weakening the rights of patent owners in certain situations.
34
In addition to increasing uncertainty with regard to our ability to obtain patents in the future, this combination of events has created uncertainty with respect to the value of patents once obtained. Depending on decisions by the U.S. Congress, the federal courts and the PTO, the laws and regulations governing patents could change in unpredictable ways that would weaken our ability to obtain new patents or to enforce patents that we might obtain in the future. Additionally, there is no assurance that competitors will not be able to design around our patents.
We also rely on contractual rights with the third parties that license technology to us to protect our rights in such licensed technology. In addition, we rely on unpatented proprietary technology. We cannot assure you that we can meaningfully protect all of our rights in our unpatented proprietary technology or that others will not independently develop substantially equivalent proprietary products or processes or otherwise gain access to our unpatented proprietary technology.
We seek to protect our know-how and other unpatented proprietary technology with confidentiality agreements and intellectual property assignment agreements with our employees, OEM partners, independent distributors and consultants. However, such agreements may not be enforceable or may not provide meaningful protection for our proprietary information in the event of unauthorized use or disclosure or other breaches of the agreements or in the event that our competitors discover or independently develop similar or identical designs or other proprietary information. In addition, we rely on the use of registered and common law trademarks with respect to the brand names of some of our products. Common law trademarks provide less protection than registered trademarks. Loss of rights in our trademarks could adversely affect our business, financial condition and results of operations.
Furthermore, the laws of foreign countries may not protect our intellectual property rights to the same extent as the laws of the U.S. If we fail to apply for intellectual property protection or if we cannot adequately protect our intellectual property rights in these foreign countries, our competitors may be able to compete more effectively against us, which could adversely affect our competitive position, as well as our business, financial condition and results of operations.
If third parties claim that we infringe their intellectual property rights, we may incur liabilities and costs and may have to redesign or discontinue selling certain products.
Companies in the medical device industry have used intellectual property litigation to gain a competitive advantage in the marketplace. We face the risk of claims that we have infringed on third parties’ intellectual property rights. Searching for existing intellectual property rights may not reveal important intellectual property and our competitors may also have filed for patent protection, which is not publicly-available information, or claimed trademark rights that have not been revealed through our searches. In addition, some of our employees were previously employed at other medical device companies. We may be subject to claims that our employees have disclosed, or that we have used, trade secrets or other proprietary information of our employees’ former employers. Our efforts to identify and avoid infringing on third parties’ intellectual property rights may not always be successful. Any claims of patent or other intellectual property infringement against us, even those without merit, could:
|
•
|
increase the cost of our products;
|
|
•
|
be expensive and time consuming to defend;
|
|
•
|
result in us being required to pay significant damages to third parties;
|
|
•
|
force us to cease making or selling products that incorporate the challenged intellectual property;
|
|
•
|
require us to redesign, reengineer or rebrand our products, product candidates and technologies;
|
|
•
|
require us to enter into royalty or licensing agreements in order to obtain the right to use a third-party’s intellectual property on terms that may not be favorable or acceptable to us;
|
|
•
|
require us to indemnify third parties pursuant to contracts in which we have agreed to provide indemnification for intellectual property infringement claims;
|
|
•
|
divert the attention of our management and other key employees;
|
|
•
|
result in our customers or potential customers deferring or limiting their purchase or use of the affected products impacted by the claims until the claims are resolved; and
|
|
•
|
otherwise have a material adverse effect on our business, financial condition and results of operations.
|
In addition, new patents obtained by our competitors could threaten the continued commercialization of our products in the market even after they have already been introduced.
We believe competitors may currently be violating and may in the future violate our intellectual property rights, and we may bring additional litigation to protect and enforce our intellectual property rights, which may result in substantial expense and may divert management’s attention from implementing our business strategy.
35
We believe that the success of our business depends, in significant part, on obtaining patent protection for our products and technologies, defending our patents and preserving our trade secrets. We were previously involved in significant litigation to protect our patent position and may be required to engage in further litigation. In 2006, we settled a costly, six-year lawsuit against Mallinckrodt, Inc., part of Tyco Healthcare, and one of its subsidiaries, Nellcor Puritan Bennett, Inc., in which we claimed infringement of some of our pulse oximetry signal processing patents.
In November 2015, we settled multiple litigations with Mindray DS USA, Inc., Shenzhen Mindray Bio-Medical Electronics Co., Ltd. and Mindray Medical International Ltd.
In November 2016, we entered into a Settlement Agreement with Koninklijke Philips N.V., with respect to certain patent infringement and antitrust claims, as well as other contractual disputes, which is described in Note 15 to our accompanying consolidated financial statements under the caption “Litigation” included in Part IV, Item 15(a) of this Annual Report on Form 10-K.
Our ongoing and future litigation could result in significant additional costs and further divert the attention of our management and key personnel from our business operations and the implementation of our business strategy and may not be adequate to protect our intellectual property rights.
Risks Related to Our Regulatory Environment
Our failure to obtain and maintain FDA clearances or approvals on a timely basis, or at all, would prevent us from commercializing our current or upgraded products in the U.S., which could severely harm our business.
Each medical device that we wish to market in the U.S. generally must first undergo premarket review by the FDA and receive clearance or approval pursuant to the Federal Food, Drug, and Cosmetic Act (FDCA) by receiving clearance of a 510(k) premarket notification, receiving clearance through the
de novo
review process, or obtaining approval of a premarket approval (PMA) application. Even if regulatory clearance or approval of a product is granted, the FDA may clear or approve our products only for limited indications for use, which would limit our ability to market the product to only such indications for use. We cannot guarantee that the FDA will grant 510(k) clearance on a timely basis, if at all, for new products or uses that we propose for Masimo SET
®
or licensed rainbow
®
technology. The traditional FDA 510(k) clearance process for our products has generally taken between three to six months. However, our more recent experience and interactions with the FDA, along with information we have received from other medical device manufacturers, suggests that, in some cases, the FDA is requiring applicants to provide additional or different information and data for 510(k) clearance than it had previously required; and that the FDA may not rely on approaches that it had previously accepted to support 510(k) clearance, thereby leading to more review cycles or to decisions by the FDA that our products are not substantially equivalent or require greater amounts of information to demonstrate substantial equivalence. As a result, we have experienced lengthier FDA 510(k) review periods over the past few years, which have delayed the 510(k) clearance process for our products.
To support our product applications to the FDA, we frequently are required to conduct clinical testing of our products. Such clinical testing must be conducted in compliance with the requirements of the FDA pertaining to human research. Among other requirements, we must obtain informed consent from human subjects and approval by institutional review boards before such studies may begin. We must also comply with other FDA requirements such as monitoring, recordkeeping, and reporting, including the submission of information regarding certain clinical trials to a database maintained by the National Institutes of Health. In addition, depending on the risk posed by a study, we may be required to obtain the FDA’s approval of the study under an Investigational Device Exemption (IDE). Compliance with these requirements can require significant time and resources and if the FDA determines that we have not complied with such requirements, it may refuse to consider the data to support our applications or initiate enforcement actions.
Even though 510(k) clearances have been obtained, if safety or effectiveness problems are identified with our pulse oximeters incorporating Masimo SET
®
and licensed rainbow
®
technology, patient monitor devices, sensors, cables and other products, we may need to initiate a recall of such devices. Furthermore, our new products or significantly modified marketed products could be denied 510(k) clearance and be required to undergo the more burdensome PMA or
de novo
review processes. The process of obtaining clearance of a
de novo
request or approval of a PMA is much more costly, lengthy and uncertain than the process for obtaining 510(k) clearance. Clearance of a
de novo
request generally takes six months to one year from the time of submission of the
de novo
request, although it can take longer. Approval of a PMA generally takes one to three years from the time of submission of the PMA, but may be longer.
We sell consumer versions of our iSpO
2
®
and MightySat
™
pulse oximeters that are not intended for medical use. We are marketing these products in accordance with the FDA’s current policy for products that are intended for wellness or fitness uses. Some of our products may also be exempted from the 510(k) process in accordance with specific FDA guidance and policies, such as the FDA guidance related to mobile medical applications. In addition, some of our products may not be subject to regulation under Section 520(o) of the FDCA, which was enacted as part of the 21st Century Cures Act (Cures Act) in
36
December 2016 and excludes certain software functions from the statutory definition of a device. We cannot assure you that the FDA will not change its policy regarding the regulation of these products. If the FDA changes its policy or concludes that our marketing of these products is not in accordance with its current policy and/or Section 520(o) of the FDCA, we may be required to seek clearance or approval of these devices through the 510(k),
de novo
or PMA processes.
The failure of our OEM partners to obtain required FDA clearances or approvals for products that incorporate our technologies could have a negative impact on our revenue.
Our OEM partners are required to obtain their own FDA clearances for products incorporating Masimo SET
®
and licensed rainbow
®
technology to market these products in the U.S. We cannot guarantee that the FDA clearances we have obtained will make it easier for our OEM partners to obtain clearances of products incorporating these technologies, or that the FDA will grant clearances on a timely basis, if at all, for any future product incorporating Masimo SET
®
and licensed rainbow
®
technology that our OEM partners propose to market.
If we or our suppliers fail to comply with ongoing regulatory requirements, or if we experience unanticipated problems with our products, these products could be subject to restrictions or withdrawal from the market.
Our products, along with the manufacturing processes, labeling and promotional activities for our products, are subject to continual review and periodic inspections by the FDA and other regulatory bodies. Among other requirements, we and our suppliers are required to comply with the FDA’s Quality System Regulation (QSR), which covers the methods and documentation of the design, control testing, production, component suppliers control, quality assurance, complaint handling, labeling control, packaging, storage and shipping of our products. The FDA enforces the QSR through announced and unannounced inspections. We are also subject to similar state requirements and licenses.
In 2013, the FDA inspected our facility in Irvine, California and issued an FDA Form 483 listing observations the investigator believed may constitute violations of statutes or regulations administered by the FDA, including observations relating to complaint handling, medical device reporting and corrective and preventative action (CAPA) procedures. In 2014, the FDA also inspected our facility in Mexicali, Mexico and issued a Form 483 listing observations relating to our CAPA procedures, documentation practices associated with our device history records and procedures for employee training. We submitted responses to both Form 483s. In August 2014, we received from the FDA a final inspection report closing out the Mexicali inspection and a warning letter (the Warning Letter) related to the Irvine inspection. We submitted a response (the Response Letter) to the Warning Letter and attended a regulatory meeting with the FDA in September 2014. At the meeting, in addition to discussing our Response Letter, the FDA raised issues beyond the scope of the Warning Letter in the areas of Good Manufacturing Practices, quality, bioresearch monitoring and labeling/promotion. Although the FDA has yet to close out the Warning Letter, the FDA issued certificates to foreign governments (CFGs) for products manufactured in our Irvine, California facility in January 2016, which allows us to continue to register and import products into certain countries that require CFGs. We do not know what further actions, if any, the FDA will take in connection with these issues. If we are unable to resolve the issues raised by the FDA, our business, financial condition and results of operations could be adversely affected.
Failure by us or one of our suppliers to comply with statutes and regulations administered by the FDA and other regulatory bodies or failure to adequately respond to any FDA Form 483 observations, any Food and Drug Branch notices of violation or any similar reports could result in, among other things, any of the following items:
|
•
|
warning letters or untitled letters issued by the FDA;
|
|
•
|
fines, civil penalties, in rem forfeiture proceedings, injunctions, consent decrees and criminal prosecution;
|
|
•
|
import alerts;
|
|
•
|
unanticipated expenditures to address or defend such actions;
|
|
•
|
delays in clearing or approving, or refusal to clear or approve, our products;
|
|
•
|
withdrawal or suspension of clearance or approval of our products or those of our third-party suppliers by the FDA or other regulatory bodies;
|
|
•
|
product recall or seizure;
|
|
•
|
orders for physician notification or device repair, replacement or refund;
|
|
•
|
interruption of production or inability to export to certain foreign countries; and
|
|
•
|
operating restrictions.
|
If any of these items were to occur, it would harm our reputation and adversely affect our business, financial condition and results of operations.
37
Failure to obtain regulatory authorizations in foreign jurisdictions may prevent us from marketing our products abroad.
We currently market and intend to continue to market our products internationally. Outside of the U.S., we can market a product only if we receive a marketing authorization and, in some cases, pricing approval, from the appropriate regulatory authorities. The regulatory registration/licensing process varies among international jurisdictions, may require additional product testing, and may differ from that required for obtaining FDA clearance. FDA clearance does not ensure new product registration/licensing by foreign regulatory authorities and we may be unable to obtain foreign regulatory registration/licensing on a timely basis, if at all. In addition, clearance by one foreign regulatory authority does not ensure clearance by any other foreign regulatory authority or by the FDA. If we fail to receive necessary approvals to commercialize our products in foreign jurisdictions on a timely basis, or at all, our business, financial condition and results of operations could be adversely affected.
Modifications to our marketed devices may require new regulatory clearances or premarket approvals, or may require us to cease marketing or to recall the modified devices until clearances or approvals are obtained.
We have made modifications to our devices in the past and we may make additional modifications in the future. Any modifications to an FDA-cleared device that could significantly affect its safety or effectiveness or that would constitute a major change in its intended use would require a new 510(k) clearance or possibly a
de novo
review or PMA. We may not be able to obtain such clearances or approvals in a timely fashion, or at all. Delays in obtaining future clearances would adversely affect our ability to introduce new or enhanced products in a timely manner, which in turn would have an adverse effect on our business, financial condition and results of operations. The standards for determining which modifications require a new 510(k) clearance are ambiguous, and the FDA may disagree with our conclusions. For those modifications that we conclude do not require a new 510(k), if the FDA disagrees with our conclusion and requires new clearances or approvals for the modifications, we may be required to recall and to stop marketing the modified devices, which could have an adverse effect on our business, financial condition and results of operations.
Federal regulatory reforms may make it difficult to maintain or attain approval to develop and commercialize our products and technologies.
From time to time, legislation is drafted and introduced in Congress that could significantly change the statutory provisions governing the clearance or approval, manufacture and marketing of medical devices. For example, in December 2016, Congress enacted the Cures Act, which contained several provisions related to the review and approval of new medical technologies. Along with other changes, the Cures Act established a statutory program for “breakthrough” devices, defined as a device intended to treat or diagnose a life-threatening or irreversibly debilitating disease or condition and (1) that represents a breakthrough technology, (2) that has no approved/cleared alternatives, (3) that offers significant advantages over approved/cleared alternatives or (4) the availability of the device is in the best interest of patients. The FDA will apply additional resources to help speed the approval or clearance of devices that are designated as breakthrough devices. The Cures Act also included provisions related to the “least burdensome” principle with respect to demonstrating substantial equivalence or reasonable assurance of safety and effectiveness and expanded the number of patients that could be treated by a device approved under a Humanitarian Device Exemption, among other provisions. In addition, the FDA regulations and guidance are often revised or reinterpreted by the FDA in ways that may significantly affect our business and our products. It is impossible to predict whether additional legislative changes will be enacted or whether FDA regulations, guidance or interpretations will be changed, and what the impact of such changes, if any, may be. However, any future regulatory changes could make it more difficult for us to maintain or attain approval to develop and commercialize our products and technologies.
If our products cause or contribute to a death or serious injury, or malfunction in a way that would likely cause or contribute to a death or serious injury, we will be subject to medical device reporting regulations, which can result in voluntary corrective actions or agency enforcement actions, including recall of our products.
Under the FDA medical device reporting regulations, we are required to report to the FDA any incident in which a product of ours may have caused or contributed to a death or serious injury or in which a product of ours malfunctioned and, if the malfunction were to recur, would likely cause or contribute to death or serious injury. In addition, all manufacturers placing medical devices in the European Union (EU) are legally required to report any serious or potentially serious incidents involving devices produced or sold by the manufacturer to the relevant authority in those jurisdictions where any such incident occurred.
The FDA and similar foreign governmental authorities have the authority to require the recall of our commercialized products in the event of material deficiencies or defects in, for example, design, labeling or manufacture. In the case of the FDA, the authority to require a recall generally must be based on an FDA finding that there is a reasonable probability that the device would cause serious injury or death. Manufacturers may, under their own initiative, recall a product if any material deficiency in a device is found or they become aware of a safety issue involving a marketed product. A government-mandated or voluntary recall by us or by one of our distributors could occur as a result of component failures, manufacturing errors, design or labeling defects or other deficiencies and issues.
38
We may initiate certain field actions, such as a correction or removal of our products in the future. A correction is a repair, modification, adjustment, relabeling, destruction or inspection of a device, without its physical removal from its point of use to some other location. A removal is the physical removal of a device from its point of use to some other location for repair, modification, adjustment, relabeling, destruction or inspection. If a correction or removal is initiated to reduce a health risk posed by our device, or to remedy a violation of the FDCA caused by the device that may present a risk to health, the correction or removal must be reported to the FDA. Recalls of any of our products would divert managerial and financial resources and have an adverse effect on our financial condition and results of operations.
From time to time, we have initiated various field actions related to our products as required by applicable law and regulations, including device corrections and removals, none of which were material to our operating results. Some of these field actions involved “reportable events” that were reported to the FDA and other foreign regulatory agencies within the appropriate regulatory timeframes. Because of our dependence upon patient and physician perceptions, any negative publicity associated with these or any future voluntary recalls could materially and adversely affect our business, financial condition, results of operations and growth prospects.
Promotion of our products using claims that are off-label, unsubstantiated, false or misleading could subject us to substantial penalties.
Obtaining 510(k) clearance permits us to promote our products for the uses cleared by the FDA. Use of a device outside its cleared or approved indications is known as “off-label” use. Physicians may use our products off-label because the FDA does not restrict or regulate a physician’s choice of treatment within the practice of medicine. While we may request additional cleared indications for our current products, the FDA may deny those requests, require additional expensive clinical data to support any additional indications or impose limitations on the intended use of any cleared product as a condition of clearance. If the FDA determines that we or our OEM partners have promoted our products for off-label use or have made false or misleading or inadequately substantiated promotional claims, it could request that we or our OEM partners modify those promotional materials or take regulatory or enforcement actions, including the issuance of an untitled letter, warning letter, injunction, seizure, civil fine and criminal penalties. It is also possible that other federal, state or foreign enforcement authorities may take action if they consider our promotional or training materials to constitute promotion of an uncleared or unapproved use. Although, depending on the facts and circumstances, such promotion might be protected speech under the First Amendment to the U.S. Constitution, we cannot be sure that government authorities or a court would accept such an argument. If not successfully defended, enforcement actions related to off-label promotion could result in significant fines or penalties under other statutory authorities, such as laws prohibiting false claims for reimbursement. In any such event, in addition to potential extensive fines and penalties, our reputation could be damaged and adoption of our products would be impaired. Although our policy is to refrain from statements that could be considered off-label promotion of our products, the FDA or another regulatory agency could conclude that we have engaged in off-label promotion.
In addition to promoting our products in a manner consistent with our clearances, we must have adequate substantiation for the claims we make for our products. If any of our claims are determined to be false, misleading or deceptive, our products could be considered to be misbranded under the FDCA or to violate the Federal Trade Commission Act.
We may be subject to or otherwise affected by federal and state health care laws, including fraud and abuse laws and health information privacy and security laws, and could face substantial penalties if we are unable to fully comply with these laws.
Although we do not provide health care services or receive payments directly from Medicare, Medicaid or other third-party payers for our products or the procedures in which our products are used, health care regulation by federal and state governments will impact our business. Health care fraud and abuse laws potentially applicable to our operations include, but are not limited to:
|
•
|
the Federal Anti-Kickback Statute, which prohibits, among other things, knowingly and willfully offering, paying, soliciting or receiving any bribe, kickback or other remuneration intended to induce the purchase, order or recommendation of an item or service reimbursable under a federal health care program (such as the Medicare or Medicaid programs);
|
|
•
|
the Federal False Claims Act and other federal laws which prohibit, among other things, knowingly and willfully presenting, or causing to be presented, claims for payment from Medicare, Medicaid or other third-party payers that are false or fraudulent;
|
|
•
|
the provisions of the federal Health Insurance Portability and Accountability Act of 1996 (HIPAA), which established federal crimes for knowingly and willfully executing a scheme to defraud any health care benefit program or making false statements in connection with the delivery of or payment for health care benefits, items or services; and
|
|
•
|
state laws analogous to each of the above federal laws, such as state anti-kickback and false claims laws that may apply to items or services reimbursed by governmental programs and non-governmental third-party payers, including commercial insurers, and state laws governing the privacy of certain patient identifiable health information (PHI).
|
39
Federal and state false claims laws prohibit anyone from presenting, or causing to be presented, claims for payment to third-party payers that are false or fraudulent. For example, the federal Civil False Claims Act imposes liability on any person or entity that, among other things, knowingly and willfully presents, or causes to be presented, a false or fraudulent claim for payment by a federal health care program, including Medicaid and Medicare.
Some suits filed under the Civil False Claims Act, known as “qui tam” actions, can be brought by a private individual, referred to as a “whistleblower” or “relator,” on behalf of the government, and such individuals may share in any amounts paid by the entity to the government in fines or settlement. Such complaints are filed under seal and remain sealed until the applicable court orders otherwise. In recent years, the number of suits brought by private individuals has increased dramatically. Manufacturers, like us, can be held liable under false claims laws, even if they do not submit claims to the government, if they are found to have caused medical care providers to have submitted claims to the government for payment for a service or the use of a device that is not properly covered for government reimbursement.
A number of states also have false claims laws, and some of these laws may apply to claims for items or services reimbursed under Medicaid and/or commercial insurance. Sanctions under these federal and state laws may include civil monetary penalties, exclusion of a manufacturer’s products from reimbursement under government programs and imprisonment. In particular, when an entity is determined to have violated the federal Civil False Claims Act, it may be required to pay up to three times the actual damages sustained by the government, plus civil penalties of $5,500 to $11,000 for each separate false claim.
We have certain arrangements with hospitals that may be affected by health care fraud and abuse laws. For instance, under our standard customer arrangements, we provide hospitals with free pulse oximetry monitoring devices in exchange for their agreement to purchase future pulse oximetry sensor requirements from us. In addition, we occasionally provide our customers with rebates in connection with their annual purchases. While we believe that these arrangements are structured such that we are currently in compliance with applicable federal and state health care laws, one or more of these arrangements may not meet the Federal Anti-Kickback Statute’s safe harbor requirements, which may result in increased scrutiny by government authorities that are responsible for enforcing these laws.
There can be no assurance that we will not be found to be in violation of any of such laws or other similar governmental regulations to which we are directly or indirectly subject and, as a result, we may be subject to penalties, including civil and criminal penalties, damages, fines, exclusion of our products from reimbursement under Medicare, Medicaid and other federal health care programs, and the curtailment or restructuring of our operations. Any penalties could adversely affect our ability to operate our business and our financial results. Any action against us for violation of these laws, even if we successfully defend against such action, could cause us to incur significant legal expenses and divert our management’s attention from the operation of our business.
Further, we are required to comply with federal and state laws governing the transmission, security and privacy of individually identifiable PHI that we may obtain or have access to in connection with the manufacture and sale of our products. We may be required to make costly system modifications to comply with the HIPAA privacy and security requirements.
In addition, if we do not properly comply with existing or new laws and regulations related to the protection of health information, we could be subject to criminal or civil sanctions, the potential enforcement of which is greater as a result of the Health Information Technology of Economic and Clinical Health Act.
Numerous other federal and state laws protect the confidentiality of PHI, including state medical information privacy laws, state social security number protection laws and state and federal consumer protection laws. In some cases, more protective state privacy and security laws are not preempted by HIPAA and may be subject to interpretation by various governmental authorities and courts, resulting in potentially complex compliance issues for us and our customers.
In addition, state and federal human subject protection laws apply to our receipt of individually identifiable PHI in connection with clinical research. These laws could create liability for us if one of our research collaborators uses or discloses research subject information without authorization and in violation of applicable laws.
We may incur significant costs and potential liabilities in defending our new products and technologies in various legal and other proceedings.
Our noninvasive measurement technologies are new and not yet widely understood or accepted. These new technologies may become the subject of various legal and other proceedings. We may incur significant costs in explaining and defending our new products and technologies in these proceedings, often to non-technical audiences. The outcomes of these proceedings are unpredictable and may result in significant liabilities, regardless of the merits of the claims made in the proceedings.
40
Legislative and regulatory changes in the health care industry could have a negative impact on our financial performance. Furthermore, our business, financial condition, results of operations and cash flows could be significantly and adversely affected by health care reform legislation in the U.S. or if reform programs are adopted in our key international markets.
Changes in the health care industry in the U.S. and elsewhere could adversely affect the demand for our products as well as the way in which we conduct our business. In 2010, President Obama signed health care reform legislation into law that required most individuals to have health insurance, established new regulations on health plans, created insurance pooling mechanisms and reduced Medicare spending on services provided by hospitals and other providers. Beginning in January 2013, this legislation also imposed significant new taxes on medical device makers in the form of a 2.3% excise tax on U.S. medical device sales, as well as related compliance and reporting obligations. Although President Obama signed into law a bill that included a two-year suspension of the medical device tax beginning in January 2016, such tax may be reimposed on medical device makers beginning in January 2018 if such suspension is not extended or the medical device tax is not permanently repealed.
Moreover, the Physician Payment Sunshine Act (the Sunshine Act), which was enacted by Congress as part of the Patient Protection and Affordable Care Act (the Affordable Care Act) in March 2010, requires medical device companies to track and publicly report, with limited exceptions, all payments and transfers of value to physicians and teaching hospitals in the U.S. Implementing regulations for these tracking and reporting obligations were finalized in 2013, and companies are now required to track payments made since August 2013. If we fail to comply with the data collection and reporting obligations imposed by the Sunshine Act, we may be subject to substantial civil monetary penalties.
In general, an expansion in the government’s role in the U.S. health care industry may lower reimbursements for our products, reduce demand for innovative products, reduce medical procedure volumes and adversely affect our business and results of operations, possibly in a material manner. In addition, as a result of the continued focus on health care reform, there is a risk that Congress may implement changes in laws and regulations governing health care service providers, including measures to control costs or reductions in reimbursement levels, which could result in pricing pressures, have an adverse effect on the demand for our products and/or negatively impact the prices that the market is willing to accept for our current and future products. We cannot predict the effect any future legislation or regulation will have on us or what health care initiatives, if any, will be implemented at the state level. Furthermore, many private payers look to Medicare’s coverage and reimbursement policies in setting their coverage policies and reimbursement amounts such that federal reforms could influence the private sector as well. Finally, many states also may attempt to reform their Medicaid programs such that either coverage for certain items or services may be narrowed or reimbursement for them could be reduced. These health care reforms may adversely affect our business.
Consistent with or in addition to Congressional or state reforms, CMS, the federal agency that administers the Medicare and Medicaid programs, could change its current policies that affect coverage and reimbursement for our products. For example, in 2007, CMS determined that certain uses of pulse oximetry monitoring are eligible for separate Medicare payment in the hospital outpatient setting when no separately payable hospital outpatient services are reported on the same date of service. However, CMS re-examines the reimbursement rates for hospital inpatient and outpatient and physician office settings each year and could either increase or decrease the reimbursement rate for procedures utilizing our products. We are unable to predict when legislation or regulation that affects our business may be proposed or enacted in the future or what effect any such legislation or regulation would have on our business. Any such legislation, regulation or policies that affect the coverage and reimbursement of our current or future products, or the procedures utilizing our current or future products, could cause our sales to decrease and our revenue to decline.
Our success in international markets also may depend upon the eligibility of reimbursement for our products through government-sponsored health care payment systems and other third-party payers. Outside of the U.S., reimbursement systems vary by country. These systems are often subject to the same pressures to curb rising health care costs and control health care expenditures as those in the U.S. In addition, as economies of emerging markets develop, these countries may implement changes in their health care delivery and payment systems. If adequate levels of reimbursement from third-party payers outside of the U.S. are not obtained, sales of our products outside of the U.S. may be adversely affected.
In addition, the requirements or restrictions imposed on us or our products may change, either as a result of administratively adopted policies or regulations or as a result of the enactment of new laws. Moreover, there have been recent public announcements by members of the U.S. Congress, President Trump and his administration regarding their plans to repeal and replace the Affordable Care Act and Medicare. Although we cannot predict the ultimate content or timing of any healthcare reform legislation, potential changes resulting from any amendment, repeal or replacement of these programs, including any reduction in the future availability of healthcare insurance benefits, could adversely affect our business and future results of operations.
41
Our medical devices and business activities are subject to rigorous regulation by the FDA and other federal, state and international governmental authorities. These authorities and members of Congress have been increasing their scrutiny over the medical device industry. In recent years, the U.S. Congress, Department of Justice, the Office of Inspector General of the Department of Health and Human Services, and the Department of Defense have issued subpoenas and other requests for information to medical device manufacturers, primarily related to financial arrangements with health care providers, regulatory compliance and marketing and product promotional practices. Furthermore, certain state governments have enacted legislation to increase transparency of interactions with health care providers, pursuant to which we are required by law to disclose payments and other transfers for value to health care providers licensed by certain states. We anticipate that the government will continue to scrutinize our industry closely, and any new regulations or statutory provisions could result in delays or increased costs during the periods of product development, clinical trials and regulatory review and approval, as well as increased costs to assure compliance.
Risks Related to Our Business and Operations
We may experience conflicts of interest with Cercacor with respect to business opportunities and other matters.
Prior to our initial public offering in August 2007, our stockholders owned 99% of the outstanding shares of capital stock of Cercacor and we believe that, as of December 31, 2016, a number of our stockholders, including certain of our directors and executive officers, continue to own shares of Cercacor stock. Joe Kiani, our Chairman and Chief Executive Officer, is also the Chairman and Chief Executive Officer of Cercacor.
Due to the interrelated nature of Cercacor with us, conflicts of interest will arise with respect to transactions involving business dealings between us and Cercacor, potential acquisitions of businesses or products, the development and ownership of technologies and products, the sale of products, markets and other matters in which our best interests and the best interests of our stockholders may conflict with the best interests of the stockholders of Cercacor. In addition, we and Cercacor may disagree regarding the interpretation of certain terms in the Cross-Licensing Agreement. We cannot guarantee that any conflict of interest will be resolved in our favor, or that, with respect to our transactions with Cercacor, we will negotiate terms that are as favorable to us as if such transactions were with another third-party.
We will be required to assign to Cercacor and pay Cercacor for the right to use certain products and technologies we develop that relate to the monitoring of non-vital sign parameters, including improvements to Masimo SET
®
.
Under the Cross-Licensing Agreement, if we develop certain products or technologies that relate to the noninvasive monitoring of non-vital sign parameters, including improvements to Masimo SET
®
for the noninvasive monitoring of non-vital sign parameters, we would be required to assign these developments to Cercacor and then license the technology back from Cercacor in consideration for upfront payments and royalty obligations to Cercacor. Therefore, these products and technologies would be deemed to have been developed or improved exclusively by Cercacor. In addition, we will not be reimbursed by Cercacor for our expenses relating to the development or improvement of any such products or technologies, which expenses may be significant. As a result of these terms, we may not generate any revenue from the further development of certain products and technologies for the monitoring of non-vital sign parameters, including improvements to Masimo SET
®
,
which could adversely affect our business, financial condition and results of operations.
In the event that the Cross-Licensing Agreement is terminated for any reason, or Cercacor grants a license to rainbow
®
technology to a third-party, our business would be materially and adversely affected.
Cercacor owns all of the proprietary rights to certain rainbow
®
technology developed with our proprietary Masimo SET
®
for products intended to be used in the Cercacor Market, and all rights to any non-vital signs measurement for which we do not exercise an option pursuant to the Cross-Licensing Agreement. In addition, Cercacor has the right to terminate the Cross-Licensing Agreement or grant licenses covering rainbow
®
technology to third parties if we breach certain terms of the agreement, including any failure to meet our minimum royalty payment obligations or failure to use commercially reasonable efforts to develop or market products incorporating licensed rainbow
®
technology. If we lose our exclusive license to rainbow
®
technology, we would lose the ability to prevent others from making, using, selling or importing products using rainbow
®
technology in our market. As a result, we would likely be subject to increased competition within our market, and Cercacor or competitors who obtain a license to rainbow
®
technology from Cercacor would be able to offer related products.
We may not be able to commercialize our products incorporating licensed rainbow
®
technology cost-effectively or successfully.
42
As a result of the royalties that we must pay to Cercacor, it is generally more expensive for us to make products that incorporate licensed rainbow
®
technology than products that do not include licensed rainbow
®
technology.
We cannot assure you that we will be able to sell products incorporating licensed rainbow
®
technology at a price the market is willing to accept. If we cannot commercialize our products incorporating licensed rainbow
®
technology successfully, we may not be able to generate sufficient product revenue from these products to be profitable, which could adversely affect our business, financial condition and results of operations.
Rights provided to Cercacor in the Cross-Licensing Agreement may impede a change in control of our company.
Under the Cross-Licensing Agreement, a change in control includes the resignation or termination of Joe Kiani from his position as Chief Executive Officer of either Masimo or Cercacor. A change in control also includes other customary events, such as the sale or merger of Masimo or Cercacor to a non-affiliated third-party or the acquisition of 50% or more of the voting power of Masimo or Cercacor by a non-affiliated third-party. In the event we undergo a change in control, we are required to immediately pay a $2.5 million fee to exercise an option to license technology developed by Cercacor for use in blood glucose monitoring. Additionally, our per product royalties payable to Cercacor will become subject to specified minimums, and the minimum aggregate annual royalties for licensed rainbow
®
measurements payable to Cercacor related to carbon monoxide, methemoglobin, fractional arterial oxygen saturation, hemoglobin and blood glucose will increase to $15.0 million, plus up to $2.0 million for other rainbow
®
measurements. Also, if the surviving or acquiring entity ceases to use “Masimo” as a company name and trademark following a change in control, all rights to the “Masimo” trademark will automatically be assigned to Cercacor. This could delay or discourage transactions involving an actual or potential change in control of us, including transactions in which our stockholders might otherwise receive a premium for their shares over our then-current trading price. In addition, our requirement to assign all future improvements for non-vital signs to Cercacor could impede a change in control of our company.
We may experience significant fluctuations in our quarterly and annual results in the future, we may not maintain our current levels of profitability, and changes to existing accounting pronouncements or taxation rules may affect how we conduct our business and our results of operations.
Our operating results have fluctuated in the past and are likely to fluctuate in the future. We may experience fluctuations in our quarterly results of operations as a result of:
|
•
|
delays or interruptions in manufacturing and shipping of our products;
|
|
•
|
varying demand for and market acceptance of our technologies and products;
|
|
•
|
delayed acceptance of our new products, negatively impacting the carrying value of our inventory;
|
|
•
|
design, technology or other market changes that could negatively impact the carrying value of our inventory;
|
|
•
|
the effect of competing technological and market developments resulting in lower selling prices or significant promotional costs;
|
|
•
|
changes in the timing of product orders and the volume of sales to our OEM partners;
|
|
•
|
actions taken by GPOs;
|
|
•
|
delays in hospital conversions to our products and declines in hospital patient census;
|
|
•
|
our legal expenses, particularly those related to litigation matters;
|
|
•
|
changes in our product or customer mix;
|
|
•
|
movements in foreign currency exchange rates;
|
|
•
|
market seasonality of our sales due to quarterly fluctuations in hospital and other alternative care admissions;
|
|
•
|
our ability to renew existing long-term sensor contract commitments;
|
|
•
|
changes in the total dollar amount of annual contract renewal activities;
|
|
•
|
changes in the mix and, therefore, the related costs of products that we supply at no upfront costs to our customers as part of their long-term sensor commitments;
|
|
•
|
changes in hospital and other alternative care admission levels;
|
|
•
|
our inability to efficiently scale operations and establish processes to accommodate business growth;
|
|
•
|
unanticipated delays or problems in the introduction of new products, including delays in obtaining clearance or approval from the FDA;
|
|
•
|
high levels of returns and repairs; and
|
|
•
|
changes in reimbursement rates for SpHb
®
, SpCO
®
and SpMet
®
parameters.
|
43
In addition, a change in accounting pronouncements or taxation rules or practices, or the interpretation of them by the SEC or other regulatory bodies, could have a significant effect on our reported results and may even affect our reporting of transactions completed before the change is effective. New accounting pronouncements or taxation rules and varying interpretations of accounting pronouncements or taxation practice have occurred and may occur in the future. Moreover, there have been recent public announcements by members of the U.S. Congress, President Trump and his administration regarding their plans to make substantial changes in the taxation of U.S. companies and their foreign operations, including the possible implementation of a border tax, tariff or increase in custom duties on products manufactured outside of and imported into the U.S., as well as the renegotiation of U.S. trade agreements. Certain of our manufacturing facilities are located in Mexico and Sweden, and the importation of a border tax, tariff or higher customs duties on our products imported into the U.S., or any potential corresponding actions by other countries in which we do business, could negatively impact our financial performance. Furthermore, changes to existing rules, the adoption of new rules, changes in tax laws, changes in trade policies or the expiration of existing favorable tax holidays may adversely affect our reported financial results or the way we conduct our business.
If our operating results fail to meet or exceed the expectations of securities analysts or investors, our stock price could drop suddenly and significantly. Our expense levels are based, in part, on our expectations regarding future revenue levels and are relatively fixed in the short term. As a result, if our revenue for a particular period was below our expectations, we would not be able to proportionately reduce our operating expenses for that period. Any revenue shortfall would have a disproportionately negative effect on our operating results for the period. Due to these and other factors, you should not rely on our results for any one quarter as an indication of our future performance.
Our results of operations could vary as a result of the methods, estimates and judgments that we use in applying our accounting policies.
The methods, estimates and judgments that we use in applying our accounting policies have a significant impact on our results of operations. Such methods, estimates and judgments are, by their nature, subject to substantial risks, uncertainties and assumptions and factors may arise over time that lead us to change our methods, estimates and judgments. Changes in those methods, estimates and judgments could significantly affect our results of operations. See “Critical Accounting Estimates” contained in Part II, Item 7 of this Annual Report on Form 10-K.
Our 2007 Stock Incentive Plan will terminate in August 2017 and the failure to obtain necessary stockholder approval of a new equity plan could adversely affect our recruitment and retention of management and other key personnel.
If we lose the services of our key personnel, or if we are unable to attract and retain other key personnel, we may not be able to manage our operations or meet our growth objectives.
In order to attract and retain personnel in a competitive marketplace, we believe that we must provide a competitive compensation package that includes equity-based compensation. Our performance and success depends on attracting, motivating and retaining executive talent, key engineers, sales representatives, clinical specialists and other key personnel. Competition for qualified personnel in our industry is significant. As competition for senior management, engineers and field sales personnel intensifies, we may not be able to retain our personnel without certain equity-based incentive compensation plans. Our sole equity incentive plan, the 2007 Stock Incentive Plan (the 2007 Plan), will terminate in August 2017, at which time we will no longer be able to issue any new equity awards pursuant to the 2007 Plan. Under the rules of The NASDAQ Stock Market LLC, any new equity incentive plan must be approved by our stockholders. We currently expect our Board of Directors (Board) to adopt a new equity incentive plan to be submitted for approval by our stockholders at our 2017 annual meeting of stockholders. There can be no assurance that our stockholders will approve a new equity plan adopted by our Board, and our recruitment and retention efforts may be adversely affected by our inability to compete for qualified candidates in a highly competitive market, and we may experience difficulty in implementing our business strategy.
In addition, we are highly dependent on our senior management, especially Joe Kiani, our Chief Executive Officer, and other key officers. We are also heavily dependent on our engineers and field sales team, including sales representatives and clinical specialists. Additionally, some of our key personnel may hold stock options with an exercise price that is greater than our recent closing prices, which may minimize the retention value of these options. The loss of the services of members of our key personnel or the inability to attract and retain qualified personnel in the future could prevent the implementation and completion of our objectives, including the development and introduction of our products. In general, our key personnel may terminate their employment at any time and for any reason without notice, unless the individual is a participant in our 2007 Severance Protection Plan, in which case the individual has agreed to provide us with six months notice if such individual decides to voluntarily resign.
The risks inherent in operating internationally and the risks of selling and shipping our products and purchasing our components and products internationally may adversely impact our business, financial condition and results of operations.
44
We derive a portion of our net sales from international operations. For the years ended
December 31, 2016
,
January 2, 2016
and
January 3, 2015
, approximately
29.7%
,
29.7%
and
31.7%
, respectively, of our product revenue was derived from our international operations. In addition, we purchase a portion of our raw materials and components on the international market. The sale and shipment of our products across international borders, as well as the purchase of materials and components from international sources, subject us to extensive U.S. and foreign governmental trade regulations. Compliance with such regulations is costly and we could be exposed to potentially significant penalties if we are found not to be in compliance with such regulations. Any failure to comply with applicable legal and regulatory obligations could impact us in a variety of ways that include, but are not limited to, significant criminal, civil and administrative penalties, including imprisonment of individuals, fines and penalties, denial of export privileges, seizure of shipments, restrictions on certain business activities, and exclusion or debarment from government contracting. Also, the failure to comply with applicable legal and regulatory obligations could result in the disruption of our shipping, manufacturing and sales activities. Any material decrease in our international sales would adversely affect our business, financial condition and results of operations.
On June 23, 2016, the United Kingdom (UK) held a referendum pursuant to which voters elected to leave the EU, commonly referred to as Brexit. As a result of UK voters’ election to leave the EU, the British government is expected to begin negotiating the terms of the UK’s future relationship with the EU. Although the long-term effects of Brexit will depend on any agreements the UK makes to retain access to the EU markets, Brexit has created additional uncertainties that may ultimately result in new regulatory costs and challenges for medical device companies and increased restrictions on imports and exports throughout Europe, which could adversely affect our ability to conduct and expand our operations in Europe and which may have an adverse effect on our business, financial condition and results of operations. Additionally, Brexit may increase the possibility that other countries may decide to leave the EU in the future.
In addition, our international sales operations expose us and our representatives, agents and distributors to risks inherent in operating in foreign jurisdictions. These risks include, but are not limited to:
|
•
|
the imposition of additional U.S. and foreign governmental controls or regulations;
|
|
•
|
the imposition of costly and lengthy new export licensing requirements;
|
|
•
|
a shortage of high-quality sales people and distributors;
|
|
•
|
the loss of any key personnel that possess proprietary knowledge, or who are otherwise important to our success in certain international markets;
|
|
•
|
changes in duties and tariffs, license obligations and other non-tariff barriers to trade;
|
|
•
|
the imposition of new trade restrictions;
|
|
•
|
the imposition of restrictions on the activities of foreign agents, representatives and distributors;
|
|
•
|
scrutiny of foreign tax authorities which could result in significant fines, penalties and additional taxes being imposed on us;
|
|
•
|
pricing pressure that we may experience internationally;
|
|
•
|
changes in foreign currency exchange rates;
|
|
•
|
laws and business practices favoring local companies;
|
|
•
|
political instability and actual or anticipated military or political conflicts;
|
|
•
|
financial and civil unrest worldwide;
|
|
•
|
outbreaks of illnesses, pandemics or other local or global health issues such as the Zika virus;
|
|
•
|
longer payment cycles; and
|
|
•
|
difficulties in enforcing or defending intellectual property rights.
|
The U.S. Foreign Corrupt Practices Act and similar worldwide anti-bribery laws in non-U.S. jurisdictions generally prohibit companies and their intermediaries from promising or making improper payments to non-U.S. officials for the purpose of obtaining an advantage to secure or retain business. Because of the predominance of government-sponsored health care systems around the world, many of our customer relationships outside of the U.S. are with governmental entities and are therefore subject to such anti-bribery laws. Our policies mandate compliance with these anti-bribery laws.
Personal privacy and data security have become significant issues in the United States, Europe and in many other jurisdictions where we offer our products. The regulatory framework for privacy and security issues worldwide is rapidly evolving and is likely to remain uncertain for the foreseeable future. Future laws, regulations, standards and other obligations, and changes in the interpretation of existing laws, regulations, standards and other obligations could result in increased regulation, cost of compliance and limitations on data collection, use, disclosure and transfer. For example, in October 2015, the Court of Justice of the EU ruled that the US-EU Safe Harbor framework that had been in place since 2000, which allowed companies to meet
45
certain European legal requirements for the transfer of personal data from the European Economic Area to the United States, was invalid. In July 2016, a new data transfer framework referred to as the EU-U.S. Privacy Shield was adopted, which may provide a new mechanism for companies to transfer EU personal data to the U.S. While we have adopted the EU-U.S. Privacy Shield framework for the transfer of personal data from the EU to the U.S., our means for transferring personal data from the EU may not be adopted by all of our customers and suppliers and may be subject to legal challenge or risk of enforcement actions by data protection authorities. Despite our training and compliance programs, our internal control policies and procedures may not always protect us from reckless or criminal acts committed by our employees or agents. Violations of these laws, or allegations of such violations, could subject us to cash and non-cash penalties, disrupt our operations, involve significant management distraction and result in a material adverse effect on our business, financial condition and results of operations.
Our operations may be adversely impacted by our exposure to risks related to foreign currency exchange rates.
We market our products in certain foreign markets through our subsidiaries and other international distributors. As a result, events that result in global economic uncertainty could significantly affect our results of operations in the form of gains and losses on foreign currency transactions and potential devaluation of the local currencies of our customers relative to the U.S. Dollar. For example, the announcement of Brexit caused significant volatility in global economic markets and currency exchange rate fluctuations that resulted in the strengthening of the U.S. Dollar relative to certain other foreign currencies in which we conduct business. While a majority of our sales are transacted in U.S. Dollars, some of our sales agreements with foreign customers provide for payment in currencies other than the U.S. Dollar. These foreign currency revenues, when converted into U.S. Dollars, can vary depending on average exchange rates during a respective period. Similarly, certain of our foreign sales support subsidiaries transact business in their respective country’s local currency, which is also their functional currency. In addition, certain production costs related to our manufacturing operations in Mexico are denominated in Mexican Pesos. As a result, expenses of these foreign subsidiaries and certain production costs, when converted into U.S. Dollars, can vary depending on average monthly exchange rates during a respective period.
We are also exposed to foreign currency gains or losses on outstanding foreign currency denominated receivables and payables. When converted to U.S. Dollars, these receivables and payables can vary depending on the monthly exchange rates at the end of the period. In addition, certain intercompany transactions may give rise to realized and unrealized foreign currency gains or losses based on the currency underlying such intercompany transactions. Accordingly, our operating results are subject to fluctuations in foreign currency exchange rates.
The balance sheets of our foreign subsidiaries whose functional currency is not the U.S. Dollar are translated into U.S. Dollars at the rate of exchange at the balance sheet date and the statements of operations and cash flows are translated into U.S. Dollars using the average monthly exchange rate during the period. Any foreign currency exchange gain or loss as a result of translating the balance sheets of our foreign subsidiaries whose functional currency is not the U.S. Dollar is included in equity as a component of accumulated other comprehensive income (loss).
We currently do not hedge our foreign currency exchange rate risk. Should we decide in the future to hedge such exchange rate risk by entering into forward contracts, these contracts may not mitigate the potential adverse impact on our financial results due to the variability of timing and amount of payments under these contracts. In addition, our failure to sufficiently hedge, forecast or otherwise manage such foreign currency risks properly could have a material adverse effect on our business, financial condition and results of operations.
We currently manufacture our products at several locations and any disruption to or expansion of our manufacturing operations could adversely affect our business, financial condition and results of operations.
We rely on our manufacturing facilities in Mexicali and San Luis Ray, Mexico; Irvine, California; Hudson, New Hampshire; and Danderyd, Sweden. These facilities and the manufacturing equipment we use to produce our products would be difficult to replace and could require substantial time to repair. Our facilities may be affected by natural or man-made disasters. Earthquakes are of particular significance since some of our facilities are located in an earthquake-prone area. We are also vulnerable to damage from other types of disasters, including power loss, attacks from extremist or terrorist organizations, epidemics, communication failures, fire, floods and similar events. In the event that one of our facilities is affected by a natural or man-made disaster, we would be forced to rely on third-party manufacturers if we could not shift production to our other manufacturing facilities. Furthermore, our insurance for damage to our property and the disruption of our business from casualties may not be sufficient to cover all of our potential losses and may not continue to be available to us on acceptable terms, or at all. If we are forced to seek alternative facilities, or if we voluntarily expand one or more of our manufacturing operations to new locations, we may incur additional transition costs and we may experience a disruption in the supply of our products until the new facilities are available and operating.
46
We also purchase materials and components from international sources. Any disruption in the supply of such materials, including transportation or port delays, could adversely impact our manufacturing operations. Disruptions may also occur as a result of local, regional and worldwide health risks. Such disruptions may include the inability to manufacture and distribute our products due to the direct effects of illness on individuals or due to constraints on supply and distribution that may result from either voluntary or government imposed restrictions.
Any disruption or delay at our manufacturing facilities, any expansion of our operations to additional locations, or any changes in market conditions could create operational hurdles and have an adverse impact on our ability to produce sufficient inventory of our products or may require us to incur additional expenses in order to produce sufficient inventory, depending on changes in product demand. Furthermore, if we are unable to meet the demand of our customers, our customers may cancel orders or purchase products from our competitors, which could adversely affect our business, financial condition and results of operations. Conversely, if product demand decreases, we may be unable to timely adjust our manufacturing cost structure, resulting in excess capacity, which would lower gross product margins. Similarly, if we are unable to forecast demand accurately, we could be required to record charges related to excess or obsolete inventory, which would also lower our gross margin.
Our suppliers may not supply us with a sufficient amount of materials and components or materials and components of adequate quality.
We depend on certain sole or limited source suppliers for key materials and components of our noninvasive patient monitoring solutions, and if we are unable to obtain these materials and components on a timely basis, we will not be able to deliver our noninvasive patient monitoring solutions to customers. Also, we cannot guarantee that any of the materials or components that we purchase, if available at all, will be of adequate quality and at acceptable price levels. From time to time, there are industry-wide shortages of several electronic components that we use in our noninvasive blood constituent patient monitoring solutions. We may also experience price increases for materials or components, with no guarantee that such increases can be passed along to our customers.
We may experience delays in production of our products if we fail to identify alternate vendors for materials and components, if any parts supply is interrupted or reduced or if there is a significant increase in production costs, each of which could adversely affect our business, financial condition and results of operations. In addition, we rely on third party manufacturers to supply some of our products and components, including digital signal processor chips and analog to digital converter chips. Manufacturing problems may occur with these and other outside sources, as a supplier may fail to develop and supply products and components to us on a timely basis, or may supply us with products and components that do not meet our quality, quantity and cost requirements. If any of these problems occur, we may be unable to obtain substitute sources for these products and components on a timely basis or on terms acceptable to us, which could harm our ability to manufacture our own products and components profitably or on time.
If we fail to comply with the reporting obligations of the Securities Exchange Act of 1934, as amended, and Section 404 of the Sarbanes-Oxley Act of 2002, as amended, or if we fail to maintain adequate internal control over financial reporting, our business, results of operations and financial condition and investors’ confidence in us could be materially and adversely affected.
As a public company, we are required to comply with the periodic reporting obligations of the Securities Exchange Act of 1934, as amended, including preparing annual reports, quarterly reports and current reports. Our failure to prepare and disclose this information in a timely manner and meet our reporting obligations in their entirety could subject us to penalties under federal securities laws and regulations of The NASDAQ Stock Market LLC, expose us to lawsuits and restrict our ability to access financing on favorable terms, or at all.
In addition, pursuant to Section 404 of the Sarbanes-Oxley Act of 2002, as amended (the Sarbanes-Oxley Act), we are required to evaluate and provide a management report on our systems of internal control over financial reporting, and our independent registered public accounting firm is required to attest to our internal control over financial reporting. During the course of the evaluation of our internal control over financial reporting, we may identify areas requiring improvement and may be required to design enhanced processes and controls to address issues identified through this review. This could result in significant delays and costs to us and require us to divert substantial resources, including management time, from other activities. In addition, if we fail to maintain the adequacy of our internal controls over financial reporting, we may not be able to ensure that we can conclude on an ongoing basis that we have effective internal control over financial reporting in accordance with the Sarbanes-Oxley Act. Moreover, effective internal controls are necessary for us to produce reliable financial reports and are important to help prevent fraud. Any failure to maintain compliance with the requirements of Section 404 of the Sarbanes-Oxley Act or any material weakness in our internal control environment could result in the loss of investor confidence in the reliability of our financial statements, which in turn could harm our business, negatively impact the trading price of our stock, and adversely affect investors’ confidence in our company and our ability to access capital markets for financing.
47
Changing laws and increasingly complex corporate governance and public disclosure requirements could have an adverse effect on our business and operating results.
Changing laws, regulations and standards relating to corporate governance and public disclosure, including the Sarbanes-Oxley Act, the Dodd-Frank Wall Street Reform and Consumer Protection Act (Dodd-Frank Act), the California Transparency in Supply Chains Act, the UK Modern Slavery Act and new regulations issued by the SEC and The NASDAQ Stock Market LLC, have and will create additional compliance requirements for companies such as ours. To maintain high standards of corporate governance and public disclosure, we have invested in, and intend to continue to invest in, reasonably necessary resources to comply with evolving standards.
For example, the Dodd-Frank Act includes provisions regarding “conflict minerals” (generally tin, tantalum, tungsten and gold) that are mined in the Democratic Republic of Congo and adjoining countries (the DRC region), and in June 2016, the EU adopted its own regulation on conflict minerals that covers the sourcing of conflict minerals from anywhere in the world. The provisions of the Dodd-Frank Act require us to undertake comprehensive due diligence to determine whether conflict minerals used in our products, including any portion of our products manufactured by third parties, financed or benefited armed groups in the DRC region. The rules also require us to file conflict mineral reports with the SEC annually. We have incurred, and expect to continue to incur, additional costs to comply with these rules, including costs related to determining the source of origin of conflict minerals used in our products. Given the complexity of our supply chain, we may face difficulties if our suppliers are unwilling or unable to verify the origin of all conflict minerals used in our products. Furthermore, our ongoing compliance with these rules could affect the pricing, sourcing and availability of minerals used in the manufacture of our products. We may also encounter challenges with our customers and stockholders if we are unable to certify that our products are free of conflict minerals. To maintain high standards of corporate governance and public disclosure, we have invested in, and intend to continue to invest in, reasonably necessary resources to comply with such evolving standards. These investments have resulted in increased general and administrative expenses and a diversion of management time and attention from revenue-generating activities and may continue to do so in the future.
In addition, stockholder litigation surrounding executive compensation and disclosure of executive compensation has increased with the passage of the Dodd-Frank Act. Furthermore, in recent years, our stockholders have not approved our advisory vote on named executive officer compensation that is required to be voted on by our stockholders annually pursuant to the Dodd-Frank Act. If we are involved in a lawsuit related to compensation matters or any other matters not covered by our directors’ and officers’ liability insurance, we may incur significant expenses in defending against such lawsuits, or be subject to significant fines or required to take significant remedial actions, each of which could adversely affect our business, financial condition and results of operations.
If product liability claims are brought against us, we could face substantial liability and costs.
The manufacture and sale of products using Masimo SET
®
and licensed rainbow
®
technology expose us to product liability claims and product recalls, including, but not limited to, those that may arise from unauthorized off-label use, which is use of a device in a manner outside the indications for use cleared by the FDA, malfunctions, design flaws or manufacturing defects related to our products or the use of our products with incompatible components or systems. For example, in April 2014, an amended putative class action complaint was filed against us alleging product liability and negligence claims in connection with pulse oximeters that we modified and provided at the request of the study investigators for use in a randomized trial at the University of Alabama. In August 2015, the Court granted summary judgment in favor of Masimo, rejecting the plaintiffs’ claims. The plaintiffs have appealed the Court’s decision. The appellate hearing before the Eleventh Circuit Court of Appeals was held on December 13, 2016, and the parties are awaiting a decision. While we believe we have good and substantial defenses to the claims, there is no guarantee that we will ultimately prevail. In addition, we cannot be certain that our product liability insurance will be sufficient to cover any or all damages or claims asserted in this case or any other product liability claims that may be brought against us in the future. Furthermore, we may not be able to obtain or maintain insurance in the future at satisfactory rates or in adequate amounts to protect us against any product liability claims. Any losses that we may suffer from product liability claims, and the effect that any product liability litigation may have upon the reputation and marketability of our technology and products, together with the corresponding diversion of the attention of our key employees, may subject us to significant damages and could adversely affect our business, financial condition and results of operations.
Future acquisitions of businesses could negatively affect our business, financial condition and results of operations if we fail to integrate the acquired businesses successfully into our existing operations or if we discover previously undisclosed liabilities.
We have acquired six businesses since our inception and we may acquire additional businesses in the future. Successful acquisitions depend upon our ability to identify, negotiate, complete and integrate suitable acquisitions and to obtain any necessary financing. Even if we complete acquisitions, we may experience:
48
|
•
|
difficulties in integrating any acquired companies, personnel, products and other assets into our existing business;
|
|
•
|
delays in realizing the benefits of the acquired company, products or other assets;
|
|
•
|
diversion of our management’s time and attention from other business concerns;
|
|
•
|
limited or no direct prior experience in new markets or countries we may enter;
|
|
•
|
higher costs of integration than we anticipated;
|
|
•
|
difficulties in retaining key employees of the acquired business who are necessary to manage these acquisitions; and
|
|
•
|
changes in the overall financial model as certain acquired companies may have a different revenue, gross profit margin or operating expense profile.
|
In addition, an acquisition could materially impair our operating results by causing us to incur debt or requiring us to amortize acquisition expenses and acquired assets. We may also discover deficiencies in internal controls, data adequacy and integrity, product quality, regulatory compliance and product liabilities that we did not uncover prior to our acquisition of such businesses, which could result in us becoming subject to penalties or other liabilities.
Any difficulties in the integration of acquired businesses or unexpected penalties or liabilities in connection with such businesses could have a material adverse effect on our business, financial condition and results of operations.
We may incur environmental and personal injury liabilities related to certain hazardous materials used in our operations.
Our manufacturing processes involve the use, generation and disposal of certain hazardous materials and wastes, including silicone adhesives, solder and solder paste, sealants, epoxies and various solvents such as methyl ethyl ketone, acetone and isopropyl alcohol. As a result, we are subject to stringent federal, state and local laws relating to the protection of the environment, including those governing the use, handling and disposal of hazardous materials and wastes. For example, products that we sell in Europe are subject to regulation in the EU markets under the Restriction of the Use of Hazardous Substances Directive (RoHS). RoHS prohibits companies from selling products that contain certain hazardous materials, including lead, mercury, cadmium, chromium, polybrominated biphenyls and polybrominated diphenyl ethers, in EU member states. In addition, the EU’s Registration, Evaluation, Authorization, and Restriction of Chemicals Directive also restricts substances of very high concern in products. Compliance with such regulations may be costly and, therefore, we may be forced to incur significant costs to comply with environmental regulations.
From time to time, new regulations are enacted and it is difficult to anticipate how such regulations will be implemented and enforced. We continue to evaluate the necessary steps for compliance with environmental regulations as they are enacted. Future environmental laws may significantly affect our operations by, for example, requiring our manufacturing processes to be altered or requiring us to use different types of materials in manufacturing our products. Any changes to our operations may increase our manufacturing costs, detrimentally impact the performance of our products, add greater testing lead-times for product introductions or have other similar effects. In our research and manufacturing activities, we use, and our employees may be exposed to, materials that are hazardous to human health, safety or the environment. These materials and various wastes resulting from their use are stored at our facility pending ultimate use and disposal.
The risk of accidental injury to our employees or contamination from these materials cannot be eliminated. In the event of such an accident, we could be held liable for any resulting damages and any such liability could exceed our reserves. Although we maintain general liability insurance, we do not specifically insure against environmental liabilities. If an enforcement action were to occur, our reputation and our business and financial condition may be harmed, even if we were to prevail or settle the action on terms favorable to us.
We rely significantly on information technology and any failure, inadequacy, interruption or security lapse of that technology, including any cybersecurity incidents, could harm our ability to operate our business effectively.
Increased global cybersecurity vulnerabilities, threats and more sophisticated and targeted cybersecurity attacks pose a risk to the security of Masimo’s and our customers’, partners’, suppliers’ and third-party service providers’ products, systems and networks, and the confidentiality, availability and integrity of any underlying information and data. Our ability to effectively manage and maintain our internal business information, and to ship products to customers and invoice them on a timely basis, depends significantly on our enterprise resource planning system and other information systems. Portions of our information technology systems may experience interruptions, delays or cessations of service or produce errors in connection with ongoing systems implementation work. In addition, interfaces between our products and our customers’ computer network could provide additional opportunities for cybersecurity attacks on us and our customers. The techniques used to attack computer systems are sophisticated, change frequently and may originate from less regulated and remote areas of the world. Cybersecurity attacks in particular are evolving and include, but are not limited to, malicious software, attempts to gain unauthorized access to data and other electronic security breaches that could lead to disruptions in systems, misappropriation of confidential or otherwise
49
protected information and corruption of data. As a result, there can be no assurance that our protective measures will prevent or detect security breaches that could have a significant impact on our business, reputation, financial condition and results of operations. The failure of these systems to operate or integrate effectively with other internal, customer, supplier or third-party service provider systems and to protect the underlying information technology system and data integrity, including from cyber-attacks, intrusions or other breaches or unauthorized access of these systems, or any failure by us to remediate any such attacks or breaches, may also result in damage to our reputation or competitiveness, delays in product fulfillment and reduced efficiency of our operations, and could require significant capital investments to remediate any such failure, problem or breach, all of which could adversely affect our business, financial condition and results of operations.
Our operating results may be adversely affected by unfavorable economic and market conditions.
Many of the countries in which we operate, including the U.S. and several of the members of the EU, have experienced and continue to experience uncertain economic conditions resulting from global as well as local factors, such as Brexit. Our business or financial results may be adversely impacted by these uncertain economic conditions, including: adverse changes in interest rates, foreign currency exchange rates, tax laws or tax rates; inflation; contraction in the availability of credit in the marketplace due to legislation or other economic conditions, which may potentially impair our ability to access the capital markets on terms acceptable to us or at all; and the effects of government initiatives to manage economic conditions.
In addition, we cannot predict how future economic conditions will affect our critical customers, suppliers and distributors and any negative impact on our critical customers, suppliers or distributors may also have an adverse impact on our results of operations or financial condition.
Our Amended and Restated Credit Agreement contains certain covenants and restrictions that may limit our flexibility in operating our business.
Our Amended and Restated Credit Agreement, dated January 8, 2016 (Restated Credit Facility), with JPMorgan Chase Bank, N.A., as Administrative Agent and a Lender, Bank of America, N.A., as Syndication Agent and a Lender, Citibank, N.A., as Documentation Agent and a Lender, and various other Lenders (collectively, the Lenders), contains various affirmative covenants and restrictions that limit our ability to engage in specified types of transactions, including:
|
•
|
incurring specified types of additional indebtedness (including guarantees or other contingent obligations);
|
|
•
|
paying dividends on, repurchasing or making distributions in respect of our common stock or making other restricted payments, subject to specified exceptions;
|
|
•
|
making specified investments (including loans and advances);
|
|
•
|
selling or transferring certain assets;
|
|
•
|
creating certain liens;
|
|
•
|
consolidating, merging, selling or otherwise disposing of all or substantially all of our assets; and
|
|
•
|
entering into certain transactions with any of our affiliates.
|
In addition, under our Restated Credit Facility, we are required to satisfy and maintain specified financial ratios and other affirmative covenants. Our ability to meet those financial ratios and affirmative covenants could be affected by events beyond our control and, therefore, we cannot be assured that we will be able to continue to satisfy these requirements. A breach of any of these ratios or covenants could result in a default under the Restated Credit Facility. Upon the occurrence of an event of default, the Lenders could elect to declare all amounts outstanding under the Restated Credit Facility immediately due and payable, terminate all commitments to extend further credit and pursue legal remedies for recovery, all of which could adversely affect our business and financial condition. As of
December 31, 2016
, we had
no
amounts outstanding under the Restated Credit Facility and were in compliance with all applicable covenants.
Risks Related to Our Stock
Our stock price may be volatile, and your investment in our stock could suffer a decline in value.
There has been significant volatility in the market price and trading volume of equity securities, which is often unrelated to the financial performance of the companies issuing the securities. These broad market fluctuations may negatively affect the market price of our stock. From
January 4, 2016
to
December 31, 2016
, our closing stock price ranged from
$35.12
to
$67.85
per share. You may not be able to resell your shares at or above the price you paid for them due to fluctuations in the market price of our stock caused by changes in our operating performance or prospects and other factors.
50
In addition to the other risk factors previously discussed above, there are many other factors that we may not be able to control that could have a significant effect on our stock price. These include, but are not limited to:
|
•
|
actual or anticipated fluctuations in our operating results or future prospects;
|
|
•
|
our announcements or our competitors’ announcements of new products;
|
|
•
|
the public’s reaction to our press releases, our other public announcements and our filings with the SEC;
|
|
•
|
strategic actions by us or our competitors, such as acquisitions or restructurings;
|
|
•
|
new laws or regulations or new interpretations of existing laws or regulations applicable to our business;
|
|
•
|
changes in accounting standards, policies, guidance, interpretations or principles;
|
|
•
|
changes in our growth rates or our competitors’ growth rates;
|
|
•
|
developments regarding our patents or proprietary rights or those of our competitors;
|
|
•
|
ongoing legal proceedings;
|
|
•
|
our inability to raise additional capital as needed;
|
|
•
|
concerns or allegations as to the safety or efficacy of our products;
|
|
•
|
changes in financial markets or general economic conditions, including the effects of recession or slow economic growth in the U.S. and abroad;
|
|
•
|
sales of stock by us or members of our management team, our Board or certain institutional stockholders; and
|
|
•
|
changes in stock market analyst recommendations or earnings estimates regarding our stock, other comparable companies or our industry generally.
|
Concentration of ownership among our existing directors, executive officers and principal stockholders may prevent new investors from influencing significant corporate decisions.
As of
December 31, 2016
, our current directors and executive officers and their affiliates, in the aggregate, beneficially owned approximately
14.9%
of our outstanding stock. Subject to any fiduciary duties owed to our other stockholders under Delaware law, these stockholders may be able to exercise significant influence over matters requiring stockholder approval, including the election of directors and approval of significant corporate transactions, and will have some control over our management and policies. Some of these persons or entities may have interests that are different from yours. For example, these stockholders may support proposals and actions with which you may disagree or which are not in your best interests. The concentration of ownership could delay or prevent a change in control of us, or otherwise discourage a potential acquirer from attempting to obtain control of us, which in turn could reduce the price of our stock. In addition, these stockholders could use their voting influence to maintain our existing management and directors in office or support or reject other management and Board proposals that are subject to stockholder approval, such as amendments to our employee stock plans and approvals of significant financing transactions.
You could experience substantial dilution of your investment as a result of subsequent exercises of our outstanding options, vesting of outstanding restricted stock units (RSUs) or the grant of future equity awards by us.
As of
December 31, 2016
, approximately
16.1 million
shares of our common stock were reserved for future issuance under our two equity incentive plans, approximately
8.5 million
of which were subject to options outstanding as of that date at a weighted-average exercise price of
$28.56
per share and approximately 2.7 million of which were subject to outstanding RSUs. Over the past 12 months, we have experienced higher rates of stock option exercises compared to many earlier periods, and this trend may continue. To the extent outstanding options are exercised or outstanding RSUs vest, our existing stockholders may incur dilution. We rely on equity awards to motivate current employees and to attract new employees. The grant of future equity awards by us to our employees and other service providers may further dilute our stockholders.
Future resales of our stock, including those by our insiders and a few investment funds, may cause our stock price to decline.
A significant portion of our outstanding shares are held by our directors, our executive officers and a few investment funds. Resales by these stockholders of a substantial number of such shares, announcements of any proposed resale of substantial amounts of our stock or the perception that substantial resales may be made, could significantly reduce the market price of our stock. Some of our directors and executive officers have entered into Rule 10b5-1 trading plans pursuant to which they have arranged to sell shares of our stock from time to time in the future. Generally, these sales require public filings. Actual or potential sales by these insiders, including those under a pre-arranged Rule 10b5-1 trading plan, could be interpreted by the market as an indication that the insider has lost confidence in our stock and reduce the market price of our stock.
51
We have registered and expect to continue to register shares reserved under our equity plans pursuant to Registration Statements on Form S-8. All shares issued pursuant to a Registration Statement on Form S-8 can be freely sold in the public market upon issuance, subject to restrictions on our affiliates under Rule 144. If a large number of these shares are sold in the public market, the sales could reduce the trading price of our stock.
Our corporate documents and Delaware law contain provisions that could discourage, delay or prevent a change in control of our company, prevent attempts to replace or remove current management and reduce the market price of our stock.
Provisions in our amended and restated certificate of incorporation and amended and restated bylaws may discourage, delay or prevent a merger or acquisition involving us that our stockholders may consider favorable. For example, our amended and restated certificate of incorporation authorizes our Board to issue up to 5.0 million shares of “blank check” preferred stock. As a result, without further stockholder approval, our Board has the authority to attach special rights, including voting and dividend rights, to this preferred stock, including pursuant to a stockholder rights plan. With these rights, preferred stockholders could make it more difficult for a third-party to acquire us. In addition, our amended and restated certificate of incorporation provides for a staggered board of directors, whereby directors serve for three year terms, with one-third of the directors coming up for reelection each year. A staggered Board will make it more difficult for a third-party to obtain control of our Board through a proxy contest, which may be a necessary step in an acquisition of us that is not favored by our Board.
We are also subject to anti-takeover provisions under the General Corporation Law of the State of Delaware. Under these provisions, if anyone becomes an “interested stockholder,” we may not enter into a “business combination” with that person for three years without special approval, which could discourage a third-party from making a takeover offer and could delay or prevent a change in control of us. For purposes of these provisions, an “interested stockholder” generally means someone owning 15% or more of our outstanding voting stock or an affiliate of ours that owned 15% or more of our outstanding voting stock during the past three years, subject to certain exceptions as described in the General Corporation Law of the State of Delaware.
We may elect not to declare cash dividends on our stock, may elect to only pay dividends on an infrequent or irregular basis, or may elect not to make any additional stock repurchases. As a result, any return on your investment may be limited to the value of our stock. In addition, the payment of any future dividends or the repurchase of our stock might limit our ability to pursue other growth opportunities
.
Our Board may from time to time declare, and we may pay, dividends on our outstanding shares in the manner and upon the terms and conditions provided by law. However, we may elect to retain all future earnings for the operation and expansion of our business, rather than paying cash dividends on our stock. Any payment of cash dividends on our stock will be at the discretion of our Board and will depend upon our results of operations, earnings, capital requirements, financial condition, business prospects, contractual restrictions and other factors deemed relevant by our Board. In addition, under certain circumstances, our Restated Credit Facility may limit or restrict our ability to pay cash dividends. In the event our Board declares any dividends, there is no assurance with respect to the amount, timing or frequency of any such dividends.
In September 2015, our Board authorized a stock repurchase program, whereby we may purchase up to 5.0 million shares of our common stock over a period of up to three years. As of
December 31, 2016
, approximately
2.9 million
shares remained available for repurchase under this program. Any repurchase of our common stock will be at the discretion of a committee comprised of our Chief Executive Officer and Chief Financial Officer, and will depend on several factors, including, but not limited to, results of operations, capital requirements, financial conditions, available capital from operations or other sources and the market price of our common stock. Therefore, there is no assurance with respect to the amount, price or timing of any such repurchases. We may elect to retain all future earnings for the operation and expansion of our business, rather than repurchasing additional outstanding shares. In addition, under certain circumstances, our Restated Credit Facility may limit or restrict our ability to repurchase our stock. In the event we pay dividends, or make any stock repurchases in the future, our ability to finance any material expansion of our business, including through acquisitions, investments or increased capital spending, or to fund our operations, may be limited. In addition, any repurchases we may make in the future may not prove to be at optimal prices. Our Board may modify or amend our stock repurchase program at any time at its discretion without stockholder approval.
|
ITEM 1B.
|
UNRESOLVED STAFF COMMENTS
|
None.
52
|
ITEM 2.
|
PROPERTIES
|
We own an approximately
213,400
square foot property located in Irvine, California that houses our corporate headquarters and U.S. research and development activities. We also own an approximately
90,000
square foot facility in Hudson, New Hampshire, which is used to manufacture advanced light emitting diodes and other advanced component-level technologies, as well as warehousing and administrative operations.
We continue to lease and occupy various buildings in Irvine, California approximating a total of
173,400
square feet for product manufacturing, warehousing, distribution and sales support operations. These leases expire from
November 2019
through
November 2026
. We also operate approximately
159,000
square feet of space in Mexicali and San Luis Ray, Mexico, for the manufacture of our products under a shelter labor agreement with Industrial Vallera de Mexicali, S.A. de C.V. (IVEMSA). IVEMSA leases these manufacturing facilities directly from the owners of the properties under separate agreements. These leases expire from July 2017 to
December 2020
.
Our international headquarters are located in approximately
10,000
square feet of leased office space in Neuchatel, Switzerland. This office space is focused on operations that include sales, marketing, customer service and other administrative functions. In addition, we currently lease approximately
18,200
square feet of space in Montreal, Canada, which we use primarily for research, development, sales and marketing activities. We also lease approximately
16,400
square feet in Danderyd, Sweden, primarily for manufacturing, research, development and administrative functions related to our capnography and gas monitoring products. Our operations in Tokyo, Japan, are located in approximately
10,000
square feet of leased space that we use for sales, marketing, customer service, administrative and warehousing operations. We also maintain a number of small sales offices throughout Europe, Asia, India, the Middle East, Australia and Latin America. We believe that our existing facilities are adequate to meet our needs and that existing needs and future growth can be accommodated by leasing alternative or additional space.
|
ITEM 3.
|
LEGAL PROCEEDINGS
|
The information set forth in Note 15 to our accompanying consolidated financial statements under the caption “Litigation” included in Part IV, Item 15(a) of this Annual Report on Form 10-K is incorporated herein by reference.
|
ITEM 4.
|
MINE SAFETY DISCLOSURES
|
Not applicable.
53
|
ITEM 5.
|
MARKET FOR REGISTRANT’S COMMON EQUITY, RELATED STOCKHOLDER MATTERS AND ISSUER PURCHASES OF EQUITY SECURITIES
|
Market Information
Our stock is traded on the NASDAQ Global Select Market under the symbol “MASI”. The following table sets forth the high and low closing sales price of our stock for the periods indicated.
|
Fiscal 2016
|
Fiscal 2015
|
|||||||||||||||
|
High
|
Low
|
High
|
Low
|
|||||||||||||
|
Fiscal:
|
||||||||||||||||
|
First Quarter
|
$
|
42.47
|
|
35.12
|
|
$
|
33.45
|
|
$
|
25.52
|
|
|||||
|
Second Quarter
|
$
|
52.52
|
|
$
|
41.61
|
|
$
|
39.73
|
|
$
|
33.76
|
|
||||
|
Third Quarter
|
$
|
60.32
|
|
$
|
51.5
|
|
$
|
43.61
|
|
$
|
37.61
|
|
||||
|
Fourth Quarter
|
$
|
67.85
|
|
$
|
54.35
|
|
$
|
43.12
|
|
$
|
38.12
|
|
||||
The above quotations reflect inter-dealer prices, without retail markup, markdown or commission, and may not necessarily represent actual transactions.
As of February 9, 2017, the closing price of our stock on the NASDAQ Global Select Market was
$76.64
per share, and the number of stockholders of record was
30
. We believe that the number of beneficial owners is substantially greater than the number of record holders because a large portion of our stock is held of record through brokerage firms in “street name.”
Stock Performance Graph
The following stock performance graph and related information shall not be deemed “soliciting material” or to be “filed” with the SEC, nor shall such information be incorporated by reference into any future filing under the Securities Act or Exchange Act, except to the extent that we specifically incorporate it by reference into such filing.
The following stock performance graph compares total stockholder returns for Masimo Corporation from
December 31, 2011
through
December 31, 2016
against the NASDAQ Market Composite Index and NASDAQ Medical Equipment Index, assuming a $100 investment made on
December 31, 2011
. Each of the two comparative measures of cumulative total return assumes reinvestment of dividends. The stock performance shown on the graph below is not necessarily indicative of future price performance.
54
COMPARISON OF 5 YEAR CUMULATIVE TOTAL RETURN*
Among Masimo Corporation, the NASDAQ Market Composite Index, and
the NASDAQ Medical Equipment Index
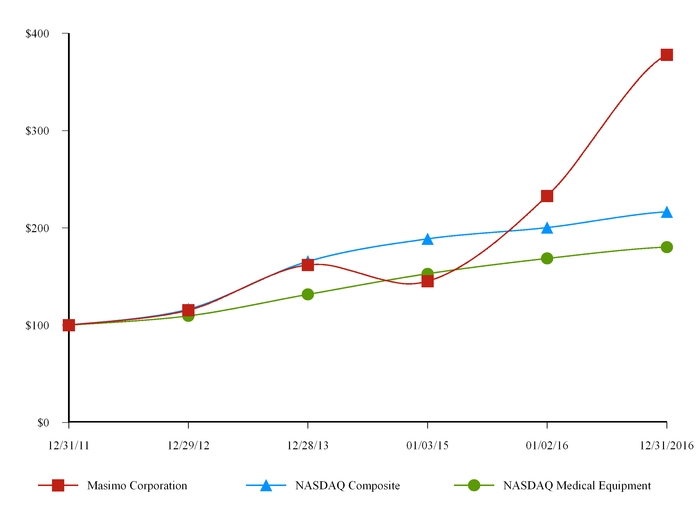
*$100 invested on
12/31/11
in stock or 01/01/11 in index, including reinvestment of dividends. Indexes calculated on month-end basis.
Dividend Policy
Future determination as to the payment of cash (or stock) dividends will be at the discretion of our board of directors (Board) and will depend upon our results of operations, earnings, capital requirements, financial condition, business prospects, contractual restrictions and other factors deemed relevant by our Board.
Stock Repurchase Program
In February 2013, our Board authorized the repurchase of up to
6.0 million
shares of common stock under a stock repurchase program. In October 2014, our Board increased the number of shares of our common stock authorized for repurchase by
3.0 million
shares, bringing the total number of shares of our common stock authorized for repurchase under such program to
9.0 million
. This repurchase program terminated pursuant to its terms in September 2015 when all of the authorized
9.0 million
shares had been repurchased.
In September 2015, our Board authorized a new stock repurchase program, whereby we may purchase up to
5.0 million
shares of our common stock over a period of up to three years. The stock repurchase program may be carried out at the discretion of a committee comprised of our Chief Executive Officer and Chief Financial Officer through open market purchases, one or more Rule 10b5-1 trading plans, block trades and in privately negotiated transactions. During the year ended
December 31, 2016
, we repurchased approximately
1.5 million
shares under this stock repurchase program at an average cost of
$42.39
per share, totaling approximately
$63.4 million
. The total remaining shares authorized for repurchase under this stock repurchase program approximated
2.9 million
shares as of
December 31, 2016
.
55
Any repurchases will be subject to the availability of stock, general market conditions, the trading price of the stock, available capital, alternative uses for capital and our financial performance. We paid for prior repurchases of stock with available cash and cash equivalents as well as borrowings under our revolving credit agreement.
The following table provides the stock repurchase activities for the three months ended
December 31, 2016
and
January 2, 2016
; and for the years ended
December 31, 2016
,
January 2, 2016
and
January 3, 2015
(in thousands, except per share amounts):
|
Three Months Ended
|
Twelve Months Ended
|
|||||||||||||||||||
|
December 31, 2016
|
January 2, 2016
|
December 31, 2016
|
January 2, 2016
|
January 3, 2015
|
||||||||||||||||
|
Shares repurchased
(1)
|
—
|
|
603
|
|
1,496
|
|
4,148
|
|
4,455
|
|
||||||||||
|
Average cost per share
|
$
|
—
|
|
$
|
41.15
|
|
$
|
42.39
|
|
$
|
37.36
|
|
$
|
23.00
|
|
|||||
|
Value of shares repurchased
(1)
|
$
|
—
|
|
$
|
24,810
|
|
$
|
63,402
|
|
$
|
154,967
|
|
$
|
102,453
|
|
|||||
________________
|
(1)
|
Amounts in thousands.
|
|
ITEM 6.
|
SELECTED FINANCIAL DATA
|
The following tables reflect selected financial data derived from our consolidated financial statements for each of the last five years. The consolidated statement of operations data for the years ended
December 31, 2016
,
January 2, 2016
and
January 3, 2015
and the consolidated balance sheet data as of
December 31, 2016
and
January 2, 2016
were derived from our audited consolidated financial statements included in this Annual Report on Form 10-K. The consolidated statement of operations data for the years ended
December 28, 2013
and
December 31, 2012
, and the consolidated balance sheet data as of
January 3, 2015
,
December 28, 2013
and
December 31, 2012
were derived from our audited consolidated financial statements that are not included in this Annual Report on Form 10-K. Historical results are not necessarily indicative of future results. The selected financial data set forth below should be read in conjunction with our consolidated financial statements, the related notes and Item 7 - “Management’s Discussion and Analysis of Financial Condition and Results of Operations” included elsewhere in this Annual Report on Form 10-K.
56
|
Year ended
December 31, 2016 |
Year ended
January 2, 2016 |
Year ended
January 3, 2015 |
Year ended
December 28, 2013 |
Year ended
December 29, 2012 |
|||||||||||||||
|
(dollars in thousands)
|
|||||||||||||||||||
|
Statement of Operations
(1)
:
|
|||||||||||||||||||
|
Revenue:
|
|||||||||||||||||||
|
Product
|
$
|
663,846
|
|
$
|
599,334
|
|
$
|
556,764
|
|
$
|
517,429
|
|
$
|
464,928
|
|
||||
|
Royalty
|
30,779
|
|
30,777
|
|
29,879
|
|
29,816
|
|
28,305
|
|
|||||||||
|
Total revenue
|
694,625
|
|
630,111
|
|
586,643
|
|
547,245
|
|
493,233
|
|
|||||||||
|
Cost of goods sold
|
230,826
|
|
220,128
|
|
195,864
|
|
188,418
|
|
166,982
|
|
|||||||||
|
Gross profit
|
463,799
|
|
409,983
|
|
390,779
|
|
358,827
|
|
326,251
|
|
|||||||||
|
Operating expenses:
|
|||||||||||||||||||
|
Selling, general and administrative
|
253,667
|
|
252,725
|
|
241,016
|
|
215,469
|
|
193,948
|
|
|||||||||
|
Research and development
|
59,362
|
|
56,617
|
|
56,581
|
|
55,631
|
|
47,077
|
|
|||||||||
|
Litigation settlement, award and/or defense costs
|
(270,000
|
)
|
(19,609
|
)
|
(10,331
|
)
|
8,010
|
|
—
|
|
|||||||||
|
Total operating expenses
|
43,029
|
|
289,733
|
|
287,266
|
|
279,110
|
|
241,025
|
|
|||||||||
|
Operating income
|
420,770
|
|
120,250
|
|
103,513
|
|
79,717
|
|
85,226
|
|
|||||||||
|
Non-operating expense
|
2,429
|
|
3,905
|
|
1,472
|
|
3,991
|
|
1,405
|
|
|||||||||
|
Income before provision for income taxes
|
418,341
|
|
116,345
|
|
102,041
|
|
75,726
|
|
83,821
|
|
|||||||||
|
Provision for income taxes
|
117,675
|
|
34,845
|
|
27,678
|
|
20,005
|
|
21,883
|
|
|||||||||
|
Net income including noncontrolling interests
|
300,666
|
|
81,500
|
|
74,363
|
|
55,721
|
|
61,938
|
|
|||||||||
|
Net income (loss) attributable to noncontrolling interests
|
—
|
|
(1,800
|
)
|
1,845
|
|
(2,660
|
)
|
(334
|
)
|
|||||||||
|
Net income attributable to Masimo Corporation stockholders
|
$
|
300,666
|
|
$
|
83,300
|
|
$
|
72,518
|
|
$
|
58,381
|
|
$
|
62,272
|
|
||||
|
Net income per common share attributable to Masimo Corporation stockholders
(2)
:
|
|||||||||||||||||||
|
Basic
|
$
|
6.07
|
|
$
|
1.62
|
|
$
|
1.33
|
|
$
|
1.03
|
|
$
|
1.08
|
|
||||
|
Diluted
|
$
|
5.65
|
|
$
|
1.55
|
|
$
|
1.30
|
|
$
|
1.02
|
|
$
|
1.07
|
|
||||
|
Weighted-average number of common shares:
|
|||||||||||||||||||
|
Basic
|
49,530
|
|
51,311
|
|
54,708
|
|
56,690
|
|
57,445
|
|
|||||||||
|
Diluted
|
53,195
|
|
53,707
|
|
55,571
|
|
57,480
|
|
58,374
|
|
|||||||||
________________
|
(1)
|
Pursuant to authoritative accounting guidance, our variable interest entity, Cercacor, was consolidated within our financial statements for all periods prior to January 3, 2016. Accordingly, all intercompany royalties, option and licensing fees, and other charges between us and Cercacor have been eliminated in the consolidation. For additional discussion of accounting for Cercacor, see Note 3 to our accompanying consolidated financial statements in Part IV, Item 15(a) of this Annual Report on Form 10-K.
|
|
(2)
|
See Note 2 to our accompanying consolidated financial statements in Part IV, Item 15(a) of this Annual Report on Form 10-K for a description of the method used to compute basic and diluted net income per common share.
|
|
December 31,
2016 |
January 2,
2016 |
January 3,
2015 |
December 28,
2013 |
December 31,
2012 |
|||||||||||||||
|
(in thousands, except dividends declared per common share)
|
|||||||||||||||||||
|
Balance Sheet Data:
|
|||||||||||||||||||
|
Cash, cash equivalents and short-term investments
|
$
|
305,970
|
|
$
|
132,317
|
|
$
|
134,453
|
|
$
|
95,466
|
|
$
|
71,554
|
|
||||
|
Working capital
|
286,861
|
|
166,509
|
|
173,182
|
|
168,008
|
|
129,808
|
|
|||||||||
|
Total assets
|
820,525
|
|
601,735
|
|
565,006
|
|
438,662
|
|
374,661
|
|
|||||||||
|
Total debt
|
71
|
|
185,145
|
|
125,224
|
|
336
|
|
115
|
|
|||||||||
|
Total equity
|
560,236
|
|
275,712
|
|
307,741
|
|
326,401
|
|
275,668
|
|
|||||||||
|
Dividends declared per common share
(1)
|
$
|
—
|
|
$
|
—
|
|
$
|
—
|
|
$
|
—
|
|
$
|
1.00
|
|
||||
57
_____________
|
(1)
|
During the year ended December 29, 2012, our Board evaluated a variety of options to return value to stockholders, including acquisition opportunities, stock buy-back programs and dividends. After considering all available options, our Board concluded that the best and most direct way to reward stockholders for their continued investment and confidence in Masimo was through the declaration of a special cash dividend. In October 2012, our Board declared a special dividend of $1.00 per share, or $57.3 million in the aggregate, which was paid in December 2012. There can be no assurance as to the amount or frequency of any dividends that could be declared in the future.
|
58
|
ITEM 7.
|
MANAGEMENT’S DISCUSSION AND ANALYSIS OF FINANCIAL CONDITION AND RESULTS OF OPERATIONS
|
You should read this discussion together with the financial statements, related notes and other financial information included in this Annual Report on Form 10-K. The following discussion may contain predictions, estimates and other forward-looking statements that involve a number of risks and uncertainties, including those discussed under Item 1A—“Risk Factors” and elsewhere in this Annual Report on Form 10-K. These risks could cause our actual results to differ materially from any future performance suggested below.
Executive Overview
We are a global medical technology company that develops, manufactures and markets a variety of noninvasive monitoring technologies. Our mission is to improve patient outcomes and reduce cost of care by taking noninvasive monitoring to new sites and applications
™
. We invented Masimo SET
®
,
which provides the capabilities of Measure-through Motion and Low Perfusion
™
pulse oximetry to address the primary limitations of conventional pulse oximetry. Pulse oximetry is the noninvasive measurement of the oxygen saturation level of arterial blood, or the blood that delivers oxygen to the body’s tissues, and pulse rate. Pulse oximetry is one of the most common measurements made in and out of hospitals around the world. Masimo SET
®
has been validated in over 100 independent clinical studies and is the only pulse oximetry technology we are aware of that has been proven to help clinicians detect critical congenital heart disease in newborns, reduce retinopathy of prematurity in neonates, and decrease intensive care unit transfers and rapid response activations on the general floor.
After introducing Masimo SET
®
, we have continued to innovate by introducing noninvasive measurements beyond arterial blood oxygen saturation level and pulse rate, which create new market opportunities in both the hospital and non-hospital care settings. We believe our Masimo rainbow SET
™
platform, which utilizes both Masimo SET
®
and licensed rainbow
®
technology, includes the first devices cleared by the U.S. Food and Drug Administration (the FDA) to noninvasively and continuously monitor multiple measurements that previously required invasive or complicated procedures. SpCO
®
, our noninvasive carboxyhemoglobin parameter, allows measurement of carbon monoxide levels in the blood. Carbon monoxide is the most common cause of poisoning in the world. SpMet
®
, our noninvasive methemoglobin sensor, allows for the measurement of methemoglobin levels in the blood. Methemoglobin in the blood leads to a dangerous condition known as methemoglobinemia, which occurs as a reaction to some common drugs used in hospitals and outpatient procedures. Our PVi
®
parameter measures dynamic changes in perfusion index (Pi) during the respiratory cycle and can assist clinicians with fluid administration. Our noninvasive hemoglobin sensor, SpHb
®
, monitors hemoglobin, the oxygen-carrying component of red blood cells. Hemoglobin measurement is one of the most frequent invasive laboratory measurements in the world, often measured as part of a complete blood count. A low hemoglobin status is called anemia, which is generally caused by bleeding or the inability of the body to produce red blood cells. RRa
®
allows for the continuous and noninvasive monitoring of respiration rate, via rainbow Acoustic Monitoring
®
. Respiration rate is the number of breaths per minute. A low respiration rate is indicative of respiratory depression and a high respiration rate is indicative of patient distress. Traditional methods used to measure respiration rate are often considered inaccurate or are not tolerated well by patients. RRp
™
allows clinicians to noninvasively and continuously measure and monitor respiration rate using a standard Masimo SET
®
pulse oximetry or rainbow
®
Pulse CO-Oximeter
®
sensor. The RRp
™
measurement is determined by the variations in the plethysmograph waveform due to respiration. SpfO
2
™
, or
fractional
oxygen saturation, allows more precise arterial oxygenation assessment in patients with elevated dyshemoglobins, common throughout the hospital and pre-hospital setting, compared to
functional
oxygen saturation, and may also allow earlier interventions and more timely therapeutic decisions. ORi
™
provides real-time visibility to oxygenation status in moderate hyperoxic range, which we define as a patient’s oxygen “reserve”. ORi
™
can be trended and has optional alarms to notify clinicians of changes in a patient’s oxygen reserve.
Our products consist of a monitor or circuit board, and a “Board-in-Cable” solution, for use with our proprietary single-patient-use and reusable sensors and cables. We sell our products to end-users through our direct sales force and certain distributors, and also sell some of our products to our OEM partners, for incorporation into their equipment. As of
December 31, 2016
we estimate that the worldwide installed base of our pulse oximeters and OEM monitors that incorporate Masimo SET
®
and rainbow SET
™
was more than
1,504,000
units. Our installed base is the primary driver for the recurring sales of our sensors, most notably single-patient adhesive sensors.
We offer Masimo SET
®
and rainbow SET
™
through our OEMs and our own end-user products, including the Radical-7
®
, Rad-57
®
, Pronto
®
, Rad-8
®
, Rad-5
®
, Rad-5v
®
and Rad-97
™
. Our solutions and related products are based upon our proprietary Masimo SET
®
and rainbow
®
algorithms. This software-based technology is incorporated into a variety of product platforms depending on our customers’ specifications. Our technology is supported by a substantial intellectual property portfolio that we have built through internal development and, to a lesser extent, acquisitions and license agreements. As of
December 31, 2016
, we had
913
issued and pending patents worldwide. We have exclusively licensed from our development partner, Cercacor, the right to OEM rainbow
®
technology and the right to incorporate rainbow
®
technology into our products intended to be used by professional caregivers, including, but not limited to, hospital caregivers and alternate care facility caregivers.
59
Settlement Agreement with Koninklijke Philips N.V. (Philips N.V.)
On November 5, 2016, we entered into a settlement agreement with Philips N.V. (the Philips Settlement Agreement), pursuant to which Philips N.V. agreed to pay us $300 million, and Philips N.V. and its affiliates (collectively, the Philips Group) and us (collectively, the Parties) agreed to dismiss, with prejudice, all pending legal and contractual disputes between the Parties and agreed not to sue each other for patent infringement for certain of each other’s products. In addition, the Parties agreed to work together to integrate our technologies into additional Philips Group products, and to jointly develop certain other products. Each of the Parties has additional obligations to the other in the event that such party does not meet certain objectives under the settlement agreement. The Philips Settlement Agreement also contains rainbow
®
parameter pricing and related terms. The Parties further agreed to undertake a joint marketing program to promote rainbow
®
adoption with Philips Group products. See Note 15 to our accompanying consolidated financial statements under the caption “Litigation” included in Part IV, Item 15(a) of this Annual Report on Form 10-K for additional information on the Philips legal disputes and the Philips Settlement Agreement.
Stock Repurchase Programs
In February 2013, our Board authorized the repurchase of up to
6.0 million
shares of common stock under a stock repurchase program (2013 Plan). In October 2014, our Board increased the number of shares of our common stock authorized for repurchase under the 2013 Plan by
3.0 million
shares, bringing the total number of shares of our common stock authorized for repurchase under the 2013 Plan to
9.0 million
. The 2013 Plan terminated pursuant to its terms in September 2015 when all of the authorized
9.0 million
shares had been repurchased.
In September 2015, our Board authorized a new stock repurchase program, whereby we may purchase up to
5.0 million
shares of our common stock over a period of up to three years. The stock repurchase program may be carried out at the discretion of a committee comprised of our Chief Executive Officer and Chief Financial Officer through open market purchases, one or more Rule 10b5-1 trading plans, block trades and in privately negotiated transactions. The total remaining shares authorized for repurchase under this stock repurchase program approximated
2.9 million
shares as of
December 31, 2016
.
For further details regarding our stock repurchase program, please see Note 13 to our accompanying consolidated financial statements included in Part IV, Item 15(a) of this Annual Report on Form 10-K.
Cercacor
Cercacor is an independent entity spun off from Masimo to our stockholders in 1998. We are a party to a cross-licensing agreement with Cercacor, which was amended and restated effective January 1, 2007 (Cross-Licensing Agreement), that governs each party’s rights to certain intellectual property held by the two companies. Joe Kiani, our Chairman and Chief Executive Officer, is also the Chairman and Chief Executive Officer of Cercacor. We have also entered into various other agreements with Cercacor, including an Administrative Services Agreement, a Consulting Services Agreement and a Sublease Agreement. See Note 4 to our accompanying consolidated financial statements included in Part IV, Item 15(a) of this Annual Report on Form 10-K for additional information on these agreements and other transactions with Cercacor.
As a result of recent changes in the capital structure of Cercacor, as well as certain of its contractual relationships with us, we completed a re-evaluation of the authoritative consolidation guidance during the first quarter of 2016 and determined that although Cercacor remains a variable interest entity (VIE), we are no longer its primary beneficiary as we can no longer be deemed to have the power to direct the activities of Cercacor that most significantly impact Cercacor’s economic performance and can no longer be deemed to have an obligation to absorb Cercacor’s losses pursuant to our on-going contractual relationships with Cercacor. Based on such determination, we discontinued consolidating Cercacor within our consolidated financial statements effective as of January 3, 2016. However, Cercacor continues to be a related party following its deconsolidation. We recognized a gain of $0.3 million upon such deconsolidation, which has been reported within non-operating income in the consolidated statement of operations. See Note 3 to our accompanying consolidated financial statements included in Part IV, Item 15(a) of this Annual Report on Form 10-K for additional information on the deconsolidation of Cercacor.
60
Results of Operations
The following table sets forth, for the periods indicated, our results of operations expressed as U.S. Dollar amounts and as a percentage of revenue.
|
Year ended
December 31, 2016 |
Year ended
January 2, 2016 |
Year ended
January 3, 2015 |
||||||||||||||||||
|
Amount
|
% of
Revenue
|
Amount
|
% of
Revenue |
Amount
|
% of
Revenue |
|||||||||||||||
|
(dollars in thousands)
|
||||||||||||||||||||
|
Revenue:
|
||||||||||||||||||||
|
Product
|
$
|
663,846
|
|
95.6
|
%
|
$
|
599,334
|
|
95.1
|
%
|
$
|
556,764
|
|
94.9
|
%
|
|||||
|
Royalty
|
30,779
|
|
4.4
|
|
30,777
|
|
4.9
|
|
29,879
|
|
5.1
|
|
||||||||
|
Total revenue
|
694,625
|
|
100.0
|
|
630,111
|
|
100.0
|
|
586,643
|
|
100.0
|
|
||||||||
|
Cost of goods sold
|
230,826
|
|
33.2
|
|
220,128
|
|
34.9
|
|
195,864
|
|
33.4
|
|
||||||||
|
Gross profit
|
463,799
|
|
66.8
|
|
409,983
|
|
65.1
|
|
390,779
|
|
66.6
|
|
||||||||
|
Operating expenses:
|
||||||||||||||||||||
|
Selling, general and administrative
|
253,667
|
|
36.5
|
|
252,725
|
|
40.1
|
|
241,016
|
|
41.1
|
|
||||||||
|
Research and development
|
59,362
|
|
8.5
|
|
56,617
|
|
9.0
|
|
56,581
|
|
9.5
|
|
||||||||
|
Litigation settlement, award and/or defense costs
|
(270,000
|
)
|
(38.9
|
)
|
(19,609
|
)
|
(3.1
|
)
|
(10,331
|
)
|
(1.8
|
)
|
||||||||
|
Total operating expenses
|
43,029
|
|
6.2
|
|
289,733
|
|
46.0
|
|
287,266
|
|
49.0
|
|
||||||||
|
Operating income
|
420,770
|
|
60.6
|
|
120,250
|
|
19.1
|
|
103,513
|
|
17.6
|
|
||||||||
|
Non-operating expense
|
2,429
|
|
0.3
|
|
3,905
|
|
0.6
|
|
1,472
|
|
0.3
|
|
||||||||
|
Income before provision for income taxes
|
418,341
|
|
60.2
|
|
116,345
|
|
18.5
|
|
102,041
|
|
17.5
|
|
||||||||
|
Provision for income taxes
|
117,675
|
|
16.9
|
|
34,845
|
|
5.5
|
|
27,678
|
|
4.7
|
|
||||||||
|
Net income including noncontrolling interests
|
300,666
|
|
43.3
|
|
81,500
|
|
13.0
|
|
74,363
|
|
12.7
|
|
||||||||
|
Net income (loss) attributable to noncontrolling interests
|
—
|
|
—
|
|
(1,800
|
)
|
(0.3
|
)
|
1,845
|
|
0.3
|
|
||||||||
|
Net income attributable to Masimo Corporation stockholders
|
$
|
300,666
|
|
43.3
|
%
|
$
|
83,300
|
|
13.3
|
%
|
$
|
72,518
|
|
12.4
|
%
|
|||||
Comparison of the Year ended
December 31, 2016
to the Year ended
January 2, 2016
Revenue
. Total revenue
increased
$64.5 million
, or
10.2%
, to
$694.6 million
for the year ended
December 31, 2016
, from
$630.1 million
for the year ended
January 2, 2016
. The following table details our total product revenues by the geographic area to which the products were shipped for fiscal years
2016
and
2015
(dollars in thousands):
|
Year ended
December 31, 2016 |
Year ended
January 2, 2016 |
Increase/
(Decrease)
|
Percentage
Change
|
|||||||||||||||||
|
United States
|
$
|
465,588
|
|
70.1
|
%
|
$
|
421,628
|
|
70.3
|
%
|
$
|
43,960
|
|
10.4
|
%
|
|||||
|
Europe, Middle East and Africa
|
112,273
|
|
16.9
|
|
105,323
|
|
17.6
|
|
6,950
|
|
6.6
|
|
||||||||
|
Asia and Australia
|
65,955
|
|
10.0
|
|
55,675
|
|
9.3
|
|
10,280
|
|
18.5
|
|
||||||||
|
North and South America (excluding United States)
|
20,030
|
|
3.0
|
|
16,708
|
|
2.8
|
|
3,322
|
|
19.9
|
|
||||||||
|
Total Product Revenue
|
$
|
663,846
|
|
100.0
|
%
|
$
|
599,334
|
|
100.0
|
%
|
$
|
64,512
|
|
55.4
|
%
|
|||||
|
Royalty
|
30,779
|
|
30,777
|
|
2.0
|
|
||||||||||||||
|
Total Revenue
|
$
|
694,625
|
|
$
|
630,111
|
|
$
|
64,514
|
|
|||||||||||
Product revenues
increased
$64.5 million
, or
10.8%
, to
$663.8 million
for the year ended
December 31, 2016
from
$599.3 million
for the year ended
January 2, 2016
. This increase was primarily due to higher sales of our consumable and reusable sensor products resulting from an increase in our installed base of circuit boards and pulse oximeters, as well as increased sales of rainbow
®
parameters and higher direct and distribution sales of capital equipment. Total rainbow
®
product revenue
rose
$4.9 million
, or
7.8%
, to
$66.7 million
for the year ended
December 31, 2016
from
$61.8 million
for the year ended
January 2, 2016
. During the year ended
December 31, 2016
, the impact of movements in foreign exchange rates from the prior year period on the U.S. Dollar translation of foreign sales that were denominated in various foreign currencies, primarily in Europe, Asia and
61
Canada, increased product revenues by approximately
$0.4 million
. As of
December 31, 2016
, we estimate that our installed base of circuit boards and pulse oximeters totaled more than
1,504,000
units, up from
1,414,000
units at
January 2, 2016
.
Product revenue generated through our direct and distribution sales channels
increased
$63.8 million
, or
12.5%
, to
$572.0 million
for the year ended
December 31, 2016
, compared to
$508.2 million
for the year ended
January 2, 2016
. Revenues from our OEM channel
increased
0.7 million
, or
0.8%
, to
$91.8 million
for the year ended
December 31, 2016
as compared to
$91.1 million
for the year ended
January 2, 2016
.
Royalty revenue remained consistent with the prior year period and is primarily comprised of amounts received from Medtronic plc (Medtronic) pursuant to the terms of our amended settlement agreement. Pursuant to the terms of the Third Amendment to Settlement Agreement and Release of Claims effective September 2016, Medtronic agreed to continue paying royalties through October 6, 2018, after which no more royalties will be due.
Gross Profit
. Gross profit consists of total revenue less cost of goods sold. Our gross profit for fiscal years
2016
and
2015
was as follows (dollars in thousands):
|
Gross Profit
|
||||||||||||||||||||
|
Year ended
December 31, 2016 |
Percentage of
Net Revenues
|
Year ended
January 2, 2016 |
Percentage of
Net Revenues
|
Increase/
(Decrease) |
Percentage
Change |
|||||||||||||||
|
Product Gross Profit
|
$
|
433,020
|
|
65.2
|
%
|
$
|
379,206
|
|
63.3
|
%
|
$
|
53,814
|
|
14.2
|
%
|
|||||
|
Royalty Gross Profit
|
30,779
|
|
100.0
|
|
30,777
|
|
100.0
|
|
2
|
|
—
|
|
||||||||
|
Total Gross Profit
|
$
|
463,799
|
|
66.8
|
%
|
$
|
409,983
|
|
65.1
|
%
|
$
|
53,816
|
|
13.1
|
%
|
|||||
Cost of goods sold includes labor, material, overhead and other similar costs related to the production, supply, distribution and support of our products. Cost of goods sold
increased
$10.7 million
to
$230.8 million
for the year ended
December 31, 2016
, from
$220.1 million
for the year ended
January 2, 2016
, primarily due to the increase in product revenues and the impact of approximately $6.4 million of Cercacor royalty expenses that are no longer eliminated in consolidation. These increases were partially offset by the non-recurrence of approximately $9.7 million of inventory valuation adjustments related to certain product end-of-life decisions in the year ended
January 2, 2016
and approximately $2.8 million in lower cost of goods sold resulting from favorable foreign exchange movements, primarily in the Mexican Peso. Our total gross margin
increased
to
66.8%
for the year ended
December 31, 2016
from
65.1%
for the year ended
January 2, 2016
. This increase in product gross margin was primarily due to customer/product mix favorability, our continued cost reduction efforts, the non-recurrence of the prior year inventory valuation adjustments and favorable movements in foreign exchange rates, which were partially offset by the non-elimination of the Cercacor royalty costs. We incurred $6.7 million in Cercacor royalty expense for the year ended
January 2, 2016
that was eliminated in our consolidated financial statements for such period. Had such royalty expense not been eliminated in consolidation, the adjusted product gross profit margin would have been
62.2%
for the year ended
January 2, 2016
, compared to our reported product gross profit margin of
65.2%
for the year ended
December 31, 2016
. (See Note 3 to our accompanying consolidated financial statements included in Part IV, Item 15(a) of this Annual Report on Form 10-K for additional information related to the deconsolidation of Cercacor.) A reconciliation of GAAP product gross profit to adjusted product gross profit is as follows (dollars in thousands):
|
Year ended
December 31, 2016 |
Gross Profit
Percentage |
Year ended
January 2, 2016 |
Gross Profit
Percentage |
||||||||||
|
Product Gross Profit (GAAP)
|
$
|
433,020
|
|
65.2
|
%
|
$
|
379,206
|
|
63.3
|
%
|
|||
|
Less: Cercacor Royalty Expense Eliminated in Consolidation
|
—
|
|
—
|
|
6,660
|
|
1.1
|
|
|||||
|
Adjusted Product Gross Profit (Non-GAAP)
|
$
|
433,020
|
|
65.2
|
%
|
$
|
372,546
|
|
62.2
|
%
|
|||
Selling, General and Administrative
. Selling, general and administrative expenses consist primarily of salaries and related expenses for sales, marketing and administrative personnel, sales commissions, advertising and promotion costs, professional fees related to legal, accounting and other outside services, public company costs and other corporate expenses. Selling, general and administrative expenses for fiscal years
2016
and
2015
were as follows (dollars in thousands):
|
Selling, General and Administrative
|
|||||
|
Year ended
December 31, 2016 |
Percentage of
Net Revenues |
Year ended
January 2, 2016 |
Percentage of
Net Revenues |
Increase/
(Decrease) |
Percentage
Change |
|
$253,667
|
36.5%
|
$252,725
|
40.1%
|
$942
|
0.4%
|
62
Selling, general and administrative expenses
increased
$0.9 million
, or
0.4%
, to
$253.7 million
for the year ended
December 31, 2016
from
$252.7 million
for the year ended
January 2, 2016
. This net increase was due primarily to increases in payroll-related costs of approximately $12.6 million, group purchasing organization (GPO) and distribution administration fees of $2.8 million, travel and entertainment costs of $2.6 million and advertising and trade show expenses of $1.5 million. These increases were partially offset by a decrease in legal fees of approximately $9.7 million, of which $3.0 million resulted from an insurance recovery related to a dispute over reimbursable defense costs from prior periods, and lower medical device excise taxes of approximately $6.9 million as the result of the two year moratorium signed into law on December 18, 2015 under the Consolidated Appropriations Act. Also offsetting these higher expenses were approximately
$2.1 million
of selling, general and administrative expenses related to Cercacor that were included in our consolidated results of operations for the year ended
January 2, 2016
, as compared to $0 for the year ended
December 31, 2016
due to the deconsolidation of Cercacor as of January 3, 2016. (See Note 3 of our accompanying consolidated financial statements included in Part IV, Item 15(a) of this Annual Report on Form 10-K for additional information related to the deconsolidation of Cercacor.) Approximately
$9.4 million
and
$8.1 million
of share-based compensation expense was included in selling, general and administrative expenses for the years ended
December 31, 2016
and
January 2, 2016
, respectively.
Research and Development
. Research and development expenses consist primarily of salaries and related expenses for engineers and other personnel engaged in the design and development of our products. These expenses also include third-party fees paid to consultants, prototype and engineering supply expenses and the costs of clinical trials. Research and development expenses for fiscal years
2016
and
2015
were as follows (dollars in thousands):
|
Research and Development
|
|||||
|
Year ended
December 31, 2016 |
Percentage of
Net Revenues |
Year ended
January 2, 2016 |
Percentage of
Net Revenues |
Increase/
(Decrease) |
Percentage
Change |
|
$59,362
|
8.5%
|
$56,617
|
9.0%
|
$2,745
|
4.8%
|
Research and development expenses
increased
$2.7 million
, or
4.8%
, to
$59.4 million
for the year ended
December 31, 2016
from
$56.6 million
for the year ended
January 2, 2016
. This net increase was due primarily to increases in payroll-related costs of approximately $5.2 million, occupancy-related costs of $1.7 million, engineering project-related costs and professional fees of $0.9 million and the non-recurrence of approximately $0.9 million of cost reimbursements from Cercacor in the year ended
January 2, 2016
. Offsetting these higher expenses were approximately
$6.3 million
of research and development expenses related to Cercacor that were included in our consolidated results of operations for the year ended
January 2, 2016
, as compared to $0 for the year ended
December 31, 2016
due to the deconsolidation of Cercacor as of January 3, 2016. (See Note 3 of our accompanying consolidated financial statements included in Part IV, Item 15(a) of this Annual Report on Form 10-K for additional information related to the deconsolidation of Cercacor.) Included in research and development expenses was approximately
$2.7 million
and
$2.3 million
of share-based compensation expense for the years ended
December 31, 2016
and
January 2, 2016
, respectively.
Litigation Settlement, Award and/or Defense Costs
. Litigation settlement, award and/or defense costs for fiscal years
2016
and
2015
were as follows (dollars in thousands):
|
Litigation Settlement, Award and/or Defense Costs
|
|||||
|
Year ended
December 31, 2016 |
Percentage of
Net Revenues |
Year ended
January 2, 2016 |
Percentage of
Net Revenues |
Increase/
(Decrease) |
Percentage
Change |
|
$(270,000)
|
(38.9)%
|
$(19,609)
|
(3.1)%
|
$(250,391)
|
1,276.9%
|
On November 5, 2016, we entered into a settlement agreement (the Philips Settlement Agreement) with Koninklijke Philips N.V. (Philips N.V.), which among other things, settled all of the claims, legal proceedings and contractual disputes between us, Philips and its affiliates. Pursuant to the Philips Settlement Agreement, Philips N.V. paid us $300 million, $30 million of which related to certain future performance obligations by us and, therefore, has been deferred to future periods in accordance with authoritative accounting guidance. See Note 15 to our accompanying consolidated financial statements under the caption “Litigation” included in Part IV, Item 15(a) of this Annual Report on Form 10-K for additional information on the Philips legal disputes and the Philips Settlement Agreement.
On November 16, 2015, we entered into a Settlement and Covenant Not to Sue Agreement (the Mindray Settlement Agreement) with Shenzhen Mindray Biomedical Electronics Co., Ltd. and certain of its affiliates (collectively, Mindray). The Mindray Settlement Agreement settled each of the claims and legal proceedings between us and Mindray. Pursuant to the Mindray Settlement Agreement, Mindray paid us an aggregate of $25.0 million.
63
Two of our former physician office sales representatives filed employment-related claims against us in 2011 regarding our noninvasive hemoglobin monitoring products. In January 2014, an arbitrator awarded the former sales representatives approximately $5.4 million in damages (the Arbitration Award). As a result, we recorded a charge of $8.0 million in the fiscal quarter ended December 28, 2013, which included the Arbitration Award and approximately $2.6 million in defense-related costs that had previously been reimbursed by insurance. We challenged the Arbitration Award in the U.S. District Court for the Central District of California, and in April 2014, the District Court vacated the Arbitration Award. Accordingly, we reversed the previous $8.0 million charge in the fiscal quarter ended March 29, 2014. The former sales representatives appealed the U.S. District Court’s ruling, and the appeal argument was held in the Ninth Circuit Court of Appeals on February 1, 2016. On February 19, 2016, the Ninth Circuit Court of Appeals reversed the decision of the District Court vacating the award, and remanded the case to the District Court with instructions to confirm the Arbitration Award. As a result, we reinstated the $5.4 million charge for the Arbitration Award that was previously reversed, plus approximately $0.7 million of estimated non-operating interest expense, as of January 2, 2016. As of December 31, 2016, we have not reinstated the $2.6 million charge for defense-related costs previously reimbursed by the insurance company based upon our assessment of this matter.
Non-operating Expense
. Non-operating expense consists primarily of interest income, interest expense and foreign exchange losses. Non-operating expense for fiscal years
2016
and
2015
was as follows (dollars in thousands):
|
Non-operating expense
|
|||||
|
Year ended
December 31, 2016 |
Percentage of
Net Revenues |
Year ended
January 2, 2016 |
Percentage of
Net Revenues |
Increase/
(Decrease) |
Percentage
Change |
|
$2,429
|
0.3%
|
$3,905
|
0.6%
|
$(1,476)
|
(37.8)%
|
Non-operating expense was
$2.4 million
for the year ended
December 31, 2016
, as compared to
$3.9 million
for the year ended
January 2, 2016
. This net decrease of approximately
$1.5 million
was primarily due to higher interest income of $0.4 million and a $0.3 million gain resulting from our deconsolidation of Cercacor. (See Note 3 of our accompanying consolidated financial statements included in Part IV, Item 15(a) of this Annual Report on Form 10-K for additional information related to the deconsolidation of Cercacor.) In addition, we recognized approximately $0.1 million of net realized and unrealized gains on foreign currency denominated transactions during the year ended
December 31, 2016
, as compared to $0.5 million of net realized and unrealized losses on foreign currency denominated transactions during the year ended
January 2, 2016
. Offsetting these increases was approximately $0.2 million of higher interest expense during the year ended
December 31, 2016
, resulting from increased borrowings under our revolving credit agreement
.
Provision for Income Taxes
. Our provision for income taxes for fiscal years
2016
and
2015
was as follows (dollars in thousands):
|
Provision for Income Taxes
|
|||||
|
Year ended
December 31, 2016 |
Percentage of
Net Revenues |
Year ended
January 2, 2016 |
Percentage of
Net Revenues |
Increase/
(Decrease) |
Percentage
Change |
|
$117,675
|
16.9%
|
$34,845
|
5.5%
|
$82,830
|
237.7%
|
Our provision for income taxes was
$117.7 million
for the year ended
December 31, 2016
compared to
$34.8 million
for the year ended
January 2, 2016
. Our effective tax rate was
28.1%
for the year ended
December 31, 2016
compared to
30.0%
for the year ended
January 2, 2016
. This decrease in our effective tax rate was primarily due to a tax benefit of $13.0 million during the year ended
December 31, 2016
related to excess tax benefits realized for stock-based compensation pursuant to our early adoption of Accounting Standards Update No. 2016-09,
Compensation-Stock Compensation (Topic 718): Improvements to Employee Share-Based Payment Accounting
. No similar tax benefit was recognized in our provision for income taxes for the year ended
January 2, 2016
.
We have made no provision for U.S. income taxes or foreign withholding taxes on the earnings of our foreign subsidiaries as these amounts are intended to be indefinitely reinvested in operations outside the U.S. Our effective tax rate was lower than the U.S. federal statutory rate primarily due to research and development tax credits and a portion of our earnings being generated from countries other than the U.S., where such earnings are generally subject to lower tax rates than the U.S. While we expect our effective tax rate will continue to be lower than the U.S. federal statutory rate, our actual future effective income tax rate will depend on various factors, including changes in tax laws, changes in deferred tax asset valuation allowances, the recognition and derecognition of tax benefits associated with uncertain tax positions and the geographic composition of our pre-tax income.
64
Comparison of the Year ended
January 2, 2016
to the Year ended
January 3, 2015
Revenue
. Total revenue increased $43.5 million, or 7.4%, to $630.1 million for the year ended January 2, 2016, from $586.6 million for the year ended January 3, 2015. The following chart details our total product revenues by the geographic area to which the products were shipped for fiscal years 2015 and 2014 (dollars in thousands):
|
Year ended
January 2, 2016 |
Year ended
January 3, 2015 |
Increase/
(Decrease) |
Percentage
Change |
|||||||||||||||||
|
United States
|
$
|
421,628
|
|
70.3
|
%
|
$
|
380,232
|
|
68.3
|
%
|
$
|
41,396
|
|
10.9
|
%
|
|||||
|
Europe, Middle East and Africa
|
105,323
|
|
17.6
|
|
100,747
|
|
18.1
|
|
4,576
|
|
4.5
|
|
||||||||
|
Asia and Australia
|
55,675
|
|
9.3
|
|
57,951
|
|
10.4
|
|
(2,276
|
)
|
(3.9
|
)
|
||||||||
|
North and South America (excluding United States)
|
16,708
|
|
2.8
|
|
17,834
|
|
3.2
|
|
(1,126
|
)
|
10.1
|
|
||||||||
|
Total Product Revenue
|
$
|
599,334
|
|
100.0
|
%
|
$
|
556,764
|
|
100.0
|
%
|
$
|
42,570
|
|
21.6
|
%
|
|||||
|
Royalty
|
30,777
|
|
29,879
|
|
898
|
|
||||||||||||||
|
Total Revenue
|
$
|
630,111
|
|
$
|
586,643
|
|
$
|
43,468
|
|
|||||||||||
Product revenues increased $42.6 million, or 7.6%, to $599.3 million in the year ended January 2, 2016 from $556.8 million in the year ended January 3, 2015. This increase was primarily due to higher sales of our consumable and reusable sensor products resulting from an increase in our installed base of circuit boards and pulse oximeters, as well as higher sales of rainbow
®
instruments and parameters. Total rainbow
®
product revenue increased $10.1 million, or 19.5%, to $61.8 million in the year ended January 2, 2016 from $51.8 million in the year ended January 3, 2015. Partially offsetting our increase in product revenue was approximately $18.6 million from unfavorable movements in foreign exchange rates from the prior year period that reduced the U.S. Dollar translation of foreign sales that were denominated in various foreign currencies, primarily in Europe and Asia, $1.4 million of which unfavorably impacted our rainbow
®
product revenue. In addition, we estimate that the extra week in the year ended January 3, 2015 (which consisted of 53 weeks versus 52 weeks in the year ended January 2, 2016) resulted in additional revenue of approximately $5.0 million during such year. As of January 2, 2016, we estimate that our installed base of circuit boards and pulse oximeters totaled more than 1,414,000 units, up from 1,313,000 units at January 3, 2015.
Product revenue generated through our direct and distribution sales channels increased $35.5 million, or 7.5%, to $508.2 million for the year ended January 2, 2016, compared to $472.7 million for the year ended January 3, 2015. Revenues from our OEM channel increased $7.0 million, or 8.4%, to $91.1 million for the year ended January 2, 2016 as compared to $84.1 million for the year ended January 3, 2015. The increase in revenue for both our direct and distribution and OEM channels was consistent with our overall product revenue growth of 7.6% for the year ended January 2, 2016.
Royalty revenue consists of amounts received from Medtronic related to their U.S. sales pursuant to the terms of our amended settlement agreement.
Gross Profit
. Gross profit consists of total revenue less cost of goods sold. Our gross profit for fiscal years
2015
and
2014
was as follows (dollars in thousands):
|
Gross Profit
|
||||||||||||||||||||
|
Year ended
January 2, 2016 |
Percentage of
Net Revenues
|
Year ended
January 3, 2015 |
Percentage of
Net Revenues
|
Increase/
(Decrease) |
Percentage
Change |
|||||||||||||||
|
Product Gross Profit
|
$
|
379,206
|
|
63.3
|
%
|
$
|
360,900
|
|
64.8
|
%
|
$
|
18,306
|
|
5.1
|
%
|
|||||
|
Royalty Gross Profit
|
30,777
|
|
100.0
|
|
29,879
|
|
100.0
|
|
898
|
|
3.0
|
|
||||||||
|
Total Gross Profit
|
$
|
409,983
|
|
65.1
|
%
|
$
|
390,779
|
|
66.6
|
%
|
$
|
19,204
|
|
4.9
|
%
|
|||||
Cost of goods sold increased $24.3 million to $220.1 million in the year ended January 2, 2016 from $195.9 million in the year ended January 3, 2015. Our total gross margin decreased to 65.1% for the year ended January 2, 2016 from 66.6% for the year ended January 3, 2015. Excluding royalties, product gross margin decreased to 63.3% for the year ended January 2, 2016 from 64.8% for the year ended January 3, 2015. This decrease in product gross margin was primarily due to approximately $9.7 million of inventory valuation adjustments resulting principally from certain product end-of-life decisions that were made during the fourth quarter of fiscal year 2015. Product gross margin was also negatively impacted by unfavorable movements in foreign exchange rates during fiscal 2015 that reduced the U.S. Dollar translation of foreign sales denominated in various foreign currencies by $18.6 million, which was partially offset by $4.2 million in lower cost of goods sold resulting from other favorable foreign exchange movements during fiscal 2015.
65
We incurred $6.7 million and $5.5 million in Cercacor royalty expenses for the years ended January 2, 2016 and January 3, 2015, respectively, which have been eliminated in our consolidated financial results for the periods presented. Had these royalty expenses not been eliminated, our adjusted product gross profit margin would have been 62.2% and 63.8% for the years ended January 2, 2016 and January 3, 2015, respectively. A reconciliation of GAAP product gross profit to adjusted product gross profit is as follows (dollars in thousands):
|
Year ended
January 2, 2016 |
Gross Profit
Percentage |
January 3,
2015 |
Gross Profit
Percentage |
||||||||||
|
Product Gross Profit (GAAP)
|
$
|
379,206
|
|
63.3
|
%
|
$
|
360,900
|
|
64.8
|
%
|
|||
|
Less: Cercacor Royalty Expense Eliminated in Consolidation
|
6,660
|
|
1.1
|
|
5,400
|
|
0.9
|
|
|||||
|
Adjusted Product Gross Profit (Non-GAAP)
|
$
|
372,546
|
|
62.2
|
%
|
$
|
355,430
|
|
63.9
|
%
|
|||
Selling, General and Administrative
. Selling, general and administrative expenses for fiscal years
2015
and
2014
were as follows (dollars in thousands):
|
Selling, General and Administrative
|
|||||
|
Year ended
January 2, 2016 |
Percentage of
Net Revenues |
Year ended
January 3, 2015 |
Percentage of
Net Revenues |
Increase/
(Decrease) |
Percentage
Change |
|
$252,725
|
40.1%
|
$241,016
|
41.1%
|
$11,709
|
4.9%
|
Selling, general and administrative expenses increased $11.7 million, or 4.9%, to $252.7 million for the year ended January 2, 2016 from $241.0 million for the year ended January 3, 2015, net of an estimated $7.3 million resulting from favorable movements in foreign exchange rates that reduced the U.S. Dollar translation of expenses denominated in various foreign currencies during fiscal 2015. This overall net increase in selling, general and administrative expenses was primarily attributable to approximately $4.1 million of higher charitable donations, including $3.5 million of additional donations to the Masimo Foundation for Ethics, Innovation and Competition in Healthcare (the Masimo Foundation), $2.1 million of higher GPO fees and third party commissions, $1.8 million of higher occupancy-related costs, $1.7 million of higher legal and professional fees and $1.1 million of higher payroll and employee-related costs in the year ended January 2, 2016. Approximately $8.1 million and $8.8 million of share-based compensation expense was included in selling, general and administrative expenses for the years ended January 2, 2016 and January 3, 2015, respectively. Also included in selling, general and administrative expenses were approximately $6.9 million and $6.6 million of medical device excise tax for the years ended January 2, 2016 and January 3, 2015, respectively, which was suspended for two years beginning January 1, 2016. Total direct selling, general and administrative expenses incurred by Cercacor were $2.3 million and $2.8 million for the years ended January 2, 2016 and January 3, 2015, respectively.
Research and Development
. Research and development expenses for fiscal years
2015
and
2014
were as follows (dollars in thousands):
|
Research and Development
|
|||||
|
Year ended
January 2, 2016 |
Percentage of
Net Revenues |
Year ended
January 3, 2015 |
Percentage of
Net Revenues |
Increase/
(Decrease) |
Percentage
Change |
|
$56,617
|
9.0%
|
$56,581
|
9.5%
|
$36
|
0.1%
|
Research and development expenses were relatively unchanged for the year ended January 2, 2016 as compared to the year ended January 3, 2015. Included in research and development expenses was approximately $2.3 million and $1.8 million of share-based compensation expense for the years ended January 2, 2016 and January 3, 2015, respectively. Total direct research and development expenses incurred by Cercacor for the years ended January 2, 2016 and January 3, 2015 were $6.3 million and $3.1 million, respectively.
Litigation Settlement, Award and/or Defense Costs
. Litigation settlement, award and/or defense costs for fiscal years
2015
and
2014
were as follows (dollars in thousands):
|
Litigation Settlement, Award and/or Defense Costs
|
|||||
|
Year ended
January 2, 2016 |
Percentage of
Net Revenues |
Year ended
January 3, 2015 |
Percentage of
Net Revenues |
Increase/
(Decrease) |
Percentage
Change |
|
$(19,609)
|
(3.1)%
|
$(10,331)
|
(1.8)%
|
$(9,278)
|
89.8%
|
66
On November 16, 2015, we entered into the Mindray Settlement Agreement with Mindray. The Mindray Settlement Agreement settled each of the claims and legal proceedings between us and Mindray. Pursuant to the Mindray Settlement Agreement, Mindray paid us an aggregate of $25.0 million.
Two of our former physician office sales representatives filed employment-related claims against us in 2011 regarding our noninvasive hemoglobin monitoring products. In January 2014, an arbitrator awarded the former sales representatives the Arbitration Award. As a result, we recorded a charge of $8.0 million in the fiscal quarter ended December 28, 2013, which included the Arbitration Award and approximately $2.6 million in defense-related costs that had previously been reimbursed by insurance. We challenged the Arbitration Award in the U.S. District Court for the Central District of California, and in April 2014, the District Court vacated the Arbitration Award. Accordingly, we reversed the previous $8.0 million charge in the fiscal quarter ended March 29, 2014. The former sales representatives appealed the U.S. District Court’s ruling, and the appeal argument was held in the Ninth Circuit Court of Appeals on February 1, 2016. On February 19, 2016, the Ninth Circuit Court of Appeals reversed the decision of the District Court vacating the award, and remanded the case to the District Court with instructions to confirm the Arbitration Award. As a result, we reinstated the $5.4 million charge for the Arbitration Award that was previously reversed, plus approximately $0.7 million of estimated non-operating interest expense, as of January 2, 2016. However, we did not reinstate the $2.6 million charge for defense-related costs previously reimbursed by the insurance company based upon our assessment of this matter.
In July 2014, an arbitration panel issued a final award of $4.0 million to Cercacor, our VIE, in connection with the breach by a third party of a supply agreement, payment for which was received by Cercacor in August 2014. Cercacor recorded this award in the quarter ended September 27, 2014 as a reduction to operating expenses, net of approximately $1.6 million in related legal costs. The net recovery of $2.4 million was entirely attributable to noncontrolling interests and, therefore, was not included in “net income attributable to Masimo Corporation stockholders” within our results of operations for the year ended January 3, 2015.
Non-operating Expense
. Non-operating expense consists primarily of interest income, interest expense and foreign exchange losses. Non-operating expense for fiscal years
2015
and
2014
was as follows (dollars in thousands):
|
Non-operating expense
|
|||||
|
Year ended
January 2, 2016 |
Percentage of
Net Revenues |
Year ended
January 3, 2015 |
Percentage of
Net Revenues |
Increase/
(Decrease) |
Percentage
Change |
|
$3,905
|
0.6%
|
$1,472
|
0.3%
|
$2,433
|
165.3%
|
Non-operating expense was $3.9 million for the year ended January 2, 2016, as compared to $1.5 million for the year ended January 3, 2015. This net change of $2.4 million was primarily due to higher interest expense of approximately $1.8 million during the year ended January 2, 2016, related to increased borrowings under our revolving credit agreement as compared to the year ended January 3, 2015, as well as the accrual of approximately $0.7 million of estimated interest related to the Arbitration Award. In addition, we recognized approximately $0.5 million of net realized and unrealized losses on foreign currency denominated transactions during the year ended January 2, 2016, as compared to $1.0 million of net realized and unrealized losses on foreign currency denominated transaction during the year ended January 3, 2015. The net realized and unrealized losses recognized during the year ended January 2, 2016 resulted primarily from the strengthening of the U.S. Dollar against the Euro, British Pound, Canadian Dollar and Australian Dollar partially offset by the strengthening of the U.S. Dollar against the Swedish Krona. The net realized and unrealized losses recognized during the year ended January 3, 2015 resulted primarily from the strengthening of the U.S. Dollar against the Japanese Yen and the Euro, partially offset by the strengthening of the U.S. Dollar against the Swedish Krona.
Provision for Income Taxes
. Our provision for income taxes for fiscal years
2015
and
2014
were as follows (dollars in thousands):
|
Provision for Income Taxes
|
|||||
|
Year ended
January 2, 2016 |
Percentage of
Net Revenues |
Year ended
January 3, 2015 |
Percentage of
Net Revenues |
Increase/
(Decrease) |
Percentage
Change |
|
$34,845
|
5.5%
|
$27,678
|
4.7%
|
$7,167
|
25.9%
|
Our provision for income taxes was $34.8 million for the year ended January 2, 2016 compared to $27.7 million for the year ended January 3, 2015. Our effective tax rate was 30.0% for the year ended January 2, 2016 compared to 27.1% for the year ended January 3, 2015. This increase in our effective tax rate during the year ended January 2, 2016 was primarily due to an unfavorable shift in the geographic composition of our pre-tax earnings between higher tax and lower tax jurisdictions during the year ended January 2, 2016.
67
Liquidity
Our principal sources of liquidity consist of our existing cash and cash equivalent balances, funds expected to be generated from operations, and funds available under our revolving credit agreement. As of
December 31, 2016
, we had approximately
$286.9 million
in working capital, including approximately
$306.0 million
in cash and cash equivalents, which consisted of approximately $173.5 million in checking accounts, $77.5 million of bank time deposits and $55.0 million in a bank certificate of deposit. This compares to approximately
$166.5 million
in working capital as of
January 2, 2016
, including approximately
$132.3 million
in cash and cash equivalents, which consisted of approximately $55.0 million of bank time deposits, $20.1 million of money market accounts with major financial institutions and $57.2 million in checking accounts. We carry cash equivalents at cost that approximates fair value. We currently do not maintain an investment portfolio but have the ability to invest in various security holdings, types and maturities that meet credit quality standards in accordance with our investment guidelines.
As of
December 31, 2016
, we had cash totaling
$93.0 million
held outside of the U.S., of which approximately
$6.0 million
was accessible without additional tax cost and approximately
$87.0 million
was accessible at an incremental estimated tax cost of approximately
$26.3 million
. In managing our day-to-day liquidity and capital structure, we do not rely on foreign earnings as a source of funds. We currently have sufficient funds on-hand and available under our line of credit to fund our domestic operations and do not anticipate the need to repatriate funds associated with our permanently reinvested foreign earnings. In the event funds that are treated as permanently reinvested are repatriated, we may be required to accrue and pay additional U.S. taxes to repatriate these funds.
During fiscal years
2016
,
2015
and
2014
, we received
$30.5 million
,
$30.8 million
, and
$30.0 million
, respectively, in cash from Medtronic for royalties related to their U.S. sales pursuant to the terms of our amended settlement agreement. Pursuant to the terms of the Third Amendment to Settlement Agreement and Release of Claims effective September 2016, Medtronic agreed to continue paying royalties to us through October 6, 2018, after which no more royalties will be due.
Cash
Flows
|
The following table summarizes our cash flows (in thousands):
|
||||||||
|
Year Ended
|
||||||||
|
December 31,
2016 |
January 2,
2016 |
|||||||
|
Net cash provided by (used in):
|
||||||||
|
Operating activities
|
$
|
416,842
|
|
$
|
117,212
|
|
||
|
Investing activities
|
(25,114
|
)
|
(54,594
|
)
|
||||
|
Financing activities
|
(216,624
|
)
|
(62,073
|
)
|
||||
|
Effect of foreign currency exchange rates on cash
|
(1,451
|
)
|
(2,681
|
)
|
||||
|
(Decrease) increase in cash and cash equivalents
|
$
|
173,653
|
|
$
|
(2,136
|
)
|
||
Operating Activities
. Cash provided by operating activities for the year ended
December 31, 2016
was
$416.8 million
and was driven primarily by net income of
$300.7 million
and non-cash adjustments for depreciation and amortization, share-based compensation and deferred income taxes of
$16.8 million
,
$12.5 million
and
$5.4 million
, respectively. In addition, during the year ended
December 31, 2016
, income taxes payable and deferred revenue increased by
$73.8 million
and
$41.9 million
, respectively, primarily related to the impact of the Philips Settlement Agreement, and accounts payable, other liabilities and accrued compensation increased by
$7.8 million
,
$6.6 million
and
$5.7 million
, respectively, due to the timing of cash payments. These sources of cash were partially offset by other changes in operating assets and liabilities related to an increase in accounts receivable of
$21.2 million
due to the timing of collections; an increase in inventories and deferred cost of goods sold of
$10.8 million
and
$8.3 million
, respectively, primarily due to the growth in our business; a decrease in accrued liabilities of
$7.6 million
due to the timing of payments and an increase in other assets of
$7.3 million
, primarily related to the prepayment of certain expenses.
Cash provided by operating activities for the year ended
January 2, 2016
was
$117.2 million
and was driven primarily by net income, including noncontrolling interests of
$81.5 million
and non-cash adjustments for depreciation and amortization and share-based compensation of
$15.7 million
and
$10.8 million
, respectively. In addition, during the year ended
January 2, 2016
, accrued liabilities increased by
$19.9 million
due to the timing of payments and the accrual of the Arbitration Award, inventories decreased by
$7.5 million
and accrued compensation increased by
$5.3 million
. These sources of cash were partially offset by other changes in operating assets and liabilities related to an increase in accounts receivable of
$9.9 million
due to the timing of collections, a decrease in other liabilities of
$4.6 million
, a decrease in accounts payable of
$4.3 million
due to the timing of payments and an increase in other assets of
$3.0 million
.
68
Investing Activities
. Cash used in investing activities for the fiscal year ended
December 31, 2016
was
$25.1 million
, consisting primarily of
$19.7 million
for purchases of property and equipment,
$4.6 million
for intangible assets related to capitalized patent and trademark costs and
$0.8 million
related to the deconsolidation of Cercacor. See Note 3 to our accompanying consolidated financial statements included in Part IV, Item 15(a) of this Annual Report on Form 10-K for additional information related to the deconsolidation of Cercacor.
Cash used in investing activities for the fiscal year ended
January 2, 2016
was
$54.6 million
, consisting primarily of
$50.4 million
for purchases of property and equipment, including $33.3 million related to the purchase of and improvements to our new corporate headquarters and $6.5 million related to the purchase of our manufacturing, office and warehouse facility located in New Hampshire, as well as $4.2 million for intangible assets related to capitalized patent and trademark costs.
Financing Activities
. Cash used in financing activities for the fiscal year ended
December 31, 2016
was
$216.6 million
, resulting primarily from net repayments under our amended and restated credit agreement dated January 8, 2016 of
$185.0 million
and common stock repurchase transactions that settled during the year totaling
$68.2 million
, which were offset by proceeds from the issuance of common stock (upon exercise of options) totaling
$37.3 million
.
Cash provided by financing activities for the fiscal year ended
January 2, 2016
was
$62.1 million
, resulting primarily from net borrowings under our credit agreement dated April 23, 2014 (as amended) of
$60.0 million
which were offset by common stock repurchase transactions totaling
$150.2 million
.
Capital Resources and Prospective Capital Requirements
As of
December 31, 2016
, we had outstanding loan draws of
$0.0 million
and outstanding letters of credit of
$0.3 million
under our Restated Credit Facility (as described below), leaving available borrowing capacity of
$249.7 million
. We also had outstanding capital leases related to office equipment of less than
$0.1 million
. We had no other debt obligations and were in compliance with all bank covenants as of
December 31, 2016
.
In January 2016, we entered into an Amended and Restated Credit Agreement (Restated Credit Facility) with JPMorgan Chase Bank, N.A., as Administrative Agent and a Lender, Bank of America, N.A., as Syndication Agent and a Lender, Citibank, N.A., as Documentation Agent and a Lender, and various other Lenders (collectively, the Lenders). The Restated Credit Facility amended and restated our prior credit agreement dated April 23, 2014, as amended, and initially provided for up to $450.0 million in borrowings in multiple currencies, with an option, subject to certain conditions, for us to increase the aggregate borrowing capacity to up to $550.0 million in the future. In December 2016, subsequent to our receipt of the payment pursuant to the Philips Settlement Agreement, we re-evaluated our expected credit requirements and reduced our aggregate borrowing capacity under the Restated Credit Facility to
$250.0 million
, with the option, subject to certain conditions, for us to increase the aggregate borrowing capacity to up to $350.0 million in the future. The Restated Credit Facility provides for a sublimit of up to $50.0 million for the issuance of letters of credit and a sublimit of $125.0 million in specified foreign currencies. All unpaid principal under the Restated Credit Facility will become due and payable on January 8, 2021. See Note 11 in our accompanying consolidated financial statements included in Part IV, Item 15(a) of this Annual Report on Form 10-K for additional information.
In September 2015, our Board authorized a new stock repurchase program, whereby we may purchase up to
5.0 million
shares of our common stock over a period of up to three years. The stock repurchase program may be carried out at the discretion of a committee comprised of our Chief Executive Officer and Chief Financial Officer through open market purchases, one or more Rule 10b5-1 trading plans, block trades and in privately negotiated transactions. The total remaining shares authorized for repurchase under this stock repurchase program approximated
2.9 million
shares as of
December 31, 2016
.
We expect to fund our future operating, investing and financing activities through our available cash, future cash from operations, funds available under our Restated Credit Facility and other potential sources of capital. In addition to funding our working capital requirements, we anticipate our primary use of cash to be the equipment that we provide to hospitals under our long-term sensor purchase agreements. In addition, we anticipate additional capital expenditures during fiscal
2017
of approximately $17.0 million, primarily related to investments in infrastructure growth. Possible additional uses of cash may include the repurchase of stock under our authorized stock repurchase program, as well as the acquisition of technologies or technology companies. However, any repurchases of stock will be subject to numerous factors, including the availability of our stock, general market conditions, the trading price of our stock, available capital, alternative uses for capital and our financial performance. In addition, the amount and timing of our actual investing activities will vary significantly depending on numerous factors, including the timing and amount of capital expenditures, costs of product development efforts, our timetable for international sales operations and manufacturing expansion, stock repurchase activity and costs related to our domestic and international regulatory requirements. Despite these investment requirements, we anticipate that our existing cash and cash equivalents and amounts available under our Restated Credit Facility will be sufficient to meet our working capital requirements, capital expenditures and other operational funding needs for at least the next 12 months.
69
Off-Balance Sheet Arrangements
We do not currently have, nor have we ever had, any relationships with unconsolidated entities or financial partnerships, such as entities referred to as structured finance or special purpose entities, which would have been established for the purpose of facilitating off-balance sheet arrangements or for other contractually narrow or limited purposes. In addition, we do not engage in trading activities involving non-exchange traded contracts. As a result, we are not materially exposed to any financing, liquidity, market or credit risk that could arise if we had engaged in these relationships.
Contractual Obligations and Commercial Commitments
The following table summarizes our outstanding contractual obligations and commercial commitments as of
December 31, 2016
and the effect those obligations are expected to have on our cash liquidity and cash flow in future periods (in thousands). The estimated payments reflected in this table are based on management’s estimates and assumptions about these obligations. As a result, the actual cash outflows in future periods will vary, possibly materially, from those reflected in this table.
|
Payments Due By Period
|
|||||||||||||||||||
|
Less than
1 year
|
Between
1-3 years
|
Between
3-5 years
|
More than
5 years
|
Total
|
|||||||||||||||
|
Operating leases
(1)
|
$
|
5,829
|
|
$
|
10,129
|
|
$
|
3,989
|
|
$
|
7,630
|
|
$
|
27,577
|
|
||||
|
Capital leases (including interest)
(2)
|
75
|
|
—
|
|
—
|
|
—
|
|
75
|
|
|||||||||
|
Line of credit
|
—
|
|
—
|
|
—
|
|
—
|
|
—
|
|
|||||||||
|
Purchase commitments
(3)
|
76,800
|
|
—
|
|
—
|
|
—
|
|
76,800
|
|
|||||||||
|
Total contractual obligations
|
$
|
82,704
|
|
$
|
10,129
|
|
$
|
3,989
|
|
$
|
7,630
|
|
$
|
104,452
|
|
||||
_______________
|
(1)
|
Facility, equipment and automobile leases.
|
|
(2)
|
Leased office equipment.
|
|
(3)
|
Certain inventory items under non-cancellable purchase orders.
|
Other obligations: As of
December 31, 2016
, our estimated liabilities related to uncertain tax positions, including interest, were $13.4 million. Due to the high degree of uncertainty regarding the timing of potential cash flows associated with these liabilities, we are unable to make a reasonably reliable estimate of the amounts and periods in which these liabilities might be made.
In addition to these contractual obligations, we had the following annual minimum royalty commitments to Cercacor, as of
December 31, 2016
(in thousands):
|
Payments Due By Period
|
|||||||||||||
|
Less than
1 year
|
Between
1-3 years
|
Between
3-5 years
|
More than
5 years
|
||||||||||
|
Minimum royalty commitment to Cercacor
(1)
|
$
|
5,000
|
|
$
|
10,000
|
|
$
|
10,000
|
|
(1)
|
|||
______________
|
(1)
|
Subsequent to 2019, the royalty arrangement requires a $5.0 million minimum annual royalty payment unless the agreement is amended, restated or terminated.
|
See Notes 3 and 4 to our accompanying consolidated financial statements included in Part IV, Item 15(a) of this Annual Report on Form 10-K for additional information related to Cercacor.
Critical Accounting Estimates
Our financial statements have been prepared in accordance with accounting principles generally accepted in the United States of America. The preparation of these financial statements requires management to make estimates and assumptions that affect the reported amount of assets and liabilities and disclosure of contingent assets and liabilities at the date of the financial statements and the reported amount of revenue and expenses for each reporting period. These estimates and assumptions are based on historical experience and on various other factors that are believed to be reasonable under the circumstances, and form the basis for making management’s most difficult, subjective or complex judgments, often as a result of the need to make estimates about the effects of matters that are inherently uncertain. Although we regularly evaluate these estimates and assumptions, changes in judgments and uncertainties relating to these estimates could potentially result in materially different results under different assumptions and conditions. If these estimates differ significantly from actual results, the impact to the consolidated financial statements may be material.
70
We believe that the critical accounting policies that are the most significant for purposes of fully understanding and evaluating our reported financial results include the following:
Revenue Recognition and Deferred Revenue
We follow the current authoritative guidance for revenue recognition. Based on these requirements, we generally recognize revenue from the sale of products or services when: (i) persuasive evidence of an arrangement exists, (ii) delivery has occurred or services have been rendered, (iii) the price is fixed or determinable, and (iv) collectability is reasonably assured. In the case of the license or sale of software that does not function together with hardware components to provide the essential functionality of the hardware, revenue is recognized pursuant to the software revenue recognition guidance.
We enter into agreements to sell our noninvasive monitoring solutions and services, sometimes as part of multiple deliverable arrangements that include various combinations of products, software and services. While the majority of our sales transactions contain standard business terms and conditions, there are some transactions that contain non-standard business terms and conditions. As a result, contract interpretation and analysis may be required to determine the appropriate accounting, including: (i) how the arrangement consideration should be allocated among the deliverables when multiple deliverables exist, (ii) when to recognize revenue on the deliverables, and (iii) whether undelivered elements are essential to the functionality of the delivered elements. Changes in judgments on these assumptions and estimates could materially impact the timing of revenue recognition.
In the case of multiple deliverable arrangements, the authoritative guidance provides a hierarchy to determine the selling price to be used for allocating revenue to each deliverable as follows: (i) vendor-specific objective evidence (VSOE) of fair value, (ii) third-party evidence of selling price (TPE), and (iii) best estimate of the selling price (ESP). VSOE of fair value is defined as the price charged when the same element is sold separately. VSOE generally exists only when the deliverable is sold separately and is the price actually charged for that deliverable. TPE generally does not exist for the majority of our products. The objective of ESP is to determine the price at which we would transact a sale if the product was sold on a stand-alone basis. In the absence of VSOE and TPE, we determine ESP for our products by considering multiple factors including, but not limited to, features and functionality of the product, geographies, type of customer, contractual prices pursuant to GPO contracts, our pricing and discount practices and market conditions.
A deliverable in an arrangement qualifies as a separate unit of accounting if the delivered item has value to the customer on a stand-alone basis. Most of our products in a multiple deliverable arrangement qualify as separate units of accounting. In the case of our monitoring equipment containing embedded Masimo SET
®
or rainbow SET
™
software and our Patient SafetyNet remote monitoring and clinician notification solution, we determined that the hardware and software components function together to deliver the equipment’s essential functionality and, therefore, represent a single deliverable. However, software deliverables, such as rainbow
®
parameter software, which do not function together with hardware components to provide the equipment’s essential functionality, are accounted for under software revenue recognition guidance. The revenue for these multiple-element arrangements is allocated to the software deliverables and the non-software deliverables based on the relative selling prices of all of the deliverables in the arrangement using the hierarchy in the revenue recognition accounting guidance for arrangements with multiple deliverables.
Our sales under long-term sensor purchase contracts are generally structured such that we agree to provide at no up-front charge certain monitoring equipment, software, installation, training and/or warranty support in exchange for the hospital’s agreement to purchase sensors over the term of the agreement, which generally ranges from three to six years. These contracts generally do not provide for any payments that are not dependent upon our future delivery of sensors, which are essential to the functionality of the monitoring equipment and, therefore, represent a substantive performance obligation. As a result, we generally do not recognize any revenue when the monitoring and related equipment and software are delivered to the hospitals. We recognize revenue for these delivered elements, on a pro-rata basis when installation and training are complete, as the sensors are delivered under the long-term purchase commitment. The cost of the monitoring equipment initially placed at the hospitals is deferred and amortized to cost of goods sold over the life of the underlying long-term sensor purchase contract. In cases where such contracts do provide for guaranteed payments that are unrelated to the future delivery of sensors, we recognize the net present value of such payments as revenue from the monitoring and related equipment and expense such equipment to cost of goods sold as the equipment is delivered and when installation and training are complete. Some of our long-term sensor contracts also contain provisions for certain payments to be made directly to the end-user hospital customer at the inception of the arrangement. These payments are generally treated as prepaid discounts which are deferred and amortized on a straight-line basis as contra-revenue over the life of the underlying long-term sensor purchase contract.
Many of our distributors purchase sensor products that they then resell to hospitals that are typically fulfilling their purchase obligations to us under the end-user hospitals’ long-term sensor purchase commitments. Upon shipment to these distributors, revenue is deferred until the distributor ships the product to our end-user customers based on an estimate of the inventory held by these distributors at the end of the accounting period.
71
We also earn revenue from the sale of integrated circuit boards and other products, as well as from rainbow
®
parameter software licenses, to original equipment manufacturers (OEMs) under various agreements. Revenue from the sale of products to the OEMs is generally recognized at the time of shipment. Revenue related to software licenses to OEMs is generally recognized upon shipment of the OEM’s product to its customers.
We provide certain customers with the ability to purchase sensors under rebate programs. Under these programs, the customer may earn rebates based on their purchasing activity. We estimate and provide allowances for these programs at the time of sale as a reduction to revenue.
Inventory/Reserves for Excess or Obsolete Inventory
Inventories are stated at the lower of cost or net realizable value. Cost is determined using a standard cost method, which approximates FIFO (first-in, first-out). Inventory valuation reserves are recorded for materials that have become obsolete or are no longer used in current production and for inventory that has a net realizable value less than the carrying value in inventory. We generally purchase raw materials in quantities that we anticipate will be fully used within one year. However, changes in operating strategy and customer demand, and frequent unpredictable fluctuations in market values for such materials, can limit our ability to effectively utilize all of the raw materials purchased and sold through resulting finished goods to customers for a profit. We regularly monitor potential inventory excess, obsolescence and lower market values compared to standard costs and, when necessary, reduce the carrying amount of our inventory to its market value.
We develop our inventory reserve based on an evaluation of the expected future use of our inventory on an item by item basis. We apply historical obsolescence rates to estimate the loss on inventory expected to have a recovery value below cost. Our historical obsolescence rates are developed from our company specific experience for major categories of inventory, which are then applied to excess inventory on an item by item basis. We also develop other specific inventory reserves when we become aware of other unique events that result in a known recovery value below cost. For inventory items that have been written down, either due to the inventory reserve analysis or due to a specific event, the reduced value becomes the new cost basis. Our inventory reserve was
$9.4 million
and
$16.8 million
at
December 31, 2016
and
January 2, 2016
, respectively. The significant decrease in our inventory reserve during fiscal year 2016 resulted primarily from scrapping obsolete inventory that was previously reserved during the fourth quarter of fiscal year 2015. If our estimates for potential inventory losses prove to be too low, our future earnings will be affected when any related additional inventory losses are recorded.
Allowance for Doubtful Accounts
We maintain allowances for doubtful accounts for estimated losses resulting from the inability of our customers to make required payments. This allowance is used to state trade receivables at a net estimated realizable value. We rely on prior experience to estimate the amount that we expect to collect on the gross receivables outstanding, which cannot be known with exact certainty as of the time of issuance of this report. We maintain a specific allowance for customer accounts that we know may not be collectible due to customer liquidity issues. We also maintain a general allowance for future collection losses that arise from customer accounts that do not indicate an inability, but may be unable, to pay. Although such losses have historically been within our expectations and the allowances we have established, we cannot guarantee that we will continue to experience the same loss rates that we have in the past, especially given the recent deterioration of the credit markets of the worldwide economy. A significant change in the liquidity or financial condition of our customers could cause unfavorable trends in our receivable collections and additional allowances may be required. Our accounts receivable balance was
$101.7 million
and
$81.0 million
, net of allowances for doubtful accounts of
$1.7 million
and
$2.0 million
at
December 31, 2016
and
January 2, 2016
, respectively.
Share-Based Compensation
Our share-based awards are currently comprised of stock options and restricted stock units (RSUs), both of which are equity-classified awards. For equity-classified awards granted on or after January 1, 2006, we estimate the fair value of the award on the date of grant and expense share-based compensation over the requisite service period. The fair value of our share-based awards is based on the closing price of our common stock on the grant date. The fair value of RSU awards is the closing price of our common stock on the grant date. To calculate the fair value of stock option awards, we use the Black-Scholes option pricing model, which, in addition to the closing price of our stock on the grant date and the option strike price, requires the input of subjective assumptions. These assumptions include the estimated length of time employees will retain their stock options before exercising them (the expected term), the estimated volatility of our stock price over the expected term and the dividend yield on our common stock. We estimate expected term based on both our specific historical option exercise experience, as well as expected term information available from a peer group of companies with similar vesting schedules. The estimated volatility is based on both the historical and implied volatilities of our share price.
72
We are also required to develop an estimate of the number of share-based awards that will be forfeited due to employee turnover. Adjustments in the estimated forfeiture rates can have a significant effect on our reported share-based compensation, as we recognize the cumulative effect of the rate adjustments for all expense amortization in the period the estimated forfeiture rates were adjusted. We estimate and adjust forfeiture rates based on a periodic review of recent forfeiture activity and expected future employee turnover. Adjustments in the estimated forfeiture rates could also cause changes in the amount of expense that we recognize in future periods.
Share-based compensation expense was
$12.5 million
,
$10.8 million
and
$11.0 million
for the years ended
December 31, 2016
,
January 2, 2016
and
January 3, 2015
, respectively. The fair market value of our stock may also increase the cost of future stock option grants. In general, to the extent that the fair market value of our stock increases, the overall cost of granting these options will also increase. For further details regarding our share-based compensation see Note 14 to our accompanying consolidated financial statements included in Part IV, Item 15(a) of this Annual Report on Form 10-K.
Intangible and Other Long-Lived Assets
Intangible assets from acquisitions or licensing agreements, as well as intangible assets related to the costs of registering and maintaining our patents and trademarks, are carried at cost less accumulated amortization and impairment charges, if any. For assets with determinable useful lives, amortization is computed using the straight-line method over the estimated economic lives of the respective intangible assets, ranging from one to twelve years. Acquired in-process research and development (IPR&D) is recorded at fair value as an indefinite-lived intangible asset at the acquisition date until the completion or abandonment of the associated research and development efforts or impairment. IPR&D projects relate to in-process projects that have not reached technological feasibility as of the acquisition date and have no alternative future use. Upon completion of development, acquired in-process research and development assets are transferred to finite-lived intangible assets and amortized over their useful lives.
We assess whether our intangible assets and other long-lived assets should be tested for recoverability whenever events or circumstances indicate that their carrying value may not be recoverable. The amount of impairment, if any, is measured based on fair value, which is determined using projected discounted future operating cash flows. Assets to be disposed of are reported at the lower of the carrying amount or fair value less selling costs.
Goodwill
Goodwill is recorded as the difference, if any, between the aggregate consideration paid for an acquisition and the fair value of the acquired net tangible and intangible assets. Goodwill is not amortized but instead is tested at least annually for impairment, or more frequently when events or changes in circumstances indicate that goodwill might be impaired. Our annual impairment test is performed during the fourth fiscal quarter
.
In assessing goodwill impairment we have the option to first assess the qualitative factors to determine whether the existence of events or circumstances leads to a determination that the fair value of such reporting unit is less than its carrying amount. Our qualitative assessment of the recoverability of goodwill considers various macro-economic, industry-specific and company-specific factors. These factors include: (i) severe adverse industry or economic trends; (ii) significant company-specific actions, including exiting an activity in conjunction with restructuring of operations; (iii) current, historical or projected deterioration of our financial performance; or (iv) a sustained decrease in our market capitalization below its net book value. If, after assessing the totality of events or circumstances, we determine it is unlikely that the fair value of such reporting unit is less than its carrying amount, then performing the two-step impairment test is unnecessary. However, if we conclude otherwise, then we are required to perform the first step of the two-step impairment test by comparing the fair value of the reporting unit with its carrying amount, including goodwill. If the fair value of the reporting unit exceeds its carrying amount, goodwill is not considered impaired; otherwise, goodwill is considered impaired and the loss is measured by performing step two. Under step two, the impairment loss is measured by comparing the implied fair value of the reporting unit goodwill with the carrying amount of goodwill. We also have the option to bypass the qualitative assessment and proceed directly to performing the first step of the two-step goodwill impairment test. We may resume performing the qualitative assessment in any subsequent period.
Accounting for Income Taxes
We account for income taxes using the asset and liability method, under which we recognize deferred tax assets and liabilities for the future tax consequences attributable to temporary differences between the financial statement carrying amounts of existing assets and liabilities and their respective tax bases and for net operating loss and tax credit carryforwards. A tax position that meets a more-likely-than-not recognition threshold is recognized in the first reporting period that it becomes more-likely-than-not such tax position will be sustained upon examination. A tax position that meets this more-likely-than-not recognition threshold is recorded at the largest amount of tax benefit that has a greater than 50% likelihood of being realized upon ultimate settlement. Previously recognized income tax positions that fail to meet the recognition threshold in a subsequent period are derecognized in that period.
73
Differences between actual results and our assumptions, or changes in our assumptions in future periods, are recorded in the period they become known. We record potential accrued interest and penalties related to unrecognized tax benefits in income tax expense.
As a multinational corporation, we are subject to complex tax laws and regulations in various jurisdictions. The application of tax laws and regulations is subject to legal and factual interpretation, judgment and uncertainty. Tax laws themselves are subject to change as a result of changes in fiscal policy, changes in legislation, evolution of regulations and court rulings. Although we have concluded all U.S. federal income tax matters for years through 2011 and all material state, local and foreign income tax matters for years through 2009, our 2012 U.S. federal income tax return is currently under examination by the Internal Revenue Service. Given the foregoing, our actual liability for U.S. or foreign taxes may be materially different from our estimates, which could result in the need to record additional liabilities or potentially to reverse previously recorded tax liabilities.
Deferred tax assets and liabilities are measured using enacted tax rates expected to apply to taxable income in the years in which those temporary differences are expected to be recovered or settled. The effect on deferred tax assets and liabilities of a change in tax rates is recognized in the period that includes the enactment date. A valuation allowance is recorded against any deferred tax assets when, in the judgment of management, it is more likely than not that all or part of a deferred tax asset will not be realized. In assessing the need for a valuation allowance, we consider all positive and negative evidence, including recent financial performance, scheduled reversals of temporary differences, projected future taxable income, availability of taxable income in carryback periods and tax planning strategies.
Litigation Costs and Contingencies
We record a charge equal to at least the minimum estimated liability for a loss contingency or litigation settlement when both of the following conditions are met: (i) information available prior to issuance of the financial statements indicates that it is probable that a liability had been incurred at the date of the financial statements and (ii) the range of loss can be reasonably estimated. The determination of whether a loss contingency or litigation settlement is probable or reasonably possible involves a significant amount of management judgment, as does the estimation of the range of loss given the nature of contingencies. Liabilities related to litigation settlements with multiple elements are recorded based on the fair value of each element. Legal and other litigation related expenses are recognized as the services are provided. We record insurance and other indemnity recoveries for litigation expenses when both of the following conditions are met: (i) the recovery is probable and (ii) collectability is reasonably assured. The insurance recoveries recorded are only to the extent the litigation costs have been incurred and recognized in the financial statements; however, it is reasonably possible that the actual recovery may be significantly different from our estimates. There are many uncertainties associated with any litigation, and we cannot provide assurance that any actions or other third party claims against us will be resolved without costly litigation or substantial settlement charges. If any of those events were to occur, our business, financial condition and results of operations could be materially and adversely affected.
Recent Accounting Pronouncements
For details regarding any recently adopted and recently issued accounting standards, see Note 2 to our accompanying consolidated financial statements included in Part IV, Item 15(a) of this Annual Report on Form 10-K.
|
ITEM 7A.
|
QUANTITATIVE AND QUALITATIVE DISCLOSURES ABOUT MARKET RISK
|
We are exposed to various market risks that may arise from adverse changes in market rates and prices, such as interest rates, foreign exchange fluctuations and inflation. We do not enter into derivatives or other financial instruments for trading or speculative purposes.
Interest Rate Risk
Our exposure to market risk for changes in interest rates relates to the increase or decrease in the amount of interest income we can earn on our cash and cash equivalents and on the increase or decrease in the amount of interest expense we must pay with respect to our various outstanding debt instruments. We do not believe our cash equivalents are subject to significant interest rate risk due to their short terms to maturity. As of
December 31, 2016
, the carrying value of our cash equivalents approximated fair value. Our risk associated with fluctuation in interest expense is limited to our outstanding capital lease arrangements, which have fixed interest rates, and borrowings under our Restated Credit Facility, which have variable interest rates. Under our current policies, we do not use interest rate derivative instruments to manage exposure to interest rate changes. Therefore, declines in interest rates over time will reduce our interest income and expense while increases in interest rates will increase our interest income and expense. A hypothetical 100 basis point change in interest rates along the entire interest rate yield curve would increase our annual borrowing cost and interest expense approximately $0.1 million for each $1.0 million in outstanding borrowings. At
December 31, 2016
, we had no outstanding borrowings under our Restated Credit Facility.
74
Foreign Currency Exchange Rate Risk
A majority of our assets and liabilities are maintained in the United States in U.S. Dollars and a majority of our sales and expenditures are transacted in U.S. Dollars. However, we transact with foreign customers in currencies other than the U.S. Dollar. These foreign currency revenues, when converted into U.S. Dollars, can vary depending on average exchange rates during a respective period. In addition, certain of our foreign sales support subsidiaries transact in their respective country’s local currency, which is also their functional currency. As a result, expenses of these foreign subsidiaries when converted into U.S. Dollars can also vary depending on average monthly exchange rates during a respective period.
We are exposed to foreign currency gains or losses on outstanding foreign currency denominated receivables and payables, as well as certain intercompany transactions. Realized and unrealized foreign currency gains or losses on these transactions are included in our statements of operations as incurred. Furthermore, other transactions between us or our subsidiaries and a third-party, denominated in a currency different from the functional currency, are foreign currency transactions. Realized and unrealized foreign currency gains or losses on these transactions are also included in our statements of operations as incurred, and are converted to U.S. Dollars at average exchange rates for a respective period.
The balance sheets of our foreign subsidiaries whose functional currency is not the U.S. Dollar are translated into U.S. Dollars at the rate of exchange at the balance sheet date, and the statements of operations and cash flows are translated into U.S. Dollars using the average monthly exchange rate during the period. Any foreign exchange gain or loss as a result of translating the balance sheets of our foreign subsidiaries whose functional currency is not the U.S. Dollar is included in equity as a component of accumulated other comprehensive income (loss).
Our primary foreign currency exchange rate exposures are with the Euro, the Japanese Yen, the Swedish Krona, the Canadian Dollar, the British Pound, the Mexico Peso and the Australian Dollar against the U.S. Dollar. Foreign currency exchange rates have experienced significant movements recently, particularly over the last twenty-four months, and such volatility is expected to continue in the future. Specifically, during the fiscal years ended
December 31, 2016
and
January 2, 2016
, we estimate that fluctuations in the exchange rates between the U.S. Dollar and other foreign currencies, including the Euro, the Japanese Yen, the Swedish Krona, the Canadian Dollar, the British Pound and the Australian Dollar, favorably impacted our revenues by
$0.4 million
and negatively impacted our revenues by
$18.6 million
, respectively. We currently do not enter into forward exchange contracts to hedge exposures denominated in foreign currencies and do not use derivative financial instruments for trading or speculative purposes. Therefore, the effect of a 10% change in foreign currency exchange rates could have a material effect on our future operating results or cash flows, depending on which foreign currency exchange rates change and depending on the directional change (either a strengthening or weakening against the U.S. Dollar). As our foreign operations continue to grow, our exposure to foreign currency exchange rate risk may become even more significant.
Inflation Risk
We do not believe that inflation has had a material effect on our business, financial condition or results of operations during the periods presented. If our costs were to become subject to significant inflationary pressures, we may not be able to fully offset such higher costs through price increases. Our inability or failure to do so could have a material adverse effect on our business, financial condition and results of operations.
|
ITEM 8.
|
FINANCIAL STATEMENTS AND SUPPLEMENTARY DATA
|
Our consolidated financial statements and supplementary data required by this item are set forth at the pages indicated in Part IV, Item 15(a)(1) and 15(a)(2), respectively, of this Annual Report on Form 10-K.
|
ITEM 9.
|
CHANGES IN AND DISAGREEMENTS WITH ACCOUNTANTS ON ACCOUNTING AND FINANCIAL DISCLOSURE
|
None.
|
ITEM 9A.
|
CONTROLS AND PROCEDURES
|
Evaluation of Disclosure Controls and Procedures
Under the supervision and with the participation of our management, including our principal executive officer and principal financial officer, we conducted an evaluation of our disclosure controls and procedures, as such term is defined in Rule 13a-15(e) promulgated under the Exchange Act, as of the end of the period covered by this Annual Report on Form 10-K. We recognize that any controls and procedures, no matter how well designed and operated, can provide only reasonable assurance of achieving their objectives and management necessarily applies its judgment in evaluating the cost-benefit relationship of possible controls and procedures.
75
Based on this evaluation, our principal executive officer and principal financial officer concluded that our disclosure controls and procedures were effective as of the end of the period covered by this Annual Report on Form 10-K.
Management’s Report on Internal Control Over Financial Reporting
Our management is responsible for establishing and maintaining adequate internal control over financial reporting, as such term is defined in Rule 13a-15(f) promulgated by the SEC under the Exchange Act. All internal control systems, no matter how well designed, have inherent limitations and may not prevent or detect all misstatements. Therefore, even those systems determined to be effective can provide only reasonable assurance with respect to financial statement preparation and presentation. Also, projections of any evaluation of effectiveness to future periods are subject to the risk that controls may become inadequate because of changes in conditions, or that the degree of compliance with the policies or procedures may deteriorate. Under the supervision and with the participation of our management, including our principal executive officer and principal financial officer, we conducted an evaluation of the effectiveness of our internal control over financial reporting based on criteria established in the 2013
Internal Control-Integrated Framework
issued by the Committee of Sponsoring Organizations of the Treadway Commission. Based on this evaluation, our management concluded that our internal control over financial reporting was effective as of
December 31, 2016
.
Grant Thornton LLP, an independent registered public accounting firm, has audited the effectiveness of our internal control over financial reporting as of
December 31, 2016
. Their attestation report, which expresses an unqualified opinion on the effectiveness of our internal control over financial reporting as of
December 31, 2016
, is included in Part IV, Item 15(a)(1) of this Annual Report on Form 10-K.
Changes in Internal Control Over Financial Reporting
There has been no change in our internal control over financial reporting during the quarter ended
December 31, 2016
that has materially affected, or is reasonably likely to materially affect, our internal control over financial reporting.
|
ITEM 9B.
|
OTHER INFORMATION
|
On October 27, 2016, our Board determined that our 2017 Annual Meeting of Stockholders (2017 Annual Meeting) will be held on June 1, 2017. Because the 2017 Annual Meeting will be held more than 30 days after the anniversary of the date of our 2016 Annual Meeting of Stockholders, we are notifying stockholders when stockholder proposals are due for the 2017 Annual Meeting. If a stockholder wishes to submit a proposal that is not to be included in the proxy materials for the 2017 Annual Meeting, the proposal must be submitted in writing to our Corporate Secretary at 52 Discovery, Irvine, California 92618 no later than March 3, 2017. Please review our Bylaws, which contain additional requirements regarding advance notice of stockholder proposals. Stockholders may view our Bylaws by visiting the SEC’s internet website at www.sec.gov.
76
|
ITEM 10.
|
DIRECTORS, EXECUTIVE OFFICERS AND CORPORATE GOVERNANCE
|
The information required by this item is incorporated by reference from the information contained in our Definitive Proxy Statement to be filed with the SEC in connection with the Annual Meeting of Stockholders to be held in
2017
(
2017
Proxy Statement) under the headings “Executive Officers”, “Board of Directors”, “Corporate Governance and Board Matters” and “Section 16(a) Beneficial Ownership Reporting Compliance”.
|
ITEM 11.
|
EXECUTIVE COMPENSATION
|
The information required by this item is incorporated by reference from the information contained in the
2017
Proxy Statement under the heading “Executive Compensation”.
|
ITEM 12.
|
SECURITY OWNERSHIP OF CERTAIN BENEFICIAL OWNERS AND MANAGEMENT AND RELATED STOCKHOLDER MATTERS
|
The information required by this item is incorporated by reference from the information contained in the
2017
Proxy Statement under the heading “Security Ownership of Certain Beneficial Owners and Management”.
|
ITEM 13.
|
CERTAIN RELATIONSHIPS AND RELATED TRANSACTIONS AND DIRECTOR INDEPENDENCE
|
The information required by this item is incorporated by reference from the information contained in the
2017
Proxy Statement under the headings “Corporate Governance and Board Matters” and “Transactions with Related Persons, Promoters and Certain Control Persons”.
|
ITEM 14.
|
PRINCIPAL ACCOUNTING FEES AND SERVICES
|
The information required by this item is incorporated by reference from the information contained in the
2017
Proxy Statement under the heading “Audit Related Matters-Principal Accountant Fees and Services”.
77
|
ITEM 15.
|
EXHIBITS, FINANCIAL STATEMENT SCHEDULES
|
(a)(1) Financial Statements
The Consolidated Financial Statements of Masimo Corporation and Report of Grant Thornton LLP, Independent Registered Public Accounting Firm, are included in a separate section of this Annual Report on Form 10-K beginning on page F-1.
(a)(2) Financial Statement Schedules
The financial statement schedule is included in a separate section of this Annual Report on Form 10-K beginning on page F-1.
(a)(3) Exhibits
|
Exhibit
Number
|
Description of Document
|
|
|
3.1(1)
|
Amended and Restated Certificate of Incorporation (Exhibit 3.2)
|
|
|
3.2(2)
|
Amended and Restated Bylaws (Exhibit 3.2)
|
|
|
4.1(1)
|
Form of Common Stock Certificate (Exhibit 4.1)
|
|
|
4.2(1)
|
Fifth Amended and Restated Registration Rights Agreement made and entered into as of September 14, 1999 between the Registrant and certain of its stockholders (Exhibit 4.2)
|
|
|
4.3(4)#
|
Masimo Retirement Savings Plan (Exhibit 4.7)
|
|
|
10.1(1)#
|
Form of Indemnity Agreement between the Registrant and its officers and directors (Exhibit 10.1)
|
|
|
10.2(5)#
|
Amended and Restated Employment Agreement, dated November 4, 2015, between Joe Kiani and the Registrant (Exhibit 10.1)
|
|
|
10.3(1)#
|
Offer Letter, dated February 15, 1996, between Yongsam Lee and the Registrant (Exhibit 10.7)
|
|
|
10.4(6)#
|
Offer Letter, dated May 21, 2004, between Rick Fishel and the Registrant (Exhibit 10.13)
|
|
|
10.5(1)#
|
Offer Letter, dated June 9, 2006, between Mark P. de Raad and the Registrant (Exhibit 10.9)
|
|
|
10.6(1)#
|
Offer Letter, dated March 30, 2007, between Anand Sampath and the Registrant (Exhibit 10.8)
|
|
|
10.7(6)#
|
Offer Letter, dated July 23, 2008, between Jon Coleman and the Registrant (Exhibit 10.9)
|
|
|
10.8(12)#
|
Offer Letter, dated December 27, 2007 between Paul Jansen and the Registrant (Exhibit 10.8)
|
|
|
10.9(12)#
|
Offer Letter, dated March 31, 2011 between Tom McClenahan and the Registrant (Exhibit 10.8)
|
|
|
10.10(3)#
|
Executive Restated Annual Cash Bonus Award Plan, effective March 13, 2014 (Exhibit 10.11)
|
|
|
10.11(3)#
|
Executive Multi-Year Cash Bonus Award Plan, effective March 13, 2014 (Exhibit 10.12)
|
|
|
10.12(7)#
|
CEO and Executive Officer Equity Award Compensation Policy (Exhibit 10.1)
|
|
|
10.13(5)#
|
Restricted Share Unit Award Agreement, dated November 4, 2015, by and between Joe Kiani and the Registrant (Exhibit 10.2)
|
|
|
10.14(5)#
|
Equity-Holder Non-Competition and Confidentiality Agreement, dated November 4, 2015, by and between Joe Kiani and the Registrant (Exhibit 10.3)
|
|
|
10.15(8)#
|
Amended and Restated 2007 Severance Protection Plan and Summary Plan Description, effective December 31, 2008 (Exhibit 10.11)
|
|
|
10.16(14)#
|
2007 Severance Protection Plan Participation Agreement, dated January 11, 2008, by and between the Registrant and Mark P. de Raad (Exhibit 10.2)
|
|
|
10.17(14)#
|
2007 Severance Protection Plan Participation Agreement, dated January 11, 2008, by and between the Registrant and Yongsam Lee (Exhibit 10.3)
|
|
|
10.18(6)#
|
2007 Severance Protection Plan Participation Agreement, dated January 11, 2008, by and between the Registrant and Rick Fishel (Exhibit 10.57)
|
|
78
|
Exhibit
Number |
Description of Document
|
||
|
10.19(12)#
|
Amended and Restated 2007 Severance Protection Plan Agreement, dated November 12, 2013, by and between the Registrant and Jon Coleman (Exhibit 10.17)
|
||
|
10.20(12)#
|
Amended and Restated 2007 Severance Protection Plan Agreement, dated December 9, 2013, by and between the Registrant and Anand Sampath (Exhibit 10.18)
|
||
|
10.21(12)#
|
Amended and Restated 2007 Severance Protection Plan Agreement, dated November 12, 2013, by and between the Registrant and Paul Jansen (Exhibit 10.19)
|
||
|
10.22(3)#
|
Amended and Restated 2007 Severance Protection Plan Agreement, dated November 3, 2014, by and between the Registrant and Tom McClenahan (Exhibit 10.21)
|
||
|
10.23(1)#
|
2004 Incentive Stock Option, Nonqualified Stock Option and Restricted Stock Purchase Plan of the Registrant, as amended, and forms of agreements related thereto (Exhibit 10.32)
|
||
|
10.24(1)#
|
2007 Stock Incentive Plan of the Registrant, and forms of agreements related thereto (Exhibit 10.33)
|
||
|
10.25(6)+
|
Manufacturing and Purchase Agreement, dated October 2, 2008, by and between Analog Devices, Inc.
and the Registrant (Exhibit 10.21)
|
||
|
10.26(1)+
|
Purchase Agreement, dated July 26, 2001, between Jabil Circuit, Inc. and the Registrant (Exhibit 10.15)
|
||
|
10.27(1)+
|
Shelter Labor Services Agreement, dated December 27, 2000, between Industrial Vallera de Mexicali, S.A. de C.V. and the Registrant (Exhibit 10.11)
|
||
|
10.28(9)+
|
Lease Agreement effective as of September 1, 2007, by and among Industrias Asociadas Maquiladoras, S.A. de C.V., Industrial Vallera de Mexicali, S.A. de C.V. and the Registrant, as guarantor (Exhibit 10.1)
|
||
|
10.29(12)+
|
First Amendment, Lease Agreement effective as of December 17, 2013, by and among Industrias Asociadas Maquiladoras, S.A. de C.V., Industrial Vallera de Mexicali, S.A. de C.V. and the Registrant, as guarantor (Exhibit 10.26)
|
||
|
10.30(10)+
|
Lease Agreement, relating to the premises at 40 Parker, effective as of November 1, 2009, between the Registrant and Northwestern Mutual Life Insurance Company (Exhibit 10.1)
|
||
|
10.31(15)
|
Amendment No. 1
to the November 1, 2009
Lease Agreement, relating to the premises at 40 Parker, between the Registrant and Northwestern Mutual Life Insurance Company
|
||
|
10.32(15)
|
Amendment No. 2
to the November 1, 2009
Lease Agreement, relating to the premises at 40 Parker, between the Registrant and Northwestern Mutual Life Insurance Company
|
||
|
10.33(3)
|
Amendment No. 3
to the November 1, 2009
Lease Agreement, relating to the premises at 40 Parker, between the Registrant and Northwestern Mutual Life Insurance Company (Exhibit 10.30)
|
||
|
10.34(1)
|
Settlement Agreement and Release of Claims, dated January 17, 2006, between Cercacor Laboratories, Inc., Nellcor Puritan Bennett, Inc., Mallinckrodt, Inc., Tyco Healthcare Group LP, Tyco International Ltd., Tyco International (US) Inc. and the Registrant (Exhibit 10.30)
|
||
|
10.35(11)
|
Second Amendment to the January 17, 2006 Settlement Agreement and Release of Claims, as amended pursuant to the January 24, 2006 Amendment to Settlement Agreement and Release of Claims, dated January 28, 2011, by and among Masimo Corporation, Masimo Laboratories, Inc., Nellcor Puritan Bennett LLC, Mallinckrodt Inc., Tyco Healthcare Group LP and Covidien Inc. (Exhibit 10.1)
|
||
|
10.36(1)
|
Amended and Restated Cross-Licensing Agreement, effective January 1, 2007, between Cercacor Laboratories, Inc. and the Registrant (Exhibit 10.34)
|
||
|
10.37(1)
|
Services Agreement, effective January 1, 2007, between Cercacor Laboratories, Inc. and the Registrant (Exhibit 10.35)
|
||
|
10.38(13)
|
Agreement of Purchase and Sale and Escrow Instructions, dated as of November 1, 2013, by and between the Company and Nikken, Inc. (Exhibit 10.1)
|
||
|
10.39(13)
|
First Amendment to Purchase and Sale Agreement, made and entered into effective as of January 8, 2014, by and between the Company and Nikken, Inc. (Exhibit 10.2)
|
||
|
10.40(13)
|
Second Amendment to Purchase and Sale Agreement, made and entered into effective as of January 10, 2014, by and between the Company and Nikken, Inc. (Exhibit 10.3)
|
||
79
|
Exhibit
Number
|
Description of Document
|
|
|
10.41(13)
|
Third Amendment to Purchase and Sale Agreement, made and entered into effective as of March 10, 2014, by and between the Company and Nikken, Inc. (Exhibit 10.4)
|
|
|
10.42(13)
|
Fourth Amendment to Purchase and Sale Agreement, made and entered into effective as of March 12, 2014, by and between the Company and Nikken, Inc. (Exhibit 10.5)
|
|
|
10.43(15)
|
Amended and Restated Credit Agreement, dated as of January 8, 2016, among Masimo Corporation, and the Lenders Party hereto and JP Morgan Chase Bank, N.A., as Administrative Agent
|
|
|
10.44(15)+
|
Settlement and Covenant Not to Sue Agreement, entered into as of the Effective Date of November 16, 2015, between Masimo Corporation, Masimo Technologies SARL, and Masimo International SARL and Mindray Medical International, Limited, Shenzhen Mindray Biomedical Electronics Co., Ltd and Mindray DS USA, Inc.
|
|
|
10.45(15)
|
Lease Agreement, dated July 15, 2012, related to the premises at 9600 Jeronimo, between the Registrant and The Irvine Company, LLC
|
|
|
10.46(15)
|
First Amendment to June 22, 2012 Lease Agreement, relating to the premises at 9600 Jeronimo, between the Registrant and Irvine Company, LLC
|
|
|
10.47(3)
|
Second Amendment to June 22, 2012 Lease Agreement, relating to the premises at 9600 Jeronimo, between the Registrant and Irvine Company, LLC (Exhibit 10.34)
|
|
|
10.48(15)
|
Third Amendment to June 22, 2012 Lease Agreement, relating to the premises at 9600 Jeronimo, between the Registrant and Irvine Company, LLC
|
|
|
10.49(16)
|
Single-Tenant Lease, relating to the premises at 9600 Jeronimo, dated as of July 13, 2016, by and between Masimo Corporation and The Irvine Company LLC
|
|
|
10.50(17)†
|
Third Amendment to Settlement Agreement and Release of Claims, dated as of September 1, 2016, by and among Masimo Corporation and Cercacor Laboratories, Inc., and Medtronic Plc., Covidien LP, Nellcor Puritan Bennett LLC and Covidien Holdings Inc. (Exhibit 10.1)
|
|
|
10.51(18)†
|
Settlement Agreement, dated November 5, 2016, by and between Masimo Corporation, Masimo International Technologies SARL and Masimo International SARL and Koninklijke Philips N.V. (Exhibit 10.1)
|
|
|
12.1*
|
Statement Regarding the Computation of Ratio of Earnings to Fixed Charges
|
|
|
21.1*
|
List of Registrant’s Subsidiaries
|
|
|
23.1*
|
Consent of Independent Registered Public Accounting Firm
|
|
|
31.1*
|
Certification of Joe Kiani, Chief Executive Officer, pursuant to Section 302 of the Sarbanes-Oxley Act of 2002.
|
|
|
31.2*
|
Certification of Mark P. de Raad, Chief Financial Officer, pursuant to Section 302 of the Sarbanes-Oxley Act of 2002.
|
|
|
32.1*
|
Certification of Joe Kiani, Chief Executive Officer, and Mark P. de Raad, Chief Financial Officer, pursuant to Section 906 of the Sarbanes-Oxley Act of 2002.
|
|
|
101.INS*
|
XBRL Instance Document
|
|
|
101.SCH*
|
XBRL Taxonomy Extension Schema Document
|
|
|
101.CAL*
|
XBRL Taxonomy Extension Calculation Linkbase Document
|
|
|
101.DEF*
|
XBRL Taxonomy Extension Definition Linkbase Document
|
|
|
101.LAB*
|
XBRL Taxonomy Extension Label Linkbase Document
|
|
|
101.PRE*
|
XBRL Taxonomy Extension Presentation Linkbase Document
|
|
_____________
Attached as Exhibit 101 to this report are the following formatted in XBRL (Extensible Business Reporting Language): (i) Consolidated Balance Sheets as of
December 31, 2016
and
January 2, 2016
, (ii) Consolidated Statements of Operations for the years ended
December 31, 2016
,
January 2, 2016
and
January 3, 2015
, (iii) Consolidated Statements of
80
Comprehensive Income for the years ended
December 31, 2016
,
January 2, 2016
and
January 3, 2015
, (iv) Consolidated Statements of Equity for the years ended
December 31, 2016
,
January 2, 2016
and
January 3, 2015
, (v) Consolidated Statements of Cash Flows for the years ended
December 31, 2016
,
January 2, 2016
and
January 3, 2015
, and (vi) Notes to Consolidated Financial Statements.
_____________
|
(1)
|
Incorporated by reference to the exhibits to the Registrant’s Registration Statement on Form S-1 (No. 333-142171), originally filed on April 17, 2007. The number given in parentheses indicates the corresponding exhibit number in such Form S-1, as amended.
|
|
(2)
|
Incorporated by reference to the exhibit to the Registrant’s Current Report on Form 8-K, filed on October 26, 2011. The number given in parentheses indicates the corresponding exhibit number in such Form 8-K.
|
|
(3)
|
Incorporated by reference to the exhibit to the Registrant’s Annual Report on Form 10-K, filed on February 17, 2015. The number given in parentheses indicates the corresponding exhibit number in such Form 10-K.
|
|
(4)
|
Incorporated by reference to the exhibit to the Registrant’s Registration Statement on Form S-8, filed on February 11, 2008. The number given in parentheses indicates the corresponding exhibit number in such Form S-8.
|
|
(5)
|
Incorporated by reference to the exhibit to the Registrant’s Current Report on Form 8-K, filed on November 5, 2015 at 4:45 p.m. Eastern Time. The number given in parentheses indicates the corresponding exhibit number in such Form 8-K.
|
|
(6)
|
Incorporated by reference to the exhibit to the Registrant’s Annual Report on Form 10-K, filed on March 4, 2009. The number given in parentheses indicates the corresponding exhibit number in such Form 10-K.
|
|
(7)
|
Incorporated by reference to the exhibit to the Registrant’s Quarterly Report on Form 10-Q, filed on August 1, 2013. The number given in parentheses indicates the corresponding exhibit number in such Form 10-Q.
|
|
(8)
|
Incorporated by reference to the exhibit to the Registrant’s Annual Report on Form 10-K, filed on February 15, 2013. The number given in parentheses indicates the corresponding exhibit number in such Form 10-K.
|
|
(9)
|
Incorporated by reference to the exhibit to the Registrant’s Current Report on Form 8-K, filed on June 5, 2008. The number given in parentheses indicates the corresponding exhibit number in such Form 8-K.
|
|
(10)
|
Incorporated by reference to the exhibit to the Registrant’s Quarterly Report on Form 10-Q, filed on November 4, 2009. The number given in parentheses indicates the corresponding exhibit number in such Form 10-Q.
|
|
(11)
|
Incorporated by reference to the exhibit to the Registrant’s Current Report on Form 8-K, filed on January 31, 2011. The number given in parentheses indicates the corresponding exhibit number in such Form 8-K.
|
|
(12)
|
Incorporated by reference to the exhibit to the Registrant’s Annual Report on Form 10-K filed February 14, 2014. The number given in parentheses indicates the corresponding exhibit number in such Form 10-K.
|
|
(13)
|
Incorporated by reference to the exhibit to the Registrant’s Quarterly Report on Form 10-Q, filed on May 1, 2014. The number given in parentheses indicates the corresponding exhibit number in such Form 10-Q.
|
|
(14)
|
Incorporated by reference to the exhibit to the Registrant’s Current Report on Form 8-K, filed on January 17, 2008. The number given in parentheses indicates the corresponding exhibit number in such Form 8-K.
|
|
(15)
|
Incorporated by reference to the exhibit to the Registrant’s Annual Report on Form 10-K, filed on February 24, 2016. The number given in parentheses indicates the corresponding exhibit number in such Form 8-K.
|
|
(16)
|
Incorporated by reference to the exhibit to the Registrant’s Quarterly Report on Form 10-Q, filed on August 3, 2016. The number given in parentheses indicates the corresponding exhibit number in such Form 8-K.
|
|
(17)
|
Incorporated by reference to the exhibit to the Registrant’s Quarterly Report on Form 10-Q, filed on September 2, 2016. The number given in parentheses indicates the corresponding exhibit number in such Form 8-K.
|
|
(18)
|
Incorporated by reference to the exhibit to the Registrant’s Current Report on Form 8-K, filed on November 7, 2016. The number given in parentheses indicates the corresponding exhibit number in such Form 8-K.
|
|
*
|
Filed herewith.
|
|
#
|
Indicates management contract or compensatory plan.
|
|
+
|
The SEC has granted confidential treatment with respect to certain portions of this exhibit. Omitted portions have been filed separately with the SEC.
|
|
†
|
Confidential treatment has been requested with respect to certain portions of this exhibit. Omitted portions have been filed separately with the SEC.
|
(b) Exhibits
See Item 15(a)(3) above.
(c) Financial Statement Schedules
See Item 15(a)(2) above.
81
|
ITEM 16.
|
FORM 10-K SUMMARY
|
None.
82
SIGNATURES
Pursuant to the requirements of Section 13 or 15(d) of the Securities Exchange Act of 1934, the registrant has duly caused this report to be signed on its behalf by the undersigned, thereunto duly authorized.
|
Date:
|
February 15, 2017
|
By:
|
/s/ J
OE
K
IANI
|
|
|
Joe Kiani
Chairman of the Board & Chief Executive Officer
|
||||
Pursuant to the requirements of the Securities Exchange Act of 1934, this report has been signed below by the following persons on behalf of the registrant and in the capacities and on the dates indicated.
|
SIGNATURE
|
TITLE(S)
|
DATE
|
||
|
/s/ J
OE
K
IANI
|
Chairman of the Board & Chief Executive Officer (
Principal Executive Officer
)
|
February 15, 2017
|
||
|
Joe Kiani
|
||||
|
/s/ M
ARK
P.
DE
R
AAD
|
Executive Vice President & Chief Financial Officer (
Principal Financial Officer
)
|
February 15, 2017
|
||
|
Mark P. de Raad
|
||||
|
/s/ D
AVID
J. V
AN
R
AMSHORST
|
Senior Vice President, Chief Accounting Officer
(
Principal Accounting Officer
)
|
February 15, 2017
|
||
|
David J. Van Ramshorst
|
||||
|
/s/ S
TEVEN
J. B
ARKER
, M.D. P
H
.D.
|
Director
|
February 15, 2017
|
||
|
Steven J. Barker, M.D., Ph.D.
|
||||
|
/s/ S
ANFORD
F
ITCH
|
Director
|
February 15, 2017
|
||
|
Sanford Fitch
|
||||
|
/s/ T
HOMAS
H
ARKIN
|
Director
|
February 15, 2017
|
||
|
Thomas Harkin
|
||||
|
/s/ A
DAM
M
IKKELSON
|
Director
|
February 15, 2017
|
||
|
Adam Mikkelson
|
||||
|
/s/ C
RAIG
R
EYNOLDS
|
Director
|
February 15, 2017
|
||
|
Craig Reynolds
|
||||
83
INDEX TO CONSOLIDATED FINANCIAL STATEMENTS AND SCHEDULE
MASIMO CORPORATION
|
|
|
|
Consolidated Financial Statements
|
|
|
Schedule
|
|
F-
1
REPORT OF INDEPENDENT REGISTERED PUBLIC ACCOUNTING FIRM
Board of Directors and Stockholders
Masimo Corporation
We have audited the accompanying consolidated balance sheets of Masimo Corporation (a Delaware corporation) and subsidiaries (the “Company”) as of
December 31, 2016
and
January 2, 2016
, and the related consolidated statements of operations, comprehensive income, equity, and cash flows for each of the three years in the period ended
December 31, 2016
. Our audits of the basic consolidated financial statements included the financial statement schedule listed in the index appearing under Item 15(a)(2). These financial statements and financial statement schedule are the responsibility of the Company’s management. Our responsibility is to express an opinion on these financial statements and financial statement schedule based on our audits.
We conducted our audits in accordance with the standards of the Public Company Accounting Oversight Board (United States). Those standards require that we plan and perform the audit to obtain reasonable assurance about whether the financial statements are free of material misstatement. An audit includes examining, on a test basis, evidence supporting the amounts and disclosures in the financial statements. An audit also includes assessing the accounting principles used and significant estimates made by management, as well as evaluating the overall financial statement presentation. We believe that our audits provide a reasonable basis for our opinion.
In our opinion, the consolidated financial statements referred to above present fairly, in all material respects, the financial position of Masimo Corporation and subsidiaries as of
December 31, 2016
and
January 2, 2016
, and the results of their operations and their cash flows for each of the three years in the period ended
December 31, 2016
in conformity with accounting principles generally accepted in the United States of America. Also in our opinion, the related financial statement schedule, when considered in relation to the basic consolidated financial statements taken as a whole, presents fairly, in all material respects, the information set forth therein.
As discussed in Note 2 to the consolidated financial statements under “
Recently Adopted Accounting Pronouncements”
, effective January 3, 2016, the Company adopted the provisions of Accounting Standards Update (ASU) No. 2016-09,
Compensation—Stock Compensation (Topic 718): Improvements to Employee Share-Based Payment Accounting
related to the accounting for stock-based compensation.
We also have audited, in accordance with the standards of the Public Company Accounting Oversight Board (United States), the Company’s internal control over financial reporting as of
December 31, 2016
, based on criteria established in the 2013
Internal Control—Integrated Framework
issued by the Committee of Sponsoring Organizations of the Treadway Commission (COSO), and our report dated
February 15, 2017
expressed an unqualified opinion thereon.
/s/ GRANT THORNTON LLP
Irvine, California
February 15, 2017
F-
2
REPORT OF INDEPENDENT REGISTERED PUBLIC ACCOUNTING FIRM
Board of Directors and Stockholders
Masimo Corporation
We have audited the internal control over financial reporting of Masimo Corporation (a Delaware corporation) and subsidiaries (the “Company”) as of
December 31, 2016
, based on criteria established in the 2013
Internal Control—Integrated Framework
issued by the Committee of Sponsoring Organizations of the Treadway Commission (COSO). The Company’s management is responsible for maintaining effective internal control over financial reporting and for its assessment of the effectiveness of internal control over financial reporting included in the accompanying Management’s Report on Internal Control over Financial Reporting. Our responsibility is to express an opinion on the Company’s internal control over financial reporting based on our audit.
We conducted our audit in accordance with the standards of the Public Company Accounting Oversight Board (United States). Those standards require that we plan and perform the audit to obtain reasonable assurance about whether effective internal control over financial reporting was maintained in all material respects. Our audit included obtaining an understanding of internal control over financial reporting, assessing the risk that a material weakness exists, testing and evaluating the design and operating effectiveness of internal control based on the assessed risk, and performing such other procedures as we considered necessary in the circumstances. We believe that our audit provides a reasonable basis for our opinion.
A company’s internal control over financial reporting is a process designed to provide reasonable assurance regarding the reliability of financial reporting and the preparation of financial statements for external purposes in accordance with generally accepted accounting principles. A company’s internal control over financial reporting includes those policies and procedures that (1) pertain to the maintenance of records that, in reasonable detail, accurately and fairly reflect the transactions and dispositions of the assets of the company; (2) provide reasonable assurance that transactions are recorded as necessary to permit preparation of financial statements in accordance with generally accepted accounting principles, and that receipts and expenditures of the company are being made only in accordance with authorizations of management and directors of the company; and (3) provide reasonable assurance regarding prevention or timely detection of unauthorized acquisition, use, or disposition of the company’s assets that could have a material effect on the financial statements.
Because of its inherent limitations, internal control over financial reporting may not prevent or detect misstatements. Also, projections of any evaluation of effectiveness to future periods are subject to the risk that controls may become inadequate because of changes in conditions, or that the degree of compliance with the policies or procedures may deteriorate.
In our opinion, the Company maintained, in all material respects, effective internal control over financial reporting as of
December 31, 2016
, based on criteria established in the 2013
Internal Control—Integrated Framework
issued by COSO.
We also have audited, in accordance with the standards of the Public Company Accounting Oversight Board (United States), the consolidated financial statements of the Company as of and for the year ended
December 31, 2016
and our report dated
February 15, 2017
expressed an unqualified opinion on those financial statements.
/s/ GRANT THORNTON LLP
Irvine, California
February 15, 2017
F-
3
MASIMO CORPORATION
(in thousands, except par value)
|
December 31,
2016 |
January 2,
2016 |
||||||
|
ASSETS
|
|||||||
|
Current assets
|
|||||||
|
Cash and cash equivalents
|
$
|
305,970
|
|
$
|
132,317
|
|
|
|
Accounts receivable, net of allowance for doubtful accounts of $1,698 and $1,967 at December 31, 2016 and January 2, 2016, respectively
|
101,720
|
|
80,960
|
|
|||
|
Inventories
|
72,542
|
|
62,038
|
|
|||
|
Prepaid income taxes
|
981
|
|
2,404
|
|
|||
|
Other current assets
|
26,014
|
|
21,423
|
|
|||
|
Total current assets
|
507,227
|
|
299,142
|
|
|||
|
Deferred cost of goods sold
|
79,948
|
|
66,844
|
|
|||
|
Property and equipment, net
|
135,996
|
|
132,466
|
|
|||
|
Intangible assets, net
|
29,376
|
|
27,556
|
|
|||
|
Goodwill
|
19,780
|
|
20,394
|
|
|||
|
Deferred income taxes
|
38,975
|
|
44,320
|
|
|||
|
Other assets
|
9,223
|
|
11,013
|
|
|||
|
Total assets
|
$
|
820,525
|
|
$
|
601,735
|
|
|
|
LIABILITIES AND EQUITY
|
|||||||
|
Current liabilities
|
|||||||
|
Accounts payable
|
$
|
31,125
|
|
$
|
25,865
|
|
|
|
Accrued compensation
|
43,180
|
|
38,415
|
|
|||
|
Accrued liabilities
|
31,476
|
|
44,222
|
|
|||
|
Income taxes payable
|
76,316
|
|
2,777
|
|
|||
|
Deferred revenue
|
38,198
|
|
21,280
|
|
|||
|
Current portion of capital lease obligations
|
71
|
|
74
|
|
|||
|
Total current liabilities
|
220,366
|
|
132,633
|
|
|||
|
Deferred revenue
|
25,336
|
|
298
|
|
|||
|
Long-term debt
|
—
|
|
185,071
|
|
|||
|
Other liabilities
|
14,587
|
|
8,021
|
|
|||
|
Total liabilities
|
260,289
|
|
326,023
|
|
|||
|
Commitments and contingencies (Notes 4 and 15)
|
|
|
|||||
|
Equity
|
|||||||
|
Masimo Corporation stockholders’ equity:
|
|||||||
|
Preferred stock, $0.001 par value; 5,000 shares authorized at December 31, 2016 and January 2, 2016; 0 shares issued and outstanding at December 31, 2016 and January 2, 2016
|
—
|
|
—
|
|
|||
|
Common stock, $0.001 par value, 100,000 shares authorized at December 31, 2016 and January 2, 2016; 50,188 and 49,881 shares issued and outstanding at December 31, 2016 and January 2, 2016, respectively
|
50
|
|
50
|
|
|||
|
Treasury stock, 14,255 and 12,759 shares at December 31, 2016 and January 2, 2016, respectively
|
(404,276
|
)
|
(340,873
|
)
|
|||
|
Additional paid-in capital
|
382,263
|
|
332,417
|
|
|||
|
Accumulated other comprehensive (loss) income
|
(7,027
|
)
|
(4,739
|
)
|
|||
|
Retained earnings
|
589,226
|
|
288,560
|
|
|||
|
Total Masimo Corporation stockholders’ equity
|
560,236
|
|
275,415
|
|
|||
|
Noncontrolling interest
|
—
|
|
297
|
|
|||
|
Total equity
|
560,236
|
|
275,712
|
|
|||
|
Total liabilities and equity
|
$
|
820,525
|
|
$
|
601,735
|
|
|
The accompanying notes are an integral part of these consolidated financial statements.
F-
4
MASIMO CORPORATION
(in thousands, except per share information)
|
Year ended
December 31, 2016 |
Year ended
January 2, 2016 |
Year ended
January 3, 2015 |
|||||||||
|
Revenue:
|
|||||||||||
|
Product
|
$
|
663,846
|
|
$
|
599,334
|
|
$
|
556,764
|
|
||
|
Royalty
|
30,779
|
|
30,777
|
|
29,879
|
|
|||||
|
Total revenue
|
694,625
|
|
630,111
|
|
586,643
|
|
|||||
|
Cost of goods sold
|
230,826
|
|
220,128
|
|
195,864
|
|
|||||
|
Gross profit
|
463,799
|
|
409,983
|
|
390,779
|
|
|||||
|
Operating expenses:
|
|||||||||||
|
Selling, general and administrative
|
253,667
|
|
252,725
|
|
241,016
|
|
|||||
|
Research and development
|
59,362
|
|
56,617
|
|
56,581
|
|
|||||
|
Litigation settlement, award and/or defense costs
|
(270,000
|
)
|
(19,609
|
)
|
(10,331
|
)
|
|||||
|
Total operating expenses
|
43,029
|
|
289,733
|
|
287,266
|
|
|||||
|
Operating income
|
420,770
|
|
120,250
|
|
103,513
|
|
|||||
|
Non-operating expense
|
2,429
|
|
3,905
|
|
1,472
|
|
|||||
|
Income before provision for income taxes
|
418,341
|
|
116,345
|
|
102,041
|
|
|||||
|
Provision for income taxes
|
117,675
|
|
34,845
|
|
27,678
|
|
|||||
|
Net income including noncontrolling interest
|
300,666
|
|
81,500
|
|
74,363
|
|
|||||
|
Net (loss) income attributable to noncontrolling interest
|
—
|
|
(1,800
|
)
|
1,845
|
|
|||||
|
Net income attributable to Masimo Corporation stockholders
|
$
|
300,666
|
|
$
|
83,300
|
|
$
|
72,518
|
|
||
|
Net income per share attributable to Masimo Corporation stockholders:
|
|||||||||||
|
Basic
|
$
|
6.07
|
|
$
|
1.62
|
|
$
|
1.33
|
|
||
|
Diluted
|
$
|
5.65
|
|
$
|
1.55
|
|
$
|
1.30
|
|
||
|
Weighted-average shares used in per share calculations:
|
|||||||||||
|
Basic
|
49,530
|
|
51,311
|
|
54,708
|
|
|||||
|
Diluted
|
53,195
|
|
53,707
|
|
55,571
|
|
|||||
The accompanying notes are an integral part of these consolidated financial statements.
F-
5
MASIMO CORPORATION
CONSOLIDATED STATEMENTS OF COMPREHENSIVE INCOME
(in thousands)
|
Year ended
December 31, 2016 |
Year ended
January 2, 2016 |
Year ended
January 3, 2015 |
|||||||||
|
Net income including noncontrolling interest
|
$
|
300,666
|
|
$
|
81,500
|
|
$
|
74,363
|
|
||
|
Other comprehensive loss, net of tax:
|
|||||||||||
|
Foreign currency translation adjustments
|
(2,288
|
)
|
(2,646
|
)
|
(6,088
|
)
|
|||||
|
Total comprehensive income
|
298,378
|
|
78,854
|
|
68,275
|
|
|||||
|
Comprehensive (loss) income attributable to noncontrolling interest
|
—
|
|
(1,800
|
)
|
1,845
|
|
|||||
|
Comprehensive income attributable to Masimo Corporation stockholders
|
$
|
298,378
|
|
$
|
80,654
|
|
$
|
66,430
|
|
||
The accompanying notes are an integral part of these consolidated financial statements.
F-
6
|
MASIMO CORPORATION
CONSOLIDATED STATEMENTS OF EQUITY
(in thousands)
|
|||||||||||||||||||||||||||||||||
|
Masimo Corporation Stockholders
|
|||||||||||||||||||||||||||||||||
|
Common Stock
|
Treasury Stock
|
Additional
Paid-In
Capital
|
Accumulated
Other
Comprehensive
Income
|
Retained
Earnings
|
Noncontrolling
Interest
|
Total
Equity
|
|||||||||||||||||||||||||||
|
Shares
|
Amount
|
Shares
|
Amount
|
||||||||||||||||||||||||||||||
|
Balance at December 28, 2013
|
56,623
|
|
$
|
57
|
|
4,156
|
|
$
|
(83,454
|
)
|
$
|
273,129
|
|
$
|
3,995
|
|
$
|
132,742
|
|
$
|
(68
|
)
|
$
|
326,401
|
|
||||||||
|
Stock options exercised
|
426
|
|
—
|
|
—
|
|
—
|
|
4,683
|
|
—
|
|
—
|
|
—
|
|
4,683
|
|
|||||||||||||||
|
Income tax deficit from exercise of stock options
|
—
|
|
—
|
|
—
|
|
—
|
|
(132
|
)
|
—
|
|
—
|
|
—
|
|
(132
|
)
|
|||||||||||||||
|
Compensation related to stock option grants to employees
|
—
|
|
—
|
|
—
|
|
—
|
|
11,002
|
|
—
|
|
—
|
|
3
|
|
11,005
|
|
|||||||||||||||
|
Repurchases of common stock
|
(4,455
|
)
|
(5
|
)
|
4,455
|
|
(102,452
|
)
|
4
|
|
—
|
|
—
|
|
—
|
|
(102,453
|
)
|
|||||||||||||||
|
Purchase of treasury shares by noncontrolling interest entity, net
|
—
|
|
—
|
|
—
|
|
—
|
|
—
|
|
—
|
|
—
|
|
(38
|
)
|
(38
|
)
|
|||||||||||||||
|
Net income
|
—
|
|
—
|
|
—
|
|
—
|
|
—
|
|
—
|
|
72,518
|
|
1,845
|
|
74,363
|
|
|||||||||||||||
|
Foreign currency translation adjustment
|
—
|
|
—
|
|
—
|
|
—
|
|
—
|
|
(6,088
|
)
|
—
|
|
—
|
|
(6,088
|
)
|
|||||||||||||||
|
Income tax benefit on foreign currency translation
|
—
|
|
—
|
|
—
|
|
—
|
|
—
|
|
—
|
|
—
|
|
—
|
|
—
|
|
|||||||||||||||
|
Balances at January 3, 2015
|
52,594
|
|
$
|
52
|
|
8,611
|
|
$
|
(185,906
|
)
|
$
|
288,686
|
|
$
|
(2,093
|
)
|
$
|
205,260
|
|
$
|
1,742
|
|
$
|
307,741
|
|
||||||||
|
Stock options exercised
|
1,435
|
|
2
|
|
—
|
|
—
|
|
28,324
|
|
—
|
|
—
|
|
—
|
|
28,326
|
|
|||||||||||||||
|
Payroll tax withholding on behalf of employees for stock options
|
—
|
|
—
|
|
—
|
|
—
|
|
(472
|
)
|
—
|
|
—
|
|
—
|
|
(472
|
)
|
|||||||||||||||
|
Income tax benefit from exercise of stock options
|
—
|
|
—
|
|
—
|
|
—
|
|
5,058
|
|
—
|
|
—
|
|
—
|
|
5,058
|
|
|||||||||||||||
|
Compensation related to stock option grants to employees
|
—
|
|
—
|
|
—
|
|
—
|
|
10,817
|
|
—
|
|
—
|
|
8
|
|
10,825
|
|
|||||||||||||||
|
Repurchases of common stock
|
(4,148
|
)
|
(4
|
)
|
4,148
|
|
(154,967
|
)
|
4
|
|
—
|
|
—
|
|
—
|
|
(154,967
|
)
|
|||||||||||||||
|
Issuance of shares in noncontrolling interest entity, net
|
—
|
|
—
|
|
—
|
|
—
|
|
—
|
|
—
|
|
—
|
|
347
|
|
347
|
|
|||||||||||||||
|
Net income (loss)
|
—
|
|
—
|
|
—
|
|
—
|
|
—
|
|
—
|
|
83,300
|
|
(1,800
|
)
|
81,500
|
|
|||||||||||||||
|
Foreign currency translation adjustment
|
—
|
|
—
|
|
—
|
|
—
|
|
—
|
|
(2,646
|
)
|
—
|
|
—
|
|
(2,646
|
)
|
|||||||||||||||
|
Balance at January 2, 2016
|
49,881
|
|
$
|
50
|
|
12,759
|
|
$
|
(340,873
|
)
|
$
|
332,417
|
|
$
|
(4,739
|
)
|
$
|
288,560
|
|
$
|
297
|
|
$
|
275,712
|
|
||||||||
|
Stock options exercised
|
1,799
|
|
—
|
|
—
|
|
—
|
|
37,342
|
|
—
|
|
—
|
|
—
|
|
37,342
|
|
|||||||||||||||
|
Restricted stock units vested
|
4
|
|
—
|
|
—
|
|
—
|
|
—
|
|
—
|
|
—
|
|
—
|
|
—
|
|
|||||||||||||||
|
Compensation related to stock option grants to employees
|
—
|
|
—
|
|
—
|
|
—
|
|
12,503
|
|
—
|
|
—
|
|
—
|
|
12,503
|
|
|||||||||||||||
|
Repurchases of common stock
|
(1,496
|
)
|
—
|
|
1,496
|
|
(63,403
|
)
|
1
|
|
—
|
|
—
|
|
—
|
|
(63,402
|
)
|
|||||||||||||||
|
Gain on deconsolidation of variable interest entity
|
—
|
|
—
|
|
—
|
|
—
|
|
—
|
|
—
|
|
—
|
|
(297
|
)
|
(297
|
)
|
|||||||||||||||
|
Net income
|
—
|
|
—
|
|
—
|
|
—
|
|
—
|
|
—
|
|
300,666
|
|
|
300,666
|
|
||||||||||||||||
|
Foreign currency translation adjustment
|
—
|
|
—
|
|
—
|
|
—
|
|
—
|
|
(2,288
|
)
|
—
|
|
—
|
|
(2,288
|
)
|
|||||||||||||||
|
Balance at December 31, 2016
|
50,188
|
|
$
|
50
|
|
14,255
|
|
$
|
(404,276
|
)
|
$
|
382,263
|
|
$
|
(7,027
|
)
|
$
|
589,226
|
|
$
|
—
|
|
$
|
560,236
|
|
||||||||
The accompanying notes are an integral part of these consolidated financial statements.
F-
7
MASIMO CORPORATION
(in thousands)
|
Year ended
December 31, 2016 |
Year ended
January 2, 2016 |
Year ended
January 3, 2015 |
|||||||||
|
Cash flows from operating activities:
|
|||||||||||
|
Net income including noncontrolling interest
|
$
|
300,666
|
|
$
|
81,500
|
|
$
|
74,363
|
|
||
|
Adjustments to reconcile net income including noncontrolling interest to net cash provided by operating activities:
|
|||||||||||
|
Depreciation and amortization
|
16,817
|
|
15,684
|
|
12,818
|
|
|||||
|
Share-based compensation
|
12,503
|
|
10,825
|
|
11,005
|
|
|||||
|
Loss on disposal of property, equipment and intangibles
|
658
|
|
608
|
|
918
|
|
|||||
|
Provision for doubtful accounts
|
259
|
|
342
|
|
583
|
|
|||||
|
Gain on deconsolidation of variable interest entity
|
(273
|
)
|
—
|
|
—
|
|
|||||
|
Benefit from deferred income taxes
|
5,405
|
|
(1,974
|
)
|
(320
|
)
|
|||||
|
Changes in operating assets and liabilities:
|
|||||||||||
|
(Increase) decrease in accounts receivable
|
(21,243
|
)
|
(9,900
|
)
|
4,862
|
|
|||||
|
(Increase) decrease in inventories
|
(10,831
|
)
|
7,505
|
|
(13,434
|
)
|
|||||
|
Increase in deferred cost of goods sold
|
(8,251
|
)
|
(78
|
)
|
(6,683
|
)
|
|||||
|
Decrease (increase) in prepaid income taxes
|
1,355
|
|
(1,992
|
)
|
3,316
|
|
|||||
|
Increase in other assets
|
(7,314
|
)
|
(3,012
|
)
|
(1,824
|
)
|
|||||
|
Increase (decrease) in accounts payable
|
7,816
|
|
(4,319
|
)
|
(1,375
|
)
|
|||||
|
Decrease in accounts payable to related party
|
(1,092
|
)
|
—
|
|
—
|
|
|||||
|
Increase in accrued compensation
|
5,675
|
|
5,334
|
|
4,948
|
|
|||||
|
(Decrease) increase in accrued liabilities
|
(7,605
|
)
|
19,902
|
|
1,837
|
|
|||||
|
Increase in income taxes payable
|
73,755
|
|
1,316
|
|
4,173
|
|
|||||
|
Increase in deferred revenue
|
41,900
|
|
58
|
|
199
|
|
|||||
|
Increase (decrease) in other liabilities
|
6,642
|
|
(4,587
|
)
|
227
|
|
|||||
|
Net cash provided by operating activities
|
416,842
|
|
117,212
|
|
95,613
|
|
|||||
|
Cash flows from investing activities:
|
|||||||||||
|
Purchases of property and equipment
|
(19,707
|
)
|
(50,393
|
)
|
(75,061
|
)
|
|||||
|
Increase in intangible assets
|
(4,644
|
)
|
(4,201
|
)
|
(3,903
|
)
|
|||||
|
Reduction in cash resulting from deconsolidation of variable interest entity
|
(763
|
)
|
—
|
|
—
|
|
|||||
|
Net cash used in investing activities
|
(25,114
|
)
|
(54,594
|
)
|
(78,964
|
)
|
|||||
|
Cash flows from financing activities:
|
|||||||||||
|
Borrowings under revolving line of credit
|
45,000
|
|
130,000
|
|
125,000
|
|
|||||
|
Repayments under revolving line of credit
|
(230,000
|
)
|
(70,000
|
)
|
—
|
|
|||||
|
Debt issuance costs
|
(621
|
)
|
—
|
|
(436
|
)
|
|||||
|
Repayments on capital lease obligations
|
(75
|
)
|
(80
|
)
|
(111
|
)
|
|||||
|
Proceeds from issuance of common stock
|
37,290
|
|
28,285
|
|
4,680
|
|
|||||
|
Payroll tax withholdings on behalf of employee for stock options
|
—
|
|
(472
|
)
|
—
|
|
|||||
|
Repurchases of common stock
|
(68,218
|
)
|
(150,152
|
)
|
(102,453
|
)
|
|||||
|
Net equity issuances (repurchases) by noncontrolling interest
|
—
|
|
346
|
|
(38
|
)
|
|||||
|
Net cash (used in) provided by financing activities
|
(216,624
|
)
|
(62,073
|
)
|
26,642
|
|
|||||
|
Effect of foreign currency exchange rates on cash
|
(1,451
|
)
|
(2,681
|
)
|
(4,304
|
)
|
|||||
|
Net increase (decrease) in cash and cash equivalents
|
173,653
|
|
(2,136
|
)
|
38,987
|
|
|||||
|
Cash and cash equivalents at beginning of period
|
132,317
|
|
134,453
|
|
95,466
|
|
|||||
|
Cash and cash equivalents at end of period
|
$
|
305,970
|
|
$
|
132,317
|
|
$
|
134,453
|
|
||
The accompanying notes are an integral part of these consolidated financial statements.
F-
8
MASIMO CORPORATION
NOTES TO CONSOLIDATED FINANCIAL STATEMENTS
1. Description of the Company
Masimo Corporation (the Company), is a global medical technology company that develops, manufactures and markets a variety of noninvasive monitoring technologies. The Company’s mission is to improve patient outcomes and reduce cost of care by taking noninvasive monitoring to new sites and applications. The Company’s patient monitoring solutions generally incorporate a monitor or circuit board, proprietary single-patient use, reusable or resposable sensors, software and/or cables. The Company primarily sells its products to hospitals, emergency medical service (EMS) providers, home care providers, physician offices, veterinarians, long-term care facilities and consumers through its direct sales force, distributors and original equipment manufacturer (OEM) partners.
The Company invented Masimo Signal Extraction Technology
®
(SET
®
), which provides the capabilities of Measure-through Motion and Low Perfusion
™
pulse oximetry to address the primary limitations of conventional pulse oximetry. Over the years, the Company’s product offerings have expanded significantly to also include noninvasive optical blood constituent monitoring, optical organ oximetry monitoring, electrical brain function monitoring, acoustic respiration monitoring and optical gas monitoring. The Company also developed the Root
®
patient monitoring and connectivity platform and the Masimo Patient SafetyNet remote patient surveillance monitoring system. These solutions and related products are based upon Masimo SET
®
, rainbow
®
and other proprietary algorithms. These software-based technologies are incorporated into a variety of product platforms depending on customers’ specifications. This technology is supported by a substantial intellectual property portfolio that the Company has built through internal development and, to a lesser extent, acquisitions and license agreements.
2. Summary of Significant Accounting Policies
Basis of Presentation
The consolidated financial statements have been prepared in accordance with accounting principles generally accepted in the United States of America (GAAP), and include the accounts of the Company, its wholly-owned subsidiaries and variable interest entities (VIEs) in which the Company is the primary beneficiary. All significant intercompany balances and transactions have been eliminated in consolidation.
Fiscal Periods
The Company follows a conventional 52/53 week fiscal year. Under a conventional 52/53 week fiscal year, a 52 week fiscal year includes four quarters of 13 weeks while a 53 week fiscal year includes three quarters of 13 weeks and one quarter of 14 weeks. The Company’s last 53 week fiscal year was fiscal year 2014. Fiscal years 2015 and 2016 were 52 week fiscal years. All references to years in these notes to consolidated financial statements are fiscal years unless otherwise noted.
Use of Estimates
The Company prepares its financial statements in conformity with GAAP, which requires the Company to make estimates and assumptions that affect the reported amounts of assets and liabilities and disclosure of contingent assets and liabilities at the dates of the financial statements and the reported amounts of revenues and expenses during the reporting periods. Significant estimates include the determination of accounts receivable allowances, inventory reserves, warranty reserves, rebate accruals, valuation of the Company’s stock options, goodwill valuation, deferred taxes and any associated valuation allowances, distributor channel inventory, royalty revenues, deferred revenue, uncertain income tax positions, litigation costs and related accruals. Actual results could differ from such estimates.
Reclassifications
Certain amounts in the consolidated financial statements for prior periods have been reclassified to conform to current period presentation.
Fair Value Measurements
Authoritative guidance describes a fair value hierarchy based on three levels of inputs, of which the first two are considered observable and the last unobservable, that may be used to measure fair value:
|
•
|
Level 1 - Quoted prices in active markets for
identical
assets or liabilities.
|
|
•
|
Level 2 - Inputs other than Level 1 that are observable, either directly or indirectly, such as quoted prices for
similar
assets or liabilities, quoted prices in markets that are not active or other inputs that can be corroborated by observable market data for substantially the full term of the assets or liabilities.
|
F-
9
|
•
|
Level 3 - Unobservable inputs that are supported by little or no market activity and that are significant to the fair value of the assets or liabilities.
|
Pursuant to current authoritative guidance, entities are allowed an irrevocable option to elect fair value for the initial and subsequent measurement for specified financial assets and liabilities on a contract-by-contract basis. The Company did not elect the fair value option under this guidance as to specific assets or liabilities. There were no transfers between level 1, level 2 and level 3 inputs during the years ended
December 31, 2016
or
January 2, 2016
. The Company carries cash and cash equivalents at cost which approximates fair value. As of
December 31, 2016
and
January 2, 2016
, the Company did
not
have any short-term investments.
The following tables represent the Company’s fair value hierarchy for its financial assets (in thousands):
|
December 31, 2016
|
Adjusted Basis
Cost |
Gross Unrealized
Gains |
Gross Unrealized
(Losses) |
Estimated
Fair Value |
Cash and Cash
Equivalents |
||||||||||||||
|
Cash
|
$
|
305,970
|
|
$
|
—
|
|
$
|
—
|
|
$
|
305,970
|
|
$
|
305,970
|
|
||||
|
Level 1:
|
|||||||||||||||||||
|
None
|
—
|
|
—
|
|
—
|
|
—
|
|
—
|
|
|||||||||
|
Level 2:
|
|||||||||||||||||||
|
None
|
—
|
|
—
|
|
—
|
|
—
|
|
—
|
|
|||||||||
|
Level 3:
|
|||||||||||||||||||
|
None
|
—
|
|
—
|
|
—
|
|
—
|
|
—
|
|
|||||||||
|
Total assets measured at fair value
|
$
|
305,970
|
|
$
|
—
|
|
$
|
—
|
|
$
|
305,970
|
|
$
|
305,970
|
|
||||
|
January 2, 2016
|
Adjusted Basis
Cost |
Gross Unrealized
Gains |
Gross Unrealized
(Losses) |
Estimated
Fair Value |
Cash and Cash
Equivalents |
||||||||||||||
|
Cash
|
$
|
112,168
|
|
$
|
—
|
|
$
|
—
|
|
$
|
112,168
|
|
$
|
112,168
|
|
||||
|
Level 1:
|
|||||||||||||||||||
|
Money market funds
|
20,149
|
|
—
|
|
—
|
|
20,149
|
|
20,149
|
|
|||||||||
|
Level 2:
|
|||||||||||||||||||
|
None
|
—
|
|
—
|
|
—
|
|
—
|
|
—
|
|
|||||||||
|
Level 3:
|
|||||||||||||||||||
|
None
|
—
|
|
—
|
|
—
|
|
—
|
|
—
|
|
|||||||||
|
Total assets measured at fair value
|
$
|
132,317
|
|
$
|
—
|
|
$
|
—
|
|
$
|
132,317
|
|
$
|
132,317
|
|
||||
Cash and Cash Equivalents
The Company considers all highly liquid investments with an original maturity from date of purchase of three months or less, or highly liquid investments that are readily convertible into known amounts of cash, to be cash equivalents.
Accounts Receivable and Allowance for Doubtful Accounts
Accounts receivable consist of trade receivables recorded upon recognition of revenue for product revenues, reduced by reserves for estimated bad debts and returns. Trade accounts receivable are recorded at the invoiced amount and do not bear interest. Credit is extended based on evaluation of the customer’s financial condition. Collateral is not required. The allowance for doubtful accounts is determined based on historical write-off experience, current customer information and other relevant factors, including specific identification of past due accounts, based on the age of the receivable in excess of the contemplated or contractual due date. Accounts are charged off against the allowance when the Company believes they are uncollectible.
F-
10
Inventories
Inventories are stated at the lower of cost or net realizable value. Cost is determined using a standard cost method, which approximates FIFO (first in, first out) and includes material, labor and overhead. Inventory reserves are recorded for inventory items that have become excess or obsolete or are no longer used in current production and for inventory that has a market price less than the carrying value in inventory.
Property and Equipment
Property and equipment are stated at cost. Depreciation is calculated using the straight-line method over estimated useful lives as follows:
|
Useful Lives
|
|
|
Building
|
39 years
|
|
Building improvements
|
7 to 15 years
|
|
Leasehold improvements
|
Lesser of useful life or term of lease
|
|
Machinery and equipment
|
5 to 7 years
|
|
Vehicles
|
5 years
|
|
Tooling
|
3 years
|
|
Computer equipment
|
2 to 6 years
|
|
Furniture and office equipment
|
2 to 6 years
|
|
Demonstration units
|
3 years
|
Land is not depreciated and construction in progress is not depreciated until placed in service. Normal repair and maintenance costs are expensed as incurred, whereas significant improvements that materially increase values or extend useful lives are capitalized and depreciated over the remaining estimated useful lives of the related assets. Upon sale or retirement of depreciable assets, the related cost and accumulated depreciation or amortization are removed from the accounts and any gain or loss on the sale or retirement is recognized in income.
For the years ended
December 31, 2016
,
January 2, 2016
and
January 3, 2015
, depreciation and amortization expense of property and equipment was
$13.0 million
,
$11.8 million
and
$9.2 million
, respectively.
Intangible Assets
Intangible assets consist primarily of patents, trademarks, software development costs, customer relationships and acquired technology. Costs related to patents and trademarks, which include legal and application fees, are capitalized and amortized over the estimated useful lives using the straight-line method. Patent and trademark amortization commences once final approval of the patent or trademark has been obtained. Patent costs are amortized over the lesser of
10
years or the patent’s remaining legal life, which assumes renewals, and trademark costs are amortized over
17
years, and their associated amortization cost is included in selling, general and administrative expense in the accompanying consolidated statements of operations. For intangibles purchased in an asset acquisition or business combination, which mainly include patents, trademarks, customer relationships and acquired technology, the useful life is determined in the same manner as noted above. For the years ended
December 31, 2016
,
January 2, 2016
and
January 3, 2015
, amortization of intangible assets was
$3.8 million
,
$4.2 million
and
$3.4 million
, respectively. As of
December 31, 2016
and
January 2, 2016
, the total costs of patents not yet amortizing was
$5.0 million
and
$5.4 million
, respectively. As of
December 31, 2016
and
January 2, 2016
, the total costs of trademarks not yet amortizing was
$0.6 million
and
$0.9 million
, respectively. For the years ended
December 31, 2016
and
January 2, 2016
, total renewal costs capitalized for patents and trademarks was
$0.6 million
and
$0.7 million
, respectively. As of
December 31, 2016
, the weighted-average number of years until the next renewal was
one
year for patents and
six
years for trademarks.
The Company’s policy is to renew its patents and trademarks. Costs to renew intangibles are capitalized and amortized over the remaining useful life of the intangible. The Company continually evaluates the amortization period and carrying basis of patents and trademarks to determine whether any events or circumstances warrant a revised estimated useful life or reduction in value. Capitalized application costs are charged to operations when it is determined that the patent or trademark will not be obtained or is abandoned.
F-
11
In accordance with authoritative accounting guidance, costs related to the research and development of new software products and enhancements to existing software products are expensed as incurred until technological feasibility of the product has been established, at which time such costs are capitalized, subject to expected recoverability. For the year ended
December 31, 2016
, the Company did
not
capitalize any software development costs. For each of the years ended
January 2, 2016
and
January 3, 2015
, the Company capitalized
$0.5 million
of software development costs. The capitalized costs are amortized over the estimated life of the products, which is generally
seven
years. For the year ended
December 31, 2016
, the Company amortized
$0.1 million
of capitalized costs. For each of the years ended
January 2, 2016
and
January 3, 2015
, the Company amortized
$0.2 million
of capitalized costs. The Company had unamortized software development costs of
$0.8 million
and
$0.9 million
at
December 31, 2016
and
January 2, 2016
, respectively, which is included within intangible assets, net, on the consolidated balance sheets.
Impairment of Goodwill and Intangible assets
Goodwill is recorded as the difference, if any, between the aggregate consideration paid for an acquisition and the fair value of the acquired net tangible and intangible assets. Goodwill is not amortized, but instead is tested at least annually for impairment, or more frequently when events or changes in circumstances indicate that goodwill might be impaired. In assessing goodwill impairment for each of its reporting units, the Company has the option to first assess the qualitative factors to determine whether the existence of events or circumstances leads to a determination that it is more likely than not that the fair value of a reporting unit is less than its carrying amount. The Company’s qualitative assessment of the recoverability of goodwill considers various macroeconomic, industry-specific and company-specific factors, including: (i) severe adverse industry or economic trends; (ii) significant company-specific actions; (iii) current, historical or projected deterioration of the Company’s financial performance; or (iv) a sustained decrease in the Company’s market capitalization below its net book value. If, after assessing the totality of events or circumstances, the Company determines it is unlikely that the fair value of a reporting unit is less than its carrying amount, then performing the two-step impairment test is unnecessary. However, if the Company concludes otherwise, then the Company is required to perform the first step of the two-step impairment test by comparing the fair value of the reporting unit, determined using future projected discounted operating cash flows, with its carrying amount, including goodwill. If the fair value of the reporting unit exceeds its carrying amount, goodwill is not considered impaired; otherwise, goodwill is considered impaired and the loss is measured by performing step two. Under step two, the impairment loss is measured by comparing the implied fair value of the reporting unit goodwill with the carrying amount of goodwill. The Company also has the option to bypass the qualitative assessment and proceed directly to performing the first step of the two-step goodwill impairment test. The annual impairment test is performed during the fourth fiscal quarter.
The Company reviews identifiable intangible and other long-lived assets for impairment whenever events or changes in circumstances indicate that the carrying amount of an asset may not be recoverable. Recoverability of assets to be held and used is measured by a comparison of the carrying amount of an asset to the future undiscounted operating cash flow expected to be generated by the asset. If such asset is considered to be impaired, the impairment to be recognized is measured by the amount by which the carrying amount exceeds the fair value of the asset. Long-lived assets to be disposed of are reported at the lower of carrying amount or fair value less costs to sell.
No
impairment of goodwill, intangible assets or other long-lived assets was recorded during the years ended
December 31, 2016
,
January 2, 2016
or
January 3, 2015
.
Income Taxes
The Company accounts for income taxes using the asset and liability method, under which the Company recognizes deferred tax assets and liabilities for the future tax consequences attributable to temporary differences between the financial statement carrying amounts of existing assets and liabilities and their respective tax bases and for net operating loss and tax credit carryforwards. Tax positions that meet a more-likely-than-not recognition threshold are recognized in the first reporting period that it becomes more-likely-than-not such tax position will be sustained upon examination. A tax position that meets this more-likely-than-not recognition threshold is recorded at the largest amount of tax benefit that has a greater than 50% likelihood of being realized upon ultimate settlement. Previously recognized income tax positions that fail to meet the recognition threshold in a subsequent period are derecognized in that period. Differences between actual results and the Company’s assumptions, or changes in the Company’s assumptions in future periods, are recorded in the period they become known. The Company records potential accrued interest and penalties related to unrecognized tax benefits in income tax expense.
F-
12
As a multinational corporation, the Company is subject to complex tax laws and regulations in various jurisdictions. The application of tax laws and regulations is subject to legal and factual interpretation, judgment and uncertainty. Tax laws themselves are subject to change as a result of changes in fiscal policy, changes in legislation, evolution of regulations and court rulings. Therefore, the actual liability for U.S. or foreign taxes may be materially different from the Company’s estimates, which could result in the need to record additional liabilities or potentially to reverse previously recorded tax liabilities.
Deferred tax assets and liabilities are measured using enacted tax rates expected to apply to taxable income in the years in which those temporary differences are expected to be recovered or settled. The effect on deferred tax assets and liabilities of a change in tax rates is recognized in the period that includes the enactment date. A valuation allowance is recorded against any deferred tax assets when, in the judgment of management, it is more likely than not that all or part of a deferred tax asset will not be realized. In assessing the need for a valuation allowance, the Company considers all positive and negative evidence, including recent financial performance, scheduled reversals of temporary differences, projected future taxable income, availability of taxable income in carryback periods and tax planning strategies.
Revenue Recognition and Deferred Revenue
The Company follows the current authoritative guidance for revenue recognition. Based on these requirements, the Company recognizes revenue from the sale of products or services when: (i) persuasive evidence of an arrangement exists, (ii) delivery has occurred or services have been rendered, (iii) the price is fixed or determinable, and (iv) collectability is reasonably assured. In the case of the license or sale of software that does not function together with hardware components to provide the essential functionality of the hardware, revenue is recognized pursuant to the software revenue recognition guidance.
The Company derives the majority of its revenue from
four
primary sources: (i) direct sales under long-term sensor purchase agreements with end-user hospitals where the Company provides up-front monitoring equipment at no up-front charge in exchange for a multi-year sensor purchase commitment, (ii) other direct sales of noninvasive monitoring solutions to end-user hospitals, emergency medical response organizations and other direct customers; (iii) sales of noninvasive monitoring solutions to distributors who then typically resell to end-user hospitals, emergency medical response organizations and other direct customers; and (iv) sales of integrated circuit boards to OEM customers who incorporate the Company’s embedded software technology into their multiparameter monitoring devices.
The Company enters into agreements to sell its noninvasive monitoring solutions and services, sometimes as part of multiple deliverable arrangements that include various combinations of products and services. While the majority of the Company’s sales transactions contain standard business terms and conditions, there are some transactions that contain non-standard business terms and conditions. As a result, contract interpretation and analysis is sometimes required to determine the appropriate accounting, including: (i) how the arrangement consideration should be allocated among the deliverables when multiple deliverables exist, (ii) when to recognize revenue on the deliverables, and (iii) whether undelivered elements are essential to the functionality of the delivered elements. Changes in judgments on these assumptions and estimates could materially impact the timing of revenue recognition.
In the case of multiple deliverable arrangements, the authoritative guidance provides a hierarchy to determine the selling price to be used for allocating revenue to deliverables as follows: (i) vendor-specific objective evidence (VSOE) of fair value, (ii) third-party evidence of selling price (TPE), and (iii) best estimate of the selling price (ESP). VSOE of fair value is defined as the price charged when the same element is sold separately. VSOE generally exists only when the deliverable is sold separately and is the price actually charged for that deliverable. TPE generally does not exist for the majority of the Company’s products. The objective of ESP is to determine the price at which the Company would transact a sale if the product was sold on a stand-alone basis. In the absence of VSOE and TPE, the Company determines ESP for its products by considering multiple factors including, but not limited to, features and functionality of the product, geographies, type of customer, contractual prices pursuant to Group Purchasing Organization (GPO) contracts, the Company’s pricing and discount practices, and market conditions.
A deliverable in an arrangement qualifies as a separate unit of accounting if the delivered item has value to the customer on a stand-alone basis. Most of the Company’s products in a multiple deliverable arrangement qualify as separate units of accounting. In the case of the Company’s monitoring equipment containing embedded Masimo SET
®
or rainbow SET
™
software, the Company has determined that the hardware and software components function together to deliver the equipment’s essential functionality and, therefore, represent a single deliverable. However, software deliverables, such as rainbow
®
parameter software, which do not function together with hardware components to provide the equipment’s essential functionality, are accounted for under software revenue recognition guidance.
F-
13
The revenue for these multiple-element arrangements is allocated to the software deliverables and the non-software deliverables based on the relative selling prices of all of the deliverables in the arrangement using the hierarchy in the revenue recognition accounting guidance for arrangements with multiple deliverables.
Sales under long-term sensor purchase contracts are generally structured such that the Company agrees to provide at no up-front charge certain monitoring-related equipment, software, installation, training and/or warranty support in exchange for the hospital’s agreement to purchase sensors over the term of the agreement, which generally ranges from three to six years. These contracts generally do not provide for any payments that are not dependent upon the Company’s future delivery of sensors, which are essential to the functionality of the monitoring equipment and, therefore, represent a substantive performance obligation. As a result, the Company generally does not recognize any revenue when the monitoring and related equipment and software are delivered to the hospitals, but rather recognizes revenue for these delivered elements on a pro-rata basis as the sensors are delivered under the long-term purchase commitment, when installation and training are complete. Accordingly, the cost of the monitoring and related equipment initially placed at the hospitals is deferred and amortized to cost of goods sold over the life of the underlying long-term sensor purchase contract. In cases where such contracts do provide for guaranteed payments that are unrelated to the future delivery of sensors, the Company recognizes the net present value of such payments as revenue from the monitoring and related equipment and expenses the cost of such equipment to cost of goods sold, as the equipment is delivered and when installation and training are complete. Some of the Company’s long-term sensor contracts also contain provisions for certain payments to be made directly to the end-user hospital customer at the inception of the arrangement. These payments are generally treated as prepaid discounts which are deferred and amortized on a straight-line basis as contra-revenue over the life of the underlying long-term sensor purchase contract.
Many of the Company’s distributors purchase sensor products that they then resell to end-user hospitals that are typically fulfilling their purchase obligations to the Company under such end-user hospital’s long-term sensor purchase commitments. Upon shipment to the distributor, revenue is deferred until the distributor ships the product to the Company’s end-user customers based on an estimate of the inventory held by these distributors at the end of the accounting period.
The Company also earns revenue from the sale of integrated circuit boards and other products, as well as from rainbow
®
parameter software licenses, to OEMs under various agreements. Revenue from the sale of products to the OEMs is generally recognized at the time of shipment. Revenue related to software licenses to OEMs is generally recognized upon shipment of the OEM’s product to its customers, as represented to the Company by the OEM.
The Company also provides certain customers with the ability to purchase sensors under rebate programs. Under these programs, the customers may earn rebates based on their purchasing activity. The Company estimates and provides allowances for these programs at the time of sale as a reduction to revenue.
In general, customers do not have a right of return for credit or refund. However, the Company allows returns under certain circumstances. At the end of each period, the Company estimates and accrues for these returns as a reduction to revenue and accounts receivable. The Company estimates returns based on several factors, including contractual limitations and past returns history.
The majority of the Company’s royalty revenue arises from one agreement with Medtronic plc (Medtronic, formerly Covidien Ltd.) and is due and payable quarterly based on U.S. sales of certain Medtronic products. An estimate of these royalty revenues is recorded quarterly in the period earned based on the prior quarter’s historical results, adjusted for any new information or trends known to management at the time of estimation. This estimated revenue is adjusted prospectively when the Company receives the Medtronic royalty report, approximately
sixty
days after the end of the previous quarter.
Taxes Collected From Customers and Remitted to Governmental Authorities
Pursuant to authoritative guidance, the Company’s policy is to present revenue net of taxes collected from customers and remitted to governmental authorities.
Share-Based Compensation
The Company expenses the estimated fair value of employee stock options and similar awards based on the fair value of the stock option on the date of grant, in accordance with the current authoritative accounting guidance. In calculating the fair value on the date of grant, the Company uses the Black-Scholes option pricing model which requires the input of subjective assumptions. These assumptions include estimating the length of time employees will retain their stock options before exercising them, the estimated volatility of the Company’s stock price over the expected term and the number of options that will ultimately be forfeited prior to meeting their vesting requirements. The cost is recognized over the period during which an employee is required to provide services in exchange for the stock option, which is usually the vesting period.
F-
14
The Company has elected to recognize share-based compensation expense on a straight-line basis over the requisite service period for the entire stock option.
Options granted prior to January 1, 2006 were accounted for using the intrinsic value method and using the minimum value method for its pro forma disclosures, unless such options were modified, repurchased or canceled. The cash flows related to the reduction of income taxes paid as a result of the deduction triggered by employee exercise of stock options granted or modified prior to January 1, 2006 continue to be presented within operating cash flows.
Shipping and Handling Costs and Revenue
All shipping and handling costs are expensed as incurred and are recorded as a component of cost of goods sold in the accompanying consolidated statements of operations. Charges for shipping and handling billed to customers are included as a component of product revenue in accordance with authoritative accounting guidance.
Product Warranty
The Company provides a warranty against defects in material and workmanship for a period ranging from
six
months to
forty-eight
months, depending on the product type. In the case of long-term sales agreements, the Company typically warranties the products for the term of the agreement, which ranges from
three
to
six
years. In traditional sales activities, including direct and OEM sales, the Company establishes an accrual for the estimated costs of warranty at the time of revenue recognition. Estimated warranty expenses are recorded as an accrued liability, with a corresponding provision to cost of goods sold. Revenue related to any extended warranty is recognized over the life of the contract, while the product warranty costs related to the long-term sales agreements are expensed as incurred.
Changes in the product warranty accrual were as follows (in thousands):
|
Year Ended
|
|||||||||||
|
December 31,
2016 |
January 2,
2016 |
January 3,
2015 |
|||||||||
|
Warranty accrual, beginning of period
|
$
|
1,222
|
|
$
|
1,416
|
|
$
|
1,161
|
|
||
|
Accrual for warranties issued (including specific accrual)
|
871
|
|
800
|
|
1,144
|
|
|||||
|
Changes in pre-existing warranties (including changes in estimates)
|
110
|
|
61
|
|
138
|
|
|||||
|
Settlements made
|
(1,293
|
)
|
(1,055
|
)
|
(1,027
|
)
|
|||||
|
Warranty accrual, end of period
|
$
|
910
|
|
$
|
1,222
|
|
$
|
1,416
|
|
||
Advertising Costs
Advertising costs are expensed as incurred. These costs are included in selling, general and administrative expense in the accompanying consolidated statements of operations. Advertising costs for the years ended
December 31, 2016
,
January 2, 2016
and
January 3, 2015
were
$11.0 million
,
$10.7 million
and
$10.7 million
, respectively.
Research and Development
Costs related to research and development activities are expensed as incurred. These costs include personnel costs, materials, depreciation and amortization on associated tangible and intangible assets and an allocation of facility costs, all of which are directly related to research and development activities.
Litigation Costs and Contingencies
The Company records a charge equal to at least the minimum estimated liability for a loss contingency or litigation settlement when both of the following conditions are met: (i) information available prior to issuance of the financial statements indicates that it is probable that a liability had been incurred at the date of the financial statements, and (ii) the range of loss can be reasonably estimated. The determination of whether a loss contingency or litigation settlement is probable or reasonably possible involves a significant amount of management judgment, as does the estimation of the range of loss given the nature of contingencies. Liabilities related to litigation settlements with multiple elements are recorded based on the fair value of each element. Legal and other litigation related expenses are recognized as the services are provided. The Company records insurance and other indemnity recoveries for litigation expenses when both of the following conditions are met: (a) the recovery is probable, and (b) collectability is reasonably assured. Insurance recoveries are only recorded to the extent the litigation costs to which they relate have been incurred and recognized in the financial statements.
F-
15
On November 5, 2016, the Company entered into a settlement agreement (Philips Settlement Agreement) with Koninklijke Philips N.V. (Philips N.V.), which, among other things, settled all of the claims, legal proceedings and contractual disputes between the Company, Philips N.V. and its affiliates. Pursuant to the Philips Settlement Agreement, Philips N.V. paid us
$300 million
,
$30 million
of which related to certain future performance obligations by the Company and, therefore, has been deferred to future periods in accordance with authoritative accounting guidance. See Note 15 - Commitments and Contingencies under the caption “
Litigation
” for additional information on this matter.
Foreign Currency Translation
The Company’s international headquarters is in Switzerland, and its functional currency is the U.S. Dollar. The Company has several foreign sales support subsidiaries that maintain foreign offices, of which the largest are in Japan and Europe. The functional currencies of these subsidiaries are the Japanese Yen and Euro, respectively.
The Company transacts with foreign customers in currencies other than the U.S. Dollar and, in doing so, experiences realized and unrealized foreign currency gains or losses on its foreign denominated receivables. In addition, certain intercompany transactions give rise to realized and unrealized foreign currency gains or losses. Also, any other transactions between the Company or its subsidiaries and a third-party, denominated in a currency different from the functional currency, are foreign currency transactions. Realized and unrealized foreign currency gains or losses are included as a component of non-operating expense within the Company’s consolidated statements of operations as incurred and are converted to U.S. Dollars at average exchange rates for the respective period. These transaction losses were
$0.1 million
,
$0.5 million
and
$1.0 million
for the years ended
December 31, 2016
,
January 2, 2016
and
January 3, 2015
, respectively.
Assets and liabilities of foreign subsidiaries, whose functional currency is not the U.S. Dollar, are translated into U.S. Dollars at the rate of exchange at the balance sheet date. Statement of operations amounts are translated at the average monthly exchange rates for the respective periods. For these foreign subsidiaries whose functional currency is not the U.S. Dollar, translation gains and losses are included as a component of accumulated other comprehensive income (loss) within Masimo Corporation stockholders’ equity in the accompanying consolidated balance sheets.
Comprehensive Income
Authoritative accounting guidance establishes requirements for reporting and disclosure of comprehensive income and its components. Comprehensive income includes foreign currency translation adjustments and related tax benefits, which have been excluded from net income including noncontrolling interests and reflected in Masimo Corporation stockholders’ equity.
Net Income Per Share
Basic net income per share attributable to Masimo Corporation stockholders is computed by dividing net income attributable to Masimo Corporation stockholders by the weighted-average number of shares outstanding during each reporting period. Diluted net income per share attributable to Masimo Corporation stockholders is computed by dividing the net income attributable to Masimo Corporation stockholders by the weighted-average number of shares and potential shares outstanding during each reporting period, if the effect of potential shares is dilutive. Potential shares include the incremental shares of stock issuable upon the assumed exercise of stock options and the expected vesting of stock awards as calculated under the treasury stock method. For the years ended
December 31, 2016
,
January 2, 2016
and
January 3, 2015
, weighted options to purchase
0.2 million
,
0.7 million
and
5.7 million
shares of common stock, respectively, were outstanding, but were not included in the computation of diluted net income per share because the effect of including such shares would have been antidilutive. For the year ended
December 31, 2016
, certain restricted stock units (RSUs) are considered contingently issuable shares as their vesting is contingent upon the occurrence of certain future events. These events have not occurred and are not considered probable of occurring as of
December 31, 2016
. Therefore,
2.7 million
of weighted average shares have been excluded from the calculation of potential shares. For additional information with respect to these RSUs, please see “Employment and Severance Agreements” in Note 15 to these consolidated financial statements.
F-
16
The computation of basic and diluted net income per share attributable to Masimo Corporation stockholders is as follows (in thousands, except per share data):
|
Year ended
|
|||||||||||
|
December 31,
2016 |
January 2,
2016 |
January 3,
2015 |
|||||||||
|
Net income attributable to stockholders of Masimo Corporation:
|
|||||||||||
|
Net income including noncontrolling interest
|
$
|
300,666
|
|
$
|
81,500
|
|
$
|
74,363
|
|
||
|
Net income (loss) attributable to the noncontrolling interest
|
—
|
|
(1,800
|
)
|
1,845
|
|
|||||
|
Net income attributable to Masimo Corporation stockholders
|
$
|
300,666
|
|
$
|
83,300
|
|
$
|
72,518
|
|
||
|
Basic net income per share attributable to Masimo Corporation stockholders:
|
|||||||||||
|
Net income attributable to Masimo Corporation stockholders
|
$
|
300,666
|
|
$
|
83,300
|
|
$
|
72,518
|
|
||
|
Weighted-average shares outstanding - basic
|
49,530
|
|
51,311
|
|
54,708
|
|
|||||
|
Basic net income per share attributable to Masimo Corporation stockholders
|
$
|
6.07
|
|
$
|
1.62
|
|
$
|
1.33
|
|
||
|
Diluted net income per share attributable to Masimo Corporation stockholders:
|
|||||||||||
|
Weighted-average shares outstanding
|
49,530
|
|
51,311
|
|
54,708
|
|
|||||
|
Diluted share equivalents: stock options and RSUs
|
3,665
|
|
2,396
|
|
863
|
|
|||||
|
Weighted-average shares outstanding - diluted
|
53,195
|
|
53,707
|
|
55,571
|
|
|||||
|
Diluted net income per share attributable to Masimo Corporation stockholders
|
$
|
5.65
|
|
$
|
1.55
|
|
$
|
1.30
|
|
||
Supplemental Cash Flow Information (in thousands)
|
Year ended
|
|||||||||||
|
December 31,
2016 |
January 2,
2016 |
January 3,
2015 |
|||||||||
|
Cash paid during the year for:
|
|||||||||||
|
Interest (net of amounts capitalized)
|
$
|
4,052
|
|
$
|
2,293
|
|
$
|
469
|
|
||
|
Income taxes
|
31,230
|
|
36,194
|
|
19,863
|
|
|||||
|
Noncash investing and financing activities:
|
|||||||||||
|
Unpaid purchases of property, plant and equipment
|
2,009
|
|
4,371
|
|
12,155
|
|
|||||
|
Unsettled common stock proceeds
|
165
|
|
—
|
|
—
|
|
|||||
|
Unsettled common stock repurchases
|
—
|
|
4,815
|
|
—
|
|
|||||
Segment Information
The Company uses the “management approach” in determining reportable business segments. The management approach designates the internal organization used by management for making operating decisions and assessing performance as the source for determining the Company’s reportable segments. Based on this assessment, management has determined it operates in
one
reportable business segment, which is comprised of patient monitoring and related products.
Recently Adopted Accounting Pronouncements
In March 2016, the Financial Accounting Standards Board (FASB) issued Accounting Standards Update (ASU) No. 2016-09,
Compensation—Stock Compensation (Topic 718): Improvements to Employee Share-Based Payment Accounting (ASU 2016-09)
. The new standard makes several modifications to Topic 718 related to the accounting for forfeitures, employer tax withholding on stock-based compensation and the financial statement presentation of excess tax benefits or deficiencies. ASU 2016-09 also clarifies the statement of cash flows presentation for certain components of stock-based awards. The standard is effective for interim and annual reporting periods beginning after December 15, 2016, with early adoption permitted. The Company adopted this standard during the first quarter of the fiscal year ended December 31, 2016.
F-
17
The early adoption of this standard resulted in a
$13.0 million
reduction to the Company’s income tax provision and a related increase to basic and diluted net income per share attributable to Masimo Corporation stockholders of $0.26 and $0.24, respectively, for the year ended December 31, 2016.
In connection with such adoption, the Company elected to continue to estimate forfeitures expected to occur to determine the amount of compensation cost to be recognized in each period. In addition, the Company elected to apply the presentation requirements for cash flows related to excess tax benefits retrospectively to all periods presented, which resulted in an increase to both net cash provided by operating activities and net cash used in financing activities of
$3.0 million
for the year ended
January 2, 2016
and a decrease to net cash provided by operating activities and an increase to net cash provided by financing activities of
$0.4 million
for the year ended
January 3, 2015
.
In November 2015, the FASB issued ASU No. 2015-17,
Balance Sheet Classification of Deferred Taxes (ASU 2015-17).
The new standard requires entities to classify deferred tax liabilities and assets as noncurrent in a classified statement of financial position. ASU 2015-17 is effective for fiscal years beginning after December 15, 2016 and interim periods within those annual periods. The Company early adopted this standard retrospectively during the fourth quarter of the fiscal year ended January 2, 2016 and such adoption did not have a material impact on the Company’s consolidated financial statements.
In February 2015, the FASB issued ASU No. 2015-02, Consolidation (Topic 810): Amendments to the Consolidation Analysis (ASU 2015-02). The amended standard applies to entities in all industries and eliminates the deferral of certain consolidation standards for entities considered to be investment companies, as well as modifies the consolidation analysis performed on certain types of legal entities. ASU 2015-02 is effective for annual and interim fiscal reporting periods beginning after December 15, 2015, and may be applied retrospectively, with early adoption permitted. The Company adopted this standard during the first quarter of the fiscal year ended December 31, 2016, and its adoption did not have a material impact on the Company’s consolidated financial statements.
Recently Issued Accounting Pronouncements Pending Adoption
In December 2016, FASB issued ASU No. 2016-19,
Technical Corrections and Improvements (ASU 2016-19)
. The new standard is intended to provide clarity to the Accounting Standards Codification or correct unintended application of the guidance that is not expected to have a significant effect on current accounting practice or create a significant administrative cost to most entities. ASU 2016-19 is effective for annual and interim fiscal reporting periods beginning after December 15, 2017 with respect to the amendments that require transition guidance, and early adoption is permitted. All other amendments were effective on issuance. The Company is currently evaluating the expected impact of the amendments that require transition guidance, but does not expect these to have a material impact on its consolidated financial statements upon adoption.
In November 2016, the FASB issued ASU No. 2016-18, Statement of Cash Flows (Topic 230):
Restricted Cash (ASU 2016-18)
. The new standard is intended to reduce diversity in practice by adding or clarifying guidance on classification and presentation of changes in restricted cash on the statement of cash flows. ASU 2016-18 is effective for annual and interim fiscal reporting periods beginning after December 15, 2017, and early adoption is permitted. The Company is currently evaluating the expected impact of this standard, but does not expect it to have a material impact on its consolidated financial statements upon adoption.
In October 2016, the FASB issued ASU No. 2016-16, Income Taxes (Topic 740):
Intra-Entity Transfers of Assets Other than Inventory (ASU 2016-16)
. The new standard eliminates the exception that allowed the income tax consequences of an intra-entity transfer of assets other than inventory to be deferred the until the transferred asset was sold to a third party or otherwise recovered through use, and now requires recognition of such income tax consequences an the time the non-inventory asset is transferred. ASU 2016-16 is effective for annual and interim fiscal reporting periods beginning after December 15, 2017, and early adoption is permitted. The Company is currently evaluating the expected impact of this standard, but does not expect it to have a material impact on its consolidated financial statements upon adoption.
In August 2016, the FASB issued ASU No. 2016-15,
Statement of Cash Flows (Topic 230): Classification of Certain Cash Receipts and Cash Payments (ASU 2016-15)
. The new standard amended the existing accounting standards for the Statement of Cash Flows and provides guidance on eight specific cash flow issues. ASU 2016-15 is effective for annual and interim fiscal reporting periods beginning after December 15, 2019, and early adoption is permitted. The Company is currently evaluating the expected impact of this standard, but does not expect it to have a material impact on its consolidated financial statements upon adoption.
F-
18
In June 2016, the FASB issued ASU No. 2016-13,
Financial Instruments - Credit Losses (Topic 326): Measurement of Credit Losses on Financial Instruments (ASU 2016-13)
. The new standard requires entities to use a current expected credit loss model, which is a new impairment model based on expected losses rather than incurred losses. Under this model, an entity would recognize an impairment allowance equal to its current estimate of all contractual cash flows that the entity does not expect to collect. The entity’s estimate would consider relevant information about past events, current conditions, and reasonable and supportable forecasts. ASU 2016-13 is effective for annual and interim fiscal reporting periods beginning after December 15, 2019, with early adoption permitted for annual reporting periods beginning after December 15, 2018. The Company is currently evaluating the expected impact of this standard, but does not expect it to have a material impact on its consolidated financial statements upon adoption.
In February 2016, the FASB issued ASU No. 2016-02,
Leases (Topic 842): (ASU 2016-02)
. The new standard requires lessees to recognize most leases on their balance sheets but continue to recognize lease expenses in their income statement in a manner similar to current practice. The new standard states that a lessee will recognize a lease liability for the obligation to make lease payments and a right-of-use asset for the right to use the underlying asset for the lease term. Expense related to leases determined to be operating leases will be recognized on a straight-line basis, while those determined to be financing leases will be recognized following a front-loaded expense profile in which interest and amortization are presented separately in the income statement. ASU 2016-02 is effective for annual and interim fiscal reporting periods beginning after December 15, 2018, and early application is permitted. The Company is currently evaluating the expected impact of this standard on its consolidated financial statements, but anticipates that, among other things, the required recognition of a lease liability and related right-of-use asset will significantly increase both the assets and liabilities recognized and reported on its balance sheet. The Company currently expects to complete its assessment of the full financial impact of the new lease accounting guidance during the next eighteen months and has not yet finalized any decision related to the timing of adoption for this guidance.
In May 2014, the FASB issued ASU No. 2014-09,
Revenue (Topic 606): Revenue from Contracts with Customers (ASU 2014-09)
. The new standard provides a single, principles-based five-step model to be applied to all contracts with customers while enhancing disclosures about revenue, providing additional guidance for transactions that were not previously addressed comprehensively and improving guidance for multiple-element arrangements. ASU 2014-09 will replace most existing revenue recognition guidance under GAAP when it becomes effective. The standard permits the use of either the retrospective or cumulative effect transition method upon adoption. In August 2015, the FASB issued ASU No. 2015-14,
Revenue from Contracts with Customers (Topic 606): Deferral of the Effective Date (ASU 2015-14)
, which amended ASU 2014-09, providing for a one year deferral period for the implementation of ASU 2014-09. ASU 2014-09 will now be effective for annual and interim periods beginning on or after December 15, 2017. In March 2016, the FASB issued ASU No. 2016-08,
Revenue from Contracts with Customers: Principal versus Agent Considerations under FASB ASC Topic 606 (ASU 2016-08)
, which provides guidance on principal versus agent considerations. In April 2016, the FASB issued ASU No. 2016-10,
Revenue from Contracts with Customers (Topic 606) – Identifying Performance Obligations and Licensing (ASU 2016-10)
, which amended ASU 2014-09 by providing clarity in identifying performance obligations and licensing implementation guidance. In May 2016, the FASB issued ASU No. 2016-12,
Revenue from Contracts with Customers (Topic 606) – Narrow-Scope Improvements and Practical Expedients (ASU 2016-12),
which further amended ASU 2014-09 by providing additional clarity in recognizing revenue from contracts that have been modified prior to the transition period to the new standard, as well as providing additional disclosure requirements for businesses and other organizations that make the transition to the new standard by adjusting amounts from prior reporting periods via retrospective application. In December 2016, the FASB issued ASU No. 2016-20,
Technical Corrections and Improvements to Topic 606, Revenue from Contracts with Customers (ASU 2016-20)
. ASU 2016-20
affects narrow aspects of Topic 606, including contract modifications, contract costs, and the balance sheet classification of items as contract assets versus receivables. The Company is continuing to evaluate the expected impact of the new revenue guidance contained in Topic 606 on its consolidated financial statements and anticipates, among other things, that the adoption of such standard will result in the acceleration of certain revenue from product sales to distributors that is currently deferred under the “sell-through” method, as well as the capitalization and deferral of certain contract-related costs that are currently expensed when incurred. The Company currently expects to complete its assessment of the full financial impact of the new revenue recognition guidance, including the method of adoption, during the next nine months and to adopt the guidance when it becomes effective for the Company on December 31, 2017 (fiscal year 2018).
3. Variable Interest Entity (VIE)
The Company follows authoritative guidance for the consolidation of its VIE, which requires an enterprise to determine whether its variable interest gives it a controlling financial interest in a VIE. Determination about whether an enterprise should consolidate a VIE is required to be evaluated continuously as changes to existing relationships or future transactions may result in consolidating or deconsolidating the VIE. Changes in the noncontrolling interest for the consolidated VIE for each period are presented in the accompanying consolidated statements of equity.
F-
19
Cercacor Laboratories, Inc. (Cercacor)
Cercacor is an independent entity spun off from the Company to its stockholders in 1998. Joe Kiani, the Company’s Chairman and Chief Executive Officer, is also the Chairman and Chief Executive Officer of Cercacor. The Company is a party to a Cross-Licensing Agreement with Cercacor, which was most recently amended and restated effective January 1, 2007 (the Cross-Licensing Agreement), that governs each party’s rights to certain intellectual property held by the
two
companies. In addition, the Company has also entered into an administrative services agreement with Cercacor that governs certain general and administrative services the Company provides to Cercacor; a consulting services agreement with Cercacor that governs certain engineering consulting and clinical studies support services that Cercacor may provide to the Company from time-to-time and a sublease agreement with Cercacor for approximately
16,830
square feet of excess office and laboratory space located at 40 Parker, Irvine, California. See Note 4 to these consolidated financial statements for additional information on these agreements and other transactions with Cercacor.
As a result of recent changes in the capital structure of Cercacor, as well as certain of its contractual relationships with the Company, the Company completed a re-evaluation of the authoritative consolidation guidance during the first quarter of 2016 and determined that although Cercacor remains a VIE, the Company is no longer its primary beneficiary as it can no longer be deemed to have the power to direct the activities of Cercacor that most significantly impact Cercacor’s economic performance and can no longer be deemed to have an obligation to absorb Cercacor’s losses pursuant to the Company’s on-going contractual relationships with Cercacor. Based on such determination, the Company discontinued consolidating Cercacor within its consolidated financial statements effective as of January 3, 2016. However, Cercacor continues to be a related party following its deconsolidation. The Company recognized a gain of
$0.3 million
upon such deconsolidation, which has been reported within non-operating income in the consolidated statement of operations.
Cercacor continues to be included within these consolidated financial statements for all periods prior to January 3, 2016. Accordingly, for periods prior to January 3, 2016, all intercompany royalties, option and license fees and other charges between the Company and Cercacor, as well as all intercompany payables and receivables, have been eliminated in consolidation. However, for periods prior to January 3, 2016, all direct operating expenses that were incurred by the Company and charged to Cercacor, or that were incurred by Cercacor and charged to the Company, have not been eliminated and are included within operating expenses in the Company’s consolidated statements of operations. The consolidating balance sheet as of
January 2, 2016
, and statements of operations for the years ended
January 2, 2016
and
January 3, 2015
reflecting the Company, Cercacor and related eliminations (in thousands) are as follows.
F-
20
|
January 2,
2016 |
||||||||||||||||
|
Consolidating Balance Sheet:
|
Masimo Corp
|
Cercacor
|
Cercacor Elim
|
Total
|
||||||||||||
|
ASSETS
|
||||||||||||||||
|
Cash and cash equivalents
|
$
|
131,554
|
|
$
|
763
|
|
$
|
—
|
|
$
|
132,317
|
|
||||
|
Accounts receivable, net
|
80,937
|
|
23
|
|
—
|
|
80,960
|
|
||||||||
|
Inventories
|
62,038
|
|
—
|
|
—
|
|
62,038
|
|
||||||||
|
Prepaid income taxes
|
2,342
|
|
62
|
|
—
|
|
2,404
|
|
||||||||
|
Other current assets
|
21,230
|
|
1,277
|
|
(1,084
|
)
|
21,423
|
|
||||||||
|
Deferred cost of goods sold
|
66,844
|
|
—
|
|
—
|
|
66,844
|
|
||||||||
|
Property and equipment, net
|
131,877
|
|
589
|
|
—
|
|
132,466
|
|
||||||||
|
Intangible assets, net
|
29,045
|
|
2,858
|
|
(4,347
|
)
|
27,556
|
|
||||||||
|
Goodwill
|
20,394
|
|
—
|
|
—
|
|
20,394
|
|
||||||||
|
Deferred income taxes
|
44,320
|
|
—
|
|
—
|
|
44,320
|
|
||||||||
|
Other assets
|
11,013
|
|
—
|
|
—
|
|
11,013
|
|
||||||||
|
Total assets
|
$
|
601,594
|
|
$
|
5,572
|
|
$
|
(5,431
|
)
|
$
|
601,735
|
|
||||
|
LIABILITIES
|
||||||||||||||||
|
Accounts payable
|
$
|
25,798
|
|
$
|
67
|
|
$
|
—
|
|
$
|
25,865
|
|
||||
|
Accrued compensation
|
37,715
|
|
700
|
|
—
|
|
38,415
|
|
||||||||
|
Accrued liabilities
|
45,142
|
|
164
|
|
(1,084
|
)
|
44,222
|
|
||||||||
|
Income taxes payable
|
2,565
|
|
212
|
|
—
|
|
2,777
|
|
||||||||
|
Deferred revenue
|
21,280
|
|
376
|
|
(376
|
)
|
21,280
|
|
||||||||
|
Current portion of capital lease obligations
|
74
|
|
—
|
|
—
|
|
74
|
|
||||||||
|
Deferred revenue
|
298
|
|
3,406
|
|
(3,406
|
)
|
298
|
|
||||||||
|
Long-term debt
|
185,071
|
|
—
|
|
—
|
|
185,071
|
|
||||||||
|
Other liabilities
|
7,964
|
|
57
|
|
—
|
|
8,021
|
|
||||||||
|
EQUITY
|
||||||||||||||||
|
Common stock
|
50
|
|
14
|
|
(14
|
)
|
50
|
|
||||||||
|
Treasury stock
|
(340,873
|
)
|
(100
|
)
|
100
|
|
(340,873
|
)
|
||||||||
|
Additional paid-in capital
|
332,417
|
|
842
|
|
(842
|
)
|
332,417
|
|
||||||||
|
Accumulated other comprehensive loss
|
(4,739
|
)
|
—
|
|
—
|
|
(4,739
|
)
|
||||||||
|
Retained earnings (deficit)
|
288,832
|
|
(166
|
)
|
(106
|
)
|
288,560
|
|
||||||||
|
Total Masimo Corporation stockholders’ equity
|
275,687
|
|
590
|
|
(862
|
)
|
275,415
|
|
||||||||
|
Noncontrolling interest
|
—
|
|
—
|
|
297
|
|
297
|
|
||||||||
|
Total equity
|
275,687
|
|
590
|
|
(565
|
)
|
275,712
|
|
||||||||
|
Total liabilities and equity
|
$
|
601,594
|
|
$
|
5,572
|
|
$
|
(5,431
|
)
|
$
|
601,735
|
|
||||
F-
21
|
Year ended
January 2, 2016 |
Year ended
January 3, 2015 |
||||||||||||||||||||||||||||||
|
Consolidating Statements of Operations:
|
Masimo
Corp |
Cercacor
|
Cercacor
Elim |
Total
|
Masimo
Corp
|
Cercacor
|
Cercacor
Elim
|
Total
|
|||||||||||||||||||||||
|
Total revenue
|
$
|
630,111
|
|
$
|
6,910
|
|
$
|
(6,910
|
)
|
$
|
630,111
|
|
$
|
586,643
|
|
$
|
5,970
|
|
$
|
(5,970
|
)
|
$
|
586,643
|
|
|||||||
|
Cost of goods sold
|
226,788
|
|
—
|
|
(6,660
|
)
|
220,128
|
|
201,334
|
|
—
|
|
(5,470
|
)
|
195,864
|
|
|||||||||||||||
|
Gross profit
|
403,323
|
|
6,910
|
|
(250
|
)
|
409,983
|
|
385,309
|
|
5,970
|
|
(500
|
)
|
390,779
|
|
|||||||||||||||
|
Operating expenses:
|
|||||||||||||||||||||||||||||||
|
Selling, general and administrative
|
250,627
|
|
2,348
|
|
(250
|
)
|
252,725
|
|
238,674
|
|
2,842
|
|
(500
|
)
|
241,016
|
|
|||||||||||||||
|
Research and development
|
50,292
|
|
6,325
|
|
—
|
|
56,617
|
|
53,449
|
|
3,132
|
|
—
|
|
56,581
|
|
|||||||||||||||
|
Litigation settlement, award and/or defense costs
|
(19,609
|
)
|
—
|
|
—
|
|
(19,609
|
)
|
(8,010
|
)
|
(2,321
|
)
|
—
|
|
(10,331
|
)
|
|||||||||||||||
|
Total operating expenses
|
281,310
|
|
8,673
|
|
(250
|
)
|
289,733
|
|
284,113
|
|
3,653
|
|
(500
|
)
|
287,266
|
|
|||||||||||||||
|
Operating income (loss)
|
122,013
|
|
(1,763
|
)
|
—
|
|
120,250
|
|
101,196
|
|
2,317
|
|
—
|
|
103,513
|
|
|||||||||||||||
|
Non-operating expense (income)
|
3,910
|
|
(571
|
)
|
566
|
|
3,905
|
|
1,505
|
|
(33
|
)
|
—
|
|
1,472
|
|
|||||||||||||||
|
Income (loss) before provision for income taxes
|
118,103
|
|
(1,192
|
)
|
(566
|
)
|
116,345
|
|
99,691
|
|
2,350
|
|
—
|
|
102,041
|
|
|||||||||||||||
|
Provision for income taxes
|
34,803
|
|
42
|
|
—
|
|
34,845
|
|
27,173
|
|
505
|
|
—
|
|
27,678
|
|
|||||||||||||||
|
Net income (loss) including noncontrolling interests
|
83,300
|
|
(1,234
|
)
|
(566
|
)
|
81,500
|
|
72,518
|
|
1,845
|
|
—
|
|
74,363
|
|
|||||||||||||||
|
Net (loss) income attributable to noncontrolling interests
|
—
|
|
—
|
|
(1,800
|
)
|
(1,800
|
)
|
—
|
|
—
|
|
1,845
|
|
1,845
|
|
|||||||||||||||
|
Net income (loss) attributable to Masimo Corporation stockholders
|
$
|
83,300
|
|
$
|
(1,234
|
)
|
$
|
1,234
|
|
$
|
83,300
|
|
$
|
72,518
|
|
$
|
1,845
|
|
$
|
(1,845
|
)
|
$
|
72,518
|
|
|||||||
F-
22
4. Related Party Transactions
The Company’s Chairman and CEO is also the Chairman and CEO of Cercacor. The Company is a party to the following agreements and transactions with Cercacor:
|
•
|
Cross-Licensing Agreement
- The Company and Cercacor are parties to the Cross-Licensing Agreement, which governs each party’s rights to certain intellectual property held by the parties. The Company is subject to certain annual minimum aggregate royalty obligations for use of the rainbow
®
licensed technology. The current annual minimum royalty obligation is
$5.0 million
. Actual aggregate royalties accrued for Cercacor under the license were
$6.4 million
,
$6.7 million
and
$5.5 million
for the years ended
December 31, 2016
,
January 2, 2016
and
January 3, 2015
, respectively. All amounts prior to the deconsolidation of Cercacor on January 3, 2016 were eliminated in consolidation. The Company had less than
$0.1 million
in sales to Cercacor for the year ended
December 31, 2016
and
no
sales to Cercacor for the years ended
January 2, 2016
and
January 3, 2015
.
|
|
•
|
Administrative Services Agreement
- The Company is a party to an administrative services agreement with Cercacor (G&A Services Agreement), which governs certain general and administrative services that the Company provides to Cercacor. Amounts charged by the Company pursuant to the G&A Services Agreement were
$0.2 million
for each of the years ended
December 31, 2016
,
January 2, 2016
and
January 3, 2015
.
|
|
•
|
Cercacor’s Expenses related to Pronto-7
®
.
In February 2009, in order to accelerate the development of the technology and product development supporting the Company’s Pronto-7
®
device, Cercacor agreed to re-direct a substantial amount of its engineering development activities to focus on this project and the Company agreed to fund such expenses. Accordingly, from April 2009 through June 2010, the Company agreed to reimburse Cercacor for all third-party engineering materials and supplies expenses related to Pronto-7
®
development and
50%
of Cercacor’s total engineering and engineering-related payroll expenses. Subsequent to July 2010, Cercacor continued to assist the Company with other product development efforts and charged the Company accordingly. Beginning in 2012, due to a revised estimate of the support required to complete the Company’s various Pronto-7
®
related projects, the Company’s board of directors approved an increase in the percentage of Cercacor’s total engineering and engineering related payroll expenses funded by the Company from
50%
to
60%
. For the year ended
January 3, 2015
, the total funding for these additional Cercacor expenses was
$3.1 million
. This arrangement was discontinued by mutual agreement effective as of January 4, 2015.
|
During the year ended
January 2, 2016
, Cercacor completed a review of its fiscal 2014 cross-charges related to Pronto-7
®
. Based on this review, it was determined that less than
60%
of Cercacor’s total engineering and engineering-related payroll expenses were attributable to the development of Pronto-7
®
, resulting in an overpayment by the Company to Cercacor of approximately
$1.6 million
for fiscal 2014. In addition, the Company and Cercacor agreed to equally share approximately
$1.4 million
of previously incurred engineering-related payroll expenses associated with research for a new LED sensor technology for the Company and, as a result, the Company and Cercacor mutually agreed that Cercacor would refund
$0.9 million
to the Company.
|
•
|
Consulting Services Agreement
- The Company is also a party to a consulting services agreement (Consulting Agreement) with Cercacor that governs certain engineering consulting and clinical studies support services that Cercacor may provide to the Company from time-to-time. Expenses incurred by the Company related to this Consulting Agreement were approximately
$0.0 million
and
$0.3 million
for the years ended
December 31, 2016
and
January 2, 2016
, respectively.
|
|
•
|
Patent Transfer and Licensing Agreement.
The Company entered into a patent transfer and licensing agreement with Cercacor (the Patent Agreement) effective July 2015, pursuant to which, among other things, it purchased certain patents from Cercacor (the Purchased Patents) for an aggregate purchase price of
$2.4 million
. Pursuant to the Patent Agreement, the Company granted Cercacor an irrevocable, non-exclusive, worldwide license with respect to the products and services covered by the Purchased Patents.
|
|
•
|
Sublease Agreement
- In March 2016, the Company entered into a sublease agreement with Cercacor for approximately
16,830
square feet of excess office and laboratory space located at 40 Parker, Irvine, California (Cercacor Sublease). The Cercacor Sublease began on May 1, 2016 and expires on November 30, 2019. The Company recognized
$0.3 million
of sublease income for the year ended
December 31, 2016
.
|
Net amounts due from Cercacor were less than
$0.1 million
and approximately
$1.1 million
as of
December 31, 2016
and
January 2, 2016
, respectively.
F-
23
The Company’s Chief Executive Officer is also the Chairman and one of his family members is a Director of the Masimo Foundation for Ethics, Innovation and Competition in Healthcare (Masimo Foundation), a non-profit organization which was founded in 2010 to provide a platform for encouraging ethics, innovation and competition in healthcare. The Company’s Chief Financial Officer is also a Director of the Masimo Foundation. During the fiscal years ended
December 31, 2016
,
January 2, 2016
and
January 3, 2015
, the Company contributed approximately
$5.0 million
,
$6.3 million
and
$2.8 million
, respectively, to the Masimo Foundation. A portion of the Company’s contributions to the Masimo Foundation were, in turn, contributed by the Masimo Foundation to the Patient Safety Movement Foundation.
The Company’s Chief Executive Officer is also the Chairman of the Patient Safety Movement Foundation, a non-profit organization which was founded in 2013 to work with hospitals, medical technology companies and patient advocates to unite the healthcare ecosystem and eliminate the more than
200,000
U.S. preventable hospital deaths that occur every year by 2020. The Company’s Chief Financial Officer is also the Treasurer and Secretary of the Patient Safety Movement Foundation. During the fiscal years ended
December 31, 2016
,
January 2, 2016
and
January 3, 2015
, the Company contributed approximately
$200,271
,
$220
and
$500,000
, respectively, and Cercacor contributed approximately
$25,000
,
$25,000
and
$25,000
, respectively, to the Patient Safety Movement Foundation.
The Company’s Chief Executive Officer is also the Chairman of the Patient Safety Movement Coalition, a not-for-profit social welfare organization which was founded in 2013 to promote patient safety legislation. The Company’s Chief Financial Officer is also the Secretary of the Patient Safety Movement Coalition. During the fiscal years ended
December 31, 2016
,
January 2, 2016
and
January 3, 2015
, the Company contributed approximately
$20,000
,
$10,000
and
$10,000
, respectively, to the Patient Safety Movement Coalition.
The Company’s Chief Executive Officer is a member of the board of directors for Atheer Labs (Atheer), which is working with the Company on the development of next generation Root
®
applications. During the fiscal years ended,
December 31, 2016
,
January 2, 2016
and
January 3, 2015
, the Company incurred approximately
$255,000
,
$200,000
and
$0
, respectively, in license fees and other expenses owed to Atheer.
The Company’s Chief Executive Officer is a member of the board of directors of Children’s Hospital of Orange County and CHOC Children’s at Mission Hospital (collectively, CHOC), two non-profit hospitals that are devoted exclusively to caring for children. During the fiscal years ended
December 31, 2016
,
January 2, 2016
and
January 3, 2015
, the Company contributed approximately
$11,500
,
$1,500
and
$26,500
, respectively, to CHOC and its affiliates.
5. Inventories
Inventories consist of the following (in thousands):
|
December 31,
2016 |
January 2,
2016 |
||||||
|
Raw materials
|
$
|
32,647
|
|
$
|
25,781
|
|
|
|
Work-in-process
|
7,701
|
|
4,337
|
|
|||
|
Finished goods
|
32,194
|
|
31,920
|
|
|||
|
Total
|
$
|
72,542
|
|
$
|
62,038
|
|
|
Finished goods inventory held by distributors was
$4.9 million
and
$2.9 million
as of
December 31, 2016
and
January 2, 2016
, respectively.
6. Other Current Assets
Other current assets consist of the following (in thousands):
|
December 31,
2016 |
January 2,
2016 |
||||||
|
Prepaid expenses
|
$
|
13,051
|
|
$
|
9,930
|
|
|
|
Royalties receivable
|
7,500
|
|
7,200
|
|
|||
|
Employee loans and advances
|
305
|
|
320
|
|
|||
|
Due from related party
|
24
|
|
—
|
|
|||
|
Other current assets
|
5,134
|
|
3,973
|
|
|||
|
Total other current assets
|
$
|
26,014
|
|
$
|
21,423
|
|
|
F-
24
7. Property and Equipment
Property and equipment, net consists of the following (in thousands):
|
December 31,
2016 |
January 2,
2016 |
||||||
|
Building and building improvements
|
$
|
85,966
|
|
$
|
78,877
|
|
|
|
Machinery and equipment
|
41,683
|
|
42,460
|
|
|||
|
Land
|
23,762
|
|
23,738
|
|
|||
|
Computer equipment
|
13,549
|
|
15,023
|
|
|||
|
Tooling
|
12,895
|
|
13,079
|
|
|||
|
Furniture and office equipment
|
9,669
|
|
8,885
|
|
|||
|
Leasehold improvements
|
8,289
|
|
7,734
|
|
|||
|
Demonstration units
|
448
|
|
973
|
|
|||
|
Vehicles
|
45
|
|
45
|
|
|||
|
Construction-in-progress
|
7,923
|
|
7,124
|
|
|||
|
Total property and equipment
|
204,229
|
|
197,938
|
|
|||
|
Accumulated depreciation and amortization
|
(68,233
|
)
|
(65,472
|
)
|
|||
|
Total property and equipment, net
|
$
|
135,996
|
|
$
|
132,466
|
|
|
In June 2015, the Company, through a wholly owned subsidiary, completed the purchase of its previously leased
90,000
square foot manufacturing, office and warehouse facility located in New Hampshire (the Property). The total purchase price of the Property, inclusive of closing costs and amounts allocable to certain intangible assets and the termination of the existing lease, was
$8.5 million
, of which
$0.7 million
was recorded to land and
$5.7 million
was recorded to building and improvements.
During the year ended
December 31, 2016
, the Company completed construction of its initial renovations to its new corporate headquarters and research and development facility in Irvine, California, resulting in the reclassification of approximately
$6.4 million
from construction-in-progress to building and improvements. As of
January 2, 2016
, approximately
$4.0 million
of construction-in-progress related to the initial purchase and subsequent renovation costs for this facility and approximately
$4.2 million
of construction costs were included in accounts payable. The Company capitalized less than
$0.1 million
and
$0.4 million
of interest expense related to the purchase and renovation of this facility during the years ended
December 31, 2016
and
January 2, 2016
, respectively.
The gross value of furniture and office equipment under capital lease obligations was
$0.4 million
and
$0.4 million
as of
December 31, 2016
and
January 2, 2016
, respectively, with accumulated depreciation of
$0.4 million
and
$0.3 million
as of
December 31, 2016
and
January 2, 2016
, respectively.
F-
25
8. Intangible Assets
Intangible assets, net consist of the following (in thousands):
|
December 31,
2016 |
January 2,
2016 |
||||||
|
Cost
|
|||||||
|
Patents
|
$
|
19,950
|
|
$
|
21,619
|
|
|
|
Customer relationships
|
7,669
|
|
7,669
|
|
|||
|
Licenses
|
7,500
|
|
—
|
|
|||
|
Acquired technology
|
5,580
|
|
5,580
|
|
|||
|
Trademarks
|
3,777
|
|
3,944
|
|
|||
|
Capitalized software development costs
|
2,539
|
|
2,539
|
|
|||
|
Other
|
3,674
|
|
2,541
|
|
|||
|
Total cost
|
50,689
|
|
43,892
|
|
|||
|
Accumulated amortization
|
|||||||
|
Patents
|
(7,427
|
)
|
(7,743
|
)
|
|||
|
Customer relationships
|
(3,387
|
)
|
(2,620
|
)
|
|||
|
Acquired technology
|
(2,508
|
)
|
(1,950
|
)
|
|||
|
Trademarks
|
(1,331
|
)
|
(1,106
|
)
|
|||
|
Capitalized software development costs
|
(1,766
|
)
|
(1,647
|
)
|
|||
|
Other
|
(4,894
|
)
|
(1,270
|
)
|
|||
|
Total accumulated amortization
|
(21,313
|
)
|
(16,336
|
)
|
|||
|
Net carrying amount
|
$
|
29,376
|
|
$
|
27,556
|
|
|
Estimated amortization expense for each of the next fiscal years is as follows (in thousands):
|
Fiscal year
|
Amount
|
||
|
2017
|
$
|
4,232
|
|
|
2018
|
3,925
|
|
|
|
2019
|
3,685
|
|
|
|
2020
|
3,329
|
|
|
|
2021
|
2,813
|
|
|
|
Thereafter
|
11,392
|
|
|
|
Total
|
$
|
29,376
|
|
9. Goodwill
Changes in the goodwill balance were as follows (in thousands):
|
December 31,
2016 |
January 2,
2016 |
||||||
|
Goodwill, beginning of period
|
$
|
20,394
|
|
$
|
20,979
|
|
|
|
Foreign currency translation adjustment
|
(614
|
)
|
(585
|
)
|
|||
|
Goodwill, end of period
|
$
|
19,780
|
|
$
|
20,394
|
|
|
F-
26
10. Accrued Liabilities
Accrued liabilities consist of the following (in thousands):
|
December 31,
2016 |
January 2,
2016 |
||||||
|
Accrued customer rebates, fees and reimbursements
|
$
|
21,103
|
|
$
|
11,857
|
|
|
|
Accrued taxes
|
5,135
|
|
5,263
|
|
|||
|
Accrued legal fees
|
1,362
|
|
5,785
|
|
|||
|
Accrued warranty
|
910
|
|
1,222
|
|
|||
|
Accrued donations
|
503
|
|
5,612
|
|
|||
|
Accrued arbitration award
|
—
|
|
5,391
|
|
|||
|
Accrued stock repurchases
|
—
|
|
4,815
|
|
|||
|
Accrued other
|
2,463
|
|
4,277
|
|
|||
|
Total accrued liabilities
|
$
|
31,476
|
|
$
|
44,222
|
|
|
Long-term debt consists of the following (in thousands):
|
December 31,
2016 |
January 2,
2016 |
||||||
|
Revolving line of credit
|
$
|
—
|
|
$
|
185,000
|
|
|
|
Long-term portion of capital lease obligations acquisition
|
—
|
|
71
|
|
|||
|
Total long-term debt
|
$
|
—
|
|
$
|
185,071
|
|
|
The Company incurred total interest expense of
$3.3 million
,
$3.5 million
and
$0.6 million
for the years ended
December 31, 2016
,
January 2, 2016
and
January 3, 2015
, respectively, the majority of which was related to its revolving line of credit.
Revolving Line of Credit
In January 2016, the Company entered into an Amended and Restated Credit Agreement (Restated Credit Facility) with JPMorgan, as Administrative Agent and a Lender, BofA, as Syndication Agent and a Lender, Citibank, N.A., as Documentation Agent and a Lender, and various other Lenders (collectively, the Lenders). The Restated Credit Facility amended and restated the prior credit agreement dated April 23, 2014 (as amended in September 2014, the Amended Credit Agreement), and provided for up to
$450.0 million
in borrowings in multiple currencies, with an option, subject to certain conditions, for the Company to increase the aggregate borrowing capacity to up to $550.0 million in the future. Effective December 19, 2016, the Company decreased the total available borrowing capacity under the Restated Credit Facility from
$450.0 million
to
$250.0 million
.
Borrowings under the Restated Credit Facility will be deemed, at the Company’s election, either: (i) an ABR draw, which bears interest at the Alternate Base Rate (ABR), as defined below, plus a spread (ABR Spread) based upon a Company leverage ratio, or (ii) a Eurodollar draw, which bears interest at the Adjusted LIBO Rate (as defined below), plus a spread (Eurodollar Spread) based upon a Company leverage ratio. The ABR Spread is
0.125%
to
1.0%
and the Eurodollar Spread is
1.125%
to
2.0%
. Subject to certain conditions, the Company may also request swingline loans from time to time (Swingline Loans) that bear interest similar to an ABR Loan.
The ABR is determined by taking the greatest of (i) the prime rate, (ii) the federal funds effective rate plus
0.5%
, and (iii) the one-month Adjusted LIBO Rate plus
1.0%
. The Adjusted LIBO Rate is equal to LIBOR for the applicable interest period multiplied by the statutory reserve rate for such period.
The Company is obligated under the Restated Credit Facility to pay a fee ranging from
0.175%
to
0.300%
per annum, based upon a Company leverage ratio, with respect to any unused portion of the line of credit. This fee and any interest accrued on an ABR Loan are due and payable quarterly in arrears. Interest accrued on any Eurodollar Loan is due and payable at the end of the applicable interest period (or at each three month interval in the case of loans with interest periods greater than three months). Interest on any Swingline Loan is due and payable on the date that the Swingline Loan is required to be repaid. The Company may prepay the loans and terminate the commitments in whole at any time, without premium or penalty, subject to reimbursement of certain costs in the case of Eurodollar Loans.
F-
27
Pursuant to the terms of the Restated Credit Facility, the Company is subject to certain covenants, including financial covenants related to a leverage ratio and an interest charge coverage ratio, and other customary negative covenants. The Company’s obligations under the Restated Credit Facility are secured by substantially all of the Company’s personal property, including all equity interests in domestic subsidiaries and first-tier foreign subsidiaries.
As of
December 31, 2016
, the Restated Credit Facility had
no
outstanding draws and had outstanding standby letters of credit totaling
$0.3 million
. The Company was in compliance with all covenants under the Restated Credit Facility as of
December 31, 2016
.
12. Other Liabilities, Long-Term
Other long-term liabilities consist of the following (in thousands):
|
December 31,
2016 |
January 2,
2016 |
||||||
|
Unrecognized tax benefit
|
$
|
13,442
|
|
$
|
7,747
|
|
|
|
Deferred rent, long-term
|
558
|
|
76
|
|
|||
|
Deferred tax liability, long-term
|
340
|
|
194
|
|
|||
|
Other
|
247
|
|
4
|
|
|||
|
Total other liabilities, long-term
|
$
|
14,587
|
|
$
|
8,021
|
|
|
Unrecognized tax benefit relates to the Company’s long-term portion of tax liability associated with uncertain tax positions. Authoritative guidance prescribes a recognition threshold and a measurement attribute for the financial statement recognition and measurement of tax positions taken or expected to be taken in a tax return. See Note 17 to these consolidated financial statements for further details.
13. Equity
Series A Junior Participating Preferred Stock and Stockholder Rights Plan
In November 2007, the Company authorized and declared a dividend of
one preferred stock purchase right
(Right) for each outstanding share of its common stock to stockholders of record at the close of business on November 26, 2007 (the Record Date) pursuant to a Rights Agreement, dated as of November 9, 2007, with Computershare Trust Company, N.A., as Rights Agent (the Rights Agreement). In addition, one Right was issued with each share of common stock that became outstanding after the Record Date. Each Right entitled the registered holder to purchase from the Company
one thousandth
of one share of the Company’s Series A junior participating preferred stock, par value
$0.001
per share, at a purchase price equal to
$136.00
per Right, subject to adjustment.
On February 12, 2016, the Company entered into an amendment to the Rights Agreement (the Rights Amendment). The Rights Amendment accelerated the expiration of the Rights from the close of business on February 8, 2017 to the close of business on February 16, 2016, and had the effect of terminating the Rights Agreement on that date. Upon the termination of the Rights Agreement, all of the Rights distributed to holders of the Company’s common stock pursuant to the Rights Agreement expired.
Stock Repurchase Programs
In February 2013, the Board authorized the repurchase of up to
6.0 million
shares of common stock under a stock repurchase program (2013 Repurchase Program). In October 2014, the Board increased the number of shares of the Company’s common stock authorized for repurchase by
3.0 million
shares, bringing the total number of shares of the Company’s common stock authorized under such repurchase program to
9.0 million
. The 2013 Repurchase Program plan terminated pursuant to its terms in September 2015 when all of the authorized
9.0 million
shares had been repurchased.
In September 2015, the Board authorized a new stock repurchase program, whereby the Company may purchase up to
5.0 million
shares of its common stock over a period of up to three years (2015 Repurchase Program). The 2015 Repurchase Program may be carried out at the discretion of a committee comprised of the Company’s Chief Executive Officer and Chief Financial Officer through open market purchases, one or more Rule 10b5-1 trading plans, block trades or privately negotiated transactions. The total remaining shares authorized for repurchase under the 2015 Repurchase Program approximated
2.9 million
shares as of
December 31, 2016
. The Company expects to fund any additional repurchases under the 2015 Repurchase Program through its available cash, future cash from operations, funds available under its Restated Credit Facility or other potential sources of capital.
F-
28
The following table provides a summary of the Company’s stock repurchase activities during the years ended
December 31, 2016
,
January 2, 2016
and
January 3, 2015
(in thousands, except per share amounts):
|
Years Ended
|
|||||||||||
|
December 31,
2016 |
January 2,
2016 |
January 3,
2015 |
|||||||||
|
Shares repurchased
|
1,496
|
|
4,148
|
|
4,455
|
|
|||||
|
Average cost per share
|
$
|
42.39
|
|
$
|
37.36
|
|
$
|
23.00
|
|
||
|
Value of shares repurchased
|
$
|
63,402
|
|
$
|
154,967
|
|
$
|
102,453
|
|
||
14. Share-Based Compensation
Stock Plans
On August 7, 2007, in connection with the Company’s initial public offering, the 2007 Stock Incentive Plan (2007 Plan) became effective. Under the 2007 Plan,
3.0 million
shares of common stock plus shares available under prior equity incentive plans, including shares that become available under the 2007 Plan due to forfeitures at prices not less than the fair market value of the Company’s common stock on the date the option is granted, were initially reserved for future issuance. The options generally vest annually over
five
years using the straight-line method, unless otherwise provided, and expire
ten
years from the date of grant. Options forfeited under any Stock Incentive Plan are automatically added to the share reserve of the 2007 Plan. Pursuant to the “evergreen” provision contained in the 2007 Plan, approximately
1.7 million
additional shares of common stock were added to the share reserve of the 2007 Plan on each of January 4, 2015, December 29, 2013, December 30, 2012, January 1, 2012, January 3, 2010 and January 4, 2009, which represented
3%
of the Company’s total shares outstanding as of each of the years ended January 3, 2015, December 28, 2013, December 29, 2012, December 31, 2011, January 2, 2010 and January 3, 2009. No shares were added to the share reserve for the year ended January 1, 2011. The Company may terminate the 2007 Plan at any time. If not terminated sooner, the 2007 Plan will automatically terminate on August 7, 2017.
Beginning in 2015, equity awards granted to employees include a mix of stock options and RSUs. With the exception of the RSUs granted to the Company’s Chairman and Chief Executive Officer in connection with the amendment and restatement of his employment agreement (see “Employment and Severance Agreements” in Note 15 to these consolidated financial statements for further details), the RSUs generally vest
one
year from date of grant. The number of shares issued on each date that an RSU vests is net of any shares withheld to satisfy the minimum statutory tax withholdings that are paid in cash by the Company to the appropriate taxing authorities.
Stock-Based Award Activity
A summary of stock option activity, as well as the number and weighted-average exercise price of stock options issued and outstanding under all stock plans, is presented below (in thousands, except for exercise price):
|
Year ended
December 31, 2016 |
Year ended
January 2, 2016 |
Year ended
January 3, 2015 |
||||||||||||||||||
|
Shares
|
Average
Exercise Price |
Shares
|
Average
Exercise
Price
|
Shares
|
Average
Exercise Price |
|||||||||||||||
|
Options outstanding, beginning of period
|
9,202
|
|
$
|
25.46
|
|
9,956
|
|
$
|
23.59
|
|
8,911
|
|
$
|
22.76
|
|
|||||
|
Granted
|
1,290
|
|
39.94
|
|
914
|
|
36.18
|
|
1,887
|
|
24.83
|
|
||||||||
|
Canceled
|
(172
|
)
|
29.13
|
|
(218
|
)
|
24.33
|
|
(416
|
)
|
24.46
|
|
||||||||
|
Expired
|
—
|
|
—
|
|
—
|
|
—
|
|
—
|
|
—
|
|
||||||||
|
Exercised
|
(1,799
|
)
|
20.76
|
|
(1,450
|
)
|
19.54
|
|
(426
|
)
|
10.95
|
|
||||||||
|
Options outstanding, end of period
|
8,521
|
|
$
|
28.56
|
|
9,202
|
|
25.46
|
|
9,956
|
|
$
|
23.59
|
|
||||||
|
Options exercisable, end of period
|
4,988
|
|
$
|
26.33
|
|
5,609
|
|
$
|
24.72
|
|
5,859
|
|
$
|
23.63
|
|
|||||
F-
29
The number and weighted-average exercise price of outstanding and exercisable stock options segregated by exercise price ranges (in thousands, except range of exercise prices and remaining contractual life) were as follows:
|
Year ended
December 31, 2016 |
Year ended
January 2, 2016 |
||||||||||||||
|
Options Outstanding
|
Options
Exercisable
|
Options Outstanding
|
Options
Exercisable
|
||||||||||||
|
Range of Exercise Prices
|
Number of
Options
|
Average
Remaining
Contractual
Life
|
Number of
Options
|
Number of
Options
|
Average
Remaining
Contractual
Life
|
Number of
Options
|
|||||||||
|
$8.00 to $20.00
|
565
|
|
5.34
|
296
|
|
1,367
|
|
3.79
|
947
|
|
|||||
|
$20.01 to $30.00
|
4,297
|
|
5.31
|
2,940
|
|
5,196
|
|
6.17
|
3,006
|
|
|||||
|
$30.01 to $40.00
|
3,233
|
|
5.89
|
1,591
|
|
2,349
|
|
5.00
|
1,534
|
|
|||||
|
$40.01 to $50.00
|
311
|
|
6.14
|
161
|
|
290
|
|
6.81
|
122
|
|
|||||
|
$50.01 to $60.00
|
91
|
|
9.65
|
—
|
|
—
|
|
|
—
|
|
|||||
|
$60.01 to $70.00
|
24
|
|
9.90
|
—
|
|
—
|
|
|
—
|
|
|||||
|
Total
|
8,521
|
|
5.62
|
4,988
|
|
9,202
|
|
5.53
|
5,609
|
|
|||||
As of
December 31, 2016
and
January 2, 2016
, the weighted-average remaining contractual term of options outstanding with an exercise price less than the closing price of the Company’s common stock was
5.6
years and
5.5
years, respectively. As of
December 31, 2016
and
January 2, 2016
, the weighted-average remaining contractual term of options exercisable with an exercise price less than the closing price of the Company’s common stock was
3.9
years and
4
years, respectively.
A summary of unvested RSU award activity is presented below (in thousands) except for per share amounts:
|
Year ended
December 31, 2016 |
Year ended
January 2, 2016 |
Year ended
January 3, 2015 |
||||||||||||||||||
|
Units
|
Weighted Average Grant
Date Fair Value
|
Units
|
Weighted Average Grant
Date Fair Value
|
Units
|
Weighted Average Grant
Date Fair Value
|
|||||||||||||||
|
RSUs outstanding, beginning of period
|
2,703
|
|
$
|
41.45
|
|
—
|
|
$
|
—
|
|
—
|
|
$
|
—
|
|
|||||
|
Granted
|
6
|
|
43.09
|
|
2,703
|
|
41.45
|
|
—
|
|
—
|
|
||||||||
|
Canceled
|
—
|
|
—
|
|
—
|
|
—
|
|
—
|
|
—
|
|
||||||||
|
Expired
|
—
|
|
—
|
|
—
|
|
—
|
|
—
|
|
—
|
|
||||||||
|
Vested
|
(3
|
)
|
41.45
|
|
—
|
|
—
|
|
—
|
|
—
|
|
||||||||
|
RSUs outstanding, end of period
|
2,706
|
|
$
|
41.45
|
|
2,703
|
|
$
|
41.45
|
|
—
|
|
$
|
—
|
|
|||||
Approximately
2.7 million
of the total RSUs granted during the year ended January 2, 2016 were awarded to the Company’s Chairman and Chief Executive Officer in connection with the amendment and restatement of his employment agreement (see “Employment and Severance Agreements” in Note 15 to these consolidated financial statements for further details).
At
December 31, 2016
, an aggregate of
15.6 million
shares of common stock were reserved for future issuance under the 2007 Plan and prior equity incentive plans of which
4.0 million
shares were available for future grant under the 2007 Plan.
Valuation of Stock-Based Award Activity
The fair value of each RSU award is determined based on the closing price of the Company’s common stock on the grant date.
The Black-Scholes option pricing model is used to estimate the fair value of stock options granted under the Company’s share-based compensation plans. The range of assumptions used and the resulting weighted-average fair value of stock options granted at the date of grant were as follows:
F-
30
|
Year ended
December 31, 2016 |
Year ended
January 2, 2016 |
Year ended
January 3, 2015 |
|||
|
Risk-free interest rate
|
1.0% to 2.1%
|
1.3% to 1.9%
|
1.4% to 1.9%
|
||
|
Expected term
|
5.5 years to 5.7 years
|
5.5 years to 5.7 years
|
5.1 years to 5.5 years
|
||
|
Estimated volatility
|
29.8% to 35.7%
|
32.0% to 37.4%
|
31.7% to 36.5%
|
||
|
Expected dividends
|
0%
|
0%
|
0%
|
||
|
Weighted-average fair value of options granted
|
$13.64 per share
|
$12.20 per share
|
$7.85 per share
|
||
Risk-free interest rate.
The risk-free interest rate is based on the implied yield available on U.S. Treasury zero-coupon issues with a remaining term approximately equal to the expected term of the Company’s stock options.
Expected term.
The expected term represents the average period that the Company’s stock options are expected to be outstanding. The expected term is based on both the Company’s specific historical option exercise experience, as well as expected term information available from a peer group of companies with a similar vesting schedule.
Estimated volatility.
The estimated volatility is the amount by which the Company’s share price is expected to fluctuate during a period. The Company’s estimated volatilities for 2015, 2014 and 2013 are based on historical and implied volatilities of the Company’s share price over the expected term of the option.
Expected dividends.
The Board may from time to time declare, and the Company may pay, dividends on its outstanding shares in the manner and upon the terms and conditions provided by law. Any determination to declare and pay dividends will be made by the Board and will depend upon the Company’s results of operations, earnings, capital requirements, financial condition, business prospects, contractual restrictions and other factors deemed relevant by the Board. In the event a dividend is declared, there is no assurance with respect to the amount, timing or frequency of any such dividends. The dividend declared in 2012 was deemed to be a special dividend and there is no assurance that special dividends will be declared again during the expected term. Based on this uncertainty and unknown frequency, for the years ended
December 31, 2016
,
January 2, 2016
and
January 3, 2015
, no dividend rate was used in the assumptions to calculate the share-based compensation expense.
Estimated forfeiture rate.
The Company is required to develop an estimate of the number of stock options and RSUs that will be forfeited due to employee turnover. Adjustments in the estimated forfeiture rates can have a significant effect on the Company’s reported share-based compensation, as it recognizes the cumulative effect of the rate adjustments for all expense amortization in the period the estimated forfeiture rates were adjusted. The Company estimates and adjusts forfeiture rates based on a periodic review of recent forfeiture activity and expected future employee turnover. Adjustments in the estimated forfeiture rates could also cause changes in the amount of expense that it recognizes in future periods.
As of
December 31, 2016
, there was
$27.1 million
of total unrecognized share-based compensation expense related to unvested options granted or modified on or after January 1, 2006. That expense is expected to be recognized over a weighted-average period of
3.4
years as of
December 31, 2016
. The Company has elected to recognize share-based compensation expense on a straight-line basis over the requisite service period for the entire award. The total fair value of all options that vested during fiscal years
2016
,
2015
and
2014
aggregated
$10.6 million
,
$10.4 million
and
$11.2 million
, respectively. As of
December 31, 2016
, there was
$0.1 million
of total unrecognized compensation expense related to unvested RSUs that is expected to be recognized over a weighted average period of less than
1
year, excluding any contingent compensation expense related to certain RSUs that were granted to the Company’s Chairman and Chief Executive Officer in connection with the amendment and restatement of his employment agreement (see “Employment and Severance Agreements” in Note 15 to these consolidated financial statements for further details).
The aggregate intrinsic value is calculated as the difference between the market value of the Company’s common stock on the date of exercise or the respective period end, as appropriate, and the exercise price of the options. The aggregate intrinsic value of options outstanding, with an exercise price less than the closing price of the Company’s common stock, as of
December 31, 2016
was
$330.9 million
. The aggregate intrinsic value of options exercisable, with an exercise price less than the closing price of the Company’s common stock, as of
December 31, 2016
was
$204.9 million
. The aggregate intrinsic value of options exercised during the years ended
December 31, 2016
,
January 2, 2016
and
January 3, 2015
was
$57.0 million
,
$26.4 million
and
$6.6 million
, respectively.
The total income tax benefit recognized in the consolidated statements of operations for share-based compensation expense was
$16.2 million
,
$3.7 million
and
$3.7 million
for the years ended
December 31, 2016
,
January 2, 2016
and
January 3, 2015
, respectively. During the year ended
December 31, 2016
, the Company early adopted ASU 2016-09, which resulted in changes to the recognition of excess tax benefits for share-based compensation. Please see Note 2 - Summary of Significant Accounting
F-
31
Policies under the subheading “
Recently Adopted Accounting Pronouncements
” for additional information on the impact of such adoption.
The following table presents the total share-based compensation expense that is included in each functional line item of the consolidated statements of operations (in thousands):
|
Year ended
December 31, 2016 |
Year ended
January 2, 2016 |
Year ended
January 3, 2015 |
|||||||||
|
Cost of goods sold
|
$
|
355
|
|
$
|
348
|
|
$
|
436
|
|
||
|
Selling, general and administrative
|
9,443
|
|
8,139
|
|
8,812
|
|
|||||
|
Research and development
|
2,705
|
|
2,338
|
|
1,757
|
|
|||||
|
Total
|
$
|
12,503
|
|
$
|
10,825
|
|
$
|
11,005
|
|
||
15. Commitments and Contingencies
Leases
The Company leases certain facilities in North America, Europe and Asia under operating lease agreements expiring at various dates through
December 2026
. Some of these leases contain predetermined price escalations and in some cases renewal options. The Company recognizes the lease costs using a straight line method based on total lease payments. As of
December 31, 2016
and
January 2, 2016
, rent expense accrued in excess of the amount paid aggregated
$0.7 million
and
$0.2 million
, respectively, and is classified in other liabilities in the accompanying consolidated balance sheets. The Company also leases automobiles in the U.S. and Europe that are classified as operating leases and expire at various dates through
December 2026
. The majority of these leases are non-cancellable. The Company also has outstanding capital leases for office equipment that are non-cancellable.
Future minimum lease payments, including interest, under operating and capital leases for each of the following fiscal years ending on or about December 31 are (in thousands):
|
Fiscal year
|
Operating
Leases |
Capital
Leases |
Total
|
||||||||
|
2017
|
$
|
5,829
|
|
$
|
75
|
|
$
|
5,904
|
|
||
|
2018
|
5,486
|
|
—
|
|
5,486
|
|
|||||
|
2019
|
4,643
|
|
—
|
|
4,643
|
|
|||||
|
2020
|
2,598
|
|
—
|
|
2,598
|
|
|||||
|
2021
|
1,391
|
|
—
|
|
1,391
|
|
|||||
|
Thereafter
|
7,630
|
|
—
|
|
7,630
|
|
|||||
|
Total
|
$
|
27,577
|
|
$
|
75
|
|
$
|
27,652
|
|
||
On January 26, 2016, the Company entered into the Third Amendment to Lease with The Irvine Company LLC (Third Amendment) relating to the rental of space in a building located in Irvine, California. Pursuant to the terms of the Third Amendment, the Company’s current lease of certain premises will be terminated in exchange for the Company’s leasing of approximately
70,700
square feet of space in another building in Irvine, California, located near the Company’s new corporate headquarters (New Premises). The Third Amendment also extends the term of the original lease to the end of the month in which the
ten
-year anniversary of the date of commencement (Commencement Date) of the lease for the New Premises occurs. The Commencement Date for the New Premises was November 1, 2016.
On July 13, 2016, the Company entered into a Single-Tenant Lease with The Irvine Company LLC extending the rental of approximately
32,518
square feet of space in a building that was expected to be vacated in connection with the Third Amendment described above. The New Lease commenced December 1, 2016 and will continue in effect for a period of
ten
years until November 30, 2026. The Prior Lease terminated immediately prior to commencement of the New Lease.
Rental expense related to operating leases for the years ended
December 31, 2016
,
January 2, 2016
and
January 3, 2015
was
$5.3 million
,
$5.2 million
and
$6.1 million
, respectively. Included in the future capital lease payments as of
December 31, 2016
is interest aggregating less than
$0.1 million
.
F-
32
Employee Retirement Savings Plan
In 1996, the Company adopted the Masimo Retirement Savings Plan (the Plan), which is a 401(k) plan covering all of the Company’s full-time U.S. employees who meet certain eligibility requirements. In general, the Company matches an employee’s contribution up to
3%
of the employee’s compensation, subject to a maximum amount. The Company may also contribute to the Plan on a discretionary basis. The Company contributed
$1.9 million
,
$1.8 million
and
$1.7 million
to the Plan for the years ended
December 31, 2016
,
January 2, 2016
and
January 3, 2015
, respectively, all in the form of matching contributions.
In addition, the Company also sponsors various defined contribution plans in certain locations outside of the United States (Subsidiary Plans). For the years ended
December 31, 2016
,
January 2, 2016
and
January 3, 2015
, the Company contributed
$0.3 million
,
$0.3 million
and
$0.2 million
, respectively, to the Subsidiary Plans.
Employment and Severance Agreements
On November 4, 2015, the Company entered into an Amended and Restated Employment Agreement with Joe Kiani, the Company’s Chairman and Chief Executive Officer (the Restated Employment Agreement). The Restated Employment Agreement, among other things, eliminates the tax gross-up payments, “single trigger” change in control payments and certain survival provisions, as well as phases out the fixed annual stock option grants guaranteed to Mr. Kiani under his previous employment agreement. Pursuant to the terms of the Restated Employment Agreement, upon a “Qualifying Termination” (as defined in the Restated Employment Agreement including a change in control), Mr. Kiani will be entitled to receive a cash severance benefit equal to two times the sum of his then-current base salary and the average annual bonus paid to Mr. Kiani during the immediately preceding three years. In addition, upon a Qualifying Termination prior to 2018, Mr. Kiani will receive
2.7 million
shares of common stock (subject to adjustment for recapitalizations, stock splits, stock dividends and the like) upon the vesting of certain RSUs granted to Mr. Kiani in connection with the Restated Employment Agreement, and an additional cash payment of
$35.0 million
related to a Non-Competition and Confidentiality Agreement between Mr. Kiani and the Company (collectively, the Special Payment). For any Qualifying Termination occurring on or after January 1, 2018, the number of shares to be issued to Mr. Kiani pursuant to the RSUs and the cash payment will each be reduced by
10%
of the original amount each year so that after December 31, 2026, no Special Payment will be due to Mr. Kiani upon a Qualifying Termination. As of
December 31, 2016
, the expense related to the Special Payment that would be recognized in the Company’s consolidated financial statements upon the occurrence of a Qualifying Termination under the Restated Employment Agreement approximated
$146.9 million
.
As of
December 31, 2016
, the Company had severance plan participation agreements with
seven
of its executive officers. The participation agreements (Participation Agreements) are governed by the terms and conditions of the Company’s 2007 Severance Protection Plan, which became effective on July 19, 2007 and was amended effective December 31, 2008. Under the Participation Agreements, each executive officer may be entitled to receive certain salary, equity, medical and life insurance benefits if he is terminated by the Company without cause or terminates his employment for good reason under certain circumstances. The executive officers are also required to provide the Company with
six months
advance notice of their resignation under certain circumstances.
Cercacor Cross-Licensing Agreement Change in Control Provisions
The Company’s Cross-Licensing Agreement with Cercacor contains certain provisions that will go into effect upon a change in control (as defined in the Cross-Licensing Agreement) of the Company or Cercacor. Upon a change in control of the Company or Cercacor: (i) all rights to the “Masimo” trademark will be assigned to Cercacor if the surviving or acquiring entity ceases to use “Masimo” as a company name and trademark; (ii) the option to license technology developed by Cercacor for use in blood glucose monitoring will be deemed automatically exercised and a $2.5 million license fee for this technology will become immediately payable to Cercacor; and (iii) the minimum aggregate annual royalties payable to Cercacor for carbon monoxide, methemoglobin, fractional arterial oxygen saturation, hemoglobin and/or glucose measurements will increase to $15.0 million per year until the exclusivity period of the agreement ends, plus up to $2.0 million for each additional vital sign measurement with no maximum ceiling for non-vital sign measurements.
Purchase Commitments
Pursuant to contractual obligations with vendors, the Company had
$76.8 million
of purchase commitments as of
December 31, 2016
, which are expected to be fulfilled within one year. These purchase commitments were made for certain inventory items to secure better pricing and to ensure the Company will have raw materials when necessary.
F-
33
Other
Contractual Commitments
In the normal course of business, the Company may provide bank guarantees to support government hospital tenders in certain foreign jurisdictions. As of
December 31, 2016
, there were approximately
$0.5 million
of such bank guarantees outstanding, the majority of which relates to performance obligations with respect to certain government tenders.
Concentrations of Risk
The Company is exposed to credit loss for the amount of cash deposits with financial institutions in excess of federally insured limits. As of
December 31, 2016
, the Company had approximately
$306.0 million
of cash and cash equivalents, of which
$2.9 million
was covered by either the U.S. Federal Deposit Insurance Corporation limit or foreign countries deposit insurance organizations. The Company invests its excess cash deposits in certificates of deposit, money market and time deposit accounts with major financial institutions.
While the Company and its contract manufacturers rely on sole source suppliers for certain components, steps have been taken to minimize the impact of a shortage or stoppage of shipments, such as maintaining a safety stock of inventory and designing products that may be easily modified to use a different component. However, there can be no assurance that a shortage or stoppage of shipments of the materials or components that the Company purchases will not result in a delay in production or adversely affect the Company’s business.
The Company’s ability to sell its products to U.S. hospitals depends in part on its relationships with GPOs. Many existing and potential customers for the Company’s products become members of GPOs. GPOs negotiate pricing arrangements and contracts, sometimes exclusively, with medical supply manufacturers and distributors, and these negotiated prices are made available to a GPO’s affiliated hospitals and other members. For the years ended
December 31, 2016
,
January 2, 2016
and
January 3, 2015
, revenue from the sale of the Company’s pulse oximetry products to customers affiliated with GPOs amounted to
$375.0 million
,
$337.4 million
and
$309.9 million
, respectively.
For the years ended
December 31, 2016
,
January 2, 2016
and
January 3, 2015
, the Company had sales through
two
just-in-time distributors, which in total represented approximately
14.0%
and
12.8%
,
14.6%
and
11.7%
, and
14.0%
and
11.1%
of total revenue, respectively. As of
December 31, 2016
, these
two
just-in-time distributors represented
7.5%
and
5.6%
of the accounts receivable balance, respectively, with another customer who represented
13.6%
of the accounts receivable balance. As of
January 2, 2016
,
two
different just-in-time distributors represented
5.5%
and
5.3%
of the accounts receivable balance, respectively, and another customer represented
10.5%
of the accounts receivable balance.
For the years ended
December 31, 2016
,
January 2, 2016
and
January 3, 2015
, the Company recorded
$30.8 million
,
$30.8 million
and
$29.9 million
, respectively, in royalty revenues from Medtronic pursuant to a settlement agreement and amendments. The current royalty rate is
7.75%
and pursuant to the terms of the Third Amendment to Settlement Agreement and Release of Claims effective September 2016, Medtronic agreed to continue paying royalties through October 6, 2018, after which no more royalties will be due.
Litigation
On February 3, 2009, the Company filed a patent infringement suit in the U.S. District Court for the District of Delaware against Philips Electronics North America Corporation and Philips Medizin Systeme Böblingen GmbH (collectively, Philips) related to Philips’ FAST pulse oximetry technology and certain of Philips’ patient monitors. On June 15, 2009, Philips answered the Company’s complaint and Philips Electronics North America Corporation filed antitrust and patent infringement counterclaims against the Company, as well as counterclaims seeking declaratory judgments of invalidity of the patents asserted by the Company against Philips. On July 9, 2009, the Company filed its answer denying Philips’ counterclaims and asserting various defenses. The Company also asserted counterclaims against Philips for fraud and intentional interference with prospective economic advantage and for declaratory judgments of noninfringement and invalidity with respect to the patents asserted by Philips against the Company. Philips later added a claim for infringement of
one
additional patent. Subsequently, the Court bifurcated Philips’ antitrust claims and its patent misuse defense, as well as stayed the discovery phase on those claims pending trial in the patent case. In addition, the Company asserted additional patents in 2012, and the Court ordered that these patents and some of the originally asserted patents be tried in a second phase. On May 23, 2014, Philips filed a motion for leave to amend its answer and counterclaims to allege inequitable conduct. The Court granted Philips’ motion for leave to amend. A jury trial commenced on September 15, 2014 with respect to
two
of the Company’s patents and
one
of Philips’ patents. On October 1, 2014, the jury determined that both of the Company’s patents were valid and that the damages amount for Philips’ infringement was
$466.8 million
. The jury also determined that the Company did not infringe the Philips patent. Philips indicated that it intended to appeal the damages award once a final judgment was rendered in the case.
F-
34
On September 18, 2015, the Court set a schedule for the trials related to the Company’s second phase patents against Philips and Philips’ antitrust counterclaims and patent misuse defense, with both trials scheduled to take place in the first quarter of 2017. On November 16, 2015, the Company asserted three antitrust claims against Philips. On December 9, 2015, the Court dismissed with prejudice Philips’ sole remaining patent infringement claim against the Company. On January 4, 2016, the Court granted Philips’ motion to strike the Company’s antitrust counterclaims, ruling that the Company must bring these claims in a separate litigation. On March 4, 2016, the Company filed an additional suit against Philips alleging antitrust violations and patent infringement in the District of Delaware.
On November 5, 2016, the Company entered into the Philips Settlement Agreement, pursuant to which Philips N.V. agreed to pay the Company
$300 million
. Philips N.V. and its affiliates (collectively, the Philips Group) and the Company (collectively with the Philips Group, the Parties) agreed to dismiss with prejudice all pending legal disputes between the Parties, including the patent infringement and antitrust lawsuits described above, as well as other contractual disputes, and agreed not to sue each other for patent infringement for certain of each other’s products. In addition, the Parties agreed to work together to integrate the Company’s technologies into additional Philips Group products, and to jointly develop certain other products. Each of the Parties has additional obligations to the other in the event that such party does not meet certain objectives under the settlement agreement. The settlement agreement also contains rainbow
®
parameter pricing and related terms. The Parties further agreed to undertake a joint marketing program to promote rainbow
®
adoption with Philips Group products.
In April 2011, the Company was informed by the United States Attorney’s Office for the Central District of California, Civil Division, that a qui tam complaint had been filed against the Company in the U.S. District Court for the Central District of California by
three
of the Company’s former physician office sales representatives. The qui tam complaint alleged, among other things, that the Company’s noninvasive hemoglobin products failed to meet their accuracy specifications, and that the Company misled the U.S. Food and Drug Administration and customers regarding the accuracy of the products. In November 2011, the United States declined to intervene in the case, and in October 2013, the District Court granted summary judgment in favor of the Company. The former sales representatives appealed the District Court’s decision and an argument on the appeal was held in the Ninth Circuit Court of Appeals on February 1, 2016.
On February 19, 2016, the Ninth Circuit Court of Appeals affirmed the summary judgment of the District Court.
In September 2011,
two
of the same former sales representatives filed employment-related claims against the Company in arbitration also stemming from their allegations regarding the Company’s noninvasive hemoglobin products. On January 16, 2014, the Company was notified that the arbitrator awarded the plaintiffs approximately
$5.4 million
in damages (the Arbitration Award). The Company challenged the Arbitration Award in the U.S. District Court for the Central District of California, and on April 3, 2014, the District Court vacated the award. The former sales representatives appealed the District Court’s decision, and the appeal argument was held in the Ninth Circuit Court of Appeals on February 1, 2016. On February 19, 2016, the Ninth Circuit Court of Appeals reversed the decision of the District Court vacating the award, and remanded the case to the District Court with instructions to confirm the Arbitration Award. On March 23, 2016, the District Court entered final judgment confirming the Arbitration Award, and on April 8, 2016 the Company remitted
$6.2 million
to the plaintiffs in full payment of the Arbitration Award and related interest. On May 18, 2016, the Company filed a petition for a writ of certiorari with the United States Supreme Court seeking reversal of the decision of the Ninth Circuit Court of Appeals. On October 3, 2016, the Supreme Court denied such petition.
On July 20, 2016, the Company was notified that its insurance carrier was seeking reimbursement of certain defense costs previously advanced by the carrier in light of the decision by the Ninth Circuit Court of Appeals reinstating the Arbitration Award. The Company believes it has good and substantial grounds to dispute the coverage determination of the insurance carrier, but there is no guarantee that the Company will prevail. The Company has not recorded a charge related to this insurance coverage dispute and is unable to determine whether any loss will ultimately occur. However, the Company estimates that the potential incremental loss related to this insurance coverage dispute would approximate
$2.6 million
plus potential interest at the rate of
10%
per annum from the date such payments were advanced by the insurance carrier.
On January 2, 2014, a putative class action complaint was filed against the Company in the U.S. District Court for the Central District of California by Physicians Healthsource, Inc. The complaint alleges that the Company sent unsolicited facsimile advertisements in violation of the Junk Fax Protection Act of 2005 and related regulations. The complaint seeks
$500
for each alleged violation, treble damages if the District Court finds the alleged violations to be knowing, plus interest, costs and injunctive relief. On April 14, 2014, the Company filed a motion to stay the case pending a decision on a related petition filed by the Company with the Federal Communications Commission (FCC). On May 22, 2014, the District Court granted the motion and stayed the case pending a ruling by the FCC on the petition. On October 30, 2014, the FCC granted some of the relief and denied some of the relief requested in the Company’s petition. Both parties appealed the FCC’s decision on the petition.
F-
35
On November 25, 2014, the District Court granted the parties’ joint request that the stay remain in place pending a decision on the appeal. The appellate hearing in the D.C. Circuit Court of Appeals was held on November 8, 2016, and the parties are awaiting a decision. The Company believes it has good and substantial defenses to the claims, but there is no guarantee that the Company will prevail. The Company is unable to determine whether any loss will ultimately occur or to estimate the range of such loss; therefore, no amount of loss has been accrued by the Company in the accompanying consolidated financial statements.
On January 31, 2014, an amended putative class action complaint was filed against the Company in the U.S. District Court for the Northern District of Alabama by and on behalf of
two
participants in the Surfactant, Positive Pressure, and Oxygenation Randomized Trial at the University of Alabama. On April 21, 2014, a further amended complaint was filed adding a third participant. The complaint alleges product liability and negligence claims in connection with pulse oximeters the Company modified and provided at the request of study investigators for use in the trial. On August 13, 2015, the U.S. District Court for the Northern District of Alabama granted summary judgment in favor of the Company on all claims. The plaintiffs have appealed the U.S. District Court for the Northern District of Alabama’s decision. The appellate hearing before the Eleventh Circuit Court of Appeals was held on December 13, 2016, and the parties are awaiting a decision. The Company is unable to determine whether any loss will ultimately occur or to estimate the range of such loss; therefore, no amount of loss has been accrued by the Company in the accompanying consolidated financial statements.
On October 21, 2015, Medtronic filed
three
separate
inter partes
review petitions (IPR Petitions) with the Patent Trial and Appeal Board (PTAB) of the U.S. Patent and Trademark Office (PTO), challenging several of the claims of the Company’s U.S. Patent Nos. 7,496,393 (the ‘393 Patent), titled “Signal processing apparatus”, which expired in September 2016, and 8,560,034 (the ‘034 Patent), also titled “Signal processing apparatus”, which expires in October 2018. On April 27, 2016, the PTAB denied Medtronic’s IPR Petitions with respect to the ‘034 Patent. On April 28, 2016, the PTAB granted Medtronic’s IPR Petition for review of certain claims of the ‘393 Patent, and denied Medtronic’s IPR Petition for review of other claims of the ‘393 Patent. On September 1, 2016, the Company entered into the Third Amendment to the Settlement Agreement and Release of Claims (Settlement Agreement) with Cercacor and Medtronic, Covidien LP, Nellcor Puritan Bennett LLC and Covidien Holding Inc. (collectively, Medtronic Parties), pursuant to which the Company, Cercacor and the Medtronic Parties agreed not to assert, prior to December 31, 2019: (1) that any of the intellectual property rights of another party are invalid, unpatentable or unenforceable, or (2) any claim of patent infringement against another party based on products of such party that were commercially available as of September 1, 2016. The Company and the Medtronic Parties also agreed to jointly request termination of the IPR petition for review of the claims of the ‘393 Patent, and such IPR petition was dismissed by the PTO on September 23, 2016. Furthermore, the Medtronic Parties agreed to continue paying the Company royalties through October 6, 2018, after which no more royalties will be due under the Settlement Agreement.
From time to time, the Company may be involved in other litigation and investigations relating to claims and matters arising out of its operations in the normal course of business. The Company believes that it currently is not a party to any other legal proceedings which, individually or in the aggregate, would have a material adverse effect on its consolidated financial position, results of operations or cash flows.
16. Segment Information and Enterprise Reporting
The Company’s chief decision maker, the Chief Executive Officer, reviews financial information presented on a consolidated basis, accompanied by disaggregated information about revenues by geographic region for purposes of making operating decisions and assessing financial performance. Accordingly, the Company considers itself to be in a single reporting segment, specifically noninvasive patient monitoring solutions and related products. The Company does not assess the performance of its geographic regions on other measures of income or expense, such as depreciation and amortization, operating income or net income including noncontrolling interests. In addition, the Company’s assets are primarily located in the U.S.
F-
36
The following schedule presents an analysis of the Company’s product revenue based upon the geographic area to which the product was shipped (in thousands):
|
Year ended
December 31, 2016 |
Year ended
January 2, 2016 |
Year ended
January 3, 2015 |
||||||||||||||||||
|
Geographic area by destination
|
||||||||||||||||||||
|
United States
|
$
|
465,588
|
|
70.1
|
%
|
$
|
421,628
|
|
70.3
|
%
|
$
|
380,232
|
|
68.3
|
%
|
|||||
|
Europe, Middle East and Africa
|
112,273
|
|
16.9
|
|
105,323
|
|
17.6
|
|
100,747
|
|
18.1
|
|
||||||||
|
Asia and Australia
|
65,955
|
|
10.0
|
|
55,675
|
|
9.3
|
|
57,951
|
|
10.4
|
|
||||||||
|
North and South America (excluding United States)
|
20,030
|
|
3.0
|
|
$
|
16,708
|
|
2.8
|
|
$
|
17,834
|
|
3.2
|
|
||||||
|
Total Product Revenue
|
$
|
663,846
|
|
100
|
%
|
$
|
599,334
|
|
100
|
%
|
$
|
556,764
|
|
100.0
|
%
|
|||||
The Company’s consolidated long-lived assets (total non-current assets excluding deferred taxes, goodwill and intangible assets) by geographic area are:
|
Year ended
December 31, 2016 |
Year ended
January 2, 2016 |
Year ended
January 3, 2015 |
||||||||||||||||||
|
Long-lived assets by geographic area
|
||||||||||||||||||||
|
United States
|
$
|
216,784
|
|
96.3
|
%
|
$
|
203,553
|
|
96.8
|
%
|
$
|
170,117
|
|
96.2
|
%
|
|||||
|
International
|
8,383
|
|
3.7
|
%
|
6,770
|
|
3.2
|
|
6,805
|
|
3.8
|
|
||||||||
|
Total
|
$
|
225,167
|
|
100.0
|
%
|
$
|
210,323
|
|
100.0
|
%
|
$
|
176,922
|
|
100.0
|
%
|
|||||
The Company possesses licenses from the U.S. Treasury Department’s Office of Foreign Assets Control for conducting business with certain countries identified by the State Department as state sponsors of terrorism. Although the Company does not have any subsidiaries, affiliates, offices, investments or employees in any country identified as a state sponsor of terrorism, the Company has conducted an immaterial amount of business with distributors in Iran, Sudan and Syria relating to the sale of products during the prior two fiscal years. The Company does not believe that these activities are material to its business, financial condition or results of operations.
17. Income Taxes
The components of income before provision for income taxes are as follows (in thousands):
|
Year ended
December 31, 2016 |
Year ended
January 2, 2016 |
Year ended
January 3, 2015 |
|||||||||
|
United States
|
$
|
320,702
|
|
$
|
87,762
|
|
$
|
69,282
|
|
||
|
Foreign
|
97,639
|
|
28,583
|
|
32,759
|
|
|||||
|
Total
|
$
|
418,341
|
|
$
|
116,345
|
|
$
|
102,041
|
|
||
F-
37
The following table presents the current and deferred provision (benefit) for income taxes (in thousands):
|
Year ended
December 31, 2016 |
Year ended
January 2, 2016 |
Year ended
January 3, 2015 |
|||||||||
|
Current:
|
|||||||||||
|
Federal
|
$
|
99,533
|
|
$
|
31,983
|
|
$
|
22,553
|
|
||
|
State
|
6,922
|
|
2,388
|
|
2,736
|
|
|||||
|
Foreign
|
5,815
|
|
2,448
|
|
2,709
|
|
|||||
|
112,270
|
|
36,819
|
|
27,998
|
|
||||||
|
Deferred:
|
|||||||||||
|
Federal
|
2,982
|
|
(900
|
)
|
342
|
|
|||||
|
State
|
2,331
|
|
(1,206
|
)
|
(811
|
)
|
|||||
|
Foreign
|
92
|
|
132
|
|
149
|
|
|||||
|
5,405
|
|
(1,974
|
)
|
(320
|
)
|
||||||
|
Total
|
$
|
117,675
|
|
$
|
34,845
|
|
$
|
27,678
|
|
||
Included in the fiscal
2016
,
2015
and 2014 current tax provisions are net increases of
$6.1 million
,
$0.6 million
and
$1.1 million
, respectively, for tax and accrued interest related to uncertain tax positions for each fiscal year.
The reconciliation of the U.S. federal statutory tax rate to the Company’s effective tax rate is as follows:
|
Year ended
December 31, 2016 |
Year ended
January 2, 2016 |
Year ended
January 3, 2015 |
||||||
|
Statutory regular federal income tax rate
|
35.0
|
%
|
35.0
|
%
|
35.0
|
%
|
||
|
State provision, net of federal benefit
|
1.4
|
|
0.7
|
|
1.2
|
|
||
|
Nondeductible items
|
0.8
|
|
1.7
|
|
1.3
|
|
||
|
Foreign income taxed at different rates
|
(5.6
|
)
|
(6.3
|
)
|
(8.2
|
)
|
||
|
Tax credits
|
(0.5
|
)
|
(1.7
|
)
|
(1.5
|
)
|
||
|
Change in federal valuation allowance
|
—
|
|
0.4
|
|
(0.1
|
)
|
||
|
Excess stock based compensation
|
(3.0
|
)
|
—
|
|
—
|
|
||
|
Other
|
—
|
|
0.2
|
|
(0.6
|
)
|
||
|
Total
|
28.1
|
%
|
30.0
|
%
|
27.1
|
%
|
||
F-
38
The components of the deferred tax assets are as follows (in thousands):
|
December 31,
2016 |
January 2,
2016 |
||||||
|
Deferred tax assets:
|
|||||||
|
Tax credits
|
$
|
802
|
|
$
|
4,683
|
|
|
|
Deferred revenue
|
5,393
|
|
3,994
|
|
|||
|
Accrued liabilities
|
16,244
|
|
20,817
|
|
|||
|
Share-based compensation
|
18,680
|
|
20,688
|
|
|||
|
Other
|
1,902
|
|
2,416
|
|
|||
|
Total
|
43,021
|
|
52,598
|
|
|||
|
Valuation allowance
|
—
|
|
(4,196
|
)
|
|||
|
Total deferred tax assets
|
43,021
|
|
48,402
|
|
|||
|
Deferred tax liabilities:
|
|||||||
|
Property and equipment
|
(2,691
|
)
|
—
|
|
|||
|
State taxes and other
|
(1,695
|
)
|
(4,276
|
)
|
|||
|
Total deferred tax liabilities
|
(4,386
|
)
|
(4,276
|
)
|
|||
|
Net deferred tax assets
|
$
|
38,635
|
|
$
|
44,126
|
|
|
As of
December 31, 2016
, the Company has
$0.1 million
of net operating losses from various states, which will begin to expire in 2028, all of which will be recorded in equity when realized. The Company has state research and development tax credits of
$2.6 million
that will carry forward indefinitely. Additionally, the Company has
$0.4 million
of investment tax credit on research and development expenditures from its operations in Canada that will begin to expire in 2031. The Company believes that it is more likely than not that the deferred tax assets related to these carryforwards will be realized. In making this determination, the Company considered all available positive and negative evidence, including scheduled reversals of liabilities, projected future taxable income, tax planning strategies and recent financial performance.
As a result of certain business and employment actions undertaken by the Company, income earned in a certain European country is subject to a reduced tax rate through 2018 as the Company has met certain employment thresholds. For the years ended
December 31, 2016
,
January 2, 2016
and
January 3, 2015
, the estimated income tax benefit related to such business arrangement was
$4.6 million
,
$1.3 million
and
$1.6 million
, respectively, and favorably impacted net income per diluted share by
$0.09
,
$0.02
and
$0.03
, respectively.
As of
December 31, 2016
, the Company has not provided for deferred income taxes on approximately
$198.2 million
of cumulative undistributed earnings of certain foreign subsidiaries, because such earnings are intended to be permanently reinvested in those operations. If such earnings were distributed, the Company would accrue estimated additional income tax expense of
$62.5 million
.
The following is a tabular reconciliation of the total amounts of unrecognized tax benefits (in thousands):
|
Year ended
December 31, 2016 |
Year ended
January 2, 2016 |
||||||
|
Unrecognized tax benefits (gross), beginning of period
|
$
|
8,875
|
|
$
|
8,024
|
|
|
|
Amounts related to Cercacor from prior year
|
(277
|
)
|
—
|
|
|||
|
Increase from tax positions in prior period
|
143
|
|
131
|
|
|||
|
Increase from tax positions in current period
|
6,437
|
|
1,616
|
|
|||
|
Settlements
|
(296
|
)
|
—
|
|
|||
|
Lapse of statute of limitations
|
(388
|
)
|
(896
|
)
|
|||
|
Unrecognized tax benefits (gross), end of period
|
$
|
14,494
|
|
$
|
8,875
|
|
|
The amount of unrecognized benefits which, if ultimately recognized, could favorably affect the tax rate in a future period was
$13.1 million
and
$7.2 million
as of
December 31, 2016
and
January 2, 2016
, respectively. It is reasonably possible that the amount of unrecognized tax benefits in various jurisdictions may change in the next
12 months
due to the expiration of statutes of limitation and audit settlements.
F-
39
However, due to the uncertainty surrounding the timing of these events, an estimate of the change within the next
12 months
cannot be made at this time. For the years ended
December 31, 2016
,
January 2, 2016
and
January 3, 2015
, the Company accrued
$0.1 million
,
$0.2 million
and less than
$0.1 million
, respectively, for interest and penalties related to unrecognized tax benefits as part of income tax expense. Total accrued interest and penalties related to unrecognized tax benefits as of
December 31, 2016
and
January 2, 2016
were
$1.2 million
and
$1.1 million
, respectively.
The Company conducts business in multiple jurisdictions, and as a result, one or more of the Company’s subsidiaries files income tax returns in the U.S. federal, various state, local and foreign jurisdictions. The Company has concluded all U.S. federal income tax matters for years through 2011. The Company’s 2012 income tax return is currently under examination by the U.S. Internal Revenue Service. All material state, local and foreign income tax matters have been concluded for years through 2009. The Company does not believe that the results of any tax authority examination would have a significant impact on its financial statements.
18. Quarterly Financial Data (unaudited)
The healthcare business in the United States and overseas is typically subject to quarterly fluctuations in hospital and other alternative care admissions. Although this did not occur during fiscal year 2015, the Company’s third fiscal quarter revenues have historically experienced a sequential decline from its second fiscal quarter revenues. The Company believes this is primarily due to the summer vacation season during which people tend to avoid elective procedures. Another factor affecting the seasonality of the Company’s quarterly revenues is the traditional “flu season” that often increases hospital and acute care facility admissions in the first and fourth calendar quarters. Because the Company’s non-sales variable operating expenses often do not fluctuate in the same manner as its quarterly product sales, this may cause fluctuations in the Company’s quarterly operating income that are disproportionate to fluctuations in its quarterly revenue.
The following tables contain selected unaudited consolidated statements of operations data for each quarter of
2016
and
2015
(in thousands, except per share data):
|
Quarters Ended
|
||||||||||||||||
|
Fiscal 2016
|
April 2,
2016 |
July 2,
2016 |
October 1,
2016 |
December 31,
2016 |
||||||||||||
|
Total revenue
|
$
|
171,167
|
|
$
|
172,636
|
|
$
|
167,621
|
|
$
|
183,201
|
|
||||
|
Gross profit
|
114,213
|
|
115,135
|
|
110,122
|
|
124,329
|
|
||||||||
|
Operating income
|
37,337
|
|
36,429
|
|
36,604
|
|
310,400
|
|
(1)
|
|||||||
|
Net income attributable to Masimo Corporation stockholders
|
27,577
|
|
30,023
|
|
27,773
|
|
215,293
|
|
(2)
|
|||||||
|
Net income per share attributable to Masimo Corporation stockholders:
|
||||||||||||||||
|
Basic
(3)
|
$
|
0.56
|
|
$
|
0.61
|
|
$
|
0.56
|
|
$
|
4.31
|
|
||||
|
Diluted
(3)
|
$
|
0.53
|
|
$
|
0.57
|
|
$
|
0.52
|
|
$
|
3.97
|
|
||||
|
(1)
On November 5, 2016, the Company entered into the Philips Settlement Agreement, pursuant to which Philips N.V. agreed to pay the Company $300 million. Per the terms of the agreement, $270 million of this settlement is included within Operating income for the quarter ended December 31, 2016. See Note 2 - Summary of Significant Accounting Policies under the subheading “
Litigation Costs and Contingencies
” and Note 15 - Commitments and Contingencies under the subheading “
Litigation
” for additional information on the Phillips Settlement Agreement.
|
||||||||||||||||
|
(2)
The Company early adopted Accounting Standards Update No. 2016-09,
Compensation-Stock Compensation (Topic 718): Improvements to Employee Share-Based Payment Accounting
(ASU 2016-09) during the quarter ended April 2, 2016. The early adoption of ASU 2016-09 increased net income for the quarters ended April 2, 2016, July 2, 2016, October 1, 2016 and December 31, 2016 by $1.0 million, $4.1 million, $2.6 million and $5.2 million, respectively.
|
||||||||||||||||
|
(3)
Due to the significant impact of the Philips Settlement Agreement on the fourth quarter results, the sum of the basic and diluted earnings per share numbers for each quarter will not equal the basic and diluted earnings per share number for the entire year.
|
||||||||||||||||
F-
40
|
Quarters Ended
|
||||||||||||||||
|
Fiscal 2015
|
April 4,
2015 |
July 4,
2015 |
October 3,
2015 |
January 2,
2016 |
||||||||||||
|
Total revenue
|
$
|
154,537
|
|
$
|
155,726
|
|
$
|
152,575
|
|
$
|
167,273
|
|
||||
|
Gross profit
|
103,105
|
|
102,901
|
|
102,232
|
|
101,745
|
|
||||||||
|
Operating income
|
27,377
|
|
27,841
|
|
28,140
|
|
36,892
|
|
(2)
|
|||||||
|
Net income attributable to Masimo Corporation stockholders
|
20,523
|
|
19,351
|
|
19,325
|
|
24,101
|
|
||||||||
|
Net income per share attributable to Masimo Corporation stockholders:
|
||||||||||||||||
|
Basic
|
$
|
0.39
|
|
$
|
0.38
|
|
$
|
0.38
|
|
$
|
0.48
|
|
||||
|
Diluted
|
$
|
0.38
|
|
$
|
0.36
|
|
$
|
0.36
|
|
$
|
0.46
|
|
||||
|
(2)
On November 16, 2015, we entered into a Settlement Agreement with Shenzhen Mindray Biomedical Electronics Co., Ltd. and certain of its affiliates (collectively, Mindray), pursuant to which Mindray agreed to pay the Company $25 million, which has been included within Operating income for the quarter ended January 2, 2016.
|
||||||||||||||||
F-
41
Schedule II
|
MASIMO CORPORATION
VALUATION AND QUALIFYING ACCOUNTS
Years ended December 31, 2016, January 2, 2016 and January 3, 2015
(in thousands)
|
||||||||||||||||
|
Description
|
Balance at
beginning of period
|
Additions charged to
expense and other accounts
|
Amounts charged
against reserve
|
Balance at
end of period
|
||||||||||||
|
Year ended December 31, 2016
|
||||||||||||||||
|
Allowance for doubtful accounts
|
$
|
1,967
|
|
$
|
259
|
|
$
|
(528
|
)
|
$
|
1,698
|
|
||||
|
Sales returns, allowance and reserves
|
710
|
|
2,320
|
|
(2,425
|
)
|
605
|
|
||||||||
|
Valuation allowance on deferred tax asset
|
4,196
|
|
—
|
|
(4,196
|
)
|
—
|
|
||||||||
|
Year ended January 2, 2016
|
||||||||||||||||
|
Allowance for doubtful accounts
|
1,890
|
|
342
|
|
(265
|
)
|
1,967
|
|
||||||||
|
Sales returns, allowance and reserves
|
472
|
|
2,621
|
|
(2,383
|
)
|
710
|
|
||||||||
|
Valuation allowance on deferred tax asset
|
3,365
|
|
831
|
|
—
|
|
4,196
|
|
||||||||
|
Year ended January 3, 2015
|
||||||||||||||||
|
Allowance for doubtful accounts
|
1,833
|
|
583
|
|
(526
|
)
|
1,890
|
|
||||||||
|
Sales returns, allowance and reserves
|
429
|
|
1,832
|
|
(1,789
|
)
|
472
|
|
||||||||
|
Valuation allowance on deferred tax asset
|
3,563
|
|
—
|
|
(198
|
)
|
3,365
|
|
||||||||
F-
42
TABLE OF CONTENTS
Part IItem 1. BusinessItem 1A. Risk FactorsItem 1B. Unresolved Staff CommentsItem 2. PropertiesItem 3. Legal ProceedingsItem 4. Mine Safety DisclosuresPart IIItem 5. Market For Registrant S Common Equity, Related Stockholder Matters and Issuer Purchases Of Equity SecuritiesItem 6. Selected Financial DataItem 7. Management S Discussion and Analysis Of Financial Condition and Results Of OperationsItem 7A. Quantitative and Qualitative Disclosures About Market RiskItem 8. Financial Statements and Supplementary DataItem 9. Changes in and Disagreements with Accountants on Accounting and Financial DisclosureItem 9A. Controls and ProceduresItem 9B. Other InformationPart IIIItem 10. Directors, Executive Officers and Corporate GovernanceItem 11. Executive CompensationItem 12. Security Ownership Of Certain Beneficial Owners and Management and Related Stockholder MattersItem 13. Certain Relationships and Related Transactions and Director IndependenceItem 14. Principal Accounting Fees and ServicesPart IVItem 15. Exhibits, Financial Statement SchedulesItem 16. Form 10-k Summary