MATTEL INC /DE/
10-Ks and 10-Qs
|
|
|
|
|
|
|
|
|
|
|
|
|
|
|
|
|
|
|
|
|
|
|
|
|
|
|
|
|
|
|
|
|
|
|
|
|
|
|
|
|
|
|
|
|
|
|
|
|
|
|
|
|
|
|
|
|
|
|
UNITED STATES
SECURITIES AND EXCHANGE COMMISSION
Washington, D.C. 20549
________________________________________________________
FORM 10-K
(Mark One)
|
ý
|
ANNUAL REPORT PURSUANT TO SECTION 13 OR 15(d) OF THE SECURITIES EXCHANGE ACT OF 1934
|
|
For the fiscal year ended December 31, 2016
|
|
or
|
¨
|
TRANSITION REPORT PURSUANT TO SECTION 13 OR 15(d) OF THE SECURITIES EXCHANGE ACT OF 1934
|
|
For the transition period from to
|
|
Commission File Number 001-05647
________________________________________________________
MATTEL, INC.
(Exact name of registrant as specified in its charter)
|
Delaware
|
|
95-1567322
|
|
(State or other jurisdiction of incorporation or organization)
|
|
(I.R.S. Employer Identification No.)
|
333 Continental Blvd.
El Segundo, CA 90245-5012
(Address of principal executive offices)
(310) 252-2000
(Registrant’s telephone number)
Securities registered pursuant to Section 12(b) of the Act:
|
Title of each class
|
|
Name of each exchange on which registered
|
|
Common Stock, $1.00 par value
|
|
The NASDAQ Global Select Market
|
________________________________________________________
Securities registered pursuant to Section 12(g) of the Act:
NONE
________________________________________________________
Indicate by check mark if the registrant is a well-known seasoned issuer, as defined in Rule 405 of the Securities Act. Yes
ý
No
¨
Indicate by check mark whether the registrant is not required to file reports pursuant to Section 13 or 15(d) of the Act. Yes
¨
No
ý
Indicate by check mark whether the registrant (1) has filed all reports required to be filed by Section 13 or 15(d) of the Securities Exchange Act of 1934 during the preceding 12 months (or for such shorter period that the registrant was required to file such reports), and (2) has been subject to such filing requirements for the past 90 days. Yes
ý
No
¨
Indicate by check mark whether the registrant has submitted electronically and posted on its corporate Website, if any, every Interactive Data File required to be submitted and posted pursuant to Rule 405 of Regulations S-T(§232.405 of this chapter) during the preceding 12 months (or for such shorter period that the registrant was required to submit and post such files). Yes
ý
No
¨
Indicate by check mark if disclosure of delinquent filers pursuant to Item 405 of Regulation S-K (§229.405 of this chapter) is not contained herein, and will not be contained, to the best of registrant’s knowledge, in definitive proxy or information statements incorporated by reference in Part III of this Form 10-K or any amendment of this Form 10-K.
¨
Indicate by check mark whether registrant is a large accelerated filer, an accelerated filer, a non-accelerated filer, or a smaller reporting company. See definitions of “large accelerated filer,” “accelerated filer,” and “smaller reporting company” in Rule 12b-2 of the Exchange Act.
Large accelerated filer
ý
Accelerated filer
¨
Non-accelerated filer
¨
Smaller reporting company
¨
Indicate by check mark whether registrant is a shell company (as defined in Rule 12b-2 of the Act). Yes
¨
No
ý
The aggregate market value of the voting and non-voting common equity held by non-affiliates of the registrant was
$10,657,561,740
based upon the closing market price as of the close of business June 30,
2016
, the last business day of the registrant’s most recently completed second fiscal quarter.
Number of shares outstanding of registrant’s common stock, $1.00 par value, as of
February 10, 2017
:
342,445,392
shares
DOCUMENTS INCORPORATED BY REFERENCE
Portions of the Mattel, Inc. 2017 Proxy Statement, to be filed with the Securities and Exchange Commission (“SEC”) within 120 days after the close of the registrant’s fiscal year (incorporated into Part III).
MATTEL, INC. AND SUBSIDIARIES
|
|
|
Page
|
|
PART I
|
||
|
Item 1.
|
||
|
Item 1A.
|
||
|
Item 1B.
|
||
|
Item 2.
|
||
|
Item 3.
|
||
|
Item 4.
|
||
|
PART II
|
||
|
Item 5.
|
||
|
Item 6.
|
||
|
Item 7.
|
||
|
Item 7A.
|
||
|
Item 8.
|
||
|
Item 9.
|
||
|
Item 9A.
|
||
|
Item 9B.
|
||
|
PART III
|
||
|
Item 10.
|
||
|
Item 11.
|
||
|
Item 12.
|
||
|
Item 13.
|
||
|
Item 14.
|
||
|
PART IV
|
||
|
Item 15.
|
||
(Cautionary Statement Under the Private Securities Litigation Reform Act of 1995)
Mattel is including this Cautionary Statement to make applicable and take advantage of the safe harbor provisions of the Private Securities Litigation Reform Act of 1995 (the “Act”) for forward-looking statements. This Annual Report on Form 10-K includes forward-looking statements within the meaning of the Act. Forward-looking statements can be identified by the fact that they do not relate strictly to historical or current facts. They often include words such as “believes,” “expects,” “anticipates,” “estimates,” “intends,” “plans,” “seeks,” “aims,” “estimates,” “projects,” “on track,” or words of similar meaning, or future or conditional verbs, such as “will,” “should,” “could,” or “may.” A forward-looking statement is neither a prediction nor a guarantee of future events or circumstances, and those future events or circumstances may not occur. Investors should not place undue reliance on the forward-looking statements, which speak only as of the date of this Annual Report on Form 10-K. These forward-looking statements are all based on currently available operating, financial, economic and competitive information and are subject to various risks and uncertainties. The Company’s actual future results and trends may differ materially depending on a variety of factors, including, but not limited to, the risks and uncertainties discussed below. Mattel expressly disclaims any obligation to update or revise any forward-looking statement, whether as a result of new developments or otherwise.
|
Item 1.
|
Business.
|
Throughout this report “Mattel” refers to Mattel, Inc. and/or one or more of its family of companies. Mattel designs, manufactures, and markets a broad variety of toy products worldwide which are sold to its customers and directly to consumers. Mattel is a creations company that inspires the wonder of childhood. Mattel’s objectives are to grow its share in the marketplace, continue to improve its operating margins, and create long-term stockholder value. To achieve these objectives, management has established the following strategies:
First, Mattel is focused on embracing brand building, creativity, and innovation, and management will put a premium on speed and personal accountability. Management is focused on putting Mattel back on track for growth and improved profitability.
Additionally, Mattel is organizing around the following five strategic priorities:
•
Build powerful brand franchises;
•
Establish Toy Box as the partner of choice;
•
Develop unmatched commercial excellence;
•
Drive continuous cost improvement; and
•
Build emerging market leadership.
Mattel believes its products are among the most widely recognized toy products in the world. Mattel’s portfolio of brands and products are grouped into four major brand categories.
Mattel Girls & Boys Brands
—including Barbie
®
fashion dolls and accessories (“Barbie”), Monster High
®
, Ever After High
®
, Polly Pocket
®
, and DC Super Hero Girls™ (collectively “Other Girls”), Hot Wheels
®
and Matchbox
®
vehicles and play sets (collectively “Wheels”), and CARS
®
, DC Comics
®
, WWE
®
Wrestling, Minecraft
®
, Max Steel
®
, BOOMco.
®
, Toy Story
®
, and games and puzzles (collectively “Entertainment”).
Fisher-Price Brands
—including Fisher-Price
®
, Little People
®
, BabyGear™, Laugh & Learn
®
, and Imaginext
®
(collectively “Core Fisher-Price”), Thomas & Friends
®
, Dora the Explorer
®
, Mickey Mouse
®
Clubhouse, and Disney Jake and the Never Land Pirates
®
(collectively “Fisher-Price Friends”), and Power Wheels
®
.
American Girl Brands
—including Truly Me
®
, Girl of the Year
®
, BeForever
®
, Bitty Baby
®
, and WellieWishers™. American Girl
®
Brands products are sold directly to consumers via its catalog, website, and proprietary retail stores, as well as sold directly to certain retailers.
Construction and Arts & Crafts Brands
—including MEGA BLOKS
®
and RoseArt
®
.
Mattel, Inc. was incorporated in California in 1948 and reincorporated in Delaware in 1968. Its executive offices are located at 333 Continental Blvd., El Segundo, California 90245-5012, telephone number (310) 252-2000.
Business Segments
Mattel’s operating segments are separately managed business units, consisting of: (i) North America, which consists of the US and Canada, (ii) International, and (iii) American Girl. The North America and International segments sell products in the Mattel Girls & Boys Brands, Fisher-Price Brands, and Construction and Arts & Crafts Brands categories, although some products are developed and adapted for particular international markets.
For additional information on Mattel’s segment reporting, including revenues and segment income, see Part II, Item 7 “Management’s Discussion and Analysis of Financial Condition and Results of Operations—Results of Operations” and Part II, Item 8 “Financial Statements and Supplementary Data—Note 12 to the Consolidated Financial Statements—Segment Information.” For additional information regarding segment assets and geographic areas, see Part II, Item 8 “Financial Statements and Supplementary Data—Note 12 to the Consolidated Financial Statements—Segment Information.” For additional information regarding revenues by brand category, see Part II, Item 8 “Financial Statements and Supplementary Data—Note 12 to the Consolidated Financial Statements—Segment Information.”
For a discussion of the risks inherent in the foreign operations of Mattel, which affect each segment, see Item 1A “Risk Factors.”
3
North America Segment
The North America segment markets and sells toys in the US and Canada through the Mattel Girls & Boys Brands, Fisher-Price Brands, and Construction and Arts & Crafts Brands categories.
In the Mattel Girls & Boys Brands category, Barbie includes Barbie fashion dolls and accessories. Other Girls includes Monster High, Ever After High, Little Mommy
®
, and Polly Pocket. Wheels includes Hot Wheels and Matchbox vehicles and play sets. Entertainment includes key licensing partnerships with The Walt Disney Company, Warner Bros. Entertainment Inc., NBCUniversal Media, LLC, and WWE, as well as owned brands and products, including games and puzzles.
Barbie continues to evolve the “You Can Be Anything”™ campaign by highlighting role models throughout 2017, beginning with Dads in the spring. Technology and connectivity will continue to be infused into new Barbie products for the holiday season and will feature new products to support Barbie's animated content including,
Barbie: Video Game Hero
™,
Barbie Dreamtopia
™, and
Barbie: Dreamhouse Adventures
™.
In 2017, Hot Wheels will introduce new track sets, designed cars, and a new digital gaming experience. The new Hot Wheels Track Builder™ sets will include building bricks in their construction compatible sets. Additionally, Hot Wheels will continue to partner with the best in the automotive and entertainment world, including Star Wars
®
, DC Comics, and Marvel
®
.
Mattel’s Toy Box will continue to focus on bringing products to the global marketplace with speed and innovation. Toy Box will continue to partner with leading entertainment companies such as Disney, Warner Bros. Entertainment Inc., Nickelodeon
®
, NBCUniversal Media, LLC, and WWE. Key product lines based on entertainment franchises for 2017 include Disney Pixar's Cars 3, Warner Bros.'s Justice League
®
and Wonder Woman
®
, Nickelodeon's Shimmer & Shine™, and Universal’s Fast & Furious™.
The Fisher-Price Brands category includes Fisher-Price BabyGear, Laugh & Learn, Little People, Think & Learn™, Imaginext, Thomas & Friends, Dora & Friends™, Blaze and The Monster Machines
®
, Shimmer and Shine, Mickey Mouse Clubhouse, Minnie Mouse, Octonauts
®
, and Power Wheels.
In 2017, Fisher-Price will introduce the next phase of the Best Possible Start campaign, with the core message that parental love and play is the best possible start for child development. With the addition of Jonathan Adler as the Creative Director of Fisher-Price brands, existing and new product lines to be launched in 2017 will have a contemporary design catering to millennial parents. Fisher-Price will introduce simple sleep solutions, including the Revolve Swing, which features a natural soothing motion. For infants, Fisher-Price is debuting the new Laugh & Learn First Words line focused on early language development by exposing babies to their first 100 words. Additionally, the Little People brand will evolve in 2017 by integrating emotional intelligence traits, including sharing, caring, and helping others. The Think & Learn preschool learning line will continue to keep the minds and bodies of preschoolers active with the Think & Learn Smart Cycle
®
and Teach ‘n Tag Movi™ products. Thomas & Friends will also introduce its first global brand campaign, Set Friendship in Motion™, while releasing the Thomas & Friends Super Station™ playset, designed to work with all Thomas & Friends engines.
The Construction and Arts & Crafts Brands category includes MEGA BLOKS, RoseArt, and Board Dudes
®
.
In 2017, MEGA BLOKS will continue to expand its line of building sets. With its articulated micro figures, build-to-play features, and authentic details, kids and collectors will be invited to Build Beyond™ with Mega Construx™. New Halo
®
construction sets will be released leading up to the highly-anticipated launch of the
Halo Wars 2
video game. Wellie Wishers from American Girl, Thomas & Friends, Pokémon™, and Shimmer & Shine will be introduced to the MEGA BLOCKS lineup, which includes Despicable Me
®
, Destiny
®
, and Teenage Mutant Ninja Turtles
®
. Parents and preschoolers who love to build with the MEGA BLOKS Big Building Bag and Block Scooping Wagon can also add the all-new Elephant Parade to their building basics collection this Fall.
International Segment
Products marketed by the International segment are generally the same as those developed and marketed by the North America segment, although some are developed or adapted for particular international markets. Mattel’s products are sold directly to retailers and wholesalers in most European, Latin American, and Asian countries, and in Australia and New Zealand, and through agents and distributors in those countries where Mattel has no direct presence.
4
Mattel’s International segment revenue represented 40% of worldwide consolidated gross sales in
2016
. Within the International segment, Mattel operates in three regional groups that generated the following gross sales during
2016
:
|
Amount
|
Percentage of
International
Gross Sales
|
|||||
|
|
(In millions, except
percentage information)
|
|||||
|
Europe
|
$
|
1,293.3
|
|
53
|
%
|
|
|
Latin America
|
636.5
|
|
26
|
%
|
||
|
Asia Pacific
|
517.8
|
|
21
|
%
|
||
|
$
|
2,447.6
|
|
100
|
%
|
||
No individual country within the International segment exceeded 6% of worldwide consolidated gross sales during
2016
.
The strength of the US dollar relative to other currencies can significantly affect the revenues and profitability of Mattel’s international operations. Mattel enters into foreign currency forward exchange contracts, primarily to hedge its purchase and sale of inventory and other intercompany transactions denominated in foreign currencies, to limit the impact of exchange rate fluctuations on its results of operations and cash flows. See Part II, Item 7A “Quantitative and Qualitative Disclosures About Market Risk” and Part II, Item 8 “Financial Statements and Supplementary Data—Note 9 to the Consolidated Financial Statements—Derivative Instruments.” For financial information by geographic area, see Part II, Item 8 “Financial Statements and Supplementary Data—Note 12 to the Consolidated Financial Statements—Segment Information.”
American Girl Segment
The American Girl segment is a direct marketer, children’s publisher, and retailer best known for its BeForever flagship line of historical dolls, books, and accessories, as well as the Truly Me, Girl of the Year, Bitty Baby, and WellieWishers brands. American Girl also publishes best-selling fiction and non-fiction titles, plus the award-winning
American Girl
®
magazine. The American Girl segment sells products directly to consumers via its catalog, website, in its proprietary retail stores in the US, and at select retailers nationwide, as well as in specialty boutiques at select Indigo™ and Chapters™ stores in Canada and El Palacio de Hierro locations in Mexico City.
In January 2017, American Girl introduced Gabriela McBride™, the new Girl of the Year. American Girl will also introduce a new series of contemporary characters and stories in 2017. The first two new characters launched in February, which also included American Girl’s first boy doll. The third new character will debut in late April and will come to life by means of an Amazon Original Special. During the summer of 2017, American Girl will feature more personalized customization options within its Truly Me line, and add a new historical character from 1940's Hawaii.
Manufacturing and Materials
Mattel manufactures toy products for all segments in both company-owned facilities and through third-party manufacturers. Products are also purchased from unrelated entities that design, develop, and manufacture those products. To provide greater flexibility in the manufacture and delivery of its products, and as part of a continuing effort to reduce manufacturing costs, Mattel has concentrated production of most of its core products in company-owned facilities and generally uses third-party manufacturers for the production of non-core products.
Mattel’s principal manufacturing facilities are located in Canada, China, Indonesia, Malaysia, Mexico, and Thailand. To help avoid disruption of its product supply due to political instability, civil unrest, economic instability, changes in government policies or regulations, and other risks, Mattel produces its products in multiple facilities across multiple countries. Mattel believes that the existing production capacity at its own and its third-party manufacturers’ facilities is sufficient to handle expected volume in the foreseeable future. See Item 1A “Risk Factors.”
Mattel bases its production schedules for toy products on customer orders and forecasts, taking into account historical trends, results of market research, and current market information. Actual shipments of products ordered and order cancellation rates are affected by consumer acceptance of product lines, strength of competing products, marketing strategies of retailers, changes in buying patterns of both retailers and consumers, and overall economic conditions. Unexpected changes in these factors could result in a lack of product availability or excess inventory in a particular product line.
The majority of Mattel’s raw materials are available from numerous suppliers but may be subject to fluctuations in price.
5
Competition and Industry Background
Mattel is a worldwide leader in the manufacture, marketing, and sale of toys, games, and other products related to learning and development. Competition in the toy industry is based primarily on quality, play value, brands, and price. Mattel offers a diverse range of products for children of all ages and families that include, among others, toys for infants and preschoolers, girls’ toys, boys’ toys, youth electronics, hand-held and other games, puzzles, educational toys, technology-related products, media-driven products, and fashion-related toys. The North America segment competes with several large toy companies, including Hasbro, Jakks Pacific, Just Play Products, Lego, MGA Entertainment, Moose Toys, Spin Master, and VTech, many smaller toy companies, and manufacturers of video games and consumer electronics. The International segment competes with global toy companies including Famosa, Giochi Preziosi, Hasbro, Lego, MGA Entertainment, Playmobil, Ravensburger, Simba, Spin Master, and VTech, other national and regional toy companies, and manufacturers of video games and consumer electronics. Foreign regions may include competitors that are strong in a particular toy line or geographical area but do not compete with Mattel or other international toy companies worldwide. The American Girl segment competes with companies that manufacture girls’ toys and with children’s book publishers and retailers.
Competition among the above companies is intensifying due to trends towards shorter life cycles for individual toy products and an increasing use of high technology in toys. In addition, as a result of the phenomenon of “children getting older younger” resulting from children outgrowing toys at younger ages, Mattel competes with companies that sell products outside the toy aisle, such as electronic consumer products and video games. Competition continues to be heavily influenced by the fact that a small number of retailers account for a large portion of all toy sales, allocate the shelf space from which toys are viewed, and have direct contact with parents and children through in-store purchases, coupons, and print advertisements. Such retailers can and do promote their own private-label toys, facilitate the sale of competitors’ toys, and allocate shelf space to one type of toy over another. Competition is also intensifying due to the availability of online-only distributors, including Amazon.com, which are able to promote a wide variety of toys and represent a wide variety of toy manufacturers, and, with limited overhead, do so at a lower cost.
Seasonality
Mattel’s business is highly seasonal, with consumers making a large percentage of all toy purchases during the traditional holiday season. A significant portion of Mattel’s customers’ purchasing occurs in the third and fourth quarters of Mattel’s fiscal year in anticipation of holiday buying. These seasonal purchasing patterns and requisite production lead times create risk to Mattel’s business associated with the underproduction of popular toys and the overproduction of less popular toys that do not match consumer demand. Retailers have also been attempting to manage their inventories more tightly in recent years, requiring Mattel to ship products closer to the time the retailers expect to sell the products to consumers. These factors increase the risk that Mattel may not be able to meet demand for certain products at peak demand times or that Mattel’s own inventory levels may be adversely impacted by the need to pre-build products before orders are placed. Additionally, as retailers manage their inventories, Mattel experiences cyclical ordering patterns for products and product lines that may cause its sales to vary significantly from period to period.
In anticipation of retail sales in the traditional holiday season, Mattel significantly increases its production in advance of the peak selling period, resulting in a corresponding build-up of inventory levels in the first three quarters of its fiscal year. Seasonal shipping patterns result in significant peaks in the third and fourth quarters in the respective levels of inventories and accounts receivable, which result in seasonal working capital financing requirements. See Part II, Item 8 “Financial Statements and Supplementary Data—Note 5 to the Consolidated Financial Statements—Seasonal Financing and Debt.”
Product Design and Development
Through its product design and development group, Mattel regularly refreshes, redesigns, and extends existing toy product lines and develops innovative new toy product lines for all segments. Mattel believes its success is dependent on its ability to continue these activities effectively. See Item 1A “Risk Factors.” Product design and development activities are principally conducted by a group of professional designers and engineers employed by Mattel. During
2016
,
2015
, and
2014
, Mattel incurred expenses of
$215.3 million
,
$217.8 million
, and
$209.5 million
, respectively, in connection with the design and development of products, exclusive of royalty payments. See Part II, Item 8 “Financial Statements and Supplementary Data—Note 13 to the Consolidated Financial Statements—Supplemental Financial Information.”
Additionally, independent toy designers and developers bring concepts and products to Mattel and are generally paid a royalty on the net selling price of products licensed to Mattel. These independent toy designers may also create different products for other toy companies.
6
Advertising and Marketing
Mattel supports its product lines with extensive advertising and consumer promotions. Advertising takes place at varying levels throughout the year and peaks during the traditional holiday season. Advertising includes television and radio commercials, magazine, newspaper, and internet advertisements, and social media. Promotions include in-store displays, sweepstakes, merchandising materials, major events focusing on products, and tie-ins with various consumer products companies.
During
2016
,
2015
, and
2014
, Mattel incurred expenses of
$634.9 million
(
11.6%
of net sales),
$717.9 million
(
12.6%
of net sales), and
$733.2 million
(
12.2%
of net sales), respectively, for advertising and promotion.
Sales
Mattel’s products are sold throughout the world. Products within the North America segment are sold directly to retailers, including discount and free-standing toy stores, chain stores, department stores, other retail outlets, and, to a limited extent, wholesalers. Mattel also operates several small retail outlets, generally near or at its corporate headquarters and distribution centers as a service to its employees and as an outlet for its products. Products within the International segment are sold directly to retailers and wholesalers in most European, Latin American, and Asian countries, and in Australia and New Zealand, and through agents and distributors in those countries where Mattel has no direct presence. Mattel also has retail outlets in Latin America and Europe that serve as outlets for its products. American Girl products and its children's publications are sold directly to consumers and select retailers nationwide. Mattel has 20 American Girl retail stores: American Girl Place in Chicago, Illinois, Los Angeles, California, and New York, New York, and American Girl stores in Alpharetta, Georgia, Bloomington, Minnesota, Charlotte, North Carolina, Chesterfield, Missouri, Columbus, Ohio, Dallas, Texas, Houston, Texas, Lone Tree, Colorado, Lynnwood, Washington, McLean, Virginia, Miami, Florida, Nashville, Tennessee, Natick, Massachusetts, Orlando, Florida, Overland Park, Kansas, Palo Alto, California, and Scottsdale, Arizona, each of which features children’s products from the American Girl segment. Additionally, Mattel sells certain of its products online through websites of one or more of its subsidiaries.
During
2016
, Mattel’s three largest customers (Wal-Mart at
$1.1 billion
, Toys “R” Us at
$0.6 billion
, and Target at
$0.4 billion
) accounted for approximately
39%
of worldwide consolidated net sales. Within countries in the International segment, there is also a concentration of sales to certain large customers that do not operate in the US, none of which exceed 10% of net sales. The customers and the degree of concentration vary depending upon the region or nation. See Item 1A “Risk Factors” and Part II, Item 8 “Financial Statements and Supplementary Data—Note 12 to the Consolidated Financial Statements—Segment Information.”
Licenses and Distribution Agreements
Mattel has license agreements with third parties that permit Mattel to utilize the trademark, characters, or inventions of the licensor in products that Mattel sells. A number of these licenses relate to product lines that are significant to Mattel’s business and operations.
Mattel has entered into agreements to license entertainment properties from, among others, Disney Enterprises, Inc. (including Disney characters such as Star Wars, Mickey Mouse, Jake and the Never Land Pirates, Disney Planes™, CARS and Toy Story from Pixar, and certain Disney films and television properties), NBCUniversal Media, LLC (including the Fast & Furious and Jurassic World
®
franchises), Viacom International, Inc. relating to its Nickelodeon properties (including Dora the Explorer, Blaze and the Monster Machines, and SpongeBob SquarePants
®
), Warner Bros. Consumer Products (including Batman
®
, Superman
®
, Wonder Woman, Justice League, and DC Super Hero Girls), Microsoft (including Halo), Mojang (including Minecraft), and WWE Wrestling.
Royalty expense for
2016
,
2015
, and
2014
was
$228.9 million
,
$264.6 million
, and
$242.4 million
, respectively. See “Commitments” and Part II, Item 8 “Financial Statements and Supplementary Data—Note 11 to the Consolidated Financial Statements—Commitments and Contingencies."
Mattel’s license agreement with Disney Enterprises, Inc. for the global rights to produce and sell toys based on Disney Princess
®
characters expired at the end of 2015 and was not renewed. Gross sales of Disney Princess products were $455.6 million in 2015. However, Mattel's license of CARS 3 and Toy Story 4 were renewed in 2016, with theatrical releases in 2017 and 2019, respectively.
Mattel also licenses a number of its trademarks and other property rights to others for use in connection with the sale of their products. Mattel distributes some third-party finished products that are independently designed and manufactured.
7
Trademarks, Copyrights, and Patents
Most of Mattel’s products are sold under trademarks, trade names, and copyrights, and a number of these products incorporate patented devices or designs. Trademarks, copyrights, and patents are significant assets of Mattel in that they provide product recognition and acceptance worldwide.
Mattel customarily seeks trademark, copyright, and patent protection covering its products, and it owns or has applications pending for US and foreign trademarks, copyrights, and patents covering many of its products. Although a number of these trademarks, copyrights, and patents relate to product lines that are significant to Mattel’s business and operations, Mattel does not believe it is dependent on a single trademark, copyright or patent. Mattel believes its rights to these properties are adequately protected, but there can be no assurance that its rights can be successfully asserted in the future or will not be invalidated, circumvented, or challenged.
Commitments
In the normal course of business, Mattel enters into contractual arrangements for future purchases of goods and services to ensure availability and timely delivery and to obtain and protect Mattel’s right to create and market certain products. Certain of these commitments routinely contain provisions for guarantees or minimum expenditures during the term of the contracts. Current and future commitments for guaranteed payments reflect Mattel’s focus on expanding its product lines through alliances with businesses in other industries. Additionally, Mattel routinely enters into noncancelable lease agreements for premises and equipment used in the normal course of business.
Agreements to purchase inventory, services, and other items with terms extending through
2021
contain future minimum payments totaling approximately
$445 million
. Licensing and similar agreements with terms extending through
2021
and beyond contain provisions for future guaranteed minimum payments totaling approximately
$392 million
. Operating lease commitments with terms extending through
2021
and beyond contain future minimum obligations totaling approximately
$620 million
. See Part II, Item 7 “Management’s Discussion and Analysis of Financial Condition and Results of Operations—Commitments” and Part II, Item 8 “Financial Statements and Supplementary Data—Note 11 to the Consolidated Financial Statements—Commitments and Contingencies.”
Backlog
Mattel ships products in accordance with delivery schedules specified by its customers, which usually request delivery within three months. In the toy industry, orders are subject to cancellation or change at any time prior to shipment. In recent years, a trend toward just-in-time inventory practices in the toy industry has resulted in fewer advance orders and therefore less backlog of orders. Mattel believes that the amount of backlog orders at any given time may not accurately indicate future sales.
Financial Instruments
Currency exchange rate fluctuations may impact Mattel’s results of operations and cash flows. Mattel seeks to mitigate its exposure to foreign exchange risk by monitoring its foreign currency transaction exposure for the year and partially hedging such exposure using foreign currency forward exchange contracts primarily to hedge its purchase and sale of inventory and other intercompany transactions denominated in foreign currencies. These contracts generally have maturity dates of up to 18 months. In addition, Mattel manages its exposure to currency exchange rate fluctuations through the selection of currencies used for international borrowings. Mattel does not trade in financial instruments for speculative purposes.
For additional information regarding foreign currency contracts, see “International Segment” above, Part II, Item 7A “Quantitative and Qualitative Disclosures About Market Risk,” and Part II, Item 8 “Financial Statements and Supplementary Data—Note 9 to the Consolidated Financial Statements—Derivative Instruments.”
Seasonal Financing
See Part II, Item 8 “Financial Statements and Supplementary Data—Note 5 to the Consolidated Financial Statements—Seasonal Financing and Debt.”
Government Regulations and Environmental Quality
Mattel’s products sold in the US are subject to the provisions of the Consumer Product Safety Act, as amended by the Consumer Product Safety Improvement Act of 2008, the Federal Hazardous Substances Act, and the Consumer Product Safety Improvement Act of 2008, and may also be subject to the requirements of the Flammable Fabrics Act or the Food, Drug, and Cosmetics Act and the regulations promulgated pursuant to such statutes. These statutes and the related regulations ban from
8
the market consumer products that fail to comply with applicable product safety laws, regulations, and standards. The Consumer Product Safety Commission may require the recall, repurchase, replacement, or repair of any such banned products or products that otherwise create a substantial risk of injury and may seek penalties for regulatory noncompliance under certain circumstances. Similar laws exist in some US states. Mattel believes that it is in substantial compliance with these federal and state laws and regulations.
Mattel’s products sold worldwide are subject to the provisions of similar laws and regulations in many jurisdictions, including the European Union and Canada. Mattel believes that it is in substantial compliance with these laws and regulations.
Mattel maintains a quality control program to help ensure compliance with applicable product safety requirements. Nonetheless, Mattel has experienced, and may in the future experience, issues in products that result in recalls, withdrawals, or replacements of products. A product recall could have a material adverse effect on Mattel’s results of operations and financial condition, depending on the product affected by the recall and the extent of the recall efforts required. A product recall could also negatively affect Mattel’s reputation and the sales of other Mattel products. See Item 1A “Risk Factors.”
Mattel’s advertising is subject to the Federal Trade Commission Act, The Children’s Television Act of 1990, the rules and regulations promulgated by the Federal Trade Commission, and the Federal Communications Commission, as well as laws of certain countries that regulate advertising and advertising to children. In addition, Mattel’s web-based products and services and other online and digital communications activity are or may be subject to US and foreign privacy-related regulations, including the US Children’s Online Privacy Protection Act of 1998 and the EU Data Protection Directive (Directive 95/46/EC) and related national regulations. Mattel believes that it is in substantial compliance with these laws and regulations.
Mattel’s worldwide operations are subject to the requirements of various environmental laws and regulations in the jurisdictions where those operations are located. Mattel believes that it is in substantial compliance with those laws and regulations. Mattel’s operations are from time to time the subject of investigations, conferences, discussions, and negotiations with various federal, state and local environmental agencies within and outside the US with respect to the discharge or cleanup of hazardous waste. Mattel is not aware of any material cleanup liabilities.
Mattel is subject to various other federal, state, local and international laws and regulations applicable to its business. Mattel believes that it is in substantial compliance with these laws and regulations.
Employees
The total number of persons employed by Mattel and its subsidiaries at any one time varies because of the seasonal nature of its manufacturing operations. As of
December 31, 2016
, Mattel’s total number of employees was approximately 32,000.
Research and Development
See “Design and Development” in Part II, Item 8 “Financial Statements and Supplementary Data—Note 13 to the Consolidated Financial Statements—Supplemental Financial Information.”
Available Information
Mattel files its Annual Report on Form 10-K, Quarterly Reports on Form 10-Q, Current Reports on Form 8-K, Proxy Statements and amendments to those reports filed or furnished pursuant to Section 13(a) or 15(d) of the Securities Exchange Act of 1934 (the “Exchange Act”) with the SEC. The public may read and copy any materials that Mattel files with the SEC at the SEC’s Public Reference Room at 100 F Street, NE, Washington, DC 20549. The public may obtain information on the operation of the Public Reference Room by calling the SEC at 1-800-SEC-0330. The SEC maintains an Internet website that contains reports, proxy and other information regarding issuers that file electronically with the SEC at
http://www.sec.gov
.
Mattel’s Internet website address is
http://corporate.mattel.com
. Mattel makes available on its Internet website, free of charge, its Annual Report on Form 10-K, Quarterly Reports on Form 10-Q, Current Reports on Form 8-K, Proxy Statements and amendments to those reports filed or furnished pursuant to Section 13(a) or 15(d) of the Exchange Act as soon as reasonably practicable after such materials are electronically filed with, or furnished to, the SEC.
9
|
Item 1A.
|
Risk Factors.
|
If Mattel does not successfully identify or satisfy consumer preferences, its results of operations may be adversely affected.
Mattel’s business and operating results depend largely upon the appeal of its products, driven by both innovation and marketing. Consumer preferences, particularly with children as the end users of Mattel’s products, are continuously changing. Significant, sudden shifts in demand are caused by “hit” toys and trends, which are often unpredictable. Mattel offers a diverse range of products for children of all ages and families that includes, among others, toys for infants and preschoolers, girls’ toys, boys’ toys, youth electronics, digital media, hand-held and other games, puzzles, educational toys, media-driven products, and fashion-related toys. Mattel competes domestically and internationally with a wide range of large and small manufacturers, marketers and sellers of toys, video games, consumer electronics such as tablets and mobile devices, and other play products, as well as retailers, which means that Mattel’s market position is always at risk. Mattel’s ability to maintain its current product sales, and increase its product sales or establish product sales with new, innovative toys, will depend on Mattel’s ability to satisfy play preferences, enhance existing products, develop and introduce new products, and achieve market acceptance of these products. These challenges are intensifying due to trends towards shorter life cycles for individual toy products, the phenomenon of children outgrowing traditional toys at younger ages, an increasing use of more sophisticated technology in toys, and an evolving path to purchase. If Mattel does not successfully meet the challenges outlined above in a timely and cost-effective manner, demand for its products could decrease, and Mattel’s revenues, profitability and results of operations may be adversely affected.
High levels of competition and low barriers to entry make it difficult to achieve, maintain, or build upon the success of Mattel’s brands, products, and product lines.
Mattel faces competitors who are also constantly monitoring and attempting to anticipate consumer tastes, seeking ideas which will appeal to consumers, and introducing new products that compete with Mattel’s products. In addition, competition for access to entertainment properties could lessen Mattel’s ability to secure, maintain, and renew popular licenses to entertainment products developed by other parties and licensed to Mattel or require Mattel to pay licensors higher royalties and higher minimum guaranteed payments in order to obtain or retain these licenses. As a licensee of entertainment properties, Mattel has no guarantee that a particular property or brand will translate into a successful toy, game, or other product. In addition, the barriers to entry for new participants in the toy products industry are low. In a very short period of time, new market participants with a popular product idea or entertainment property can become a significant source of competition for Mattel and its products. If demand for Mattel’s brands, products and product lines is reduced as a result of these factors, Mattel’s results of operations may be adversely affected.
Inaccurately anticipating changes and trends in popular culture, media and movies, fashion, or technology can negatively affect Mattel’s sales.
Successful movies and characters in children’s literature affect play preferences, and many products depend on media-based intellectual property licenses. Media-based licenses can cause a line of toys or other products to gain immediate success among children, parents, or families. Trends in media, movies, and children’s characters change swiftly and contribute to the transience and uncertainty of play preferences. In addition, certain developments in the entertainment industry, including labor strikes, could cause delay or interruption in the release of new movies and television programs and could adversely affect the sales of Mattel’s products based on such movies and television programs. Mattel responds to such trends and developments by modifying, refreshing, extending, and expanding its product offerings on an annual basis. If Mattel does not accurately anticipate trends in popular culture, movies, media, fashion, or technology, its products may not be accepted by children, parents, or families and Mattel’s revenues, profitability, and results of operations may be adversely affected.
Mattel’s failure to successfully market or advertise its products could have an adverse effect on Mattel’s business, financial condition, and results of operations.
Mattel’s products are marketed worldwide through a diverse spectrum of advertising and promotional programs. Mattel’s ability to sell products is dependent in part upon the success of these programs. If Mattel does not successfully market its products or if media or other advertising or promotional costs increase, these factors could have an adverse effect on Mattel’s business, financial condition, and results of operations.
10
Mattel’s business is highly seasonal and its operating results depend, in large part, on sales during the relatively brief traditional holiday season. Any events that disrupt Mattel’s business during its peak demand times could significantly, adversely, and disproportionately affect Mattel’s business.
Mattel’s business is subject to risks associated with the underproduction of popular toys and the overproduction of toys that are less popular with consumers. Sales of toy products at retail are highly seasonal, with a majority of retail sales occurring during the period from September through December. In recent years, many consumers have delayed their purchases until just before the holidays. As a result, Mattel’s operating results depend, in large part, on sales during the relatively brief traditional holiday season. Retailers attempt to manage their inventories tightly, which requires Mattel to ship products closer to the time the retailers expect to sell the products to consumers. This in turn results in shorter lead times for production. Management believes that the recent increase in “last minute” shopping during the holiday season and the popularity of gift cards (which often shift purchases to after the holiday season) may negatively impact customer re-orders during the holiday season. These factors may decrease sales or increase the risks that Mattel may not be able to meet demand for certain products at peak demand times or that Mattel’s own inventory levels may be adversely impacted by the need to pre-build products before orders are placed.
In addition, as a result of the seasonal nature of Mattel’s business, Mattel may be significantly and adversely affected, in a manner disproportionate to the impact on a company with sales spread more evenly throughout the year, by unforeseen events, such as terrorist attacks, economic shocks, severe weather, earthquakes or other catastrophic events, that harm the retail environment or consumer buying patterns during its key selling season, or by events, such as strikes, disruptions in transportation, or port delays, that interfere with the manufacture or shipment of goods during the critical months leading up to the holiday purchasing season.
Mattel has significant customer concentration, so that economic difficulties or changes in the purchasing policies or patterns of its key customers could have a significant impact on Mattel’s business and operating results.
A small number of customers account for a large share of Mattel’s net sales. In
2016
, Mattel’s three largest customers, Wal-Mart, Toys “R” Us, and Target, in the aggregate, accounted for approximately
39%
of net sales, and its ten largest customers, in the aggregate, accounted for approximately 49% of net sales. While the concentration of Mattel’s business with a relatively small number of customers may provide certain benefits to Mattel, such as potentially more efficient product distribution and decreased costs of sales and distribution, this concentration may expose Mattel to a material adverse effect if one or more of Mattel’s large customers were to significantly reduce purchases for any reason, favor competitors or new entrants, or increase their direct competition with Mattel by expanding their private-label business. Customers make no binding long-term commitments to Mattel regarding purchase volumes and make all purchases by delivering one-time purchase orders. Any customer could reduce its overall purchases of Mattel’s products, reduce the number and variety of Mattel’s products that it carries and the shelf space allotted for Mattel’s products, or otherwise seek to materially change the terms of the business relationship at any time. Any such change could significantly harm Mattel’s business and operating results. Furthermore, the bankruptcy or other lack of success of one or more of Mattel's significant retail customers could negatively impact Mattel's revenues and profitability.
Liquidity problems or bankruptcy of Mattel’s key customers could have a significant adverse effect on Mattel’s business, financial condition and results of operations.
Mattel’s sales to customers are typically made on credit without collateral. There is a risk that key customers will not pay, or that payment may be delayed, because of bankruptcy, contraction of credit availability to such customers, weak retail sales or other factors beyond the control of Mattel, which could increase Mattel’s exposure to losses from bad debts. In addition, if key customers were to cease doing business as a result of bankruptcy or significantly reduce the number of stores operated, it could have a significant adverse effect on Mattel’s business, financial condition, and results of operations.
Significant increases in the price of commodities, transportation, or labor, if not offset by declines in other input costs, or a reduction or interruption in the delivery of raw materials, components, and finished products from Mattel’s vendors could negatively impact Mattel’s financial results.
Cost increases, whether resulting from rising costs of materials, transportation, services, labor, or compliance with existing or future regulatory requirements, could impact the profit margins realized by Mattel on the sale of its products. Because of market conditions, timing of pricing decisions, and other factors, there can be no assurance that Mattel will be able to offset any of these increased costs by adjusting the prices of its products. Increases in prices of Mattel’s products may not be sustainable and could result in lower sales. Mattel’s ability to meet customer demand depends, in part, on its ability to obtain timely and adequate delivery of materials, parts and components from its suppliers and internal manufacturing capacity. Mattel has experienced shortages in the past, including shortages of raw materials and components. Additionally, as Mattel cannot
11
guarantee the stability of its major suppliers, major suppliers may stop manufacturing components at any time with little or no notice. If Mattel is required to use alternative sources, it may be required to redesign some aspects of the affected products, which may involve delays and additional expense. Although Mattel works closely with suppliers to avoid these types of shortages, there can be no assurance that Mattel will not encounter these problems in the future. A reduction or interruption in supplies or in the delivery of finished products, whether resulting from more stringent regulatory requirements, disruptions in transportation, port delays, labor strikes, lockouts, an outbreak of a severe public health pandemic, severe weather, the occurrence or threat of wars or other conflicts, or a significant increase in the price of one or more supplies, such as fuel or resin (which is an oil-based product used in plastics), or otherwise, could negatively impact Mattel’s financial results.
Significant changes in currency exchange rates or the ability to transfer capital across borders could have a significant adverse effect on Mattel’s business and results of operations.
Mattel operates facilities and sells products in numerous countries outside the United States. During
2016
, Mattel’s net sales to international customers comprised 41% of Mattel’s total consolidated net sales. Furthermore, Mattel’s net investment in its foreign subsidiaries and its results of operations and cash flows are subject to changes in currency exchange rates and regulations. Highly inflationary economies of certain foreign countries can result in foreign currency devaluation, which negatively impacts Mattel’s profitability. Mattel seeks to mitigate the exposure of its results of operations to fluctuations in currency exchange rates by aligning its prices with the local currency cost of acquiring inventory, distributing earnings in US Dollars, and partially hedging this exposure using foreign currency forward exchange contracts. These contracts are primarily used to hedge Mattel’s purchase and sale of inventory, and other intercompany transactions denominated in foreign currencies. Government action may restrict Mattel’s ability to transfer capital across borders and may also impact the fluctuation of currencies in the countries where Mattel conducts business or has invested capital. Significant changes in currency exchange rates, reductions in Mattel’s ability to transfer its capital across borders, and changes in government-fixed currency exchange rates, including the Chinese yuan and Venezuelan bolivar fuerte, could have a significant adverse effect on Mattel’s business and results of operations.
If global economic conditions deteriorate, Mattel’s business and financial results could be adversely affected.
Mattel designs, manufactures, and markets a wide variety of toy products worldwide through sales to retailer customers and directly to consumers. Mattel’s performance is impacted by the level of discretionary consumer spending, which remains relatively weak in many countries around the world in which Mattel does business. Consumers’ discretionary purchases of toy products may be impacted by job losses, foreclosures, bankruptcies, reduced access to credit, significantly falling home prices, lower consumer confidence, and other macroeconomic factors that affect consumer spending behavior. Any of these factors can reduce the amount which consumers spend on the purchase of Mattel’s products. Deterioration of global economic conditions or disruptions in credit markets in the markets in which Mattel operates could potentially have a material adverse effect on Mattel’s liquidity and capital resources, including increasing Mattel’s cost of capital or its ability to raise additional capital if needed, or otherwise adversely affect Mattel’s business and financial results.
In addition to experiencing potentially lower revenues during times of economic difficulty, in an effort to maintain sales during such times, Mattel may need to increase promotional spending or take other steps to encourage retailer and consumer purchase of its products. Those steps may increase costs and/or decrease operating margins.
An increasing portion of Mattel's business may come from new and emerging markets, and growing business in new and emerging markets presents additional challenges.
Mattel expects an increasing portion of its net revenues to come from new and emerging markets, including China, India, and Russia. Operating in new and emerging markets, each with its own unique consumer preferences and business climates, presents additional challenges that Mattel must meet. In addition, sales and operations in new and emerging markets are subject to other risks associated with international operations. Such risks include complications in complying with different laws in varying jurisdictions; dealing with changes in governmental policies and the evolution of laws and regulations that impact Mattel's product offerings and related enforcement; difficulties understanding the retail climate, consumer trends, local customs and competitive conditions in foreign markets, which may be quite different from the US; difficulties in moving materials and products from one country to another, including port congestion, strikes and other transportation delays and interruptions; potential challenges to Mattel's transfer pricing determinations and other aspects of its cross border transactions; and the impact of tariffs, quotas, or other protectionist measures.
Because of the importance of Mattel's new and emerging market net revenues, Mattel's business, financial condition and results of operations could be harmed if any of the risks described above are not properly managed, or if Mattel is otherwise unsuccessful in managing its new and emerging market business.
12
An increasing portion of Mattel's business may come from technologically advanced or sophisticated digital and smart technology products, which present additional challenges compared to more traditional toys and games.
Mattel expects that children will continue to be interested in product offerings incorporating sophisticated technology, such as video games, consumer electronics and social and digital media, at younger and younger ages. Mattel also expects that parents will seek to enhance child development and learning through digital technologies and analog and technology-based play.
In addition to the risks associated with Mattel’s more traditional products, sophisticated digital and smart technology products face certain additional risks. Costs associated with designing, developing and producing technologically advanced or sophisticated products tend to be higher than for many of Mattel’s more traditional products. Heavy competition in consumer electronics and entertainment products and difficult economic conditions may increase the risk of Mattel not achieving sales sufficient to recover the increased costs associated with these products. Designing, developing and producing sophisticated digital and smart technology products requires different competencies and may follow longer timelines than traditional toys and games, and any delays in the design, development or production of these products could have a significant impact on our ability to successfully offer such products. In addition, the pace of change in product offerings and consumer tastes in the video games, consumer electronics and social and digital media areas is potentially even greater than for Mattel’s more traditional products. This pace of change means that the window in which a technologically advanced or sophisticated product can achieve and maintain consumer interest may be shorter than traditional toys and games. These products may also present data security and data privacy risks and be subject to certain laws, government policies or regulations not applicable to more traditional products, such as the US Children’s Online Privacy Protection Act of 1998 and the EU Data Protection Directive (Directive 95/46/EC) and related national regulations.
Failure to successfully implement new initiatives or meet product introduction schedules could have a significant adverse effect on Mattel’s business, financial condition, and results of operations.
Mattel has announced, and in the future may announce, initiatives to reduce its costs, increase its efficiency, improve the execution of its core business, globalize and extend Mattel’s brands, catch new trends, create new brands, and offer new innovative products and improve existing products, enhance product safety, develop people, improve productivity, simplify processes, maintain customer service levels, as well as initiatives designed to drive sales growth, capitalize on Mattel’s scale advantage, and improve its supply chain. These initiatives involve investment of capital and complex decision-making as well as extensive and intensive execution, and the success of these initiatives is not assured. In addition, Mattel may anticipate introducing a particular product, product line or brand at a certain time in the future. There is no guarantee that Mattel will be able to manufacture, source and ship new or continuing products in a timely manner and on a cost-effective basis. Unforeseen delays or difficulties in the development process or significant increases in the planned cost of development for new Mattel products may cause the introduction date for products to be later than anticipated or, in some situations, may cause a product or new product introduction to be discontinued. Failure to successfully implement any of these initiatives, or launches, or the failure of any of these initiatives or launches to produce the results anticipated by management, could have a significant adverse effect on Mattel’s business, financial condition, and results of operations.
Mattel’s business depends in large part on the success of its vendors and outsourcers, and Mattel’s brands and reputation may be harmed by actions taken by third-parties that are outside Mattel’s control. In addition, any material failure, inadequacy, or interruption resulting from such vendors or outsourcings could harm Mattel’s ability to effectively operate its business.
As a part of its efforts to cut costs, achieve better efficiencies and increase productivity and service quality, Mattel relies significantly on vendor and outsourcing relationships with third parties for services and systems including manufacturing, transportation, logistics and information technology. Any shortcoming of a Mattel vendor or outsourcer, particularly an issue affecting the quality of these services or systems, may be attributed by customers to Mattel, thus damaging Mattel’s reputation, and brand value, and potentially affecting its results of operations. In addition, problems with transitioning these services and systems to or operating failures with these vendors and outsourcers could cause delays in product sales, and reduce efficiency of Mattel’s operations, and significant capital investments could be required to remediate the problem.
Increases in interest rates, reduction of Mattel’s credit ratings, contraction of credit availability, or the inability of Mattel to meet the debt covenant requirements in its credit facilities could negatively impact Mattel’s ability to conduct its operations.
Mattel relies on external financing, including commercial paper and borrowings under its domestic unsecured committed revolving credit facility, to help fund its seasonal working capital needs. Increases in interest rates, both domestically and internationally, could negatively affect Mattel’s cost of financing its operations. Any reduction in Mattel’s credit ratings could
13
increase the cost of obtaining financing. Mattel may be hindered from obtaining, or incur additional costs to obtain, additional credit in tight credit markets. Additionally, Mattel’s ability to issue long-term debt and obtain seasonal financing could be adversely affected by factors such as market conditions and an inability to meet its debt covenant requirements, which include maintaining certain financial ratios. Mattel’s ability to conduct its operations could be negatively impacted should these or other adverse conditions affect its ability to access these sources of liquidity.
If Mattel is not able to adequately protect its proprietary intellectual property and information, and protect against third party claims that Mattel is infringing on their intellectual property rights, its results of operations could be adversely affected.
The value of Mattel’s business depends on its ability to protect its intellectual property and information, including its trademarks, trade names, copyrights, patents, trade secrets, and rights under intellectual property license agreements and other agreements with third parties, in the US and around the world, as well as its customer, employee, and consumer data. From time to time, third parties have challenged, and may in the future try to challenge, Mattel's ownership of its intellectual property in the US and around the world. In addition, Mattel's business is subject to the risk of third parties counterfeiting its products or infringing on its intellectual property rights. The steps Mattel has taken may not prevent unauthorized use of its intellectual property, particularly in foreign countries where the laws may not protect its intellectual property as fully as in the US. Mattel may need to resort to litigation to protect its intellectual property rights, which could result in substantial costs and diversion of resources. If Mattel fails to protect its proprietary intellectual property and information, including with respect to any successful challenge to Mattel’s ownership of its intellectual property or material infringements of its intellectual property, this failure could have a significant adverse effect on Mattel’s business, financial condition, and results of operations.
Mattel has acquired certain intellectual properties from third parties. Declines in the profitability of these acquired brands may impact Mattel’s ability to recover the carrying value of the related assets and could result in an impairment charge. Reduction in net earnings caused by impairment charges could harm Mattel’s financial results.
Unfavorable resolution of or adverse developments in legal proceedings, other investigations, or regulatory matters could have a significant adverse effect on Mattel’s financial condition.
Mattel periodically receives claims of infringement of intellectual property rights held by other parties. Responding to any infringement claim, regardless of its validity, may be costly and time-consuming and may divert management and key personnel from business operations. If Mattel, its distributors, its licensors or its manufacturers are found to be infringing on the intellectual property rights of any third party, they may be required to obtain a license to use those rights, which may not be obtainable on reasonable terms, if at all.
Mattel is, from time to time, involved in litigation or other disputes, investigations, and regulatory matters. An unfavorable resolution of these matters could have a significant adverse effect on Mattel’s financial condition and its operations. Regardless of their outcome, these matters may result in substantial costs and expenses, significantly divert the attention of management, or interrupt Mattel’s normal business operations. There can be no assurance that Mattel will be able to prevail in, or achieve a favorable settlement of, any of these matters.
Mattel is subject to various laws and government policies or regulations in numerous jurisdictions, violation of which could subject it to sanctions. In addition, changes in such laws or policies or regulations may lead to increased costs, changes in Mattel’s effective tax rate, or the interruption of normal business operations that would negatively impact Mattel’s financial condition and results of operations.
Mattel operates in a highly regulated environment in the US and international markets. US federal, state, and local governmental entities, and foreign governments regulate many aspects of Mattel’s business, including its products and the importation and exportation of its products. These policies or regulations may include accounting standards, taxation requirements (including changes in applicable income tax rates, new tax laws and revised tax law interpretations), product safety and other safety standards, trade restrictions, duties and tariffs, and regulations regarding currency and financial matters, anticorruption standards (such as the US Foreign Corrupt Practices Act), environmental matters, advertising directed toward children, product content, and privacy and data protection, as well as other administrative and regulatory restrictions. While Mattel takes all the steps it believes are necessary to comply with these laws and policies or regulations, there can be no assurance that Mattel will be in compliance in the future. Compliance with these various laws, regulations and policies imposes significant costs on Mattel’s business, and failure to comply could result in monetary liabilities and other penalties, and could lead to significant negative media attention and consumer dissatisfaction, which could have a significant adverse effect on Mattel’s business, financial condition and results of operations.
14
In addition, changes in laws or policies or regulations may lead to increased costs, changes in Mattel’s effective tax rate, or the interruption of normal business operations, any of which could negatively impact its financial condition and results of operations.
Issues with products may lead to product liability, personal injury or property damage claims, recalls, withdrawals, replacements of products, or regulatory actions by governmental authorities that could divert resources, affect business operations, decrease sales, increase costs, and put Mattel at a competitive disadvantage, any of which could have a significant adverse effect on Mattel’s financial condition.
Mattel has experienced, and may in the future experience, issues with products that may lead to product liability, personal injury or property damage claims, recalls, withdrawals, replacements of products, or regulatory actions by governmental authorities. Any of these activities could result in increased governmental scrutiny, harm to Mattel’s reputation, reduced demand by consumers for its products, decreased willingness by retailer customers to purchase or provide marketing support for those products, adverse impacts on Mattel’s ability to enter into licensing agreements for products on competitive terms, absence or increased cost of insurance, or additional safety and testing requirements. Such results could divert development and management resources, adversely affect Mattel’s business operations, decrease sales, increase legal fees and other costs, and put Mattel at a competitive disadvantage compared to other manufacturers not affected by similar issues with products, any of which could have a significant adverse effect on Mattel’s financial condition and results of operations.
Mattel’s current and future operating procedures and product requirements may increase costs, significantly and adversely affect its relationship with vendors, and make it more difficult for Mattel to produce, purchase, and deliver products on a timely basis to meet market demands. Future conditions may require Mattel to adopt further changes that may increase its costs and further affect its relationship with vendors.
Mattel’s current operating procedures and product requirements, including testing requirements and standards, have imposed costs on both Mattel and the vendors from which it purchases products. Changes in business conditions, including those resulting from new legislative and regulatory requirements, have caused and in the future could cause further revisions in Mattel’s operating procedures and product requirements. Changes in Mattel’s operating procedures and product requirements may delay delivery of products and increase costs. Mattel’s relationship with its existing vendors may be adversely affected as a result of these changes, making Mattel more dependent on a smaller number of vendors. Mattel is not currently dependent on a single supplier or group of suppliers. Some vendors may choose not to continue to do business with Mattel or not to accommodate Mattel’s needs to the extent that they have done in the past. In addition, rising production costs, contraction of credit availability, and labor shortages have caused a substantial contraction in the number of toy manufacturers in China, decreasing the number of potential vendors to manufacture Mattel’s products. Because of the seasonal nature of Mattel’s business and the demands of its customers for deliveries with short lead times, Mattel depends upon the cooperation of its vendors to meet market demand for its products in a timely manner. There can be no assurance that existing and future events will not require Mattel to adopt additional requirements and incur additional costs, and impose those requirements and costs on its vendors, which may adversely affect its relationship with those vendors and Mattel’s ability to meet market demand in a timely manner.
Political developments, including trade relations, and the threat or occurrence of war or terrorist activities could adversely impact Mattel, its personnel and facilities, its customers and suppliers, retail and financial markets, and general economic conditions.
Mattel’s business is worldwide in scope, including operations in 40 countries and territories. Political instability, civil unrest, the deterioration of the political situation in a country in which Mattel has significant sales or operations, or the breakdown of trade relations between the US and a foreign country in which Mattel has significant manufacturing facilities or other operations, could adversely affect Mattel’s business, financial condition, and results of operations. For example, a change in trade status for China or Mexico could result in a substantial increase in the import duty of toys manufactured in these countries and imported into the US. In addition, the occurrence of war or hostilities between countries or threat of terrorist activities, and the responses to and results of these activities, could adversely impact Mattel, its personnel and facilities, its customers and suppliers, retail and financial markets, and general economic conditions.
Disruptions in Mattel’s manufacturing operations due to political instability, civil unrest, or disease could negatively impact Mattel’s business, financial position, and results of operations.
Mattel owns, operates and manages manufacturing facilities and utilizes third-party manufacturers throughout Asia, primarily in China, Indonesia, Malaysia, Thailand, Canada, and Mexico. The risk of political instability and civil unrest exists in certain of these countries, which could temporarily or permanently damage Mattel’s manufacturing operations located there. In the past, outbreaks of SARS have been significantly concentrated in Asia, particularly in Hong Kong, and in the Guangdong
15
province of China, where many of Mattel’s manufacturing facilities and third-party manufacturers are located. The design, development and manufacture of Mattel’s products could suffer if a significant number of Mattel’s employees or the employees of its third-party manufacturers or their suppliers contract SARS, avian flu or other communicable diseases, or otherwise are unable to fulfill their obligations to Mattel. While Mattel has developed contingency plans designed to help mitigate the impact of disruptions in its manufacturing operations, its business, financial position, and results of operations could be negatively impacted by a significant disruption to its manufacturing operations or suppliers.
Earthquakes or other catastrophic events out of Mattel’s control may damage its facilities or those of its contractors and harm Mattel’s results of operations.
Mattel has significant operations near major earthquake faults, including its corporate headquarters in El Segundo, California. A catastrophic event where Mattel has important operations, such as an earthquake, tsunami, flood, typhoon, fire, or other natural or manmade disaster, could disrupt Mattel’s operations or those of its contractors and impair production or distribution of its products, damage inventory, interrupt critical functions, or otherwise affect its business negatively, harming Mattel’s results of operations.
The production and sale of private-label toys by Mattel’s retail customers may result in lower purchases of Mattel-branded products by those retail customers.
In recent years, consumer goods companies, including those in the toy business, generally have experienced the phenomenon of retail customers developing their own private-label products that directly compete with the products of traditional manufacturers. Some retail chains that are customers of Mattel sell private-label toys designed, manufactured and branded by the retailers themselves. These toys may be sold at prices lower than comparable toys sold by Mattel and may result in lower purchases of Mattel-branded products by these retailers. In some cases, retailers who sell these private-label toys are larger than Mattel and may have substantially more resources than Mattel.
Mattel depends on key personnel and may not be able to hire, retain, and integrate sufficient qualified personnel to maintain and expand its business.
Mattel’s future success depends partly on the continued contribution of key executives, designers, technical, sales, marketing, manufacturing, and other personnel. The loss of services of any of Mattel’s key personnel could harm Mattel’s business. Recruiting and retaining skilled personnel is costly and highly competitive. If Mattel fails to retain, hire, train, and integrate qualified employees and contractors, Mattel may not be able to maintain or expand its business.
Mattel may engage in acquisitions, mergers, dispositions, or other strategic transactions, which may affect the profit, revenues, profit margins, debt-to-capital ratio, capital expenditures, or other aspects of Mattel’s business. In addition, Mattel has certain anti-takeover provisions in its by-laws that may make it more difficult for a third party to acquire Mattel without its consent, which may adversely affect Mattel’s stock price.
Mattel regularly considers, and from time to time may engage in, discussions and negotiations regarding acquisitions, mergers, or dispositions or other strategic transactions that could affect the profit, revenues, profit margins, debt-to-capital ratio, capital expenditures, or other aspects of Mattel’s business. There can be no assurance that Mattel will be able to identify suitable acquisition targets or merger partners or that, if identified, it will be able to complete these transactions on terms acceptable to Mattel and to potential merger partners. There can also be no assurance that Mattel will be successful in integrating any acquired company into its overall operations, or that any such acquired company will operate profitably or will not otherwise adversely impact Mattel’s results of operations. Further, Mattel cannot be certain that key talented individuals at those acquired companies will continue to work for Mattel after the acquisition or that they will continue to develop popular and profitable products or services. In addition, Mattel has certain anti-takeover provisions in its by-laws that may make it more difficult for a third party to acquire Mattel without its consent, which may adversely affect Mattel’s stock price.
Mattel relies extensively on information technology in its operations, and any material failure, inadequacy, interruption, or security breach of that technology could have a material adverse impact on its business.
Mattel relies extensively on information technology systems across its operations, including for management of its supply chain, sale and delivery of its products and services, reporting its results of operations, collection and storage of consumer data, personal data of customers, employees and other stakeholders, and various other processes and transactions. Many of these systems are managed by third-party service providers. We use third party technology and systems for a variety of reasons, including, without limitation, encryption and authentication technology, employee email, content delivery to customers, back-office support, and other functions. A small and growing volume of our consumer products and services are web-based, and some are offered in conjunction with business partners or such third-party service providers. We and our business partners and
16
third-party service providers collect, process, store and transmit consumer data, including personal information, in connection with those products and services. Failure to follow applicable regulations related to those activities, or to prevent or mitigate data loss or other security breaches, including breaches of our business partners’ technology and systems could expose us or our customers to a risk of loss or misuse of such information, which could adversely affect our operating results, result in regulatory enforcement, other litigation and potential liability for us, and otherwise harm our business. Mattel’s ability to effectively manage its business and coordinate the production, distribution, and sale of its products and services depends significantly on the reliability and capacity of these systems and third-party service providers. Although we have developed systems and processes that are designed to protect customer information and prevent data loss and other security breaches, including systems and processes designed to reduce the impact of a security breach at a third party provider, such measures cannot provide absolute security.
Mattel has exposure to similar security risks faced by other large companies that have data stored on their information technology systems. To its knowledge, Mattel has not experienced any material breach of its cybersecurity systems. If Mattel’s or its third-party service providers’ systems fail to operate effectively or are damaged, destroyed, or shut down, or there are problems with transitioning to upgraded or replacement systems, or there are security breaches in these systems, any of the aforementioned could occur as a result of natural disasters, software or equipment failures, telecommunications failures, loss or theft of equipment, acts of terrorism, circumvention of security systems, or other cyber-attacks, Mattel could experience delays or decreases in product sales, and reduced efficiency of its operations. Additionally, any of these events could lead to violations of privacy laws, loss of customers, or loss, misappropriation or corruption of confidential information, trade secrets or data, which could expose Mattel to potential litigation, regulatory actions, sanctions or other statutory penalties, any or all of which could adversely affect its business, and cause it to incur significant losses and remediation costs.
The level of returns on pension plan assets and the actuarial assumptions used for valuation purposes could affect Mattel’s earnings in future periods. Changes in standards and government regulations could also affect its pension plan expense and funding requirements.
Assumptions used in determining projected benefit obligations and the fair value of plan assets for Mattel’s pension plan are evaluated by Mattel in consultation with outside actuaries. In the event that Mattel determines that changes are warranted in the assumptions used, such as the discount rate, expected long term rate of return, or health care costs, its future pension benefit expenses could increase or decrease. Due to changing market conditions or changes in the participant population, the actuarial assumptions that Mattel uses may differ from actual results, which could have a significant impact on its pension and postretirement liability and related costs. Funding obligations are determined based on the value of assets and liabilities on a specific date as required under relevant government regulations for each plan. Future pension funding requirements, and the timing of funding payments, could be affected by legislation enacted by the relevant governmental authorities.
If Mattel’s nonamortizable intangible assets or goodwill becomes impaired, Mattel’s results of operations could be adversely affected.
Mattel tests its nonamortizable intangible assets, including trademarks and trade names, and goodwill for impairment annually or more often if an event or circumstance indicates that an impairment may have occurred. The impairment test for nonamortizable intangible assets is performed by comparing the estimated fair values of the assets with their carrying values. Future changes in estimates used to determine the fair values may impact the fair value of Mattel’s intangible assets, which could result in a write-down, negatively impacting its results of operations. For purposes of evaluating whether goodwill is impaired, goodwill is allocated to various reporting units, which are at the operating segment level. Declines in profitability of Mattel’s reporting units may impact the fair value of its reporting units, which could result in a write-down of its goodwill, negatively impacting its results of operations.
Mattel’s stock price has been volatile over the past several years and could decline in the future, resulting in losses for our investors.
All the factors discussed in this section or any other material announcements or events could affect our stock price. In addition, quarterly fluctuations in our operating results, changes in investor and analyst perception of our business risks and conditions of our business, our ability to meet earnings estimates and other performance expectations of financial analysts or investors, unfavorable commentary or downgrades of our stock by research analysts, fluctuations in the stock prices of our peer companies or in stock markets in general, and general economic or political conditions could also cause the price of our stock to change. A significant drop in the price of our stock could expose us to the risk of securities class action lawsuits, which could result in substantial costs and divert management’s attention and resources, adversely affecting our business.
* * * * * * * * * * * * * * * * *
17
If any of the risks and uncertainties described in the cautionary risk factors listed above actually occurs, Mattel’s business, financial condition and results of operations could be significantly and adversely affected. The risk factors listed above are not exhaustive. Other sections of this Annual Report on Form 10-K include additional factors that could materially and adversely impact Mattel’s business, financial condition and results of operations. Moreover, Mattel operates in a very competitive and rapidly changing environment. New factors emerge from time to time, and it is not possible for management to predict the impact of all of these factors on Mattel’s business, financial condition or results of operations, or the extent to which any factor, or combination of factors, may cause actual results to differ materially from those contained in any forward-looking statements. Given these risks and uncertainties, investors should not rely on forward-looking statements as a prediction of actual results. Any or all of the forward-looking statements contained in this Annual Report on Form 10-K and any other public statement made by Mattel or its representatives may turn out to be wrong. Mattel expressly disclaims any obligation to update or revise any forward-looking statements, whether as a result of new developments or otherwise.
|
Item 1B.
|
Unresolved Staff Comments.
|
None.
|
Item 2.
|
Properties.
|
Mattel owns its corporate headquarters in El Segundo, California, consisting of approximately 335,000 square feet, and an adjacent office building consisting of approximately 55,000 square feet. Mattel also leases buildings in El Segundo consisting of approximately 327,000 square feet. All segments use these facilities. Mattel also owns facilities in East Aurora, New York, consisting of approximately 535,000 square feet, which is used by the North America segment and for brand and corporate support functions. American Girl owns its headquarters facilities in Middleton, Wisconsin, consisting of approximately 180,000 square feet, a warehouse in Middleton, consisting of approximately 215,000 square feet, and distribution facilities in Middleton, DeForest, and Wilmot, Wisconsin, consisting of a total of approximately 948,000 square feet, all of which are used by the American Girl segment. Additionally, Mattel leases a facility in Montreal, Canada, consisting of approximately 817,000 square feet, which is used for brand support and manufacturing functions, and a warehouse in Lachine, Canada, consisting of approximately 360,000 square feet. These facilities in Canada are used by both the North America and International segments. Mattel also owns its principal manufacturing facilities located in Indonesia, Malaysia, Mexico, and Thailand.
Mattel maintains leased offices in Arkansas, California, Minnesota, and New York, and leased warehouse and distribution facilities in California and Texas, all of which are used by the North America segment. Mattel has leased retail and related office space in Chicago, Illinois, Los Angeles, California, and New York, New York for its American Girl Place stores, and in Alpharetta, Georgia, Bloomington, Minnesota, Charlotte, North Carolina, Chesterfield, Missouri, Columbus, Ohio, Dallas, Texas, Houston, Texas, Lone Tree, Colorado, Lynnwood, Washington, McLean, Virginia, Miami, Florida, Nashville, Tennessee, Natick, Massachusetts, Orlando, Florida, Overland Park, Kansas, Palo Alto, California, and Scottsdale, Arizona for its American Girl stores. Internationally, Mattel has offices and/or warehouse space in Argentina, Australia, Austria, Belgium, Bermuda, Brazil, Canada, Chile, China, Colombia, Czech Republic, Denmark, France, Germany, Greece, Hong Kong, Hungary, India, Indonesia, Italy, Japan, Malaysia, Mexico, the Netherlands, New Zealand, Panama, Peru, Poland, Portugal, Russia, South Africa, South Korea, Spain, Switzerland, Taiwan, Turkey, the United Kingdom, and Venezuela, which are leased (with the exception of office and warehouse space in Chile and certain warehouse space in France that is owned by Mattel) and used by the International segment. Mattel also has office space and principal manufacturing facilities in China, which support both the North America and International segments.
For leases that are scheduled to expire during the next twelve months, Mattel may negotiate new lease agreements, renew existing lease agreements, or utilize alternate facilities. See Part II, Item 8 “Financial Statements and Supplementary Data—Note 11 to the Consolidated Financial Statements—Commitments and Contingencies.” Mattel believes that its owned and leased facilities, in general, are suitable and adequate for its present and currently foreseeable needs.
|
Item 3.
|
Legal Proceedings.
|
See Part II, Item 8 “Financial Statements and Supplementary Data—Note 11 to the Consolidated Financial Statements—Commitments and Contingencies—Litigation."
|
Item 4.
|
Mine Safety Disclosures.
|
Not applicable.
18
|
Item 5.
|
Market for the Registrant's Common Equity, Related Stockholder Matters and Issuer Purchases of Equity Securities.
|
Market Information
For information regarding the markets in which Mattel’s common stock, par value $1.00 per share, is traded, see the cover page hereof. For information regarding the high and low closing prices of Mattel’s common stock for the last two calendar years, see Item 8 “Financial Statements and Supplementary Data—Note 14 to the Consolidated Financial Statements—Quarterly Financial Information (Unaudited).”
Holders of Record
As of February 10, 2017, Mattel had approximately 28,000 holders of record of its common stock.
Dividends
During
2016
,
2015
, and
2014
, Mattel paid total dividends per share of $1.52, in each year, to holders of its common stock. The Board of Directors declared the dividends on a quarterly basis, and Mattel paid the dividends during the quarters in which the dividends were declared. The payment of dividends on common stock is at the discretion of the Board of Directors and is subject to customary limitations.
Under US federal income tax rules, corporate dividends are designated as a dividend or a non-dividend distribution based on the applicable “earnings and profits” of the entity paying the dividend. Although Mattel has significant retained earnings, these earnings do not constitute “earnings and profits” as defined in US federal tax rules. Non-dividend distributions are considered a return of capital and are generally not taxable; however, the recipient must adjust his cost basis to reflect the distribution. In
2016
, based on reasonable assumptions by Mattel, 100% of the distribution is a non-dividend distribution for US federal income tax purposes. Mattel expects more than 70% of its future dividends to be designated as a non-dividend distribution for US federal income tax purposes, assuming no changes to current business operations or current tax laws.
Recent Sales of Unregistered Securities
During the fourth quarter of
2016
, Mattel did not sell any unregistered securities.
Issuer Purchases of Equity Securities
During
2016
and
2015
, Mattel did not repurchase any shares of its common stock. During
2014
, Mattel repurchased 4.9 million shares of its common stock at a cost of $177.2 million.
The following table provides certain information with respect to Mattel’s purchases of its common stock during the fourth quarter of
2016
:
|
Period
|
Total Number of Shares (or Units) Purchased (1)
|
Average Price Paid per Share (or Unit)
|
Total Number of Shares (or Units) Purchased as Part of Publicly Announced Plans or Programs
|
Maximum Number (or Approximate Dollar Value) of Shares (or Units) that May Yet Be Purchased Under the Plans or Programs (2)
|
|||||||||
|
October 1—31
|
1,462
|
|
$
|
31.60
|
|
—
|
|
$
|
203,016,273
|
|
|||
|
November 1—30
|
5,067
|
|
31.37
|
|
—
|
|
203,016,273
|
|
|||||
|
December 1—31
|
25,887
|
|
29.34
|
|
—
|
|
203,016,273
|
|
|||||
|
Total
|
32,416
|
|
$
|
29.76
|
|
—
|
|
$
|
203,016,273
|
|
|||
|
(1)
|
The total number of shares purchased includes
32,416
shares withheld from employees to satisfy minimum tax withholding obligations that occur upon vesting of restricted stock units. These shares were not purchased as part of a publicly announced repurchase plan or program.
|
|
(2)
|
Mattel's share repurchase program was first announced on July 21, 2003. On July 17, 2013, the Board of Directors authorized Mattel to increase its share repurchase program by $500.0 million. At
December 31, 2016
, share repurchase authorizations of
$203.0 million
had not been executed. Repurchases under the program will take place from time to time, depending on market conditions. Mattel’s share repurchase program has no expiration date.
|
19
Performance Graph
The following graph compares the performance of Mattel common stock with that of the S&P 500 Index and the S&P 500 Consumer Discretionary Index. The Cumulative Total Return listed below assumes an initial investment of $100 on
December 31, 2011
and reinvestment of dividends.
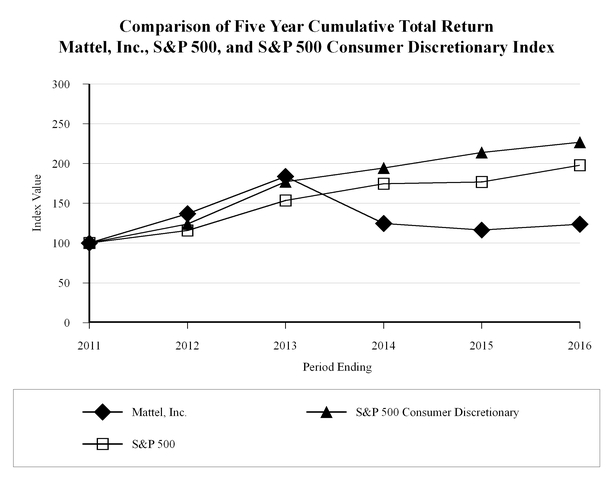
|
December 31,
|
|||||||||||||||||||||||
|
Cumulative Total Return
|
2011
|
2012
|
2013
|
2014
|
2015
|
2016
|
|||||||||||||||||
|
Mattel, Inc.
|
$
|
100.00
|
|
$
|
136.81
|
|
$
|
183.80
|
|
$
|
124.76
|
|
$
|
116.34
|
|
$
|
123.63
|
|
|||||
|
S&P 500
|
100.00
|
|
115.98
|
|
153.51
|
|
174.47
|
|
176.88
|
|
197.98
|
|
|||||||||||
|
S&P 500 Consumer Discretionary
|
100.00
|
|
123.90
|
|
177.24
|
|
194.38
|
|
214.03
|
|
226.92
|
|
|||||||||||
20
|
Item 6.
|
Selected Financial Data.
|
|
|
For the Year Ended December 31,
|
||||||||||||||||||
|
|
2016
|
2015
|
2014
|
2013
|
2012
|
||||||||||||||
|
|
(In thousands, except per share and percentage information)
|
||||||||||||||||||
|
Operating Results:
|
|||||||||||||||||||
|
Net sales
|
$
|
5,456,650
|
|
$
|
5,702,613
|
|
$
|
6,023,819
|
|
$
|
6,484,892
|
|
$
|
6,420,881
|
|
||||
|
Gross profit
|
2,554,391
|
|
2,806,358
|
|
3,001,022
|
|
3,478,883
|
|
3,409,197
|
|
|||||||||
|
% of net sales
|
46.8
|
%
|
49.2
|
%
|
49.8
|
%
|
53.6
|
%
|
53.1
|
%
|
|||||||||
|
Operating income (a)
|
519,233
|
|
540,922
|
|
653,714
|
|
1,168,103
|
|
1,021,015
|
|
|||||||||
|
% of net sales
|
9.5
|
%
|
9.5
|
%
|
10.9
|
%
|
18.0
|
%
|
15.9
|
%
|
|||||||||
|
Income before income taxes
|
409,742
|
|
463,915
|
|
586,910
|
|
1,099,128
|
|
945,045
|
|
|||||||||
|
Provision for income taxes (b)
|
91,720
|
|
94,499
|
|
88,036
|
|
195,184
|
|
168,581
|
|
|||||||||
|
Net income (a)
|
$
|
318,022
|
|
$
|
369,416
|
|
$
|
498,874
|
|
$
|
903,944
|
|
$
|
776,464
|
|
||||
|
Net Income Per Common Share—Basic (a)
|
$
|
0.93
|
|
$
|
1.08
|
|
$
|
1.46
|
|
$
|
2.61
|
|
$
|
2.25
|
|
||||
|
Net Income Per Common Share—Diluted (a)
|
$
|
0.92
|
|
$
|
1.08
|
|
$
|
1.45
|
|
$
|
2.58
|
|
$
|
2.22
|
|
||||
|
Dividends Declared Per Common Share
|
$
|
1.52
|
|
$
|
1.52
|
|
$
|
1.52
|
|
$
|
1.44
|
|
$
|
1.24
|
|
||||
|
|
December 31,
|
||||||||||||||||||
|
|
2016
|
2015
|
2014
|
2013
|
2012
|
||||||||||||||
|
|
(In thousands)
|
||||||||||||||||||
|
Financial Position:
|
|||||||||||||||||||
|
Total assets
|
$
|
6,493,794
|
|
$
|
6,535,143
|
|
$
|
6,721,983
|
|
$
|
6,439,626
|
|
$
|
6,526,785
|
|
||||
|
Noncurrent liabilities
|
2,580,439
|
|
2,256,360
|
|
2,684,026
|
|
2,140,627
|
|
1,743,729
|
|
|||||||||
|
Stockholders’ equity
|
2,407,782
|
|
2,633,254
|
|
2,949,071
|
|
3,251,559
|
|
3,067,044
|
|
|||||||||
|
(a)
|
In 2012, a charge arising from the litigation between Mattel and MGA Entertainment, Inc. resulted in reductions to operating income and net income of $137.8 million and $87.1 million, respectively. This litigation charge also negatively impacted both basic and diluted net income per common share by $0.25 per share.
|
|
(b)
|
The provision for income taxes in 2016 was positively impacted by net tax benefits of $16.8 million, primarily related to reassessments of prior years' tax liabilities based on the status of audits and tax filings in various jurisdictions around the world, settlements, and enacted tax law changes, and the adoption of a new accounting pronouncement. The provision for income taxes in 2015 was positively impacted by net tax benefits of $19.1 million, primarily related to reassessments of prior years' tax liabilities based on the status of audits and tax filings in various jurisdictions around the world, settlements, and enacted tax law changes. The provision for income taxes in 2014 was positively impacted by net tax benefits of $42.6 million, primarily related to reassessments of prior years’ tax liabilities based on the status of audits and tax filings in various jurisdictions around the world, settlements, and enacted tax law changes, partially offset by a tax charge related to a 2014 tax restructuring for the HIT Entertainment
®
and MEGA Brands operations. The provision for income taxes in 2013 was positively impacted by net tax benefits of $32.2 million, primarily related to reassessments of prior years’ tax liabilities based on the status of audits and tax filings in various jurisdictions around the world, settlements, and enacted tax law changes. The provision for income taxes in 2012 was positively impacted by net tax benefits of $16.0 million, primarily related to reassessments of prior years’ tax liabilities based on the status of audits and tax filings in various jurisdictions around the world, settlements, and enacted tax law changes.
|
21
|
Item 7.
|
Management's Discussion and Analysis of Financial Condition and Results of Operations.
|
The following discussion should be read in conjunction with the consolidated financial statements and the related notes. See Item 8 “Financial Statements and Supplementary Data.”
The following discussion also includes gross sales and currency exchange rate impact, non-GAAP financial measures within the meaning of Regulation G promulgated by the Securities and Exchange Commission (“Regulation G”), to supplement the financial results as reported in accordance with GAAP. Gross sales represent sales to customers, excluding the impact of sales adjustments, such as trade discounts and other allowances. The currency exchange rate impact reflects the portion (expressed as a percentage) of changes in Mattel's reported results that are attributable to fluctuations in currency exchange rates. Mattel uses these non-GAAP financial measures to analyze its continuing operations and to monitor, assess, and identify meaningful trends in its operating and financial performance. These measures are not, and should not be viewed as, a substitute for GAAP financial measures. Refer to “Non-GAAP Financial Measures” in this Annual Report on Form 10-K for a more detailed discussion, including a reconciliation of gross sales, a non-GAAP financial measure, to net sales, its most directly comparable GAAP financial measure.
Overview
Mattel is a creations company that inspires the wonder of childhood. Mattel’s objectives are to grow its share in the marketplace, continue to improve its operating margins, and create long-term stockholder value. To achieve these objectives, management has established the following strategies:
First, Mattel is focused on embracing brand building, creativity, and innovation, and management will put a premium on speed and personal accountability. Management is focused on putting Mattel back on track for growth and improved profitability.
Additionally, Mattel is organizing around the following five strategic priorities:
•
Build powerful brand franchises;
•
Establish Toy Box as the partner of choice;
•
Develop unmatched commercial excellence;
•
Drive continuous cost improvement; and
•
Build emerging market leadership.
2016
Overview
Mattel’s 2016 results were negatively impacted by industry-wide challenges, including a significant US toy category slowdown in the holiday period, and increased foreign exchange headwinds. The slowdown in industry sales growth triggered elevated retail promotional activity and decreased shipping, which had a significant impact on gross margin. Despite this, Mattel experienced solid performance in its core brands and saw significant growth in key emerging markets such as China.
Mattel’s
2016
financial highlights include the following:
•
Net sales in
2016
were $5.46 billion, a 4% decrease, as compared to
2015
net sales of $5.70 billion.
•
Gross sales in
2016
were $6.07 billion, a 3% decrease, as compared to
2015
gross sales of $6.28 billion.
|
•
|
Gross margin in
2016
was 46.8%, a decrease of 240 basis points from
2015
.
|
|
•
|
Operating income in
2016
was $519.2 million, as compared to operating income of $540.9 million in
2015
.
|
|
•
|
Earnings per share in
2016
was $0.92, as compared to earnings per share of $1.08 in
2015
.
|
2017
and Beyond
Mattel remains optimistic about performance in 2017 and beyond with a very strong licensed entertainment slate complemented by continuing key core brand momentum. In addition, Mattel believes its investments in emerging and developing markets, content partnerships, and innovation will support growth in the business.
22
Results of Operations
2016
Compared to
2015
Consolidated Results
Net sales for
2016
were
$5.46 billion
, a
4%
decrease, as compared to
$5.70 billion
in
2015
, with an unfavorable impact from changes in currency exchange rates of
2 percentage points
. Net income for
2016
was
$318.0 million
, or
$0.92
per diluted share, as compared to net income of
$369.4 million
, or
$1.08
per diluted share, in
2015
. Net income for
2016
was negatively impacted by lower gross profit, partially offset by lower other selling and administrative expenses and lower advertising and promotion expenses.
The following table provides a summary of Mattel’s consolidated results for
2016
and
2015
(in millions, except percentage and basis point information):
|
|
For the Year Ended
|
|
Year/Year Change
|
||||||||||||||||
|
December 31, 2016
|
December 31, 2015
|
|
|||||||||||||||||
|
Amount
|
|
% of Net
Sales |
Amount
|
|
% of Net
Sales |
|
%
|
|
Basis Points
of Net Sales |
||||||||||
|
Net sales
|
$
|
5,456.7
|
|
|
100.0
|
%
|
$
|
5,702.6
|
|
|
100.0
|
%
|
|
-4
|
%
|
—
|
|
||
|
Gross profit
|
$
|
2,554.4
|
|
46.8
|
%
|
$
|
2,806.4
|
|
49.2
|
%
|
-9
|
%
|
(240
|
)
|
|||||
|
Advertising and promotion expenses
|
634.9
|
|
11.6
|
|
717.9
|
|
12.6
|
|
-12
|
%
|
(100
|
)
|
|||||||
|
Other selling and administrative expenses
|
1,400.3
|
|
25.7
|
|
1,547.6
|
|
27.1
|
|
-10
|
%
|
(140
|
)
|
|||||||
|
Operating income
|
519.2
|
|
9.5
|
|
540.9
|
|
9.5
|
|
-4
|
%
|
—
|
|
|||||||
|
Interest expense
|
95.1
|
|
1.7
|
|
85.3
|
|
1.5
|
|
12
|
%
|
20
|
|
|||||||
|
Interest (income)
|
(9.1
|
)
|
-0.2
|
|
(7.2
|
)
|
-0.1
|
|
26
|
%
|
(10
|
)
|
|||||||
|
Other non-operating expense (income), net
|
23.5
|
|
(1.1
|
)
|
|||||||||||||||
|
Income before income taxes
|
$
|
409.7
|
|
7.5
|
%
|
$
|
463.9
|
|
8.1
|
%
|
-12
|
%
|
(60
|
)
|
|||||
Sales
Net sales for
2016
were
$5.46 billion
, a
4%
decrease, as compared to
$5.70 billion
in
2015
, with an unfavorable impact from changes in currency exchange rates of
2 percentage points
.
23
The following table provides a summary of Mattel’s consolidated gross sales by brand results for
2016
and
2015
:
|
|
For the Year Ended
|
|
% Change as
Reported |
|
Currency
Exchange Rate Impact |
||||||||
|
December 31, 2016
|
December 31, 2015
|
|
|||||||||||
|
(In millions, except percentage information)
|
|||||||||||||
|
Mattel Girls & Boys Brands:
|
|
||||||||||||
|
Barbie
|
$
|
971.8
|
|
|
$
|
905.9
|
|
|
7
|
%
|
-2
|
%
|
|
|
Other Girls
|
461.7
|
|
|
954.4
|
|
|
-52
|
%
|
-5
|
%
|
|||
|
Wheels
|
885.1
|
|
|
831.3
|
|
|
6
|
%
|
-5
|
%
|
|||
|
Entertainment
|
875.5
|
|
|
772.6
|
|
|
13
|
%
|
-3
|
%
|
|||
|
3,194.1
|
|
|
3,464.2
|
|
|
-8
|
%
|
-3
|
%
|
||||
|
Fisher-Price Brands:
|
|||||||||||||
|
Core Fisher-Price
|
1,262.8
|
|
|
1,224.1
|
|
|
3
|
%
|
-3
|
%
|
|||
|
Fisher-Price Friends
|
496.2
|
|
|
503.1
|
|
|
-1
|
%
|
-5
|
%
|
|||
|
Other Fisher-Price
|
129.1
|
|
|
125.0
|
|
|
3
|
%
|
-2
|
%
|
|||
|
1,888.1
|
|
|
1,852.2
|
|
|
2
|
%
|
-4
|
%
|
||||
|
American Girl Brands
|
570.8
|
|
|
572.0
|
|
|
—
|
%
|
—
|
%
|
|||
|
Construction and Arts & Crafts Brands
|
377.6
|
|
|
351.7
|
|
|
7
|
%
|
-8
|
%
|
|||
|
Other
|
43.1
|
|
|
43.5
|
|
|
|||||||
|
Total Gross Sales
|
$
|
6,073.7
|
|
|
$
|
6,283.6
|
|
|
-3
|
%
|
-3
|
%
|
|
|
Sales Adjustments
|
(617.0
|
)
|
(581.0
|
)
|
|||||||||
|
Total Net Sales
|
$
|
5,456.7
|
|
$
|
5,702.6
|
|
-4
|
%
|
-2
|
%
|
|||
Gross sales were
$6.07 billion
in
2016
, a decrease of
$209.9 million
, or
3%
, as compared to
$6.28 billion
in
2015
, with an unfavorable impact from changes in currency exchange rates of
3 percentage points
. The decrease in gross sales was due to lower sales of Other Girls products, partially offset by higher sales of Entertainment products. Of the 52% decrease in Other Girls gross sales, 47% was due to lower sales of Disney Princess products. Of the 13% increase in Entertainment gross sales, 12% was due to higher sales of DC Comics products.
Cost of Sales
Cost of sales as a percentage of net sales was
53.2%
in
2016
, as compared to
50.8%
in
2015
. Cost of sales in
2016
was flat with
2015
at
$2.90 billion
, as compared to a
4%
decrease in net sales. Within cost of sales, product and other costs increased by $52.4 million, or 2%, to $2.35 billion in
2016
from $2.30 billion in
2015
; royalty expenses decreased $35.7 million, or 13%, to $228.9 million in
2016
from $264.6 million in
2015
; and freight and logistics expenses decreased by $10.7 million, or 3%, to $322.7 million in
2016
from $333.4 million in
2015
.
Gross Margin
Gross margin decreased to
46.8%
in
2016
from
49.2%
in
2015
. The decrease in gross margin was primarily due to unfavorable foreign exchange, higher sales adjustments, and higher input costs, partially offset by strategic pricing and Funding Our Future savings.
Advertising and Promotion Expenses
Advertising and promotion expenses primarily consist of: (i) media costs, which primarily include the media, planning, and buying fees for television, print, and online advertisements, (ii) non-media costs, which primarily include commercial and website production, merchandising, and promotional costs, (iii) retail advertising costs, which primarily include consumer direct catalogs, newspaper inserts, fliers, and mailers, and (iv) generic advertising costs, which primarily include trade show costs. Advertising and promotion expenses as a percentage of net sales decreased to
11.6%
in
2016
from
12.6%
in
2015
, primarily as a result of lower media and non-media costs.
24
Other Selling and Administrative Expenses
Other selling and administrative expenses were
$1.40 billion
, or
25.7%
of net sales, in
2016
, as compared to
$1.55 billion
, or
27.1%
of net sales, in
2015
. The decrease in other selling and administrative expenses was primarily due to Funding Our Future net savings of approximately $60 million, lower incentive and equity compensation of approximately $36 million, and lower severance and restructuring charges of approximately $32 million.
Other Non-Operating Expense (Income), Net
Other non-operating expense was
$23.5 million
in
2016
, as compared to other non-operating income of
$1.1 million
in
2015
. The increase in other non-operating expense was primarily due to the change in the remeasurement rate used by Mattel's Venezuelan subsidiary, which resulted in an unrealized foreign currency exchange loss of approximately $26 million, in the first quarter of 2016.
Provision for Income Taxes
Mattel’s provision for income taxes was
$91.7 million
in
2016
, compared to
$94.5 million
in
2015
. Mattel's effective tax rate on income before income taxes in
2016
was 22.4%, as compared to 20.4% in
2015
. The
2016
income tax provision included net tax benefits of $16.8 million primarily related to reassessments of prior years' tax liabilities based on the status of audits and tax filings in various jurisdictions around the world, settlements, and enacted tax law changes, and the adoption of a new accounting pronouncement. The
2015
income tax provision included net tax benefits of $19.1 million primarily related to reassessments of prior years' tax liabilities based on the status of audits and tax filings in various jurisdictions around the world, settlements, and enacted tax law changes.
25
North America Segment
The following table provides a summary of Mattel’s gross sales by brand for the North America segment for
2016
and
2015
:
|
|
For the Year Ended
|
% Change as
Reported |
Currency
Exchange Rate Impact |
||||||||||
|
|
December 31, 2016
|
December 31, 2015
|
|||||||||||
|
|
(In millions, except percentage information)
|
||||||||||||
|
Mattel Girls & Boys Brands:
|
|
|
|||||||||||
|
Barbie
|
$
|
489.1
|
|
|
$
|
433.9
|
|
|
13
|
%
|
—
|
%
|
|
|
Other Girls
|
219.6
|
|
|
443.9
|
|
|
-51
|
%
|
-1
|
%
|
|||
|
Wheels
|
446.0
|
|
|
409.9
|
|
|
9
|
%
|
—
|
%
|
|||
|
Entertainment
|
496.8
|
|
|
417.4
|
|
|
19
|
%
|
—
|
%
|
|||
|
1,651.5
|
|
1,705.1
|
|
-3
|
%
|
—
|
%
|
||||||
|
Fisher-Price Brands:
|
|||||||||||||
|
Core Fisher-Price
|
740.9
|
|
734.0
|
|
1
|
%
|
—
|
%
|
|||||
|
Fisher-Price Friends
|
249.5
|
|
263.6
|
|
-5
|
%
|
—
|
%
|
|||||
|
Other Fisher-Price
|
121.5
|
|
117.3
|
|
4
|
%
|
—
|
%
|
|||||
|
1,111.9
|
|
1,114.9
|
|
—
|
%
|
—
|
%
|
||||||
|
Construction and Arts & Crafts Brands
|
253.4
|
|
245.4
|
|
3
|
%
|
—
|
%
|
|||||
|
Other
|
19.4
|
|
18.5
|
|
|||||||||
|
Total Gross Sales
|
$
|
3,036.2
|
|
$
|
3,083.9
|
|
-2
|
%
|
-1
|
%
|
|||
|
Sales Adjustments
|
(198.4
|
)
|
(192.8
|
)
|
|||||||||
|
Total Net Sales
|
$
|
2,837.8
|
|
$
|
2,891.1
|
|
-2
|
%
|
—
|
%
|
|||
Gross sales for the North America segment were
$3.04 billion
in
2016
, a decrease of
$47.7 million
or
2%
, as compared to
$3.08 billion
in
2015
, with an unfavorable impact from changes in currency exchange rates of
1 percentage point
. The decrease in the North America segment gross sales was primarily due to lower sales of Other Girls products, partially offset by higher sales of Entertainment and Barbie products. Of the 51% decrease in Other Girls gross sales, 47% was due to lower sales of Disney Princess products. Of the 19% increase in Entertainment gross sales, 12% was due to higher sales of DC Comics products and 5% was due to initial sales of Fuhu
®
tablets. The 13% increase in Barbie gross sales was due to sales of the Fashionistas
®
and I Can Be
®
product lines, and the new younger girl product line, Barbie Dreamtopia, as well as licensing revenue recorded during the second quarter. Cost of sales decreased 2% in
2016
, as compared to a 2% decrease in net sales, primarily due to lower product and other costs and lower royalty expenses. Gross margins in
2016
were flat with
2015
.
North America segment income increased by 5% to
$564.4 million
in
2016
, as compared to
$538.2 million
in
2015
, primarily due to lower advertising and promotion expenses, partially offset by lower gross profit.
International Segment
The following table provides a summary of percentage changes in net sales within the International segment in
2016
versus
2015
:
|
% Change in
Net Sales as Reported
|
Currency Exchange Rate Impact
|
||||
|
Total International Segment
|
-8
|
%
|
-6
|
%
|
|
|
Europe
|
-9
|
%
|
-6
|
%
|
|
|
Latin America
|
-12
|
%
|
-9
|
%
|
|
|
Asia Pacific
|
—
|
%
|
-3
|
%
|
|
26
The following table provides a summary of percentage changes in gross sales within the International segment in
2016
versus
2015
:
|
% Change in
Gross Sales as Reported
|
Currency Exchange Rate Impact
|
||||
|
Total International Segment
|
-6
|
%
|
-7
|
%
|
|
|
Europe
|
-7
|
%
|
-7
|
%
|
|
|
Latin America
|
-10
|
%
|
-10
|
%
|
|
|
Asia Pacific
|
3
|
%
|
-2
|
%
|
|
The following table provides a summary of Mattel’s gross sales by brand for the International segment for
2016
and
2015
:
|
|
For the Year Ended
|
|
% Change as
Reported |
|
Currency
Exchange Rate Impact |
||||||||
|
|
December 31, 2016
|
December 31, 2015
|
|
||||||||||
|
|
(In millions, except percentage information)
|
||||||||||||
|
Mattel Girls & Boys Brands:
|
|
|
|
||||||||||
|
Barbie
|
$
|
482.7
|
|
|
$
|
472.0
|
|
|
2
|
%
|
-5
|
%
|
|
|
Other Girls
|
242.1
|
|
|
510.5
|
|
|
-53
|
%
|
-8
|
%
|
|||
|
Wheels
|
439.1
|
|
|
421.4
|
|
|
4
|
%
|
-8
|
%
|
|||
|
Entertainment
|
378.7
|
|
|
355.2
|
|
|
7
|
%
|
-5
|
%
|
|||
|
1,542.6
|
|
1,759.1
|
|
-12
|
%
|
-6
|
%
|
||||||
|
Fisher-Price Brands:
|
|||||||||||||
|
Core Fisher-Price
|
521.9
|
|
490.1
|
|
6
|
%
|
-7
|
%
|
|||||
|
Fisher-Price Friends
|
246.7
|
|
239.5
|
|
3
|
%
|
-9
|
%
|
|||||
|
Other Fisher-Price
|
7.6
|
|
7.7
|
|
-1
|
%
|
-16
|
%
|
|||||
|
776.2
|
|
737.3
|
|
5
|
%
|
-7
|
%
|
||||||
|
American Girl Brands
|
2.5
|
|
—
|
|
|||||||||
|
Construction and Arts & Crafts Brands
|
124.0
|
|
106.3
|
|
17
|
%
|
-20
|
%
|
|||||
|
Other
|
2.3
|
|
0.8
|
|
|||||||||
|
Total Gross Sales
|
$
|
2,447.6
|
|
$
|
2,603.5
|
|
-6
|
%
|
-7
|
%
|
|||
|
Sales Adjustments
|
(392.8
|
)
|
(362.0
|
)
|
|||||||||
|
Total Net Sales
|
$
|
2,054.8
|
|
$
|
2,241.5
|
|
-8
|
%
|
-6
|
%
|
|||
Gross sales for the International segment were
$2.45 billion
in
2016
, a decrease of
$155.9 million
or
6%
, as compared to
$2.60 billion
in
2015
, with an unfavorable impact from changes in currency exchange rates of
7 percentage points
. The decrease in the International segment gross sales was primarily due to lower sales of Other Girls products, partially offset by higher sales of Construction and Arts & Crafts Brands products. Of the 53% decrease in Other Girls gross sales, 47% was due to lower sales of Disney Princess products. Of the 17% increase in Construction and Arts & Crafts gross sales, 14% was due to initial sales of Teenage Mutant Ninja Turtles MEGA BLOKS products. Cost of sales increased 4% in
2016
, as compared to an 8% decrease in net sales, primarily due to higher product and other costs, partially offset by lower royalty expenses. Gross margins in
2016
decreased as a result of unfavorable foreign currency exchange rates, higher input costs, and higher sales adjustments, partially offset by strategic pricing and Funding Our Future savings.
International segment income decreased by 9% to
$291.2 million
in
2016
, as compared to
$321.1 million
in
2015
, primarily due to lower gross profit, partially offset by lower advertising and promotion expenses and lower other selling and administrative expenses.
27
American Girl Segment
The following table provides a summary of Mattel’s gross sales by brand for the American Girl segment for
2016
and
2015
:
|
|
For the Year Ended
|
|
% Change as
Reported |
|
Currency
Exchange Rate Impact |
||||||||
|
|
December 31, 2016
|
December 31, 2015
|
|
||||||||||
|
|
(In millions, except percentage information)
|
||||||||||||
|
American Girl Segment:
|
|
|
|||||||||||
|
American Girl Brands
|
$
|
568.3
|
|
$
|
572.0
|
|
|
-1
|
%
|
-1
|
%
|
||
|
Construction and Arts & Crafts Brands
|
0.2
|
|
—
|
|
|||||||||
|
Other
|
21.4
|
|
24.2
|
|
|
-12
|
%
|
-1
|
%
|
||||
|
Total Gross Sales
|
$
|
589.9
|
|
$
|
596.2
|
|
-1
|
%
|
—
|
%
|
|||
|
Sales Adjustments
|
(25.8
|
)
|
(26.2
|
)
|
|||||||||
|
Total Net Sales
|
$
|
564.1
|
|
$
|
570.0
|
|
-1
|
%
|
—
|
%
|
|||
Gross sales for the American Girl segment were
$589.9 million
in
2016
, a decrease of
$6.3 million
or
1%
, as compared to
$596.2 million
in
2015
. Cost of sales decreased 3% in
2016
, as compared to a 1% decrease in net sales, primarily due to lower product and other costs and lower freight and logistics costs. Gross margins in
2016
increased as a result of higher licensing income and Funding Our Future savings.
American Girl segment income increased by 52% to
$106.4 million
in
2016
, as compared to
$69.9 million
in
2015
, primarily due to the new franchise licensing agreement to expand the brand into the Middle East, lower advertising and promotion expenses, and lower other selling and administrative expenses.
2015
Compared to
2014
Consolidated Results
Net sales for
2015
were
$5.70 billion
, a
5%
decrease, as compared to
$6.02 billion
in
2014
, with an unfavorable impact from changes in currency exchange rates of
7 percentage points
. Net income for
2015
was
$369.4 million
, or
$1.08
per diluted share, as compared to net income of
$498.9 million
, or
$1.45
per diluted share, in
2014
. Net income for
2015
was negatively impacted by unfavorable foreign exchange and lower gross profit, partially offset by Funding Our Future savings.
The following table provides a summary of Mattel’s consolidated results for
2015
and
2014
(in millions, except percentage and basis point information):
|
|
For the Year Ended
|
|
Year/Year Change
|
||||||||||||||||
|
December 31, 2015
|
December 31, 2014
|
|
|||||||||||||||||
|
Amount
|
|
% of Net
Sales |
Amount
|
|
% of Net
Sales |
|
%
|
|
Basis Points
of Net Sales |
||||||||||
|
Net sales
|
$
|
5,702.6
|
|
|
100.0
|
%
|
$
|
6,023.8
|
|
|
100.0
|
%
|
|
-5
|
%
|
—
|
|
||
|
Gross profit
|
$
|
2,806.4
|
|
49.2
|
%
|
$
|
3,001.0
|
|
49.8
|
%
|
-6
|
%
|
–60
|
|
|||||
|
Advertising and promotion expenses
|
717.9
|
|
12.6
|
|
733.2
|
|
12.2
|
|
-2
|
%
|
40
|
|
|||||||
|
Other selling and administrative expenses
|
1,547.6
|
|
27.1
|
|
1,614.1
|
|
26.8
|
|
-4
|
%
|
30
|
|
|||||||
|
Operating income
|
540.9
|
|
9.5
|
|
653.7
|
|
10.9
|
|
-17
|
%
|
–140
|
|
|||||||
|
Interest expense
|
85.3
|
|
1.5
|
|
79.3
|
|
1.3
|
|
8
|
%
|
20
|
|
|||||||
|
Interest (income)
|
(7.2
|
)
|
-0.1
|
|
(7.4
|
)
|
-0.1
|
|
-2
|
%
|
—
|
|
|||||||
|
Other non-operating (income), net
|
(1.1
|
)
|
(5.1
|
)
|
|||||||||||||||
|
Income before income taxes
|
$
|
463.9
|
|
8.1
|
%
|
$
|
586.9
|
|
9.7
|
%
|
-21
|
%
|
–160
|
|
|||||
Sales
Net sales for
2015
were
$5.70 billion
, a
5%
decrease, as compared to
$6.02 billion
in
2014
, with an unfavorable impact from changes in currency exchange rates of
7 percentage points
.
28
The following table provides a summary of Mattel’s consolidated gross sales by brand for
2015
and
2014
:
|
|
For the Year Ended
|
|
% Change as
Reported |
|
Currency
Exchange Rate Impact |
||||||||
|
December 31, 2015
|
December 31, 2014
|
|
|||||||||||
|
(In millions, except percentage information)
|
|||||||||||||
|
Mattel Girls & Boys Brands:
|
|
||||||||||||
|
Barbie
|
$
|
905.9
|
|
|
$
|
1,009.5
|
|
|
-10
|
%
|
-9
|
%
|
|
|
Other Girls
|
954.4
|
|
|
1,293.5
|
|
|
-26
|
%
|
-9
|
%
|
|||
|
Wheels
|
831.3
|
|
|
754.9
|
|
|
10
|
%
|
-11
|
%
|
|||
|
Entertainment
|
772.6
|
|
|
839.3
|
|
|
-8
|
%
|
-9
|
%
|
|||
|
3,464.2
|
|
|
3,897.2
|
|
|
-11
|
%
|
-9
|
%
|
||||
|
Fisher-Price Brands:
|
|||||||||||||
|
Core Fisher-Price
|
1,224.1
|
|
|
1,213.4
|
|
|
1
|
%
|
-7
|
%
|
|||
|
Fisher-Price Friends
|
503.1
|
|
|
504.8
|
|
|
—
|
%
|
-6
|
%
|
|||
|
Other Fisher-Price
|
125.0
|
|
|
124.4
|
|
|
—
|
%
|
-2
|
%
|
|||
|
1,852.2
|
|
|
1,842.6
|
|
|
1
|
%
|
-6
|
%
|
||||
|
American Girl Brands
|
572.0
|
|
|
618.7
|
|
|
-8
|
%
|
-1
|
%
|
|||
|
Construction and Arts & Crafts Brands
|
351.7
|
|
|
315.0
|
|
|
|||||||
|
Other
|
43.5
|
|
|
44.9
|
|
|
|||||||
|
Total Gross Sales
|
$
|
6,283.6
|
|
|
$
|
6,718.4
|
|
|
-6
|
%
|
-7
|
%
|
|
|
Sales Adjustments
|
(581.0
|
)
|
(694.6
|
)
|
|||||||||
|
Total Net Sales
|
$
|
5,702.6
|
|
$
|
6,023.8
|
|
-5
|
%
|
-7
|
%
|
|||
Gross sales were
$6.28 billion
in
2015
, a decrease of
$434.8 million
or
6%
, compared to
$6.72 billion
in
2014
, with an unfavorable impact from changes in currency exchange rates of
7 percentage points
. The decrease in gross sales was primarily due to lower sales of Other Girls and Barbie products, partially offset by higher sales of Wheels. Of the 26% decrease in Other Girls gross sales, 19% was due to lower sales of Monster High products and 4% was due to lower sales of Disney Princess products. The 10% decrease in Barbie gross sales was due to continued inventory overhang in certain European markets and increased competition within the doll category in certain international markets. Of the 10% increase in Wheels gross sales, 10% was due to higher sales of Hot Wheels products.
Cost of Sales
Cost of sales as a percentage of net sales was
50.8%
in
2015
, as compared to
50.2%
in
2014
. Cost of sales decreased by
$126.5 million
, or
4%
, from
$3.02 billion
in
2014
to
$2.90 billion
in
2015
, as compared to a
5%
decrease in net sales. Within cost of sales, product and other costs decreased by $145.0 million, or 6%, from $2.44 billion in
2014
to $2.30 billion in
2015
; royalty expenses increased $22.2 million, or 9%, from $242.4 million in
2014
to $264.6 million in
2015
; and freight and logistics expenses decreased by $3.7 million, or 1%, from $337.1 million in
2014
to $333.4 million in
2015
.
Gross Margin
Gross margin decreased from
49.8%
in
2014
to
49.2%
in
2015
. The decrease in gross margin was due to unfavorable foreign exchange, higher product-related costs, unfavorable product mix, and higher royalty expenses, partially offset by price increases and Funding Our Future savings.
Advertising and Promotion Expenses
Advertising and promotion expenses primarily consist of: (i) media costs, which primarily include the media, planning, and buying fees for television, print, and online advertisements, (ii) non-media costs, which primarily include commercial and website production, merchandising, and promotional costs, (iii) retail advertising costs, which primarily include consumer direct catalogs, newspaper inserts, fliers, and mailers and (iv) generic advertising costs, which primarily include trade show costs. Advertising and promotion expenses as a percentage of net sales increased from
12.2%
in
2014
to
12.6%
in
2015
, primarily as a result of Mattel's investments to support core brands throughout the year.
29
Other Selling and Administrative Expenses
Other selling and administrative expenses decreased from
$1.61 billion
, or
26.8%
of net sales, in
2014
to
$1.55 billion
, or
27.1%
of net sales, in
2015
. The decrease in other selling and administrative expenses was primarily due to Funding Our Future savings of approximately $70 million.
Non-Operating Items
Interest expense increased $6.0 million from $79.3 million in
2014
to $85.3 million in
2015
, primarily due to higher average outstanding long-term borrowings.
Provision for Income Taxes
Mattel’s effective tax rate on income before income taxes in
2015
was 20.4%, as compared to 15.0% in
2014
. The
2015
and
2014
income tax provisions included net tax benefits of $19.1 million and $42.6 million, respectively. The
2015
net tax benefits primarily relate to reassessments of prior years’ tax liabilities based on the status of audits and tax filings in various jurisdictions around the world, settlements, and enacted tax law changes. The
2014
net tax benefits primarily relate to reassessments of prior year's tax liabilities based on the status of audits and tax filings in various jurisdictions around the world, settlements, and enacted tax law changes, partially offset by a tax charge related to a
2014
tax restructuring for the HIT Entertainment and MEGA Brands operations.
North America Segment
The following table provides a summary of Mattel’s gross sales by brand for the North America segment for
2015
and
2014
:
|
|
For the Year Ended
|
% Change as
Reported |
Currency
Exchange Rate Impact |
||||||||||
|
|
December 31, 2015
|
December 31, 2014
|
|||||||||||
|
|
(In millions, except percentage information)
|
||||||||||||
|
Mattel Girls & Boys Brands:
|
|
|
|||||||||||
|
Barbie
|
$
|
433.9
|
|
|
$
|
423.6
|
|
|
2
|
%
|
-1
|
%
|
|
|
Other Girls
|
443.9
|
|
|
563.1
|
|
|
-21
|
%
|
—
|
%
|
|||
|
Wheels
|
409.9
|
|
|
337.9
|
|
|
21
|
%
|
-1
|
%
|
|||
|
Entertainment
|
417.4
|
|
|
379.0
|
|
|
10
|
%
|
-1
|
%
|
|||
|
1,705.1
|
|
1,703.6
|
|
—
|
%
|
-1
|
%
|
||||||
|
Fisher-Price Brands:
|
|||||||||||||
|
Core Fisher-Price
|
734.0
|
|
682.5
|
|
8
|
%
|
—
|
%
|
|||||
|
Fisher-Price Friends
|
263.6
|
|
279.7
|
|
-6
|
%
|
-1
|
%
|
|||||
|
Other Fisher-Price
|
117.3
|
|
108.3
|
|
8
|
%
|
-1
|
%
|
|||||
|
1,114.9
|
|
1,070.5
|
|
4
|
%
|
-1
|
%
|
||||||
|
Construction and Arts & Crafts Brands
|
245.4
|
|
220.5
|
|
|||||||||
|
Other
|
18.5
|
|
17.0
|
|
|||||||||
|
Total Gross Sales
|
$
|
3,083.9
|
|
$
|
3,011.6
|
|
2
|
%
|
-1
|
%
|
|||
|
Sales Adjustments
|
(192.8
|
)
|
(213.3
|
)
|
|||||||||
|
Total Net Sales
|
$
|
2,891.1
|
|
$
|
2,798.3
|
|
3
|
%
|
-1
|
%
|
|||
Gross sales for the North America segment were
$3.08 billion
in
2015
, an increase of
$72.3 million
, or
2%
, as compared to
$3.01 billion
in
2014
, with an unfavorable impact from changes in currency exchange rates of
1 percentage point
. The increase in the North America segment gross sales was primarily due to higher sales of Wheels and Entertainment products, partially offset by lower sales of Other Girls products. Of the 21% increase in Wheels gross sales, 20% was due to higher sales of Hot Wheels products. Of the 10% increase in Entertainment gross sales, 18% was due to initial sales of Minecraft products, 3% was due to higher sales of WWE Wrestling products, and 3% was due to initial sales of Dinotrux
®
, partially offset by lower sales of Disney Planes products of 14%. Of the 21% decrease in Other Girls gross sales, 10% was due to lower sales of Monster High products and 10% was due to lower sales of Disney Princess products. Cost of sales increased 2% in
2015
, compared to a 3% increase in net sales, primarily due to higher product and other costs, higher freight and logistics expenses, and higher royalty expenses, partially offset by Funding Our Future savings. Gross margins increased due to Funding Our Future savings.
30
North America segment income increased 17% to
$538.2 million
in
2015
, as compared to
$459.8 million
in
2014
, due to higher gross profit and lower other selling and administrative expenses.
International Segment
The following table provides a summary of percentage changes in net sales within the International segment in
2015
versus
2014
:
|
% Change in
Net Sales as Reported
|
Currency Exchange Rate Impact
|
||||
|
Total International Segment
|
-14
|
%
|
-16
|
%
|
|
|
Europe
|
-17
|
%
|
-15
|
%
|
|
|
Latin America
|
-19
|
%
|
-21
|
%
|
|
|
Asia Pacific
|
8
|
%
|
-8
|
%
|
|
The following table provides a summary of percentage changes in gross sales within the International segment in
2015
versus
2014
:
|
% Change in
Gross Sales as Reported
|
Currency Exchange Rate Impact
|
||||
|
Total International Segment
|
-15
|
%
|
-16
|
%
|
|
|
Europe
|
-18
|
%
|
-15
|
%
|
|
|
Latin America
|
-22
|
%
|
-21
|
%
|
|
|
Asia Pacific
|
8
|
%
|
-8
|
%
|
|
The following table provides a summary of Mattel’s gross sales by brand for the International segment for
2015
and
2014
:
|
|
For the Year Ended
|
|
% Change as
Reported |
|
Currency
Exchange Rate Impact |
||||||||
|
|
December 31, 2015
|
December 31, 2014
|
|
||||||||||
|
|
(In millions, except percentage information)
|
||||||||||||
|
Mattel Girls & Boys Brands:
|
|
|
|
||||||||||
|
Barbie
|
$
|
472.0
|
|
|
$
|
585.9
|
|
|
-19
|
%
|
-15
|
%
|
|
|
Other Girls
|
510.5
|
|
|
730.4
|
|
|
-30
|
%
|
-15
|
%
|
|||
|
Wheels
|
421.4
|
|
|
417.0
|
|
|
1
|
%
|
-19
|
%
|
|||
|
Entertainment
|
355.2
|
|
|
460.3
|
|
|
-23
|
%
|
-16
|
%
|
|||
|
1,759.1
|
|
2,193.6
|
|
-20
|
%
|
-16
|
%
|
||||||
|
Fisher-Price Brands:
|
|||||||||||||
|
Core Fisher-Price
|
490.1
|
|
530.9
|
|
-8
|
%
|
-14
|
%
|
|||||
|
Fisher-Price Friends
|
239.5
|
|
225.1
|
|
6
|
%
|
-12
|
%
|
|||||
|
Other Fisher-Price
|
7.7
|
|
16.1
|
|
-52
|
%
|
-12
|
%
|
|||||
|
737.3
|
|
772.1
|
|
-4
|
%
|
-13
|
%
|
||||||
|
Construction and Arts & Crafts Brands
|
106.3
|
|
94.5
|
|
|||||||||
|
Other
|
0.8
|
|
1.3
|
|
|||||||||
|
Total Gross Sales
|
$
|
2,603.5
|
|
$
|
3,061.5
|
|
-15
|
%
|
-16
|
%
|
|||
|
Sales Adjustments
|
(362.0
|
)
|
(460.3
|
)
|
|||||||||
|
Total Net Sales
|
$
|
2,241.5
|
|
$
|
2,601.2
|
|
-14
|
%
|
-16
|
%
|
|||
31
Gross sales for the International segment were
$2.60 billion
in
2015
, a decrease of
$458.0 million
, or
15%
, as compared to
$3.06 billion
in
2014
, with an unfavorable impact from changes in currency exchange rates of
16 percentage points
. The decrease in the International segment gross sales was primarily due to lower sales of Other Girls, Entertainment, and Barbie products. Of the 30% decrease in Other Girls gross sales, 27% was due to lower sales of Monster High products. Of the 23% decrease in Entertainment gross sales, 12% was due to lower sales of Disney Planes products and 7% was due to lower sales of Max Steel products. The 19% decrease in Barbie gross sales was due to continued inventory overhang in certain European markets and increased competition within the doll category in certain international markets. Cost of sales decreased 18% in
2015
, as compared to a 14% decrease in net sales, primarily due to Funding Our Future savings and lower freight and logistics expenses, partially offset by higher product and other costs. Gross margins increased due to Funding Our Future savings.
International segment income decreased 11% to
$321.1 million
in
2015
, as compared to
$359.9 million
in
2014
, primarily due to lower gross profit, partially offset by lower other selling and administrative expenses and lower advertising and promotion expenses.
American Girl Segment
The following table provides a summary of Mattel’s gross sales by brand for the American Girl segment for
2015
and
2014
:
|
|
For the Year Ended
|
|
% Change as
Reported |
|
Currency
Exchange Rate Impact |
||||||||
|
|
December 31, 2015
|
December 31, 2014
|
|
||||||||||
|
|
(In millions, except percentage information)
|
||||||||||||
|
American Girl Segment:
|
|
|
|||||||||||
|
American Girl Brands
|
$
|
572.0
|
|
$
|
618.7
|
|
|
-8
|
%
|
-1
|
%
|
||
|
Other
|
24.2
|
|
26.6
|
|
|
-9
|
%
|
-11
|
%
|
||||
|
Total Gross Sales
|
$
|
596.2
|
|
$
|
645.3
|
|
-8
|
%
|
-1
|
%
|
|||
|
Sales Adjustments
|
(26.2
|
)
|
(21.0
|
)
|
|||||||||
|
Total Net Sales
|
$
|
570.0
|
|
$
|
624.3
|
|
-9
|
%
|
-1
|
%
|
|||
Gross sales for the American Girl segment were
$596.2 million
in
2015
, a decrease of
$49.1 million
, or
8%
, as compared to
$645.3 million
in
2014
, with an unfavorable impact from changes in currency exchange rates of
1 percentage point
. Cost of sales decreased 6% in
2015
, as compared to a 9% decrease in net sales, primarily due to lower product and other costs. Gross margins decreased due to higher product-related costs, partially offset by Funding Our Future savings.
American Girl segment income decreased 38% to
$69.9 million
in
2015
, as compared to
$113.6 million
in
2014
, primarily due to lower gross profit.
Cost Savings Programs
During 2013, Mattel initiated Operational Excellence 3.0, which targeted cumulative gross cost savings of approximately $175 million by the end of 2014. Mattel exceeded its Operational Excellence 3.0 goal by realizing approximately $179 million of cumulative gross cost savings throughout the program.
During
2014
, Mattel realized gross cost savings before severance charges and investments of approximately $119 million (or approximately $74 million in net cost savings). Of the gross cost savings realized in
2014
, approximately $77 million was reflected within gross profit, approximately $35 million within other selling and administrative expenses, and approximately $7 million within advertising and promotion expenses.
During
2015
, Mattel initiated the next phase of its cost savings program, Funding Our Future, which targeted additional cumulative gross cost savings of approximately $250 million to $300 million by the end of 2016. Mattel achieved cumulative gross cost savings of approximately $295 million, which was at the high end of its Funding Our Future goal. The cost savings program was designed to generate cost savings through various initiatives, including structural and process improvements and supply chain optimization.
During 2015, Mattel realized gross cost savings before severance charges and investments of approximately $153 million (or approximately $92 million in net cost savings). Of the gross cost savings realized in 2015, approximately $70 million was reflected within gross profit, approximately $73 million within other selling and administrative expenses, and approximately $10 million within advertising and promotion expenses.
32
During
2016
, Mattel realized gross cost savings before severance charges and investments of approximately $142 million (or approximately $123 million in net cost savings). Of the gross cost savings realized in
2016
, approximately $74 million was reflected within gross profit, approximately $60 million within other selling and administrative expenses, and approximately $8 million within advertising and promotion expenses.
Income Taxes
Mattel’s effective tax rate on income before income taxes in
2016
was 22.4%, as compared to 20.4% in
2015
. The
2016
income tax provision included net tax benefits of $16.8 million, primarily related to reassessments of prior years’ tax liabilities based on the status of audits and tax filings in various jurisdictions around the world, settlements, and enacted tax law changes, and the adoption of a new accounting pronouncement.
Mattel’s effective tax rate on income before income taxes in
2015
and
2014
was 20.4% and 15.0%, respectively. The
2015
income tax provision included net tax benefits of $19.1 million, primarily related to reassessments of prior years’ tax liabilities based on the status of audits and tax filings in various jurisdictions around the world, settlements, and enacted tax law changes.
The
2014
income tax provision included net tax benefits of $42.6 million, primarily related to reassessments of prior years’ tax liabilities based on the status of audits and tax filings in various jurisdictions around the world, settlements, and enacted tax law changes, partially offset by a tax charge related to a 2014 tax restructuring for the HIT Entertainment and MEGA Brands operations.
In the first quarter of 2016, Mattel retrospectively adopted ASU 2015-17,
Balance Sheet Classification of Deferred Taxes
, which generally simplifies the classification of all deferred tax assets and liabilities, along with any related valuation allowance, into noncurrent amounts on the balance sheet. As of December 31, 2015, prepaid expenses and other current assets decreased by
$195.8 million
, other noncurrent assets increased by
$193.6 million
, and other noncurrent liabilities decreased by
$2.2 million
from the previously reported amounts.
Liquidity and Capital Resources
Mattel’s primary sources of liquidity are its cash and equivalents balances, access to short-term borrowing facilities, including its $1.60 billion domestic unsecured committed revolving credit facility (“Credit Facility”), and issuances of long-term debt securities. Cash flows from operating activities could be negatively impacted by decreased demand for Mattel’s products, which could result from factors such as adverse economic conditions and changes in public and consumer preferences, or by increased costs associated with manufacturing and distribution of products or shortages in raw materials or component parts. Additionally, Mattel’s ability to issue long-term debt and obtain seasonal financing could be adversely affected by factors such as global economic crises and tight credit environments, an inability to meet its debt covenant requirements, which include maintaining consolidated debt-to-earnings before interest, taxes, depreciation, and amortization (“EBITDA”) and interest coverage ratios, or a deterioration of Mattel’s credit ratings. Mattel’s ability to conduct its operations could be negatively impacted should these or other adverse conditions affect its primary sources of liquidity.
Of Mattel’s $869.5 million in cash and equivalents as of
December 31, 2016
, approximately $683 million is held by foreign subsidiaries. Mattel may need to accrue and pay additional income taxes if some or all of the undistributed earnings of foreign subsidiaries were repatriated. Mattel does not intend nor foresee a need to repatriate undistributed earnings of foreign subsidiaries. Mattel has several liquidity options to fund its domestic operations and obligations, including investing and financing activities such as dividends, share repurchases, and debt service. Positive cash flows generated annually by its domestic operations, the Credit Facility, and access to both long-term and short-term public and private debt markets at highly competitive interest rates are available to fund domestic operations and obligations. If these sources are not adequate, Mattel also has the ability to repatriate highly taxed foreign earnings, receive repayment of intercompany loans to foreign subsidiaries, and distribute liquidating dividends from foreign subsidiaries, all of which would have a very nominal impact, if any, on Mattel’s tax liabilities. Mattel believes that its policy to indefinitely reinvest the earnings of its foreign subsidiaries will not result in and is not reasonably likely to result in a material change to Mattel’s liquidity position.
Current Market Conditions
Mattel is exposed to financial market risk resulting from changes in interest and foreign currency exchange rates. Mattel believes that it has ample liquidity to fund its business needs, including beginning of year cash and equivalents, cash flows from operations, and access to the commercial paper markets and its Credit Facility, which it uses for seasonal working capital requirements. As of
December 31, 2016
, Mattel had available incremental borrowing resources totaling $1.46 billion under the Credit Facility, and Mattel has not experienced any limitations on its ability to access this source of liquidity. Market conditions could affect certain terms of other debt instruments that Mattel enters into from time to time.
33
Mattel monitors the third-party depository institutions that hold the Company’s cash and equivalents. Mattel’s emphasis is primarily on safety and liquidity of principal, and secondarily on maximizing the yield on those funds. Mattel diversifies its cash and equivalents among counterparties and securities to minimize risks.
Mattel is subject to credit risks relating to the ability of its counterparties in hedging transactions to meet their contractual payment obligations. The risks related to creditworthiness and nonperformance have been considered in the fair value measurements of Mattel’s foreign currency forward exchange contracts. Mattel closely monitors its counterparties and takes action, as necessary, to manage its counterparty credit risk.
Mattel expects that some of its customers and vendors may experience difficulty in obtaining the liquidity required to buy inventory or raw materials. Mattel monitors its customers’ financial condition and their liquidity in order to mitigate Mattel’s accounts receivable collectibility risks, and customer terms and credit limits are adjusted, if necessary. Additionally, Mattel uses a variety of financial arrangements to ensure collectibility of accounts receivable of customers deemed to be a credit risk, including requiring letters of credit, factoring, purchasing various forms of credit insurance with unrelated third parties, or requiring cash in advance of shipment.
Mattel sponsors defined benefit pension plans and postretirement benefit plans for its employees. Actual returns below the expected rate of return, along with changes in interest rates that affect the measurement of the liability, would impact the amount and timing of Mattel’s future contributions to these plans.
Capital and Investment Framework
To guide future capital deployment decisions, with a goal of maximizing stockholder value, Mattel’s Board of Directors established the following capital and investment framework:
|
•
|
To maintain approximately $800 million to $1 billion in year-end cash available to fund a substantial portion of seasonal working capital;
|
|
•
|
To maintain a year-end debt-to-capital ratio of about 35%;
|
|
•
|
To invest approximately $180 million to $200 million in capital expenditures annually to maintain and grow the business;
|
|
•
|
To make strategic opportunistic acquisitions; and
|
|
•
|
To return excess funds to stockholders through dividends and share repurchases.
|
Over the long term, assuming annual cash flows from operating activities remain strong, Mattel plans to use its free cash flows to invest in strategic acquisitions and to return funds to stockholders through cash dividends and share repurchases. Mattel’s share repurchase program has no expiration date and repurchases will take place from time to time, depending on market conditions. The ability to successfully implement the capital deployment plan is directly dependent on Mattel’s ability to generate strong annual cash flows from operating activities. There is no assurance that Mattel will continue to generate strong annual cash flows from operating activities or achieve its targeted goals for investing activities.
Operating Activities
Cash flows from operating activities were $594.5 million during
2016
, as compared to $734.6 million during
2015
and $888.6 million during
2014
. The decrease in cash flows from operating activities in
2016
from
2015
was primarily due to higher working capital usage and lower net income. The decrease in cash flows from operating activities in
2015
from
2014
was primarily due to higher working capital usage and lower net income.
Investing Activities
Cash flows used for investing activities were $311.9 million during
2016
, as compared to $282.5 million during
2015
and $708.6 million during
2014
. The increase in cash flows used for investing activities in
2016
from
2015
was primarily due to the acquisition of Fuhu and Sproutling in 2016. The decrease in cash flows used for investing activities in
2015
from
2014
was primarily due to the acquisition of MEGA Brands in 2014.
34
Financing Activities
Cash flows used for financing activities were $281.5 million during
2016
, as compared to $500.2 million during
2015
and $227.3 million during
2014
. The decrease in cash flows used for financing activities in
2016
from
2015
was primarily due to the $350.0 million issuance of senior notes in the third quarter of 2016 and higher short-term borrowings, partially offset by the $300.0 million repayment of maturing senior notes in the fourth quarter of 2016. The increase in cash flows used for financing activities in
2015
from
2014
was primarily due to prior year net proceeds from long-term borrowings and lower proceeds from stock option exercises, partially offset by lower share repurchases.
During
2016
and
2015
, Mattel did not repurchase any shares of its common stock. During
2014
, Mattel repurchased 4.9 million shares of its common stock at a cost of $177.2 million. Mattel's share repurchase program was first announced on July 21, 2003. On July 17, 2013, the Board of Directors authorized Mattel to increase its share repurchase program by $500.0 million. At
December 31, 2016
, share repurchase authorizations of
$203.0 million
had not been executed. Repurchases under the program will take place from time to time, depending on market conditions. Mattel's share repurchase program has no expiration date.
During
2016
,
2015
, and
2014
, Mattel paid total dividends per share of $1.52, in each year, to holders of its common stock. The Board of Directors declared the dividends on a quarterly basis, and Mattel paid the dividends during the quarters in which the dividends were declared. The payment of dividends on common stock is at the discretion of the Board of Directors and is subject to customary limitations. Dividend payments were
$518.5 million
,
$515.1 million
, and
$514.8 million
in
2016
,
2015
, and
2014
, respectively.
Seasonal Financing
See Item 8 “Financial Statements and Supplementary Data—Note 5 to the Consolidated Financial Statements—Seasonal Financing and Debt.”
Financial Position
Mattel’s cash and equivalents decreased $23.3 million to
$869.5 million
at
December 31, 2016
, as compared to
$892.8 million
at
December 31, 2015
. The decrease was primarily due to dividend payments, purchases of tools, dies, and molds and other property, plant, and equipment, and the acquisition of Fuhu and Sproutling, partially offset by cash flows from operating activities and net proceeds from short-term borrowings and long-term debt.
Accounts receivable decreased $29.9 million to
$1.12 billion
at
December 31, 2016
, as compared to
$1.15 billion
at
December 31, 2015
. Inventory increased $26.3 million to
$613.8 million
at
December 31, 2016
, as compared to
$587.5 million
at
December 31, 2015
. The decrease in accounts receivable was primarily due to accelerated customer payments, partially offset by higher American Girl receivables as a result of external distribution and a shift in sales to countries with longer payment terms. The increase in inventory was primarily due to higher inventory to meet expected future demands and higher American Girl production for external distribution.
Accounts payable and accrued liabilities decreased $16.2 million to $1.29 billion at
December 31, 2016
, as compared to $1.31 billion at
December 31, 2015
. The decrease was primarily due to lower incentive compensation, accrued severance, and royalties, partially offset by tight management of vendor disbursements.
As of
December 31, 2016
, Mattel had short-term borrowings outstanding of
$192.2 million
, including $47.2 million of foreign short-term borrowings and $145.0 million of domestic short-term borrowings, which was $175.3 million higher than December 31, 2015.
35
A summary of Mattel’s capitalization is as follows:
|
|
December 31, 2016
|
December 31, 2015
|
|||||||||||
|
|
(In millions, except percentage information)
|
||||||||||||
|
2010 Senior Notes
|
$
|
500.0
|
|
10
|
%
|
$
|
500.0
|
|
10
|
%
|
|||
|
2011 Senior Notes
|
300.0
|
|
6
|
|
300.0
|
|
6
|
|
|||||
|
2013 Senior Notes
|
500.0
|
|
10
|
|
500.0
|
|
10
|
|
|||||
|
2014 Senior Notes
|
500.0
|
|
10
|
|
500.0
|
|
10
|
|
|||||
|
2016 Senior Notes
|
350.0
|
|
7
|
|
—
|
|
—
|
|
|||||
|
Debt issuance costs
|
(15.7
|
)
|
—
|
|
(15.3
|
)
|
—
|
|
|||||
|
Total noncurrent long-term debt
|
2,134.3
|
|
43
|
|
1,784.7
|
|
36
|
|
|||||
|
Other noncurrent liabilities
|
446.1
|
|
9
|
|
471.6
|
|
10
|
|
|||||
|
Stockholders’ equity
|
2,407.8
|
|
48
|
|
2,633.3
|
|
54
|
|
|||||
|
$
|
4,988.2
|
|
100
|
%
|
$
|
4,889.6
|
|
100
|
%
|
||||
Noncurrent long-term debt increased by approximately $350 million from
December 31, 2015
to
$2.13 billion
at
December 31, 2016
, primarily due to issuance of $350.0 million aggregate principal amount of 2.35% senior unsecured notes due August 15, 2021 ("2016 Senior Notes").
Stockholders’ equity decreased $225.5 million from
December 31, 2015
to
$2.41 billion
at
December 31, 2016
, primarily due to dividend payments and currency translation adjustments, partially offset by net income.
Mattel’s debt-to-total capital ratio, including short-term borrowings and the current portion of long-term debt, increased from 44.4% at
December 31, 2015
to 49.1% at
December 31, 2016
as a result of higher short-term borrowings and lower stockholders’ equity.
Off-Balance Sheet Arrangements
Mattel has no off-balance sheet arrangements that have or are reasonably likely to have a current or future material effect on its financial condition, revenues or expenses, results of operations, liquidity, capital expenditures, or capital resources.
Commitments
In the normal course of business, Mattel enters into debt agreements and contractual arrangements to obtain and protect Mattel’s right to create and market certain products and for future purchases of goods and services to ensure availability and timely delivery. These arrangements include commitments for future inventory and service purchases and royalty payments pursuant to licensing agreements. Certain of these commitments routinely contain provisions for guarantees or minimum expenditures during the terms of the contracts. Mattel also has defined benefit and postretirement benefit plans, which require future cash contributions and benefit payments. Additionally, Mattel routinely enters into noncancelable lease agreements for premises and equipment used, which contain minimum rental payments.
36
The following table summarizes Mattel’s contractual commitments and obligations:
|
|
Total
|
2017
|
2018
|
2019
|
2020
|
2021
|
Thereafter
|
||||||||||||||||||||
|
|
(In millions)
|
||||||||||||||||||||||||||
|
Long-term debt
|
$
|
2,150.0
|
|
$
|
—
|
|
$
|
250.0
|
|
$
|
500.0
|
|
$
|
250.0
|
|
$
|
350.0
|
|
$
|
800.0
|
|
||||||
|
Interest on long-term debt
|
934.6
|
|
74.8
|
|
71.5
|
|
62.9
|
|
56.1
|
|
44.9
|
|
624.4
|
|
|||||||||||||
|
Capital leases*
|
0.9
|
|
0.3
|
|
0.3
|
|
0.3
|
|
—
|
|
—
|
|
—
|
|
|||||||||||||
|
Operating leases
|
620.3
|
|
110.1
|
|
94.4
|
|
78.1
|
|
69.7
|
|
62.3
|
|
205.7
|
|
|||||||||||||
|
Minimum guarantees under licensing and similar agreements
|
392.5
|
|
105.6
|
|
123.1
|
|
91.8
|
|
58.0
|
|
9.4
|
|
4.6
|
|
|||||||||||||
|
Defined benefit and postretirement benefit plans
|
414.7
|
|
56.8
|
|
40.4
|
|
40.6
|
|
40.5
|
|
40.1
|
|
196.3
|
|
|||||||||||||
|
Purchases of inventory, services, and other
|
444.5
|
|
409.3
|
|
21.9
|
|
12.2
|
|
1.1
|
|
—
|
|
—
|
|
|||||||||||||
|
Total
|
$
|
4,957.5
|
|
$
|
756.9
|
|
$
|
601.6
|
|
$
|
785.9
|
|
$
|
475.4
|
|
$
|
506.7
|
|
$
|
1,831.0
|
|
||||||
|
*
|
Represents total obligation, including imputed interest of $0.1 million.
|
Liabilities for uncertain tax positions for which a cash tax payment is not expected to be made in the next twelve months are classified as other noncurrent liabilities. Due to the uncertainty about the periods in which examinations will be completed and limited information related to current audits, Mattel is not able to make reasonably reliable estimates of the periods in which cash settlements will occur with taxing authorities for the noncurrent liabilities.
Subsequent Event
On January 25, 2017, Mattel announced that its Board of Directors declared a first quarter dividend of $0.38 per common share. The dividend is payable on March 3, 2017 to stockholders of record on February 16, 2017.
Litigation
The content of Item 8 “Financial Statements and Supplementary Data—Note 11 to the Consolidated Financial Statements—Commitments and Contingencies—Litigation” is hereby incorporated by reference in this Item 7.
Effects of Inflation
Inflation rates in the US and in major foreign countries where Mattel does business have not had a significant impact on its results of operations or financial position during
2016
,
2015
, or
2014
. Mattel receives some protection from the impact of inflation from high turnover of inventories and its ability, under certain circumstances and at certain times, to pass on higher prices to its customers.
Employee Savings Plan
Mattel sponsors a 401(k) savings plan, the Mattel, Inc. Personal Investment Plan (the “Plan”), for its domestic employees. Contributions to the Plan include voluntary contributions by eligible employees and employer automatic and matching contributions by Mattel. The Plan allows employees to allocate both their voluntary contributions and their employer automatic and matching contributions to a variety of investment funds, including a fund that is invested in Mattel common stock (the “Mattel Stock Fund”). Employees are not required to allocate any of their Plan account balance to the Mattel Stock Fund, allowing employees to limit or eliminate their exposure to market changes in Mattel’s stock price. Furthermore, the Plan limits the percentage of the employee’s total account balance that may be allocated to the Mattel Stock Fund to 25%. Employees may generally reallocate their account balances on a daily basis. However, pursuant to Mattel’s insider trading policy, employees classified as insiders and restricted personnel under Mattel’s insider trading policy are limited to certain periods in which they may make allocations into or out of the Mattel Stock Fund.
37
Application of Critical Accounting Policies and Estimates
Mattel makes certain estimates and assumptions that affect the reported amounts of assets and liabilities and the reported amounts of revenues and expenses. The accounting policies and estimates described below are those Mattel considers most critical in preparing its consolidated financial statements. Management has discussed the development and selection of these critical accounting policies and estimates with the Audit Committee of its Board of Directors, and the Audit Committee has reviewed the disclosures included below. These accounting policies and estimates include significant judgments made by management using information available at the time the estimates are made. As described below, however, these estimates could change materially if different information or assumptions were used instead.
For a summary of Mattel’s significant accounting policies, estimates, and methods used in the preparation of Mattel’s consolidated financial statements, see Item 8 “Financial Statements and Supplementary Data—Note 1 to the Consolidated Financial Statements—Summary of Significant Accounting Policies.” In most instances, Mattel must use an accounting policy or method because it is the only policy or method permitted under accounting principles generally accepted in the United States of America (“US GAAP”).
Accounts Receivable—Allowance for Doubtful Accounts
The allowance for doubtful accounts represents adjustments to customer trade accounts receivable for amounts deemed partially or entirely uncollectible. Management believes the accounting estimate related to the allowance for doubtful accounts is a “critical accounting estimate” because significant changes in the assumptions used to develop the estimate could materially affect key financial measures, including other selling and administrative expenses, net income, and accounts receivable. In addition, the allowance requires a high degree of judgment since it involves estimation of the impact of both current and future economic factors in relation to its customers’ ability to pay amounts owed to Mattel.
Mattel’s products are sold throughout the world. Products within the North America segment are sold directly to retailers, including discount and free-standing toy stores, chain stores, department stores, other retail outlets and, to a limited extent, wholesalers, and directly to consumers. Products within the International segment are sold directly to retailers and wholesalers in most European, Latin American, and Asian countries, and in Australia and New Zealand, and through agents and distributors in those countries where Mattel has no direct presence.
In recent years, the mass-market retail channel has experienced significant shifts in market share among competitors, causing some large retailers to experience liquidity problems. Mattel’s sales to customers are typically made on credit without collateral and are highly concentrated in the third and fourth quarters due to the seasonal nature of toy sales, which results in a substantial portion of trade receivables being collected during the latter half of the year and the first quarter of the following year. There is a risk that customers will not pay, or that payment may be delayed, because of bankruptcy or other factors beyond the control of Mattel. This could increase Mattel’s exposure to losses from bad debts.
A small number of customers account for a large share of Mattel’s net sales and accounts receivable. In
2016
, Mattel’s three largest customers, Wal-Mart, Toys “R” Us, and Target, in the aggregate, accounted for approximately
39%
of net sales, and its ten largest customers, in the aggregate, accounted for approximately 49% of net sales. As of
December 31, 2016
, Mattel’s three largest customers accounted for approximately 35% of net accounts receivable, and its ten largest customers accounted for approximately 44% of net accounts receivable. The concentration of Mattel’s business with a relatively small number of customers may expose Mattel to a material adverse effect if one or more of Mattel’s large customers were to experience financial difficulty.
Mattel has procedures to mitigate its risk of exposure to losses from bad debts. Revenue is recognized upon shipment or upon receipt of products by the customer, depending on the terms, provided that: there are no uncertainties regarding customer acceptance; persuasive evidence of an agreement exists documenting the specific terms of the transaction; the sales price is fixed or determinable; and collectibility is reasonably assured. Value added taxes are recorded on a net basis and are excluded from revenue. Credit limits and payment terms are established based on the underlying criteria that collectibility must be reasonably assured at the levels set for each customer. Extensive evaluations are performed on an ongoing basis throughout the fiscal year of each customer’s financial performance, cash generation, financing availability, and liquidity status. Customers are reviewed at least annually, with more frequent reviews being performed, if necessary, based on the customers’ financial condition and the level of credit being extended. For customers who are experiencing financial difficulties, management performs additional financial analyses prior to shipping to those customers on credit. Customers’ terms and credit limits are adjusted, if necessary, to reflect the results of the review. Mattel uses a variety of financial arrangements to ensure collectibility of accounts receivable of customers deemed to be a credit risk, including requiring letters of credit, factoring, purchasing various forms of credit insurance with unrelated third parties, or requiring cash in advance of shipment.
38
The following table summarizes Mattel’s allowance for doubtful accounts:
|
December 31,
2016 |
December 31,
2015 |
December 31,
2014 |
|||||||||
|
|
(In millions, except percentage information)
|
||||||||||
|
Allowance for doubtful accounts
|
$
|
21.4
|
|
$
|
24.4
|
|
$
|
26.3
|
|
||
|
As a percentage of total accounts receivable
|
1.4
|
%
|
1.6
|
%
|
1.7
|
%
|
|||||
Mattel’s allowance for doubtful accounts is based on management’s assessment of the business environment, customers’ financial condition, historical collection experience, accounts receivable aging, and customer disputes. Changes in the allowance for doubtful accounts reflect management’s assessment of the factors noted above, including past due accounts, disputed balances with customers, and the financial condition of customers. The allowance for doubtful accounts is also affected by the time at which uncollectible accounts receivable balances are actually written off.
Mattel believes that its allowance for doubtful accounts at
December 31, 2016
is adequate and proper. However, as described above, Mattel’s business is greatly dependent on a small number of customers. Should one or more of Mattel’s major customers experience liquidity problems, then the allowance for doubtful accounts may not be sufficient to cover such losses. Any incremental bad debt charges would negatively affect the results of operations of one or more of Mattel’s business segments.
Inventories—Allowance for Obsolescence
Inventories, net of an allowance for excess quantities and obsolescence, are stated at the lower of cost or market. Inventory obsolescence reserves are recorded for damaged, obsolete, excess, and slow-moving inventory. Inventory allowances are charged to cost of sales and establish a lower cost basis for the inventory. Management believes that the accounting estimate related to the allowance for obsolescence is a “critical accounting estimate” because changes in the assumptions used to develop the estimate could materially affect key financial measures, including gross profit, net income, and inventories. As more fully described below, valuation of Mattel’s inventory could be impacted by changes in public and consumer preferences, demand for product, or changes in the buying patterns of both retailers and consumers and inventory management of customers.
In the toy industry, orders are subject to cancellation or change at any time prior to shipment since actual shipments of products ordered and order cancellation rates are affected by consumer acceptance of product lines, strength of competing products, marketing strategies of retailers, changes in buying patterns of both retailers and consumers, and overall economic conditions. Unexpected changes in these factors could result in excess inventory in a particular product line, which would require management to record a valuation adjustment on such inventory.
Mattel bases its production schedules for toy products on customer orders and forecasts, taking into account historical trends, results of market research, and current market information. Mattel ships products in accordance with delivery schedules specified by its customers, who usually request delivery within three months. In anticipation of retail sales in the traditional holiday season, Mattel significantly increases its production in advance of the peak selling period, resulting in a corresponding build-up of inventory levels in the first three quarters of its fiscal year. These seasonal purchasing patterns and requisite production lead times create risk to Mattel’s business associated with the underproduction of popular toys and the overproduction of toys that do not match consumer demand. Retailers are also attempting to manage their inventories more tightly, requiring Mattel to ship products closer to the time the retailers expect to sell the products to consumers. These factors increase inventory valuation risk since Mattel’s inventory levels may be adversely impacted by the need to pre-build products before orders are placed.
When current conditions in the domestic and global economies become uncertain, it is difficult to estimate the level of growth or contraction for the economy as a whole. It is even more difficult to estimate growth or contraction in various parts of the economy, including the economies in which Mattel participates. Because all components of Mattel’s budgeting and forecasting are dependent upon estimates of growth or contraction in the markets it serves and demand for its products, economic uncertainty makes estimates of future demand for product more difficult. Such economic changes may affect the sales of Mattel’s products and its corresponding inventory levels, which could potentially impact the valuation of its inventory.
39
At the end of each quarter, management within each business segment, North America, International, and American Girl, performs a detailed review of its inventory on an item-by-item basis and identifies products that are believed to be impaired. Management assesses the need for, and the amount of, an obsolescence reserve based on the following factors:
|
•
|
Customer and/or consumer demand for the item;
|
|
•
|
Overall inventory positions of Mattel’s customers;
|
|
•
|
Strength of competing products in the market;
|
|
•
|
Quantity on hand of the item;
|
|
•
|
Sales price of the item;
|
|
•
|
Mattel’s cost for the item; and
|
|
•
|
Length of time the item has been in inventory.
|
The timeframe between when an estimate is made and the time of disposal depends on the above factors and may vary significantly. Generally, slow-moving inventory is liquidated during the next annual selling cycle.
The following table summarizes Mattel’s obsolescence reserve:
|
December 31,
2016 |
December 31,
2015 |
December 31,
2014 |
|||||||||
|
|
(In millions, except percentage information)
|
||||||||||
|
Allowance for obsolescence
|
$
|
36.8
|
|
$
|
45.7
|
|
$
|
46.9
|
|
||
|
As a percentage of total inventory
|
5.5
|
%
|
7.2
|
%
|
7.7
|
%
|
|||||
Management believes that its allowance for obsolescence at
December 31, 2016
is adequate and proper. However, the impact resulting from the aforementioned factors could cause actual results to vary. Any incremental obsolescence charges would negatively affect the results of operations of one or more of Mattel’s business segments.
Goodwill and Nonamortizable Intangible Assets
Mattel tests goodwill and nonamortizable intangible assets for impairment annually or more often if an event or circumstance indicates that an impairment may have occurred. Management believes that the accounting estimates related to the fair value estimates of its goodwill and nonamortizable intangible assets are “critical accounting estimates” because significant changes in the assumptions used to develop the estimates could materially affect key financial measures, including net income, goodwill, and other intangible assets.
Assessing goodwill for impairment involves a high degree of judgment due to the assumptions that underlie the valuation. For purposes of evaluating whether goodwill is impaired, goodwill is allocated to various reporting units, which are at the operating segment level. Mattel’s reporting units are: (i) North America, (ii) International, and (iii) American Girl. Mattel then assesses qualitative factors to determine whether it is more likely than not that the fair value of a reporting unit is less than its carrying value. This qualitative assessment is used as a basis for determining whether it is necessary to perform the quantitative two-step goodwill impairment test. When the quantitative two-step goodwill impairment test is necessary, impairment is determined by estimating the fair value of a reporting unit and comparing that value to the reporting unit’s book value. If the fair value is greater than the book value of the reporting unit, goodwill is not impaired. If an impairment exists, the fair value of the reporting unit is allocated to all of its assets and liabilities excluding goodwill, with the excess amount representing the fair value of goodwill. An impairment loss is measured as the amount by which the book value of the reporting unit’s goodwill exceeds the estimated fair value of that goodwill.
When performing the quantitative two-step goodwill impairment test, Mattel utilizes the fair value based upon the discounted cash flows that the business can be expected to generate in the future (the “Income Approach”). The Income Approach valuation method requires Mattel to make projections of revenue, operating costs, and working capital investment for the reporting unit over a multi-year period. Additionally, management must make an estimate of a weighted average cost of capital that a market participant would use as a discount rate. Changes in these projections or estimates could result in a reporting unit either passing or failing the first step of the impairment model, which could significantly change the amount of any impairment ultimately recorded.
40
During the third quarter of 2016, Mattel assessed its goodwill for impairment by performing the quantitative two-step goodwill impairment test. Mattel determined that its goodwill was not impaired since, for each of the reporting units, the fair value of the reporting unit exceeded its carrying value.
Testing nonamortizable intangible assets for impairment also involves a high degree of judgment due to the assumptions that underlie the valuation. Mattel evaluates nonamortizable intangible assets, including trademarks and trade names, for impairment by comparing the estimated fair values with the carrying values. The fair value is measured using a multi-period excess earnings method, which reflects the incremental after-tax cash flows attributable to the trademark and trade names after deducting the appropriate contributory asset charges.
During the third quarter of
2016
, Mattel performed the annual impairment test for the remaining nonamortizable intangible assets as required and determined that its remaining nonamortizable intangible assets were not impaired as the fair values of the nonamortizable intangible assets exceeded their carrying values. Mattel also considered events and circumstances subsequent to these impairment tests in concluding there was no impairment as of
December 31, 2016
.
Sales Adjustments
Mattel routinely enters into arrangements with its customers to provide sales incentives, support customer promotions, and provide allowances for returns and defective merchandise. Such programs are based primarily on customer purchases, customer performance of specified promotional activities, and other specified factors such as sales to consumers. Accruals for these programs are recorded as sales adjustments that reduce gross revenue in the period the related revenue is recognized. Sales adjustments for such programs totaled
$617.0 million
,
$581.0 million
, and
$694.6 million
during
2016
,
2015
, and
2014
, respectively.
The above-described programs primarily involve fixed amounts or percentages of sales to customers. Accruals for such programs are calculated based on an assessment of customers’ purchases and performance under the programs and any other specified factors. While the majority of sales adjustment amounts are readily determinable at period end and do not require estimates, certain of the sales adjustments require management to make estimates. In making these estimates, management considers all available information, including the overall business environment, historical trends, and information from customers. Management believes that the accruals recorded for customer programs as of
December 31, 2016
are adequate and proper.
Benefit Plan Assumptions
Mattel and certain of its subsidiaries have retirement and other postretirement benefit plans covering substantially all employees of these companies. See Item 8 “Financial Statements and Supplementary Data—Note 4 to the Consolidated Financial Statements—Employee Benefit Plans.”
Actuarial valuations are used in determining amounts recognized in the financial statements for certain retirement and other postretirement benefit plans. These valuations incorporate the following significant assumptions:
|
•
|
Weighted average discount rate to be used to measure future plan obligations and interest cost component of plan income or expense;
|
|
•
|
Rate of future compensation increases (for defined benefit pension plans);
|
|
•
|
Expected long-term rate of return on plan assets (for funded plans); and
|
|
•
|
Health care cost trend rates (for other postretirement benefit plans).
|
Management believes that these assumptions are “critical accounting estimates” because significant changes in these assumptions could impact Mattel’s results of operations and financial position. Management believes that the assumptions utilized to record its obligations under its plans are reasonable based on the plans’ experience and advice received from its outside actuaries. Mattel reviews its benefit plan assumptions annually and modifies its assumptions based on current rates and trends as appropriate. The effects of such changes in assumptions are amortized as part of plan income or expense in future periods.
41
At the end of each fiscal year, Mattel determines the weighted average discount rate used to calculate the projected benefit obligation. The discount rate is an estimate of the current interest rate at which the benefit plan liabilities could be effectively settled at the end of the year. The discount rate also impacts the interest cost component of plan income or expense. As of
December 31, 2016
, Mattel determined the discount rate for its domestic benefit plans used in determining the projected and accumulated benefit obligations to be
3.9%
, as compared to
4.2%
and
3.8%
as of December 31,
2015
and
2014
, respectively. In estimating this rate, Mattel reviews rates of return on high-quality corporate bond indices, which approximate the timing and amount of benefit payments. Assuming all other benefit plan assumptions remain constant, the decrease in the discount rate from 4.2% to 3.9% would result in a decrease in benefit plan expense during
2017
of $0.3 million.
As a result of the curtailment of Mattel's domestic defined benefit pension plans, the rate of future compensation increase was not applicable for the
2016
benefit obligation and net periodic pension cost calculations. The rate of future compensation increases used by Mattel for the benefit obligation and the net periodic pension cost of its domestic defined benefit pension plans averaged
3.8%
for
2015
and
2014
, based on plan demographics. This assumption is reviewed annually based on historical salary increases for participants in the defined benefit pension plans and impacts the service and interest cost components of plan income or expense.
The long-term rate of return on plan assets is based on management’s expectation of earnings on the assets that secure Mattel’s funded defined benefit pension plans, taking into account the mix of invested assets, the arithmetic average of past returns, economic and stock market conditions and future expectations, and the long-term nature of the projected benefit obligation to which these investments relate. The long-term rate of return is used to calculate the expected return on plan assets that is used in calculating pension income or expense. The difference between this expected return and the actual return on plan assets is deferred, net of tax, and is included in accumulated other comprehensive loss. The net deferral of past asset gains or losses affects the calculated value of plan assets and, ultimately, future pension income or expense. Mattel’s long-term rate of return used in determining plan expense for its domestic defined benefit pension plans was
6.5%
in
2016
, as compared to
7.5%
during the first half of
2015
and revised to
6.8%
for the second half of
2015
, and
8.0%
in
2014
. Assuming all other benefit plan assumptions remain constant, a one percentage point decrease in the expected return on plan assets would result in an increase in benefit plan expense during
2017
of $3.4 million.
The health care cost trend rates used by Mattel for its other postretirement benefit plans reflect management’s best estimate of expected claim costs over the next ten years. These trend rates impact the service and interest cost components of plan expense. Rates ranging from
8.3%
in
2016
to
4.5%
in
2024
, with rates assumed to stabilize in
2023
for participants younger than age 65 and
2024
for participants age 65 and older, were used in determining plan expense for
2016
. These rates are reviewed annually and are estimated based on historical costs for participants in the other postretirement benefit plans as well as estimates based on current economic conditions. As of
December 31, 2016
, Mattel maintained the health care cost trend rates for its other postretirement benefit plan obligation at
7.0%
for participants younger than age 65 and
7.8%
for participants age 65 and older. For participants younger than age 65, the cost trend rates are estimated to reduce to
4.5%
by
2024
, with rates assumed to stabilize in
2024
. For participants age 65 and older, the cost trend rates are estimated to reduce to
4.5%
by
2024
, with rates assumed to stabilize in
2024
. Assuming all other postretirement benefit plan assumptions remain constant, a one percentage point increase in the assumed health care cost trend rates would result in an increase in benefit plan expense during
2017
of $0.1 million.
A one percentage point increase/(decrease) in the assumed health care cost trend rate for each future year would impact the postretirement benefit obligation as of
December 31, 2016
by $2.1 million and $(1.9) million, respectively, and the service and interest cost recognized for
2016
by $0.1 million and $(0.1) million, respectively.
Share-Based Payments
Mattel recognizes the cost of employee share-based payment awards on a straight-line attribution basis over the requisite employee service period, net of estimated forfeitures. Determining the fair value of share-based awards at the measurement date requires judgment, including estimating the expected term that stock options will be outstanding prior to exercise, the associated volatility, and the expected dividends. Mattel estimates the fair value of options granted using the Black-Scholes valuation model. The expected life of the options used in this calculation is the period of time the options are expected to be outstanding and has been determined based on historical exercise experience. Expected stock price volatility is based on the historical volatility of Mattel’s stock for a period approximating the expected life, the expected dividend yield is based on Mattel’s most recent actual annual dividend payout, and the risk-free interest rate is based on the implied yield available on US Treasury zero-coupon issues approximating the expected life. Judgment is also required in estimating the amount of share-based awards that will be forfeited prior to vesting. Management believes that these assumptions are “critical accounting estimates” because significant changes in the assumptions used to develop the estimates could materially affect key financial measures, including net income.
42
The weighted average grant date fair value of options granted during
2016
,
2015
, and
2014
was
$4.09
,
$1.97
, and
$4.57
, respectively. The following weighted average assumptions were used in determining the fair value of options granted:
|
2016
|
2015
|
2014
|
||||||
|
Expected life (in years)
|
5.0
|
|
4.9
|
|
4.9
|
|
||
|
Risk-free interest rate
|
1.1
|
%
|
1.5
|
%
|
1.6
|
%
|
||
|
Volatility factor
|
25.3
|
%
|
23.1
|
%
|
23.7
|
%
|
||
|
Dividend yield
|
4.7
|
%
|
6.5
|
%
|
4.3
|
%
|
||
The following tables summarizes the sensitivity of valuation assumptions within the calculation of stock option fair values, if all other assumptions are held constant:
|
Increase in Assumption Factor
|
Increase (Decrease) in Fair Value (in % pts)
|
||||
|
Expected life (in years)
|
1 year
|
|
1.5
|
|
|
|
Risk-free interest rate
|
1
|
%
|
10.7
|
|
|
|
Volatility factor
|
1
|
%
|
5.6
|
|
|
|
Dividend yield
|
1
|
%
|
(14.4
|
)
|
|
|
(Decrease) in Assumption Factor
|
Increase (Decrease) in Fair Value (in % pts)
|
||||
|
Expected life (in years)
|
(1) year
|
|
(3.2
|
)
|
|
|
Risk-free interest rate
|
(1
|
)%
|
(10.0
|
)
|
|
|
Volatility factor
|
(1
|
)%
|
(5.6
|
)
|
|
|
Dividend yield
|
(1
|
)%
|
16.3
|
|
|
Mattel recognized compensation expense of
$10.5 million
,
$15.2 million
, and
$12.5 million
for stock options during
2016
,
2015
, and
2014
, respectively, which is included within other selling and administrative expenses. Compensation expense recognized related to grants of restricted stock units (“RSUs”), including performance-based restricted stock units (“Performance RSUs”), was
$43.4 million
,
$41.5 million
, and
$39.5 million
in
2016
,
2015
, and
2014
, respectively, and is also included within other selling and administrative expenses. As of
December 31, 2016
, total unrecognized compensation cost related to unvested share-based payments totaled
$85.1 million
and is expected to be recognized over a weighted-average period of
2.0 years
.
Income Taxes
Mattel’s income tax provision and related income tax assets and liabilities are based on actual and expected future income, US and foreign statutory income tax rates, and tax regulations and planning opportunities in the various jurisdictions in which Mattel operates. Management believes that the accounting estimates related to income taxes are “critical accounting estimates” because significant judgment is required in interpreting tax regulations in the US and in foreign jurisdictions, evaluating Mattel’s worldwide uncertain tax positions, and assessing the likelihood of realizing certain tax benefits. Actual results could differ materially from those judgments, and changes in judgments could materially affect Mattel’s consolidated financial statements.
Certain income and expense items are accounted for differently for financial reporting and income tax purposes. As a result, the income tax expense reflected in Mattel’s consolidated statements of operations is different than that reported in Mattel’s tax returns filed with the taxing authorities. Some of these differences are permanent, such as expenses that are not deductible in Mattel’s tax return, and some differences reverse over time, such as depreciation expense. These timing differences create deferred income tax assets and liabilities. Deferred income tax assets generally represent items that can be used as a tax deduction or credit in Mattel’s tax returns in future years for which Mattel has already recorded a tax benefit in its consolidated statement of operations. Mattel records a valuation allowance to reduce its deferred income tax assets if, based on the weight of available evidence, management believes expected future taxable income is not likely to support the use of a deduction or credit in that jurisdiction. Management evaluates the level of Mattel’s valuation allowances at least annually, and more frequently if actual operating results differ significantly from forecasted results.
43
Mattel records unrecognized tax benefits for US federal, state, local, and foreign tax positions related primarily to transfer pricing, tax credits claimed, tax nexus, and apportionment. For each reporting period, management applies a consistent methodology to measure unrecognized tax benefits and all unrecognized tax benefits are reviewed periodically and adjusted as circumstances warrant. Mattel’s measurement of its unrecognized tax benefits is based on management’s assessment of all relevant information, including prior audit experience, the status of audits, conclusions of tax audits, lapsing of applicable statutes of limitations, identification of new issues, and any administrative guidance or developments. Mattel recognizes unrecognized tax benefits in the first financial reporting period in which information becomes available indicating that such benefits will more-likely-than-not (a greater than 50 percent likelihood) be realized.
Mattel’s effective tax rate on income before income taxes in 2016 was 22.4%, as compared to 20.4% in 2015. The income tax provision included net tax benefits of $16.8 million, $19.1 million, and $42.6 million in 2016, 2015, and 2014, respectively. The 2016 net tax benefits primarily relate to reassessments of prior years’ tax liabilities based on the status of audits and tax filings in various jurisdictions around the world, settlements, and enacted tax law changes, and the adoption of a new accounting pronouncement. The 2015 net tax benefits primarily relate to reassessments of prior years’ tax liabilities based on the status of audits and tax filings in various jurisdictions around the world, settlements, and enacted tax law changes. The 2014 net tax benefits primarily related to the reassessments of prior years’ tax liabilities based on the status of audits and tax filings in various jurisdictions around the world, settlements, and enacted tax law changes, partially offset by a tax charge related to a 2014 tax restructuring for the HIT Entertainment and MEGA Brands operations.
In the normal course of business, Mattel is regularly audited by federal, state, local, and foreign tax authorities. The ultimate settlement of any particular issue with the applicable taxing authority could have a material impact on Mattel’s consolidated financial statements.
New Accounting Pronouncements
See Item 8 “Financial Statements and Supplementary Data—Note 1 to the Consolidated Financial Statements—Summary of Significant Accounting Policies.”
Non-GAAP Financial Measures
To supplement the financial results presented in accordance with GAAP, Mattel presents certain non-GAAP financial measures within the meaning of Regulation G promulgated by the Securities and Exchange Commission. Mattel uses these metrics to analyze its continuing operations and to monitor, assess, and identify meaningful trends in its operating and financial performance, and each is discussed in detail below. These measures are not, and should not be viewed as, substitutes for GAAP financial measures and may not be comparable to similarly-titled measures by other companies.
Currency Exchange Rate Impact
The currency exchange rate impact reflects the portion (expressed as a percentage) of changes in Mattel's reported results that are attributable to fluctuations in currency exchange rates.
For entities reporting in currencies other than the US dollar, Mattel calculates the percentage change of period-over-period results at constant currency exchange rates (established as described below) by translating current period and prior period results using these rates. It then determines the currency exchange rate impact percentage by calculating the difference between the percentage change at such constant currency exchange rates and the percentage change at actual exchange rates.
Mattel established the exchange rates that it uses for these constant currency calculations years ago. It considers whether any changes to these rates are appropriate at the beginning of each year but, generally, has held them unchanged.
Gross Sales
Gross sales represent sales to customers, excluding the impact of sales adjustments. Net sales, as reported, include the impact of sales adjustments, such as trade discounts and other allowances. Mattel presents changes in gross sales as a metric for comparing its aggregate, brand, and geographic results to highlight significant trends in Mattel’s business. Changes in gross sales are discussed because, while Mattel records the details of such sales adjustments in its financial accounting systems at the time of sale, such sales adjustments are generally not associated with brands or individual products, making net sales less meaningful. Because sales adjustments are not allocated to individual products, net sales are only presented on a consolidated and segment basis and not on a brand level.
44
A reconciliation from Mattel's consolidated net sales to its consolidated gross sales is as follows:
|
For the Year Ended
|
% Change as Reported
|
Currency Exchange Rate Impact
|
|||||||||||
|
December 31,
2016 |
December 31,
2015 |
||||||||||||
|
(In millions, except percentage information)
|
|||||||||||||
|
Net sales
|
$
|
5,456.7
|
|
$
|
5,702.6
|
|
-4
|
%
|
-2
|
%
|
|||
|
Sales adjustments
|
617.0
|
|
581.0
|
|
|||||||||
|
Gross sales
|
$
|
6,073.7
|
|
$
|
6,283.6
|
|
-3
|
%
|
-3
|
%
|
|||
A reconciliation from net sales to gross sales for the North America segment is as follows:
|
For the Year Ended
|
% Change as Reported
|
Currency Exchange Rate Impact
|
|||||||||||
|
December 31,
2016 |
December 31,
2015 |
||||||||||||
|
(In millions, except percentage information)
|
|||||||||||||
|
Net sales
|
$
|
2,837.8
|
|
$
|
2,891.1
|
|
-2
|
%
|
—
|
%
|
|||
|
Sales adjustments
|
198.4
|
|
192.8
|
|
|||||||||
|
Gross sales
|
$
|
3,036.2
|
|
$
|
3,083.9
|
|
-2
|
%
|
-1
|
%
|
|||
A reconciliation from net sales to gross sales for the International segment is as follows:
|
For the Year Ended
|
% Change as Reported
|
Currency Exchange Rate Impact
|
|||||||||||
|
December 31,
2016 |
December 31,
2015 |
||||||||||||
|
(In millions, except percentage information)
|
|||||||||||||
|
Net sales
|
$
|
2,054.8
|
|
$
|
2,241.5
|
|
-8
|
%
|
-6
|
%
|
|||
|
Sales adjustments
|
392.8
|
|
362.0
|
|
|||||||||
|
Gross sales
|
$
|
2,447.6
|
|
$
|
2,603.5
|
|
-6
|
%
|
-7
|
%
|
|||
A reconciliation from net sales to gross sales for the American Girl segment is as follows:
|
For the Year Ended
|
% Change as Reported
|
Currency Exchange Rate Impact
|
|||||||||||
|
December 31,
2016 |
December 31,
2015 |
||||||||||||
|
(In millions, except percentage information)
|
|||||||||||||
|
Net Sales
|
$
|
564.1
|
|
$
|
570.0
|
|
-1
|
%
|
—
|
%
|
|||
|
Sales adjustments
|
25.8
|
|
26.2
|
|
|||||||||
|
Gross Sales
|
$
|
589.9
|
|
$
|
596.2
|
|
-1
|
%
|
—
|
%
|
|||
45
|
Item 7A.
|
Quantitative and Qualitative Disclosures About Market Risk.
|
Foreign Currency Exchange Rate Risk
Currency exchange rate fluctuations may impact Mattel’s results of operations and cash flows. Inventory transactions denominated in the Euro, Mexican peso, British pound sterling, Canadian dollar, Australian dollar, Brazilian real, Russian ruble, Indonesian rupiah, and Malaysian ringgit were the primary transactions that caused foreign currency transaction exposure for Mattel during
2016
,
2015
, and
2014
. Mattel seeks to mitigate its exposure to market risk by monitoring its foreign currency transaction exposure for the year and partially hedging such exposure using foreign currency forward exchange contracts primarily to hedge its purchase and sale of inventory and other intercompany transactions denominated in foreign currencies. These contracts generally have maturity dates of up to 18 months. For those intercompany receivables and payables that are not hedged, the transaction gains or losses are recorded in the consolidated statement of operations in the period in which the exchange rate changes as part of operating income or other non-operating income/expense, net based on the nature of the underlying transaction. Transaction gains or losses on hedged intercompany inventory transactions are recorded in the consolidated statement of operations in the period in which the inventory is sold to customers. In addition, Mattel manages its exposure to currency exchange rate fluctuations through the selection of currencies used for international borrowings. Mattel does not trade in financial instruments for speculative purposes.
Mattel’s financial position is also impacted by currency exchange rate fluctuations on translation of its net investments in subsidiaries with non-US dollar functional currencies. Assets and liabilities of subsidiaries with non-US dollar functional currencies are translated into US dollars at fiscal year-end exchange rates. Income, expense, and cash flow items are translated at weighted average exchange rates prevailing during the fiscal year. The resulting currency translation adjustments are recorded as a component of accumulated other comprehensive loss within stockholders’ equity. Mattel’s primary currency translation exposures in 2016 were related to its net investments in entities having functional currencies denominated in the British pound sterling, Mexican peso, Euro, and Brazilian real.
There are numerous factors impacting the amount by which Mattel’s financial results are affected by foreign currency translation and transaction gains and losses resulting from changes in currency exchange rates, including, but not limited to, the level of foreign currency forward exchange contracts in place at a given time and the volume of foreign currency-denominated transactions in a given period. However, assuming that such factors were held constant, Mattel estimates that a 1 percent change in the US dollar Trade-Weighted Index would impact Mattel’s net sales by approximately 0.5% and its full year earnings per share by approximately $0.00 to $0.01.
Mattel’s foreign currency forward exchange contracts that were used to hedge firm foreign currency commitments as of
December 31, 2016
are shown below. All contracts in the following table are against the US dollar and are maintained by reporting units with a US dollar functional currency, with the exception of the Indonesian rupiah contracts, which are maintained by entities with an Indonesian rupiah functional currency.
46
|
|
Buy
|
Sell
|
|||||||||||||||||||
|
|
Contract
Amount
|
Weighted
Average
Contract
Rate
|
Fair
Value
|
Contract
Amount
|
Weighted
Average
Contract
Rate
|
Fair
Value
|
|||||||||||||||
|
|
(In thousands of US dollars, except for rates)
|
||||||||||||||||||||
|
Australian dollar*
|
$
|
34,773
|
|
0.75
|
|
$
|
(1,369
|
)
|
$
|
42,322
|
|
0.74
|
|
$
|
1,655
|
|
|||||
|
Brazilian real
|
—
|
|
—
|
|
—
|
|
9,134
|
|
3.41
|
|
(116
|
)
|
|||||||||
|
British pound sterling*
|
56,951
|
|
1.25
|
|
(1,158
|
)
|
—
|
|
—
|
|
—
|
|
|||||||||
|
Canadian dollar*
|
—
|
|
—
|
|
—
|
|
83,058
|
|
0.76
|
|
1,873
|
|
|||||||||
|
Czech koruna
|
904
|
|
25.33
|
|
(16
|
)
|
—
|
|
—
|
|
—
|
|
|||||||||
|
Danish krone
|
2,370
|
|
6.99
|
|
(39
|
)
|
—
|
|
—
|
|
—
|
|
|||||||||
|
Euro*
|
230,739
|
|
1.06
|
|
(3,174
|
)
|
360,948
|
|
1.12
|
|
19,492
|
|
|||||||||
|
Hungarian forint
|
3,703
|
|
295.48
|
|
4
|
|
—
|
|
—
|
|
—
|
|
|||||||||
|
Indonesian rupiah
|
65,440
|
|
13,841.69
|
|
(191
|
)
|
—
|
|
—
|
|
—
|
|
|||||||||
|
Japanese yen
|
—
|
|
—
|
|
—
|
|
4,828
|
|
115.09
|
|
103
|
|
|||||||||
|
Mexican peso
|
101,092
|
|
20.77
|
|
278
|
|
35,078
|
|
20.05
|
|
1,292
|
|
|||||||||
|
New Zealand dollar*
|
18,289
|
|
0.72
|
|
(682
|
)
|
—
|
|
—
|
|
—
|
|
|||||||||
|
Polish zloty
|
10,363
|
|
4.17
|
|
(101
|
)
|
—
|
|
—
|
|
—
|
|
|||||||||
|
Russian ruble
|
24,893
|
|
60.94
|
|
189
|
|
—
|
|
—
|
|
—
|
|
|||||||||
|
Singapore dollar
|
8,417
|
|
1.43
|
|
(144
|
)
|
—
|
|
—
|
|
—
|
|
|||||||||
|
Swiss franc
|
30,907
|
|
1.01
|
|
(370
|
)
|
—
|
|
—
|
|
—
|
|
|||||||||
|
Turkish lira
|
2,459
|
|
3.52
|
|
(17
|
)
|
—
|
|
—
|
|
—
|
|
|||||||||
|
$
|
591,300
|
|
$
|
(6,790
|
)
|
$
|
535,368
|
|
$
|
24,299
|
|
||||||||||
*
The weighted average contract rate for these contracts is quoted in US dollar per local currency.
For the purchase of foreign currencies, fair value reflects the amount, based on dealer quotes, that Mattel would pay at maturity for contracts involving the same notional amounts, currencies, and maturity dates, if they had been entered into as of
December 31, 2016
. For the sale of foreign currencies, fair value reflects the amount, based on dealer quotes, that Mattel would receive at maturity for contracts involving the same notional amounts, currencies, and maturity dates, if they had been entered into as of
December 31, 2016
. The differences between the market forward amounts and the contract amounts are expected to be fully offset by currency transaction gains and losses on the underlying hedged transactions.
In addition to the contracts involving the US dollar detailed in the above table, Mattel also had contracts to sell British pound sterling for the purchase of Euro. As of
December 31, 2016
, these contracts had a contract amount of $66.5 million and a fair value of $(0.7) million.
Had Mattel not entered into hedges to limit the effect of currency exchange rate fluctuations on its results of operations and cash flows, its income before income taxes would have decreased by approximately $7 million in
2016
, decreased by approximately $6 million in
2015
, and increased by approximately $32 million in
2014
.
Venezuelan Operations
Since January 1, 2010, Mattel has accounted for Venezuela as a highly inflationary economy as the three-year cumulative inflation rate for Venezuela exceeded 100%. Accordingly, Mattel’s Venezuelan subsidiary uses the US dollar as its functional currency, and monetary assets and liabilities denominated in Venezuelan bolívar fuerte (“BsF”) generate income or expense for changes in value associated with foreign currency exchange rate fluctuations against the US dollar. From January 2010 through January 2013, Mattel’s Venezuelan subsidiary used the Sistema de Transacciones con Títulos en Moneda Extranjera (“SITME”) rate, which was quoted at
5.30
BsF per US dollar as of December 31, 2012, to remeasure monetary assets and liabilities denominated in BsF. During February 2013, the Central Bank of Venezuela revised its official exchange rate to
6.30
BsF per US dollar and eliminated the SITME rate.
47
During March 2013, the Venezuelan government introduced a complementary currency exchange system, the Sistema Complementario de Administración de Divisas 1 (“SICAD 1”). SICAD 1 was intended to function as an auction system, allowing entities in specific sectors to bid for US dollars to be used for specified import transactions. During February 2014, the Venezuelan government introduced an additional currency exchange system, the Sistema Complementario de Administración de Divisas 2 (“SICAD 2”), which was expected to provide a greater supply of US dollars from sources other than the Venezuelan government and increase participation to all sectors and companies.
During February 2015, the Venezuelan government announced the launch of a new three-tiered currency exchange platform, which included a new exchange system called the Marginal Currency System (“SIMADI”). The first tier was used for food, medicine, agriculture, and other essential goods and used an official exchange rate of
6.30
BsF per US dollar. The second tier was a merger of the SICAD 1 and SICAD 2 systems, which held periodic auctions for entities in specific sectors. The third tier was the new SIMADI system, which was intended to be a market-driven exchange that allowed for legal trading of foreign currency based on supply and demand.
During March 2016, the Venezuelan government further revised its currency exchange platform to a dual system. The SICAD rate merged with the official exchange rate, becoming the new Tipo de Cambio Protegido ("DIPRO") exchange rate, which was fixed at
10.00
BsF per US dollar. The existing SIMADI rate was renamed the Tipo de Cambio Complementario ("DICOM") exchange rate. The DIPRO rate is used for essential imports, such as food and medicine, whereas the DICOM rate is used for all other transactions. During the first quarter of 2016, Mattel changed its remeasurement rate from the official exchange rate to the new DICOM exchange rate. The change in the remeasurement rate resulted in an unrealized foreign currency exchange loss of approximately $26 million, which was recognized in other non-operating income (expense), net in the consolidated statement of operations in the first quarter of 2016.
Mattel’s Venezuelan subsidiary represented less than
0.01%
of Mattel’s consolidated net sales for the year ended December 31,
2016
and had approximately
$1 million
of net monetary assets denominated in BsF as of December 31,
2016
. Venezuela currency matters, along with economic and political instability, continue to impact the operating results of Mattel’s Venezuelan subsidiary. If the Venezuelan bolívar fuerte significantly devalues in the future, or if the economic or political conditions significantly worsen, Mattel may consider ceasing operations of its Venezuelan subsidiary, which could result in a pre-tax charge to its consolidated statement of operations of up to
$71 million
.
United Kingdom Operations
During June 2016, the referendum by British voters to exit the European Union ("Brexit") adversely impacted global markets and resulted in a sharp decline of the British pound sterling against the US dollar. In the short-term, volatility in the British pound sterling could continue as the United Kingdom negotiates its anticipated exit from the European Union. In the longer term, any impact from Brexit on Mattel's United Kingdom operations will depend, in part, on the outcome of tariff, trade, regulatory, and other negotiations. Mattel's United Kingdom operations represented approximately
4%
of Mattel's consolidated net sales for the year ended December 31,
2016
.
48
|
Item 8.
|
Financial Statements and Supplementary Data.
|
MANAGEMENT’S REPORT ON INTERNAL CONTROL OVER FINANCIAL REPORTING
Management is responsible for establishing and maintaining adequate internal control over financial reporting (as defined in Exchange Act Rules 13a-15(f) and 15d-15(f)). Mattel’s management, including Margaret H. Georgiadis, its principal executive officer, and Kevin M. Farr, its principal financial officer, evaluated the effectiveness of Mattel’s internal control over financial reporting using the framework in
Internal Control—Integrated Framework (2013)
issued by the Committee of Sponsoring Organizations of the Treadway Commission (COSO). The scope of management’s evaluation of the effectiveness of internal control over financial reporting does not include any internal controls of Sproutling, Inc. ("Sproutling") and Fuhu, Inc. ("Fuhu"), which were acquired in January 2016. This exclusion is in accordance with the SEC’s general guidance that a recently acquired business may be omitted from the scope of the assessment in the year of acquisition. Sprouting and Fuhu, excluding acquired intangible assets, represented less than 1% of Mattel’s total assets as of December 31, 2016 and less than 1% of Mattel’s total net sales for the year ended December 31, 2016. Based on this evaluation, management concluded that Mattel’s internal control over financial reporting was effective as of
December 31, 2016
. The effectiveness of the Company’s internal control over financial reporting as of
December 31, 2016
has been audited by PricewaterhouseCoopers LLP, an independent registered public accounting firm, as stated in their report which appears herein.
49
REPORT OF INDEPENDENT REGISTERED PUBLIC ACCOUNTING FIRM
To the Board of Directors and Stockholders of Mattel, Inc.
In our opinion, the consolidated financial statements listed in the index appearing under Item 15(a)(1) present fairly, in all material respects, the financial position of Mattel, Inc. and its subsidiaries at
December 31, 2016
and
December 31, 2015
, and the results of their operations and their cash flows for each of the three years in the period ended
December 31, 2016
in conformity with accounting principles generally accepted in the United States of America. In addition, in our opinion, the financial statement schedule listed in the index appearing under Item 15(a)(2) presents fairly, in all material respects, the information set forth therein when read in conjunction with the related consolidated financial statements. Also in our opinion, the Company maintained, in all material respects, effective internal control over financial reporting as of
December 31, 2016
, based on criteria established in
Internal Control—Integrated Framework (2013)
issued by the Committee of Sponsoring Organizations of the Treadway Commission (COSO). The Company’s management is responsible for these financial statements and financial statement schedule, for maintaining effective internal control over financial reporting and for its assessment of the effectiveness of internal control over financial reporting, included in Management’s Report on Internal Control over Financial Reporting appearing under Item 8. Our responsibility is to express opinions on these financial statements, on the financial statement schedule, and on the Company’s internal control over financial reporting based on our integrated audits. We conducted our audits in accordance with the standards of the Public Company Accounting Oversight Board (United States). Those standards require that we plan and perform the audits to obtain reasonable assurance about whether the financial statements are free of material misstatement and whether effective internal control over financial reporting was maintained in all material respects. Our audits of the financial statements included examining, on a test basis, evidence supporting the amounts and disclosures in the financial statements, assessing the accounting principles used and significant estimates made by management, and evaluating the overall financial statement presentation. Our audit of internal control over financial reporting included obtaining an understanding of internal control over financial reporting, assessing the risk that a material weakness exists, and testing and evaluating the design and operating effectiveness of internal control based on the assessed risk. Our audits also included performing such other procedures as we considered necessary in the circumstances. We believe that our audits provide a reasonable basis for our opinions.
As discussed in Note 3 to the consolidated financial statements, the Company changed the manner in which it classifies deferred taxes in 2016.
A company’s internal control over financial reporting is a process designed to provide reasonable assurance regarding the reliability of financial reporting and the preparation of financial statements for external purposes in accordance with generally accepted accounting principles. A company’s internal control over financial reporting includes those policies and procedures that (i) pertain to the maintenance of records that, in reasonable detail, accurately and fairly reflect the transactions and dispositions of the assets of the company; (ii) provide reasonable assurance that transactions are recorded as necessary to permit preparation of financial statements in accordance with generally accepted accounting principles, and that receipts and expenditures of the company are being made only in accordance with authorizations of management and directors of the company; and (iii) provide reasonable assurance regarding prevention or timely detection of unauthorized acquisition, use, or disposition of the company’s assets that could have a material effect on the financial statements.
Because of its inherent limitations, internal control over financial reporting may not prevent or detect misstatements. Also, projections of any evaluation of effectiveness to future periods are subject to the risk that controls may become inadequate because of changes in conditions, or that the degree of compliance with the policies or procedures may deteriorate.
As described in Management’s Report on Internal Control Over Financial Reporting, management has excluded Sproutling, Inc. and Fuhu, Inc. from its assessment of internal control over financial reporting as of December 31, 2016 because Sproutling, Inc. and Fuhu, Inc. were acquired by the Company in purchase business combinations during 2016. We have also excluded Sproutling, Inc. and Fuhu, Inc. from our audit of internal control over financial reporting. Sproutling, Inc. and Fuhu, Inc. are wholly-owned subsidiaries whose total assets and total revenues collectively represent less than 1% of the related consolidated financial statement amounts as of and for the year ended December 31, 2016.
/s/ PricewaterhouseCoopers LLP
Los Angeles, California
February 23, 2017
50
MATTEL, INC. AND SUBSIDIARIES
|
December 31,
2016 |
December 31,
2015 |
||||||
|
|
(In thousands, except share data)
|
||||||
|
ASSETS
|
|||||||
|
Current Assets
|
|||||||
|
Cash and equivalents
|
$
|
869,531
|
|
$
|
892,814
|
|
|
|
Accounts receivable, net of allowances of $21.4 million and $24.4 million in 2016 and 2015, respectively
|
1,115,217
|
|
1,145,099
|
|
|||
|
Inventories
|
613,798
|
|
587,521
|
|
|||
|
Prepaid expenses and other current assets
|
341,518
|
|
375,625
|
|
|||
|
Total current assets
|
2,940,064
|
|
3,001,059
|
|
|||
|
Noncurrent Assets
|
|||||||
|
Property, plant, and equipment, net
|
773,965
|
|
741,147
|
|
|||
|
Goodwill
|
1,387,628
|
|
1,384,520
|
|
|||
|
Other noncurrent assets
|
1,392,137
|
|
1,408,417
|
|
|||
|
Total Assets
|
$
|
6,493,794
|
|
$
|
6,535,143
|
|
|
|
LIABILITIES AND STOCKHOLDERS’ EQUITY
|
|||||||
|
Current Liabilities
|
|||||||
|
Short-term borrowings
|
$
|
192,168
|
|
$
|
16,914
|
|
|
|
Current portion of long-term debt
|
—
|
|
300,000
|
|
|||
|
Accounts payable
|
664,857
|
|
651,681
|
|
|||
|
Accrued liabilities
|
628,826
|
|
658,182
|
|
|||
|
Income taxes payable
|
19,722
|
|
18,752
|
|
|||
|
Total current liabilities
|
1,505,573
|
|
1,645,529
|
|
|||
|
Noncurrent Liabilities
|
|||||||
|
Long-term debt
|
2,134,271
|
|
1,784,721
|
|
|||
|
Other noncurrent liabilities
|
446,168
|
|
471,639
|
|
|||
|
Total noncurrent liabilities
|
2,580,439
|
|
2,256,360
|
|
|||
|
Commitments and Contingencies (See Note 11)
|
|
|
|||||
|
Stockholders’ Equity
|
|||||||
|
Common stock $1.00 par value, 1.0 billion shares authorized; 441.4 million shares issued
|
441,369
|
|
441,369
|
|
|||
|
Additional paid-in capital
|
1,790,832
|
|
1,789,870
|
|
|||
|
Treasury stock at cost: 99.0 million shares and 101.7 million shares in 2016 and 2015, respectively
|
(2,426,749
|
)
|
(2,494,901
|
)
|
|||
|
Retained earnings
|
3,545,359
|
|
3,745,815
|
|
|||
|
Accumulated other comprehensive loss
|
(943,029
|
)
|
(848,899
|
)
|
|||
|
Total stockholders’ equity
|
2,407,782
|
|
2,633,254
|
|
|||
|
Total Liabilities and Stockholders’ Equity
|
$
|
6,493,794
|
|
$
|
6,535,143
|
|
|
The accompanying notes are an integral part of these statements.
51
MATTEL, INC. AND SUBSIDIARIES
|
|
For the Year Ended
|
||||||||||
|
|
December 31,
2016 |
December 31,
2015 |
December 31,
2014 |
||||||||
|
|
(In thousands, except per share amounts)
|
||||||||||
|
Net Sales
|
$
|
5,456,650
|
|
$
|
5,702,613
|
|
$
|
6,023,819
|
|
||
|
Cost of sales
|
2,902,259
|
|
2,896,255
|
|
3,022,797
|
|
|||||
|
Gross Profit
|
2,554,391
|
|
2,806,358
|
|
3,001,022
|
|
|||||
|
Advertising and promotion expenses
|
634,947
|
|
717,852
|
|
733,243
|
|
|||||
|
Other selling and administrative expenses
|
1,400,211
|
|
1,547,584
|
|
1,614,065
|
|
|||||
|
Operating Income
|
519,233
|
|
540,922
|
|
653,714
|
|
|||||
|
Interest expense
|
95,118
|
|
85,270
|
|
79,271
|
|
|||||
|
Interest (income)
|
(9,144
|
)
|
(7,230
|
)
|
(7,382
|
)
|
|||||
|
Other non-operating expense (income), net
|
23,517
|
|
(1,033
|
)
|
(5,085
|
)
|
|||||
|
Income Before Income Taxes
|
409,742
|
|
463,915
|
|
586,910
|
|
|||||
|
Provision for income taxes
|
91,720
|
|
94,499
|
|
88,036
|
|
|||||
|
Net Income
|
$
|
318,022
|
|
$
|
369,416
|
|
$
|
498,874
|
|
||
|
Net Income Per Common Share—Basic
|
$
|
0.93
|
|
$
|
1.08
|
|
$
|
1.46
|
|
||
|
Weighted average number of common shares
|
341,480
|
|
339,172
|
|
339,016
|
|
|||||
|
Net Income Per Common Share—Diluted
|
$
|
0.92
|
|
$
|
1.08
|
|
$
|
1.45
|
|
||
|
Weighted average number of common and potential common shares
|
344,233
|
|
339,748
|
|
340,768
|
|
|||||
|
Dividends Declared Per Common Share
|
$
|
1.52
|
|
$
|
1.52
|
|
$
|
1.52
|
|
||
The accompanying notes are an integral part of these statements.
52
MATTEL, INC. AND SUBSIDIARIES
CONSOLIDATED STATEMENTS OF COMPREHENSIVE INCOME
|
|
For the Year Ended
|
||||||||||
|
|
December 31,
2016 |
December 31,
2015 |
December 31,
2014 |
||||||||
|
|
(In thousands)
|
||||||||||
|
Net Income
|
$
|
318,022
|
|
$
|
369,416
|
|
$
|
498,874
|
|
||
|
Other Comprehensive (Loss), Net of Tax:
|
|||||||||||
|
Currency translation adjustments
|
(101,539
|
)
|
(213,797
|
)
|
(189,666
|
)
|
|||||
|
Defined benefit pension plan adjustments
|
2,154
|
|
1,649
|
|
(29,561
|
)
|
|||||
|
Net unrealized gains on available-for-sale security
|
3,149
|
|
—
|
|
—
|
|
|||||
|
Net unrealized gains (losses) on derivative instruments:
|
|||||||||||
|
Unrealized holding gains
|
18,733
|
|
37,926
|
|
39,931
|
|
|||||
|
Reclassification adjustment for realized (gains) losses included in net income
|
(16,627
|
)
|
(52,588
|
)
|
883
|
|
|||||
|
2,106
|
|
(14,662
|
)
|
40,814
|
|
||||||
|
Other Comprehensive (Loss), Net of Tax
|
(94,130
|
)
|
(226,810
|
)
|
(178,413
|
)
|
|||||
|
Comprehensive Income
|
$
|
223,892
|
|
$
|
142,606
|
|
$
|
320,461
|
|
||
The accompanying notes are an integral part of these statements.
53
MATTEL, INC. AND SUBSIDIARIES
|
|
For the Year Ended
|
||||||||||
|
|
December 31,
2016 |
December 31,
2015 |
December 31,
2014 |
||||||||
|
|
(In thousands)
|
||||||||||
|
Cash Flows From Operating Activities:
|
|||||||||||
|
Net income
|
$
|
318,022
|
|
$
|
369,416
|
|
$
|
498,874
|
|
||
|
Adjustments to reconcile net income to net cash flows from operating activities:
|
|||||||||||
|
Depreciation
|
235,797
|
|
233,025
|
|
207,701
|
|
|||||
|
Amortization
|
26,543
|
|
32,402
|
|
41,000
|
|
|||||
|
Deferred income taxes
|
1,236
|
|
4,133
|
|
8,142
|
|
|||||
|
Share-based compensation
|
53,950
|
|
56,691
|
|
51,993
|
|
|||||
|
Decrease (increase) from changes in assets and liabilities, net of acquired assets and liabilities:
|
|||||||||||
|
Accounts receivable
|
(24,033
|
)
|
(136,259
|
)
|
90,285
|
|
|||||
|
Inventories
|
(37,195
|
)
|
(74,262
|
)
|
43,392
|
|
|||||
|
Prepaid expenses and other current assets
|
34,754
|
|
(36,865
|
)
|
(25,319
|
)
|
|||||
|
Accounts payable, accrued liabilities, and income taxes payable
|
9,006
|
|
248,047
|
|
(34,653
|
)
|
|||||
|
Other, net
|
(23,571
|
)
|
38,229
|
|
7,149
|
|
|||||
|
Net cash flows from operating activities
|
594,509
|
|
734,557
|
|
888,564
|
|
|||||
|
Cash Flows From Investing Activities:
|
|||||||||||
|
Purchases of tools, dies, and molds
|
(140,124
|
)
|
(142,363
|
)
|
(147,236
|
)
|
|||||
|
Purchases of other property, plant, and equipment
|
(122,069
|
)
|
(111,818
|
)
|
(113,221
|
)
|
|||||
|
Payments for acquisition, net of cash acquired
|
(33,154
|
)
|
—
|
|
(423,309
|
)
|
|||||
|
Payments for foreign currency forward exchange contracts
|
(6,103
|
)
|
(61,509
|
)
|
(19,933
|
)
|
|||||
|
Other, net
|
(10,460
|
)
|
33,195
|
|
(4,853
|
)
|
|||||
|
Net cash flows used for investing activities
|
(311,910
|
)
|
(282,495
|
)
|
(708,552
|
)
|
|||||
|
Cash Flows From Financing Activities:
|
|||||||||||
|
Payments of short-term borrowings, net
|
(83,914
|
)
|
—
|
|
(4,278
|
)
|
|||||
|
Proceeds from short-term borrowings, net
|
259,168
|
|
16,914
|
|
—
|
|
|||||
|
Payments of long-term borrowings
|
(300,000
|
)
|
—
|
|
(44,587
|
)
|
|||||
|
Proceeds from long-term borrowings, net
|
350,000
|
|
—
|
|
495,459
|
|
|||||
|
Share repurchases
|
—
|
|
—
|
|
(177,162
|
)
|
|||||
|
Payment of dividends on common stock
|
(518,529
|
)
|
(515,073
|
)
|
(514,813
|
)
|
|||||
|
Proceeds from exercise of stock options
|
34,065
|
|
14,995
|
|
43,299
|
|
|||||
|
Other, net
|
(22,261
|
)
|
(17,058
|
)
|
(25,237
|
)
|
|||||
|
Net cash flows used for financing activities
|
(281,471
|
)
|
(500,222
|
)
|
(227,319
|
)
|
|||||
|
Effect of Currency Exchange Rate Changes on Cash
|
(24,411
|
)
|
(30,676
|
)
|
(20,259
|
)
|
|||||
|
Decrease in Cash and Equivalents
|
(23,283
|
)
|
(78,836
|
)
|
(67,566
|
)
|
|||||
|
Cash and Equivalents at Beginning of Year
|
892,814
|
|
971,650
|
|
1,039,216
|
|
|||||
|
Cash and Equivalents at End of Year
|
$
|
869,531
|
|
$
|
892,814
|
|
$
|
971,650
|
|
||
|
Supplemental Cash Flow Information:
|
|||||||||||
|
Cash paid during the year for:
|
|||||||||||
|
Income taxes, gross
|
$
|
113,022
|
|
$
|
120,232
|
|
$
|
141,964
|
|
||
|
Interest
|
84,763
|
|
83,005
|
|
79,122
|
|
|||||
The accompanying notes are an integral part of these statements.
54
MATTEL, INC. AND SUBSIDIARIES
CONSOLIDATED STATEMENTS OF STOCKHOLDERS’ EQUITY
|
Common
Stock
|
Additional
Paid-In
Capital
|
Treasury
Stock
|
Retained
Earnings
|
Accumulated
Other
Comprehensive
Loss
|
Total
Stockholders’
Equity
|
||||||||||||||||||
|
|
(In thousands)
|
||||||||||||||||||||||
|
Balance, December 31, 2013
|
$
|
441,369
|
|
$
|
1,784,445
|
|
$
|
(2,448,701
|
)
|
$
|
3,918,122
|
|
$
|
(443,676
|
)
|
$
|
3,251,559
|
|
|||||
|
Net income
|
|
|
|
498,874
|
|
|
498,874
|
|
|||||||||||||||
|
Other comprehensive loss, net of tax
|
|
|
|
|
(178,413
|
)
|
(178,413
|
)
|
|||||||||||||||
|
Purchase of treasury stock
|
|
|
(177,162
|
)
|
|
|
(177,162
|
)
|
|||||||||||||||
|
Issuance of treasury stock for stock option exercises
|
|
(4,053
|
)
|
46,323
|
|
|
|
42,270
|
|
||||||||||||||
|
Issuance of treasury stock for restricted stock units vesting
|
|
(87,827
|
)
|
45,302
|
|
|
|
(42,525
|
)
|
||||||||||||||
|
Deferred compensation
|
|
|
672
|
|
(543
|
)
|
|
129
|
|
||||||||||||||
|
Share-based compensation
|
|
51,993
|
|
|
|
|
51,993
|
|
|||||||||||||||
|
Tax benefits from share-based payment arrangements
|
|
21,187
|
|
|
|
|
21,187
|
|
|||||||||||||||
|
Dividend equivalents for restricted stock units
|
|
1,351
|
|
|
(5,379
|
)
|
|
(4,028
|
)
|
||||||||||||||
|
Dividends
|
|
|
|
(514,813
|
)
|
|
(514,813
|
)
|
|||||||||||||||
|
Balance, December 31, 2014
|
441,369
|
|
1,767,096
|
|
(2,533,566
|
)
|
3,896,261
|
|
(622,089
|
)
|
2,949,071
|
|
|||||||||||
|
Net income
|
|
|
|
369,416
|
|
|
369,416
|
|
|||||||||||||||
|
Other comprehensive loss, net of tax
|
|
|
|
|
(226,810
|
)
|
(226,810
|
)
|
|||||||||||||||
|
Issuance of treasury stock for stock option exercises
|
(3,822
|
)
|
18,820
|
|
14,998
|
|
|||||||||||||||||
|
Issuance of treasury stock for restricted stock units vesting
|
|
(28,425
|
)
|
19,345
|
|
|
|
(9,080
|
)
|
||||||||||||||
|
Deferred compensation
|
|
|
500
|
|
(500
|
)
|
|
—
|
|
||||||||||||||
|
Share-based compensation
|
|
56,691
|
|
|
|
|
56,691
|
|
|||||||||||||||
|
Tax deficiencies from share-based payment arrangements
|
|
(2,780
|
)
|
|
|
|
(2,780
|
)
|
|||||||||||||||
|
Dividend equivalents for restricted stock units
|
|
1,110
|
|
|
(4,289
|
)
|
|
(3,179
|
)
|
||||||||||||||
|
Dividends
|
|
|
|
(515,073
|
)
|
|
(515,073
|
)
|
|||||||||||||||
|
Balance, December 31, 2015
|
441,369
|
|
1,789,870
|
|
(2,494,901
|
)
|
3,745,815
|
|
(848,899
|
)
|
2,633,254
|
|
|||||||||||
|
Net income
|
|
|
|
318,022
|
|
|
318,022
|
|
|||||||||||||||
|
Other comprehensive loss, net of tax
|
|
|
|
|
(94,130
|
)
|
(94,130
|
)
|
|||||||||||||||
|
Issuance of treasury stock for stock option exercises
|
|
(3,854
|
)
|
37,909
|
|
|
|
34,055
|
|
||||||||||||||
|
Issuance of treasury stock for restricted stock units vesting
|
|
(47,516
|
)
|
29,668
|
|
|
|
(17,848
|
)
|
||||||||||||||
|
Deferred compensation
|
|
385
|
|
575
|
|
(575
|
)
|
|
385
|
|
|||||||||||||
|
Share-based compensation
|
|
53,950
|
|
|
|
|
53,950
|
|
|||||||||||||||
|
Dividend equivalents for restricted stock units
|
|
(2,003
|
)
|
|
626
|
|
|
(1,377
|
)
|
||||||||||||||
|
Dividends
|
|
|
|
(518,529
|
)
|
|
(518,529
|
)
|
|||||||||||||||
|
Balance, December 31, 2016
|
$
|
441,369
|
|
$
|
1,790,832
|
|
$
|
(2,426,749
|
)
|
$
|
3,545,359
|
|
$
|
(943,029
|
)
|
$
|
2,407,782
|
|
|||||
The accompanying notes are an integral part of these statements.
55
MATTEL, INC. AND SUBSIDIARIES
NOTES TO CONSOLIDATED FINANCIAL STATEMENTS
Principles of Consolidation and Basis of Preparation
The consolidated financial statements include the accounts of Mattel, Inc. and its subsidiaries. All wholly and majority-owned subsidiaries are consolidated and included in Mattel’s consolidated financial statements. Mattel does not have any minority stock ownership interests in which it has a controlling financial interest that would require consolidation. All significant intercompany accounts and transactions have been eliminated upon consolidation.
Use of Estimates
Preparation of the consolidated financial statements in conformity with accounting principles generally accepted in the United States of America (“US GAAP”) requires management to make estimates and assumptions that affect the amounts reported in the consolidated financial statements and accompanying notes. Actual results could ultimately differ from those estimates.
Cash and Equivalents
Cash and equivalents include short-term investments, which are highly liquid investments with maturities of
three
months or less when purchased. Such investments are stated at cost, which approximates market value.
Accounts Receivable and Allowance for Doubtful Accounts
Credit is granted to customers on an unsecured basis. Credit limits and payment terms are established based on extensive evaluations made on an ongoing basis throughout the fiscal year of the financial performance, cash generation, financing availability, and liquidity status of each customer. Customers are reviewed at least annually, with more frequent reviews performed as necessary, based on the customers’ financial condition and the level of credit being extended. For customers who are experiencing financial difficulties, management performs additional financial analyses before shipping to those customers on credit. Mattel uses a variety of financial arrangements to ensure collectibility of accounts receivable of customers deemed to be a credit risk, including requiring letters of credit, purchasing various forms of credit insurance with unrelated third parties, factoring, or requiring cash in advance of shipment.
Mattel records an allowance for doubtful accounts based on management’s assessment of the business environment, customers’ financial condition, historical collection experience, accounts receivable aging, and customer disputes.
Inventories
Inventories, net of an allowance for excess quantities and obsolescence, are stated at the lower of cost or market. Inventory allowances are charged to cost of sales and establish a lower cost basis for the inventory. Cost is determined by the first-in, first-out method.
Property, Plant, and Equipment
Property, plant, and equipment are stated at cost less accumulated depreciation. Depreciation is computed using the straight-line method over estimated useful lives of
10
to
30
years for buildings,
3
to
15
years for machinery and equipment,
3
to
10
years for software, and
10
to
20
years, not to exceed the lease term, for leasehold improvements. Tools, dies, and molds are depreciated using the straight-line method over
3
years. Estimated useful lives are periodically reviewed and, where appropriate, changes are made prospectively. The carrying value of property, plant, and equipment is reviewed when events or changes in circumstances indicate that the carrying value of an asset may not be recoverable. Any potential impairment identified is assessed by evaluating the operating performance and future undiscounted cash flows of the underlying assets. When property is sold or retired, the cost of the property and the related accumulated depreciation are removed from the consolidated balance sheet, and any resulting gain or loss is included in the results of operations.
56
Goodwill and Intangible Assets
Goodwill is allocated to various reporting units, which are at the operating segment level, for purposes of evaluating whether goodwill is impaired. Mattel’s reporting units are: (i) North America, (ii) International, and (iii) American Girl. Components of the operating segments have been aggregated into a single reporting unit as the components have similar economic characteristics. The similar economic characteristics include the nature of the products, the nature of the production processes, the customers, and the manner in which the products are distributed. Mattel tests its goodwill for impairment annually in the third quarter and whenever events or changes in circumstances indicate that the carrying value of a reporting unit may exceed its fair value.
Mattel tests its nonamortizable intangible assets, including trademarks and trade names, for impairment by comparing the estimated fair values of the nonamortizable intangible assets with the carrying values. Mattel tests nonamortizable intangible assets for impairment annually in the third quarter or whenever events or changes in circumstances indicate that the carrying value may exceed its fair value.
Mattel also tests its amortizable intangible assets, which are primarily comprised of trademarks and trade names, for impairment whenever events or changes in circumstances indicate that the carrying value of the asset may not be recovered.
Foreign Currency Translation Exposure
Mattel’s reporting currency is the US dollar. The translation of its net investments in subsidiaries with non-US dollar functional currencies subjects Mattel to the impact of currency exchange rate fluctuations in its results of operations and financial position. Assets and liabilities of subsidiaries with non-US dollar functional currencies are translated into US dollars at year-end exchange rates. Income, expense, and cash flow items are translated at weighted average exchange rates prevailing during the year. The resulting currency translation adjustments are recorded as a component of accumulated other comprehensive loss within stockholders’ equity. Mattel’s primary currency translation exposures in 2016 were related to its net investments in entities having functional currencies denominated in the British pound sterling, Mexican peso, Euro, and Brazilian real.
Foreign Currency Transaction Exposure
Currency exchange rate fluctuations may impact Mattel’s results of operations and cash flows. Mattel’s currency transaction exposures include gains and losses realized on unhedged inventory purchases and unhedged receivables and payables balances that are denominated in a currency other than the applicable functional currency. Gains and losses on unhedged inventory purchases and other transactions associated with operating activities are recorded in the components of operating income in the consolidated statement of operations. Gains and losses on unhedged intercompany loans and advances are recorded as a component of other non-operating expense (income), net in the consolidated statement of operations in the period in which the currency exchange rate changes. Inventory transactions denominated in the Euro, Mexican peso, British pound sterling, Canadian dollar, Australian dollar, Brazilian real, Russian ruble, and Indonesian rupiah were the primary transactions that caused foreign currency transaction exposure for Mattel in 2016.
Derivative Instruments
Mattel uses foreign currency forward exchange contracts as cash flow hedges primarily to hedge its purchases and sales of inventory denominated in foreign currencies. At the inception of the contracts, Mattel designates these derivatives as cash flow hedges and documents the relationship of the hedge to the underlying transaction. Hedge effectiveness is assessed at inception and throughout the life of the hedge to ensure the hedge qualifies for hedge accounting. Changes in fair value associated with hedge ineffectiveness, if any, are recorded in the results of operations. Changes in fair value of cash flow hedge derivatives are deferred and recorded as part of accumulated other comprehensive loss in stockholders’ equity until the underlying transaction affects earnings. In the event that an anticipated transaction is no longer likely to occur, Mattel recognizes the change in fair value of the derivative in its results of operations in the period the determination is made.
Additionally, Mattel uses foreign currency forward exchange contracts to hedge intercompany loans and advances denominated in foreign currencies. Due to the short-term nature of the contracts involved, Mattel does not use hedge accounting for these contracts, and as such, changes in fair value are recorded in the period of change in the consolidated statements of operations.
57
Revenue Recognition and Sales Adjustments
Revenue is recognized upon shipment or upon receipt of products by the customer, depending on the terms, provided that: there are no uncertainties regarding customer acceptance; persuasive evidence of an agreement exists documenting the specific terms of the transaction; the sales price is fixed or determinable; and collectibility is reasonably assured. Management assesses the business environment, the customer’s financial condition, historical collection experience, accounts receivable aging, and customer disputes to determine whether collectibility is reasonably assured. If collectibility is not considered reasonably assured at the time of sale, Mattel does not recognize revenue until collection occurs. Value added taxes are recorded on a net basis and are excluded from revenue. Mattel routinely enters into arrangements with its customers to provide sales incentives, support customer promotions, and provide allowances for returns and defective merchandise. Such programs are based primarily on customer purchases, customer performance of specified promotional activities, and other specified factors such as sales to consumers. The costs of these programs are recorded as sales adjustments that reduce gross revenue in the period the related revenue is recognized.
Advertising and Promotion Costs
Costs of media advertising are expensed the first time the advertising takes place, except for direct-response advertising, which is capitalized and amortized over its expected period of future benefits. Direct-response advertising consists primarily of catalog production and mailing costs, which are generally amortized within
three
months from the date the catalogs are mailed.
Product Recalls and Withdrawals
Mattel establishes a reserve for product recalls and withdrawals on a product-specific basis when circumstances giving rise to the recall or withdrawal become known. Facts and circumstances related to the recall or withdrawal, including where the product affected by the recall or withdrawal is located (e.g., with consumers, in customers’ inventory, or in Mattel’s inventory), cost estimates for shipping and handling for returns, cost estimates for communicating the recall or withdrawal to consumers and customers, and cost estimates for parts and labor if the recalled or withdrawn product is deemed to be repairable, are considered when establishing a product recall or withdrawal reserve. These factors are updated and reevaluated each period, and the related reserves are adjusted when these factors indicate that the recall or withdrawal reserve is either not sufficient to cover or exceeds the estimated product recall or withdrawal expenses.
Design and Development Costs
Product design and development costs primarily include employee compensation and outside services and are charged to the results of operations as incurred.
Employee Benefit Plans
Mattel and certain of its subsidiaries have retirement and other postretirement benefit plans covering substantially all employees of these companies. Actuarial valuations are used in determining amounts recognized in the financial statements for certain retirement and other postretirement benefit plans (see “Note 4 to the Consolidated Financial Statements—Employee Benefit Plans”).
Share-Based Payments
Mattel recognizes the cost of employee share-based payment awards on a straight-line attribution basis over the requisite employee service period, net of estimated forfeitures.
Determining the fair value of share-based awards at the measurement date requires judgment, including estimating the expected term that stock options will be outstanding prior to exercise, the associated volatility, and the expected dividends. Mattel estimates the fair value of options granted using the Black-Scholes valuation model. The expected life of the options used in this calculation is the period of time the options are expected to be outstanding and has been determined based on historical exercise experience. Expected stock price volatility is based on the historical volatility of Mattel’s stock for a period approximating the expected life, the expected dividend yield is based on Mattel’s most recent actual annual dividend payout, and the risk-free interest rate is based on the implied yield available on US Treasury zero-coupon issues approximating the expected life. Judgment is also required in estimating the amount of share-based awards that will be forfeited prior to vesting.
Mattel determines the fair value of RSUs based on the closing market price of Mattel’s common stock on the date of grant, adjusted by the present value of the expected dividend for RSUs that are not entitled to a dividend during the vest period.
58
In the fourth quarter of 2016, Mattel early adopted Accounting Standards Update ("ASU") 2016-09,
Improvements to Employee Share-Based Payment Accounting
, which simplifies several aspects of the accounting for employee share-based payment transactions for public entities. The new standard requires companies to recognize all excess tax benefits and tax deficiencies in the income statement when the awards vest or are settled. Upon adoption, Mattel recognized
$4.3 million
in discrete tax benefits related to share-based payment accounting, which is more fully described in "Note 3 to the Consolidated Financial Statements—Income Taxes". Mattel also elected to apply the change in presentation of excess tax benefits in the statements of cash flows on a prospective basis, and as a result, prior periods were not retroactively adjusted. Excess tax benefits (deficits) in 2016 are classified as an operating activity in the statements of cash flows.
Prior to the adoption of ASU 2016-09, the tax effect of deductions in excess of compensation cost (“windfalls”) related to the exercise of nonqualified stock options and vesting of other share-based compensation awards were recorded in equity and tax deficiencies (“shortfalls”) were recorded in equity to the extent of previously recognized windfalls.
Income Taxes
Certain income and expense items are accounted for differently for financial reporting and income tax purposes. Deferred income tax assets and liabilities are determined based on the difference between the financial statement and tax bases of assets and liabilities, applying enacted statutory income tax rates in effect for the year in which the differences are expected to reverse.
In the normal course of business, Mattel is regularly audited by federal, state, local, and foreign tax authorities. The ultimate settlement of any particular issue with the applicable taxing authority could have a material impact on Mattel’s consolidated financial statements.
Venezuelan Operations
Since January 1, 2010, Mattel has accounted for Venezuela as a highly inflationary economy as the three-year cumulative inflation rate for Venezuela exceeded 100%. Accordingly, Mattel’s Venezuelan subsidiary uses the US dollar as its functional currency, and monetary assets and liabilities denominated in Venezuelan bolívar fuerte (“BsF”) generate income or expense for changes in value associated with foreign currency exchange rate fluctuations against the US dollar. From January 2010 through January 2013, Mattel’s Venezuelan subsidiary used the Sistema de Transacciones con Títulos en Moneda Extranjera (“SITME”) rate, which was quoted at
5.30
BsF per US dollar as of December 31, 2012, to remeasure monetary assets and liabilities denominated in BsF. During February 2013, the Central Bank of Venezuela revised its official exchange rate to
6.30
BsF per US dollar and eliminated the SITME rate.
During March 2013, the Venezuelan government introduced a complementary currency exchange system, the Sistema Complementario de Administración de Divisas 1 (“SICAD 1”). SICAD 1 was intended to function as an auction system, allowing entities in specific sectors to bid for US dollars to be used for specified import transactions. During February 2014, the Venezuelan government introduced an additional currency exchange system, the Sistema Complementario de Administración de Divisas 2 (“SICAD 2”), which was expected to provide a greater supply of US dollars from sources other than the Venezuelan government and increase participation to all sectors and companies.
During February 2015, the Venezuelan government announced the launch of a new three-tiered currency exchange platform, which included a new exchange system called the Marginal Currency System (“SIMADI”). The first tier was used for food, medicine, agriculture, and other essential goods and used an official exchange rate of
6.30
BsF per US dollar. The second tier was a merger of the SICAD 1 and SICAD 2 systems, which held periodic auctions for entities in specific sectors. The third tier was the new SIMADI system, which was intended to be a market-driven exchange that allowed for legal trading of foreign currency based on supply and demand.
During March 2016, the Venezuelan government further revised its currency exchange platform to a dual system. The SICAD rate merged with the official exchange rate, becoming the new Tipo de Cambio Protegido ("DIPRO") exchange rate, which was fixed at
10.00
BsF per US dollar. The existing SIMADI rate was renamed the Tipo de Cambio Complementario ("DICOM") exchange rate. The DIPRO rate is used for essential imports, such as food and medicine, whereas the DICOM rate is used for all other transactions. During the first quarter of 2016, Mattel changed its remeasurement rate from the official exchange rate to the new DICOM exchange rate. The change in the remeasurement rate resulted in an unrealized foreign currency exchange loss of approximately
$26 million
, which was recognized in other non-operating income (expense), net in the consolidated statement of operations in the first quarter of 2016.
59
Mattel’s Venezuelan subsidiary represented less than
0.01%
of Mattel’s consolidated net sales for the year ended December 31,
2016
and had approximately
$1 million
of net monetary assets denominated in BsF as of December 31,
2016
. Venezuela currency matters, along with economic and political instability, continue to impact the operating results of Mattel’s Venezuelan subsidiary. If the Venezuelan bolívar fuerte significantly devalues in the future, or if the economic or political conditions significantly worsen, Mattel may consider ceasing operations of its Venezuelan subsidiary, which could result in a pre-tax charge to its consolidated statement of operations of up to
$71 million
.
United Kingdom Operations
During June 2016, the referendum by British voters to exit the European Union ("Brexit") adversely impacted global markets and resulted in a sharp decline of the British pound sterling against the US dollar. In the short-term, volatility in the British pound sterling could continue as the United Kingdom negotiates its anticipated exit from the European Union. In the longer term, any impact from Brexit on Mattel's United Kingdom operations will depend, in part, on the outcome of tariff, trade, regulatory, and other negotiations. Mattel's United Kingdom operations represented approximately
4%
of Mattel's consolidated net sales for the year ended December 31,
2016
.
New Accounting Pronouncements
In May 2014, the Financial Accounting Standards Board (“FASB”) issued ASU 2014-09,
Revenue from Contracts with Customers,
which supersedes the revenue recognition requirements in Accounting Standards Codification (“ASC”) 605,
Revenue Recognition,
and most industry-specific guidance. The core principle of the guidance is that an entity should recognize revenue to depict the transfer of promised goods or services to customers in an amount that reflects the consideration to which the entity expects to be entitled in exchange for those goods or services. The new guidance establishes a five-step model to achieve that core principle and also requires additional disclosures about the nature, amount, timing, and uncertainty of revenue and cash flows arising from customer contracts. ASU 2014-09 was originally effective for interim and annual reporting periods beginning after December 15, 2016. In August 2015, the FASB issued ASU 2015-14,
Revenue from Contracts with Customers – Deferral of the Effective Date,
which defers the effective date to annual reporting periods beginning after December 15, 2017. Early application is permitted after December 15, 2016. In March 2016, the FASB issued ASU 2016-08,
Principal versus Agent Considerations (Reporting Revenue Gross versus Net)
, which clarifies the implementation guidance on principal versus agent considerations, and ASU 2016-10,
Identifying Performance Obligations and Licensing
, which clarifies the identification of performance obligations and the licensing implementation guidance. In May 2016, the FASB issued ASU 2016-12,
Revenue from Contracts with Customers - Narrow-Scope Improvements and Practical Expedients
, which clarifies guidance on assessing collectibility, presenting sales taxes and other similar taxes collected from customers, measuring noncash consideration, and certain transition matters. Mattel is currently evaluating the impact of the adoption of ASU 2014-09, ASU 2015-14, ASU 2016-08, ASU 2016-10, and ASU 2016-12 on its operating results and financial position.
In July 2015, the FASB issued ASU 2015-11,
Simplifying the Measurement of Inventory,
which requires an entity that uses first-in, first-out or average cost to measure its inventory at the lower of cost or net realizable value. Net realizable value is the estimated selling price in the ordinary course of business, less reasonably predictable costs of completion, disposal, and transportation. ASU 2015-11 will be effective for interim and annual reporting periods beginning after December 15, 2016. Early application is permitted. Mattel does not expect the adoption of ASU 2015-11 to have a material effect on its operating results or financial position.
In February 2016, the FASB issued ASU 2016-02,
Leases
, which requires a lessee to recognize a lease asset and lease liability on its balance sheet for all leases with a term greater than 12 months. ASU 2016-02 will be effective for interim and annual reporting periods beginning after December 15, 2018. Early application is permitted. Mattel is currently evaluating the impact of the adoption of ASU 2016-02 on its operating results and financial position.
In August 2016, the FASB issued ASU 2016-15,
Statement of Cash Flows - Classification of Certain Cash Receipts and Cash Payments
, which adds and clarifies guidance on the classification of certain cash receipts and payments in the statement of cash flows. ASU 2016-15 will be effective for interim and annual reporting periods beginning after December 15, 2017. Early application is permitted. Mattel is currently evaluating the impact of the adoption of ASU 2016-15 on its operating results and financial statements.
In October 2016, the FASB issued ASU 2016-16,
Income Taxes: Intra-Entity Transfers of Assets Other Than Inventory,
which requires an entity to recognize the income tax consequences of an intra-entity transfer of an asset other than inventory when the transfer occurs. ASU 2016-16 will be effective for interim and annual reporting periods beginning after December 15, 2017. Early application is permitted. Mattel is currently evaluating the impact of the adoption of ASU 2016-16 on its operating results and financial position.
60
In January 2017, the FASB issued ASU 2017-01,
Business Combinations: Clarifying the Definition of a Business,
which clarifies the definition of a business to assist entities with evaluating whether transactions should be accounted for as acquisitions (or disposals) of assets or businesses and refines the definition of the term output. ASU 2017-01 will be effective for interim and annual reporting periods beginning after December 15, 2017. Early application is permitted. Mattel is currently evaluating the impact of the adoption of ASU 2017-01 on its operating results and financial position.
In January 2017, the FASB issued ASU 2017-04,
Intangibles - Goodwill and Other: Simplifying the Test for Goodwill Impairment
, which removes Step 2 from the goodwill impairment test. ASU 2017-04 will be effective for interim and annual reporting periods beginning after December 15, 2019. Early application is permitted after January 1, 2017. Mattel is currently evaluating the impact of the adoption of ASU 2017-04 on its operating results and financial position.
Goodwill is allocated to various reporting units, which are at the operating segment level, for purposes of evaluating whether goodwill is impaired. Mattel’s reporting units are: (i) North America, (ii) International, and (iii) American Girl. Components of the operating segments have been aggregated into a single reporting unit as the components have similar economic characteristics. The similar economic characteristics include the nature of the products, the nature of the production processes, the customers, and the manner in which the products are distributed.
The change in the carrying amount of goodwill by operating segment for
2016
and
2015
is shown below. Brand-specific goodwill held by foreign subsidiaries is allocated to the North America and American Girl operating segments selling those brands, thereby causing a foreign currency translation impact for these operating segments.
|
North America
|
International
|
American Girl
|
Total
|
||||||||||||
|
|
(In thousands)
|
||||||||||||||
|
Balance at December 31, 2014
|
$
|
720,939
|
|
$
|
458,766
|
|
$
|
213,220
|
|
$
|
1,392,925
|
|
|||
|
Currency exchange rate impact
|
(1,940
|
)
|
(5,887
|
)
|
(578
|
)
|
(8,405
|
)
|
|||||||
|
Balance at December 31, 2015
|
718,999
|
|
452,879
|
|
212,642
|
|
1,384,520
|
|
|||||||
|
Acquisition
|
15,078
|
|
8,572
|
|
—
|
|
23,650
|
|
|||||||
|
Currency exchange rate impact
|
(3,938
|
)
|
(16,443
|
)
|
(161
|
)
|
(20,542
|
)
|
|||||||
|
Balance at December 31, 2016
|
$
|
730,139
|
|
$
|
445,008
|
|
$
|
212,481
|
|
$
|
1,387,628
|
|
|||
In the third quarter of
2016
, Mattel performed its annual impairment tests and determined that goodwill was not impaired since each reporting unit's fair value exceeded its carrying value. Mattel has not recorded any goodwill impairment charges since it initially adopted the provisions of ASC 350-20,
Goodwill.
Acquisitions of Sproutling, Inc. and Fuhu, Inc.
In January 2016, Mattel completed its acquisition of Sproutling, Inc. ("Sproutling"), a maker of smart technology products for parents and families, for total consideration of
$9.9 million
and additional contingent consideration that may become payable under the terms of the agreement based on Sproutling's operating results over the next
three
years. Also in January 2016, Mattel acquired substantially all of the assets of Fuhu, Inc. ("Fuhu"), a developer of high technology products for children and families and best known for its nabi® brand of products, for total consideration of
$23.3 million
. These acquisitions are expected to strengthen Mattel's digital and smart technology capabilities and create opportunities to bring new technology-enabled products to market.
Mattel finalized the valuation of the assets acquired and liabilities assumed in the fourth quarter of 2016, which resulted in adjustments to the purchase price allocation during the measurement period. During 2016, Mattel recognized approximately
$2 million
of integration and acquisition costs. Integration and acquisition costs are recorded within other selling and administrative expenses in the consolidated statements of operations. The pro forma and actual results of operations for these acquisitions have not been presented because they are not material, individually or in the aggregate, to Mattel.
61
Acquisition of MEGA Brands Inc.
On April 30, 2014, Mattel acquired MEGA Brands Inc., a corporation incorporated under the laws of Canada (“MEGA Brands”), pursuant to the Arrangement Agreement dated as of February 27, 2014, between MEGA Brands, Mattel Overseas Operations Ltd., a corporation incorporated under the laws of Bermuda, Mattel-MEGA Holdings Inc., a corporation incorporated under the laws of Canada (the “Purchasing Subsidiary”), and, with respect to certain provisions thereof, Mattel (the “Arrangement Agreement”). Pursuant to the terms set forth in the Arrangement Agreement, Mattel indirectly acquired, through the Purchasing Subsidiary,
100%
of the issued and outstanding common shares and warrants of MEGA Brands for total cash consideration of
$454.9 million
, including payment for cash acquired of
$31.6 million
. The acquisition of MEGA Brands builds upon Mattel’s portfolio of brands by expanding into the construction building sets and arts and crafts categories.
The total purchase consideration was allocated to the assets acquired and liabilities assumed based on their estimated fair values. As a result of the acquisition, Mattel recognized
$95.0 million
of identifiable intangible assets (primarily related to trade names and existing product lines),
$40.6 million
of net assets acquired (which included
$31.6 million
of cash,
$36.6 million
of accounts receivable,
$83.0 million
of inventory,
$32.5 million
of property, plant, and equipment,
$66.6 million
of accounts payable and accrued liabilities,
$44.6 million
of long-term debt, and
$31.9 million
of other net liabilities), and
$319.3 million
of goodwill, which is not deductible for tax purposes. The fair values of the identifiable intangible assets related to trade names were based on the relief from royalty method, using Level 3 inputs within the fair value hierarchy, which included forecasted future cash flows, long-term revenue growth rates, royalty rates, and discount rates. The fair values of the identifiable intangible assets related to existing product lines were estimated based on the multi-period excess earnings method, using Level 3 inputs within the fair value hierarchy, which included forecasted future cash flows, long-term revenue growth rates, and discount rates. Goodwill relates to a number of factors built into the purchase price, including the future earnings and cash flow potential of the business, as well as the complementary strategic fit and the resulting synergies it brings to Mattel’s existing operations.
Mattel finalized the valuation of the assets acquired and liabilities assumed in the first quarter of 2015, which resulted in adjustments to the purchase price allocation during the measurement period. As such, Mattel has retrospectively adjusted the provisional amounts recorded in its consolidated balance sheet as of December 31, 2014 as if the valuation of the assets acquired and liabilities assumed was finalized on the acquisition date. For the consolidated balance sheet as of December 31, 2014, the retrospective adjustments resulted in an increase to net assets acquired of approximately
$1 million
and a decrease to goodwill of approximately
$1 million
.
There were
no
integration or transaction costs during 2016. During
2015
, Mattel recognized approximately
$11 million
of integration costs. There were
no
transaction costs during
2015
. During
2014
, Mattel recognized approximately
$21 million
and
$7 million
of integration costs and transaction costs, respectively. Integration and transaction costs are recorded within other selling and administrative expenses in the consolidated statements of operations. The pro forma and actual results of operations for this acquisition have not been presented because they are not material.
Other Intangibles
Identifiable intangibles include the following:
|
|
December 31,
2016 |
December 31,
2015 |
|||||
|
|
(In thousands)
|
||||||
|
Nonamortizable identifiable intangibles
|
$
|
458,589
|
|
$
|
488,144
|
|
|
|
Identifiable intangibles (net of amortization of $153.7 and $131.5 million at December 31, 2016 and 2015, respectively)
|
201,859
|
|
212,161
|
|
|||
|
$
|
660,448
|
|
$
|
700,305
|
|
||
In connection with the acquisition of Sproutling and Fuhu during 2016, Mattel recognized
$11.0 million
of amortizable identifiable intangible assets, primarily related to patents.
Mattel tests nonamortizable intangible assets, including trademarks and trade names, for impairment annually in the third quarter and whenever events or changes in circumstances indicate that the carrying values may exceed the fair values. During 2016, Mattel performed the annual impairment tests and determined that its nonamortizable intangible assets were not impaired.
62
Mattel also tests its amortizable intangible assets for impairment whenever events or changes in circumstances indicate that the carrying value of the asset may not be recoverable. Mattel determined that its amortizable intangible assets were not impaired during 2016.
Consolidated pre-tax income (loss) consists of the following:
|
|
For the Year Ended
|
||||||||||
|
|
December 31,
2016 |
December 31,
2015 |
December 31,
2014 |
||||||||
|
|
(In thousands)
|
||||||||||
|
US operations
|
$
|
9,179
|
|
$
|
(3,435
|
)
|
$
|
39,149
|
|
||
|
Foreign operations
|
400,563
|
|
467,350
|
|
547,761
|
|
|||||
|
$
|
409,742
|
|
$
|
463,915
|
|
$
|
586,910
|
|
|||
63
The provision (benefit) for current and deferred income taxes consists of the following:
|
|
For the Year Ended
|
||||||||||
|
|
December 31,
2016 |
December 31,
2015 |
December 31,
2014 |
||||||||
|
|
(In thousands)
|
||||||||||
|
Current
|
|||||||||||
|
Federal
|
$
|
(3,041
|
)
|
$
|
(1,405
|
)
|
$
|
(25,075
|
)
|
||
|
State
|
2,455
|
|
1,946
|
|
(2,029
|
)
|
|||||
|
Foreign
|
91,070
|
|
89,825
|
|
106,998
|
|
|||||
|
90,484
|
|
90,366
|
|
79,894
|
|
||||||
|
Deferred
|
|||||||||||
|
Federal
|
(4,624
|
)
|
(3,802
|
)
|
21,987
|
|
|||||
|
State
|
2,623
|
|
(2,200
|
)
|
8,233
|
|
|||||
|
Foreign
|
3,237
|
|
10,135
|
|
(22,078
|
)
|
|||||
|
1,236
|
|
4,133
|
|
8,142
|
|
||||||
|
Provision for income taxes
|
$
|
91,720
|
|
$
|
94,499
|
|
$
|
88,036
|
|
||
Deferred income taxes are provided principally for tax credit carryforwards, research and development expenses, net operating loss carryforwards, employee compensation-related expenses, and certain other reserves that are recognized in different years for financial statement and income tax reporting purposes. Mattel’s deferred income tax assets (liabilities) are composed of the following:
|
|
December 31,
2016 |
December 31,
2015 |
|||||
|
|
(In thousands)
|
||||||
|
Allowances and reserves
|
$
|
204,661
|
|
$
|
211,538
|
|
|
|
Research and development expenses
|
193,908
|
|
191,057
|
|
|||
|
Loss carryforwards
|
165,522
|
|
150,270
|
|
|||
|
Deferred compensation
|
78,245
|
|
98,832
|
|
|||
|
Tax credit carryforwards
|
59,426
|
|
50,309
|
|
|||
|
Postretirement benefits
|
47,732
|
|
48,648
|
|
|||
|
Intangible assets
|
9,160
|
|
14,035
|
|
|||
|
Other
|
62,057
|
|
71,453
|
|
|||
|
Gross deferred income tax assets
|
820,711
|
|
836,142
|
|
|||
|
Intangible assets
|
(295,968
|
)
|
(305,818
|
)
|
|||
|
Other
|
—
|
|
(2,905
|
)
|
|||
|
Gross deferred income tax liabilities
|
(295,968
|
)
|
(308,723
|
)
|
|||
|
Deferred income tax asset valuation allowances
|
(74,125
|
)
|
(77,334
|
)
|
|||
|
Net deferred income tax assets
|
$
|
450,618
|
|
$
|
450,085
|
|
|
64
Net deferred income tax assets are reported in the consolidated balance sheets as follows:
|
|
December 31,
2016 |
December 31,
2015 |
|||||
|
|
(In thousands)
|
||||||
|
Other noncurrent assets
|
$
|
508,363
|
|
$
|
510,928
|
|
|
|
Other noncurrent liabilities
|
(57,745
|
)
|
(60,843
|
)
|
|||
|
$
|
450,618
|
|
$
|
450,085
|
|
||
In the first quarter of 2016, Mattel retrospectively adopted ASU 2015-17,
Balance Sheet Classification of Deferred Taxes
, which generally simplifies the classification of all deferred tax assets and liabilities, along with any related valuation allowance, into noncurrent amounts on the balance sheet. As of December 31, 2015, prepaid expenses and other current assets decreased by
$195.8 million
, other noncurrent assets increased by
$193.6 million
, and other noncurrent liabilities decreased by
$2.2 million
from the previously reported amounts.
As of
December 31, 2016
, Mattel had federal and foreign loss carryforwards totaling
$639.1 million
and tax credit carryforwards of
$60.6 million
, which excludes carryforwards that do not meet the threshold for recognition in the financial statements. Utilization of these loss and tax credit carryforwards is subject to annual limitations. Mattel’s loss and tax credit carryforwards expire in the following periods:
|
Loss
Carryforwards
|
Tax Credit
Carryforwards
|
||||||
|
|
(In thousands)
|
||||||
|
2017 – 2021
|
$
|
52,614
|
|
$
|
1,578
|
|
|
|
Thereafter
|
321,859
|
|
54,376
|
|
|||
|
No expiration date
|
264,674
|
|
4,637
|
|
|||
|
Total
|
$
|
639,147
|
|
$
|
60,591
|
|
|
Management considered all available evidence under existing tax law and anticipated expiration of tax statutes and determined that a valuation allowance of
$65.2 million
was required as of
December 31, 2016
for those loss and tax credit carryforwards that are not expected to provide future tax benefits. In addition, management determined that a valuation allowance of
$8.9 million
was required as of
December 31, 2016
for those deferred tax assets for which there is not sufficient evidence as to their ultimate utilization, primarily related to certain foreign affiliates. Changes in the valuation allowance for
2016
primarily relate to increases in the valuation allowance related to losses without benefits, offset by decreases in the valuation allowance for certain deferred tax assets and expirations of tax loss and/or tax credit carryforwards. Management believes it is more-likely-than-not (a greater than
50 percent
likelihood) that Mattel will generate sufficient taxable income in the appropriate future periods to realize the benefit of the remaining net deferred income tax assets of
$450.6 million
. Changes in enacted tax laws, audits in various jurisdictions around the world, settlements, or acquisitions could negatively impact Mattel’s ability to fully realize all of the benefits of its remaining net deferred tax assets.
65
Differences between the provision for income taxes at the US federal statutory income tax rate and the provision in the consolidated statements of operations are as follows:
|
|
For the Year Ended
|
||||||||||
|
|
December 31,
2016 |
December 31,
2015 |
December 31,
2014 |
||||||||
|
|
(In thousands)
|
||||||||||
|
Provision at US federal statutory rate
|
$
|
143,410
|
|
$
|
162,370
|
|
$
|
205,419
|
|
||
|
(Decrease) increase resulting from:
|
|||||||||||
|
Foreign earnings taxed at different rates, including withholding taxes
|
(51,711
|
)
|
(56,877
|
)
|
(107,409
|
)
|
|||||
|
Foreign losses without income tax benefit
|
8,526
|
|
5,843
|
|
20,140
|
|
|||||
|
State and local taxes, net of US federal benefit
|
3,385
|
|
482
|
|
3,760
|
|
|||||
|
Adjustments to previously accrued taxes
|
(12,537
|
)
|
(19,134
|
)
|
(55,026
|
)
|
|||||
|
Adoption of ASU 2016-09
|
(4,308
|
)
|
—
|
|
—
|
|
|||||
|
Tax restructuring
|
—
|
|
—
|
|
12,400
|
|
|||||
|
Other
|
4,955
|
|
1,815
|
|
8,752
|
|
|||||
|
Provision for income taxes
|
$
|
91,720
|
|
$
|
94,499
|
|
$
|
88,036
|
|
||
In the fourth quarter of 2016, Mattel early adopted ASU 2016-09,
Improvements to Employee Share-Based Payment Accounting
, which requires all excess tax benefits and tax deficiencies to be recognized in the income statement when the awards vest or are settled. Upon adoption of ASU 2016-09, Mattel recognized
$4.3 million
in discrete tax benefits related to share-based payment accounting.
Prior to the adoption of ASU 2016-09, the tax effect of deductions in excess of compensation cost (“windfalls”) related to the exercise of nonqualified stock options and vesting of other share-based compensation awards were recorded in equity and tax deficiencies (“shortfalls”) were recorded in equity to the extent of previously recognized windfalls. The exercise of nonqualified stock options and vesting of other share-based compensation awards resulted in a (decrease)/increase to additional paid-in capital totaling
$(2.8) million
and
$21.2 million
in
2015
and
2014
, respectively.
In assessing whether uncertain tax positions should be recognized in its financial statements, Mattel first determines whether it is more-likely-than-not that a tax position will be sustained upon examination, including resolution of any related appeals or litigation processes, based on the technical merits of the position. In evaluating whether a tax position has met the more-likely-than-not recognition threshold, Mattel presumes that the position will be examined by the appropriate taxing authority that would have full knowledge of all relevant information. For tax positions that meet the more-likely-than-not recognition threshold, Mattel measures the amount of benefit recognized in the financial statements at the largest amount of benefit that is greater than
50 percent
likely of being realized upon ultimate settlement. Mattel recognizes unrecognized tax benefits in the first financial reporting period in which information becomes available indicating that such benefits will more-likely-than-not be realized.
Mattel records a reserve for unrecognized tax benefits for US federal, state, local, and foreign tax positions related primarily to transfer pricing, tax credits claimed, tax nexus, and apportionment. For each reporting period, management applies a consistent methodology to measure unrecognized tax benefits, and all unrecognized tax benefits are reviewed periodically and adjusted as circumstances warrant. Mattel’s measurement of its reserve for unrecognized tax benefits is based on management’s assessment of all relevant information, including prior audit experience, the status of audits, conclusions of tax audits, lapsing of applicable statutes of limitations, identification of new issues, and any administrative guidance or developments.
66
A reconciliation of the reserve for unrecognized tax benefits is as follows:
|
|
For the Year Ended
|
||||||||||
|
|
December 31,
2016 |
December 31,
2015 |
December 31,
2014 |
||||||||
|
|
(In thousands)
|
||||||||||
|
Unrecognized tax benefits at January 1
|
$
|
118,099
|
|
$
|
100,357
|
|
$
|
111,370
|
|
||
|
Increases for positions taken in current year
|
2,925
|
|
5,724
|
|
9,886
|
|
|||||
|
Increases for positions taken in a prior year
|
921
|
|
22,584
|
|
53,221
|
|
|||||
|
Decreases for positions taken in a prior year
|
(1,706
|
)
|
(4,242
|
)
|
(51,421
|
)
|
|||||
|
Decreases for settlements with taxing authorities
|
(1,097
|
)
|
(3,577
|
)
|
(9,493
|
)
|
|||||
|
Decreases for lapses in the applicable statute of limitations
|
(9,795
|
)
|
(2,747
|
)
|
(13,206
|
)
|
|||||
|
Unrecognized tax benefits at December 31
|
$
|
109,347
|
|
$
|
118,099
|
|
$
|
100,357
|
|
||
Of the
$109.3 million
of unrecognized tax benefits as of December 31, 2016,
$105.8 million
would impact the effective tax rate if recognized.
Mattel recognized a decrease of interest and penalties of approximately
$2 million
during 2016, and increase of interest and penalties of approximately
$0
and
$2 million
during 2015 and 2014, respectively, related to unrecognized tax benefits, which are reflected in provision for income taxes in the consolidated statements of operations. As of
December 31, 2016
, Mattel accrued
$17.1 million
in interest and penalties related to unrecognized tax benefits. Of this balance,
$16.2 million
would impact the effective tax rate if recognized. As of December 31, 2015, Mattel accrued
$18.3 million
in interest and penalties related to unrecognized tax benefits.
In the normal course of business, Mattel is regularly audited by federal, state, local and foreign tax authorities. In May 2014, the IRS completed its audit of Mattel’s 2010 and 2011 federal income tax returns. Mattel remains subject to IRS examination for the 2013 through 2016 tax years. Mattel files multiple state and local income tax returns and remains subject to examination in various of these jurisdictions, including California for the 2008 through 2016 tax years, New York for the 2010 through 2016 tax years, and Wisconsin for the 2008 through 2016 tax years. Mattel files multiple foreign income tax returns and remains subject to examination in major foreign jurisdictions, including Hong Kong for the 2010 through 2016 tax years, Brazil, Mexico and Netherlands for the 2011 through 2016 tax years and Russia for the 2014 through 2016 tax years. Based on the current status of federal, state, local and foreign audits, Mattel believes it is reasonably possible that in the next 12 months, the total unrecognized tax benefits could decrease by approximately
$11 million
related to the settlement of tax audits and/or the expiration of statutes of limitations. The ultimate settlement of any particular issue with the applicable taxing authority could have a material impact on Mattel’s consolidated financial statements.
The income tax provision included net tax benefits of
$16.8 million
,
$19.1 million
, and
$42.6 million
in
2016
,
2015
, and
2014
, respectively. The 2016 net tax benefits primarily related to reassessments of prior years’ tax liabilities based on the status of audits and tax filings in various jurisdictions around the world, settlements, and enacted tax law changes, and the adoption of ASU 2016-09. The
2015
net tax benefits primarily related to reassessments of prior years’ tax liabilities based on the status of audits and tax filings in various jurisdictions around the world, settlements, and enacted tax law changes. The 2014 net tax benefits primarily related to the reassessments of prior years’ tax liabilities based on the status of audits and tax filings in various jurisdictions around the world, settlements, and enacted tax law changes, partially offset by a tax charge related to a 2014 tax restructuring for the HIT Entertainment
®
and MEGA Brands operations.
The cumulative amount of undistributed earnings of foreign subsidiaries that Mattel intends to indefinitely reinvest and upon which no deferred US income taxes have been provided is approximately
$7.0 billion
as of
December 31, 2016
. Management periodically reviews the undistributed earnings of its foreign subsidiaries and reassesses the intent to indefinitely reinvest such earnings. It is not practicable for Mattel to determine the deferred tax liability associated with these undistributed earnings due to the availability of foreign tax credits, the complexity of Mattel's international holding company structure, the rules governing the utilization of foreign tax credits, and the interplay between utilization of such foreign tax credits and Mattel’s other significant tax attributes.
67
Mattel and certain of its subsidiaries have qualified and nonqualified retirement plans covering substantially all employees of these companies. These plans include defined benefit pension plans, defined contribution retirement plans, postretirement benefit plans, and deferred compensation and excess benefit plans. In addition, Mattel makes contributions to government-mandated retirement plans in countries outside the US where its employees work.
A summary of retirement plan expense is as follows:
|
|
For the Year Ended
|
||||||||||
|
|
December 31,
2016 |
December 31,
2015 |
December 31,
2014 |
||||||||
|
|
(In thousands)
|
||||||||||
|
Defined contribution retirement plans
|
$
|
37,661
|
|
$
|
40,673
|
|
$
|
43,819
|
|
||
|
Defined benefit pension plans
|
13,999
|
|
14,779
|
|
18,124
|
|
|||||
|
Deferred compensation and excess benefit plans
|
5,093
|
|
225
|
|
4,840
|
|
|||||
|
Postretirement benefit plans
|
1,343
|
|
1,396
|
|
1,461
|
|
|||||
|
$
|
58,096
|
|
$
|
57,073
|
|
$
|
68,244
|
|
|||
Defined Benefit Pension and Postretirement Benefit Plans
Mattel provides defined benefit pension plans for eligible domestic employees, which are intended to comply with the requirements of the Employee Retirement Income Security Act of 1974 (“ERISA”). Some of Mattel’s foreign subsidiaries have defined benefit pension plans covering substantially all of their eligible employees. Mattel funds these plans in accordance with the terms of the plans and local statutory requirements, which differ for each of the countries in which the subsidiaries are located. Mattel also has unfunded postretirement health insurance plans covering certain eligible domestic employees.
A summary of the components of Mattel’s net periodic benefit cost and other changes in plan assets and benefit obligations recognized in other comprehensive income for the years ended December 31 is as follows:
|
|
Defined Benefit Pension Plans
|
Postretirement Benefit Plans
|
|||||||||||||||||||||
|
|
2016
|
2015
|
2014
|
2016
|
2015
|
2014
|
|||||||||||||||||
|
|
(In thousands)
|
||||||||||||||||||||||
|
Net periodic benefit cost:
|
|||||||||||||||||||||||
|
Service cost
|
$
|
5,557
|
|
$
|
6,105
|
|
$
|
7,515
|
|
$
|
52
|
|
$
|
54
|
|
$
|
67
|
|
|||||
|
Interest cost
|
24,526
|
|
26,007
|
|
27,708
|
|
1,143
|
|
1,194
|
|
1,377
|
|
|||||||||||
|
Expected return on plan assets
|
(25,726
|
)
|
(29,850
|
)
|
(31,833
|
)
|
—
|
|
—
|
|
—
|
|
|||||||||||
|
Amortization of prior service cost (credit)
|
461
|
|
(465
|
)
|
(1,037
|
)
|
—
|
|
—
|
|
—
|
|
|||||||||||
|
Recognized actuarial loss
|
6,994
|
|
15,168
|
|
15,771
|
|
148
|
|
148
|
|
17
|
|
|||||||||||
|
Settlement loss
|
1,772
|
|
6,453
|
|
—
|
|
—
|
|
—
|
|
—
|
|
|||||||||||
|
Curtailment loss (gain)
|
415
|
|
(8,639
|
)
|
—
|
|
—
|
|
—
|
|
—
|
|
|||||||||||
|
Net periodic benefit cost
|
$
|
13,999
|
|
$
|
14,779
|
|
$
|
18,124
|
|
$
|
1,343
|
|
$
|
1,396
|
|
$
|
1,461
|
|
|||||
|
Other changes in plan assets and benefit obligations recognized in other comprehensive income:
|
|||||||||||||||||||||||
|
Net actuarial (gain) loss
|
$
|
(1,531
|
)
|
$
|
(8,813
|
)
|
$
|
48,502
|
|
$
|
(1,833
|
)
|
$
|
(3,130
|
)
|
$
|
(2,205
|
)
|
|||||
|
Prior service cost
|
505
|
|
8,691
|
|
20
|
|
—
|
|
—
|
|
—
|
|
|||||||||||
|
Amortization of prior service (cost) credit
|
(461
|
)
|
465
|
|
1,037
|
|
—
|
|
—
|
|
—
|
|
|||||||||||
|
Total recognized in other comprehensive income (a)
|
$
|
(1,487
|
)
|
$
|
343
|
|
$
|
49,559
|
|
$
|
(1,833
|
)
|
$
|
(3,130
|
)
|
$
|
(2,205
|
)
|
|||||
|
Total recognized in net periodic benefit cost and other comprehensive income
|
$
|
12,512
|
|
$
|
15,122
|
|
$
|
67,683
|
|
$
|
(490
|
)
|
$
|
(1,734
|
)
|
$
|
(744
|
)
|
|||||
|
(a)
|
Amounts exclude related tax expense (benefit) of
$1.2 million
,
$1.1 million
, and
$(17.8) million
, during
2016
,
2015
, and
2014
, respectively, which are also included in other comprehensive income.
|
68
Net periodic benefit cost for Mattel’s domestic defined benefit pension and postretirement benefit plans was calculated on January 1 of each year using the following assumptions:
|
|
For the Year Ended
|
|||||||
|
|
December 31,
2016 |
December 31,
2015 |
December 31,
2014 |
|||||
|
Defined benefit pension plans:
|
||||||||
|
Discount rate
|
4.2
|
%
|
3.8
|
%
|
4.7
|
%
|
||
|
Weighted average rate of future compensation increases
|
N/A
|
|
3.8
|
%
|
3.8
|
%
|
||
|
Long-term rate of return on plan assets
|
6.5
|
%
|
(a)
|
|
8.0
|
%
|
||
|
Postretirement benefit plans:
|
||||||||
|
Discount rate
|
4.2
|
%
|
3.8
|
%
|
4.7
|
%
|
||
|
Annual increase in Medicare Part B premium
|
6.0
|
%
|
6.0
|
%
|
6.0
|
%
|
||
|
Health care cost trend rate:
|
||||||||
|
Pre-65
|
7.0
|
%
|
7.5
|
%
|
8.5
|
%
|
||
|
Post-65
|
8.3
|
%
|
8.8
|
%
|
7.5
|
%
|
||
|
Ultimate cost trend rate:
|
||||||||
|
Pre-65
|
4.5
|
%
|
4.5
|
%
|
6.1
|
%
|
||
|
Post-65
|
4.5
|
%
|
4.5
|
%
|
5.4
|
%
|
||
|
Year that the rate reaches the ultimate cost trend rate:
|
||||||||
|
Pre-65
|
2023
|
|
2023
|
|
2030
|
|
||
|
Post-65
|
2024
|
|
2024
|
|
2030
|
|
||
|
(a)
|
A long-term rate of return on plan assets of
7.5%
was used for the first half of 2015. A long-term rate of return on plan assets of
6.8%
was used for the second half of 2015, resulting from a change in the plans' target asset allocation.
|
Discount rates, weighted average rates of future compensation increases, and long-term rates of return on plan assets for Mattel’s foreign defined benefit pension plans differ from the assumptions used for Mattel’s domestic defined benefit pension plans due to differences in local economic conditions in the locations where the non-US plans are based. The rates shown in the preceding table are indicative of the weighted average rates of all Mattel’s defined benefit pension plans given the relative insignificance of the foreign plans to the consolidated total.
The estimated net actuarial loss and prior service cost for the domestic defined benefit pension plans that will be amortized from accumulated other comprehensive loss into net periodic benefit cost in
2017
is
$6.5 million
. The estimated net actuarial loss for the domestic postretirement benefit plans that will be amortized from accumulated other comprehensive loss into net periodic benefit cost in
2017
is
$0.2 million
.
69
Mattel used a measurement date of
December 31, 2016
for its defined benefit pension and postretirement benefit plans. A summary of the changes in benefit obligation and plan assets is as follows:
|
|
Defined Benefit
Pension Plans
|
Postretirement
Benefit Plans
|
|||||||||||||
|
|
December 31,
2016 |
December 31,
2015 |
December 31,
2016 |
December 31,
2015 |
|||||||||||
|
|
(In thousands)
|
||||||||||||||
|
Change in Benefit Obligation:
|
|||||||||||||||
|
Benefit obligation, beginning of year
|
$
|
611,490
|
|
$
|
677,641
|
|
$
|
30,416
|
|
$
|
34,402
|
|
|||
|
Service cost
|
5,557
|
|
6,105
|
|
52
|
|
54
|
|
|||||||
|
Interest cost
|
24,526
|
|
26,007
|
|
1,143
|
|
1,194
|
|
|||||||
|
Impact of currency exchange rate changes
|
(14,535
|
)
|
(11,016
|
)
|
—
|
|
—
|
|
|||||||
|
Actuarial loss (gain)
|
25,164
|
|
(14,604
|
)
|
(1,686
|
)
|
(2,981
|
)
|
|||||||
|
Benefits paid
|
(46,425
|
)
|
(67,994
|
)
|
(2,311
|
)
|
(2,253
|
)
|
|||||||
|
Plan amendments
|
74
|
|
(4,649
|
)
|
—
|
|
—
|
|
|||||||
|
Benefit obligation, end of year
|
$
|
605,851
|
|
$
|
611,490
|
|
$
|
27,614
|
|
$
|
30,416
|
|
|||
|
Change in Plan Assets:
|
|||||||||||||||
|
Plan assets at fair value, beginning of year
|
$
|
435,274
|
|
$
|
475,940
|
|
$
|
—
|
|
$
|
—
|
|
|||
|
Actual return on plan assets
|
43,292
|
|
(690
|
)
|
—
|
|
—
|
|
|||||||
|
Employer contributions
|
17,617
|
|
33,353
|
|
2,311
|
|
2,253
|
|
|||||||
|
Impact of currency exchange rate changes
|
(15,978
|
)
|
(5,335
|
)
|
—
|
|
—
|
|
|||||||
|
Benefits paid
|
(46,425
|
)
|
(67,994
|
)
|
(2,311
|
)
|
(2,253
|
)
|
|||||||
|
Plan assets at fair value, end of year
|
$
|
433,780
|
|
$
|
435,274
|
|
$
|
—
|
|
$
|
—
|
|
|||
|
Net Amount Recognized in Consolidated Balance Sheets:
|
|||||||||||||||
|
Funded status, end of year
|
$
|
(172,071
|
)
|
$
|
(176,216
|
)
|
$
|
(27,614
|
)
|
$
|
(30,416
|
)
|
|||
|
Current accrued benefit liability
|
(4,519
|
)
|
(7,416
|
)
|
(2,700
|
)
|
(3,300
|
)
|
|||||||
|
Noncurrent accrued benefit liability
|
(167,552
|
)
|
(168,800
|
)
|
(24,914
|
)
|
(27,116
|
)
|
|||||||
|
Total accrued benefit liability
|
$
|
(172,071
|
)
|
$
|
(176,216
|
)
|
$
|
(27,614
|
)
|
$
|
(30,416
|
)
|
|||
|
Amounts Recognized in Accumulated Other Comprehensive Loss (a):
|
|||||||||||||||
|
Net actuarial loss (gain)
|
$
|
243,249
|
|
$
|
244,780
|
|
$
|
(49
|
)
|
$
|
1,784
|
|
|||
|
Prior service cost
|
164
|
|
120
|
|
—
|
|
—
|
|
|||||||
|
$
|
243,413
|
|
$
|
244,900
|
|
$
|
(49
|
)
|
$
|
1,784
|
|
||||
|
(a)
|
Amounts exclude related tax benefits of
$85.7 million
and
$86.8 million
for
December 31, 2016
and
2015
, respectively, which are also included in accumulated other comprehensive loss.
|
The accumulated benefit obligation differs from the projected benefit obligation in that it assumes future compensation levels will remain unchanged. Mattel’s accumulated benefit obligation for its defined benefit pension plans as of
December 31, 2016
and
2015
totaled
$588.4 million
and
$589.2 million
, respectively.
70
The assumptions used in determining the projected and accumulated benefit obligations of Mattel’s domestic defined benefit pension and postretirement benefit plans are as follows:
|
|
December 31,
2016 |
December 31,
2015 |
|||
|
Defined benefit pension plans:
|
|||||
|
Discount rate
|
3.9
|
%
|
4.2
|
%
|
|
|
Weighted average rate of future compensation increases
|
N/A
|
|
3.8
|
%
|
|
|
Postretirement benefit plans:
|
|||||
|
Discount rate
|
3.9
|
%
|
4.2
|
%
|
|
|
Annual increase in Medicare Part B premium
|
6.0
|
%
|
6.0
|
%
|
|
|
Health care cost trend rate:
|
|||||
|
Pre-65
|
7.0
|
%
|
7.0
|
%
|
|
|
Post-65
|
7.8
|
%
|
8.3
|
%
|
|
|
Ultimate cost trend rate:
|
|||||
|
Pre-65
|
4.5
|
%
|
4.5
|
%
|
|
|
Post-65
|
4.5
|
%
|
4.5
|
%
|
|
|
Year that the rate reaches the ultimate cost trend rate:
|
|||||
|
Pre-65
|
2024
|
|
2023
|
|
|
|
Post-65
|
2024
|
|
2024
|
|
|
A one percentage point increase/(decrease) in the assumed health care cost trend rate for each future year would impact the postretirement benefit obligation as of
December 31, 2016
by
$2.1 million
and
$(1.9) million
, respectively, and the service and interest cost recognized for
2016
by
$0.1 million
and
$(0.1) million
, respectively.
The estimated future benefit payments for Mattel’s defined benefit pension and postretirement benefit plans are as follows:
|
Defined Benefit
Pension Plans
|
Postretirement
Benefit Plans
|
||||||
|
|
(In thousands)
|
||||||
|
2017
|
$
|
54,051
|
|
$
|
2,700
|
|
|
|
2018
|
37,833
|
|
2,600
|
|
|||
|
2019
|
37,997
|
|
2,600
|
|
|||
|
2020
|
37,901
|
|
2,600
|
|
|||
|
2021
|
37,466
|
|
2,600
|
|
|||
|
2022 – 2026
|
185,012
|
|
11,300
|
|
|||
Mattel expects to make cash contributions totaling approximately
$10 million
to its defined benefit pension and postretirement benefit plans in
2017
, which includes approximately
$9 million
for benefit payments for its unfunded plans.
Mattel periodically commissions a study of the plans’ assets and liabilities to determine an asset allocation that would best match expected cash flows from the plans’ assets to expected benefit payments. Mattel monitors the returns earned by the plans’ assets and reallocates investments as needed. Mattel’s overall investment strategy is to achieve an adequately diversified asset allocation mix of investments that provides for both near-term benefit payments as well as long-term growth. The assets are invested in a combination of indexed and actively managed funds. The target allocations for Mattel’s domestic plan assets, which comprise
79%
of Mattel’s total plan assets, are
42%
in US equities,
28%
in non-US equities,
20%
in fixed income securities, and
10%
in real estate securities. The US equities are benchmarked against the S&P 500, and the non-US equities are benchmarked against a combination of developed and emerging markets indices. Fixed income securities are long-duration bonds intended to closely match the duration of the liabilities and include US government treasuries and agencies, corporate bonds from various industries, and mortgage-backed and asset-backed securities.
71
Mattel’s defined benefit pension plan assets are measured and reported in the financial statements at fair value using inputs, which are more fully described in “Note 10 to the Consolidated Financial Statements—Fair Value Measurements,” as follows:
|
|
December 31, 2016
|
||||||||||||||
|
|
Level 1
|
Level 2
|
Level 3
|
Total
|
|||||||||||
|
|
(In thousands)
|
||||||||||||||
|
US government and US government agency securities
|
$
|
—
|
|
$
|
1,568
|
|
$
|
—
|
|
$
|
1,568
|
|
|||
|
US corporate debt instruments
|
—
|
|
33,787
|
|
—
|
|
33,787
|
|
|||||||
|
International corporate debt instruments
|
—
|
|
8,689
|
|
—
|
|
8,689
|
|
|||||||
|
Mutual funds
|
582
|
|
—
|
|
—
|
|
582
|
|
|||||||
|
Money market funds
|
2,531
|
|
—
|
|
|
2,531
|
|
||||||||
|
Other
|
—
|
|
6,640
|
|
—
|
|
6,640
|
|
|||||||
|
Collective trust funds:
|
|||||||||||||||
|
US equity securities (a)
|
96,487
|
|
|||||||||||||
|
International equity securities (a)
|
239,177
|
|
|||||||||||||
|
International fixed income (a)
|
44,319
|
|
|||||||||||||
|
Total
|
$
|
3,113
|
|
$
|
50,684
|
|
$
|
—
|
|
$
|
433,780
|
|
|||
|
|
December 31, 2015
|
||||||||||||||
|
|
Level 1
|
Level 2
|
Level 3
|
Total
|
|||||||||||
|
|
(In thousands)
|
||||||||||||||
|
US government and US government agency securities
|
$
|
—
|
|
$
|
1,540
|
|
$
|
—
|
|
$
|
1,540
|
|
|||
|
US corporate debt instruments
|
—
|
|
31,254
|
|
—
|
|
31,254
|
|
|||||||
|
International corporate debt instruments
|
—
|
|
5,612
|
|
—
|
|
5,612
|
|
|||||||
|
Mutual funds
|
567
|
|
—
|
|
—
|
|
567
|
|
|||||||
|
Other
|
—
|
|
10,023
|
|
—
|
|
10,023
|
|
|||||||
|
Collective trust funds:
|
|||||||||||||||
|
US equity securities (a)
|
86,466
|
|
|||||||||||||
|
International equity securities (a)
|
255,694
|
|
|||||||||||||
|
International fixed income (a)
|
44,118
|
|
|||||||||||||
|
Total
|
$
|
567
|
|
$
|
48,429
|
|
$
|
—
|
|
$
|
435,274
|
|
|||
(a) These investments consist of privately placed funds that are valued based on net asset value per share. With the adoption of ASU 2015-07, certain investments that are measured at fair value using the net asset value per share (or its equivalent) practical expedient have not been classified in the fair value hierarchy. The fair value amounts presented in this table are intended to permit reconciliation of the fair value hierarchy to the amounts presented in the statement of financial position and its related disclosures.
The fair value of collective trust funds are determined based on the net asset value per share held at year-end. The fair value of mutual funds, money market funds, US government securities, US government agency securities, and corporate debt instruments are determined based on quoted market prices or are estimated using pricing models with observable inputs or quoted prices of securities with similar characteristics.
Mattel’s defined benefit pension plan assets are not directly invested in Mattel common stock. Mattel believes that the long-term rate of return on plan assets of
6.5%
as of
December 31, 2016
is reasonable based on historical returns.
72
Defined Contribution Retirement Plans
Domestic employees are eligible to participate in a 401(k) savings plan, the Mattel, Inc. Personal Investment Plan (the “Plan”), sponsored by Mattel, which is a funded defined contribution plan intended to comply with ERISA’s requirements. Contributions to the Plan include voluntary contributions by eligible employees and employer automatic and matching contributions by Mattel. The Plan allows employees to allocate both their voluntary contributions and their employer automatic and matching contributions to a variety of investment funds, including a fund that is invested in Mattel common stock (the “Mattel Stock Fund”). Employees are not required to allocate any of their Plan account balance to the Mattel Stock Fund, allowing employees to limit or eliminate their exposure to market changes in Mattel’s stock price. Furthermore, the Plan limits the percentage of the employee’s total account balance that may be allocated to the Mattel Stock Fund to
25%
. Employees may generally reallocate their account balances on a daily basis. However, pursuant to Mattel’s insider trading policy, employees classified as insiders and restricted personnel under Mattel’s insider trading policy are limited to certain periods in which they may make allocations into or out of the Mattel Stock Fund.
Certain non-US employees participate in other defined contribution retirement plans with varying vesting and contribution provisions.
Deferred Compensation and Excess Benefit Plans
Mattel maintains a deferred compensation plan that permits certain officers and key employees to elect to defer portions of their compensation. The deferred compensation plan, together with certain contributions made by Mattel and participating employees to an excess benefit plan, earns various rates of return. The liability for these plans as of
December 31, 2016
and
2015
was
$70.0 million
and
$71.7 million
, respectively, and is primarily included in other noncurrent liabilities in the consolidated balance sheets. Changes in the market value of the participant-selected investment options are recorded as retirement plan expense within other selling and administrative expenses in the consolidated statements of operations. Separately, Mattel has purchased group trust-owned life insurance contracts designed to assist in funding these programs. The cash surrender value of these policies, valued at
$70.9 million
and
$67.3 million
as of
December 31, 2016
and
2015
, respectively, are held in an irrevocable grantor trust, the assets of which are subject to the claims of Mattel’s creditors and are included in other noncurrent assets in the consolidated balance sheets.
Incentive Compensation Plans
Mattel has annual incentive compensation plans under which officers and key employees may earn incentive compensation based on Mattel’s performance and are subject to certain approvals of the Compensation Committee of the Board of Directors. For
2016
,
2015
, and
2014
,
$16.5 million
,
$50.2 million
, and
$25.2 million
, respectively, was charged to expense for awards under these plans.
Mattel had two long-term incentive program (“LTIP”) performance cycles in place for the time period between
2014
and
2016
: (i) a January 1, 2014—December 31, 2016 performance cycle, which was established by the Compensation Committee of the Board of Directors in March 2014, and (ii) a January 1, 2016—December 31, 2018 performance cycle, which was established by the Compensation Committee of the Board of Directors in March 2016.
For the January 1, 2014—December 31, 2016 LTIP performance cycle, Mattel granted performance-based restricted stock units ("Performance RSUs") under the Mattel, Inc. 2010 Equity and Long-Term Compensation Plan to officers and certain employees providing services to Mattel. Performance RSUs granted under this program could be earned based on an initial target number with the final number of Performance RSUs payable being determined based on the product of the initial target number of Performance RSUs multiplied by a performance factor based on measurements of Mattel’s performance with respect to: (i) annual operating result targets for each year in the performance cycle using a net operating profit after taxes less capital charge measure and a net sales performance measure (“the 2014-2016 performance-related components”), and (ii) Mattel’s total stock return ("TSR") for the
three
-year performance cycle relative to the TSR realized by companies comprising the S&P 500 as of the first day of the performance cycle (“the 2014-2016 market-related component”), adjusted for dividends declared during the
three
-year performance cycle. The Performance RSUs also had dividend equivalent rights that could be converted to shares of Mattel common stock only when and to the extent the underlying Performance RSUs were earned and paid in shares of Mattel common stock. For the January 1, 2014—December 31, 2016 LTIP performance cycle,
no
shares were earned relating to the 2014-2016 performance-related components, market-related component, or dividend equivalent rights.
For the January 1, 2014—December 31, 2016 LTIP performance cycle, the weighted average grant date fair values of the performance-related and market-related components of the Performance RSUs were
$32.60
and
($3.57)
per share, respectively, for 2016,
$23.14
and
$(3.57)
per share, respectively, for 2015, and
$39.03
and
($3.57)
per share, respectively, for 2014. During 2016, 2015, and 2014,
no
expense was recognized related to the 2014-2016 performance cycle, as no shares were earned.
73
For the January 1, 2016—December 31, 2018 LTIP performance cycle, Mattel granted Performance RSUs under the Mattel, Inc. Amended and Restated 2010 Equity and Long-Term Compensation Plan to officers and certain employees providing services to Mattel. Performance RSUs granted under this program are also earned based on an initial target number with the final number of Performance RSUs payable being determined based on the product of the initial target number of Performance RSUs multiplied by a performance factor based on measurements of Mattel's performance with respect to (i) a cumulative
three
-year EPS target for the performance cycle (the "2016-2018 performance-related component") and (ii) Mattel's TSR for the
three
-year performance cycle relative to the TSR realized by companies comprising the S&P 500 as of the first day of the performance cycle (the "2016-2018 market-related component"), adjusted for dividends declared during the
three
-year performance cycle. The Performance RSUs also have dividend equivalent rights that are converted to shares of Mattel common stock only when and to the extent the underlying Performance RSUs are earned and paid in shares of Mattel common stock. For the 2016-2018 performance-related component, the range of possible outcomes is that between
zero
and
0.5 million
shares could be earned. For the 2016-2018 market-related component, the possible outcomes range from an upward adjustment of
0.2 million
shares to a downward adjustment of
0.2 million
shares to the result of the performance-related component.
For the January 1, 2016—December 31, 2018 LTIP performance cycle, the weighted average grant date fair value of the performance-related and market-related components of the Performance RSUs were
$32.60
and
$5.10
per share, respectively, for
2016
. During
2016
, Mattel recognized share-based compensation expense of
$2.8 million
relating to the 2016-2018 performance-related component and
$0.4 million
relating to the 2016-2018 market-related component.
The fair values of the performance-related components were based on the closing stock prices of Mattel’s common stock on each of the grant dates. The fair values of the market-related components were estimated at the grant dates using a Monte Carlo valuation methodology.
Seasonal Financing
Mattel maintains and periodically amends or replaces its domestic unsecured committed revolving credit facility ("Credit Facility") with a commercial bank group. The facility is used as a back-up to Mattel’s commercial paper program, which is used as the primary source of financing for the seasonal working capital requirements of its domestic subsidiaries. The agreement governing the Credit Facility was amended and restated on June 8, 2015 to, among other things, (i) extend the maturity date of the Credit Facility to
June 9, 2020
, (ii) amend the definition of consolidated earnings before interest, taxes, depreciation, and amortization (“Consolidated EBITDA”) used in calculating Mattel’s financial ratio covenants, and (iii) increase the maximum allowed consolidated debt-to-Consolidated EBITDA ratio to
3.50
to 1. The aggregate commitments under the Credit Facility remain at
$1.60 billion
, with an “accordion feature,” which allows Mattel to increase the aggregate availability under the Credit Facility to
$1.85 billion
under certain circumstances. In addition, applicable interest rate margins remain within a range of
0.00%
to
0.75%
above the applicable base rate for base rate loans and
0.88%
to
1.75%
above the applicable LIBOR for Eurodollar rate loans, and the commitment fees range from
0.08%
to
0.25%
of the unused commitments under the Credit Facility, in each case depending on Mattel’s senior unsecured long-term debt rating.
The proportion of unamortized debt issuance costs from the prior facility renewal related to creditors involved in both the prior facility and amended facility and borrowing costs incurred as a result of the amendment were deferred, and such costs will be amortized over the term of the amended facility.
Mattel is required to meet financial ratio covenants at the end of each quarter and fiscal year, using the formulae specified in the credit agreement to calculate the ratios. Mattel was in compliance with such covenants at the end of each fiscal quarter and fiscal year in
2016
. As of
December 31, 2016
, Mattel’s consolidated debt-to-EBITDA ratio, as calculated per the terms of the credit agreement, was
2.86
to 1 (compared to a maximum allowed of
3.50
to 1), and Mattel’s interest coverage ratio was
8.62
to 1 (compared to a minimum required of
3.50
to 1).
The credit agreement is a material agreement, and failure to comply with the financial ratio covenants may result in an event of default under the terms of the Credit Facility. If Mattel were to default under the terms of the Credit Facility, its ability to meet its seasonal financing requirements could be adversely affected.
Mattel believes its cash on hand, amounts available under its Credit Facility, and its foreign credit lines will be adequate to meet its seasonal financing requirements in
2017
.
To finance seasonal working capital requirements of certain foreign subsidiaries, Mattel avails itself of individual short-term credit lines with a number of banks. As of
December 31, 2016
, foreign credit lines totaled approximately
$366 million
. Mattel expects to extend the majority of these credit lines throughout
2017
.
74
Additionally, sales of foreign receivables occur periodically to finance seasonal working capital requirements. The outstanding amounts of accounts receivable that have been sold under international factoring arrangements were
$18.1 million
and
$19.5 million
at
December 31, 2016
and
2015
, respectively. These amounts have been excluded from Mattel’s consolidated balance sheets.
In January 2017, a major credit rating agency placed Mattel’s Senior Unsecured Debt rating of Baa1 on negative watch. Another major credit rating agency changed Mattel's outlook from stable to negative. In January 2016, a major credit rating agency changed Mattel's long-term credit rating from A- to BBB+, maintained its short-term credit rating of F2, and changed its outlook from negative to stable. In January 2015, a major credit rating agency changed Mattel’s long-term credit rating from BBB+ to BBB and maintained its short-term credit rating of A-2 and outlook at stable. Another major credit rating agency maintained Mattel’s long-term credit rating of Baa1 and short-term credit rating of P-2 and changed its outlook from stable to negative. A third major credit rating agency maintained Mattel’s long-term credit rating of A- and short-term credit rating of F2 and changed its outlook from stable to negative. A reduction in Mattel’s credit ratings could increase the cost of obtaining financing.
Short-Term Borrowings
As of
December 31, 2016
and 2015, Mattel had foreign short-term bank loans outstanding of
$47.2 million
and
$16.9 million
, respectively. As of
December 31, 2016
and
2015
, Mattel had
no
borrowings outstanding under the Credit Facility. As of December 31, 2016 and 2015, Mattel had
$145.0 million
and
$0
, respectively, of commercial paper outstanding.
During
2016
and
2015
, Mattel had average borrowings of
$2.0 million
and
$2.9 million
, respectively, under its foreign short-term bank loans, and
$728.4 million
and
$374.3 million
, respectively, under the Credit Facility and other short-term borrowings, to help finance its seasonal working capital requirements. The weighted average interest rate on foreign short-term bank loans during
2016
and
2015
was
12.5%
and
13.7%
, respectively. The weighted average interest rate on the Credit Facility and other short-term borrowings during
2016
and
2015
was
0.6%
and
0.3%
, respectively.
Long-Term Debt
In August 2016, Mattel issued
$350.0 million
aggregate principal amount of
2.35%
senior unsecured notes due August 15, 2021 (“2016 Senior Notes”). Interest on the 2016 Senior Notes is payable semi-annually in arrears on February 15 and August 15 of each year, beginning February 15, 2017. Mattel may redeem all or part of the 2016 Senior Notes at any time or from time to time prior to July 15, 2021 (one month prior to the maturity date of the 2016 Senior Notes) (the “Par Call Date”), at its option, at a redemption price equal to the greater of (1)
100%
of the principal amount of the 2016 Senior Notes being redeemed or (2) a “make-whole” amount based on the yield of a comparable US Treasury security plus
20 basis points
, plus, in each case, accrued and unpaid interest on the 2016 Senior Notes being redeemed to, but excluding, the redemption date. Mattel may redeem all or part of the 2016 Senior Notes at any time or from time to time on or after the Par Call Date, at its option, at a redemption price equal to
100%
of the principal amount of the 2016 Senior Notes to be redeemed, plus accrued and unpaid interest on the 2016 Senior Notes being redeemed to, but excluding, the redemption date.
In May 2014, Mattel issued
$500.0 million
aggregate principal amount of
2.35%
senior unsecured notes due
May 6, 2019
(“2014 Senior Notes”). Interest on the 2014 Senior Notes is payable semi-annually on May 6 and November 6 of each year, beginning November 6, 2014. Mattel may redeem all or part of the 2014 Senior Notes at any time or from time to time at its option, at a redemption price equal to the greater of (i)
100%
of the principal amount of the notes being redeemed plus accrued and unpaid interest to, but excluding, the redemption date, and (ii) a “make-whole” amount based on the yield of a comparable US Treasury security plus
12.5 basis points
.
Mattel’s 2010 Senior Notes bear interest at fixed rates ranging from
4.35%
to
6.20%
, with a weighted average interest rate of
5.28%
as of
December 31, 2016
and
2015
. Mattel’s 2011 Senior Notes bear interest at fixed rates ranging from
2.50%
to
5.45%
, with a weighted average interest rate of
5.45%
and
3.98%
as of
December 31, 2016
and
2015
, respectively. Mattel’s 2013 Senior Notes bear interest at fixed rates ranging from
1.70%
to
3.15%
, with a weighted average interest rate of
2.43%
as of
December 31, 2016
and
2015
. Mattel’s 2014 Senior Notes bear interest at a fixed rate of
2.35%
as of
December 31, 2016
and 2015. Mattel’s 2016 Senior Notes bear interest at a fixed rate of
2.35%
as of
December 31, 2016
.
On November 1, 2016, Mattel repaid
$300.0 million
of its
2.50%
Senior Notes in connection with the scheduled maturity. During 2014, Mattel repaid
$44.6 million
of long-term borrowings assumed through the acquisition of MEGA Brands.
During the first quarter of 2016, Mattel retrospectively adopted ASU 2015-03,
Simplifying the Presentation of Debt Issuance Costs.
As such, prior periods were restated to present debt issuance costs as a deduction from long-term debt.
75
Mattel’s long-term debt consists of the following:
|
|
December 31,
2016 |
December 31,
2015 |
|||||
|
|
(In thousands)
|
||||||
|
2010 Senior Notes due October 2020 and October 2040
|
$
|
500,000
|
|
$
|
500,000
|
|
|
|
2011 Senior Notes due November 2016 and November 2041
|
300,000
|
|
600,000
|
|
|||
|
2013 Senior Notes due March 2018 and March 2023
|
500,000
|
|
500,000
|
|
|||
|
2014 Senior Notes due May 2019
|
500,000
|
|
500,000
|
|
|||
|
2016 Senior Notes due August 2021
|
350,000
|
|
—
|
|
|||
|
Debt issuance costs
|
(15,729
|
)
|
(15,279
|
)
|
|||
|
2,134,271
|
|
2,084,721
|
|
||||
|
Less: current portion
|
—
|
|
(300,000
|
)
|
|||
|
Total long-term debt
|
$
|
2,134,271
|
|
$
|
1,784,721
|
|
|
The aggregate principal amount of long-term debt maturing in the next five years and thereafter is as follows:
|
2010
Senior
Notes
|
2011
Senior
Notes
|
2013
Senior
Notes
|
2014
Senior
Notes
|
2016
Senior
Notes
|
Total
|
||||||||||||||||||
|
|
(In thousands)
|
||||||||||||||||||||||
|
2017
|
$
|
—
|
|
$
|
—
|
|
$
|
—
|
|
$
|
—
|
|
$
|
—
|
|
$
|
—
|
|
|||||
|
2018
|
—
|
|
—
|
|
250,000
|
|
—
|
|
—
|
|
250,000
|
|
|||||||||||
|
2019
|
—
|
|
—
|
|
—
|
|
500,000
|
|
—
|
|
500,000
|
|
|||||||||||
|
2020
|
250,000
|
|
—
|
|
—
|
|
—
|
|
—
|
|
250,000
|
|
|||||||||||
|
2021
|
—
|
|
—
|
|
—
|
|
—
|
|
350,000
|
|
350,000
|
|
|||||||||||
|
Thereafter
|
250,000
|
|
300,000
|
|
250,000
|
|
—
|
|
—
|
|
800,000
|
|
|||||||||||
|
$
|
500,000
|
|
$
|
300,000
|
|
$
|
500,000
|
|
$
|
500,000
|
|
$
|
350,000
|
|
$
|
2,150,000
|
|
||||||
Preference Stock
Mattel is authorized to issue up to
20.0 million
shares of
$0.01
par value preference stock, of which
none
is currently outstanding.
Preferred Stock
Mattel is authorized to issue up to
3.0 million
shares of
$1.00
par value preferred stock, of which
none
is currently outstanding.
Common Stock Repurchase Program
During
2016
and
2015
, Mattel did not repurchase any shares of its common stock. During
2014
, Mattel repurchased
4.9 million
shares of its common stock at a cost of
$177.2 million
. Mattel’s share repurchase program was first announced on July 21, 2003. On July 17, 2013, the Board of Directors authorized Mattel to increase its share repurchase program by
$500.0 million
. At December 31,
2016
, share repurchase authorizations of
$203.0 million
had not been executed. Repurchases will take place from time to time, depending on market conditions. Mattel’s share repurchase program has no expiration date.
Dividends
During
2016
,
2015
, and
2014
, Mattel paid total dividends per share of
$1.52
, in each year, to holders of its common stock. The Board of Directors declared the dividends on a quarterly basis, and Mattel paid the dividends during the quarters in which the dividends were declared. The payment of dividends on common stock is at the discretion of the Board of Directors and is subject to customary limitations.
76
Accumulated Other Comprehensive Income (Loss)
The following tables present changes in the accumulated balances for each component of other comprehensive income, including current period other comprehensive income and reclassifications out of accumulated other comprehensive income (loss):
|
|
For the Year Ended December 31, 2016
|
||||||||||||||||||
|
|
Derivative
Instruments |
Available-for-Sale Security
|
Defined Benefit
Pension Plans |
Currency
Translation Adjustments |
Total
|
||||||||||||||
|
|
(In thousands)
|
||||||||||||||||||
|
Accumulated Other Comprehensive Income (Loss), Net of Tax, as of December 31, 2015
|
$
|
15,363
|
|
$
|
—
|
|
$
|
(159,858
|
)
|
$
|
(704,404
|
)
|
$
|
(848,899
|
)
|
||||
|
Other comprehensive income (loss) before reclassifications
|
18,733
|
|
3,149
|
|
(4,154
|
)
|
(101,539
|
)
|
(83,811
|
)
|
|||||||||
|
Amounts reclassified from accumulated other comprehensive income (loss)
|
(16,627
|
)
|
—
|
|
6,308
|
|
—
|
|
(10,319
|
)
|
|||||||||
|
Net increase (decrease) in other comprehensive income
|
2,106
|
|
3,149
|
|
2,154
|
|
(101,539
|
)
|
(94,130
|
)
|
|||||||||
|
Accumulated Other Comprehensive Income (Loss), Net of Tax, as of December 31, 2016
|
$
|
17,469
|
|
$
|
3,149
|
|
$
|
(157,704
|
)
|
$
|
(805,943
|
)
|
$
|
(943,029
|
)
|
||||
|
|
For the Year Ended December 31, 2015
|
||||||||||||||||||
|
|
Derivative
Instruments |
Available-for-Sale Security
|
Defined Benefit
Pension Plans |
Currency
Translation Adjustments |
Total
|
||||||||||||||
|
|
(In thousands)
|
||||||||||||||||||
|
Accumulated Other Comprehensive Income (Loss), Net of Tax, as of December 31, 2014
|
$
|
30,025
|
|
$
|
—
|
|
$
|
(161,507
|
)
|
$
|
(490,607
|
)
|
$
|
(622,089
|
)
|
||||
|
Other comprehensive income (loss) before reclassifications
|
37,926
|
|
—
|
|
(6,443
|
)
|
(213,797
|
)
|
(182,314
|
)
|
|||||||||
|
Amounts reclassified from accumulated other comprehensive income (loss)
|
(52,588
|
)
|
—
|
|
8,092
|
|
—
|
|
(44,496
|
)
|
|||||||||
|
Net (decrease) increase in other comprehensive income
|
(14,662
|
)
|
—
|
|
1,649
|
|
(213,797
|
)
|
(226,810
|
)
|
|||||||||
|
Accumulated Other Comprehensive Income (Loss), Net of Tax, as of December 31, 2015
|
$
|
15,363
|
|
$
|
—
|
|
$
|
(159,858
|
)
|
$
|
(704,404
|
)
|
$
|
(848,899
|
)
|
||||
|
|
For the Year Ended December 31, 2014
|
||||||||||||||||||
|
|
Derivative
Instruments |
Available-for-Sale Security
|
Defined Benefit
Pension Plans |
Currency
Translation Adjustments |
Total
|
||||||||||||||
|
|
(In thousands)
|
||||||||||||||||||
|
Accumulated Other Comprehensive Income (Loss), Net of Tax, as of December 31, 2013
|
$
|
(10,789
|
)
|
$
|
—
|
|
$
|
(131,946
|
)
|
$
|
(300,941
|
)
|
$
|
(443,676
|
)
|
||||
|
Other comprehensive income (loss) before reclassifications
|
39,931
|
|
—
|
|
(38,969
|
)
|
(189,666
|
)
|
(188,704
|
)
|
|||||||||
|
Amounts reclassified from accumulated other comprehensive income (loss)
|
883
|
|
—
|
|
9,408
|
|
—
|
|
10,291
|
|
|||||||||
|
Net increase (decrease) in other comprehensive income
|
40,814
|
|
—
|
|
(29,561
|
)
|
(189,666
|
)
|
(178,413
|
)
|
|||||||||
|
Accumulated Other Comprehensive Income (Loss), Net of Tax, as of December 31, 2014
|
$
|
30,025
|
|
$
|
—
|
|
$
|
(161,507
|
)
|
$
|
(490,607
|
)
|
$
|
(622,089
|
)
|
||||
77
The following table presents the classification and amount of the reclassifications from accumulated other comprehensive income (loss) to the consolidated statement of operations:
|
|
For the Year Ended
|
Statements of Operations
Classification
|
|||||||||||
|
|
December 31,
2016 |
December 31,
2015 |
December 31,
2014 |
||||||||||
|
|
(In thousands)
|
|
|||||||||||
|
Derivative Instruments
|
|||||||||||||
|
Gain (loss) on foreign currency forward exchange contracts
|
$
|
17,101
|
|
$
|
52,037
|
|
$
|
(916
|
)
|
Cost of sales
|
|||
|
(474
|
)
|
551
|
|
33
|
|
Provision for income taxes
|
|||||||
|
$
|
16,627
|
|
$
|
52,588
|
|
$
|
(883
|
)
|
Net income
|
||||
|
Defined Benefit Pension Plans
|
|||||||||||||
|
Amortization of prior service (cost) credit
|
$
|
(461
|
)
|
$
|
465
|
|
$
|
1,037
|
|
(a)
|
|||
|
Recognized actuarial loss
|
(7,142
|
)
|
(15,316
|
)
|
(15,788
|
)
|
(a)
|
||||||
|
Settlement loss
|
(1,772
|
)
|
(6,453
|
)
|
—
|
|
Other selling and administrative expenses
|
||||||
|
Curtailment (loss) gain
|
(415
|
)
|
8,639
|
|
—
|
|
Other selling and administrative expenses
|
||||||
|
(9,790
|
)
|
(12,665
|
)
|
(14,751
|
)
|
||||||||
|
3,482
|
|
4,573
|
|
5,343
|
|
Provision for income taxes
|
|||||||
|
$
|
(6,308
|
)
|
$
|
(8,092
|
)
|
$
|
(9,408
|
)
|
Net income
|
||||
|
(a)
|
The amortization of prior service (cost) credit and recognized actuarial loss are included in the computation of net periodic benefit cost. Refer to “Note 4 to the Consolidated Financial Statements—Employee Benefit Plans” for additional information regarding Mattel’s net periodic benefit cost.
|
Currency Translation Adjustments
For
2016
, currency translation adjustments resulted in a net loss of
$101.5 million
, primarily due to the weakening of the British pound sterling, Mexican peso, and Euro against the US dollar, partially offset by the strengthening of the Brazilian real against the US dollar. For
2015
, currency translation adjustments resulted in a net loss of
$213.8 million
, primarily due to the weakening of the Euro, Brazilian real, Mexican peso, and British pound sterling against the US dollar. For
2014
, currency translation adjustments resulted in a net loss of
$189.7 million
, primarily due to the weakening of the Euro, Mexican peso, British pound sterling, Russian ruble, and Brazilian real against the US dollar.
Mattel Stock Option Plans
In May 2015, Mattel’s stockholders approved the Mattel, Inc. Amended and Restated 2010 Equity and Long-Term Compensation Plan (the “Amended 2010 Plan”). The 2010 Equity and Long-Term Compensation Plan was approved by Mattel's stockholders in May 2010 (the "2010 Plan"). Upon approval of the 2010 Plan, Mattel terminated its 2005 Equity Compensation Plan (the “2005 Plan”), except with respect to grants then outstanding under the 2005 Plan. All restricted stock unit (“RSU”) awards made under the 2005 Plan have vested as of December 31, 2015. Outstanding stock option grants under the 2005 Plan that have not expired or have not been terminated continue to be exercisable under the terms of their respective grant agreements. The terms of the Amended 2010 Plan are substantially similar to the terms of the 2010 Plan and the 2005 Plan.
78
Under the Amended 2010 Plan, Mattel has the ability to grant nonqualified stock options, incentive stock options, stock appreciation rights, restricted stock, RSUs, dividend equivalent rights, performance awards, and shares of common stock to officers, employees, and other persons providing services to Mattel. Generally, options vest and become exercisable contingent upon the grantees’ continued employment or service with Mattel. Nonqualified stock options are granted at not less than
100%
of the fair market value of Mattel’s common stock on the date of grant, expire no later than
10 years
from the date of grant, and vest on a schedule determined by the Compensation Committee of the Board of Directors, generally during a period of
3 years
from the date of grant. In the event of a retirement of an employee aged
55
years or older with
5
or more years of service, or the death or disability of an employee, that occurs in each case at least
6 months
after the grant date, nonqualified stock options become fully vested. Similar provisions exist for non-employee directors. Time-vesting RSUs granted under the Amended 2010 Plan generally vest over a period of
3 years
from the date of grant. In the event of the involuntary termination of an employee aged
55
years or older with
5
or more years of service, or the death or disability of an employee, that occurs at least
6 months
after the grant date, RSUs become fully vested. The Amended 2010 Plan also contains provisions regarding grants of equity compensation to the non-employee members of the Board of Directors. The Amended 2010 Plan expires on
March 26, 2025
, except as to any grants then outstanding.
The number of shares of common stock available for grant under the Amended 2010 Plan is subject to an aggregate limit of the sum of (i)
77 million
shares, (ii) the number of shares that remained available for issuance under the 2005 Plan on May 12, 2010, and (iii) any shares subject to awards outstanding under the 2005 Plan that on or after May 12, 2010 are forfeited or otherwise terminate or expire without the issuance of shares to the holder of the award. The Amended 2010 Plan is further subject to detailed share-counting rules. As a result of such share-counting rules, full-value grants such as grants of restricted stock or RSUs count against shares remaining available for grant at a higher rate than grants of stock options and stock appreciation rights. Each stock option or stock appreciation right grant is treated as using one available share for each share actually subject to such grant, whereas each restricted stock or RSU grant is treated as using
three
available shares for each share actually subject to such full-value grant. At
December 31, 2016
, there were approximately
26 million
shares of common stock available for grant remaining under the 2010 Plan.
As of
December 31, 2016
, total unrecognized compensation cost related to unvested share-based payments totaled
$85.1 million
and is expected to be recognized over a weighted-average period of
2.0 years
.
Stock Options
Mattel recognized compensation expense of
$10.5 million
,
$15.2 million
, and
$12.5 million
for stock options during
2016
,
2015
, and
2014
, respectively, which is included within other selling and administrative expenses in the consolidated statements of operations. Income tax benefits related to stock option activity during
2016
,
2015
, and
2014
totaled
$6.8 million
,
$5.5 million
, and
$3.5 million
, respectively. The 2016 income tax benefit related to stock options includes
$3.5 million
recognized as a result of the adoption of ASU 2016-09.
The fair value of options granted has been estimated using the Black-Scholes valuation model. The expected life of the options used in this calculation is the period of time the options are expected to be outstanding and has been determined based on historical exercise experience. Expected stock price volatility is based on the historical volatility of Mattel’s stock for a period approximating the expected life, the expected dividend yield is based on Mattel’s most recent actual annual dividend payout, and the risk-free interest rate is based on the implied yield available on US Treasury zero-coupon issues approximating the expected life. The weighted average grant date fair value of options granted during
2016
,
2015
, and
2014
was
$4.09
,
$1.97
, and
$4.57
, respectively.
The following weighted average assumptions were used in determining the fair value of options granted:
|
2016
|
2015
|
2014
|
||||||
|
Expected life (in years)
|
5.0
|
|
4.9
|
|
4.9
|
|
||
|
Risk-free interest rate
|
1.1
|
%
|
1.5
|
%
|
1.6
|
%
|
||
|
Volatility factor
|
25.3
|
%
|
23.1
|
%
|
23.7
|
%
|
||
|
Dividend yield
|
4.7
|
%
|
6.5
|
%
|
4.3
|
%
|
||
79
The following is a summary of stock option information and weighted average exercise prices for Mattel’s stock options:
|
|
2016
|
2015
|
2014
|
|||||||||||||||||
|
|
Shares
|
Weighted Average Exercise Price
|
Shares
|
Weighted Average Exercise Price
|
Shares
|
Weighted Average Exercise Price
|
||||||||||||||
|
|
(In thousands, except weighted average exercise price)
|
|||||||||||||||||||
|
Outstanding at January 1
|
17,900
|
|
$
|
27.39
|
|
10,523
|
|
$
|
30.77
|
|
9,218
|
|
$
|
27.48
|
|
|||||
|
Granted
|
3,498
|
|
32.67
|
|
9,112
|
|
23.37
|
|
3,373
|
|
35.33
|
|
||||||||
|
Exercised
|
(1,539
|
)
|
22.13
|
|
(764
|
)
|
19.63
|
|
(1,891
|
)
|
22.35
|
|
||||||||
|
Forfeited
|
(388
|
)
|
26.77
|
|
(717
|
)
|
31.34
|
|
(166
|
)
|
36.85
|
|
||||||||
|
Canceled
|
(155
|
)
|
36.87
|
|
(254
|
)
|
35.07
|
|
(11
|
)
|
25.28
|
|
||||||||
|
Outstanding at December 31
|
19,316
|
|
$
|
28.71
|
|
17,900
|
|
$
|
27.39
|
|
10,523
|
|
$
|
30.77
|
|
|||||
|
Exercisable at December 31
|
9,851
|
|
$
|
29.83
|
|
7,498
|
|
$
|
30.09
|
|
5,810
|
|
$
|
26.07
|
|
|||||
The intrinsic value of a stock option is the amount by which the current market value of the underlying stock exceeds the exercise price of an option. The total intrinsic value of options exercised during
2016
,
2015
, and
2014
was
$15.8 million
,
$4.9 million
, and
$24.1 million
, respectively. At
December 31, 2016
, options outstanding had an intrinsic value of
$44.8 million
, with a weighted average remaining life of
7.5
years. At
December 31, 2016
, options exercisable had an intrinsic value of
$22.2 million
, with a weighted average remaining life of
6.3
years. At
December 31, 2016
, stock options vested or expected to vest totaled
18.9 million
shares, with a total intrinsic value of
$44.2 million
, weighted average exercise price of
$28.68
, and weighted average remaining life of
7.5
years. During
2016
, approximately
4 million
stock options vested. The total grant date fair value of stock options vested during
2016
,
2015
, and
2014
was approximately
$13 million
,
$12 million
, and
$12 million
, respectively.
Mattel uses treasury shares purchased under its share repurchase program to satisfy stock option exercises. Cash received from stock options exercised during
2016
,
2015
, and
2014
was
$34.1 million
,
$15.0 million
, and
$43.3 million
, respectively.
Restricted Stock Units
RSUs are valued at the market value on the date of grant, adjusted by the present value of the expected dividends for RSUs that are not entitled to a dividend during the vest period. The expense for RSUs is evenly attributed to the periods in which the restrictions lapse, which is generally
3 years
from the date of grant.
Compensation expense recognized related to grants of RSUs, excluding Performance RSUs, was
$40.2 million
,
$41.5 million
, and
$39.5 million
in
2016
,
2015
, and
2014
, respectively, and is included within other selling and administrative expenses in the consolidated statements of operations. Income tax benefits related to RSU activity during
2016
,
2015
, and
2014
totaled
$11.5 million
,
$11.0 million
, and
$10.6 million
, respectively. The 2016 income tax benefit related to RSUs includes
$0.8 million
recognized as a result of the adoption of ASU 2016-09.
The following is a summary of RSU information and weighted average grant date fair values for Mattel’s RSUs, excluding Performance RSUs:
|
|
2016
|
2015
|
2014
|
|||||||||||||||||
|
|
Shares
|
Weighted Average Grant Date Fair Value
|
Shares
|
Weighted Average Grant Date Fair Value
|
Shares
|
Weighted Average Grant Date Fair Value
|
||||||||||||||
|
|
(In thousands, except weighted average grant date fair value)
|
|||||||||||||||||||
|
Unvested at January 1
|
3,738
|
|
$
|
28.98
|
|
3,173
|
|
$
|
37.10
|
|
3,036
|
|
$
|
34.94
|
|
|||||
|
Granted
|
1,608
|
|
29.68
|
|
2,332
|
|
23.54
|
|
1,786
|
|
34.83
|
|
||||||||
|
Vested
|
(1,756
|
)
|
30.25
|
|
(1,159
|
)
|
37.29
|
|
(1,426
|
)
|
29.77
|
|
||||||||
|
Forfeited
|
(347
|
)
|
27.04
|
|
(608
|
)
|
34.67
|
|
(223
|
)
|
36.27
|
|
||||||||
|
Unvested at December 31
|
3,244
|
|
$
|
28.85
|
|
3,738
|
|
$
|
28.98
|
|
3,173
|
|
$
|
37.10
|
|
|||||
At
December 31, 2016
, RSUs expected to vest totaled
3.1 million
shares, with a weighted average grant date fair value of
$27.07
. The total grant date fair value of RSUs vested during
2016
,
2015
, and
2014
was
$53.1 million
,
$43.2 million
, and
$42.5 million
, respectively.
80
In addition to the expense and share amounts described above, Mattel recognized compensation expense of
$3.2 million
during
2016
for Performance RSUs granted in connection with its January 1, 2016—December 31, 2018 LTIP performance cycle, more fully described in “Note 4 to the Consolidated Financial Statements—Employee Benefit Plans.” Income tax benefits related to Performance RSU compensation expense recognized in the consolidated statements of operations during
2016
totaled
$1.2 million
.
No
compensation expense and
no
related income tax benefit was recognized for Performance RSUs granted in connection with its January 1, 2014—December 31, 2016 LTIP performance cycle, also more fully described in "Note 4 to the Consolidated Financial Statements—Employee Benefit Plans," for the years ended
2016
,
2015
, and
2014
as actual results did not meet minimum performance thresholds.
Unvested share-based payment awards that contain nonforfeitable rights to dividends or dividend equivalents (whether paid or unpaid) are participating securities and are included in the computation of earnings per share pursuant to the two-class method. Certain of Mattel’s RSUs are considered participating securities because they contain nonforfeitable rights to dividend equivalents.
Under the two-class method, net income is reduced by the amount of dividends declared in the period for each class of common stock and participating securities. The remaining undistributed earnings are then allocated to common stock and participating securities as if all of the net income for the period had been distributed. Basic earnings per common share excludes dilution and is calculated by dividing net income allocable to common shares by the weighted average number of common shares outstanding for the period. Diluted earnings per common share is calculated by dividing net income allocable to common shares by the weighted average number of common shares for the period, as adjusted for the potential dilutive effect of non-participating share-based awards.
The following table reconciles earnings per common share:
|
|
For the Year Ended
|
||||||||||
|
|
December 31,
2016 |
December 31,
2015 |
December 31,
2014 |
||||||||
|
|
(In thousands, except per share amounts)
|
||||||||||
|
Basic:
|
|||||||||||
|
Net income
|
$
|
318,022
|
|
$
|
369,416
|
|
$
|
498,874
|
|
||
|
Less: Net income allocable to participating RSUs
|
(1,377
|
)
|
(3,179
|
)
|
(4,028
|
)
|
|||||
|
Net income available for basic common shares
|
$
|
316,645
|
|
$
|
366,237
|
|
$
|
494,846
|
|
||
|
Weighted average common shares outstanding
|
341,480
|
|
339,172
|
|
339,016
|
|
|||||
|
Basic net income per common share
|
$
|
0.93
|
|
$
|
1.08
|
|
$
|
1.46
|
|
||
|
Diluted:
|
|||||||||||
|
Net income
|
$
|
318,022
|
|
$
|
369,416
|
|
$
|
498,874
|
|
||
|
Less: Net income allocable to participating RSUs
|
(1,377
|
)
|
(3,179
|
)
|
(4,028
|
)
|
|||||
|
Net income available for diluted common shares
|
$
|
316,645
|
|
$
|
366,237
|
|
$
|
494,846
|
|
||
|
Weighted average common shares outstanding
|
341,480
|
|
339,172
|
|
339,016
|
|
|||||
|
Weighted average common equivalent shares arising from:
|
|||||||||||
|
Dilutive stock options and non-participating RSUs
|
2,753
|
|
576
|
|
1,752
|
|
|||||
|
Weighted average number of common and potential common shares
|
344,233
|
|
339,748
|
|
340,768
|
|
|||||
|
Diluted net income per common share
|
$
|
0.92
|
|
$
|
1.08
|
|
$
|
1.45
|
|
||
The calculation of potential common shares assumes the exercise of dilutive stock options and vesting of non-participating RSUs, net of assumed treasury share repurchases at average market prices. Nonqualified stock options and non-participating RSUs totaling
8.5 million
shares,
9.6 million
shares, and
2.8 million
shares were excluded from the calculation of diluted net income per common share for
2016
,
2015
, and
2014
, respectively, because they were antidilutive.
81
Mattel seeks to mitigate its exposure to foreign currency transaction risk by monitoring its foreign currency transaction exposure for the year and partially hedging such exposure using foreign currency forward exchange contracts. Mattel uses foreign currency forward exchange contracts as cash flow hedges primarily to hedge its purchases and sales of inventory denominated in foreign currencies. These contracts generally have maturity dates of up to
18 months
. These derivative instruments have been designated as effective cash flow hedges, whereby the unsettled hedges are reported in Mattel’s consolidated balance sheets at fair value, with changes in the fair value of the hedges reflected in other comprehensive income (“OCI”). Realized gains and losses for these contracts are recorded in the consolidated statements of operations in the period in which the inventory is sold to customers. Additionally, Mattel uses foreign currency forward exchange contracts to hedge intercompany loans and advances denominated in foreign currencies. Due to the short-term nature of the contracts involved, Mattel does not use hedge accounting for these contracts, and as such, changes in fair value are recorded in the period of change in the consolidated statements of operations. As of
December 31, 2016
and
2015
, Mattel held foreign currency forward exchange contracts with notional amounts of
$1.20 billion
and
$930.8 million
, respectively.
The following table presents Mattel’s derivative assets and liabilities:
|
|
Derivative Assets
|
||||||||
|
|
Balance Sheet Classification
|
Fair Value
|
|||||||
|
|
|
December 31, 2016
|
December 31, 2015
|
||||||
|
|
|
(In thousands)
|
|||||||
|
Derivatives designated as hedging instruments:
|
|||||||||
|
Foreign currency forward exchange contracts
|
Prepaid expenses and other current assets
|
$
|
18,747
|
|
$
|
15,279
|
|
||
|
Foreign currency forward exchange contracts
|
Other noncurrent assets
|
5,782
|
|
1,611
|
|
||||
|
Total derivatives designated as hedging instruments
|
$
|
24,529
|
|
$
|
16,890
|
|
|||
|
Derivatives not designated as hedging instruments:
|
|||||||||
|
Foreign currency forward exchange contracts
|
Prepaid expenses and other current assets
|
$
|
2,678
|
|
$
|
1,216
|
|
||
|
Total
|
$
|
27,207
|
|
$
|
18,106
|
|
|||
|
|
Derivative Liabilities
|
||||||||
|
|
Balance Sheet Classification
|
Fair Value
|
|||||||
|
|
|
December 31, 2016
|
December 31, 2015
|
||||||
|
|
|
(In thousands)
|
|||||||
|
Derivatives designated as hedging instruments:
|
|||||||||
|
Foreign currency forward exchange contracts
|
Accrued liabilities
|
$
|
1,917
|
|
$
|
1,214
|
|
||
|
Foreign currency forward exchange contracts
|
Other noncurrent liabilities
|
223
|
|
219
|
|
||||
|
Total derivatives designated as hedging instruments
|
$
|
2,140
|
|
$
|
1,433
|
|
|||
|
Derivatives not designated as hedging instruments:
|
|||||||||
|
Foreign currency forward exchange contracts
|
Accrued liabilities
|
$
|
7,072
|
|
$
|
2,287
|
|
||
|
Total
|
$
|
9,212
|
|
$
|
3,720
|
|
|||
82
The following tables present the classification and amount of gains and losses, net of tax, from derivatives reported in the consolidated statements of operations:
|
|
Derivatives Designated As Hedging Instruments
|
Statements of
Operations
Classification
|
|||||||||||
|
For the Year Ended
|
|||||||||||||
|
|
December 31,
2016 |
December 31,
2015 |
December 31,
2014 |
||||||||||
|
|
(In thousands)
|
|
|||||||||||
|
Foreign currency forward exchange contracts:
|
|||||||||||||
|
Amount of gain recognized in OCI
|
$
|
18,733
|
|
$
|
37,926
|
|
$
|
39,931
|
|
||||
|
Amount of gain (loss) reclassified from accumulated OCI to statements of operations
|
16,627
|
|
52,588
|
|
(883
|
)
|
Cost of sales
|
||||||
The net gains (losses) of
$16.6 million
,
$52.6 million
, and
$(0.9) million
reclassified from accumulated other comprehensive loss to the consolidated statements of operations during
2016
,
2015
, and
2014
, respectively, are offset by the changes in cash flows associated with the underlying hedged transactions.
|
|
Derivatives Not Designated As Hedging Instruments
|
Statements of Operations
Classification
|
|||||||||||
|
For the Year Ended
|
|||||||||||||
|
|
December 31,
2016 |
December 31,
2015 |
December 31,
2014 |
||||||||||
|
|
(In thousands)
|
|
|||||||||||
|
Amount of (loss) gain recognized in the statements of operations:
|
|||||||||||||
|
Foreign currency forward exchange contracts
|
$
|
(11,056
|
)
|
$
|
(51,679
|
)
|
$
|
(31,485
|
)
|
Non-operating income/expense
|
|||
|
Cross currency swap contract
|
—
|
|
5,288
|
|
—
|
|
Non-operating income/ expense
|
||||||
|
Foreign currency forward exchange contracts
|
1,631
|
|
(265
|
)
|
732
|
|
Cost of sales
|
||||||
|
Total
|
$
|
(9,425
|
)
|
$
|
(46,656
|
)
|
$
|
(30,753
|
)
|
||||
The net losses of
$9.4 million
,
$46.7 million
, and
$30.8 million
recognized in the consolidated statements of operations during
2016
,
2015
, and
2014
, respectively, are offset by foreign currency transaction gains and losses on the related hedged balances.
The following table presents information about Mattel’s assets and liabilities measured and reported in the financial statements at fair value on a recurring basis as of
December 31, 2016
and
2015
and indicates the fair value hierarchy of the valuation techniques utilized to determine such fair value. The three levels of the fair value hierarchy are as follows:
|
•
|
Level 1 – Valuations based on unadjusted quoted prices in active markets for identical assets or liabilities that the entity has the ability to access.
|
|
•
|
Level 2 – Valuations based on quoted prices for similar assets or liabilities, quoted prices in markets that are not active, or other inputs that are observable or can be corroborated by observable data for substantially the full term of the assets or liabilities.
|
|
•
|
Level 3 – Valuations based on inputs that are unobservable, supported by little or no market activity, and that are significant to the fair value of the assets or liabilities.
|
83
Mattel’s financial assets and liabilities include the following:
|
|
December 31, 2016
|
||||||||||||||
|
|
Level 1
|
Level 2
|
Level 3
|
Total
|
|||||||||||
|
|
(In thousands)
|
||||||||||||||
|
Assets:
|
|||||||||||||||
|
Foreign currency forward exchange contracts (a)
|
$
|
—
|
|
$
|
27,207
|
|
$
|
—
|
|
$
|
27,207
|
|
|||
|
Available-for-sale security (b)
|
14,939
|
|
—
|
|
—
|
|
14,939
|
|
|||||||
|
$
|
14,939
|
|
$
|
27,207
|
|
$
|
—
|
|
$
|
42,146
|
|
||||
|
Liabilities:
|
|||||||||||||||
|
Foreign currency forward exchange contracts (a)
|
$
|
—
|
|
$
|
9,212
|
|
$
|
—
|
|
$
|
9,212
|
|
|||
|
|
December 31, 2015
|
||||||||||||||
|
|
Level 1
|
Level 2
|
Level 3
|
Total
|
|||||||||||
|
|
(In thousands)
|
||||||||||||||
|
Assets:
|
|||||||||||||||
|
Foreign currency forward exchange contracts (a)
|
$
|
—
|
|
$
|
18,106
|
|
$
|
—
|
|
$
|
18,106
|
|
|||
|
Liabilities:
|
|||||||||||||||
|
Foreign currency forward exchange contracts (a)
|
$
|
—
|
|
$
|
3,720
|
|
$
|
—
|
|
$
|
3,720
|
|
|||
|
(a)
|
The fair value of the foreign currency forward exchange contracts is based on dealer quotes of market forward rates and reflects the amount that Mattel would receive or pay at their maturity dates for contracts involving the same notional amounts, currencies, and maturity dates.
|
|
(b)
|
The fair value of the available-for-sale security is based on the quoted price on an active public exchange.
|
During 2015, Mattel sold its auction rate security and received proceeds of
$32.3 million
, resulting in a gain of
$1.3 million
for the year ended December 31, 2015. The fair value of the auction rate security was estimated using a discounted cash flow model based on (i) estimated interest rates, timing, and amount of cash flows, (ii) credit spreads, recovery rates, and credit quality of the underlying securities, (iii) illiquidity considerations, and (iv) market correlation.
The following table presents information about Mattel's investments measured and reported at fair value on a recurring basis using significant Level 3 inputs:
|
|
Level 3
|
||
|
|
(In thousands)
|
||
|
Balance at December 31, 2014
|
$
|
30,960
|
|
|
Proceeds from sale
|
(32,250
|
)
|
|
|
Gain on sale
|
1,290
|
|
|
|
Balance at December 31, 2015
|
$
|
—
|
|
Non-Recurring Fair Value Measurements
Mattel tests its long-lived assets for impairment whenever events or changes in circumstances indicate that the carrying value may not be recoverable or that the carrying value may exceed its fair value. During
2016
,
2015
, and
2014
, Mattel did not have any assets or liabilities measured and reported at fair value on a non-recurring basis in periods subsequent to initial recognition.
Other Financial Instruments
Mattel’s financial instruments include cash and equivalents, accounts receivable and payable, short-term borrowings, and accrued liabilities. The carrying value of these instruments approximate their fair value because of their short-term nature and are classified as Level 2 within the fair value hierarchy.
84
The estimated fair value of Mattel’s long-term debt, including the current portion, was
$2.18 billion
(compared to a carrying value of
$2.15 billion
) as of
December 31, 2016
and
$2.15 billion
(compared to a carrying value of
$2.10 billion
) as of
December 31, 2015
. The estimated fair values have been calculated based on broker quotes or rates for the same or similar instruments and are classified as Level 2 within the fair value hierarchy.
Leases
Mattel routinely enters into noncancelable lease agreements for premises and equipment used in the normal course of business. Certain of these leases include escalation clauses that adjust rental expense to reflect changes in price indices, as well as renewal options. In addition to minimum rental payments, certain of Mattel’s leases require additional payments to reimburse the lessors for operating expenses such as real estate taxes, maintenance, utilities, and insurance. Rental expense is recorded on a straight-line basis, including escalating minimum payments. The American Girl Place leases in Chicago, Illinois, Los Angeles, California, and New York, New York, and American Girl store leases in Alpharetta, Georgia, Bloomington, Minnesota, Charlotte, North Carolina, Chesterfield, Missouri, Columbus, Ohio, Dallas, Texas, Houston, Texas, Lone Tree, Colorado, Lynnwood, Washington, McLean, Virginia, Miami, Florida, Nashville, Tennessee, Natick, Massachusetts, Orlando, Florida, Overland Park, Kansas, Palo Alto, California, and Scottsdale, Arizona also contain provisions for additional rental payments based on a percentage of the sales of each store after reaching certain sales benchmarks. Contingent rental expense is recorded in the period in which the contingent event becomes probable. During
2016
,
2015
, and
2014
, contingent rental expense was not material.
The following table shows the future minimum obligations under lease commitments in effect at
December 31, 2016
:
|
Capital
Leases
|
Operating
Leases
|
||||||
|
|
(In thousands)
|
||||||
|
2017
|
$
|
294
|
|
|
$
|
110,131
|
|
|
2018
|
294
|
|
|
94,431
|
|
||
|
2019
|
294
|
|
|
78,107
|
|
||
|
2020
|
25
|
|
|
69,738
|
|
||
|
2021
|
—
|
|
|
62,266
|
|
||
|
Thereafter
|
—
|
|
|
205,650
|
|
||
|
$
|
907
|
|
(a)
|
$
|
620,323
|
|
|
|
(a)
|
Includes
$0.1 million
of imputed interest.
|
Rental expense under operating leases amounted to
$110.1 million
,
$114.9 million
, and
$120.9 million
for
2016
,
2015
, and
2014
, respectively, net of sublease income of
$2.7 million
,
$2.7 million
, and
$2.6 million
in
2016
,
2015
, and
2014
, respectively.
Commitments
In the normal course of business, Mattel enters into contractual arrangements to obtain and protect Mattel’s right to create and market certain products and for future purchases of goods and services to ensure availability and timely delivery. Such arrangements include royalty payments pursuant to licensing agreements and commitments primarily for future inventory purchases. Certain of these commitments routinely contain provisions for guarantees or minimum expenditures during the term of the contracts. Current and future commitments for guaranteed payments reflect Mattel’s focus on expanding its product lines through alliances with businesses in other industries.
85
Licensing and similar agreements in effect at
December 31, 2016
contain provisions for future minimum payments as shown in the following table:
|
|
Licensing and
Similar
Agreements
|
||
|
|
(In thousands)
|
||
|
2017
|
$
|
105,641
|
|
|
2018
|
123,107
|
|
|
|
2019
|
91,793
|
|
|
|
2020
|
58,027
|
|
|
|
2021
|
9,431
|
|
|
|
Thereafter
|
4,451
|
|
|
|
$
|
392,450
|
|
|
Royalty expense for
2016
,
2015
, and
2014
was
$228.9 million
,
$264.6 million
, and
$242.4 million
, respectively.
The following table shows the future minimum obligations for purchases of inventory, services, and other as of
December 31, 2016
:
|
|
Other
Purchase
Obligations
|
||
|
|
(In thousands)
|
||
|
2017
|
$
|
409,298
|
|
|
2018
|
21,900
|
|
|
|
2019
|
12,206
|
|
|
|
2020
|
1,104
|
|
|
|
2021
|
—
|
|
|
|
$
|
444,508
|
|
|
Insurance
Mattel has a wholly-owned subsidiary, Far West Insurance Company, Ltd. (“Far West”), that was established to insure Mattel’s workers’ compensation, general, automobile, product liability, and property risks. Far West insures the first
$1.0 million
per occurrence for workers’ compensation risks, the first
$0.5 million
for general and automobile liability risks, the first
$2.0 million
per occurrence and
$2.0 million
per year for product liability risks, and up to
$1.0 million
per occurrence for property risks. Various insurance companies, that have an “A” or better AM Best rating at the time the policies are purchased, reinsure Mattel’s risk in excess of the amounts insured by Far West. Mattel’s liability for reported and incurred but not reported claims at
December 31, 2016
and
2015
totaled
$15.5 million
and
$13.9 million
, respectively, and is included in other noncurrent liabilities in the consolidated balance sheets. Loss reserves are accrued based on Mattel’s estimate of the aggregate liability for claims incurred.
Litigation
Litigation Related to Carter Bryant and MGA Entertainment, Inc.
In April 2004, Mattel filed a lawsuit in Los Angeles County Superior Court against Carter Bryant (“Bryant”), a former Mattel design employee. The suit alleges that Bryant aided and assisted a Mattel competitor, MGA Entertainment, Inc. (“MGA”), during the time he was employed by Mattel, in violation of his contractual and other duties to Mattel. In September 2004, Bryant asserted counterclaims against Mattel, including counterclaims in which Bryant sought, as a putative class action representative, to invalidate Mattel’s Confidential Information and Proprietary Inventions Agreements with its employees. Bryant also removed Mattel’s suit to the United States District Court for the Central District of California. In December 2004, MGA intervened as a party-defendant in Mattel’s action against Bryant, asserting that its rights to Bratz properties are at stake in the litigation.
86
Separately, in November 2004, Bryant filed an action against Mattel in the United States District Court for the Central District of California. The action sought a judicial declaration that Bryant’s purported conveyance of rights in Bratz was proper and that he did not misappropriate Mattel property in creating Bratz.
In April 2005, MGA filed suit against Mattel in the United States District Court for the Central District of California. MGA’s action alleges claims of trade dress infringement, trade dress dilution, false designation of origin, unfair competition, and unjust enrichment. The suit alleges, among other things, that certain products, themes, packaging, and/or television commercials in various Mattel product lines have infringed upon products, themes, packaging, and/or television commercials for various MGA product lines, including Bratz. The complaint also asserts that various alleged Mattel acts with respect to unidentified retailers, distributors, and licensees have damaged MGA and that various alleged acts by industry organizations, purportedly induced by Mattel, have damaged MGA. MGA’s suit alleges that MGA has been damaged in an amount “believed to reach or exceed tens of millions of dollars” and further seeks punitive damages, disgorgement of Mattel’s profits and injunctive relief.
In June 2006, the
three
cases were consolidated in the United States District Court for the Central District of California. On July 17, 2006, the Court issued an order dismissing all claims that Bryant had asserted against Mattel, including Bryant’s purported counterclaims to invalidate Mattel’s Confidential Information and Proprietary Inventions Agreements with its employees, and Bryant’s claims for declaratory relief.
On January 12, 2007, Mattel filed an Amended Complaint setting forth counterclaims that included additional claims against Bryant as well as claims for copyright infringement, Racketeer Influenced and Corrupt Organizations (“RICO”) violations, misappropriation of trade secrets, intentional interference with contract, aiding and abetting breach of fiduciary duty and breach of duty of loyalty, and unfair competition, among others, against MGA, its Chief Executive Officer Isaac Larian, certain MGA affiliates and an MGA employee. The RICO claim alleged that MGA stole Bratz and then, by recruiting and hiring key Mattel employees and directing them to bring with them Mattel confidential and proprietary information, unfairly competed against Mattel using Mattel’s trade secrets, confidential information, and key employees to build their business.
Mattel sought to try all of its claims in a single trial, but in February 2007, the Court decided that the consolidated cases would be tried in two phases, with the first trial to determine claims and defenses related to Mattel’s ownership of Bratz works and whether MGA infringed those works. On May 19, 2008, Bryant reached a settlement agreement with Mattel and is no longer a defendant in the litigation. In the public stipulation entered by Mattel and Bryant in connection with the resolution, Bryant agreed that he was and would continue to be bound by all prior and future Court Orders relating to Bratz ownership and infringement, including the Court’s summary judgment rulings.
The first phase of the first trial resulted in a unanimous jury verdict on July 17, 2008 in favor of Mattel. The jury found that almost all of the Bratz design drawings and other works in question were created by Bryant while he was employed at Mattel; that MGA and Isaac Larian intentionally interfered with the contractual duties owed by Bryant to Mattel, aided and abetted Bryant’s breaches of his duty of loyalty to Mattel, aided and abetted Bryant’s breaches of the fiduciary duties he owed to Mattel, and converted Mattel property for their own use. The same jury determined that defendants MGA, Larian, and MGA Entertainment (HK) Limited infringed Mattel’s copyrights in the Bratz design drawings and other Bratz works, and awarded Mattel total damages of approximately
$100 million
against the defendants. On December 3, 2008, the Court issued a series of orders rejecting MGA’s equitable defenses and granting Mattel’s motions for equitable relief, including an order enjoining the MGA party defendants from manufacturing, marketing, or selling certain Bratz fashion dolls or from using the “Bratz” name. The Court stayed its December 3, 2008 injunctive orders until further order of the Court.
The parties filed and argued additional motions for post-trial relief, including a request by MGA to enter judgment as a matter of law on Mattel’s claims in MGA’s favor and to reduce the jury’s damages award to Mattel. Mattel additionally moved for the appointment of a receiver. On April 27, 2009, the Court entered an order confirming that Bratz works found by the jury to have been created by Bryant during his Mattel employment were Mattel’s property and that hundreds of Bratz female fashion dolls infringe Mattel’s copyrights. The Court also upheld the jury’s award of damages in the amount of
$100 million
and ordered an accounting of post-trial Bratz sales. The Court further vacated the stay of the December 3, 2008 orders.
MGA appealed the Court’s equitable orders to the Court of Appeals for the Ninth Circuit. On December 9, 2009, the Ninth Circuit heard oral argument on MGA’s appeal and issued an order staying the District Court’s equitable orders pending a further order to be issued by the Ninth Circuit. On July 22, 2010, the Ninth Circuit vacated the District Court’s equitable orders. The Ninth Circuit stated that, because of several jury instruction errors it identified, a significant portion—if not all—of the jury verdict and damage award should be vacated.
87
In its opinion, the Ninth Circuit found that the District Court erred in concluding that Mattel’s Invention Agreement unambiguously applied to “ideas;” that it should have considered extrinsic evidence in determining the application of the agreement; and if the conclusion turns on conflicting evidence, it should have been up to the jury to decide. The Ninth Circuit also concluded that the District Judge erred in transferring the entire brand to Mattel based on misappropriated names and that the Court should have submitted to the jury, rather than deciding itself, whether Bryant’s agreement assigned works created outside the scope of his employment and whether Bryant’s creation of the Bratz designs and sculpt was outside of his employment. The Court then went on to address copyright issues which would be raised after a retrial, since Mattel “might well convince a properly instructed jury” that it owns Bryant’s designs and sculpt. The Ninth Circuit stated that the sculpt itself was entitled only to “thin” copyright protection against virtually identical works, while the Bratz sketches were entitled to “broad” protection against substantially similar works; in applying the broad protection, however, the Ninth Circuit found that the lower court had erred in failing to filter out all of the unprotectable elements of Bryant’s sketches. This mistake, the Court said, caused the lower court to conclude that all Bratz dolls were substantially similar to Bryant’s original sketches.
Judge Stephen Larson, who presided over the first trial, retired from the bench during the course of the appeal, and the case was transferred to Judge David O. Carter. After the transfer, Judge Carter granted Mattel leave to file a Fourth Amended Answer and Counterclaims which focused on RICO, trade secret and other claims, and added additional parties, and subsequently granted in part and denied in part a defense motion to dismiss those counterclaims.
Later, on August 16, 2010, MGA asserted several new claims against Mattel in response to Mattel’s Fourth Amended Answer and Counterclaims, including claims for alleged trade secret misappropriation, an alleged violation of RICO, and wrongful injunction. MGA alleged, in summary, that, for more than a decade dating back to 1992, Mattel employees engaged in a pattern of stealing alleged trade secret information from competitors “toy fair” showrooms, and then sought to conceal that alleged misconduct. Mattel moved to strike and/or dismiss these claims, as well as certain MGA allegations regarding Mattel’s motives for filing suit. The Court granted that motion as to the wrongful injunction claim, which it dismissed with prejudice, and as to the allegations about Mattel’s motives, which it struck. The Court denied the motion as to MGA’s trade secret misappropriation claim and its claim for violations of RICO.
The Court resolved summary judgment motions in late 2010. Among other rulings, the Court dismissed both parties’ RICO claims; dismissed Mattel’s claim for breach of fiduciary duty and portions of other claims as “preempted” by the trade secrets act; dismissed MGA’s trade dress infringement claims; dismissed MGA’s unjust enrichment claim; dismissed MGA’s common law unfair competition claim; and dismissed portions of Mattel’s copyright infringement claim as to “later generation” Bratz dolls.
Trial of all remaining claims began in early January 2011. During the trial, and before the case was submitted to the jury, the Court granted MGA’s motions for judgment as to Mattel’s claims for aiding and abetting breach of duty of loyalty and conversion. The Court also granted a defense motion for judgment on portions of Mattel’s claim for misappropriation of trade secrets relating to thefts by former Mattel employees located in Mexico.
The jury reached verdicts on the remaining claims in April 2011. In those verdicts, the jury ruled against Mattel on its claims for ownership of Bratz-related works, for copyright infringement, and for misappropriation of trade secrets. The jury ruled for MGA on its claim of trade secret misappropriation as to
26
of its claimed trade secrets and awarded
$88.5 million
in damages. The jury ruled against MGA as to
88
of its claimed trade secrets. The jury found that Mattel’s misappropriation was willful and malicious.
In early August 2011, the Court ruled on post-trial motions. The Court rejected MGA’s unfair competition claims and also rejected Mattel’s equitable defenses to MGA’s misappropriation of trade secrets claim. The Court reduced the jury’s damages award of
$88.5 million
to
$85.0 million
. The Court awarded MGA an additional
$85.0 million
in punitive damages and approximately
$140 million
in attorney’s fees and costs. The Court entered a judgment which totaled approximately
$310 million
in favor of MGA.
On August 11, 2011, Mattel appealed the judgment, challenging on appeal the entirety of the District Court’s monetary award in favor of MGA, including both the award of
$170 million
in damages for alleged trade secret misappropriation and approximately
$140 million
in attorney’s fees and costs. On January 24, 2013, the Ninth Circuit Court of Appeals issued a ruling on Mattel’s appeal. In that ruling, the Court found that MGA’s claim for trade secrets misappropriation was not compulsory to any Mattel claim and could not be filed as a counterclaim-in-reply. Accordingly, the Court of Appeals vacated the portion of the judgment awarding damages and attorney’s fees and costs to MGA for prevailing on its trade secrets misappropriation claim, totaling approximately
$172.5 million
. It ruled that, on remand, the District Court must dismiss MGA’s trade secret claim without prejudice. In its ruling, the Court of Appeals also affirmed the District Court’s award of attorney’s fees and costs under the Copyright Act. Accordingly, Mattel recorded a litigation accrual of approximately
$138 million
during the fourth quarter of 2012 to cover these fees and costs.
88
Because multiple claimants asserted rights to the attorney’s fees portion of the judgment, on February 13, 2013, Mattel filed a motion in the District Court for orders permitting Mattel to interplead the proceeds of the judgment and releasing Mattel from liability to any claimant based on Mattel’s payment of the judgment.
On February 27, 2013, MGA filed a motion for leave to amend its prior complaint in the existing federal court lawsuit so that it could reassert its trade secrets claim. Mattel opposed that motion. On December 17, 2013, the District Court denied MGA’s motion for leave to amend and entered an order dismissing MGA’s trade secrets claim without prejudice. Also on December 17, 2013, following a settlement between MGA and certain insurance carriers, the District Court denied Mattel’s motion for leave to interplead the proceeds of the judgment.
On December 21, 2013, a stipulation regarding settlement with insurers and payment of judgment was filed in the District Court, which provided that (i) Mattel would pay approximately
$138 million
, including accrued interest, in full satisfaction of the copyright fees judgment, (ii) all parties would consent to entry of an order exonerating and discharging the appeal bond posted by Mattel, and (iii) MGA’s insurers would dismiss all pending actions related to the proceeds of the copyright fees judgment, including an appeal by Evanston Insurance Company in an action against Mattel that was pending in the Ninth Circuit. On December 23, 2013, Mattel paid the copyright fees judgment in the total sum, including interest, of approximately
$138 million
. On December 26, 2013, the District Court entered an order exonerating and discharging the appeal bond posted by Mattel, and on December 27, 2013, MGA filed an acknowledgment of satisfaction of judgment. On December 30, 2013, Evanston Insurance Company’s appeal in its action against Mattel was dismissed.
On January 13, 2014, MGA filed a new, but virtually identical, trade secrets claim against Mattel in Los Angeles County Superior Court. In its complaint, MGA purports to seek damages in excess of
$1 billion
. Mattel believes that MGA’s claim should be barred as a matter of law, and intends to vigorously defend against it. On December 3, 2014, the Court overruled Mattel’s request to dismiss MGA’s case as barred as a result of prior litigation between the parties. In light of that ruling, Mattel believes that it is reasonably possible that damages in this matter could range from
$0
to approximately
$12.5 million
. In addition, Mattel believes that if such damages are awarded, it is reasonably possible that pre-judgment interest, ranging from
$0
to approximately
$12.0 million
, could be awarded. Mattel may be entitled to an offset against any damages awarded to MGA. Mattel has not quantified the amount of any such offset as it is not currently estimable. As Mattel believes a loss in this matter is reasonably possible but not probable,
no
liability has been accrued to date.
Litigation Related to Yellowstone do Brasil Ltda.
Yellowstone do Brasil Ltda. (formerly known as Trebbor Informática Ltda.) was a customer of Mattel’s subsidiary Mattel do Brasil Ltda. when a commercial dispute arose between Yellowstone and Mattel do Brasil regarding the supply of product and related payment terms. As a consequence of the dispute, in April 1999, Yellowstone filed a declarative action against Mattel do Brasil before the 15
th
Civil Court of Curitiba – State of Parana (the “Trial Court”), requesting the annulment of its security bonds and promissory notes given to Mattel do Brasil as well as requesting the Trial Court to find Mattel do Brasil liable for damages incurred as a result of Mattel do Brasil’s alleged abrupt and unreasonable breach of an oral exclusive distribution agreement between the parties relating to the supply and sale of toys in Brazil. Yellowstone’s complaint sought alleged loss of profits of approximately
$1 million
, plus an unspecified amount of damages consisting of: (i) compensation for all investments made by Yellowstone to develop Mattel do Brasil’s business; (ii) reimbursement of the amounts paid by Yellowstone to terminate labor and civil contracts in connection with the business; (iii) compensation for alleged unfair competition and for the goodwill of trade; and (iv) compensation for non-pecuniary damages.
Mattel do Brasil filed its defenses to these claims and simultaneously presented a counterclaim for unpaid accounts receivable for goods supplied to Yellowstone in the approximate amount of
$4 million
.
During the evidentiary phase a first accounting report was submitted by a court-appointed expert. Such report stated that Yellowstone had invested approximately
$3 million
in its business. Additionally, the court-appointed expert calculated a loss of profits compensation of approximately
$1 million
. Mattel do Brasil challenged the report since it was not made based on the official accounting documents of Yellowstone and since the report calculated damages based only on documents unilaterally submitted by Yellowstone.
The Trial Court accepted the challenge and ruled that a second accounting examination should take place in the lawsuit. Yellowstone appealed the decision to the Court of Appeals of the State of Parana (the “Appeals Court”), but it was upheld by the Appeals Court.
The second court-appointed expert’s report submitted at trial did not assign a value to any of Yellowstone’s claims and found no evidence of causation between Mattel do Brasil’s actions and such claims.
89
In January 2010, the Trial Court ruled in favor of Mattel do Brasil and denied all of Yellowstone’s claims based primarily on the lack of any causal connection between the acts of Mattel do Brasil and Yellowstone’s alleged damages. Additionally, the Trial Court upheld Mattel do Brasil’s counterclaim and ordered Yellowstone to pay Mattel do Brasil approximately
$4 million
. The likelihood of Mattel do Brasil recovering this amount was uncertain due to the fact that Yellowstone was declared insolvent and filed for bankruptcy protection. In February 2010, Yellowstone filed a motion seeking clarification of the decision which was denied.
In September 2010, Yellowstone filed a further appeal with the Appeals Court. Under Brazilian law, the appeal was de novo and Yellowstone restated all of the arguments it made at the Trial Court level. Yellowstone did not provide any additional information supporting its unspecified alleged damages. The Appeals Court held hearings on the appeal in March and April 2013. On July 26, 2013, the Appeals Court awarded Yellowstone approximately
$17 million
in damages, plus attorney's fees, as adjusted for inflation and interest. The Appeals Court also awarded Mattel do Brasil approximately
$7.5 million
on its counterclaim, as adjusted for inflation. On August 2, 2013, Mattel do Brasil filed a motion with the Appeals Court for clarification since the written decision contained clear errors in terms of amounts awarded and interest and inflation adjustments. Mattel do Brasil’s motion also asked the Appeals Court to decide whether Yellowstone’s award could be offset by the counterclaim award, despite Yellowstone’s status as a bankrupt entity. Yellowstone also filed a motion for clarification on August 5, 2013. A decision on the clarification motions was rendered on November 11, 2014, and the Appeals Court accepted partially the arguments raised by Mattel do Brasil. As a result, the Appeals Court awarded Yellowstone approximately
$14.5 million
in damages, as adjusted for inflation and interest, plus attorney's fees. The Appeals Court also awarded Mattel do Brasil approximately
$7.5 million
on its counterclaim, as adjusted for inflation. The decision also recognized the existence of legal rules that support Mattel do Brasil’s right to offset its counterclaim award of approximately
$7.5 million
. Mattel do Brasil filed a new motion for clarification with the Appeals Court on January 21, 2015, due to the incorrect statement made by the reporting judge of the Appeals Court, that the court-appointed expert analyzed the “accounting documents” of Yellowstone. On April 26, 2015, a decision on the motion for clarification was rendered. The Appeals Court ruled that the motion for clarification was denied and imposed a fine on Mattel do Brasil equal to
1%
of the value of the claims made for the delay caused by the motion. On July 3, 2015, Mattel do Brasil filed a special appeal to the Superior Court of Justice based upon both procedural and substantive grounds. This special appeal seeks to reverse the Appeals Court's decision of July 26, 2013, and to reverse the fine as inappropriate under the law. This special appeal was submitted to the Appeals Court which must rule on its admissibility before it is transferred to the Superior Court.
Yellowstone also filed a special appeal with the Appeals Court in February 2015, which was made available to Mattel do Brasil on October 7, 2015. Yellowstone's special appeal seeks to reverse the Appeals Court decision with respect to: (a) the limitation on Yellowstone's loss of profits claim to the amount requested in the complaint, instead of the amount contained in the first court-appointed experts report, and (b) the award of damages to Mattel do Brasil on the counterclaim, since the specific amount was not requested in Mattel do Brasil's counterclaim brief.
On October 19, 2015, Mattel do Brasil filed its answer to the special appeal filed by Yellowstone and Yellowstone filed its answer to the special appeal filed by Mattel do Brasil. On April 4, 2016, the Appeals Court rendered a decision denying the admissibility of Mattel's and Yellowstone's special appeals. On May 11, 2016, both Mattel and Yellowstone filed interlocutory appeals and are awaiting the decision.
Mattel believes that it is reasonably possible that a loss in this matter could range from
$0
to approximately
$16.5 million
. The high end of this range, approximately
$16.5 million
, is based on the calculation of the current amount of the damages (reported in the first court-appointed examination report submitted in the lawsuit), and loss of profits (indicated in the complaint by Yellowstone), including interest, inflation, currency adjustments, plus attorney's fees. Mattel do Brasil will be entitled to offset its counterclaim award of approximately
$7.5 million
, the current amount including inflation, and currency adjustment, against such loss. The existence of procedural matters that will be addressed to the Superior Court of Justice adds some uncertainty to the final outcome of the matter. Mattel do Brasil believes, however, that it has valid legal grounds for an appeal of the Appeals Court decision and currently does not believe that a loss is probable for this matter. Accordingly, a liability has not been accrued to date. Mattel do Brasil may be required by the Trial Court to place a bond for the full amount of the damage award in escrow pending an appeal decision by the Superior Court.
90
Description of Segments
Mattel, through its subsidiaries, sells a broad variety of toy products which are grouped into
four
major brand categories:
Mattel Girls & Boys Brands
—including Barbie
®
fashion dolls and accessories (“Barbie”), Monster High
®
, Ever After High
®
, Polly Pocket
®
, and DC Super Hero Girls™ (collectively “Other Girls”), Hot Wheels
®
and Matchbox
®
vehicles and play sets (collectively “Wheels”), and CARS
®
, DC Comics
®
, WWE
®
Wrestling, Minecraft
®
, Max Steel
®
, BOOMco.
®
, Toy Story
®
, and games and puzzles (collectively “Entertainment”).
Fisher-Price Brands
—including Fisher-Price
®
, Little People
®
, BabyGear™, Laugh & Learn
®
, and Imaginext
®
(collectively “Core Fisher-Price”), Thomas & Friends
®
, Dora the Explorer
®
, Mickey Mouse
®
Clubhouse, and Disney Jake and the Never Land Pirates
®
(collectively “Fisher-Price Friends”), and Power Wheels
®
.
American Girl Brands
—including Truly Me
®
, Girl of the Year
®
, BeForever
®
, Bitty Baby
®
, and WellieWishers™. American Girl
®
Brands products are sold directly to consumers via its catalog, website, and proprietary retail stores, as well as sold directly to certain retailers.
Construction and Arts & Crafts Brands
—including MEGA BLOKS
®
and RoseArt
®
.
Mattel’s operating segments are: (i) North America, which consists of the US and Canada, (ii) International, and (iii) American Girl. Factors considered in determining the operating segments include the nature of business activities, the management structure directly accountable to the Chief Operating Decision Maker (“CODM”) for operating and administrative activities, availability of discrete financial information, and strategic priorities within the organizational structure. These factors correspond to the manner in which the CODM reviews and evaluates operating performance to make decisions about resources to be allocated to these operating segments.
The North America and International segments sell products in the Mattel Girls & Boys Brands, Fisher-Price Brands, and Construction and Arts & Crafts Brands categories, although some are developed and adapted for particular international markets.
91
Segment Data
The following tables present information about revenues, income, and assets by segment. Mattel does not include sales adjustments such as trade discounts and other allowances in the calculation of segment revenues (referred to as “gross sales”). Mattel records these adjustments in its financial accounting systems at the time of sale to each customer, but the adjustments are not allocated to individual products. For this reason, Mattel’s CODM uses gross sales by segment as one of the metrics to measure segment performance. Such sales adjustments are included in the determination of segment income from operations based on the adjustments recorded in the financial accounting systems. Segment income represents each segment’s operating income, while consolidated operating income represents income from operations before net interest, other non-operating income, and income taxes as reported in the consolidated statements of operations. The corporate and other expense category includes costs not allocated to individual segments, including charges related to incentive compensation, share-based payments, and corporate headquarters functions managed on a worldwide basis, and the impact of changes in foreign currency rates on intercompany transactions.
|
|
For the Year Ended
|
||||||||||
|
|
December 31,
2016 |
December 31,
2015 |
December 31,
2014 |
||||||||
|
|
(In thousands)
|
||||||||||
|
Revenues by Segment
|
|||||||||||
|
North America
|
$
|
3,036,181
|
|
$
|
3,083,873
|
|
$
|
3,011,633
|
|
||
|
International
|
2,447,615
|
|
2,603,537
|
|
3,061,506
|
|
|||||
|
American Girl
|
589,918
|
|
596,218
|
|
645,309
|
|
|||||
|
Gross sales
|
6,073,714
|
|
6,283,628
|
|
6,718,448
|
|
|||||
|
Sales adjustments
|
(617,064
|
)
|
(581,015
|
)
|
(694,629
|
)
|
|||||
|
Net sales
|
$
|
5,456,650
|
|
$
|
5,702,613
|
|
$
|
6,023,819
|
|
||
|
Segment Income
|
|||||||||||
|
North America
|
$
|
564,378
|
|
$
|
538,249
|
|
$
|
459,833
|
|
||
|
International
|
291,230
|
|
321,068
|
|
359,904
|
|
|||||
|
American Girl
|
106,423
|
|
69,899
|
|
113,571
|
|
|||||
|
962,031
|
|
929,216
|
|
933,308
|
|
||||||
|
Corporate and other expense (a)
|
(442,798
|
)
|
(388,294
|
)
|
(279,594
|
)
|
|||||
|
Operating income
|
519,233
|
|
540,922
|
|
653,714
|
|
|||||
|
Interest expense
|
95,118
|
|
85,270
|
|
79,271
|
|
|||||
|
Interest (income)
|
(9,144
|
)
|
(7,230
|
)
|
(7,382
|
)
|
|||||
|
Other non-operating expense (income), net
|
23,517
|
|
(1,033
|
)
|
(5,085
|
)
|
|||||
|
Income before income taxes
|
$
|
409,742
|
|
$
|
463,915
|
|
$
|
586,910
|
|
||
|
(a)
|
Corporate and other expense includes (i) incentive compensation expense of
$16.5 million
,
$50.2 million
, and
$25.2 million
for
2016
,
2015
, and
2014
, respectively, (ii)
$39.9 million
,
$72.0 million
, and
$51.8 million
of charges related to severance and other termination-related costs for
2016
,
2015
, and
2014
, respectively, (iii) share-based compensation expense of
$53.9 million
,
$56.7 million
, and
$52.0 million
for
2016
,
2015
, and
2014
, respectively, and (iv) legal fees associated with MGA litigation matters.
|
92
|
|
For the Year Ended
|
||||||||||
|
|
December 31,
2016 |
December 31,
2015 |
December 31,
2014 |
||||||||
|
|
(In thousands)
|
||||||||||
|
Depreciation and Amortization by Segment
|
|||||||||||
|
North America
|
$
|
118,047
|
|
$
|
122,757
|
|
$
|
118,633
|
|
||
|
International
|
88,414
|
|
90,269
|
|
86,011
|
|
|||||
|
American Girl
|
23,023
|
|
22,054
|
|
18,434
|
|
|||||
|
229,484
|
|
235,080
|
|
223,078
|
|
||||||
|
Corporate and other
|
32,856
|
|
30,347
|
|
25,623
|
|
|||||
|
Depreciation and amortization
|
$
|
262,340
|
|
$
|
265,427
|
|
$
|
248,701
|
|
||
Segment assets are comprised of accounts receivable and inventories, net of applicable reserves and allowances.
|
|
For the Year Ended
|
||||||||||
|
|
December 31,
2016 |
December 31,
2015 |
December 31,
2014 |
||||||||
|
|
(In thousands)
|
||||||||||
|
Assets by Segment
|
|||||||||||
|
North America
|
$
|
677,203
|
|
$
|
764,945
|
|
$
|
698,357
|
|
||
|
International
|
766,584
|
|
759,709
|
|
778,849
|
|
|||||
|
American Girl
|
154,924
|
|
108,414
|
|
108,667
|
|
|||||
|
1,598,711
|
|
1,633,068
|
|
1,585,873
|
|
||||||
|
Corporate and other
|
130,304
|
|
99,552
|
|
70,334
|
|
|||||
|
Accounts receivable and inventories, net
|
$
|
1,729,015
|
|
$
|
1,732,620
|
|
$
|
1,656,207
|
|
||
Mattel sells a broad variety of toy products, which are grouped into four major categories: Mattel Girls & Boys Brands, Fisher-Price Brands, American Girl Brands, and Construction and Arts & Crafts Brands. The table below presents worldwide revenues by brand category:
|
|
For the Year Ended
|
||||||||||
|
|
December 31,
2016 |
December 31,
2015 |
December 31,
2014 |
||||||||
|
|
(In thousands)
|
||||||||||
|
Worldwide Revenues by Brand Category
|
|||||||||||
|
Mattel Girls & Boys Brands
|
$
|
3,194,100
|
|
$
|
3,464,195
|
|
$
|
3,897,218
|
|
||
|
Fisher-Price Brands
|
1,888,146
|
|
1,852,219
|
|
1,842,550
|
|
|||||
|
American Girl Brands
|
570,770
|
|
571,957
|
|
618,678
|
|
|||||
|
Construction and Arts & Crafts Brands
|
377,570
|
|
351,747
|
|
314,994
|
|
|||||
|
Other
|
43,128
|
|
43,510
|
|
45,008
|
|
|||||
|
Gross sales
|
6,073,714
|
|
6,283,628
|
|
6,718,448
|
|
|||||
|
Sales adjustments
|
(617,064
|
)
|
(581,015
|
)
|
(694,629
|
)
|
|||||
|
Net sales
|
$
|
5,456,650
|
|
$
|
5,702,613
|
|
$
|
6,023,819
|
|
||
93
Geographic Information
The tables below present information by geographic area. Revenues are attributed to countries based on location of customer. Long-lived assets principally include goodwill, property, plant, and equipment, net, and identifiable intangibles, net.
|
|
For the Year Ended
|
||||||||||
|
|
December 31,
2016 |
December 31,
2015 |
December 31,
2014 |
||||||||
|
|
(In thousands)
|
||||||||||
|
Revenues
|
|||||||||||
|
North American Region (a)
|
$
|
3,626,099
|
|
$
|
3,680,091
|
|
$
|
3,656,942
|
|
||
|
International Region:
|
|||||||||||
|
Europe
|
1,293,302
|
|
1,388,753
|
|
1,687,039
|
|
|||||
|
Latin America
|
636,535
|
|
711,041
|
|
909,432
|
|
|||||
|
Asia Pacific
|
517,778
|
|
503,743
|
|
465,035
|
|
|||||
|
Total International Region
|
2,447,615
|
|
2,603,537
|
|
3,061,506
|
|
|||||
|
Gross sales
|
6,073,714
|
|
6,283,628
|
|
6,718,448
|
|
|||||
|
Sales adjustments
|
(617,064
|
)
|
(581,015
|
)
|
(694,629
|
)
|
|||||
|
Net sales
|
$
|
5,456,650
|
|
$
|
5,702,613
|
|
$
|
6,023,819
|
|
||
|
|
December 31,
2016 |
December 31,
2015 |
December 31,
2014 |
||||||||
|
|
(In thousands)
|
||||||||||
|
Long-Lived Assets
|
|||||||||||
|
North American Region (b)
|
$
|
1,566,621
|
|
$
|
1,557,153
|
|
$
|
1,656,985
|
|
||
|
International Region
|
1,478,747
|
|
1,466,003
|
|
1,492,633
|
|
|||||
|
Consolidated total
|
$
|
3,045,368
|
|
$
|
3,023,156
|
|
$
|
3,149,618
|
|
||
|
(a)
|
Revenues for the North American Region include revenues attributable to the US of
$3.39 billion
,
$3.46 billion
, and
$3.41 billion
for
2016
,
2015
, and
2014
, respectively.
|
|
(b)
|
Long-lived assets for the North American Region include long-lived assets attributable to the US of
$1.57 billion
,
$1.57 billion
, and
$1.65 billion
for
2016
,
2015
, and
2014
, respectively.
|
Major Customers
Sales to Mattel’s three largest customers accounted for
39%
,
37%
, and
35%
of worldwide consolidated net sales for
2016
,
2015
, and
2014
, respectively, as follows:
|
|
For the Year Ended
|
||||||||||
|
|
December 31,
2016 |
December 31,
2015 |
December 31,
2014 |
||||||||
|
|
(In billions)
|
||||||||||
|
Wal-Mart
|
$
|
1.1
|
|
$
|
1.0
|
|
$
|
1.1
|
|
||
|
Toys “R” Us
|
0.6
|
|
0.6
|
|
0.6
|
|
|||||
|
Target
|
0.4
|
|
0.5
|
|
0.5
|
|
|||||
The North America segment sells products to each of Mattel’s three largest customers. The International segment sells products to Wal-Mart and Toys “R” Us. The American Girl segment sells its children’s publications to each of Mattel's three largest customers.
94
|
|
December 31,
2016 |
December 31,
2015 |
|||||
|
|
(In thousands)
|
||||||
|
Inventories include the following:
|
|||||||
|
Raw materials and work in process
|
$
|
112,327
|
|
$
|
105,917
|
|
|
|
Finished goods
|
501,471
|
|
481,604
|
|
|||
|
$
|
613,798
|
|
$
|
587,521
|
|
||
|
Property, plant, and equipment, net includes the following:
|
|||||||
|
Land
|
$
|
25,113
|
|
$
|
27,049
|
|
|
|
Buildings
|
280,226
|
|
275,266
|
|
|||
|
Machinery and equipment
|
828,969
|
|
764,657
|
|
|||
|
Software
|
356,622
|
|
331,251
|
|
|||
|
Tools, dies, and molds
|
869,385
|
|
840,586
|
|
|||
|
Capital leases
|
23,970
|
|
23,970
|
|
|||
|
Leasehold improvements
|
261,254
|
|
245,082
|
|
|||
|
2,645,539
|
|
2,507,861
|
|
||||
|
Less: accumulated depreciation
|
(1,871,574
|
)
|
(1,766,714
|
)
|
|||
|
$
|
773,965
|
|
$
|
741,147
|
|
||
|
Other noncurrent assets include the following:
|
|||||||
|
Deferred income taxes
|
$
|
508,363
|
|
$
|
510,928
|
|
|
|
Nonamortizable identifiable intangibles
|
458,589
|
|
488,144
|
|
|||
|
Identifiable intangibles (net of amortization of $153.7 million and $131.5 million at December 31, 2016 and 2015, respectively)
|
201,859
|
|
212,161
|
|
|||
|
Other
|
223,326
|
|
197,184
|
|
|||
|
$
|
1,392,137
|
|
$
|
1,408,417
|
|
||
|
Accrued liabilities include the following:
|
|||||||
|
Royalties
|
$
|
107,077
|
|
$
|
122,153
|
|
|
|
Advertising and promotion
|
85,116
|
|
75,991
|
|
|||
|
Taxes other than income taxes
|
67,555
|
|
66,848
|
|
|||
|
Incentive compensation
|
18,830
|
|
52,721
|
|
|||
|
Other
|
350,248
|
|
340,469
|
|
|||
|
$
|
628,826
|
|
$
|
658,182
|
|
||
|
Other noncurrent liabilities include the following:
|
|||||||
|
Benefit plan liabilities
|
$
|
192,466
|
|
$
|
195,916
|
|
|
|
Noncurrent tax liabilities
|
96,871
|
|
106,584
|
|
|||
|
Other
|
156,831
|
|
169,139
|
|
|||
|
$
|
446,168
|
|
$
|
471,639
|
|
||
95
|
|
For the Year Ended
|
||||||||||
|
|
December 31,
2016 |
December 31,
2015 |
December 31,
2014 |
||||||||
|
|
(In thousands)
|
||||||||||
|
Currency transaction (losses) gains included in:
|
|||||||||||
|
Operating income
|
$
|
(164,042
|
)
|
$
|
(25,715
|
)
|
$
|
44,060
|
|
||
|
Other non-operating (expense) income, net
|
(27,290
|
)
|
(8,291
|
)
|
2,827
|
|
|||||
|
Net transaction (losses) gains
|
$
|
(191,332
|
)
|
$
|
(34,006
|
)
|
$
|
46,887
|
|
||
|
Other selling and administrative expenses include the following:
|
|||||||||||
|
Design and development
|
$
|
215,304
|
|
$
|
217,816
|
|
$
|
209,467
|
|
||
|
Identifiable intangible asset amortization
|
22,215
|
|
27,923
|
|
36,704
|
|
|||||
|
Bad debt expense
|
9,165
|
|
5,813
|
|
11,507
|
|
|||||
96
|
First
Quarter
|
Second
Quarter
|
Third
Quarter
|
Fourth
Quarter
|
||||||||||||
|
|
(In thousands, except per share amounts)
|
||||||||||||||
|
Year Ended December 31, 2016
|
|||||||||||||||
|
Net sales
|
$
|
869,399
|
|
$
|
957,276
|
|
$
|
1,795,575
|
|
$
|
1,834,400
|
|
|||
|
Gross profit
|
388,671
|
|
433,567
|
|
870,765
|
|
861,388
|
|
|||||||
|
Advertising and promotion expenses
|
86,943
|
|
94,771
|
|
202,900
|
|
250,333
|
|
|||||||
|
Other selling and administrative expenses
|
350,874
|
|
350,456
|
|
350,469
|
|
348,412
|
|
|||||||
|
Operating (loss) income
|
(49,146
|
)
|
(11,660
|
)
|
317,396
|
|
262,643
|
|
|||||||
|
(Loss) Income before income taxes
|
(93,479
|
)
|
(29,752
|
)
|
294,028
|
|
238,945
|
|
|||||||
|
Net (loss) income (a)
|
(72,959
|
)
|
(19,114
|
)
|
236,250
|
|
173,845
|
|
|||||||
|
Net (loss) income per common share—basic
|
$
|
(0.21
|
)
|
$
|
(0.06
|
)
|
$
|
0.69
|
|
$
|
0.51
|
|
|||
|
Weighted average number of common shares
|
340,369
|
|
340,926
|
|
341,961
|
|
342,653
|
|
|||||||
|
Net (loss) income per common share—diluted
|
$
|
(0.21
|
)
|
$
|
(0.06
|
)
|
$
|
0.68
|
|
$
|
0.50
|
|
|||
|
Weighted average number of common and potential common shares
|
340,369
|
|
340,926
|
|
344,226
|
|
344,996
|
|
|||||||
|
Dividends declared per common share
|
$
|
0.38
|
|
$
|
0.38
|
|
$
|
0.38
|
|
$
|
0.38
|
|
|||
|
Common stock market price:
|
|||||||||||||||
|
High
|
$
|
33.62
|
|
$
|
34.26
|
|
$
|
34.12
|
|
$
|
33.09
|
|
|||
|
Low
|
24.87
|
|
28.89
|
|
30.28
|
|
27.55
|
|
|||||||
|
Year Ended December 31, 2015
|
|||||||||||||||
|
Net sales
|
$
|
922,749
|
|
$
|
988,152
|
|
$
|
1,791,968
|
|
$
|
1,999,744
|
|
|||
|
Gross profit
|
450,448
|
|
472,858
|
|
879,597
|
|
1,003,455
|
|
|||||||
|
Advertising and promotion expenses
|
102,428
|
|
104,744
|
|
213,245
|
|
297,435
|
|
|||||||
|
Other selling and administrative expenses
|
402,487
|
|
367,551
|
|
365,579
|
|
411,967
|
|
|||||||
|
Operating (loss) income
|
(54,467
|
)
|
563
|
|
300,773
|
|
294,053
|
|
|||||||
|
(Loss) Income before income taxes
|
(73,147
|
)
|
(19,898
|
)
|
286,139
|
|
270,821
|
|
|||||||
|
Net (loss) income (a)
|
(58,177
|
)
|
(11,351
|
)
|
223,784
|
|
215,160
|
|
|||||||
|
Net (loss) income per common share—basic
|
$
|
(0.17
|
)
|
$
|
(0.03
|
)
|
$
|
0.66
|
|
$
|
0.63
|
|
|||
|
Weighted average number of common shares
|
338,579
|
|
338,843
|
|
339,420
|
|
339,815
|
|
|||||||
|
Net (loss) income per common share—diluted
|
$
|
(0.17
|
)
|
$
|
(0.03
|
)
|
$
|
0.66
|
|
$
|
0.63
|
|
|||
|
Weighted average number of common and potential common shares
|
338,579
|
|
338,843
|
|
339,790
|
|
340,364
|
|
|||||||
|
Dividends declared per common share
|
$
|
0.38
|
|
$
|
0.38
|
|
$
|
0.38
|
|
$
|
0.38
|
|
|||
|
Common stock market price:
|
|||||||||||||||
|
High
|
$
|
30.47
|
|
$
|
30.20
|
|
$
|
26.34
|
|
$
|
27.69
|
|
|||
|
Low
|
22.61
|
|
22.65
|
|
21.03
|
|
19.83
|
|
|||||||
|
(a)
|
Net loss for the first and second quarters of
2016
included net discrete tax expense of
$0.2 million
and net discrete tax benefits of
$4.0 million
, respectively, primarily related to reassessments of prior years’ tax liabilities based on the status of audits and tax filings in various jurisdictions around the world, settlements, and enacted law changes. Net income for the third and fourth quarters of
2016
included net discrete tax benefits of
$9.0 million
and $
4.0 million
, respectively, primarily related to reassessments of prior years’ tax liabilities based on the status of audits and tax filings in various jurisdictions around the world, settlements, and enacted tax law changes, and the adoption of a new accounting pronouncement. Net loss for the first and second quarters of
2016
included net discrete tax expense of
$0.7 million
and net discrete tax benefits of
$4.3 million
, respectively, primarily related to reassessments of prior years’ tax liabilities based on the status of audits and tax filings in various jurisdictions around the world, settlements, and enacted law changes. Net income for the third and fourth quarters of
2016
included net discrete tax expense of
$0.8 million
and net discrete tax benefits of
$16.3 million
, respectively, primarily related to reassessments of prior years’ tax liabilities based on the status of audits and tax filings in various jurisdictions around the world, settlements, and enacted tax law changes.
|
97
On
January 25, 2017
, Mattel announced that its Board of Directors declared a first quarter dividend of
$0.38
per common share. The dividend is payable on
March 3, 2017
to stockholders of record on
February 16, 2017
.
|
Item 9.
|
Changes in and Disagreements with Accountants on Accounting and Financial Disclosure.
|
None.
|
Item 9A.
|
Controls and Procedures.
|
Evaluation of Disclosure Controls and Procedures
As of
December 31, 2016
, Mattel’s disclosure controls and procedures were evaluated, with the participation of Mattel’s principal executive officer and principal financial officer, to assess whether they are effective in providing reasonable assurance that information required to be disclosed by Mattel in the reports that it files or submits under the Securities Exchange Act of 1934 is accumulated and communicated to management, including its principal executive officer and principal financial officer, as appropriate, to allow timely decisions regarding required disclosure and to provide reasonable assurance that such information is recorded, processed, summarized and reported within the time periods specified in Securities and Exchange Commission rules and forms. Based on this evaluation, Margaret H. Georgiadis, Mattel’s principal executive officer, and Kevin M. Farr, Mattel’s principal financial officer, concluded that these disclosure controls and procedures were effective as of
December 31, 2016
.
Management’s Report on Internal Control Over Financial Reporting
The report called for by Item 308(a) of Regulation S-K is incorporated by reference to Management’s Report on Internal Control Over Financial Reporting, included in Item 8 “Financial Statements and Supplementary Data” of this report.
Report of Independent Registered Public Accounting Firm
The report called for by Item 308(b) of Regulation S-K is incorporated by reference to Report of Independent Registered Public Accounting Firm, included in Item 8 “Financial Statements and Supplementary Data” of this report.
Changes in Internal Control Over Financial Reporting
There was no change in our internal control over financial reporting that occurred during the period covered by this report that has materially affected, or is reasonably likely to materially affect, our internal control over financial reporting.
|
Item 9B.
|
Other Information.
|
None.
98
|
Item 10.
|
Directors, Executive Officers and Corporate Governance.
|
The information required under this Item is incorporated herein by reference to sections entitled “Proposal 1—Election of Directors”; “Corporate Governance at Mattel—Board General Information—Board Committees—Audit Committee”; "Executive Officers and Executive Compensation—Executive Officers"; and “Stock Ownership and Reporting —Section 16(a) Beneficial Ownership Reporting Compliance” in the Mattel
2017
Proxy Statement to be filed with the SEC within 120 days after
December 31, 2016
(the “Proxy Statement”).
Mattel has adopted the Mattel Code of Conduct (the “Code of Conduct”), which satisfies the listing rules of the NASDAQ Stock Market (“NASDAQ”) regarding “code of conduct” and satisfies the SEC rules regarding disclosure of a “code of ethics” for the Chief Executive Officer, Chief Financial Officer and Controller. The Code of Conduct is publicly available on Mattel’s corporate website at
http://corporate.mattel.com
, and the text of the Code of Conduct will be updated on the website to reflect any amendment. A copy may also be obtained free of charge by mailing a request in writing to: Secretary, Mail Stop M1-1516, Mattel, Inc., 333 Continental Blvd., El Segundo, CA 90245-5012. If Mattel grants any waiver from a provision of the Code of Conduct for any executive officer or director, or makes any substantive amendment to the SEC-mandated “code of ethics” that applies to the Chief Executive Officer, Chief Financial Officer or Controller, Mattel will make disclosures to the extent required by applicable laws, regulations and stock exchange listing standards on its corporate website or in a Current Report on Form 8-K. Mattel has posted the Board of Directors’ corporate governance guidelines and the charters of its Audit, Compensation and Governance and Social Responsibility Committees of the Board of Directors on its corporate website at
http://corporate.mattel.com
. Copies of the corporate governance guidelines and committee charters may be obtained free of charge by mailing a request to the address noted above.
Mattel has filed the Sarbanes-Oxley Act Section 302 certifications of its Chief Executive Officer and Chief Financial Officer as Exhibit 31.0 and Exhibit 31.1 hereto, respectively.
|
Item 11.
|
Executive Compensation.
|
The information required under this Item is incorporated herein by reference to sections entitled “Executive Officers and Executive Compensation” and “Corporate Governance at Mattel—Board General Information—Board Committees—Compensation Committee” in the Proxy Statement.
|
Item 12.
|
Security Ownership of Certain Beneficial Owners and Management and Related Stockholder Matters.
|
The information required under this Item is incorporated herein by reference to the section entitled “Stock Ownership and Reporting” in the Proxy Statement.
|
Item 13.
|
Certain Relationships and Related Transactions, and Director Independence.
|
The information required under this Item is incorporated herein by reference to sections entitled “Audit and Related Party Matters—Certain Transactions with Related Persons” and “Corporate Governance at Mattel—Board General Information—Board Independence Determination” in the Proxy Statement.
|
Item 14.
|
Principal Accountant Fees and Services.
|
The information required under this Item is incorporated herein by reference to the section entitled “Audit and Related Party Matters—Fees Incurred for Services by PricewaterhouseCoopers LLP” in the Proxy Statement.
99
|
(a)
|
The following documents are filed as part of this report:
|
|
1.
|
Financial Statements
|
The following financial statements are filed as part of this report under Part II, Item 8 “Financial Statements and Supplementary Data.”
|
|
Page
|
2.
Financial Statement Schedule for the Years Ended December 31, 2016, 2015 and 2014
Schedule II—Valuation and Qualifying Accounts and Allowances
All other financial statement schedules are omitted because they are not applicable or the required information is shown in the consolidated financial statements or notes thereto. See Part II, Item 8 “Financial Statements and Supplementary Data.”
3.
Exhibits (Listed by numbers corresponding to Item 601 of Regulation S-K)
|
|
|
Incorporated by Reference
|
||||||||
|
Exhibit No.
|
Exhibit Description
|
Form
|
File No.
|
Exhibit(s)
|
Filing Date
|
|||||
|
3.0
|
Restated Certificate of Incorporation of Mattel, Inc.
|
8-K
|
001-05647
|
99.0
|
May 21, 2007
|
|||||
|
3.1
|
Amended and Restated Bylaws of Mattel, Inc.
|
8-K
|
001-05647
|
3.1
|
January 30, 2017
|
|||||
|
4.0
|
Specimen Stock Certificate with respect to Mattel, Inc.’s Common Stock
|
10-Q
|
001-05647
|
4.0
|
August 3, 2007
|
|||||
|
4.1
|
Indenture, dated as of September 23, 2010, between Mattel, Inc. and Union Bank, N.A. relating to Senior Debt Securities
|
S-3ASR
|
333-169539
|
4.1
|
September 23, 2010
|
|||||
|
4.2
|
Form of Indenture between Mattel, Inc. and Union Bank, N.A. relating to Subordinated Debt Securities
|
S-3ASR
|
333-169539
|
4.2
|
September 23, 2010
|
|||||
|
4.3
|
Form of 4.350% Notes due 2020
|
8-K
|
001-05647
|
4.1
|
September 28, 2010
|
|||||
|
4.4
|
Form of 6.200% Notes due 2040
|
8-K
|
001-05647
|
4.2
|
September 28, 2010
|
|||||
|
4.5
|
Form of 5.450% Notes due 2041
|
8-K
|
001-05647
|
4.2
|
November 8, 2011
|
|||||
|
4.6
|
Form of 1.700% Notes due 2018
|
8-K
|
001-05647
|
4.1
|
March 7, 2013
|
|||||
|
4.7
|
Form of 3.150% Notes due 2023
|
8-K
|
001-05647
|
4.2
|
March 7, 2013
|
|||||
|
4.8
|
Form of 2.350% Notes due 2019
|
8-K
|
001-05647
|
4.1
|
May 6, 2014
|
|||||
|
4.9
|
Form of 2.350% Notes due 2021
|
8-K
|
001-05647
|
4.1
|
August 5, 2016
|
|||||
100
|
|
|
Incorporated by Reference
|
||||||||
|
Exhibit No.
|
Exhibit Description
|
Form
|
File No.
|
Exhibit(s)
|
Filing Date
|
|||||
|
10.0
|
Seventh Amended and Restated Credit Agreement dated as of June 8, 2015, by and among Mattel, Inc., as Borrower, Bank of America, N.A., as Administrative Agent, Merrill Lynch, Pierce, Fenner & Smith Incorporated, Wells Fargo Securities, LLC, and Citigroup Global Markets Inc., as Joint Lead Arrangers and Joint Book Runners, Wells Fargo Bank, N.A., and Citibank N.A., as Co-Syndication Agents, Mizuho Bank, Ltd., MUFG Union Bank, N.A., and Royal Bank of Canada, as Co-Documentation Agents, and the other financial institutions party thereto
|
8-K
|
001-05647
|
10.1
|
June 9, 2015
|
|||||
|
10.1
+
|
Letter Agreement between Mattel, Inc. and Peter D. Gibbons, dated March 28, 2013, regarding an offer of employment for the position of EVP, Global Operations
|
10-Q
|
001-05647
|
10.2
|
April 22, 2013
|
|||||
|
10.2
+
|
Letter Agreement between Mattel, Inc. and Richard Dickson dated May 16, 2014 regarding an offer of employment for the position of Chief Brands Officer
|
10-Q
|
001-05647
|
10.2
|
July 29, 2014
|
|||||
|
10.3
+
|
Letter Agreement between Mattel, Inc. and Christopher A. Sinclair, dated February 19, 2015, regarding an offer of employment for the position of Interim Chief Executive Officer
|
10-Q
|
001-05647
|
10.3
|
April 28, 2015
|
|||||
|
10.4
+
|
Letter Agreement between Mattel, Inc. and Bryan G. Stockton, dated March 3, 2015, regarding Mr. Stockton's separation from Mattel
|
10-Q
|
001-05647
|
10.2
|
April 28, 2015
|
|||||
|
10.5
+
|
Consulting Agreement, by and between Mattel, Inc. and Bryan G. Stockton, dated March 10, 2015
|
8-K
|
001-05647
|
10.1
|
March 16, 2015
|
|||||
|
10.6
+
|
Letter Agreement between Mattel, Inc. and Joseph B. Johnson, dated March 11, 2015, regarding an offer of employment for the position of SVP and Corporate Controller
|
8-K
|
001-05647
|
10.1
|
May 4, 2015
|
|||||
|
10.7
+
|
Letter Agreement between Mattel, Inc. and Christopher A. Sinclair, dated April 15, 2015, regarding an offer of employment for the position of Chief Executive Officer
|
10-Q
|
001-05647
|
10.4
|
July 28, 2015
|
|||||
|
10.8
+
|
Letter Agreement between Mattel, Inc. and Geoffrey H. Walker, dated June 29, 2015, regarding Mr. Walker's promotion to EVP, Commercial - North America
|
10-Q
|
001-05647
|
10.2
|
October 27, 2015
|
|||||
|
10.9
+*
|
Letter Agreement between Mattel, Inc. and Juliana Chugg, dated August 25, 2015, regarding an offer of employment for the position of EVP & Chief Brands Officer -
Core Brands
|
|||||||||
|
10.10
+
|
Letter Agreement between Mattel, Inc. and Margaret H. Georgiadis, dated January 11, 2017, regarding an offer of employment for the position of Chief Executive Officer
|
8-K
|
001-05647
|
10.1
|
January 17, 2017
|
|||||
|
10.11
+
|
Participation Letter Agreement under the Mattel, Inc. Executive Severance Plan B between Mattel, Inc. and Margaret H. Georgiadis, dated January 11, 2017
|
8-K
|
001-05647
|
10.2
|
January 17, 2017
|
|||||
|
10.12
+
|
Mattel Incentive Plan
|
DEF 14A
|
001-05647
|
Appendix A
|
March 28, 2012
|
|||||
|
10.13
+
|
Amendment No. 1 to the Mattel Incentive Plan
|
10-Q
|
001-05647
|
10.1
|
October 24, 2013
|
|||||
101
|
|
|
Incorporated by Reference
|
||||||||
|
Exhibit No.
|
Exhibit Description
|
Form
|
File No.
|
Exhibit(s)
|
Filing Date
|
|||||
|
10.14
+
|
Mattel, Inc. Deferred Compensation and PIP Excess Plan
|
S-8
|
333-89458
|
4.1
|
May 31, 2002
|
|||||
|
10.15
+
|
Mattel, Inc. Deferred Compensation and PIP Excess Plan (Post-2004)(the "DCPEP")
|
10-Q
|
001-05647
|
10.1
|
October 24, 2008
|
|||||
|
10.16
+
|
Amendment No. 1 to the DCPEP
|
10-Q
|
001-05647
|
10.2
|
October 24, 2013
|
|||||
|
10.17
+
|
Amendment No. 2 to the DCPEP
|
10-Q
|
001-05647
|
10.3
|
October 24, 2013
|
|||||
|
10.18
+
|
Amendment No. 3 to the DCPEP
|
10-K
|
001-05647
|
10.19
|
February 25, 2016
|
|||||
|
10.19
+
|
Mattel, Inc. Deferred Compensation Plan for Non-Employee Directors (as amended and restated effective January 1, 2009)
|
10-K
|
001-05647
|
10.35
|
February 26, 2009
|
|||||
|
10.20
+
|
Amendment No. 1 to the Mattel, Inc. Deferred Compensation Plan for Non-Employee Directors
|
10-Q
|
001-05647
|
10.4
|
October 24, 2013
|
|||||
|
10.21
+
|
Mattel, Inc. 2005 Supplemental Executive Retirement Plan (as amended and restated effective January 1, 2009)
|
10-K
|
001-05647
|
10.36
|
February 26, 2009
|
|||||
|
10.22
+
|
Amendment No. 1 to the Mattel, Inc. 2005 Supplemental Executive Retirement Plan
|
10-Q
|
001-05647
|
10.5
|
October 24, 2013
|
|||||
|
10.23
+
|
Mattel, Inc. Executive Severance Plan (effective June 30, 2009) (the "Executive Severance Plan")
|
8-K
|
001-05647
|
10.4
|
July 2, 2009
|
|||||
|
10.24
+
|
Amendment No. 1 to the Executive Severance Plan
|
10-Q
|
001-05647
|
10.6
|
October 24, 2013
|
|||||
|
10.25
+
|
Mattel, Inc. Executive Severance Plan B (effective July 1, 2014) (the "Executive Severance Plan B" and collectively with the Executive Severance Plan, the "Executive Severance Plans")
|
8-K
|
001-05647
|
10.1
|
July 21, 2014
|
|||||
|
10.26
+
|
The Mattel Cash Balance Excess Benefit Plan (as amended and restated, effective July 1, 2012)
|
10-K
|
001-05647
|
10.10
|
February 26, 2013
|
|||||
|
10.27
+
|
Amendment No. 1 to the Mattel Cash Balance Excess Benefit Plan
|
10-Q
|
001-05647
|
10.7
|
October 24, 2013
|
|||||
|
10.28
+
|
Mattel, Inc. Personal Investment Plan (amended and restated as of January 1, 2013) (the “PIP”)
|
10-K
|
001-05647
|
10.11
|
February 26, 2013
|
|||||
|
10.29
+
|
Amendment One to the PIP
|
10-K
|
001-05647
|
10.21
|
February 26, 2014
|
|||||
|
10.30
+
|
Amendment Two to the PIP
|
10-K
|
001-05647
|
10.22
|
February 25, 2015
|
|||||
|
10.31
+
|
Amendment Three to the PIP
|
10-K
|
001-05647
|
10.23
|
February 25, 2015
|
|||||
|
10.32
+
|
Amendment Four and Merger Agreement for the PIP and the MEGA Brands America, Inc. 401(k) Savings Plan
|
10-K
|
001-05647
|
10.24
|
February 25, 2015
|
|||||
|
10.33
+
|
Amendment Five to the PIP
|
10-Q
|
001-05647
|
10.6
|
July 28, 2015
|
|||||
|
10.34
+*
|
Amendment Six to the PIP
|
|||||||||
|
10.35
+
|
Mattel, Inc. 2005 Equity Compensation Plan (the “2005 Plan”)
|
DEF 14A
|
001-05647
|
Appendix C
|
April 13, 2005
|
|||||
|
10.36
+
|
Amendment No. 1 to the 2005 Plan
|
10-K
|
001-05647
|
10.76
|
February 26, 2009
|
|||||
|
10.37
+
|
Amendment No. 2 to the 2005 Plan
|
10-Q
|
001-05647
|
10.1
|
April 29, 2009
|
|||||
|
10.38
+
|
Amendment No. 3 to the 2005 Plan
|
10-Q
|
001-05647
|
10.8
|
October 24, 2013
|
|||||
|
10.39
+
|
Mattel, Inc. 2010 Equity and Long-Term Compensation Plan (the “2010 Plan”)
|
DEF 14A
|
001-05647
|
Appendix A
|
March 30, 2010
|
|||||
|
10.40
+
|
Amendment No. 1 to the 2010 Plan
|
10-Q
|
001-05647
|
10.9
|
October 24, 2013
|
|||||
102
|
|
|
Incorporated by Reference
|
||||||||
|
Exhibit No.
|
Exhibit Description
|
Form
|
File No.
|
Exhibit(s)
|
Filing Date
|
|||||
|
10.41
+
|
Mattel, Inc. Amended and Restated 2010 Equity and Long-Term Compensation Plan (the "Amended 2010 Plan")
|
DEF 14A
|
001-05647
|
Appendix A
|
April 9, 2015
|
|||||
|
10.42
+
|
Form of Grant Agreement as of May 17, 2007 for grants of Non-Qualified Stock Options ("NQSOs") to employees under the 2005 Plan
|
8-K
|
001-05647
|
99.0
|
May 18, 2007
|
|||||
|
10.43
+
|
Form of Grant Agreement as of May 17, 2007 for grants of NQSOs to Non-Employee Directors under the 2005 Plan
|
8-K
|
001-05647
|
99.8
|
May 18, 2007
|
|||||
|
10.44
+
|
Form of Grant Agreement for August 1, 2007 grant of NQSOs to Kevin M. Farr under the 2005 Plan
|
8-K
|
001-05647
|
99.3
|
May 18, 2007
|
|||||
|
10.45
+
|
Form of Notice of Grant and Grant Agreement for grants of Restricted Stock Units ("RSUs") to Non-Employee Directors under the 2010 Plan
|
10-Q
|
001-05647
|
10.1
|
July 28, 2010
|
|||||
|
10.46
+
|
Form of Notice of Grant and Grant Agreement for grants of NQSOs to employees under the 2010 Plan
|
10-Q
|
001-05647
|
10.1
|
October 27, 2010
|
|||||
|
10.47
+
|
Form of Notice of Grant and Grant Agreement for grants of RSUs to employees under the 2010 Plan
|
10-Q
|
001-05647
|
10.2
|
October 27, 2010
|
|||||
|
10.48
+
|
Form of Grant Agreement for grants of Long-Term Incentive Program performance-based RSUs ("Performance Units") under the 2010 Plan to certain Executive Officers with employment agreements and participants in the Executive Severance Plan
|
10-Q
|
001-05647
|
10.1
|
April 27, 2011
|
|||||
|
10.49
+
|
Form of Grant Agreement for grants of Performance Units to senior executives under the 2010 Plan
|
10-Q
|
001-05647
|
10.2
|
April 27, 2011
|
|||||
|
10.50
+
|
Form of Notice of Grant and Grant Agreement for grants of NQSOs to certain Executive Officers with employment agreements under the 2010 Plan
|
10-Q
|
001-05647
|
10.5
|
October 27, 2010
|
|||||
|
10.51
+
|
Form of Notice of Grant and Grant Agreement for grants of NQSOs to participants in the Executive Severance Plan under the 2010 Plan
|
10-Q
|
001-05647
|
10.6
|
October 27, 2010
|
|||||
|
10.52
+
|
Form of Grant Agreement for grants of RSUs to participants in the Executive Severance Plan under the Amended 2010 Plan
|
10-Q
|
001-05647
|
10.4
|
October 27, 2015
|
|||||
|
10.53
+
|
Form of Grant Agreement for grants of RSUs to participants in the Executive Severance Plan B under the Amended 2010 Plan
|
10-Q
|
001-05647
|
10.5
|
October 27, 2015
|
|||||
|
10.54
+
|
Form of Grant Agreement for grants of RSUs to employees under the Amended 2010 Plan
|
10-Q
|
001-05647
|
10.6
|
October 27, 2015
|
|||||
|
10.55
+
|
Form of Grant Agreement for grants of NQSOs to participants in the Executive Severance Plan under the Amended 2010 Plan
|
10-Q
|
001-05647
|
10.7
|
October 27, 2015
|
|||||
|
10.56
+
|
Form of Grant Agreement for grants of NQSOs to participants in the Executive Severance Plan B under the Amended 2010 Plan
|
10-Q
|
001-05647
|
10.8
|
October 27, 2015
|
|||||
|
10.57
+
|
Form of Grant Agreement for grants of NQSOs to employees under the Amended 2010 Plan
|
10-Q
|
001-05647
|
10.9
|
October 27, 2015
|
|||||
|
10.58
+
|
Form of Grant Agreement for grants of Performance Units to participants in the Executive Severance Plans under the Amended 2010 Plan
|
10-Q
|
001-05647
|
10.1
|
April 28, 2016
|
|||||
103
|
|
|
Incorporated by Reference
|
||||||||
|
Exhibit No.
|
Exhibit Description
|
Form
|
File No.
|
Exhibit(s)
|
Filing Date
|
|||||
|
10.59
+
|
Form of Grant Agreement for grants of Performance Units to senior executives under the Amended 2010 Plan
|
10-Q
|
001-05647
|
10.2
|
April 28, 2016
|
|||||
|
10.60
+
|
Form of Grant Agreement for grants of RSUs to Non-Employee Directors under the Amended 2010 Plan
|
10-Q
|
001-05647
|
10.1
|
July 28, 2016
|
|||||
|
10.61
+
*
|
Notice of Grant and Grant Agreement for February 8, 2017 make-whole grant of RSUs to Margaret H. Georgiadis under the Amended 2010 Plan
|
|||||||||
|
10.62
+
*
|
Notice of Grant and Grant Agreement for February 8, 2017 new-hire grant of RSUs to Margaret H. Georgiadis under the Amended 2010 Plan
|
|||||||||
|
10.63
+
*
|
Notice of Grant and Grant Agreement for February 8, 2017 new-hire grant of NQSOs to Margaret H. Georgiadis under the Amended 2010 Plan
|
|||||||||
|
12.0*
|
Computation of Earnings to Fixed Charges
|
|||||||||
|
21.0*
|
Subsidiaries of the Registrant as of December 31, 2016
|
|||||||||
|
23.0*
|
Consent of Independent Registered Public Accounting Firm
|
|||||||||
|
24.0*
|
Power of Attorney (on page 106 of Form 10-K)
|
|||||||||
|
31.0*
|
Certification of Principal Executive Officer dated February 23, 2017 pursuant to Section 302 of the Sarbanes-Oxley Act of 2002
|
|||||||||
|
31.1*
|
Certification of Principal Financial Officer dated February 23, 2017 pursuant to Section 302 of the Sarbanes-Oxley Act of 2002
|
|||||||||
|
32.0**
|
Certification of Principal Executive Officer and Principal Financial Officer dated February 23, 2017, pursuant to 18 U.S.C. Section 1350, as adopted pursuant to Section 906 of the Sarbanes-Oxley Act of 2002
|
|||||||||
|
101.INS*
|
XBRL Instance Document
|
|||||||||
|
101.SCH*
|
XBRL Taxonomy Extension Schema Document
|
|||||||||
|
101.CAL*
|
XBRL Taxonomy Extension Calculation Linkbase Document
|
|||||||||
|
101.DEF*
|
XBRL Taxonomy Extension Definition Linkbase Document
|
|
|
|
||||||
|
101.LAB*
|
XBRL Taxonomy Extension Label Linkbase Document
|
|
|
|
||||||
|
101.PRE*
|
XBRL Taxonomy Extension Presentation Linkbase Document
|
|
|
|
||||||
+
Management contract or compensatory plan or arrangement.
*
Filed herewith.
**
Furnished herewith. This exhibit should not be deemed to be “filed” for purposes of Section 18 of the Exchange Act.
104
Mattel has not filed certain long-term debt instruments under which the principal amount of securities authorized to be issued does not exceed 10% of its total assets. Copies of such agreements will be provided to the SEC upon request.
(b) Exhibits Required by Item 601 of Regulation S-K
See Item (a)(3) above.
(c) Financial Statement Schedule
See Item (a)(2) above.
Copies of this Annual Report on Form 10-K (including Exhibit 24.0) and Exhibits 12.0, 21.0, 23.0, 31.0, 31.1, and 32.0 are available to stockholders of Mattel without charge. Written requests should be sent to: Secretary, Mail Stop M1-1516, Mattel, Inc., 333 Continental Blvd., El Segundo, California 90245-5012.
105
SIGNATURE
Pursuant to the requirements of Section 13 or 15(d) of the Securities Exchange Act of 1934, the registrant has duly caused this report to be signed on its behalf by the undersigned, thereunto duly authorized.
|
MATTEL, INC.
Registrant
|
|||
|
By:
|
|
/s/ K
EVIN
M. F
ARR
|
|
|
|
Kevin M. Farr
Chief Financial Officer
|
||
Date:
February 23, 2017
106
POWER OF ATTORNEY
KNOW ALL PERSONS BY THESE PRESENTS, that we, the undersigned directors and officers of Mattel, Inc., do hereby severally constitute and appoint Robert Normile, Tiffani L. Magri, and Margaret H. Georgiadis, and each of them, our true and lawful attorneys-in-fact and agents, each with full powers of substitution, to do any and all acts and things in our name and behalf in our capacities as directors and officers and to execute any and all instruments for us and in our names in the capacities indicated below, which said attorneys-in-fact and agents, or any of them, may deem necessary or advisable to enable Mattel, Inc. to comply with the Securities Exchange Act of 1934, as amended, and any rules, regulations and requirements of the Securities and Exchange Commission, in connection with this Annual Report on Form 10-K, including specifically, but without limitation, power and authority to sign for us or any of us, in our names in the capacities indicated below, any and all amendments hereto; and we do each hereby ratify and confirm all that said attorneys-in-fact and agents or their substitutes, or any one of them, shall do or cause to be done by virtue hereof.
Pursuant to the requirements of the Securities Exchange Act of 1934, this report has been signed below by the following persons on behalf of the registrant and in the capacities and on the dates indicated.
|
Signature
|
|
Title
|
|
Date
|
|
/
S
/ M
ARGARET
H. G
EORGIADIS
|
|
Chief Executive Officer
(principal executive officer)
|
|
February 23, 2017
|
|
Margaret H. Georgiadis
|
||||
|
/
S
/ K
EVIN
M. F
ARR
|
|
Chief Financial Officer
(principal financial officer)
|
|
February 23, 2017
|
|
Kevin M. Farr
|
||||
|
/
S
/ J
OSEPH
B. J
OHNSON
|
|
Senior Vice President and Corporate Controller (principal accounting officer)
|
|
February 23, 2017
|
|
Joseph B. Johnson
|
||||
|
/
S
/ C
HRISTOPHER
A. S
INCLAIR
|
Executive Chairman of the Board
|
February 23, 2017
|
||
|
Christopher A. Sinclair
|
||||
|
/
S
/ M
ICHAEL
J. D
OLAN
|
|
Director
|
|
February 23, 2017
|
|
Michael J. Dolan
|
||||
|
/
S
/ T
REVOR
A. E
DWARDS
|
|
Director
|
|
February 23, 2017
|
|
Trevor A. Edwards
|
||||
|
/
S
/ D
R
. F
RANCES
D. F
ERGUSSON
|
|
Director
|
|
February 23, 2017
|
|
Dr. Frances D. Fergusson
|
||||
|
/
S
/ A
NN
L
EWNES
|
Director
|
February 23, 2017
|
||
|
Ann Lewnes
|
||||
|
/
S
/ D
OMINIC
N
G
|
Director
|
February 23, 2017
|
||
|
Dominic Ng
|
||||
|
/
S
/ V
ASANT
M. P
RABHU
|
Director
|
February 23, 2017
|
||
|
Vasant M. Prabhu
|
||||
|
/
S
/ D
EAN
A. S
CARBOROUGH
|
Director
|
February 23, 2017
|
||
|
Dean A. Scarborough
|
||||
|
/
S
/ D
IRK
V
AN
D
E
P
UT
|
Director
|
February 23, 2017
|
||
|
Dirk Van de Put
|
||||
|
/
S
/ K
ATHY
W
HITE
L
OYD
|
Director
|
February 23, 2017
|
||
|
Kathy White Loyd
|
||||
107
SCHEDULE II
MATTEL, INC. AND SUBSIDIARIES
VALUATION AND QUALIFYING ACCOUNTS AND ALLOWANCES
|
Balance at Beginning of Year
|
Additions Charged to Operations
|
Net Deductions and Other
|
Balance at End of Year
|
||||||||||||
|
|
(In thousands)
|
||||||||||||||
|
Allowance for Doubtful Accounts:
|
|||||||||||||||
|
Year Ended December 31, 2016
|
$
|
24,370
|
|
$
|
9,165
|
|
|
$
|
(12,159
|
)
|
(a)
|
$
|
21,376
|
|
|
|
Year Ended December 31, 2015
|
$
|
26,283
|
|
$
|
5,813
|
|
|
$
|
(7,726
|
)
|
(a)
|
$
|
24,370
|
|
|
|
Year Ended December 31, 2014
|
$
|
20,416
|
|
$
|
11,507
|
|
|
$
|
(5,640
|
)
|
(a)
|
$
|
26,283
|
|
|
|
Allowance for Inventory Obsolescence:
|
|||||||||||||||
|
Year Ended December 31, 2016
|
$
|
45,715
|
|
$
|
31,455
|
|
|
$
|
(40,394
|
)
|
(b)
|
$
|
36,776
|
|
|
|
Year Ended December 31, 2015
|
$
|
46,899
|
|
$
|
33,305
|
|
|
$
|
(34,489
|
)
|
(b)
|
$
|
45,715
|
|
|
|
Year Ended December 31, 2014
|
$
|
49,113
|
|
$
|
39,235
|
|
|
$
|
(41,449
|
)
|
(b)
|
$
|
46,899
|
|
|
|
Income Tax Valuation Allowances:
|
|||||||||||||||
|
Year Ended December 31, 2016
|
$
|
77,334
|
|
$
|
15,772
|
|
(d)
|
$
|
(18,981
|
)
|
(c)
|
$
|
74,125
|
|
|
|
Year Ended December 31, 2015
|
$
|
133,297
|
|
$
|
8,161
|
|
|
$
|
(64,124
|
)
|
(c)
|
$
|
77,334
|
|
|
|
Year Ended December 31, 2014
|
$
|
64,641
|
|
$
|
73,497
|
|
|
$
|
(4,841
|
)
|
(c)
|
$
|
133,297
|
|
|
|
(a)
|
Includes write-offs, recoveries of previous write-offs, and currency translation adjustments.
|
|
(b)
|
Primarily relates to the disposal of related inventory and raw materials and currency translation adjustments.
|
|
(c)
|
Primarily represents projected utilization and write-offs of loss carryforwards and certain deferred tax assets for 2016; projected utilization and write-offs of loss carryforwards and certain deferred tax assets for 2015; and projected utilization and write-offs of loss carryforwards for 2014.
|
|
(d)
|
Primarily represents increases related to losses without benefit and certain deferred tax assets.
|
108
TABLE OF CONTENTS
Part IItem 1. BusinessItem 1A. Risk FactorsItem 1B. Unresolved Staff CommentsItem 2. PropertiesItem 3. Legal ProceedingsItem 4. Mine Safety DisclosuresPart IIItem 5. Market For The Registrant's Common Equity, Related Stockholder Matters and Issuer Purchases Of Equity SecuritiesItem 6. Selected Financial DataItem 7. Management's Discussion and Analysis Of Financial Condition and Results Of OperationsItem 7A. Quantitative and Qualitative Disclosures About Market RiskItem 8. Financial Statements and Supplementary DataNote 1 Summary Of Significant Accounting PoliciesNote 2 Goodwill and Other IntangiblesNote 3 Income TaxesNote 4 Employee Benefit PlansNote 5 Seasonal Financing and DebtNote 6 Stockholders EquityNote 7 Share-based PaymentsNote 8 Earnings Per ShareNote 9 Derivative InstrumentsNote 10 Fair Value MeasurementsNote 11 Commitments and ContingenciesNote 12 Segment InformationNote 13 Supplemental Financial InformationNote 14 Quarterly Financial Information (unaudited)Note 15 Subsequent EventItem 9. Changes in and Disagreements with Accountants on Accounting and Financial DisclosureItem 9A. Controls and ProceduresItem 9B. Other InformationPart IIIItem 10. Directors, Executive Officers and Corporate GovernanceItem 11. Executive CompensationItem 12. Security Ownership Of Certain Beneficial Owners and Management and Related Stockholder MattersItem 13. Certain Relationships and Related Transactions, and Director IndependenceItem 14. Principal Accountant Fees and ServicesPart IVItem 15. Exhibits and Financial Statement Schedules