MALIBU BOATS, INC.
10-Ks and 10-Qs
|
|
|
|
|
|
|
|
|
|
|
|
|
|
|
|
|
|
|
|
|
|
|
|
|
|
|
|
|
|
|
|
|
|
|
|
|
|
|
|
|
UNITED STATES
SECURITIES AND EXCHANGE COMMISSION
Washington, D.C. 20549
FORM 10-K
ANNUAL REPORT PURSUANT TO SECTION 13 OR 15(d) OF THE
SECURITIES EXCHANGE ACT OF 1934
For the fiscal year ended
June 30, 2014
Commission file number: 001-36290

MALIBU BOATS, INC.
(Exact Name of Registrant as specified in its charter)
|
Delaware
|
5075 Kimberly Way
Loudon, Tennessee 37774 |
46-4024640
|
||
|
(State or other jurisdiction of
incorporation or organization)
|
(Address of principal executive offices,
including zip code)
|
(I.R.S. Employer
Identification No.)
|
||
|
(865) 458-5478
|
||||
|
(Registrant’s telephone number,
including area code)
|
||||
|
Securities Registered Pursuant to Section 12(b) of the Act:
|
||
|
Title of each class
|
Name of each exchange on which registered
|
|
|
Class A Common Stock ($0.01 par value per share)
|
NASDAQ Global Select Market
|
|
Indicate by check mark if the registrant is a well-known seasoned issuer, as defined in Rule 405 of the Securities Act. Yes
¨
No
þ
Indicate by check mark if the registrant is not required to file reports pursuant to Section 13 or Section 15(d) of the Act. Yes
¨
No
þ
Indicate by check mark whether the registrant (1) has filed all reports required to be filed by Section 13 or 15(d) of the Securities Exchange Act of 1934 during the preceding 12 months (or for such shorter period that the registrant was required to file such reports), and (2) has been subject to such filing requirements for the past 90 days. Yes
þ
No
¨
Indicate by check mark whether the registrant has submitted electronically and posted on its corporate Web site, if any, every Interactive Data File required to be submitted and posted pursuant to Rule 405 of Regulation S-T (§232.405 of this chapter) during the preceding 12 months (or for such shorter period that the registrant was required to submit and post such files). Yes
þ
No
¨
Indicate by check mark if disclosure of delinquent filers pursuant to Item 405 of Regulation S-K is not contained herein, and will not be contained, to the best of registrant's knowledge, in the definitive proxy or information statements incorporated by reference in Part III of this Form 10-K or any amendment to this Form 10-K.
¨
Indicate by check mark whether the registrant is a large accelerated filer, an accelerated filer, a non-accelerated filer, or a smaller reporting company. See the definitions of “large accelerated filer,” “accelerated filer” and “smaller reporting company” in Rule 12b-2 of the Exchange Act. (Check one):
Large accelerated filer
¨
Accelerated filer
¨
Non-accelerated filer
þ
Smaller reporting company
¨
Indicate by check mark whether the registrant is a shell company (as defined in Rule 12b-2 of the Exchange Act). Yes
¨
No
þ
As of December 31, 2013, the last business day of the registrant’s most recently completed second fiscal quarter, there was no established public market for the registrant’s common stock. The registrant’s Class A common stock began trading on the NASDAQ Global Select Market on January 31, 2014. As of
June 30, 2014
, the aggregate value of the registrant’s common stock held by non-affiliates was approximately $114.8 million, based on the number of shares of Class A common stock held by non-affiliates as of
June 30, 2014
and the closing price of the registrant’s Class A common stock on the NASDAQ Global Select Market on
June 30, 2014
. Shares held by each executive officer, director and by each person who owns 10% or more of the outstanding Class A common stock have been excluded in that such persons may be deemed to be affiliates. This determination of affiliate status is not necessarily a conclusive determination for other purposes. The number of outstanding shares of the registrant’s Class A common stock, par value $0.01 per share, and Class B common stock, par value $0.01, as of
September 24, 2014
was 15,436,094 and 43, respectively.
DOCUMENTS INCORPORATED BY REFERENCE
Portions of the registrant’s Proxy Statement for the
2014
Annual Meeting of Stockholders are incorporated into Part III of this Annual Report on Form 10-K where indicated. Such proxy statement will be filed with the Securities and Exchange Commission within 120 days of the registrant’s fiscal year ended
June 30, 2014
.
1
TABLE OF CONTENTS
|
|
Page
|
|
1
SPECIAL NOTE REGARDING FORWARD-LOOKING STATEMENTS
This Annual Report on Form 10-K contains forward-looking statements. All statements other than statements of historical facts contained in this Form 10-K are forward-looking statements, including statements regarding our future financial position, sources of revenue, demand for our products, our strengths, business strategy and plans, prospective products or products under development, costs, timing and likelihood of success, gross margins, non-GAAP financial measures and management’s objectives for future operations. In particular, many of the statements under the headings “Item 1A. Risk Factors,” “Item 7. Management’s Discussion and Analysis of Financial Condition and Results of Operations” and “Item 1. Business” constitute forward-looking statements. In some cases, you can identify forward-looking statements by terminology such as “may,” “will,” “should,” “expects,” “plans,” “anticipates,” “believes,” “estimates,” “predicts,” “potential,” “continue,” the negative of these terms, or by other similar expressions that convey uncertainty of future events or outcomes to identify these forward-looking statements. These statements are only predictions, involving known and unknown risks, uncertainties and other factors that may cause our or our industry’s actual results, levels of activity, performance or achievements to be materially different from any future results, levels of activity, performance or achievements expressed or implied by these forward-looking statements. Such factors include general economic conditions; significant fluctuations in our annual and quarterly financial results; our reliance on our network of independent dealers and increasing competition for dealers; the financial health of our dealers and their continued access to financing; our obligation to repurchase inventory of certain dealers; our failure to manage our manufacturing levels while addressing the seasonal retail pattern for our products; our large fixed cost base; intense competition within our industry; increased consumer preference for used boats or the supply of new boats by competitors in excess of demand; the successful introduction of new products; competition with other activities for consumers’ scarce leisure time; the continued strength of our brands; our ability to execute our manufacturing strategy successfully; our ability to meet our manufacturing workforce needs; our reliance on third-party suppliers and ability to obtain adequate raw materials and components; our dependence on key personnel; our ability to grow our business through acquisitions or strategic alliances and new partnerships; our ability to protect our intellectual property; our exposure to claims for product liability and warranty claims; risks inherent in operating in foreign jurisdictions; an increase in energy costs; any failure to comply with laws and regulations including environmental and other regulatory requirements; a natural disaster or other disruption at our manufacturing facilities; increases in income tax rates or changes in income tax laws; our status as an “emerging growth company”; and increased costs as a result of being a new public company.
We discuss many of these factors, risks and uncertainties in greater detail under the heading “Item 1A. Risk Factors” and elsewhere in this Form 10-K. These factors expressly qualify as forward-looking statements attributable to us or persons acting on our behalf.
You should not rely on forward-looking statements as predictions of future events. Although we believe that the expectations reflected in the forward-looking statements are reasonable, we cannot guarantee future results, levels of activity, performance or achievements. Actual results may differ materially from those suggested by the forward-looking statements for various reasons, including those discussed under “Item 1A. Risk Factors” in this Form 10-K. Except as required by law, we assume no obligation to update forward-looking statements for any reason after the date of this Form 10-K to conform these statements to actual results or to changes in our expectations.
2
Unless otherwise expressly indicated or the context otherwise requires, in this Annual Report on Form 10-K:
|
•
|
we use the terms “Malibu Boats,” the “Company,” “we,” “us,” “our” or similar references to refer (1) prior to the consummation of the initial public offering, or IPO, to Malibu Boats Holdings, LLC, or the LLC, and its consolidated subsidiaries and (2) after the IPO, to Malibu Boats, Inc. and its consolidated subsidiaries;
|
|
•
|
we refer to the owners of membership interests in the LLC immediately prior to the consummation of the IPO, collectively, as our “pre-IPO owners”;
|
|
•
|
we refer to owners of membership interests in the LLC (the "LLC Units"), collectively, as our “LLC members”;
|
|
•
|
references to “fiscal year” refer to the fiscal year of Malibu Boats, which ends on June 30. Fiscal years 2012 and 2013 for the LLC ended on June 30, 2012 and 2013, respectively. Fiscal year 2014 ended on June 30, 2014;
|
|
•
|
we use the term “performance sport boat category” to refer to our industry category, primarily consisting of fiberglass boats equipped with inboard propulsion and ranging from 19 feet to 26 feet in length, which we believe most closely corresponds to (1) the inboard ski/wakeboard category, as defined and tracked by the National Marine Manufacturers Association, or NMMA, and (2) the inboard skiboat category, as defined and tracked by Statistical Surveys, Inc., or SSI; and
|
|
•
|
references to certain market and industry data presented in this Form 10-K are determined as follows: (1) U.S. boat sales and unit volume for the overall powerboat industry and any powerboat category during any calendar year are based on retail boat market data from the NMMA; (2) U.S. market share and unit volume for the overall powerboat industry and any powerboat category during any fiscal year ended June 30 or any calendar year ended December 31 are based on comparable same-state retail boat registration data from SSI, as reported by the 50 states for which data was available as of the date of this Form 10-K; and (3) market share among U.S. manufacturers of exports to international markets of boats in any powerboat category for any period is based on data from the Port Import Export Reporting Service, available through
June 30, 2014
, and excludes such data for Australia and New Zealand.
|
This Annual Report on Form 10-K includes our trademarks, such as “Surf Gate” and “Wakesetter,” which are protected under applicable intellectual property laws and are the property of Malibu Boats. This Form 10-K also contains trademarks, service marks, trade names and copyrights of other companies, which are the property of their respective owners. Solely for convenience, trademarks and trade names referred to in this Form 10-K may appear without the
®
or TM symbols, but such references are not intended to indicate, in any way, that we will not assert, to the fullest extent under applicable law, our rights or the right of the applicable licensor to these trademarks and trade names.
Our Company
We are a leading designer, manufacturer and marketer of performance sport boats, having the #1 market share position in the United States since 2010. Our boats are used for water sports, including water skiing, wakeboarding and wake surfing, as well as general recreational boating. Since inception in 1982, we believe we have been a consistent innovator in the powerboat industry, designing products that appeal to an expanding range of recreational boaters and water sports enthusiasts whose passion for boating and water sports is a key aspect of their lifestyle. We believe many of our innovations, such as our proprietary Surf Gate technology launched in 2012, expand the market for our products by introducing consumers to new and exciting recreational activities. We believe that our boats are increasingly versatile, allowing consumers to use them for a wide range of activities that enhance the experience of a day on the water with family and friends. While there is no guarantee that we will achieve market share growth in the future, we believe that the performance, quality, value and multi-purpose features of our boats position us to achieve our goal of increasing our market share in the expanding recreational boating market.
We sell our high performance boats under two brands-Malibu and Axis Wake Research, or Axis. Our flagship Malibu brand boats offer our latest innovations in performance, comfort and convenience, and are designed for consumers seeking a premium boating experience. Retail prices of our Malibu boats typically range from $55,000 to $125,000. We launched our Axis brand of boats in 2009 to appeal to consumers who desire a more affordable product but still demand high performance, functional simplicity and the option to upgrade key features. Retail prices of our Axis boats typically range from $45,000 to $85,000.
All of our boats are built and tested at our corporate headquarters near Knoxville, Tennessee. Our boats are constructed of fiberglass, equipped with inboard propulsion systems and available in a range of sizes and hull designs. We employ experienced
3
product development and engineering teams that enable us to offer a range of models across each of our brands while consistently introducing innovative features in our product offerings. Our engineering team closely collaborates with our manufacturing personnel in order to improve product quality and process efficiencies. The results of this collaboration are reflected in our receipt of numerous industry awards, including the Watersports Industry Association’s Innovation of the Year in 2010 and 2013.
We sell our boats through a dealer network that we believe is the strongest in the performance sport boat category. As of
June 30, 2014
, our distribution channel consisted of
118
independent dealers in North America operating in
143
locations in North America and
52
independent dealer locations across
36
countries outside of North America. Our boats are the exclusive performance sport boats offered by the majority of our dealers. Additionally, we have an exclusive licensee in Australia that we believe is the largest performance sport boat manufacturer in that country. Our dealer base is an important part of our consumers’ experience, our marketing efforts and our brands. We devote significant time and resources to find, develop and improve the performance of our dealers and believe our dealer network gives us a distinct competitive advantage.
Our Market Opportunity
During calendar year 2013, retail sales of new powerboats in the United States totaled $6.5 billion. Of the powerboat categories defined and tracked by the NMMA, our core market corresponds most directly to the inboard ski/wakeboard category, which we refer to as the performance sport boat category. We believe our addressable market also includes similar and adjacent powerboat categories identified by the NMMA, which totaled over $4.4 billion of sales in 2013. The following table illustrates the size of our addressable market in units and retail sales for calendar year 2013:
|
Powerboat Category
|
Unit Sales
|
Retail Sales
|
|||||
|
(Dollars in millions)
|
|||||||
|
Outboard
|
134,800
|
|
$
|
2,961
|
|
||
|
Sterndrive
|
15,100
|
|
895
|
|
|||
|
Performance sport boat
|
6,100
|
|
470
|
|
|||
|
Jet boat
|
3,000
|
|
113
|
|
|||
|
Total addressable market
|
159,000
|
|
$
|
4,439
|
|
||
We believe we are well-positioned to benefit from several trends underway in our addressable market, including:
Improving Macroeconomic Environment Driving Increased Consumer Demand for Boats
. Following the economic downturn, the recreational boating industry has grown and is projected to continue to recover. While domestic sales of new performance sport boats in 2013 grew to approximately
6,100
units, they remained
53%
below the category’s 2006 sales volume of
13,100
. IBIS World projects that total U.S. powerboat manufacturer sales will grow at a compound annual growth rate, or CAGR, of 6.5% from 2012 to 2017. While there is no guarantee that these projected growth rates will be achieved in the future, we believe the recreational boating industry has significant opportunity for growth from increased consumer demand and will continue to benefit from improved economic conditions.
Improved Dealer Inventory Positions
. Boat manufacturers in our addressable market and industry-wide have been focused on clearing aged inventory from the retail channel over the past few years, driving the current inventory of new boats that are over a year old at dealerships to normalized and healthy levels. If retail sales levels continue to improve, we expect our dealers to place more wholesale orders from us in order to meet this demand. Lower dealer inventory positions also mitigate the potential effects of a decline in retail sales on wholesale volumes.
Increasing Ages of Used Boats Driving New Boat Sales
. In 2013, new powerboats accounted for approximately one out of six powerboat sales in the United States compared to an average of approximately one out of four between 2002 and 2008. We believe the shift toward purchasing more used boats during the economic downturn helped cause the average age of powerboats in use to increase from 15 years in 1997 to over 20 years today. As the powerboat industry continues its ongoing recovery and older boats reach the end of their usable lives, we expect consumer purchases of new boats to shift back toward historic levels benefiting new boat manufacturers.
Our Strengths
#1 Market Share Position in Performance Sport Boat Category
. We held the number one market share position, based on unit volume, in the United States among manufacturers of performance sport boats for calendar years 2010, 2011, 2012 and 2013. We have grown our U.S. market share from
23.1%
in 2008, the year prior to the arrival of our current Chief Executive
4
Officer and Chief Financial Officer, to
32.8%
in 2013. The following table reflects our U.S. market share in the performance sport boat category compared to the market share of our competitors for the periods shown:
|
U.S. Market Share in Performance Sport Boat Category
|
||||||||||||||||||
|
Manufactuer/Brand(s)
|
2008
|
2009
|
2010
|
2011
|
2012
|
2013
|
||||||||||||
|
Malibu Boats/Malibu and Axis
|
23.1
|
%
|
23.4
|
%
|
24.2
|
%
|
28.7
|
%
|
30.6
|
%
|
32.8
|
%
|
||||||
|
MasterCraft Boat Company, LLC/MasterCraft
|
23.8
|
|
24.7
|
|
23.4
|
|
24.3
|
|
21.9
|
|
20.0
|
|
||||||
|
Correct Craft, Inc./Nautique
|
15.2
|
|
13.9
|
|
16.0
|
|
14.8
|
|
14.7
|
|
15.8
|
|
||||||
|
Skier's Choice, Inc./Supra and Moomba
|
16.6
|
|
15.6
|
|
16.5
|
|
15.5
|
|
14.6
|
|
12.6
|
|
||||||
|
All others
|
21.3
|
|
22.4
|
|
19.9
|
|
16.7
|
|
18.2
|
|
18.8
|
|
||||||
|
Total
|
100
|
%
|
100
|
%
|
100
|
%
|
100
|
%
|
100
|
%
|
100
|
%
|
||||||
In addition, our
33%
market share of performance sport boat exports to international markets for the 12 months ended
June 30, 2014
was the second highest among U.S. manufacturers.
Performance Sport Boat Category Taking Share.
As the recovery in the general economy and overall powerboat industry has continued, the performance sport boat category in which we participate has experienced one of the highest growth rates. New unit sales of performance sport boats in the United States increased by
13%
from 2011 to 2012, while new unit sales of all other powerboats in the United States increased
10%
over the same period. This trend continued in 2013, as new unit sales of performance sport boats and all other powerboats in the United States increased by
11%
and
2%
, respectively, for the year ended December 31, 2013. We believe this is largely attributable to increased innovation in the features, designs and layouts of performance sport boats, which has improved the performance, functionality and versatility of these boats versus other recreational powerboats, particularly the larger category of sterndrive boats. We believe that we have been at the forefront of product innovation and will continue to appeal to a broader consumer base that values our boats not only for water sports, but also for general recreational boating and leisure activities. We believe that our market-leading position within our expanding category will create continued growth opportunities for us.
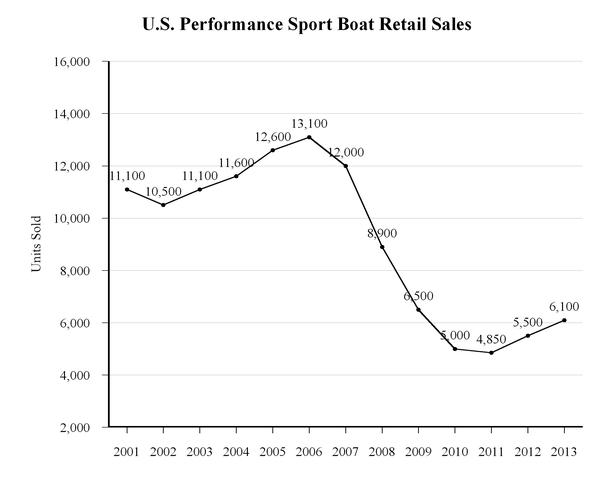
Poised to Take Advantage of the Performance Sport Boat Market Recovery.
With our leading and growing market share in our category, we believe that we are well-positioned to take advantage of the ongoing recovery in the powerboat market. While the performance sport boat category grew
11%
in 2013, new unit sales remained significantly below historical peaks. As illustrated in the chart below, the
6,100
new units sold in calendar year 2013 were
48%
below the average annual new unit sales volume of
11,714
observed between 2001 and 2007 and
53%
below the
13,100
new units sold in 2006. While there is no guarantee that the market will continue to grow or return to historical sales levels, we believe we are in the early stages of a recovery that presents significant opportunity for growth.
5
Even if the performance sport boat market does not reach previous peak levels, we believe that our #1 market share position in a category that is growing faster than the overall powerboat industry, our investments in the Company during and subsequent to the economic downturn, and our innovative product offering should drive superior performance.
Industry-leading Product Design and Innovation.
We believe that our innovation in the design of new boat models and new features has been a key to our success, helping us increase our market share within our category and generally broaden the appeal of our products among recreational boaters. As a result of the features we have introduced, we believe that our boats are used for an increasingly wide range of activities and are increasingly easier to use, while maintaining the high performance characteristics that consumers expect. Additionally, by introducing new boat models in a range of price points, sizes, bow and hull designs, and optional performance features, we have enhanced consumers’ ability to select a boat suited to their individual preferences. Our commitment to, and consistency in, developing new boat models and introducing new features are reflected in several notable achievements, including:
|
•
|
release of our patented Surf Gate technology in 2012, which allows users to surf on either side of the boat’s wake, generates a better quality surf wave and was the Watersports Industry Association’s Innovation of the Year in 2013;
|
|
•
|
launch of the Axis brand of boats in 2009, designed from the ground up to be an entry-level product, which has already captured a 6.4% share of the U.S. market in our category as of December 31, 2013;
|
|
•
|
introduction of the patented Power Wedge in 2006, which gives boaters the ability to customize the size and shape of the boat’s wake with the push of a button; and
|
|
•
|
a strong new product lineup for model year 2015 that includes the redesign of the Malibu Wakesetter VLX and the Axis A22. In addition, on our model year 2015 Malibu products, we will offer an enhanced touchscreen dash, an improved Power Wedge and an optional, all machined aluminum G4 tower.
|
Strong Dealer Network.
We have worked diligently with our dealers to develop the strongest distribution network in the performance sport boat category. We believe that our distribution network of
143
North American dealer locations and
52
international dealer locations as of June 30, 2014 allows us to distribute our products more broadly and effectively than our
6
competitors. For fiscal year 2013 our dealers held the #1 market share position for the performance sport boat category in 75 of 133 U.S. markets. We have nominal dealer concentration, with our largest dealer responsible for less than
4.7%
and
6.0%
of our unit volume for fiscal year
2014
and fiscal year
2013
and our top ten dealers representing
34.1%
and
36.1%
of our unit volume for fiscal year
2014
and fiscal year
2013
, respectively. We continually review our geographic coverage to identify opportunities for expansion and improvement, and have added 35 new North American dealer locations in the past six fiscal years to address previously underserved markets. In addition, we have strengthened our dealer network by replacing 37 dealer locations in the past six fiscal years, 19 of which were converted from selling one of our competitor’s products.
Highly Recognized Brands.
We believe our Malibu and Axis brands are widely recognized in the powerboat industry, which helps us reach a growing number of target consumers. For over 30 years, our Malibu brand has generated a loyal following of recreational boaters and water sports enthusiasts who value the brand’s premium performance and features. Our Axis brand has grown rapidly as consumers have been drawn to its more affordable price point and available optional features. We believe that the appeal of our high performance and innovative products with athletes and enthusiasts contributes to our brand awareness with dealers and with consumers. We are able to build on this brand recognition and support through a series of marketing initiatives coordinated with our dealers or executed directly by us. Many of our marketing efforts are conducted on a grass-roots level domestically and internationally. Key grass-roots initiatives include: production and distribution of water sports videos; online and social marketing; on-the-water events; athlete, tournament and water sport facility sponsorships; and participation and product placement at important industry events. Additionally, our boats, their innovative features, our sponsored athletes and our dealers all frequently win industry awards, which we believe further boosts our brand recognition and reputation for excellence. We believe our marketing strategies and accomplishments enhance our profile in the industry, strengthen our credibility with consumers and dealers and increase the appeal of our brands.
Compelling Margins and Cash Flow.
Our adjusted EBITDA margin, which is not a measurement under accounting principles generally accepted in the United States ("GAAP") was
19.5%
,
19.0%
and
14.1%
for fiscal years
2014
,
2013
, and
2012
, respectively. For the definition of adjusted EBITDA margin and a reconciliation to net (loss) income, see “Item 7. Management’s Discussion and Analysis of Financial Condition and Results of Operations - GAAP Reconciliation of Non-GAAP Financial Measures.” In recent years, we have implemented a number of initiatives to reduce our cost base and improve the efficiency of our manufacturing process. Re-engineering the manufacturing process in our Tennessee facility has reduced labor hours per boat produced, and close collaboration between our product development and manufacturing teams has improved production throughput and product quality. Further, vertical integration of tower and tower accessory production has allowed us to increase incremental margin per boat sold. As a result of these and other initiatives, adjusted EBITDA for fiscal year
2014
grew
17.4%
on net sales growth of
14.3%
as compared to fiscal year
2013
. Our low capital expenditure requirements and a highly efficient working capital cycle allowed us to generate significant excess cash flow, excluding one time offering related expenditures, in fiscal years
2014
,
2013
and
2012
. We believe our strong cash flow increases our financial stability and provides us with more flexibility to invest in growth initiatives.
Highly Experienced Management Team.
Our experienced management team has demonstrated its ability to identify, create and integrate new product innovations, improve financial performance, optimize operations, enhance our distribution model and recruit top industry talent. Our Chief Executive Officer, Jack Springer, joined Malibu Boats in 2009 and has assembled an executive team with strong, complementary talents and experience. This team has led a workforce that we believe has produced superior results, including market share gains, sales growth and profitability improvement in each year since 2009.
Our Strategy
We intend to capitalize on the ongoing recovery in the powerboat market through the following strategies:
Continue to Develop New and Innovative Products in Our Core Markets.
We intend to continue developing and introducing new and innovative products-both new boat models to better address a broader range of consumers and new features to deliver better performance, functionality, convenience, comfort and safety to our consumers. We believe that new products and features are important to the growth of our market share, the continued expansion of our category and our ability to maintain attractive margins.
Our product development strategy consists of a two-pronged approach. First, we seek to introduce new boat models to target unaddressed or underserved segments of the performance sport boat category, while also updating and refreshing our existing boat models regularly. For example, we introduced Axis-branded boats starting in 2009 to address the entry-level segment of our category, and we launched the Malibu Wakesetter MXZ product line in 2012 to enter the premium “picklefork” bow design segment of our market. Second, we seek to develop and integrate innovative new features into our boats, such as Surf Gate, Malibu Touch Command and Power Wedge. For the 2014 model year, which began on July 1, 2013, we redesigned the Wakesetter 23LSV model and expanded our product offerings, including the introduction of two new models under the Axis brand, doubling the number of models offered under the Axis brand. In addition, Surf Gate was added as an available feature on
7
our Axis boats. We intend to continue releasing new products and features multiple times during the year, which we believe enhances our reputation as a leading-edge boat manufacturer and provides us with a competitive advantage.
Capture Additional Share from Adjacent Boating Categories.
Our culture of innovation has enabled us to expand the market for our products by attracting consumers from other categories, most notably from the sterndrive category. As illustrated by the chart below, the new unit sales volume of performance sport boats steadily increased from 2001 through 2013 as a percentage of the total new unit sales volume of performance sports boats and sterndrive boats. While there is no guarantee that this trend will continue in the future, we believe our market-leading position and broad offering of boat models and features will continue to attract consumers to our performance sport boats.
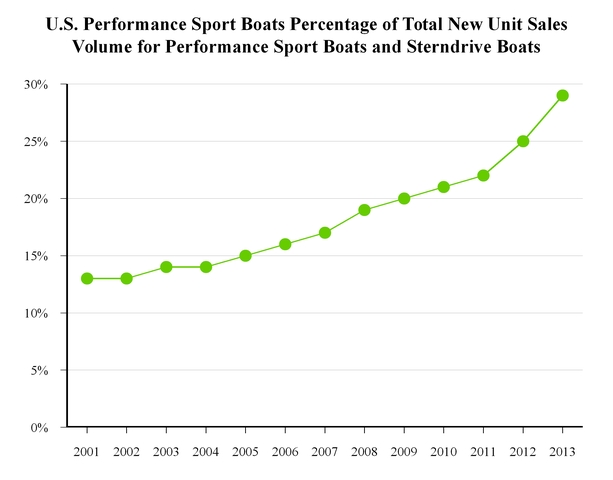
We intend to continue to enhance the performance, comfort and versatility of our products in order to further target crossover consumers seeking high-performance powerboats for general recreational activity. For example, we believe that one of our newest boat models, the Wakesetter 24 MXZ, appeals to a broader range of recreational boaters by offering the performance benefits of our products, including superior drivability and water sports versatility, while also providing greater seating capacity, a roomy, plush interior and extensive storage space to allow an increased number of family and friends to spend time together on the water.
Further Strengthen Our Dealer Network.
Our goal is to achieve and maintain leading market share in each of the markets in which we operate. We continually assess our distribution network and take the actions necessary to achieve our goal. We intend to strengthen our current footprint by selectively recruiting market-leading dealers who currently sell our competitors’ products. In addition, we plan to continue expanding our dealer network in certain geographic areas to increase consumer access and service in markets where it makes strategic sense. In the past six fiscal years, we have added 35 new dealer locations in the United States and Canada to provide incremental geographic coverage. We believe our targeted initiatives to enhance and grow our dealer network will increase unit sales in the future.
Accelerate International Expansion.
Based on our U.S. leadership position, brand recognition, diverse, innovative product offering and distribution strengths, we believe that we are well-positioned to increase our international sales. Our
33%
market
8
share of performance sport boat exports to international markets for the fiscal year ended
June 30, 2014
was the second highest among U.S. manufacturers. Our unit sales outside of North America, however, represented less than 5.0% of our total sales volume in fiscal year
2014
. We believe we will increase our international sales both by promoting our products in developed markets where we have a well-established dealer base, such as Western Europe, and by penetrating new and emerging markets where we expect rising consumer incomes to increase demand for recreational products, such as Asia and South America, although there is no guarantee that our efforts will be successful or that international sales will increase.
We have taken a number of steps to enhance our international presence and our ability to drive sales in developed and emerging markets. Over the past four fiscal years, we added 12 new international dealers, bringing our total number of dealer locations to
52
outside of North America as of
June 30, 2014
. Historically, the majority of our boats have been distributed to international markets through third parties. In 2013, we restructured our agreements with those parties to provide for direct sales coverage of key markets, including Central America, South America, Asia (excluding the Middle East) and most of Africa. In Australia, we work closely with a licensed manufacturer to maintain and grow what we believe is our leading market share position while also pursuing opportunities to improve our unit economics. To better manage and optimize international sales, we have added dedicated company resources and increased our sales and marketing activity, including international dealer meetings, dealer service schools, regional marketing campaigns and promotional visits by water sport athletes.
Our Products and Brands
We design, manufacture and sell performance sport boats that we believe deliver superior performance for water sports, including wakeboarding, water skiing and wake surfing, as well as general recreational boating. We market our boats under two brands:
|
•
|
Malibu
, our flagship brand, dates to our inception in 1982, primarily targeting consumers seeking a premium boating experience and offering our latest innovations in performance, comfort and convenience; and
|
|
•
|
Axis
, which we launched as a new brand in 2009, targets a younger demographic and provides them with a more affordably priced, entry-level boat that provides high performance, functional simplicity and the option to upgrade key features.
|
In addition, we offer various accessories and aftermarket parts.
Boat Models
We believe our boats are renowned for their performance, design, innovative technology, quality and ability to provide consumers a high-quality boating experience at varying price points. We currently offer a number of performance sport boat models across our two brands, which provide consumers with a variety of options across length, hull type, bow type, horsepower and seating capacity in addition to customizable designs and features available for upgrade across our models. The following table provides an overview of our most popular product offerings by brand:
|
Brand
|
Series
|
Number of
Models
|
Lengths
|
Hull Types
|
Bow Types
|
Maximum
Power
|
Maximum
Capacity
(persons)
|
Retail Price
Range
(In thousands)
|
|
Malibu
|
Wakesetter
|
7
|
20’-25’
|
Wake,
Cut Diamond, Diamond |
Traditional,
Picklefork |
555 hp
|
13-18
|
$55-$125
|
|
Malibu
|
Response
|
3
|
20’-21’
|
Cut Diamond
|
Traditional
|
450 hp
|
8-9
|
$35-$70
|
|
Axis
|
Axis
|
4
|
20’-24’
|
Wake
|
Traditional,
Picklefork |
450 hp
|
11-17
|
$45-$85
|
|
•
|
Malibu Wakesetter.
Introduced in 1998, the Wakesetter series is our premium boat series and the top selling series within the performance sport boat category. The Wakesetter series is designed for consumers seeking the highest-performance water sport and boating experience. Wakesetter offers consumers a highly-customizable boat with our most innovative technologies, premium features, newest graphics, color options and interior finishes. Demonstrating Wakesetter’s industry-leading performance and market position, the Wakesetter 23 LSV model was the best-selling boat in the performance sport boat category for fiscal years 2009 through 2013 and the Wakesetter 22 MXZ model was the official performance sport boat of the 2013 Red Bull Wake Open.
|
|
•
|
Malibu Response
. The Response series, created in 1995, was designed for consumers who desire a high-performance water ski boat. Primarily because of its direct drive engine setup, the Response series produces the smallest wake of any of our boats and is designed to accommodate both professional and recreational skiers by allowing for a range of speeds and line
|
9
lengths. Demonstrating Response’s reputation for high-performance and quality, the Response TXI model is the boat of choice for Regina Jaquess, the holder of the women’s slalom world record.
|
•
|
Axis
. After the continued success with our Wakesetter series, we identified a market opportunity in entry-level performance sport boats and, in 2009, launched our Axis brand. We designed Axis for consumers who desire a lower price point, but who still demand high performance, functional simplicity and the option to upgrade their boats to have key features such as Surf Gate. The Axis series currently has four available models and we plan to refine these models continually as well as add new ones as we build out the brand. We believe the Axis series successfully provides consumers with a high quality water sport and boating experience at an attractive price, as evidenced by its #6 market position in the performance sport boat category after only four years on the market.
|
Innovative Features
In addition to the standard features included on all of our boats, we offer consumers the ability to upgrade our base models by adding certain of our full line of innovative features designed to enhance performance, functionality and the overall boating experience. Our innovative features drive our high average selling prices. Some of these include:
|
•
|
Surf Gate
. Introduced in July 2012 and initially patented in September 2013, Surf Gate is available as an optional feature on all Malibu Wakesetter models and Axis brand boats. Surf Gate has revolutionized the increasingly popular sport of wake surfing. Prior to Surf Gate, boaters needed to empty ballast tanks on one side of the boat and shift passengers around to lean the boat to create a larger, more pronounced surf-quality wake. By employing precisely engineered and electronically controlled panels, Surf Gate alleviates this time-consuming and cumbersome process, allowing boaters to easily surf behind an evenly weighted boat without the need to wait for ballast changes. Recent enhancements to Surf Gate have improved upon the system’s actuators, allowing for easier and faster transfer, as well as the installation of an indicator horn and optional light signaling, which alert riders to wave transfers. In 2013, the Watersports Industry Association named Surf Gate as Innovation of the Year.
|
|
•
|
Manual Wedge/Power Wedge
. Our patented Manual Wedge and Power Wedge allow riders to customize their wakes by simulating up to 1,200 pounds of ballast weight in the transom of their boats. Used in conjunction with Surf Gate, wake surfers are able to customize the size and shape of the wave. The Manual Wedge is available on all Malibu and Axis brand boats. Unlike our Manual Wedge, the Power Wedge, available exclusively on our Malibu line, is fully automated and integrated within the Malibu Touch Command system, increasing functionality and ease-of-use for the driver. Re-engineered for model year 2015, we released the Power Wedge II. It features a larger foil and a 21% surface-area increase, which equates to an additional 300 pounds of simulated ballast, for a total of 1,500 pounds of wake-creating water displacement. In addition, a new upward angle increases lift, allowing the driver to achieve a fully loaded boat planing much faster.
|
|
•
|
G3/G4 Tower.
Our G3 Towers, available on Malibu brand boats, are fully customizable with speakers, power lights and racks, enhancing the overall style, performance and functionality of our boats. Our G3 Tower can easily be folded down by one person with its weightless, gas spring-assisted design, making the G3 Tower safe and easy to store. We are the only manufacturer of performance sport boats that produces towers in-house, allowing us to control this critical design element of our boats. For model year 2015, we are offering a new G4 Tower featuring aerospace aluminum and an internal honeycomb structure to provide the optimal strength-to-weight ratio, making the G4 three times more rigid than its predecessor. The new design contains automatic visible locks, a fully integrated wiring harness, Z5 Bimini compatibility, and zero pinch points. The new G4 has an aggressive design yet preserves ease of use by taking less than 30 pounds of force to lift, lower, and latch.
|
|
•
|
Electronic Dashboard Controls
. Every boat in our Wakesetter series is equipped with our MaliView and Malibu Touch Command ("MTC") systems, which function as an electronic command center that enhances the driver’s experience by providing simple and quick control of all systems on board, including the Power Wedge and Surf Gate systems, rider presets, music, lighting and navigation. For the model year 2015, we are first to market with a 12-inch touchscreen. It joins our seven-inch MTC to form the display for our new Command Center, giving the driver endless data in an easy-to-navigate interface. Every major feature is on the home screen, menu paths have been streamlined and each component meets IP60 water-intrusion standards. Built with more processing power, higher levels of integration, a feature-packed new operating system and powerful wireless connectivity, the new Command Center represents the most advanced screen technology available on performance sport boats.
|
We also offer an array of less technological, but nonetheless value-added boat features such as gelcoat upgrades, upholstery upgrades, engine drivetrain enhancements (such as silent exhaust tips, propeller upgrades and closed cooling engine configuration), sound system upgrades, Bimini tops, boat covers and trailers which further increase the level of customization afforded to consumers.
10
Our Dealer Network
We rely on independent dealers to sell our products. We establish performance criteria that our dealers must meet as part of their dealer agreements to ensure our dealer network remains the strongest in the industry. As a member of our network, dealers in North America may qualify for floor plan financing programs, rebates, seasonal discounts, promotional co-op payments and other allowances. We believe our dealer network is the most extensive in the performance sport boat category. The majority of our dealers, including eight in our top ten markets, are exclusive to Malibu and Axis brand boats within the performance sport boat category, highlighting the commitment of our key dealers to our boats.
North America
In North America, we had a total of
143
dealer locations as of
June 30, 2014
. Of these locations,
15%
sell our products exclusively,
61%
are multi-line locations that only carry non-competitive brands and products and
24%
sell our brands as well as other performance sport boat brands. Approximately
34%
of our dealer locations have been with us for over ten years. For fiscal year 2013, our dealers held the #1 market share position for the performance sport boat category in 75 of 133 U.S. markets.
We consistently review our distribution network to identify opportunities to expand our geographic footprint and improve our coverage of the market. During the past six fiscal years, we have added 35 new dealer locations to serve previously underserved markets in North America, and these new dealers have sold over 725 additional units over the last six fiscal years. In addition, we have strengthened our dealer network by replacing 37 dealer locations in the past six fiscal years, 19 of which were converted from selling one of our competitor’s products. We believe our outstanding dealer network allows us to distribute our products more efficiently than our competitors.
We do not have a significant concentration of sales among our dealers. For fiscal year
2014
, our top ten dealers accounted for
34.1%
of our units sold and none of our dealers accounted for more than
4.7%
of our total sales volume.
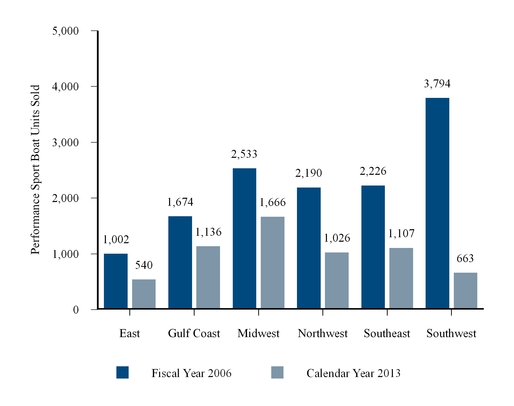
We believe that our strong market position in each region of the United States will help us capitalize on growth opportunities as our industry continues to recover from the economic downturn. In particular, we expect to generate continued growth in the southwestern United States (which includes California), a region that experienced the most pronounced decline in sales of new performance sport boats and where we have our highest regional market share. The following graph provides a comparison of the number of units sold by U.S. geographic region during fiscal year 2006, when the market was generally at its pre-recession peak, and calendar year 2013, as well as our U.S. market share in the performance sport boat category for calendar year 2013:
11
Market Size and Our Market Share by Region
|
Market Share
|
34%
|
31%
|
32%
|
29%
|
36%
|
39%
|
|
International
Less than
5.0%
of our unit volume for fiscal years
2014
and
2013
was generated outside of North America. For these international sales, we rely in part on our relationship with an independent representative with whom we have had a relationship for over 17 years. The independent representative services international dealer arrangements in Europe, the Middle East and South Africa on our behalf and is responsible for certain international dealer relationships, dealer sourcing and account management, which includes order management and customer service support. Under the terms of the agreement with the independent representative, the independent representative purchases boats directly from us at a predetermined percentage discount. These sales are made under the same terms and conditions offered to all dealers, which include, among other things, no right of return except in limited circumstances under our warranty policy. Like sales to our dealers, there are no continuing performance obligations in connection with our sales to the independent representative. Revenue from these sales is recognized in accordance with our customary shipping terms, free on board shipping point. A fixed percentage discount is earned by the independent representative at the time a boat is shipped as a reduction in the price of the boat and is recorded in our consolidated statement of operations as a reduction in sales. In 2013, we restructured our agreement with this representative and our Australian licensee to allow for direct coverage by us of Central America, South America and most of Asia and Africa. In Europe, we had a total of 32 independent dealer locations in 20 countries as of
June 30, 2014
. In Asia, 12 independent dealer locations marketed our boats in 10 countries as of
June 30, 2014
. In the rest of the world (other than Australia), we engaged 8 independent dealer locations in 6 countries as of
June 30, 2014
. In Australia, as discussed below, we have a direct relationship with a licensee.
Australia License
Our Malibu and Axis lines have been manufactured and sold in Australia by an exclusive licensee, Malibu Boats Pty Ltd, since 1995. This licensing arrangement has contributed significantly to our large market share in the Australian market, where we believe our brands outsold our most significant competitors at a three-to-one ratio during the year ended December 31, 2013.
12
We entered into an Exclusive Manufacture and Distribution Agreement with Malibu Boats Pty Ltd. in 2006, as subsequently amended. The agreement has a term of 15 years, with a 15-year automatic renewal period, and is generally terminable for cause with 30 days’ prior notice. Pursuant to the agreement, Malibu Boats Pty Ltd has the exclusive right to manufacture and distribute Malibu and Axis products and spare parts in Australia and New Zealand. We sell to Malibu Boats Pty Ltd certain materials that it requires to manufacture Malibu and Axis products and we also sell complete boats for resale in the covered territory. Further, we have granted a license to Malibu Boats Pty Ltd to display our trademarks and brand names on the products it manufactures under the agreement. We also provide Malibu Boats Pty Ltd with certain marketing assistance. On a quarterly basis, we receive royalties on the gross revenue from the sale of Malibu and Axis products sold by Malibu Boats Pty Ltd. Pursuant to the agreement, Malibu Boats Pty Ltd agrees to, among other things:
|
•
|
refrain from selling or distributing any of our competitors’ products;
|
|
•
|
maintain design and quality control standards prescribed by us;
|
|
•
|
promote and demonstrate Malibu and Axis products to consumers; and
|
|
•
|
indemnify us for certain claims.
|
On June 2, 2014, we entered into a non-binding letter of intent to acquire all of the equity interest of the Malibu Boats licensee in Australia. The Australian license business is operated by Malibu Boats Pty Ltd. and includes distribution rights in the Australia and New Zealand markets as well as a manufacturing facility in Albury, Australia. The proposed acquisition is expected to close in the first half of fiscal year 2015 subject to negotiation and execution of definitive documentation.
Dealer Management
Our relationship with our dealers is governed through dealer agreements. Each dealer agreement has a finite term lasting between one and three years. Our dealer agreements also are typically terminable without cause by the dealer at any time and by us with 90 days’ prior notice. We may also generally terminate these agreements immediately for cause upon certain events. Pursuant to our dealer agreements, the dealers typically agree to, among other things:
|
•
|
represent our products at specified boat shows;
|
|
•
|
market our products only to retail end users in a specific geographic territory;
|
|
•
|
promote and demonstrate our products to consumers;
|
|
•
|
place a specified minimum number of orders of our products during the term of the agreement in exchange for rebate eligibility that varies according to the level of volume they commit to purchase;
|
|
•
|
provide us with regular updates regarding the number and type of our products in their inventory;
|
|
•
|
maintain a service department to service our products, and perform all appropriate warranty service and repairs; and
|
|
•
|
indemnify us for certain claims.
|
Our dealer network, including all additions, renewals, non-renewals or terminations, is managed by our sales personnel. Our sales team operates using a semi-annual dealer review process involving our senior management team. Each individual dealer is reviewed semi-annually with a broad assessment across multiple key elements, including the dealer’s geographic region, market share and customer service ratings, to identify underperforming dealers for remediation and to manage the transition process when non-renewal or termination is a necessary step.
We have developed a system of financial incentives for our dealers based on customer satisfaction and achievement of best practices. Our dealer incentive program has been refined through nearly 30 years of experience and provides the following key elements:
|
•
|
Rebates
. Our dealers agree to an annual commitment volume that places each dealer into a certain rebate tier and determines its prospective rebate percentage. If a dealer meets its annual commitment volume as well as other terms of the rebate program, the dealer is entitled to the specified rebate. Failure to meet the commitment volume may result in partial or complete forfeiture of the dealer’s rebate.
|
|
•
|
Co-op
. Dealers of the Malibu product line may earn certain co-op reimbursements upon reaching a specified level of qualifying expenditures.
|
13
|
•
|
Free flooring
. Our dealers that take delivery of current model year boats in the offseason, typically July through April, are entitled to have us pay the interest to floor the boat until the earlier of (1) the sale of the unit or (2) a date near the end of the current model year. This program is an additional incentive to encourage dealers to order in the offseason and helps us balance our seasonal production.
|
Our dealer incentive programs are also structured to promote more evenly distributed ordering throughout the fiscal year, which allows us to achieve better level-loading of our production and thereby generate plant operating efficiencies. In addition, these programs offer further rewards for dealers who are exclusive to Malibu and Axis in our performance sport boat category.
Floor Plan Financing
Our North American dealers often purchase boats through floor plan financing programs with third-party floor plan financing providers. During fiscal year
2014
, approximately 80% of our domestic shipments were made pursuant to floor plan financing programs through which our dealers participate. These programs allow dealers to establish lines of credit with third-party lenders to purchase inventory. Under these programs, a dealer draws on the floor plan facility upon the purchase of our boats and the lender pays the invoice price of the boats. As is typical in our industry, we have entered into repurchase agreements with certain floor plan financing providers to our dealers. Under the terms of these arrangements, in the event a lender repossesses a boat from a dealer that has defaulted on its floor financing arrangement and is able to deliver the repossessed boat to us, we are obligated to repurchase the boat from the lender. Our obligation to repurchase such repossessed products for the unpaid balance of our original invoice price for the boat is subject to reduction or limitation based on the age and condition of the boat at the time of repurchase, and in certain cases by an aggregate cap on repurchase obligations associated with a particular floor financing program.
Our exposure under repurchase agreements with third-party lenders is mitigated by our ability to reposition inventory with a new dealer in the event that a repurchase event occurs. The primary cost to us of a repurchase event is any loss on the resale of a repurchased unit, which is often less than 10% of the repurchase amount. Since July 1, 2010, we have not repurchased any boats under our repurchase agreements.
Marketing and Sales
As of
June 30, 2014
, we employed seven specialized and dedicated sales professionals. We believe that providing a high level of service to our dealers and end consumers is essential to maintaining our excellent reputation. Our sales personnel receive training on the latest Malibu Boats products and technologies, as well as training on our competitors’ products and technologies, and attend trade shows to increase their market knowledge. This training is then passed along to our dealers to ensure a consistent marketing message and leverage our marketing expenditures. We enjoy strong brand awareness, as evidenced by our substantial market share.
Our marketing strategy focuses on strengthening and promoting the Malibu and Axis brands in the recreational boating marketplace. An important element of our marketing strategy involves specialized promotions at competitive water sports events, and individual and team sponsorships. Our leading position in the performance sport boat category is supported by our sponsorship of some of the most prestigious water sports competitions, including the Red Bull Wake Open, Malibu Open and World Wakeboard Association Riders Experience, which we believe positively influences the purchasing habits of enthusiasts and other consumers seeking high-performance products. These events feature the most popular figures in water sports, drawing large audiences of enthusiasts to a variety of sites around the country. Further, we sponsor a team of elite male and female athletes from the professional water sports tours. Team Malibu includes legendary wakeboarders such as Phil Soven, named “King of Wake” at the 2013 Surf Expo, Dallas Friday, winner of the 2004 ESPY for “Best Female Action Sports Athlete,” Ralph Derome, winner of WakeWorld.com’s “Rail Rider of the Year” for 2013, and Amber Wing, winner of TransWorld’s “Best Women’s Rider” for 2013. We believe that the performance of our products has been demonstrated by, and our brands benefit from, the success of professional athletes who use our products.
In addition to our website and traditional marketing channels, such as print advertising and tradeshows, we maintain an active digital advertising and social media platform, including use of Facebook and Twitter to increase brand awareness, foster loyalty and build a community of users. In addition, we benefit from the various Malibu and Axis user-generated videos and photos that are uploaded to websites including YouTube, Vimeo and Instagram. As strategies and marketing plans are developed for our products, our internal marketing and communications group works to ensure brand cohesion and consistency. We believe that our marketing initiatives, as well as our strategic focus on product innovation, performance and quality attracts aspiring and enthusiast consumers to our brands and products.
14
Product Development and Engineering
We are strategically and financially committed to innovation, as reflected in our dedicated product development and engineering group and evidenced by our track record of new product introduction. Our product development and engineering group spans both our Tennessee headquarters and our California facility and comprises nine professionals. These individuals bring to our product development efforts significant expertise across core disciplines, including boat design, computer-aided design, electrical engineering and mechanical engineering. They are responsible for execution of all facets of our new product strategy, including designing new and refreshed boat models and new features, engineering these designs for manufacturing and integrating new features into our boats. In addition, our Chief Executive Officer and Chief Operating Officer are actively involved in the product development process and integration into manufacturing.
We take a disciplined approach to the management of our product development strategy. We use a formalized phase gate process, overseen by a dedicated project manager, to develop, evaluate and implement new product ideas for both boat models and innovative features. Application of the phase gate process requires management to establish an overall timeline that is sub-divided into milestones, or “gates,” for product development. Setting milestones at certain intervals in the product development process ensures that each phase of development occurs in an organized manner and enables management to become aware of and address any issues in timely fashion, which facilitates on-time, on-target release of new products with expected return on investment. Extensive testing and coordination with our manufacturing group are important elements of our product development process, which we believe enable us to minimize the risk associated with the release of new products. Our phase gate process also facilitates our introduction of new boat models and features throughout the year, which we believe provides us with a competitive advantage in the marketplace. Finally, in addition to our process for managing new product introductions in a given fiscal year, we also engage in longer-term product lifecycle and product portfolio planning.
Manufacturing
Our manufacturing efforts are led by our Chief Operating Officer, who brings 30 years of experience in the manufacture of performance sport boats, supported by a workforce of 372 employees as of
June 30, 2014
. We manufacture all of our boats at our Tennessee facility, and we manufacture towers, tower accessories and stainless steel and aluminum billet at our California facility.
Our boats are built through a continuous flow manufacturing process that encompasses fabrication, assembly, quality management and testing. Each boat is produced over a seven-day cycle that includes the fabrication of the hull and deck through gelcoat application and fiberglass lamination, grinding and hole cutting, installation of components, rigging, finishing, detailing and on-the-water testing. We manufacture certain components and subassemblies for our boats, such as upholstery, stainless steel and aluminum billet and towers. We procure other components, such as engines and electronic controls, from third-party vendors and install them on the boat.
We acquired our tower and tower accessory manufacturing capability in 2009 through the acquisition of certain assets of Titan Wake Accessories, which had been one of our suppliers. Tower-related manufacturing occurs in our Merced-based machine shop, where we use multiple computer-controlled machines to cut all of the aluminum parts required for tower assembly. We are the only performance sport boat company that manufacturers towers in-house. We believe that the vertical integration of these components is a distinct competitive advantage that allows us to control key design elements of our boats and generate higher margins.
We are committed to continuous improvement in our operations, and our efforts in this regard have resulted in higher gross margins. Specifically, we have increased labor efficiency, reduced cost of materials and reduced warranty claims. Our production engineers evaluate and seek to optimize the configuration of our production line given our production volumes and model mix. We use disciplined mold maintenance procedures to maintain the usable life of our molds and to reduce surface defects that would require rework. We have instituted scrap material reduction and recovery processes, both internally and with our supplier base, helping to manage our material costs. Finally, we have implemented a quality management system to ensure that proper procedures and control measures are in place to deliver consistent, high-quality product, especially as our production volumes have increased.
We focus on worker safety in our operations. From July 1, 2012 through
June 30, 2014
, we recorded 1,268,634 consecutive man-hours without a lost-time accident in our Tennessee facility, an accomplishment that has reduced workers’ compensation claims and warranty costs, as our most experienced employees continue to remain on the job.
Suppliers
We purchase a wide variety of raw materials from our supplier base, including resins, fiberglass, hydrocarbon feedstocks and steel, as well as product parts and components, such as engines and electronic controls, through a sales order process.
15
We belong to Independent Boat Buildings, Inc., or IBBI, a 20-member marine purchasing cooperative and sit on its board of directors. Membership in IBBI is limited to top-tier manufacturers and is not only helpful for procuring materials, but also helps us stay abreast of technological developments and industry best practices. Although we purchase certain supplies, such as fiberglass and resins, through the IBBI cooperative agreement, we maintain informal arrangements with third-party suppliers outside of the IBBI agreement for other raw materials and components, which we believe ensures that our boats are constructed using the best available components and raw materials.
We have not experienced any material shortages in any of our raw materials, product parts or components. Temporary shortages, when they do occur, usually involve manufacturers of these products adjusting model mixes, introducing new product lines or limiting production in response to an industry-wide reduction in boat demand.
The most significant component used in manufacturing our boats, based on cost, are engines. We maintain a strong and long-standing relationship with our primary supplier of engines, and we have also developed a relationship with a second supplier from whom we expect to source approximately 30% of our engines for fiscal year 2015. As is typical in our industry, our engine suppliers are marinizers of engines that they procure from larger engine block manufacturers, such as General Motors Corporation.
Insurance and Product Warranties
We carry various insurance policies, including policies to cover general products liability, workers’ compensation and other casualty and property risks, to protect against certain risks of loss consistent with the exposures associated with the nature and scope of our operations. Our policies are generally based on our safety record as well as market trends in the insurance industry and are subject to certain deductibles, limits and policy terms and conditions.
We provide limited product warranties, generally covering periods from 12 to 36 months for Malibu brand boats and 12 to 24 months for Axis brand boats. During the warranty period, we reimburse dealers and Malibu Boats authorized service facilities for all or a portion of the cost of repair or replacement performed on the products (mainly composed of parts or accessories provided by us and labor costs incurred by dealers or Malibu Boats authorized service facilities). Some materials, components or parts of the boat that are not covered by our limited product warranties are separately warranted by their manufacturers or suppliers. These other warranties include warranties covering engines and trailers, among other components.
Intellectual Property
We rely on a combination of patent, trademark and copyright protection, trade secret laws, confidentiality procedures and contractual provisions to protect our rights in our brand, products and proprietary technology. This is an important part of our business and we intend to continue protecting our intellectual property. We currently hold twelve U.S. patents, nine pending U.S. patent applications, three pending Australian patent applications and two international (PCT) patents. On June 27, 2014, Nautique Boat Company, Inc. filed a petition with the U.S. Patent and Trademark Office requesting institution of an
Inter Partes
Review of our U.S. Pat. No. 8,539,897. We intend to vigorously defend the patented technology of the ‘897 patent. For more information, see Note 14 to our audited consolidated financial statements included elsewhere in this Annual Report.
We own 26 registered trademarks in various countries around the world, and we have made applications for four additional registrations. Such trademarks may endure in perpetuity on a country-by-country basis, provided that we comply with all statutory maintenance requirements, including continued use of each trademark in each such country. We currently do not own any registered copyrights.
Competition
The powerboat industry, including the performance sport boat category, is highly competitive for consumers and dealers. Competition affects our ability to succeed in the markets we currently serve and new markets that we may enter in the future. We compete with several large manufacturers that may have greater financial, marketing and other resources than we do. We compete with large manufacturers who are represented by dealers in the markets in which we now operate and into which we plan to expand. We also compete with a wide variety of small, independent manufacturers. Competition in our industry is based primarily on brand name, price and product performance. For more information, see Item 1A. “Risk Factors-Risks Related to Our Business-Our industry is characterized by intense competition, which affects our sales and profits.”
Environmental, Safety and Regulatory Matters
Certain materials used in our manufacturing, including the resins used in production of our boats, are toxic, flammable, corrosive or reactive and are classified by the federal and state governments as “hazardous materials.” Control of these substances is regulated by the Environmental Protection Agency, or EPA, and state pollution control agencies. The Occupational Safety and Health Administration, or OSHA, standards limit the amount of emissions to which an employee may
16
be exposed without the need for respiratory protection or upgraded plant ventilation. Our facilities are regularly inspected by OSHA and by state and local inspection agencies and departments. We believe that our facilities comply in all material aspects with these regulations. Although capital expenditures related to compliance with environmental laws are expected to increase, we do not currently anticipate any material expenditure will be required to continue to comply with existing environmental or safety regulations in connection with our existing manufacturing facilities.
Powerboats sold in the United States must be manufactured to meet the standards of certification required by the United States Coast Guard. In addition, boats manufactured for sale in the European Community must be certified to meet the European Community’s imported manufactured products standards. These certifications specify standards for the design and construction of powerboats. We believe that all of our boats meet these standards. In addition, safety of recreational boats is subject to federal regulation under the Boat Safety Act of 1971, which requires boat manufacturers to recall products for replacement of parts or components that have demonstrated defects affecting safety. We have instituted recalls for defective component parts produced by certain of our third-party suppliers. None of the recalls has had a material adverse effect on our Company.
The EPA has adopted regulations stipulating that many marine propulsion engines meet an air emission standard that requires fitting a catalytic converter to the engine. These regulations also require, among other things, that engine manufacturers provide a warranty that their engines meet EPA emission standards. The engines used in our products are subject to these regulations. This regulation has increased the cost to manufacture our products.
Employees
We believe we maintain excellent relations with our employees, treating them as business partners and focusing on building careers. As of
June 30, 2014
, more than
17.0%
of our employees had been with us for ten or more years. As of
June 30, 2014
, we employed
411
people,
346
of whom work at our facilities in Tennessee,
57
of whom work at our California site and
eight
who work remotely. As of
June 30, 2014
, approximately
16.0%
of our employees were salaried and
84.0%
were hourly workers. None of our employees are represented by a labor union and, since our founding in 1982, we have never experienced a labor-related work stoppage. Since 2012, we have engaged an outside consultant to assist with employee training, in order to provide our employees a path for upward mobility and develop leadership skills applicable to their day-to-day responsibilities.
History and Formation Transactions
Company History
In 1982, a group of six friends who shared a common passion for waterskiing decided to start building custom ski boats in a small shop in Merced, California. Robert Alkema founded the company and chose the Malibu Boats brand name. During our first year of operation, Malibu Boats built two boats per week using a single-hull design and each boat, with its blended gel coat design, had a distinct California flair. Only two years later, we were building over 400 boats per year. By 1988, the California plant was manufacturing at full capacity. To satisfy increased demand, we opened a second plant in Tennessee and by the end of 1988 were building almost 1,000 boats annually. That year also marked the year we received our first Product Excellence award from
Powerboat
magazine.
Growth continued throughout the early 1990s and, in 1992, we built a new production facility near Knoxville, Tennessee to accommodate increased demand east of the Mississippi. During that time, we became the first boat manufacturer to use computers in our initial boat designs and introduced a new, patented, fiberglass engine chassis system that eliminated vibration and noise associated with the drivetrain.
Water sports evolved in the late 1990s and wakeboarding quickly gained in popularity. To capitalize on this growing trend, we introduced the WakeSetter model and the wakeboarding-focused Manual Wedge feature, which created an enhanced, “rampy” wake without the need for ballast tanks.
In 1999, we sponsored The Malibu Open water ski championships, which quickly became a premier event for slalom, trick and jump waterskiing. Shortly thereafter, the Malibu Just Ride wakeboard series, the first wakeboard-specific event that did not include water skiing, kicked off in the United States in 2001.
By 2003, we had captured the leading market share position in the performance sport boat category.
In 2006, we were acquired by an investor group, including affiliates of Black Canyon Capital LLC, Horizon Holdings, LLC and then-current management. In 2008 and 2009, we, like almost every manufacturer in the marine industry, experienced significant volume declines as a result of the global recession. In the midst of the recession, in May 2009, Jack Springer took over as our interim Chief Executive Officer and became Chief Executive Officer in February 2010. Wayne Wilson became our Chief Financial Officer in November 2009. In 2011, Ritchie Anderson joined our senior management team as Vice President of
17
Operations and was later named Chief Operating Officer. This highly talented team with complementary skill sets has been instrumental in leading our company out of the recession, achieving #1 market share and developing our strategies for continued growth. In February 2014, we completed our initial public offering of Class A Common Stock on the NASDAQ Global Select Market, as discussed in more detail below.
Our Organizational Structure
Malibu Boats, Inc. was incorporated as a Delaware corporation on November 1, 2013 in anticipation of the IPO to serve as a holding company that owns only an interest in Malibu Boats Holdings, LLC. Immediately after the completion of the Recapitalization (as defined below) and IPO, Malibu Boats Inc. held approximately 49.3% of the economic interest in the LLC, which increased after the follow-on offering described below to approximately 68.8% of the economic interest in the LLC.
The certificate of incorporation of Malibu Boats, Inc. authorizes two classes of common stock, Class A Common Stock and Class B Common Stock. Holders of our Class A Common Stock and our Class B Common Stock have voting power over Malibu Boats, Inc., the sole managing member of the LLC, at a level that is consistent with their overall equity ownership of our business. In connection with the Recapitalization and IPO, Malibu Boats, Inc. issued to each pre-IPO owner, for nominal consideration, one share of Class B Common Stock of Malibu Boats, Inc., each of which provides its owner with no economic rights but entitles the holder to one vote on matters presented to stockholders of Malibu Boats, Inc. for each LLC Unit held by such holder. Pursuant to our certificate of incorporation and bylaws, each share of Class A Common Stock entitles the holder to one vote with respect to each matter presented to our stockholders on which the holders of Class A Common Stock are entitled to vote. Each holder of Class B Common Stock is entitled to the number of votes equal to the total number of LLC units held by such holder multiplied by the exchange rate specified in the exchange agreement with respect to each matter presented to our stockholders on which the holders of Class B Common Stock are entitled to vote. Accordingly, the holders of LLC Units collectively have a number of votes that is equal to the aggregate number of LLC Units that they hold. As the LLC members sell LLC Units to us or subsequently exchange LLC Units for shares of Class A Common Stock of Malibu Boats, Inc. pursuant to the exchange agreement described below, the voting power afforded to them by their shares of Class B Common Stock is automatically and correspondingly reduced. Subject to any rights that may be applicable to any then outstanding preferred stock, our Class A and Class B Common Stock vote as a single class on all matters presented to our stockholders for their vote or approval, except as otherwise provided in our certificate of incorporation or bylaws or required by applicable law. In addition, subject to preferences that may apply to any shares of preferred stock outstanding at the time, the holders of our Class A Common Stock are entitled to share equally, identically and ratably in any dividends or distributions (including in the event of any voluntary or involuntary liquidation, dissolution or winding up of our affairs) that our board of directors may determine to issue from time to time, while holders of our Class B Common Stock do not have any right to receive dividends or other distributions.
As noted above, Malibu Boats, Inc. is a holding company with a controlling equity interest in the LLC. Malibu Boats, Inc., as sole managing member of the LLC, operates and controls all of the business and affairs and consolidates the financial results of the LLC. The limited liability company agreement of the LLC provides that it may be amended, supplemented, waived or modified by the written consent of Malibu Boats, Inc., as managing member of the LLC, in its sole discretion without the approval of any other holder of LLC Units, except that no amendment may materially and adversely affect the rights of a holder of LLC Units, other than on a pro rata basis with other holders of LLC Units, without the consent of such holder (unless more than one holder is so affected, then the consent of a majority of such affected holders is required). Pursuant to the limited liability company agreement of the LLC, Malibu Boats, Inc. has the right to determine when distributions (other than tax distributions) will be made to the members of the LLC and the amount of any such distributions. If Malibu Boats, Inc. authorizes a distribution, such distribution will be made to the members of the LLC (including Malibu Boats, Inc.) pro rata in accordance with the percentages of their respective LLC Units.
Recapitalization
Immediately prior to the closing of the IPO of Malibu Boats, Inc. on February 5, 2014, a new single class of LLC Units of Malibu Boats Holdings, LLC, was allocated among the pre-IPO owners in exchange for their prior membership interests of the LLC pursuant to the distribution provisions of the former limited liability company agreement of the LLC based upon the liquidation value of the LLC, assuming it was liquidated at the time of the IPO with a value implied by the initial public offering price of the shares of Class A Common Stock sold in the IPO. Immediately prior to the closing of the IPO, there were 17,071,424 LLC Units issued and outstanding.
Further, on February 4, 2014 (prior to the closing of the IPO), two holders of membership interests in the LLC merged with and into two newly formed subsidiaries of Malibu Boats, Inc. As a result of these mergers, the sole stockholders of each of the two merging entities received shares of Class A Common Stock in exchange for shares of capital stock of the merging entities.
18
Also, we redeemed for nominal consideration, the initial 100 shares of Class A Common Stock issued to our initial stockholder in connection with our formation.
We refer to the foregoing transactions as the “Recapitalization.”
IPO and Follow-On Offering
On February 5, 2014, we completed our IPO of 8,214,285 shares of Class A Common Stock at a price to the public of $14.00 per share, of which 7,642,996 shares were issued and sold by us and 571,289 shares were sold by selling stockholders. This included 899,252 shares issued and sold by us and 172,175 shares sold by selling stockholders pursuant to the over-allotment option granted to the underwriters, which was exercised concurrently with the closing of the IPO. The aggregate gross proceeds from the IPO were $115.0 million. Of these proceeds, we received $99.5 million and the selling stockholders received $7.4 million, after deducting $8.1 million in underwriting discounts and commissions. With the proceeds we received, approximately $29.8 million was used to purchase units in the LLC, or the LLC Units, directly from the pre-IPO owners and $69.8 million was used to purchase newly issued LLC Units from the LLC, which the LLC then used (i) to pay down all of the amounts owed under the LLC’s credit facilities and term loans in the amount of $63.4 million, (ii) to pay Malibu Boats Investor, LLC, an affiliate of the LLC, a fee of $3.8 million in connection with the termination of the LLC’s management agreement upon consummation of the IPO, and (iii) for general corporate purposes with the remaining approximately $2.7 million. In connection with the repayment of the LLC’s credit facilities and term loans, debt issuance costs associated with the term loans were written off to interest expense.
On July 15, 2014, we completed a follow-on public offering of 5,520,000 shares of our Class A Common Stock at a price to the public of $18.50 per share, of which 4,371,893 shares were issued and sold by us and 1,148,107 shares were sold by selling stockholders. This included 538,252 shares issued and sold by us and 181,748 shares sold by selling stockholders pursuant to the over-allotment option granted to the underwriters, which was exercised concurrently with the closing of the follow-on offering. The aggregate gross proceeds from the follow-on offering were $102.1 million. Of these proceeds, we received $76.8 million and the selling stockholders received $20.2 million, after deducting $5.1 million in underwriting discounts and commissions. We used all of the proceeds we received to purchase LLC Units directly from the holders of LLC Units.
The diagram below depicts our current organizational structure, as of September 24, 2014:
19
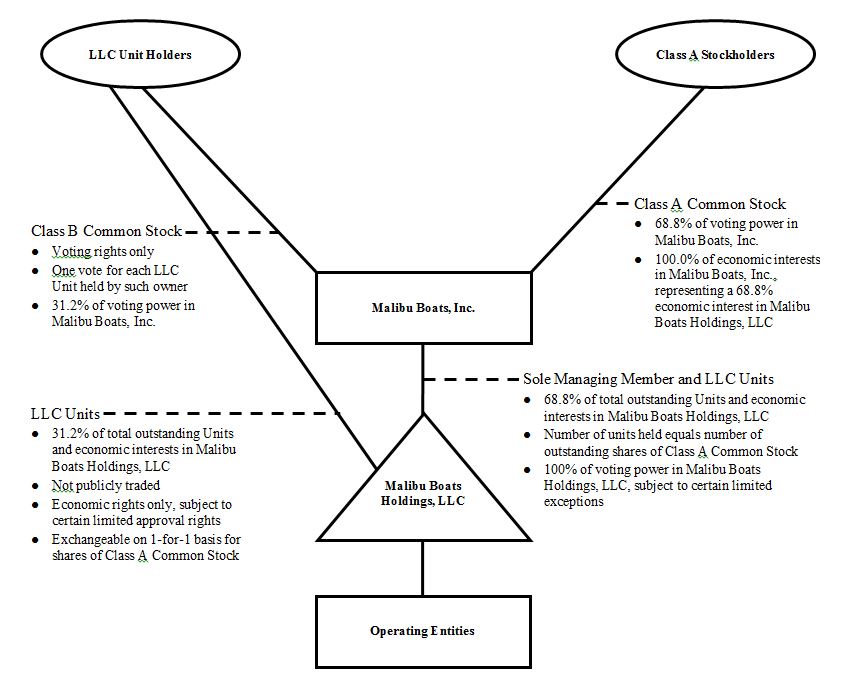
Our organizational structure allows the LLC members to retain their equity ownership in the LLC, an entity that is classified as a partnership for U.S. federal income tax purposes, in the form of LLC Units. Holders of Class A Common Stock, by contrast, hold their equity ownership in Malibu Boats, Inc., a Delaware corporation that is a domestic corporation for U.S. federal income tax purposes, in the form of shares of Class A Common Stock. We believe that the LLC members generally will find it advantageous to hold their equity interests in an entity that is not taxable as a corporation for U.S. federal income tax purposes. The holders of LLC Units, including Malibu Boats, Inc., will incur U.S. federal, state and local income taxes on their proportionate share of any taxable income of the LLC. Net profits and net losses of the LLC will generally be allocated to the LLC’s members (including Malibu Boats, Inc.) pro rata in accordance with the percentages of their respective limited liability company interests. The limited liability company agreement provides for cash distributions to the holders of LLC Units if Malibu Boats, Inc. determines that the taxable income of the LLC will give rise to taxable income for its members. In accordance with the limited liability company agreement, we intend to cause the LLC to make cash distributions to the holders of LLC Units for purposes of funding their tax obligations in respect of the income of the LLC that is allocated to them. Generally, these tax distributions will be computed based on our estimate of the taxable income of the LLC allocable to such holder of LLC Units multiplied by an assumed tax rate equal to the highest effective marginal combined U.S. federal, state and local income tax rate prescribed for an individual or corporate resident in Los Angeles, California (taking into account the nondeductibility of certain expenses and the character of our income). For purposes of determining the taxable income of the LLC, such determination will be made by generally disregarding any adjustment to the taxable income of any member of the LLC that arises under the tax basis adjustment rules of the Internal Revenue Code of 1986, as amended, or the Code and is attributable to the acquisition by such member of an interest in the LLC in a sale or exchange transaction.
Exchanges and Other Transactions with Holders of LLC Units
20
In connection with the Recapitalization and IPO, we entered into an exchange agreement with the pre-IPO owners of the LLC under which (subject to the terms of the exchange agreement) each pre-IPO owner (or its permitted transferee) has the right to exchange its LLC Units for shares of our Class A Common Stock on a one-for-one basis, subject to customary conversion rate adjustments for stock splits, stock dividends and reclassifications, or, at our option, except in the event of a change in control, for a cash payment equal to the market value of the Class A Common Stock. The exchange agreement provides, however, that such exchanges must be for a minimum of the lesser of 1,000 LLC Units, all of the LLC Units held by the holder, or such amount as we determine to be acceptable. The exchange agreement also provides that an LLC member will not have the right to exchange LLC Units if Malibu Boats, Inc. determines that such exchange would be prohibited by law or regulation or would violate other agreements with Malibu Boats, Inc. to which the LLC member may be subject or any of our written policies related to unlawful or insider trading. The exchange agreement also provides that Malibu Boats, Inc. may impose additional restrictions on exchanges that it determines to be necessary or advisable so that the LLC is not treated as a “publicly traded partnership” for U.S. federal income tax purposes. In addition, pursuant to the limited liability company agreement of the LLC, Malibu Boats, Inc., as managing member of the LLC, has the right to require all members of the LLC to exchange their LLC Units for Class A Common Stock in accordance with the terms of the exchange agreement, subject to the consent of Black Canyon Management LLC and the holders of a majority of outstanding LLC Units other than those held by Malibu Boats, Inc.
As a result of exchanges of LLC Units into Class A Common Stock and purchases by Malibu Boats, Inc. of LLC Units from holders of LLC Units, like we completed in our IPO and follow-on offering, Malibu Boats, Inc. will become entitled to a proportionate share of the existing tax basis of the assets of the LLC at the time of such exchanges or purchases. In addition, such exchanges and purchases of LLC Units are expected to result in increases in the tax basis of the assets of the LLC that otherwise would not have been available. These increases in tax basis may reduce the amount of tax that Malibu Boats, Inc. would otherwise be required to pay in the future. These increases in tax basis may also decrease gains (or increase losses) on future dispositions of certain capital assets to the extent tax basis is allocated to those capital assets. We have entered into a tax receivable agreement with the pre-IPO owners (or their permitted assignees) that provides for the payment by Malibu Boats, Inc. to the pre-IPO owners (or their permitted assignees) of 85% of the amount of the benefits, if any, that Malibu Boats, Inc. is deemed to realize as a result of (1) increases in tax basis and (2) certain other tax benefits related to our entering into the tax receivable agreement, including tax benefits attributable to payments under the tax receivable agreement. These payment obligations are obligations of Malibu Boats, Inc. and not of the LLC.
Available Information
Our Annual Report on Form 10-K, Quarterly Reports on Form 10-Q, Current Reports on Form 8-K and amendments to reports filed or furnished pursuant to Sections 13(a) and 15(d) of the Securities Exchange Act of 1934, as amended, or the Exchange Act are available on our web site at www.malibuboats.com, free of charge, as soon as reasonably practicable after the electronic filing of these reports with, or furnishing of these reports to, the Securities and Exchange Commission, or the SEC. Any materials we file with the SEC are available at the SEC’s Public Reference Room at 100 F Street, NE, Washington, DC 20549. Additional information about the operation of the Public Reference Room can also be obtained by calling the SEC at 1-800-SEC-0330. In addition, the SEC maintains a web site at www.sec.gov that contains reports, proxy and information statements, and other information regarding issuers that file electronically with the SEC, including us.
The following describes the risks and uncertainties that could cause our actual results to differ materially from those presented in our forward-looking statements. The risks and uncertainties described below are not the only ones we face but do represent those risks and uncertainties that we believe are material to us. Additional risks and uncertainties not presently known to us or that we currently deem immaterial may also harm our business.
Risks Related to Our Business
General economic conditions, particularly in the United States, affect our industry, demand for our products, and our business and results of operations.
General economic conditions continue to be challenging as the economy recovers from the effects of the financial crisis that led to the last recession in the United States. Demand for new performance sport boats has been significantly influenced by weak economic conditions, low consumer confidence and high unemployment and increased market volatility worldwide, especially in the United States. In times of economic uncertainty and contraction, consumers tend to have less discretionary income and to defer or avoid expenditures for discretionary items, such as our products. Sales of our products are highly sensitive to personal discretionary spending levels, and our success depends on general economic conditions and overall
21
consumer confidence and personal income levels. Any deterioration in general economic conditions that diminishes consumer confidence or discretionary income may reduce our sales and adversely affect our business, financial condition and results of operations. We cannot predict the duration or strength of an economic recovery, either in the United States or in the specific markets where we sell our products.
Consumers often finance purchases of our products. Although consumer credit markets have improved, consumer credit market conditions continue to influence demand, especially for boats, and may continue to do so. There continue to be fewer lenders, tighter underwriting and loan approval criteria and greater down payment requirements than in the past. If credit conditions worsen, and adversely affect the ability of consumers to finance potential purchases at acceptable terms and interest rates, it could result in a decrease in the sales of our products.
Our annual and quarterly financial results are subject to significant fluctuations depending on various factors, many of which are beyond our control.
Our sales and operating results can vary significantly from quarter to quarter and year to year depending on various factors, many of which are beyond our control. These factors include, but are not limited to:
|
•
|
seasonal consumer demand for our products;
|
|
•
|
discretionary spending habits;
|
|
•
|
changes in pricing in, or the availability of supply in, the used powerboat market;
|
|
•
|
variations in the timing and volume of our sales;
|
|
•
|
the timing of our expenditures in anticipation of future sales;
|
|
•
|
sales promotions by us and our competitors;
|
|
•
|
changes in competitive and economic conditions generally;
|
|
•
|
consumer preferences and competition for consumers’ leisure time;
|
|
•
|
impact of unfavorable weather conditions;
|
|
•
|
changes in the cost or availability of our labor; and
|
|
•
|
increased fuel prices.
|
As a result, our results of operations may decline quickly and significantly in response to changes in order patterns or rapid decreases in demand for our products. We anticipate that fluctuations in operating results will continue in the future.
We depend on our network of independent dealers, face increasing competition for dealers and have little control over their activities.
Substantially all of our sales are derived from our network of independent dealers. We have agreements with the dealers in our network that typically provide for one-year terms, although some agreements have a term of up to three years. For fiscal years
2014
and
2013
, our top ten dealers accounted for
34.1%
and
36.1%
, respectively, of our total units sold. The loss of a significant number of these dealers could have a material adverse effect on our financial condition and results of operations. The number of dealers supporting our products and the quality of their marketing and servicing efforts are essential to our ability to generate sales. Competition for dealers among performance sport boat manufacturers continues to increase based on the quality, price, value and availability of the manufacturer’s products, the manufacturer’s attention to customer service and the marketing support that the manufacturer provides to the dealers. We face intense competition from other performance sport boat manufacturers in attracting and retaining dealers, and we cannot assure you that we will be able to attract or retain relationships with qualified and successful dealers. We cannot assure you that we will be able to maintain or improve our relationship with our dealers or our market share position. A substantial deterioration in the number of dealers or quality of our network of dealers would have a material adverse effect on our business, financial condition and results of operations.
Our success depends, in part, upon the financial health of our dealers and their continued access to financing.
Because we sell nearly all of our products through dealers, their financial health is critical to our success. Our business, financial condition and results of operations may be adversely affected if the financial health of the dealers that sell our products suffers. Their financial health may suffer for a variety of reasons, including a downturn in general economic
22
conditions, rising interest rates, higher rents, increased labor costs and taxes, compliance with regulations and personal financial issues.
In addition, our dealers require adequate liquidity to finance their operations, including purchases of our products. Dealers are subject to numerous risks and uncertainties that could unfavorably affect their liquidity positions, including, among other things, continued access to adequate financing sources on a timely basis on reasonable terms. These sources of financing are vital to our ability to sell products through our distribution network. Access to floor plan financing generally facilitates our dealers’ ability to purchase boats from us, and their financed purchases reduce our working capital requirements. If floor plan financing were not available to our dealers, our sales and our working capital levels would be adversely affected. The availability and terms of financing offered by our dealers’ floor plan financing providers will continue to be influenced by:
|
•
|
their ability to access certain capital markets and to fund their operations in a cost-effective manner;
|
|
•
|
the performance of their overall credit portfolios;
|
|
•
|
their willingness to accept the risks associated with lending to dealers; and
|
|
•
|
the overall creditworthiness of those dealers.
|
We may be required to repurchase inventory of certain dealers.
Many of our dealers have floor plan financing arrangements with third-party finance companies that enable the dealers to purchase our products. In connection with these agreements, we may have an obligation to repurchase our products from a finance company under certain circumstances, and we may not have any control over the timing or amount of any repurchase obligation nor have access to capital on terms acceptable to us to satisfy any repurchase obligation. This obligation is triggered if a dealer defaults on its debt obligations to a finance company, the finance company repossesses the boat and the boat is returned to us. Our obligation to repurchase a repossessed boat for the unpaid balance of our original invoice price for the boat is subject to reduction or limitation based on the age and condition of the boat at the time of repurchase, and in certain cases by an aggregate cap on repurchase obligations associated with a particular floor financing program. If we were obligated to repurchase a significant number of units under any repurchase agreement, our business, operating results and financial condition could be adversely affected.
If we fail to manage our manufacturing levels while still addressing the seasonal retail pattern for our products, our business and margins may suffer.
The seasonality of retail demand for our products, together with our goal of balancing production throughout the year, requires us to manage our manufacturing and allocate our products to our dealer network to address anticipated retail demand. Our dealers must manage seasonal changes in consumer demand and inventory. If our dealers reduce their inventories in response to weakness in retail demand, we could be required to reduce our production, resulting in lower rates of absorption of fixed costs in our manufacturing and, therefore, lower margins. As a result, we must balance the economies of level production with the seasonal retail sales pattern experienced by our dealers. Failure to adjust manufacturing levels adequately may have a material adverse effect on our financial condition and results of operations.
We have a large fixed cost base that will affect our profitability if our sales decrease.
The fixed cost levels of operating a powerboat manufacturer can put pressure on profit margins when sales and production decline. Our profitability depends, in part, on our ability to spread fixed costs over a sufficiently large number of products sold and shipped, and if we make a decision to reduce our rate of production, gross or net margins could be negatively affected. Consequently, decreased demand or the need to reduce production can lower our ability to absorb fixed costs and materially impact our financial condition or results of operations.
Our industry is characterized by intense competition, which affects our sales and profits.
The performance sport boat category, and the powerboat industry as a whole, is highly competitive for consumers and dealers. We also compete against consumer demand for used boats. Competition affects our ability to succeed in both the markets we currently serve and new markets that we may enter in the future. Competition is based primarily on brand name, price, product selection and product performance. We compete with several large manufacturers that may have greater financial, marketing and other resources than we do and who are represented by dealers in the markets in which we now operate and into which we plan to expand. We also compete with a variety of small, independent manufacturers. We cannot assure you that we will not face greater competition from existing large or small manufacturers or that we will be able to compete successfully with new competitors. Our failure to compete effectively with our current and future competitors would adversely affect our business, financial condition and results of operations.
23
Our sales may be adversely impacted by increased consumer preference for used boats or the supply of new boats by competitors in excess of demand.
During the economic downturn, we observed a shift in consumer demand toward purchasing more used boats, primarily because prices for used boats are typically lower than retail prices for new boats. If this were to continue or occur again, it could have the effect of reducing demand among retail purchasers for our new boats. Also, while we have taken steps designed to balance production volumes for our boats with demand, our competitors could choose to reduce the price of their products, which could have the effect of reducing demand for our new boats. Reduced demand for new boats could lead to reduced sales by us, which could adversely affect our business, results of operations or financial condition.
Our sales and profitability depend, in part, on the successful introduction of new products.
Market acceptance of our products depends on our technological innovation and our ability to implement technology in our boats. Our sales and profitability may be adversely affected by difficulties or delays in product development, such as an inability to develop viable or innovative new products. Our failure to introduce new technologies and product offerings that our markets desire could adversely affect our business, financial condition and results of operations. Also, we have been able to achieve higher margins in part as a result of the introduction of new features or enhancements to our existing boat models. If we fail to introduce new features or those we introduce, such as the Wakesetter 24 MXZ, fail to gain market acceptance, our margins may suffer.
In addition, some of our direct competitors and indirect competitors may have significantly more resources to develop and patent new technologies. It is possible that our competitors will develop and patent equivalent or superior technologies and other products that compete with ours. They may assert these patents against us and we may be required to license these patents on unfavorable terms or cease using the technology covered by these patents, either of which would harm our competitive position and may materially adversely affect our business.
We also cannot be certain that our products or technologies have not infringed or will not infringe the proprietary rights of others. Any such infringement could cause third parties, including our competitors, to bring claims against us, resulting in significant costs and potential damages.
We compete with a variety of other activities for consumers’ scarce leisure time.
Our boats are used for recreational and sport purposes, and demand for our boats may be adversely affected by competition from other activities that occupy consumers’ leisure time and by changes in consumer life style, usage pattern or taste. Similarly, an overall decrease in consumer leisure time may reduce consumers’ willingness to purchase and enjoy our products.
Our success depends upon the continued strength of our brands, Malibu and Axis, and the value of our brands and sales of our products could be diminished if we, the athletes who use our products or the sports and activities in which our products are used, are associated with negative publicity.
We believe that our brands, Malibu and Axis, are significant contributors to the success of our business and that maintaining and enhancing our brands are important to expanding our consumer and dealer base. Failure to continue to protect our brands may adversely affect our business, financial condition and results of operations.
Negative publicity, including that resulting from severe injuries or death occurring in the sports and activities in which our products are used, could negatively affect our reputation and result in restrictions, recalls or bans on the use of our products. Further, actions taken by athletes associated with our products that harm the reputations of those athletes could also harm our brand image and adversely affect our financial condition. If the popularity of the sports and activities for which we design, manufacture and sell products were to decrease as a result of these risks or any negative publicity, sales of our products could decrease, which could have an adverse effect on our net revenue, profitability and operating results. In addition, if we become exposed to additional claims and litigation relating to the use of our products, our reputation may be adversely affected by such claims, whether or not successful, including by generating potential negative publicity about our products, which could adversely impact our business and financial condition.
We may not be able to execute our manufacturing strategy successfully, which could cause the profitability of our products to suffer.
Our manufacturing strategy is designed to improve product quality and increase productivity, while reducing costs and increasing flexibility to respond to ongoing changes in the marketplace. To implement this strategy, we must be successful in our continuous improvement efforts, which depend on the involvement of management, production employees and suppliers. Any inability to achieve these objectives could adversely impact the profitability of our products and our ability to deliver desirable products to our consumers.
24
Our ability to meet our manufacturing workforce needs is crucial to our results of operations and future sales and profitability.
We rely on the existence of an available hourly workforce to manufacture our boats. We cannot assure you that we will be able to attract and retain qualified employees to meet current or future manufacturing needs at a reasonable cost, or at all. Although none of our employees is currently covered by collective bargaining agreements, we cannot assure you that our employees will not elect to be represented by labor unions in the future. Additionally, competition for qualified employees could require us to pay higher wages to attract a sufficient number of employees. Significant increases in manufacturing workforce costs could materially adversely affect our business, financial condition or results of operations.
We rely on third-party suppliers and may be unable to obtain adequate raw materials and components.
We depend on third-party suppliers to provide components and raw materials essential to the construction of our boats. Historically, we have not entered into long-term agreements with our suppliers, but have developed 90-day forecast models with our major suppliers to minimize disruptions in our supply chain. While we believe that our relationships with our current suppliers are sufficient to provide the materials necessary to meet present production demand, we cannot assure you that these relationships will continue or that the quantity or quality of materials available from these suppliers will be sufficient to meet our future needs, irrespective of whether we successfully implement our growth strategy. In particular, the availability and cost of engines used in the manufacture of our boats are critical. For fiscal years
2014
and
2013
, we purchased approximately 90% and nearly 100%, respectively, of the engines for our boats from a single supplier. If we are required to replace this supplier or the supplier of any other key components or raw materials, it could cause a decrease in products available for sale or an increase in the cost of goods sold, either of which could adversely affect our business, financial condition and results of operations.
We depend upon key personnel and we may not be able to retain them nor to attract, assimilate and retain highly qualified employees in the future.
Our future success will depend in significant part upon the continued service of our senior management team and our continuing ability to attract, assimilate and retain highly qualified and skilled managerial, product development, manufacturing, marketing and other personnel. The loss of the services of any members of our senior management or other key personnel or the inability to hire or retained qualified personnel in the future could adversely affect our business, financial condition and results of operations.
We may attempt to grow our business through acquisitions or strategic alliances and new partnerships, which we may not be successful in completing or integrating.
We may in the future explore acquisitions and strategic alliances, such as our potential acquisition of our Australian licensee, that will enable us to acquire complementary skills and capabilities, offer new products, expand our consumer base, enter new product categories or geographic markets and obtain other competitive advantages. We cannot assure you, however, that we will identify acquisition candidates or strategic partners that are suitable to our business, obtain financing on satisfactory terms, complete acquisitions or strategic alliances or successfully integrate acquired operations into our existing operations. Once integrated, acquired operations may not achieve anticipated levels of sales or profitability, or otherwise perform as expected. Acquisitions also involve special risks, including risks associated with unanticipated challenges, liabilities and contingencies, and diversion of management attention and resources from our existing operations.
Our reliance upon patents, trademark laws and contractual provisions to protect our proprietary rights may not be sufficient to protect our intellectual property from others who may sell similar products and may lead to costly litigation. We are currently, and may be in the future, party to lawsuits and other intellectual property rights claims that are expensive and time-consuming.
We hold patents and trademarks relating to various aspects of our products and believe that proprietary technical know-how is important to our business. Proprietary rights relating to our products are protected from unauthorized use by third parties only to the extent that they are covered by valid and enforceable patents or trademarks or are maintained in confidence as trade secrets. We cannot be certain that we will be issued any patents from any pending or future patent applications owned by or licensed to us or that the claims allowed under any issued patents will be sufficiently broad to protect our technology. In the absence of enforceable patent or trademark protection, we may be vulnerable to competitors who attempt to copy our products, gain access to our trade secrets and know-how or diminish our brand through unauthorized use of our trademarks, all of which could adversely affect our business.
In addition, others may initiate litigation or other proceedings to challenge the validity of our patents, or allege that we infringe their patents, or they may use their resources to design comparable products that do not infringe our patents. We may
25
incur substantial costs if our competitors initiate litigation to challenge the validity of our patents, or allege that we infringe their patents, or if we initiate any proceedings to protect our proprietary rights. Further, we may need to engage in future litigation to enforce intellectual property rights to protect trade secrets or to determine the validity and scope of proprietary rights of others. If the outcome of any such litigation is unfavorable to us, our business, financial condition and results of operations could be adversely affected.
We are currently a party to a legal proceeding arising from intellectual property matters. We are a plaintiff in a Tennessee lawsuit alleging infringement by a competitor of our patent rights in certain wake surfing technology. We also were a defendant in a lawsuit alleging patent infringement and related claims in connection with windshields installed in our boats that we purchased from a third-party supplier. We resolved this lawsuit with the plaintiffs in September 2014 and have agreed to pay $20.0 million in cash to the plaintiffs upon the entry into a definitive settlement agreement or such later date as the parties agree. We accrued a one-time charge of $20.0 million for the settlement in the fiscal year ended June 30, 2014. For more information, see Note 14 to our audited consolidated financial statements included elsewhere in this Annual Report. Although we do not believe that the remaining unresolved lawsuit will have a material adverse effect on our business, financial condition or results of operations, we cannot predict its outcome, and an unfavorable outcome could have an adverse impact on our business, financial condition or results of operation. Regardless of the outcome of such litigation or similar litigation in the future, it could significantly increase our costs and divert management’s attention from operation of our business, which could adversely affect our financial condition and results of operations.
Product liability, warranty and recall claims may materially affect our financial condition and damage our reputation.
We are engaged in a business that exposes us to claims for product liability and warranty claims in the event our products actually or allegedly fail to perform as expected or the use of our products results, or is alleged to result, in property damage, personal injury or death. Although we maintain product and general liability insurance of the types and in the amounts that we believe are customary for the industry, we are not fully insured against all such potential claims. We may experience legal claims in excess of our insurance coverage or claims that are not covered by insurance, either of which could adversely affect our business, financial condition and results of operations. Adverse determination of material product liability and warranty claims made against us could have a material adverse effect on our financial condition and harm our reputation. In addition, if any of our products are, or are alleged to be, defective, we may be required to participate in a recall of that product if the defect or alleged defect relates to safety. These and other claims we face could be costly to us and require substantial management attention.
Our international markets require significant management attention, expose us to difficulties presented by international economic, political, legal and business factors, and may not be successful or produce desired levels of sales and profitability.
We currently sell our products throughout the world. Our total sales outside North America (including licensing royalties from our Australian licensee) were less than 10% of our total revenue for fiscal year
2014
and fiscal year
2013
. International markets have, and will continue to be, a focus for sales growth. We believe many opportunities exist in the international markets, and over time we intend for international sales to comprise a larger percentage of our total revenue. Several factors, including weakened international economic conditions, could adversely affect such growth. The expansion of our existing international operations and entry into additional international markets require significant management attention. Some of the countries in which we market and our distributors or licensee sell our products are to some degree subject to political, economic or social instability. Our international operations expose us and our representatives, agents and distributors to risks inherent in operating in foreign jurisdictions. These risks include, but are not limited to:
|
•
|
increased costs of customizing products for foreign countries;
|
|
•
|
unfamiliarity with local demographics, consumer preferences and discretionary spending patterns;
|
|
•
|
the imposition of additional foreign governmental controls or regulations, including rules relating to environmental, health and safety matters and regulations and other laws applicable to publicly-traded companies, such as the Foreign Corrupt Practices Act, or the FCPA;
|
|
•
|
new or enhanced trade restrictions and restrictions on the activities of foreign agents, representatives and distributors;
|
|
•
|
the imposition of increases in costly and lengthy import and export licensing and other compliance requirements, customs duties and tariffs, license obligations and other non-tariff barriers to trade;
|
|
•
|
the relative strength of the U.S. dollar compared to local currency, making our products less price-competitive relative to products manufactured outside of the United States;
|
26
|
•
|
laws and business practices favoring local companies;
|
|
•
|
longer payment cycles and difficulties in enforcing agreements and collecting receivables through certain foreign legal systems; and
|
|
•
|
difficulties in enforcing or defending intellectual property rights.
|
Our international operations may not produce desired levels of total sales, or one or more of the foregoing factors may harm our business, financial condition or results of operations.
An increase in energy costs may adversely affect our business, financial condition and results of operations.
Higher energy costs result in increases in operating expenses at our manufacturing facility and in the expense of shipping products to our dealers. In addition, increases in energy costs may adversely affect the pricing and availability of petroleum-based raw materials, such as resins and foams, that are used in our products. Also, higher fuel prices may have an adverse effect on demand for our boats, as they increase the cost of ownership and operation.
We are subject to U.S. and other anti-corruption laws, trade controls, economic sanctions and similar laws and regulations, including those in the jurisdictions where we operate. Our failure to comply with these laws and regulations could subject us to civil, criminal and administrative penalties and harm our reputation.
Doing business on a worldwide basis requires us to comply with the laws and regulations of various foreign jurisdictions. These laws and regulations place restrictions on our operations, trade practices, partners and investment decisions. In particular, our operations are subject to U.S. and foreign anti-corruption and trade control laws and regulations, such as the FCPA, export controls and economic sanctions programs, including those administered by the U.S. Treasury Department’s Office of Foreign Assets Control, or the OFAC. As a result of doing business in foreign countries and with foreign partners, we are exposed to a heightened risk of violating anti-corruption and trade control laws and sanctions regulations.
The FCPA prohibits us from providing anything of value to foreign officials for the purposes of obtaining or retaining business or securing any improper business advantage. It also requires us to keep books and records that accurately and fairly reflect our transactions.
Economic sanctions programs restrict our business dealings with certain sanctioned countries, persons and entities. In addition, because we act through dealers and distributors, we face the risk that our dealers, distributors or consumers might further distribute our products to a sanctioned person or entity, or an ultimate end-user in a sanctioned country, which might subject us to an investigation concerning compliance with OFAC or other sanctions regulations.
Violations of anti-corruption and trade control laws and sanctions regulations are punishable by civil penalties, including fines, denial of export privileges, injunctions, asset seizures, debarment from government contracts and revocations or restrictions of licenses, as well as criminal fines and imprisonment. We cannot assure you that all of our local, strategic or joint partners will comply with these laws and regulations, in which case we could be held liable for actions taken inside or outside of the United States, even though our partners may not be subject to these laws. Such a violation could materially and adversely affect our reputation, business, results of operations and financial condition. Our continued international expansion, including in developing countries, and our development of new partnerships and joint venture relationships worldwide, could increase the risk of FCPA or OFAC violations in the future.
If we are unable to comply with environmental and other regulatory requirements, our business may be exposed to material liability or fines.
Our operations are subject to extensive regulation, including product safety, environmental and health and safety requirements, under various federal, state, local and foreign statutes, ordinances and regulations. While we believe that we are in material compliance with all applicable federal, state, local and foreign regulatory requirements, we cannot assure you that we will be able to continue to comply with applicable regulatory requirements. The failure to comply with applicable regulatory requirements could cause us to incur significant fines or penalties or could materially increase the cost of operations. In addition, legal requirements are constantly evolving, and changes in laws, regulations or policies, or changes in interpretations of the foregoing, could also increase our costs or create liabilities where none exists today.
As with boat construction in general, our manufacturing processes involve the use, handling, storage and contracting for recycling or disposal of hazardous substances and wastes. The failure to manage or dispose of such hazardous substances and wastes properly could expose us to material liability or fines. Also, the components to our boats may become subject to more stringent environmental regulations. For example, boat engines may be subject to more stringent emissions standards, which could increase the cost of our engines and our products, which, in turn, may reduce consumer demand for our products.
27
A natural disaster or other disruption at our manufacturing facilities could adversely affect our business, financial condition and results of operations.
We rely on the continuous operation of manufacturing facilities in Tennessee and California. Any natural disaster or other serious disruption to our facilities due to fire, flood, earthquake or any other unforeseen circumstances could adversely affect our business, financial condition and results of operations. The occurrence of any disruption at our manufacturing facilities may have an adverse effect on our productivity and profitability, during and after the period of the disruption. These disruptions may also cause personal injury and loss of life, severe damage to or destruction of property and equipment and environmental damage. Although we maintain property, casualty and business interruption insurance of the types and in the amounts that we believe are customary for the industry, we are not fully insured against all potential natural disasters or other disruptions to our manufacturing facilities.
Increases in income tax rates or changes in income tax laws or enforcement could have a material adverse impact on our financial results.
Changes in domestic and international tax legislation could expose us to additional tax liability. Although we monitor changes in tax laws and work to mitigate the impact of proposed changes, such changes may negatively impact our financial results. In addition, any increase in individual income tax rates, such as those implemented at the beginning of 2013, would negatively affect our potential consumers’ discretionary income and could decrease the demand for our products.
Our credit facilities contain covenants which may limit our operating flexibility; failure to comply with covenants may restrict our access to these.
In the past, we have relied upon our existing credit facilities to provide us with adequate liquidity to operate our business. The availability of borrowing amounts under our credit facilities are dependent upon compliance with the debt covenants set forth in our credit agreement. Violation of those covenants, whether as a result of operating losses or otherwise, could result in our lenders restricting or terminating our borrowing ability under our credit facilities. If our lenders reduce or terminate our access to amounts under our credit facilities, we may not have sufficient capital to fund our working capital and other needs and we may need to secure additional capital or financing to fund our operations or to repay outstanding debt under our credit facilities. We cannot assure you that we will be successful in ensuring our availability to amounts under our credit facilities or in connection with raising additional capital and that any amount, if raised, will be sufficient to meet our cash needs or on terms as favorable as have historically been available to us. If we are not able to maintain our borrowing availability under our credit facilities or raise additional capital when needed, our business and operations will be materially and adversely affected.
We are an “emerging growth company” and we cannot be certain if the reduced disclosure requirements applicable to emerging growth companies will make our Class A Common Stock less attractive to investors.
We are an “emerging growth company” as defined in the Jumpstart Our Business Starups Act, or the JOBS Act. We have taken, and for as long as we continue to be an emerging growth company, we may choose to take, advantage of certain exemptions from various reporting requirements applicable to other public companies but not to emerging growth companies, which includes, among other things:
|
•
|
exemption from the auditor attestation requirements under Section 404 of the Sarbanes-Oxley Act;
|
|
•
|
reduced disclosure obligations regarding executive compensation in our periodic reports and proxy statements;
|
|
•
|
exemption from the requirements of holding non-binding stockholder votes on executive compensation arrangements; and
|
|
•
|
exemption from any public rules requiring mandatory audit firm rotation and auditor discussion and analysis and, unless the SEC otherwise determines, any future audit rules that may be adopted by the Public Company Accounting Oversight Board.
|
We could be an emerging growth company until the last day of the fiscal year following the fifth anniversary after our initial public offering (June 30, 2019) or until the earliest of (1) the last day of the fiscal year in which we have annual gross revenue of $1 billion or more, (2) the date on which we have, during the previous three-year period, issued more than $1 billion in non-convertible debt or (3) the date on which we are deemed to be a large accelerated filer under the federal securities laws. We will qualify as a large accelerated filer as of the first day of the first fiscal year after we have (a) more than $700 million in outstanding common equity held by our non-affiliates and (b) been public for at least 12 months. The value of our outstanding common equity will be measured each year on the last day of our second fiscal quarter.
28
Under the JOBS Act, emerging growth companies are also permitted to elect to delay adoption of new or revised accounting standards until companies that are not subject to periodic reporting obligations are required to comply, if such accounting standards apply to non-reporting companies. We have made an irrevocable decision to opt out of this extended transition period for complying with new or revised accounting standards.
We cannot predict if investors will find our Class A Common Stock less attractive if we rely on these exemptions. If some investors find our Class A Common Stock less attractive as a result, there may be less active trading market for our Class A Common Stock and our stock price may be more volatile.
We will incur significant increased costs as a result of being a new public company, and our management will be required to devote substantial time to comply with the laws and regulations affecting public companies, particularly after we are no longer an emerging growth company.
We recently became a public company on January 30, 2014. As a public company, particularly after we cease to qualify as an emerging growth company, we will incur significant legal, accounting and other expenses that we did not incur as a private company, including costs associated with public company reporting and corporate governance requirements, in order to comply with the rules and regulations imposed by the Sarbanes-Oxley Act, as well as rules implemented by the SEC and NASDAQ Stock Market, LLC, or NASDAQ. Our management and other personnel will need to devote a substantial amount of time to these compliance initiatives and our legal and accounting compliance costs will increase. It is likely that we will need to hire additional staff in the areas of investor relations, legal and accounting as we continue to operate as a public company. We also believe these new rules and regulations make it more difficult and expensive for us to obtain director and liability insurance, and we may be required to accept reduced policy limits and coverage or incur substantially higher costs to obtain the same or similar coverage. As a result, it may be more difficult for us to attract and retain qualified individuals to serve on our board of directors or as executive officers. We are currently evaluating and monitoring developments with respect to these rules, and we cannot predict or estimate the amount of additional costs we may incur in the future or the timing of such costs.
For example, the Sarbanes-Oxley Act requires, among other things, that we maintain effective internal controls over financial reporting and disclosure controls and procedures. In particular, as a public company, we will be required to perform system and process evaluations and testing of our internal control over financial reporting to allow management and our independent registered public accounting firm to report on the effectiveness of our internal controls over financial reporting, as required by Section 404 of the Sarbanes-Oxley Act. As an emerging growth company, we will not need to comply with the auditor attestation provisions of Section 404 for several years. Our testing, or the subsequent testing by our independent registered public accounting firm, may reveal deficiencies in our internal control over financial reporting that are deemed to be material weaknesses. Our compliance with Section 404 will require that we incur substantial accounting expense and management time on compliance-related issues. Moreover, if we are not able to comply with the requirements of Section 404 in a timely manner, or if we or our independent registered public accounting firm identify deficiencies in our internal control over financial reporting that are deemed to be material weaknesses, we could lose investor confidence in the accuracy and completeness of our financial reports, which could cause our stock price to decline.
When the available exemptions under the JOBS Act cease to apply, we expect to incur additional expenses and devote increased management effort toward ensuring compliance with them. We cannot predict or estimate the amount of additional costs we may incur as a result of becoming a public company or the timing of such costs.
Risks Related to Our Organizational Structure
Our only material asset is our interest in the LLC, and we are accordingly dependent upon distributions from the LLC to pay taxes, make payments under the tax receivable agreement or pay dividends.
Malibu Boats, Inc. is a holding company and has no material assets other than our ownership of LLC Units. Malibu Boats, Inc. has no independent means of generating revenue. We intend to cause the LLC to make distributions to its unit holders in an amount sufficient to cover all applicable taxes at assumed tax rates, payments under the tax receivable agreement and dividends, if any, declared by us. To the extent that we need funds, and the LLC is restricted from making such distributions under applicable law or regulation or under the terms of its financing arrangements, or is otherwise unable to provide such funds, it could materially adversely affect our liquidity and financial condition. For example, our credit agreement generally prohibits the LLC, Malibu Boats, LLC and Malibu Domestic International Sales Corp. from paying dividends or making distributions. Our credit agreement permits, however, distributions based on a member’s allocated taxable income, distributions to fund payments that are required under the tax receivable agreement, payments pursuant to stock option and other benefit plans up to $2 million in any fiscal year, dividends and distributions within the loan parties and dividends payable solely in interests of classes of securities. In addition, the LLC may make dividends and distributions of up to $4,000,000 in any fiscal year, subject to compliance with other financial covenants.
29
We will be required to pay the pre-IPO owners (or any permitted assignees) for certain tax benefits pursuant to our tax receivable agreement with them, and the amounts we may pay could be significant.
Malibu Boats, Inc. used a portion of the proceeds from the IPO and follow-on offering to purchase LLC Units from the LLC members. We entered into a tax receivable agreement with the pre-IPO owners that provides for the payment by us to the pre-IPO owners (or any permitted assignees) of 85% of the tax benefits, if any, that we are deemed to realize as a result of (1) the increases in tax basis resulting from our purchases or exchanges of LLC Units and (2) certain other tax benefits related to our entering into the tax receivable agreement, including tax benefits attributable to payments under the tax receivable agreement. These payment obligations are our obligations and not of the LLC. For purposes of the agreement, the benefit deemed realized by us will be computed by comparing our actual income tax liability (calculated with certain assumptions) to the amount of such taxes that we would have been required to pay had there been no increase to the tax basis of the assets of the LLC as a result of the purchases or exchanges, and had we not entered into the tax receivable agreement. Estimating the amount of payments that may be made under the tax receivable agreement is by its nature imprecise, insofar as the calculation of amounts payable depends on a variety of factors. The actual increase in tax basis, as well as the amount and timing of any payments under the agreement, will vary depending upon a number of factors, including:
|
•
|
the timing of purchases or exchanges
-for instance, the increase in any tax deductions will vary depending on the fair value, which may fluctuate over time, of the depreciable or amortizable assets of the LLC at the time of each purchase or exchange;
|
|
•
|
the price of shares of our Class A Common Stock at the time of the purchase or exchange
-the increase in any tax deductions, as well as the tax basis increase in other assets, of the LLC is directly related to the price of shares of our Class A Common Stock at the time of the purchase or exchange;
|
|
•
|
the extent to which such purchases or exchanges are taxable
-if an exchange or purchase is not taxable for any reason, increased deductions will not be available; and
|
|
•
|
the amount and timing of our income
-the corporate taxpayer will be required to pay 85% of the deemed benefits as and when deemed realized. If we do not have taxable income, we generally will not be required (absent a change of control or other circumstances requiring an early termination payment) to make payments under the tax receivable agreement for that taxable year because no benefit will have been realized. However, any tax benefits that do not result in realized benefits in a given tax year will likely generate tax attributes that may be utilized to generate benefits in previous or future tax years. The utilization of such tax attributes will result in payments under the tax receivable agreement.
|
For more information see "Item 1. Business - History and Formation Transactions" and Note 2 to our audited consolidated financial statements included elsewhere in this Annual Report.
We expect that the payments that we may make under the tax receivable agreement may be substantial. Assuming no material changes in the relevant tax law, and that we earn sufficient taxable income to realize all tax benefits that are subject to the agreement, we expect that future payments under the tax receivable agreement relating to the purchases by Malibu Boats, Inc. of LLC Units as part of the Recapitalization, the IPO and the follow-on offering will be approximately $47.7 million over the next 15 years. Future payments to the pre-IPO owners (or their permitted assignees) in respect of subsequent exchanges or purchases would be in addition to these amounts and are expected to be substantial. The foregoing numbers are merely estimates and the actual payments could differ materially. It is possible that future transactions or events could increase or decrease the actual tax benefits realized and the corresponding tax receivable agreement payments. There may be a material negative effect on our liquidity if distributions to us by the LLC are not sufficient to permit us to make payments under the tax receivable agreement after we have paid taxes. For example, we may have an obligation to make tax receivable agreement payments for a certain amount while receiving distributions from the LLC in a lesser amount, which would negatively affect our liquidity. The payments under the tax receivable agreement are not conditioned upon the pre-IPO owners’ (or any permitted assignees’) continued ownership of us.
We are required to make a good faith effort to ensure that we have sufficient cash available to make any required payments under the tax receivable agreement. The limited liability company agreement of the LLC requires the LLC to make “tax distributions” which, in the ordinary course, will be sufficient to pay our actual tax liability and to fund required payments under the tax receivable agreement. If for any reason the LLC is not able to make a tax distribution in an amount that is sufficient to make any required payment under the tax receivable agreement or we otherwise lack sufficient funds, interest would accrue on any unpaid amounts at the London Interbank Offered Rate, or LIBOR, plus 500 basis points until they are paid.
30
In certain cases, payments under the tax receivable agreement to the pre-IPO owners (or any permitted assignees) may be accelerated or significantly exceed the actual benefits we realize in respect of the tax attributes subject to the tax receivable agreement.
The tax receivable agreement provides that, in the event that we exercise our right to early termination of the tax receivable agreement, or in the event of a change in control or a material breach by us of our obligations under the tax receivable agreement, the tax receivable agreement will terminate, and we will be required to make a lump-sum payment equal to the present value of all forecasted future payments that would have otherwise been made under the tax receivable agreement, which lump-sum payment would be based on certain assumptions, including those relating to our future taxable income. The change in control payment and termination payments to the pre-IPO owners (or any permitted assignees) could be substantial and could exceed the actual tax benefits that we receive as a result of acquiring the LLC Units because the amounts of such payments would be calculated assuming that we would have been able to use the potential tax benefits each year for the remainder of the amortization periods applicable to the basis increases, and that tax rates applicable to us would be the same as they were in the year of the termination. In these situations, our obligations under the tax receivable agreement could have a substantial negative impact on our liquidity. There can be no assurance that we will be able to finance our obligations under the tax receivable agreement.
Payments under the tax receivable agreement will be based on the tax reporting positions that we determine. Although we are not aware of any issue that would cause the Internal Revenue Service, or the IRS, to challenge a tax basis increase, Malibu Boats, Inc. will not be reimbursed for any payments previously made under the tax receivable agreement. As a result, in certain circumstances, payments could be made under the tax receivable agreement in excess of the benefits that Malibu Boats, Inc. actually realizes in respect of (1) the increases in tax basis resulting from our purchases or exchanges of LLC Units and (2) certain other tax benefits related to our entering into the tax receivable agreement, including tax benefits attributable to payments under the tax receivable agreement.
We have entered into a voting agreement with Black Canyon Management LLC, which provides it with rights to nominate a number of designees to our board of directors.
In connection with our Recapitalization and IPO, we entered into a voting agreement with certain affiliates. Under the voting agreement, Black Canyon Management LLC is entitled to nominate to our board of directors a number of designees equal to (1) 20% of the total number of directors comprising our board of directors at such time, so long as specified entities affiliated with Black Canyon Management LLC (and their permitted transferees) and Messrs. Springer, Wilson and Anderson together beneficially own 15% or more of the voting power of the shares of Class A Common Stock and Class B Common Stock entitled to vote generally in the election of directors, voting together as a single class, and (2) 10% of the total number of directors comprising the board of directors at such time, so long as specified entities affiliated with Black Canyon Management LLC (and their permitted transferees) and Messrs. Springer, Wilson and Anderson together beneficially own more than 5% but less than 15% of the voting power of the shares of Class A Common Stock and Class B Common Stock entitled to vote generally in the election of directors, voting together as a single class. In addition, Black Canyon Management LLC has the right to remove and replace its director-designees at any time and for any reason and to nominate any individuals to fill any such vacancies. Messrs. Springer, Wilson and Anderson will be required to vote any of their Class A Common Stock and Class B Common Stock in favor of the director or directors nominated by Black Canyon Management LLC. As of September 24, 2014, the specified entities affiliated with Black Canyon Management LLC, their permitted transferees, and Messrs. Springer, Wilson and Anderson own (as calculated pursuant to the voting agreement) approximately 21.6% of the voting power of the shares of Class A Common Stock and Class B Common Stock, voting together as a single class. It is possible that the interests of Black Canyon Management LLC may in some circumstances conflict with our interests and the interests of our other stockholders.
Affiliates of Black Canyon Capital LLC have certain consent rights that could limit the ability of stockholders to influence the outcome of key transactions, including a sale of Malibu Boats, Inc.
The amended and restated limited liability company agreement of the LLC provides that Malibu Boats, Inc., as managing member of the LLC, has the right to require all members to exchange their LLC Units for Class A Common Stock in accordance with the terms of the exchange agreement, subject to the consent of Black Canyon Management LLC and the holders of a majority of outstanding LLC Units other than those held by Malibu Boats, Inc. This consent right could impede the ability of Malibu Boats, Inc. to take certain actions that might benefit its stockholders, including a sale of Malibu Boats, Inc. The interests of Black Canyon Management LLC may conflict with or differ from our interests and the interests of our other stockholders.
The consent of Black Canyon Management LLC will be required for certain amendments to the limited liability company agreement of the LLC.
31
The limited liability company agreement of the LLC provides that, for so long as specified entities affiliated with Black Canyon Management LLC and their permitted transferees own an amount of LLC Units equal to at least 5% of the LLC Units that were outstanding immediately following our IPO, after giving effect to the use of proceeds therefrom, or 568,687 LLC Units, the consent of Black Canyon Management LLC will be required for any amendment to the limited liability company agreement that would:
|
•
|
reduce the rights of a holder of LLC Units to receive tax distributions, except on a pro rata basis with other holders of LLC Units;
|
|
•
|
preclude or limit the rights of any member to exercise its rights under the exchange agreement;
|
|
•
|
require any member to make a capital contribution;
|
|
•
|
materially increase the obligations of any member under the limited liability company agreement; or
|
|
•
|
result in the LLC being treated as a corporation for tax purposes.
|
Specified entities affiliated with Black Canyon Management LLC and their permitted transferees own (as calculated pursuant to the LLC Agreement) 2,858,094 LLC Units as of September 24, 2014. The interests of the entities affiliated with Black Canyon Management LLC may conflict with or differ from our interests and the interests of our other stockholders.
Risks Related to Our Class A Common Stock
Our stock price may be volatile and stockholders may be unable to sell shares at or above the price at which they purchased them.
The market price of our Class A Common Stock could be subject to wide fluctuations in response to the many risk factors listed in this section, and others beyond our control, including:
|
•
|
general economic, market and industry conditions;
|
|
•
|
actual or anticipated fluctuations in our financial condition and results of operations;
|
|
•
|
addition or loss of consumers or dealers;
|
|
•
|
actual or anticipated changes in our rate of growth relative to our competitors;
|
|
•
|
additions or departures of key personnel;
|
|
•
|
failure to introduce new products, or for those products to achieve market acceptance;
|
|
•
|
disputes or other developments related to proprietary rights, including patents, litigation matters and our ability to obtain intellectual property protection for our technologies;
|
|
•
|
announcements by us or our competitors of significant acquisitions, strategic partnerships, joint ventures or capital commitments;
|
|
•
|
fluctuations in the valuation of companies perceived by investors to be comparable to us;
|
|
•
|
changes in applicable laws or regulations;
|
|
•
|
issuance of new or updated research or reports by securities analysts;
|
|
•
|
sales of our Class A Common Stock by us or our stockholders;
|
|
•
|
share price and volume fluctuations attributable to inconsistent trading volume levels of our shares; and
|
|
•
|
the expiration of contractual lock-up agreements with our executive officers, directors and stockholders.
|
Further, the stock markets may experience extreme price and volume fluctuations that can affect the market prices of equity securities. These fluctuations can be unrelated or disproportionate to the operating performance of those companies. These broad market and industry fluctuations, as well as general economic, political and market conditions such as recessions, interest rate changes or international currency fluctuations, could harm the market price of our Class A Common Stock.
32
In the past, companies that have experienced volatility in the market price of their stock have been subject to securities class action litigation. We may be the target of this type of litigation in the future. Securities litigation against us could result in substantial costs and divert our management’s attention from other business concerns, which could harm our business.
Further, the stock markets may experience extreme price and volume fluctuations that can affect the market prices of equity securities. These fluctuations can be unrelated or disproportionate to the operating performance of those companies. These broad market and industry fluctuations, as well as general economic, political and market conditions such as recessions, interest rate changes or international currency fluctuations, could harm the market price of our Class A Common Stock.
If securities or industry analysts do not publish research or reports about our business, or publish negative reports about our business, our share price and trading volume could decline.
The trading market for our Class A Common Stock will depend on the research and reports that securities or industry analysts publish about us or our business. We do not have any control over these analysts. If one or more of the analysts who cover us downgrade our shares or change their opinion of our shares, our share price would likely decline. If one or more of these analysts cease coverage of our company or fail to regularly publish research or reports on us, we could lose visibility in the financial markets, which could cause our stock price or trading volume to decline.
Future sales of our Class A Common Stock in the public market could cause our share price to fall.
Sales of a substantial number of shares of our Class A Common Stock in the public market, or the perception that these sales might occur, could depress the market price of our Class A Common Stock and could impair our ability to raise capital through the sale of additional equity securities.
Our governing documents and Delaware law could prevent a takeover that stockholders consider favorable and could also reduce the market price of our stock.
Our certificate of incorporation and bylaws contain certain provisions that could delay or prevent a change in control. These provisions could also make it more difficult for stockholders to elect directors and take other corporate actions. These provisions include, without limitation:
|
•
|
a classified board structure;
|
|
•
|
a requirement that stockholders must provide advance notice to propose nominations or have other business considered at a meeting of stockholders;
|
|
•
|
supermajority stockholder approval to amend our bylaws or certain provisions in our certificate of incorporation; and
|
|
•
|
authorization of blank check preferred stock.
|
In addition, we are subject to the provisions of Section 203 of the Delaware General Corporation Law. These provisions may prohibit large stockholders, in particular those owning 15% or more of our outstanding Class A Common Stock, from engaging in certain business combinations without the approval of substantially all of our stockholders for a certain period of time.
These and other provisions in our certificate of incorporation, bylaws and under Delaware law could discourage potential takeover attempts, reduce the price that investors might be willing to pay for shares of our Class A Common Stock in the future and result in the market price being lower than it would be without these provisions.
We currently do not intend to pay dividends on our Class A Common Stock and, consequently, the only opportunity for stockholders to achieve a return on their investment is if the price of our Class A Common Stock appreciates.
We currently do not plan to declare or pay dividends on shares of our Class A Common Stock in the foreseeable future. Further, because we are a holding company, our ability to pay dividends depends on our receipt of cash distributions from the LLC and the LLC also relies on its subsidiaries for receipt of cash for distributions. This may further restrict our ability to pay dividends as a result of the laws of the jurisdiction of organization of the LLC and its subsidiaries, agreements of the LLC or its subsidiaries or covenants under our, the LLC’s or its subsidiaries’ existing or future indebtedness. For example, our credit agreement generally prohibits the LLC, Malibu Boats, LLC and Malibu Domestic International Sales Corp. from paying dividends or making distributions. Our credit agreement permits, however, distributions based on a member’s allocated taxable income, distributions to fund payments that are required under the tax receivable agreement, payments pursuant to stock option and other benefit plans, dividends and distributions within the loan parties and dividends payable solely in interests of classes of securities. In addition, the LLC may make dividends and distributions of up to $4,000,000 in any fiscal year, subject to
33
compliance with other financial covenants. Consequently, for stockholders the only opportunity to achieve a return on the shares they purchase will be if the market price of our Class A Common Stock appreciates and they sell their shares at a profit.
Not applicable.
Tennessee
Our boats are manufactured and tested on the lake at the site of our 144,000 square-foot primary manufacturing facility located in Loudon, Tennessee. We recently added a 9,715 square feet mezzanine to this facility to increase production efficiencies. The construction was completed on July 7, 2014. Our primary facility is leased pursuant to a lease agreement that has a term through March 31, 2028, with the option to extend for three additional terms of ten years each. We also lease:
|
•
|
23,460 square feet of warehouse and office space located in Loudon pursuant to a lease agreement that has a term through December 31, 2014, with an additional renewal term of two years; and
|
|
•
|
approximately 20,000 square feet of warehouse space in Lenoir City, Tennessee pursuant to a lease agreement which expired August 31, 2014 and is currently month-to-month.
|
On August 21, 2014, we completed the construction of our warehouse and loading facility on land we own in Loudon, Tennessee. The 16 acre facility contains approximately 24,000 square feet of warehouse and office space and will be used primarily for storing, handling and shipping of our finished boats.
California
We lease a 150,000 square-foot facility in Merced, California pursuant to a lease agreement that has a term through March 31, 2028, with the option to extend for three additional terms of ten years each. Our Merced site houses both our product development team that focuses on design innovations as well as our tower and tower accessory manufacturing operations. The components assembled at this site are delivered to our facilities in Tennessee and our Australian partner.
The discussion of legal matters under the section entitled "Legal Proceedings" is incorporated by reference from Note 14 of our audited consolidated financial statements included elsewhere in this Annual Report.
Not Applicable.
34
Market Information
Our Class A Common Stock has been listed on the NASDAQ Global Select Market under the symbol “MBUU” since January 31, 2014. Prior to that date, there was no public trading market for our Class A Common Stock. The following table sets forth, for the periods indicated, the high and low sales prices of our Class A Common Stock as reported by the NASDAQ Global Select Market:
|
High
|
Low
|
||||||
|
Third Quarter of Fiscal 2014 (from January 31, 2014)
|
$
|
24.90
|
|
$
|
16.67
|
|
|
|
Fourth Quarter of Fiscal 2014
|
$
|
23.49
|
|
$
|
18.39
|
|
|
On
September 24, 2014
, the last reported sale price on the NASDAQ Global Select Market of our Class A Common Stock was $
19.02
per share. As of
September 24, 2014
, we had approximately
3
holders of record of our Class A Common Stock and
43
holders of record of our Class B Common Stock. The actual number of stockholders is greater than this number of record holders, and includes stockholders who are beneficial owners, but whose shares are held in street name by brokers and other nominees. This number of holders of record also does not include stockholders whose shares may be held in trust by other entities.
Dividends
Malibu Boats, Inc. has never declared or paid any cash dividends on its capital stock. We currently anticipate that we will retain all of our future earnings for use in the expansion and operation of our business and do not anticipate paying any cash dividends in the foreseeable future. Any future determination to declare cash dividends will be made at the discretion of our board of directors, subject to applicable law and will depend on our financial condition, results of operations, capital requirements, general business conditions and other factors that our board of directors may deem relevant. In addition, our credit facility restricts our ability to pay dividends on our capital stock in certain cases.
Malibu Boats, Inc. is a holding company and has no material assets other than its ownership of LLC Units. We intend to cause the LLC to make distributions to us in an amount sufficient to cover cash dividends, if any, declared by us. If the LLC makes such distributions to Malibu Boats, Inc., the other holders of LLC Units will be entitled to receive equivalent distributions on a pro rata basis.
Stock Performance Graph
The stock price performance graph below shall not be deemed soliciting material or to be filed with the SEC or subject to Regulation 14A or 14C under the Exchange Act or to the liabilities of Section 18 of the Exchange Act, nor shall it be incorporated by reference into any past or future filing under the Securities Act of 1933, as amended, or the Securities Act or the Exchange Act, except to the extent we specifically request that it be treated as soliciting material or specifically incorporate it by reference into a filing under the Securities Act or the Exchange Act.
The following graph shows the cumulative total stockholder return of an investment of $100 in cash at market close on January 31, 2014 (the first day of trading of our Class A Common Stock), through June 30, 2014 for (i) our Class A Common Stock and (ii) performance of the Russell 2000 Index and Recreational Vehicle Index for the same period. Pursuant to applicable SEC rules, all values assume reinvestment of the full amount of all dividends, however no dividends have been declared on our Class A Common Stock to date. The stockholder return shown on the graph below is not necessarily indicative of future performance, and we do not make or endorse any predictions as to future stockholder returns.
35
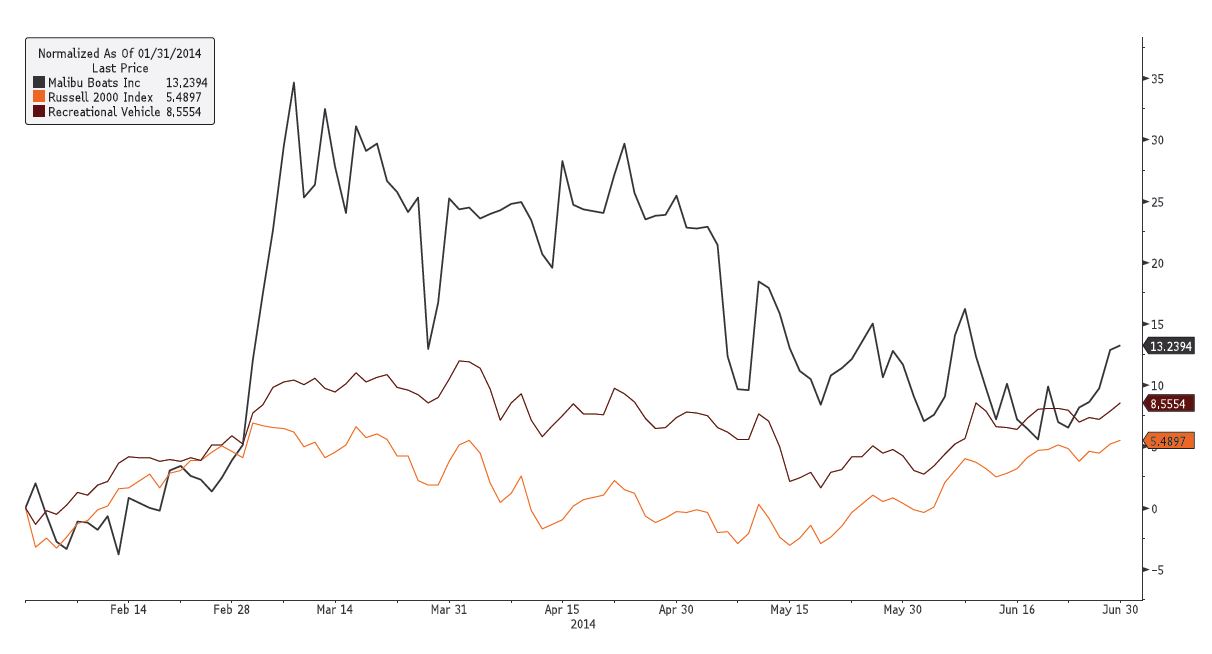
Equity Compensation Plan Information
Equity compensation plan information required by this Item 5 will be included in our definitive proxy statement for our annual meeting of stockholders, which will be filed with the SEC no later than 120 days after the end of our fiscal year ended
June 30, 2014
(the "Proxy Statement"), and is incorporated herein by reference.
36
The following table presents our selected financial data. The table should be read in conjunction with "Item 7. Management’s Discussion and Analysis of Financial Condition and Results of Operations," and "Item 8. Financial Statements and Supplementary Data," of this Annual Report on Form 10-K.
|
|
Fiscal Year Ended June 30,
|
||||||||||||||
|
|
2014
|
2013
|
2012
|
2011
|
|||||||||||
|
|
(Dollars in thousands)
|
||||||||||||||
|
Consolidated statement of operations data:
|
|
|
|
|
|||||||||||
|
Net sales
|
$
|
190,935
|
|
$
|
167,012
|
|
$
|
140,892
|
|
$
|
99,984
|
|
|||
|
Cost of sales
|
140,141
|
|
123,412
|
|
110,849
|
|
83,730
|
|
|||||||
|
Gross profit
|
50,794
|
|
43,600
|
|
30,043
|
|
16,254
|
|
|||||||
|
Operating expenses:
|
|
|
|
|
|
|
|
|
|||||||
|
Selling and marketing
|
6,098
|
|
4,937
|
|
4,071
|
|
3,621
|
|
|||||||
|
General and administrative
1
|
39,974
|
|
14,177
|
|
8,307
|
|
6,194
|
|
|||||||
|
Amortization
|
5,177
|
|
5,178
|
|
5,178
|
|
5,178
|
|
|||||||
|
Operating (loss) income
|
(455
|
)
|
19,308
|
|
12,487
|
|
1,261
|
|
|||||||
|
Other expense, net
|
(2,953
|
)
|
(1,324
|
)
|
(1,381
|
)
|
(1,804
|
)
|
|||||||
|
Net (loss) income before benefit for income taxes
|
(3,408
|
)
|
17,984
|
|
11,106
|
|
(543
|
)
|
|||||||
|
Income tax benefit
|
(2,220
|
)
|
—
|
|
—
|
|
—
|
|
|||||||
|
Net (loss) income
|
(1,188
|
)
|
17,984
|
|
11,106
|
|
(543
|
)
|
|||||||
|
Net (loss) income attributable to non-controlling interest
2
|
3,488
|
|
17,984
|
|
11,106
|
|
(543
|
)
|
|||||||
|
Net loss attributable to Malibu Boats, Inc.
|
$
|
(4,676
|
)
|
$
|
—
|
|
$
|
—
|
|
$
|
—
|
|
|||
|
Net loss available to Class A Common Stock per share
3
:
|
|
|
|
|
|||||||||||
|
Basic
|
$
|
(0.42
|
)
|
|
|
|
|
||||||||
|
Diluted
|
$
|
(0.42
|
)
|
|
|
|
|
||||||||
|
Weighted average shares outstanding used in computing net loss per share:
|
|||||||||||||||
|
Basic
|
11,055,310
|
|
|||||||||||||
|
Diluted
|
11,055,310
|
|
|||||||||||||
|
Consolidated balance sheet data:
|
|
|
|
|
|
|
|
|
|||||||
|
Total assets
|
$
|
84,801
|
|
$
|
65,927
|
|
$
|
64,725
|
|
$
|
60,033
|
|
|||
|
Total liabilities
|
56,731
|
|
45,913
|
|
39,280
|
|
45,566
|
|
|||||||
|
Total stockholders’/members' equity
|
28,070
|
|
20,014
|
|
25,445
|
|
14,467
|
|
|||||||
|
Additional financial and other data:
|
|
|
|
|
|
||||||||||
|
Unit volume
|
2,910
|
|
2,672
|
|
2,482
|
|
1,860
|
|
|||||||
|
Gross margin
|
26.6
|
%
|
26.1
|
%
|
21.3
|
%
|
16.3
|
%
|
|||||||
|
Adjusted EBITDA
4
|
$
|
37,272
|
|
$
|
31,758
|
|
$
|
19,863
|
|
$
|
7,918
|
|
|||
|
Adjusted EBITDA margin
4
|
19.5
|
%
|
19.0
|
%
|
14.1
|
%
|
7.9
|
%
|
|||||||
|
Adjusted fully distributed net income per share
4
|
$
|
0.78
|
|
$
|
0.68
|
|
$
|
0.35
|
|
$
|
—
|
|
|||
37
|
(1)
|
Fiscal 2014 includes a one-time charge related to the settlement of litigation with Pacific Coast Marine Windshields Ltd. on September 15, 2014. For more information, see Note 14 to our audited consolidated financial statements included elsewhere in this Annual Report.
|
|
(2)
|
For the period after the IPO on February 5, 2014, the non-controlling interest represents the portion of earnings or loss attributable to the economic interest held by the non-controlling LLC Unit holders, which was 50.7% as of June 30, 2014. Since all of the earnings prior to and up to February 5, 2014 were entirely allocable to the LLC Unit holders, we updated our historical presentation to attribute these earnings to the non-controlling interest accordingly.
|
|
(3)
|
As noted above, all earnings prior and up to February 5, 2014, the date of completion of the IPO, were entirely allocable to the non-controlling interest. As a result, earnings per share information attributable to these historical periods is not comparable to earnings per share information attributable to the Company after the IPO and, as such, has been omitted.
|
|
(4)
|
Adjusted EBITDA, adjusted EBITDA margin, and adjusted fully distributed net income per share are non-GAAP financial measures. For definitions of adjusted EBITDA, adjusted EBITDA margin, and adjusted fully distributed net income and a reconciliation of each to net income, see “Item 7. Management’s Discussion and Analysis of Financial Condition and Results of Operations-GAAP Reconciliation of Non-GAAP Financial Measures.”
|
38
Item 7.
Management's Discussion and Analysis of Financial Condition and Results of Operations
Some of the information in this Annual Report on Form 10-K includes “forward-looking statements” within the meaning of Section 27A of the Securities Act and Section 21E of the Exchange Act. All statements other than statements of historical facts included in this Form 10-K, including, without limitation, certain statements under this “Management’s Discussion and Analysis of Financial Condition and Results of Operations”, may constitute forward-looking statements. In some cases you can identify these “forward-looking statements” by words like “may,” “will,” “should,” “expects,” “plans,” “anticipates,” “believes,” “estimates,” “predicts,” “potential” or “continue” or the negative of those words and other comparable words. Any such forward-looking statements are not guarantees of future performance and involve risks, uncertainties and other factors that may cause our actual results, performance or achievements, or industry results to vary materially from our future results, performance or achievements, or those of our industry, expressed or implied in such forward-looking statements. Such factors include, among others, general industry, economic and business conditions, demand for our products, changes in consumer preferences, competition within our industry, our reliance on our network of independent dealers, our ability to manage our manufacturing levels and our large fixed cost base, and the successful introduction of our new products, as well as other factors affecting us discussed under the heading “Item 1A. Risk Factors” in this Form 10-K. Many of these risks and uncertainties are outside our control, and there may be other risks and uncertainties which we do not currently anticipate because they relate to events and depend on circumstances that may or may not occur in the future. We do not intend and undertake no obligation to update any forward-looking information to reflect actual results or future events or circumstances.
Overview
We are a leading designer, manufacturer and marketer of performance sport boats, having the #1 market share position in the United States since 2010. Our boats are used for water sports, including water skiing, wakeboarding and wake surfing, as well as general recreational boating. We earn revenue and generate profits from the sale of our high performance boats under two brands—Malibu and Axis. Our flagship Malibu brand boats offer our latest innovations in performance, comfort and convenience, and are designed for consumers seeking a premium boating experience. Our Axis brand of boats is designed to appeal to consumers who desire a more affordable product but still demand high performance, functional simplicity and the option to upgrade key features.
Since inception in 1982, we have been a consistent innovator in the powerboat industry, designing products that appeal to an expanding range of recreational boaters and water sports enthusiasts whose passion for boating and water sports is a key aspect of their lifestyle. We continue to focus on innovation and invest in product development to expand the market for our products by introducing consumers to new and exciting recreational activities. We believe that our boats are increasingly versatile, allowing consumers to use them for a wide range of activities that enhance the experience of a day on the water with family and friends. While there is no guarantee that we will achieve market share growth in the future, we believe that the
39
performance, quality, value and multi-purpose features of our boats position us to achieve our goal of increasing our market share in the expanding recreational boating market.
We offer our boats for sale through an extensive network of independent dealers in North America and throughout the world. As of
June 30, 2014
, our distribution channel consisted of
118
independent dealers in North America operating
143
locations and
52
independent dealer locations across
36
countries outside of North America. Our boats are the exclusive performance sport boats offered by the majority of our dealers. Additionally, we offer our boats through an exclusive licensee in Australia that is one of the largest performance sport boat manufacturers in that country. Our dealer base is an important part of our consumers’ experience, our marketing efforts and our brands. We devote significant time and resources to find, develop and improve the performance of our dealers and believe our dealer network gives us a distinct competitive advantage.
We have undergone significant growth since we were founded in 1982 and began building custom ski boats in a small shop in Merced, California. In 2006, we were acquired by an investor group, including affiliates of Black Canyon Capital LLC, Horizon Holdings, LLC and then-current management. Beginning in 2009, under the leadership of new management, we implemented several measures designed to improve our cost structure, increase our operating leverage, enhance our product offerings and brands, and strengthen our dealer network. Jack Springer, our Chief Executive Officer, and Wayne Wilson, our Chief Financial Officer, helped lead us successfully through the volume declines experienced during the economic recession. Despite the downturn, we continued to build on our legacy of innovation and invested in product development and process improvements. For example, we:
|
•
|
introduced the Axis brand in 2009 for consumers seeking a performance sport boat at a more affordable price;
|
|
•
|
acquired Titan Wake Accessories in 2009 in order to bring tower manufacturing in-house, and subsequently designed and introduced the G3/G4 Tower;
|
|
•
|
released the first picklefork bow design under the Malibu brand in 2012 to fill a specific gap within our product portfolio, quickly followed by two additional Malibu picklefork models;
|
|
•
|
enhanced our manufacturing efficiencies through process improvements and product engineering, including moving from batch to continuous flow manufacturing; and
|
|
•
|
introduced our patented Surf Gate technology in 2012, which allows users to surf on either side of the boat’s wake, generates a better quality surf wave and was the Watersports Industry Association’s Innovation of the Year in 2013.
|
In addition, we initiated a disciplined process of reviewing, assessing and expanding our dealer network. We grew our dealer network in North America by 35 dealer locations from fiscal 2010 to fiscal 2014 and also improved the overall performance of our dealers. During this period, we initiated a more disciplined approach of monitoring dealer inventory levels relative to market demand in order to align annual production levels more closely with annual retail sales levels at our dealers. As a result of these collective initiatives, we have a rationalized cost base with a high growth product portfolio that achieved fiscal year
2014
net sales, adjusted EBITDA and net (loss) income of
$190.9 million
,
$37.3 million
and
$(1.2) million
, respectively, compared to
$167.0 million
,
$31.8 million
and
$18.0 million
, respectively, for fiscal year
2013
and
$140.9 million
,
$19.9 million
and
$11.1 million
, respectively, for fiscal year
2012
. For the fiscal year ended
June 30, 2014
, net sales, gross margin as a percentage of sales, and adjusted EBITDA increased
14.3%
,
0.5%
, and
17.4%
, respectively, compared to the fiscal year ended
June 30, 2013
. For the fiscal year ended
June 30, 2014
, net (loss) income decreased
106.6%
, compared to the fiscal year ended
June 30, 2013
. The decrease in net (loss) income was largely due to a one time charge related to the settlement of litigation with Pacific Coast Marine Windshields Ltd. and one time charges in connection with our initial public offering and follow-on offering. For the definition of adjusted EBITDA and a reconciliation to net (loss) income, see “—GAAP Reconciliation of Non-GAAP Financial Measures.”
Malibu Boats, Inc. is a Delaware corporation with its principal offices in Loudon, Tennessee. We use the terms “Malibu Boats,” the “Company,” “we,” “us,” “our” or similar references to refer to (i) Malibu Boats Holdings, LLC, or the LLC, and its consolidated subsidiaries prior to the Recapitalization and IPO of Malibu Boats, Inc.’s Class A Common Stock as described under “Item 1. Business—History and Formation Transactions” and (ii) Malibu Boats, Inc. and its consolidated subsidiaries after the Recapitalization and IPO, which were completed on February 5, 2014.
Components of Results of Operations
Net Sales
We generate revenue from the sale of boats to our dealers. The substantial majority of our net sales are derived from the sale of boats, including optional features included at the time of the initial wholesale purchase of the boat. Net sales consists of the following:
40
|
•
|
Gross sales from:
|
|
•
|
Boat sales
—sales of boats to our dealer network. In addition, nearly all of our boat sales include optional feature upgrades purchased by the consumer, such as Surf Gate, which increase the average selling price of our boats;
|
|
•
|
Trailers, parts and accessories sales—
sales of boat trailers and replacement and aftermarket boat parts and accessories to our dealer network and Australian licensee; and
|
|
•
|
Royalty income
—licensing fees and royalties that we earn as a result of our contractual relationship with our Australian licensee, which has the exclusive right to manufacture and distribute our products in Australia and New Zealand.
|
|
•
|
Net sales are net of:
|
|
•
|
Sales returns
—primarily contractual repurchases of boats either repossessed by the floor plan financing provider from the dealer or returned by the dealer under our warranty program; and
|
|
•
|
Rebates, free flooring and discounts
—incentives, including rebates and free flooring, we provide to our dealers based on sales of eligible products. If a dealer meets its annual commitment volume as well as other terms of the rebate program, the dealer is entitled to a specified rebate. Our dealers that take delivery of current model year boats in the offseason, typically July through April, are entitled to have us pay the interest to floor the boat until the earlier of (1) the sale of the unit or (2) a date near the end of the current model year, which incentive we refer to as “free flooring.” For more information, see "Item 1. Business - Dealer Management."
|
Cost of Sales
Our cost of sales includes all of the costs to manufacture our products, including raw materials, components, supplies, direct labor and factory overhead. For components and accessories manufactured by third-party vendors, such costs represent the amounts invoiced by the vendors. Shipping costs and depreciation expense related to manufacturing equipment and facilities are also included in cost of sales. Warranty costs associated with the repair or replacement of our boats under warranty are also included in cost of sales.
Operating Expenses
Our operating expenses include selling and marketing, and general and administrative costs. Each of these items includes personnel and related expenses, supplies, non-manufacturing overhead, third-party professional fees and various other operating expenses. Further, selling and marketing expenditures include the cost of advertising and various promotional sales incentive programs. General and administrative expenses include, among other things, salaries, benefits and other personnel related expenses for employees engaged in product development, engineering, finance, information technology, human resources, litigation settlement expense and executive management. Other costs include outside legal and accounting fees, investor relations, risk management (insurance) and other administrative costs.
Other Expense, Net
Other expense, net consists of interest expense and other income or expense, net. Interest expense consists of interest charged under our credit agreement, debt issuance costs written off in connection with the pay down of all the amounts owed on the credit facilities and term loan, and settlement of our interest rate swap.
Income Taxes
Malibu Boats, Inc. is subject to U.S. federal and state income tax in multiple jurisdictions with respect to our allocable share of any net taxable income of the LLC after the IPO on February 5, 2014. The LLC is a pass-through entity for federal purposes but incurs income tax in certain state jurisdictions. The income tax benefit for fiscal 2014 reflects a reported effective income tax rate of 65.2% attributable to Malibu Boats, Inc.'s share of loss after the completion of the IPO. The reported effective tax rate differs from the statutory federal income tax rate of 35% primarily due to the impact of the non-controlling interest and state income taxes attributable to the LLC as well as the impact of state taxes and the Company's share of the LLC's permanent items such as stock compensation expense attributable to profits interests and the domestic production activities deduction.
41
Net Income Attributable to Non-controlling Interest
In connection with the Recapitalization and IPO, we obtained a
49.3%
controlling economic and 100% voting interest in the LLC and, therefore, we consolidate the LLC's operating results for financial statement purposes. Net income or loss attributable to non-controlling interest represents the portion of net income or loss attributable to the LLC members.
Recapitalization, IPO and Follow-On Offering
Recapitalization
Immediately prior to the closing of the IPO of Malibu Boats, Inc. on February 5, 2014, a new single class of LLC Units of the LLC, was allocated among the pre-IPO owners in exchange for their prior membership interests of the LLC pursuant to the distribution provisions of the former limited liability company agreement of the LLC based upon the liquidation value of the LLC, assuming it was liquidated at the time of the IPO with a value implied by the initial public offering price of the shares of Class A Common Stock sold in the IPO. Immediately prior to the closing of the IPO, there were 17,071,424 LLC Units issued and outstanding.
Further, on February 4, 2014 (prior to the closing of the IPO), two holders of membership interests in the LLC merged with and into two newly formed subsidiaries of Malibu Boats, Inc. As a result of these mergers, the sole stockholders of each of the two merging entities received shares of Class A Common Stock in exchange for shares of capital stock of the merging entities. Also, we redeemed for nominal consideration, the initial 100 shares of Class A Common Stock issued to our initial stockholder in connection with our formation.
We refer to the foregoing transactions as the “Recapitalization.”
IPO and Follow-On Offering
On February 5, 2014, we completed our initial public offering of 8,214,285 shares of Class A Common Stock at a price to the public of $14.00 per share, of which 7,642,996 shares were issued and sold by us and 571,289 shares were sold by selling stockholders. This included 899,252 shares issued and sold by us and 172,175 shares sold by selling stockholders pursuant to the over-allotment option granted to the underwriters, which was exercised concurrently with the closing of the IPO.
The aggregate gross proceeds from the IPO were $115.0 million. Of these proceeds, we received $99.5 million and the selling stockholders received $7.4 million, after deducting $8.1 million in underwriting discounts and commissions. With the proceeds we received, approximately $29.8 million was used to purchase LLC Units directly from the pre-IPO owners and $69.8 million was used to purchase newly issued LLC Units from the LLC, which the LLC then used (i) to pay down all of the amounts owed under the LLC’s credit facilities and term loans in the amount of $63.4 million, (ii) to pay Malibu Boats Investor, LLC, an affiliate of the LLC, a fee of $3.8 million in connection with the termination of the LLC’s management agreement upon consummation of the IPO, and (iii) for general corporate purposes with the remaining approximately $2.7 million. In connection with the repayment of the LLC’s credit facilities and term loans, debt issuance costs associated with the term loans were written off to interest expense.
On July 15, 2014, we completed a follow-on public offering of 5,520,000 shares of our Class A Common Stock at a price to the public of $18.50 per share, of which 4,371,893 shares were issued and sold by us and 1,148,107 shares were sold by selling stockholders. This included 538,252 shares issued and sold by us and 181,748 shares sold by selling stockholders pursuant to the over-allotment option granted to the underwriters, which was exercised concurrently with the closing of the follow-on offering.
The aggregate gross proceeds from the follow-on offering were $102.1 million. Of these proceeds, we received $76.8 million and the selling stockholders received $20.2 million, after deducting $5.1 million in underwriting discounts and commissions. We used all of the proceeds we received to purchase LLC Units directly from the holders of LLC Units.
We incurred strategic and financial restructuring expenses in connection with the Recapitalization, IPO and follow-on offering of approximately $1.6 million in the fiscal year ended June 30, 2014. In addition, we anticipate future ongoing incremental expenses associated with being a public company to approximate between $2.0 million and $3.0 million on an annual basis, excluding compensation expense related to the long-term incentive plan established in connection with the Recapitalization and IPO.
Outlo
ok
Although industry-wide retail boat sales remain lower than they were in 2007, prior to the financial crisis, sales volumes expanded during fiscal
2014
, and we expect this trend to continue into fiscal
2015
. According to SSI, as of December 2013,
42
domestic retail registrations of performance sport boats for 50 reporting states increased 11% over calendar year 2012. This followed domestic performance sport boat registration growth of approximately 13% in 2012 as compared to 2011. For the six month period ending
June 30, 2014
, domestic retail registrations of performance sport boats for 40 reporting states increased 18% compared to the same six month period in
2013
, according to SSI. While performance sport boat registration in the U.S. for the six month period ending
June 30, 2014
has been robust, we expect the industry's overall retail sales growth to be negatively impacted by colder weather in Canada and Canadian dollar exchange rate fluctuations that have slowed retail sales in Canada. Regardless, we expect the favorable demand environment for our product to continue, with long-term prospects depending on the strength of the broader economic recovery.
Since 2008, we have increased our market share among manufacturers of performance sport boats annually due to new product development, redesigned models, and innovative features. For the 2014 model year which began on July 1, 2013, we redesigned the Wakesetter 23LSV model and expanded our product offerings, including the introduction of two new models under the Axis brand doubling the number of models offered. In addition, Surf Gate was added as an available feature on our Axis boats. We expect these new and redesigned models and feature offerings, combined with our recognized brand names and dealer base, to position us for further growth within our industry. For the 2015 model year which began on July 1, 2014, we have redesigned the Wakesetter VLX and the Axis A22 models and enhanced our Wakesetter line with a new 12-inch touchscreen dash, an improved Power Wedge and an optional, all machined aluminum, G4 tower.
As with other boat manufacturers in our industry, we face broader challenges that could impact demand. These include higher interest rates reducing retail consumer appetite for our product, consumer confidence, the availability of credit to our dealers and consumers, fuel costs, the continued acceptance of our new products in the recreational boating market, our ability to compete in the competitive power boating industry, and the costs of labor and certain of our raw materials and key components.
Factors Affecting Our Results of Operations
We believe that our results of operations and our growth prospects are affected by a number of factors, which we discuss below.
Economic Environment and Consumer Demand
Our product sales are impacted by general economic conditions, which affect the demand for our products, the demand for optional features, the availability of credit for our dealers and retail consumers, and overall consumer confidence. Consumer spending, especially purchases of discretionary items, tends to decline during recessionary periods and tends to increase during expansionary periods. The recreational boating industry was adversely affected by the economic downturn, and is now beginning to recover. IBISWorld projects U.S. powerboat manufacturer sales will grow at a CAGR, of 6.5% between 2012 and 2017. In recent years, the performance sport boat category has grown faster than the overall powerboat market. In 2012, domestic sales of new performance sport boats increased by
13%
compared to 2011, while new unit sales of all other powerboats grew
10%
over the same period. More recently, new unit sales of performance sport boats increased
11%
for 2013 compared to the same period in 2012, while new unit sales of all other powerboats increased
2%
over the same period. While there is no guarantee that our market will continue to grow, we expect to benefit from the recovery in the boating industry and from improved consumer confidence levels.
New Product Development and Innovation
Our long-term revenue prospects are based in part on our ability to develop new products and technological enhancements that meet the demands of existing and new consumers. Developing and introducing new boat models and features that deliver improved performance and convenience is essential to leveraging the value of our Malibu and Axis brands. By introducing new boat models, we are able to appeal to a new and broader range of consumers and focus on underserved or adjacent segments of the broader powerboat category. We introduced nine new boat models since the beginning of model year 2011. We believe we also are able to capture additional value from the sale of each boat through the introduction of new features, which we believe permits us to raise average selling prices and enhances our margins. We allocate most of our product development costs to new model and feature designs, usually with a specific consumer base and market in mind. We use industry data to analyze our markets and evaluate revenue potential from each major project we undertake. Our product development cycle, or the time from initial concept to volume production, can be up to two years. As a result, our development costs, which may be significant, may not be offset by corresponding new sales during the same periods. Once new designs and technologies become available to our consumers, we typically realize revenue from these products from one year up to 15 years. We may not, however, realize our revenue expectations from each innovation. We believe our close communication with our consumers, dealers and sponsored athletes regarding their future product desires enhances the efficiency of our product development expenditures.
Product Mix
43
Historically, we have been successful in leveraging our robust product offering and features to enhance our sales growth and gross margins. Our product mix, as it relates to our brands, types of boats and features, not only makes our offerings attractive to consumers but also helps drive higher sales and margins. Typically, we are able to realize higher sales and margins when we sell larger boats compared to our smaller boats, our premium Malibu brand compared to our entry-level Axis brand and our boats that are fully-equipped with optional features. We will strive to continue to develop new features and models and maintain an attractive product mix that optimizes sales growth and margins.
Ability to Manage Manufacturing Costs, Sales Cycles and Inventory Levels
Our results of operations are affected by our ability to manage our manufacturing costs effectively and to respond to changing sales cycles. Our product costs vary based on the costs of supplies and raw materials, as well as labor costs. We have implemented various initiatives to reduce our cost base and improve the efficiency of our manufacturing process. For example, we re-engineered the manufacturing process in our Tennessee facility to reduce labor hours per boat produced and the amount of re-work required. We continuously monitor and review our manufacturing processes to identify improvements and create additional efficiencies. We rely on our insights into the market gleaned from dealer inventory levels, industry reports about anticipated demand for our products in the upcoming sales cycle and our own estimates and assumptions in formulating our manufacturing plan for the following fiscal year. Throughout our consumer sales cycle, which reaches its peak from March through August each year, we adjust our manufacturing activities in order to adapt to variability in demand.
Dealer Network, Dealer Financing and Incentives
We rely on our dealer network to distribute and sell our products. We believe we have developed the strongest distribution network in the performance sport boat category. To improve and expand our network and compete effectively for dealers, we regularly monitor and assess the performance of our dealers and evaluate dealer locations and geographic coverage in order to identify potential market opportunities. As a result of management’s strategic initiatives, we have sold an increasing number of units to dealers in new territories in the United States and Canada not previously covered prior to 2009. We intend to continue to add dealers in new territories in the United States as well as internationally, which we believe will result in increased unit sales.
Our dealers are exposed to seasonal variations in consumer demand for boats. As discussed above under “Ability to Manage Manufacturing Costs, Sales Cycles and Inventory Levels,” we address anticipated demand for our products and manage our manufacturing in order to mitigate seasonal variations. We also use our dealer incentive programs to encourage dealers to order in the off-season by providing floor plan financing relief, which typically permits dealers to take delivery of current model year boats between July 1 and April 30 on an interest-free basis for a specified period. We also offer our dealers other incentives, including rebates, seasonal discounts, promotional co-op arrangements and other allowances. We facilitate floor plan financing programs for many of our dealers by entering into repurchase agreements with certain third-party lenders, which enable our dealers, under certain circumstances, to establish lines of credit with the third-party lenders to purchase inventory. Under these floor plan financing programs, a dealer draws on the floor plan facility upon the purchase of our boats and the lender pays the invoice price of the boats. Since July 1, 2010, we have not repurchased any units from lenders. We will continue to review and refine our dealer incentive offerings and monitor any exposures arising under these arrangements.
Results of Operations
The table below sets forth our results of operations, expressed in thousands (except unit volume and net sales per unit) and as a percentage of net sales, for the periods presented. Our financial results for these periods are not necessarily indicative of the financial results that we will achieve in future periods. Data from the consolidated statement of operations and balance sheet as of and for the fiscal years ended June 30, 2012 and 2013 reflects information presented by the LLC for the period prior to the Recapitalization and IPO on February 5, 2014, while data as of and for the fiscal year ended
June 30, 2014
, reflects information as presented by us for the period after the Recapitalization and IPO on February 5, 2014. Certain totals for the table below will not sum to exactly 100% due to rounding.
44
|
Fiscal Year Ended June 30,
|
|||||||||||||||||||||
|
2014
|
2013
|
2012
|
|||||||||||||||||||
|
Consolidated statement of operations data:
|
$
|
% Revenue
|
$
|
% Revenue
|
$
|
% Revenue
|
|||||||||||||||
|
Net sales
|
190,935
|
|
100.0
|
%
|
167,012
|
|
100.0
|
%
|
140,892
|
|
100.0
|
%
|
|||||||||
|
Cost of sales
|
140,141
|
|
73.4
|
%
|
123,412
|
|
73.9
|
%
|
110,849
|
|
78.7
|
%
|
|||||||||
|
Gross profit
|
50,794
|
|
26.6
|
%
|
43,600
|
|
26.1
|
%
|
30,043
|
|
21.3
|
%
|
|||||||||
|
Operating expenses:
|
|||||||||||||||||||||
|
Selling and marketing
|
6,098
|
|
3.2
|
%
|
4,937
|
|
3.0
|
%
|
4,071
|
|
2.9
|
%
|
|||||||||
|
General and administrative
1
|
39,974
|
|
20.9
|
%
|
14,177
|
|
8.5
|
%
|
8,307
|
|
5.9
|
%
|
|||||||||
|
Amortization
|
5,177
|
|
2.7
|
%
|
5,178
|
|
3.1
|
%
|
5,178
|
|
3.7
|
%
|
|||||||||
|
Operating (loss) income
|
(455
|
)
|
(0.2
|
)%
|
19,308
|
|
11.6
|
%
|
12,487
|
|
8.8
|
%
|
|||||||||
|
Other income (expense):
|
|||||||||||||||||||||
|
Other
|
9
|
|
—
|
%
|
10
|
|
—
|
%
|
52
|
|
—
|
%
|
|||||||||
|
Interest expense
|
(2,962
|
)
|
(1.6
|
)%
|
(1,334
|
)
|
(0.8
|
)%
|
(1,433
|
)
|
(1.0
|
)%
|
|||||||||
|
Other expense, net
|
(2,953
|
)
|
(1.5
|
)%
|
(1,324
|
)
|
(0.8
|
)%
|
(1,381
|
)
|
(1.0
|
)%
|
|||||||||
|
Net (loss) income before benefit for income taxes
|
(3,408
|
)
|
(1.8
|
)%
|
17,984
|
|
10.8
|
%
|
11,106
|
|
7.8
|
%
|
|||||||||
|
Income tax benefit
|
(2,220
|
)
|
(1.2
|
)%
|
—
|
|
—
|
%
|
—
|
|
—
|
%
|
|||||||||
|
Net (loss) income
|
(1,188
|
)
|
(0.6
|
)%
|
17,984
|
|
10.8
|
%
|
11,106
|
|
7.8
|
%
|
|||||||||
|
Net income attributable to non-controlling interest
2
|
3,488
|
|
1.8
|
%
|
17,984
|
|
10.8
|
%
|
11,106
|
|
7.8
|
%
|
|||||||||
|
Net loss attributable to Malibu Boats, Inc.
|
(4,676
|
)
|
(2.4
|
)%
|
—
|
|
—
|
%
|
—
|
|
—
|
%
|
|||||||||
|
Other data:
|
|||||||||||||||||||||
|
Unit volumes
|
2,910
|
|
2,672
|
|
2,482
|
|
|||||||||||||||
|
Net sales per unit
|
$
|
65,613
|
|
$
|
62,504
|
|
$
|
56,766
|
|
||||||||||||
|
(1)
|
Fiscal 2014 includes a one-time charge related to the settlement of litigation with Pacific Coast Marine Windshields Ltd. on September 15, 2014. For more information, see Note 14 to our audited consolidated financial statements included elsewhere in this Annual Report.
|
|
(2)
|
For the period after the IPO on February 5, 2014, the non-controlling interest represents the portion of earnings or loss attributable to the economic interest held by the non-controlling LLC Unit holders, which was 50.7% as of June 30, 2014. Since all of the earnings prior to and up to February 5, 2014 were entirely allocable to the LLC Unit holders, we updated our historical presentation to attribute these earnings to the non-controlling interest accordingly.
|
Comparison of the
Fiscal Year Ended
June 30, 2014
to the
Fiscal Year Ended
June 30, 2013
Net Sales
Our net sales for fiscal year
2014
were
$190.9 million
, reflecting an increase of
$23.9 million
, or
14.3%
, compared to fiscal year
2013
. Unit volume for fiscal year
2014
was
2,910
units, a
8.9%
increase compared to fiscal year
2013
. The volume increase for fiscal year
2014
was attributable to strong, continued consumer demand for our boats, bolstered by the introduction of two completely new Axis models. Net sales per unit increased approximately
5.0%
for fiscal year
2014
compared to fiscal year
2013
, primarily because of increased sales prices on new boat models and increased sales of larger boats, including the Wakesetter 23 LSV remodeled in fiscal year 2014, and Axis A24, introduced early in fiscal year 2014, as well as increased sales of our Surf Gate system, which became available on the Axis brand during July 2013.
Cost of Sales
Our cost of sales increased
13.6%
to
$140.1 million
for the fiscal year
2014
compared to fiscal year
2013
. The increase in cost of sales resulted primarily from the
8.9%
increase in unit volume and higher material cost per unit.
Gross Profit
For fiscal year
2014
, our gross profit increased
16.5%
to
$50.8 million
compared to the same period during
2013
. Gross profit as a percentage of net sales increased
0.5%
to
26.6%
for fiscal year
2014
compared to the same period in
2013
. These
45
increases resulted primarily from increased volumes, higher average selling prices driven by price increases and increased sales of larger boats and optional features and product cost reduction efforts.
Operating Expenses
Selling and marketing expense increased
$1.2 million
for fiscal year
2014
compared to fiscal year
2013
primarily because of increased marketing costs associated with increased sales volumes. General and administrative expense increased
$25.8 million
for fiscal year
2014
compared to fiscal year ended
2013
, largely attributable to a one time charge of $20.0 million related to the settlement of litigation with Pacific Coast Marine Windshields Ltd.. The balance of the increase was primarily due to one time charges incurred in connection with our initial public offering, including a $3.8 million termination fee for our previously existing management agreement, $1.8 million in stock compensation charges attributable to the modification of awards granted in 2012, and $1.6 million in additional legal and professional fees associated with our recapitalization and equity offerings during fiscal
2014
. For the fiscal year ended
June 30, 2014
, recurring stock compensation charges and expenses related to our board of directors, including insurance, increased approximately $1.0 million compared to fiscal
2013
. This increase was partially offset by decreases of approximately $0.3 million in incentive compensation and $2.1 million in management fees paid to our former sponsor from fiscal
2013
.
Other Expense, Net
Interest expense increased
$1.6 million
for fiscal
2014
compared to fiscal
2013
. This increase was driven by deferred financing costs written off in connection with the pay down of our term loan as part of the Recapitalization and IPO transactions as well as higher debt balances associated with our July 2013 refinancing prior to the pay down of our term loan.
Income Taxes
Malibu Boats, Inc. is subject to U.S. federal and state income tax in multiple jurisdictions with respect to our allocable share of any net taxable income of the LLC after the IPO on February 5, 2014. The LLC is a pass-through entity for federal purposes but incurs income tax in certain state jurisdictions. The income tax benefit of
$2.2 million
for the fiscal year ended
June 30, 2014
reflects a reported effective income tax rate of 65.2% attributable to Malibu Boats, Inc.'s share of loss after the completion of the IPO. The Company's reported effective income tax rate differs from the statutory federal income tax rate of 35% primarily due to the impact of the non-controlling interest and state income taxes attributable to the LLC as well as the impact of state taxes and the Company's share of the LLC's permanent items such as stock compensation expense attributable to profits interests and the domestic production activities deduction.
Non-controlling interest
Non-controlling interest represents the ownership interests of the other members of the LLC after the Recapitalization and IPO. The non-controlling interest was
50.7%
immediately following the IPO and as of
June 30, 2014
. The amount of non-controlling interest is computed by multiplying pre-tax loss during the period by the percentage ownership in the LLC not directly attributable to us, or
50.7%
. All of the pre-tax income for the fiscal year ended
June 30, 2013
was attributed to the non-controlling interest.
Comparison of the Fiscal Year Ended June 30, 2013 to the Fiscal Year Ended June 30, 2012
Net Sales
Our net sales for fiscal year 2013 were $167.0 million, an increase of $26.1 million, or 18.5%, compared to fiscal year 2012. Unit volume for fiscal year 2013 was 2,672, an 8% increase compared to fiscal year 2012. The volume increase was attributable to increased consumer demand for our products. Net sales per unit increased approximately 10% for fiscal year 2013 compared to fiscal year 2012, primarily because of increased sales prices on new boat models and the introduction of two new boat models during fiscal year 2013, including our most expensive model, the Wakesetter 24 MXZ, as well as the introduction of our Surf Gate system as an option for consumers of our Malibu boats beginning in fiscal year 2013.
Cost of Sales
For fiscal year 2013, our cost of sales increased 11.3% to $123.4 million compared to fiscal year 2012. The increase in cost of sales resulted primarily from the 8% increase in unit volume and a richer mix of products sold with additional features, offset somewhat by continued realization of labor efficiencies.
Gross Profit
46
For fiscal year 2013, our gross profit increased 45.1% to $43.6 million compared to fiscal year 2012. Our gross profit as a percentage of net sales increased 480 basis points to 26.1% for fiscal year 2013 compared to fiscal year 2012. These increases resulted primarily from continued production efficiencies on increased volumes, higher average selling prices driven by price increases and increased sales of new boat models and optional features, and continued product cost reductions.
Operating Expenses
Our operating expenses for fiscal year 2013 increased 38.4% to $24.3 million compared to fiscal year 2012. Operating expenses as a percentage of sales for fiscal year 2013 increased 200 basis points to 14.5% percent compared to fiscal year 2012. The increase in operating expenses for 2013 was primarily attributable to increased general and administrative expense, comprised of payments made pursuant to our management agreement with Malibu Boats Investor, LLC, which was terminated upon the consummation of our IPO, and increased legal expenditures related to ongoing litigation. In addition, dealer incentives and sales expenses increased during fiscal year 2013 compared to fiscal year 2012 as a result of increased sales.
Other Expense, Net
Interest expense decreased by $0.1 million to $1.3 million in fiscal year 2013 compared to $1.4 million in fiscal year 2012. This decrease was a result of lower interest rates on our borrowings. For more information about the 2012 refinancing of our credit facilities, see “-Liquidity and Capital Resources-Comparison of the Fiscal Year Ended June 30, 2013 to the Fiscal Year Ended June 30, 2012-Financing Activities.” We experienced a modest decrease in other income over these periods, driven by a reduction in interest income.
47
GAAP Reconciliation of Non-GAAP Financial Measures
Adjusted EBITDA
Adjusted EBITDA and adjusted EBITDA margin are non-GAAP financial measures that are used by management as well as by investors, commercial bankers, industry analysts and other users of our financial statements.
We define adjusted EBITDA as earnings or loss before interest expense, income taxes, depreciation, amortization and non-cash, non-recurring and non-operating expenses, including severance and relocation, management fees and expenses, certain professional fees, litigation settlement expense, non-cash compensation expense and strategic and financial restructuring expenses. We define adjusted EBITDA margin as adjusted EBITDA divided by net sales. Adjusted EBITDA and adjusted EBITDA margin are not measures of net (loss) income as determined by GAAP. Management believes adjusted EBITDA and adjusted EBITDA margin are useful because they allow management to evaluate our operating performance and compare the results of our operations from period to period and against our peers without regard to our financing methods, capital structure and non-recurring and non-operating expenses. We exclude the items listed above from net (loss) income in arriving at adjusted EBITDA because these amounts can vary substantially from company to company within our industry depending upon accounting methods and book values of assets, capital structures, the methods by which assets were acquired and other factors. Adjusted EBITDA has limitations as an analytical tool and should not be considered as an alternative to, or more meaningful than, net (loss) income as determined in accordance with GAAP or as an indicator of our liquidity. Certain items excluded from adjusted EBITDA are significant components in understanding and assessing a company’s financial performance, such as a company’s cost of capital and tax structure, as well as the historical costs of depreciable assets. Our presentation of adjusted EBITDA and adjusted EBITDA margin should not be construed as an inference that our results will be unaffected by unusual or non-recurring items. Our computations of adjusted EBITDA and adjusted EBITDA margin may not be comparable to other similarly titled measures of other companies.
The following table sets forth a reconciliation of net (loss) income as determined in accordance with GAAP to adjusted EBITDA and adjusted EBITDA margin for the periods indicated (dollars in thousands):
|
Fiscal Year Ended June 30,
|
||||||||||||
|
2014
|
2013
|
2012
|
||||||||||
|
Net (loss) income
|
$
|
(1,188
|
)
|
$
|
17,984
|
|
$
|
11,106
|
|
|||
|
Income tax benefit
|
(2,220
|
)
|
—
|
|
—
|
|
||||||
|
Interest expense
|
2,962
|
|
1,334
|
|
1,433
|
|
||||||
|
Depreciation and amortization
|
6,777
|
|
6,268
|
|
6,072
|
|
||||||
|
Severance and relocation
1
|
—
|
|
192
|
|
181
|
|
||||||
|
Management fees and expenses
2
|
4,584
|
|
2,896
|
|
87
|
|
||||||
|
Professional fees
3
|
2,219
|
|
2,957
|
|
852
|
|
||||||
|
Litigation settlement
4
|
20,000
|
|
—
|
|
—
|
|
||||||
|
Stock based compensation expense
5
|
2,577
|
|
127
|
|
132
|
|
||||||
|
Strategic and financial restructuring expenses
6
|
1,561
|
|
—
|
|
—
|
|
||||||
|
Adjusted EBITDA
|
$
|
37,272
|
|
$
|
31,758
|
|
$
|
19,863
|
|
|||
|
Adjusted EBITDA margin
|
19.5
|
%
|
19.0
|
%
|
14.1
|
%
|
||||||
48
|
(1)
|
Represents one-time employment related expenses, including a severance payment to a former executive, and costs to relocate certain departments from California to our Tennessee facility.
|
|
(2)
|
Represents management fees and out-of-pocket expenses paid pursuant to our management agreement with Malibu Boats Investor, LLC, an affiliate, which was terminated upon the closing of the IPO. Upon termination of the agreement, we paid a one time termination fee of $3.75 million.
|
|
(3)
|
Represents legal and advisory fees related to our refinancing activities and legal expenses related to our litigation with Pacific Coast Marine Windshields Ltd. and Nautique Boat Company, Inc. For more information about the legal proceedings, refer to Note 14 of our consolidated financial statements included elsewhere in this Annual Report.
|
|
(4)
|
Represents a one-time charge related to the settlement of litigation with Pacific Coast Marine Windshields Ltd. on September 15, 2014. For more information, see Note 14 to our audited consolidated financial statements included elsewhere in this Annual Report.
|
|
(5)
|
Represents equity-based incentives awarded to certain of our employees including a $1.8 million stock compensation charge as a result of the modification of certain profits interest awards previously granted in 2012 under the first amended and restated limited liability company agreement of the LLC, as amended, in connection with our IPO.
|
|
(6)
|
Represents legal, accounting and other expenses directly related to the Recapitalization and public equity offerings.
|
Adjusted Fully Distributed Net Income
We define Adjusted Fully Distributed Net Income as net (loss) income attributable to Malibu Boats, Inc. (i) excluding income tax expense, (ii) excluding the effect of non-recurring and non-cash items, (iii) assuming the exchange of all LLC Units into shares of Class A Common Stock, which results in the elimination of non-controlling interest in the LLC, and (iv) reflecting an adjustment for income tax expense on fully distributed net (loss) income before income taxes at our estimated effective income tax rate. Adjusted Fully Distributed Net Income is a non-GAAP financial measure because it represents net (loss) income attributable to Malibu Boats, Inc, before non-recurring or non-cash items and the effects of non-controlling interests in the LLC.
We use Adjusted Fully Distributed Net Income to facilitate a comparison of our operating performance on a consistent basis from period to period that, when viewed in combination with our results prepared in accordance with GAAP, provides a more complete understanding of factors and trends affecting our business than GAAP measures alone.
We believe Adjusted Fully Distributed Net Income assists our board of directors, management and investors in comparing our net (loss) income on a consistent basis from period to period because it removes non-cash (stock-based compensation) and non-recurring items (strategic and financial restructuring expenses), and eliminates the variability of non-controlling interest as a result of member owner exchanges of LLC Units into shares of Class A Common Stock.
In addition, because Adjusted Fully Distributed Net Income are susceptible to varying calculations, the Adjusted Fully Distributed Net Income measures, as presented in this Annual Report, may differ from and may, therefore, not be comparable to similarly titled measures used by other companies.
The table that follows shows the reconciliation of net (loss) income attributable to Malibu Boats, Inc. to Adjusted Fully Distributed Net Income for the periods presented (in thousands except per share data):
49
|
Fiscal Year Ended June 30,
|
||||||||||||
|
2014
|
2013
|
2012
|
||||||||||
|
Net loss attributable to Malibu Boats, Inc.
|
$
|
(4,676
|
)
|
$
|
—
|
|
$
|
—
|
|
|||
|
Income tax benefit
|
(2,220
|
)
|
—
|
|
—
|
|
||||||
|
Stock based compensation expense
|
2,577
|
|
127
|
|
132
|
|
||||||
|
Management fees and expenses
1
|
4,584
|
|
2,896
|
|
87
|
|
||||||
|
Professional fees
2
|
2,219
|
|
2,957
|
|
852
|
|
||||||
|
Litigation settlement
3
|
20,000
|
|
—
|
|
—
|
|
||||||
|
Strategic and financial restructuring expenses
4
|
1,561
|
|
—
|
|
—
|
|
||||||
|
Net income attributable to non-controlling interest
5
|
3,488
|
|
17,984
|
|
11,106
|
|
||||||
|
Fully distributed net income before income taxes
|
27,533
|
|
23,964
|
|
12,177
|
|
||||||
|
Income tax expense on fully distributed income before income taxes
6
|
9,912
|
|
8,627
|
|
4,384
|
|
||||||
|
Adjusted Fully Distributed Net Income
|
$
|
17,621
|
|
$
|
15,337
|
|
$
|
7,793
|
|
|||
|
Adjusted Fully Distributed Net Income per share of Class A Common Stock
7
:
|
||||||||||||
|
Basic
|
$
|
0.78
|
|
$
|
0.68
|
|
$
|
0.35
|
|
|||
|
Diluted
|
$
|
0.78
|
|
$
|
0.68
|
|
$
|
0.35
|
|
|||
|
Shares of Class A Common Stock outstanding used in computing Adjusted Fully Distributed Net Income
8
:
|
||||||||||||
|
Basic
|
22,498,631
|
|
22,498,631
|
|
22,498,631
|
|
||||||
|
Diluted
|
22,498,631
|
|
22,498,631
|
|
22,498,631
|
|
||||||
|
(1)
|
Represents management fees and out-of-pocket expenses paid pursuant to our management agreement with Malibu Boats Investor, LLC, an affiliate, which was terminated upon the closing of the IPO. Upon termination of the agreement, we paid a one-time termination fee of $3.75 million.
|
|
(2)
|
Represents legal and advisory fees related to our refinancing activities and legal expenses related to our litigation with Pacific Coast Marine Windshields Ltd. and Nautique Boat Company, Inc.
|
|
(3)
|
Represents a one-time charge related to the settlement of litigation with Pacific Coast Marine Windshields Ltd. on September 15, 2014. For more information, see Note 14 to our audited consolidated financial statements included elsewhere in this Annual Report.
|
|
(4)
|
Represents legal, accounting and other expenses directly related to the Recapitalization.
|
|
(5)
|
Reflects the elimination of the non-controlling interest in the LLC as if all LLC members had fully exchanged their LLC Units for shares of Class A Common Stock. Earnings prior and up to our IPO on February 5, 2014 were entirely allocable to members of the LLC, as such we updated our historical presentation to attribute these earnings to the non-controlling interest LLC Unit holders.
|
|
(6)
|
Reflects income tax expense at an estimated normalized annual effective income tax rate of 36.0% of income before income taxes assuming the conversion of all LLC Units into shares of Class A Common Stock and the tax impact of excluding strategic and financial restructuring expenses. The estimated normalized annual effective income tax rate is based on the federal statutory rate plus a blended state rate adjusted for deductions under Section 199 of the Internal Revenue Code of 1986, as amended, and state taxes attributable to the LLC.
|
|
(7)
|
Adjusted fully distributed net income divided by the shares of Class A Common Stock outstanding in (8) below.
|
|
(8)
|
Shares of Class A Common Stock represents (i) the total number of shares of Class A Common Stock outstanding as of June 30, 2014, (ii) the 11,373,737 remaining LLC Units not held by the Company as of June 30, 2014 as if they were exchanged on a one-for-one basis for the Company's Class A Common Stock, and (iii) the 60,693 fully vested stock units outstanding as of June 30, 2014 granted to directors for their services. For the fiscal years 2013 and 2012, the Company assumed the same number of Class A Common Stock shares outstanding as of June 30, 2014.
|
Quarterly Results of Operations
The table below sets forth our unaudited quarterly consolidated statements of operations data for each of the eight quarters through the period ended
June 30, 2014
. The unaudited quarterly consolidated statements of operations data were prepared on a basis consistent with the audited consolidated financial statements included elsewhere in this Annual Report on Form 10-K. Quarterly information presented for the quarters through December 31, 2013 reflects information as presented by the LLC for periods prior to our IPO on February 5, 2014 while quarterly information for the quarter ended March 31, 2014 and
June 30, 2014
reflects information as presented by us after our IPO on February 5, 2014. Since earnings prior and up to February 5,
50
2014 were entirely allocable to members of the LLC, we updated our historical presentation to attribute these earnings to the non-controlling interest LLC unit holders. In the opinion of management, the quarterly financial information reflects all adjustments, consisting only of normal recurring adjustments, necessary for a fair presentation of this data. This information should be read in conjunction with the audited consolidated financial statements and related notes included elsewhere in this Annual Report. The historical results presented below are not necessarily indicative of the results to be expected for any future period, and the results for any interim period may not necessarily indicative of the results of operations for a full year. The numbers in this table may not foot due to rounding differences.
|
Three Months Ended (Unaudited)
|
|||||||||||||||||||||||||||||||
|
|
June 30,
2014 |
Mar. 31,
2014 |
Dec. 31,
2013 |
Sept. 30,
2013 |
June 30,
2013 |
Mar. 31,
2013 |
Dec. 31,
2012 |
Sept. 30,
2012 |
|||||||||||||||||||||||
|
Net sales
|
$
|
53,400
|
|
$
|
50,293
|
|
$
|
43,938
|
|
$
|
43,304
|
|
$
|
48,973
|
|
$
|
47,062
|
|
$
|
37,818
|
|
$
|
33,159
|
|
|||||||
|
Gross profit
|
14,676
|
|
13,401
|
|
11,696
|
|
11,021
|
|
13,938
|
|
12,500
|
|
9,294
|
|
7,868
|
|
|||||||||||||||
|
Operating (loss) income
|
(12,914
|
)
|
296
|
|
5,823
|
|
6,340
|
|
8,624
|
|
5,532
|
|
4,165
|
|
986
|
|
|||||||||||||||
|
Net (loss) income
|
(10,600
|
)
|
(987
|
)
|
5,220
|
|
5,179
|
|
8,376
|
|
5,200
|
|
3,767
|
|
639
|
|
|||||||||||||||
|
Net (loss) income attributable to non-controlling interest
|
(6,294
|
)
|
(617
|
)
|
5,220
|
|
5,179
|
|
8,376
|
|
5,200
|
|
3,767
|
|
639
|
|
|||||||||||||||
|
Net loss attributable to Malibu Boats, Inc.
|
$
|
(4,306
|
)
|
$
|
(370
|
)
|
$
|
—
|
|
$
|
—
|
|
$
|
—
|
|
$
|
—
|
|
$
|
—
|
|
$
|
—
|
|
|||||||
Liquidity and Capital Resources
Our primary sources of funds have been cash provided by operating activities, borrowings under our credit agreement and net proceeds from our IPO. Our primary use of funds has been for repayments under our credit arrangements, capital investments and cash distributions to members of the LLC. The following table summarizes the cash flows from operating, investing and financing activities (dollars in thousands):
|
|
Fiscal Year Ended June 30,
|
||||||||||
|
|
2014
|
2013
|
2012
|
||||||||
|
Total cash provided by (used in):
|
|||||||||||
|
Operating activities
|
$
|
23,765
|
|
$
|
25,899
|
|
$
|
15,495
|
|
||
|
Investment activities
|
(5,906
|
)
|
(2,878
|
)
|
(2,651
|
)
|
|||||
|
Financing activities
|
(21,643
|
)
|
(21,861
|
)
|
(7,132
|
)
|
|||||
|
(Decrease) increase in cash
|
$
|
(3,784
|
)
|
$
|
1,160
|
|
$
|
5,712
|
|
||
Comparison of the
Fiscal Year Ended June 30, 2014
to the
Fiscal Year Ended June 30, 2013
Operating Activities
Net cash from operating activities was
$23.8 million
for the fiscal year ended
June 30, 2014
, compared to
$25.9 million
for the same period in
2013
, a decrease of
$2.1 million
. The decrease in cash from operating activities was primarily due to cash paid for one time operating expenses, including a $3.8 million termination payment in connection with the termination of our former management agreement and $2.8 million in IPO-related costs. Cash receipts from boat sales to our dealer network increased $25.3 million during fiscal
2014
as compared to fiscal
2013
, driven mostly by higher unit sales volume, which increased
8.9%
and higher average net sales per unit, which increased
5.0%
over the same period. The higher average net sales per unit was attributable to higher sales prices on new boat models and increased sales of larger, higher margin boats, including the Wakesetter 23 LSV and Axis A24, as well as increased sales of our Surf Gate system, which became available on Axis models in July 2013. Cash payments to suppliers for purchase of raw material and other supplies used in the manufacturing process increased $21.5 million for the fiscal year ended
June 30, 2014
, compared to the same period in
2013
, primarily due to increased production levels associated with the higher volumes as well as increased consumption of materials driven by a mix of larger boats. Cash paid for interest increased $0.2 million attributable to the refinancing of our term loan in July 2013.
Investing Activities
Net cash used for investing activities was
$5.9 million
for the fiscal year ended
June 30, 2014
compared to
$2.9 million
for the same period in
2013
, an increase of
$3.0 million
. Our cash used for investing activities for fiscal years
2014
and
2013
51
primarily related to investments in new property and equipment, including boat molds, a new ventilation system, and construction on a loading facility at our Loudon, Tennessee plant.
Financing Activities
Net cash used for financing activities was
$21.6 million
for fiscal
2014
compared to
$21.9 million
for fiscal
2013
, a decrease of $0.3 million. During July 2013, we refinanced our term loan for $65 million. The proceeds from our new term loan not used to repay our former term loan were used to pay distributions to the holders of LLC Units. In connection with the refinancing, we paid $1.1 million for financing fees directly attributable to obtaining the term loan. Distributions paid to LLC unit holders for fiscal
2014
were
$65.2 million
. We received net proceeds of $99.5 million from our IPO in February 2014, and used approximately $29.8 million to purchase LLC Units directly from the existing holders of LLC Units and used the remainder, or $69.8 million, to purchase newly issued LLC Units from the LLC. Of the net proceeds received by the LLC, $63.4 million was used to pay down all of the amounts owed under the LLC’s credit facilities and term loan. Offering costs of $1.6 million, paid for and capitalized in connection with our IPO, were netted against the proceeds from the IPO.
Comparison of the Fiscal Year Ended June 30, 2013 to the Fiscal Year Ended June 30, 2012
Operating Activities
Net cash from operating activities was $25.9 million for the fiscal year ended June 30, 2013, compared to $15.5 million for the fiscal year ended June 30, 2012, an increase of $10.4 million. This increase was primarily driven by an increase in our cash receipts from sales of recreational and sports boats to our dealer network, which for the fiscal year ended June 30, 2013, increased by $29.6 million over receipts for the fiscal year ended June 30, 2012. The increase was driven by a 7.7% higher unit sales volume during the fiscal year ended June 30, 2013, compared to the same period in 2012. Additionally, average net sales per unit increased for the fiscal year ended June 30, 2013, compared to the same period in 2012, primarily attributable to increased sales prices on new boat models and the introduction of new premium-priced models, including the Wakesetter 24 MXZ and Wakesetter 20 MXZ, both of which were introduced in 2013. We also introduced our new Surf Gate system during the same period. Cash payments to suppliers for purchase of raw material and other supplies increased by $12.6 million for the fiscal year ended June 30, 2013, compared to the same period in 2012, primarily attributable to consumption of these items during the manufacturing process associated with higher production volumes, larger models and additional features. Cash paid for operating expenses increased $6.3 million during fiscal year ended June 30, 2013, as compared to the same period 2012. This increase was primarily attributable to payments of $2.8 million to our sponsor for management fees, including a one-time payment of $2.1 million, as well as professional fees related to our refinancing activities and legal expenses related to a dispute with a former supplier and increased selling and marketing expense to support higher unit sales volumes.
Investing Activities
Net cash used for investing activities was $2.9 million for fiscal year 2013 compared to $2.7 million for fiscal year 2012. Our cash used for investing activities for fiscal years 2012 and 2013 primarily related to the purchase of property and equipment.
Financing Activities
Net cash used for financing activities was $21.9 million for fiscal year 2013 compared to $7.1 million for fiscal year 2012. Our financing activities for fiscal year 2013 primarily consisted of distributions to members of the LLC financed by our July 2012 refinancing as well as ongoing tax distributions. The proceeds from the July 2012 refinancing were used to repay existing term and revolving loans that were due August 2012, pay equity distributions of $15.4 million, deferred financing and related fees of $0.7 million and management fees of $2.1 million in connection with the payment of management fees to Malibu Boats Investor, LLC, an affiliate, pursuant to an amendment to the management agreement in July 2012. Our financing activities for fiscal year 2012 primarily consisted of principal repayments of a prior credit facility.
Loans and Commitments
Our indirect subsidiary, Malibu Boats, LLC, as borrower, has lending arrangements with several financial institutions pursuant to a credit agreement with a syndicate of banks led by SunTrust Bank. Borrowings under the credit agreement bear interest at a rate equal to either, at our option, (i) the highest of the prime rate, the Federal Funds Rate plus 0.5% or one-month London Interbank Offered Rate ("LIBOR") plus 1% or (ii) the Adjusted LIBOR Rate, in each case plus the applicable margin, as defined in our credit agreement. The obligations of Malibu Boats LLC under the credit agreement are currently guaranteed by its parent, Malibu Boats Holdings, LLC, and its subsidiary, Malibu Boats Domestic International Sales Corp. Malibu Boats, Inc. is not a party to the credit agreement. The lending arrangements are required to be guaranteed by the LLC and the present and future domestic subsidiaries of Malibu Boats, LLC and are secured by substantially all of the assets of the LLC, Malibu
52
Boats, LLC and Malibu Domestic International Sales Corp., and those of any future domestic subsidiary pursuant to a security agreement. As of
June 30, 2014
, the credit agreement included the following facilities:
|
•
|
Revolving Credit Facility
. Malibu Boats, LLC has access to a revolving credit facility from a bank syndicate led by SunTrust Bank with available borrowings of $10 million due on or before July 16, 2018. As of
June 30, 2014
, no amounts were outstanding under the revolving credit facility.
|
|
•
|
Swingline Credit Facility
. Malibu Boats, LLC received a swingline line of credit from SunTrust Bank in the principal amount of up to $2 million due on or before July 16, 2018. Any amounts drawn under the swingline line of credit reduce the capacity under the revolving credit facility. As of
June 30, 2014
, no amounts were outstanding under the swingline facility.
|
|
•
|
Letter of Credit Facility
. Malibu Boats, LLC has the ability to request the issuance of letters of credit by SunTrust Bank in the principal amount of up to $3 million. The principal amounts of any issued but undrawn letters of credit and any amounts drawn under issued letters of credit that have not been reimbursed reduce the availability under the revolving credit facility. As of
June 30, 2014
, no drawn and unreimbursed amounts were outstanding under the letter of credit facility.
|
|
•
|
Term Loans
. Malibu Boats, LLC received a term loan from each of the banks in the syndicate in the aggregate principal amount of $65 million due on or before July 16, 2018. We repaid the $63.4 million outstanding related to the term loan in full on February 5, 2014 with the proceeds from the IPO.
|
Subject to the terms of the credit agreement, Malibu Boats, LLC has the option to request the lenders to increase the aggregate amount under the revolving credit facility and the term loan facility up to an additional $30 million; however, the lenders are not obligated to do so.
The credit agreement permits prepayment without any penalties. It contains certain customary representations and warranties, and notice requirements for the occurrence of specific events such as pending or threatened labor disputes, litigation or judgments over a certain amount. The credit agreement requires compliance with certain financial covenants that we believe are customary for facilities and transactions of this type, including a minimum ratio of EBITDA to fixed charges and a maximum ratio of total debt to EBITDA. The credit agreement also contains certain restrictive covenants, which, among other things, place limits on our activities and those of our subsidiaries, the incurrence of additional indebtedness and additional liens on property and limit the future payment of dividends or distributions. For example, the credit agreement generally prohibits the LLC, Malibu Boats, LLC and Malibu Domestic International Sales Corp. from paying dividends or making distributions, including to Malibu Boats, Inc. The credit agreement permits, however, distributions based on a member’s allocated taxable income, distributions to fund payments that are required under the tax receivable agreement, payments pursuant to stock option and other benefit plans up to $2.0 million in any fiscal year, dividends and distributions within the loan parties and dividends payable solely in interests of classes of securities. In addition, after June 30, 2014, the LLC may make dividends and distributions of up to $4.0 million in any fiscal year, subject to compliance with other financial covenants. The credit agreement specifies permitted liens, permitted investments and permitted debt. Affirmative covenants governing the timing of monthly, quarterly and annual financial reporting are also included in the credit agreement. As of
June 30, 2014
, we were in compliance with all covenants in the credit agreement and security agreement.
Future Liquidity Needs
Management believes that our existing cash, borrowing capacity under our revolving credit facility and cash flows from operations will be sufficient to fund our operations for the next 12 months. Our future capital requirements will depend on many factors, including the general economic environment in which we operate and our ability to generate cash flow from operations. Factors impacting our cash flow from operations include, but are not limited to, our growth rate and the timing and extent of operating expenses.
In September 2014, we resolved a litigation matter with Pacific Coast Marine Windshields Ltd., or "PCMW," and agreed to pay $20.0 million in cash to the plaintiffs. We expect to use available cash on hand and borrowings under our revolving credit facility to make the settlement payment. Refer to Note 14 to the audited consolidated financial statements included elsewhere in this Annual Report for further information on the litigation matter. As a result of our upcoming payment for the settlement in the litigation matter with PCMW and our potential acquisition of our Australian licensee, we may seek additional financing to enhance our liquidity position.
Capital Resources
53
Future uses of cash related to significant capital projects underway include the expansion of our Loudon, Tennessee facility to add approximately 24,000 square feet for a loading and warehouse facility on land we own. Remaining expenditures associated with this capital project are expected to be up to $1.0 million over the next quarter.
Management expects our capital expenditures for fiscal year 2015 to be lower the fiscal year 2014 capital expenditures because we expect to complete the expansion of our warehouse and loading facility in the first quarter of fiscal 2015. Capital expenditures for fiscal year 2015 are expected to consist primarily of additional investments to expand our Tennessee facility, new tooling, and expenditures to increase production capacity to accommodate future growth.
Off-Balance Sheet Arrangements
Repurchase Commitments
In connection with our dealers’ wholesale floor plan financing of boats, we have entered into repurchase agreements with various lending institutions. The repurchase commitment is on an individual unit basis with a term from the date it is financed by the lending institution through payment date by the dealer, generally not exceeding two and a half years. Such agreements are customary in the industry and our exposure to loss under such agreements is limited by the resale value of the inventory which is required to be repurchased. Refer to Note 14 to the audited consolidated financial statements included elsewhere in this Annual Report for further information on repurchase commitments.
Contractual Obligations and Commitments
On February 5, 2014, we used a portion of the net proceeds from the IPO of Malibu Boats, Inc. to pay down all of the amounts owed under the credit facilities and term loans in an amount equal to $63.4 million. In addition, the interest rate swap was settled in connection with the repayment of the term loan. See "- Recapitalization, IPO and Follow-on Offering" above.
As of
June 30, 2014
, our continuing contractual obligations were as follows:
|
Payments Due by Period
|
|||||||||||||||||||
|
Total
|
Less than 1 Year
|
1-3 Years
|
3-5 Years
|
More than 5 Years
|
|||||||||||||||
|
(In thousands)
|
|||||||||||||||||||
|
Operating leases
1
|
$
|
24,762
|
|
$
|
1,949
|
|
$
|
3,846
|
|
$
|
3,955
|
|
$
|
15,012
|
|
||||
|
Purchase obligations
2
|
19,931
|
|
19,931
|
|
—
|
|
—
|
|
—
|
|
|||||||||
|
Total
|
$
|
44,693
|
|
$
|
21,880
|
|
$
|
3,846
|
|
$
|
3,955
|
|
$
|
15,012
|
|
||||
|
(1)
|
We sold our two primary manufacturing and office facilities for a total of $18.3 million in 2008, which resulted in a gain of $0.7 million. Simultaneous with the sale, we entered into an agreement to lease back the buildings for an initial term of 20 years. The net gain of $0.2 million has been deferred and is being amortized in proportion to rent charged over the initial lease term.
|
|
(2)
|
As part of the normal course of business, we enter into purchase orders from a variety of suppliers, primarily for raw materials, in order to manage our various operating needs. The orders are expected to be purchased throughout fiscal years 2015 and 2016.
|
The table above does not reflect our obligation to pay $20.0 million for the settlement of our litigation with Pacific Coast Marine Windshields, Ltd. The payment is due on the date we enter into the definitive settlement agreement which is expected to be on or prior to September 29, 2014, or such later date as the parties agree.
Our dealers have arrangements with certain finance companies to provide secured floor plan financing for the purchase of our products. These arrangements indirectly provide liquidity to us by financing dealer purchases of our products, thereby minimizing the use of our working capital in the form of accounts receivable. A majority of our sales are financed under similar arrangements, pursuant to which we receive payment within a few days of shipment of the product. We have agreed to repurchase products repossessed by the finance companies if a dealer defaults on its debt obligations to a finance company and the boat is returned to us, subject to certain limitations. Our financial exposure under these agreements is limited to the difference between the amounts unpaid by the dealer with respect to the repossessed product plus costs of repossession and the amount received on the resale of the repossessed product. No losses have been incurred under these agreements in the past three fiscal years. An adverse change in retail sales, however, could require us to repurchase repossessed units upon an event of default by any of our dealers, subject to the annual limitation.
Seasonality
54
Our dealers experience seasonality in their business. Retail demand for boats is seasonal, with a significant majority of sales occurring during peak boating season, which coincides with our first and fourth fiscal quarters. In order to minimize the impact of this seasonality on our business, we manage our manufacturing processes and structure dealer incentives to tie our annual volume rebates program to consistent ordering patterns, encouraging dealers to purchase our products throughout the year. In this regard, we may offer free flooring incentives to dealers from the beginning of our model year through April 30 of each year. Further, in the event that a dealer does not consistently order units throughout the year, such dealer’s rebate is materially reduced. We may offer off-season retail promotions to our dealers in seasonally slow months, during and ahead of boat shows, to encourage retail demand.
Emerging Growth Company
We are an “emerging growth com
pany,
” as defined in the JOBS Act. For as long as we are an “emerging growth company,” we may take advantage of certain exemptions from various reporting requirements that are applicable to other public companies that are not “emerging growth companies,” including, but not limited to, not being required to comply with the auditor attestation requirements of Section 404(b) of the Sarbanes-Oxley Act, reduced disclosure obligations regarding executive compensation in our periodic reports and proxy statements and exemptions from the requirements of holding stockholder advisory “say-on-pay” votes on executive compensation and stockholder advisory votes on golden parachute compensation.
The JOBS Act also provides that an “emerging growth company” can utilize the extended transition period provided in Section 7(a)(2)(B) of the Securities Act, for complying with new or revised accounting standards. Pursuant to Section 107 of the JOBS Act, we have chosen to “opt out” of such extended transition period and, as a result, we will comply with new or revised accounting standards on the relevant dates on which adoption of such standards is required for companies that are not “emerging growth companies.” Under the JOBS Act, our decision to opt out of the extended transition period for complying with new or revised accounting standards is irrevocable.
We will continue to be an emerging growth company until the earliest to occur of (i) the last day of the fiscal year during which we had total annual gross revenues of at least $1 billion (as indexed for inflation), (ii) the last day of the fiscal year following the fifth anniversary of the closing of the IPO, (iii) the date on which we have, during the previous three-year period, issued more than $1 billion in non-convertible debt or (iv) the date on which we are deemed to be a "large accelerated filer," as defined under the Exchange Act. Accordingly, we could remain an "emerging growth company" until as late as June 30, 2019.
Inflation
The
mar
ket prices of certain materials and components used in manufacturing our products, especially resins that are made with hydrocarbon feedstocks, copper, aluminum and stainless steel, can be volatile. Historically, however, inflation has not had a material effect on our results of operations. Significant increases in inflation, particularly those related to wages and increases in the cost of raw materials, could have an adverse impact on our business, financial condition and results of operations.
New boat buyers often finance their purchases. Inflation typically results in higher interest rates that could translate into an increased cost of boat ownership. Should inflation and increased interest rates occur, prospective consumers may choose to forgo or delay their purchases or buy a less expensive boat in the event credit is not available to finance their boat purchases.
Critical Accounting Policies
Our discussion and analysis of our financial condition and results of operations are based upon our consolidated financial statements, which have been prepared in accordance with GAAP. These principles require us to make estimates and judgments that affect the reported amounts of assets, liabilities, expenses and cash flows, and related disclosure of contingent assets and liabilities. Our estimates include those related to goodwill, revenue recognition, rebates, equity-based compensation, product repurchases and warranty claims. We base our estimates on historical experience and on various other assumptions that we believe to be reasonable under the circumstances. Actual results may differ from these estimates. To the extent that there are material differences between these estimates and our actual results, our future financial statements will be affected.
We believe that of our significant accounting policies, which are described in the notes to our audited consolidated financial statements appearing elsewhere in this Annual Report, the accounting policies listed below involve a greater degree of judgment and complexity. Accordingly, we believe these are the most critical to understand and evaluate fully our financial condition and results of operations.
Goodwill
Goodwill is an asset representing the future economic benefits arising from other assets acquired in a business combination that are not individually identified and separately recognized. Goodwill amounts are not amortized, but rather are evaluated for
55
potential impairment on an annual basis, as of June 30, unless circumstances indicate the need for impairment testing between the annual tests in accordance with the provisions of Accounting Standards Codification, or ASC Topic 350, “Intangibles—Goodwill and Other.” If this assessment indicates the possibility of impairment, the income approach to test for goodwill impairment would be used unless circumstances indicate that a better estimate of fair value was available. Under the income approach, management calculates the fair value of each reporting unit based on the present value of estimated future cash flows. If the fair value of the reporting unit exceeds the carrying value of the net assets including goodwill assigned to that unit, goodwill is not impaired. If the carrying value of the reporting unit’s net assets including goodwill exceeds the fair value of the reporting unit, then management determines the implied fair value of the reporting unit’s goodwill. If the carrying value of a reporting unit’s goodwill exceeds its implied fair value, then we would record an impairment loss equal to the difference. We did not recognize any goodwill impairment charges in the fiscal years ended
June 30, 2014
and
2013
.
Revenue Recognition
We generally manufacture products based on specific orders from dealers and often ship completed products only after receiving credit approval from third-party financial institutions or those participating in floor financing programs. Revenue associated with sales to dealers financed through either source is primarily recorded when all of the following conditions have been met:
|
•
|
an order for a product has been received;
|
|
•
|
a common carrier signs the delivery ticket accepting responsibility for the product; and
|
|
•
|
the product is removed from our property for delivery.
|
These conditions are generally met when title passes, which is when boats are shipped to dealers in accordance with shipping terms, which are primarily free on board shipping point.
Dealers generally have no rights to return unsold boats. From time to time, however, we may accept returns in limited circumstances and at our discretion under our warranty policy, which generally limits returns to instances of manufacturing defects. We estimate the costs that may be incurred under our basic limited warranty and record a liability in the amount of such costs at the time the product revenue is recognized. We may also be obligated, in the event of default by a dealer, to accept returns of unsold boats under our repurchase commitment to floor financing providers, which are able to obtain such boats through foreclosure. We accrue estimated losses when a loss, due to the default of one of our dealers, is determined to be probable and the amount of the loss is reasonably estimable. Refer to Notes 6 and 14 to our audited consolidated financial statements included elsewhere in this Annual Report for more information related to our product warranty and repurchase commitment obligations, respectively.
Revenue from boat part sales is recorded as the product is shipped from our location, which is free on board shipping point. Revenue associated with sales of materials, parts, boats or engine products sold under our exclusive manufacturing and distribution agreement with our Australian licensee are recognized under free-on-board port of disembarkment terms, the point at which the risks of ownership and loss pass to the licensee. We also earn royalties from our Australian licensee, which are accrued on a monthly basis based on a percentage of the licensee’s gross sales. Royalties earned are paid to us on a quarterly basis.
Revenue associated with sales to the independent representative responsible for international sales is recognized in accordance with free on board shipping point terms, the point at which the risks of ownership and loss pass to the representative. A fixed percentage discount is earned by the independent representative at the time of shipment to the representative as a reduction in the price of the boat and is recorded in our consolidated statement of operations as a reduction in sales.
Rebates, Promotions, Floor Financing and Incentives
We provide for various structured dealer rebate and sales promotions incentives, which are recognized as a reduction in net sales, at the time of sale to the dealer. Examples of such programs include rebates, seasonal discounts, promotional co-op arrangements and other allowances. Dealer rebates and sales promotion expenses are estimated based on current programs and historical achievement and/or usage rates. Actual results may differ from these estimates if market conditions dictate the need to enhance or reduce sales promotion and incentive programs or if dealer achievement or other items vary from historical trends. Free floor financing incentives are estimated at the time of sale to the dealer based on the expected expense to us over the term of the free flooring period and are recognized as a reduction in sales.
Income Taxes
56
Malibu Boats, Inc. is taxed as a C corporation for U.S. income tax purposes and is therefore subject to both federal and state taxation at a corporate level. Following the IPO, the LLC continues to operate in the United States as a partnership for U.S. federal income tax purposes.
We file various federal and state tax returns, including some returns that are consolidated with subsidiaries. We account for the current and deferred tax effects of such returns using the asset and liability method. Significant judgments and estimates are required in determining our current and deferred tax assets and liabilities, which reflect our best assessment of the estimated future taxes we will pay. These estimates are updated throughout the year to consider income tax return filings, our geographic mix of earnings, legislative changes and other relevant items.
We recognize deferred tax assets and liabilities based on the differences between the financial statement carrying amounts of assets and liabilities and the amounts used for income tax purposes. Deferred tax assets represent items to be used as a tax deduction or credit in future tax returns. Realization of the deferred tax assets ultimately depends on the existence of sufficient taxable income of the appropriate character in either the carryback or carryforward period.
Each quarter we analyze the likelihood that our deferred tax assets will be realized. A valuation allowance is recorded if, based on the weight of all available positive and negative evidence, it is more likely than not (a likelihood of more than 50%) that some portion, or all, of a deferred tax asset will not be realized. A summary of our deferred tax assets is included in Note 10 to our audited consolidated financial statements included elsewhere in this Annual Report.
On an annual basis, we perform a comprehensive analysis of all forms of positive and negative evidence based on year end results. During each interim period, we update our annual analysis for significant changes in the positive and negative evidence.
If we later determine that realization is more likely than not for deferred tax assets with a valuation allowance, the related valuation allowance will be reduced. Conversely, if we determine that it is more likely than not that we will not be able to realize a portion of our deferred tax assets, we will increase the valuation allowance.
We recognize a tax benefit associated with an uncertain tax position when, in our judgment, it is more likely than not that the position will be sustained based upon the technical merits of the position. For a tax position that meets the more-likely-than-not recognition threshold, we initially and subsequently measure the income tax benefit as the largest amount that we judge to have a greater than 50% likelihood of being realized. Our liability associated with unrecognized tax benefits is adjusted periodically due to changing circumstances, such as the progress of tax audits, case law developments and new or emerging legislation. Such adjustments are recognized entirely in the period in which they are identified. Our income tax provision includes the net impact of changes in the liability for unrecognized tax benefits.
We have not filed a tax return yet and therefore have no open tax years. However, our subsidiary, Malibu Boats Holdings, LLC, remains open to examination for years 2011 through 2013 in certain tax jurisdictions. While it is often difficult to predict the final outcome or the timing of resolution of any particular tax matter, we believe our liability for unrecognized tax benefits is adequate.
We consider an issue to be resolved at the earlier of the issue being “effectively settled,” settlement of an examination, or the expiration of the statute of limitations. Upon resolution, unrecognized tax benefits will be reversed as a discrete event.
Our liability for unrecognized tax benefits is generally presented as noncurrent. However, if we anticipate paying cash within one year to settle an uncertain tax position, the liability is presented as current. We classify interest and penalties recognized on the liability for unrecognized tax benefits as income tax expense.
Tax Receivable Agreement
As a result of exchanges of LLC Units into Class A Common Stock and purchases by us of LLC Units from holders of LLC Units, we will become entitled to a proportionate share of the existing tax basis of the assets of the LLC at the time of such exchanges or purchases. In addition, such exchanges or purchases of LLC Units are expected to result in increases in the tax basis of the assets of the LLC that otherwise would not have been available. These increases in tax basis may reduce the amount of tax that we would otherwise be required to pay in the future. These increases in tax basis may also decrease gains (or increase losses) on future dispositions of certain capital assets to the extent tax basis is allocated to those capital assets.
In connection with the Recapitalization and IPO, we entered into a tax receivable agreement with the pre-IPO owners of the LLC that provides for the payment by us to the pre-IPO owners (or any permitted assignees) of 85% of the amount of the benefits, if any, that we are deemed to realize as a result of (i) increases in tax basis and (ii) certain other tax benefits, including those attributable to payments, under the tax receivable agreement. These payment obligations are our obligations and are not obligations of the LLC. For purposes of the tax receivable agreement, the benefit deemed realized by us will be computed by
57
comparing our actual income tax liability (calculated with certain assumptions) to the amount of such taxes that we would have been required to pay had there been no increase to the tax basis of the assets of the LLC as a result of the purchases or exchanges, and had we not entered into the tax receivable agreement.
The timing and/or amount of aggregate payments due under the tax receivable agreement may vary based on a number of factors, including the amount and timing of the taxable income we generate in the future and the tax rate then applicable and amortizable basis.
The term of the tax receivable agreement will continue until all such tax benefits have been utilized or expired, unless we exercise our right to terminate the tax receivable agreement for an amount based on the agreed payments remaining to be made under the agreement. In certain mergers, asset sales or other forms of business combinations or other changes of control, we (or our successor) would owe to the existing owners of the LLC a lump-sum payment equal to the present value of all forecasted future payments that would have otherwise been made under the tax receivable agreement that would be based on certain assumptions, including a deemed exchange of all LLC Units and that we would have had sufficient taxable income to fully utilize the deductions arising from the increased tax basis and other tax benefits related to entering into the tax receivable agreement.
Equity-Based Compensation
On January 6, 2014, our board of directors adopted the Malibu Boats, Inc. Long-Term Incentive Plan, or the Incentive Plan. The Incentive Plan, which became effective on January 1, 2014, reserves for issuance up to 1,700,000 shares of our Class A Common Stock. Incentive stock awards authorized under the plan include stock options, stock appreciation rights, restricted stock, restricted stock units, dividend equivalent awards and performance awards. Stock-based compensation expense is accounted for in accordance with the provisions of ASC Topic 718, "Compensation - Stock Compensation". The compensation cost recorded for these awards will be based on their fair value at grant date.
Stock-based compensation attributable to profits interest awards granted to employees pursuant to the LLC’s limited liability company agreement in effect prior to our IPO are also accounted for in accordance with the provisions of ASC Topic 718. The fair value of profits interest awards are based on the value of our LLC Units, which is estimated, on the date of grant, using the Black-Scholes model. These awards are subject to the terms of the applicable agreement governing the profits interest award.
For all time-vesting awards granted, stock-based compensation expense is recognized in the statements of operations and amortized using the straight-line attribution method. For profits interest awards that contain a liquidity condition, which is satisfied upon occurrence of a qualifying event, defined as a change in control transaction, expense recognition will occur at the time of the qualifying event.
We utilize the Black-Scholes model for estimating fair value of our awards granted. Option valuation models, including the Black-Scholes model, require the input of subjective assumptions, and changes in the assumptions used can materially affect the grant date fair value of an award. These assumptions include the risk-free rate of interest, expected dividend yield, expected volatility and the expected life of the award.
Expected volatility rates used for determining the fair value of profits interest awards are based on historical volatility of the common stock of comparable publicly traded entities and other factors, including adjustments for leverage, due to the lack of historic information regarding the LLC. The expected life of profits interest awards is the period of time for which the profits interest awards are expected to be outstanding. Given the lack of historic exercise data, the expected life is determined using the anticipated liquidity event for the awards.
The risk-free interest rates used for determining the fair value of profits interest awards are based on the U.S. Treasury yield for a period consistent with the expected term of the option in effect at the time of the grant. We do not anticipate paying any cash dividends in the foreseeable future, therefore, we have assumed an expected dividend rate of zero.
Given the absence of an active market for our equity prior to our IPO, the exercise price of the profits interest awards on the date of grant was determined and approved by the board of directors using several factors, including progress and milestones achieved in our business development and performance, general industry and economic trends. In establishing the estimated fair value of our profits interest awards, we considered the guidance set forth in American Institute of Certified Public Accountants Practice Guide, “Valuation of Privately-Held-Company Equity Securities Issued as Compensation.”
58
The table below sets forth the assumptions used for calculating the value of profits interest awards granted during the fiscal year ended June 2012. No profit interest awards were granted during the fiscal year ended June 30, 2013.
|
|
Fiscal Year Ended June 30, 2012
|
|
|
Dividend yield
|
0.00%
|
|
|
Expected volatility
|
75% - 84%
|
|
|
Weighted-average risk-free interest rate
|
0.53% - 0.65%
|
|
|
Expected term (years)
|
4.0
|
|
On November 1, 2013, the LLC granted profits interest awards to certain members of its management, which were subsequently converted to LLC Units as part of the Recapitalization. The fair value of the awards was calculated using the Probability-Weighted Expected Return Method under which the LLC’s enterprise value was estimated at the date of potential future outcomes, such as an initial public offering, strategic sale, or liquidation event. In connection with such estimation, each potential outcome was weighted according to the likelihood of such potential future outcome occurring as of November 1, 2013. These awards will vest in three equal installments on each of September 30, 2014, September 30, 2015 and September 30, 2016.
On June 26, 2014, the vesting period for certain profit interest awards granted to a member of management on November 1, 2013 and previously granted in 2012 were accelerated to vest on the date immediately prior to the completion of the follow-on offering. Refer to Note 12 in our audited consolidated financial statements included elsewhere in this Annual Report.
Repurchase Commitments
In connection with our dealers’ wholesale floor plan financing of boats, we have entered into repurchase agreements with various lending institutions. The repurchase commitment is on an individual unit basis with a term from the date it is financed by the lending institution through payment date by the dealer, generally not exceeding two and a half years. Such agreements are customary in the industry and our exposure to loss under such agreements is limited by the resale value of the inventory which is required to be repurchased. No units were repurchased for fiscal years
2014
or
2013
.
Product Warranties
We provide a limited warranty for a period of up to three years for our products. Our standard warranties require us or our dealers to repair or replace defective products during the warranty period at no cost to the consumer. We estimate the costs that may be incurred under our basic limited warranty and records as a liability in the amount of such costs at the time the product revenue is recognized. Factors that affect our warranty liability include the number of units sold, historical and anticipated rates of warranty claims, and cost per claim. We periodically assess the adequacy of the recorded warranty liabilities by brand and adjust the amounts as necessary. We utilize historical trends and analytical tools to assist in determining the appropriate warranty liability.
New Accounting Pronouncements
See "Part II, Item 8. Financial Statements and Supplementary Data—Note 1—Organization, Basis of Presentation, and Summary of Significant Accounting Policies—New Accounting Pronouncements.”
Market risk represents the risk of loss that may impact our financial condition through adverse changes in financial market prices and rates and inflation. Changes in these factors could cause fluctuations in our results of operations and cash flows. In the ordinary course of business, we are primarily exposed to interest rate risks. We manage our exposure to these market risks through regular operating and financing activities. In the past, we have also attempted to reduce our market risks through hedging instruments such as interest rate swaps.
59
INDEX TO FINANCIAL STATEMENTS
|
|
Page
|
60
Report of Independent Registered Public Accounting Firm
on Consolidated Financial Statements
To the Board of Directors and Shareholders
Malibu Boats, Inc. and Subsidiaries
We have audited the accompanying consolidated balance sheets of Malibu Boats, Inc. and subsidiaries as of June 30, 2014 and 2013, and the related consolidated statements of operations, stockholders' equity, and cash flows for the years ended June 30, 2014, 2013 and 2012. These financial statements are the responsibility of the Company's management. Our responsibility is to express an opinion on these financial statements based on our audits.
We conducted our audits in accordance with the standards of the Public Company Accounting Oversight Board (United States). Those standards require that we plan and perform the audit to obtain reasonable assurance about whether the financial statements are free of material misstatement. The Company is not required to have, nor were we engaged to perform, an audit of its internal control over financial reporting. Our audits included consideration of internal control over financial reporting as a basis for designing audit procedures that are appropriate in the circumstances, but not for the purpose of expressing an opinion on the effectiveness of the Company’s internal control over financial reporting. Accordingly, we express no such opinion. An audit also includes examining, on a test basis, evidence supporting the amounts and disclosures in the financial statements, assessing the accounting principles used and significant estimates made by management, as well as evaluating the overall financial statement presentation. We believe that our audits provide a reasonable basis for our opinion.
In our opinion, the consolidated financial statements referred to above present fairly, in all material respects, the financial position of Malibu Boats, Inc. and subsidiaries as of June 30, 2014 and 2013, and the results of their operations and their cash flows for the years ended June 30, 2014, 2013 and 2012, in conformity with U.S. generally accepted accounting principles.
/s/ McGladrey LLP
Indianapolis, Indiana
September 24, 2014
61
MALIBU BOATS, INC. AND SUBSIDIARIES
(In thousands, except share data)
|
|
Fiscal Year Ended June 30,
|
|||||||||||
|
|
2014
|
2013
|
2012
|
|||||||||
|
Net sales
|
$
|
190,935
|
|
$
|
167,012
|
|
$
|
140,892
|
|
|||
|
Cost of sales
|
140,141
|
|
123,412
|
|
110,849
|
|
||||||
|
Gross profit
|
50,794
|
|
43,600
|
|
30,043
|
|
||||||
|
Operating expenses:
|
|
|
|
|
||||||||
|
Selling and marketing
|
6,098
|
|
4,937
|
|
4,071
|
|
||||||
|
General and administrative
|
39,974
|
|
14,177
|
|
8,307
|
|
||||||
|
Amortization
|
5,177
|
|
5,178
|
|
5,178
|
|
||||||
|
Operating (loss) income
|
(455
|
)
|
19,308
|
|
12,487
|
|
||||||
|
Other income (expense):
|
|
|
|
|
||||||||
|
Other
|
9
|
|
10
|
|
52
|
|
||||||
|
Interest expense
|
(2,962
|
)
|
(1,334
|
)
|
(1,433
|
)
|
||||||
|
Other expense
|
(2,953
|
)
|
(1,324
|
)
|
(1,381
|
)
|
||||||
|
Net (loss) income before benefit for income taxes
|
(3,408
|
)
|
17,984
|
|
11,106
|
|
||||||
|
Income tax benefit
|
(2,220
|
)
|
—
|
|
—
|
|
||||||
|
Net (loss) income
|
$
|
(1,188
|
)
|
$
|
17,984
|
|
$
|
11,106
|
|
|||
|
Net income attributable to non-controlling interest
|
3,488
|
|
17,984
|
|
11,106
|
|
||||||
|
Net loss attributable to Malibu Boats, Inc.
|
$
|
(4,676
|
)
|
$
|
—
|
|
$
|
—
|
|
|||
|
For Period from February 5, 2014 to June 30, 2014
|
||||||||||||
|
Weighted average shares outstanding used in computing net loss per share:
|
||||||||||||
|
Basic
|
11,055,310
|
|
||||||||||
|
Diluted
|
11,055,310
|
|
||||||||||
|
Net loss available to Class A Common Stock per share:
|
||||||||||||
|
Basic
|
$
|
(0.42
|
)
|
|||||||||
|
Diluted
|
$
|
(0.42
|
)
|
|||||||||
The accompanying notes are an integral part of these Consolidated Financial Statements.
62
MALIBU BOATS, INC. AND SUBSIDIARIES
(In thousands, except share data)
|
June 30, 2014
|
June 30, 2013
|
||||||
|
Assets
|
|
|
|
|
|||
|
Current assets
|
|
|
|
|
|||
|
Cash
|
$
|
12,173
|
|
$
|
15,957
|
|
|
|
Trade receivables, net
|
6,475
|
|
7,642
|
|
|||
|
Inventories, net
|
12,890
|
|
11,639
|
|
|||
|
Deferred tax asset
|
500
|
|
—
|
|
|||
|
Prepaid expenses
|
2,272
|
|
223
|
|
|||
|
Total current assets
|
34,310
|
|
35,461
|
|
|||
|
Property and equipment, net
|
10,963
|
|
6,648
|
|
|||
|
Goodwill
|
5,718
|
|
5,718
|
|
|||
|
Other intangible assets
|
12,358
|
|
17,535
|
|
|||
|
Debt issuance costs, net
|
—
|
|
531
|
|
|||
|
Deferred tax asset
|
21,452
|
|
—
|
|
|||
|
Other assets
|
—
|
|
34
|
|
|||
|
Total assets
|
$
|
84,801
|
|
$
|
65,927
|
|
|
|
Liabilities
|
|
|
|
|
|||
|
Current liabilities
|
|
|
|
|
|||
|
Current maturities of long-term debt
|
$
|
—
|
|
$
|
3,326
|
|
|
|
Accounts payable
|
7,161
|
|
11,294
|
|
|||
|
Accrued expenses:
|
|||||||
|
Compensation
|
2,164
|
|
2,154
|
|
|||
|
Warranties
|
6,164
|
|
5,658
|
|
|||
|
Dealer incentives
|
2,404
|
|
2,709
|
|
|||
|
Legal and professional fees
|
1,490
|
|
361
|
|
|||
|
Litigation
|
20,000
|
|
—
|
|
|||
|
Other
|
462
|
|
3
|
|
|||
|
Income tax and distribution payable
|
2,121
|
|
—
|
|
|||
|
Deferred tax liabilities
|
995
|
|
—
|
|
|||
|
Total current liabilities
|
42,961
|
|
25,505
|
|
|||
|
Deferred gain on sale-leaseback
|
134
|
|
145
|
|
|||
|
Payable pursuant to tax receivable agreement
|
13,636
|
|
—
|
|
|||
|
Long-term debt, less current maturities
|
—
|
|
20,263
|
|
|||
|
Total liabilities
|
56,731
|
|
45,913
|
|
|||
|
Commitments and contingencies (See Note 14)
|
|
|
|
|
|||
|
Equity
|
|
|
|
|
|||
|
Class A Common Stock, par value $0.01 per share, 100,000,000 shares authorized; 11,064,201
shares issued and outstanding as of June 30, 2014; none authorized, issued or outstanding as of June 30, 2013
|
110
|
|
—
|
|
|||
|
Class B Common Stock, par value $0.01 per share, 25,000,000 shares authorized; 44 shares issued and outstanding as of June 30, 2014; none authorized, issued or outstanding as of June 30, 2013
|
—
|
|
—
|
|
|||
|
Preferred Stock, par value $0.01 per share; 25,000,000 shares authorized; no shares issued and outstanding as of June 30, 2014; none authorized, issued or outstanding as of June 30, 2013
|
—
|
|
—
|
|
|||
|
Class A Units, no units authorized, issued and outstanding as of June 30, 2014 and 37,000 units authorized, 36,742 units issued and outstanding as of June 30, 2013
|
—
|
|
16,978
|
|
|||
|
Class B Units, no units authorized, issued and outstanding as of June 30, 2014 and 3,885 units authorized, issued and outstanding as of June 30, 2013
|
—
|
|
(2,417
|
)
|
|||
|
Class M Units, no units authorized, issued and outstanding as of June 30, 2014 and 2,658 units authorized, 1,421 units issued and outstanding as of June 30, 2013
|
—
|
|
(460
|
)
|
|||
|
Additional paid in capital
|
23,835
|
|
—
|
|
|||
|
Accumulated (deficit) earnings
|
(4,676
|
)
|
5,913
|
|
|||
|
Total stockholders' equity attributable to Malibu Boats, Inc./members' equity
|
19,269
|
|
20,014
|
|
|||
|
Non-controlling interest
|
$
|
8,801
|
|
$
|
—
|
|
|
|
Total stockholders’/members' equity
|
$
|
28,070
|
|
$
|
20,014
|
|
|
|
Total liabilities and equity
|
$
|
84,801
|
|
$
|
65,927
|
|
|
The accompanying notes are an integral part of these Consolidated Financial Statements.
63
MALIBU BOATS, INC. AND SUBSIDIARIES
Consolidated Statements of Members’ and Stockholders' Equity
(In thousands, except number of Class B shares)
|
Malibu Boats Holdings, LLC
|
Malibu Boats, Inc.
|
||||||||||||||||||||||||||||||||||||||||||||||||||||||
|
Units
|
Accumulated (Deficit) Earnings
|
Common Stock
|
Additional Paid In Capital
|
Non-controlling Interest in LLC
|
Accumulated Deficit
|
Total Members/Stockholders Equity
|
|||||||||||||||||||||||||||||||||||||||||||||||||
|
LLC Units
|
Class A Units
|
Class B Units
|
Class M Units
|
Class A
|
Class B
|
||||||||||||||||||||||||||||||||||||||||||||||||||
|
Units
|
Amount
|
Units
|
Amount
|
Units
|
Amount
|
Units
|
Amount
|
Shares
|
Amount
|
Shares
|
Amount
|
||||||||||||||||||||||||||||||||||||||||||||
|
Balance at June 30, 2011
|
—
|
|
$
|
—
|
|
37,000
|
|
$
|
37,000
|
|
3,885
|
|
$
|
526
|
|
469
|
|
$
|
118
|
|
$
|
(23,177
|
)
|
—
|
|
$
|
—
|
|
—
|
|
$
|
—
|
|
$
|
—
|
|
$
|
—
|
|
$
|
—
|
|
$
|
14,467
|
|
||||||||||
|
Net income
|
|
|
|
|
|
|
|
|
|
|
|
|
11,106
|
|
11,106
|
|
|||||||||||||||||||||||||||||||||||||||
|
Stock based compensation
|
|
|
|
|
|
|
|
|
|
|
132
|
|
|
|
132
|
|
|||||||||||||||||||||||||||||||||||||||
|
Membership units vested
|
|
|
|
|
559
|
|
|
|
|
|
—
|
|
|||||||||||||||||||||||||||||||||||||||||||
|
Repurchase of vested membership units
|
(258
|
)
|
(223
|
)
|
|
|
|
|
(113
|
)
|
(37
|
)
|
|
|
(260
|
)
|
|||||||||||||||||||||||||||||||||||||||
|
Balance at June 30, 2012
|
—
|
|
—
|
|
36,742
|
|
36,777
|
|
3,885
|
|
526
|
|
915
|
|
213
|
|
(12,071
|
)
|
—
|
|
—
|
|
—
|
|
—
|
|
—
|
|
—
|
|
—
|
|
25,445
|
|
|||||||||||||||||||||
|
Net income
|
17,984
|
|
17,984
|
|
|||||||||||||||||||||||||||||||||||||||||||||||||||
|
Stock based compensation
|
127
|
|
127
|
|
|||||||||||||||||||||||||||||||||||||||||||||||||||
|
Membership units vested
|
506
|
|
—
|
|
|||||||||||||||||||||||||||||||||||||||||||||||||||
|
Distributions to members
|
(19,799
|
)
|
(2,943
|
)
|
(800
|
)
|
(23,542
|
)
|
|||||||||||||||||||||||||||||||||||||||||||||||
|
Balance at June 30, 2013
|
—
|
|
—
|
|
36,742
|
|
16,978
|
|
3,885
|
|
(2,417
|
)
|
1,421
|
|
(460
|
)
|
5,913
|
|
—
|
|
—
|
|
—
|
|
—
|
|
—
|
|
—
|
|
—
|
|
20,014
|
|
|||||||||||||||||||||
|
Net income before February 5, 2014
|
10,448
|
|
10,448
|
|
|||||||||||||||||||||||||||||||||||||||||||||||||||
|
Stock based compensation before February 5, 2014
|
76
|
|
76
|
|
|||||||||||||||||||||||||||||||||||||||||||||||||||
|
Membership units vested before February 5, 2014
|
304
|
|
—
|
|
|||||||||||||||||||||||||||||||||||||||||||||||||||
|
Distributions to non-controlling unit holders before February 5, 2014
|
(55,172
|
)
|
|
|
(6,474
|
)
|
(2,981
|
)
|
—
|
|
(64,627
|
)
|
|||||||||||||||||||||||||||||||||||||||||||
|
Recapitalization Transactions:
|
|||||||||||||||||||||||||||||||||||||||||||||||||||||||
|
Issuance of Class A Common Stock for merger of entities in Recapitalization
|
3,412
|
|
34
|
|
47,732
|
|
47,766
|
|
|||||||||||||||||||||||||||||||||||||||||||||||
64
|
Exchange of LLC Units held by selling shareholders for Class A Common Stock upon merger of entities in Recapitalization
|
(47,766
|
)
|
(47,766
|
)
|
|||||||||||||||||||||||||||||||||||||||||||||||||||
|
Conversion of previous classes of units into LLC units as part of the Recapitalization
|
11,374
|
|
(50,450
|
)
|
(36,742
|
)
|
38,194
|
|
(3,885
|
)
|
8,891
|
|
(1,725
|
)
|
3,365
|
|
—
|
|
|||||||||||||||||||||||||||||||||||||
|
Initial Public Offering Transactions:
|
|||||||||||||||||||||||||||||||||||||||||||||||||||||||
|
Allocation of non-controlling interest in LLC
|
(11,374
|
)
|
50,450
|
|
(16,361
|
)
|
(52,433
|
)
|
18,344
|
|
—
|
|
|||||||||||||||||||||||||||||||||||||||||||
|
Issuance of Class A Common Stock for IPO, net of underwriting discounts
|
7,643
|
|
76
|
|
99,436
|
|
99,512
|
|
|||||||||||||||||||||||||||||||||||||||||||||||
|
Issuance of Class B Common Stock
|
44
|
|
—
|
|
—
|
|
|||||||||||||||||||||||||||||||||||||||||||||||||
|
Purchase of LLC Units from existing owners of LLC
|
(29,762
|
)
|
(29,762
|
)
|
|||||||||||||||||||||||||||||||||||||||||||||||||||
|
Increase in payable pursuant to the tax receivable agreement
|
(13,636
|
)
|
(13,636
|
)
|
|||||||||||||||||||||||||||||||||||||||||||||||||||
|
Increase in deferred tax asset from step-up in tax basis
|
18,303
|
|
18,303
|
|
|||||||||||||||||||||||||||||||||||||||||||||||||||
|
Capitalized offering costs
|
(1,550
|
)
|
(1,550
|
)
|
|||||||||||||||||||||||||||||||||||||||||||||||||||
|
Stock based compensation
|
2,501
|
|
2,501
|
|
|||||||||||||||||||||||||||||||||||||||||||||||||||
|
Distributions to non-controlling unit holders
|
(2,583
|
)
|
(2,583
|
)
|
|||||||||||||||||||||||||||||||||||||||||||||||||||
|
Issuance of equity for services
|
9
|
|
—
|
|
1,010
|
|
1,010
|
|
|||||||||||||||||||||||||||||||||||||||||||||||
|
Net loss after February 5, 2014
|
(6,960
|
)
|
(4,676
|
)
|
(11,636
|
)
|
|||||||||||||||||||||||||||||||||||||||||||||||||
|
Balance at June 30, 2014
|
—
|
|
$
|
—
|
|
—
|
|
$
|
—
|
|
—
|
|
$
|
—
|
|
—
|
|
$
|
—
|
|
$
|
—
|
|
11,064
|
|
$
|
110
|
|
44
|
|
$
|
—
|
|
$
|
23,835
|
|
$
|
8,801
|
|
$
|
(4,676
|
)
|
$
|
28,070
|
|
||||||||||
The accompanying notes are an integral part of these Consolidated Financial Statements.
65
MALIBU BOATS, INC. AND SUBSIDIARIES
(In thousands)
|
|
Fiscal Year Ended June 30,
|
|||||||||||
|
|
2014
|
2013
|
2012
|
|||||||||
|
Operating activities:
|
||||||||||||
|
Net (loss) income
|
$
|
(1,188
|
)
|
$
|
17,984
|
|
$
|
11,106
|
|
|||
|
Adjustments to reconcile net (loss) income to net cash provided by operating activities:
|
||||||||||||
|
Non-cash compensation expense
|
2,577
|
|
127
|
|
132
|
|
||||||
|
Non-cash litigation settlement payable
|
20,000
|
|
—
|
|
—
|
|
||||||
|
Depreciation
|
1,600
|
|
1,090
|
|
895
|
|
||||||
|
Amortization of intangible assets
|
5,177
|
|
5,178
|
|
5,178
|
|
||||||
|
Gain on sale-leaseback transaction
|
(11
|
)
|
(11
|
)
|
(11
|
)
|
||||||
|
Amortization of deferred financing costs
|
1,583
|
|
148
|
|
181
|
|
||||||
|
Change in fair value of derivative
|
28
|
|
(28
|
)
|
—
|
|
||||||
|
Deferred income taxes
|
(2,654
|
)
|
—
|
|
—
|
|
||||||
|
(Gain) loss on sale of equipment
|
(9
|
)
|
—
|
|
5
|
|
||||||
|
Change in operating assets and liabilities:
|
||||||||||||
|
Trade receivables
|
1,167
|
|
(161
|
)
|
(3,675
|
)
|
||||||
|
Inventories
|
(1,251
|
)
|
(2,516
|
)
|
944
|
|
||||||
|
Prepaid expenses and other assets
|
(1,332
|
)
|
(211
|
)
|
145
|
|
||||||
|
Accounts payable
|
(4,133
|
)
|
1,441
|
|
(1,189
|
)
|
||||||
|
Accrued expenses
|
2,098
|
|
2,858
|
|
1,784
|
|
||||||
|
Income taxes payable
|
113
|
|
—
|
|
—
|
|
||||||
|
Net cash provided by operating activities
|
23,765
|
|
25,899
|
|
15,495
|
|
||||||
|
Investing activities:
|
||||||||||||
|
Purchases of property and equipment
|
(5,915
|
)
|
(2,878
|
)
|
(2,651
|
)
|
||||||
|
Proceeds from sale of property and equipment
|
9
|
|
—
|
|
—
|
|
||||||
|
Net cash used in investing activities
|
(5,906
|
)
|
(2,878
|
)
|
(2,651
|
)
|
||||||
|
Financing activities:
|
||||||||||||
|
Principal payments on long-term borrowings
|
(88,589
|
)
|
(26,155
|
)
|
(6,872
|
)
|
||||||
|
Proceeds from long-term borrowings
|
65,000
|
|
28,500
|
|
—
|
|
||||||
|
Payment of deferred financing costs
|
(1,052
|
)
|
(664
|
)
|
—
|
|
||||||
|
Proceeds from issuance of Class A Common Stock in initial public offering, net of underwriting discounts
|
99,512
|
|
—
|
|
—
|
|
||||||
|
Purchase of units from existing LLC Unit holders
|
(29,762
|
)
|
—
|
|
—
|
|
||||||
|
Payment of costs directly associated with initial public offering
|
(1,550
|
)
|
—
|
|
—
|
|
||||||
|
Distributions to non-controlling LLC Unit holders
|
(65,202
|
)
|
(23,542
|
)
|
—
|
|
||||||
|
Repurchase of member units
|
—
|
|
—
|
|
(260
|
)
|
||||||
|
Net cash used in financing activities
|
(21,643
|
)
|
(21,861
|
)
|
(7,132
|
)
|
||||||
|
Changes in cash
|
(3,784
|
)
|
1,160
|
|
5,712
|
|
||||||
|
Cash—Beginning of period
|
15,957
|
|
14,797
|
|
9,085
|
|
||||||
|
Cash—End of period
|
$
|
12,173
|
|
$
|
15,957
|
|
$
|
14,797
|
|
|||
|
Supplemental cash flow information:
|
||||||||||||
|
Cash paid for interest
|
$
|
1,383
|
|
$
|
1,190
|
|
$
|
1,241
|
|
|||
|
Cash paid for income taxes
|
392
|
|
—
|
|
—
|
|
||||||
|
Non-cash financing activities:
|
||||||||||||
|
Initial establishment of deferred tax assets
|
18,303
|
|
—
|
|
—
|
|
||||||
|
Initial establishment of amounts payable under tax receivable agreements
|
13,636
|
|
—
|
|
—
|
|
||||||
|
Exchange of LLC Units held by selling shareholders for Class A Common Stock upon merger of entities in Recapitalization
|
47,766
|
|
—
|
|
—
|
|
||||||
|
Tax distributions payable to non-controlling LLC Unit holders
|
2,008
|
|
—
|
|
—
|
|
||||||
|
Equity issued for services
|
1,010
|
|
—
|
|
—
|
|
||||||
The accompanying notes are an integral part of these Consolidated Financial Statements.
66
MALIBU BOATS, INC. AND SUBSIDIARIES
Notes to Consolidated Financial Statements
(Dollars in thousands, except per unit and per share data)
1. Organization, Basis of Presentation, and Summary of Significant Accounting Policies
Organization
Malibu Boats, Inc. (together with its subsidiaries, the “Company” or "Malibu") was formed as a Delaware corporation on November 1, 2013, as a holding company for the purposes of facilitating an initial public offering of shares of common stock. The Company was not engaged in any business or other activities except in connection with its formation and registration with the Securities and Exchange Commission (“SEC”). Following the Recapitalization and IPO transactions completed on February 5, 2014 (as such terms are defined in Note 2), the Company became the sole managing member of and has a controlling interest in Malibu Boats Holdings, LLC (the "LLC"). As the sole managing member the Company operates and controls all of the LLC's business and affairs and, therefore, pursuant to Accounting Standards Codification (“ASC”) Topic 810, "Consolidation", consolidates the financial results of the LLC and its subsidiaries, and recorded a non-controlling interest for the economic interest in the Company held by the holders of units in the LLC ("LLC Units"). Malibu Boats Holdings, LLC was formed in 2006 with the acquisition by an investor group, including affiliates of Black Canyon Capital LLC, Horizon Holdings, LLC and then-current management. Malibu Boats Holdings, LLC is engaged in the design, engineering, manufacturing and marketing of innovative, high-quality, performance sports boats that are sold through a world-wide network of independent dealers.
On June 2, 2014, the Company entered into a non-binding letter of intent to acquire all of the equity interest of the Malibu Boats licensee in Australia. The Australian license business is operated by Malibu Boats Pty Ltd. and includes distribution rights in the Australia and New Zealand markets as well as manufacturing facility in Albury, Australia. The proposed acquisition is expected to close in the first half of fiscal year 2015, subject to negotiation and execution of definitive documentation.
Basis of Presentation
The accompanying consolidated financial statements have been prepared in accordance with accounting principles generally accepted in the United States ("GAAP"). Certain reclassifications have been made to the prior period presentation to conform to the current period presentation. Units and shares are presented as whole numbers while all dollar amounts are presented in thousands, unless otherwise noted.
Principles of Consolidation
The accompanying consolidated financial statements include the operations and accounts of the Company and all subsidiaries thereof. All intercompany balances and transactions have been eliminated upon consolidation.
Non-controlling Interest
The non-controlling interest on the consolidated statement of operations represents the portion of earnings or loss attributable to the economic interest in the Company's subsidiary, Malibu Boats Holdings, LLC, held by the non-controlling LLC Unit holders. Non-controlling interest on the consolidated balance sheet represents the portion of net assets of the Company attributable to the non-controlling LLC Unit holders, based on the portion of the LLC Units owned by such unit holders. As of
June 30, 2014
, the non-controlling interest was
50.7%
.
The balance of the non-controlling interest from the initial public offering date of February 5, 2014 (the "IPO") to
June 30, 2014
is as follows (in thousands):
|
Balance held by the non-controlling LLC unit holders immediately after the IPO
|
$
|
18,344
|
|
|
|
Allocation of loss to the non-controlling LLC unit holders subsequent to the IPO
|
(6,960
|
)
|
||
|
Distributions paid and payable to non-controlling LLC unit holders subsequent to IPO
|
(2,583
|
)
|
||
|
Balance of non-controlling interest as of June 30, 2014
|
$
|
8,801
|
|
|
Use of Estimates
The preparation of financial statements in conformity with GAAP requires management to make estimates and assumptions that affect the reported amounts of assets and liabilities and disclosure of contingent assets and liabilities as of the
67
date of the financial statements and the reported amounts of revenues and expenses during the reporting period. Actual results could differ from those estimates, and such differences could be material.
Certain Significant Risks and Uncertainties
The Company is subject to those risks common in manufacture-driven markets, including, but not limited to, competitive forces, dependence on key personnel, consumer demand for its products, the successful protection of its proprietary technologies, compliance with government regulations and the possibility of not being able to obtain additional financing if and when needed.
Concentration of Credit and Business Risk
A majority of the Company’s sales are made pursuant to floor plan financing programs in which the Company participates on behalf of its dealers through a contingent repurchase agreement with various third-party financing institutions. Under these arrangements, a dealer establishes a line of credit with one or more of these third-party lenders for the purchase of dealer boat inventory. When a dealer purchases and takes delivery of a boat pursuant to a floor plan financing arrangement, it draws against its line of credit and the lender pays the invoice cost of the boat directly to the Company within approximately two weeks. For dealers that use local floor plan financing programs or pay cash, the Company may extend credit without collateral under the dealer agreement based on the Company’s evaluation of the dealer’s credit risk and past payment history. The Company maintains allowances for potential credit losses that it believes are adequate. Refer to Note 1 “Trade Accounts Receivable” for factors considered in determining the Company’s allowance for doubtful accounts.
As of June 30, 2014
(unaudited), the Company’s distribution channel consisted of over
150
independent dealers worldwide. No single dealer accounted for
4.7%
or more of the Company’s unit volume for the fiscal years ended June 30,
2014
and
2013
. The Company’s top ten dealers represented
34.1%
and
36.1%
of the Company’s volume for the fiscal years ended June 30,
2014
and
2013
, respectively.
Cash
The Company considers all highly liquid investments purchased with an original maturity of 90 days or less to be cash equivalents. Cash equivalents are stated at cost, which approximates fair value. As of June 30,
2014
and
2013
, no highly liquid investments were held and the entire balance consists of traditional cash.
At June 30,
2014
and
2013
, substantially all cash on hand was held by one financial institution. This cash on deposit may be, at times, in excess of insurance limits provided by the FDIC.
Trade Accounts Receivable
Trade receivables are carried at original invoice amount less an estimate made for doubtful receivables based on a review of all outstanding amounts on a monthly basis. As of
June 30, 2014
and
2013
, the allowance for doubtful receivables was
$123
and
$254
, respectively. Management determines the allowance for doubtful accounts by identifying troubled accounts and by using historical experience applied to an aging of accounts. Trade receivables are written off when deemed uncollectible. Recoveries of trade receivables previously written off are recorded when received. A trade receivable is considered to be past due if any portion of the receivable balance is outstanding beyond customer terms.
Inventories
Inventories are stated at the lower of cost or market, determined on the first in, first out (“FIFO”) basis. Manufacturing cost includes materials, labor and manufacturing overhead. Unallocated overhead and abnormal costs are expensed as incurred.
Capitalization of Offering Costs
Capitalized offering costs are costs directly attributable to the Company's equity offerings. As of
June 30, 2014
,
$644
of costs directly attributable to the follow-on offering completed on July 15, 2014 (the "Follow-on Offering") were capitalized as prepaid assets. Refer to Note 18 for additional information regarding the Follow-on Offering. Upon closing of the Follow-on Offering, these costs were netted against the proceeds and, as such, were reclassified into additional paid in capital.
Property and Equipment
Property and equipment acquired outside of acquisition are stated at cost. When property and equipment is retired or otherwise disposed of, the related cost and accumulated depreciation is removed from the accounts and any resulting gain or loss is accounted for in the statement of operations. Major additions are capitalized; maintenance, repairs and minor improvements are charged to operating expenses as incurred if they do not increase the life or productivity of the related
68
capitalized asset. Depreciation on leasehold improvements is computed using the straight-line method based on the lesser of the remaining lease term or the estimated useful life and depreciation of equipment is computed using the straight-line method over the estimated useful life as follows:
|
Years
|
||
|
Leasehold improvements
|
Shorter of useful life or lease term
|
|
|
Machinery and equipment
|
3-5
|
|
|
Furniture and fixtures
|
3-5
|
|
The Company accounts for the impairment and disposition of long-lived assets in accordance with ASC Topic 360, “Property, Plant, and Equipment”. In accordance with ASC Topic 360, long-lived assets to be held are reviewed for events or changes in circumstances that indicate that their carrying value may not be recoverable. The Company periodically reviews for any indicators and, if indicators are present, tests the carrying value of long-lived assets, assessing their net realizable values based on estimated undiscounted cash flows over their remaining estimated useful lives. If the carrying amount of an asset exceeds its estimated future cash flows, an impairment charge is recognized by the amount by which the carrying amount of the asset exceeds the fair value of the asset. No impairment charges were recorded for the fiscal years ended June 30,
2014
,
2013
and
2012
in the Company’s consolidated financial statements.
Goodwill
Goodwill is an asset representing the future economic benefits arising from other assets acquired in a business combination that are not individually identified and separately recognized. Goodwill amounts are not amortized, but rather are evaluated for potential impairment on an annual basis, as of June 30, unless circumstances indicate the need for impairment testing between the annual tests in accordance with the provisions of ASC Topic 350, “Intangibles—Goodwill and Other.” If this assessment indicates the possibility of impairment, the income approach to test for goodwill impairment would be used unless circumstances indicate that a better estimate of fair value was available. Under the income approach, management calculates the fair value of its reporting unit based on the present value of estimated future cash flows. If the fair value of the reporting unit exceeds the carrying value of the net assets including goodwill assigned to that unit, goodwill is not impaired. If the carrying value of the reporting unit’s net assets including goodwill exceeds the fair value of the reporting unit, then management determines the implied fair value of the reporting unit’s goodwill. If the carrying value of the reporting unit’s goodwill exceeds its implied fair value, then the Company would record an impairment loss equal to the difference. The Company did not recognize any goodwill impairment charges in the fiscal years ended June 30,
2014
,
2013
and
2012
.
Intangible Assets
Intangible assets consist primarily of relationships, product trade names and legal and contractual rights surrounding a patent. These assets are recorded at their estimated fair values at the acquisition dates using the income approach. These assets are being amortized using straight-line method based on their estimated useful lives ranging from eight to 15 years. The estimated useful lives of acquired dealer relationships consider the average length of dealer relationships at the time of acquisition, historical rates of dealer attrition and retention, the Company’s history of renewal and extension of dealer relationships, as well as competitive and economic factors resulting in a range of useful lives. The estimated useful lives of the Company’s product trade names are based on a number of factors including technological obsolescence and the competitive environment. The estimated useful lives of legal and contractual rights are estimated based on the benefits that the patent provides for its remaining terms unless competitive, technological obsolescence or other factors indicate a shorter life.
Management, assisted by third-party valuation specialists, determined the estimated fair values of separately identifiable intangible assets at the date of acquisition under the income approach. Significant data and assumptions used in the valuations included cost, market and income comparisons, discount rates, royalty rates and management forecasts. Discount rates for each intangible asset were selected based on judgment of relative risk and approximate rates of returns investors in the subject assets might require. The royalty rates were developed using weighted average rates, which were based on projected sales and profits of products sold and management’s assessment of the intangibles’ importance to the sales and profitability of the product. Management provided forecasts of financial data pertaining to assets, liabilities and income statement balances to be utilized in the valuations. While management believes the assumptions, estimates, appraisal methods and ensuing results are appropriate and represent the best evidence of fair value in the circumstances, modification or use of other assumptions or methods could have yielded different results.
The carrying amount of intangible assets are reviewed whenever circumstances arise that indicate the carrying amount of an asset may not be recoverable. The carrying value of these assets is compared to the undiscounted future cash flows the assets are expected to generate. If the asset is considered to be impaired, the carrying value is compared to the fair value and this
69
difference is recognized as an impairment loss. There was no impairment loss recognized on intangible assets for the fiscal years ended June 30,
2014
,
2013
and
2012
.
Income Taxes
Malibu Boats, Inc. is taxed as a C corporation for U.S. income tax purposes and is therefore subject to both federal and state taxation at a corporate level. Following the IPO, the LLC continues to operate in the United States as a partnership for U.S. federal income tax purposes.
The Company files various federal and state tax returns, including some returns that are consolidated with subsidiaries. The Company accounts for the current and deferred tax effects of such returns using the asset and liability method. Significant judgments and estimates are required in determining its current and deferred tax assets and liabilities, which reflect its best assessment of the estimated future taxes the Company will pay. These estimates are updated throughout the year to consider income tax return filings, its geographic mix of earnings, legislative changes and other relevant items.
The Company recognizes deferred tax assets and liabilities based on the differences between the financial statement carrying amounts of assets and liabilities and the amounts used for income tax purposes. Deferred tax assets represent items to be used as a tax deduction or credit in future tax returns. Realization of the deferred tax assets ultimately depends on the existence of sufficient taxable income of the appropriate character in either the carryback or carryforward period.
Each quarter the Company analyzes the likelihood that its deferred tax assets will be realized. A valuation allowance is recorded if, based on the weight of all available positive and negative evidence, it is more likely than not (a likelihood of more than 50%) that some portion, or all, of a deferred tax asset will not be realized. A summary of its deferred tax assets is included in Note 10.
On an annual basis, the Company performs a comprehensive analysis of all forms of positive and negative evidence based on year end results. During each interim period, the Company updates its annual analysis for significant changes in the positive and negative evidence.
If the Company later determines that realization is more likely than not for deferred tax assets with a valuation allowance, the related valuation allowance will be reduced. Conversely, if the Company determines that it is more likely than not that it will not be able to realize a portion of its deferred tax assets, the Company will increase the valuation allowance.
The Company recognizes a tax benefit associated with an uncertain tax position when, in its judgment, it is more likely than not that the position will be sustained based upon the technical merits of the position. For a tax position that meets the more-likely-than-not recognition threshold, the Company initially and subsequently measures the income tax benefit as the largest amount that the Company judges to have a greater than 50% likelihood of being realized. Its liability associated with unrecognized tax benefits is adjusted periodically due to changing circumstances, such as the progress of tax audits, case law developments and new or emerging legislation. Such adjustments are recognized entirely in the period in which they are identified. The Company's income tax provision includes the net impact of changes in the liability for unrecognized tax benefits.
The years open to tax examinations vary by jurisdiction. While it is often difficult to predict the final outcome or the timing of resolution of any particular tax matter, the Company believes its liability for unrecognized tax benefits is adequate.
The Company considers an issue to be resolved at the earlier of the issue being “effectively settled,” settlement of an examination, or the expiration of the statute of limitations. Upon resolution, unrecognized tax benefits will be reversed as a discrete event.
The Company's liability for unrecognized tax benefits is generally presented as noncurrent. However, if the Company anticipates paying cash within one year to settle an uncertain tax position, the liability is presented as current. The Company classifies interest and penalties recognized on the liability for unrecognized tax benefits as income tax expense.
Revenue Recognition
The Company generally manufactures products based on specific orders from dealers and often ships completed products only after receiving credit approval from financial institutions. Revenue is primarily recorded when all of the following conditions have been met:
|
•
|
an order for a product has been received;
|
|
•
|
a common carrier signs the delivery ticket accepting responsibility for the product; and
|
70
|
•
|
the product is removed from the Company’s property for delivery.
|
These conditions are generally met when title passes, which is when boats are shipped to dealers in accordance with shipping terms, which are primarily free on board shipping point.
Dealers generally have no rights to return unsold boats. From time to time, however, the Company may accept returns in limited circumstances and at the Company’s discretion under its warranty policy, which generally limits returns to instances of manufacturing defects. The Company estimates the costs that may be incurred under its basic limited warranty and records as a liability the amount of such costs at the time the product revenue is recognized. The Company may be obligated, in the event of default by a dealer, to accept returns of unsold boats under its repurchase commitment to floor financing providers, who are able to obtain such boats through foreclosure. The Company accrues estimated losses when a loss, due to the default of one of its dealers, is determined to be probable and the amount of the loss is reasonably estimable. Refer to Note 6 and Note 14 related to the Company’s product warranty and repurchase commitment obligations, respectively.
Revenue from boat part sales is recorded as the product is shipped from the Company’s location, which is free on board shipping point.
Revenue associated with sales of materials, parts, boats or engine products sold under the Company’s exclusive manufacturing and distribution agreement with its Australian licensee are recognized under free on board port of disembarkment terms, the point at which the risks of ownership and loss pass to the licensee. The Company also earns royalties from its Australian licensee, which are accrued on a monthly basis based on a percentage of the licensee’s gross sales. Royalties earned are paid to the Company on a quarterly basis.
Revenue associated with sales to the independent representative responsible for international sales is recognized in accordance with free on board shipping point terms, the point at which the risks of ownership and loss pass to the representative. A fixed percentage discount is earned by the independent representative at the time of shipment to the representative as a reduction in the price of the boat and is recorded in our consolidated statement of operations as a reduction in sales.
Delivery Costs
Shipping and freight costs are included in cost of goods sold in the accompanying consolidated statements of operations.
Rebates, Promotions, Floor Financing and Incentives
The Company provides for various structured dealer rebate and sales promotions incentives, which are recognized as a reduction in net sales, at the time of sale to the dealer. Examples of such programs include rebates, seasonal discounts, promotional co-op arrangements and other allowances. Dealer rebates and sales promotion expenses are estimated based on current programs and historical achievement and/or usage rates. Actual results may differ from these estimates if market conditions dictate the need to enhance or reduce sales promotion and incentive programs or if dealer achievement or other items vary from historical trends.
Free floor financing incentives includes payments to the lenders providing floor plan financing to the dealers or directly to the dealers themselves. Free floor financing incentives are estimated at the time of sale to the dealer based on the expected expense to the Company over the term of the free flooring period, ending in April each year, and are recognized as a reduction in sales. The Company accounts for both incentive payments directly to dealers and payment to third party lenders in this manner.
Changes in the Company’s accrual for dealer rebates were as follows:
|
|
As of June 30,
|
||||||
|
|
2014
|
2013
|
|||||
|
Balance at beginning of year
|
$
|
2,709
|
|
$
|
1,801
|
|
|
|
Add: Additions to dealer rebate incentive provision
|
4,511
|
|
4,261
|
|
|||
|
Less: Dealer rebates paid
|
(4,816
|
)
|
(3,353
|
)
|
|||
|
Balance at end of year
|
$
|
2,404
|
|
$
|
2,709
|
|
|
71
Changes in the Company’s accrual for flooring financing were as follows:
|
|
As of June 30,
|
||||||
|
|
2014
|
2013
|
|||||
|
Balance at beginning of year
|
$
|
—
|
|
$
|
—
|
|
|
|
Add: Additions to flooring provision
|
2,197
|
|
2,413
|
|
|||
|
Less: Flooring paid
|
(2,197
|
)
|
(2,413
|
)
|
|||
|
Balance at end of year
|
$
|
—
|
|
$
|
—
|
|
|
Accrued Expenses
The Company’s accrued expenses primarily consist of estimates for dealer rebates, promotions, floor financing, and incentives (see above), product warranties (refer to Note 6 for more information) and litigation settlement payable (refer to Note 14 for additional information) as well as normal obligations for compensation related costs and legal and professional fees.
Derivative Instruments
The Company follows the guidance set forth in ASC Topic 815, “Derivatives and Hedging,” which requires that an entity recognize all derivatives as either assets or liabilities in the balance sheet and measure those instruments at fair value. Changes in fair value of derivatives are recorded each period in current earnings or other comprehensive income, depending on whether the derivative is designated as part of a hedge transaction and, if it is, depending on the type of hedge transaction. As of June 30, 2013, the Company had a derivative instrument in the form of an interest rate swap. The interest rate swap was settled in connection with the pay down of all the amounts owed on the credit facilities and term loans with the proceeds from the Company's IPO on February 5, 2014. Refer to Note 8 for additional information.
Fair Value of Financial Instruments
Financial instruments for which the Company did not elect the fair value option include accounts receivable, prepaids and other current assets, short-term credit facilities, accounts payable, accrued expenses and other current liabilities. The carrying amounts of these financial instruments approximate their fair values as a result of their short-term nature or variable interest rates. A variable rate term note issued by the Company was used to extinguish the previously existing fixed rate subordinated debt during 2013. The carrying value of the Company’s debt approximated fair value. This term note was subsequently paid off in connection with the Company's IPO on February 5, 2014. See Note 9 for more information.
Fair Value Measurements
The Company applies the provisions of ASC Topic 820, “Fair Value Measurements and Disclosures”, for fair value measurements of financial assets and financial liabilities, and for fair value measurements of nonfinancial items that are recognized or disclosed at fair value in the financial statements on a recurring basis. ASC Topic 820 defines fair value as the price that would be received to sell an asset or paid to transfer a liability in an orderly transaction between market participants at the measurement date. ASC Topic 820 also establishes a framework for measuring fair value and expands disclosures about fair value measurements. In addition to the financial assets and liabilities measured on a recurring basis, certain nonfinancial assets and liabilities are to be measured at fair value on a nonrecurring basis in accordance with applicable GAAP. This includes items such as nonfinancial assets and liabilities initially measured at fair value in a business combination (but not measured at fair value in subsequent periods) and nonfinancial long-lived asset groups measured at fair value for an impairment assessment. In general, non-financial assets including goodwill, other intangible assets and property and equipment are measured at fair value when there is an indication of impairment and are recorded at fair value only when any impairment is recognized. See Note 9 for more information.
Equity-Based Compensation
The Company expenses employee share-based awards under ASC Topic 718, "Compensation—Stock Compensation", which requires compensation cost for the grant-date fair value of share-based awards to be recognized over the requisite service period. The Company estimates the grant date fair value of the share-based awards issued in the form of profit interests using the Black-Scholes option pricing model. The fair value of restricted stock unit awards are measured based on the market price of the Company’s stock on the grant date. See Note 12 for more information.
72
(Loss) Earnings Per Share
Basic (loss) earnings per share is computed by dividing net (loss) income attributable to Malibu Boats, Inc. by the weighted average shares outstanding during the period. Diluted (loss) earnings per share is computed by dividing net (loss) income attributable to Malibu Boats, Inc., adjusted as necessary for the impact of potentially dilutive securities, by the weighted-average shares outstanding during the period and the impact of securities that would have a dilutive effect on (loss) earnings per share. See Note 13 for further discussion.
Repurchase Commitments
In connection with its dealers’ wholesale floor-plan financing of boats, the Company has entered into repurchase agreements with various lending institutions. The repurchase commitment is on an individual unit basis with a term from the date it is financed by the lending institution through payment date by the dealer, generally not exceeding two and a half years. The total amount financed under the floor financing programs with repurchase obligations was
$63,200
and
$51,800
at June 30,
2014
and
2013
, respectively. Such agreements are customary in the industry and the Company’s exposure to loss under such agreements is limited by contractual caps and the resale value of the inventory which is required to be repurchased. No units were repurchased for the fiscal years ended June 30,
2014
and
2013
.
Debt Issuance Costs
In July 2013, deferred financing costs of
$1,016
were capitalized with the issuance of the new revolving credit facility and term note of Malibu Boats, LLC, a subsidiary of the Company. Unamortized debt issuance costs of
$531
associated with the previously existing term note and revolving credit facility were expensed upon extinguishment of the debt. On February 5, 2014, the Company used a portion of the net proceeds from the IPO of Malibu Boats, Inc. to pay down all amounts owed under the existing credit facilities and term loans. Unamortized debt issuance costs of
$965
associated with pay down were expensed upon settlement. Refer to Note 2 for further information regarding the IPO. Amortization of deferred financing costs, including those related to the extinguishment of the prior debt, of
$1,583
and
$148
were recorded for the fiscal years ended June 30,
2014
and
2013
, respectively. Unamortized debt issuance costs were
$0
and
$531
at June 30,
2014
and
2013
, respectively. These amounts were classified as other assets, net and were amortized over the term underlying credit agreement into interest expense using the effective interest method. See Note 7 for more information on credit agreement.
Advertising Costs
Advertising costs are expensed as incurred. Advertising expenses are included in selling and marketing expenses and were not material for fiscal years ended June 30,
2014
,
2013
and
2012
.
Recent Accounting Pronouncements
In May 2014, the Financial Accounting Standards Board (the "FASB") and International Accounting Standards Board jointly issued a final standard on revenue recognition which outlines a single comprehensive model for entities to use in accounting for revenue arising from contracts with customers. This standard will supersede most current revenue recognition guidance. Under the new standard, entities are required to identify the contract with a customer; identify the separate performance obligations in the contract; determine the transaction price; allocate the transaction price to the separate performance obligations in the contract; and recognize the appropriate amount of revenue when (or as) the entity satisfies each performance obligation. The standard is effective for fiscal years, and the interim periods within those years, beginning on or after January 1, 2017. Entities have the option of using either retrospective transition or a modified approach in applying the new standard. The Company is currently evaluating the approach it will use to apply the new standard and the impact that the adoption of the new standard will have on the Company’s consolidated financial statements.
In December 2011 and February 2013, the FASB issued an amendment to the balance sheet topic of the ASC, which requires entities to disclose both gross and net information about both derivatives and transactions eligible for offset in the statement of financial position and instruments and transactions subject to an agreement similar to a master netting agreement. The objective of the disclosure is to facilitate comparison between those entities that prepare their financial statements on the basis of GAAP and those entities that prepare their financial statements on the basis of International Financial Reporting Standards (“IFRS”). This standard is effective for fiscal years, and interim periods within those years, beginning on or after January 1, 2013. Retrospective presentation for all comparative periods presented is required. The adoption of the standard had no impact on the Company’s results of operations or financial condition.
In July 2012, the FASB issued guidance on testing indefinite-lived intangible assets for impairment. Under the guidance, testing the decline in the realizable value (impairment) of indefinite-lived intangible assets other than goodwill has been simplified. The guidance allows an organization the option to first assess qualitative factors to determine whether it is necessary
73
to perform the quantitative impairment test. An organization electing to perform a qualitative assessment is no longer required to calculate the fair value of an indefinite-lived intangible asset unless the organization determines, based on a qualitative assessment, that it is more likely than not that the asset is impaired. The guidance is effective for impairment tests for fiscal years beginning after September 15, 2012 and early adoption is permitted. This guidance did not have a material impact on the Company’s results of operations or financial condition.
2. Recapitalization and Initial Public Offering
Recapitalization
Immediately prior to the closing of the Company’s initial public offering (the "IPO") of Class A Common Stock, par value $0.01 per share ("Class A Common Stock") on February 5, 2014, a new single class of LLC Units of the LLC was allocated among the pre-IPO owners of the LLC in exchange for their prior membership interests of the LLC pursuant to the distribution provisions of the former limited liability company agreement of the LLC based upon the liquidation value of the LLC, assuming it was liquidated at the time of the IPO with a value implied by the IPO price of the shares of Class A Common Stock sold in the IPO. Immediately prior to the closing of the IPO, there were
17,071,424
LLC Units issued and outstanding. In addition,
34
shares of Class B Common Stock were issued, one to each existing LLC Unit holders. Further, on February 4, 2014, prior to the closing of the IPO, two holders of membership interests in the LLC merged with and into two newly formed subsidiaries of Malibu Boats, Inc. As a result of these mergers, the sole stockholders of each of the two merging entities received shares of Class A Common Stock in exchange for shares of capital stock of the merging entities. Also, the Company redeemed for nominal consideration the initial
100
shares of Class A Common Stock issued to the Company's initial stockholder in connection with its formation. The foregoing transactions are referred to as the “Recapitalization.”
IPO
On February 5, 2014, the Company completed its IPO of
8,214,285
shares of Class A Common Stock at a price to the public of $
14.00
per share for aggregate gross proceeds of
$115,000
. Of these proceeds, the Company received $
99,512
and the selling shareholders received
$7,438
after underwriting discounts and commissions of
$8,050
. Of the shares of Class A Common Stock sold to the public,
7,642,996
shares were issued and sold by the Company and
571,289
shares were sold by selling stockholders. This included
899,252
shares issued and sold by the Company and
172,175
shares sold by selling stockholders pursuant to the over-allotment option granted to the underwriters, which was exercised concurrently with the closing of the IPO.
The Company used $
69,750
of the net proceeds from the IPO to purchase LLC Units from the LLC and caused the LLC to use these proceeds (i) to pay down all of the amounts owed under the LLC’s credit facilities and term loans in an amount equal to
$63,410
, (ii) to pay Malibu Boats Investor, LLC, an affiliate of the LLC, a fee of
$3,750
upon the consummation of the IPO in connection with the termination of the LLC’s management agreement, and (iii) for general corporate purposes with the remaining amount of approximately
$2,700
. The Company used all of the remaining net proceeds from the IPO, or
$29,762
, to purchase LLC Units from the existing owners of the LLC at a purchase price equal to the initial public offering price per share of Class A Common Stock in the IPO, after deducting underwriting discounts and commissions. In connection with the repayment of the LLC’s credit facilities and term loans, debt issuance costs associated with the term loans were written off to interest expense.
First Amended and Restated Limited Liability Company Agreement
In connection with the Recapitalization and IPO, the Company became the sole managing member of the LLC and, through the LLC, operates the business of the LLC. Accordingly, although the Company acquired a
49.3
% economic interest in the LLC immediately following the closing of the IPO, the Company has
100
% of the voting power and controls the management of the LLC. Holders of LLC Units generally do not have voting rights under the first amended and restated limited liability company agreement of the LLC, as amended (the “LLC Agreement”).
Net profits and net losses of the LLC will generally be allocated to the LLC’s members (including the Company) pro rata in accordance with the percentages of their respective limited liability company interests. The LLC Agreement provides for cash distributions to the holders of LLC Units if the Company determines that the taxable income of the LLC will give rise to taxable income for its members. In accordance with the LLC Agreement, the Company intends to cause the LLC to make cash distributions to holders of LLC Units for purposes of funding their tax obligations in respect of the income of the LLC that is allocated to them.
Second Amendment to the First Amended and Restated Limited Liability Company Agreement
74
On June 27, 2014, the Company, the managing member of the LLC, entered into a Second Amendment (the “Second Amendment”) to the LLC Agreement. The Second Amendment to the LLC Agreement amends the LLC Agreement by (i) providing that the schedule of members will be maintained at the Company’s principal executive offices, (ii) modifying the notice provisions related to registered offerings of Class A Common Stock, and (iii) modifying the term of the holdback period related to underwritten offerings of the Company’s securities.
Voting Agreement
In connection with the Recapitalization and IPO, the Company entered into a voting agreement (the “Voting Agreement”) with certain affiliates. Under the Voting Agreement, Black Canyon Management LLC is entitled to nominate to the Company’s board of directors a number of designees equal to (i)
20
% of the total number of directors comprising the Company’s board of directors for so long as specified entities affiliated with Black Canyon Management LLC (and their permitted transferees) and Jack Springer, Wayne Wilson and Ritchie Anderson, together, beneficially own
15
% or more of the voting power of the shares of Class A Common Stock and Class B Common Stock, par value $0.01 per share ("Class B Common Stock") entitled to vote generally in the election of directors, voting together as a single class, and (ii)
10%
of the total number of directors comprising the Company’s board of directors for so long as specified entities affiliated with Black Canyon Management LLC (and their permitted transferees) and Messrs. Springer, Wilson and Anderson, together, beneficially own more than
5
% but less than
15
% of the voting power of the shares of Class A Common Stock and Class B Common Stock entitled to vote generally in the election of directors, voting together as a single class. For purposes of calculating the number of directors that Black Canyon Management LLC is entitled to nominate pursuant to this formula, any fractional amounts would be rounded up to the nearest whole number and the calculation would be made on a pro forma basis, taking into account any increase in the size of the board of directors (e.g., one and one-third (1⅓) directors equates to two directors). In addition, Black Canyon Management LLC has the right to remove and replace its director-designees at any time and for any reason and to nominate any individual(s) to fill any such vacancies. Messrs. Springer, Wilson and Anderson are required to vote any of their LLC Units in favor of the director or directors nominated by Black Canyon Management LLC.
Exchange Agreement
In connection with the Recapitalization and IPO, the Company entered into an exchange agreement (the “Exchange Agreement”) with the pre-IPO owners of the LLC, several of whom are directors and/or officers of the Company. Under the Exchange Agreement, each pre-IPO owner of the LLC (and certain permitted transferees thereof) has the right to exchange its LLC Units for shares of Class A Common Stock of the Company on a one-for-one basis, subject to customary conversion rate adjustments for stock splits, stock dividends and reclassifications, or at the Company's option, except in the event of a change in control, for a cash payment equal to the market value of the Class A Common Stock. Notwithstanding the foregoing, within the 180-day period following the closing of the IPO, a holder of LLC Units may only exchange those LLC Units for Class A Common Stock if such holder executed a lock-up agreement. The Exchange Agreement provides, however, that such exchanges must be for a minimum of the lesser of 1,000 LLC Units, all of the LLC Units held by the holder, or such amount as we determine to be acceptable. Further, the Exchange Agreement provides that LLC members do not have the right to exchange LLC Units if the Company determines that such exchange would be prohibited by law or regulation or would violate other agreements with the Company to which the LLC member may be subject or any of the Company's written policies related to unlawful or insider trading. The Exchange Agreement also provides that the Company may impose additional restrictions on exchanges that it determines to be necessary or advisable so that the LLC is not treated as a “publicly traded partnership” for U.S. federal income tax purposes. In addition, pursuant to the LLC Agreement, the Company as managing member of the LLC, has the right to require all members of the LLC to exchange their LLC Units for Class A Common Stock in accordance with the terms of the Exchange Agreement, subject to the consent of Black Canyon Management LLC and the holders of a majority of outstanding LLC Units other than those held by the Company.
Registration Rights Agreement
In connection with the Recapitalization and IPO, the Company entered into a registration rights agreement (the “Registration Rights Agreement”) with Black Canyon Management LLC and certain affiliates of Black Canyon Capital LLC pursuant to which Black Canyon Management LLC may request registration or inclusion of shares of Class A Common Stock held by affiliates of Black Canyon Capital LLC in any registration of Class A Common Stock in compliance with the Securities Act of 1933, as amended. In addition, the Registration Rights Agreement provides that, as soon as practicable following the one-year anniversary of the closing of the IPO, the Company is required to use all reasonable efforts to cause a resale shelf registration statement to become effective and remain effective until the eighth anniversary of the closing of the IPO. The Registration Rights Agreement will remain in effect until (i) the eighth anniversary of the IPO or (ii) termination of the Registration Rights Agreement by both (a) Black Canyon Management LLC and (b) holders owning two-thirds of the outstanding LLC Units covered by the Registration Rights Agreement. In addition, the LLC Agreement permits members that own securities that the Company proposes or is required to register with the SEC, pursuant to the Registration Rights
75
Agreement or otherwise, the right to include their securities in such registration, subject to the limitations set forth in the LLC Agreement.
First Amendment to the Registration Rights Agreement
On June 27, 2014, the Company, Black Canyon Management LLC and affiliates of Black Canyon Capital LLC entered into the First Amendment (the “First Amendment”) to the Registration Rights Agreement. The First Amendment to the Registration Rights Agreement amends the Registration Rights Agreement by (i) modifying the notice provisions related to registered offerings of the Company’s Class A Common Stock and (ii) modifying the term of the holdback period related to underwritten offerings of the Company’s securities.
Tax Receivable Agreement
As a result of exchanges of LLC Units into Class A Common Stock and purchases by the Company of LLC Units from holders of LLC Units, the Company will become entitled to a proportionate share of the existing tax basis of the assets of the LLC at the time of such exchanges or purchases. In addition, such exchanges and purchases of LLC Units are expected to result in increases in the tax basis of the assets of the LLC that otherwise would not have been available. These increases in tax basis may reduce the amount of tax that the Company would otherwise be required to pay in the future. These increases in tax basis may also decrease gains (or increase losses) on future dispositions of certain capital assets to the extent tax basis is allocated to those capital assets.
In connection with the Recapitalization and IPO, the Company entered into a tax receivable agreement (the “Tax Receivable Agreement”) with the pre-IPO owners of the LLC that provides for the payment by the Company to the pre-IPO owners (or their permitted assignees) of
85%
of the amount of the benefits, if any, that the Company is deemed to realize as a result of (i) increases in tax basis and (ii) certain other tax benefits related to the Company entering into the Tax Receivable Agreement, including those attributable to payments under the Tax Receivable Agreement. These payment obligations are obligations of the Company and not of the LLC. For purposes of the Tax Receivable Agreement, the benefit deemed realized by the Company will be computed by comparing the actual income tax liability of the Company (calculated with certain assumptions) to the amount of such taxes that the Company would have been required to pay had there been no increase to the tax basis of the assets of the LLC as a result of the purchases or exchanges, and had the Company not entered into the Tax Receivable Agreement.
The Tax Receivable Agreement further provides that, upon certain mergers, asset sales or other forms of business combinations or other changes of control, the Company (or its successor) would owe to the pre-IPO owners of the LLC a lump-sum payment equal to the present value of all forecasted future payments that would have otherwise been made under the Tax Receivable Agreement that would be based on certain assumptions, including a deemed exchange of LLC Units and that the Company would have sufficient taxable income to fully utilize the deductions arising from the increased tax basis and other tax benefits related to entering into the Tax Receivable Agreement. The Company also is entitled to terminate the Tax Receivable Agreement, which, if terminated, would obligate the Company to make early termination payments to the pre-IPO owners of the LLC. In addition, a pre-IPO owner may elect to unilaterally terminate the Tax Receivable Agreement with respect to such pre-IPO owner, which would obligate the Company to pay to such existing owner certain payments for tax benefits received through the taxable year of the election.
Effects of the Recapitalization and IPO
As a result of the Recapitalization and the IPO, immediately after the IPO:
|
•
|
Investors in the IPO collectively owned
8,214,285
shares of Class A Common Stock;
|
|
•
|
The two selling stockholders in the IPO, who were former holders of LLC Units, continued to collectively own
2,840,545
shares of Class A Common Stock;
|
|
•
|
The Company owned
11,054,830
LLC Units, representing
49.3
% of the economic interest in the LLC;
|
|
•
|
Pre-IPO owners of the LLC collectively owned
11,373,737
LLC Units, representing
50.7
% of the economic interest in the LLC;
|
|
•
|
Investors in the IPO collectively had
36.6
% of the voting power in the Company;
|
|
•
|
The two selling stockholders in the IPO who were former holders of LLC Units, continued to collectively have
12.7
% of the voting power in the Company; and
|
76
|
•
|
Pre-IPO owners of the LLC, through their holdings of the Company’s Class B Common Stock, collectively had
50.7
% of the voting power in the Company, but not an economic interest in the Company.
|
The Company accounted for the Recapitalization as a non-substantive transaction in a manner similar to a transaction between entities under common control pursuant to ASC 805, "Business Combinations". Accordingly, after the Recapitalization, the assets and liabilities of the Company are reflected at their carryover basis. The acquisition of LLC units from the LLC Unit holders is accounted for under the general guidance of ASC Topic 810, "Consolidation"
,
and ASC Topic 740, "Income Taxes", for transactions with noncontrolling shareholders, which states that the direct tax effects of a transaction with noncontrolling parties should be accounted for within equity.
Capitalization of Offering Costs
Capitalized offering costs include costs directly attributable to the IPO. Prior to the IPO, we had capitalized approximately
$1,550
of offering costs as prepaid assets. Upon closing of the IPO on February 5, 2014, these costs were netted against the proceeds of the IPO and, as such, were reclassified into additional paid in capital.
3. Inventories
Inventories, net consisted of the following:
|
|
As of June 30, 2014
|
As of June 30, 2013
|
|||||
|
Raw materials
|
$
|
9,786
|
|
$
|
7,796
|
|
|
|
Work in progress
|
1,428
|
|
1,148
|
|
|||
|
Finished goods
|
2,440
|
|
3,151
|
|
|||
|
Inventory obsolescence reserve
|
(764
|
)
|
(456
|
)
|
|||
|
Net inventory
|
$
|
12,890
|
|
$
|
11,639
|
|
|
4. Property and Equipment
Property and equipment, net consisted of the following:
|
|
As of June 30, 2014
|
As of June 30, 2013
|
||||||
|
Land
|
$
|
254
|
|
$
|
254
|
|
||
|
Leasehold improvements
|
2,039
|
|
1,604
|
|
||||
|
Machinery and equipment
|
11,257
|
|
7,320
|
|
||||
|
Furniture and fixtures
|
1,544
|
|
1,379
|
|
||||
|
Construction in process
|
2,987
|
|
1,683
|
|
||||
|
18,081
|
|
12,240
|
|
|||||
|
Less accumulated depreciation
|
(7,118
|
)
|
(5,592
|
)
|
||||
|
$
|
10,963
|
|
$
|
6,648
|
|
|||
Depreciation expense was
$1,600
, $
1,090
and
$895
for the fiscal years ended June 30,
2014
,
2013
and
2012
, respectively, substantially all of which was recorded in cost of goods sold.
Sale-Leaseback Transaction
In March 2008, the Company sold its
two
primary manufacturing and office facilities for a total of
$18,250
, which resulted in a gain of
$726
. Expenses incurred related to the sale were
$523
. Simultaneous with the sale, the Company entered into an agreement to lease back the buildings for an initial term of
20 years
. The net gain on this transaction of
$203
has been deferred and is being amortized over the initial lease term. For each of the fiscal years ended June 30,
2014
,
2013
and
2012
,
$11
of the realized gain was recognized.
5. Goodwill and Other Intangible Assets
The Company’s intangible assets and goodwill consisted of the following:
77
|
|
As of June 30, 2014
|
||||||||||||
|
|
Gross Carrying
Amount |
Accumulated
Amortization |
Net Book
Value |
Useful Life
|
|||||||||
|
Definite-lived intangibles:
|
|||||||||||||
|
Dealer relationships
|
$
|
27,392
|
|
$
|
(27,106
|
)
|
$
|
286
|
|
8 years
|
|||
|
Patent
|
1,386
|
|
(915
|
)
|
471
|
|
12 years
|
||||||
|
Trade name
|
24,567
|
|
(12,966
|
)
|
11,601
|
|
15 years
|
||||||
|
Total definite-lived intangibles
|
53,345
|
|
(40,987
|
)
|
12,358
|
|
|||||||
|
Goodwill
|
5,718
|
|
—
|
|
5,718
|
|
|||||||
|
Total intangible assets and goodwill
|
$
|
59,063
|
|
$
|
(40,987
|
)
|
$
|
18,076
|
|
||||
|
|
As of June 30, 2013
|
||||||||||||
|
|
Gross Carrying
Amount |
Accumulated
Amortization |
Net Book
Value |
Useful Life
|
|||||||||
|
Definite-lived intangibles:
|
|||||||||||||
|
Dealer relationships
|
$
|
27,392
|
|
$
|
(23,683
|
)
|
$
|
3,709
|
|
8 years
|
|||
|
Patent
|
1,386
|
|
(799
|
)
|
587
|
|
12 years
|
||||||
|
Trade name
|
24,567
|
|
(11,328
|
)
|
13,239
|
|
15 years
|
||||||
|
Total definite-lived intangibles
|
53,345
|
|
(35,810
|
)
|
17,535
|
|
|||||||
|
Goodwill
|
5,718
|
|
—
|
|
5,718
|
|
|||||||
|
Total intangible assets and goodwill
|
$
|
59,063
|
|
$
|
(35,810
|
)
|
$
|
23,253
|
|
||||
Amortization expense recognized on all amortizable intangibles was
$5,177
,
$5,178
and
$5,178
for the fiscal years ended June 30,
2014
,
2013
and
2012
, respectively. As of
June 30, 2014
, the weighted average remaining useful lives for dealer relationships were
0.1
years, the weighted average remaining useful lives for patents were
4.1
years and the weighted average remaining useful lives for trade names were
7.1
years.
Estimated future amortization expenses as of
June 30, 2014
are as follows:
|
Fiscal Year
|
As of June 30, 2014
|
|||
|
2015
|
$
|
2,039
|
|
|
|
2016
|
1,753
|
|
||
|
2017
|
1,753
|
|
||
|
2018
|
1,753
|
|
||
|
2019
|
1,647
|
|
||
|
Thereafter
|
3,413
|
|
||
|
$
|
12,358
|
|
||
6. Product Warranties
The Company provides a limited warranty for a period of up to
three years
for its products. The Company’s standard warranties require the Company or its dealers to repair or replace defective products during such warranty period at no cost to the consumer. The Company estimates the costs that may be incurred under its basic limited warranty and records as a liability in the amount of such costs at the time the product revenue is recognized. Factors that affect the Company’s warranty liability include the number of units sold, historical and anticipated rates of warranty claims and cost per claim. The Company assesses the adequacy of its recorded warranty liabilities by brand on a quarterly basis and adjusts the amounts as necessary. The Company utilizes historical trends and analytical tools to assist in determining the appropriate warranty liability.
Changes in the Company’s product warranty liability were as follows:
78
|
|
As of June 30, 2014
|
As of June 30, 2013
|
|||||
|
Balance at beginning of year
|
$
|
5,658
|
|
$
|
3,863
|
|
|
|
Add: Additions to warranty provision
|
2,907
|
|
3,756
|
|
|||
|
Less: Warranty claims paid
|
(2,401
|
)
|
(1,961
|
)
|
|||
|
Balance at end of year
|
$
|
6,164
|
|
$
|
5,658
|
|
|
7. Financing
Outstanding debt consisted of the following:
|
|
As of June 30, 2014
|
As of June 30, 2013
|
||||||
|
Short-term debt
|
||||||||
|
Notes payable—equipment
|
$
|
—
|
|
$
|
76
|
|
||
|
Current maturities of long-term debt
|
—
|
|
3,250
|
|
||||
|
Long-term debt
|
||||||||
|
Notes payable—equipment
|
—
|
|
—
|
|
||||
|
Term loan
|
—
|
|
—
|
|
||||
|
Previous term loan
|
—
|
|
20,263
|
|
||||
|
—
|
|
23,589
|
|
|||||
|
Less current maturities
|
—
|
|
(3,326
|
)
|
||||
|
Total debt less current maturities
|
$
|
—
|
|
$
|
20,263
|
|
||
Short-Term Debt
On March 31, 2011, the Company issued a promissory note to General Electric Capital Corporation in connection with the lease of production equipment for its manufacturing facility. Under the terms of the promissory note, payments of principal and interest were due in monthly installments with a final payment due in May 2014. As of
June 30, 2014
, the promissory note was paid in full.
Long-Term Debt
New Revolving Line of Credit and Term Loan.
On July 16, 2013, Malibu Boats, LLC entered into a credit agreement with a syndicate of banks led by SunTrust Bank that included a revolving credit facility and term loan (the “Credit Agreement”). The proceeds from the Credit Agreement were used to repay the previously existing revolving credit facility and term loan with the same bank. The obligations of Malibu Boats LLC under the credit agreement are currently guaranteed by its parent, Malibu Boats Holdings, LLC, and its subsidiary, Malibu Boats Domestic International Sales Corp. Malibu Boats, Inc. is not a party to the credit agreement. The lending arrangements are required to be guaranteed by the LLC and the present and future domestic subsidiaries of Malibu Boats, LLC and are secured by substantially all of the assets of the LLC, Malibu Boats, LLC and Malibu Domestic International Sales Corp., and those of any future domestic subsidiary pursuant to a security agreement. The revolving credit facility and term loan mature on July 16, 2018.
The Credit Agreement is comprised of a
$10,000
revolving commitment,
none
of which was outstanding as of
June 30, 2014
, and a
$65,000
term loan, which was repaid in full with the proceeds of the IPO. Borrowings under the Credit Agreement bear interest at the Company’s option of Bank Prime or London Interbank Offered Rate (“LIBOR”) plus the applicable margin, as defined in the Credit Agreement.
The Company also has a swingline line of credit from SunTrust Bank in the principal amount of up to
$2,000
due on or before July 16, 2018. Any amounts drawn under the swingline line of credit reduce the capacity under the revolving credit facility. As of
June 30, 2014
, the Company had
no
outstanding balance under the swingline facility.
Under the Credit Agreement, the Company has the ability to issue letters of credit up to
$3,000
,
none
of which was outstanding as of
June 30, 2014
. This letter of credit availability may be reduced by borrowings under the revolving line of credit. The Company’s access to these letters of credit expires July 16, 2018 with the expiration of access to the revolving commitment.
The credit agreement permits prepayment without any penalties. It contains certain customary representations and warranties, and notice requirements for the occurrence of specific events such as pending or threatened labor disputes, litigation or judgments over a certain amount. The credit agreement requires compliance with certain financial covenants that we believe
79
are usual for facilities and transactions of this type, including a minimum ratio of EBITDA to fixed charges and a maximum ratio of total debt to EBITDA. The credit agreement also contains certain restrictive covenants, which, among other things, place limits on our activities and those of our subsidiaries, the incurrence of additional indebtedness and additional liens on property and limit the future payment of dividends or distributions. For example, the credit agreement generally prohibits the LLC, Malibu Boats, LLC and Malibu Domestic International Sales Corp. from paying dividends or making distributions, including to Malibu Boats, Inc. The credit agreement permits, however, distributions based on a member’s allocated taxable income, distributions to fund payments that are required under the tax receivable agreement, payments pursuant to stock option and other benefit plans up to
$2.0 million
in any fiscal year, dividends and distributions within the loan parties and dividends payable solely in interests of classes of securities. In addition, after
June 30, 2014
, the LLC may make dividends and distributions of up to
$4.0 million
in any fiscal year, subject to compliance with other financial covenants. The credit agreement specifies permitted liens, permitted investments and permitted debt. Affirmative covenants governing the timing of monthly, quarterly and annual financial reporting are also included in the credit agreement. For the fiscal years ended June 30,
2014
and
2013
, the Company was in compliance with financial covenants contained in the Credit Agreement (unaudited).
On February 5, 2014, the Company used a portion of the net proceeds from the IPO of Malibu Boats, Inc. to pay down all of the amounts owed under its credit facilities and term loans in an amount equal to
$63,410
. Refer to Note 2 for further information regarding the IPO.
Previous Revolving Line of Credit and Term Loan.
On July 11, 2012, Malibu Boats, LLC entered into a revolving credit and term loan agreement with SunTrust Bank comprised of a
$5,000
revolving commitment,
none
of which was outstanding as of
June 30, 2013
, and a
$28,500
term loan commitment,
$23,513
of which was outstanding as of
June 30, 2013
. The revolving credit facility and term loan were collateralized by substantially all of the Company’s assets. The proceeds from this revolving line of credit and term loan agreement were used to repay previously existing term and revolving loans. Borrowings against the revolving line of credit bore interest at the Company’s option of Bank Prime or LIBOR plus the applicable margin, as defined in the agreement. The Company had the ability to issue letters of credit under this agreement up to
$3,000
. At
June 30, 2013
, the effective rate on the previous revolving and term loan commitments were
6.5%
and
3.94%
, respectively.
8. Derivative Instrument
On August 2, 2012, the Company entered into an interest rate swap with a notional value of
$14,250
which was entered into to hedge the variable rate interest payments on half of the long-term debt entered into during July 2012. Under the swap, the Company paid interest on a quarterly basis at a fixed rate of
0.61%
and received interest at a variable rate equal to
one-month LIBOR
. The notional amount of the swap reduced as mandatory debt principal payments under the Company’s July 2012 credit agreement were scheduled to amortize. The interest rate swap expires on June 30, 2017. Because management had not designated the swap as a hedge, the Company recorded the changes in fair value of the swap of
$0
and
$28
for the fiscal years ended June 30,
2014
and
2013
, respectively, in interest expense. The interest rate swap was settled in connection with the pay down of all the amounts owed on the credit facilities and term loans discussed in Note 7 above.
9. Fair Value Measurements
In determining the fair value of certain assets and liabilities, the Company employs a fair value hierarchy that prioritizes the inputs to valuation techniques used to measure fair value. As defined in ASC Topic 820, “Fair Value Measurements and Disclosures,” fair value is the amount that would be received to sell an asset or paid to transfer a liability in an orderly transaction between market participants at the measurement date (i.e., the exit price). Financial assets and financial liabilities recorded on the consolidated balance sheets at fair value are categorized based on the reliability of inputs to the valuation techniques as follows:
|
•
|
Level 1—Financial assets and financial liabilities whose values are based on unadjusted quoted prices in active markets for identical assets.
|
|
•
|
Level 2—Financial assets and financial liabilities whose values are based on quoted prices for similar assets or liabilities in active markets; quoted prices for identical or similar assets or liabilities in non-active markets; or valuation models whose inputs are observable, directly or indirectly, for substantially the full term of the asset or liability.
|
|
•
|
Level 3—Financial assets and financial liabilities whose values are based on prices or valuation techniques that require inputs that are both unobservable and significant to the overall fair value measurement. These inputs reflect the Company’s estimates of the assumptions that market participants would use in valuing the financial assets and financial liabilities.
|
80
The hierarchy gives the highest priority to Level 1 inputs and the lowest priority to Level 3 inputs. In certain cases, the inputs used to measure fair value may fall into different levels of the fair value hierarchy. In such cases, the level in the fair value hierarchy within which the fair value measurement in its entirety falls has been determined based on the lowest level input that is significant to the fair value measurement in its entirety. The Company’s assessment of the significance of a particular input to the fair value measurement in its entirety requires judgment and considers factors specific to the asset or liability.
Assets and liabilities that had recurring fair value measurements were as follows:
|
|
Fair Value Measurements at Reporting Date Using
|
||||||||||||||
|
|
Total
|
Quoted Prices
in Active
Markets for
Identical Assets
(Level 1)
|
Significant
Other
Observable
Inputs
(Level 2)
|
Significant
Unobservable
Inputs
(Level 3)
|
|||||||||||
|
As of June 30, 2014:
|
|||||||||||||||
|
Cash
|
$
|
12,173
|
|
$
|
12,173
|
|
$
|
—
|
|
$
|
—
|
|
|||
|
Derivative instrument
|
—
|
|
—
|
|
—
|
|
—
|
|
|||||||
|
Total assets at fair value
|
$
|
12,173
|
|
$
|
12,173
|
|
$
|
—
|
|
$
|
—
|
|
|||
|
As of June 30, 2013:
|
|||||||||||||||
|
Cash
|
$
|
15,957
|
|
$
|
15,957
|
|
$
|
—
|
|
$
|
—
|
|
|||
|
Derivative instrument
|
28
|
|
—
|
|
28
|
|
—
|
|
|||||||
|
Total assets at fair value
|
$
|
15,985
|
|
$
|
15,957
|
|
$
|
28
|
|
$
|
—
|
|
|||
Fair value measurements for the Company’s cash is classified under Level 1 because such measurements are based on quoted market prices in active markets for identical assets. Fair value measurements of the Company’s interest rate swap are classified under Level 2 because such measurements are based on significant other observable inputs. There were no transfers of assets or liabilities between Level 1 and Level 2 as of June 30,
2014
or
2013
, respectively.
The Company’s nonfinancial assets and liabilities that have nonrecurring fair value measurements include property, plant and equipment, goodwill and intangibles.
In assessing the need for goodwill impairment, management relies on a number of factors, including operating results, business plans, economic projections, anticipated future cash flows, transactions and marketplace data. Accordingly, these fair value measurements fall in Level 3 of the fair value hierarchy. The Company generally uses projected cash flows, discounted as necessary, to estimate the fair values of property, plant and equipment and intangibles using key inputs such as management’s projections of cash flows on a held-and-used basis (if applicable), management’s projections of cash flows upon disposition and discount rates. Accordingly, these fair value measurements fall in Level 3 of the fair value hierarchy. These assets and certain liabilities are measured at fair value on a nonrecurring basis as part of the Company’s impairment assessments and as circumstances require.
There were
no
impairments recorded in connection with tangible and intangible long-lived assets for the fiscal years ended June 30,
2014
,
2013
or
2012
, respectively.
10. Income Taxes
In accordance with ASC Topic 740, "Income Taxes", income taxes are recognized for the amount of taxes payable for the current year and for the impact of deferred tax liabilities and assets, which represent future tax consequences of events that have been recognized differently in the financial statements than for tax purposes. Deferred tax assets and liabilities are established using the enacted statutory tax rates and are adjusted for any changes in such rates in the period of change. Malibu Boats, Inc. is taxed as a C Corporation, which is subject to both federal and state taxation at a corporate level. Therefore, tax expense and deferred tax assets and liabilities reflect such status.
81
The components of provision for (benefit from) income taxes are as follows:
|
Fiscal Year Ended
June 30, 2014 |
||||
|
Current tax expense:
|
||||
|
Federal
|
$
|
44
|
|
|
|
State
|
376
|
|
||
|
Foreign
|
14
|
|
||
|
Total Current
|
434
|
|
||
|
Deferred tax benefit:
|
||||
|
Federal
|
(2,066
|
)
|
||
|
State
|
(588
|
)
|
||
|
Foreign
|
—
|
|
||
|
Total Deferred
|
(2,654
|
)
|
||
|
Income tax benefit
|
$
|
(2,220
|
)
|
|
The income tax benefit differs from the amount computed by applying the federal statutory income tax rate to income from continuing operations before income taxes. The sources and tax effects of the differences are as follows:
|
Fiscal Year Ended
June 30, 2014 |
|||
|
Federal tax provision at statutory rate
|
35.0
|
%
|
|
|
State income taxes, net of federal benefit
|
5.5
|
|
|
|
Permanent differences attributable to partnership investment
|
(9.9
|
)
|
|
|
Non-controlling interest
|
36.5
|
|
|
|
Other, net
|
(1.9
|
)
|
|
|
Total income tax expense on continuing operations
|
65.2
|
%
|
|
The Company’s effective tax rate includes a rate benefit attributable to the fact that the Company’s subsidiary operated as a limited liability company which was not subject to federal income tax. Accordingly, the portion of the Company’s subsidiary earnings attributable to the non-controlling interest are subject to tax when reported as a component of the non-controlling interests’ taxable income.
The components of the Company's net deferred income tax assets and liabilities at
June 30, 2014
are as follows:
|
As of June 30, 2014
|
||||
|
Deferred tax assets:
|
||||
|
Litigation accrual
|
$
|
500
|
|
|
|
Partnership basis differences
|
21,452
|
|
||
|
Total deferred tax assets
|
21,952
|
|
||
|
Deferred tax liabilities:
|
||||
|
Income tax deferral due to fiscal year end
|
995
|
|
||
|
Total deferred tax liabilities
|
995
|
|
||
|
Less valuation allowance
|
—
|
|
||
|
Total net deferred tax assets
|
$
|
20,957
|
|
|
In connection with completion of the Company's IPO on February, 5, 2014, the Company recorded deferred tax assets of
$18,303
associated with basis differences in assets upon acquiring an interest in Malibu Boats Holdings, LLC and in anticipation of making a Section 754 election. The Company also recorded
$13,636
in Tax Receivable Agreement liabilities representing
85%
of the tax savings that the Company will receive in connection with the Section 754 election. The Company recorded a corresponding reduction to paid-in capital for the difference between the Tax Receivable Agreement liability and the related deferred tax asset.
82
On an annual basis, the Company performs a comprehensive analysis of all forms of positive and negative evidence to determine whether realizability of deferred tax assets is more likely than not. During each interim period, the Company updates its annual analysis for significant changes in the positive and negative evidence. At
June 30, 2014
, the Company concluded that no valuation allowance against deferred tax assets was necessary.
Unrecognized tax benefits are discussed in the Company's accounting policy for income taxes (refer to Note 1, Organization, Basis of Presentation, and Summary of Significant Accounting Policies - Income Taxes). As of
June 30, 2014
, there was no liability for unrecognized tax benefits. Tax years 2011 through 2013 for the Company's subsidiary, Malibu Boats Holdings, LLC, remain open to examination in certain tax jurisdictions. The Company has not yet filed a tax return and therefore has no open tax years.
11. Stockholder’s Equity
The Company is authorized to issue
150,000,000
shares of capital stock, consisting of
100,000,000
shares of Class A Common Stock,
25,000,000
shares of Class B Common Stock, and
25,000,000
shares of Preferred Stock, par value $
0.01
per share. On November 1, 2013, the Company issued
100
shares of Class A Common Stock in exchange for $
10.00
, all of which were held by BC-Malibu Boats GP, an affiliate of Black Canyon Capital LLC, in connection with formation of Malibu Boats, Inc. These shares were subsequently redeemed for nominal consideration in connection with the Recapitalization.
As discussed in Note 2, on February 5, 2014, the Company completed its IPO of
8,214,285
shares of Class A Common Stock at a price to the public of
$14.00
per share. Immediately prior to the IPO, on February 4, 2014, two holders of membership interests in the LLC merged with and into two newly-formed subsidiaries of the Company. As a result of these mergers, the sole stockholders of each of the two merging entities received an aggregate
2,840,545
shares of Class A Common Stock in exchange for shares of capital stock of the merging entities. A total of
34
shares of Class B Common Stock (one to each pre-IPO LLC Unit holder) were issued to pre-IPO LLC Unit holders in connection with the Recapitalization.
In May 2014, in connection with transfers of membership units of the LLC by certain members to various individuals and entities (the “New LLC Members”), the Company issued a total of
10
additional shares of its Class B Common Stock to the New LLC Members for nominal consideration. As of
June 30, 2014
, the Company had a total of
44
shares of its Class B Common Stock issued and outstanding.
On July 15, 2014, the Company completed its Follow-on Offering issuing
5,520,000
shares of Class A Common Stock. Refer to Note 18 for more information regarding Follow-on Offering.
Class A Common Stock and Class B Common Stock
Voting Rights
Holders of Class A Common Stock and Class B Common Stock will have voting power over Malibu Boats, Inc., the sole managing member of the LLC, at a level that is consistent with their overall equity ownership of the Company's business. Pursuant to the Company's certificate of incorporation and bylaws, each share of Class A Common Stock entitles the holder to one vote with respect to each matter presented to the Company's stockholders on which the holders of Class A Common Stock are entitled to vote. Each holder of Class B Common Stock shall be entitled to the number of votes equal to the total number of LLC Units held by such holder multiplied by the exchange rate specified in the Exchange Agreement with respect to each matter presented to the Company's stockholders on which the holders of Class B Common Stock are entitled to vote. Accordingly, the holders of LLC Units collectively have a number of votes that is equal to the aggregate number of LLC Units that they hold. Subject to any rights that may be applicable to any then outstanding preferred stock, the Company's Class A and Class B Common Stock vote as a single class on all matters presented to the Company's stockholders for their vote or approval, except as otherwise provided in the Company's certificate of incorporation or bylaws or required by applicable law. Holders of the Company's Class A and Class B Common Stock do not have cumulative voting rights. Except in respect of matters relating to the election and removal of directors on the Company's board of directors and as otherwise provided in the Company's certificate of incorporation, the Company's bylaws, or as required by law, all matters to be voted on by the Company's stockholders must be approved by a majority of the shares present in person or by proxy at the meeting and entitled to vote on the subject matter.
Dividends
Subject to preferences that may apply to any shares of preferred stock outstanding at the time, the holders of the Company's Class A Common Stock will be entitled to share equally, identically and ratably in any dividends that the board of directors may determine to issue from time to time. Holders of the Company's Class B Common Stock do not have any right to receive dividends.
83
Liquidation Rights
In the event of any voluntary or involuntary liquidation, dissolution or winding up of our affairs, holders of the Company's Class A Common Stock would be entitled to share ratably in the Company's assets that are legally available for distribution to stockholders after payment of its debts and other liabilities. If the Company has any preferred stock outstanding at such time, holders of the preferred stock may be entitled to distribution and/or liquidation preferences. In either such case, the Company must pay the applicable distribution to the holders of its preferred stock before it may pay distributions to the holders of its Class A Common Stock. Holders of the Company Class B Common Stock do not have any right to receive a distribution upon a voluntary or involuntary liquidation, dissolution or winding up of the Company's affairs.
Other Rights
Holders of the Company's Class A Common Stock will have no preemptive, conversion or other rights to subscribe for additional shares. The rights, preferences and privileges of the holders of the Company's Class A Common Stock will be subject to, and may be adversely affected by, the rights of the holders of shares of any series of the Company's preferred stock that the Company may designate and issue in the future.
Preferred Stock
Though the Company currently has no plans to issue any shares of preferred stock, its board of directors has the authority, without further action by the Company's stockholders, to designate and issue up to
25,000,000
shares of preferred stock in one or more series. The Company's board of directors may also designate the rights, preferences and privileges of the holders of each such series of preferred stock, any or all of which may be greater than or senior to those granted to the holders of common stock. Though the actual effect of any such issuance on the rights of the holders of common stock will not be known until the Company's board of directors determines the specific rights of the holders of preferred stock, the potential effects of such an issuance include:
|
•
|
diluting the voting power of the holders of common stock;
|
|
•
|
reducing the likelihood that holders of common stock will receive dividend payments;
|
|
•
|
reducing the likelihood that holders of common stock will receive payments in the event of the Company's liquidation, dissolution, or winding up; and
|
|
•
|
delaying, deterring or preventing a change-in-control or other corporate takeover.
|
LLC Units
In connection with the Recapitalization, the LLC Agreement was amended and restated to, among other things; modify its capital structure by replacing the different classes of interests previously held by the LLC unit holders to a single new class of units called “LLC Units.” As a result of the Recapitalization and IPO, the Company holds LLC Units in the LLC and is the sole managing member of the LLC. Holders of LLC Units do not have voting rights under the LLC Agreement.
Further, the LLC and the pre-IPO owners entered into the Exchange Agreement under which (subject to the terms of the Exchange Agreement) they have the right to exchange their LLC Units for shares of the Company's Class A Common Stock on a one-for-one basis, subject to customary conversion rate adjustments for stock splits, stock dividends and reclassifications, or at the Company's option, except in the event of a change in control, for a cash payment equal to the market value of the Class A Common Stock. As of
June 30, 2014
, non-controlling LLC Unit holders held
11,373,737
LLC Units, representing
50.7%
of the economic interest in the LLC. As discussed in Note 2, net profits and net losses of the LLC will generally be allocated to the LLC’s members (including the Company) pro rata in accordance with the percentages of their respective limited liability company interests. The LLC Agreement provides for cash distributions to the holders of LLC Units if the Company determines that the taxable income of the LLC will give rise to taxable income for its members. In accordance with the LLC Agreement, the Company intends to cause the LLC to make cash distributions to holders of LLC Units for purposes of funding their tax obligations in respect of the income of the LLC that is allocated to them.
On July 15, 2014, the Company completed its Follow-on Offering. As a result, the Company held
15,426,723
LLC Units, representing a
68.8%
economic interest in the LLC, while non-controlling LLC Unit holders held
7,001,844
LLC Units, representing a
31.2%
interest in the LLC. Refer to Note 18 for more information regarding the Follow-on Offering.
12. Stock-Based Compensation
Equity Awards Issued Under the Malibu Boats, Inc. Long-Term Incentive Plan
84
On January 6, 2014, the Company’s Board of Directors adopted the Malibu Boats, Inc. Long-Term Incentive Plan (the “Incentive Plan”). The Incentive Plan, which became effective on January 1, 2014, reserves for issuance up to
1,700
shares of Malibu Boats, Inc. Class A Common Stock for the Company’s employees, consultants, members of its board of directors and other independent contractors at the discretion of the compensation committee. Incentive stock awards authorized under the Incentive Plan including unrestricted shares of Class A Common Stock, stock options, SARs, restricted stock, restricted stock units, dividend equivalent awards and performance awards.
On
June 27, 2014
, the Company granted
46
restricted stock unit awards to key employees under the Incentive Plan with a grant date fair value of
$20.03
per unit. Under the terms of the agreements, the awards will vest
25%
ratably on each anniversary of their grant date. Stock-based compensation expense attributable to these restricted stock units is amortized on a straight-line basis over the requisite service period. As of
June 30, 2014
, the weighted-average years non-vested for these awards was approximately
4.0
years.
The Company's non-employee directors receive an annual retainer for their services as directors consisting of both a cash retainer and equity awards in the form of Class A Common Stock or restricted stock units. Directors may elect that their cash annual retainer be converted into either fully vested shares of Class A Common Stock or restricted stock units paid on a deferral basis. Equity awards issued to directors are fully vested at the date of grant. Directors receiving restricted stock units as compensation for services have no rights as a stockholder of the Company, no dividend rights (except with respect to dividend equivalent rights), and no voting rights until Class A Common Stock is actually issued to them upon separation from service or change in control as defined in the Incentive Plan. If dividends are paid by the Company to its stockholders, directors would be entitled to receive an equal number of restricted stock units based on their proportional interest. On June 30, 2014, the Company issued
9
shares of Class A Common Stock and
61
restricted stock units to its non-employee directors for their services as directors pursuant to the Incentive Plan. The grant date fair value for the Class A Common Stock and restricted stock units received for the equity portion of the annual retainer was
$14.00
and the grant date fair value for the portion of the cash retainer elected to be received in equity was
$20.10
.
The following table presents the number and weighted-average grant date fair value of the Company’s restricted stock units at
June 30, 2014
(in thousands, except per share amounts):
|
Number of Restricted Stock Units Outstanding
|
Weighted Average Grant Date Fair Value
|
|||||
|
Total Non-vested Restricted Stock Units as of June 30, 2013
|
—
|
|
$
|
—
|
|
|
|
Granted
|
107
|
|
16.82
|
|
||
|
Vested
|
(61
|
)
|
14.38
|
|
||
|
Forfeited
|
—
|
|
—
|
|
||
|
Total Non-vested Restricted Stock Units as of June 30, 2014
|
46
|
|
$
|
20.03
|
|
|
Equity Awards Issued Under the Previously Existing LLC Agreement
As discussed in Note 2, the LLC modified its capital structure creating a new single class of interests called LLC Units. Previously granted profits interests (formerly Class M Units) were converted into LLC Units in connection with the Recapitalization. These LLC Units are generally subject to the terms of the applicable pre-existing agreements governing the awards, including vesting and repurchase rights at fair market value adjustment upon separation. Under these agreements, the LLC units cannot be resold and unvested units are subject to forfeiture if the recipient’s employment is terminated. Forfeited unvested units are not entitled to future distributions. Furthermore, such LLC Units are not transferable, except in limited circumstances as set out in the LLC Agreement. Pursuant to the LLC Agreement, the LLC has the right to determine when distributions will be made to holders of LLC Units and the amount of any such distributions. If a distribution is authorized, such distribution will be made to the holders of LLC Units (including Malibu Boats, Inc.) pro rata in accordance with the percentages of their respective LLC Units.
Certain agreements related to profits interest awards previously granted in 2012 under the former LLC agreement were modified to fully vest the awards at the time of the Recapitalization and IPO transactions. As a result, the incremental fair value associated with the awards was recognized as stock compensation expense when the Recapitalization and IPO transactions occurred. Further, certain profits interest awards previously granted in November 2013, vest
one-third
on each of the first
three
anniversaries of September 30, 2014. On June 26, 2014, the vesting period for certain profit interest awards granted to a member of management on November 1, 2013 and previously granted in 2012 were accelerated to vest on the date immediately prior to the completion of the Follow-on Offering. Refer to the Note 18 for more information on the Follow-on Offering.
85
A detail of the LLC’s outstanding restricted LLC Units (formerly M Units) for the fiscal years ended
June 30, 2014
and
2013
are as follows (in thousands, except per share amounts):
|
Total Units
June 30,
2012
|
Units
Granted
|
Units
Forfeited/Sold
|
Total Units June 30, 2013
|
Units Vested Through June 30, 2013
|
Units Unvested Through June 30, 2013
|
||||||||||||||||||
|
LLC Units
|
931
|
|
—
|
|
—
|
|
931
|
|
551
|
|
380
|
|
|||||||||||
|
Weighted Average Grant Date Fair Value Per Unit
|
$
|
14.78
|
|
$
|
—
|
|
$
|
—
|
|
$
|
14.78
|
|
$
|
14.68
|
|
$
|
14.84
|
|
|||||
|
Total Units
June 30,
2013
|
Units
Granted
|
Units
Forfeited/Sold
|
Total Units June 30, 2014
|
Units Vested Through June 30, 2014
|
Units Unvested Through June 30, 2014
|
||||||||||||||||||
|
LLC Units
|
931
|
|
387
|
|
(211
|
)
|
1,107
|
|
815
|
|
292
|
|
|||||||||||
|
Weighted Average Grant Date Fair Value Per Unit
|
$
|
14.78
|
|
$
|
14.12
|
|
$
|
(14.46
|
)
|
$
|
14.52
|
|
$
|
14.59
|
|
$
|
14.32
|
|
|||||
As of
June 30, 2014
, the weighted-average years unvested for these awards was approximately
1.2
years. The total fair value of LLC Units vested for the period from IPO to
June 30, 2014
was
$2,558
.
Stock compensation expense attributable to all of the Company's equity awards was
$2,577
,
$127
and
$132
for the fiscal years
2014
,
2013
and
2012
, respectively, and is included in general and administrative expense in the Company's consolidated statement of operations. The cash flow effects resulting from equity awards were reflected as noncash operating activities. As of June 30,
2014
, unrecognized compensation cost related to nonvested, share-based compensation was
$3,515
.
13. Net Loss Per Share
Basic net loss per share of Class A Common Stock is computed by dividing net loss attributable to the Company's earnings by the weighted average number of shares of Class A Common Stock outstanding during the period. The weighted average number of shares of Class A Common Stock outstanding used in computing basic net loss per share includes fully vested restricted stock units awarded to directors that are entitled to participate in distributions to common shareholders through receipt of additional units of equivalent value to the dividends paid to Class A Common Stock holde
rs.
Diluted net loss per share of Class A Common Stock is computed similarly to basic net loss per share except the weighted average shares outstanding are increased to include additional shares from the assumed exercise of any common stock equivalents using the treasury method, if dilutive. The Company’s restricted LLC Units are considered common stock equivalents for this purpose. The number of additional shares of Class A Common Stock related to these common stock equivalents is calculated using the treasury stock method.
All earnings (loss) prior to and up to February 5, 2014, the date of completion of the IPO, were entirely allocable to non-controlling interest and, as a result, earnings (loss) per share information is not applicable for reporting periods prior to this date. Consequently, only the net loss allocable to Malibu Boats, Inc. from the period subsequent to February 5, 2014 is included in the net loss attributable to the stockholders of Class A Common Stock for the fiscal year ended
June 30, 2014
. Basic and diluted net loss per share of Class A Common Stock from February 5, 2014 to
June 30, 2014
have been computed as follows (in thousands, except share and per share amounts):
86
|
Period from February 5, 2014 to June 30, 2014
|
|||
|
Basic:
|
|||
|
Net loss attributable to Malibu Boats, Inc.
|
$
|
(4,676
|
)
|
|
Shares used in computing basic net loss per share:
|
|||
|
Weighted-average Class A Common Stock
|
11,054,894
|
|
|
|
Weighted-average participating restricted stock units convertible into Class A Common Stock
|
416
|
|
|
|
Basic weighted-average shares outstanding
|
11,055,310
|
|
|
|
Basic net loss per share
|
$
|
(0.42
|
)
|
|
Diluted:
|
|||
|
Net loss attributable to Malibu Boats, Inc.
|
$
|
(4,676
|
)
|
|
Net loss
|
(4,676
|
)
|
|
|
Shares used in computing diluted net loss per share:
|
|||
|
Weighted-average Class A Common Stock
|
11,054,894
|
|
|
|
Weighted-average participating restricted stock units convertible into Class A Common Stock
|
416
|
|
|
|
Diluted weighted-average shares outstanding
|
11,055,310
|
|
|
|
Diluted net loss per share
|
$
|
(0.42
|
)
|
1
The Company excluded
11,373,855
potentially dilutive shares from the calculation of diluted loss per share for the fiscal year ended June 30, 2014 as these units would have been antidilutive.
The shares of Class B Common Stock do not share in the earnings or losses of Malibu Boats, Inc. and are therefore not included in the calculation. Accordingly, basic and diluted net earnings (loss) per share of Class B Common Stock has not been presented.
On July 15, 2014, the Company issued
5,520,000
shares of Class A Common Stock in connection with its Follow-on Offering. The issuance of these shares are expected to have a material impact on net income attributable to the Company and weighted-average shares outstanding used in computing basic net earnings per share of Class A Common Stock for periods subsequent to fiscal year ended
June 30, 2014
. The issuance will also have a material offsetting impact between the weighted-average Class A Common Stock and non-controlling interest units convertible into Class A Common Stock outstanding used in determining diluted weighted-average shares outstanding for periods subsequent to fiscal year ended
June 30, 2014
. The impact on diluted weighted-average shares outstanding and diluted net earnings per share of Class A Common Stock is therefore excepted to be nominal. Refer to Note 18 for more information.
14. Commitments and Contingencies
Repurchase Commitments
In connection with its dealers’ wholesale floor-plan financing of boats, the Company has entered into repurchase agreements with various lending institutions. The reserve methodology used to record an estimated expense and loss reserve in each accounting period is based upon an analysis of likely repurchases based on current field inventory and likelihood of repurchase. Subsequent to the inception of the repurchase commitment, the Company evaluates the likelihood of repurchase and adjusts the estimated loss reserve and related consolidated statement of operations account accordingly. This potential loss reserve is presented in accrued liabilities in the accompanying consolidated balance sheets. If the Company were obligated to repurchase a significant number of units under any repurchase agreement, its business, operating results and financial condition could be adversely affected.
Repurchases and subsequent sales are recorded as a revenue transaction. The net difference between the original repurchase price and the resale price is recorded against the loss reserve and presented in cost of goods sold in the accompanying consolidated income statements. No units were repurchased for the fiscal years ended June 30,
2014
and
2013
. The Company did not carry a reserve for repurchases as of June 30,
2014
and
2013
, respectively.
Lease Commitments
87
In connection with a sale-leaseback transaction as of March 2008, the Company now leases its manufacturing and office facilities for
$156
per month with periodic inflationary adjustments, plus the payment of property taxes, normal maintenance, and insurance on the property under an agreement which expires March 2028, with three ten-year options to extend, at the Company’s discretion. For more information, see Note 4.
The Company also has various other leases for operating facilities and machinery and equipment under operating leases that expire over the next three years. The total rental expense for the years ended June 30,
2014
,
2013
and
2012
was $
2,088
,
$1,889
and
$1,817
, respectively.
Future minimum lease payments under noncancelable operating leases as of
June 30, 2014
, are as follows:
|
As of June 30, 2014
|
||||
|
Fiscal Year
|
||||
|
2015
|
$
|
1,949
|
|
|
|
2016
|
1,942
|
|
||
|
2017
|
1,904
|
|
||
|
2018
|
1,905
|
|
||
|
2019
|
2,050
|
|
||
|
Thereafter
|
15,012
|
|
||
|
$
|
24,762
|
|
||
Contingencies
Product Liability
The Company is engaged in a business that exposes it to claims for product liability and warranty claims in the event the Company’s products actually or allegedly fail to perform as expected or the use of the Company’s products results, or is alleged to result, in property damage, personal injury or death. Although the Company maintains product and general liability insurance of the types and in the amounts that the Company believes are customary for the industry, the Company is not fully insured against all such potential claims. The Company may have the ability to refer claims to its suppliers and their insurers to pay the costs associated with any claims arising from the suppliers’ products. The Company’s insurance covers such claims that are not adequately covered by a supplier’s insurance and provides for excess secondary coverage above the limits provided by the Company’s suppliers.
The Company may experience legal claims in excess of its insurance coverage or claims that are not covered by insurance, either of which could adversely affect its business, financial condition and results of operations. Adverse determination of material product liability and warranty claims made against the Company could have a material adverse effect on its financial condition and harm its reputation. In addition, if any of the Company products are, or are alleged to be, defective, the Company may be required to participate in a recall of that product if the defect or alleged defect relates to safety. These and other claims that the Company faces could be costly to the Company and require substantial management attention. Refer to Note 6 for discussion of warranty claims. The Company insures against product liability claims and believes there are no material product liability claims as of
June 30, 2014
that would not be covered by our insurance.
Litigation
Certain conditions may exist which could result in a loss, but which will only be resolved when future events occur. The Company, in consultation with its legal counsel, assesses such contingent liabilities, and such assessments inherently involve an exercise of judgment. If the assessment of a contingency indicates that it is probable that a loss has been incurred, the Company accrues for such contingent loss when it can be reasonably estimated. If the assessment indicates that a potentially material loss contingency is not probable but reasonably estimable, or is probable but cannot be estimated, the nature of the contingent liability, together with an estimate of the range of possible loss if determinable and material, is disclosed. Estimates of potential legal fees and other directly related costs associated with contingencies are not accrued but rather are expensed as incurred. Except as disclosed below, management does not believe there are any pending claims (asserted or unasserted) at
June 30, 2014
or
June 30, 2013
that will have a material adverse impact on the Company’s financial condition, results of operations or cash flows. See ‘Legal Proceedings’ section below for more detail on on-going litigation.
Legal Proceedings
88
On August 27, 2010, Pacific Coast Marine Windshields Ltd., or "PCMW," filed suit against the Company and certain third parties, including Marine Hardware, Inc., a third-party supplier of windshields to the Company, in the U.S. District Court for the Middle District of Florida seeking monetary and injunctive relief. PCMW was a significant supplier of windshields to the Company through 2008, when the Company sought an alternative vendor of windshields in response to defective product supplied by PCMW. PCMW’s amended complaint alleged, among other things, infringement of a design patent and two utility patents related to marine windshields, copyright infringement and misappropriation of trade secrets. The Company denied any liability arising from the causes of action alleged by PCMW and filed a counter claim alleging PCMW’s infringement of one of the Company's patents, conversion of two of the patents asserted against the Company, unfair competition and breach of contract. In December 2012, the court granted partial summary judgment in the Company's favor, holding that the Company did not infringe the design patent asserted against the Company. PCMW appealed the court’s decision and dismissed all remaining claims against the Company, other than the claims of copyright infringement and misappropriation of trade secrets. The court stayed the remaining matters pending resolution of PCMW’s appeal. On January 8, 2014, the Court of Appeals for the Federal Circuit Court reversed the decision granting summary judgment in the Company's favor regarding the design patent asserted against the Company, and the case was remanded to the district court. The appellate court’s decision did not affect any of the Company's other defenses to any of PCMW’s claims, including the design patent claim, nor did it affect any of the Company's claims against PCMW. The district court scheduled a hearing on June 3, 2014 for the pending summary judgment motions, and it subsequently entered an order denying those motions and confirming the previously-set trial date of September 22, 2014 on PCMW’s remaining claims for infringement of a design patent, copyright, and trade secret misappropriation and the Company’s claims against PCMW for declaratory relief, conversion, breach of warranty, and unfair competition.
As part of the order dated August 22, 2014, denying the Company’s summary judgment motion, the district court ruled that if successful at trial in proving that the Company infringes the design patent, PCMW would be allowed to seek recovery of Malibu’s profits from the sale of the boats using the alleged infringing windshield, and not merely the profits from the windshield. On September 15, 2014, the Company entered into a Memorandum of Understanding between it and PCMW subject to the execution of a definitive settlement agreement which is expected to occur on or prior to September 29, 2014. As a result, the Company will pay
$20.0 million
in cash to to the plaintiffs, PCMW and Darren Bach, upon entry into a definitive agreement or such later date as the parties agree, and the parties have released each other from all past and present claims. Further, the plaintiffs, including PCMW, have agreed not to sue on now-existing intellectual property rights. Accordingly, the Company recorded a one-time charge of
$20.0 million
in connection with the settlement for the fiscal year ending June 30, 2014.
On October 31, 2013, the Company filed suit against Nautique Boat Company, Inc., or "Nautique," in the U.S. District Court for the Eastern District of Tennessee alleging infringement of two of the Company's patents and seeking monetary and injunctive relief. This Tennessee lawsuit is a re-filing of a California patent infringement lawsuit against Nautique that was dismissed without prejudice on October 31, 2013. On November 1, 2013, Nautique filed for declaratory judgment in the U.S. District Court for the Middle District of Florida, claiming that it has not infringed the two patents identified in the original complaint in the Tennessee lawsuit. The Tennessee court has enjoined Nautique from maintaining the Florida lawsuit which is partially duplicative. Nautique has dismissed the Florida lawsuit to comply with the Tennessee court’s ruling. On December 13, 2013, the Company amended the Company's complaint to add another of its patents to the Tennessee lawsuit. All three patents in the case relate to the Company's proprietary wake surfing technology.
On June 27, 2014, Nautique filed a petition with the U.S. Patent and Trademark Office, or “PTO,” requesting institution of an
Inter Partes
Review, or “IPR,” of the Company’s U.S. Pat. No. 8,539,897, one of the three patents at issue in the Tennessee litigation. The Company will file a response with the PTO addressing the allegations made in Nautique’s petition. Thereafter, the PTO will determine whether to institute the IPR. In the Tennessee litigation, the Court denied Nautique’s motion to stay the litigation pending the outcome of Nautique’s petition for an IPR. The Court also set a trial date for the litigation of February 9, 2015. The Company intends to vigorously pursue the Tennessee litigation and the IPR to enforce and defend its rights in the patented technology.
15. Related Party Transactions
On July 11, 2012, the LLC reinstated certain payment provisions of a management agreement with an equity sponsor. Under the terms of the management agreement, as amended, the LLC agreed to pay a management fee of
$1,831
for periods prior to June 30, 2012,
$250
for the period July 1, 2012 through December 31, 2012 and
$750
per annum beginning January 1, 2013, all of which is payable in advance. In connection with the IPO, this management agreement was terminated and a one time termination fee of $
3,750
was paid to the former sponsor. Total payments associated with the management services, including termination fees, for the years ended June 30,
2014
,
2013
and
2012
were
$4,500
,
$2,831
and
$0
, respectively, all of which are recorded as general and administrative expense.
Three non-employee members of the Company's board of directors are also shareholders of the Company and receive an annual retainer as compensation for services rendered. For the fiscal year ended
June 30, 2014
,
$416
was paid to these directors
89
in both cash and equity for their services. Of the amount paid,
$268
was a prepayment for services through the 2015 annual meeting.
16. Segment Reporting
The Company operates as
one
operating segment—the manufacturing, distribution, marketing and sale of performance sport boats. The Company considers an operating segment to be a component of an entity for which discrete financial information is available for such component and the operating results for such segment are regularly reviewed by the chief operating decision maker (“CODM”), as defined by ASC Topic 280, “Segment Reporting,” to assess performance and allocate Company resources. The Company’s Chief Executive Officer serves as the CODM. The Company relied upon the following factors in determining that it operates as a single operating segment: (i) the similar nature of the products sold by the Company; (ii) the centralized production and management structure of the Company, which supports all marketing, selling and customer service efforts worldwide; and (iii) the consolidated nature of the reports reviewed by the CODM for purposes of assessing the Company’s performance and allocating its resources.
17. Quarterly Financial Reporting (Unaudited)
|
Quarter Ended
1
|
Fiscal Year Ended
June 30, 2014 |
|||||||||||||||||||
|
June 30, 2014
|
March 31, 2014
|
December 31, 2013
|
September 30, 2013
|
|||||||||||||||||
|
Net Sales
|
$
|
53,400
|
|
$
|
50,293
|
|
$
|
43,938
|
|
$
|
43,304
|
|
$
|
190,935
|
|
|||||
|
Gross Profit
|
14,676
|
|
13,401
|
|
11,696
|
|
11,021
|
|
50,794
|
|
||||||||||
|
Operating (loss) income
|
(12,914
|
)
|
296
|
|
5,823
|
|
6,340
|
|
(455
|
)
|
||||||||||
|
Net (loss) income
|
(10,600
|
)
|
(987
|
)
|
5,220
|
|
5,179
|
|
(1,188
|
)
|
||||||||||
|
Net (loss) income attributable to non-controlling interest
|
(6,294
|
)
|
(617
|
)
|
5,220
|
|
5,179
|
|
3,488
|
|
||||||||||
|
Net loss attributable to Malibu Boats, Inc.
|
$
|
(4,306
|
)
|
$
|
(370
|
)
|
$
|
—
|
|
$
|
—
|
|
$
|
(4,676
|
)
|
|||||
|
Basic loss per share of Class A Common Stock
|
$
|
(0.39
|
)
|
$
|
(0.03
|
)
|
$
|
—
|
|
$
|
—
|
|
$
|
(0.42
|
)
|
|||||
|
Diluted loss per share of Class A Common Stock
|
$
|
(0.39
|
)
|
$
|
(0.04
|
)
|
$
|
—
|
|
$
|
—
|
|
$
|
(0.42
|
)
|
|||||
|
Quarter Ended
2
|
Fiscal Year Ended
June 30, 2013 |
|||||||||||||||||||
|
June 30, 2013
|
March 31, 2013
|
December 31, 2012
|
September 30, 2012
|
|||||||||||||||||
|
Net Sales
|
$
|
48,973
|
|
$
|
47,062
|
|
$
|
37,818
|
|
$
|
33,159
|
|
$
|
167,012
|
|
|||||
|
Gross Profit
|
13,938
|
|
12,500
|
|
9,294
|
|
7,868
|
|
43,600
|
|
||||||||||
|
Operating income
|
8,624
|
|
5,532
|
|
4,165
|
|
986
|
|
19,308
|
|
||||||||||
|
Net income
|
8,376
|
|
5,200
|
|
3,767
|
|
639
|
|
17,984
|
|
||||||||||
|
Net income attributable to non-controlling interest
|
8,376
|
|
5,200
|
|
3,767
|
|
639
|
|
17,984
|
|
||||||||||
|
Net income attributable to Malibu Boats, Inc.
|
$
|
—
|
|
$
|
—
|
|
$
|
—
|
|
$
|
—
|
|
$
|
—
|
|
|||||
|
Basic earnings per share of Class A Common Stock
|
$
|
—
|
|
$
|
—
|
|
$
|
—
|
|
$
|
—
|
|
$
|
—
|
|
|||||
|
Diluted earnings per share of Class A Common Stock
|
$
|
—
|
|
$
|
—
|
|
$
|
—
|
|
$
|
—
|
|
$
|
—
|
|
|||||
1
The quarterly information presented for the quarters ended September 30 and December 31, 2013 reflect the financial statement results attributable to the LLC. The quarterly information presented for the quarters ended March 31 and June 30, 2013 reflect the financial statement results of the Company. Certain totals will not sum exactly due to rounding.
2
The quarterly information presented for the fiscal year ended June 30, 2013 reflect the financial statement results entirely attributable to the LLC. Certain totals will not sum exactly due to rounding.
18. Subsequent Events
401(k) Retirement Plan
90
The Company adopted a new 401(k) retirement plan effective as of July 1, 2014. Full-time employees who have completed one year of service will have the opportunity to participate in the 401(k) plan. The 401(k) plan will be intended to qualify under Section 401 of the Internal Revenue Code. Employees will be able to elect to defer a portion of their eligible compensation not to exceed the statutorily prescribed annual limit in the form of elective deferral contributions to the Company’s 401(k) plan. The Company’s 401(k) plan will also have a “catch-up contribution” feature for employees eligible to defer amounts over the statutory limit that applies to all other employees. The Company also expects to provide matching contributions of up to $0.50 per $1.00 of participant deferral up to a maximum per participant deferral amount equivalent to
6%
of eligible compensation, with a maximum matching contribution of
3%
of eligible compensation per participant per plan year. Participants will always be vested in their personal contributions to the 401(k) plan, and company matching contributions under the plan are expected to cliff vest following a participant’s completion of three years of service.
Unregistered Sales of Equity Securities
On July 2, 2014, in connection with transfers of membership units of the LLC by certain members of the LLC to one LLC member, the Company canceled
one
share of its Class B Common Stock, par value $
0.01
per share, for a total of
43
shares.
Follow-on Offering
On July 15, 2014, the Company completed the Follow-on Offering of
5,520,000
shares of Class A Common Stock at a price to the public of $
18.50
per share, of which
4,371,893
shares were issued and sold by the Company and
1,148,107
shares were sold by selling stockholders. This included
538,252
shares issued and sold by the Company and
181,748
shares sold by selling stockholders pursuant to the over-allotment option granted to the underwriters, which was exercised concurrently with the closing of the Follow-on Offering.
The aggregate gross proceeds from the Follow-on Offering were
$102,120
. Of these proceeds, the Company received
$76,836
and the selling stockholders received
$20,178
, after deducting
$5,106
in underwriting discounts and commissions. All the proceeds from the Follow-on Offering were used to purchase LLC Units directly from the holders of LLC Units. Immediately following the Follow-on Offering, the Company owned
15,426,723
LLC Units representing
68.8%
of the economic interest in the LLC while non-controlling LLC Unit holders owned
7,001,844
LLC Units representing a
31.2%
interest in the LLC.
In connection with completion of the Follow-on Offering, the Company estimates it will record deferred tax assets of approximately
$37,202
associated with basis differences in assets upon acquiring the additional interest in Malibu Boats Holdings, LLC and in anticipation of making a Section 754 election. The Company also estimates it will record approximately
$34,019
in tax receivable agreement liabilities representing
85%
of the tax savings that the Company will receive in connection with the Section 754 election. These amounts are preliminary and subject to adjustment.
Distributions to Non-Controlling LLC Unit Holders
On August 21, 2014, the LLC paid tax distributions to non-controlling LLC Unit holders in the aggregate amount of
$2,008
.
Settlement of Litigation with PCMW
On September 15, 2014, the Company agreed to settle litigation with PCMW regarding infringement of certain intellectual property rights. Accordingly, the Company recorded a one-time charge of
$20.0 million
in connection with the settlement for the fiscal year ending June 30, 2014. Refer to Note 14 for more information.
91
None.
Evaluation of Disclosure Controls and Procedures
We maintain disclosure controls and procedures (as defined in Rule 13a-15(e) of the Exchange Act) that are designed to ensure that information required to be disclosed by us in the reports that we file or submit under the Exchange Act is recorded, processed, summarized and reported within the time periods specified in the SEC's rules and forms, and that such information is accumulated and communicated to our management, including our chief executive officer and chief financial officer, as appropriate, to allow timely decisions regarding required disclosures. Any controls and procedures, no matter how well designed and operated, can provide only reasonable assurance of achieving the desired control objectives.
As of the end of the period covered by this Form 10-K Annual Report, we carried out an evaluation under the supervision and with the participation of our management, including our chief executive officer and chief financial officer, of the effectiveness of our disclosure controls and procedures. Based upon this evaluation, our chief executive officer and chief financial officer have concluded that our disclosure controls and procedures were effective at a reasonable assurance level as of
June 30, 2014
.
Changes in Internal Control Over Financial Reporting
There have been no changes in our internal control over financial reporting during the quarter ended
June 30, 2014
that have materially affected, or are reasonably likely to materially affect, our internal control over financial reporting.
Exemption from Management’s Report on Internal Control Over Financial Reporting
This Annual Report does not include a report of management’s assessment regarding internal control over financial reporting or an attestation report of our independent registered public accounting firm due to a transition period established by rules of the SEC for newly public companies.
Not Applicable.
92
The Company has adopted a Code of Business Conduct applicable to our employees, directors, and officers and a Code of Ethics and a Supplemental Code of Ethics. This Code of Ethics is applicable to our principal executive officer, principal financial officer, principal accounting officer and controller, or persons performing similar functions. The codes are available on the Company’s website at
www.malibuboats.com
. To the extent required by rules adopted by the SEC and NASDAQ, we intend to promptly disclose future amendments to certain provisions of the codes, or waivers of such provisions granted to executive officers and directors on our website at
www.malibuboats.com
.
The remaining information required by this Item 10 will be included the Proxy Statement and is incorporated herein by reference.
The information required by this Item 11 will be included in the Proxy Statement and is incorporated herein by reference.
The information required by this Item 12 will be included in the Proxy Statement and is incorporated herein by reference.
The information required by this Item 13 will be included in the Proxy Statement and is incorporated herein by reference.
The information required by this Item 14 will be included in the Proxy Statement and is incorporated herein by reference.
93
Item 15.
Exhibits, Financial Statement Schedules
The following documents are filed as part of this Annual Report on Form 10-K:
1. Consolidated Financial Statements
The following financial statements are included in Part II, Item 8 of this Annual Report on Form 10-K:
|
•
|
Consolidated Statements of Operations for the fiscal years ended
June 30, 2014
,
2013
, and
2012
.
|
|
•
|
Consolidated Balance Sheets as of
June 30, 2014
and
2013
.
|
|
•
|
Consolidated Statements of Stockholders’ and Members’ Equity for the fiscal years ended
June 30, 2014
,
2013
, and
2012
.
|
|
•
|
Consolidated Statements of Cash Flows for the fiscal years ended
June 30, 2014
,
2013
, and
2012
.
|
|
•
|
Notes to Consolidated Financial Statements.
|
|
•
|
Report of Independent Registered Public Accounting Firm.
|
2. Financial Statement Schedules
Separate financial statement schedules have been omitted because such information is inapplicable or is included in the financial statements or notes described above.
3. Exhibits
The exhibits filed as part of this Annual Report are listed in the exhibit index immediately preceding such exhibits, which exhibit index is incorporated herein by reference.
|
Exhibit No.
|
Description
|
|
|
3.1
|
|
Certificate of Incorporation of Malibu Boats, Inc. (incorporated herein by reference to Exhibit 3.1 to Amendment No. 1 to Malibu Boats, Inc.’s Registration Statement on Form S-1 filed on January 8, 2014 (File No. 333-192862))
|
|
3.2
|
|
Bylaws of Malibu Boats, Inc. (incorporated herein by reference to Exhibit 3.2 to Amendment No. 1 to Malibu Boats, Inc.’s Registration Statement on Form S-1 filed on January 8, 2014 (File No. 333-192862))
|
|
3.3
|
|
Certificate of Formation of Malibu Boats Holdings, LLC (incorporated herein by reference to Exhibit 3.3 to Amendment No. 1 to Malibu Boats, Inc.’s Registration Statement on Form S-1 filed on January 8, 2014 (File No. 333-192862))
|
|
3.4
|
|
First Amended and Restated Limited Liability Company Agreement of Malibu Boats Holdings, LLC dated as of February 5, 2014 (incorporated herein by reference to Exhibit 10.1 to Malibu Boats, Inc.’s Current Report on Form 8-K filed on February 6, 2014 (File No. 001-36290))
|
|
3.4.1
|
|
First Amendment, dated as of February 5, 2014, to First Amended and Restated Limited Liability Company Agreement of Malibu Boats Holdings, LLC (incorporated herein by reference to Exhibit 3.5 to Malibu Boats, Inc.’s Quarterly Report on Form 10-Q/A filed on May 13, 2014 (File No. 001-36290))
|
|
3.4.2
|
|
Second Amendment, dated as of June 27, 2014, to First Amended and Restated Limited Liability Company Agreement of Malibu Boats Holdings, LLC (incorporated herein by reference to Exhibit 3.1 to Malibu Boats, Inc.’s Current Report on Form 8-K filed on June 27, 2014 (File No. 001-36290))
|
|
4.1
|
|
Form of Class A Common Stock Certificate (incorporated herein by reference to Exhibit 4.1 to Amendment No. 1 to Malibu Boats, Inc.’s Registration Statement on Form S-1 filed on January 8, 2014 (File No. 333-192862))
|
|
4.2
|
|
Form of Class B Common Stock Certificate (incorporated herein by reference to Exhibit 4.2 to Amendment No. 1 to Malibu Boats, Inc.’s Registration Statement on Form S-1 filed on January 8, 2014 (File No. 333-192862))
|
94
|
10.1
|
|
Credit Agreement by and among Malibu Boats, LLC, Malibu Boats Holdings, LLC, SunTrust Bank and the other Lenders and Guarantors defined therein, dated July 16, 2013 (incorporated herein by reference to Exhibit 10.1 to Amendment No. 1 to Malibu Boats, Inc.’s Registration Statement on Form S-1 filed on January 8, 2014 (File No. 333-192862))†
|
|
10.1.1
|
|
First Amendment, dated January 3, 2014, to Credit Agreement and Consent by and among Malibu Boats, LLC, Malibu Boats Holdings, LLC, SunTrust Bank and the other Lenders and Guarantors defined therein (incorporated herein by reference to Exhibit 10.1.1 to Amendment No. 1 to Malibu Boats, Inc.’s Registration Statement on Form S-1 filed on January 8, 2014 (File No. 333-192862))
|
|
10.1.2
|
|
Second Amendment, dated as of May 8, 2014, to Credit Agreement and Consent by and among Malibu Boats, LLC, Malibu Boats Holdings, LLC, SunTrust Bank and the other Lenders and Guarantors defined therein (incorporated herein by reference to Exhibit 10.1 to Malibu Boats, Inc.’s Quarterly Report on Form 10-Q filed on May 12, 2014 (File No. 001-36290))
|
|
10.2
|
|
Security Agreement by and among Malibu Boats, LLC, Malibu Boats Holdings, LLC, Malibu Boats Domestic International Sales Corp. and SunTrust Bank, dated July 16, 2013 (incorporated herein by reference to Exhibit 10.2 to Malibu Boats, Inc.’s registration statement on Form S-1 filed on December 13, 2013 (File No. 333-192862))
|
|
10.3
|
|
Trademark and Patent Security Agreement by and between Malibu Boats, LLC and SunTrust Bank, dated July 16, 2013 (incorporated herein by reference to Exhibit 10.3 to Amendment No. 1 to Malibu Boats, Inc.’s Registration Statement on Form S-1 filed on January 8, 2014 (File No. 333-192862))
|
|
10.4
|
|
Master Lease Agreement by and between Malibu Boats, LLC and Spirit Master Funding IV, LLC, dated March 31, 2008 (incorporated herein by reference to Exhibit 10.7 to Malibu Boats, Inc.’s registration statement on Form S-1 filed on December 13, 2013 (File No. 333-192862))
|
|
10.5
|
|
Sublease by and between Malibu Boats, LLC and Spirit Master Funding IV, LLC, dated March 31, 2008 (incorporated herein by reference to Exhibit 10.8 to Malibu Boats, Inc.’s registration statement on Form S-1 filed on December 13, 2013 (File No. 333-192862))
|
|
10.6*
|
|
Employment Agreement by and between Malibu Boats, Inc. and Ritchie Anderson, dated February 5, 2014 (incorporated herein by reference to Exhibit 10.7 to Malibu Boats, Inc.’s Current Report on Form 8-K filed on February 6, 2014 (File No. 001-36290))
|
|
10.7*
|
|
Employment Agreement by and between Malibu Boats, Inc. and Jack Springer, dated February 5, 2014 (incorporated herein by reference to Exhibit 10.8 to Malibu Boats, Inc.’s Current Report on Form 8-K filed on February 6, 2014 (File No. 001-36290))
|
|
10.8*
|
|
Employment Agreement by and between Malibu Boats, Inc. and Wayne Wilson, dated February 5, 2014 (incorporated herein by reference to Exhibit 10.9 to Malibu Boats, Inc.’s Current Report on Form 8-K filed on February 6, 2014 (File No. 001-36290))
|
|
10.9*
|
|
Long-Term Incentive Plan (incorporated herein by reference to Exhibit 10.15 to Amendment No. 1 to Malibu Boats, Inc.’s Registration Statement on Form S-1 filed on January 8, 2014 (File No. 333-192862))
|
|
10.9.1*
|
|
Amendment Number One, dated as of June 24, 2014, to the Long Term Incentive Plan (incorporated herein by reference to Exhibit 10.2 to Malibu Boats, Inc.’s Current Report on Form 8-K filed on June 27, 2014 (File No. 001-36290))
|
|
10.9.2*
|
|
Form of Incentive Stock Option Agreement (incorporated herein by reference to Exhibit 10.15.1 to Amendment No. 1 to Malibu Boats, Inc.’s Registration Statement on Form S-1 filed on January 8, 2014 (File No. 333-192862))
|
|
10.9.3*
|
|
Form of Nonqualified Stock Option Agreement (incorporated herein by reference to Exhibit 10.15.2 to Amendment No. 1 to Malibu Boats, Inc.’s Registration Statement on Form S-1 filed on January 8, 2014 (File No. 333-192862))
|
|
10.9.4*
|
|
Form of Restricted Stock Agreement (incorporated herein by reference to Exhibit 10.15.3 to Amendment No. 1 to Malibu Boats, Inc.’s Registration Statement on Form S-1 filed on January 8, 2014 (File No. 333-192862))
|
|
10.9.5*
|
|
Form of Restricted Stock Unit Award Agreement (incorporated herein by reference to Exhibit 10.15.4 to Amendment No. 1 to Malibu Boats, Inc.’s Registration Statement on Form S-1 filed on January 8, 2014 (File No. 333-192862))
|
|
10.10
|
|
Exchange Agreement, dated as of February 5, 2014, by and among Malibu Boats, Inc. and Affiliates of Black Canyon Capital LLC and Horizon Holdings LLC (incorporated herein by reference to Exhibit 10.2 to Malibu Boats, Inc.’s Current Report on Form 8-K filed on February 6, 2014 (File No. 001-36290))
|
|
10.10.1
|
|
Exchange Agreement, dated as of February 5, 2014, by and among Malibu Boats, Inc. and the Other Members of Malibu Boats Holdings, LLC (incorporated herein by reference to Exhibit 10.3 to Malibu Boats, Inc.’s Current Report on Form 8-K filed on February 6, 2014 (File No. 001-36290))
|
95
|
10.11
|
|
Tax Receivable Agreement, dated as of February 5, 2014, by and among Malibu Boats, Inc., Malibu Boats Holdings, LLC and the Other Members of Malibu Boats Holdings, LLC (incorporated herein by reference to Exhibit 10.4 to Malibu Boats, Inc.’s Current Report on Form 8-K filed on February 6, 2014 (File No. 001-36290))
|
|
10.12
|
|
Registration Rights Agreement, dated as of February 5, 2014, by and among Malibu Boats, Inc., Black Canyon Management LLC and Affiliates of Black Canyon Capital LLC (incorporated herein by reference to Exhibit 10.5 to Malibu Boats, Inc.’s Current Report on Form 8-K filed on February 6, 2014 (File No. 001-36290))
|
|
10.12.1
|
|
First Amendment, dated as of June 27, 2014, to the Registration Rights Agreement by and among Malibu Boats, Inc., Black Canyon Management LLC and Affiliates of Black Canyon Capital LLC (incorporated herein by reference to Exhibit 10.1 to Malibu Boats, Inc.’s Current Report on Form 8-K filed on June 27, 2014 (File No. 001-36290))
|
|
10.13*
|
|
Form of Indemnification Agreement (incorporated herein by reference to Exhibit 10.19 to Malibu Boats, Inc.’s registration statement on Form S-1 filed on December 13, 2013 (File No. 333-192862))
|
|
10.14
|
|
Voting Agreement, dated as of February 5, 2014, by and among Malibu Boats, Inc., Black Canyon Management LLC, Jack D. Springer, Wayne R. Wilson and Ritchie L. Anderson (incorporated herein by reference to Exhibit 10.6 to Malibu Boats, Inc.’s Current Report on Form 8-K filed on February 6, 2014 (File No. 001-36290))
|
|
10.15*
|
|
Letter Agreement Amending LLC Unit Vesting Schedule by and between Malibu Boats Holdings, LLC and Ritchie Anderson (incorporated herein by reference to Exhibit 10.4 to Malibu Boats, Inc.’s Current Report on Form 8-K filed on June 27, 2014 (File No. 001-36290))
|
|
10.16*
|
|
Director Compensation Policy (incorporated herein by reference to Exhibit 10.3 to Malibu Boats, Inc.’s Current Report on Form 8-K filed on June 27, 2014 (File No. 001-36290))
|
|
21.1
|
|
Subsidiaries of Malibu Boats, Inc. (incorporated herein by reference to Exhibit 21.1 to Amendment No. 1 to Malibu Boats, Inc.’s Registration Statement on Form S-1 filed on January 8, 2014 (File No. 333-192862))
|
|
23.1
|
|
Consent of McGladrey LLP, independent registered public accounting firm for Malibu Boats, Inc.
|
|
31.1
|
|
Certificate of the Chief Executive Officer of Malibu Boats, Inc. pursuant to Rule 13a-14 or 15d-14 of the Securities Exchange Act of 1934, as amended, as adopted pursuant to Section 302 of the Sarbanes-Oxley Act of 2002
|
|
31.2
|
|
Certificate of the Chief Financial Officer of Malibu Boats, Inc. pursuant to Rule 13a-14 or 15d-14 of the Securities Exchange Act of 1934, as amended, as adopted pursuant to Section 302 of the Sarbanes-Oxley Act of 2002
|
|
32
|
|
Certification of the Chief Executive Officer and Chief Financial Officer of Malibu Boats, Inc. pursuant to 18 U.S.C. Section 1350, as adopted pursuant to Section 906 of the Sarbanes-Oxley Act of 2002
|
|
101.INS
|
|
XBRL Instance Document ***
|
|
101.SCH
|
|
XBRL Taxonomy Extension Schema Document ***
|
|
101.CAL
|
|
XBRL Taxonomy Calculation Linkbase Document ***
|
|
101.DEF
|
|
XBRL Definition Linkbase Document ***
|
|
101.LAB
|
|
XBRL Taxonomy Label Linkbase Document ***
|
|
101.PRE
|
|
XBRL Taxonomy Presentation Linkbase Document ***
|
|
*
|
Management contract or compensatory plan or arrangement
|
|
***
|
Pursuant to Rule 406T of Regulation S-T, the Interactive Data Files in Exhibit 101 hereto are deemed not filed or part of a registration statement or prospectus for purposes of Sections 11 or 12 of the Securities Act of 1933, as amended, are deemed not filed for purposes of Section 18 of the Securities and Exchange Act of 1934, as amended, and otherwise are not subject to liability under those sections.
|
|
†
|
Confidential treatment has been granted with respect to certain portions of this exhibit. Omitted portions have been filed separately with the Securities and Exchange Commission.
|
96
SIGNATURE
Pursuant to the requirements of the Securities Exchange Act of 1934, the registrant has duly caused this report to be signed on its behalf by the undersigned thereunto duly authorized.
MALIBU BOATS, INC.
|
September 24, 2014
|
/s/ Jack D. Springer
|
|
Jack D. Springer
|
|
|
Chief Executive Officer
(Principal Executive Officer)
|
|
|
September 24, 2014
|
/s/ Wayne R. Wilson
|
|
Wayne R. Wilson
|
|
|
Chief Financial Officer
(Principal Financial and Accounting Officer)
|
|
97
Pursuant to the requirements of the Securities Exchange Act of 1934, this report has been signed below by the following persons on behalf of the registrant and in the capacities and on the dates indicated:
|
Signature
|
Title
|
Date
|
||
|
/s/ Jack D. Springer
|
||||
|
Jack D. Springer
|
Chief Executive Officer and Director
(Principal Executive Officer)
|
September 24, 2014
|
||
|
/s/ Wayne R. Wilson
|
||||
|
Wayne R. Wilson
|
Chief Financial Officer
(Principal Financial and Accounting Officer)
|
September 24, 2014
|
||
|
/s/ Michael K. Hooks
|
||||
|
Michael K. Hooks
|
Chairman of the Board and Director
|
September 24, 2014
|
||
|
/s/ Mark W. Lanigan
|
||||
|
Mark W. Lanigan
|
Director
|
September 24, 2014
|
||
|
/s/ Phillip S. Estes
|
||||
|
Phillip S. Estes
|
Director
|
September 24, 2014
|
||
|
/s/ James R. Buch
|
||||
|
James R. Buch
|
Director
|
September 24, 2014
|
||
|
/s/ Ivar S. Chhina
|
||||
|
Ivar S. Chhina
|
Director
|
September 24, 2014
|
||
|
/s/ Michael J. Connolly
|
||||
|
Michael J. Connolly
|
Director
|
September 24, 2014
|
||
|
/s/ Peter E. Murphy
|
||||
|
Peter E. Murphy
|
Director
|
September 24, 2014
|
||
|
/s/ John E. Stokely
|
||||
|
John E. Stokely
|
Director
|
September 24, 2014
|
||
98
TABLE OF CONTENTS
Part IItem 1. BusinessItem 1A. Risk FactorsItem 1B. Unresolved Staff CommentsItem 2. PropertiesItem 3. Legal ProceedingsItem 4. Mine Safety DisclosuresPart IIItem 5. Market For Registrant's Common Equity, Related Stockholder Matters and Issuer Purchases Of Equity SecuritiesItem 6. Selected Financial DataItem 7. Management's Discussion and Analysis Of Financial Condition and Results Of OperationsItem 7A. Quantitative and Qualitative Disclosures About Market RiskItem 8. Financial Statements and Supplementary DataItem 9. Changes in and Disagreements with Accountants on Accounting and Financial DisclosureItem 9A. Controls and ProceduresItem 9B. Other InformationPart IIIItem 10. Directors, Executive Officers and Corporate GovernanceItem 11. Executive CompensationItem 12. Security Ownership Of Certain Beneficial Owners and Management and Related Stockholder MattersItem 13. Certain Relationships and Related Transactions, and Director IndependenceItem 14. Principal Accounting Fees and ServicesPart IVItem 15. Exhibits, Financial Statement Schedules