HOMESTREET, INC.
10-Ks and 10-Qs
|
|
|
|
|
|
|
|
|
|
|
|
|
|
|
|
|
|
|
|
|
|
|
|
|
|
|
|
|
|
|
|
|
|
|
|
|
|
UNITED STATES
SECURITIES AND EXCHANGE COMMISSION
WASHINGTON, D.C. 20549
____________________________
FORM 10-K
____________________________
(Mark One)
|
x
|
ANNUAL REPORT PURSUANT TO SECTION 13 OR 15(d) OF THE SECURITIES EXCHANGE ACT OF 1934
|
For the fiscal year ended December 31, 2014
OR
|
¨
|
TRANSITION REPORT PURSUANT TO SECTION 13 OR 15(d) OF THE SECURITIES EXCHANGE ACT OF 1934
|
For the transition period from to
Commission file number: 001-35424
____________________________
HOMESTREET, INC.
(Exact name of registrant as specified in its charter)
____________________________
|
Washington
|
|
91-0186600
|
|
(State or other jurisdiction of
incorporation or organization)
|
|
(I.R.S. Employer
Identification Number)
|
601 Union Street, Ste. 2000
Seattle, WA 98101
(Address of principal executive offices) (Zip Code)
Registrant’s telephone number, including area code: (206) 623-3050
Securities registered pursuant to Section 12(b) of the Act:
|
Title of each class
|
|
Name of each exchange on which registered
|
|
Common Stock, no par value
|
|
Nasdaq Stock Market LLC
|
Securities registered pursuant to Section 12(g) of the Act:
None.
____________________________
Indicate by check mark if the registrant is a well-known seasoned issuer, as defined in Rule 405 of the Securities Act. Yes
¨
No
x
Indicate by check mark if the registrant is not required to file reports pursuant to Section 13 or Section 15(d) of the Act. Yes
¨
No
x
Indicate by check mark whether the Registrant (1) has filed all reports required to be filed by Section 13 or 15(d) of the Securities Exchange Act of 1934 during the preceding 12 months (or for such shorter period that the Registrant was required to file such reports), and (2) has been subject to such filing requirements for the past 90 days. Yes
x
No
¨
Indicate by check mark if disclosure of delinquent filers pursuant to Item 405 of Regulation S-K is not contained herein, and will not be contained, to the best of the Registrant’s knowledge, in definitive proxy or information statements incorporated by reference in Part III of this Form 10-K or any amendment to this Form 10-K.
x
Indicate by check mark whether the registrant has submitted electronically and posted on its corporate Web site, if any, every Interactive Data File required to be submitted and posted pursuant to Rule 405 of Regulation S-T during the preceding 12 months (or for such shorter period that the registrant was required to submit and post such files). Yes
x
No
¨
Indicate by check mark whether the registrant is a large accelerated filer, an accelerated filer, or a non-accelerated filer, or a smaller reporting company. See the definitions of “large accelerated filer,” “accelerated filer” and “smaller reporting company” in Rule 12b-2 of the Exchange Act. (Check one):
|
Large accelerated filer
|
|
¨
|
Accelerated filer
|
|
x
|
|
Non-accelerated filer
|
|
¨
(Do not check if a smaller reporting company)
|
Smaller reporting company
|
|
¨
|
Indicate by check mark whether the registrant is a shell company (as defined in Rule 12b-2 of the Act). Yes
¨
No
x
As of June 30, 2014, the last business day of the registrant’s most recently completed second fiscal quarter, the aggregate market value of common stock held by non-affiliates was approximately
$173.8 million
, based on a closing price of $18.37 per share of common stock on the Nasdaq Global Select Market on such date. Shares of common stock held by each executive officer and director and by each person known to the Company who beneficially owns more than 5% of the outstanding common stock have been excluded in that such persons may under certain circumstances be deemed to be affiliates. This determination of executive officer or affiliate status is not necessarily a conclusive determination for other purposes.
The number of outstanding shares of the registrant’s common stock as of March 10, 2015 was
22,038,748
.
DOCUMENTS INCORPORATED BY REFERENCE
Certain information that will be contained in the definitive proxy statement for the registrant's annual meeting to be held in 2015 is incorporated by reference into Part III of this Form 10-K.
|
ITEM 1
|
||
|
ITEM 1A
|
||
|
ITEM 1B
|
||
|
ITEM 2
|
||
|
ITEM 3
|
||
|
ITEM 4
|
||
|
ITEM 5
|
||
|
ITEM 6
|
||
|
ITEM 7
|
||
|
ITEM 7A
|
||
|
ITEM 8
|
||
|
ITEM 9
|
||
|
ITEM 9A
|
||
|
ITEM 9B
|
||
|
ITEM 10
|
||
|
ITEM 11
|
||
|
ITEM 12
|
||
|
ITEM 13
|
||
|
ITEM 14
|
||
|
ITEM 15
|
||
|
CERTIFICATIONS
|
||
|
EXHIBIT 21
|
||
|
EXHIBIT 31.1
|
||
|
EXHIBIT 31.2
|
||
|
EXHIBIT 32
|
||
Unless we state otherwise or the content otherwise requires, references in this Form 10-K to “HomeStreet,” “we,” “our,” “us” or the “Company” refer collectively to HomeStreet, Inc., a Washington corporation, HomeStreet Bank (“Bank”), HomeStreet Capital Corporation (“HomeStreet Capital”) and other direct and indirect subsidiaries of HomeStreet, Inc.
2
FORWARD-LOOKING STATEMENTS
This Form 10-K and the documents incorporated by reference contain, in addition to historical information, “forward-looking statements” within the meaning of Section 27A of the Securities Act of 1933, as amended (the “Securities Act”) and Section 21E of the Securities Exchange Act of 1934, as amended (the “Exchange Act”). These statements relate to our future plans, objectives, expectations, intentions and financial performance, and assumptions that underlie these statements. All statements other than statements of historical fact are “forward-looking statements” for the purposes of these provisions. When used in this Form 10-K, terms such as “anticipates,” “believes,” “continue,” “could,” “estimates,” “expects,” “intends,” “may,” “plans,” “potential,” “predicts,” “should,” or “will” or the negative of those terms or other comparable terms are intended to identify such forward-looking statements. These statements involve known and unknown risks, uncertainties and other factors that may cause industry trends or actual results, level of activity, performance or achievements to be materially different from any future results, levels of activity, performance or achievements expressed or implied by these statements. Our actual results may differ significantly from the results discussed in such forward-looking statements, and we may take actions that differ from our current plans and expectations. The known risks that could cause our results to differ, or may cause us to take actions that are not currently planned or expected, are described in Item 1A, Risk Factors.
Unless required by law, we do not intend to update any of the forward-looking statements after the date of this Form 10-K to conform these statements to actual results or changes in our expectations. Readers are cautioned not to place undue reliance on these forward-looking statements, which apply only as of the date of this Form 10-K.
Except as otherwise noted, references to “we,” “our,” “us” or “the Company” refer to HomeStreet, Inc. and its subsidiaries that are consolidated for financial reporting purposes.
3
|
ITEM 1
|
BUSINESS
|
General
We are a diversified financial services company founded in
1921
and headquartered in Seattle, Washington, serving customers primarily in the Pacific Northwest, California and Hawaii. HomeStreet, Inc. (the "Company") is principally engaged in real estate lending, including mortgage banking activities, and commercial and consumer banking. Our primary subsidiaries are HomeStreet Bank (the "Bank") and HomeStreet Capital Corporation. The Bank is a Washington state-chartered savings bank that provides mortgage and commercial loans, deposit products and services, non-deposit investment products, private banking and cash management services. Our primary loan products include single family residential mortgages, loans secured by commercial real estate, construction loans for residential and commercial real estate projects, commercial business loans and agricultural loans. HomeStreet Capital Corporation, a Washington corporation, originates, sells and services multifamily mortgage loans under the Fannie Mae Delegated Underwriting and Servicing Program (“DUS"
®(1)
) in conjunction with HomeStreet Bank. Doing business as HomeStreet Insurance Agency, we provide insurance products and services for consumers and businesses. We also offer single family home loans through our partial ownership in an affiliated business arrangement with WMS Series LLC, whose businesses are known as Windermere Mortgage Services and Penrith Home Loans. At
December 31, 2014
, we had total assets of
$3.54 billion
.
We generate revenue by earning “net interest income” and “noninterest income.” Net interest income is primarily the difference between interest income earned on loans and investment securities less the interest we pay on deposits and other borrowings. We earn noninterest income from the origination, sale and servicing of loans and from fees earned on deposit services and investment and insurance sales.
At
December 31, 2014
, we had a network of
33
bank branches in the Puget Sound, Eastern and Southwest regions of Washington state, Portland, Oregon and Hawaii, as well as
55
stand-alone lending centers located in these same areas and additionally in California; Phoenix, Arizona; the Eugene and Salem regions of Oregon; and in the Boise and northern regions of Idaho. WMS Series LLC provides point-of-sale loan origination services at
42
Windermere Real Estate offices in Washington and Oregon. On March 1, 2015 we added
seven
bank branches in Southern California with the acquisition of Simplicity Bancorp, Inc. ("Simplicity") and its wholly owned subsidiary, Simplicity Bank.
We operate two business segments: Commercial and Consumer Banking and Mortgage Banking. For a discussion of operating results of these lines of business, see
"Business Segments"
within Management's Discussion and Analysis of this Form 10-K.
Commercial and Consumer Banking
. We provide diversified financial products and services to our commercial and consumer customers through bank branches and through ATMs, online, mobile and telephone banking. These products and services include deposit products; residential, consumer, business and agricultural portfolio loans; non-deposit investment products; insurance products and cash management services. We originate construction loans, bridge loans and permanent loans for our portfolio primarily on single family residences, and on office, retail, industrial and multifamily property types. We originate multifamily real estate loans through our Fannie Mae DUS business, whereby loans are sold to or securitized by Fannie Mae, while the Company generally retains the servicing rights. This segment is also responsible for the management of the Company's portfolio of investment securities.
Mortgage Banking.
We originate single family residential mortgage loans for sale in the secondary markets. We have become a rated originator and servicer of non-conforming jumbo loans, allowing us to sell these loans to other securitizers. We also purchase loans from WMS Series LLC through a correspondent arrangement with that company. The majority of our mortgage loans are sold to or securitized by Fannie Mae, Freddie Mac or Ginnie Mae, while we retain the right to service these loans. On occasion, we may sell a portion of our MSR portfolio. A small percentage of our loans are brokered to other lenders or sold on a servicing-released basis to correspondent lenders. We manage the loan funding and the interest rate risk associated with the secondary market loan sales and the retained single family mortgage servicing rights within this business segment.
Shares of our common stock are traded on the Nasdaq Global Select Market under the symbol “HMST.”
Acquisitions
On March 1, 2015, we completed our acquisition of Simplicity and its wholly owned subsidiary, Simplicity Bank.
On November 1, 2013, the Company completed its acquisitions of Fortune Bank (“Fortune”) and YNB Financial Services Corp. (“YNB”), the parent company of Yakima National Bank.
|
(1)
DUS® is a registered trademark of Fannie Mae.
|
4
|
|
On December 6, 2013, the Company acquired two retail deposit branches and certain related assets from AmericanWest Bank, a Washington state-chartered bank. The branches are located on Bainbridge Island and in West Seattle.
Recent Developments
On March 1, 2015, we completed our acquisition of Simplicity and its wholly owned subsidiary, Simplicity Bank, and issued
7,180,005
shares of our common stock as merger consideration to the former stockholders of Simplicity. The shares were issued pursuant to a permit to register shares granted by the California Department of Business Oversight following a fairness hearing by that office that determined that the merger was fair, just and equitable to Simplicity stockholders. Through the merger, HomeStreet acquired seven bank branches in Southern California. At
December 31, 2014
, Simplicity had assets of approximately
$863 million
and deposits of approximately
$656 million
. Simplicity’s principal business activities prior to the merger were attracting retail deposits from the general public, originating or purchasing loans, primarily loans secured by first mortgages on owner-occupied, one-to-four family residences and multi-family residences located in Southern California and, to a lesser extent, commercial real estate, automobile and other consumer loans; and mortgage banking consisting mostly of the origination and sale of fixed-rate, conforming, one-to-four family residential real estate loans in the secondary market, usually with servicing retained. We believe that we will be able to grow the business of the former Simplicity branches by offering additional banking and lending products to former Simplicity customers as well as new customers.
Business Strategy
During 2014, we made significant progress in building a strong foundation for growth and diversification. We grew our Commercial and Consumer Banking segment by expanding our business development capacity and geographic footprint through hiring additional loan officers, by opening three de novo bank branches and through the acquisition of Simplicity in California, which was completed in March 2015. In our Mortgage Banking segment, we continued to build on our heritage as a single family mortgage lender by increasing the number of mortgage lending offices within our current footprint, including significant growth in California, as well as expanding into Arizona, and by targeted hiring throughout our network of mortgage lending offices. We believe the mortgage industry is moving toward a higher ratio of purchase mortgage loans and away from the refinance mortgage loan trend that has dominated residential lending in recent years. Therefore, we have hired additional purchase-oriented lending officers in order to help mitigate the impact of the transition to a purchase mortgage market and reduction in refinancing activity.
We are pursuing the following strategies in our business segments:
Commercial and Consumer Banking.
Our Commercial and Consumer Banking strategy involves growth through expansion while improving operations and productivity to drive cost efficiencies. Through our acquisitions of Fortune and YNB in November 2013, we increased our portfolio of commercial business loans and added experienced commercial lending officers and managers. We increased our presence in the Puget Sound area through the Fortune acquisition and expanded into central and eastern Washington through our acquisition of YNB. In March 2015, we gained a foothold in retail banking in Southern California with our acquisition of Simplicity, acquiring 7 retail deposit branches in the Los Angeles area with a significant retail deposit customer base and increasing our portfolio of single family mortgage loans.
In the commercial real estate arena, we plan to expand our business, with a focus on multifamily mortgage origination, including through our Fannie Mae DUS origination and servicing relationships. We also plan to expand beyond our current markets by forming strategic alliances with multifamily property service providers inside and outside our existing lending areas. We expect to continue to benefit from being one of only 25 companies nationally that is an approved Fannie Mae DUS
seller and servicer. In addition, we have historically supported our DUS
program by providing new construction and short-term bridge loans to experienced borrowers who intend to build or purchase apartment buildings for renovation, which we then seek to replace with permanent financing upon completion of the projects. Through our recent acquisition of Simplicity, we also expect to grow our commercial real estate and residential construction lending in Southern California.
We also originate commercial construction real estate loans, bridge loans and permanent loans for our portfolio, primarily on office, retail, industrial and multifamily property types located within the Company's geographic footprint. We also may place loans with capital market sources, such as life insurance companies.
Our Commercial and Consumer Banking strategy also involves the expansion of our retail deposit branch network, primarily focusing on high-growth areas of Puget Sound and by gaining a foothold in teh California market, in order to build convenience and market share. In connection with this strategy, we opened
three
de novo retail deposit branches during
2014
and acquired
seven
bank branches in Southern California with the acquisition of Simplicity in 2015. We are also in the process of growing our consumer banking business in central and eastern Washington through our 2013 acquisition of YNB, which allowed us to
5
add four retail deposit branches in those regions. We intend to continue to add de novo retail deposit branches in new and existing markets. We seek to meet the financial needs of our consumer and business customers by providing targeted banking products and services, investment services and products, and insurance products through our bank branches and through dedicated investment advisors, insurance agents and business banking officers. We intend to grow our network of retail deposit branches and in turn grow our core deposits and increase business deposits from new cash management and business lending customers.
Mortgage Banking.
We have leveraged our reputation for high quality service and reliable loan closing to increase our single family mortgage market share significantly over the last four years. With the 2015 Simplicity acquisition, we expect to expand our existing Southern California single family mortgage origination footprint to attractive new sub-markets. We plan to continue to grow our business in the western U.S. through targeted hiring of loan originators with successful track records and an emphasis on purchase mortgage transactions. We intend to continue to focus on conventional conforming and government insured or guaranteed single family mortgage origination. We also expect to use portfolio lending to complement secondary market lending, particularly for well-qualified borrowers with loan sizes greater than the conventional conforming limits.
Market and Competition
The financial services industry is highly competitive. We compete with banks, savings and loan associations, credit unions, mortgage banking companies, insurance companies, finance companies, and investment and mutual fund companies. In particular, we compete with several financial institutions with greater resources, including the capacity to make larger loans, fund extensive advertising and offer a broader array of products and services. The number of competitors for middle-market business customers has, however, decreased in recent years due to bank failures and consolidations. At the same time, national banks have been focused on larger customers to achieve economies of scale in lending and depository relationships and have also consolidated business banking operations and support and reduced service levels in the Pacific Northwest. We have taken advantage of the failures and takeovers of certain of our competitors by recruiting well-qualified employees and attracting new customers who seek long-term stability, local decision-making, quality services, products and expertise. We believe there is a significant opportunity for a well-capitalized, community-focused bank that emphasizes responsive and personalized service to provide a full range of financial services to small- and middle-market commercial and consumer customers in those markets where we do business. During 2014, we expanded our home loan production into Arizona and opened additional home lending centers in Southern California. Through the 2015 acquisition of Simplicity, we continued to increase our presence in Southern California by adding consumer retail deposit branches and single family mortgage loan production personnel.
In addition, we believe we are well positioned to take advantage of changes in the single family mortgage origination and servicing industry that have helped to reduce the number of competitors. The mortgage industry is compliance-intensive and requires significant expertise and internal control systems to ensure mortgage loan origination and servicing providers meet all origination, processing, underwriting, servicing and disclosure requirements. These requirements are causing some competitors to exit the industry. New entrants must make significant investments in experienced personnel and specialized systems to manage the compliance process. These investments represent a significant barrier to entry. In addition, lending in conventional and government guaranteed or insured mortgage products, including Federal Housing Administration ("FHA") and Department of Veterans' Affairs ("VA") loans, requires significantly higher capitalization than had previously been required for mortgage brokers and non-bank mortgage companies.
Our single family mortgage origination and servicing business is highly dependent upon compliance with underwriting and servicing guidelines of Fannie Mae, Freddie Mac, FHA, VA and Ginnie Mae as well as a myriad of federal and state consumer compliance regulations. Our demonstrated expertise in these activities, together with our significant volume of lending in low- and moderate-income areas and direct community investment, contribute to our uninterrupted record of “Outstanding” Community Reinvestment Act (“CRA”) ratings since 1986. We believe our ability to maintain our historically strong compliance culture represents a significant competitive advantage.
Employees
As of
December 31, 2014
the Company employed
1,611
full-time equivalent employees, compared to
1,502
full-time equivalent employees at
December 31, 2013
.
Where You Can Obtain Additional Information
We file annual, quarterly, current and other reports with the Securities and Exchange Commission (the "SEC"). We make available free of charge on or through our website http://www.homestreet.com all of these reports (and all amendments thereto), as soon as reasonably practicable after we file these materials with the SEC. Please note that the contents of our website do not
6
constitute a part of our reports, and those contents are not incorporated by reference into this report or any of our other securities filings. You may review a copy of our reports, including exhibits and schedules filed therewith, and obtain copies of such materials at the SEC's Public Reference Room at 100 F Street, NE, Washington, D.C. 20549. You may obtain information on the operation of the Public Reference Room by calling the SEC at 1-800-SEC-0330. The SEC maintains a website (
http://www.sec.gov
) that contains reports, proxy and information statements and other information regarding registrants, such as HomeStreet, that file electronically with the SEC.
7
REGULATION AND SUPERVISION
The following is a brief description of certain laws and regulations that are applicable to us. The description of these laws and regulations, as well as descriptions of laws and regulations contained elsewhere in this annual report on Form 10-K, does not purport to be complete and is qualified in its entirety by reference to the applicable laws and regulations.
The bank regulatory framework to which we are subject is intended primarily for the protection of bank depositors and the Deposit Insurance Fund and not for the protection of shareholders or other security holders.
General
The Company is a savings and loan holding company and is regulated by the Board of Governors of the Federal Reserve System (the "Federal Reserve"), and the Washington State Department of Financial Institutions, Division of Banks (the "WDFI"). The Company is required to register and file reports with, and otherwise comply with, the rules and regulations of the Federal Reserve and the WDFI.
The Office of Thrift Supervision, or the OTS, previously was the Company's primary federal regulator. Under the Dodd-Frank Act, the OTS was dissolved on July 21, 2011 and its authority to supervise and regulate the Company and its non-bank subsidiaries was transferred to the Federal Reserve. References to the Federal Reserve in this document should be read to include the OTS prior to the date of the transfer with respect to those functions transferred to the Federal Reserve.
The Bank is a Washington state-chartered savings bank. The Bank is subject to regulation, examination and supervision by the WDFI and the Federal Deposit Insurance Corporation (the "FDIC").
As a result of the recent financial crisis, regulation of the financial services industry has been undergoing major changes. Among these is the Dodd-Frank Act, which makes significant modifications to and expansions of the rulemaking, supervisory and enforcement authority of the federal banking regulators. Some of the changes were effective immediately, but others are being phased in over time. The Dodd-Frank Act requires various regulators, including the banking regulators, to adopt numerous regulations, not all of which have been finalized. Accordingly, in certain instances, the precise requirements of the Dodd-Frank Act are not yet known.
Further, new statutes, regulations and guidance are considered regularly that could contain wide-ranging potential changes to the competitive landscape for financial institutions operating and doing business in the United States. We cannot predict whether or in what form any proposed statute, regulation or other guidance will be adopted or promulgated, or the extent to which our business may be affected. Any change in policies, whether by the Federal Reserve, the WDFI, the FDIC, the Washington legislature or the United States Congress, could have a material adverse impact on us and our operations and shareholders. In addition, the Federal Reserve, the WDFI and the FDIC have significant discretion in connection with their supervisory and enforcement activities and examination policies, including, among other things, policies with respect to the Bank's capital levels, the classification of assets and establishment of adequate loan loss reserves for regulatory purposes.
Our operations and earnings will be affected by domestic economic conditions and the monetary and fiscal policies of the United States government and its agencies. In addition to its role as the regulator of savings and loan holding companies, the Federal Reserve has, and is likely to continue to have, an important impact on the operating results of financial institutions through its power to implement national monetary and fiscal policy including, among other things, actions taken in order to curb inflation or combat a recession. The Federal Reserve affects the levels of bank loans, investments and deposits in various ways, including through its control over the issuance of United States government securities, its regulation of the discount rate applicable to member banks and its influence over reserve requirements to which banks are subject. In recent years, in response to the financial crisis, the Federal Reserve has created several innovative programs to stabilize certain financial institutions, to help ensure the availability of credit and to purchase financial assets through programs such as quantitative easing. Quantitative easing has had a significant impact on the market for mortgage-backed securities ("MBS") and by some accounts has stimulated the national economy. We believe these policies have had a beneficial effect on the Company and the mortgage banking industry as a whole. In late 2014, the Federal Reserve discontinued its quantitative easing program of purchasing financial assets. We cannot predict the effects of this discontinuance. In addition, we cannot predict the nature or impact of future changes in monetary and fiscal policies of the Federal Reserve.
8
Regulation of the Company
General
Because we have made an election under Section 10(1) of the Home Owners' Loan Act (“HOLA”) for the Bank to be treated as a “savings association” for purposes of Section 10 of HOLA, the Company is registered as a savings and loan holding company with the Federal Reserve and is subject to Federal Reserve regulations, examinations, supervision and reporting requirements relating to savings and loan holding companies. Among other things, the Federal Reserve is authorized to restrict or prohibit activities that are determined to be a serious risk to the financial safety, soundness or stability of a subsidiary savings bank. Unlike bank holding companies, savings and loan holding companies have not in the past been subject to any specific regulatory capital ratios, although they have been subject to review by the Federal Reserve and approval of capital levels as part of its examination process. However, as a result of the Dodd-Frank Act, beginning in 2015, the Company has become subject to capital requirements. Our continued ability to use the provisions of Section 10(1) of HOLA - which allow the Company to be registered as a savings and loan holding company rather than as a bank holding company - is conditioned upon the Bank's continued qualification as a lender under the Qualified Thrift Lender test set forth in HOLA. See “- Regulation and Supervision of HomeStreet Bank -
Qualified Thrift Lender Test
.” Since the Bank is chartered under Washington law, the WDFI has authority to regulate the Company generally relating to its conduct affecting the Bank. As a subsidiary of a savings and loan holding company, the Bank is subject to certain restrictions in its dealings with the Company and affiliates thereof.
Numerous provisions of the Dodd-Frank Act affect the Company and its business and operations. Some of the provisions are:
|
•
|
New capital requirements for savings and loan holding companies.
|
|
•
|
All holding companies of depository institutions are required to serve as a source of strength for their depository subsidiaries.
|
|
•
|
The Federal Reserve is given heightened authority to examine, regulate and take action with respect to all of a holding company's subsidiaries.
|
The Company is a unitary savings and loan holding company within the meaning of federal law. Generally, companies that become savings and loan holding companies following the May 4, 1999 grandfather date in the Gramm-Leach-Bliley Act of 1999 may engage only in the activities permitted for financial institution holding companies as well as activities that are permitted for multiple savings and loan holding companies. Because the Company became a savings and loan holding company prior to that grandfather date, the activities in which the Company and its subsidiaries (other than the Bank and its subsidiaries) may engage generally are not restricted by HOLA. If, however, we are acquired by a non-financial company, or if we acquire another savings association subsidiary (and become a multiple savings and loan holding company), we will terminate our “grandfathered” unitary savings and loan holding company status and become subject to certain limitations on the types of business activities in which we could engage. The Company may not engage in any activity or render any service for or on behalf of the Bank for the purpose of or with the effect of evading any law or regulation applicable to the Bank.
Because the Bank is treated as a savings association subsidiary of a savings and loan holding company, we must give the Federal Reserve at least 30 days' advance notice of the proposed declaration of a dividend by the Bank. In addition, the financial impact of a holding company on its subsidiary institution is a matter that is evaluated by the Federal Reserve, and the Federal Reserve has authority to order cessation of activities or divestiture of subsidiaries deemed to pose a threat to the safety and soundness of the Bank.
Capital / Source of Strength
Under the Dodd-Frank Act, capital requirements are now imposed on savings and loan holding companies such as the Company. See “Regulation and Supervision of HomeStreet Bank -
Capital and Prompt Corrective Action Requirements - Proposed Capital Regulations
.”
Regulations and historical practice of the Federal Reserve have required bank holding companies to serve as a “source of strength” for their subsidiary banks. The Dodd-Frank Act codifies this requirement and extends it to all companies that control an insured depository institution. Accordingly, the Company is now required to act as a source of strength for the Bank.
9
Restrictions Applicable to Savings and Loan Holding Companies
Federal law prohibits a savings and loan holding company, including the Company, directly or indirectly (or through one or more subsidiaries), from acquiring:
|
•
|
control (as defined under HOLA) of another savings institution (or a holding company parent) without prior written approval of the Federal Reserve;
|
|
•
|
through merger, consolidation or purchase of assets, another savings institution or a holding company thereof, or acquiring all or substantially all of the assets of such institution (or a holding company) without prior Federal Reserve or FDIC approval;
|
|
•
|
with certain exceptions, more than 5.0% of the voting shares of a non-subsidiary savings association or a non-subsidiary holding company; or
|
|
•
|
control of any depository institution not insured by the FDIC (except through a merger with and into the holding company's savings institution subsidiary that is approved by the FDIC).
|
In evaluating applications by holding companies to acquire savings associations, the Federal Reserve must consider the financial and managerial resources and future prospects of the company and institution involved, the effect of the acquisition on the risk to the insurance funds, the convenience and needs of the community and competitive factors.
A savings and loan holding company generally may not acquire as a separate subsidiary a savings association in a different state from where its current savings association is located, except:
|
•
|
in the case of certain emergency acquisitions approved by the FDIC;
|
|
•
|
if such holding company controls a savings association that operated a home or branch office in such additional state as of March 5, 1987; or
|
|
•
|
if the laws of the state in which the savings association to be acquired is located specifically authorize a savings association chartered by that state to be acquired by a savings institution chartered by the state where the acquiring savings association or savings and loan holding company is located, or by a holding company that controls such a state-chartered association.
|
Acquisition of Control
Under the federal Change in Bank Control Act, a notice must be submitted to the Federal Reserve if any person (including a company), or group acting in concert, seeks to acquire “control” of a savings and loan holding company. An acquisition of control can occur upon the acquisition of 10.0% or more of the voting stock of a savings and loan holding company or as otherwise defined by the Federal Reserve. Under the Change in Bank Control Act, the Federal Reserve has 60 days from the filing of a complete notice to act (the 60-day period may be extended), taking into consideration certain factors, including the financial and managerial resources of the acquirer and the antitrust effects of the acquisition. Control can also exist if an individual or company has, or exercises, directly or indirectly or by acting in concert with others, a controlling influence over the Bank. Washington law also imposes certain limitations on the ability of persons and entities to acquire control of banking institutions and their parent companies.
Dividend Policy
Under Washington law, the Company is generally permitted to make a distribution, including payments of dividends, only if, after giving effect to the distribution, in the judgment of the board of directors, (1) the Company would be able to pay its debts as they become due in the ordinary course of business and (2) the Company's total assets would at least equal the sum of its total liabilities plus the amount that would be needed if the Company were to be dissolved at the time of the distribution to satisfy the preferential rights upon dissolution of shareholders whose preferential rights are superior to those receiving the distribution.
The Company had previously elected to defer the payment of interest on its outstanding Trust Preferred Securities ("TruPS"), and therefore had been prohibited from declaring or paying dividends or distributions on, and from making liquidation payments with respect to, its common stock until it is current on all interest payments due. On March 12, 2013, the Federal Reserve approved the Company's request to make its interest payments current on its outstanding TruPS and the Company subsequently paid all deferred and current interest owed on its outstanding TruPS on March 15, 2013.
10
The Company's ability to pay dividends to shareholders is significantly dependent on the Bank's ability to pay dividends to the Company. New capital rules impose additional requirements on the ability of the Company and the Bank to pay dividends. See “Regulation of Home Street Bank -
Capital and Prompt Corrective Action Requirements - New Capital Rules
.”
Compensation Policies
Compensation policies and practices at HomeStreet, Inc. and HomeStreet Bank are subject to regulation by their respective banking regulators and the SEC.
Guidance on Sound Incentive Compensation Policies
. Effective on June 25, 2010, the Office of the Comptroller of the Currency, the Federal Reserve, the FDIC and the OTS adopted Sound Incentive Compensation Policies Final Guidance (the “Final Guidance”) designed to help ensure that incentive compensation policies at banking organizations do not encourage imprudent risk-taking and are consistent with the safety and soundness of the organization.
The Final Guidance applies to senior executives and others who are responsible for oversight of HomeStreet's company-wide activities and material business lines, as well as other employees who, either individually or as a part of a group, have the ability to expose the Bank to material amounts of risk.
Dodd-Frank Act
. In addition to the Final Guidance, the Dodd-Frank Act contains a number of provisions relating to compensation applying to public companies such as the Company. The Dodd-Frank Act added a new Section 14A(a) to the Exchange Act that requires companies to include a separate non-binding resolution subject to shareholder vote in their proxy materials approving the executive compensation disclosed in the materials. In addition, a new Section 14A(b) to the Exchange Act requires any proxy or consent solicitation materials for a meeting seeking shareholder approval of an acquisition, merger, consolidation or disposition of all or substantially all of the company's assets to include a separate non-binding shareholder resolution approving certain “golden parachute” payments made in connection with the transaction. A new Section 10D to the Exchange Act requires the SEC to direct the national securities exchanges to require companies to implement a policy to “claw back” certain executive payments that were made based on improper financial statements.
In addition, Section 956 of the Dodd-Frank Act requires certain regulators (including the FDIC, SEC and Federal Reserve) to adopt requirements or guidelines prohibiting excessive compensation or compensation that could lead to material loss as well as rules relating to disclosure of compensation. On April 14, 2011, these regulators published a joint proposed rulemaking to implement Section 956 of Dodd-Frank for depository institutions, their holding companies and various other financial institutions with $1 billion or more in assets. Section 956 prohibits incentive-based compensation arrangements which encourage inappropriate risk taking by covered financial institutions and are deemed to be excessive, or that may lead to material losses. The proposed rule would (1) prohibit incentive-based compensation arrangements for covered persons that would encourage inappropriate risks by providing excess compensation, (2) prohibit incentive-based compensation arrangements for covered persons that would expose the institution to inappropriate risks by providing compensation that could lead to a material financial loss, (3) require policies and procedures for incentive-based compensation arrangements that are commensurate with the size and complexity of the institutions and (4) require annual reports on incentive compensation structures to the institution's appropriate federal regulator.
FDIC Regulations
. We are further restricted in our ability to make certain “golden parachute” and “indemnification” payments under Part 359 of the FDIC regulations, and the FDIC also regulates payments to executives under Part 364 of its regulations relating to excessive executive compensation.
Emerging Growth Company
We are an “Emerging Growth Company,” as defined in the Jumpstart Our Business Startups Act (the “JOBS Act”), and are eligible to take advantage of certain exemptions from various reporting requirements that are applicable to other public companies that are not Emerging Growth Companies. These include, but are not limited to, not being required to comply with the auditor attestation requirements of Section 404 of the Sarbanes-Oxley Act of 2002, reduced disclosure obligations regarding executive compensation in our periodic reports and proxy statements, and exemptions from certain requirements under the Dodd-Frank Act, including the requirement to hold a non-binding advisory vote on executive compensation and the requirement to obtain stockholder approval of any golden parachute payments not previously approved. We currently intend to take advantage of some or all of these reporting exemptions until we no longer qualify as an Emerging Growth Company.
We will remain an Emerging Growth Company for up to five years from the end of the year of our initial public offering, or until (1) we have total annual gross revenues of at least $1 billion, (2) we qualify as a large accelerated filer, or (3) we issue more than $1 billion in nonconvertible debt in a three-year period.
11
Regulation and Supervision of HomeStreet Bank
General
As a savings bank chartered under the laws of the State of Washington, HomeStreet Bank is subject to applicable provisions of Washington law and regulations of the WDFI. As a state-chartered savings bank that is not a member of the Federal Reserve System, the Bank's primary federal regulator is the FDIC. It is subject to regulation and examination by the WDFI and the FDIC, as well as enforcement actions initiated by the WDFI and the FDIC, and its deposits are insured by the FDIC.
Washington Banking Regulation
As a Washington savings bank, the Bank's operations and activities are substantially regulated by Washington law and regulations, which govern, among other things, the Bank's ability to take deposits and pay interest, to make loans on or invest in residential and other real estate, to make consumer and commercial loans, to invest in securities, to offer various banking services to its customers and to establish branch offices. Under state law, savings banks in Washington also generally have, subject to certain limitations or approvals, all of the powers that Washington chartered commercial banks have under Washington law and that federal savings banks and national banks have under federal laws and regulations.
Washington law also governs numerous corporate activities relating to the Bank, including the Bank's ability to pay dividends, to engage in merger activities and to amend its articles of incorporation, as well as limitations on change of control of the Bank. Under Washington law, the board of directors of the Bank generally may not declare a cash dividend on its capital stock if payment of such dividend would cause its net worth to be reduced below the net worth requirements, if any, imposed by the WDFI and dividends may not be paid in an amount greater than its retained earnings without the approval of the WDFI. These restrictions are in addition to restrictions imposed by federal law. Mergers involving the Bank and sales or acquisitions of its branches are generally subject to the approval of the WDFI. No person or entity may acquire control of the Bank until 30 days after filing an application with the WDFI, who has the authority to disapprove the application. Washington law defines “control” of an entity to mean directly or indirectly, alone or in concert with others, to own, control or hold the power to vote 25.0% or more of the outstanding stock or voting power of the entity. Any amendment to the Bank's articles of incorporation requires the approval of the WDFI.
The Bank is subject to periodic examination by and reporting requirements of the WDFI, as well as enforcement actions initiated by the WDFI. The WDFI's enforcement powers include the issuance of orders compelling or restricting conduct by the Bank and the authority to bring actions to remove the Bank's directors, officers and employees. The WDFI has authority to place the Bank under supervisory direction or to take possession of the Bank and to appoint the FDIC as receiver.
Dodd-Frank Act
Numerous provisions of the Dodd-Frank Act affect the Bank and its business and operations. For example, the Dodd-Frank Act broadened the base for FDIC insurance assessments. Assessments are now based on the average consolidated total assets less tangible equity capital of a financial institution. The Dodd-Frank Act also permanently increased the maximum amount of deposit insurance for banks, savings institutions and credit unions to $250,000 per depositor.
In addition, under the Dodd-Frank Act:
|
•
|
The requirements relating to the Bank's capital have been modified.
|
|
•
|
In order to prevent abusive residential lending practices, new responsibilities are imposed on parties engaged in residential mortgage origination, brokerage and lending, and securitizers of mortgages and other asset-backed securities ("ABS") are required, subject to certain exemptions, to retain not less than five percent of the credit risk of the mortgages or other assets backing the securities.
|
|
•
|
Restrictions on affiliate and insider transactions are expanded.
|
|
•
|
Restrictions on management compensation and related governance have been enhanced.
|
|
•
|
A federal Consumer Financial Protection Bureau ("CFPB") is created with a broad authority to regulate consumer financial products and services.
|
|
•
|
Restrictions are imposed on the amount of interchange fees that certain debit card issuers may charge.
|
|
•
|
Restrictions on banking entities from engaging in proprietary trading or owning interests in or sponsoring hedge funds or private equity funds (the Volcker Rule).
|
In part because not all of the regulations implementing the Dodd-Frank Act have yet been finalized, it is difficult to completely predict at this time what specific impact the Dodd-Frank Act and the final rules and regulations will have on community banks.
12
However, it is expected that at a minimum they will increase our operating and compliance costs and could increase our interest expense. Any additional changes in our regulation and oversight, whether in the form of new laws, rules and regulations, could make compliance more difficult or expensive or otherwise materially adversely affect our business, financial condition or prospects. The provisions of the Dodd-Frank Act and the subsequent exercise by regulators of their revised and expanded powers thereunder could materially and negatively impact the profitability of our business, the value of assets we hold or the collateral available for our loans, require changes to business practices or force us to discontinue businesses and expose us to additional costs, taxes, liabilities, enforcement actions and reputational risk.
Insurance of Deposit Accounts and Regulation by the FDIC
The FDIC is the Bank's principal federal bank regulator. As such, the FDIC is authorized to conduct examinations of and to require reporting by the Bank. The FDIC may prohibit the Bank from engaging in any activity determined by law, regulation or order to pose a serious risk to the institution, and may take a variety of enforcement actions in the event the Bank violates a law, regulation or order, engages in an unsafe or unsound practice or under certain other circumstances. The FDIC also has the authority to appoint itself as receiver of the Bank or to terminate the Bank's deposit insurance if it were to determine that the Bank has engaged in unsafe or unsound practices or is in an unsafe or unsound condition.
The Bank is a member of the Deposit Insurance Fund (“DIF”) administered by the FDIC, which insures customer deposit accounts. Under the Dodd-Frank Act, the amount of federal deposit insurance coverage was permanently increased from $100,000 to $250,000, per depositor, for each account ownership category at each depository institution. This change made permanent the coverage increases that had been in effect since October 2008. The unlimited FDIC insurance for non-interest bearing transaction accounts that had been available since 2008 was discontinued as of December 31, 2012.
In order to maintain the DIF, member institutions, such as the Bank, are assessed insurance premiums. The Dodd-Frank Act required the FDIC to make numerous changes to the DIF and the manner in which assessments are calculated. The minimum ratio of assets in the DIF to the total of estimated insured deposits was increased from 1.15% to 1.35%, and the FDIC is given until September 30, 2020 to meet the reserve ratio. In December 2010, the FDIC adopted a final rule setting the reserve ratio of the DIF at 2.0%. As required by the Dodd-Frank Act, assessments are now based on an insured institution's average consolidated assets less tangible equity capital.
For the purpose of determining an institution's assessment rate, each institution is provided an assessment risk assignment, which is generally based on the risk that the institution presents to the DIF. Insured institutions with assets of less than $10 billion are placed in one of four risk categories. These risk categories are generally determined based on an institution's capital levels and its supervisory evaluation. These institutions generally have an assessment rate that can range from 2.5 to 45 basis points. However, the FDIC does have flexibility to adopt assessment rates without additional rule-making provided that the total base assessment rate increase or decrease does not exceed 2 basis points. In the future, if the reserve ratio reaches certain levels, these assessment rates will generally be lowered. As of December 31, 2014, the Bank's assessment rate was
7
basis points on average assets less average tangible equity capital.
In addition, all FDIC-insured institutions are required to pay a pro rata portion of the interest due on obligations issued by the Financing Corporation to fund the closing and disposal of failed thrift institutions by the Resolution Trust Corporation. The Financing Corporation rate is adjusted quarterly to reflect changes in assessment bases of the DIF. These assessments will continue until the Financing Corporation bonds mature in 2019. The annual rate for the first quarter of 2015 is 0.60 basis points.
Qualified Thrift Lender Test
A savings association can comply with the Qualified Thrift Lender test either by meeting the Qualified Thrift Lender test set forth in the HOLA and its implementing regulations or by qualifying as a domestic building and loan association as defined in Section 7701(a)(19) of the Internal Revenue Code of 1986 and implementing regulations.
To qualify under the HOLA test, the Bank is required to maintain at least 65% of its “portfolio assets” in “qualified thrift investments” in at least nine months of the most recent 12-month period. “Portfolio assets” are total assets less (1) specified liquid assets up to 20% of total assets, (2) intangibles, including goodwill, and (3) the value of the property used to conduct business. “Qualified thrift investments” primarily consists of residential mortgages and related investments, including certain MBS, home equity loans, credit card loans, student loans and small business loans.
To qualify under the Internal Revenue Code test, a savings association must meet both a “business operations” test and a “60% of assets” test. The business operations test requires the business of a savings association to consist primarily of acquiring the savings of the public and investing in loans. The 60% of assets test requires that at least 60% of a savings association's assets
13
must consist of residential real property loans and certain other traditional thrift assets. While the Bank is eligible to qualify as a qualified thrift lender under the HOLA test, it is not clear due to statutory ambiguities that the Bank is eligible to qualify under the Internal Revenue Code test. As noted above, it is necessary for the Bank to qualify as a qualified thrift lender only under one of these two tests.
As of
December 31, 2014
, the Bank held approximately
99.7%
of its portfolio assets in qualified thrift investments and had
$2.88 billion
of its portfolio assets in qualified thrift investments for each of the 12 months ending
December 31, 2014
. Therefore, the Bank qualified under the HOLA test. A savings association subsidiary of a savings and loan holding company that does not meet the Qualified Thrift Lender test must comply with the following restrictions on its operations:
|
•
|
the association may not engage in any new activity or make any new investment, directly or indirectly, unless the activity or investment is also permissible for a national bank;
|
|
•
|
the branching powers of the association are restricted to those of a national bank located in the association's home state; and
|
|
•
|
payment of dividends by the association is subject to the rules regarding payment of dividends by a national bank and must be necessary for its parent company to meet its obligations and must receive regulatory approval.
|
Further, an institution which fails to comply with the qualified thrift lender test is also subject to possible agency enforcement action as a violation of law under the HOLA. In addition, if the institution does not requalify under HOLA test within three years after failing the test, the institution would be prohibited from engaging in any activity not permissible for a national bank and would have to repay any outstanding advances from the FHLB as promptly as possible. Within one year of the date that a savings association ceases to meet the Qualified Thrift Lender test, any company that controls the association must register as and be deemed to be a bank holding company subject to all of the provisions of the Bank Holding Company Act of 1956 and other statutes applicable to bank holding companies. There are certain limited exceptions to these requirements.
Capital and Prompt Corrective Action Requirements
Capital Requirements
Federally insured depository institutions, such as the Bank, are required to maintain minimum levels of regulatory capital. Prior to 2015, the FDIC regulations have recognized two types, or tiers, of capital: “core capital,” or Tier 1 capital, and “supplementary capital,” or Tier 2 capital. “Total capital” generally means the sum of Tier 1 capital and Tier 2 capital. Tier 1 capital generally includes common shareholders' equity and noncumulative perpetual preferred stock, less most intangible assets. Tier 2 capital, which is recognized up to 100% of Tier 1 capital for risk-based capital purposes (after any deductions for disallowed intangibles and disallowed deferred tax assets), includes such items as qualifying general loan loss reserves (up to 1.25% of risk-weighted assets), cumulative perpetual preferred stock, long-term preferred stock (original maturity of at least 20 years), certain perpetual preferred stock, hybrid capital instruments including mandatory convertible debt, term subordinated debt, intermediate-term preferred stock (original average maturity of at least five years) and net unrealized holding gains on equity securities (subject to certain limitations); provided, however, the amount of term subordinated debt and intermediate term preferred stock that may be included in Tier 2 capital for risk-based capital purposes is limited to 50.0% of Tier 1 capital.
Prior to 2015, the FDIC had measured a bank's capital using the (1) total risk-based capital ratio, (2) Tier 1 risk-based capital ratio and (3) Tier 1 capital leverage ratio. The risk-based measures are based on ratios of qualifying capital to risk-weighted assets. To determine risk-weighted assets, assets are placed in one of five categories and given a percentage weight based on the relative risk of that category. In addition, certain off-balance-sheet items are converted to balance-sheet credit equivalent amounts, and each amount is then assigned to one of the five categories. In evaluating the adequacy of a bank's capital, the FDIC may also consider other factors that may affect the bank's financial condition, such as interest rate risk exposure, liquidity, funding and market risks, the quality and level of earnings, concentration of credit risk, risks arising from nontraditional activities, loan and investment quality, the effectiveness of loan and investment policies, and management's ability to monitor and control financial operating risks. Under these capital rules, banks are required to have a total risk-based capital ratio of at least 8.00%, a Tier 1 risk-based capital ratio of at least 4.00% and Tier 1 capital leverage ratio generally of at least 4.00%.
In July 2013, federal banking regulators (including the FDIC and the FRB) adopted new capital rules (the “Rules”). The Rules apply to both depository institutions (such as the Bank) and their holding companies (such as the Company). The Rules reflect, in part, certain standards initially adopted by the Basel Committee on Banking Supervision in December 2010 (which standards are commonly referred to as “Basel III”) as well as requirements contemplated by the Dodd-Frank Act.
14
The Rules apply to both the Company and the Bank beginning in 2015. In addition to the existing capital ratios, the Rules implement a new capital ratio of common equity Tier 1 capital to risk-based assets. Common equity Tier 1 capital generally consists of retained earnings and common stock instruments (subject to certain adjustments), as well as accumulated other comprehensive income (“AOCI”) except to the extent that the Company and the Bank exercise a one-time irrevocable option to exclude certain components of AOCI. Both the Company and the Bank expect to elect this one-time option in 2015 to exclude certain components of AOCI. Both the Company and the Bank are required to have a common equity Tier 1 capital ratio of 4.5% as well as a Tier 1 leverage ratio of 4.0%, a Tier 1 risk-based ratio of 6.0% and a total risk-based ratio of 8.0%. In addition to the preceding requirements, both the Company and the Bank are required to establish a “conservation buffer,” consisting of common equity Tier 1 capital, which is at least 2.5% above each of the preceding common equity Tier 1 capital ratio, the Tier 1 risk-based ratio and the total risk-based ratio. An institution that does not meet the conservation buffer will be subject to restrictions on certain activities including payment of dividends, stock repurchases and discretionary bonuses to executive officers.
The Rules modify the manner in which certain capital elements are determined, including but not limited to, requiring certain deductions related to mortgage servicing rights and deferred tax assets. When the federal banking regulators initially proposed new capital rules in 2012, the rules would have phased out trust preferred securities as a component of Tier 1 capital. As finally adopted, however, the Rules permit holding companies with less than $15 billion in total assets as of December 31, 2009 (which includes the Company) to continue to include trust preferred securities issued prior to May 19, 2010 in Tier 1 capital, generally up to 25% of other Tier 1 capital.
The Rules make changes in the methods of calculating certain risk-based assets, which in turn affects the calculation of risk- based ratios. Higher or more sensitive risk weights are assigned to various categories of assets, among which are commercial real estate, credit facilities that finance the acquisition, development or construction of real property, certain exposures or credits that are 90 days past due or are nonaccrual, foreign exposures, certain corporate exposures, securitization exposures, equity exposures and in certain cases mortgage servicing rights and deferred tax assets.
Both the Company and the Bank are generally required to begin compliance with the Rules on January 1, 2015. The conservation buffer will be phased in beginning in 2016 and will take full effect on January 1, 2019. Certain calculations under the Rules will also have phase-in periods. We believe that the current capital levels of the Company and the Bank are in compliance with the standards under the Rules including the conservation buffer.
Prompt Corrective Action Regulations
Section 38 of the Federal Deposit Insurance Act establishes a framework of supervisory actions for insured depository institutions that are not adequately capitalized, also known as “prompt corrective action” regulations. All of the federal banking agencies have promulgated substantially similar regulations to implement a system of prompt corrective action. These regulations apply to the Bank but not the Company. The framework establishes five capital categories; prior to 2015, a bank was:
|
•
|
“well capitalized” if it had a total risk-based capital ratio of 10.0% or more, a Tier 1 risk-based capital ratio of 6.0% or more, and a leverage capital ratio of 5.0% or more, and was not subject to any written agreement, order or capital directive to meet and maintain a specific capital level for any capital measure;
|
|
•
|
“adequately capitalized” if it had a total risk-based capital ratio of 8.0% or more, a Tier 1 risk-based capital ratio of 4.0% or more, and a leverage capital ratio of 4.0% or more;
|
|
•
|
“undercapitalized” if it had a total risk-based capital ratio less than 8.0%, a Tier 1 risk-based capital ratio less than 4.0%, or a leverage capital ratio less than 4.0%;
|
|
•
|
“significantly undercapitalized” if it had a total risk-based capital ratio less than 6.0%, a Tier 1 risk-based capital ratio less than 3.0%, or a leverage capital ratio less than 3.0%; and
|
|
•
|
“critically undercapitalized” if it had a ratio of tangible equity to total assets equal to or less than 2.0%.
|
The Rules adopted by the banking regulators in July 2013 modified the prompt corrective action regulations by increasing some of the requirements for the capital categories and by adding a requirement for the common equity Tier 1 risk-based capital ratio. Accordingly, beginning in 2015, a bank is:
|
•
|
“well capitalized” if it has a total risk-based capital ratio of 10.0% or more, a Tier 1 risk-based capital ratio of 8.0% or more, a common equity Tier 1 risk-based ratio of 6.5% or more, and a leverage capital ratio of 5.0% or more, and is not subject to any written agreement, order or capital directive to meet and maintain a specific capital level for any capital measure;
|
15
|
•
|
“adequately capitalized” if it has a total risk-based capital ratio of 8.0% or more, a Tier 1 risk-based capital ratio of 6.0% or more, a common equity Tier 1 risk-based ratio of 4.5% or more, and a leverage capital ratio of 4.0% or more;
|
|
•
|
“undercapitalized” if it has a total risk-based capital ratio less than 8.0%, a Tier 1 risk-based capital ratio less than 6.0%, a common equity risk-based ratio less than 4.5% or a leverage capital ratio less than 4.0%;
|
|
•
|
“significantly undercapitalized” if it has a total risk-based capital ratio less than 6.0%, a Tier 1 risk-based capital ratio less than 4.0%, a common equity risk-based ratio less than 3.0% or a leverage capital ratio less than 3.0%; and
|
|
•
|
“critically undercapitalized” if it has a ratio of tangible equity to total assets that is equal to or less than 2.0%.
|
A bank that, based upon its capital levels, is classified as “well capitalized,” “adequately capitalized” or “undercapitalized” may be treated as though it were in the next lower capital category if the appropriate federal banking agency, after notice and opportunity for a hearing, determines that an unsafe or unsound condition, or an unsafe or unsound practice, warrants such treatment.
At each successive lower capital category, an insured bank is subject to increasingly severe supervisory actions. These actions include, but are not limited to, restrictions on asset growth, interest rates paid on deposits, branching, allowable transactions with affiliates, ability to pay bonuses and raises to senior executives and pursuing new lines of business. Additionally, all “undercapitalized” banks are required to implement capital restoration plans to restore capital to at least the “adequately capitalized” level, and the FDIC is generally required to close “critically undercapitalized” banks within a 90-day period.
Limitations on Transactions with Affiliates
Transactions between the Bank and any affiliate are governed by Sections 23A and 23B of the Federal Reserve Act. An affiliate of the Bank is any company or entity which controls, is controlled by or is under common control with the Bank but which is not a subsidiary of the Bank. The Company and its non-bank subsidiaries are affiliates of the Bank. Generally, Section 23A limits the extent to which the Bank or its subsidiaries may engage in “covered transactions” with any one affiliate to an amount equal to 10.0% of the Bank's capital stock and surplus, and imposes an aggregate limit on all such transactions with all affiliates in an amount equal to 20.0% of such capital stock and surplus. Section 23B applies to “covered transactions” as well as certain other transactions and requires that all transactions be on terms substantially the same, or at least as favorable to the Bank, as those provided to a non-affiliate. The term “covered transaction” includes the making of loans to an affiliate, the purchase of or investment in the securities issued by an affiliate, the purchase of assets from an affiliate, the acceptance of securities issued by an affiliate as collateral security for a loan or extension of credit to any person or company, the issuance of a guarantee, acceptance or letter of credit on behalf of an affiliate, or certain transactions with an affiliate that involves the borrowing or lending of securities and certain derivative transactions with an affiliate.
In addition, Sections 22(g) and (h) of the Federal Reserve Act place restrictions on loans, derivatives, repurchase agreements and securities lending to executive officers, directors and principal shareholders of the Bank and its affiliates.
Standards for Safety and Soundness
The federal banking regulatory agencies have prescribed, by regulation, a set of guidelines for all insured depository institutions prescribing safety and soundness standards. These guidelines establish general standards for internal controls, information systems, internal audit systems, loan documentation, credit underwriting, interest rate risk exposure, asset growth, asset quality, earnings standards, compensation, fees and benefits. In general, the guidelines require appropriate systems and practices to identify and manage the risks and exposures specified in the guidelines before capital becomes impaired. The guidelines prohibit excessive compensation as an unsafe and unsound practice and describe compensation as excessive when the amounts paid are unreasonable or disproportionate to the services performed by an executive officer, employee, director, or principal shareholder.
Each insured depository institution must implement a comprehensive written information security program that includes administrative, technical and physical safeguards appropriate to the institution's size and complexity and the nature and scope of its activities. The information security program also must be designed to ensure the security and confidentiality of customer information, protect against any unanticipated threats or hazards to the security or integrity of such information, protect against unauthorized access to or use of such information that could result in substantial harm or inconvenience to any customer and ensure the proper disposal of customer and consumer information. Each insured depository institution must also develop and implement a risk-based response program to address incidents of unauthorized access to customer information in customer information systems. If the FDIC determines that the Bank fails to meet any standard prescribed by the guidelines, it may
16
require the Bank to submit an acceptable plan to achieve compliance with the standard. The Bank maintains a program to meet the information security requirements and believes it is currently in compliance with this regulation.
Real Estate Lending Standards
FDIC regulations require the Bank to adopt and maintain written policies that establish appropriate limits and standards for real estate loans. These standards, which must be consistent with safe and sound banking practices, must establish loan portfolio diversification standards, prudent underwriting standards (including loan-to-value ratio limits) that are clear and measurable, loan administration procedures and documentation, approval and reporting requirements. The Bank is obligated to monitor conditions in its real estate markets to ensure that its standards continue to be appropriate for current market conditions. The Bank's board of directors is required to review and approve the Bank's standards at least annually.
The FDIC has published guidelines for compliance with these regulations, including supervisory limitations on loan-to-value ratios for different categories of real estate loans. Under the guidelines, the aggregate amount of all loans in excess of the supervisory loan-to-value ratios should not exceed 100.0% of total capital, and the total of all loans for commercial, agricultural, multifamily or other non-one-to-four family residential properties in excess of such ratios should not exceed 30.0% of total capital. Loans in excess of the supervisory loan-to-value ratio limitations must be identified in the Bank's records and reported at least quarterly to the Bank's board of directors.
The FDIC and the federal banking agencies have also issued guidance on sound risk management practices for concentrations in commercial real estate lending. The particular focus is on exposure to commercial real estate loans that are dependent on the cash flow from the real estate held as collateral and that are likely to be sensitive to conditions in the commercial real estate market (as opposed to real estate collateral held as a secondary source of repayment or as an abundance of caution). The purpose of the guidance is not to limit a bank's commercial real estate lending but to guide banks in developing risk management practices and capital levels commensurate with the level and nature of real estate concentrations.
Risk Retention
The Dodd-Frank Act requires that, subject to certain exemptions, securitizers of mortgage and other asset-backed securities retain not less than five percent of the credit risk of the mortgages or other assets and that the securitizer not hedge or otherwise transfer the risk it is required to retain. In December 2014, the federal banking regulators, together with the SEC, the Federal Housing Finance Agency and the Department of Housing and Urban Development, published a final rule implementing this requirement. Generally, the final rule provides various ways in which the retention of risk requirement can be satisfied and also describes exemptions from the retention requirements for various types of assets, including mortgages. Compliance with the final rule with respect to residential mortgage securitizations is required beginning in December 2015 and in December 2016 for all other securitizations.
Volcker Rule
In December 2013, the FDIC, the FRB and various other federal agencies issued final rules to implement certain provisions of the Dodd-Frank Act commonly known as the “Volcker Rule.” Subject to certain exceptions, the final rules generally prohibit banks and affiliated companies from engaging in short-term proprietary trading of certain securities, derivatives, commodity futures and options on those instruments, for their own account. The final rules also impose restrictions on banks and their affiliates from acquiring or retaining an ownership interest in, sponsoring or having certain other relationships with hedge funds or private equity funds. Compliance with the rule will be required by July 21, 2015.
Activities and Investments of Insured State-Chartered Financial Institutions
Federal law generally prohibits FDIC-insured state banks from engaging as a principal in activities, and from making equity investments, other than those that are permissible for national banks. An insured state bank is not prohibited from, among other things, (1) acquiring or retaining a majority interest in certain subsidiaries, (2) investing as a limited partner in a partnership the sole purpose of which is direct or indirect investment in the acquisition, rehabilitation or new construction of a qualified housing project, provided that such limited partnership investments may not exceed 2.0% of the bank's total assets, (3) acquiring up to 10.0% of the voting stock of a company that solely provides or reinsures directors', trustees' and officers' liability insurance coverage or bankers' blanket bond group insurance coverage for insured depository institutions and (4) acquiring or retaining the voting shares of a depository institution if certain requirements are met.
Washington State has enacted a law regarding financial institution parity. The law generally provides that Washington-chartered savings banks may exercise any of the powers of Washington-chartered commercial banks, national banks or federally-chartered savings banks, subject to the approval of the Director of the WDFI in certain situations.
17
Environmental Issues Associated With Real Estate Lending
The Comprehensive Environmental Response, Compensation and Liability Act, or the CERCLA, is a federal statute that generally imposes strict liability on all prior and present “owners and operators” of sites containing hazardous waste. However, Congress has acted to protect secured creditors by providing that the term “owner and operator” excludes a person whose ownership is limited to protecting its security interest in the site. Since the enactment of the CERCLA, this “secured creditor” exemption has been the subject of judicial interpretations which have left open the possibility that lenders could be liable for cleanup costs on contaminated property that they hold as collateral for a loan. To the extent that legal uncertainty exists in this area, all creditors, including the Bank, that have made loans secured by properties with potential hazardous waste contamination (such as petroleum contamination) could be subject to liability for cleanup costs, which costs often substantially exceed the value of the collateral property.
Reserve Requirements
The Bank is subject to Federal Reserve regulations pursuant to which depositary institutions may be required to maintain non-interest-earning reserves against their deposit accounts and certain other liabilities. Currently, reserves must be maintained against transaction accounts (primarily negotiable order of withdrawal and regular checking accounts). The regulations generally required that in 2014 reserves be maintained in the amount of 3.0% of the aggregate of transaction accounts over $13.3 million up to $89.0 million and 10% of the accounts over $89.0 million. Net transaction accounts up to $13.3 million were exempt from reserve requirements. The regulations generally require that reserves be maintained in the amount of 3.0% of the aggregate of transaction accounts over $14.5 million up to $103.6 million in 2015 and 10% of the accounts over $103.6 million. Net transaction accounts up to $14.5 million are exempt from reserve requirements.
Federal Home Loan Bank System
The Federal Home Loan Bank system consists of twelve regional Federal Home Loan Banks. Among other benefits, each of these serves as a reserve or central bank for its members within its assigned region. Each of the Federal Home Loan Banks makes available loans or advances to its members in compliance with the policies and procedures established by its board of directors. The Bank is a member of the Federal Home Loan Bank of Seattle ("FHLB"). As a member, the Bank is required to own stock in the FHLB and currently owns
$33.9 million
of stock in the FHLB. The Federal Housing Finance Agency (the “Finance Agency”) is the primary regulator of the FHLB, and in August 2009 the Finance Agency classified the FHLB as undercapitalized. In October 2010, the FHLB entered into a Stipulation and Consent to The Issuance of a Consent Order with the Finance Agency, which sets forth requirements for capital management, asset composition and other operating and risk management improvements. In September 2012, the Finance Agency reclassified the FHLB as adequately capitalized but the FHLB remained subject to the Consent Order. On November 22, 2013, the Finance Agency issued an amended Consent Order, which modifies and supersedes the October 2010 Consent Order. The amended Consent Order acknowledges the FHLB’s fulfillment of many of the requirements set forth in the 2010 Consent Order and improvements in the FHLB’s financial performance, while continuing to impose certain restrictions on its ability to repurchase, redeem, and pay dividends on its capital stock. As such, Finance Agency approval or non-objection will continue to be required for all repurchases, redemptions, and dividend payments on FHLB capital stock.
In September 2014, the FHLB entered into a merger agreement with the Federal Home Loan Bank of Des Moines (the “Des Moines Bank”). If the merger agreement is consummated, the FHLB will merge with and into the Des Moines Bank, with the Des Moines Bank being the surviving entity. As a result, the Bank will become a member of the Des Moines Bank and its shares of FHLB stock will be converted into shares of stock of the Des Moines Bank.
Community Reinvestment Act of 1977
Banks are subject to the provisions of the CRA of 1977, which requires the appropriate federal bank regulatory agency to assess a bank's record in meeting the credit needs of the assessment areas serviced by the bank, including low and moderate income neighborhoods. The regulatory agency's assessment of the bank's record is made available to the public. Further, these assessments are considered by regulators when evaluating mergers, acquisitions and applications to open or relocate a branch or facility. The Bank currently has a rating of “Outstanding” under the CRA.
Dividends
Dividends from the Bank constitute an important source of funds for dividends that may be paid by the Company to shareholders. The amount of dividends payable by the Bank to the Company depends upon the Bank's earnings and capital position and is limited by federal and state laws. Under Washington law, the Bank may not declare or pay a cash dividend on its capital stock if this would cause its net worth to be reduced below the net worth requirements, if any, imposed by the WDFI. In
18
addition, dividends on the Bank's capital stock may not be paid in an amount greater than its retained earnings without the approval of the WDFI.
The amount of dividends actually paid during any one period will be strongly affected by the Bank's policy of maintaining a strong capital position. Because the Bank is treated as a savings association subsidiary of a savings and loan holding company, it must give the Federal Reserve at least 30 days' advance notice of the proposed declaration of a dividend on its guaranty, permanent or other non-withdrawable stock. Federal law prohibits an insured depository institution from paying a cash dividend if this would cause the institution to be “undercapitalized,” as defined in the prompt corrective action regulations. Moreover, the federal bank regulatory agencies have the general authority to limit the dividends paid by insured banks if such payments are deemed to constitute an unsafe and unsound practice. New capital rules going into effect in 2015 will impose additional requirements on the Bank’s ability to pay dividends. See “-
Capital and Prompt Corrective Action Requirements - New Capital Rules
.”
Liquidity
The Bank is required to maintain a sufficient amount of liquid assets to ensure its safe and sound operation. See “Management's Discussion and Analysis -
Liquidity Risk and Capital Resources.”
Compensation
The Bank is subject to regulation of its compensation practices. See “Regulation and Supervision -
Regulation of the Company
-
Compensation Policies
.”
Bank Secrecy Act and USA Patriot Act
The Company and the Bank are subject to the Bank Secrecy Act, as amended by the USA PATRIOT Act, which gives the federal government powers to address money laundering and terrorist threats through enhanced domestic security measures, expanded surveillance powers and mandatory transaction reporting obligations. By way of example, the Bank Secrecy Act imposes an affirmative obligation on the Bank to report currency transactions that exceed certain thresholds and to report other transactions determined to be suspicious.
Like all United States companies and individuals, the Company and the Bank are prohibited from transacting business with certain individuals and entities named on the Office of Foreign Asset Control's list of Specially Designated Nationals and Blocked Persons. Failure to comply may result in fines and other penalties. The Office of Foreign Asset Control (“OFAC”) has issued guidance directed at financial institutions in which it asserted that it may, in its discretion, examine institutions determined to be high-risk or to be lacking in their efforts to comply with these prohibitions.
The Bank maintains a program to meet the requirements of the Bank Secrecy Act, USA PATRIOT Act and OFAC and believes it is currently in compliance with these requirements.
Identity Theft
Section 315 of the Fair and Accurate Credit Transactions Act ("FACT Act") requires each financial institution or creditor to develop and implement a written Identity Theft Prevention Program to detect, prevent and mitigate identity theft “red flags” in connection with the opening of certain accounts or certain existing accounts.
The Bank maintains a program to meet the requirements of Section 315 of the FACT Act and believes it is currently in compliance with these requirements.
Consumer Protection Laws and Regulations
The Bank and its affiliates are subject to a broad array of federal and state consumer protection laws and regulations that govern almost every aspect of its business relationships with consumers. While this list is not exhaustive, these include the Truth-in-Lending Act, the Truth in Savings Act, the Electronic Fund Transfer Act, the Expedited Funds Availability Act, the Equal Credit Opportunity Act, the Fair Housing Act, the Secure and Fair Enforcement in Mortgage Licensing Act, the Real Estate Settlement Procedures Act, the Home Mortgage Disclosure Act, the Fair Credit Reporting Act, the Fair Debt Collection Practices Act, the Service Members' Civil Relief Act, the Right to Financial Privacy Act, the Home Ownership and Equity Protection Act, the Consumer Leasing Act, the Fair Credit Billing Act, the Homeowners Protection Act, the Check Clearing for the 21st Century Act, laws governing flood insurance, laws governing consumer protections in connection with the sale of insurance, federal and state laws prohibiting unfair and deceptive business practices, foreclosure laws and various regulations that implement some or all of the foregoing. These laws and regulations mandate certain disclosure requirements and regulate
19
the manner in which financial institutions must deal with customers when taking deposits, making loans, collecting loans and providing other services. Failure to comply with these laws and regulations can subject the Bank to various penalties, including but not limited to, enforcement actions, injunctions, fines, civil liability, criminal penalties, punitive damages and the loss of certain contractual rights. The Bank has a compliance governance structure in place to help ensure its compliance with these requirements.
The Dodd-Frank Act established the CFPB as a new independent bureau that is responsible for regulating consumer financial products and services under federal consumer financial laws. The CFPB has broad rulemaking authority with respect to these laws and exclusive examination and primary enforcement authority with respect to banks with assets of more than $10 billion.
The Dodd-Frank Act also contains a variety of provisions intended to reform consumer mortgage practices. The provisions include (1) a requirement that lenders make a determination that at the time a residential mortgage loan is consummated the consumer has a reasonable ability to repay the loan and related costs, (2) a ban on loan originator compensation based on the interest rate or other terms of the loan (other than the amount of the principal), (3) a ban on prepayment penalties for certain types of loans, (4) bans on arbitration provisions in mortgage loans and (5) requirements for enhanced disclosures in connection with the making of a loan. The Dodd-Frank Act also imposes a variety of requirements on entities that service mortgage loans.
The Dodd-Frank Act contains provisions further regulating payment card transactions. The Dodd-Frank Act required the Federal Reserve to adopt regulations limiting any interchange fee for a debit transaction to an amount which is “reasonable and proportional” to the costs incurred by the issuer. The Federal Reserve has adopted final regulations limiting the amount of debit interchange fees that large bank issuers may charge or receive on their debit card transactions. There is an exemption from the rules for issuers with assets of less than $10 billion and the Federal Reserve has stated that it will monitor and report to Congress on the effectiveness of the exemption. Nevertheless, it is unclear whether such smaller issuers (which include the Bank) will, as a practical matter, be able to avoid the impact of the regulations.
Sarbanes-Oxley Act of 2002
The Sarbanes-Oxley Act of 2002 ("Sarbanes-Oxley") implemented a broad range of corporate governance and accounting measures to increase corporate responsibility, to provide for enhanced penalties for accounting and auditing improprieties at publicly traded companies, and to protect investors by improving the accuracy and reliability of disclosures under federal securities laws. We are subject to Sarbanes-Oxley because we are required to file periodic reports with the SEC under the Securities Exchange Act of 1934. Among other things, Sarbanes-Oxley and/or its implementing regulations establishes membership requirements and additional responsibilities for our audit committee, imposes restrictions on the relationship between us and our outside auditors (including restrictions on the types of non-audit services our auditors may provide to us), imposes additional responsibilities for our external financial statements on our chief executive officer and chief accounting officer, expands the disclosure requirements for our corporate insiders, requires our management to evaluate our disclosure controls and procedures and our internal control over financial reporting, and requires our independent registered public accounting firm to issue a report on our internal control over financial reporting.
Future Legislation or Regulation
In light of recent conditions in the United States economy and the financial services industry, the Obama administration, Congress, the regulators and various states continue to focus attention on the financial services industry. Additional proposals that affect the industry have been and will likely continue to be introduced. We cannot predict whether any of these proposals will be enacted or adopted or, if they are, the effect they would have on our business, our operations or our financial condition.
20
|
ITEM 1A
|
RISK FACTORS
|
This Annual Report on Form 10-K contains forward-looking statements that involve risks and uncertainties. Our actual results could differ materially from those anticipated in these forward-looking statements as a result of certain factors, including the risks faced by us described below and elsewhere in this report.
We are growing rapidly, and we may be unable to manage our growth properly.
In 2012, HomeStreet completed its initial public offering of common stock. At that time HomeStreet had been operating under regulatory orders that had been imposed during the financial crisis of 2007 through 2010 as a result of HomeStreet Bank having experienced operating losses, capital impairment, asset quality deterioration and a number of related operational and management issues. In early 2010 we began recruiting a new management team, and the recapitalization brought about by our initial public offering, together with aggressive management strategies, helped us substantially improve all aspects of our operations and financial condition. As a result of a combination of these factors, our regulators removed all extraordinary restrictions on our operations by early 2013. In November 2013 we completed the simultaneous acquisitions by merger of Fortune Bank, headquartered in Seattle, and Yakima National Bank, headquartered in Yakima, Washington. In December 2013 we completed the acquisition of two Seattle branches from AmericanWest Bank. In March 2015, we completed the acquisition by merger of Simplicity Bancorp and the merger of Simplicity Bank with and into HomeStreet Bank ("Simplicity Merger"). That merger represents our third whole-bank acquisition in less than two years. Simultaneously, we have grown our mortgage origination operations opportunistically but quickly, opening new offices in the San Francisco Bay and Los Angeles areas of California in 2013 and 2014, and further expanding our mortgage origination operations into Arizona beginning in the fourth quarter of 2014 while also continuing to grow those operations in the Pacific Northwest. We also expanded our residential construction lending activities, opening a new office in Salt Lake City, Utah and adding production personnel in Southern California during 2014.
At the time we completed our IPO, and after giving effect to the $77.6 million in net proceeds from that offering, based on December 31, 2011 balances, we had total assets of approximately $2.4 billion, total deposits of approximately $2.0 billion, and total loans of approximately $1.5 billion, and we had approximately 600 employees. At
December 31, 2014
, we had total assets of approximately
$3.5 billion
, total deposits of
$2.4 billion
, total loans of approximately
$2.7 billion
, and approximately 1,600 employees. As of
December 31, 2014
, Simplicity had total assets of approximately
$863 million
, total deposits of
$656 million
, and total loans of approximately
$683 million
. Further, unlike the Fortune Bank and Yakima National Bank acquisitions, which together resulted in only modest geographic expansion, the Simplicity Merger represents a substantial geographic expansion of our commercial and consumer banking operations. We have plans to continue growing strategically, and we may also grow opportunistically from time to time. Growth can present substantial demands on management personnel, line employees, and other aspects of a bank’s operations, and those challenges are particularly pronounced when growth occurs rapidly. We may face difficulties in managing that growth, and we may experience a variety of adverse consequences, including:
|
•
|
Loss of or damage to key customer relationships;
|
|
•
|
Distraction of management from ordinary course operations;
|
|
•
|
Loss of key employees or significant numbers of employees;
|
|
•
|
The potential of litigation from prior employers relating to the portability of their employees;
|
|
•
|
Costs associated with opening new offices to accommodate our growth in employees;
|
|
•
|
Increased costs related to hiring, training and providing initial compensation to new employees, which may not be recouped if those employees do not remain with us long enough to be profitable;
|
|
•
|
Challenges in complying with legal and regulatory requirements in new jurisdictions;
|
|
•
|
Inadequacies in our computer systems, accounting policies and procedures, and management personnel (some of which may be difficult to detect until other problems become manifest);
|
|
•
|
Challenges integrating different systems, practices, and customer relationships;
|
|
•
|
An inability to attract and retain personnel whose experience and (in certain circumstances) business relationships promote the achievement of our strategic goals; and
|
|
•
|
Increasing volatility in our operating results as we progress through these initiatives.
|
21
The integration of Simplicity into HomeStreet following the Simplicity Merger, as well as any future acquisitions, could consume significant resources, present significant challenges in integration and may not be successful.
In March 2015, we completed the Simplicity Merger and are working to integrate the Simplicity operations into HomeStreet’s operations. There are certain risks related to that integration, and similar risks may arise if we seek out other acquisitions in the near future as we look for ways to continue to grow our business and our market share. Any future acquisition we may undertake may involve numerous risks related to the investigation and consideration of the potential acquisition and the costs of undertaking such a transaction, and both the Simplicity integration and integration into HomeStreet or HomeStreet Bank of any other assets or entities we may acquire in the future involve inherent risks, including risks that arise after the transaction is completed. These risks include:
|
•
|
Diversion of management's attention from normal daily operations of the business;
|
|
•
|
Costs incurred in the process of vetting potential acquisition candidates which we may not recoup;
|
|
•
|
Difficulties in integrating the operations, technologies, and personnel of the acquired companies;
|
|
•
|
Difficulties in implementing, upgrading and maintaining our internal controls over financial reporting and our disclosure controls and procedures;
|
|
•
|
Inability to maintain the key business relationships and the reputations of acquired businesses;
|
|
•
|
Entry into markets in which we have limited or no prior experience and in which competitors have stronger market positions;
|
|
•
|
Potential responsibility for the liabilities of acquired businesses;
|
|
•
|
Inability to maintain our internal standards, controls, procedures and policies at the acquired companies or businesses; and
|
|
•
|
Potential loss of key employees of the acquired companies.
|
Difficulties in pursuing or integrating any new acquisitions may increase our costs and adversely impact our financial condition and results of operations. Further, even if we successfully address these factors and are successful in closing the transaction and integrating the systems together, we may nonetheless experience customer losses, or we may fail to grow the acquired businesses as we intend.
Fluctuations in interest rates could adversely affect the value of our assets and reduce our net interest income and noninterest income, thereby adversely affecting our earnings and profitability.
Interest rates may be affected by many factors beyond our control, including general and economic conditions and the monetary and fiscal policies of various governmental and regulatory authorities. For example, increases in interest rates in early 2014 reduced our mortgage revenues in large part by drastically reducing the market for refinancings, which negatively impacted our noninterest income and, to a lesser extent, our net interest income, as well as demand for our residential loan products and the revenue realized on the sale of loans in the first half of 2014. Our earnings are also dependent on the difference between the interest earned on loans and investments and the interest paid on deposits and borrowings. Changes in market interest rates impact the rates earned on loans and investment securities and the rates paid on deposits and borrowings and may negatively impact our ability to attract deposits, make loans and achieve satisfactory interest rate spreads, which could adversely affect our financial condition or results of operations. In addition, changes to market interest rates may impact the level of loans, deposits and investments and the credit quality of existing loans.
In addition, our securities portfolio includes securities that are insured or guaranteed by U.S. government agencies or government-sponsored enterprises and other securities that are sensitive to interest rate fluctuations. The unrealized gains or losses in our available-for-sale portfolio are reported as a separate component of shareholders' equity until realized upon sale. Future interest rate fluctuations may impact the value of these securities and as a result, shareholders' equity, causing material fluctuations from quarter to quarter. Failure to hold our securities until maturity or until market conditions are favorable for a sale could adversely affect our financial condition.
A significant portion of our noninterest income is derived from originating residential mortgage loans and selling them into the secondary market. That business has benefited from a long period of historically low interest rates. To the extent interest rates rise again, particularly if they rise substantially, we may experience another reduction in mortgage financing of new home purchases and refinancing. These factors have negatively affected our mortgage loan origination volume and our noninterest income in the past and may do so again in the future.
22
We have recently identified certain deficiencies in our internal controls over financial reporting, and those deficiencies or others that we have not discovered may result in our inability to maintain control over our assets or to identify and accurately report our financial condition, results of operations, or cash flows.
Our internal controls over financial reporting include those policies and procedures that (i) pertain to the maintenance of records that, in reasonable detail, accurately and fairly reflect the transactions and dispositions of the assets of the company; (ii) provide reasonable assurance that transactions are recorded as necessary to permit preparation of financial statements in accordance with accounting principles generally accepted in the United States of America and that receipts and expenditures of the company are being made only in accordance with authorizations of management and directors of the company; and (iii) provide reasonable assurance regarding prevention or timely detection of unauthorized acquisition, use or disposition of the company’s assets that could have a material effect on the financial statements.
Each year, our management, under the supervision of the Chief Executive Officer and the Chief Accounting Officer, conducts an evaluation of the effectiveness of our internal control over financial reporting. Based on this evaluation, our management has concluded that our internal controls over financial reporting was not effective as of
December 31, 2014
, because of a material weakness in our internal controls related to certain new back office systems, primarily relating to accounts payable processing and payroll processing. Implementation of key systems requires that management perform a thorough risk assessment to adequately assess risk at an appropriate level of detail to allow for (i) the design of controls with the appropriate precision and responsiveness to address those risks, (ii) the timely and effective implementation of controls, including evidence of operating effectiveness, and (iii) effective monitoring of the controls. Management concluded that its risk assessment related to these changes was not comprehensive enough and that sufficient documentation was not maintained. In each of these cases, management determined that no material loss occurred, and that we did not have an actual misstatement of our financial statements. However, management also noted that in the absence of specific management attention, we could have experienced a material loss or could have made a material error in the reporting of our results of operations for the fourth quarter of 2014. Management thus determined that these potential outcomes reflect a material weakness in our internal controls over financial reporting, and that, as a result, our internal controls over financial reporting were not effective as of
December 31, 2014
.
These deficiencies are discussed in greater detail under Item 9A, “
Internal Control over Financial Reporting
,” and led management to conclude that as of
December 31, 2014
, our internal controls over financial reporting were not effective. Management has identified certain remedial measures that we believe will resolve these deficiencies. However, if these measures are not effective, or if our internal controls over financial reporting are subject to additional defects we have not identified, we may be unable to maintain adequate control over our assets, or we may experience material errors in recording our assets, liabilities and results of operations. Further, we reported an unrelated material weakness in our internal controls over financial reporting following the end of our third fiscal quarter of 2014. Repeated or continuing deficiencies may cause investors to question the reliability of our internal controls or our financial statements, and may result in an erosion of confidence in our management.
Current economic conditions continue to pose significant challenges for us and could adversely affect our financial condition and results of operations.
We generate revenue from the interest and fees we charge on the loans and other products and services we sell, and a substantial amount of our revenue and earnings comes from the net interest and noninterest income that we earn from our mortgage banking and commercial lending businesses. Our operations have been, and will continue to be, materially affected by the state of the U.S. economy, particularly unemployment levels and home prices. Although the U.S. economy has continued to gradually improve from the recessionary levels of 2008 and early 2009, economic growth has been slow and uneven.
A prolonged period of slow growth in the U.S. economy, or any deterioration in general economic conditions and/or the financial markets resulting from these factors, or any other events or factors that may disrupt or dampen the economic recovery
,
could materially adversely affect our financial results and condition. If economic conditions do not continue to improve or if the economy worsens and unemployment rises, which also would likely result in a decrease in consumer and business confidence and spending, the demand for our credit products, including our mortgages, may fall, reducing our net interest and noninterest income and our earnings.
In addition, financial institutions continue to be affected by changing conditions in the real estate and financial markets, along with an arduous and changing regulatory climate in which regulations passed in response to conditions and events during the economic downturn continue to be implemented. Recent improvements in the housing market may not continue, and a return to a recessionary economy could result in financial stress on our borrowers that may result in volatility in home prices, increased
23
foreclosures and significant write-downs of asset values, all of which would adversely affect our financial condition and results of operations.
In particular, we may face risks related to market conditions that may negatively impact our business opportunities and plans, such as:
|
•
|
Market developments may affect consumer confidence levels and may cause adverse changes in payment patterns, resulting in increased delinquencies and default rates on loans and other credit facilities;
|
|
•
|
Regulatory scrutiny of the industry could further increase, leading to stricter regulation of our industry that could lead to a higher cost of compliance, limit our ability to pursue business opportunities and increase our exposure to the judicial system and the plaintiff’s bar;
|
|
•
|
The models we use to assess the creditworthiness of our customers may prove less reliable than we had anticipated in predicting future behaviors which may impair our ability to make good underwriting decisions;
|
|
•
|
If our forecasts of economic conditions and other economic predictions are not accurate, we may face challenges in accurately estimating the ability of our borrowers to repay their loans;
|
|
•
|
Further erosion in the fiscal condition of the U.S. Treasury may lead to new taxes limiting the ability of the Company to pursue growth and return profits to shareholders; and
|
|
•
|
Future political developments and fiscal policy decisions may create uncertainty in the marketplace.
|
If recovery from the economic recession slows or if we experience another recessionary dip, our ability to access capital and our business, financial condition and results of operations may be adversely impacted.
Any restructuring or replacement of Fannie Mae and Freddie Mac and changes in existing government-sponsored and federal mortgage programs could adversely affect our business.
We originate and purchase, sell and thereafter service single family and multifamily mortgages under the Fannie Mae, and to a lesser extent the Freddie Mac single family purchase programs and the Fannie Mae multifamily DUS program. In 2008, Fannie Mae and Freddie Mac were placed into conservatorship, and since then Congress, various executive branch agencies and certain large private investors in Fannie Mae and Freddie Mac have offered a wide range of proposals aimed at restructuring these agencies. While the Obama administration and certain members of Congress have called for scaling back the role of the U.S. government in, and promoting the return of private capital to, the mortgage markets and the reduction of the role of Fannie Mae and Freddie Mac in the mortgage markets by, among other things, reducing conforming loan limits, increasing guarantee fees and requiring larger down payments by borrowers with the ultimate goal of winding down Fannie Mae and Freddie Mac, others have focused on ways to bring additional private capital into the system in order to reduce taxpayer risk. We expect that Congress will continue to hold hearings and consider legislation on the future status of Fannie Mae and Freddie Mac, including proposals that would result in Fannie Mae’s liquidation or dissolution.
However, we cannot be certain if or when Fannie Mae and Freddie Mac ultimately will be restructured or wound down, if or when additional reform of the housing finance market will be implemented or what the future role of the U.S. government will be in the mortgage market, and, accordingly, we will not be able to determine the impact that any such reform may have on us until a definitive reform plan is adopted. However, any restructuring or replacement of Fannie Mae and Freddie Mac that restricts the current loan purchase programs of those entities may have a material adverse effect on our business and results of operations. Moreover, we have recorded on our balance sheet an intangible asset (mortgage servicing rights, or MSRs) relating to our right to service single and multifamily loans sold to Fannie Mae and Freddie Mac. That MSR asset was valued at
$123.3 million
at
December 31, 2014
. Changes in the policies and operations of Fannie Mae and Freddie Mac or any replacement for or successor to those entities that adversely affect our single family residential loan and DUS mortgage servicing assets may require us to record impairment charges to the value of these assets, and significant impairment charges could be material and adversely affect our business.
In addition, our ability to generate income through mortgage sales to institutional investors depends in part on programs sponsored by Fannie Mae, Freddie Mac and Ginnie Mae, which facilitate the issuance of mortgage-backed securities in the secondary market. Any discontinuation of, or significant reduction in, the operation of those programs could have a material adverse effect on our loan origination and mortgage sales as well as our results of operations. Also, any significant adverse change in the level of activity in the secondary market or the underwriting criteria of these entities could negatively impact our results of business, operations and cash flows.
24
We are subject to more stringent capital requirements under Basel III.
As of January 1, 2015, we are subject to new rules relating to capital standards requirements, including requirements contemplated by Section 171 of the Dodd-Frank Act as well as certain standards initially adopted by the Basel Committee on Banking Supervision, which standards are commonly referred to as Basel III. A substantial portion of these rules applies to both the Company and the Bank, including a requirement that both the Company and the Bank have a common equity Tier 1 capital ratio of 4.5%, a Tier 1 leverage ratio of 4.0%, a Tier 1 risk-based ratio of 6.0% and a total risk-based ratio of 8.0%. In addition, beginning in 2016, both the Company and the Bank will be required to establish a “conservation buffer”, consisting of common equity Tier 1 capital, equal to 2.5%, which means in effect that, once the conservation buffer is fully phased in, in order to prevent certain regulatory restrictions, the common equity Tier 1 capital ratio requirement will be 7.0%, the Tier 1 risk-based ratio requirement will be 8.5% and the total risk-based ratio requirement will be 10.5%. Any institution that does not meet the conservation buffer will be subject to restrictions on certain activities including payment of dividends, stock repurchases and discretionary bonuses to executive officers. The requirement for a conservation buffer will be phased in beginning in 2016 and will take full effect on January 1, 2019.
Beginning in 2015, additional prompt corrective action rules will apply to the Bank, including higher and new ratio requirements for the Bank to be considered well-capitalized. The new rules also modify the manner for determining when certain capital elements are included in the ratio calculations. Under current capital standards, the effects of accumulated other comprehensive income items included in capital are excluded for the purposes of determining regulatory capital ratios. Under Basel III, the effects of certain accumulated other comprehensive items are not excluded; however, banking organizations that are not required to use advanced approaches, including the Company and the Bank, may make a one-time permanent election to continue to exclude these items. The Company and Bank expect to make this election in 2015 in order to avoid significant variations in the level of capital depending upon the impact of interest rate fluctuations on the fair value of the Company's securities portfolio.
In addition, deductions include, for example, the requirement that mortgage servicing rights, certain deferred tax assets not dependent upon future taxable income and significant investments in non-consolidated financial entities be deducted from the new common equity Tier 1 capital to the extent that any one such category exceeds 10% of new common equity Tier 1 capital, or all such categories in the aggregate exceed 15% of new common equity Tier 1 capital. Maintaining higher capital levels may result in lower profits for the Company as we will not be able to grow our lending as quickly as we might otherwise be able to do if we were to maintain lower capital levels. See “Regulation and Supervision of Home Street Bank -
Capital and Prompt Corrective Action Requirements - New Capital Regulations
” in Item 1 of this Form 10-K for the year ended December 31, 2014.
The sale of approximately 24% of our MSR portfolio in the second quarter of 2014 was consummated in part to facilitate balance sheet and capital management in preparation for Basel III. The application of more stringent capital requirements could, among other things, result in lower returns on invested capital and result in regulatory actions if we were to be unable to comply with such requirements.
We are subject to extensive regulation that may restrict our activities, including declaring cash dividends or capital distributions, and imposes financial requirements or limitations on the conduct of our business.
Our operations are subject to extensive regulation by federal, state and local governmental authorities, including the FDIC, the Washington Department of Financial Institutions and the Federal Reserve, and are subject to various laws and judicial and administrative decisions imposing requirements and restrictions on part or all of our operations. Because our business is highly regulated, the laws, rules and regulations to which we are subject are evolving and change frequently. Changes to those laws, rules and regulations are also sometimes retroactively applied. Examination findings by the regulatory agencies may result in adverse consequences to the Company or the Bank. We have, in the past, been subject to specific regulatory orders that constrained our business and required us to take measures that investors may have deemed undesirable, and we may again in the future be subject to such orders if banking regulators were to determine that our operations require such restrictions. Regulatory authorities have extensive discretion in their supervisory and enforcement activities, including the authority to restrict our operations, adversely reclassify our assets, determine the level of deposit premiums assessed and require us to increase our allowance for loan losses.
The Dodd-Frank Act has increased our costs of operations and may have a material negative effect on us.
The Dodd-Frank Act significantly changed the laws as they apply to financial institutions and revised and expanded the rulemaking, supervisory and enforcement authority of federal banking regulators. It is also having a material impact on our relationships with current and future customers.
25
Some of these changes were effective immediately, although others are still being phased in gradually. In addition, the statute in many instances calls for regulatory rulemaking to implement its provisions. While many of the provisions are now being implemented, such as the Basel III capital standards, not all of the regulations called for by Dodd-Frank have been completed or are in effect, so the precise contours of the law and its effects on us cannot yet be fully understood. The provisions of the Dodd-Frank Act and the subsequent exercise by regulators of their revised and expanded powers thereunder could materially and negatively impact the profitability of our business, the value of assets we hold or the collateral available for our loans, require changes to business practices or force us to discontinue businesses and expose us to additional costs, taxes, liabilities, enforcement actions and reputational risk. For example, the Dodd-Frank Act imposes a requirement that private securitizers of mortgage and other asset backed securities retain, subject to certain exemptions, not less than five percent of the credit risk of the mortgages or other assets backing the securities. The regulatory agencies published the final Risk Retention rules in December 2014; compliance is required beginning in December 2015 for residential mortgage-backed securitizations and December 2016 for all other securitization types. See “
Regulation and Supervision
” in Item 1 of this Form 10-K for the year ended December 31, 2014.
New federal and state legislation, case law or regulatory action may negatively impact our business.
Enacted legislation, including the Dodd-Frank Act, as well as future federal and state legislation, case law and regulations could require us to revise our operations and change certain business practices, impose additional costs, reduce our revenue and earnings and otherwise adversely impact our business, financial condition and results of operations. For instance,
|
•
|
Recent legislation and court decisions with precedential value could allow judges to modify the terms of residential mortgages in bankruptcy proceedings and could hinder our ability to foreclose promptly on defaulted mortgage loans or expand assignee liability for certain violations in the mortgage loan origination process, any or all of which could adversely affect our business or result in our being held responsible for violations in the mortgage loan origination process.
|
|
•
|
Congress and various regulatory authorities have proposed programs that would require a reduction in principal balances of “underwater” residential mortgages, which if implemented would tend to reduce loan servicing income and which might adversely affect the carrying values of portfolio loans.
|
These or other judicial decisions or legislative actions, if upheld or implemented, may limit our ability to take actions that may be essential to preserve the value of the mortgage loans we service or hold for investment. Any restriction on our ability to foreclose on a loan, any requirement that we forego a portion of the amount otherwise due on a loan or any requirement that we modify any original loan terms may require us to advance principal, interest, tax and insurance payments, which would negatively impact our business, financial condition, liquidity and results of operations. Given the relatively high percentage of our business that derives from originating residential mortgages, any such actions are likely to have a significant impact on our business, and the effects we experience will likely be disproportionately high in comparison to financial institutions whose residential mortgage lending is more attenuated.
In addition, while these legislative and regulatory proposals and courts decisions generally have focused primarily, if not exclusively, on residential mortgage origination and servicing, other laws and regulations may be enacted that affect the manner in which we do business and the products and services that we provide, restrict our ability to grow through acquisition, restrict our ability to compete in our current business or expand into any new business, and impose additional fees, assessments or taxes on us or increase our regulatory oversight.
Policies and regulations enacted by CFPB may negatively impact our residential mortgage loan business and compliance risk.
Our consumer business, including our mortgage, credit card, and other consumer lending and non-lending businesses, may be adversely affected by the policies enacted or regulations adopted by the Consumer Financial Protection Bureau (CFPB) which under the Dodd-Frank Act has broad rulemaking authority over consumer financial products and services. For example, in January 2014 new federal regulations promulgated by the CFPB took effect which impact how we originate and service residential mortgage loans. Those regulations, among other things, require mortgage lenders to assess and document a borrower’s ability to repay their mortgage loan. The regulations provide borrowers the ability to challenge foreclosures and sue for damages based on allegations that the lender failed to meet the standard for determining the borrower’s ability to repay their loan. While the regulations include presumptions in favor of the lender based on certain loan underwriting criteria, it is uncertain how these presumptions will be construed and applied by courts in the event of litigation. The ultimate impact of these new regulations on the lender’s enforcement of its loan documents in the event of a loan default, and the cost and expense
26
of doing so, is uncertain, but may be significant. In addition, the secondary market demand for loans that do not fall within the presumptively safest category of a “qualified mortgage” as defined by the CFPB is uncertain. The 2014 regulations also require changes to certain loan servicing procedures and practices, which result in increased foreclosure costs and longer foreclosure timelines in the event of loan default, and failure to comply with the new servicing rules may result in additional litigation and compliance risk. On November 20, 2014, the CFPB released its Final Integrated Disclosure Rule (“Rule”) that will become effective on August 1, 2015. Among other things, the new rule requires lenders to combine the initial Good Faith Estimate and Initial Truth in Lending (“TIL”) disclosures into a single new Loan Estimate disclosure and the HUD-1 and Final TIL disclosures into a single new Closing Disclosure. The definition of an application and timing requirements will also change, and a new Closing Disclosure waiting period has been added. These changes, along with other changes required by the Rule, will require significant systems modifications, process and procedures changes and training. Failure to comply with these new requirements may result in penalties for disclosure violations under the Real Estate Settlement Procedures Act (“RESPA”) and the Truth In Lending Act (“TILA”).
In addition, the CFPB recently proposed additional rules under the Home Mortgage Disclosure Act (“HMDA”) that are intended to improve information reported about the residential mortgage market and increase disclosure about consumer access to mortgage credit. As drafted, the proposed updates to the HMDA increase the types of dwelling-secured loans that would be subject to the disclosure requirements of the rule and expand the categories of information that financial institutions such as the Bank would be required to report with respect to such loans and such borrowers, including potentially sensitive customer information. If implemented, these changes would increase our compliance costs due to the need for additional resources to meet the enhanced disclosure requirements, including additional personnel and training costs as well as informational systems to allow the Bank to properly capture and report the additional mandated information. The anticipated volume of new data that would be required to be reported under the updated rules would also cause the Bank to face an increased risk of errors in the information. More importantly, because of the sensitive nature of some of the additional customer information to be included in such reports, the Bank would face a higher potential for a security breach resulting in the disclosure of sensitive customer information in the event the HMDA reporting files were obtained by an unauthorized party. The comment period for these proposed rules closed on October 29, 2014 and the final rules have not yet been released.
While the full impact of CFPB's activities on our business is still unknown, we anticipate that the proposed rule change under the HMDA and other CFPB actions that may follow may increase our compliance costs and require changes in our business practices as a result of new regulations and requirements and could limit the products and services we are able to provide to customers. We are unable to predict whether U.S. federal, state or local authorities, or other pertinent bodies, will enact legislation, laws, rules, regulations, handbooks, guidelines or similar provisions that will affect our business or require changes in our practices in the future, and any such changes could adversely affect our cost of doing business and profitability.
Our accounting policies and methods are fundamental to how we report our financial condition and results of operations, and we use estimates in determining the fair value of certain of our assets, which estimates may prove to be imprecise and result in significant changes in valuation.
A portion of our assets are carried on the balance sheet at fair value, including investment securities available for sale, mortgage servicing rights related to single family loans and single family loans held for sale. Generally, for assets that are reported at fair value, we use quoted market prices or internal valuation models that utilize observable market data inputs to estimate their fair value. In certain cases, observable market prices and data may not be readily available or their availability may be diminished due to market conditions. We use financial models to value certain of these assets. These models are complex and use asset-specific collateral data and market inputs for interest rates. Although we have processes and procedures in place governing internal valuation models and their testing and calibration, such assumptions are complex as we must make judgments about the effect of matters that are inherently uncertain. Different assumptions could result in significant changes in valuation, which in turn could affect earnings or result in significant changes in the dollar amount of assets reported on the balance sheet.
If we fail to maintain effective systems of internal and disclosure control, we may not be able to accurately report our financial results or prevent fraud. As a result, current and potential shareholders could lose confidence in our financial reporting, which would harm our business and the trading price of our securities.
Effective internal and disclosure controls are necessary for us to provide reliable financial reports and effectively prevent fraud and to operate successfully as a public company. If we cannot provide reliable financial reports or prevent fraud, our reputation and operating results would be harmed. As part of our ongoing monitoring of internal control from time to time we have discovered deficiencies in our internal control as defined under standards adopted by the Public Company Accounting Oversight Board, or PCAOB, that have required remediation. Under the PCAOB standards, a “material weakness” is a significant deficiency or combination of significant deficiencies that results in more than a remote likelihood that a material
27
misstatement of the annual or interim financial statements will not be prevented or detected. A “significant deficiency” is a control deficiency or combination of control deficiencies, that adversely affect a company’s ability to initiate, authorize, record, process, or report financial data reliably in accordance with generally accepted accounting principles such that there is a more than remote likelihood that a misstatement of a company’s annual or interim financial statements that is more than inconsequential will not be prevented or detected.
To support our growth initiatives and to create operating efficiencies the company has implemented, and will continue to implement, new systems and processes. If our project management processes are not sound and adequate resources are not deployed to these implementations we may experience internal control lapses that could expose the company to operating losses.
If we discover additional deficiencies in our internal controls, we may also identify defects in our disclosure controls and procedures that require remediation. If we discover additional deficiencies, we will take affirmative steps to improve our internal and disclosure controls. However, there is no assurance that we will be successful. Any failure to maintain effective controls or timely effect any necessary improvement of our internal and disclosure controls could harm operating results or cause us to fail to meet our reporting obligations. Ineffective internal and disclosure controls, including the deficiencies identified in this report, could also cause investors to lose confidence in our reported financial information, which would likely have a negative effect on the trading price of our securities.
HomeStreet, Inc. primarily relies on dividends from the Bank and payment of dividends by the Bank may be limited by applicable laws and regulations.
HomeStreet, Inc. is a separate legal entity from the Bank, and although we may receive some dividends from HomeStreet Capital Corporation, the primary source of our funds from which we service our debt, pay any dividends that we may declare to our shareholders and otherwise satisfy our obligations is dividends from the Bank. The availability of dividends from the Bank is limited by various statutes and regulations, as well as by our policy of retaining a significant portion of our earnings to support the Bank's operations. New capital rules impose more stringent capital requirements to maintain “well capitalized” status which may additionally impact the Bank’s ability to pay dividends to the Company. See “Management’s Discussion and Analysis of Financial Condition and Results of Operations - Capital Management - New Capital Regulations” as well as “Regulation of Home Street Bank - Capital and Prompt Corrective Action Requirements - New Ca
pital Rules
” in Item 1 of this Form 10-K. If the Bank cannot pay dividends to us, we may be limited in our ability to service our debts, fund the Company's operations and acquisition plans and pay dividends to the Company's shareholders. While the Company has made special dividend distributions to its public shareholders in prior quarters, the Company has not adopted a dividend policy and the board of directors determined that it is in the best interests of the shareholders not to declare a dividend to be paid in the fourth quarter of 2014. As such, our dividends are not regular and are subject to restriction due to cash flow limitations, capital requirements, capital needs of the business or other factors.
We cannot assure you that we will remain profitable.
We have sustained significant losses in the past and our profitability has declined in recent quarters. We cannot guarantee that we will remain profitable or be able to maintain the level of profit we are currently experiencing. Many factors determine whether or not we will be profitable, and our ability to remain profitable is threatened by a myriad of issues, including:
|
•
|
Increases in interest rates may limit our ability to make loans, decrease our net interest income and noninterest income, reduce demand for loans, increase the cost of deposits and otherwise negatively impact our financial situation;
|
|
•
|
Volatility in mortgage markets, which is driven by factors outside of our control such as interest rate changes, housing inventory and general economic conditions, may negatively impact our ability to originate loans and change the fair value of our existing loans and servicing rights;
|
|
•
|
Changes in regulations may negatively impact the Company or the Bank and may limit our ability to offer certain products or services or may increase our costs of compliance;
|
|
•
|
Increased costs from growth through acquisition could exceed the income growth anticipated from these opportunities, especially in the short term as these acquisitions are integrated into our business;
|
|
•
|
Changes in government-sponsored enterprises and their ability to insure or to buy our loans in the secondary market may result in significant changes in our ability to recognize income on sale of our loans to third parties;
|
|
•
|
Competition in the mortgage market industry may drive down the interest rates we are able to offer on our mortgages, which will negatively impact our net interest income;
|
28
|
•
|
Changes in the cost structures and fees of government-sponsored enterprises to whom we sell many of these loans may compress our margins and reduce our net income and profitability; and
|
|
•
|
Our hedging strategies to offset risks related to interest rate changes may not prove to be successful and may result in unanticipated losses for the Company.
|
These and other factors may limit our ability to generate revenue in excess of our costs, which in turn may result in a lower rate of profitability or even substantial losses for the Company.
Federal, state and local consumer protection laws may restrict our ability to offer and/ or increase our risk of liability with respect to certain products and services and could increase our cost of doing business.
Federal, state and local laws have been adopted that are intended to eliminate certain practices considered “predatory” or “unfair and deceptive”. These laws prohibit practices such as steering borrowers away from more affordable products, failing to disclose key features, limitations, or costs related to products and services, selling unnecessary insurance to borrowers, repeatedly refinancing loans, imposing excessive fees for overdrafts, and making loans without a reasonable expectation that the borrowers will be able to repay the loans irrespective of the value of the underlying property. It is our policy not to make predatory loans or engage in deceptive practices, but these laws and regulations create the potential for liability with respect to our lending, servicing, loan investment and deposit taking activities. As we offer products and services to customers in additional states, we may become subject to additional state and local laws designed to protect consumers. The additional laws and regulations may increase our cost of doing business, and ultimately may prevent us from making certain loans, offering certain products, and may cause us to reduce the average percentage rate or the points and fees on loans and other products and services that we do provide.
The significant concentration of real estate secured loans in our portfolio has had and may continue to have a negative impact on our asset quality and profitability.
Substantially all of our loans are secured by real property. Our real estate secured lending is generally sensitive to national, regional and local economic conditions, making loss levels difficult to predict. Declines in real estate sales and prices, significant increases in interest rates, and a degeneration in prevailing economic conditions may result in higher than expected loan delinquencies, foreclosures, problem loans, OREO, net charge-offs and provisions for credit and OREO losses. Although real estate prices are stable in the markets in which we operate, if market values decline, the collateral for our loans may provide less security and our ability to recover the principal, interest and costs due on defaulted loans by selling the underlying real estate will be diminished, leaving us more likely to suffer additional losses on defaulted loans. Such declines may have a greater effect on our earnings and capital than on the earnings and capital of financial institutions whose loan portfolios are more geographically diversified.
Worsening conditions in the real estate market and higher than normal delinquency and default rates on loans could cause other adverse consequences for us, including:
|
•
|
The reduction of cash flows and capital resources, as we are required to make cash advances to meet contractual obligations to investors, process foreclosures, and maintain, repair and market foreclosed properties;
|
|
•
|
Declining mortgage servicing fee revenues because we recognize these revenues only upon collection;
|
|
•
|
Increasing loan servicing costs;
|
|
•
|
Declining fair value on our mortgage servicing rights; and
|
|
•
|
Declining fair values and liquidity of securities held in our investment portfolio that are collateralized by mortgage obligations.
|
Our allowance for loan losses may prove inadequate or we may be negatively affected by credit risk exposures. Future additions to our allowance for loan losses will reduce our earnings.
Our business depends on the creditworthiness of our customers. As with most financial institutions, we maintain an allowance for loan losses to provide for defaults and nonperformance, which represents management's best estimate of probable incurred losses inherent in the loan portfolio. Management's estimate is the result of our continuing evaluation of specific credit risks and loan loss experience, current loan portfolio quality, present economic, political and regulatory conditions, industry concentrations and other factors that may indicate future loan losses. The determination of the appropriate level of the allowance for loan losses inherently involves a high degree of subjectivity and judgment and requires us to make estimates of current credit risks and future trends, all of which may undergo material changes. Generally, our nonperforming loans and
29
OREO reflect operating difficulties of individual borrowers and weaknesses in the economies of the markets we serve. This allowance may not be adequate to cover actual losses, and future provisions for losses could materially and adversely affect our financial condition, results of operations and cash flows.
In addition, as a result of our acquisitions of Simplicity Bank on March 1, 2015 and Fortune Bank, Yakima National Bank and two branches of AmericanWest Bank in the second half of 2013, we have added the loans previously held by the acquired companies or related to the acquired branches to our books. Any future acquisitions we may make will have a similar result. Although we review loan quality as part of our due diligence in considering any acquisition, the addition of such loans may increase our credit risk exposure, requiring an increase in our allowance for loan losses or we may experience adverse effects to our financial condition, results of operations and cash flows stemming from losses on those additional loans.
Our real estate lending also exposes us to environmental liabilities.
In the course of our business, it is necessary to foreclose and take title to real estate, which could subject us to environmental liabilities with respect to these properties. Hazardous substances or waste, contaminants, pollutants or sources thereof may be discovered on properties during our ownership or after a sale to a third party. We could be held liable to a governmental entity or to third parties for property damage, personal injury, investigation and clean-up costs incurred by these parties in connection with environmental contamination, or may be required to investigate or clean up hazardous or toxic substances or chemical releases at such properties. The costs associated with investigation or remediation activities could be substantial and could substantially exceed the value of the real property. In addition, as the owner or former owner of a contaminated site, we may be subject to common law claims by third parties based on damages and costs resulting from environmental contamination emanating from the property. We may be unable to recover costs from any third party. These occurrences may materially reduce the value of the affected property, and we may find it difficult or impossible to use or sell the property prior to or following any environmental remediation. If we ever become subject to significant environmental liabilities, our business, financial condition and results of operations could be materially and adversely affected.
A failure in or breach of our security systems or infrastructure, or those of our third party vendors and other service providers, resulting from cyber-attacks, could disrupt our businesses, result in the disclosure or misuse of confidential or proprietary information, damage our reputation, increase our costs and cause losses.
Information security risks for financial institutions have generally increased in recent years in part because of the proliferation of new technologies, the use of the Internet and telecommunications technologies to conduct financial transactions, and the increased sophistication and activities of organized crime, hackers, terrorists, activists, and other external parties. Those parties also may attempt to fraudulently induce employees, customers, or other users of our systems to disclose confidential information in order to gain access to our data or that of our customers. Our operations rely on the secure processing, transmission and storage of confidential information in our computer systems and networks, either managed directly by us or through our data processing vendors. In addition, to access our products and services, our customers may use personal smartphones, tablet PCs, and other mobile devices that are beyond our control systems. Although we believe we have robust information security procedures and controls, we are heavily reliant on our third party vendors, and our vendors’ or our own technologies, systems, networks and our customers' devices may become the target of cyber-attacks, computer viruses, malicious code, unauthorized access, hackers or information security breaches that could result in the unauthorized release, gathering, monitoring, misuse, loss or destruction of Company or our customers' confidential, proprietary and other information, or otherwise disrupt the Company's or its customers' or other third parties' business operations.
Third parties with which we do business or that facilitate our business activities, including exchanges, clearing houses, financial intermediaries or vendors that provide services or security solutions for our operations, could also be sources of operational and information security risk to us, including from breakdowns or failures of their own systems or capacity constraints. In addition, some of our primary third party service providers may be subject to enhanced regulatory scrutiny due to regulatory findings during examinations of such service provider(s) conducted by federal regulators. While we have and will subject such vendor(s) to higher scrutiny and monitor any corrective measures that the vendor(s) are taking or would undertake, we are not able to fully mitigate any risk which could result from a breach or other operational failure caused by this, or any other vendor’s breach.
To date we are not aware of any material losses relating to cyber-attacks or other information security breaches, but there can be no assurance that we will not suffer such attacks and losses in the future. Our risk and exposure to these matters remains heightened because of, among other things, the evolving nature of these threats, our plans to continue to implement our Internet banking and mobile banking channel, our expanding operations and the outsourcing of a significant portion of our business operations. As a result, cybersecurity and the continued development and enhancement of our controls, processes and practices
30
designed to protect customer information, our systems, computers, software, data and networks from attack, damage or unauthorized access remain a priority for the Company. As cyber threats continue to evolve, we may be required to expend significant additional resources to insure, to continue to modify or enhance our protective measures or to investigate and remediate important information security vulnerabilities, however, our measures may be insufficient to prevent physical .and electronic break-ins, denial of service and other cyber-attacks or security breaches.
Disruptions or failures in the physical infrastructure or operating systems that support our businesses and customers, or cyber-attacks or security breaches of the networks, systems or devices that our customers use to access our products and services could result in customer attrition, financial losses, the inability of our customers to transact business with us, violations of applicable privacy and other laws, regulatory fines, penalties or intervention, additional regulatory scrutiny, reputational damage, litigation, reimbursement or other compensation costs, and/or additional compliance costs, any of which could materially and adversely affect our results of operations or financial condition.
The network and computer systems on which we depend could fail or experience security breaches.
Our computer systems could be vulnerable to unforeseen problems. Because we conduct a part of our business over the Internet and outsource several critical functions to third parties, operations will depend on our ability, as well as the ability of third-party service providers, to protect computer systems and network infrastructure against damage from fire, power loss, telecommunications failure, physical break-ins or similar catastrophic events. Any damage or failure that causes interruptions in operations may compromise our ability to perform critical functions in a timely manner and could have a material adverse effect on our business, financial condition and results of operations as well as our reputation and customer or vendor relationships.
In addition, a significant barrier to online financial transactions is the secure transmission of confidential information over public networks. Our Internet banking system relies on encryption and authentication technology to provide the security and authentication necessary to effect secure transmission of confidential information. Advances in computer capabilities, new discoveries in the field of cryptography or other developments could result in a compromise or breach of the algorithms our third-party service providers use to protect customer transaction data. If any such compromise of security were to occur, it could have a material adverse effect on our business, financial condition and results of operations.
The failure to protect our customers’ confidential information and privacy could adversely affect our business.
We are subject to state and federal privacy regulations and confidentiality obligations that, among other things restrict the use and dissemination of, and access to, the information that we produce, store or maintain in the course of our business. We also have contractual obligations to protect certain confidential information we obtain from our existing vendors and customers. These obligations generally include protecting such confidential information in the same manner and to the same extent as we protect our own confidential information, and in some instances may impose indemnity obligations on us relating to unlawful or unauthorized disclosure of any such information.
The actions we may take in order to promote compliance with these obligations vary by business segment and may change over time, but may include, among other things:
|
•
|
Training and educating our employees and independent contractors regarding our obligations relating to confidential information;
|
|
•
|
Monitoring changes in state or federal privacy and compliance requirements;
|
|
•
|
Drafting and enforcing appropriate contractual provisions into any contract that raises proprietary and confidentiality issues;
|
|
•
|
Maintaining secure storage facilities and protocols for tangible records;
|
|
•
|
Physically and technologically securing access to electronic information; and
|
|
•
|
In the event of a security breach, providing credit monitoring or other services to affected customers.
|
If we do not properly comply with privacy regulations and protect confidential information, we could experience adverse consequences, including regulatory sanctions, penalties or fines, increased compliance costs, litigation and damage to our reputation, which in turn could result in decreased revenues and loss of customers, all of which would have a material adverse effect on our business, financial condition and results of operations.
31
Our operations could be interrupted if our third-party service and technology providers experience difficulty, terminate their services or fail to comply with banking regulations.
We depend, and will continue to depend, to a significant extent, on a number of relationships with third-party service and technology providers. Specifically, we receive core systems processing, essential web hosting and other Internet systems and deposit and other processing services from third-party service providers. If these third-party service providers, or if any parties to whom our third party service providers have subcontracted services, experience difficulties or terminate their services and we are unable to replace them with other service providers, our operations could be interrupted and our operating expenses may be materially increased. If an interruption were to continue for a significant period of time, our business financial condition and results of operations could be materially adversely affected. Additionally, if our third-party service and technology providers, including our mortgage loan origination technology provider, fail to update their systems or services in a timely manner to reflect new or changing regulation, our ability to meet regulatory requirements may be impacted and may expose us to heightened regulatory scrutiny and the potential for payment of monetary penalties.
We continually encounter technological change, and we may have fewer resources than many of our competitors to continue to invest in technological improvements.
The financial services industry is undergoing rapid technological changes with frequent introductions of new technology-driven products and services. The effective use of technology increases efficiency and enables financial institutions to better serve customers and to reduce costs. Our future success will depend, in part, upon our ability to address the needs of our clients by using technology to provide products and services that will satisfy client demands for convenience, as well as to create additional efficiencies in our operations. Many national vendors provide turn-key services to community banks, such as Internet banking and remote deposit capture that allow smaller banks to compete with institutions that have substantially greater resources to invest in technological improvements. We may not be able, however, to effectively implement new technology-driven products and services or be successful in marketing these products and services to our customers.
We may be required to recognize impairment with respect to investment securities, including the FHLB stock we hold.
Our securities portfolio currently includes securities with unrecognized losses. We may continue to observe declines in the fair market value of these securities. We evaluate the securities portfolio for any other than temporary impairment each reporting period. In addition, as a condition of membership in the FHLB, we are required to purchase and hold a certain amount of FHLB stock. Our stock purchase requirement is based, in part, upon the outstanding principal balance of advances from the FHLB. Our FHLB stock is carried at cost and is subject to recoverability testing under applicable accounting standards. Future negative changes to the financial condition of the FHLB may require us to recognize an impairment charge with respect to such holdings. The FHLB is currently subject to a Consent Order issued by its primary regulator, the Federal Housing Finance Agency. See “
Regulation and Supervision
” in Item 1 of this Form 10-K for the year ended December 31, 2014.
A change in federal monetary policy could adversely impact our mortgage banking revenues.
The Federal Reserve is responsible for regulating the supply of money in the United States, and as a result its monetary policies strongly influence our costs of funds for lending and investing as well as the rate of return we are able to earn on those loans and investments, both of which impact our net interest income and net interest margin. The Federal Reserve Board's interest rate policies can also materially affect the value of financial instruments we hold, including debt securities and mortgage servicing rights, or MSRs. These monetary policies can also negatively impact our borrowers, which in turn may increase the risk that they will be unable to pay their loans according to the terms or be unable to pay their loans at all. We have no control over the monetary policies of the Federal Reserve Board and cannot predict when changes are expected or what the magnitude of such changes may be.
For example, as a result of the Federal Reserve Board's concerns regarding continued slow economic growth, the Federal Reserve Board, in 2008 implemented its standing monetary policy known as “quantitative easing,” a program involving the purchase of mortgage backed securities and United States Treasury securities, the volume of which was aligned with specific economic targets or measures intended to bolster the U.S. economy. Although the Federal Reserve Board has ended quantitative easing, it still holds the securities purchased during the program and, if economic conditions worsened, could revive that program.
Because a substantial portion of our revenues and our net income historically have been, and in the foreseeable future are expected to be, derived from gain on the origination and sale of mortgage loans and on the continuing servicing of those loans, the Federal Reserve Board's monetary policies may have had the effect of supporting higher revenues than might otherwise be available. If the rebound in employment and real wages is not adequate to offset the termination of the program, or if the
32
Federal Reserve begins selling off the securities it has accumulated, we may see a reduction in mortgage originations throughout the United States, and may see a corresponding rise in interest rates, which could reduce our mortgage origination revenues and in turn have a material adverse impact upon our business.
A substantial portion of our revenue is derived from residential mortgage lending which is a market sector that experiences significant volatility.
A substantial portion of our consolidated net revenues (net interest income plus noninterest income) are derived from originating and selling residential mortgages. Residential mortgage lending in general has experienced substantial volatility in recent periods. An increase in interest rates in the second quarter of 2013 resulted in a significant adverse impact on our business and financial results due primarily to a related decrease in volume of loan originations, especially refinancings. The Federal Reserve has indicated that interest rates may rise again as early as June 2015. Any such increase in interest rates may materially and adversely affect our future loan origination volume, margins, and the value of the collateral securing our outstanding loans, may increase rates of borrower default, and may otherwise adversely affect our business. Additionally, in recent periods we have experienced very low levels of homes available for sale in many of the markets in which we operate. The lack of housing inventory has had a downward impact on the volume of mortgage loans that we originate. Further, it has resulted in elevated costs, as a significant amount of loan processing and underwriting that we perform are to qualifying borrowers for mortgage loan transactions that never materialize. The lack of inventory of homes for sale may continue to have an adverse impact on mortgage loan volumes into the foreseeable future.
We may incur losses due to changes in prepayment rates.
Our mortgage servicing rights carry interest rate risk because the total amount of servicing fees earned, as well as changes in fair-market value, fluctuate based on expected loan prepayments (affecting the expected average life of a portfolio of residential mortgage servicing rights). The rate of prepayment of residential mortgage loans may be influenced by changing national and regional economic trends, such as recessions or depressed real estate markets, as well as the difference between interest rates on existing residential mortgage loans relative to prevailing residential mortgage rates. Changes in prepayment rates are therefore difficult for us to predict. An increase in the general level of interest rates may adversely affect the ability of some borrowers to pay the interest and principal of their obligations. During periods of declining interest rates, many residential borrowers refinance their mortgage loans. The loan administration fee income (related to the residential mortgage loan servicing rights corresponding to a mortgage loan) decreases as mortgage loans are prepaid. Consequently, the fair value of portfolios of residential mortgage loan servicing rights tend to decrease during periods of declining interest rates, because greater prepayments can be expected and, as a result, the amount of loan administration income received also decreases.
We may incur significant losses as a result of ineffective hedging of interest rate risk related to our loans sold with a reservation of servicing rights.
Both the value our single family mortgage servicing rights, or MSRs, and the value of our single family loans held for sale changes with fluctuations in interest rates, among other things, reflecting the changing expectations of mortgage prepayment activity. To mitigate potential losses of fair value of single family loans held for sale and MSRs related to changes in interest rates, we actively hedge this risk with financial derivative instruments. Hedging is a complex process, requiring sophisticated models, experienced and skilled personnel and continual monitoring. Changes in the value of our hedging instruments may not correlate with changes in the value of our single family loans held for sale and MSRs, and we could incur a net valuation loss as a result of our hedging activities. Following the expansion of our single family mortgage operations in early 2012 through the addition of a significant number of single family mortgage origination personnel, the volume of our single family loans held for sale and MSRs has increased. The increase in volume in turn increases our exposure to the risks associated with the impact of interest rate fluctuations on single family loans held for sale and MSRs.
Changes in fee structures by third party loan purchasers and mortgage insurers may decrease our loan production volume and the margin we can recognize on conforming home loans, and may adversely impact our results of operations.
Certain third party loan purchasers revised their fee structures in the third quarter of 2013 and increased the costs of doing business with them. For example, certain purchasers of conforming loans, including Fannie Mae and Freddie Mac, raised costs of guarantee fees and other required fees and payments. These changes increased the cost of mortgages to consumers and the cost of selling conforming loans to third party loan purchasers which in turn decreased our margin and negatively impacted our profitability. Additionally, the FHA raised costs for premiums and extended the period for which private mortgage insurance is required on a loan purchased by them. Additional changes in the future from third party loan purchasers may have a negative impact on our ability to originate loans to be sold because of the increased costs of such loans and may decrease our profitability with respect to loans held for sale. In addition, any significant adverse change in the level of activity in the
33
secondary market or the underwriting criteria of these third party loan purchasers could negatively impact our results of business, operations and cash flows.
If we breach any of the representations or warranties we make to a purchaser or securitizer of our mortgage loans or MSRs, we may be liable to the purchaser or securitizer for certain costs and damages.
When we sell or securitize mortgage loans in the ordinary course of business, we are required to make certain representations and warranties to the purchaser about the mortgage loans and the manner in which they were originated. Our agreements require us to repurchase mortgage loans if we have breached any of these representations or warranties, in which case we may be required to repurchase such loan and record a loss upon repurchase and/or bear any subsequent loss on the loan. We may not have any remedies available to us against a third party for such losses, or the remedies available to us may not be as broad as the remedies available to the purchaser of the mortgage loan against us. In addition, if there are remedies against a third party available to us, we face further risk that such third party may not have the financial capacity to perform remedies that otherwise may be available to us. Therefore, if a purchaser enforces remedies against us, we may not be able to recover our losses from a third party and may be required to bear the full amount of the related loss.
If repurchase and indemnity demands increase on loans or MSRs that we sell from our portfolios, our liquidity, results of operations and financial condition will be adversely affected.
If we breach any representations or warranties or fail to follow guidelines when originating a FHA/HUD-insured loan or a VA-guaranteed loan, we may lose the insurance or guarantee on the loan and suffer losses, pay penalties, and/or be subjected to litigation from the federal government.
We originate and purchase, sell and thereafter service single family loans that are insured by FHA/HUD or guaranteed by the VA. We certify to the FHA/HUD and the VA that the loans meet their requirements and guidelines. The FHA/HUD and VA audit loans that are insured or guaranteed under their programs, including audits of our processes and procedures as well as individual loan documentation. Violations of guidelines can result in monetary penalties or require us to provide indemnifications against loss or loans declared ineligible for their programs. In the past, monetary penalties and losses from indemnifications have not created material losses to the Bank. As a result of the housing crisis, the FHA/HUD has stepped up enforcement initiatives. In addition to regular FHA/HUD audits, HUD's Inspector General has become active in enforcing FHA regulations with respect to individual loans and has partnered with the Department of Justice ("DOJ") in filing lawsuits against lenders for systemic violations. The penalties resulting from such lawsuits can be much more severe, since systemic violations can be applied to groups of loans and penalties may be subject to treble damages. The DOJ has used the Federal False Claims Act and other federal laws and regulations in prosecuting these lawsuits. Because of our significant origination of FHA/HUD insured and VA guaranteed loans, if the DOJ were to find potential violations by the Bank, we could be subject to material monetary penalties and/or losses, and may even be subject to lawsuits alleging systemic violations which could result in treble damages.
We may face risk of loss if we purchase loans from a seller that fails to satisfy its indemnification obligations.
We generally receive representations and warranties from the originators and sellers from whom we purchase loans and servicing rights such that if a loan defaults and there has been a breach of such representations and warranties, we may be able to pursue a remedy against the seller of the loan for the unpaid principal and interest on the defaulted loan. However, if the originator and/or seller breach such representations and warranties and does not have the financial capacity to pay the related damages, we may be subject to the risk of loss for such loan as the originator or seller may not be able to pay such damages or repurchase loans when called upon by us to do so. Currently, we only purchase loans from WMS Series LLC, an affiliated business arrangement with certain Windermere real estate brokerage franchise owners.
Some provisions of our articles of incorporation and bylaws and certain provisions of Washington law may deter takeover attempts, which may limit the opportunity of our shareholders to sell their shares at a favorable price.
Some provisions of our articles of incorporation and bylaws may have the effect of deterring or delaying attempts by our shareholders to remove or replace management, to commence proxy contests, or to effect changes in control. These provisions include:
|
•
|
A classified board of directors so that only approximately one third of our board of directors is elected each year;
|
|
•
|
Elimination of cumulative voting in the election of directors;
|
|
•
|
Procedures for advance notification of shareholder nominations and proposals;
|
|
•
|
The ability of our board of directors to amend our bylaws without shareholder approval; and
|
34
|
•
|
The ability of our board of directors to issue shares of preferred stock without shareholder approval upon the terms and conditions and with the rights, privileges and preferences as the board of directors may determine.
|
In addition, as a Washington corporation, we are subject to Washington law which imposes restrictions on some transactions between a corporation and certain significant shareholders. These provisions, alone or together, could have the effect of deterring or delaying changes in incumbent management, proxy contests or changes in control.
|
ITEM 1B
|
UNRESOLVED STAFF COMMENTS
|
None.
|
ITEM 2
|
PROPERTIES
|
We lease principal offices, which are located in office space in downtown Seattle at 601 Union Street, Suite 2000, Seattle, WA 98101. This office lease provides sufficient space to conduct the management of our business. In addition, we currently lease space for all
94
of our office locations. We own several properties where our retail branches are or will be located including properties in Selah, Washington; Yakima, Washington; Riverside, California; an owned building on ground lease in Issaquah, Washington; as well as two other properties under contract to purchase in Kennewick, Washington and Tacoma, Washington. Our branches include separate lending and retail banking facilities, as well as combined facilities, primarily located in the Pacific Northwest, California and Hawaii.
|
ITEM 3
|
LEGAL PROCEEDINGS
|
Because the nature of our business involves the collection of numerous accounts, the validity of liens and compliance with various state and federal lending laws, we are subject to various legal proceedings in the ordinary course of our business related to foreclosures, bankruptcies, condemnation and quiet title actions and alleged statutory and regulatory violations. We are also subject to legal proceedings in the ordinary course of business related to employment matters. We do not expect that these proceedings, taken as a whole, will have a material adverse effect on our business, financial position or our results of operations. There are currently no matters that, in the opinion of management, would have a material adverse effect on our consolidated financial position, results of operation or liquidity, or for which there would be a reasonable possibility of such a loss based on information known at this time.
|
ITEM 4
|
MINE SAFETY DISCLOSURES
|
Not applicable.
35
|
ITEM 5
|
MARKET FOR REGISTRANT’S COMMON EQUITY, RELATED STOCKHOLDER MATTERS AND ISSUER PURCHASES OF EQUITY SECURITIES
|
Our common stock began trading on the Nasdaq stock market on February 10, 2012 under the symbol “HMST.” Prior to that date, our common stock was not publicly traded. The following table sets forth, for the periods indicated, the high and low reported sales prices per share of the common stock as reported on the Nasdaq Global Select Market, our principal trading market.
|
High
|
Low
|
Special Cash Dividends Declared
|
|||||||||
|
For the year ended December 31, 2014
|
|||||||||||
|
First quarter ended March 31
|
$
|
20.91
|
|
$
|
17.02
|
|
$
|
0.11
|
|
||
|
Second quarter ended June 30
|
19.74
|
|
16.51
|
|
—
|
|
|||||
|
Third quarter ended September 30
|
19.21
|
|
16.90
|
|
—
|
|
|||||
|
Fourth quarter ended December 31
|
17.60
|
|
15.95
|
|
—
|
|
|||||
|
For the year ended December 31, 2013
|
|||||||||||
|
First quarter ended March 31
|
$
|
28.73
|
|
$
|
21.80
|
|
$
|
—
|
|
||
|
Second quarter ended June 30
|
24.69
|
|
19.66
|
|
0.11
|
|
|||||
|
Third quarter ended September 30
|
23.17
|
|
18.97
|
|
0.11
|
|
|||||
|
Fourth quarter ended December 31
|
21.25
|
|
18.48
|
|
0.11
|
|
|||||
As of March 10, 2015, there were 2,692 shareholders of record of our common stock.
Dividend Policy
The Company declared a special cash dividend of $0.11 per share in each of the quarters ended June 30, 2013, September 30, 2013, December 31, 2013 and March 31, 2014.
The amount and timing of future dividends have not been determined. The payment of dividends will depend upon a number of factors, including regulatory capital requirements, the Company’s and the Bank’s liquidity, financial condition and results of operations, strategic growth plans, tax considerations, statutory and regulatory limitations and general economic conditions. The Company's ability to pay dividends to shareholders is significantly dependent on the Bank's ability to pay dividends to the Company, which is limited to the extent necessary for the Bank to meet the regulatory requirements of a “well-capitalized” bank or other formal or informal guidance communicated by our principal regulators. New capital rules implemented on January 1, 2015 have imposed more stringent requirements on the ability of the Bank to maintain “well-capitalized” status and to pay dividends to the Company. See “Regulation of Home Street Bank -
Capital and Prompt Corrective Action Requirements - New Capital Rules
.”
For the foregoing reasons, there can be no assurance that we will pay any further special dividends in any future period.
Sales of Unregistered Securities
Not applicable.
Stock Repurchases in the Fourth Quarter
Not applicable.
36
Equity Compensation Plan Information
The following table gives information about our common stock that may be issued upon the exercise of options, warrants and rights under all of our existing equity compensation plans as of December 31, 2014, including the HomeStreet, Inc. 2014 Equity Incentive Plan (the “2014 Plan”), HomeStreet, Inc. 2010 Equity Incentive Plan (the “2010 Plan”) and the retention grants made in 2010 outside of the 2010 Plan but subject to the terms and conditions of that plan.
|
Plan Category
|
(a) Number of
Securities to be
Issued Upon
Exercise of
Outstanding
Options,
Warrants and
Rights
|
(b) Weighted
Average Exercise
Price of
Outstanding
Options,
Warrants, and
Rights
|
(c) Number of
Securities
Remaining
Available for
Future Issuance
Under Equity
Compensation
Plans (Excluding
Securities Reflected
in Column (a))
|
|
||||||||
|
Plans approved by shareholders
|
685,790
|
|
(1
|
)
|
$
|
12.45
|
|
(2
|
)
|
798,990
|
|
(3)(4)
|
|
Plans not approved by shareholders
(5)
|
15,600
|
|
(5
|
)
|
$
|
0.97
|
|
N/A
|
|
|||
|
Total
|
701,390
|
|
$
|
12.15
|
|
798,990
|
|
|||||
|
(1)
|
Consists of 591,699 shares subject to option grants awarded pursuant to the 2010 Plan, 35,766 shares subject to Restricted Stock Units awarded under the 2014 Plan and 58,325 shares issuable under Performance Share Units awarded under the 2014 Plan, assuming maximum performance goals are met under such awards, resulting in the issuance of the maximum number of shares allowed under those awards.
|
|
(2)
|
Shares issued on vesting of Restricted Stock Units and Performance Stock Units under the 2014 Plan are done without payment by the participant of any additional consideration and therefore have been excluded from this calculation. The weighted average exercise price reflects only the exercise price of the options issued under the 2010 Plan that are still outstanding as of the date of his table.
|
|
(3)
|
Consists of shares remaining available for issuance under the 2014 Plan.
|
|
(4)
|
The 2014 Plan was approved by our shareholders at our last annual meeting and became effective immediately following that meeting on May 29, 2014. The 2014 Plan replaced both the 2010 Plan and the 2011 Plan, which were terminated at that time. While the terms of the 2010 Plan remains in effect for any awards issued under that plan that are still outstanding, new awards may not be granted under the 2010 Plan and the 100,752 shares remaining available for issuance at the time of its termination were added to the pool of shares available for issuance under the 2014 Plan. No awards remain outstanding under the 2011 Plan, and the 148,905 shares remaining available for issuance at the time of termination of that plan were also added to the shares available for issuance under the 2014 Plan.
|
|
(5)
|
Consists of retention equity awards granted in 2010 outside of the 2010 Plan but subject to its terms and conditions.
|
37
Stock Performance Graph
This performance graph shall not be deemed "soliciting material" or to be "filed" with the SEC for purposes of Section 18 of the Securities Exchange Act of 1934, as amended (Exchange Act), or otherwise subject to the liabilities under that Section, and shall not be deemed to be incorporated by reference into any filing of HomeStreet, Inc. under the Securities Act of 1933, as amended, or the Exchange Act.
The following graph shows a comparison from February 10, 2012 (the date our common stock commenced trading on the Nasdaq Stock Market) through December 31, 2014 of the cumulative total return for our common stock, the KBW Bank Index (BKX) and the Russell 2000 (RUT) Index. The graph assumes that $100 was invested at the market close on February 10, 2012 in the common stock of HomeStreet, Inc., the KBW Bank Index and the Russell 2000 Index and data for the KBW Bank Index and the Russell 2000 Index assumes reinvestments of dividends. The stock price performance of the following graph is not necessarily indicative of future stock price performance.
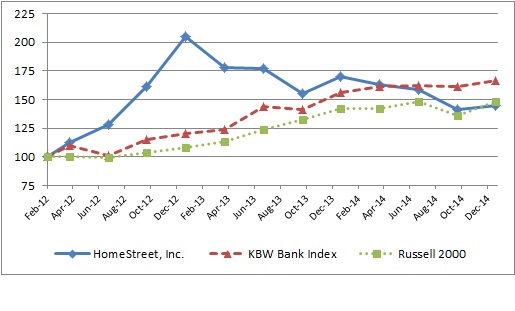
38
|
ITEM 6
|
SELECTED FINANCIAL DATA
|
The data set forth below should be read in conjunction with Item 7, “Management’s Discussion and Analysis of Consolidated Financial Condition and Results of Operations,” and the Consolidated Financial Statements and Notes thereto appearing at Item 8 of this report.
The following table sets forth selected historical consolidated financial and other data for us at and for each of the periods ended as described below. The selected historical consolidated financial data as of December 31, 2014 and 2013 and for each of the years ended December 31, 2014, 2013 and 2012 have been derived from, and should be read together with, our audited consolidated financial statements and related notes included elsewhere in this Form 10-K. The selected historical consolidated financial data as of December 31, 2012, 2011 and 2010 and for each of the years ended December 31, 2011 and 2010 have been derived from our audited consolidated financial statements for those years, which are not included in this Form 10-K. You should read the summary selected historical consolidated financial and other data presented below in conjunction with “Management’s Discussion and Analysis of Financial Condition and Results of Operations” and our financial statements and the notes thereto, which are included elsewhere in this Form 10-K. We have prepared our unaudited information on the same basis as our audited consolidated financial statements and have included, in our opinion, all adjustments that we consider necessary for a fair presentation of the financial information set forth in that information.
|
|
At or for the Year Ended December 31,
|
||||||||||||||||||
|
(dollars in thousands, except share data)
|
2014
|
2013
|
2012
|
2011
|
2010
|
||||||||||||||
|
Income statement data (for the period ended):
|
|||||||||||||||||||
|
Net interest income
|
$
|
98,669
|
|
$
|
74,444
|
|
$
|
60,743
|
|
$
|
48,494
|
|
$
|
39,276
|
|
||||
|
Provision for credit losses
|
(1,000
|
)
|
900
|
|
11,500
|
|
3,300
|
|
37,300
|
|
|||||||||
|
Noninterest income
|
185,657
|
|
190,745
|
|
238,020
|
|
97,205
|
|
90,474
|
|
|||||||||
|
Noninterest expense
|
252,011
|
|
229,495
|
|
183,591
|
|
126,494
|
|
126,000
|
|
|||||||||
|
Income (loss) before income taxes
|
33,315
|
|
34,794
|
|
103,672
|
|
15,905
|
|
(33,550
|
)
|
|||||||||
|
Income tax expense (benefit)
|
11,056
|
|
10,985
|
|
21,546
|
|
(214
|
)
|
697
|
|
|||||||||
|
Net income (loss)
|
$
|
22,259
|
|
$
|
23,809
|
|
$
|
82,126
|
|
$
|
16,119
|
|
$
|
(34,247
|
)
|
||||
|
Basic income (loss) per share
(1)
|
$
|
1.50
|
|
$
|
1.65
|
|
$
|
6.17
|
|
$
|
2.98
|
|
$
|
(6.34
|
)
|
||||
|
Diluted income (loss) per share
(1)
|
$
|
1.49
|
|
$
|
1.61
|
|
$
|
5.98
|
|
$
|
2.80
|
|
$
|
(6.34
|
)
|
||||
|
Common shares outstanding
(1)
|
14,856,611
|
|
14,799,991
|
|
14,382,638
|
|
5,403,498
|
|
5,403,498
|
|
|||||||||
|
Weighted average number of shares outstanding:
|
|||||||||||||||||||
|
Basic
|
14,800,689
|
|
14,412,059
|
|
13,312,939
|
|
5,403,498
|
|
5,403,498
|
|
|||||||||
|
Diluted
|
14,961,081
|
|
14,798,168
|
|
13,739,398
|
|
5,748,342
|
|
5,403,498
|
|
|||||||||
|
Book value per share
|
$
|
20.34
|
|
$
|
17.97
|
|
$
|
18.34
|
|
$
|
15.99
|
|
$
|
10.88
|
|
||||
|
Dividends per share
|
$
|
0.11
|
|
$
|
0.33
|
|
$
|
—
|
|
$
|
—
|
|
$
|
—
|
|
||||
|
Financial position (at year end):
|
|||||||||||||||||||
|
Cash and cash equivalents
|
$
|
30,502
|
|
$
|
33,908
|
|
$
|
25,285
|
|
$
|
263,302
|
|
$
|
72,639
|
|
||||
|
Investment securities
|
455,332
|
|
498,816
|
|
416,517
|
|
329,242
|
|
313,715
|
|
|||||||||
|
Loans held for sale
|
621,235
|
|
279,941
|
|
620,799
|
|
150,409
|
|
212,602
|
|
|||||||||
|
Loans held for investment, net
|
2,099,129
|
|
1,871,813
|
|
1,308,974
|
|
1,300,873
|
|
1,538,521
|
|
|||||||||
|
Mortgage servicing rights
|
123,324
|
|
162,463
|
|
95,493
|
|
77,281
|
|
87,232
|
|
|||||||||
|
Other real estate owned
|
9,448
|
|
12,911
|
|
23,941
|
|
38,572
|
|
170,455
|
|
|||||||||
|
Total assets
|
3,535,090
|
|
3,066,054
|
|
2,631,230
|
|
2,264,957
|
|
2,485,697
|
|
|||||||||
|
Deposits
|
2,445,430
|
|
2,210,821
|
|
1,976,835
|
|
2,009,755
|
|
2,129,742
|
|
|||||||||
|
Federal Home Loan Bank advances
|
597,590
|
|
446,590
|
|
259,090
|
|
57,919
|
|
165,869
|
|
|||||||||
|
Federal funds purchased and securities sold under agreements to repurchase
|
50,000
|
|
—
|
|
—
|
|
—
|
|
—
|
|
|||||||||
|
Total shareholders' equity
|
$
|
302,238
|
|
$
|
265,926
|
|
$
|
263,762
|
|
$
|
86,407
|
|
$
|
58,789
|
|
||||
39
|
|
At or for the Year Ended December 31,
|
||||||||||||||||||
|
(dollars in thousands, except share data)
|
2014
|
2013
|
2012
|
2011
|
2010
|
||||||||||||||
|
Financial position (averages):
|
|||||||||||||||||||
|
Investment securities
|
$
|
459,060
|
|
$
|
515,000
|
|
$
|
410,819
|
|
$
|
306,813
|
|
$
|
457,930
|
|
||||
|
Loans held for investment
|
1,890,537
|
|
1,496,146
|
|
1,303,010
|
|
1,477,976
|
|
1,868,035
|
|
|||||||||
|
Total interest earning assets
|
2,869,414
|
|
2,422,136
|
|
2,167,363
|
|
2,069,858
|
|
2,642,693
|
|
|||||||||
|
Total interest-bearing deposits
|
1,883,622
|
|
1,661,568
|
|
1,644,859
|
|
1,814,464
|
|
2,071,237
|
|
|||||||||
|
Federal Home Loan Bank advances
|
431,623
|
|
293,871
|
|
93,325
|
|
93,755
|
|
382,083
|
|
|||||||||
|
Total interest-bearing liabilities
|
2,386,537
|
|
2,020,613
|
|
1,817,847
|
|
1,970,725
|
|
2,522,767
|
|
|||||||||
|
Shareholders’ equity
|
$
|
289,420
|
|
$
|
249,081
|
|
$
|
211,329
|
|
$
|
68,537
|
|
$
|
89,267
|
|
||||
|
Financial performance:
|
|||||||||||||||||||
|
Return on average shareholders' equity
(2)
|
7.69
|
%
|
9.56
|
%
|
38.86
|
%
|
23.52
|
%
|
(38.00
|
)%
|
|||||||||
|
Return on average total assets
|
0.69
|
%
|
0.88
|
%
|
3.42
|
%
|
0.70
|
%
|
(1.19
|
)%
|
|||||||||
|
Net interest margin
(3)
|
3.51
|
%
|
3.17
|
%
|
(4)
|
2.89
|
%
|
2.36
|
%
|
1.50
|
%
|
||||||||
|
Efficiency ratio
(5)
|
88.63
|
%
|
86.54
|
%
|
61.45
|
%
|
86.82
|
%
|
97.24
|
%
|
|||||||||
|
Credit quality:
|
|||||||||||||||||||
|
Allowance for credit losses
|
$
|
22,524
|
|
$
|
24,089
|
|
$
|
27,751
|
|
$
|
42,800
|
|
$
|
64,566
|
|
||||
|
Allowance for loan losses/total loans
|
1.04
|
%
|
1.26
|
%
|
2.06
|
%
|
3.18
|
%
|
4.00
|
%
|
|||||||||
|
Allowance for loan losses/nonaccrual loans
|
137.51
|
%
|
93.00
|
%
|
92.20
|
%
|
55.81
|
%
|
56.69
|
%
|
|||||||||
|
Total nonaccrual loans
(6)
|
$
|
16,014
|
|
$
|
25,707
|
|
$
|
29,892
|
|
$
|
76,484
|
|
$
|
113,210
|
|
||||
|
Nonaccrual loans/total loans
|
0.75
|
%
|
1.36
|
%
|
2.24
|
%
|
5.69
|
%
|
7.06
|
%
|
|||||||||
|
Other real estate owned
|
$
|
9,448
|
|
$
|
12,911
|
|
$
|
23,941
|
|
$
|
38,572
|
|
$
|
170,455
|
|
||||
|
Total nonperforming assets
|
$
|
25,462
|
|
$
|
38,618
|
|
$
|
53,833
|
|
$
|
115,056
|
|
$
|
283,665
|
|
||||
|
Nonperforming assets/total assets
|
0.72
|
%
|
1.26
|
%
|
2.05
|
%
|
5.08
|
%
|
11.41
|
%
|
|||||||||
|
Net charge-offs
|
$
|
565
|
|
$
|
4,562
|
|
$
|
26,549
|
|
$
|
25,066
|
|
$
|
83,156
|
|
||||
|
Regulatory capital ratios for the bank:
|
|||||||||||||||||||
|
Tier 1 leverage capital (to average assets)
|
9.38
|
%
|
9.96
|
%
|
11.78
|
%
|
6.04
|
%
|
4.52
|
%
|
|||||||||
|
Tier 1 risk-based capital (to risk-weighted assets)
|
13.10
|
%
|
14.12
|
%
|
18.05
|
%
|
9.88
|
%
|
6.88
|
%
|
|||||||||
|
Total risk-based capital (to risk-weighted assets)
|
14.03
|
%
|
15.28
|
%
|
19.31
|
%
|
11.15
|
%
|
8.16
|
%
|
|||||||||
|
SUPPLEMENTAL DATA:
|
|||||||||||||||||||
|
Loans serviced for others:
|
|||||||||||||||||||
|
Single family
|
$
|
11,216,208
|
|
$
|
11,795,621
|
|
$
|
8,870,688
|
|
$
|
6,885,285
|
|
$
|
6,343,158
|
|
||||
|
Multifamily
|
752,640
|
|
720,429
|
|
727,118
|
|
758,535
|
|
776,671
|
|
|||||||||
|
Other
|
82,354
|
|
95,673
|
|
53,235
|
|
56,785
|
|
58,765
|
|
|||||||||
|
Total loans serviced for others
|
$
|
12,051,202
|
|
$
|
12,611,723
|
|
$
|
9,651,041
|
|
$
|
7,700,605
|
|
$
|
7,178,594
|
|
||||
|
Loan origination activity:
|
|||||||||||||||||||
|
Single family
|
$
|
4,697,767
|
|
$
|
4,852,879
|
|
$
|
4,901,073
|
|
$
|
1,721,264
|
|
$
|
2,069,144
|
|
||||
|
Other
|
967,500
|
|
603,271
|
|
255,435
|
|
150,401
|
|
120,058
|
|
|||||||||
|
Total loan origination activity
|
$
|
5,665,267
|
|
$
|
5,456,150
|
|
$
|
5,156,508
|
|
$
|
1,871,665
|
|
$
|
2,189,202
|
|
||||
40
|
(1)
|
Share and per share data shown after giving effect to the 2-for-1 forward stock splits effective March 6, 2012 and November 5, 2012 , as well as the 1-for-2.5 reverse stock split effective July 19, 2011.
|
|
(2)
|
Net earnings (loss) available to common shareholders divided by average common shareholders’ equity.
|
|
(3)
|
Net interest income divided by total average earning assets on a tax equivalent basis.
|
|
(4)
|
Net interest margin for the year ended
December 31, 2013
included $1.4 million in interest expense related to the correction of the cumulative effect of an error in prior years, resulting from the under accrual of interest due on the TruPS for which the Company had deferred the payment of interest. Excluding the impact of the prior period interest expense correction, the net interest margin was
3.23%
for the year ended
December 31, 2013
.
|
|
(5)
|
The efficiency ratio is noninterest expense divided by total revenue (net interest income and noninterest income).
|
|
(6)
|
Generally, loans are placed on nonaccrual status when they are 90 or more days past due.
|
41
|
ITEM 7
|
MANAGEMENT’S DISCUSSION AND ANALYSIS OF FINANCIAL CONDITION AND RESULTS OF OPERATIONS
|
The following discussion should be read in conjunction with the “Selected Consolidated Financial Data” and the Consolidated Financial Statements and the related Notes included in Items 6 and 8 of this Form 10-K. The following discussion contains statements using the words “anticipate,” “believe,” “could,” “estimate,” “expect,” “intend,” “may,” “plan,” “potential,” “should,” “will” and “would” and similar expressions (or the negative of these terms) generally identify forward-looking statements. Such statements involve inherent risks and uncertainties, many of which are difficult to predict and are generally beyond the control of the Company and are subject to risks and uncertainties, including, but not limited to, those discussed below and elsewhere in this Form 10-K, particularly in Item 1A “Risk Factors” that could cause actual results to differ significantly from those projected. Although we believe that expectations reflected in the forward-looking statements are reasonable, we cannot guarantee future results, levels of activity, performance or achievements. We do not intend to update any of the forward-looking statements after the date of this Form 10-K to conform these statements to actual results or changes in our expectations. Readers are cautioned not to place undue reliance on these forward-looking statements, which apply only as of the date of this Form 10-K.
Management's Discussion and Analysis of Financial Condition and Results of Operations should be read in conjunction with the Consolidated Financial Statements and Notes presented elsewhere in this annual report on Form 10-K.
Management’s Overview of 2014 Financial Performance
HomeStreet is a diversified financial services company founded in 1921 and headquartered in Seattle, Washington, serving customers primarily in the Pacific Northwest, California and Hawaii. HomeStreet, Inc. is principally engaged in real estate lending, including mortgage banking activities, and commercial and consumer banking. Our primary subsidiaries are HomeStreet Bank and HomeStreet Capital Corporation. The Bank is a Washington state-chartered savings bank that provides mortgage and commercial loans, deposit products and services, non-deposit investment products, private banking and cash management services. Our primary loan products include single family residential mortgages, loans secured by commercial real estate, construction loans for residential and commercial real estate projects, commercial business loans and agricultural loans. HomeStreet Capital Corporation, a Washington corporation, originates, sells and services multifamily mortgage loans under the Fannie Mae Delegated Underwriting and Servicing Program (“DUS"
®
)
1
in conjunction with HomeStreet Bank. Doing business as HomeStreet Insurance Agency, we provide insurance products and services for consumers and businesses. We also offer single family home loans through our partial ownership in an affiliated business arrangement with WMS Series LLC, whose businesses are known as Windermere Mortgage Services and Penrith Home Loans.
We generate revenue by earning “net interest income” and “noninterest income.” Net interest income is primarily the difference between interest income earned on loans and investment securities less the interest we pay on deposits and other borrowings. We earn noninterest income from the origination, sale and servicing of loans and from fees earned on deposit services and investment and insurance sales.
At
December 31, 2014
, we had total assets of
$3.54 billion
, net loans held for investment of
$2.10 billion
, deposits of
$2.45 billion
and shareholders’ equity of
$302.2 million
. At
December 31, 2013
, we had total assets of
$3.07 billion
, net loans held for investment of
$1.87 billion
, deposits of
$2.21 billion
and shareholders' equity of
$265.9 million
.
In 2014, we continued to execute our strategy of diversifying earnings by expanding the commercial and consumer banking business; growing our mortgage banking market share in existing and new markets; growing and improving the quality of our deposits; and bolstering our processing, compliance and risk management capabilities. Despite substantial growth in home loan centers and mortgage production personnel, our production volume was less than expected due in part to macroeconomic forces and substantial volatility in our single family residential mortgage lending markets caused by a sharp drop in refinance activity since mid-2013 and by very low inventory of homes for sale in most of our lending markets. With the decrease in interest rates in recent months, we have experienced a stronger refinance and purchase mortgage market. However, the lack of housing inventory had the effect of dramatically reducing mortgage loan production compared to what it otherwise may have been through the end of 2014. Further, it resulted in elevated costs, as a significant amount of loan processing and underwriting resources were devoted to qualifying borrowers for mortgage loan transactions that were never consummated. However, we do not anticipate the lack of inventory of homes for sale will continue to have a significant impact on our mortgage loan origination volume in the first quarter of 2015.
Results for
2014
reflect the growth of our mortgage banking business and investments made to expand our commercial and consumer banking business. During
2014
, we increased our lending capacity by adding loan origination and operations
|
(1)
DUS® is a registered trademark of Fannie Mae.
|
42
|
|
personnel in single family lending, commercial real estate lending, and commercial business lending, and opened
11
mortgage loan origination offices and
three
de novo retail deposit branches.
Consolidated Financial Performance
|
|
Year Ended December 31,
|
||||||||||
|
(in thousands, except per share data and ratios)
|
2014
|
2013
|
2012
|
||||||||
|
Selected statement of operations data
|
|||||||||||
|
Total net revenue
(1)
|
$
|
284,326
|
|
$
|
265,189
|
|
$
|
298,763
|
|
||
|
Total noninterest expense
|
252,011
|
|
229,495
|
|
183,591
|
|
|||||
|
Provision (reversal of reserve) for credit losses
|
(1,000
|
)
|
900
|
|
11,500
|
|
|||||
|
Income tax expense
|
11,056
|
|
10,985
|
|
21,546
|
|
|||||
|
Net income
|
22,259
|
|
23,809
|
|
82,126
|
|
|||||
|
Financial performance
|
|||||||||||
|
Diluted income per share
|
$
|
1.49
|
|
$
|
1.61
|
|
$
|
5.98
|
|
||
|
Return on average shareholders’ equity
|
7.69
|
%
|
9.56
|
%
|
38.86
|
%
|
|||||
|
Return on average total assets
|
0.69
|
%
|
0.88
|
%
|
3.42
|
%
|
|||||
|
Net interest margin
|
3.51
|
%
|
3.17
|
%
|
(2)
|
2.89
|
%
|
||||
|
Capital ratios (Bank only)
|
|||||||||||
|
Tier 1 leverage capital (to average assets)
|
9.38
|
%
|
9.96
|
%
|
11.78
|
%
|
|||||
|
Tier 1 risk-based capital (to risk-weighted assets)
|
13.10
|
%
|
14.12
|
%
|
18.05
|
%
|
|||||
|
Total risk-based capital (to risk-weighted assets)
|
14.03
|
%
|
15.28
|
%
|
19.31
|
%
|
|||||
|
(1)
|
Total net revenue is net interest income and noninterest income.
|
|
(2)
|
Net interest margin for the year ended
December 31, 2013
included $1.4 million in interest expense related to the correction of the cumulative effect of an error in prior years, resulting from the under accrual of interest due on the Trust Preferred Securities ("TruPS") for which the Company had deferred the payment of interest. Excluding the impact of the prior period interest expense correction, the net interest margin was
3.23%
for the year ended
December 31, 2013
.
|
For
2014
, we reported net income of
$22.3 million
, or
$1.49
per diluted share, compared to
$23.8 million
, or
$1.61
per diluted share, for
2013
. Net interest margin was
3.51%
for
2014
, compared to
3.17%
for
2013
. Return on average equity was
7.69%
for
2014
, compared to
9.56%
for
2013
, while the return on average assets was
0.69%
for
2014
, compared to
0.88%
for
2013
.
Commercial and Consumer Banking Segment Results
Commercial and Consumer Banking segment net income increased to
$14.7 million
for the year ended
December 31, 2014
from
$6.0 million
for the year ended
December 31, 2013
, primarily due to increased net interest income, reflecting higher average balances of portfolio loans and lower provision for credit losses due to improvement in our loan credit quality.
Commercial and Consumer Banking segment net interest income was
$82.0 million
for the year ended
December 31, 2014
,
an increase
of
$22.8 million
, or
38.6%
, from
$59.2 million
for the year ended
December 31, 2013
, primarily due to higher average balances of and higher yields on portfolio loans, as well as improved composition of deposit balances. The continued improvement in the composition of deposits was primarily the result of our successful efforts to attract transaction and savings deposit balances through effective brand marketing.
In recognition of our improving credit trends and lower charge-offs, we recorded a
$1.0 million
reversal to the provision for loan losses for the year ended
December 31, 2014
, compared to a provision for loan losses of
$900 thousand
for the year ended
December 31, 2013
. Net charge-offs were
$565 thousand
in
2014
, compared to
$4.6 million
in
2013
. Overall, the allowance for loan losses (which excludes the allowance for unfunded commitments) was
1.04%
of loans held for investment at
December 31, 2014
, compared to
1.26%
at
December 31, 2013
, which primarily reflected the improved credit quality of the Company's loan portfolio. Excluding acquired loans, the allowance for loan losses as a percentage of total loans was
1.10%
at
December 31, 2014
, compared to
1.40%
of total loans at
December 31, 2013
. Nonperforming assets of
$25.5 million
, or
0.72%
43
of total assets at
December 31, 2014
, were down significantly from
December 31, 2013
when nonperforming assets were
$38.6 million
, or
1.26%
of total assets.
Mortgage Banking Segment Results
Mortgage Banking segment net income was
$7.5 million
for the year ended
December 31, 2014
, compared to net income of
$17.8 million
for the year ended
December 31, 2013
. The decrease in net income was primarily the result of lower gain on sale margins.
Mortgage Banking noninterest income of
$167.0 million
for the year ended
December 31, 2014
decreased
$8.7 million
, or
4.9%
, from
$175.7 million
for the year ended
December 31, 2013
, primarily due to lower gain on sale margins on our mortgage loan production. Our single family mortgage interest rate lock commitments of
$4.34 billion
in
2014
increased
11.2%
, compared to
$3.91 billion
in the
2013
. However, we experienced lower gain on sale margins on our interest rate lock commitments during
2014
compared to
2013
. Rising mortgage interest rates beginning in the second quarter of 2013 caused a significant decrease in refinancing activity that was only partially offset by a slightly stronger purchase mortgage market. At the same time, the mortgage market became substantially more competitive as lenders tried to secure a reliable flow of production through competitive pricing. Partially offsetting these decreases was increases to noninterest income due to increases in the fair value of MSRs resulting from slower than expected long-term prepayment speeds.
Mortgage Banking noninterest expense of
$172.2 million
for the year ended
December 31, 2014
increased
$8.8 million
, or
5.4%
, from
$163.4 million
for the year ended
December 31, 2013
, primarily due to increased salaries and related costs, as well as occupancy and information services expenses related to the addition of approximately
84
mortgage originators and mortgage fulfillment personnel as we grew our single family mortgage lending network.
Regulatory Matters
The Bank remains well-capitalized, with Tier 1 leverage and total risk-based capital ratios at
December 31, 2014
of
9.38%
and
14.03%
, respectively, compared with
9.96%
and
15.28%
at
December 31, 2013
.
On January 1, 2015, the Company and the Bank became subject to new capital standards commonly referred to as “Basel III” which raised our minimum capital requirements. For more on the Basel III requirements as they apply to us, please see “Capital Management – New Capital Regulations" within the Liquidity and Capital Resources section of this Form 10-K. In preparation for the higher capital targets under these new regulatory requirements and to better diversify our balance sheet and improve our risk profile, we sold single family mortgage loans that previously were held for investment and sold single family mortgage servicing rights during the first half of 2014.
Recent Developments
On March 1, 2015, the Company completed its acquisition of Simplicity Bancorp, Inc., a Maryland corporation (“Simplicity”) and Simplicity’s wholly owned subsidiary, Simplicity Bank. The acquisition was accomplished by the merger of Simplicity with and into HomeStreet, Inc. with HomeStreet, Inc. as the surviving corporation, followed by the merger of Simplicity Bank with and into HomeStreet Bank with HomeStreet Bank as the surviving subsidiary. The results of operations of Simplicity will be included in the consolidated results of operations from the date of acquisition. The merger represents a significant expansion of HomeStreet’s commercial and consumer banking activities in Southern California.
Under the terms of the 100% stock agreement, Simplicity stockholders received one share of HomeStreet common stock for each share owned of Simplicity common stock.
As a result of the March 1, 2015 merger with Simplicity Bank, we expect an improvement in the capital ratios of the Company and the Bank under the new Basel III capital rules compared to what they otherwise may have been.
Critical Accounting Policies and Estimates
The preparation of financial statements in accordance with the accounting principles generally accepted in the United States ("U.S. GAAP") requires management to make a number of judgments, estimates and assumptions that affect the reported amount of assets, liabilities, income and expense in the financial statements. Various elements of our accounting policies, by their nature, involve the application of highly sensitive and judgmental estimates and assumptions. Some of these policies and estimates relate to matters that are highly complex and contain inherent uncertainties. It is possible that, in some instances,
44
different estimates and assumptions could reasonably have been made and used by management, instead of those we applied, which might have produced different results that could have had a material effect on the financial statements.
We have identified the following accounting policies and estimates that, due to the inherent judgments and assumptions and the potential sensitivity of the financial statements to those judgments and assumptions, are critical to an understanding of our financial statements. We believe that the judgments, estimates and assumptions used in the preparation of the Company's financial statements are appropriate. For a further description of our accounting policies, see Note 1–
Summary of Significant Accounting Policies
in the financial statements included in this Form 10-K.
Allowance for Loan Losses
The allowance for loan losses represents management’s estimate of incurred credit losses inherent within our loan portfolio. Determining the appropriateness of the allowance is complex and requires judgment by management about the effect of matters that are inherently uncertain. Subsequent evaluations of the loan portfolio, in light of the factors then prevailing, may result in significant changes in the allowance for loan losses in those future periods.
We employ a disciplined process and methodology to establish our allowance for loan losses that has two basic components: first, an asset-specific component involving the identification of impaired loans and the measurement of impairment for each individual loan identified; and second, a formula-based component for estimating probable principal losses for all other loans.
An asset-specific allowance for impaired loans is established based on the amount of impairment calculated on those loans and charging off amounts determined to be uncollectible. A loan is considered impaired when it is probable that all contractual principal and interest payments due will not be collected substantially in accordance with the terms of the loan agreement. Factors we consider in determining whether a loan is impaired include payment status, collateral value, borrower financial condition, guarantor support and the probability of collecting scheduled principal and interest payments when due.
When a loan is identified as impaired, impairment is measured as the difference between the recorded investment in the loan and the present value of expected future cash flows discounted at the loan’s effective interest rate or based on the loan’s observable market price. For impaired collateral-dependent loans, impairment is measured as the difference between the recorded investment in the loan and the fair value of the underlying collateral. The fair value of the collateral is adjusted for the estimated cost to sell if repayment or satisfaction of a loan is dependent on the sale (rather than only on the operation) of the collateral. In accordance with our appraisal policy, the fair value of impaired collateral-dependent loans is based upon independent third-party appraisals or on collateral valuations prepared by in-house appraisers, which generally are updated every twelve months. We require an independent third-party appraisal at least annually for substandard loans and other real estate owned ("OREO"). Once a third-party appraisal is six months old, or if our chief appraiser determines that market conditions, changes to the property, changes in intended use of the property or other factors indicate that an appraisal is no longer reliable, we perform an internal collateral valuation to assess whether a change in collateral value requires an additional adjustment to carrying value. A collateral valuation is a restricted-use report prepared by our internal appraisal staff in accordance with our appraisal policy. Upon the receipt of an updated appraisal or collateral valuation, loan impairments are remeasured and recorded. If the calculated impairment is determined to be permanent, fixed or nonrecoverable, the impairment will be charged off. Loans designated as impaired are generally placed on nonaccrual and remain in that status until all principal and interest payments are current and the prospects for future payments in accordance with the loan agreement are reasonably assured, at which point the loan is returned to accrual status. See "
Credit Risk Management – Asset Quality and Nonperforming Assets
” discussions within Management's Discussion and Analysis of this Form 10-K.
In estimating the formula-based component of the allowance for loan losses, loans are segregated into loan classes. Loans are designated into loan classes based on loans pooled by product types and similar risk characteristics or areas of risk concentration. Credit loss assumptions are estimated using a model that categorizes loan pools based on loan type and asset quality rating ("AQR") or delinquency bucket. This model calculates an expected loss percentage for each loan category by considering the probability of default, based on the migration of loans from performing to loss by AQR or delinquency buckets using one-year analysis periods, and the potential severity of loss, based on the aggregate net lifetime losses incurred per loan class.
The formula-based component of the allowance for loan losses also considers qualitative factors for each loan class, including the following changes in:
|
•
|
lending policies and procedures;
|
|
•
|
international, national, regional and local economic business conditions and developments that affect the collectability of the portfolio, including the condition of various markets;
|
45
|
•
|
the nature of the loan portfolio, including the terms of the loans;
|
|
•
|
the experience, ability and depth of the lending management and other relevant staff;
|
|
•
|
the volume and severity of past due and adversely classified or graded loans and the volume of nonaccrual loans;
|
|
•
|
the quality of our loan review and process;
|
|
•
|
the value of underlying collateral for collateral-dependent loans;
|
|
•
|
the existence and effect of any concentrations of credit and changes in the level of such concentrations; and
|
|
•
|
the effect of external factors such as competition and legal and regulatory requirements on the level of estimated credit losses in the existing portfolio.
|
Qualitative factors are expressed in basis points and are adjusted downward or upward based on management’s judgment as to the potential loss impact of each qualitative factor to a particular loan pool at the date of the analysis.
The provision for loan losses recorded through earnings is based on management’s assessment of the amount necessary to maintain the allowance for loan losses at a level appropriate to cover probable incurred losses inherent within the loans held for investment portfolio. The amount of provision and the corresponding level of allowance for loan losses are based on our evaluation of the collectability of the loan portfolio based on historical loss experience and other significant qualitative factors.
The allowance for loan losses, as reported in our consolidated statements of financial condition, is adjusted by a provision for loan losses, which is recognized in earnings, and reduced by the charge-off of loan amounts, net of recoveries. For further information on the allowance for loan losses, see Note 5–
Loans and Credit Quality
in the notes to the financial statements of this Form 10-K.
Fair Value of Financial Instruments, Single Family MSRs and OREO
A portion of our assets are carried at fair value, including single family mortgage servicing rights, single family loans held for sale, interest rate lock commitments, investment securities available for sale and derivatives used in our hedging programs. Fair value is defined as the price that would be received to sell an asset or paid to transfer a liability in an orderly transaction between market participants at the measurement date.
Fair value is based on quoted market prices, when available. If a quoted price for an asset or liability is not available, the Company uses valuation models to estimate its fair value. These models incorporate inputs such as forward yield curves, loan prepayment assumptions, expected loss assumptions, market volatilities, and pricing spreads utilizing market-based inputs where readily available. We believe our valuation methods are appropriate and consistent with those that would be used by other market participants. However, imprecision in estimating unobservable inputs and other factors may result in these fair value measurements not reflecting the amount realized in an actual sale or transfer of the asset or liability in a current market exchange.
A three-level valuation hierarchy has been established under the Financial Accounting Standards Board ("FASB") Accounting Standards Codification ("ASC") Topic 820 for disclosure of fair value measurements. The valuation hierarchy is based on the observability of inputs to the valuation of an asset or liability as of the measurement date. A financial instrument’s categorization within the valuation hierarchy is based on the lowest level of input that is significant to the fair value measurement. The levels are defined as follows:
|
•
|
Level 1 – Quoted prices (unadjusted) in active markets for identical assets or liabilities that the reporting entity can access at the measurement date. An active market for the asset or liability is a market in which transactions for the asset or liability take place with sufficient frequency and volume to provide pricing information on an ongoing basis.
|
|
•
|
Level 2 – Inputs other than quoted prices included within Level 1 that are observable for the asset or liability, either directly or indirectly. This includes quoted prices for similar assets and liabilities in active markets and inputs that are observable for the asset or liability for substantially the full term of the financial instrument.
|
|
•
|
Level 3 – Unobservable inputs for the asset or liability. These inputs reflect the Company’s assumptions of what market participants would use in pricing the asset or liability.
|
Significant judgment is required to determine whether certain assets and liabilities measured at fair value are included in Level 2 or Level 3. When making this judgment, we consider all available information, including observable market data, indications
46
of market liquidity and orderliness, and our understanding of the valuation techniques and significant inputs used. The classification of Level 2 or Level 3 is based upon the specific facts and circumstances of each instrument or instrument category and judgments are made regarding the significance of the Level 3 inputs to an instrument's fair value measurement in its entirety. If Level 3 inputs are considered significant, the instrument is classified as Level 3.
As of
December 31, 2014
, our Level 3 recurring fair value measurements consisted of single family MSRs and interest rate lock commitments.
On a quarterly basis, our Asset/Liability Management Committee ("ALCO") and the Finance Committee of the Board review significant modeling variables used to measure the fair value of the Company’s financial instruments, including the significant inputs used in the valuation of single family MSRs. Additionally, at least annually ALCO obtains an independent review of the MSR valuation process and procedures, including a review of the model architecture and the valuation assumptions. We obtain an MSR valuation from an independent valuation firm monthly to assist with the validation of our fair value estimate and the reasonableness of the assumptions used in measuring fair value.
In addition to the recurring fair value measurements, from time to time the Company may have certain nonrecurring fair value measurements. These fair value measurements usually result from the application of lower of cost or fair value accounting or impairment of individual assets. As of
December 31, 2014
and
2013
, the Company's Level 3 nonrecurring fair value measurements were based on the appraised value of collateral used as the basis for the valuation of collateral dependent loans held for investment and OREO.
Real estate valuations are overseen by our appraisal department, which is independent of our lending and credit administration functions. The appraisal department maintains the appraisal policy and recommends changes to the policy subject to approval by the Credit Committee of the Company's Board of Directors and Company's Loan Committee (the "Loan Committee"), established by the Credit Committee of the Company's Board of Directors and comprised of certain of the Company's management. Appraisals are prepared by independent third-party appraisers and our internal appraisers. Appraisals are reviewed either by our in-house appraisal staff or by independent and qualified third-party appraisers.
For further information on the fair value of financial instruments, single family MSRs and OREO, see Note 1–
Summary of Significant Accounting Policies,
Note 12–
Mortgage Banking Operations
and Note 17–
Fair Value Measurements
in the notes to the financial statements of this Form 10-K.
Income Taxes
In establishing an income tax provision, we must make judgments and interpretations about the application of inherently complex tax laws. We must also make estimates about when in the future certain items will affect taxable income. Our interpretations may be subject to review during examination by taxing authorities and disputes may arise over the respective tax positions. We monitor tax authorities and revise our estimates of accrued income taxes due to changes in income tax laws and their interpretation by the courts and regulatory authorities on a quarterly basis. Revisions of our estimate of accrued income taxes also may result from our own income tax planning and strategies and from the resolution of income tax controversies. Such revisions in our estimates may be material to our operating results for any given reporting period.
Income taxes are accounted for using the asset and liability method, which requires the recognition of deferred tax assets and liabilities for the expected future tax consequences of events that have been included in the financial statements. Under this method, a deferred tax asset or liability is determined based on the differences between the financial statements and tax basis of assets and liabilities using enacted tax rates in effect for the year in which the differences are expected to reverse. The effect of a change in tax rates on deferred tax assets and liabilities is recognized in income in the period that includes the enactment date.
The Company records net deferred tax assets to the extent it is believed that these assets will more likely than not be realized. In making such determination, management considers all available positive and negative evidence, including future reversals of existing taxable temporary differences, projected future taxable income, tax planning strategies and recent financial operations. After reviewing and weighing all of the positive and negative evidence, if the positive evidence outweighs the negative evidence, then the Company does not record a valuation allowance for deferred tax assets. If the negative evidence outweighs the positive evidence, then a valuation allowance for all or a portion of the deferred tax assets is recorded.
The Company recognizes interest and penalties related to unrecognized tax benefits as income tax expense in the consolidated statements of operations. Accrued interest and penalties are included within the related tax liability line in the consolidated statements of financial condition. For further information regarding income taxes, see Note 14–
Income Taxes
to the financial statements of this Form 10-K.
47
Results of Operations
Average Balances and Rates
Average balances, together with the total dollar amounts of interest income and expense, on a tax equivalent basis related to such balances and the weighted average rates were as follows:
|
Year Ended December 31,
|
||||||||||||||||||||||
|
|
2014
|
2013
|
||||||||||||||||||||
|
(in thousands)
|
Average
Balance
|
Interest
|
Average
Yield/Cost
|
Average
Balance
|
Interest
|
Average
Yield/Cost
|
||||||||||||||||
|
Assets
|
||||||||||||||||||||||
|
Interest-earning assets
(1)
|
||||||||||||||||||||||
|
Cash and cash equivalents
|
$
|
31,137
|
|
$
|
58
|
|
0.18
|
%
|
$
|
29,861
|
|
$
|
73
|
|
0.24
|
%
|
||||||
|
Investment securities
|
459,060
|
|
12,945
|
|
2.82
|
|
515,000
|
|
14,608
|
|
2.84
|
|
||||||||||
|
Loans held for sale
|
488,680
|
|
18,569
|
|
3.80
|
|
381,129
|
|
14,180
|
|
3.72
|
|
||||||||||
|
Loans held for investment
|
1,890,537
|
|
81,659
|
|
4.32
|
|
1,496,146
|
|
62,384
|
|
4.17
|
|
||||||||||
|
Total interest-earning assets
|
2,869,414
|
|
113,231
|
|
3.95
|
|
2,422,136
|
|
91,245
|
|
3.77
|
|
||||||||||
|
Noninterest-earning assets
(2)
|
335,037
|
|
296,078
|
|
||||||||||||||||||
|
Total assets
|
$
|
3,204,451
|
|
$
|
2,718,214
|
|
||||||||||||||||
|
Liabilities and shareholders’ equity
|
||||||||||||||||||||||
|
Deposits
|
||||||||||||||||||||||
|
Interest-bearing demand accounts
|
$
|
270,634
|
|
$
|
939
|
|
0.35
|
%
|
$
|
238,552
|
|
$
|
925
|
|
0.38
|
%
|
||||||
|
Savings accounts
|
173,678
|
|
937
|
|
0.54
|
|
122,602
|
|
545
|
|
0.44
|
|
||||||||||
|
Money market accounts
|
980,045
|
|
4,361
|
|
0.45
|
|
810,666
|
|
3,899
|
|
0.48
|
|
||||||||||
|
Certificate accounts
|
459,265
|
|
3,195
|
|
0.70
|
|
489,748
|
|
5,053
|
|
1.03
|
|
||||||||||
|
Total interest-bearing deposits
|
1,883,622
|
|
9,432
|
|
0.50
|
|
1,661,568
|
|
10,422
|
|
0.64
|
|
||||||||||
|
Federal Home Loan Bank advances
|
431,623
|
|
1,990
|
|
0.46
|
|
293,871
|
|
1,532
|
|
0.52
|
|
||||||||||
|
Securities sold under agreements to repurchase
|
8,977
|
|
22
|
|
0.25
|
|
2,721
|
|
11
|
|
0.40
|
|
||||||||||
|
Long-term debt
|
62,315
|
|
1,121
|
|
1.80
|
|
62,349
|
|
2,546
|
|
(3)
|
4.03
|
|
|||||||||
|
Other borrowings
|
—
|
|
49
|
|
—
|
|
104
|
|
20
|
|
19.23
|
|
||||||||||
|
Total interest-bearing liabilities
|
2,386,537
|
|
12,614
|
|
0.53
|
|
2,020,613
|
|
14,531
|
|
0.72
|
|
||||||||||
|
Noninterest-bearing liabilities
|
528,494
|
|
448,520
|
|
||||||||||||||||||
|
Total liabilities
|
2,915,031
|
|
2,469,133
|
|
||||||||||||||||||
|
Shareholders' equity
|
289,420
|
|
249,081
|
|
||||||||||||||||||
|
Total liabilities and shareholders’ equity
|
$
|
3,204,451
|
|
$
|
2,718,214
|
|
||||||||||||||||
|
Net interest income
(4)
|
$
|
100,617
|
|
$
|
76,714
|
|
||||||||||||||||
|
Net interest spread
|
3.42
|
%
|
3.05
|
%
|
||||||||||||||||||
|
Impact of noninterest-bearing sources
|
0.09
|
%
|
0.12
|
%
|
||||||||||||||||||
|
Net interest margin
|
3.51
|
%
|
3.17
|
%
|
||||||||||||||||||
|
(1)
|
The average balances of nonaccrual assets and related income, if any, are included in their respective categories.
|
|
(2)
|
Includes former loan balances that have been foreclosed and are now reclassified to OREO.
|
|
(3)
|
Interest expense for the year ended December 31, 2013 included $1.4 million recorded in the first quarter of 2013 related to the correction of the cumulative effect of an error in prior years, resulting from the under accrual of interest due on our Trust Preferred Securities for which the Company had deferred payment of interest. Excluding the impact of the prior period interest expense correction, the net interest margin was
3.23%
.
|
|
(4)
|
Includes taxable-equivalent adjustments primarily related to tax-exempt income on certain loans and securities of
$1.9 million
and
$2.3 million
for the years ended
2014
and
2013
, respectively. The estimated federal statutory tax rate was
35%
for the periods presented.
|
48
Interest on Nonaccrual Loans
We do not include interest collected on nonaccrual loans in interest income. When we place a loan on nonaccrual status, we reverse the accrued unpaid interest receivable against interest income and amortization of any net deferred fees is suspended. Additionally, if interest is received on nonaccrual loans, the interest collected on the loan is recognized as an adjustment to the cost basis of the loan. The net decrease to interest income due to adjustments made for nonaccrual loans, including the effect of additional interest income that would have been recorded during the period if the loans had been accruing, was
$2.8 million
and
$4.6 million
for the years ended
December 31, 2014
and
2013
, respectively.
Rate and Volume Analysis
The following table presents the extent to which changes in interest rates and changes in the volume of our interest-earning assets and interest-bearing liabilities have affected our interest income and interest expense, excluding interest income from nonaccrual loans. Information is provided in each category with respect to: (1) changes attributable to changes in volume (changes in volume multiplied by prior rate), (2) changes attributable to changes in rate (changes in rate multiplied by prior volume), (3) changes attributable to changes in rate and volume (change in rate multiplied by change in volume), which were allocated in proportion to the percentage change in average volume and average rate and included in the relevant column and (4) the net change.
|
|
Year Ended December 31,
|
||||||||||
|
|
2014 vs. 2013
|
||||||||||
|
|
Increase (Decrease)
Due to
|
Total Change
|
|||||||||
|
(in thousands)
|
Rate
|
Volume
|
|||||||||
|
Assets
|
|||||||||||
|
Interest-earning assets
|
|||||||||||
|
Cash and cash equivalents
|
$
|
(19
|
)
|
$
|
3
|
|
$
|
(16
|
)
|
||
|
Investment securities
|
(75
|
)
|
(1,588
|
)
|
(1,663
|
)
|
|||||
|
Loans held for sale
|
388
|
|
4,002
|
|
4,390
|
|
|||||
|
Loans held for investment
|
2,829
|
|
16,446
|
|
19,275
|
|
|||||
|
Total interest-earning assets
|
3,123
|
|
18,863
|
|
21,986
|
|
|||||
|
Liabilities
|
|||||||||||
|
Deposits
|
|||||||||||
|
Interest-bearing demand accounts
|
(112
|
)
|
125
|
|
13
|
|
|||||
|
Savings accounts
|
165
|
|
227
|
|
392
|
|
|||||
|
Money market accounts
|
(352
|
)
|
815
|
|
463
|
|
|||||
|
Certificate accounts
|
(1,544
|
)
|
(314
|
)
|
(1,858
|
)
|
|||||
|
Total interest-bearing deposits
|
(1,843
|
)
|
853
|
|
(990
|
)
|
|||||
|
Federal Home Loan Bank advances
|
(260
|
)
|
718
|
|
458
|
|
|||||
|
Securities sold under agreements to repurchase
|
(14
|
)
|
25
|
|
11
|
|
|||||
|
Long-term debt
|
(1,424
|
)
|
(1
|
)
|
(1,425
|
)
|
|||||
|
Other borrowings
|
29
|
|
—
|
|
29
|
|
|||||
|
Total interest-bearing liabilities
|
(3,512
|
)
|
1,595
|
|
(1,917
|
)
|
|||||
|
Total changes in net interest income
|
$
|
6,635
|
|
$
|
17,268
|
|
$
|
23,903
|
|
||
49
Net Income
For the year ended
2014
, we reported net income of
$22.3 million
,
a decrease
of
$1.6 million
, or
6.5%
, compared to net income of
$23.8 million
in
2013
. The decrease to net income in
2014
mainly resulted from a
$22.5 million
, or
9.8%
,
increase
in noninterest expense compared to
2013
, primarily due to increased salaries and related costs and increased information services costs as we continued to grow our business and market share in
2014
. This decrease to net income was largely offset by a
$24.2 million
, or
32.5%
, increase in net interest income in
2014
as a result of higher average balances of loans held for investment.
Net Interest Income
Our profitability depends significantly on net interest income, which is the difference between income earned on our interest-earning assets, primarily loans and investment securities, and interest paid on interest-bearing liabilities. Our interest-bearing liabilities consist primarily of deposits and borrowed funds, including our outstanding trust preferred securities ("TruPS") and advances from the Federal Home Loan Bank of Seattle ("FHLB").
Net interest income on a tax equivalent basis was
$100.6 million
for the year ended December 31,
2014
,
an increase
of
$23.9 million
, or
31.2%
, from
$76.7 million
for the year ended December 31,
2013
. During
2014
, total interest income
increased
$22.0 million
from
2013
, while total interest expense
decreased
$1.9 million
from
2013
. The net interest margin for the year ended December 31,
2014
improved to
3.51%
from
3.17%
in
2013
. Total average interest-earning assets increased in
2014
primarily as a result of growth in new portfolio loan originations, partially offset by a decrease in investment securities. Total average interest-bearing deposit balances increased from
2013
mostly as a result of an increase in transaction and savings deposits. The improvement in our net interest income and net interest margin in large part reflected the execution of our deposit product and pricing strategies, as growth in transaction and savings account balances partially offset maturities of higher yielding certificates of deposit. Additionally, we increased our net interest income through increased commercial portfolio lending as we continued to grow our Commercial and Consumer Banking segment.
Total average interest-earning assets increased in
2014
, primarily as a result of growth in average loans held for investment, both from originations and from the fourth quarter 2013 acquisitions. Total average interest-bearing deposit balances increased from the prior periods primarily due to acquisition-related and organic growth in transaction and savings deposits.
Total interest income on a tax equivalent basis of
$113.2 million
in
2014
increased
$22.0 million
, or
24.1%
, from
$91.2 million
in
2013
, primarily resulting from higher average balances of loans held for investment, which
increased
$394.4 million
, or
26.4%
, from
2013
. These increases were partially offset by a decrease in the average balance of investment securities, which
decreased
$55.9 million
, or
10.9%
, from
2013
.
Total interest expense of
$12.6 million
in
2014
decreased
$1.9 million
, or
13.2%
, from
$14.5 million
in
2013
. This decrease was primarily due to a 33 basis point decline in the average interest rates paid on the average balances of certificates of deposit, partially offset by an increase in lower cost transaction and savings deposits as we expand our deposit branch network. Included in interest expense for
2013
was expense of $1.4 million related to the correction of the cumulative effect of an immaterial error in prior years, resulting from the under accrual of interest due on the TruPS for which the Company had deferred the payment of interest.
Provision for Loan Losses
Management believes that the Company’s allowance for loan losses is at a level appropriate to cover estimated incurred losses inherent within the loans held for investment portfolio. Our credit risk profile has improved since
December 31, 2013
as illustrated by the credit trends below.
In recognition of our improving credit trends and lower charge-offs, we recorded a reversal of provision for credit losses of
$1.0 million
in
2014
, compared to a provision for credit losses of
$900 thousand
in
2013
. Nonaccrual loans declined to
$16.0 million
at
December 31, 2014
,
a decrease
of
$9.7 million
, or
37.7%
, from
$25.7 million
at
December 31, 2013
. Nonaccrual loans as a percentage of total loans was
0.75%
at
December 31, 2014
, compared to
1.36%
at
December 31, 2013
. Loan delinquencies also decreased, with total loans past due decreasing to
2.99%
of loans held for investment at
December 31, 2014
, compared to
4.44%
at
December 31, 2013
. Overall, the allowance for credit losses decreased to
$22.5 million
, or
1.06%
of loans held for investment at
December 31, 2014
, down from
$24.1 million
, or
1.27%
of total loans held for investment at
December 31, 2013
.
50
Net charge-offs of
$565 thousand
for
2014
were down
$4.0 million
, or
87.6%
, from net charge-offs of
$4.6 million
for
2013
. For a more detailed discussion on our allowance for loan losses and related provision for loan losses, see "-
Credit Risk Management"
in this Form 10-K.
Noninterest Income
Noninterest income was
$185.7 million
for the year ended
December 31, 2014
,
a decrease
of
$5.1 million
, or
2.7%
, from noninterest income of
$190.7 million
for
2013
. Our noninterest income is heavily dependent upon our single family mortgage banking activities, which are comprised of mortgage origination and sale and mortgage servicing activities. The level of our mortgage banking activity fluctuates and is influenced by mortgage interest rates, the economy, employment, and housing supply and affordability, among other factors. The decrease in noninterest income in
2014
compared to
2013
was primarily the result of a
$20.6 million
decrease in net gain on mortgage loan origination and sale activities, partially offset by a
$17.0 million
increase in mortgage servicing income. Our single family mortgage interest rate lock commitments of
$4.34 billion
in
2014
increased
11.2%
, compared to
$3.91 billion
in the
2013
. However, we experienced lower gain on sale margins on our interest rate lock commitments during
2014
compared to
2013
. Included in noninterest income for the year ended
2014
were a
$4.7 million
pre-tax net increase in mortgage servicing income resulting from the sale of MSRs and a
$4.6 million
pre-tax gain on single family mortgage origination and sale activities from the sale of loans that were originally held for investment. No similar transactions occurred in the year ended
2013
.
Noninterest income consisted of the following:
|
|
Year Ended December 31,
|
Dollar
Change
|
Percentage Change
|
|||||||||||
|
(in thousands)
|
2014
|
2013
|
||||||||||||
|
Net gain on mortgage loan origination and sale activities
(1)
|
$
|
144,122
|
|
(2)
|
$
|
164,712
|
|
$
|
(20,590
|
)
|
(13
|
)%
|
||
|
Mortgage servicing income
|
34,092
|
|
(3)
|
17,073
|
|
17,019
|
|
100
|
|
|||||
|
Income from WMS Series LLC
|
101
|
|
704
|
|
(603
|
)
|
(86
|
)
|
||||||
|
Loss on debt extinguishment
|
(573
|
)
|
—
|
|
(573
|
)
|
NM
|
|
||||||
|
Depositor and other retail banking fees
|
3,572
|
|
3,172
|
|
400
|
|
13
|
|
||||||
|
Insurance agency commissions
|
1,153
|
|
864
|
|
289
|
|
33
|
|
||||||
|
Gain on sale of investment securities available for sale
|
2,358
|
|
1,772
|
|
586
|
|
33
|
|
||||||
|
Other
|
832
|
|
2,448
|
|
(1,616
|
)
|
(66
|
)
|
||||||
|
Total noninterest income
|
$
|
185,657
|
|
$
|
190,745
|
|
$
|
(5,088
|
)
|
(3
|
)%
|
|||
|
NM=Not meaningful
|
||||||||||||||
|
(1)
|
Single family and multifamily mortgage banking activities.
|
|
(2)
|
Includes
$4.6 million
in pre-tax gain during 2014 from the sale of loans that were originally held for investment.
|
|
(3)
|
Includes pre-tax income of
$4.7 million
, net of transaction costs, resulting from the sale of single family MSRs during 2014.
|
51
The significant components of our noninterest income are described in greater detail, as follows.
Net gain on mortgage loan origination and sale activities
consisted of the following:
|
|
Year Ended December 31,
|
Dollar
Change
|
Percentage Change
|
|||||||||||
|
(in thousands)
|
2014
|
2013
|
||||||||||||
|
Single family:
|
||||||||||||||
|
Servicing value and secondary market gains
(1)
|
$
|
109,063
|
|
$
|
128,391
|
|
$
|
(19,328
|
)
|
(15
|
)%
|
|||
|
Loan origination and funding fees
|
25,572
|
|
30,051
|
|
(4,479
|
)
|
(15
|
)
|
||||||
|
Total single family
|
134,635
|
|
158,442
|
|
(23,807
|
)
|
(15
|
)
|
||||||
|
Multifamily
|
4,723
|
|
5,306
|
|
(583
|
)
|
(11
|
)
|
||||||
|
Other
|
4,764
|
|
(2)
|
964
|
|
3,800
|
|
NM
|
|
|||||
|
Net gain on mortgage loan origination and sale activities
|
$
|
144,122
|
|
$
|
164,712
|
|
$
|
(20,590
|
)
|
(13
|
)%
|
|||
|
NM=Not meaningful
|
||||||||||||||
|
(1)
|
Comprised of gains and losses on interest rate lock commitments (which considers the value of servicing), single family loans held for sale, forward sale commitments used to economically hedge secondary market activities, and changes in the Company's repurchase liability for loans that have been sold.
|
|
(2)
|
Includes
$4.6 million
in pre-tax gain during 2014 from the sale of loans that were originally held for investment.
|
Net gain on mortgage loan origination and sale activities was
$144.1 million
in
2014
, a decrease of
$20.6 million
, or
12.5%
, from
$164.7 million
in
2013
. This decrease predominantly reflected substantially lower gain margins on interest rate lock commitments. Single family mortgage interest rate lock commitments increased
11.2%
mainly due to the expansion of our mortgage lending operations, as we added approximately
84
mortgage origination and support personnel during
2014
. Included in net gain on mortgage loan origination and sale activities for
2014
was a
$4.6 million
pre-tax gain on single family mortgage origination and sale activities from the sale of loans that were originally held for investment. No similar transactions occurred in 2013.
Single family production volumes
related to loans designated for sale consisted of the following:
|
|
Year Ended December 31,
|
Dollar
Change
|
Percentage Change
|
|||||||||||
|
(in thousands)
|
2014
|
2013
|
||||||||||||
|
Single family mortgage closed loan volume
(1)
|
$
|
4,400,617
|
|
$
|
4,459,649
|
|
$
|
(59,032
|
)
|
(1
|
)%
|
|||
|
Single family mortgage interest rate lock commitments
(1)
|
$
|
4,344,248
|
|
$
|
3,907,274
|
|
$
|
436,974
|
|
11
|
%
|
|||
|
(1)
|
Includes loans originated by WMS Series LLC ("WMS") and purchased by HomeStreet.
|
During
2014
, single family closed loan production decreased
1.3%
, and single family interest rate lock commitments increased
11.2%
from
2013
. The increase in interest rate lock commitments was mainly a result of the expansion of our mortgage lending operations.
The Company records a liability for estimated mortgage repurchase losses, which has the effect of reducing net gain on mortgage loan origination and sale activities. The following table presents the effect of changes in the Company's mortgage repurchase liability within the respective line items of net gain on mortgage loan origination and sale activities. For further information on the Company's mortgage repurchase liability, see Note 13,
Commitments, Guarantees and Contingencies
to the financial statements of this Form 10-K.
52
|
|
Year Ended December 31,
|
||||||
|
(in thousands)
|
2014
|
2013
|
|||||
|
Effect of changes to the mortgage repurchase liability recorded in net gain on mortgage loan origination and sale activities:
|
|||||||
|
New loan sales
(1)
|
$
|
(1,570
|
)
|
$
|
(1,828
|
)
|
|
|
Other changes in estimated repurchase losses
(2)
|
140
|
|
—
|
|
|||
|
$
|
(1,430
|
)
|
$
|
(1,828
|
)
|
||
|
(1)
|
Represents the estimated fair value of the repurchase or indemnity obligation recognized as a reduction of proceeds on new loan sales.
|
|
(2)
|
Represents changes in estimated probable future repurchase losses on previously sold loans.
|
Mortgage servicing income
consisted of the following:
|
|
Year Ended December 31,
|
Dollar
Change
|
Percent
Change
|
|||||||||||
|
(in thousands)
|
2014
|
2013
|
||||||||||||
|
Servicing income, net:
|
||||||||||||||
|
Servicing fees and other
|
$
|
37,818
|
|
$
|
34,173
|
|
$
|
3,645
|
|
11
|
%
|
|||
|
Changes in fair value of MSRs due to modeled amortization
(1)
|
(26,112
|
)
|
(24,321
|
)
|
(1,791
|
)
|
7
|
|
||||||
|
Amortization
|
(1,712
|
)
|
(1,803
|
)
|
91
|
|
(5
|
)
|
||||||
|
9,994
|
|
8,049
|
|
1,945
|
|
24
|
%
|
|||||||
|
Risk management:
|
||||||||||||||
|
Changes in fair value of MSRs due to changes in model inputs and/or assumptions
(2)
|
(15,629
|
)
|
(3)
|
29,456
|
|
(45,085
|
)
|
(153
|
)%
|
|||||
|
Net (loss) gain from derivatives economically hedging MSRs
|
39,727
|
|
(20,432
|
)
|
60,159
|
|
(294
|
)
|
||||||
|
24,098
|
|
9,024
|
|
15,074
|
|
167
|
|
|||||||
|
Mortgage servicing income
|
$
|
34,092
|
|
$
|
17,073
|
|
$
|
17,019
|
|
100
|
%
|
|||
|
(1)
|
Represents changes due to collection/realization of expected cash flows and curtailments.
|
|
(2)
|
Principally reflects changes in model assumptions, including prepayment speed assumptions, which are primarily affected by changes in mortgage interest rates.
|
|
(3)
|
Includes pre-tax income of
$4.7 million
, net of brokerage fees and prepayment reserves, resulting from the sale of single family MSRs during 2014.
|
For the year ended
December 31, 2014
, mortgage servicing income of
$34.1 million
increased
$17.0 million
from
$17.1 million
in
2013
, primarily due to MSR sales, a lower housing turnover rate and improved MSR risk management results.
MSR risk management results represent changes in the fair value of single family MSRs due to changes in model inputs and assumptions net of the gain/(loss) from derivatives economically hedging MSRs. The fair value of MSRs is sensitive to changes in interest rates, primarily due to the effect on prepayment speeds. MSRs typically decrease in value when interest rates decline because declining interest rates tend to increase mortgage prepayment speeds and therefore reduce the expected life of the net servicing cash flows of the MSR asset. Certain other changes in MSR fair value relate to factors other than interest rate changes and are generally not within the scope of the Company's MSR economic hedging strategy. These factors may include but are not limited to the impact of changes to the housing price index, the level of home sales activity, changes to mortgage spreads, valuation discount rates, costs to service and policy changes by U.S. government agencies.
The net performance of our MSR risk management activities for
2014
was a gain of
$24.1 million
, compared to a gain of
$9.0 million
in
2013
. The higher hedging gain in
2014
largely reflected higher sensitivity to interest rates for the Company's MSRs, which led the Company to increase the notional amount of derivative instruments used to economically hedge MSRs. The higher notional amount of derivative instruments, along with a steeper yield curve, resulted in higher net gains from MSR risk management, which positively impacted mortgage servicing income. In addition, MSR risk management results for
2014
reflected the impact on the fair value of MSRs of changes in model inputs and assumptions related to historically low long-term prepayment speeds (lower housing turnover rate) experienced throughout
2014
.
53
Mortgage servicing fees collected in
2014
were
$37.8 million
, an increase of
$3.6 million
, or
10.7%
, from
$34.2 million
in
2013
primarily as a result of the higher average balances of the loans serviced for others portfolio during
2014
. On June 30, 2014, we sold the rights to service
$2.96 billion
of single family mortgage loans, resulting in a loans serviced for others portfolio of
$11.22 billion
at
December 31, 2014
, compared to
$11.80 billion
at
December 31, 2013
. Mortgage servicing fees collected were negatively impacted in the short term because the balance of the loans serviced for others portfolio was reduced as a consequence of this sale.
Income from WMS Series LLC
in
2014
was
$101 thousand
, compared to
$704 thousand
in
2013
. The decrease in
2014
was primarily due to a
17.0%
decrease
in interest rate lock commitments and a
29.3%
decrease
in closed loan volume, which were
$455.2 million
and
$491.3 million
in
2014
, respectively, compared to
$548.7 million
and
$694.4 million
in
2013
.
Loss on debt extinguishment.
We recorded a loss on debt extinguishment of
$573 thousand
in
2014
resulting from the retirement of certain TruPS that we acquired from our
2013
acquisition of Yakima National Bank compared to
no
loss in
2013
.
Depositor and other retail banking fees
for
2014
were relatively consistent with
2013
results. The following table presents the composition of depositor and other retail banking fees for the periods indicated.
|
|
Year Ended December 31,
|
Dollar
Change
|
Percent
Change
|
|||||||||||
|
(in thousands)
|
2014
|
2013
|
||||||||||||
|
Monthly maintenance and deposit-related fees
|
$
|
1,632
|
|
$
|
1,568
|
|
$
|
64
|
|
4
|
%
|
|||
|
Debit Card/ATM fees
|
1,898
|
|
1,523
|
|
375
|
|
25
|
|
||||||
|
Other fees
|
42
|
|
81
|
|
(39
|
)
|
(48
|
)
|
||||||
|
Total depositor and other retail banking fees
|
$
|
3,572
|
|
$
|
3,172
|
|
$
|
400
|
|
13
|
%
|
|||
Noninterest Expense
Noninterest expense was
$252.0 million
in
2014
,
an increase
of
$22.5 million
, or
9.8%
, from
$229.5 million
in
2013
. Included in noninterest expense were acquisition-related expenses of
$3.1 million
and
$4.5 million
in
2014
and
2013
, respectively. The increase in noninterest expense was primarily the result of a
$13.9 million
increase in salaries and related costs and a
$4.8 million
increase in occupancy costs, primarily a result of the integration of our acquisitions, and a
7.3%
growth in personnel in connection with our continued expansion of our mortgage banking and commercial and consumer banking businesses. These additions to personnel were partially offset by attrition and position eliminations in mortgage production, mortgage operations, and in commercial lending and administration. We eliminated some positions between the fourth quarter of 2013 and through most of 2014 in response to a slowdown in mortgage activity as well as the integration of our acquisitions and we expect such eliminations to improve efficiency and performance. Also contributing to increased noninterest expense was a
$5.6 million
increase in information services costs resulting from system upgrades and implementation. These increases in noninterest expense were partially offset by significantly lower net cost of operation and sale of other real estate owned ("OREO"), which was a gain of
$470 thousand
in
2014
,
a decrease
of
$2.3 million
from OREO expense of
$1.8 million
in
2013
.
54
Noninterest expense consisted of the following:
|
|
Year Ended December 31,
|
Dollar Change
|
Percentage Change
|
|||||||||||
|
(in thousands)
|
2014
|
2013
|
||||||||||||
|
Noninterest expense
|
||||||||||||||
|
Salaries and related costs
|
$
|
163,387
|
|
$
|
149,440
|
|
$
|
13,947
|
|
9
|
%
|
|||
|
General and administrative
|
42,833
|
|
40,366
|
|
2,467
|
|
6
|
|
||||||
|
Legal
|
2,071
|
|
2,552
|
|
(481
|
)
|
(19
|
)
|
||||||
|
Consulting
|
3,224
|
|
5,637
|
|
(2,413
|
)
|
(43
|
)
|
||||||
|
Federal Deposit Insurance Corporation assessments
|
2,316
|
|
1,433
|
|
883
|
|
62
|
|
||||||
|
Occupancy
|
18,598
|
|
13,765
|
|
4,833
|
|
35
|
|
||||||
|
Information services
|
20,052
|
|
14,491
|
|
5,561
|
|
38
|
|
||||||
|
Net cost of operation and sale of other real estate owned
|
(470
|
)
|
1,811
|
|
(2,281
|
)
|
(126
|
)
|
||||||
|
Total noninterest expense
|
$
|
252,011
|
|
$
|
229,495
|
|
$
|
22,516
|
|
10
|
%
|
|||
The significant components of our noninterest expense are described in greater detail, as follows.
Salaries and related costs
were
$163.4 million
in
2014
, an increase of
$13.9 million
, or
9.3%
, from
$149.4 million
in
2013
. The increase primarily resulted from a
7.3%
net increase in full-time equivalent employees at
December 31, 2014
compared to
December 31, 2013
, as well as a
1.7%
increase in commissions and incentives paid to employees for
2014
due to the overall growth in our mortgage lending and commercial and consumer business lines.
General and administrative
expense was
$42.8 million
in
2014
, an increase of
$2.5 million
, or
6.1%
, from
$40.4 million
in
2013
. These expenses include general office and equipment expense, marketing, taxes and insurance. The increase in general and administrative expense in
2014
was primarily due to Company growth and increased marketing expenses.
Consulting
expense was
$3.2 million
in
2014
, a decrease of
$2.4 million
, or
42.8%
, from
$5.6 million
in
2013
, primarily due to less acquisition-related activities in
2014
compared to
2013
.
Occupancy
expense was
$18.6 million
in
2014
, an increase of
$4.8 million
, or
35.1%
, from
$13.8 million
in
2013
as we grew our mortgage banking business and consumer and commercial customer base with the opening of
11
new mortgage loan origination offices and
three
de novo retail deposit branches in
2014
. Additionally, we added six retail deposit branches through acquisitions during the fourth quarter of 2013.
Information services
expense was
$20.1 million
in
2014
, an increase of
$5.6 million
, or
38.4%
, from
$14.5 million
in
2013
. This increase was primarily due to company-wide systems and tools upgrades and a
7.3%
increase in headcount.
Net cost of operation and sale of other real estate owned
was a gain of
$470 thousand
in
2014
, improved by
$2.3 million
from expense of
$1.8 million
in
2013
. OREO valuation adjustments were
$69 thousand
for
2014
, compared to valuation adjustments of
$603 thousand
in
2013
. Valuation adjustments to OREO balances declined with the reduction in the net balance of OREO properties in
2014
. Lower balances of OREO properties also resulted in decreased maintenance expenses.
Income Tax Expense
The Company’s income tax expense for
2014
was
$11.1 million
, representing an effective tax rate of
33.2%
. In
2013
, the Company’s tax expense was
$11.0 million
, representing an effective tax rate of
31.6%
. The effective rate rose from 2013 to 2014 due to tax exempt interest income constituting a smaller portion of total income, the adoption of new accounting standards for investments in low income housing partnerships, higher levels of permanently capitalized transaction costs related to mergers and acquisitions, and increases to taxable income in higher state tax jurisdictions. The 2014 effective tax rate of
33.2%
differed from the federal statutory rate of 35.0% due to the impact of tax exempt interest income, the impact of investments in low income housing tax credit partnerships, permanently capitalized transaction costs related to the acquisition of Simplicity, and the impact of state taxes.
55
Capital Expenditures
During
2014
, our net expenditures for property and equipment were
$19.9 million
, compared to net expenditures of
$22.8 million
during
2013
, as we continued to implement our strategic initiatives regarding the expansion of our mortgage banking and commercial and consumer businesses.
56
Comparison of the year ended
2013
to the year ended
2012
Average Balances and Rates
Average balances, together with the total dollar amounts of interest income and expense, on a tax equivalent basis related to such balances and the weighted average rates, for years ended December 31,
2013
and
2012
were as follows:
|
|
Year Ended December 31,
|
||||||||||||||||||||
|
|
2013
|
2012
|
|||||||||||||||||||
|
(in thousands)
|
Average
Balance
|
Interest
|
Average
Yield/Cost
|
Average
Balance
|
Interest
|
Average
Yield/Cost
|
|||||||||||||||
|
Assets
|
|||||||||||||||||||||
|
Interest-earning assets
(1)
|
|||||||||||||||||||||
|
Cash and cash equivalents
|
$
|
29,861
|
|
$
|
73
|
|
0.24
|
%
|
$
|
94,478
|
|
$
|
231
|
|
0.24
|
%
|
|||||
|
Investment securities
|
515,000
|
|
14,608
|
|
2.84
|
|
410,819
|
|
11,040
|
|
2.69
|
|
|||||||||
|
Loans held for sale
|
381,129
|
|
14,180
|
|
3.72
|
|
359,056
|
|
12,719
|
|
3.56
|
|
|||||||||
|
Loans held for investment
|
1,496,146
|
|
62,384
|
|
4.17
|
|
1,303,010
|
|
58,490
|
|
4.49
|
|
|||||||||
|
Total interest-earning assets
|
2,422,136
|
|
91,245
|
|
3.77
|
|
2,167,363
|
|
82,480
|
|
3.81
|
|
|||||||||
|
Noninterest-earning assets
(2)
|
296,078
|
|
236,497
|
|
|||||||||||||||||
|
Total assets
|
$
|
2,718,214
|
|
$
|
2,403,860
|
|
|||||||||||||||
|
Liabilities and shareholders’ equity
|
|||||||||||||||||||||
|
Deposits
|
|||||||||||||||||||||
|
Interest-bearing demand accounts
|
$
|
238,552
|
|
$
|
925
|
|
0.38
|
%
|
$
|
151,029
|
|
$
|
498
|
|
0.33
|
%
|
|||||
|
Savings accounts
|
122,602
|
|
545
|
|
0.44
|
|
90,246
|
|
395
|
|
0.44
|
|
|||||||||
|
Money market accounts
|
810,666
|
|
3,899
|
|
0.48
|
|
613,546
|
|
3,243
|
|
0.53
|
|
|||||||||
|
Certificate accounts
|
489,748
|
|
5,053
|
|
1.03
|
|
790,038
|
|
12,605
|
|
1.60
|
|
|||||||||
|
Deposits
|
1,661,568
|
|
10,422
|
|
0.64
|
|
1,644,859
|
|
16,741
|
|
1.02
|
|
|||||||||
|
Federal Home Loan Bank advances
|
293,871
|
|
1,532
|
|
0.52
|
|
93,325
|
|
1,788
|
|
1.91
|
|
|||||||||
|
Securities sold under agreements to repurchase
|
2,721
|
|
11
|
|
0.40
|
|
17,806
|
|
70
|
|
0.39
|
|
|||||||||
|
Long-term debt
|
62,349
|
|
2,546
|
|
(3)
|
4.03
|
|
61,857
|
|
1,333
|
|
2.16
|
|
||||||||
|
Other borrowings
|
104
|
|
20
|
|
19.23
|
|
—
|
|
16
|
|
—
|
|
|||||||||
|
Total interest-bearing
liabilities
|
2,020,613
|
|
14,531
|
|
0.72
|
|
1,817,847
|
|
19,948
|
|
1.10
|
|
|||||||||
|
Other noninterest-bearing liabilities
|
448,520
|
|
374,684
|
|
|||||||||||||||||
|
Total liabilities
|
2,469,133
|
|
2,192,531
|
|
|||||||||||||||||
|
Shareholders' equity
|
249,081
|
|
211,329
|
|
|||||||||||||||||
|
Total liabilities and shareholders’ equity
|
$
|
2,718,214
|
|
$
|
2,403,860
|
|
|||||||||||||||
|
Net interest income
(4)
|
$
|
76,714
|
|
$
|
62,532
|
|
|||||||||||||||
|
Net interest spread
|
3.05
|
%
|
2.71
|
%
|
|||||||||||||||||
|
Impact of noninterest-bearing sources
|
0.12
|
%
|
0.18
|
%
|
|||||||||||||||||
|
Net interest margin
|
3.17
|
%
|
2.89
|
%
|
|||||||||||||||||
|
(1)
|
The average balances of nonaccrual assets and related income, if any, are included in their respective categories.
|
|
(2)
|
Includes loan balances that have been foreclosed and are now reclassified to other real estate owned.
|
|
(3)
|
Interest expense for the year ended December 31, 2013 included $1.4 million recorded in the first quarter of 2013 related to the correction of the cumulative effect of an error in prior years, resulting from the under accrual of interest due on our Trust Preferred Securities for which the Company had deferred payment of interest. Excluding the impact of the prior period interest expense correction, the net interest margin was
3.23%
.
|
|
(4)
|
Includes taxable-equivalent adjustments primarily related to tax-exempt income on certain loans and securities of
$2.3 million
and $1.8 million for the years ended
2013
and
2012
, respectively. The estimated federal statutory tax rate was 35% for the periods presented.
|
57
Interest on Nonaccrual Loans
We do not include interest collected on nonaccrual loans in interest income. When we place a loan on nonaccrual status, we reverse the accrued unpaid interest receivable against interest income and amortization of any net deferred fees is suspended. Additionally, if interest is received on nonaccrual loans, the interest collected on the loan is recognized as an adjustment to the cost basis of the loan. The net decrease to interest income due to adjustments made for nonaccrual loans, including the effect of additional interest income that would have been recorded during the period if the loans had been accruing, was
$4.6 million
and
$6.2 million
for the years ended December 31,
2013
and
2012
, respectively.
Rate and Volume Analysis
The following table presents the extent to which changes in interest rates and changes in the volume of our interest-earning assets and interest-bearing liabilities affected our interest income and interest expense, excluding interest income from nonaccrual loans. Information is provided in each category with respect to: (1) changes attributable to changes in volume (changes in volume multiplied by prior rate), (2) changes attributable to changes in rate (changes in rate multiplied by prior volume), (3) changes attributable to changes in rate and volume (change in rate multiplied by change in volume), which were allocated in proportion to the percentage change in average volume and average rate and included in the relevant column and (4) the net change.
|
|
Year Ended December 31,
|
||||||||||
|
|
2013 vs. 2012
|
||||||||||
|
|
Increase (Decrease) Due to
|
Total Change
|
|||||||||
|
(in thousands)
|
Rate
|
Volume
|
|||||||||
|
Assets
|
|||||||||||
|
Interest-earning assets
|
|||||||||||
|
Cash & cash equivalents
|
$
|
—
|
|
$
|
(158
|
)
|
$
|
(158
|
)
|
||
|
Investment securities
|
762
|
|
2,806
|
|
3,568
|
|
|||||
|
Loans held for sale
|
675
|
|
786
|
|
1,461
|
|
|||||
|
Loans held for investment
|
(4,775
|
)
|
8,669
|
|
3,894
|
|
|||||
|
Total interest-earning assets
|
(3,338
|
)
|
12,103
|
|
8,765
|
|
|||||
|
Liabilities
|
|||||||||||
|
Deposits
|
|||||||||||
|
Interest-bearing demand accounts
|
129
|
|
298
|
|
427
|
|
|||||
|
Savings accounts
|
8
|
|
142
|
|
150
|
|
|||||
|
Money market accounts
|
(386
|
)
|
1,042
|
|
656
|
|
|||||
|
Certificate accounts
|
(1,819
|
)
|
(5,970
|
)
|
(7,789
|
)
|
|||||
|
Total interest-bearing deposits
|
(2,068
|
)
|
(4,488
|
)
|
(6,556
|
)
|
|||||
|
Federal Home Loan Bank advances
|
(4,079
|
)
|
3,823
|
|
(256
|
)
|
|||||
|
Securities sold under agreements to repurchase
|
(1
|
)
|
(58
|
)
|
(59
|
)
|
|||||
|
Long-term debt
|
1,203
|
|
10
|
|
1,213
|
|
|||||
|
Other borrowings
|
—
|
|
241
|
|
241
|
|
|||||
|
Total interest-bearing liabilities
|
(4,945
|
)
|
(472
|
)
|
(5,417
|
)
|
|||||
|
Total changes in net interest income
|
$
|
1,607
|
|
$
|
12,575
|
|
$
|
14,182
|
|
||
58
Net Income
For the year ended 2013, we reported net income of $23.8 million, a decrease of $58.3 million, or 71.0%, compared to net income of $82.1 million in 2012. The decline in net income in 2013 mainly resulted from a $47.3 million, or 19.9%, decrease in noninterest income compared to 2012, primarily due to a significantly lower gain on mortgage loan origination and sale activities resulting from a decline in single family mortgage loan production compared to the record production that the Company experienced in 2012. This decrease was partially offset by a $13.7 million increase in net interest income in 2013 mainly due to improved deposit product and pricing strategies that included reducing our higher-cost deposits and converting customers with maturing certificates of deposit to transaction and savings deposits. Additionally, we experienced a $45.9 million, or 25.0%, increase in noninterest expense as we continued to grow our business and market share in 2013 both organically and through acquisitions.
Net Interest Income
Net interest income on a tax equivalent basis was $76.7 million for the year ended December 31, 2013, an increase of $14.2 million, or 23%, from $62.5 million for the year ended December 31, 2012. During 2013, total interest income increased $8.8 million from 2012, while total interest expense decreased $5.4 million from 2012. The net interest margin for the year ended December 31, 2013 improved to 3.17% from 2.89% in 2012. Total average interest-earning assets increased in 2013 primarily as a result of growth in the investment securities portfolio and new portfolio loan originations, partially offset by a decrease in cash and cash equivalents mainly used to fund these investments. Total average interest-bearing deposit balances decreased from 2012 mostly as a result of a reduction in higher-cost retail certificates of deposits, partially offset by an increase in transaction and savings deposits. The improvement in our net interest income and net interest margin from 2012 to 2013 in large part reflected the execution of our deposit product and pricing strategies, as growth in transaction and savings account balances partially offset maturities of higher yielding certificates of deposit. Additionally, we increased our net interest income through increased commercial portfolio lending as we continued to grow our Commercial and Consumer Banking segment.
Total interest income on a tax equivalent basis of $91.2 million in 2013 increased $8.8 million, or 10.6%, from $82.5 million in 2012, primarily driven by higher average balances of portfolio loans and investment securities. Average balance of loans held for investment increased by $193.1 million, or 14.8%, and the average balance of investment securities increased $104.2 million, or 25.4%, from 2012 to 2013. We re-balanced our investment securities in 2013 with a shift toward higher-yielding municipal securities, which resulted in an increase in yield on investment securities of 15 basis points. These increases were partially offset by a decrease in the average balance of cash and cash equivalents, which decreased $64.6 million, or 68.4%, compared to 2012 and a lower yield on average loans held for investment, which decreased 32 basis points during 2013.
Total interest expense of $14.5 million in 2013 decreased $5.4 million, or 27%, from $19.9 million in 2012. This decrease was primarily due to a
$300.3 million
, or
38.0%
, reduction in the average balance of higher-yielding certificates of deposit, partially offset by an increase in lower cost transaction and savings deposits as we expand our deposit branch network. Also contributing to the decrease in interest expense was the restructuring of FHLB advances. We prepaid certain long-term FHLB advances and used short-term FHLB advances in 2013 to meet short-term mortgage origination and sales funding needs, which contributed to a 139 basis point decline in interest cost on FHLB advances.
Provision for Loan Losses
Provision for credit losses was $900 thousand in 2013, compared to $11.5 million in 2012, reflecting the improved credit quality of the Company's loan portfolio from 2012. Nonaccrual loans declined to $25.7 million at December 31, 2013, a decrease of $4.2 million, or 14.0%, from $29.9 million at December 31, 2012. Nonaccrual loans as a percentage of total loans was 1.36% at December 31, 2013, compared to 2.24% at December 31, 2012. Criticized/classified loans declined to 5.01% of total loans at December 31, 2013 from 11.08% of total loans at December 31, 2012. Loan delinquencies also decreased, with total loans past due decreasing to 4.44% of loans held for investment at December 31, 2013, compared to 6.58% at December 31, 2012. Overall, the allowance for credit losses decreased to $24.1 million, or 1.27% of loans held for investment at December 31, 2013, down from $27.8 million, or 2.07% of total loans held for investment at December 31, 2012.
Net charge-offs of $4.6 million for 2013 were down $22.0 million, or 82.8%, from net charge-offs of $26.5 million for 2012. Net charge-offs during 2012 included an $11.8 million charge-off related to the settlement of collection litigation and resolution of certain related nonperforming construction/land development loans with aggregate carrying values of $26.6 million.
59
Noninterest Income
Noninterest income was $190.7 million for the year ended December 31, 2013, a decrease of $47.3 million, or 19.9%, from noninterest income of $238.0 million for 2012. The decrease in noninterest income in 2013 compared to 2012 was primarily the result of lower net gain on mortgage loan origination and sale activities, mostly related to substantially lower refinancing activities that resulted mainly from increased mortgage interest rates, partially offset by growth in 2013 in our purchase mortgage transactions and the expansion of our mortgage lending operations.
Noninterest income consisted of the following:
|
|
Year Ended December 31,
|
Dollar
Change
|
Percentage Change
|
|||||||||||
|
(in thousands)
|
2013
|
2012
|
||||||||||||
|
Net gain on mortgage loan origination and sale activities
(1)
|
$
|
164,712
|
|
$
|
210,564
|
|
$
|
(45,852
|
)
|
(22
|
)%
|
|||
|
Mortgage servicing income
|
17,073
|
|
16,121
|
|
952
|
|
6
|
|
||||||
|
Income from WMS Series LLC
|
704
|
|
4,264
|
|
(3,560
|
)
|
(83
|
)
|
||||||
|
Gain (loss) on debt extinguishment
|
—
|
|
(939
|
)
|
939
|
|
(100
|
)
|
||||||
|
Depositor and other retail banking fees
|
3,172
|
|
3,062
|
|
110
|
|
4
|
|
||||||
|
Insurance agency commissions
|
864
|
|
743
|
|
121
|
|
16
|
|
||||||
|
Gain on investment securities available for sale
|
1,772
|
|
1,490
|
|
282
|
|
19
|
|
||||||
|
Other
|
2,448
|
|
2,715
|
|
(267
|
)
|
(10
|
)
|
||||||
|
Total noninterest income
|
$
|
190,745
|
|
$
|
238,020
|
|
$
|
(47,275
|
)
|
(20
|
)%
|
|||
|
(1)
|
Single family and multifamily mortgage banking activities.
|
The significant components of our noninterest income are described in greater detail, as follows.
Net gain on mortgage loan origination and sale activities
consisted of the following.
|
|
Year Ended December 31,
|
Dollar
Change
|
Percentage Change
|
|||||||||||
|
(in thousands)
|
2013
|
2012
|
||||||||||||
|
Single family
|
||||||||||||||
|
Servicing value and secondary market gains
(1)
|
$
|
128,391
|
|
175,655
|
|
$
|
(47,264
|
)
|
(27
|
)%
|
||||
|
Loan origination and funding fees
|
30,051
|
|
30,037
|
|
14
|
|
—
|
|
||||||
|
Total single family
|
158,442
|
|
205,692
|
|
(47,250
|
)
|
(23
|
)
|
||||||
|
Multifamily
|
5,306
|
|
4,872
|
|
434
|
|
9
|
|
||||||
|
Other
|
964
|
|
—
|
|
964
|
|
NM
|
|
||||||
|
Net gain on mortgage loan origination and sale activities
|
$
|
164,712
|
|
$
|
210,564
|
|
$
|
(45,852
|
)
|
(22
|
)%
|
|||
|
NM=Not meaningful
|
||||||||||||||
|
(1)
|
Comprised of gains and losses on interest rate lock commitments (which considers the value of servicing), single family loans held for sale, forward sale commitments used to economically hedge secondary market activities, and changes in the Company's repurchase liability for loans that have been sold.
|
Net gain on mortgage loan origination and sale activities was
$164.7 million
in
2013
, a decrease of
$45.9 million
, or
21.8%
, from
$210.6 million
in
2012
. This decrease predominantly reflected lower secondary market gains on our interest rate lock commitments. Interest rate lock commitments declined in 2013 mainly due to the rise in mortgage interest rates beginning in the second quarter of that year, causing a significant decrease in refinancing activity that was only partially offset by a slightly stronger purchase mortgage market. This impact was partially mitigated by the expansion of our mortgage lending operations as we added approximately 120 mortgage origination and support personnel during
2013
.
60
Single family production volumes
of loans designated for sale consisted of the following.
|
|
Year Ended December 31,
|
Dollar
Change
|
Percentage Change
|
|||||||||||
|
(in thousands)
|
2013
|
2012
|
||||||||||||
|
Single family mortgage closed loan volume
(1)
|
$
|
4,459,649
|
|
$
|
4,668,167
|
|
$
|
(208,518
|
)
|
(4
|
)%
|
|||
|
Single family mortgage interest rate lock commitments
(1)
|
$
|
3,907,274
|
|
$
|
4,786,667
|
|
$
|
(879,393
|
)
|
(18
|
)%
|
|||
|
(1)
|
Includes loans originated by WMS Series LLC and purchased by HomeStreet.
|
During
2013
, single family closed loan production decreased
4.5%
and single family interest rate lock commitments decreased
18.4%
from
2012
mainly as a result of higher mortgage interest rates during
2013
. Our production mix continued to shift from the refinance mortgage market to the purchase mortgage market during
2013
.
The Company records a liability for estimated mortgage repurchase losses, which has the effect of reducing net gain on mortgage loan origination and sale activities. The following table presents the effect of changes in the Company's mortgage repurchase liability within the respective line items of net gain on mortgage loan origination and sale activities. For further information on the Company's mortgage repurchase liability, see Note 13,
Commitments, Guarantees and Contingencies
to the financial statements of this Form 10-K.
|
|
Year Ended December 31,
|
||||||
|
(in thousands)
|
2013
|
2012
|
|||||
|
Effect of changes to the mortgage repurchase liability recorded in net gain on mortgage loan origination and sale activities:
|
|||||||
|
New loan sales
(1)
|
$
|
(1,828
|
)
|
$
|
(1,348
|
)
|
|
|
Other changes in estimated repurchase losses
(2)
|
—
|
|
(2,969
|
)
|
|||
|
$
|
(1,828
|
)
|
$
|
(4,317
|
)
|
||
|
(1)
|
Represents the estimated fair value of the repurchase or indemnity obligation recognized as a reduction of proceeds on new loan sales.
|
|
(2)
|
Represents changes in estimated probable future repurchase losses on previously sold loans.
|
61
Mortgage servicing income
consisted of the following.
|
|
Year Ended December 31,
|
Dollar
Change
|
Percent
Change
|
|||||||||||
|
(in thousands)
|
2013
|
2012
|
||||||||||||
|
Servicing income, net:
|
||||||||||||||
|
Servicing fees and other
|
$
|
34,173
|
|
$
|
27,833
|
|
$
|
6,340
|
|
23
|
%
|
|||
|
Changes in fair value of MSRs due to modeled amortization
(1)
|
(24,321
|
)
|
(26,706
|
)
|
2,385
|
|
(9
|
)
|
||||||
|
Amortization
|
(1,803
|
)
|
(2,014
|
)
|
211
|
|
(10
|
)
|
||||||
|
8,049
|
|
(887
|
)
|
8,936
|
|
(1,007
|
)
|
|||||||
|
Risk management:
|
||||||||||||||
|
Changes in fair value of MSRs due to changes in model inputs and/or assumptions
(2)
|
29,456
|
|
(4,974
|
)
|
34,430
|
|
(692
|
)
|
||||||
|
Net gain from derivatives economically hedging MSRs
|
(20,432
|
)
|
21,982
|
|
(42,414
|
)
|
(193
|
)
|
||||||
|
9,024
|
|
17,008
|
|
(7,984
|
)
|
(47
|
)
|
|||||||
|
Mortgage servicing income
|
$
|
17,073
|
|
$
|
16,121
|
|
$
|
952
|
|
6
|
%
|
|||
|
NM = not meaningful
|
||||||||||||||
|
(1)
|
Represents changes due to collection/realization of expected cash flows and curtailments.
|
|
(2)
|
Principally reflects changes in model assumptions, including prepayment speed assumptions, which are primarily affected by changes in mortgage interest rates.
|
For the year ended
December 31, 2013
, mortgage servicing income of
$17.1 million
decreased
$1.0 million
from
$16.1 million
in
2012
, primarily due to increased servicing fees collected during
2013
on the Company's single family mortgage servicing. This increase was partially offset by lower MSR risk management results, which represents changes in the fair value of single family MSRs due to changes in model inputs and assumptions net of the gain/(loss) from derivatives economically hedging MSRs.
The net performance of our MSR risk management activities for
2013
was a gain of
$9.0 million
, compared to a gain of
$17.0 million
in
2012
. The lower gain in
2013
largely reflected lower sensitivity to interest rates for the Company's MSRs, which led the Company to
reduce the notional amount of derivative instruments used to economically hedge MSRs. The lower notional amount of derivative instruments, along with a flatter yield curve, resulted in lower net gains from MSR risk management, which negatively impacted mortgage servicing income. In addition, MSR risk management results for
2013
reflected the impact on the fair value of MSRs of changes in model inputs and assumptions related to factors other than interest rate changes, such as higher expected home values which generally lead to higher projected prepayment speeds, and a decline in income from MSR risk management activities in
2013
.
Mortgage servicing fees collected in
2013
were
$34.2 million
, an increase of
$6.3 million
, or
22.8%
, from
$27.8 million
in
2012
primarily as a result of the increase in the loans serviced for others portfolio. Our loans serviced for others portfolio increased to
$12.61 billion
at
December 31, 2013
from
$9.65 billion
at December 31, 2012.
Income from WMS Series LLC
in
2013
was $704 thousand, compared to $4.3 million in
2012
. The decrease in
2013
was primarily due to a 33.6% decrease in interest rate lock commitments and a 25.5% decrease in closed loan volume, which were
$548.7 million and $694.4 million in 2013, respectively, compared to $825.8 million and $932.4 million in 2012.
Loss on debt extinguishment.
We recorded no loss on debt extinguishment in
2013
, compared to a loss of
$939 thousand
in
2012
, primarily as a result of a prepayment fee for the early retirement of $25.5 million of long-term FHLB advances. This prepayment resulted in reduced interest expense in
2013
as we replaced high-cost, long-term FHLB advances with other lower-cost, short-term borrowings.
Depositor and other retail banking fees
for
2013
were relatively consistent with
2012
results. The following table presents the composition of depositor and other retail banking fees for the periods indicated.
62
|
|
Year Ended December 31,
|
Dollar
Change
|
Percent
Change
|
|||||||||||
|
(in thousands)
|
2013
|
2012
|
||||||||||||
|
Monthly maintenance and deposit-related fees
|
$
|
1,568
|
|
$
|
1,569
|
|
$
|
(1
|
)
|
—
|
%
|
|||
|
Debit Card/ATM fees
|
1,523
|
|
1,396
|
|
127
|
|
9
|
|
||||||
|
Other fees
|
81
|
|
97
|
|
(16
|
)
|
(16
|
)
|
||||||
|
Total depositor and other retail banking fees
|
$
|
3,172
|
|
$
|
3,062
|
|
$
|
110
|
|
4
|
%
|
|||
Insurance agency commissions
increased to $864 thousand from $743 thousand in
2012
. This increase in commissions primarily resulted from increased personal and casualty insurance line sales.
Gain on investment securities available for sale
was $1.8 million in
2013
, compared to $1.5 million in
2012
, as the Company re-balanced its portfolio and provided liquidity for the growth in lending volumes.
Other income
was $2.4 million in
2013
, relatively consistent with $2.7 million in
2012
.
Noninterest Expense
Noninterest expense was
$229.5 million
in
2013
, an increase of
$45.9 million
, or
25.0%
, from
$183.6 million
in
2012
. Included in noninterest expense in
2013
were acquisition-related expenses of
$4.5 million
. The increase in noninterest expense was primarily the result of a
$29.6 million
increase in salaries and related costs and a
$12.5 million
increase in general and administrative expenses resulting from a 37% growth in personnel in 2013 in connection with our continued expansion of our mortgage banking and commercial and consumer businesses. These additions to personnel were partially offset by attrition and position eliminations in the same year in mortgage production, mortgage operations, and in commercial lending and administration. Position eliminations in
2013
were in response to a slowdown in mortgage activity and the integration of our acquisitions and were intended to improve efficiency and performance. These increases in noninterest expense were partially offset by significantly lower other real estate owned ("OREO") expenses, which were
$1.8 million
in
2013
, a decrease of
$8.3 million
from OREO expense of
$10.1 million
in
2012
.
Noninterest expense consisted of the following:
|
|
Year Ended December 31,
|
Dollar Change
|
Percentage Change
|
|||||||||||
|
(in thousands)
|
2013
|
2012
|
||||||||||||
|
Noninterest expense
|
||||||||||||||
|
Salaries and related costs
|
$
|
149,440
|
|
$
|
119,829
|
|
$
|
29,611
|
|
25
|
%
|
|||
|
General and administrative
|
40,366
|
|
27,838
|
|
12,528
|
|
45
|
|
||||||
|
Legal
|
2,552
|
|
1,796
|
|
756
|
|
42
|
|
||||||
|
Consulting
|
5,637
|
|
3,037
|
|
2,600
|
|
86
|
|
||||||
|
Federal Deposit Insurance Corporation assessments
|
1,433
|
|
3,554
|
|
(2,121
|
)
|
(60
|
)
|
||||||
|
Occupancy
|
13,765
|
|
8,585
|
|
5,180
|
|
60
|
|
||||||
|
Information services
|
14,491
|
|
8,867
|
|
5,624
|
|
63
|
|
||||||
|
Net cost of operation and sale of other real estate owned
|
1,811
|
|
10,085
|
|
(8,274
|
)
|
(82
|
)
|
||||||
|
Total noninterest expense
|
$
|
229,495
|
|
$
|
183,591
|
|
$
|
45,904
|
|
25
|
%
|
|||
The significant components of our noninterest expense are described in greater detail, as follows.
Salaries and related costs
were
$149.4 million
in
2013
, an increase of
$29.6 million
, or
24.7%
, from
$119.8 million
in
2012
. The increase primarily resulted from a 36.7% increase in full-time equivalent employees at
December 31, 2013
compared to December 31, 2012, as well as commissions and incentives paid to employees for
2013
due to the overall growth in our mortgage lending and commercial and consumer business lines.
63
General and administrative
expense was
$40.4 million
in
2013
, an increase of
$12.5 million
, or
45.0%
, from
$27.8 million
in
2012
. These expenses include general office and equipment expense, marketing, taxes and insurance. The increase in general and administrative expense in
2013
was primarily due to Company growth and increased marketing expenses.
Consulting
expense was
$5.6 million
in
2013
, an increase of
$2.6 million
, or
85.6%
, from
$3.0 million
in
2012
, primarily due to acquisition-related activities.
FDIC assessments
were
$1.4 million
in
2013
, a decrease of
$2.1 million
, or
59.7%
, from
$3.6 million
in
2012
, primarily due to an improvement in the Company's risk category.
Occupancy
expense was
$13.8 million
in
2013
, an increase of
$5.2 million
, or
60.3%
, from
$8.6 million
in
2012
as we grew our mortgage banking business and consumer and commercial customer base with the opening of 19 new mortgage loan origination offices, two commercial lending offices and two de novo retail deposit branches in
2013
. Additionally, we added six retail deposit branches through acquisitions during the fourth quarter of 2013.
Information services
expense was
$14.5 million
in
2013
, an increase of
$5.6 million
, or
63.4%
, from
$8.9 million
in
2012
. This increase was primarily due to company-wide systems and tools upgrades and a 36.7% increase in headcount.
Net cost of operation and sale of other real estate owned
was
$1.8 million
in
2013
, a decrease of
$8.3 million
from
$10.1 million
in
2012
. OREO valuation adjustments were
$603 thousand
for
2013
, compared to valuation adjustments of $12.2 million in
2012
. Valuation adjustments to OREO balances declined with the reduction in the net balance of OREO properties in
2013
. Lower balances of OREO properties also resulted in decreased maintenance expenses.
Income Tax Expense
The Company's income tax expense was
$11.0 million
for the year ended December 31,
2013
, compared to
$21.5 million
for the year ended December 31,
2012
. The Company's
2013
tax expense is based on the annual effective income tax rate plus discrete benefits recognized during the year. The Company's annual effective income tax rate for the year was
31.6%
, compared to an annual effective income tax rate of 20.8% for
2012
. The lower effective income tax rate in
2012
primarily reflected the benefit of a full reversal of deferred tax asset valuation allowances during
2012
.
Capital Expenditures
During
2013
, our net expenditures for property and equipment were
$22.8 million
, compared to net expenditures of
$11.4 million
during
2012
, as we continued to implement our strategic initiatives regarding the expansion of our mortgage banking and commercial and consumer businesses.
64
Review of Financial Condition – Comparison of
December 31, 2014
to
December 31, 2013
Total assets were
$3.54 billion
at
December 31, 2014
and
$3.07 billion
at
December 31, 2013
. The increase in total assets was primarily due to a
$341.3 million
increase
in loans held for sale and a
$227.3 million
increase
in portfolio loans, partially offset by a
$43.5 million
decrease
in investment securities.
Cash and cash equivalents
was
$30.5 million
at
December 31, 2014
, compared to
$33.9 million
at
December 31, 2013
,
a decrease
of
$3.4 million
, or
10.0%
.
Investment securities
was
$455.3 million
at
December 31, 2014
, compared to
$498.8 million
at
December 31, 2013
, a
decrease
of
$43.5 million
, or
8.7%
. The lower balance of our investment securities portfolio reflected management's decision to change the composition of the overall asset mix by selling certain residential mortgage-backed securities and adding corporate debt securities to the Company's portfolio. With the Company's improved credit position and excess capital, the investment in corporate debt securities provided diversification in the Company's investment securities portfolio with minimal additional credit risk.
We primarily hold investment securities for liquidity purposes, while also creating a relatively stable source of interest income. We designated substantially all securities as available for sale. We held securities having a carrying value of
$28.0 million
, which were designated as held to maturity.
The following table sets forth certain information regarding the amortized cost and fair values of our investment securities available for sale.
|
|
At December 31,
|
|||||||||||||||
|
|
2014
|
2013
|
||||||||||||||
|
(in thousands)
|
Amortized
Cost
|
Fair Value
|
Amortized
Cost
|
Fair Value
|
||||||||||||
|
Available for sale:
|
||||||||||||||||
|
Mortgage-backed securities:
|
||||||||||||||||
|
Residential
|
$
|
107,624
|
|
$
|
107,280
|
|
$
|
137,602
|
|
$
|
133,910
|
|
||||
|
Commercial
|
13,030
|
|
13,671
|
|
13,391
|
|
13,433
|
|
||||||||
|
Municipal bonds
|
119,744
|
|
122,334
|
|
136,937
|
|
130,850
|
|
||||||||
|
Collateralized mortgage obligations:
|
||||||||||||||||
|
Residential
|
44,254
|
|
43,166
|
|
93,112
|
|
90,327
|
|
||||||||
|
Commercial
|
20,775
|
|
20,486
|
|
17,333
|
|
16,845
|
|
||||||||
|
Corporate debt securities
|
80,214
|
|
79,400
|
|
75,542
|
|
68,866
|
|
||||||||
|
U.S. Treasury securities
|
40,976
|
|
40,989
|
|
27,478
|
|
27,452
|
|
||||||||
|
Total available for sale
|
$
|
426,617
|
|
$
|
427,326
|
|
$
|
501,395
|
|
$
|
481,683
|
|
||||
Mortgage-backed securities ("MBS") and collateralized mortgage obligations ("CMO") represent securities issued by government sponsored entities ("GSEs"). Each of the MBS and CMO securities in our investment portfolio are guaranteed by Fannie Mae, Ginnie Mae or Freddie Mac. Municipal bonds are comprised of general obligation bonds (i.e., backed by the general credit of the issuer) and revenue bonds (i.e., backed by revenues from the specific project being financed) issued by various municipalities. As of
December 31, 2014
and
2013
, all securities held, including municipal bonds and corporate debt securities, were rated investment grade based upon external ratings where available and, where not available, based upon internal ratings which correspond to ratings as defined by Standard and Poor’s Rating Services (“S&P”) or Moody’s Investors Services (“Moody’s”). As of
December 31, 2014
and
2013
, substantially all securities held by the Company had ratings available by external ratings agencies.
The following tables present the fair value of investment securities available for sale by contractual maturity along with the associated contractual yield for the periods indicated below. Contractual maturities for mortgage-backed securities and collateralized mortgage obligations as presented exclude the effect of expected prepayments. Expected maturities will differ from contractual maturities because borrowers may have the right to prepay obligations before the underlying mortgages
65
mature. The weighted-average yield is computed using the contractual coupon of each security weighted based on the fair value of each security and does not include adjustments to a tax equivalent basis.
|
|
At December 31, 2014
|
|||||||||||||||||||||||||||||||||
|
|
Within one year
|
After one year
through five years
|
After five years
through ten years
|
After
ten years
|
Total
|
|||||||||||||||||||||||||||||
|
(in thousands)
|
Fair
Value
|
Weighted
Average
Yield
|
Fair
Value
|
Weighted
Average
Yield
|
Fair
Value
|
Weighted
Average
Yield
|
Fair
Value
|
Weighted
Average
Yield
|
Fair
Value
|
Weighted
Average
Yield
|
||||||||||||||||||||||||
|
Mortgage-backed securities:
|
||||||||||||||||||||||||||||||||||
|
Residential
|
$
|
—
|
|
—
|
%
|
$
|
—
|
|
—
|
%
|
$
|
6,949
|
|
1.72
|
%
|
$
|
100,331
|
|
1.75
|
%
|
$
|
107,280
|
|
1.75
|
%
|
|||||||||
|
Commercial
|
—
|
|
—
|
|
—
|
|
—
|
|
—
|
|
—
|
|
13,671
|
|
4.75
|
|
13,671
|
|
4.75
|
|
||||||||||||||
|
Municipal bonds
|
—
|
|
—
|
|
604
|
|
4.10
|
|
23,465
|
|
3.55
|
|
98,265
|
|
4.21
|
|
122,334
|
|
4.09
|
|
||||||||||||||
|
Collateralized mortgage obligations:
|
||||||||||||||||||||||||||||||||||
|
Residential
|
—
|
|
—
|
|
—
|
|
—
|
|
—
|
|
—
|
|
43,166
|
|
1.84
|
|
43,166
|
|
1.84
|
|
||||||||||||||
|
Commercial
|
—
|
|
—
|
|
—
|
|
—
|
|
9,776
|
|
1.96
|
|
10,710
|
|
1.99
|
|
20,486
|
|
1.97
|
|
||||||||||||||
|
Corporate debt securities
|
—
|
|
—
|
|
9,000
|
|
2.21
|
|
38,487
|
|
3.35
|
|
31,913
|
|
3.73
|
|
79,400
|
|
3.37
|
|
||||||||||||||
|
U.S. Treasury securities
|
25,998
|
|
0.28
|
|
14,991
|
|
0.46
|
|
—
|
|
—
|
|
—
|
|
—
|
|
40,989
|
|
0.35
|
|
||||||||||||||
|
Total available for sale
|
$
|
25,998
|
|
0.28
|
%
|
$
|
24,595
|
|
1.19
|
%
|
$
|
78,677
|
|
3.09
|
%
|
$
|
298,056
|
|
2.92
|
%
|
$
|
427,326
|
|
2.69
|
%
|
|||||||||
|
|
At December 31, 2013
|
|||||||||||||||||||||||||||||||||
|
|
Within one year
|
After one year
Through five years
|
After five years
through ten years
|
After ten years
|
Total
|
|||||||||||||||||||||||||||||
|
(in thousands)
|
Fair
Value
|
Weighted
average
yield
|
Fair
value
|
Weighted
average
yield
|
Fair
value
|
Weighted
average
yield
|
Fair
value
|
Weighted
average
yield
|
Fair
value
|
Weighted
average
yield
|
||||||||||||||||||||||||
|
Mortgage-backed securities:
|
||||||||||||||||||||||||||||||||||
|
Residential
|
$
|
—
|
|
—
|
%
|
$
|
—
|
|
—
|
%
|
$
|
10,581
|
|
1.63
|
%
|
$
|
123,329
|
|
1.82
|
%
|
$
|
133,910
|
|
1.81
|
%
|
|||||||||
|
Commercial
|
—
|
|
—
|
|
—
|
|
—
|
|
—
|
|
—
|
|
13,433
|
|
4.51
|
|
13,433
|
|
4.51
|
|
||||||||||||||
|
Municipal bonds
|
—
|
|
—
|
|
—
|
|
—
|
|
19,598
|
|
3.51
|
|
111,252
|
|
4.29
|
|
130,850
|
|
4.17
|
|
||||||||||||||
|
Collateralized mortgage obligations:
|
|
|
||||||||||||||||||||||||||||||||
|
Residential
|
—
|
|
—
|
|
—
|
|
—
|
|
19,987
|
|
2.31
|
|
70,340
|
|
2.17
|
|
90,327
|
|
2.20
|
|
||||||||||||||
|
Commercial
|
—
|
|
—
|
|
—
|
|
—
|
|
5,270
|
|
1.90
|
|
11,575
|
|
1.42
|
|
16,845
|
|
1.57
|
|
||||||||||||||
|
Corporate debt securities
|
—
|
|
—
|
|
—
|
|
—
|
|
32,848
|
|
3.31
|
|
36,018
|
|
3.75
|
|
68,866
|
|
3.54
|
|
||||||||||||||
|
U.S. Treasury securities
|
1,001
|
|
0.18
|
|
26,451
|
|
0.30
|
|
—
|
|
—
|
|
—
|
|
—
|
|
27,452
|
|
0.29
|
|
||||||||||||||
|
Total available for sale
|
$
|
1,001
|
|
0.18
|
%
|
$
|
26,451
|
|
0.30
|
%
|
$
|
88,284
|
|
2.84
|
%
|
$
|
365,947
|
|
2.92
|
%
|
$
|
481,683
|
|
2.75
|
%
|
|||||||||
Each of the MBS and CMO securities in our investment portfolio are guaranteed by Fannie Mae, Ginnie Mae or Freddie Mac. Investments in these instruments involve a risk that actual prepayments will vary from the estimated prepayments over the life of the security. This may require adjustments to the amortization of premium or accretion of discount relating to such instruments, thereby changing the net yield on such securities. At
December 31, 2014
, the aggregate net premium associated with our MBS portfolio was
$10.5 million
, or
7.7%
, of the aggregate unpaid principal balance, compared with
$10.5 million
or
8.7%
at
December 31, 2013
. The aggregate net premium associated with our CMO portfolio as of
December 31, 2014
was
$3.1 million
, or
5.0%
, of the aggregate unpaid principal balance, compared with
$6.4 million
or
6.1%
at
December 31, 2013
. There
66
is also reinvestment risk associated with the cash flows from such securities and the market value of such securities may be adversely affected by changes in interest rates.
Management monitors the portfolio of securities classified as available for sale for impairment, which may result from credit deterioration of the issuer, changes in market interest rates relative to the rate of the instrument or changes in prepayment speeds. We evaluate each investment security on a quarterly basis to assess if impairment is considered other than temporary. In conducting this evaluation, management considers many factors, including but not limited to whether we expect to recover the entire amortized cost basis of the security in light of adverse changes in expected future cash flows, the length of time the security has been impaired and the severity of the unrealized loss. We also consider whether we intend to sell the security (or whether we will be required to sell the security) prior to recovery of its amortized cost basis, which may be at maturity.
Based on this evaluation, management concluded that unrealized losses as of
December 31, 2014
were the result of changes in interest rates. Management does not intend to sell such securities nor is it likely it will be required to sell such securities prior to recovery of the securities’ amortized cost basis. Accordingly, none of the unrealized losses as of
December 31, 2014
were considered other than temporary.
Loans held for sale
were
$621.2 million
at
December 31, 2014
, compared to
$279.9 million
as of
December 31, 2013
, a
increase
of
$341.3 million
, or
121.9%
. Loans held for sale include single family and multifamily residential loans, typically sold within 30 days of closing the loan. The increase in the loans held for sale balance is primarily due to increased single family mortgage closed loan volume during December 2014.
Loans held for investment, net
were
$2.10 billion
at
December 31, 2014
, compared to
$1.87 billion
as of
December 31, 2013
, an
increase
of
$227.3 million
, or
12.1%
. Our single family loan portfolio
decreased
by
$8.2 million
from
December 31, 2013
, primarily due to the net transfer of
$217.8 million
of single family mortgage loans out of the portfolio and into loans held for sale during 2014, largely offset by increased originations of mortgages that exceed conventional conforming loan limits. Our commercial construction loan balances
increased
$237.5 million
from
December 31, 2013
primarily as a result of the organic growth of our commercial lending business. At
December 31, 2014
, commercial construction loan balances were comprised of
$143.2 million
of multifamily construction,
$104.7 million
of residential construction,
$60.8 million
of commercial real estate construction and
$59.3 million
of single family/one-step construction. At
December 31, 2013
, we had balances comprised of
$23.6 million
of multifamily construction,
$49.6 million
of residential construction,
$23.1 million
of commercial real estate construction and
$34.2 million
of single family/one-step construction.
67
The following table details the composition of our loans held for investment portfolio by dollar amount and as a percentage of our total loan portfolio.
|
|
At December 31,
|
|||||||||||||||||||||||||||||||||
|
2014
|
2013
|
2012
|
2011
|
2010
|
||||||||||||||||||||||||||||||
|
(in thousands)
|
Amount
|
Percent
|
Amount
|
Percent
|
Amount
|
Percent
|
Amount
|
Percent
|
Amount
|
Percent
|
||||||||||||||||||||||||
|
Consumer loans:
|
||||||||||||||||||||||||||||||||||
|
Single family
|
$
|
896,665
|
|
42.2
|
%
|
$
|
904,913
|
|
47.7
|
%
|
$
|
673,865
|
|
50.3
|
%
|
$
|
496,934
|
|
36.9
|
%
|
$
|
526,462
|
|
32.7
|
%
|
|||||||||
|
Home equity
|
135,598
|
|
6.4
|
|
135,650
|
|
7.1
|
|
136,746
|
|
10.2
|
|
158,936
|
|
11.8
|
|
181,537
|
|
11.3
|
|
||||||||||||||
|
1,032,263
|
|
48.6
|
|
1,040,563
|
|
54.8
|
|
810,611
|
|
60.5
|
|
655,870
|
|
48.7
|
|
707,999
|
|
44.0
|
|
|||||||||||||||
|
Commercial loans:
|
||||||||||||||||||||||||||||||||||
|
Commercial real estate
(1)
|
523,464
|
|
24.6
|
|
477,642
|
|
25.1
|
|
361,879
|
|
27.0
|
|
402,139
|
|
29.8
|
|
426,879
|
|
26.6
|
|
||||||||||||||
|
Multifamily
|
55,088
|
|
2.6
|
|
79,216
|
|
4.2
|
|
17,012
|
|
1.3
|
|
56,379
|
|
4.2
|
|
104,497
|
|
6.5
|
|
||||||||||||||
|
Construction/ land development
|
367,934
|
|
17.3
|
|
130,465
|
|
6.9
|
|
71,033
|
|
5.3
|
|
173,405
|
|
12.9
|
|
285,131
|
|
17.7
|
|
||||||||||||||
|
Commercial business
|
147,449
|
|
6.9
|
|
171,054
|
|
9.0
|
|
79,576
|
|
5.9
|
|
59,831
|
|
4.4
|
|
82,959
|
|
5.2
|
|
||||||||||||||
|
1,093,935
|
|
51.4
|
|
858,377
|
|
45.2
|
|
529,500
|
|
39.5
|
|
691,754
|
|
51.3
|
|
899,466
|
|
56.0
|
|
|||||||||||||||
|
2,126,198
|
|
100.0
|
%
|
1,898,940
|
|
100.0
|
%
|
1,340,111
|
|
100.0
|
%
|
1,347,624
|
|
100.0
|
%
|
1,607,465
|
|
100.0
|
%
|
|||||||||||||||
|
Net deferred loan fees, costs and discounts
|
(5,048
|
)
|
(3,219
|
)
|
(3,576
|
)
|
(4,062
|
)
|
(4,767
|
)
|
||||||||||||||||||||||||
|
2,121,150
|
|
1,895,721
|
|
1,336,535
|
|
1,343,562
|
|
1,602,698
|
|
|||||||||||||||||||||||||
|
Allowance for loan losses
|
(22,021
|
)
|
(23,908
|
)
|
(27,561
|
)
|
(42,689
|
)
|
(64,177
|
)
|
||||||||||||||||||||||||
|
$
|
2,099,129
|
|
$
|
1,871,813
|
|
$
|
1,308,974
|
|
$
|
1,300,873
|
|
$
|
1,538,521
|
|
||||||||||||||||||||
|
(1)
|
December 31, 2014
,
2013
and
2012
balances comprised of
$143.8 million
,
$156.7 million
and $94.9 million of owner-occupied loans, respectively, and
$379.6 million
,
$320.9 million
and $267.0 million of non-owner-occupied loans, respectively.
|
68
The following table shows the composition of the loan portfolio by fixed-rate and adjustable-rate loans.
|
|
At December 31,
|
||||||||||||
|
|
2014
|
2013
|
|||||||||||
|
(in thousands)
|
Amount
|
Percent
|
Amount
|
Percent
|
|||||||||
|
Adjustable-rate loans
|
|||||||||||||
|
Single family
|
$
|
576,295
|
|
27.1
|
%
|
$
|
508,232
|
|
26.8
|
%
|
|||
|
Commercial
|
345,307
|
|
16.2
|
|
293,548
|
|
15.5
|
|
|||||
|
Multifamily
|
45,957
|
|
2.2
|
|
69,439
|
|
3.7
|
|
|||||
|
Construction/land development, net
(1)
|
226,635
|
|
10.7
|
|
70,028
|
|
3.7
|
|
|||||
|
Commercial business
|
95,484
|
|
4.5
|
|
117,718
|
|
6.2
|
|
|||||
|
Home equity
|
69,500
|
|
3.3
|
|
79,447
|
|
4.2
|
|
|||||
|
Total adjustable-rate loans
|
1,359,178
|
|
63.9
|
|
1,138,412
|
|
59.9
|
|
|||||
|
Fixed-rate loans
|
|||||||||||||
|
Single family
|
320,370
|
|
15.1
|
|
396,681
|
|
20.9
|
|
|||||
|
Commercial
|
178,157
|
|
8.4
|
|
184,094
|
|
9.7
|
|
|||||
|
Multifamily
|
9,131
|
|
0.4
|
|
9,777
|
|
0.5
|
|
|||||
|
Construction/land development, net
(1)
|
141,299
|
|
6.6
|
|
60,437
|
|
3.2
|
|
|||||
|
Commercial business
|
51,965
|
|
2.4
|
|
53,336
|
|
2.8
|
|
|||||
|
Home equity
|
66,098
|
|
3.1
|
|
56,203
|
|
3.0
|
|
|||||
|
Total fixed-rate loans
|
767,020
|
|
36.1
|
|
760,528
|
|
40.1
|
|
|||||
|
Total loans held for investment
|
2,126,198
|
|
100.0
|
%
|
1,898,940
|
|
100.0
|
%
|
|||||
|
Less:
|
|||||||||||||
|
Net deferred loan fees, costs and discounts
|
(5,048
|
)
|
(3,219
|
)
|
|||||||||
|
Allowance for loan losses
|
(22,021
|
)
|
(23,908
|
)
|
|||||||||
|
Loans held for investment, net
|
$
|
2,099,129
|
|
$
|
1,871,813
|
|
|||||||
|
(1)
|
Construction/land development is presented net of the undisbursed portion of the loan commitment.
|
69
The following tables show the contractual maturity of our loan portfolio by loan type.
|
|
December 31, 2014
|
Loans due after one year
by rate characteristic
|
|||||||||||||||||||||
|
(in thousands)
|
Within one year
|
After
one year through
five years
|
After
five
years
|
Total
|
Fixed-
rate
|
Adjustable-
rate
|
|||||||||||||||||
|
|
|
|
|
|
|
||||||||||||||||||
|
Consumer:
|
|||||||||||||||||||||||
|
Single family
|
$
|
1,335
|
|
$
|
12,401
|
|
$
|
882,929
|
|
$
|
896,665
|
|
$
|
319,055
|
|
$
|
576,275
|
|
|||||
|
Home equity
|
344
|
|
3,371
|
|
131,883
|
|
135,598
|
|
65,921
|
|
69,333
|
|
|||||||||||
|
Total consumer
|
1,679
|
|
15,772
|
|
1,014,812
|
|
1,032,263
|
|
384,976
|
|
645,608
|
|
|||||||||||
|
Commercial:
|
|||||||||||||||||||||||
|
Commercial real estate
|
40,482
|
|
150,001
|
|
332,981
|
|
523,464
|
|
154,001
|
|
328,981
|
|
|||||||||||
|
Multifamily
|
6,008
|
|
4,051
|
|
45,029
|
|
55,088
|
|
5,692
|
|
43,388
|
|
|||||||||||
|
Construction/land development
|
181,327
|
|
156,605
|
|
30,002
|
|
367,934
|
|
62,176
|
|
124,431
|
|
|||||||||||
|
Commercial business
|
80,406
|
|
43,061
|
|
23,982
|
|
147,449
|
|
44,709
|
|
22,334
|
|
|||||||||||
|
Total commercial
|
308,223
|
|
353,718
|
|
431,994
|
|
1,093,935
|
|
266,578
|
|
519,134
|
|
|||||||||||
|
Total loans held for investment
|
$
|
309,902
|
|
$
|
369,490
|
|
$
|
1,446,806
|
|
$
|
2,126,198
|
|
$
|
651,554
|
|
$
|
1,164,742
|
|
|||||
|
|
December 31, 2013
|
Loans due after one year
by rate characteristic
|
|||||||||||||||||||||
|
(in thousands)
|
Within one year
|
After
one year through
five years
|
After
five
years
|
Total
|
Fixed-
rate
|
Adjustable-
rate
|
|||||||||||||||||
|
|
|
|
|
|
|
||||||||||||||||||
|
Consumer:
|
|||||||||||||||||||||||
|
Single family
|
$
|
2,117
|
|
$
|
11,889
|
|
$
|
890,907
|
|
$
|
904,913
|
|
$
|
396,580
|
|
$
|
506,215
|
|
|||||
|
Home equity
|
1,001
|
|
3,231
|
|
131,418
|
|
135,650
|
|
56,107
|
|
78,542
|
|
|||||||||||
|
Total consumer
|
3,118
|
|
15,120
|
|
1,022,325
|
|
1,040,563
|
|
452,687
|
|
584,757
|
|
|||||||||||
|
Commercial:
|
|||||||||||||||||||||||
|
Commercial real estate
|
21,265
|
|
107,259
|
|
349,118
|
|
477,642
|
|
177,567
|
|
278,810
|
|
|||||||||||
|
Multifamily
|
—
|
|
4,255
|
|
74,961
|
|
79,216
|
|
9,777
|
|
69,439
|
|
|||||||||||
|
Construction/land development
|
75,019
|
|
45,404
|
|
10,042
|
|
130,465
|
|
24,259
|
|
31,187
|
|
|||||||||||
|
Commercial business
|
99,374
|
|
46,030
|
|
25,650
|
|
171,054
|
|
43,016
|
|
28,661
|
|
|||||||||||
|
Total commercial
|
195,658
|
|
202,948
|
|
459,771
|
|
858,377
|
|
254,619
|
|
408,097
|
|
|||||||||||
|
Total loans held for investment
|
$
|
198,776
|
|
$
|
218,068
|
|
$
|
1,482,096
|
|
$
|
1,898,940
|
|
$
|
707,306
|
|
$
|
992,854
|
|
|||||
70
The following table presents the loan portfolio by loan type and region as of
December 31, 2014
.
|
|
Washington
|
Idaho
|
|||||||||||||||||||||||||||||
|
|
Puget Sound
|
Vancouver & Other
(2)(3)
|
Central & Eastern
WA
(2)(3)
|
Kitsap/Jefferson/Clallam
(1)
|
|||||||||||||||||||||||||||
|
(in thousands)
|
King
(1)
|
Snohomish
(3)
|
Pierce
(1)
|
Thurston
(3)
|
Boise
(2)
|
||||||||||||||||||||||||||
|
Consumer:
|
|||||||||||||||||||||||||||||||
|
Single family
|
$
|
348,256
|
|
$
|
84,611
|
|
$
|
44,517
|
|
$
|
16,407
|
|
$
|
53,970
|
|
$
|
35,990
|
|
$
|
11,426
|
|
$
|
15,816
|
|
|||||||
|
Home equity
|
55,404
|
|
14,859
|
|
9,242
|
|
4,168
|
|
8,899
|
|
3,326
|
|
5,289
|
|
149
|
|
|||||||||||||||
|
403,660
|
|
99,470
|
|
53,759
|
|
20,575
|
|
62,869
|
|
39,316
|
|
16,715
|
|
15,965
|
|
||||||||||||||||
|
Commercial:
|
|||||||||||||||||||||||||||||||
|
Commercial real estate
|
231,981
|
|
57,506
|
|
27,130
|
|
49,479
|
|
2,754
|
|
58,065
|
|
14,002
|
|
657
|
|
|||||||||||||||
|
Multifamily
|
21,371
|
|
1,217
|
|
16,893
|
|
520
|
|
—
|
|
5,766
|
|
—
|
|
—
|
|
|||||||||||||||
|
Construction/land development
|
153,496
|
|
34,932
|
|
43,864
|
|
9,590
|
|
22,106
|
|
25,955
|
|
873
|
|
9,546
|
|
|||||||||||||||
|
Commercial business
|
94,081
|
|
7,605
|
|
5,328
|
|
12
|
|
93
|
|
31,751
|
|
1,354
|
|
—
|
|
|||||||||||||||
|
500,929
|
|
101,260
|
|
93,215
|
|
59,601
|
|
24,953
|
|
121,537
|
|
16,229
|
|
10,203
|
|
||||||||||||||||
|
Total loans
|
$
|
904,589
|
|
$
|
200,730
|
|
$
|
146,974
|
|
$
|
80,176
|
|
$
|
87,822
|
|
$
|
160,853
|
|
$
|
32,944
|
|
$
|
26,168
|
|
|||||||
|
|
Oregon
|
|
|
|
|||||||||||||||||||||||||||
|
(in thousands)
|
Portland
(2)(3)
|
Eugene/Bend
(2)(3)
|
Salem
(2)
|
Hawaii
|
Utah
|
California
|
Other
(4)
|
Total
|
|||||||||||||||||||||||
|
Consumer:
|
|||||||||||||||||||||||||||||||
|
Single family
|
$
|
69,162
|
|
$
|
20,029
|
|
$
|
11,128
|
|
$
|
39,582
|
|
$
|
933
|
|
$
|
140,539
|
|
$
|
4,299
|
|
$
|
896,665
|
|
|||||||
|
Home equity
|
12,723
|
|
2,938
|
|
3,428
|
|
8,228
|
|
—
|
|
6,445
|
|
500
|
|
135,598
|
|
|||||||||||||||
|
81,885
|
|
22,967
|
|
14,556
|
|
47,810
|
|
933
|
|
146,984
|
|
4,799
|
|
1,032,263
|
|
||||||||||||||||
|
Commercial:
|
|||||||||||||||||||||||||||||||
|
Commercial real estate
|
46,010
|
|
19,342
|
|
6,585
|
|
—
|
|
—
|
|
—
|
|
9,953
|
|
523,464
|
|
|||||||||||||||
|
Multifamily
|
1,758
|
|
7,563
|
|
—
|
|
—
|
|
—
|
|
—
|
|
—
|
|
55,088
|
|
|||||||||||||||
|
Construction/land development
|
22,320
|
|
5,356
|
|
2,345
|
|
5,308
|
|
11,812
|
|
20,431
|
|
—
|
|
367,934
|
|
|||||||||||||||
|
Commercial business
|
4,468
|
|
97
|
|
—
|
|
—
|
|
—
|
|
—
|
|
2,660
|
|
147,449
|
|
|||||||||||||||
|
74,556
|
|
32,358
|
|
8,930
|
|
5,308
|
|
11,812
|
|
20,431
|
|
12,613
|
|
1,093,935
|
|
||||||||||||||||
|
Total loans
|
$
|
156,441
|
|
$
|
55,325
|
|
$
|
23,486
|
|
$
|
53,118
|
|
$
|
12,745
|
|
$
|
167,415
|
|
$
|
17,412
|
|
$
|
2,126,198
|
|
|||||||
|
(1)
|
Refers to a specific county.
|
|
(2)
|
Refers to a specific city.
|
|
(3)
|
Also includes surrounding counties.
|
|
(4)
|
Includes Alaska, Florida, Arizona and Colorado.
|
71
The following table presents the loan portfolio by loan type and region as of
December 31, 2013
.
|
|
Washington
|
||||||||||||||||||||||||||
|
|
Puget Sound
|
Vancouver & Other
(2)(3)
|
|
Kitsap/Jefferson/Clallam
(1)
|
|||||||||||||||||||||||
|
(in thousands)
|
King
(1)
|
Snohomish
(3)
|
Pierce
(1)
|
Thurston
(3)
|
Spokane
(2)(3)
|
||||||||||||||||||||||
|
Consumer:
|
|||||||||||||||||||||||||||
|
Single family
|
$
|
464,120
|
|
$
|
89,921
|
|
$
|
51,267
|
|
$
|
17,703
|
|
$
|
41,348
|
|
$
|
30,883
|
|
$
|
14,192
|
|
||||||
|
Home equity
|
56,491
|
|
15,722
|
|
10,406
|
|
4,557
|
|
8,706
|
|
3,957
|
|
5,211
|
|
|||||||||||||
|
520,611
|
|
105,643
|
|
61,673
|
|
22,260
|
|
50,054
|
|
34,840
|
|
19,403
|
|
||||||||||||||
|
Commercial:
|
|||||||||||||||||||||||||||
|
Commercial real estate
|
238,663
|
|
54,068
|
|
22,007
|
|
23,987
|
|
624
|
|
56,673
|
|
6,942
|
|
|||||||||||||
|
Multifamily
|
25,342
|
|
3,183
|
|
16,729
|
|
515
|
|
—
|
|
12,497
|
|
—
|
|
|||||||||||||
|
Construction/land development
|
60,547
|
|
11,825
|
|
11,532
|
|
5,449
|
|
13,185
|
|
16,729
|
|
269
|
|
|||||||||||||
|
Commercial business
|
122,396
|
|
1,248
|
|
7,702
|
|
—
|
|
149
|
|
31,973
|
|
1,293
|
|
|||||||||||||
|
446,948
|
|
70,324
|
|
57,970
|
|
29,951
|
|
13,958
|
|
117,872
|
|
8,504
|
|
||||||||||||||
|
Total loans
|
$
|
967,559
|
|
$
|
175,967
|
|
$
|
119,643
|
|
$
|
52,211
|
|
$
|
64,012
|
|
$
|
152,712
|
|
$
|
27,907
|
|
||||||
|
|
Idaho
|
Oregon
|
|
|
|
||||||||||||||||||||||
|
(in thousands)
|
Boise
(2)
|
Portland
(2)(3)
|
Bend
(2)(3)
|
Salem
(2)
|
Hawaii
|
Other
(4)
|
Total
|
||||||||||||||||||||
|
Consumer:
|
|||||||||||||||||||||||||||
|
Single family
|
$
|
12,001
|
|
$
|
67,387
|
|
$
|
19,246
|
|
$
|
12,656
|
|
$
|
38,832
|
|
$
|
45,357
|
|
$
|
904,913
|
|
||||||
|
Home equity
|
91
|
|
13,348
|
|
3,257
|
|
4,218
|
|
8,678
|
|
1,008
|
|
135,650
|
|
|||||||||||||
|
12,092
|
|
80,735
|
|
22,503
|
|
16,874
|
|
47,510
|
|
46,365
|
|
1,040,563
|
|
||||||||||||||
|
Commercial:
|
|||||||||||||||||||||||||||
|
Commercial real estate
|
589
|
|
50,261
|
|
8,009
|
|
6,725
|
|
—
|
|
9,094
|
|
477,642
|
|
|||||||||||||
|
Multifamily
|
—
|
|
13,282
|
|
7,668
|
|
—
|
|
—
|
|
—
|
|
79,216
|
|
|||||||||||||
|
Construction/land development
|
2,331
|
|
3,813
|
|
3,272
|
|
—
|
|
1,513
|
|
—
|
|
130,465
|
|
|||||||||||||
|
Commercial business
|
—
|
|
2,318
|
|
47
|
|
—
|
|
3
|
|
3,925
|
|
171,054
|
|
|||||||||||||
|
2,920
|
|
69,674
|
|
18,996
|
|
6,725
|
|
1,516
|
|
13,019
|
|
858,377
|
|
||||||||||||||
|
Total loans
|
$
|
15,012
|
|
$
|
150,409
|
|
$
|
41,499
|
|
$
|
23,599
|
|
$
|
49,026
|
|
$
|
59,384
|
|
$
|
1,898,940
|
|
||||||
|
(1)
|
Refers to a specific county.
|
|
(2)
|
Refers to a specific city.
|
|
(3)
|
Also includes surrounding counties.
|
|
(4)
|
Includes California, Alaska and Florida.
|
72
The following table presents the loan portfolio by loan type and year of origination.
|
|
December 31, 2014
|
||||||||||||||||||||||||||
|
|
Prior to
2006
|
2006-
2008
|
2009-
2011
|
2012
|
2013
|
2014
|
Total
|
||||||||||||||||||||
|
(in thousands)
|
|||||||||||||||||||||||||||
|
Consumer
|
|||||||||||||||||||||||||||
|
Single family
|
$
|
36,109
|
|
$
|
174,541
|
|
$
|
128,376
|
|
$
|
88,167
|
|
$
|
151,352
|
|
$
|
318,120
|
|
$
|
896,665
|
|
||||||
|
Home equity
|
26,632
|
|
70,654
|
|
3,351
|
|
1,846
|
|
14,934
|
|
18,181
|
|
135,598
|
|
|||||||||||||
|
62,741
|
|
245,195
|
|
131,727
|
|
90,013
|
|
166,286
|
|
336,301
|
|
1,032,263
|
|
||||||||||||||
|
Commercial
|
|||||||||||||||||||||||||||
|
Commercial real estate
|
25,583
|
|
182,498
|
|
30,479
|
|
60,050
|
|
122,347
|
|
102,507
|
|
523,464
|
|
|||||||||||||
|
Multifamily
|
5,572
|
|
6,515
|
|
1,730
|
|
—
|
|
35,959
|
|
5,312
|
|
55,088
|
|
|||||||||||||
|
Construction/land development
|
—
|
|
7,834
|
|
157
|
|
17,396
|
|
94,075
|
|
248,472
|
|
367,934
|
|
|||||||||||||
|
Commercial business
|
15,232
|
|
15,360
|
|
27,284
|
|
18,703
|
|
31,145
|
|
39,725
|
|
147,449
|
|
|||||||||||||
|
46,387
|
|
212,207
|
|
59,650
|
|
96,149
|
|
283,526
|
|
396,016
|
|
1,093,935
|
|
||||||||||||||
|
Total loans
|
$
|
109,128
|
|
$
|
457,402
|
|
$
|
191,377
|
|
$
|
186,162
|
|
$
|
449,812
|
|
$
|
732,317
|
|
$
|
2,126,198
|
|
||||||
The following table presents the loan portfolio by loan type and year of origination.
|
|
December 31, 2013
|
||||||||||||||||||||||||||
|
|
Prior to
2000
|
2000-
2004
|
2005-
2008
|
2009-
2010
|
2011-
2012 |
2013
|
Total
|
||||||||||||||||||||
|
(in thousands)
|
|||||||||||||||||||||||||||
|
Consumer
|
|||||||||||||||||||||||||||
|
Single family
|
$
|
7,236
|
|
$
|
25,471
|
|
$
|
195,559
|
|
$
|
136,240
|
|
$
|
168,885
|
|
$
|
371,522
|
|
$
|
904,913
|
|
||||||
|
Home equity
|
3
|
|
17,919
|
|
93,304
|
|
4,819
|
|
2,704
|
|
16,901
|
|
135,650
|
|
|||||||||||||
|
7,239
|
|
43,390
|
|
288,863
|
|
141,059
|
|
171,589
|
|
388,423
|
|
1,040,563
|
|
||||||||||||||
|
Commercial
|
|||||||||||||||||||||||||||
|
Commercial real estate
|
361
|
|
10,041
|
|
205,754
|
|
20,263
|
|
109,308
|
|
131,915
|
|
477,642
|
|
|||||||||||||
|
Multifamily
|
—
|
|
63
|
|
12,199
|
|
1,115
|
|
5,416
|
|
60,423
|
|
79,216
|
|
|||||||||||||
|
Construction/land development
|
—
|
|
—
|
|
14,155
|
|
411
|
|
19,789
|
|
96,110
|
|
130,465
|
|
|||||||||||||
|
Commercial business
|
52
|
|
892
|
|
29,980
|
|
14,493
|
|
43,110
|
|
82,527
|
|
171,054
|
|
|||||||||||||
|
413
|
|
10,996
|
|
262,088
|
|
36,282
|
|
177,623
|
|
370,975
|
|
858,377
|
|
||||||||||||||
|
Total loans
|
$
|
7,652
|
|
$
|
54,386
|
|
$
|
550,951
|
|
$
|
177,341
|
|
$
|
349,212
|
|
$
|
759,398
|
|
$
|
1,898,940
|
|
||||||
73
The following table presents loan origination and loan sale volumes.
|
|
Year Ended December 31,
|
||||||||||
|
(in thousands)
|
2014
|
2013
|
2012
|
||||||||
|
Loans originated
|
|||||||||||
|
Real estate
|
|||||||||||
|
Single family
|
|||||||||||
|
Originated by HomeStreet
|
$
|
4,208,736
|
|
$
|
4,160,435
|
|
$
|
3,968,696
|
|
||
|
Originated by WMS Series LLC
|
489,031
|
|
692,444
|
|
932,377
|
|
|||||
|
Single family
|
4,697,767
|
|
4,852,879
|
|
4,901,073
|
|
|||||
|
Multifamily
|
152,280
|
|
90,967
|
|
115,274
|
|
|||||
|
Commercial real estate
|
57,025
|
|
129,531
|
|
49,982
|
|
|||||
|
Construction/land development
|
595,034
|
|
255,314
|
|
54,187
|
|
|||||
|
Total real estate
|
5,502,106
|
|
5,328,691
|
|
5,120,516
|
|
|||||
|
Commercial business
|
142,602
|
|
109,735
|
|
35,606
|
|
|||||
|
Home equity
|
20,559
|
|
17,724
|
|
386
|
|
|||||
|
Total loans originated
|
$
|
5,665,267
|
|
$
|
5,456,150
|
|
$
|
5,156,508
|
|
||
|
Loans sold
|
|||||||||||
|
Single family
|
$
|
3,979,398
|
|
$
|
4,733,473
|
|
$
|
4,170,840
|
|
||
|
Multifamily
|
141,859
|
|
104,016
|
|
118,805
|
|
|||||
|
Total loans sold
|
$
|
4,121,257
|
|
$
|
4,837,489
|
|
$
|
4,289,645
|
|
||
Other real estate owned
was
$9.4 million
at
December 31, 2014
, compared to
$12.9 million
at
December 31, 2013
,
a decrease
of
$3.5 million
, or
26.8%
. This decrease was predominantly due to sales of OREO properties, which totaled
$7.5 million
and loss provision of
$69 thousand
for 2014, partially offset by additions to the OREO assets of
$4.1 million
.
FHLB Stock
was
$33.9 million
at
December 31, 2014
, compared to
$35.3 million
at
December 31, 2013
. FHLB stock is carried at par value and can only be purchased or redeemed at par value in transactions between the FHLB and its member institutions. Both cash and stock dividends received on FHLB stock are reported in earnings.
On November 6, 2009, the FHLB’s regulator defined its capital classification as undercapitalized. Under the Federal Housing Finance Agency (the "Finance Agency") regulations, a FHLB that fails to meet any regulatory capital requirement may not declare a dividend or redeem or repurchase capital stock. In September 2012, the Finance Agency reclassified the FHLB as adequately capitalized but the FHLB remained subject to a consent order. On November 22, 2013, the Finance Agency issued an amended consent order, which modified and superseded the October 2010 consent order. The amended consent order acknowledges the FHLB’s fulfillment of many of the requirements set forth in the 2010 consent order and improvements in the FHLB’s financial performance, while continuing to impose certain restrictions on its ability to repurchase, redeem, and pay dividends on its capital stock. As such, Finance Agency approval or non-objection will continue to be required for all repurchases, redemptions, and dividend payments on capital stock.
In September 2014, the FHLB entered into a merger agreement with the Federal Home Loan Bank of Des Moines (the “Des Moines Bank”). If the merger agreement is consummated, the FHLB will merge with and into the Des Moines Bank, with the Des Moines Bank being the surviving entity. As a result, the Bank will become a member of the Des Moines Bank and its shares of FHLB stock will be converted into shares of stock of the Des Moines Bank.
Management periodically evaluates FHLB stock for other-than-temporary impairment based on its assessment of ultimate recoverability of par value, rather than recognizing temporary declines in value. The determination of whether the decline affects the ultimate recoverability is influenced by criteria such as (1) the significance of the decline in net assets of the FHLB as compared to the capital stock amount for the FHLB and the length of time this situation has persisted, (2) commitments by the FHLB to make payments required by law or regulation and the level of such payments in relation to the operating performance of the FHLB, (3) the impact of legislative and regulatory changes on institutions and, accordingly, on the customer base of the FHLB and (4) the liquidity position of the FHLB. The FHLB continues to benefit from a superior credit rating from Standard & Poor’s, which allows the FHLB to secure funding for its activities at attractive rates and terms, further supporting
74
continued access to liquidity. Based on its evaluation, management determined there is no other-than-temporary impairment on the FHLB stock investment as of
December 31, 2014
or
December 31, 2013
.
Accounts receivable and other assets
was
$105.0 million
at
December 31, 2014
, compared to
$122.2 million
at
December 31, 2013
,
a decrease
of
$17.2 million
, or
14.1%
, primarily attributable to the collection of federal income tax receivable during
2014
. The income tax receivable balance was
$29.6 million
at
December 31, 2013
.
Deposits
Deposits were
$2.45 billion
at
December 31, 2014
, compared to
$2.21 billion
at
December 31, 2013
,
an increase
of
$234.6 million
, or
10.6%
. This increase was primarily attributable to the organic growth of our deposit branch network. During
2014
, the Company increased the balances of transaction and savings deposits by
$183.0 million
, or
11.9%
, to
$1.72 billion
at
December 31, 2014
from
$1.54 billion
at
December 31, 2013
. Partially offsetting the increased transaction and savings deposits was the managed reduction of certificates of deposit balances, which decreased
$19.9 million
, or
3.9%
, to
$494.5 million
at
December 31, 2014
from
$514.4 million
at
December 31, 2013
. This improvement in the composition of deposits was partially the result of our successful efforts to attract transaction and savings deposit balances through effective brand marketing.
Deposit balances were as follows for the periods indicated:
|
|
At December 31,
|
||||||||||
|
(in thousands)
|
2014
|
2013
|
2012
|
||||||||
|
Noninterest-bearing accounts - checking and savings
|
$
|
240,679
|
|
$
|
164,437
|
|
$
|
83,563
|
|
||
|
Interest-bearing transaction and savings deposits:
|
|||||||||||
|
NOW accounts
|
272,390
|
|
297,966
|
|
174,699
|
|
|||||
|
Statement savings accounts due on demand
|
200,638
|
|
156,181
|
|
103,932
|
|
|||||
|
Money market accounts due on demand
|
1,007,213
|
|
919,322
|
|
683,906
|
|
|||||
|
Total interest-bearing transaction and savings deposits
|
1,480,241
|
|
1,373,469
|
|
962,537
|
|
|||||
|
Total transaction and savings deposits
|
1,720,920
|
|
1,537,906
|
|
1,046,100
|
|
|||||
|
Certificates of deposit
|
494,526
|
|
514,400
|
|
655,467
|
|
|||||
|
Noninterest-bearing accounts - other
|
229,984
|
|
158,515
|
|
275,268
|
|
|||||
|
Total deposits
|
$
|
2,445,430
|
|
$
|
2,210,821
|
|
$
|
1,976,835
|
|
||
Borrowings
FHLB advances were
$597.6 million
at
December 31, 2014
, compared to
$446.6 million
as of
December 31, 2013
. FHLB advances may be collateralized by stock in the FHLB, cash, pledged mortgage-backed securities, real estate-secured commercial loans and unencumbered qualifying mortgage loans. As of
December 31, 2014
,
2013
and
2012
, FHLB borrowings had weighted average interest rates of
0.41%
,
0.43%
and
0.60%
, respectively. Of the total FHLB borrowings outstanding as of
December 31, 2014
,
$532.0 million
mature prior to December 31,
2015
. We had
$317.9 million
and
$228.5 million
of additional borrowing capacity with the FHLB as of
December 31, 2014
and
December 31, 2013
, respectively. Our lending agreement permits the FHLB to refuse to make advances under that agreement during periods in which an “event of default” (as defined in that agreement) exists. An “event of default” occurs when the FHLB gives notice to the Bank of an intention to take any of a list of permissible actions following the occurrence of specified events or conditions affecting the Bank. Among those events is the issuance or entry of “any supervisory or consent order pertaining to” the Bank. No such condition existed at
December 31, 2014
.
We may also borrow, on a collateralized basis, from the Federal Reserve Bank of San Francisco ("FRBSF" or "Federal Reserve Bank"). At
December 31, 2014
and
December 31, 2013
, we did not have any outstanding borrowings from the FRBSF. Based on the amount of qualifying collateral available, borrowing capacity from the FRBSF was
$316.1 million
and
$332.7 million
at
December 31, 2014
and
December 31, 2013
, respectively. The FRBSF is also not contractually bound to offer credit to us, and our access to this source for future borrowings may be discontinued at any time.
Long-term debt was
$61.9 million
at
December 31, 2014
and
$64.8 million
at
December 31, 2013
. This balance represents junior subordinated debentures issued in connection with the sale of TruPS by HomeStreet Statutory Trusts, subsidiaries of
75
HomeStreet, Inc. During 2013, as a result of the acquisition of YNB, the Company acquired
$3.1 million
of additional TruPS, which was redeemed during 2014. TruPS allow investors to buy subordinated debt through a variable interest entity trust that issues preferred securities to third-party investors and uses the cash received to purchase subordinated debt from the issuer. That debt is the sole asset of the trust and the coupon rate on the debt mirrors the dividend rate on the preferred securities. These securities are nonvoting and are not convertible into capital stock, and the variable interest entity trust is not consolidated in our financial statements.
Shareholders' Equity
Shareholders’ equity was
$302.2 million
at
December 31, 2014
, compared to
$265.9 million
at
December 31, 2013
. This increase included net income of
$22.3 million
and other comprehensive
income
of
$13.5 million
recognized during
2014
, partially offset by
$1.6 million
of dividends paid during
2014
. The comprehensive
income
in
2014
represented unrealized gains in the valuation of our investment securities available for sale portfolio at
December 31, 2014
.
The Company paid cash dividends to shareholders of $0.11 per share on February 24, 2014.
Shareholders' equity, on a per share basis, was
$20.34
per share at
December 31, 2014
, compared to
$17.97
per share at
December 31, 2013
.
Return on Equity and Assets
The following table presents certain information regarding our returns on average equity and average total assets. Return on equity ratios for the periods shown may not be comparable due to the impact and timing of the Company's initial public offering of common stock completed in February 2012 and changes in the annual effective income tax rate between periods. During 2012, the Company benefited from the full reversal of its deferred tax asset valuation allowances.
|
|
Year Ended December 31,
|
|||||||
|
(in thousands)
|
2014
|
2013
|
2012
|
|||||
|
Return on assets
(1)
|
0.69
|
%
|
0.88
|
%
|
3.42
|
%
|
||
|
Return on equity
(2)
|
7.69
|
%
|
9.56
|
%
|
38.86
|
%
|
||
|
Equity to assets ratio
(3)
|
9.03
|
%
|
9.16
|
%
|
8.79
|
%
|
||
|
(1)
|
Net income divided by average total assets.
|
|
(2)
|
Net earnings (loss) available to common shareholders divided by average common shareholders’ equity.
|
|
(3)
|
Average equity divided by average total assets.
|
Business Segments
The Company's business segments are determined based on the products and services provided, as well as the nature of the related business activities, and they reflect the manner in which financial information is currently evaluated by management.
This process is dynamic and is based on management's current view of the Company's operations and is not necessarily comparable with similar information for other financial institutions. We define our business segments by product type and customer segment. If the management structure or the allocation process changes, allocations, transfers and assignments may change.
76
We use various management accounting methodologies to assign certain income statement items to the responsible operating segment, including:
|
•
|
a funds transfer pricing (“FTP”) system, which allocates interest income credits and funding charges between the segments, assigning to each segment a funding credit for its liabilities, such as deposits, and a charge to fund its assets;
|
|
•
|
an allocation of charges for services rendered to the segments by centralized functions, such as corporate overhead, which are generally based on each segment’s consumption patterns; and
|
|
•
|
an allocation of the Company's consolidated income taxes which are based on the effective tax rate applied to the segment's pretax income or loss.
|
Commercial and Consumer Banking Segment
Commercial and Consumer Banking
provides diversified financial products and services to our commercial and consumer customers through bank branches and through ATMs, online, mobile and telephone banking. These products and services include deposit products; residential, consumer, business and agricultural portfolio loans; non-deposit investment products; insurance products and cash management services. We originate construction loans, bridge loans and permanent loans for our portfolio primarily on single family residences, and on office, retail, industrial and multifamily property types. We originate multifamily real estate loans through our Fannie Mae DUS business, whereby loans are sold to or securitized by Fannie Mae, while the Company generally retains the servicing rights. As of
December 31, 2014
, our bank branch network consisted of
33
branches in the Pacific Northwest and Hawaii. At
December 31, 2014
and
2013
, our transaction and savings deposits totaled
$1.72 billion
and
$1.54 billion
, respectively, and our loan portfolio totaled
$2.10 billion
and
$1.87 billion
, respectively. This segment is also responsible for the management of the Company's portfolio of investment securities.
Commercial and Consumer Banking segment results are detailed below.
|
|
Year Ended December 31,
|
||||||||||
|
(in thousands)
|
2014
|
2013
|
2012
|
||||||||
|
Net interest income
|
$
|
81,986
|
|
$
|
59,172
|
|
$
|
46,625
|
|
||
|
Provision (reversal of provision) for loan losses
|
(1,000
|
)
|
900
|
|
11,500
|
|
|||||
|
Noninterest income
|
18,666
|
|
(3)
|
15,091
|
|
12,465
|
|
||||
|
Noninterest expense
|
79,812
|
|
66,141
|
|
63,609
|
|
|||||
|
Income (loss) before income taxes
|
21,840
|
|
7,222
|
|
(16,019
|
)
|
|||||
|
Income tax (benefit) expense
|
7,092
|
|
1,249
|
|
(3,316
|
)
|
|||||
|
Net income (loss)
|
$
|
14,748
|
|
$
|
5,973
|
|
$
|
(12,703
|
)
|
||
|
Total assets
|
$
|
2,746,409
|
|
$
|
2,576,762
|
|
$
|
1,862,315
|
|
||
|
Pre-tax pre-provision profit (loss)
(1)
|
20,840
|
|
8,122
|
|
(4,519
|
)
|
|||||
|
Efficiency ratio
(2)
|
79.29
|
%
|
89.06
|
%
|
107.65
|
%
|
|||||
|
Full-time equivalent employees (ending)
|
608
|
|
577
|
|
413
|
|
|||||
|
Net gain on mortgage loan origination and sale activity:
|
|||||||||||
|
Multifamily
|
$
|
4,723
|
|
$
|
5,306
|
|
$
|
4,872
|
|
||
|
Other
|
4,764
|
|
(3)
|
964
|
|
—
|
|
||||
|
$
|
9,487
|
|
$
|
6,270
|
|
$
|
4,872
|
|
|||
|
Commercial and Consumer Banking production volumes:
|
|||||||||||
|
Multifamily mortgage originations
|
$
|
152,282
|
|
$
|
90,968
|
|
$
|
112,074
|
|
||
|
Multifamily mortgage loans sold
|
$
|
141,859
|
|
$
|
104,016
|
|
$
|
118,805
|
|
||
|
(1)
|
Pre-tax pre-provision profit is total net revenue (net interest income and noninterest income) less noninterest expense. The Company believes that this financial measure is useful in assessing the ability of a lending institution to generate income in excess of its provision for credit losses.
|
|
(2)
|
Noninterest expense divided by total net revenue (net interest income and noninterest income).
|
|
(3)
|
Includes
$4.6 million
in pre-tax gain during 2014 from the sale of loans that were originally held for investment.
|
77
Commercial and Consumer Banking net income was
$14.7 million
for the year ended
December 31, 2014
, an increase of
$8.8 million
from
$6.0 million
for the year ended
December 31, 2013
. The increase in net income in
2014
was primarily the result of a
$22.8 million
increase in net interest income, which reflected improvements in our deposit product and pricing strategy. That strategy included reducing our higher-cost deposits and converting customers with maturing certificates of deposit to transaction and savings deposits. Additionally, improved credit quality of the Company's loan portfolio resulted in a
$1.0 million
reversal of provision for loan losses in
2014
, compared to provision of
$900 thousand
in
2013
. Partially offsetting these improvements to net income was increased noninterest expense as we continue to grow this segment.
Commercial and Consumer Banking noninterest expense of
$79.8 million
increased
$13.7 million
, or
20.7%
, from
$66.1 million
in
2013
, primarily due to increased salaries and related costs, reflecting the growth of our commercial real estate and commercial business lending units and the expansion of our branch banking network, including growth through acquisitions which closed in the fourth quarter of 2013.
Commercial and Consumer Banking had net income of
$6.0 million
for the year ended
December 31, 2013
, compared to a net loss of
$12.7 million
for the year ended
December 31, 2012
. The improvement in
2013
was primarily due to an increase in net interest income, which in large part reflected improvements in our deposit product and pricing strategy.
Commercial and Consumer Banking servicing income consisted of the following.
|
|
Year Ended December 31,
|
||||||||||
|
(in thousands)
|
2014
|
2013
|
2012
|
||||||||
|
Servicing income, net:
|
|||||||||||
|
Servicing fees and other
|
$
|
4,166
|
|
$
|
3,174
|
|
$
|
3,396
|
|
||
|
Amortization of multifamily MSRs
|
(1,712
|
)
|
(1,803
|
)
|
(2,014
|
)
|
|||||
|
Commercial mortgage servicing income
|
$
|
2,454
|
|
$
|
1,371
|
|
$
|
1,382
|
|
||
Commercial and Consumer Banking loans serviced for others consisted of the following.
|
Year Ended December 31,
|
|||||||
|
(in thousands)
|
2014
|
2013
|
|||||
|
Commercial
|
|||||||
|
Multifamily
|
$
|
752,640
|
|
$
|
720,429
|
|
|
|
Other
|
82,354
|
|
95,673
|
|
|||
|
Total commercial loans serviced for others
|
$
|
834,994
|
|
$
|
816,102
|
|
|
Mortgage Banking Segment
Mortgage Banking originates single family residential mortgage loans for sale in the secondary markets. We have become a rated originator and servicer of non-conforming jumbo loans, allowing us to sell these loans to other securitizers. We also purchase loans from WMS Series LLC through a correspondent arrangement with that company. The majority of our mortgage loans are sold to or securitized by Fannie Mae, Freddie Mac or Ginnie Mae, while we retain the right to service these loans. On occasion, we may sell a portion of our MSR portfolio. A small percentage of our loans are brokered to other lenders or sold on a servicing-released basis to correspondent lenders. We manage the loan funding and the interest rate risk associated with the secondary market loan sales and the retained single family mortgage servicing rights within this business segment.
78
|
|
Year Ended December 31,
|
||||||||||
|
(in thousands)
|
2014
|
2013
|
2012
|
||||||||
|
Net interest income
|
$
|
16,683
|
|
$
|
15,272
|
|
$
|
14,117
|
|
||
|
Noninterest income
|
166,991
|
|
175,654
|
|
225,555
|
|
|||||
|
Noninterest expense
|
172,199
|
|
163,354
|
|
119,981
|
|
|||||
|
Income before income taxes
|
11,475
|
|
27,572
|
|
119,691
|
|
|||||
|
Income tax expense
|
3,964
|
|
9,736
|
|
24,862
|
|
|||||
|
Net income
|
$
|
7,511
|
|
$
|
17,836
|
|
$
|
94,829
|
|
||
|
Total assets
|
$
|
788,681
|
|
$
|
489,292
|
|
$
|
768,915
|
|
||
|
Efficiency ratio
(1)
|
93.75
|
%
|
85.56
|
%
|
50.06
|
%
|
|||||
|
Full-time equivalent employees (ending)
|
1,003
|
|
925
|
|
686
|
|
|||||
|
Production volumes for sale to the secondary market:
|
|||||||||||
|
Single family mortgage closed loan volume
(2)(3)
|
$
|
4,400,617
|
|
$
|
4,459,649
|
|
$
|
4,668,167
|
|
||
|
Single family mortgage interest rate lock commitments
(2)
|
4,344,248
|
|
3,907,274
|
|
4,786,667
|
|
|||||
|
Single family mortgage loans sold
(2)
|
3,979,398
|
|
4,733,473
|
|
4,170,840
|
|
|||||
|
(1)
|
Noninterest expense divided by total net revenue (net interest income and noninterest income).
|
|
(2)
|
Includes loans originated by WMS Series LLC ("WMS") and purchased by HomeStreet Bank.
|
|
(3)
|
Represents single family mortgage production volume designated for sale to the secondary market during each respective period.
|
Mortgage Banking net income was
$7.5 million
for the year ended
December 31, 2014
,
a decrease
of
$10.3 million
, or
57.9%
, from net income of
$17.8 million
for the year ended
December 31, 2013
. The decrease in Mortgage Banking net income for
2014
was driven primarily by lower gain on sale income. Our single family mortgage interest rate lock commitments of
$4.34 billion
in
2014
increased
11.2%
, compared to
$3.91 billion
in the
2013
. However, we experienced lower gain on sale margins on our interest rate lock commitments during
2014
compared to
2013
. In periods where we experience lower gain on sale margins, noninterest expense will be higher relative to noninterest income, as we do not see a commensurate decrease in commissions expense at the time of closing the loan.
Mortgage Banking net income of
$17.8 million
for the year ended
December 31, 2013
decreased
$77.0 million
, or
81.2%
, from
$94.8 million
for the year ended
December 31, 2012
. The decrease in Mortgage Banking net income for
2013
was driven primarily by higher mortgage interest rates that led to a sharp decrease in interest rate lock commitments.
Mortgage Banking net gain on sale to the secondary market
is detailed in the following table.
|
|
Year Ended December 31,
|
|||||||||||
|
(in thousands)
|
2014
|
2013
|
2012
|
|||||||||
|
Net gain on mortgage loan origination and sale activities:
(1)
|
||||||||||||
|
Single family:
|
||||||||||||
|
Servicing value and secondary market gains
(2)
|
$
|
109,063
|
|
$
|
128,391
|
|
$
|
178,624
|
|
|||
|
Provision for repurchase losses
(3)
|
—
|
|
—
|
|
(2,969
|
)
|
||||||
|
Net gain from secondary market activities
|
109,063
|
|
128,391
|
|
175,655
|
|
||||||
|
Loan origination and funding fees
|
25,572
|
|
30,051
|
|
30,037
|
|
||||||
|
Total mortgage banking net gain on mortgage loan origination and sale activities
(1)
|
$
|
134,635
|
|
$
|
158,442
|
|
$
|
205,692
|
|
|||
|
(1)
|
Excludes inter-segment activities.
|
|
(2)
|
Comprised of gains and losses on interest rate lock commitments (which considers the value of servicing), single family loans held for sale, forward sale commitments used to economically hedge secondary market activities, and the estimated fair value of the repurchase or indemnity obligation recognized on new loan sales.
|
|
(3)
|
Represents changes in estimated probable future repurchase losses on previously sold loans.
|
79
Net gain on mortgage loan origination and sale activities was
$134.6 million
for the year ended
December 31, 2014
, a decrease of
$23.8 million
, or
15.0%
, from
$158.4 million
for the year ended
December 31, 2013
. This decrease is primarily the result of lower gain on sale margins on our interest rate lock commitments during
2014
compared to
2013
. Partially offsetting this effect on net gain on mortgage loan origination and sale activities was an
11.2%
increase in interest rate lock commitments resulting from the expansion of our mortgage lending operations, as we entered new markets by adding
11
mortgage loan origination offices during
2014
.
Mortgage Banking servicing income
consisted of the following.
|
|
Year Ended December 31,
|
||||||||||
|
(in thousands)
|
2014
|
2013
|
2012
|
||||||||
|
Servicing income, net:
|
|||||||||||
|
Servicing fees and other
|
$
|
33,652
|
|
$
|
30,999
|
|
$
|
24,437
|
|
||
|
Changes in fair value of MSRs due to modeled amortization
(1)
|
(26,112
|
)
|
(24,321
|
)
|
(26,706
|
)
|
|||||
|
7,540
|
|
6,678
|
|
(2,269
|
)
|
||||||
|
Risk management:
|
|||||||||||
|
Changes in fair value of MSRs due to changes in model inputs and/or assumptions
(2)
|
(15,629
|
)
|
(3)
|
29,456
|
|
$
|
(4,974
|
)
|
|||
|
Net gain from derivatives economically hedging MSRs
|
39,727
|
|
(20,432
|
)
|
21,982
|
|
|||||
|
24,098
|
|
9,024
|
|
17,008
|
|
||||||
|
Mortgage Banking servicing income
|
$
|
31,638
|
|
$
|
15,702
|
|
$
|
14,739
|
|
||
|
(1)
|
Represents changes due to collection/realization of expected cash flows and curtailments.
|
|
(2)
|
Principally reflects changes in model assumptions, including prepayment speed assumptions, which are primarily affected by changes in mortgage interest rates.
|
|
(3)
|
Includes pre-tax income of
$4.7 million
, net of brokerage fees and prepayment reserves, resulting from the second quarter 2014 sale of single family MSRs.
|
Single family mortgage servicing income of
$31.6 million
in the year ended
December 31, 2014
increased
by
$15.9 million
from
$15.7 million
in the year ended
December 31, 2013
. This increase was primarily due to MSR risk management results and increased servicing fees collected on the Company's single family mortgages. Risk management results represent changes in the fair value of single family MSRs due to changes in model inputs and assumptions net of the gain/(loss) from derivatives economically hedging MSRs. Included in risk management results for the year ended
December 31, 2014
is
$4.7 million
of pre-tax income recognized from the second quarter 2014 sale of single family MSRs. No similar transactions occurred in 2013.
Single family mortgage servicing fees collected in the year ended
December 31, 2014
increased
$2.7 million
, or
8.6%
, from the year ended
December 31, 2013
. As a result of the June 30, 2014 sale of
$2.96 billion
of single family MSRs, the portfolio of single family loans serviced for others decreased to
$11.22 billion
at
December 31, 2014
, compared to
$11.80 billion
at
December 31, 2013
. Mortgage servicing fees collected in future periods will be negatively impacted in the short term because the balance of the loans serviced for others portfolio was reduced as a consequence of this sale.
Single family mortgage servicing income of
$15.7 million
for the year ended
December 31, 2013
increased from servicing income of
$14.7 million
for the year ended
December 31, 2012
, primarily as a result of growth in the portfolio of single family loans serviced for others, which increased to
$11.80 billion
at
December 31, 2013
from
$8.87 billion
at
December 31, 2012
.
80
Single family loans serviced for others
consisted of the following.
|
At December 31,
|
|||||||
|
(in thousands)
|
2014
|
2013
|
|||||
|
Single family
|
|||||||
|
U.S. government and agency
|
$
|
10,630,864
|
|
$
|
11,467,853
|
|
|
|
Other
|
585,344
|
|
327,768
|
|
|||
|
Total single family loans serviced for others
|
$
|
11,216,208
|
|
$
|
11,795,621
|
|
|
Mortgage Banking noninterest expense of
$172.2 million
for the year ended
December 31, 2014
increased
$8.8 million
, or
5.4%
, from
$163.4 million
in
2013
. This increase was primarily attributable to increased salaries and related costs, as well as occupancy and information services expenses related to the addition of approximately
84
mortgage originators and mortgage fulfillment personnel as we grew our single family mortgage lending network.
Off-Balance Sheet Arrangements
In the normal course of business, we are a party to financial instruments with off-balance sheet risk. These financial instruments (which include commitments to originate loans and commitments to purchase loans) include potential credit risk in excess of the amount recognized in the accompanying consolidated financial statements. These transactions are designed to (1) meet the financial needs of our customers, (2) manage our credit, market or liquidity risks, (3) diversify our funding sources and/or (4) optimize capital.
For more information on off-balance sheet arrangements, see Note 13,
Commitments
,
Guarantees and Contingencies
to the financial statements of this Form 10-K.
Commitments, Guarantees and Contingencies
We may incur liabilities under certain contractual agreements contingent upon the occurrence of certain events. Our known contingent liabilities include:
|
•
|
Unfunded loan commitments.
We make certain unfunded loan commitments as part of our lending activities that have not been recognized in the Company’s financial statements. These include commitments to extend credit made as part of our mortgage lending activities and interest rate lock commitments on loans we intend to hold in our loans held for investment portfolio. The aggregate amount of these unrecognized unfunded loan commitments existing at
December 31, 2014
and
December 31, 2013
was
$72.0 million
and
$18.4 million
, respectively.
|
|
•
|
Credit agreements.
We extend secured and unsecured open-end loans to meet the financing needs of our customers. These commitments, which primarily related to unused home equity and commercial real estate lines of credit and business banking funding lines, totaled
$149.4 million
and
$154.0 million
at
December 31, 2014
and
December 31, 2013
. Undistributed construction loan proceeds, where the Company has an obligation to advance funds for construction progress payments, was
$379.4 million
and
$168.5 million
at
December 31, 2014
and
December 31, 2013
, respectively. The total amounts of unused commitments do not necessarily represent future credit exposure or cash requirements in that commitments may expire without being drawn upon.
|
|
•
|
Interest rate lock commitments
. The Company writes options in the form of interest rate lock commitments on single family mortgage loans that are exercisable at the option of the borrower. We are exposed to market risk on interest rate lock commitments. The fair value of interest rate lock commitments existing at
December 31, 2014
and
December 31, 2013
, was
$11.9 million
and
$6.0 million
, respectively. We mitigate the risk of future changes in the fair value of interest rate lock commitments primarily through the use of forward sale commitments.
|
|
•
|
Credit loss sharing.
We originate, sell and service multifamily loans through the Fannie Mae DUS program. Multifamily loans are sold to Fannie Mae subject to a loss sharing arrangement. HomeStreet Capital services the loans for Fannie Mae and shares in the risk of loss with Fannie Mae under the terms of the DUS contracts. Under the DUS program, the DUS lender is contractually responsible for the first 5% of losses and then shares equally in the remainder of losses with Fannie Mae with a maximum lender loss of 20% of the original principal balance of each DUS loan. The total principal balance of loans outstanding under the DUS program as of
December 31, 2014
|
81
and
December 31, 2013
was
$752.6 million
and
$720.4 million
, respectively, and our loss reserve was
$2.3 million
and
$2.0 million
as of
December 31, 2014
and
December 31, 2013
, respectively.
|
•
|
Mortgage repurchase liability
. In our single family lending business, we sell residential mortgage loans to GSEs that include the mortgage loans in GSE-guaranteed mortgage securitizations. In addition, the Company pools FHA-insured and Department of Veterans' Affairs ("VA")-guaranteed mortgage loans that are used to back Ginnie Mae-guaranteed securities. We have made representations and warranties that the loans sold meet certain requirements. We may be required to repurchase mortgage loans or indemnify loan purchasers due to defects in the origination process of the loan, such as documentation errors, underwriting errors and judgments, early payment defaults and fraud. These obligations expose us to any credit loss on the repurchased mortgage loans after accounting for any mortgage insurance that it may receive. Generally, the maximum amount of future payments we would be required to make for breaches of these representations and warranties would be equal to the unpaid principal balance of such loans that are deemed to have defects that were sold to purchasers plus, in certain circumstances, accrued and unpaid interest on such loans and certain expenses.
|
We do not typically receive repurchase requests from Ginnie Mae, FHA or VA. As an originator of FHA-insured or VA-guaranteed loans, we are responsible for obtaining the insurance with FHA or the guarantee with the VA. If loans are later found not to meet the requirements of FHA or VA, through required internal quality control reviews or through agency audits, we may be required to indemnify FHA or VA against loss. The loans remain in Ginnie Mae pools unless and until they qualify for voluntary repurchase by the Company. In general, once a FHA or VA loan becomes 90 days past due, we repurchase the FHA or VA loan to minimize the cost of interest advances on the loan. If the loan is cured through borrower efforts or through loss mitigation activities, the loan may be resold into a Ginnie Mae pool. The Company's liability for mortgage loan repurchase losses incorporates probable losses associated with such indemnification.
As of
December 31, 2014
and
December 31, 2013
, the total principal balance of loans sold on a servicing-retained basis that were subject to the terms and conditions of these representations and warranties totaled
$11.30 billion
and
$11.89 billion
, respectively. The recorded mortgage repurchase liability for loans sold on a servicing-retained and a servicing-released basis was
$2.0 million
and
$1.3 million
at
December 31, 2014
and
2013
, respectively. The Company's mortgage repurchase liability reflects management's estimate of losses for loans sold on a servicing-retained and servicing-released basis for which we could have a repurchase obligation. Actual repurchase losses of
$734 thousand
,
$2.5 million
and
$2.8 million
were incurred for the years ended
December 31, 2014
,
2013
and
2012
, respectively.
|
•
|
Leases
. The Company is obligated under non-cancelable leases for office space. The office leases also contain renewal and space options. Rental expense under non-cancelable operating leases totaled
$15.3 million
,
$11.4 million
and
$7.1 million
for the years ended
December 31, 2014
,
2013
and
2012
, respectively.
|
Derivative Counterparty Credit Risk
Derivative financial instruments expose us to credit risk in the event of nonperformance by counterparties to such agreements. This risk consists primarily of the termination value of agreements where we are in a favorable position. Credit risk related to derivative financial instruments is considered within the fair value measurement of the instrument. We manage the credit risk associated with our various derivative agreements through counterparty credit review, counterparty exposure limits and monitoring procedures. From time to time, we may provide or obtain collateral from certain counterparties for amounts in excess of exposure limits as outlined by the counterparty credit policies of the parties. We have entered into agreements with derivative counterparties that include netting arrangements whereby the counterparties are entitled to settle their positions on a net basis. At
December 31, 2014
and
2013
, our net exposure to the credit risk of derivative counterparties was
$18.8 million
and
$10.2 million
.
82
Contractual Obligations
The following table summarizes our significant fixed and determinable contractual obligations, within the categories described below, by payment date or contractual maturity as of
December 31, 2014
. The payment amounts for financial instruments shown below represent principal amounts contractually due to the recipient and do not include any unamortized premiums or discounts, or other similar carrying value adjustments.
|
(in thousands)
|
Within
one year
|
After one but
within three years
|
After three but
within five
|
More than
five years
|
Total
|
||||||||||||||
|
Deposits
(1)
|
$
|
2,270,483
|
|
$
|
165,529
|
|
$
|
9,418
|
|
$
|
—
|
|
$
|
2,445,430
|
|
||||
|
FHLB advances
|
532,000
|
|
50,000
|
|
—
|
|
15,590
|
|
597,590
|
|
|||||||||
|
Federal funds purchased
|
50,000
|
|
—
|
|
—
|
|
—
|
|
50,000
|
|
|||||||||
|
Trust preferred securities
(2)
|
—
|
|
—
|
|
—
|
|
61,857
|
|
61,857
|
|
|||||||||
|
Interest
(3)
|
4,677
|
|
6,564
|
|
3,899
|
|
20,062
|
|
35,202
|
|
|||||||||
|
Operating leases
|
14,555
|
|
29,128
|
|
22,070
|
|
54,047
|
|
119,800
|
|
|||||||||
|
Purchase obligations
(4)
|
8,458
|
|
9,698
|
|
5,834
|
|
170
|
|
24,160
|
|
|||||||||
|
Total
|
$
|
2,880,173
|
|
$
|
260,919
|
|
$
|
41,221
|
|
$
|
151,726
|
|
$
|
3,334,039
|
|
||||
|
(1)
|
Deposits with indeterminate maturities, such as demand, savings and money market accounts, are reflected as obligations due less than one year.
|
|
(2)
|
Trust preferred securities is included in long-term debt on the consolidated statements of financial condition.
|
|
(3)
|
Represents the future interest obligations related to interest-bearing time deposits and long-term debt in the normal course of business. These interest obligations assume no early debt redemption. We estimated variable interest rate payments using
December 31, 2014
rates, which we held constant until maturity.
|
|
(4)
|
Represents agreements to purchase goods or services.
|
Enterprise Risk Management
All financial institutions manage and control a variety of business and financial risks that can significantly affect their financial performance. Among these risks are credit risk; market risk, which includes interest rate risk and price risk; liquidity risk; and operational risk. We are also subject to risks associated with compliance/legal, strategic and reputational matters.
The Company's Board of Directors (the "Board") and executive management have overall and ultimate responsibility for management of these risks. The Board, its committees and senior managers oversee the management of various risks. We review and assess these risks on an enterprise-wide basis periodically and as part of the annual strategic planning process. We use internal audits, quality control and loan review functions to assess the strength of and adherence to risk management policies, internal controls and regulatory requirements. Similarly, external reviews, examinations and audits are conducted by regulators and others. In addition, our compliance, appraisal, corporate security and information security personnel provide additional risk management services in their areas of expertise.
The Board and its committees (both for the Company and its subsidiaries) work closely with senior management in overseeing risk. Management recommends the appropriate level of risk in our strategic and business plans and in our board-approved credit and operating policies and has responsibility for measuring, managing, controlling and reporting on risks. The Board and its committees oversee the monitoring and controlling of significant risk exposures, including the policies governing risk management. The Board authorizes its committees to take any action on its behalf as described in their respective charter or as otherwise delegated by the Board, except as otherwise specifically reserved by law, regulation, other committees' charters or the Company's charter documents for action solely by the full board or another board committee. These committees include:
|
•
|
Audit Committee.
The Audit Committee oversees the policies and management activities relating to our financial reporting, internal and external audit, regulatory, legal and compliance risks.
|
|
•
|
Finance Committee.
The Finance Committee oversees the consolidated companies' activities related to balance sheet management, major financial risks including market, interest rate, liquidity and funding risks and counterparty risk management, including trading limits.
|
83
|
•
|
Credit Committee.
The Credit Committee oversees the annual Loan Review Plan, lending policies, credit performance and trends, the allowance for credit loss policy and loan loss reserves, large borrower exposure and concentrations, and approval of broker/dealer relationships.
|
|
•
|
Human Resources and Corporate Governance Committee
. The Human Resources and Corporate Governance Committee (the "HRCG") of HomeStreet, Inc. reviews all matters concerning our human resources, compensation, benefits, and corporate governance. HRCG's policy objectives are to ensure that HomeStreet and its operating subsidiaries meet their corporate objectives of attracting and retaining a well-qualified workforce, to oversee our human resource strategies and policies and to ensure processes are in place to assure compliance with employment laws and regulations.
|
|
•
|
Enterprise Risk Management Committee.
The Enterprise Risk Management Committee (the "ERMC") oversees the Company's enterprise-wide risk management framework, including evaluating management's identification and assessment of the significant risks and the related infrastructure to address such risks and monitors the Company's compliance with its risk appetite and risk limit structures and effective remediation of non-compliance on an ongoing, enterprise-wide, and individual entity basis. The ERMC does not duplicate the risk oversight of the Board's other committees, but rather helps ensure end-to-end understanding and oversight of all risk issues in one Board committee and enhances the Board's and management's understanding of the Company's aggregate enterprise-wide risk appetite.
|
The following is a discussion of our risk management practices. The risks related to credit, liquidity, interest rate and price warrant in-depth discussion due to the significance of these risks and the impact they may have on our business.
Credit Risk Management
Credit risk is defined as the risk to current or anticipated earnings or capital arising from an obligor’s failure to meet the terms of any contract with the Company, including those in the lending, securities and derivative portfolios, or otherwise perform as agreed. Factors relating to the degree of credit risk include the size of the asset or transaction, the contractual terms of the related documents, the credit characteristics of the borrower, the channel through which assets are acquired, the features of loan products or derivatives, the existence and strength of guarantor support, the availability, quality and adequacy of any underlying collateral and the economic environment after the loan is originated or the asset is acquired. Our overall portfolio credit risk is also impacted by asset concentrations within the portfolio.
Our credit risk management process is primarily governed centrally. Our overall credit process includes comprehensive credit policies, judgmental or statistical credit underwriting, frequent and detailed risk measurement and modeling and loan review, quality control and audit processes. In addition, we have an independent loan review function that reports directly to the Credit Committee of the Board, and internal auditors and regulatory examiners review and perform detailed tests of our credit underwriting, loan administration and allowance processes.
The Chief Credit Officer’s primary responsibilities include directing the activities of the credit risk management function as it relates to the loan portfolio, overseeing loan portfolio performance and ensuring compliance with regulatory requirements and the Company's established credit policies, standards and limits, determining the reasonableness of our allowance for loan losses, reviewing and approving large credit exposures and delegating credit approval authorities. Senior credit administrators who oversee the lines of business have both transaction approval authority and governance authority for the approval of procedures within established policies, standards and limits. The Chief Credit Officer reports directly to the Chief Executive Officer.
The Loan Committee provides direction and oversight within our risk management framework. The committee seeks to ensure effective portfolio risk analysis and policy review and to support sound implementation of defined business and risk strategies. Additionally, the Loan Committee periodically approves credits larger than the Chief Credit Officer’s or Chief Executive Officer’s individual approval authorities allow. The members of the Loan Committee are the Chief Executive Officer, Chief Credit Officer and the Commercial Banking Director.
The loan review department's primary responsibility includes the review of our loan portfolios to provide an independent assessment of credit quality, portfolio oversight and credit management, including accuracy of loan grading. Loan review also conducts targeted credit-related reviews and credit process reviews at the request of the Board and management and reviews a sample of newly originated loans for compliance with closing conditions and accuracy of loan grades. Loan review reports directly to the Credit Committee and administratively to the Compliance and Regulatory Affairs Director.
84
Credit limits for capital markets counterparties, including derivative counterparties, are defined in the Company's Counterparty Risk policy, which is reviewed annually by the Bank Loan Committee, with final approval by the Board Credit Committee. The treasury function is responsible for directing the activities related to securities and derivative portfolios, including overseeing derivative portfolio performance and ensuring compliance with established credit policies, standards and limits. The Chief Investment Officer and Treasurer reports directly to the Chief Executive Officer.
Appraisal Policy
An integral part of our credit risk management process is the valuation of the collateral supporting the loan portfolio, which is primarily comprised of loans secured by real estate. We maintain a Board-approved appraisal policy for real estate appraisals that conforms to the Uniform Standards of Professional Appraisal Practice and FDIC regulatory requirements. Our Chief Appraiser, who is independent of the business unit and credit administration departments, is responsible for maintaining the appraisal policy and recommending changes to the policy subject to Loan Committee and Credit Committee approval.
Real Estate
Our appraisal policy requires that market value appraisals or evaluations be prepared prior to new loan origination, subsequent loan transactions and for loan monitoring purposes. Our appraisals are prepared by independent third-party appraisers and our staff appraisers. Evaluations are prepared by independent and qualified third-party providers. We use state certified and licensed appraisers with appropriate expertise as it relates to the subject property type and location. All appraisals contain an “as is” market value estimate based upon the definition of market value as set forth in the FDIC appraisal regulations. For applicable property types, we may also obtain “upon completion” and “upon stabilization” values. The appraisal standard for non-tract development properties (four units or less) is the retail market value of individual units. For tract development properties with five or more units, the appraisal standard is the bulk market value of the tract as a whole.
We review all appraisals and evaluations prior to the closing of a loan transaction. Commercial and single family real estate appraisals and evaluations are reviewed by either our in-house appraisal staff or by independent and qualified third-party appraisers.
For loan monitoring and problem loan management purposes our appraisal practices are as follows:
|
•
|
We generally do not perform valuation monitoring for pass-graded credits due to minimal credit risk.
|
|
•
|
For loans graded special mention, an appraisal is performed at the time of loan downgrade, and an appraisal or evaluation is performed at least every two years thereafter, depending upon property complexity, market area, market conditions, intended use and other considerations.
|
|
•
|
For loans graded substandard or doubtful and for all OREO properties, we require an independent third-party appraisal at the time of downgrade or transfer to OREO and at least every twelve months thereafter until disposition or loan upgrade. For loans where foreclosure is probable, an appraisal or evaluation is prepared at the intervening six-month period prior to foreclosure.
|
|
•
|
In addition, if we determine that market conditions, changes to the property, changes in the intended use of the property or other factors indicate an appraisal is no longer reliable, we will also obtain an updated appraisal or evaluation and assess whether a change in collateral value requires an additional adjustment to carrying value.
|
Other
Our appraisal requirements for loans not secured by real estate, such as business loans secured by equipment, include valuation methods ranging from evidence of sales price or verification with a recognized guide for new equipment to a valuation opinion by a professional appraiser for multiple pieces of used equipment.
Loan Modifications
We have modified loans for various reasons for borrowers not experiencing financial difficulties. For example, we have extended maturities on certain loans to allow additional time for sales or leasing of residential and commercial real estate construction or rehabilitation projects. Other short-term extensions have been granted to allow time for receipt of appraisals and other financial reporting information to facilitate underwriting of loan extensions and renewals.
When there is a well-conceived and prudent workout plan that supports the ultimate collection of principal and interest, we may enter into a loan modification to help maximize the likelihood of success for a given workout strategy. In each case we also
85
assess whether it is in the best interests of the Company to foreclose or modify the terms. We have made concessions such as interest-only payment terms, interest rate reductions, principal and interest forgiveness and payment restructures. Additionally, we have provided for concessions to construction and land development borrowers that focused primarily on forgiveness of principal in conjunction with settlement activities so as to allow us to acquire control of the real estate collateral. For single family mortgage borrowers, we have generally provided for granting interest rate reductions for periods of three years or less to reduce payments and provide the borrower time to resolve their financial difficulties. In each case, we carefully analyze the borrower’s current financial condition to assure that they can make the modified payment.
Asset Quality and Nonperforming Assets
Nonperforming assets were
$25.5 million
, or
0.72%
of total assets at
December 31, 2014
, compared to
$38.6 million
, or
1.26%
of total assets at
December 31, 2013
. Nonaccrual loans of
$16.0 million
, or
0.75%
of total loans at
December 31, 2014
,
decreased
$9.7 million
, or
37.7%
, from
$25.7 million
, or
1.36%
of total loans at
December 31, 2013
. OREO balances of
$9.4 million
at
December 31, 2014
decreased
$3.5 million
, or
26.8%
, from
$12.9 million
at
December 31, 2013
. Net charge-offs in
2014
were
$565 thousand
, compared to
$4.6 million
in
2013
and
$26.5 million
in
2012
.
At
December 31, 2014
, our loans held for investment portfolio, excluding the allowance for loan losses, was
$2.12 billion
,
an increase
of
$225.4 million
from
December 31, 2013
, while the allowance for loan losses decreased to
$22.0 million
, or
1.04%
of loans held for investment, compared to
$23.9 million
, or
1.26%
of loans held for investment at
December 31, 2013
. The decrease in the allowance for loan losses as a percentage of loans held for investment primarily reflected the improved credit quality of our loan portfolio.
We recorded a reversal of provision for loan losses of
$1.0 million
during
2014
, compared to a provision for loan losses of
$900 thousand
for
2013
and a provision for loan losses of
$11.5 million
for
2012
. Management considers the current level of the allowance for loan losses to be appropriate to cover estimated incurred losses inherent within our loans held for investment portfolio.
The following table presents the activity in our allowance for credit losses and those amounts that were collectively and individually evaluated for impairment at
December 31, 2014
,
2013
and
2012
.
|
|
December 31,
|
||||||||||
|
(in thousands)
|
2014
|
2013
|
2012
|
||||||||
|
Allowance for credit losses:
|
|||||||||||
|
Beginning balance
|
$
|
24,089
|
|
$
|
27,751
|
|
$
|
42,800
|
|
||
|
Charge-offs
|
(2,508
|
)
|
(6,854
|
)
|
(29,875
|
)
|
|||||
|
Recoveries
|
1,943
|
|
2,292
|
|
3,326
|
|
|||||
|
Provision
|
(1,000
|
)
|
900
|
|
11,500
|
|
|||||
|
Ending balance
|
$
|
22,524
|
|
$
|
24,089
|
|
$
|
27,751
|
|
||
|
Collectively evaluated for impairment
|
$
|
20,818
|
|
$
|
21,518
|
|
$
|
21,383
|
|
||
|
Individually evaluated for impairment
|
1,706
|
|
2,571
|
|
6,368
|
|
|||||
|
Total
|
$
|
22,524
|
|
$
|
24,089
|
|
$
|
27,751
|
|
||
|
Loans held for investment:
|
|||||||||||
|
Collectively evaluated for impairment
|
$
|
2,006,974
|
|
$
|
1,779,071
|
|
$
|
1,216,146
|
|
||
|
Individually evaluated for impairment
|
119,224
|
|
119,869
|
|
123,965
|
|
|||||
|
Total
|
$
|
2,126,198
|
|
$
|
1,898,940
|
|
$
|
1,340,111
|
|
||
The allowance for credit losses represents management’s estimate of the incurred credit losses inherent within our loan portfolio. For further discussion related to credit policies and estimates see "
Critical Accounting Policies and Estimates
—
Allowance for Loan Losses"
within Management's Discussion and Analysis of this Form 10-K.
86
The following tables present the recorded investment, unpaid principal balance and related allowance for impaired loans, broken down by those with and those without a specific reserve.
|
At December 31, 2014
|
|||||||||||
|
(in thousands)
|
Recorded
Investment
|
Unpaid
Principal
Balance
|
Related
Allowance
|
||||||||
|
Impaired loans:
|
|||||||||||
|
Loans with no related allowance recorded
|
$
|
82,725
|
|
$
|
98,664
|
|
$
|
—
|
|
||
|
Loans with an allowance recorded
|
36,499
|
|
37,078
|
|
1,706
|
|
|||||
|
Total
|
$
|
119,224
|
|
(1)
|
$
|
135,742
|
|
$
|
1,706
|
|
|
|
At December 31, 2013
|
|||||||||||
|
Recorded
Investment
|
Unpaid
Principal
Balance
|
Related
Allowance
|
|||||||||
|
Impaired loans:
|
|||||||||||
|
Loans with no related allowance recorded
|
$
|
81,301
|
|
$
|
112,795
|
|
$
|
—
|
|
||
|
Loans with an allowance recorded
|
38,568
|
|
38,959
|
|
2,571
|
|
|||||
|
Total
|
$
|
119,869
|
|
(1)
|
$
|
151,754
|
|
$
|
2,571
|
|
|
|
At December 31, 2012
|
|||||||||||
|
Recorded
Investment
|
Unpaid
Principal
Balance
|
Related
Allowance
|
|||||||||
|
Impaired loans:
|
|||||||||||
|
Loans with no related allowance recorded
|
$
|
53,615
|
|
$
|
67,262
|
|
$
|
—
|
|
||
|
Loans with an allowance recorded
|
70,350
|
|
72,220
|
|
6,368
|
|
|||||
|
Total
|
$
|
123,965
|
|
$
|
139,482
|
|
$
|
6,368
|
|
||
(1) Includes
$72.3 million
and
$70.3 million
in single family performing troubled debt restructurings ("TDRs") at
December 31, 2014
and
December 31, 2013
, respectively.
The Company had
258
impaired loans totaling
$119.2 million
at
December 31, 2014
, and
216
impaired loans totaling
$119.9 million
at
December 31, 2013
. Included in the total impaired loan amounts were
199
single family troubled debt restructuring ("TDR") loan relationships totaling
$74.8 million
at
December 31, 2014
and
169
single family TDR relationships totaling
$74.3 million
at
December 31, 2013
. The increase in the number of impaired loan relationships at
December 31, 2014
from
2013
was primarily due to an increase in the number of single family impaired loans. At
December 31, 2014
, there were
189
single family impaired relationships totaling
$72.3 million
that were performing per their current contractual terms. Additionally, the impaired loan balance included
$26.8 million
of loans insured by the FHA or guaranteed by the VA. The average recorded investment in these loans for the year ended
December 31, 2014
was
$118.8 million
, compared to
$122.8 million
for the year ended
December 31, 2013
. Impaired loans of
$36.5 million
and
$38.6 million
had a valuation allowance of
$1.7 million
and
$2.6 million
at
December 31, 2014
and
2013
, respectively.
87
The following table presents the allowance for credit losses, including reserves for unfunded commitments, by loan class.
|
|
At December 31,
|
||||||||||||||||||||||||||||
|
|
2014
|
2013
|
2012
|
||||||||||||||||||||||||||
|
(in thousands)
|
Amount
|
Percent of
allowance
to total
allowance
|
Loan
category
as a % of
total loans
|
Amount
|
Percent of
allowance
to total
allowance
|
Loan
category
as a % of
total loans
|
Amount
|
Percent of
allowance
to total
allowance
|
Loan
category
as a % of
total loans
|
||||||||||||||||||||
|
Consumer loans
|
|||||||||||||||||||||||||||||
|
Single family
|
$
|
9,447
|
|
41.9
|
%
|
42.2
|
%
|
$
|
11,990
|
|
49.8
|
%
|
47.7
|
%
|
$
|
13,388
|
|
48.2
|
%
|
50.3
|
%
|
||||||||
|
Home equity
|
3,322
|
|
14.8
|
|
6.4
|
|
3,987
|
|
16.6
|
|
7.1
|
|
4,648
|
|
16.8
|
|
10.2
|
|
|||||||||||
|
12,769
|
|
56.7
|
|
48.6
|
|
15,977
|
|
66.4
|
|
54.8
|
|
18,036
|
|
65.0
|
|
60.5
|
|
||||||||||||
|
Commercial loans
|
|||||||||||||||||||||||||||||
|
Commercial real estate
|
3,846
|
|
17.0
|
|
24.6
|
|
4,012
|
|
16.6
|
|
25.2
|
|
5,312
|
|
19.2
|
|
27.0
|
|
|||||||||||
|
Multifamily
|
673
|
|
3.0
|
|
2.6
|
|
942
|
|
3.9
|
|
4.2
|
|
622
|
|
2.2
|
|
1.3
|
|
|||||||||||
|
Construction/land development
|
3,818
|
|
17.0
|
|
17.3
|
|
1,414
|
|
5.9
|
|
6.9
|
|
1,580
|
|
5.7
|
|
5.3
|
|
|||||||||||
|
Commercial business
|
1,418
|
|
6.3
|
|
6.9
|
|
1,744
|
|
7.2
|
|
8.9
|
|
2,201
|
|
7.9
|
|
5.9
|
|
|||||||||||
|
9,755
|
|
43.3
|
|
51.4
|
|
8,112
|
|
33.6
|
|
45.2
|
|
9,715
|
|
35.0
|
|
39.5
|
|
||||||||||||
|
Total allowance for credit losses
|
$
|
22,524
|
|
100.0
|
%
|
100.0
|
%
|
$
|
24,089
|
|
100.0
|
%
|
100.0
|
%
|
$
|
27,751
|
|
100.0
|
%
|
100.0
|
%
|
||||||||
88
The following table presents activity in our allowance for credit losses, which includes reserves for unfunded commitments.
|
|
Year Ended December 31,
|
||||||||||
|
(in thousands)
|
2014
|
2013
|
2012
|
||||||||
|
Allowance at the beginning of period
|
$
|
24,089
|
|
$
|
27,751
|
|
$
|
42,800
|
|
||
|
Provision (reversal of provision) for loan losses
|
(1,000
|
)
|
900
|
|
11,500
|
|
|||||
|
Recoveries:
|
|||||||||||
|
Consumer
|
|||||||||||
|
Single family
|
139
|
|
536
|
|
657
|
|
|||||
|
Home equity
|
566
|
|
583
|
|
631
|
|
|||||
|
705
|
|
1,119
|
|
1,288
|
|
||||||
|
Commercial
|
|||||||||||
|
Commercial real estate
|
493
|
|
134
|
|
259
|
|
|||||
|
Multifamily residential
|
—
|
|
—
|
|
10
|
|
|||||
|
Construction/land development
|
516
|
|
767
|
|
1,042
|
|
|||||
|
Commercial business
|
229
|
|
272
|
|
727
|
|
|||||
|
1,238
|
|
1,173
|
|
2,038
|
|
||||||
|
Total recoveries
|
1,943
|
|
2,292
|
|
3,326
|
|
|||||
|
Charge-offs:
|
|||||||||||
|
Consumer
|
|||||||||||
|
Single family
|
907
|
|
2,967
|
|
5,939
|
|
|||||
|
Home equity
|
953
|
|
1,960
|
|
4,264
|
|
|||||
|
1,860
|
|
4,927
|
|
10,203
|
|
||||||
|
Commercial
|
|||||||||||
|
Commercial real estate
|
52
|
|
1,448
|
|
4,253
|
|
|||||
|
Construction/land development
|
—
|
|
458
|
|
14,861
|
|
|||||
|
Commercial business
|
596
|
|
21
|
|
558
|
|
|||||
|
648
|
|
1,927
|
|
19,672
|
|
||||||
|
Total charge-offs
|
2,508
|
|
6,854
|
|
29,875
|
|
|||||
|
(Charge-offs), net of recoveries
|
(565
|
)
|
(4,562
|
)
|
(26,549
|
)
|
|||||
|
Balance at end of period
|
$
|
22,524
|
|
$
|
24,089
|
|
$
|
27,751
|
|
||
|
Net charge-offs to average loans receivable, net
|
0.03
|
%
|
0.30
|
%
|
2.04
|
%
|
|||||
We manage asset quality and control credit risk by diversifying our loan portfolio and by applying policies designed to promote sound underwriting and loan monitoring practices. The Credit Administration department is charged with monitoring asset quality, establishing credit policies and procedures, and enforcing the consistent application of these policies and procedures across the organization. For further discussion related to credit quality, see Note 5,
Loans and Credit Quality
to the financial statements of this Form 10-K.
89
The following tables present the composition of TDRs by accrual and nonaccrual status.
|
At December 31, 2014
|
||||||||||||||||||||
|
(in thousands)
|
Accrual
|
Number of accrual relationships
|
Nonaccrual
|
Number of nonaccrual relationships
|
Total
|
Total number of relationships
|
||||||||||||||
|
Consumer:
|
||||||||||||||||||||
|
Single family
(1)
|
$
|
73,585
|
|
193
|
|
$
|
2,482
|
|
10
|
|
$
|
76,067
|
|
203
|
|
|||||
|
Home equity
|
2,430
|
|
23
|
|
231
|
|
3
|
|
2,661
|
|
26
|
|
||||||||
|
76,015
|
|
216
|
|
2,713
|
|
13
|
|
78,728
|
|
229
|
|
|||||||||
|
Commercial:
|
||||||||||||||||||||
|
Commercial real estate
|
21,703
|
|
4
|
|
1,148
|
|
1
|
|
22,851
|
|
5
|
|
||||||||
|
Multifamily residential
|
3,077
|
|
2
|
|
—
|
|
—
|
|
3,077
|
|
2
|
|
||||||||
|
Construction/land development
|
5,447
|
|
3
|
|
—
|
|
—
|
|
5,447
|
|
3
|
|
||||||||
|
Commercial business
|
1,573
|
|
3
|
|
249
|
|
2
|
|
1,822
|
|
5
|
|
||||||||
|
31,800
|
|
12
|
|
1,397
|
|
3
|
|
33,197
|
|
15
|
|
|||||||||
|
$
|
107,815
|
|
228
|
|
$
|
4,110
|
|
16
|
|
$
|
111,925
|
|
244
|
|
||||||
(1) Includes
loan balances insured by the FHA or guaranteed by the VA of
$26.8 million
.
|
At December 31, 2013
|
||||||||||||||||||||
|
(in thousands)
|
Accrual
|
Number of accrual relationships
|
Nonaccrual
|
Number of nonaccrual relationships
|
Total
|
Total number of relationships
|
||||||||||||||
|
|
||||||||||||||||||||
|
Consumer:
|
||||||||||||||||||||
|
Single family
|
$
|
70,304
|
|
159
|
|
$
|
4,017
|
|
10
|
|
$
|
74,321
|
|
169
|
|
|||||
|
Home equity
|
2,558
|
|
23
|
|
86
|
|
2
|
|
2,644
|
|
25
|
|
||||||||
|
72,862
|
|
182
|
|
4,103
|
|
12
|
|
76,965
|
|
194
|
|
|||||||||
|
Commercial:
|
||||||||||||||||||||
|
Commercial real estate
|
19,620
|
|
2
|
|
628
|
|
1
|
|
20,248
|
|
3
|
|
||||||||
|
Multifamily residential
|
3,163
|
|
2
|
|
—
|
|
—
|
|
3,163
|
|
2
|
|
||||||||
|
Construction/land development
|
6,148
|
|
4
|
|
—
|
|
—
|
|
6,148
|
|
4
|
|
||||||||
|
Commercial business
|
112
|
|
1
|
|
—
|
|
—
|
|
112
|
|
1
|
|
||||||||
|
29,043
|
|
9
|
|
628
|
|
1
|
|
29,671
|
|
10
|
|
|||||||||
|
$
|
101,905
|
|
191
|
|
$
|
4,731
|
|
13
|
|
$
|
106,636
|
|
204
|
|
||||||
(1) Includes
loan balances insured by the FHA or guaranteed by the VA of
$17.8 million
.
The Company had
244
loan relationships classified as TDRs totaling
$111.9 million
at
December 31, 2014
with related unfunded commitments of
$151 thousand
. The Company had
204
loan relationships classified as TDRs totaling
$106.6 million
at
December 31, 2013
with related unfunded commitments of
$47 thousand
. The increase in the number of TDR loan relationships at
December 31, 2014
from
2013
was primarily due to an increase in the number of single family loan TDRs. TDR loans within the loans held for investment portfolio and the related reserves are included in the impaired loan tables above. TDR loans held for sale totaled
$1.3 million
comprised of
seven
relationships, and
$1.9 million
comprised of
five
relationships, as of
December 31, 2014
and
2013
, respectively, and were predominantly comprised of loans repurchased from Ginnie Mae and cured by modifying interest rate terms.
90
The following table presents nonperforming assets, contractually past due assets, and accruing and nonaccrual restructured loans.
|
|
At December 31,
|
||||||||||||||||||
|
(in thousands)
|
2014
|
2013
|
2012
|
2011
|
2010
|
||||||||||||||
|
Loans accounted for on a nonaccrual basis:
(1)
|
|||||||||||||||||||
|
Consumer
|
|||||||||||||||||||
|
Single family
|
$
|
8,368
|
|
$
|
8,861
|
|
$
|
13,304
|
|
$
|
12,104
|
|
$
|
13,938
|
|
||||
|
Home equity
|
1,526
|
|
1,846
|
|
2,970
|
|
2,464
|
|
2,535
|
|
|||||||||
|
9,894
|
|
10,707
|
|
16,274
|
|
14,568
|
|
16,473
|
|
||||||||||
|
Commercial
|
|||||||||||||||||||
|
Commercial real estate
|
4,843
|
|
12,257
|
|
6,403
|
|
10,184
|
|
20,259
|
|
|||||||||
|
Multifamily residential
|
—
|
|
—
|
|
—
|
|
2,394
|
|
8,167
|
|
|||||||||
|
Construction/land development
|
—
|
|
—
|
|
5,042
|
|
48,387
|
|
65,952
|
|
|||||||||
|
Commercial business
|
1,277
|
|
2,743
|
|
2,173
|
|
951
|
|
2,359
|
|
|||||||||
|
6,120
|
|
15,000
|
|
13,618
|
|
61,916
|
|
96,737
|
|
||||||||||
|
Total loans on nonaccrual
|
16,014
|
|
25,707
|
|
29,892
|
|
76,484
|
|
113,210
|
|
|||||||||
|
Other real estate owned
|
9,448
|
|
12,911
|
|
23,941
|
|
38,572
|
|
170,455
|
|
|||||||||
|
Total nonperforming assets
|
$
|
25,462
|
|
$
|
38,618
|
|
$
|
53,833
|
|
$
|
115,056
|
|
$
|
283,665
|
|
||||
|
Loans 90 days or more past due and accruing
(2)
|
$
|
34,987
|
|
$
|
46,811
|
|
$
|
40,658
|
|
$
|
35,757
|
|
$
|
43,503
|
|
||||
|
Accruing TDR loans
(3)
|
107,815
|
|
101,905
|
|
$
|
100,575
|
|
104,931
|
|
31,806
|
|
||||||||
|
Nonaccrual TDR loans
(3)
|
4,110
|
|
4,731
|
|
10,208
|
|
23,540
|
|
25,063
|
|
|||||||||
|
Total TDR loans
|
$
|
111,925
|
|
$
|
106,636
|
|
$
|
110,783
|
|
$
|
128,471
|
|
$
|
56,869
|
|
||||
|
Allowance for loan losses as a percent of nonaccrual loans
|
137.51
|
%
|
93.00
|
%
|
92.20
|
%
|
55.81
|
%
|
56.69
|
%
|
|||||||||
|
Nonaccrual loans as a percentage of total loans
|
0.75
|
%
|
1.36
|
%
|
2.24
|
%
|
5.69
|
%
|
7.06
|
%
|
|||||||||
|
Nonperforming assets as a percentage of total assets
|
0.72
|
%
|
1.26
|
%
|
2.05
|
%
|
5.08
|
%
|
11.41
|
%
|
|||||||||
|
(1)
|
If interest on nonaccrual loans under the original terms had been recognized, such income is estimated to have been
$2.8 million
,
$4.6 million
and
$6.2 million
for the years ended
December 31, 2014
,
2013
and
2012
.
|
|
(2)
|
FHA-insured and VA-guaranteed single family loans that are 90 days or more past due are maintained on an accrual status if they have been determined to have little or no risk of loss.
|
|
(3)
|
At
December 31, 2014
, TDRs (performing and nonperforming) were comprised of
244
loan relationships totaling
$111.9 million
.
|
91
Delinquent loans and other real estate owned by loan type consisted of the following.
|
|
At December 31, 2014
|
||||||||||||||||||||||
|
(in thousands)
|
30-59 Days
Past Due
|
60-89 Days
Past Due
|
Nonaccrual
|
90 Days or More
Past Due and Accruing
(1)
|
Total
Past Due
Loans
|
Other
Real Estate
Owned
|
|||||||||||||||||
|
Consumer loans
|
|||||||||||||||||||||||
|
Single family
|
$
|
7,832
|
|
$
|
2,452
|
|
$
|
8,368
|
|
$
|
34,737
|
|
$
|
53,389
|
|
$
|
1,613
|
|
|||||
|
Home equity
|
371
|
|
81
|
|
1,526
|
|
—
|
|
1,978
|
|
—
|
|
|||||||||||
|
8,203
|
|
2,533
|
|
9,894
|
|
34,737
|
|
55,367
|
|
1,613
|
|
||||||||||||
|
Commercial loans
|
|||||||||||||||||||||||
|
Commercial real estate
|
—
|
|
—
|
|
4,843
|
|
—
|
|
4,843
|
|
1,996
|
|
|||||||||||
|
Multifamily
|
—
|
|
—
|
|
—
|
|
—
|
|
—
|
|
—
|
|
|||||||||||
|
Construction/land development
|
—
|
|
1,261
|
|
—
|
|
—
|
|
1,261
|
|
5,839
|
|
|||||||||||
|
Commercial business
|
611
|
|
3
|
|
1,277
|
|
250
|
|
2,141
|
|
—
|
|
|||||||||||
|
611
|
|
1,264
|
|
6,120
|
|
250
|
|
8,245
|
|
7,835
|
|
||||||||||||
|
Total
|
$
|
8,814
|
|
$
|
3,797
|
|
$
|
16,014
|
|
$
|
34,987
|
|
$
|
63,612
|
|
$
|
9,448
|
|
|||||
|
(1)
|
FHA-insured and VA-guaranteed single family loans that are 90 days or more past due are maintained on accrual status if they are determined to have little to no risk of loss.
|
|
|
At December 31, 2013
|
||||||||||||||||||||||
|
(in thousands)
|
30-59 Days
Past Due
|
60-89 Days
Past Due
|
Nonaccrual
|
90 Days or More
Past Due and Accruing
(1)
|
Total
Past Due
Loans
|
Other
Real Estate
Owned
|
|||||||||||||||||
|
Consumer loans
|
|||||||||||||||||||||||
|
Single family
|
$
|
6,466
|
|
$
|
4,901
|
|
$
|
8,861
|
|
$
|
46,811
|
|
$
|
67,039
|
|
$
|
5,246
|
|
|||||
|
Home equity
|
375
|
|
75
|
|
1,846
|
|
—
|
|
2,296
|
|
—
|
|
|||||||||||
|
6,841
|
|
4,976
|
|
10,707
|
|
46,811
|
|
69,335
|
|
5,246
|
|
||||||||||||
|
Commercial loans
|
|||||||||||||||||||||||
|
Commercial real estate
|
—
|
|
—
|
|
12,257
|
|
—
|
|
12,257
|
|
1,688
|
|
|||||||||||
|
Construction/land development
|
—
|
|
—
|
|
—
|
|
—
|
|
—
|
|
5,977
|
|
|||||||||||
|
Commercial business
|
—
|
|
—
|
|
2,743
|
|
—
|
|
2,743
|
|
—
|
|
|||||||||||
|
—
|
|
—
|
|
15,000
|
|
—
|
|
15,000
|
|
7,665
|
|
||||||||||||
|
Total
|
$
|
6,841
|
|
$
|
4,976
|
|
$
|
25,707
|
|
$
|
46,811
|
|
$
|
84,335
|
|
$
|
12,911
|
|
|||||
|
(1)
|
FHA-insured and VA-guaranteed single family loans that are 90 days or more past due are maintained on accrual status if they are determined to have little to no risk of loss.
|
92
|
|
At December 31, 2012
|
||||||||||||||||||||||
|
(in thousands)
|
30-59 Days
Past Due
|
60-89 Days
Past Due
|
Nonaccrual
|
90 Days or More
Past Due and Accruing
(1)
|
Total
Past Due
Loans
|
Other
Real Estate
Owned
|
|||||||||||||||||
|
Consumer loans
|
|||||||||||||||||||||||
|
Single family
|
$
|
11,916
|
|
$
|
4,732
|
|
$
|
13,304
|
|
$
|
40,658
|
|
$
|
70,610
|
|
$
|
4,071
|
|
|||||
|
Home equity
|
787
|
|
242
|
|
2,970
|
|
—
|
|
3,999
|
|
—
|
|
|||||||||||
|
12,703
|
|
4,974
|
|
16,274
|
|
40,658
|
|
74,609
|
|
4,071
|
|
||||||||||||
|
Commercial loans
|
|||||||||||||||||||||||
|
Commercial real estate
|
—
|
|
—
|
|
6,403
|
|
—
|
|
6,403
|
|
10,283
|
|
|||||||||||
|
Construction/land development
|
—
|
|
—
|
|
5,042
|
|
—
|
|
5,042
|
|
9,587
|
|
|||||||||||
|
Commercial business
|
—
|
|
—
|
|
2,173
|
|
—
|
|
2,173
|
|
—
|
|
|||||||||||
|
—
|
|
—
|
|
13,618
|
|
—
|
|
13,618
|
|
19,870
|
|
||||||||||||
|
Total
|
$
|
12,703
|
|
$
|
4,974
|
|
$
|
29,892
|
|
$
|
40,658
|
|
$
|
88,227
|
|
$
|
23,941
|
|
|||||
|
(1)
|
FHA-insured and VA-guaranteed single family loans that are 90 days or more past due are maintained on accrual status if they are determined to have little to no risk of loss.
|
93
The following table presents nonperforming assets by loan type by region at
December 31, 2014
.
|
|
Washington
|
||||||||||||||||||||||||||
|
|
Puget Sound
|
Vancouver &
Other
(2)(3)
|
Central & Eastern
WA
(2) (3)
|
Kitsap/Jefferson/Clallam
(1)
|
|||||||||||||||||||||||
|
(in thousands)
|
King
(1)
|
Snohomish
(3)
|
Pierce
(1)
|
Thurston
(3)
|
|||||||||||||||||||||||
|
Loans on nonaccrual status:
|
|||||||||||||||||||||||||||
|
Consumer
|
|||||||||||||||||||||||||||
|
Single family
|
$
|
2,033
|
|
$
|
1,175
|
|
$
|
1,480
|
|
$
|
167
|
|
$
|
252
|
|
$
|
361
|
|
$
|
—
|
|
||||||
|
Home equity
|
274
|
|
63
|
|
323
|
|
119
|
|
132
|
|
12
|
|
172
|
|
|||||||||||||
|
2,307
|
|
1,238
|
|
1,803
|
|
286
|
|
384
|
|
373
|
|
172
|
|
||||||||||||||
|
Commercial
|
|||||||||||||||||||||||||||
|
Commercial real estate
|
172
|
|
—
|
|
3,212
|
|
1,148
|
|
—
|
|
311
|
|
—
|
|
|||||||||||||
|
Commercial business
|
1,098
|
|
—
|
|
—
|
|
5
|
|
—
|
|
174
|
|
—
|
|
|||||||||||||
|
1,270
|
|
—
|
|
3,212
|
|
1,153
|
|
—
|
|
485
|
|
—
|
|
||||||||||||||
|
Total loans on nonaccrual status
|
$
|
3,577
|
|
$
|
1,238
|
|
$
|
5,015
|
|
$
|
1,439
|
|
$
|
384
|
|
$
|
858
|
|
$
|
172
|
|
||||||
|
Other real estate owned:
|
|||||||||||||||||||||||||||
|
Consumer
|
|||||||||||||||||||||||||||
|
Single family
|
$
|
144
|
|
$
|
—
|
|
$
|
—
|
|
$
|
211
|
|
$
|
—
|
|
$
|
167
|
|
$
|
—
|
|
||||||
|
144
|
|
—
|
|
—
|
|
211
|
|
—
|
|
167
|
|
—
|
|
||||||||||||||
|
Commercial
|
|||||||||||||||||||||||||||
|
Commercial real estate
|
—
|
|
—
|
|
—
|
|
280
|
|
—
|
|
824
|
|
892
|
|
|||||||||||||
|
Construction/land development
|
—
|
|
—
|
|
—
|
|
5,839
|
|
—
|
|
—
|
|
—
|
|
|||||||||||||
|
—
|
|
—
|
|
—
|
|
6,119
|
|
—
|
|
824
|
|
892
|
|
||||||||||||||
|
Total other real estate owned
|
$
|
144
|
|
$
|
—
|
|
$
|
—
|
|
$
|
6,330
|
|
$
|
—
|
|
$
|
991
|
|
$
|
892
|
|
||||||
|
Total nonperforming assets
|
$
|
3,721
|
|
$
|
1,238
|
|
$
|
5,015
|
|
$
|
7,769
|
|
$
|
384
|
|
$
|
1,849
|
|
$
|
1,064
|
|
||||||
94
|
|
Idaho
|
Oregon
|
|
|
|||||||||||||||||||
|
(in thousands)
|
Boise
(2)
|
Portland
(2)(3)
|
Bend
(2)(3)
|
Salem
(2)
|
Hawaii
|
Total
|
|||||||||||||||||
|
Loans on nonaccrual status:
|
|||||||||||||||||||||||
|
Consumer
|
|||||||||||||||||||||||
|
Single family
|
$
|
—
|
|
$
|
1,440
|
|
$
|
112
|
|
$
|
568
|
|
$
|
780
|
|
$
|
8,368
|
|
|||||
|
Home equity
|
—
|
|
231
|
|
—
|
|
11
|
|
189
|
|
1,526
|
|
|||||||||||
|
—
|
|
1,671
|
|
112
|
|
579
|
|
969
|
|
9,894
|
|
||||||||||||
|
Commercial
|
|||||||||||||||||||||||
|
Commercial real estate
|
—
|
|
—
|
|
—
|
|
—
|
|
—
|
|
4,843
|
|
|||||||||||
|
Commercial business
|
—
|
|
—
|
|
—
|
|
—
|
|
—
|
|
1,277
|
|
|||||||||||
|
—
|
|
—
|
|
—
|
|
—
|
|
—
|
|
6,120
|
|
||||||||||||
|
Total loans on nonaccrual status
|
$
|
—
|
|
$
|
1,671
|
|
$
|
112
|
|
$
|
579
|
|
$
|
969
|
|
$
|
16,014
|
|
|||||
|
Other real estate owned:
|
|||||||||||||||||||||||
|
Consumer
|
|||||||||||||||||||||||
|
Single family
|
$
|
—
|
|
$
|
—
|
|
$
|
—
|
|
$
|
834
|
|
$
|
257
|
|
$
|
1,613
|
|
|||||
|
—
|
|
—
|
|
—
|
|
834
|
|
257
|
|
1,613
|
|
||||||||||||
|
Commercial
|
|||||||||||||||||||||||
|
Commercial real estate
|
—
|
|
—
|
|
—
|
|
—
|
|
—
|
|
1,996
|
|
|||||||||||
|
Construction/land development
|
—
|
|
—
|
|
—
|
|
—
|
|
—
|
|
5,839
|
|
|||||||||||
|
—
|
|
—
|
|
—
|
|
—
|
|
—
|
|
7,835
|
|
||||||||||||
|
Total other real estate owned
|
$
|
—
|
|
$
|
—
|
|
$
|
—
|
|
$
|
834
|
|
$
|
257
|
|
$
|
9,448
|
|
|||||
|
Total nonperforming assets
|
$
|
—
|
|
$
|
1,671
|
|
$
|
112
|
|
$
|
1,413
|
|
$
|
1,226
|
|
$
|
25,462
|
|
|||||
|
(1)
|
Refers to a specific county.
|
|
(2)
|
Refers to a specific city.
|
|
(3)
|
Also includes surrounding counties.
|
95
The following table presents nonperforming assets by loan type by region at
December 31, 2013
.
|
|
Washington
|
||||||||||||||||||||||||||
|
|
Puget Sound
|
Vancouver &
Other
(2)(3)
|
|
Kitsap/Jefferson/Clallam
(1)
|
|||||||||||||||||||||||
|
(in thousands)
|
King
(1)
|
Snohomish
(3)
|
Pierce
(1)
|
Thurston
(3)
|
Spokane
(2)(3)
|
||||||||||||||||||||||
|
Loans on nonaccrual status:
|
|||||||||||||||||||||||||||
|
Consumer
|
|||||||||||||||||||||||||||
|
Single family
|
$
|
3,032
|
|
$
|
1,469
|
|
$
|
1,821
|
|
$
|
213
|
|
$
|
292
|
|
$
|
802
|
|
$
|
—
|
|
||||||
|
Home equity
|
596
|
|
117
|
|
386
|
|
22
|
|
49
|
|
77
|
|
—
|
|
|||||||||||||
|
3,628
|
|
1,586
|
|
2,207
|
|
235
|
|
341
|
|
879
|
|
—
|
|
||||||||||||||
|
Commercial
|
|||||||||||||||||||||||||||
|
Commercial real estate
|
7,076
|
|
2,274
|
|
—
|
|
—
|
|
—
|
|
208
|
|
—
|
|
|||||||||||||
|
Commercial business
|
2,520
|
|
—
|
|
—
|
|
—
|
|
—
|
|
223
|
|
—
|
|
|||||||||||||
|
9,596
|
|
2,274
|
|
—
|
|
—
|
|
—
|
|
431
|
|
—
|
|
||||||||||||||
|
Total loans on nonaccrual status
|
$
|
13,224
|
|
$
|
3,860
|
|
$
|
2,207
|
|
$
|
235
|
|
$
|
341
|
|
$
|
1,310
|
|
$
|
—
|
|
||||||
|
Other real estate owned:
|
|||||||||||||||||||||||||||
|
Consumer
|
|||||||||||||||||||||||||||
|
Single family
|
$
|
923
|
|
$
|
105
|
|
$
|
577
|
|
$
|
—
|
|
$
|
—
|
|
$
|
—
|
|
$
|
—
|
|
||||||
|
923
|
|
105
|
|
577
|
|
—
|
|
—
|
|
—
|
|
—
|
|
||||||||||||||
|
Commercial
|
|||||||||||||||||||||||||||
|
Commercial real estate
|
—
|
|
—
|
|
—
|
|
—
|
|
—
|
|
—
|
|
958
|
|
|||||||||||||
|
Construction/land development
|
—
|
|
—
|
|
325
|
|
6,219
|
|
—
|
|
—
|
|
—
|
|
|||||||||||||
|
—
|
|
—
|
|
325
|
|
6,219
|
|
—
|
|
—
|
|
958
|
|
||||||||||||||
|
Total other real estate owned
|
$
|
923
|
|
$
|
105
|
|
$
|
902
|
|
$
|
6,219
|
|
$
|
—
|
|
$
|
—
|
|
$
|
958
|
|
||||||
|
Total nonperforming assets
|
$
|
14,147
|
|
$
|
3,965
|
|
$
|
3,109
|
|
$
|
6,454
|
|
$
|
341
|
|
$
|
1,310
|
|
$
|
958
|
|
||||||
96
|
|
Idaho
|
Oregon
|
|
|
|||||||||||||||||||
|
(in thousands)
|
Boise
(2)
|
Portland
(2)(3)
|
Bend
(2)(3)
|
Salem
(2)
|
Hawaii
|
Total
|
|||||||||||||||||
|
Loans on nonaccrual status:
|
|||||||||||||||||||||||
|
Single family
|
$
|
—
|
|
$
|
271
|
|
$
|
301
|
|
$
|
—
|
|
$
|
660
|
|
$
|
8,861
|
|
|||||
|
Home equity
|
—
|
|
251
|
|
—
|
|
85
|
|
263
|
|
1,846
|
|
|||||||||||
|
—
|
|
522
|
|
301
|
|
85
|
|
923
|
|
10,707
|
|
||||||||||||
|
Commercial real estate
|
—
|
|
2,699
|
|
—
|
|
—
|
|
—
|
|
12,257
|
|
|||||||||||
|
Commercial business
|
—
|
|
—
|
|
—
|
|
—
|
|
—
|
|
2,743
|
|
|||||||||||
|
—
|
|
2,699
|
|
—
|
|
—
|
|
—
|
|
15,000
|
|
||||||||||||
|
Total loans on nonaccrual status
|
$
|
—
|
|
$
|
3,221
|
|
$
|
301
|
|
$
|
85
|
|
$
|
923
|
|
$
|
25,707
|
|
|||||
|
Other real estate owned:
|
|||||||||||||||||||||||
|
Consumer
|
|||||||||||||||||||||||
|
Single family
|
$
|
—
|
|
$
|
1,334
|
|
$
|
—
|
|
$
|
1,410
|
|
$
|
897
|
|
$
|
5,246
|
|
|||||
|
—
|
|
1,334
|
|
—
|
|
1,410
|
|
897
|
|
5,246
|
|
||||||||||||
|
Commercial
|
|||||||||||||||||||||||
|
Commercial real estate
|
—
|
|
—
|
|
—
|
|
—
|
|
—
|
|
958
|
|
|||||||||||
|
Construction/land development
|
—
|
|
163
|
|
—
|
|
—
|
|
—
|
|
6,707
|
|
|||||||||||
|
—
|
|
163
|
|
—
|
|
—
|
|
—
|
|
7,665
|
|
||||||||||||
|
Total other real estate owned
|
$
|
—
|
|
$
|
1,497
|
|
$
|
—
|
|
$
|
1,410
|
|
$
|
897
|
|
$
|
12,911
|
|
|||||
|
Total nonperforming assets
|
$
|
—
|
|
$
|
4,718
|
|
$
|
301
|
|
$
|
1,495
|
|
$
|
1,820
|
|
$
|
38,618
|
|
|||||
|
(1)
|
Refers to a specific county.
|
|
(2)
|
Refers to a specific city.
|
|
(3)
|
Also includes surrounding counties.
|
The following tables present the single family loan held for investment portfolio by original FICO score.
|
At December 31, 2014
|
|||||
|
Greater Than
|
|
Less Than or Equal To
|
|
Percentage
|
(1)
|
|
N/A
|
(2)
|
N/A
|
(2)
|
4.0%
|
|
|
<
|
500
|
0.1%
|
|||
|
500
|
549
|
0.2%
|
|||
|
550
|
599
|
0.9%
|
|||
|
600
|
649
|
3.5%
|
|||
|
650
|
699
|
16.9%
|
|||
|
700
|
749
|
27.0%
|
|||
|
750
|
>
|
47.3%
|
|||
|
TOTAL
|
100.0%
|
||||
|
(1)
|
Percentages based on aggregate loan amounts.
|
|
(2)
|
Information is not available.
|
97
|
At December 31, 2013
|
|||||
|
Greater Than
|
|
Less Than or Equal To
|
|
Percentage
|
(1)
|
|
N/A
|
(2)
|
N/A
|
(2)
|
3.9%
|
|
|
<
|
500
|
0.1%
|
|||
|
500
|
549
|
0.1%
|
|||
|
550
|
599
|
0.9%
|
|||
|
600
|
649
|
3.3%
|
|||
|
650
|
699
|
13.8%
|
|||
|
700
|
749
|
25.2%
|
|||
|
750
|
>
|
52.7%
|
|||
|
TOTAL
|
100.0%
|
||||
|
(1)
|
Percentages based on aggregate loan amounts.
|
|
(2)
|
Information is not available.
|
Loan Underwriting Standards
Our underwriting standards for single family and home equity loans require evaluating and understanding a borrower’s credit, collateral and ability to repay the loan. Credit is determined based on how well a borrower manages their current and prior debts, documented by a credit report that provides credit scores and the borrower’s current and past information about their credit history. Collateral is based on the type and use of property, occupancy and market value, largely determined by property appraisals. A borrower's ability to repay the loan is based on several factors, including employment, income, current debt, assets and level of equity in the property. We also consider loan-to-property value and debt-to-income ratios, loan amount and lien position in assessing whether to originate a loan. Single family and home equity borrowers are particularly susceptible to downturns in economic trends that negatively affect housing prices and demand and levels of unemployment.
For commercial, multifamily and construction loans, we consider the same factors with regard to the borrower and the guarantors. In addition, we evaluate liquidity, net worth, leverage, other outstanding indebtedness of the borrower, an analysis of cash expected to flow through the borrower (including the outflow to other lenders) and prior experience with the borrower. We use this information to assess financial capacity, profitability and experience. Ultimate repayment of these loans is sensitive to interest rate changes, general economic conditions, liquidity and availability of long-term financing.
Additional considerations for commercial permanent loans secured by real estate:
Our underwriting standards for commercial permanent loans generally require that the loan-to-value ratio for these loans not exceed 75% of appraised value or discounted cash flow value, as appropriate, and that commercial properties attain debt coverage ratios (net operating income divided by annual debt servicing) of 1.25 or better.
Our underwriting standards for multifamily residential permanent loans generally require that the loan-to-value ratio for these loans not exceed 80% of appraised value, cost, or discounted cash flow value, as appropriate, and that multifamily residential properties attain debt coverage ratios of 1.2 or better. However, underwriting standards can be influenced by competition and other factors. We endeavor to maintain the highest practical underwriting standards while balancing the need to remain competitive in our lending practices.
Additional considerations for commercial construction loans secured by real estate:
We originate a variety of real estate construction loans. Underwriting guidelines for these loans vary by loan type but include loan-to-value limits, term limits, loan advance limits and pre-leasing requirements, as applicable.
Our underwriting guidelines for commercial real estate construction loans generally require that the loan-to-value ratio not exceed 75% and stabilized debt coverage ratios of 1.25 or better.
Our underwriting guidelines for multifamily residential construction loans generally require that the loan-to-value ratio not exceed 80% and stabilized debt coverage ratios of 1.2 or better.
98
Our underwriting guidelines for single family residential construction loans to builders generally require that the loan-to-value ratio not exceed 85%.
As noted above, underwriting standards can be influenced by competition and other factors. However, we endeavor to maintain the highest practical underwriting standards while balancing the need to remain competitive in our lending practices.
Liquidity Risk and Capital Resources
Liquidity risk management is primarily intended to ensure we are able to maintain cash flows adequate to fund operations and meet our obligations, including demands from depositors, draws on lines of credit and paying any creditors, on a timely and cost-effective basis in various market conditions. Our liquidity profile is influenced by changes in market conditions, the composition of the balance sheet and risk tolerance levels. HomeStreet, Inc., HomeStreet Capital ("HSC") and the Bank
have established liquidity guidelines and operating plans that detail the sources and uses of cash and liquidity.
HomeStreet, Inc., HomeStreet Capital and the Bank have different funding needs and sources of liquidity and separate regulatory capital requirements.
HomeStreet, Inc.
The main source of liquidity for HomeStreet, Inc. is proceeds from dividends from the Bank and HomeStreet Capital. In the past, we raised longer-term funds through the issuance of TruPS. Historically, the main cash outflows were distributions to shareholders, interest and principal payments to creditors and operating expenses. HomeStreet, Inc.’s ability to pay dividends to shareholders depends substantially on dividends received from the Bank.
HomeStreet Capital
HomeStreet Capital generates positive cash flow from its servicing fee income on the DUS portfolio, net of its costs to service the portfolio. Offsetting this are HomeStreet Capital's costs to purchase the servicing rights on new production from the Bank. Liquidity management and reporting requirements for DUS lenders such as HomeStreet Capital are set by Fannie Mae. HomeStreet Capital's liquidity management therefore consists of meeting Fannie Mae requirements and its own operational needs.
HomeStreet Bank
The Bank’s primary short-term sources of funds include deposits, advances from the FHLB, repayments and prepayments of loans, proceeds from the sale of loans and investment securities and interest from our loans and investment securities. We have also raised short-term funds through the sale of securities under agreements to repurchase. While scheduled principal repayments on loans are a relatively predictable source of funds, deposit inflows and outflows and loan prepayments are greatly influenced by interest rates, economic conditions and competition. The primary liquidity ratio is defined as net cash, short-term investments and other marketable assets as a percent of net deposits and short-term borrowings. At
December 31, 2014
our primary liquidity ratio was
30.0%
, compared with
26.9%
at
December 31, 2013
.
At
December 31, 2014
and
2013
, the Bank had available borrowing capacity of
$317.9 million
and
$228.5 million
, respectively, from the FHLB, and
$316.1 million
and
$332.7 million
, respectively, from the Federal Reserve Bank of San Francisco.
Our lending agreement with the FHLB permits it to refuse to make advances during periods in which an “event of default” (as defined in that agreement) exists. An event of default occurs when the FHLB gives notice to the Bank of an intention to take any of a list of permissible actions following the occurrence of specified events or conditions affecting the Bank. The FHLB has not declared a default under this agreement, and has not notified the Bank that future advances would not be made available.
Cash Flows
For the years ended
December 31, 2014
,
2013
and
2012
, cash and cash equivalents decreased
$3.4 million
, increased
$8.6 million
, and decreased
$238.0 million
, respectively. The following discussion highlights the major activities and transactions that affected our cash flows during these periods.
99
Cash flows from operating activities
The Company's operating assets and liabilities are used to support our lending activities, including the origination and sale of mortgage loans. For the year ended
December 31, 2014
, net cash of
$348.6 million
was used in operating activities, as cash used to fund loans held for sale production exceeded proceeds from the sale of loans held for sale. During
2014
, the Company transferred a net
$217.8 million
of loans from loans held for investment to loans held for sale. We believe that cash flows from operations, available cash balances and our ability to generate cash through short-term debt are sufficient to fund our operating liquidity needs. For the year ended
December 31, 2013
, net cash of
$304.0 million
was provided by operating activities, as proceeds from the sale of loans held for sale exceeded cash used to fund loans held for sale production. During
2013
, the Company transferred
$93.6 million
of loans from loans held for investment to loans held for sale. For the year ended
December 31, 2012
, net cash of
$391.9 million
was used by operating activities, as higher mortgage production volumes during 2012 resulted in higher average balances of loans held for sale. Cash used to fund loans held for sale production was largely offset by proceeds from the sale of such loans.
Cash flows from investing activities
The Company's investing activities primarily include available-for-sale securities and loans originated and held for investment. For the year ended
December 31, 2014
, net cash of
$84.2 million
was used in investing activities. We used cash of
$443.5 million
in net originations and principal repayments of loans held for investment during
2014
, as a result of increased originations of mortgages that exceed conventional conforming loan limits. Offsetting this decrease to cash was net proceeds of
$271.4 million
from the sale of loans originated as held for investment and
$39.0 million
of proceeds form the sale of single family mortgage servicing rights. Net proceeds from our investment securities portfolio were
$35.6 million
during
2014
. For the year ended
December 31, 2013
, net cash of
$459.9 million
was used in investing activities. We used cash of
$447.9 million
in net originations and principal repayments of loans held for investment during
2013
, as a result of increased originations of mortgages that exceed conventional conforming loan limits. Net purchases in our investment securities portfolio were
$190.0 million
during 2013. Additionally, cash of
$24.0 million
was provided in connection with the purchases of YNB, Fortune Bank and two AmericanWest Bank branches. For the year ended
December 31, 2012
, net cash of
$102.9 million
was used by investing activities, as we used the proceeds from our stock issuance to purchase available-for-sale securities. Net purchases in our investment securities portfolio were
$119.0 million
during 2012. Additionally, we realized net proceeds of
$49.6 million
from the sale of OREO properties during 2012.
Cash flows from financing activities
The Company's financing activities are primarily related to customer deposits and net proceeds from the FHLB. For the year ended
December 31, 2014
, net cash of
$429.5 million
was provided by financing activities, as we increased our lower cost short-term advances from the FHLB. For additional liquidity, the Company added
$50 million
in federal funds purchased during the fourth quarter of 2014. For the year ended
December 31, 2013
, net cash of
$164.5 million
was provided by financing activities, as we increased our lower cost short-term advances from the FHLB. For the year ended
December 31, 2012
, net cash of
$256.7 million
was provided by financing activities. We had net proceeds of
$200.2 million
from FHLB advances as the Company prepaid higher cost long-term FHLB advances, replacing these borrowings with lower cost short-term advances from the FHLB. Additionally, the Company had net proceeds of
$88.2 million
from the issuance of common stock through our initial public offering and option exercises, which we used to invest in investment securities.
Capital Management
Federally insured depository institutions, such as the Bank, are required to maintain a minimum level of regulatory capital. The FDIC regulations recognize two types, or tiers, of capital: “core capital,” or Tier 1 capital, and “supplementary capital,” or Tier 2 capital. As of
December 31, 2014
, the FDIC measured a bank’s capital using (1) total risk-based capital ratio, (2) Tier 1 risk-based capital ratio and (3) Tier 1 leverage ratio. Under the standards in place on
December 31, 2014
, in order to qualify as “well capitalized,” a bank must have a total risk-based capital ratio of at least
10.0%
, a Tier 1 risk-based capital ratio of at least
6.0%
and a Tier 1 leverage ratio of at least
5.0%
. In order to be deemed “adequately capitalized” under such standards, a bank generally must have a total risk-based capital ratio of at least
8.0%
, a Tier 1 risk-based capital ratio of at least
4.0%
and a Tier 1 leverage ratio of at least
4.0%
. Beginning January 1, 2015, new rules under Dodd-Frank adopting the Basel III requirements began to go into effect, increasing the threshold requirements. See "–
New Capital Regulations"
below.
The FDIC retains the right to require a depository institution to maintain a higher capital level based on its particular risk profile.
As of
December 31, 2014
, the Bank had a total risk-based capital ratio, Tier 1 risk-based capital ratio and Tier 1 leverage capital ratio of
14.03%
,
13.10%
and
9.38%
, respectively, compared with
15.28%
,
14.12%
and
9.96%
, as of
December 31,
100
2013
. At
December 31, 2014
the Bank's capital ratios continued to meet the regulatory capital category of “well capitalized” as defined by the FDIC’s prompt corrective action rules.
The following table presents the Bank’s capital amounts and ratios.
|
At December 31, 2014
|
||||||||||||||||||||
|
Actual
|
For Minimum Capital
Adequacy Purposes
|
To Be Categorized As
“Well Capitalized” Under
Prompt Corrective
Action Provisions
|
||||||||||||||||||
|
(in thousands)
|
Amount
|
Ratio
|
Amount
|
Ratio
|
Amount
|
Ratio
|
||||||||||||||
|
Tier 1 leverage capital
(to average assets) |
$
|
319,010
|
|
9.38
|
%
|
$
|
136,058
|
|
4.0
|
%
|
$
|
170,072
|
|
5.0
|
%
|
|||||
|
Tier 1 risk-based capital
(to risk-weighted assets)
|
319,010
|
|
13.10
|
%
|
97,404
|
|
4.0
|
%
|
146,106
|
|
6.0
|
%
|
||||||||
|
Total risk-based capital
(to risk-weighted assets) |
341,534
|
|
14.03
|
%
|
194,808
|
|
8.0
|
%
|
243,511
|
|
10.0
|
%
|
||||||||
|
At December 31, 2013
|
||||||||||||||||||||
|
Actual
|
For Minimum Capital
Adequacy Purposes
|
To Be Categorized As
“Well Capitalized” Under
Prompt Corrective
Action Provisions
|
||||||||||||||||||
|
(in thousands)
|
Amount
|
Ratio
|
Amount
|
Ratio
|
Amount
|
Ratio
|
||||||||||||||
|
Tier 1 leverage capital
(to average assets) |
$
|
291,673
|
|
9.96
|
%
|
$
|
117,182
|
|
4.0
|
%
|
$
|
146,478
|
|
5.0
|
%
|
|||||
|
Tier 1 risk-based capital
(to risk-weighted assets) |
291,673
|
|
14.12
|
%
|
81,708
|
|
4.0
|
%
|
122,562
|
|
6.0
|
%
|
||||||||
|
Total risk-based capital
(to risk-weighted assets) |
315,762
|
|
15.28
|
%
|
163,415
|
|
8.0
|
%
|
204,269
|
|
10.0
|
%
|
||||||||
|
At December 31, 2012
|
||||||||||||||||||||
|
Actual
|
For Minimum Capital
Adequacy Purposes
|
To Be Categorized As
“Well Capitalized” Under
Prompt Corrective
Action Provisions
|
||||||||||||||||||
|
(in thousands)
|
Amount
|
Ratio
|
Amount
|
Ratio
|
Amount
|
Ratio
|
||||||||||||||
|
Tier 1 leverage capital
(to average assets) |
$
|
286,963
|
|
11.78
|
%
|
$
|
97,466
|
|
4.0
|
%
|
$
|
121,833
|
|
5.0
|
%
|
|||||
|
Tier 1 risk-based capital
(to risk-weighted assets) |
286,963
|
|
18.05
|
%
|
63,596
|
|
4.0
|
%
|
95,394
|
|
6.0
|
%
|
||||||||
|
Total risk-based capital
(to risk-weighted assets) |
306,934
|
|
19.31
|
%
|
127,192
|
|
8.0
|
%
|
158,991
|
|
10.0
|
%
|
||||||||
New Capital Regulations
In July 2013, federal banking regulators (including the FDIC and the FRB) adopted new capital rules (the “Rules”). The Rules apply to both depository institutions (such as the Bank) and their holding companies (such as the Company). The Rules reflect, in part, certain standards initially adopted by the Basel Committee on Banking Supervision in December 2010 (which standards are commonly referred to as “Basel III”) as well as requirements contemplated by the Dodd-Frank Act.
The Rules apply both to the Company and the Bank as of January 1, 2015. In addition to the existing capital ratios, the Rules implement a new capital ratio of common equity Tier 1 capital to risk-based assets. Common equity Tier 1 capital generally
101
consists of retained earnings and common stock instruments (subject to certain adjustments), as well as accumulated other comprehensive income (“AOCI”) except to the extent that the Company and the Bank exercise a one-time irrevocable option to exclude certain components of AOCI. Both the Company and the Bank expect to elect this one-time option in 2015 to exclude certain components of AOCI. Both the Company and the Bank are required to have a common equity Tier 1 capital ratio of 4.5% as well as a Tier 1 leverage ratio of 4.0%, a Tier 1 risk-based ratio of 6.0% and a total risk-based ratio of 8.0%. In addition to the preceding requirements, both the Company and the Bank are required to establish a “conservation buffer,” consisting of common equity Tier 1 capital, which is at least 2.5% above each of the preceding common equity Tier 1 capital ratio, the Tier 1 risk-based ratio and the total risk-based ratio. An institution that does not meet the conservation buffer will be subject to restrictions on certain activities including payment of dividends, stock repurchases and discretionary bonuses to executive officers.
The Rules modify the manner in which certain capital elements are determined, including but not limited to, requiring certain deductions related to mortgage servicing rights and deferred tax assets. When the federal banking regulators initially proposed new capital rules in 2012, the rules would have phased out trust preferred securities as a component of Tier 1 capital. As finally adopted, however, the Rules permit holding companies with less than $15 billion in total assets as of December 31, 2009 (which includes the Company) to continue to include trust preferred securities issued prior to May 19, 2010 in Tier 1 capital, generally up to 25% of other Tier 1 capital.
The Rules make changes in the methods of calculating certain risk-based assets, which in turn affects the calculation of risk- based ratios. Higher or more sensitive risk weights are assigned to various categories of assets, among which are commercial real estate, credit facilities that finance the acquisition, development or construction of real property, certain exposures or credits that are 90 days past due or are nonaccrual, foreign exposures, certain corporate exposures, securitization exposures, equity exposures and in certain cases mortgage servicing rights and deferred tax assets.
Both the Company and the Bank were generally required to begin compliance with the Rules on January 1, 2015. The conservation buffer will be phased in beginning in 2016 and will take full effect on January 1, 2019. Certain calculations under the Rules will also have phase-in periods. We believe that the current capital levels of the Company and the Bank are in compliance with the standards under the Rules including the conservation buffer. Additionally, as a result of the March 1, 2015 merger with Simplicity Bank, we expect an improvement in the capital ratios of the Company and the Bank under the Rules compared to what they otherwise may have been.
Impact of Inflation
The consolidated financial statements presented in this Form 10-K have been prepared in accordance with U.S. GAAP, which requires the measurement of financial position and operating results in terms of historical dollar amounts or market value without considering the changes in the relative purchasing power of money over time due to inflation. The impact of inflation is reflected in the cost of our operations as incurred. Unlike industrial companies, nearly all of our assets and liabilities are monetary in nature. As a result, interest rates have a greater impact on our performance than do the effects of general levels of inflation.
Operational Risk Management
Operational risk is defined as the risk to current or anticipated earnings or capital arising from inadequate or failed internal processes or systems, misconduct or errors, and adverse external events.
Each line of business has primary responsibility for identifying, monitoring and controlling its operational risks. In addition, centralized departments such as our credit administration, enterprise risk management, compliance and regulatory affairs, quality control, legal, corporate security, finance and human resources provide support to the business lines as they develop and implement risk management practices specific to their needs. Our internal audit department provides independent feedback on the strength of operational risk controls and compliance with Company policies and procedures. Additionally, we maintain mature change management, business resumption and data and customer information security processes. We also maintain a code of conduct with periodic training, setting a “tone from the top” that articulates a strong focus on compliance and ethical standards and a zero tolerance approach to unethical or fraudulent behavior.
102
Compliance/Regulatory Risk Management
Compliance risk is the risk to current or anticipated earnings or capital arising from violations of, or nonconformance with, laws, rules, regulations, prescribed practices, internal policy and procedures or ethical standards.
As a regulated financial institution with a significant mortgage banking operation, we have significant compliance and regulatory risk. Historically, we have maintained a strong compliance culture and compliance management processes as evidenced by minimal compliance issues. Management has established a tracking process for monitoring the status of pending regulations and for implementing the regulatory requirements as they are published and become effective. Each business unit is responsible for compliance with laws and regulations and has identified an individual to participate on our compliance committee, which is chaired by the Compliance Officer. The Compliance Officer monitors all new regulations and changes to existing regulations and the new requirements are discussed at the management compliance committee to determine impact to the business units and to assign responsibilities and timelines for implementation.
Strategic Risk Management
Strategic risk is the risk to current or anticipated earnings, capital or enterprise value arising from adverse business decisions, improper implementation of decisions or lack of responsiveness to industry changes.
Strategic risk is managed by the Board and senior management through development of strategic plans, successful implementation of business initiatives and reporting to the Board and its committees.
Reputation Risk Management
Reputation risk is defined as the risk to current or anticipated earnings, capital or enterprise value arising from negative public opinion.
We believe that we have an excellent reputation in the community primarily due to our longevity and significant outreach to the communities we serve. The Bank has earned “Outstanding” ratings on every one of its Bank Community Reinvestment Act (CRA) examinations since 1986.
Accounting Developments
See Financial Statements and Supplementary Data—Note 1,
Summary of Significant Accounting Policies
, for a discussion of accounting developments.
103
|
ITEM 7A
|
QUANTITATIVE AND QUALITATIVE DISCLOSURES ABOUT MARKET RISK
|
Market Risk Management
Market risk is defined as the sensitivity of income, fair value measurements and capital to changes in interest rates, foreign currency exchange rates, commodity prices and other relevant market rates or prices. The primary market risks that we are exposed to are price and interest rate risks. Price risk is defined as the risk to current or anticipated earnings or capital arising from changes in the value of either assets or liabilities that are entered into as part of distributing or managing risk. Interest rate risk is defined as risk to current or anticipated earnings or capital arising from movements in interest rates.
For the Company, price and interest rate risks arise from the financial instruments and positions we hold. This includes loans, mortgage servicing rights, investment securities, deposits, borrowings, long-term debt and derivative financial instruments. Due to the nature of our operations, we are not subject to foreign currency exchange or commodity price risk. Our real estate loan portfolio is subject to risks associated with the local economies of our various markets and, in particular, the regional economy of the Pacific Northwest and, to a growing extent, California.
Our price and interest rate risks are managed by the Bank’s Asset/Liability Management Committee ("ALCO"), a management committee that identifies and manages the sensitivity of earnings or capital to changing interest rates to achieve our overall financial objectives. ALCO is a management-level committee whose members include the Chief Investment Officer, acting as the chair, the Chief Executive Officer and other members of management. The committee meets monthly and is responsible for:
|
•
|
understanding the nature and level of the Company's interest rate risk and interest rate sensitivity;
|
|
•
|
assessing how that risk fits within our overall business strategies;
|
|
•
|
ensuring an appropriate level of rigor and sophistication in the risk management process for the overall level of risk;
|
|
•
|
complying with and reviewing the asset/liability management policy;
|
|
•
|
formulating and implementing strategies to improve balance sheet mix and earnings.
|
The Finance Committee of the Bank's Board provides oversight of the asset/liability management process, reviews the results of interest rate risk analysis and approves relevant policies.
The spread between the yield on interest-earning assets and the cost of interest-bearing liabilities and the relative dollar amounts of these assets and liabilities are the principal items affecting net interest income. Changes in net interest spread (interest rate risk) are influenced to a significant degree by the repricing characteristics of assets and liabilities (timing risk), the relationship between various rates (basis risk), customer options (option risk) and changes in the shape of the yield curve (time-sensitive risk). We manage the available-for-sale investment securities portfolio while maintaining a balance between risk and return. The Company's funding strategy is to grow core deposits while we efficiently supplement using wholesale borrowings.
We estimate the sensitivity of our net interest income to changes in market interest rates using an interest rate simulation model that includes assumptions related to the level of balance sheet growth, deposit repricing characteristics and the rate of prepayments for multiple interest rate change scenarios. Interest rate sensitivity depends on certain repricing characteristics in our interest-earnings assets and interest-bearing liabilities, including the maturity structure of assets and liabilities and their repricing characteristics during the periods of changes in market interest rates. Effective interest rate risk management seeks to ensure both assets and liabilities respond to changes in interest rates within an acceptable timeframe, minimizing the impact of interest rate changes on net interest income and capital. Interest rate sensitivity is measured as the difference between the volume of assets and liabilities, at a point in time, that are subject to repricing at various time horizons, known as interest rate sensitivity gaps.
104
The following table presents sensitivity gaps for these different intervals.
|
|
December 31, 2014
|
||||||||||||||||||||||||||||||
|
(dollars in thousands)
|
3 Mos.
or Less
|
More Than
3 Mos.
to 6 Mos.
|
More Than
6 Mos.
to 12 Mos.
|
More Than
12 Mos.
to 3 Yrs.
|
More Than
3 Yrs.
to 5 Yrs.
|
More Than
5 Yrs.
|
Non-Rate-
Sensitive
|
Total
|
|||||||||||||||||||||||
|
Interest-earning assets:
|
|||||||||||||||||||||||||||||||
|
Cash & cash equivalents
|
$
|
30,502
|
|
$
|
—
|
|
$
|
—
|
|
$
|
—
|
|
|
$
|
—
|
|
$
|
—
|
|
$
|
—
|
|
$
|
30,502
|
|
||||||
|
FHLB Stock
|
—
|
|
—
|
|
—
|
|
—
|
|
—
|
|
33,915
|
|
—
|
|
33,915
|
|
|||||||||||||||
|
Investment securities
(1)
|
17,331
|
|
20,232
|
|
45,499
|
|
89,687
|
|
58,524
|
|
224,059
|
|
—
|
|
455,332
|
|
|||||||||||||||
|
Mortgage loans held for sale
|
621,235
|
|
—
|
|
—
|
|
—
|
|
—
|
|
—
|
|
—
|
|
621,235
|
|
|||||||||||||||
|
Loans held for investment
(1)
|
550,684
|
|
154,866
|
|
258,178
|
|
541,847
|
|
320,351
|
|
295,224
|
|
—
|
|
2,121,150
|
|
|||||||||||||||
|
Total interest-earning assets
|
1,219,752
|
|
175,098
|
|
303,677
|
|
631,534
|
|
378,875
|
|
553,198
|
|
—
|
|
3,262,134
|
|
|||||||||||||||
|
Non-interest-earning assets
|
—
|
|
—
|
|
—
|
|
—
|
|
—
|
|
—
|
|
272,956
|
|
272,956
|
|
|||||||||||||||
|
Total assets
|
$
|
1,219,752
|
|
$
|
175,098
|
|
$
|
303,677
|
|
$
|
631,534
|
|
$
|
378,875
|
|
$
|
553,198
|
|
$
|
272,956
|
|
$
|
3,535,090
|
|
|||||||
|
Interest-bearing liabilities:
|
|||||||||||||||||||||||||||||||
|
NOW accounts
(2)
|
$
|
272,390
|
|
$
|
—
|
|
$
|
—
|
|
$
|
—
|
|
$
|
—
|
|
$
|
—
|
|
$
|
—
|
|
$
|
272,390
|
|
|||||||
|
Statement savings accounts
(2)
|
200,638
|
|
—
|
|
—
|
|
—
|
|
—
|
|
—
|
|
—
|
|
200,638
|
|
|||||||||||||||
|
Money market accounts
(2)
|
1,007,213
|
|
—
|
|
—
|
|
—
|
|
—
|
|
—
|
|
—
|
|
1,007,213
|
|
|||||||||||||||
|
Certificates of deposit
|
122,377
|
|
97,863
|
|
94,724
|
|
169,841
|
|
9,721
|
|
—
|
|
—
|
|
494,526
|
|
|||||||||||||||
|
FHLB advances
|
50,000
|
|
—
|
|
—
|
|
—
|
|
—
|
|
—
|
|
—
|
|
50,000
|
|
|||||||||||||||
|
Federal funds purchased and securities sold under agreements to repurchase
|
532,000
|
|
—
|
|
—
|
|
50,000
|
|
10,000
|
|
5,590
|
|
—
|
|
597,590
|
|
|||||||||||||||
|
Long-term debt
(3)
|
61,857
|
|
—
|
|
—
|
|
—
|
|
—
|
|
—
|
|
—
|
|
61,857
|
|
|||||||||||||||
|
Total interest-bearing liabilities
|
2,246,475
|
|
97,863
|
|
94,724
|
|
219,841
|
|
19,721
|
|
5,590
|
|
—
|
|
2,684,214
|
|
|||||||||||||||
|
Non-interest bearing liabilities
|
—
|
|
—
|
|
—
|
|
—
|
|
—
|
|
—
|
|
548,638
|
|
548,638
|
|
|||||||||||||||
|
Equity
|
—
|
|
—
|
|
—
|
|
—
|
|
—
|
|
—
|
|
302,238
|
|
302,238
|
|
|||||||||||||||
|
Total liabilities and shareholders’ equity
|
$
|
2,246,475
|
|
$
|
97,863
|
|
$
|
94,724
|
|
$
|
219,841
|
|
$
|
19,721
|
|
$
|
5,590
|
|
$
|
850,876
|
|
$
|
3,535,090
|
|
|||||||
|
Interest sensitivity gap
|
$
|
(1,026,723
|
)
|
$
|
77,235
|
|
$
|
208,953
|
|
$
|
411,693
|
|
$
|
359,154
|
|
$
|
547,608
|
|
|||||||||||||
|
Cumulative interest sensitivity gap
|
$
|
(1,026,723
|
)
|
$
|
(949,488
|
)
|
$
|
(740,535
|
)
|
$
|
(328,842
|
)
|
$
|
30,312
|
|
$
|
577,920
|
|
|||||||||||||
|
Cumulative interest sensitivity gap as a percentage of total assets
|
(29
|
)%
|
(27
|
)%
|
(21
|
)%
|
(9
|
)%
|
1
|
%
|
16
|
%
|
|||||||||||||||||||
|
Cumulative interest-earning assets as a percentage of cumulative interest-bearing liabilities
|
54
|
%
|
60
|
%
|
70
|
%
|
88
|
%
|
101
|
%
|
122
|
%
|
|||||||||||||||||||
|
(1)
|
Based on contractual maturities, repricing dates and forecasted principal payments assuming normal amortization and, where applicable, prepayments.
|
|
(2)
|
Assumes 100% of interest-bearing non-maturity deposits are subject to repricing in three months or less.
|
|
(3)
|
Based on contractual maturity
.
|
As of
December 31, 2014
, the Bank’s total interest-earning assets were greater than total interest-bearing liabilities, resulting in a cumulative asset-sensitive position. Therefore, net interest income would be expected to rise in the long term if interest rates were to rise. Given that the Bank is liability-sensitive in the “three months or less” period generally indicates that net interest income would generally fall in the short term if interest rates were to rise.
105
Changes in the mix of interest-earning assets or interest-bearing liabilities can either increase or decrease the net interest margin, without affecting interest rate sensitivity. In addition, the interest rate spread between an earning asset and its funding liability can vary significantly, while the timing of repricing for both the asset and the liability remains the same, thereby impacting net interest income. This characteristic is referred to as basis risk. Varying interest rate environments can create unexpected changes in prepayment levels of assets and liabilities that are not reflected in the interest rate sensitivity analysis. These prepayments may have a significant impact on our net interest margin. Because of these factors, an interest sensitivity gap analysis may not provide an accurate assessment of our actual exposure to changes in interest rates.
The estimated impact on our net interest income over a time horizon of one year and the change in net portfolio value as of
December 31, 2014
and
December 31, 2013
are provided in the table below. For the scenarios shown, the interest rate simulation assumes an instantaneous and sustained shift in market interest rates and no change in the composition or size of the balance sheet.
|
|
December 31, 2014
|
December 31, 2013
|
||||||||||
|
Change in Interest Rates
(basis points)
|
Percentage Change
|
|||||||||||
|
Net Interest Income
(1)
|
Net Portfolio Value
(2)
|
Net Interest Income
(1)
|
Net Portfolio Value
(2)
|
|||||||||
|
+200
|
(1.5
|
)%
|
(12.0
|
)%
|
(4.4
|
)%
|
(21.2
|
)%
|
||||
|
+100
|
(0.1
|
)
|
(3.5
|
)
|
(1.6
|
)
|
(10.9
|
)
|
||||
|
-100
|
(3.4
|
)
|
(4.6
|
)
|
(1.9
|
)
|
7.8
|
|
||||
|
-200
|
(7.2
|
)%
|
(18.0
|
)%
|
(3.0
|
)%
|
6.7
|
%
|
||||
|
(1)
|
This percentage change represents the impact to net interest income and servicing income for a one-year period, assuming there is no change in the structure of the balance sheet.
|
|
(2)
|
This percentage change represents the impact to the net present value of equity, assuming there is no change in the structure of the balance sheet.
|
At
December 31, 2014
, we believe our net interest income sensitivity did not exhibit a strong bias to either an increase in interest rates or a decline in interest rates. During
2014
, the Company has reduced the interest rate sensitivity of its assets and increased the interest rate sensitivity of its liabilities. It is expected that, as interest rates change, net interest income will be positively correlated with rate movements, i.e. an increase (decrease) in interest rates would result in an increase (decrease) in net interest income. Some of the assumptions made in the simulation model may not materialize and unanticipated events and circumstances will occur. In addition, the simulation model does not take into account any future actions that we could undertake to mitigate an adverse impact due to changes in interest rates from those expected, in the actual level of market interest rates or competitive influences on our deposits.
Risk Management Instruments
We originate fixed-rate residential home mortgages primarily for sale into the secondary market. These loans are hedged against interest rate fluctuations from the time of the loan commitment until the loans are sold.
We have been able to manage interest rate risk by matching both on- and off-balance sheet assets and liabilities, within reasonable limits, through a range of potential rate and repricing characteristics. Where appropriate, we also use hedging techniques including the use of forward sale commitments, option contracts and interest rate swaps.
In order to protect the economic value of our mortgage servicing rights, we employ hedging strategies utilizing derivative financial instruments including forward interest rate swaps, options on interest rate swap contracts and commitments to purchase mortgage backed securities. We utilize these instruments as economic hedges and changes in the fair value of these instruments are recognized in current income as a component of mortgage servicing income. Our mortgage servicing rights hedging policy requires management to hedge the impact on the value of our mortgage servicing rights for a low-probability, extreme and sudden increase in interest rates. This policy requires that we hedge estimated losses to a maximum of a $2.0 million loss, subject to the limitations of hedging effectiveness including market risk, basis risk, counterparty credit risk and others.
106
The following table presents the financial instruments classified as derivatives.
|
At December 31, 2014
|
|||||||||||||||||||||||
|
Notional amount
|
Fair value
|
Hedged risk
|
|||||||||||||||||||||
|
(in thousands)
|
Asset
derivatives
|
Liability
derivatives
|
Asset
(1)
interest rate locks
|
Asset
(1)
loans held for sale
|
Asset
(1)
MSR
|
||||||||||||||||||
|
Forward sale commitments
|
$
|
934,986
|
|
$
|
1,071
|
|
$
|
(5,658
|
)
|
$
|
—
|
|
$
|
(5,505
|
)
|
$
|
918
|
|
|||||
|
Interest rate swaptions
|
15,000
|
|
—
|
|
—
|
|
—
|
|
—
|
|
—
|
|
|||||||||||
|
Interest rate lock commitments
|
392,687
|
|
11,939
|
|
(6
|
)
|
11,933
|
|
—
|
|
—
|
|
|||||||||||
|
Interest rate swaps
|
610,150
|
|
11,689
|
|
(972
|
)
|
—
|
|
—
|
|
10,718
|
|
|||||||||||
|
$
|
1,952,823
|
|
$
|
24,699
|
|
$
|
(6,636
|
)
|
$
|
11,933
|
|
$
|
(5,505
|
)
|
$
|
11,636
|
|
||||||
|
(1)
|
Economic fair value hedge.
|
|
(2)
|
Fair value hedge in accordance with hedge accounting standards.
|
We may implement other hedge transactions using forward loan sales, futures, option contracts and interest rate swaps, interest rate floors, financial futures, forward rate agreements and U.S. Treasury options on futures or bonds. Prior to considering any hedging activities, we analyze the costs and benefits of the hedge in comparison to other viable alternative strategies.
107
|
ITEM 8
|
FINANCIAL STATEMENTS AND SUPPLEMENTARY DATA
|
REPORT OF INDEPENDENT REGISTERED PUBLIC ACCOUNTING FIRM
To the Board of Directors and Shareholders of
HomeStreet, Inc.
Seattle, Washington
We have audited the accompanying consolidated statements of financial condition of HomeStreet, Inc. and subsidiaries (the "Company") as of December 31, 2014 and 2013, and the related consolidated statements of operations, comprehensive income, shareholders' equity, and cash flows for the years then ended. These financial statements are the responsibility of the Company’s management. Our responsibility is to express an opinion on these financial statements based on our audit. The consolidated financial statements of the Company for the year ended December 31, 2012, before the effects of the retrospective adjustments to the disclosures for a change in the composition of reportable segments, were audited by other auditors whose report, dated March 15, 2013, expressed an unqualified opinion on those statements.
We conducted our audits in accordance with the standards of the Public Company Accounting Oversight Board (United States). Those standards require that we plan and perform the audits to obtain reasonable assurance about whether the financial statements are free of material misstatement. An audit includes examining, on a test basis, evidence supporting the amounts and disclosures in the financial statements. An audit also includes assessing the accounting principles used and significant estimates made by management, as well as evaluating the overall financial statement presentation. We believe that our audits provide a reasonable basis for our opinions.
In our opinion, the 2014 and 2013 consolidated financial statements present fairly, in all material respects, the financial position of HomeStreet, Inc. and subsidiaries as of December 31, 2014 and 2013, and the results of their operations and their cash flows for the years then ended, in conformity with accounting principles generally accepted in the United States of America.
We also have audited the adjustments to the 2012 consolidated financial statements to retrospectively adjust the disclosures for a change in the composition of reportable segments during the year ended December 31, 2013. Our procedures included (1) comparing the adjustment amounts of segment net income and average assets to the Company's underlying analysis and (2) testing the mathematical accuracy of the reconciliations of segment amounts to the consolidated financial statements. In our opinion, such retrospective adjustments are appropriate and have been properly applied. However, we were not engaged to audit, review, or apply any procedures to the 2012 consolidated financial statements of the Company other than with respect to the retrospective adjustments and, accordingly, we do not express an opinion or any other form of assurance on the 2012 consolidated financial statements taken as a whole.
We have also audited, in accordance with the standards of the Public Company Accounting Oversight Board (United States), the Company's internal control over financial reporting as of December 31, 2014, based on the criteria established in
Internal Control - Integrated Framework (2013)
issued by the Committee of Sponsoring Organizations of the Treadway Commission and our report dated March 24, 2015, expressed an adverse opinion on the Company's internal control over financial reporting because of a material weakness.
/s/ Deloitte & Touche LLP
Seattle, Washington
March 24, 2015
108
Report of Independent Registered Public Accounting Firm
The Board of Directors and Shareholders
HomeStreet, Inc.:
We have audited, before the effects of changes to reportable segments that resulted in retrospective restatement of the segment disclosures as described in Note 19, the accompanying consolidated statements of operations, comprehensive income, shareholders’ equity, and cash flows of HomeStreet, Inc. and subsidiaries (the Company) for the year ended December 31, 2012. The 2012 consolidated financial statements before the effects of the adjustments discussed in Note 19 are not presented herein. The 2012 consolidated financial statements are the responsibility of the Company’s management. Our responsibility is to express an opinion on these consolidated financial statements based on our audit.
We conducted our audit in accordance with the standards of the Public Company Accounting Oversight Board (United States). Those standards require that we plan and perform the audit to obtain reasonable assurance about whether the financial statements are free of material misstatement. An audit includes examining, on a test basis, evidence supporting the amounts and disclosures in the financial statements. An audit also includes assessing the accounting principles used and significant estimates made by management, as well as evaluating the overall financial statement presentation. We believe that our audit provides a reasonable basis for our opinion.
In our opinion, the 2012 consolidated financial statements, before the effects of changes to reportable segments that resulted in retrospective restatement of the segment disclosures as described in Note 19, referred to above, present fairly, in all material respects, the results of operations and cash flows of the Company for the year ended December 31, 2012 in conformity with U.S. generally accepted accounting principles.
We were not engaged to audit, review, or apply any procedures to the adjustments to segment disclosures described in Note 19, and, accordingly, we do not express an opinion or any other form of assurance about whether such adjustments are appropriate and have been properly applied. Those adjustments were audited by a successor auditor.
(signed) KPMG LLP
Seattle, Washington
March 15, 2013
109
|
HOMESTREET, INC. AND SUBSIDIARIES
|
|||||||
|
At December 31,
|
|||||||
|
(in thousands, except share data)
|
2014
|
2013
|
|||||
|
ASSETS
|
|||||||
|
Cash and cash equivalents (including interest-earning instruments of $10,271 and $9,436)
|
$
|
30,502
|
|
$
|
33,908
|
|
|
|
Investment securities (includes $427,326 and $481,683 carried at fair value)
|
455,332
|
|
498,816
|
|
|||
|
Loans held for sale (includes $610,350 and $279,385 carried at fair value)
|
621,235
|
|
279,941
|
|
|||
|
Loans held for investment (net of allowance for loan losses of $22,021 and $23,908)
|
2,099,129
|
|
1,871,813
|
|
|||
|
Mortgage servicing rights (includes $112,439 and $153,128 carried at fair value)
|
123,324
|
|
162,463
|
|
|||
|
Other real estate owned
|
9,448
|
|
12,911
|
|
|||
|
Federal Home Loan Bank stock, at cost
|
33,915
|
|
35,288
|
|
|||
|
Premises and equipment, net
|
45,251
|
|
36,612
|
|
|||
|
Goodwill
|
11,945
|
|
12,063
|
|
|||
|
Accounts receivable and other assets
|
105,009
|
|
122,239
|
|
|||
|
Total assets
|
$
|
3,535,090
|
|
$
|
3,066,054
|
|
|
|
LIABILITIES AND SHAREHOLDERS’ EQUITY
|
|||||||
|
Liabilities:
|
|||||||
|
Deposits
|
$
|
2,445,430
|
|
$
|
2,210,821
|
|
|
|
Federal Home Loan Bank advances
|
597,590
|
|
446,590
|
|
|||
|
Federal funds purchased and securities sold under agreements to repurchase
|
50,000
|
|
—
|
|
|||
|
Accounts payable and other liabilities
|
77,975
|
|
77,906
|
|
|||
|
Long-term debt
|
61,857
|
|
64,811
|
|
|||
|
Total liabilities
|
3,232,852
|
|
2,800,128
|
|
|||
|
Commitments and contingencies (Note 13)
|
|
|
|||||
|
Shareholders’ equity:
|
|||||||
|
Preferred stock, no par value, authorized 10,000 shares, issued and outstanding, 0 shares and 0 shares
|
—
|
|
—
|
|
|||
|
Common stock, no par value, authorized 160,000,000, issued and outstanding, 14,856,611 shares and 14,799,991 shares
|
511
|
|
511
|
|
|||
|
Additional paid-in capital
|
96,615
|
|
94,474
|
|
|||
|
Retained earnings
|
203,566
|
|
182,935
|
|
|||
|
Accumulated other comprehensive income
|
1,546
|
|
(11,994
|
)
|
|||
|
Total shareholders' equity
|
302,238
|
|
265,926
|
|
|||
|
Total liabilities and shareholders' equity
|
$
|
3,535,090
|
|
$
|
3,066,054
|
|
|
See accompanying notes to consolidated financial statements.
110
|
HOMESTREET, INC. AND SUBSIDIARIES
|
|||||||||||
|
Year Ended December 31,
|
|||||||||||
|
(in thousands, except share data)
|
2014
|
2013
|
2012
|
||||||||
|
Interest income:
|
|||||||||||
|
Loans
|
$
|
100,107
|
|
$
|
76,442
|
|
$
|
71,057
|
|
||
|
Investment securities available for sale
|
10,565
|
|
12,391
|
|
9,391
|
|
|||||
|
Other
|
621
|
|
143
|
|
243
|
|
|||||
|
111,293
|
|
88,976
|
|
80,691
|
|
||||||
|
Interest expense:
|
|||||||||||
|
Deposits
|
9,431
|
|
10,416
|
|
16,741
|
|
|||||
|
Federal Home Loan Bank advances
|
1,980
|
|
1,532
|
|
1,788
|
|
|||||
|
Federal funds purchased and securities sold under agreements to repurchase
|
22
|
|
11
|
|
70
|
|
|||||
|
Long-term debt
|
1,120
|
|
2,546
|
|
1,333
|
|
|||||
|
Other
|
71
|
|
27
|
|
16
|
|
|||||
|
12,624
|
|
14,532
|
|
19,948
|
|
||||||
|
Net interest income
|
98,669
|
|
74,444
|
|
60,743
|
|
|||||
|
Provision (reversal of provision) for credit losses
|
(1,000
|
)
|
900
|
|
11,500
|
|
|||||
|
Net interest income after provision for credit losses
|
99,669
|
|
73,544
|
|
49,243
|
|
|||||
|
Noninterest income:
|
|||||||||||
|
Net gain on mortgage loan origination and sale activities
|
144,122
|
|
164,712
|
|
210,564
|
|
|||||
|
Mortgage servicing income
|
34,092
|
|
17,073
|
|
16,121
|
|
|||||
|
Income from WMS Series LLC
|
101
|
|
704
|
|
4,264
|
|
|||||
|
Loss on debt extinguishment
|
(573
|
)
|
—
|
|
(939
|
)
|
|||||
|
Depositor and other retail banking fees
|
3,572
|
|
3,172
|
|
3,062
|
|
|||||
|
Insurance agency commissions
|
1,153
|
|
864
|
|
743
|
|
|||||
|
Gain on sale of investment securities available for sale (includes unrealized gains reclassified from accumulated other comprehensive income of $2,358, $1,772 and $1,490)
|
2,358
|
|
1,772
|
|
1,490
|
|
|||||
|
Other
|
832
|
|
2,448
|
|
2,715
|
|
|||||
|
185,657
|
|
190,745
|
|
238,020
|
|
||||||
|
Noninterest expense:
|
|||||||||||
|
Salaries and related costs
|
163,387
|
|
149,440
|
|
119,829
|
|
|||||
|
General and administrative
|
42,833
|
|
40,366
|
|
27,838
|
|
|||||
|
Legal
|
2,071
|
|
2,552
|
|
1,796
|
|
|||||
|
Consulting
|
3,224
|
|
5,637
|
|
3,037
|
|
|||||
|
Federal Deposit Insurance Corporation assessments
|
2,316
|
|
1,433
|
|
3,554
|
|
|||||
|
Occupancy
|
18,598
|
|
13,765
|
|
8,585
|
|
|||||
|
Information services
|
20,052
|
|
14,491
|
|
8,867
|
|
|||||
|
Net cost (income) from operation and sale of other real estate owned
|
(470
|
)
|
1,811
|
|
10,085
|
|
|||||
|
252,011
|
|
229,495
|
|
183,591
|
|
||||||
|
Income before income taxes
|
33,315
|
|
34,794
|
|
103,672
|
|
|||||
|
Income tax expense (includes reclassification adjustments of $825, $620 and $522)
|
11,056
|
|
10,985
|
|
21,546
|
|
|||||
|
NET INCOME
|
$
|
22,259
|
|
$
|
23,809
|
|
$
|
82,126
|
|
||
|
Basic income per share
|
$
|
1.50
|
|
$
|
1.65
|
|
$
|
6.17
|
|
||
|
Diluted income per share
|
$
|
1.49
|
|
$
|
1.61
|
|
$
|
5.98
|
|
||
|
Basic weighted average number of shares outstanding
|
14,800,689
|
|
14,412,059
|
|
13,312,939
|
|
|||||
|
Diluted weighted average number of shares outstanding
|
14,961,081
|
|
14,798,168
|
|
13,739,398
|
|
|||||
See accompanying notes to consolidated financial statements.
111
|
HOMESTREET, INC. AND SUBSIDIARIES
CONSOLIDATED STATEMENTS OF COMPREHENSIVE INCOME
|
|||||||||||
|
Year Ended December 31,
|
|||||||||||
|
(in thousands)
|
2014
|
2013
|
2012
|
||||||||
|
Net income
|
$
|
22,259
|
|
$
|
23,809
|
|
$
|
82,126
|
|
||
|
Other comprehensive income, net of tax:
|
|||||||||||
|
Unrealized gain (loss) on investment securities available for sale:
|
|||||||||||
|
Unrealized holding gain (loss) arising during the year, net of tax expense (benefit) of $8,116, $(10,786) and $3,098
|
15,072
|
|
(20,032
|
)
|
6,039
|
|
|||||
|
Reclassification adjustment for net gains included in net income, net of tax expense of $825, $620 and $522
|
(1,532
|
)
|
(1,152
|
)
|
(968
|
)
|
|||||
|
Other comprehensive income (loss)
|
13,540
|
|
(21,184
|
)
|
5,071
|
|
|||||
|
Comprehensive income
|
$
|
35,799
|
|
$
|
2,625
|
|
$
|
87,197
|
|
||
See accompanying notes to consolidated financial statements.
112
|
HOMESTREET, INC. AND SUBSIDIARIES
CONSOLIDATED STATEMENTS OF SHAREHOLDERS’ EQUITY
|
||||||||||||||||||||||
|
(in thousands, except share data)
|
Number
of shares
|
Common
stock
|
Additional
paid-in
capital
|
Retained
earnings
|
Accumulated
other
comprehensive
income (loss)
|
Total
|
||||||||||||||||
|
Balance, January 1, 2012
|
5,403,498
|
|
$
|
511
|
|
$
|
31
|
|
$
|
81,746
|
|
$
|
4,119
|
|
$
|
86,407
|
|
|||||
|
Net income
|
—
|
|
—
|
|
—
|
|
82,126
|
|
—
|
|
82,126
|
|
||||||||||
|
Share-based compensation expense
|
—
|
|
—
|
|
3,308
|
|
—
|
|
—
|
|
3,308
|
|
||||||||||
|
Common stock issued
|
8,979,140
|
|
—
|
|
86,850
|
|
—
|
|
—
|
|
86,850
|
|
||||||||||
|
Other comprehensive income
|
—
|
|
—
|
|
—
|
|
—
|
|
5,071
|
|
5,071
|
|
||||||||||
|
Balance, December 31, 2012
|
14,382,638
|
|
511
|
|
90,189
|
|
163,872
|
|
9,190
|
|
263,762
|
|
||||||||||
|
Net income
|
—
|
|
—
|
|
—
|
|
23,809
|
|
—
|
|
23,809
|
|
||||||||||
|
Dividends declared ($0.33 per share)
|
—
|
|
—
|
|
—
|
|
(4,746
|
)
|
—
|
|
(4,746
|
)
|
||||||||||
|
Share-based compensation expense
|
—
|
|
—
|
|
4,097
|
|
—
|
|
—
|
|
4,097
|
|
||||||||||
|
Common stock issued
|
417,353
|
|
—
|
|
188
|
|
—
|
|
—
|
|
188
|
|
||||||||||
|
Other comprehensive income
|
—
|
|
—
|
|
—
|
|
—
|
|
(21,184
|
)
|
(21,184
|
)
|
||||||||||
|
Balance, December 31, 2013
|
14,799,991
|
|
511
|
|
94,474
|
|
182,935
|
|
(11,994
|
)
|
265,926
|
|
||||||||||
|
Net income
|
—
|
|
—
|
|
—
|
|
22,259
|
|
—
|
|
22,259
|
|
||||||||||
|
Dividends declared ($0.11 per share)
|
—
|
|
—
|
|
—
|
|
(1,628
|
)
|
—
|
|
(1,628
|
)
|
||||||||||
|
Share-based compensation expense
|
—
|
|
—
|
|
1,767
|
|
—
|
|
—
|
|
1,767
|
|
||||||||||
|
Common stock issued
|
56,620
|
|
—
|
|
374
|
|
—
|
|
—
|
|
374
|
|
||||||||||
|
Other comprehensive income
|
—
|
|
—
|
|
—
|
|
—
|
|
13,540
|
|
13,540
|
|
||||||||||
|
Balance, December 31, 2014
|
14,856,611
|
|
$
|
511
|
|
$
|
96,615
|
|
$
|
203,566
|
|
$
|
1,546
|
|
$
|
302,238
|
|
|||||
See accompanying notes to consolidated financial statements.
113
|
HOMESTREET, INC. AND SUBSIDIARIES
|
|||||||||||
|
Year Ended December 31,
|
|||||||||||
|
(in thousands)
|
2014
|
2013
|
2012
|
||||||||
|
CASH FLOWS FROM OPERATING ACTIVITIES:
|
|||||||||||
|
Net income
|
$
|
22,259
|
|
$
|
23,809
|
|
$
|
82,126
|
|
||
|
Adjustments to reconcile net income to net cash (used in) provided by operating activities:
|
|||||||||||
|
Depreciation, amortization and accretion
|
17,503
|
|
14,947
|
|
9,953
|
|
|||||
|
(Reversal of) provision for credit losses
|
(1,000
|
)
|
900
|
|
11,500
|
|
|||||
|
Provision for losses on other real estate owned
|
69
|
|
603
|
|
12,171
|
|
|||||
|
Fair value adjustment of loans held for sale
|
(15,350
|
)
|
23,776
|
|
(24,665
|
)
|
|||||
|
Origination of mortgage servicing rights
|
(46,492
|
)
|
(63,604
|
)
|
(51,838
|
)
|
|||||
|
Change in fair value of mortgage servicing rights
|
40,691
|
|
(5,134
|
)
|
31,680
|
|
|||||
|
Net gain on sale of investment securities
|
(2,358
|
)
|
(1,772
|
)
|
(1,490
|
)
|
|||||
|
Net gain on sale of loans originated as held for investment
|
(4,586
|
)
|
—
|
|
—
|
|
|||||
|
Net fair value adjustment and gain on sale of other real estate owned
|
(941
|
)
|
(940
|
)
|
(3,400
|
)
|
|||||
|
Loss on early retirement of long-term debt
|
573
|
|
—
|
|
939
|
|
|||||
|
Net deferred income tax (benefit) expense
|
(13,664
|
)
|
21,076
|
|
(5,110
|
)
|
|||||
|
Share-based compensation expense
|
1,516
|
|
1,498
|
|
2,773
|
|
|||||
|
Origination of loans held for sale
|
(3,795,111
|
)
|
(4,428,569
|
)
|
(5,173,725
|
)
|
|||||
|
Proceeds from sale of loans originated as held for sale
|
3,420,142
|
|
4,745,651
|
|
4,728,000
|
|
|||||
|
Cash used by changes in operating assets and liabilities:
|
|||||||||||
|
Decrease (increase) in accounts receivable and other assets
|
25,420
|
|
(11,212
|
)
|
(28,181
|
)
|
|||||
|
Increase (decrease) in accounts payable and other liabilities
|
2,693
|
|
(16,999
|
)
|
17,397
|
|
|||||
|
Net cash (used in) provided by operating activities
|
(348,636
|
)
|
304,030
|
|
(391,870
|
)
|
|||||
|
CASH FLOWS FROM INVESTING ACTIVITIES:
|
|||||||||||
|
Purchase of investment securities
|
(60,548
|
)
|
(317,695
|
)
|
(285,165
|
)
|
|||||
|
Proceeds from sale of investment securities
|
96,154
|
|
127,648
|
|
166,187
|
|
|||||
|
Principal repayments and maturities of investment securities
|
24,013
|
|
70,962
|
|
35,813
|
|
|||||
|
Proceeds from sale of other real estate owned
|
9,138
|
|
19,656
|
|
49,566
|
|
|||||
|
Proceeds from sale of loans originated as held for investment
|
271,409
|
|
86,327
|
|
9,966
|
|
|||||
|
Proceeds from sale of mortgage servicing rights
|
39,004
|
|
—
|
|
—
|
|
|||||
|
Purchase of Yakima National and Fortune Banks and AmericanWest branches, net of cash acquired
|
—
|
|
23,971
|
|
—
|
|
|||||
|
Mortgage servicing rights purchased from others
|
(19
|
)
|
(22
|
)
|
(68
|
)
|
|||||
|
Capital expenditures related to other real estate owned
|
—
|
|
(22
|
)
|
(4,676
|
)
|
|||||
|
Origination of loans held for investment and principal repayments, net
|
(443,492
|
)
|
(447,873
|
)
|
(63,079
|
)
|
|||||
|
Purchase of property and equipment
|
(19,898
|
)
|
(22,836
|
)
|
(11,402
|
)
|
|||||
|
Net cash (used in) provided by investing activities
|
(84,239
|
)
|
(459,884
|
)
|
(102,858
|
)
|
|||||
114
|
(continued from prior page)
|
|||||||||||
|
Year Ended December 31,
|
|||||||||||
|
2014
|
2013
|
2012
|
|||||||||
|
CASH FLOWS FROM FINANCING ACTIVITIES:
|
|||||||||||
|
Increase (decrease) in deposits, net
|
$
|
231,871
|
|
$
|
(27,129
|
)
|
$
|
(32,920
|
)
|
||
|
Proceeds from Federal Home Loan Bank advances
|
6,704,054
|
|
5,847,392
|
|
9,924,854
|
|
|||||
|
Repayment of Federal Home Loan Bank advances
|
(6,553,054
|
)
|
(5,659,892
|
)
|
(9,724,622
|
)
|
|||||
|
Federal funds purchased and proceeds from securities sold under agreements to repurchase
|
108,308
|
|
159,790
|
|
424,672
|
|
|||||
|
Repayment of securities sold under agreements to repurchase
|
(58,308
|
)
|
(159,790
|
)
|
(424,672
|
)
|
|||||
|
Proceeds from Federal Home Loan Bank stock repurchase
|
1,373
|
|
1,319
|
|
660
|
|
|||||
|
Repayment of long-term debt
|
(3,527
|
)
|
—
|
|
—
|
|
|||||
|
Dividends paid
|
(1,628
|
)
|
—
|
|
—
|
|
|||||
|
Proceeds from stock issuance, net
|
130
|
|
188
|
|
88,204
|
|
|||||
|
Excess tax benefits related to exercise of stock options
|
250
|
|
2,599
|
|
535
|
|
|||||
|
Net cash provided by financing activities
|
429,469
|
|
164,477
|
|
256,711
|
|
|||||
|
NET (DECREASE) INCREASE IN CASH AND CASH EQUIVALENTS
|
(3,406
|
)
|
8,623
|
|
(238,017
|
)
|
|||||
|
CASH AND CASH EQUIVALENTS:
|
|||||||||||
|
Beginning of year
|
33,908
|
|
25,285
|
|
263,302
|
|
|||||
|
End of period
|
$
|
30,502
|
|
$
|
33,908
|
|
$
|
25,285
|
|
||
|
SUPPLEMENTAL DISCLOSURES OF CASH FLOW INFORMATION:
|
|||||||||||
|
Cash paid during the period for:
|
|||||||||||
|
Interest
|
$
|
14,271
|
|
$
|
28,373
|
|
$
|
21,304
|
|
||
|
Federal and state income tax refunded, net of taxes
|
6,626
|
|
6,799
|
|
26,376
|
|
|||||
|
Non-cash activities:
|
|||||||||||
|
Loans held for investment foreclosed and transferred to other real estate owned
|
5,556
|
|
12,807
|
|
51,128
|
|
|||||
|
Loans transferred from held for investment to held for sale
|
310,455
|
|
93,567
|
|
9,966
|
|
|||||
|
Loans transferred from held for sale to held for investment
|
92,668
|
|
—
|
|
—
|
|
|||||
|
Ginnie Mae loans recognized with the right to repurchase, net
|
6,840
|
|
6,360
|
|
5,674
|
|
|||||
|
Receivable from sale of mortgage servicing rights
|
$
|
4,244
|
|
$
|
—
|
|
$
|
—
|
|
||
See accompanying notes to consolidated financial statements.
115
HomeStreet, Inc. and Subsidiaries
Notes to Consolidated Financial Statements
HomeStreet, Inc. and its wholly owned subsidiaries (the “Company”) is a diversified financial services company serving customers primarily in the Pacific Northwest, California and Hawaii. The Company is principally engaged in real estate lending, including mortgage banking activities, and commercial and consumer banking. The consolidated financial statements include the accounts of HomeStreet, Inc. and its wholly owned subsidiaries, HomeStreet Capital Corporation and HomeStreet Bank (the “Bank”), and the Bank’s subsidiaries, HomeStreet/WMS, Inc., HomeStreet Reinsurance, Ltd., Continental Escrow Company, Union Street Holdings LLC and Lacey Gateway LLC. HomeStreet Bank was formed in 1986 and is a state-chartered savings bank.
The Company’s accounting and financial reporting policies conform to accounting principles generally accepted in the United States of America (U.S. GAAP). Inter-company balances and transactions have been eliminated in consolidation. In preparing the consolidated financial statements, the Company is required to make estimates and assumptions that affect the reported amounts of assets and liabilities as of the date of the financial statements and revenues and expenses during the reporting periods and related disclosures. These estimates that require application of management's most difficult, subjective or complex judgments often result in the need to make estimates about the effect of matters that are inherently uncertain and may change in future periods. Not all of these significant accounting policies require management to make difficult, subjective or complex judgments or estimates. Management has made significant estimates in several areas, including the fair value of assets acquired and liabilities assumed in business combinations (Note 2,
Business Combinations
), allowance for credit losses (Note 5,
Loans and Credit Quality
), valuation of residential mortgage servicing rights and loans held for sale (Note 12,
Mortgage Banking Operations
), loans held for investment (Note 5,
Loans and Credit Quality
), investment securities (Note 4,
Investment Securities
), derivatives (Note 11,
Derivatives and Hedging Activities
), other real estate owned (Note 6,
Other Real Estate Owned
), and taxes (Note 14,
Income Taxes
). Actual results could differ materially from those estimates. Certain amounts in the financial statements from prior periods have been reclassified to conform to the current financial statement presentation.
Consolidation
The Company consolidates legal entities in which it has a controlling financial interest. The Company determines whether it has a controlling financial interest by first evaluating whether an entity is a variable interest entity ("VIE"). If an entity is determined to not be a VIE, it is considered to be a voting interest entity.
Variable Interest Entities
The Company may have variable interests in VIEs arising from debt, equity or other monetary interests in an entity, which change with fluctuations in the fair value of the entity's assets. VIEs are entities that, by design, either (1) lack sufficient equity to permit the entity to finance its activities without additional subordinated financial support from other parties, or (2) have equity investors that do not have the ability to make significant decisions relating to the entity's operations through voting rights, or do not have the obligation to absorb the expected losses, or do not have the right to receive the residual returns of the entity.
The primary beneficiary of a VIE (i.e., the party that has a controlling financial interest) is required to consolidate the assets and liabilities of the VIE. The primary beneficiary is the party that has both (1) the power to direct the activities of an entity that most significantly impact the VIE's economic performance; and (2) through its interests in the VIE, the obligation to absorb losses or the right to receive benefits from the VIE that could potentially be significant to the VIE.
The Company's loans held for sale are sold predominantly to government-sponsored enterprises ("GSEs") Fannie Mae, Freddie Mac and Ginnie Mae for the purpose of securitization by the GSEs, who also provide credit enhancement of the loans through certain guarantee provisions. The Company typically retains the right to service the loans. Because of the power of the GSEs over the VIEs that hold the assets from these residential mortgage loan securitizations, the Company is not the primary beneficiary of the VIEs and therefore the VIEs are not consolidated.
The Company performs on-going reassessments of: (1) whether entities previously evaluated under the majority voting-interest framework have become VIEs, based on certain events, and therefore become subject to the VIE consolidation framework; and (2) whether changes in the facts and circumstances regarding the Company's involvement with a VIE cause the Company's consolidation determination to change.
116
Voting Interest Entities
Voting interest entities are entities that have sufficient equity and provide the equity investors voting rights that enable them to make significant decisions relating to the entity's operations. For these types of entities, the Company's determination of whether it has a controlling financial interest is primarily based on the amount of voting equity interests held. Entities in which the Company has a controlling financial interest, through ownership of the majority of the entities' voting equity interests, or through other contractual rights that give the Company control, are consolidated by the Company. Investments in entities in which the Company has significant influence over operating and financing decisions (but does not own a majority of the voting equity interests) are accounted for in accordance with the equity method of accounting (which requires the Company to recognize its proportionate share of the entity's net earnings). These investments are generally included in other assets.
The Company may have investments in limited partnerships or limited liability companies. The Company generally consolidates entities where it is the general partner or managing member. However, certain entities may provide limited partners or members the ability to remove the Company as the general partner or managing member without cause (i.e., kick-out rights), based on a simple majority vote, or the limited partners or members have rights to participate in important decisions of the entity. Accordingly, the Company does not consolidate these entities, in which case they are accounted for in accordance with the equity method of accounting. For equity method investments holding real estate acquired in any manner for debts previously contracted with the Company, the investment is included in other real estate owned in the consolidated statements of financial condition and the proportionate share of the entity's net earnings are included in other real estate owned expense in the consolidated statements of operations.
Cash and Cash Equivalents
Cash and cash equivalents include cash, interest-earning overnight deposits at other financial institutions, and other investments with original maturities equal to three months or less. For the consolidated statements of cash flows, the Company considered cash equivalents to be investments that are readily convertible to known amounts, so near to their maturity that they present an insignificant risk of a change in fair value due to change in interest rates, and purchased in conjunction with cash management activities. Restricted cash of
$2.4 million
and
$2.4 million
as of
December 31, 2014
and
2013
, respectively, is included in accounts receivable and other assets for reinsurance-related reserves.
Investment Securities
Investment securities that we might not hold until maturity are classified as available for sale ("AFS") and are reported at fair value in the statement of financial condition. Fair value measurement is based upon quoted market prices in active markets, if available. If quoted prices in active markets are not available, fair value is measured using pricing models or other model-based valuation techniques such as the present value of future cash flows, which consider prepayment assumptions and other factors such as credit losses and market liquidity. Unrealized gains and losses are excluded from earnings and reported, net of tax, in other comprehensive income (“OCI”). Purchase premiums and discounts are recognized in interest income using the effective interest method over the life of the securities. Purchase premiums or discounts related to mortgage-backed securities are amortized or accreted using projected prepayment speeds. Gains and losses on the sale of securities are recorded on the trade date and are determined using the specific identification method.
AFS investment securities in unrealized loss positions are evaluated for other-than-temporary impairment (“OTTI”) at least quarterly. For AFS debt securities, a decline in fair value is considered to be other-than-temporary if the Company does not expect to recover the entire amortized cost basis of the security. For AFS equity securities, the Company considers a decline in fair value to be other-than-temporary if it is probable that the Company will not recover its amortized cost basis.
Impairment may result from credit deterioration of the issuer or collateral underlying the security. In performing an assessment of recoverability, all relevant information is considered, including the length of time and extent to which fair value has been less than the amortized cost basis, the cause of the price decline, credit performance of the issuer and underlying collateral, and recoveries or further declines in fair value subsequent to the balance sheet date.
For debt securities, the Company measures and recognizes OTTI losses through earnings if (1) the Company has the intent to sell the security or (2) it is more likely than not that the Company will be required to sell the security before recovery of its amortized cost basis. In these circumstances, the impairment loss is equal to the full difference between the amortized cost basis and the fair value of the security. For securities that are considered other-than-temporarily-impaired that the Company has the intent and ability to hold in an unrealized loss position, the OTTI write-down is separated into an amount representing the credit loss, which is recognized in earnings, and the amount related to other factors, which is recognized as a component of OCI.
117
For equity securities, the Company recognizes OTTI losses through earnings if the Company intends to sell the security. The Company also considers other relevant factors, including its intent and ability to retain the security for a period of time sufficient to allow for any anticipated recovery in market value, and whether evidence exists to support a realizable value equal to or greater than the carrying value. Any impairment loss on an equity security is equal to the full difference between the amortized cost basis and the fair value of the security.
Federal Home Loan Bank Stock
As a borrower from the Federal Home Loan Bank of Seattle ("FHLB"), the Company is required to purchase an amount of FHLB stock based on our outstanding borrowings with the FHLB. This stock is used as collateral to secure the borrowings from the FHLB and is accounted for as a cost-method investment. FHLB stock is reviewed at least quarterly for possible OTTI, which includes an analysis of the FHLB's cash flows, capital needs and long-term viability.
Loans Held for Sale
Loans originated for sale in the secondary market, which is our principal market, or as whole loan sales are classified as loans held for sale. Management has elected the fair value option for all single family loans held for sale and records these loans at fair value. The fair value of loans held for sale is generally based on observable market prices from other loans in the secondary market that have similar collateral, credit, and interest rate characteristics. If quoted market prices are not readily available, the Company may consider other observable market data such as dealer quotes for similar loans or forward sale commitments. In certain cases, the fair value may be based on a discounted cash flow model. Gains and losses from changes in fair value on loans held for sale are recognized in net gain on mortgage loan origination and sale activities within noninterest income. Direct loan origination costs and fees for single family loans classified as held for sale are recognized in earnings. The change in fair value of loans held for sale is primarily driven by changes in interest rates subsequent to loan funding and changes in the fair value of related servicing asset, resulting in revaluation adjustments to the recorded fair value. The use of the fair value option allows the change in the fair value of loans to more effectively offset the change in the fair value of derivative instruments that are used as economic hedges to loans held for sale.
Multifamily loans held for sale are accounted for at the lower of amortized cost or fair value. Related gains and losses are recognized in net gain on mortgage loan origination and sale activities. Direct loan origination costs and fees for multifamily loans classified as held for sale are deferred at origination and recognized in earnings at the time of sale.
Loans Held for Investment
Loans held for investment are reported at the principal amount outstanding, net of cumulative charge-offs, interest applied to principal (for loans accounted for using the cost recovery method), unamortized net deferred loan origination fees and costs and unamortized premiums or discounts on purchased loans. Deferred fees and costs and premiums and discounts are amortized over the contractual terms of the underlying loans using the constant effective yield (the interest method). Interest on loans is accrued and recognized as interest income at the contractual rate of interest. Loan commitment fees are generally deferred and amortized into noninterest income on a straight-line basis over the commitment period. A determination is made as of the loan commitment date as to whether a loan will be held for sale or held for investment. This determination is based primarily on the type of loan or loan program and its related profitability characteristics.
When a loan is designated as held for investment, the intent is to hold these loans for the foreseeable future or until maturity or pay-off. If subsequent changes occur, the Company may change its intent to hold these loans. Once a determination has been made to sell such loans, they are immediately transferred to loans held for sale and carried at the lower of cost or fair value.
From time to time, the Company will originate loans to facilitate the sale of other real estate owned without a sufficient down payment from the borrower. Such loans are accounted for using the installment method and any gain on sale is deferred.
Nonaccrual Loans
Loans are placed on nonaccrual status when the full and timely collection of principal and interest is doubtful, generally when the loan becomes 90 days or more past due for principal or interest payment or if part of the principal balance has been charged off.
All payments received on nonaccrual loans are accounted for using the cost recovery method. Under the cost recovery method, all cash collected is applied to first reduce the principal balance. A loan may be returned to accrual status if all delinquent principal and interest payments are brought current and the collectability of the remaining principal and interest payments in
118
accordance with the loan agreement is reasonably assured. Loans that are well-secured and in the collection process are maintained on accrual status, even if they are 90 days or more past due. Loans whose repayments are insured by the Federal Housing Administration ("FHA") or guaranteed by the Department of Veterans' Affairs ("VA") are maintained on accrual status even if 90 days or more past due.
Impaired Loans
A loan is considered impaired when it is probable that all contractual principal and interest payments due will not be collected in accordance with the terms of the loan agreement. Factors considered by management in determining whether a loan is impaired include payment status, collateral value and the probability of collecting scheduled principal and interest payments when due.
Troubled Debt Restructurings
A loan is accounted for and reported as a troubled debt restructuring (“TDR”) when, for economic or legal reasons, we grant a concession to a borrower experiencing financial difficulty that we would not otherwise consider. A restructuring that results in only an insignificant delay in payment is not considered a concession. A delay may be considered insignificant if the payments subject to the delay are insignificant relative to the unpaid principal or collateral value and the contractual amount due, or the delay in timing of the restructured payment period is insignificant relative to the frequency of payments, the debt's original contractual maturity or original expected duration.
TDRs are designated as impaired because interest and principal payments will not be received in accordance with original contract terms. TDRs that are performing and on accrual status as of the date of the modification remain on accrual status. TDRs that are nonperforming as of the date of modification generally remain as nonaccrual until the prospect of future payments in accordance with the modified loan agreement is reasonably assured, generally demonstrated when the borrower maintains compliance with the restructured terms for a predetermined period, normally at least six months. TDRs with temporary below-market concessions remain designated as a TDR and impaired regardless of the accrual or performance status until the loan is paid off.
Allowance for Credit Losses
Credit quality within the loans held for investment portfolio is continuously monitored by management and is reflected within the allowance for credit losses. The allowance for credit losses is maintained at a level that, in management's judgment, is appropriate to cover losses inherent within the Company’s loans held for investment portfolio, including unfunded credit commitments, as of the balance sheet date. The allowance for loan losses, as reported in our consolidated statements of financial condition, is adjusted by a provision for loan losses, which is recognized in earnings, and reduced by the charge-off of loan amounts, net of recoveries.
The loss estimation process involves procedures to appropriately consider the unique characteristics of its two loan portfolio segments, the consumer loan portfolio segment and the commercial loan portfolio segment. These two segments are further disaggregated into loan classes, the level at which credit risk is monitored. When computing allowance levels, credit loss assumptions are estimated using a model that categorizes loan pools based on loss history, delinquency status and other credit trends and risk characteristics. Determining the appropriateness of the allowance is complex and requires judgment by management about the effect of matters that are inherently uncertain. Subsequent evaluations of the overall loan portfolio, in light of the factors then prevailing, may result in significant changes in the allowance for credit losses in those future periods.
Credit quality is assessed and monitored by evaluating various attributes and utilizes such information in our evaluation of the adequacy of the allowance for credit losses. The following provides the credit quality indicators and risk elements that are most relevant and most carefully considered and monitored for each loan portfolio segment.
Consumer Loan Portfolio Segment
The consumer loan portfolio segment is comprised of the single family and home equity loan classes, which are underwritten after evaluating a borrower’s capacity, credit, and collateral. Capacity refers to a borrower’s ability to make payments on the loan. Several factors are considered when assessing a borrower’s capacity, including the borrower’s employment, income, current debt, assets, and level of equity in the property. Credit refers to how well a borrower manages their current and prior debts as documented by a credit report that provides credit scores and the borrower’s current and past information about their credit history. Collateral refers to the type and use of property, occupancy, and market value. Property appraisals are obtained to assist in evaluating collateral. Loan-to-property value and debt-to-income ratios, loan amount, and lien position are also
119
considered in assessing whether to originate a loan. These borrowers are particularly susceptible to downturns in economic trends such as conditions that negatively affect housing prices and demand and levels of unemployment.
Commercial Loan Portfolio Segment
The commercial loan portfolio segment is comprised of the commercial real estate, multifamily residential, construction/land development and commercial business loan classes, whose underwriting standards consider the factors described for single family and home equity loan classes as well as others when assessing the borrower’s and associated guarantors or other related party’s financial position. These other factors include assessing liquidity, the level and composition of net worth, leverage, considering all other lender amounts and position, an analysis of cash expected to flow through the obligors including the outflow to other lenders, and prior experience with the borrower. This information is used to assess adequate financial capacity, profitability, and experience. Ultimate repayment of these loans is sensitive to interest rate changes, general economic conditions, liquidity, and availability of long-term financing.
Loan Loss Measurement
Allowance levels are influenced by loan volumes, loan asset quality ratings ("AQR") migration or delinquency status, historic loss experience and other conditions influencing loss expectations, such as economic conditions. The methodology for evaluating the adequacy of the allowance for loan losses has two basic components: first, an asset-specific component involving the identification of impaired loans and the measurement of impairment for each individual loan identified; and second, a formula-based component for estimating probable principle losses for all other loans
Impaired Loans
When a loan is identified as impaired, impairment is measured based on net realizable value, or the difference between the discounted value of the expected future cash flows, based on the original effective interest rate, and the recorded investment balance of the loan. For impaired loans, we recognize impairment if we determine that the net realizable value of the impaired loan is less than the recorded investment of the loan (net of previous charge-offs and deferred loan fees and costs), except when the sole remaining source of collection is the underlying collateral. In these cases impairment is measured as the difference between the recorded investment balance of the loan and the fair value of the collateral. The fair value of the collateral is adjusted for the estimated cost to sell if repayment or satisfaction of a loan is dependent on the sale (rather than only on the operation) of the collateral.
The starting point for determining the fair value of collateral is through obtaining external appraisals. Generally, collateral values for impaired loans are updated every twelve months, either from external third parties or in-house certified appraisers. A third party appraisal is required at least annually. Third party appraisals are obtained from a pre-approved list of independent, third party, local appraisal firms. Approval and addition to the list is based on experience, reputation, character, consistency and knowledge of the respective real estate market. Generally, appraisals are internally reviewed by the appraisal services group to ensure the quality of the appraisal and the expertise and independence of the appraiser. Once the impairment amount is determined an asset-specific allowance is provided for equal to the calculated impairment and included in the allowance for loan losses. If the calculated impairment is determined to be permanent or not recoverable, the impairment will be charged off. Factors considered by management in determining if impairment is permanent or not recoverable include whether management judges the loan to be uncollectible, repayment is deemed to be protracted beyond reasonable time frames or the loss becomes evident owing to the borrower’s lack of assets or, for single family loans, the loan is 180 days or more past due unless both well-secured and in the process of collection.
Estimate of Probable Loan Losses
In estimating the formula-based component of the allowance for loan losses, loans are segregated into loan classes. Loans are designated into loan classes based on loans pooled by product types and similar risk characteristics or areas of risk concentration.
In determining the allowance for loan losses we derive an estimated credit loss assumption from a model that categorizes loan pools based on loan type and AQR or delinquency bucket. This model calculates an expected loss percentage for each loan category by considering the probability of default, based on the migration of loans from performing to loss by AQR or delinquency buckets using one-year analysis periods, and the potential severity of loss, based on the aggregate net lifetime losses incurred per loan class.
120
The formula-based component of the allowance for loan losses also considers qualitative factors for each loan class, including changes in the following: (1) lending policies and procedures; (2) international, national, regional and local economic business conditions and developments that affect the collectability of the portfolio, including the condition of various markets; (3) the nature and volume of the loan portfolio including the terms of the loans; (4) the experience, ability, and depth of the lending management and other relevant staff; (5) the volume and severity of past due and adversely classified or graded loans and the volume of nonaccrual loans; (6) the quality of our loan review system; (7) the value of underlying collateral for collateral-dependent loans. Additional factors include (8) the existence and effect of any concentrations of credit, and changes in the level of such concentrations and (9) the effect of external factors such as competition and legal and regulatory requirements on the level of estimated credit losses in the existing portfolio. Qualitative factors are expressed in basis points and are adjusted downward or upward based on management’s judgment as to the potential loss impact of each qualitative factor to a particular loan pool at the date of the analysis.
Unfunded Loan Commitments
The Company maintains a separate allowance for losses on unfunded loan commitments, which is included in accounts payable and other liabilities on the consolidated statements of financial condition. Management estimates the amount of probable losses by calculating a one-year commitment usage factor and applying the loss factors used in the allowance for loan loss methodology to the results of the usage calculation to estimate the liability for credit losses related to unfunded commitments for each loan type.
Other Real Estate Owned
Other real estate owned ("OREO") represents real estate acquired for debts previously contracted with the Company, generally through the foreclosure of loans. In certain cases, such as foreclosures on loans involving both the Company and other participating lenders, other real estate owned may be held in the form of an investment in an unconsolidated legal entity that is in-substance real estate. These properties are initially recorded at the net realizable value (fair value of collateral less estimated costs to sell). Upon transfer of a loan to other real estate owned, an appraisal is obtained and any excess of the loan balance over the net realizable value is charged against the allowance for loan losses. The Company allows up to 90 days after foreclosure to finalize determination of net realizable value. Subsequent declines in net realizable value identified from the ongoing analysis of such properties are recognized in current period earnings within noninterest expense as a provision for losses on other real estate owned. The net realizable value of these assets is reviewed and updated at least every six months depending on the type of property, or more frequently as circumstances warrant.
As part of our subsequent events analysis process, we review updated independent third-party appraisals received and internal collateral valuations received subsequent to the reporting period-end to determine whether the fair value of loan collateral or OREO has changed. Additionally, we review agreements to sell OREO properties executed prior to and subsequent to the reporting period-end to identify changes in the fair value of OREO properties. If we determine that current valuations have changed materially from the prior valuations, we record any additional loan impairments or adjustments to OREO carrying values as of the end of the prior reporting period.
From time to time the Company may elect to accelerate the disposition of certain OREO properties in a time frame faster than the expected marketing period assumed in the appraisal supporting our valuation of such properties. At the time a property is identified and the decision to accelerate its disposition is made, that property’s underlying fair value is re-measured. Generally, to achieve an accelerated time frame in which to sell a property, the price that the Company is willing to accept for the disposition of the property decreases. Accordingly, the net realizable value of these properties is adjusted to reflect this change in valuation.
Mortgage Servicing Rights
We initially record all mortgage servicing rights ("MSRs") at fair value. For subsequent measurement of MSRs, accounting standards permit the election of either fair value or the lower of amortized cost or fair value. Management has elected to account for single family MSRs at fair value during the life of the MSR, with changes in fair value recorded through current period earnings. Fair value adjustments encompass market-driven valuation changes as well as modeled amortization involving the run-off of value that occurs due to the passage of time as individual loans are paid by borrowers. We account for multifamily MSRs at the lower of amortized cost or fair value.
MSRs are recorded as separate assets on our consolidated statements of financial condition upon purchase of the rights or when we retain the right to service loans that we have sold. Net gains on mortgage loan origination and sale activities depend, in part, on the initial fair value of MSRs, which is based on a discounted cash flow model.
121
Mortgage servicing income includes the changes in fair value over the reporting period of both our single family MSRs and the derivatives used to economically hedge our single family MSRs. Subsequent fair value measurements of single family MSRs, which are not traded in an active market with readily observable market prices, are determined by considering the present value of estimated future net servicing cash flows. Changes in the fair value of single family MSRs result from changes in (1) model inputs and assumptions and (2) modeled amortization, representing the collection and realization of expected cash flows and curtailments over time. The significant model inputs used to measure the fair value of single family MSRs include assumptions regarding market interest rates, projected prepayment speeds, discount rates, estimated costs of servicing and other income and additional expenses associated with the collection of delinquent loans.
Market expectations about loan duration, and correspondingly the expected term of future servicing cash flows, may vary from time to time due to changes in expected prepayment activity, especially when interest rates rise or fall. Market expectations of increased loan prepayment speeds may negatively impact the fair value of the single family MSRs. Fair value is also dependent on the discount rate used in calculating present value, which is imputed from observable market activity and market participants. Management reviews and adjusts the discount rate on an ongoing basis. An increase in the discount rate would reduce the estimated fair value of the single family MSRs asset.
For further information on how the Company measures the fair value of its single family MSRs, including key economic assumptions and the sensitivity of fair value to changes in those assumptions, see Note 12,
Mortgage Banking Operations
.
Investment in WMS Series LLC
HomeStreet/WMS, Inc. (Windermere Mortgage Services, Inc.), a wholly owned and consolidated subsidiary of the Bank, has an affiliated business arrangement with Windermere Real Estate, WMS Series Limited Liability Company ("WMS LLC"). The Company and Windermere Real Estate each have 50% joint control over the governance of WMS LLC. The operations of WMS LLC, which is subdivided into
29
individual operating series, are recorded using the equity method of accounting. The Company recognizes its proportionate share of the results of operations of WMS LLC as income from WMS Series LLC in noninterest income within the Company's consolidated statements of operations.
The Company has determined that WMS LLC is not a VIE and further does not consolidate WMS LLC under the voting interest model. The
29
individual operating series, which are divisions of WMS LLC that are allocated assets and liabilities and allow certain forms of legal isolation, are not considered to be stand-alone subsidiary legal entities for purposes of applying the consolidation guidance under U.S. GAAP. As a result, the
29
individual operating series are not considered to be VIEs based on the determination that WMS LLC is not a VIE. The investment is reviewed for possible other-than-temporary impairment annually, or more frequently if warranted. The review typically includes an analysis of facts and circumstances of the investment and expectations regarding the investment’s future cash flows. The Company has not recorded other-than-temporary impairment on this investment.
Equity method investment income from WMS LLC was
$1.3 million
,
$1.7 million
, and
$4.0 million
for the years ended December 31,
2014
,
2013
and
2012
, respectively. The Company’s investment in WMS LLC was
$3.1 million
and
$2.7 million
, which is included in accounts receivable and other assets at December 31,
2014
and
2013
, respectively.
The Company provides contracted services to WMS LLC related to accounting, loan shipping, loan underwriting, quality control, secondary marketing, and information systems support performed by Company employees on behalf of WMS LLC. The Company recorded contracted services income/(loss) of
$(1.2) million
,
$(951) thousand
, and
$279 thousand
for the years ended December 31,
2014
,
2013
and
2012
, respectively. Income related to WMS LLC, including equity method investment income and contracted services, is classified as income from WMS Series LLC in noninterest income within the consolidated statements of operations.
The Company provides a
$25.0 million
secured line of credit that allows WMS LLC to fund and close single family mortgage loans in the name of WMS LLC. The outstanding balance of the secured line of credit was
$7.1 million
and
$5.7 million
at December 31,
2014
, and
2013
, respectively. The highest outstanding balance of the secured line of credit was
$12.4 million
and
$21.4 million
during
2014
and
2013
, respectively. The line of credit matures
July 1, 2015
.
Premises and Equipment
Furniture and equipment and leasehold improvements are stated at cost less accumulated depreciation or amortization and depreciated or amortized over the shorter of the useful life of the related asset or the term of the lease, generally 3 to 15 years,
122
using the straight-line method. Management periodically evaluates furniture and equipment and leasehold improvements for impairment.
Goodwill
Goodwill is recorded upon completion of a business combination as the difference between the purchase price and the fair value of net identifiable assets acquired. Subsequent to initial recognition, the Company tests goodwill for impairment during the third quarter of each fiscal year, or more often if events or circumstances, such as adverse changes in the business climate, indicate there may be impairment. Goodwill was not impaired at December 31,
2014
or
2013
, nor was any goodwill written off due to impairment during
2014
,
2013
or
2012
.
Trust Preferred Securities ("TruPS")
TruPS allow investors the ability to invest in junior subordinated debentures of the Company, which provide the Company with long-term financing. The transaction begins with the formation of a VIE established as a trust by the Company. This trust issues two classes of securities: common securities, all of which are purchased and held by the Company and recorded in other assets on the consolidated statements of financial position, and TruPS, which are sold to third-party investors. The trust holds subordinated debentures (debt) issued by the Company, which the Company records in long-term debt on the consolidated statement of financial position. The trust finances the purchase the subordinated debentures with the proceeds from the sale of its common and preferred securities.
The junior subordinated debentures are the sole assets of the trust, and the coupon rate on the debt mirrors the dividend payment on the preferred security. The Company also has the right to defer interest payments for up to five years and has the right to call the preferred securities. These preferred securities are non-voting and do not have the right to convert to shares of the issuer. The trust's common equity securities issued to the Company are not considered to be equity at risk because the equity securities were financed by the trust through the purchase of the debentures from the Company. As a consequence, the Company holds no variable interest in the trust, and therefore, is not the trust's primary beneficiary.
Federal Funds Purchased and Securities Sold Under Agreements to Repurchase
From time to time, the Company may enter into federal funds transactions involving purchasing reserve balances on a short-term basis, or sales of securities under agreements to repurchase the same securities (“repurchase agreements”). Repurchase agreements are accounted for as secured financing arrangements with the obligation to repurchase securities sold reflected as a liability in the consolidated statements of financial condition. The dollar amount of securities underlying the repurchase agreements remains in investment securities available for sale. For short-term instruments, including securities sold under agreements to repurchase and federal funds purchased, the carrying amount is a reasonable estimate of the fair value.
Income Taxes
In establishing an income tax provision, management applies judgment and interpretations about the application of complex tax laws, which includes making estimates about when certain items will affect future taxable income. Income taxes are accounted for using the asset and liability method, which requires the recognition of deferred tax assets and liabilities for the expected future tax consequences of events that have been included in the financial statements. Under this method, a deferred tax asset or liability is determined based on the differences between the financial statements and tax basis of assets and liabilities using enacted tax rates in effect for the year in which the differences are expected to reverse. The effect of a change in tax rates on deferred tax assets and liabilities is recognized through the provision for income taxes in the period that includes the enactment date.
The Company records net deferred tax assets to the extent it is believed that these assets will more likely than not be realized. In making this determination, the Company considers all available positive and negative evidence, including future reversals of existing taxable temporary differences, projected future taxable income, tax planning strategies, and recent financial operations. After reviewing and weighing all of the positive and negative evidence, if the positive evidence outweighs the negative evidence, then the Company does not record a valuation allowance for deferred tax assets. If the negative evidence outweighs the positive evidence, then a valuation allowance for all or a portion of the deferred tax assets is recorded.
The Company recognizes interest and penalties related to unrecognized tax benefits, if any, as income tax expense in the consolidated statements of operations. Accrued interest and penalties are included within the related tax liability line in the consolidated statements of financial condition.
123
Derivatives and Hedging Activities
In order to reduce the risk of significant interest rate fluctuations on the value of certain assets and liabilities, such as certain mortgage loans held for sale or mortgage servicing rights, the Company utilizes derivatives, such as forward sale commitments, interest rate futures, option contracts, interest rate swaps and swaptions as risk management instruments in its hedging strategy.
All free-standing derivatives are required to be recorded on the consolidated statements of financial condition at fair value. As permitted under U.S. GAAP, the Company nets derivative assets and liabilities, and related collateral, when a legally enforceable master netting agreement exists between the Company and the derivative counterparty. The accounting for changes in fair value of a derivative depends on whether or not the transaction has been designated and qualifies for hedge accounting. Derivatives that are not designated as hedges are reported and measured at fair value through earnings. The Company does not use derivatives for trading purposes.
Before initiating a position where hedge accounting treatment is desired, the Company formally documents the relationship between the hedging instrument(s) and the hedged item(s), as well as its risk management objective and strategy.
For derivative instruments qualifying for hedge accounting treatment, the instrument is designed as either: (1) a hedge of changes in fair value of a recognized asset or liability or of an unrecognized firm commitment (a fair value hedge), or (2) a hedge of the variability in expected future cash flows associated with an existing recognized asset or liability or a probable forecasted transaction (a cash flow hedge).
Derivatives where the Company has not attempted to achieve or attempted but did not achieve hedge accounting treatment are referred to as economic hedges. The changes in fair value of these instruments are recorded in our consolidated statements of operations in the period in which the change occurs.
In a fair value hedge, changes in the fair value of the derivative and, to the extent that it is effective, changes in the fair value of the hedged asset or liability attributable to the hedged risk are recorded through current period earnings in the same financial statement category as the hedged item.
In a cash flow hedge, the effective portion of the change in the fair value of the hedging derivative is recorded in accumulated other comprehensive income and is subsequently reclassified into earnings during the same period in which the hedged item affects earnings. The ineffective portion is recognized immediately in noninterest income – other.
The Company discontinues hedge accounting when (1) it determines that the derivative is no longer expected to be highly effective in offsetting changes in fair value or cash flows of the designated item; (2) the derivative expires or is sold, terminated, or exercised; (3) the derivative is de-designated from the hedge relationship; or (4) it is no longer probable that a hedged forecasted transaction will occur by the end of the originally specified time period.
If the Company determines that the derivative no longer qualifies as a fair value or cash flow hedge and therefore hedge accounting is discontinued, the derivative (if retained) will continue to be recorded on the balance sheet at its fair value with changes in fair value included in current earnings. For a discontinued fair value hedge, the previously hedged item is no longer adjusted for changes in fair value.
When the Company discontinues hedge accounting because it is not probable that a forecasted transaction will occur, the derivative will continue to be recorded on the balance sheet at its fair value with changes in fair value included in current earnings, and the gains and losses in accumulated other comprehensive income will be recognized immediately in earnings. When the Company discontinues hedge accounting because the hedging instrument is sold, terminated, or de-designated as a hedge, the amount reported in accumulated other comprehensive income through the date of sale, termination, or de-designation will continue to be reported in accumulated other comprehensive income until the forecasted transaction affects earnings. For fair value hedges that are de-designated, the net gain or loss on the underlying transactions being hedged is amortized to other noninterest income over the remaining contractual life of the loans at the time of de-designation. Changes in the fair value of these derivative instruments after de-designation of fair value hedge accounting are recorded in noninterest income in the consolidated statements of operations.
Interest rate lock commitments ("IRLCs") for single family mortgage loans that we intend to sell are considered free-standing derivatives. For determining the fair value measurement of IRLCs we consider several factors including the fair value in the secondary market of the underlying loan resulting from the exercise of the commitment, the expected net future cash flows related to the associated servicing of the loan and the probability that the loan will not fund according to the terms of the commitment (referred to as a fall-out factor). The value of the underlying loan is affected primarily by changes in interest rates.
124
Management uses forward sales commitments to hedge the interest rate exposure from IRLCs. A forward loan sale commitment protects the Company from losses on sales of loans arising from the exercise of the loan commitments by securing the ultimate sales price and delivery date of the loan. The Company takes into account various factors and strategies in determining the portion of the mortgage pipeline it wants to hedge economically. Unrealized and realized gains and losses on derivative contracts utilized for economically hedging the mortgage pipeline are recognized as part of the net gain on mortgage loan origination and sale activities within noninterest income.
The Company is exposed to credit risk if derivative counterparties to derivative contracts do not perform as expected. This risk consists primarily of the termination value of agreements where the Company is in a favorable position. The Company minimizes counterparty credit risk through credit approvals, limits, monitoring procedures, and obtaining collateral, as appropriate.
Share-Based Employee Compensation
The Company has share-based employee compensation plans as more fully discussed in Note 16,
Share-Based Compensation Plan
s. Under the accounting guidance for stock compensation, compensation expense recognized includes the cost for share-based awards, such as nonqualified stock options and restricted stock grants, which are recognized as compensation expense over the requisite service period (generally the vesting period) on a straight line basis. For stock awards that vest upon the satisfaction of a market condition, the Company estimates the service period over which the award is expected to vest. If all conditions to the vesting of an award are satisfied prior to the end of the estimated vesting period, any unrecognized compensation costs associated with the portion of the award that vested earlier than expected are immediately recognized in earnings.
Fair Value Measurement
The term "fair value" is defined as the price that would be received to sell an asset or paid to transfer a liability in an orderly transaction between market participants at the measurement date. A fair value measurement assumes that the transaction to sell the asset or transfer the liability occurs in the principal market for the asset or liability or, in the absence of a principal market, the most advantageous market for the asset or liability. The Company’s approach is to maximize the use of observable inputs and minimize the use of unobservable inputs when developing fair value measurements. The degree of management judgment involved in estimating the fair value of a financial instrument or other asset is dependent upon the availability of quoted market prices or observable market value inputs for internal valuation models, used for estimating fair value. For financial instruments that are actively traded in the marketplace or whose values are based on readily available market data, little judgment is necessary when estimating the instrument’s fair value. When observable market prices and data are not readily available, significant management judgment often is necessary to estimate fair value. In those cases, different assumptions could result in significant changes in valuation. See Note 17,
Fair Value Measurement
.
Commitments, Guarantees, and Contingencies
U.S. GAAP requires that a guarantor recognize, at the inception of a guarantee, a liability in an amount equal to the fair value of the obligation undertaken in issuing the guarantee. A guarantee is a contract that contingently requires the guarantor to pay a guaranteed party based upon: (a) changes in an underlying asset, liability or equity security of the guaranteed party; or (b) a third party’s failure to perform under a specified agreement. The Company initially records guarantees at the inception date fair value of the obligation assumed and records the amount in other liabilities. For indemnifications provided in sales agreements, a portion of the sale proceeds is allocated to the guarantee, which adjusts the gain or loss that would otherwise result from the transaction. For these indemnifications, the initial liability is amortized to income as the Company’s risk is reduced (i.e., over time as the Company's exposure is reduced or when the indemnification expires).
Contingent liabilities, including those that exists as a result of a guarantee or indemnification, are recognized when it becomes probable that a loss has been incurred and the amount of the loss is reasonably estimable. The contingent portion of a guarantee is not recognized if the estimated amount of loss is less than the carrying amount of the liability recognized at inception of the guarantee (as adjusted for any amortization).
The Company typically sells loans servicing retained in either a pooled loan securitization transaction with a GSE, a whole loan sale to a GSE, or much less frequently a whole loan sale to market participants such as other financial institutions, who purchase the loans for investment purposes or include them in a private label securitization transaction, or the loans are pooled and sold into a conforming loan securitization with a government-sponsored enterprise (“GSE”), provided loan origination parameters conform to GSE guidelines. Substantially all of the Company’s loan sales are pooled loan securitization transactions with GSEs. These conforming loan securitizations are guaranteed by GSEs, such as Fannie Mae, Ginnie Mae and Freddie Mac.
125
The Company may be required to repurchase mortgage loans or indemnify loan purchasers due to defects in the origination process of the loan, such as documentation errors, underwriting errors and judgments, early payment defaults and fraud. These obligations expose the Company to any credit loss on the repurchased mortgage loans after accounting for any mortgage insurance that it may receive. Generally, the maximum amount of future payments the Company would be required to make for breaches of these representations and warranties would be equal to the unpaid principal balance of such loans that are deemed to have defects that were sold to purchasers plus, in certain circumstances, accrued and unpaid interest on such loans and certain expenses. See Note 13,
Commitments, Guarantees, and Contingencies
.
The Company sells multifamily loans through the Fannie Mae Delegated Underwriting and Servicing Program ("DUS"
®
) (DUS® is a registered trademark of Fannie Mae.) that are subject to a credit loss sharing arrangement. The Company may also from time to time sell loans with recourse. When loans are sold with recourse or subject to a loss sharing arrangement, a liability is recorded based on the estimated fair value of the obligation under the accounting guidance for guarantees. These liabilities are included within other liabilities. See Note 13,
Commitments, Guarantees, and Contingencies
.
Earnings per Share
Basic earnings per share ("EPS") is computed by dividing net income available to common shareholders by the weighted average common shares outstanding during the period. Diluted EPS is computed by dividing net income available to common shareholders by the weighted average common shares outstanding, plus the effect of common stock equivalents (for example, stock options and unvested restricted stock). Stock options issued under stock-based compensation plans that have an antidilutive effect and shares of restricted stock whose vesting is contingent upon conditions that have not been satisfied at the end of the period are excluded from the computation of diluted EPS. Weighted average common shares outstanding include shares held by the Company’s Employee Stock Ownership Plan. Shares outstanding and per share information presented in the consolidated financial statements have been adjusted to reflect the 2-for-1 forward stock splits effective on November 5, 2012 and on March 6, 2012, as well as the 1-for-2.5 reverse stock split effective on July 19, 2011.
Business Segments
The Company's business segments are determined based on the products and services provided, as well as the nature of the related business activities, and they reflect the manner in which financial information is regularly reviewed by the Company's chief operating decision maker for the purpose of allocating resources and evaluating the performance of the Company's businesses. The results for these business segments are based on management’s accounting process, which assigns income statement items and assets to each responsible operating segment. This process is dynamic and is based on management's view of the Company's operations. If the management structure and/or the allocation process changes, allocations, transfers, and assignments may change. See Note 19,
Business Segments
.
Correction of Parent Company Condensed Statements of Cash Flows
Subsequent to the issuance of the consolidated financial statements as of and for the year ended December 31, 2013, the Company determined that the $19.6 million Dividend from banking subsidiary classified within cash flows from financing activities in Note 20 -
Parent Company Financial Statements
- Condensed Statements of Cash Flows for the year ended December 31, 2013 should have been classified as net cash (used in) provided by operating activities for the year ended December 31, 2013. Accordingly, the Company corrected the error within the Parent Company Condensed Statements of Cash Flows for the year ended December 31, 2013. Parent Company Net cash used in operating activities for the year ended December 31, 2013 originally reported of $20,083 thousand was corrected to $483 thousand. Net cash provided by financing activities for the year ended December 31, 2013 originally reported of $19,818 thousand was corrected to $218 thousand. The corrections did not affect net cash used in investing activities nor the (decrease) increase in cash and cash equivalents. The foregoing corrections are not considered material by the Company.
Recent Accounting Developments
In January 2014, the Financial Accounting Standards Board ("FASB") issued Accounting Standards Update ("ASU") 2014-01,
Investments - Equity Method and Joint Ventures (Topic 323): Accounting for Investments in Qualified Affordable Housing Projects
. The ASU applies to all reporting entities that invest in qualified affordable housing projects through limited liability entities that are flow through entities for tax purposes. The amendments in this ASU eliminate the effective yield election and permit reporting entities to make an accounting policy election to account for their investments in qualified affordable housing projects using the proportional amortization method if certain conditions are met. Under the proportional amortization method, an entity amortizes the initial cost of the investment in proportion to the tax credits and other tax benefits received, and
126
recognizes the net investment performance in the income statement as a component of income tax expense (benefit). Those not electing the proportional amortization method would account for the investment using the equity method or cost method. The amendments in this ASU should be applied retrospectively to all periods presented and are effective for public business entities for annual periods and interim reporting periods within those annual periods, beginning after December 15, 2014, although early adoption is permitted. The Company elected to adopt this new accounting guidance as of January 1, 2014. It is being adopted prospectively, as the retrospective adjustments were not material. The Company's income tax expense for 2014 includes discrete tax benefit items of
$406 thousand
related to the recognition of the cumulative effect for prior years of adoption of this new accounting guidance.
In January 2014, the FASB issued ASU 2014-04,
Reclassification of Residential Real Estate Collateralized Consumer Mortgage Loans upon foreclosure.
The ASU clarifies that an in substance repossession or foreclosure occurs, and a creditor is considered to have received physical possession of residential real estate property collateralizing a consumer mortgage loan, upon either (1) the creditor obtaining legal title to the residential real estate property upon completion of a foreclosure or (2) the borrower conveying all interest in the residential real estate property to the creditor to satisfy that loan through completion of a deed in lieu of foreclosure or through a similar legal agreement. Additionally, the amendments require interim and annual disclosure of both (1) the amount of foreclosed residential real estate property held by the creditor and (2) the recorded investment in consumer mortgage loans collateralized by residential real estate property that are in the process of foreclosure according to local requirements of the applicable jurisdiction. The amendments are effective for annual and interim reporting periods beginning on or after December 15, 2014 and can be applied with a modified retrospective transition method or prospectively. The adoption of ASU 2014-04 is not expected to have a material impact on the Company's consolidated financial statements.
In May 2014, the FASB issued ASU 2014-09,
Revenue from Contracts with Customers (Topic 606).
This ASU clarifies the principles for recognizing revenue from contracts with customers. The new accounting guidance, which does not apply to financial instruments, is effective on a retrospective basis beginning on January 1, 2017. The adoption of ASU 2014-09 is not expected to have a material impact on the Company's consolidated financial statements.
In June 2014, the FASB issued ASU 2014-11,
Transfers and Servicing (Topic 860): Repurchase-to Maturity Transactions, Repurchase Financings, and Disclosures
. The ASU applies to all entities that enter into repurchase-to-maturity transactions or repurchase financings. The amendments in this ASU require that repurchase-to-maturity transactions be accounted for as secured borrowings consistent with the accounting for other repurchase agreements. In addition, the amendments require separate accounting for a transfer of a financial asset executed contemporaneously with a repurchase agreement with the same counterparty (a repurchase financing), which will result in secured borrowing accounting for the repurchase agreement. The amendments require an entity to disclose information about transfers accounted for as sales in transactions that are economically similar to repurchase agreements, in which the transferor retains substantially all of the exposure to the economic return on the transferred financial asset throughout the term of the transaction. In addition the amendments require disclosure of the types of collateral pledged in repurchase agreements, securities lending transactions, and repurchase-to-maturity transactions and the tenor of those transactions. The amendments in this ASU are effective for public business entities for the first interim or annual period beginning after December 15, 2014. Early adoption is not permitted. The application of this guidance may require enhanced disclosures of the Company's repurchase agreements, but is not expected to have a material impact on the Company's consolidated financial statements.
In August 2014, the FASB issued ASU 2014-14,
Classification of Certain Government-Guaranteed Mortgage Loans upon Foreclosure.
The ASU clarifies the classification of certain foreclosed mortgage loans held by creditors that are either fully or partially guaranteed under government programs. The ASU requires that a mortgage loan be derecognized and that a separate other receivable be recognized upon foreclosure if the following conditions are met: (1) the loan has a government guarantee that is not separable from the loan before foreclosure; (2) at the time of foreclosure, the creditor has the intent to convey the real estate property to the guarantor and make a claim on the guarantee, and the creditor has the ability to recover under that claim; (3) at the time of foreclosure, any amount of the claim that is determined on the basis of the fair value of the real estate is fixed. The separate other receivable should be measured based on the amount of the loan balance expected to be recovered from the guarantor. The amendments are effective for annual and interim reporting periods beginning on or after December 15, 2014 and can be applied with a modified retrospective transition method or prospectively. The adoption of ASU 2014-14 is not expected to have a material impact on the Company's consolidated financial statements.
127
2014 Acquisition Activity
On March 1, 2015, the Company completed its acquisition of Simplicity Bancorp, Inc., a Maryland corporation (“Simplicity”) and Simplicity’s wholly owned subsidiary, Simplicity Bank. Simplicity’s principal business activities prior to the merger were attracting retail deposits from the general public, originating or purchasing loans, primarily loans secured by first mortgages on owner-occupied, one-to-four family residences and multi-family residences located in Southern California and, to a lesser extent, commercial real estate, automobile and other consumer loans; and mortgage banking consisting mostly of the origination and sale of fixed-rate, conforming, one-to-four family residential real estate loans in the secondary market, usually with servicing retained. The primary objective for this acquisition is to grow our Commercial and Consumer Banking segment by expanding the business of the former Simplicity branches by offering additional banking and lending products to former Simplicity customers as well as new customers. The acquisition was accomplished by the merger of Simplicity with and into HomeStreet, Inc. with HomeStreet, Inc. as the surviving corporation, followed by the merger of Simplicity Bank with and into HomeStreet Bank with HomeStreet Bank as the surviving subsidiary. The results of operations of Simplicity will be included in the consolidated results of operations from the date of acquisition.
At the closing, there were
7,180,005
shares of Simplicity common stock, par value $0.01, outstanding, all of which were cancelled and exchanged for an equal number of shares of HomeStreet common stock, no par value, issued to Simplicity’s stockholders. In connection with the merger, all outstanding options to purchase Simplicity common stock were cancelled in exchange for a cash payment equal to the difference between a calculated price of HomeStreet common stock and the exercise price of the option, provided, however, that any options that were out-of-the-money at the time of closing were cancelled for no consideration. The calculated price of
$17.53
was determined by averaging the closing price of HomeStreet common stock for the 10 trading days prior to but not including the 5th business day before the closing date. Simplicity paid cash to holders of Simplicity common stock and restricted stock in lieu of fractional shares of HomeStreet common stock. The cash was funded by cash on hand.
At
December 31, 2014
, Simplicity had assets of approximately
$863 million
, loans of
$683 million
and deposits of
$656 million
. The transaction will be accounted for under the purchase acquisition method of accounting and accordingly, assets acquired, liabilities assumed and consideration exchanged will be recorded at estimated fair value on the acquisition date.
Because the merger occurred on March 1, 2015, the initial accounting for the business combination is incomplete as of the filing date of this Form 10-K. HomeStreet is in the process of determining the fair values which are subject to refinement for up to one year after the closing date of the acquisition.
2013 Acquisitions
On December 6, 2013, the Company acquired two retail deposit branches and some related assets from AmericanWest Bank, a Washington state-chartered bank. The branches are located on Bainbridge Island and in West Seattle. Deposits with face value of
$32.0 million
were acquired for a premium of
$804 thousand
.
On November 1, 2013, the Company completed its acquisition of Fortune Bank (“Fortune”) and YNB Financial Services Corp. (“YNB”), the parent of Yakima National Bank. The Company acquired all of the voting equity interests of Fortune Bank and YNB in exchange for cash consideration. Immediately following completion of the acquisitions, YNB was merged into HomeStreet, Inc. Additionally, Fortune Bank and Yakima National Bank were merged into HomeStreet Bank.
The primary objective for the acquisitions was to grow the Company’s Commercial and Consumer Banking business. Additionally, the acquisition of Yakima National Bank expanded the Company's geographic footprint, consistent with the Company's ongoing growth strategy.
The assets acquired and liabilities assumed in the acquisitions described above have been accounted for under the acquisition method of accounting. The assets and liabilities, both tangible and intangible, were recorded at their estimated fair values as of the acquisition date.
The application of the acquisition method of accounting resulted, in the aggregate, in the recognition of goodwill of
$11.5 million
and core deposit intangible assets of
$3.5 million
. The goodwill represented the excess purchase price over the estimated fair value of the net assets acquired. The goodwill is not deductible for income tax purposes. All of the goodwill was assigned to the Commercial and Consumer Banking business segment. The acquired core deposit intangibles in the aggregate were determined to have a weighted-average useful life of approximately
6.4 years
and are amortized on an accelerated basis.
128
The table below summarizes the aggregate amount recognized for each major class of assets acquired and liabilities assumed in the acquisitions of Fortune and YNB on November 1, 2013 and in the acquisition of two retail deposit branches from AmericanWest Bank on December 6, 2013:
|
(in thousands)
|
November 1, 2013
and
December 6, 2013
|
|||
|
Purchase price
(1)
|
$
|
36,890
|
|
|
|
Recognized amounts of identifiable assets acquired and (liabilities assumed), at fair value:
|
||||
|
Cash and cash equivalents
|
60,861
|
|
||
|
Investment securities
|
1,241
|
|
||
|
Acquired loans
|
206,737
|
|
||
|
Other real estate owned
|
740
|
|
||
|
Federal Home Loan Bank stock, at cost
|
240
|
|
||
|
Premises and equipment, net
|
2,416
|
|
||
|
Core deposit intangibles
|
3,455
|
|
||
|
Accounts receivable and other assets
|
15,006
|
|
||
|
Deposits
|
(261,116
|
)
|
||
|
Accounts payable and accrued expenses
|
(1,257
|
)
|
||
|
Long-term debt
|
(2,954
|
)
|
||
|
Total fair value of identifiable net assets
|
25,369
|
|
||
|
Goodwill
|
$
|
11,521
|
|
|
|
(1)
|
The purchase price represents the total amount of cash consideration transferred.
|
The operating results of the Company include the operating results produced by the acquired assets and assumed liabilities for the period November 1, 2013 to December 31, 2013 for the acquired banks and for the period December 6, 2013 to December 31, 2013 for the two retail deposit branches acquired from AmericanWest Bank.
In connection with the aforementioned 2013 acquisitions, HomeStreet recognized acquisition-related expenses of
$2.2 million
and
$4.5 million
for the years ended December 31, 2014 and 2013, respectively, as follows:
|
Year Ended December 31,
|
||||||||
|
(in thousands)
|
2014
|
2013
|
||||||
|
Acquisition-related costs recognized in noninterest expense:
|
||||||||
|
Salaries and related costs
|
$
|
459
|
|
$
|
864
|
|
||
|
General and administrative
|
427
|
|
206
|
|
||||
|
Legal
|
248
|
|
407
|
|
||||
|
Consulting
|
791
|
|
3,007
|
|
||||
|
Federal Deposit Insurance Corporation assessments
|
—
|
|
15
|
|
||||
|
Occupancy
|
11
|
|
2
|
|
||||
|
Information services
|
230
|
|
48
|
|
||||
|
$
|
2,166
|
|
$
|
4,549
|
|
|||
129
The table below details the estimated aggregate amount of contractually required payments, contractual cash flows not expected to be collected and cash flows expected to be collected as of the acquisition date on loans acquired in connection with the acquisitions of Fortune and YNB on November 1, 2013 and for the two retail deposit branches acquired from AmericanWest Bank on December 6, 2013:
|
(in thousands)
|
Year Ended December 31, 2013
|
|||
|
Contractually required repayments including interest
(1)
|
$
|
265,215
|
|
|
|
Less: Contractual cash flows not expected to be collected
|
(4,646
|
)
|
||
|
Cash flows expected to be collected
|
$
|
260,569
|
|
|
|
(1)
|
Denotes required payments based on a loan's current contractual rate and contractual schedule, assuming no loss or prepayment.
|
HomeStreet, Inc., as a unitary savings and loan holding company, is not subject to minimum regulatory capital requirements. However, the Bank is subject to various regulatory capital requirements administered by the federal banking agencies. Failure to meet minimum capital requirements could initiate certain mandatory and possibly additional discretionary actions by the regulators that, if undertaken, could have a direct material effect on the Bank’s financial statements. Under capital adequacy guidelines and the regulatory framework for prompt corrective action, the Bank must meet specific capital guidelines that involve quantitative measures of the Bank’s assets, liabilities, and certain off-balance sheet items as calculated under regulatory accounting practices. The Bank’s capital amounts and classification are also subject to qualitative judgments by the regulators about components, risk weightings, and other factors.
Quantitative measures established by regulation to ensure capital adequacy require the Bank to maintain minimum amounts and ratios of Total and Tier 1 capital (as defined in the regulations) to risk-weighted assets (as defined in the regulations) and of Tier 1 capital to average assets (as defined in the regulations). The regulators also have the ability to impose elevated capital requirements in certain circumstances. At
December 31, 2014
the Bank's capital ratios meet the regulatory capital category of “well capitalized” as defined by the FDIC's prompt corrective action rules.
The Bank’s actual capital amounts and ratios are included in the following table:
|
At December 31, 2014
|
||||||||||||||||||||
|
Actual
|
For Minimum Capital
Adequacy Purposes
|
To Be Categorized As
“Well Capitalized” Under
Prompt Corrective
Action Provisions
|
||||||||||||||||||
|
(in thousands)
|
Amount
|
Ratio
|
Amount
|
Ratio
|
Amount
|
Ratio
|
||||||||||||||
|
Tier 1 leverage capital
(to average assets) |
$
|
319,010
|
|
9.38
|
%
|
$
|
136,058
|
|
4.0
|
%
|
$
|
170,072
|
|
5.0
|
%
|
|||||
|
Tier 1 risk-based capital
(to risk-weighted assets)
|
319,010
|
|
13.10
|
|
97,404
|
|
4.0
|
|
146,106
|
|
6.0
|
|
||||||||
|
Total risk-based capital
(to risk-weighted assets) |
341,534
|
|
14.03
|
|
194,808
|
|
8.0
|
|
243,511
|
|
10.0
|
|
||||||||
130
|
At December 31, 2013
|
||||||||||||||||||||
|
Actual
|
For Minimum Capital
Adequacy Purposes
|
To Be Categorized As
“Well Capitalized” Under
Prompt Corrective
Action Provisions
|
||||||||||||||||||
|
(in thousands)
|
Amount
|
Ratio
|
Amount
|
Ratio
|
Amount
|
Ratio
|
||||||||||||||
|
Tier 1 leverage capital
(to average assets) |
$
|
291,673
|
|
9.96
|
%
|
$
|
117,182
|
|
4.0
|
%
|
$
|
146,478
|
|
5.0
|
%
|
|||||
|
Tier 1 risk-based capital
(to risk-weighted assets)
|
291,673
|
|
14.12
|
|
81,708
|
|
4.0
|
|
122,562
|
|
6.0
|
|
||||||||
|
Total risk-based capital
(to risk-weighted assets) |
315,762
|
|
15.28
|
|
163,415
|
|
8.0
|
|
204,269
|
|
10.0
|
|
||||||||
At periodic intervals, the FDIC and the WDFI routinely examine the Bank’s financial statements as part of their legally prescribed oversight of the banking industry. Based on their examinations, these regulators can direct that the Bank’s financial statements be adjusted in accordance with their findings.
The following table sets forth certain information regarding the amortized cost and fair values of our investment securities available for sale.
|
At December 31, 2014
|
|||||||||||||||
|
(in thousands)
|
Amortized
cost
|
Gross
unrealized
gains
|
Gross
unrealized
losses
|
Fair
value
|
|||||||||||
|
Mortgage-backed securities:
|
|||||||||||||||
|
Residential
|
$
|
107,624
|
|
$
|
509
|
|
$
|
(853
|
)
|
$
|
107,280
|
|
|||
|
Commercial
|
13,030
|
|
641
|
|
—
|
|
13,671
|
|
|||||||
|
Municipal bonds
|
119,744
|
|
2,847
|
|
(257
|
)
|
122,334
|
|
|||||||
|
Collateralized mortgage obligations:
|
|||||||||||||||
|
Residential
|
44,254
|
|
161
|
|
(1,249
|
)
|
43,166
|
|
|||||||
|
Commercial
|
20,775
|
|
—
|
|
(289
|
)
|
20,486
|
|
|||||||
|
Corporate debt securities
|
80,214
|
|
296
|
|
(1,110
|
)
|
79,400
|
|
|||||||
|
U.S. Treasury securities
|
40,976
|
|
13
|
|
—
|
|
40,989
|
|
|||||||
|
$
|
426,617
|
|
$
|
4,467
|
|
$
|
(3,758
|
)
|
$
|
427,326
|
|
||||
131
|
At December 31, 2013
|
|||||||||||||||
|
(in thousands)
|
Amortized
cost
|
Gross
unrealized
gains
|
Gross
unrealized
losses
|
Fair
value
|
|||||||||||
|
Mortgage-backed securities:
|
|||||||||||||||
|
Residential
|
$
|
137,602
|
|
$
|
187
|
|
$
|
(3,879
|
)
|
$
|
133,910
|
|
|||
|
Commercial
|
13,391
|
|
45
|
|
(3
|
)
|
13,433
|
|
|||||||
|
Municipal bonds
|
136,937
|
|
185
|
|
(6,272
|
)
|
130,850
|
|
|||||||
|
Collateralized mortgage obligations:
|
|||||||||||||||
|
Residential
|
93,112
|
|
85
|
|
(2,870
|
)
|
90,327
|
|
|||||||
|
Commercial
|
17,333
|
|
—
|
|
(488
|
)
|
16,845
|
|
|||||||
|
Corporate debt securities
|
75,542
|
|
—
|
|
(6,676
|
)
|
68,866
|
|
|||||||
|
U.S. Treasury securities
|
27,478
|
|
1
|
|
(27
|
)
|
27,452
|
|
|||||||
|
$
|
501,395
|
|
$
|
503
|
|
$
|
(20,215
|
)
|
$
|
481,683
|
|
||||
Mortgage-backed securities ("MBS") and collateralized mortgage obligations ("CMO") represent securities issued by government sponsored entities ("GSEs"). Each of the MBS and CMO securities in our investment portfolio are guaranteed by Fannie Mae, Ginnie Mae or Freddie Mac. Municipal bonds are comprised of general obligation bonds (i.e., backed by the general credit of the issuer) and revenue bonds (i.e., backed by revenues from the specific project being financed) issued by various municipal corporations. As of
December 31, 2014
and
2013
, all securities held, including municipal bonds and corporate debt securities, were rated investment grade based upon external ratings where available and, where not available, based upon internal ratings which correspond to ratings as defined by Standard and Poor’s Rating Services (“S&P”) or Moody’s Investors Services (“Moody’s”). As of
December 31, 2014
and
2013
, substantially all securities held had ratings available by external ratings agencies.
Investment securities available for sale that were in an unrealized loss position are presented in the following tables based on the length of time the individual securities have been in an unrealized loss position.
|
At December 31, 2014
|
|||||||||||||||||||||||
|
|
Less than 12 months
|
12 months or more
|
Total
|
||||||||||||||||||||
|
(in thousands)
|
Gross
unrealized
losses
|
Fair
value
|
Gross
unrealized
losses
|
Fair
value
|
Gross
unrealized
losses
|
Fair
value
|
|||||||||||||||||
|
Mortgage-backed securities:
|
|||||||||||||||||||||||
|
Residential
|
$
|
—
|
|
$
|
—
|
|
$
|
(853
|
)
|
$
|
57,242
|
|
$
|
(853
|
)
|
$
|
57,242
|
|
|||||
|
Commercial
|
—
|
|
—
|
|
—
|
|
—
|
|
—
|
|
—
|
|
|||||||||||
|
Municipal bonds
|
(11
|
)
|
2,339
|
|
(246
|
)
|
17,155
|
|
(257
|
)
|
19,494
|
|
|||||||||||
|
Collateralized mortgage obligations:
|
|||||||||||||||||||||||
|
Residential
|
—
|
|
—
|
|
(1,249
|
)
|
31,021
|
|
(1,249
|
)
|
31,021
|
|
|||||||||||
|
Commercial
|
(29
|
)
|
5,037
|
|
(260
|
)
|
15,449
|
|
(289
|
)
|
20,486
|
|
|||||||||||
|
Corporate debt securities
|
(56
|
)
|
13,140
|
|
(1,054
|
)
|
40,997
|
|
(1,110
|
)
|
54,137
|
|
|||||||||||
|
U.S. Treasury securities
|
—
|
|
—
|
|
—
|
|
—
|
|
—
|
|
—
|
|
|||||||||||
|
$
|
(96
|
)
|
$
|
20,516
|
|
$
|
(3,662
|
)
|
$
|
161,864
|
|
$
|
(3,758
|
)
|
$
|
182,380
|
|
||||||
132
|
At December 31, 2013
|
|||||||||||||||||||||||
|
|
Less than 12 months
|
12 months or more
|
Total
|
||||||||||||||||||||
|
(in thousands)
|
Gross
unrealized
losses
|
Fair
value
|
Gross
unrealized
losses
|
Fair
value
|
Gross
unrealized
losses
|
Fair
value
|
|||||||||||||||||
|
Mortgage-backed securities:
|
|||||||||||||||||||||||
|
Residential
|
$
|
(3,767
|
)
|
$
|
98,717
|
|
$
|
(112
|
)
|
$
|
6,728
|
|
$
|
(3,879
|
)
|
$
|
105,445
|
|
|||||
|
Commercial
|
(3
|
)
|
7,661
|
|
—
|
|
—
|
|
(3
|
)
|
7,661
|
|
|||||||||||
|
Municipal bonds
|
(5,991
|
)
|
106,985
|
|
(281
|
)
|
3,490
|
|
(6,272
|
)
|
110,475
|
|
|||||||||||
|
Collateralized mortgage obligations:
|
|
|
|
|
|||||||||||||||||||
|
Residential
|
(2,120
|
)
|
63,738
|
|
(750
|
)
|
15,081
|
|
(2,870
|
)
|
78,819
|
|
|||||||||||
|
Commercial
|
(488
|
)
|
16,845
|
|
—
|
|
—
|
|
(488
|
)
|
16,845
|
|
|||||||||||
|
Corporate debt securities
|
(6,676
|
)
|
68,844
|
|
—
|
|
—
|
|
(6,676
|
)
|
68,844
|
|
|||||||||||
|
U.S. Treasury securities
|
(27
|
)
|
25,452
|
|
—
|
|
—
|
|
(27
|
)
|
25,452
|
|
|||||||||||
|
$
|
(19,072
|
)
|
$
|
388,242
|
|
$
|
(1,143
|
)
|
$
|
25,299
|
|
$
|
(20,215
|
)
|
$
|
413,541
|
|
||||||
The Company has evaluated securities available for sale that are in an unrealized loss position and has determined that the decline in value is temporary and is related to the change in market interest rates since purchase. The decline in value is not related to any issuer- or industry-specific credit event. As of
December 31, 2014
and
2013
, the Company does not expect any credit losses in its debt securities. In addition, as of
December 31, 2014
and
2013
, the Company had not made a decision to sell any of its debt securities held, nor did the Company consider it more likely than not that it would be required to sell such securities before recovery of their amortized cost basis. The Company did not hold any marketable equity securities as of
December 31, 2014
and
2013
.
The following tables present the fair value of investment securities available for sale by contractual maturity along with the associated contractual yield for the periods indicated below. Contractual maturities for mortgage-backed securities and collateralized mortgage obligations as presented exclude the effect of expected prepayments. Expected maturities will differ from contractual maturities because borrowers may have the right to prepay obligations before the underlying mortgages mature. The weighted-average yield is computed using the contractual coupon of each security weighted based on the fair value of each security and does not include adjustments to a tax equivalent basis.
|
|
At December 31, 2014
|
|||||||||||||||||||||||||||||||||
|
|
Within one year
|
After one year
through five years
|
After five years
through ten years
|
After ten years
|
Total
|
|||||||||||||||||||||||||||||
|
(in thousands)
|
Fair
Value
|
Weighted
Average
Yield
|
Fair
Value
|
Weighted
Average
Yield
|
Fair
Value
|
Weighted
Average
Yield
|
Fair
Value
|
Weighted
Average
Yield
|
Fair
Value
|
Weighted
Average
Yield
|
||||||||||||||||||||||||
|
Mortgage-backed securities:
|
||||||||||||||||||||||||||||||||||
|
Residential
|
$
|
—
|
|
—
|
%
|
$
|
—
|
|
—
|
%
|
$
|
6,949
|
|
1.72
|
%
|
$
|
100,331
|
|
1.75
|
%
|
$
|
107,280
|
|
1.75
|
%
|
|||||||||
|
Commercial
|
—
|
|
—
|
|
—
|
|
—
|
|
—
|
|
—
|
|
13,671
|
|
4.75
|
|
13,671
|
|
4.75
|
|
||||||||||||||
|
Municipal bonds
|
—
|
|
—
|
|
604
|
|
4.10
|
|
23,465
|
|
3.55
|
|
98,265
|
|
4.21
|
|
122,334
|
|
4.09
|
|
||||||||||||||
|
Collateralized mortgage obligations:
|
||||||||||||||||||||||||||||||||||
|
Residential
|
—
|
|
—
|
|
—
|
|
—
|
|
—
|
|
—
|
|
43,166
|
|
1.84
|
|
43,166
|
|
1.84
|
|
||||||||||||||
|
Commercial
|
—
|
|
—
|
|
—
|
|
—
|
|
9,776
|
|
1.96
|
|
10,710
|
|
1.99
|
|
20,486
|
|
1.97
|
|
||||||||||||||
|
Corporate debt securities
|
—
|
|
—
|
|
9,000
|
|
2.21
|
|
38,487
|
|
3.35
|
|
31,913
|
|
3.73
|
|
79,400
|
|
3.37
|
|
||||||||||||||
|
U.S. Treasury securities
|
25,998
|
|
0.28
|
|
14,991
|
|
0.46
|
|
—
|
|
—
|
|
—
|
|
—
|
|
40,989
|
|
0.35
|
|
||||||||||||||
|
Total available for sale
|
$
|
25,998
|
|
0.28
|
%
|
$
|
24,595
|
|
1.19
|
%
|
$
|
78,677
|
|
3.09
|
%
|
$
|
298,056
|
|
2.92
|
%
|
$
|
427,326
|
|
2.69
|
%
|
|||||||||
133
|
|
At December 31, 2013
|
|||||||||||||||||||||||||||||||||
|
|
Within one year
|
After one year
through five years
|
After five years
through ten years
|
After ten years
|
Total
|
|||||||||||||||||||||||||||||
|
(in thousands)
|
Fair
Value
|
Weighted
Average
Yield
|
Fair
Value
|
Weighted
Average
Yield
|
Fair
Value
|
Weighted
Average
Yield
|
Fair
Value
|
Weighted
Average
Yield
|
Fair
Value
|
Weighted
Average
Yield
|
||||||||||||||||||||||||
|
Mortgage-backed securities:
|
||||||||||||||||||||||||||||||||||
|
Residential
|
$
|
—
|
|
—
|
%
|
$
|
—
|
|
—
|
%
|
$
|
10,581
|
|
1.63
|
%
|
$
|
123,329
|
|
1.82
|
%
|
$
|
133,910
|
|
1.81
|
%
|
|||||||||
|
Commercial
|
—
|
|
—
|
|
$
|
—
|
|
—
|
|
—
|
|
—
|
|
13,433
|
|
4.51
|
|
13,433
|
|
4.51
|
|
|||||||||||||
|
Municipal bonds
|
—
|
|
—
|
|
—
|
|
—
|
|
19,598
|
|
3.51
|
|
111,252
|
|
4.29
|
|
130,850
|
|
4.17
|
|
||||||||||||||
|
Collateralized mortgage obligations:
|
||||||||||||||||||||||||||||||||||
|
Residential
|
—
|
|
—
|
|
—
|
|
—
|
|
19,987
|
|
2.31
|
|
70,340
|
|
2.17
|
|
90,327
|
|
2.20
|
|
||||||||||||||
|
Commercial
|
—
|
|
—
|
|
—
|
|
—
|
|
5,270
|
|
1.90
|
|
11,575
|
|
1.42
|
|
16,845
|
|
1.57
|
|
||||||||||||||
|
Corporate debt securities
|
—
|
|
—
|
|
—
|
|
—
|
|
32,848
|
|
3.31
|
|
36,018
|
|
3.75
|
|
68,866
|
|
3.54
|
|
||||||||||||||
|
U.S. Treasury securities
|
1,001
|
|
0.18
|
|
26,451
|
|
0.30
|
|
—
|
|
—
|
|
—
|
|
—
|
|
27,452
|
|
0.29
|
|
||||||||||||||
|
Total available for sale
|
$
|
1,001
|
|
0.18
|
%
|
$
|
26,451
|
|
0.30
|
%
|
$
|
88,284
|
|
2.84
|
%
|
$
|
365,947
|
|
2.92
|
%
|
$
|
481,683
|
|
2.75
|
%
|
|||||||||
Sales of investment securities available for sale were as follows.
|
|
Year Ended December 31,
|
||||||||||
|
(in thousands)
|
2014
|
2013
|
2012
|
||||||||
|
Proceeds
|
$
|
96,154
|
|
$
|
127,648
|
|
$
|
166,187
|
|
||
|
Gross gains
|
2,560
|
|
2,089
|
|
1,921
|
|
|||||
|
Gross losses
|
(201
|
)
|
(315
|
)
|
(431
|
)
|
|||||
There were
$44.3 million
and
$47.3 million
in investment securities pledged to secure advances from the FHLB at December 31,
2014
and December 31,
2013
. At December 31,
2014
and
2013
, there were
$33.4 million
and
$37.7 million
, respectively, of securities pledged to secure derivatives in a liability position.
Tax-exempt interest income on securities available for sale totaling
$3.4 million
,
$4.0 million
, and
$4.3 million
for the years ended December 31,
2014
,
2013
, and
2012
, respectively, were recorded in the Company’s consolidated statements of operations.
For a detailed discussion of loans and credit quality, including accounting policies and the methodology used to estimate the allowance for credit losses, see Note 1,
Summary of Significant Accounting Policies.
The Company's portfolio of loans held for investment is divided into two portfolio segments, consumer loans and commercial loans, which are the same segments used to determine the allowance for loan losses. Within each portfolio segment, the Company monitors and assesses credit risk based on the risk characteristics of each of the following loan classes: single family and home equity loans within the consumer loan portfolio segment and commercial real estate, multifamily, construction/land development and commercial business loans within the commercial loan portfolio segment.
134
Loans held for investment consist of the following:
|
|
At December 31,
|
||||||
|
(in thousands)
|
2014
|
2013
|
|||||
|
Consumer loans
|
|||||||
|
Single family
|
$
|
896,665
|
|
$
|
904,913
|
|
|
|
Home equity
|
135,598
|
|
135,650
|
|
|||
|
1,032,263
|
|
1,040,563
|
|
||||
|
Commercial loans
|
|||||||
|
Commercial real estate
|
523,464
|
|
477,642
|
|
|||
|
Multifamily
|
55,088
|
|
79,216
|
|
|||
|
Construction/land development
|
367,934
|
|
130,465
|
|
|||
|
Commercial business
|
147,449
|
|
171,054
|
|
|||
|
1,093,935
|
|
858,377
|
|
||||
|
2,126,198
|
|
1,898,940
|
|
||||
|
Net deferred loan fees, costs and discounts
|
(5,048
|
)
|
(3,219
|
)
|
|||
|
2,121,150
|
|
1,895,721
|
|
||||
|
Allowance for loan losses
|
(22,021
|
)
|
(23,908
|
)
|
|||
|
$
|
2,099,129
|
|
$
|
1,871,813
|
|
||
Loans in the amount of
$1.06 billion
and
$800.5 million
at
December 31, 2014
and
2013
, respectively, were pledged to secure borrowings from the FHLB as part of our liquidity management strategy. The FHLB does not have the right to sell or re-pledge these loans.
It is the Company’s policy to make loans to officers, directors, and their associates in the ordinary course of business on substantially the same terms as those prevailing at the time for comparable transactions with other persons. The following is a summary of activity during the years ended
December 31, 2014
and
2013
with respect to such aggregate loans to these related parties and their associates:
|
|
Year Ended December 31,
|
||||||
|
(in thousands)
|
2014
|
2013
|
|||||
|
Beginning balance, January 1
|
$
|
9,738
|
|
$
|
11,763
|
|
|
|
New loans
|
—
|
|
2,178
|
|
|||
|
Principal repayments and advances, net
|
(4,238
|
)
|
(4,203
|
)
|
|||
|
Ending balance, December 31
|
$
|
5,500
|
|
$
|
9,738
|
|
|
Credit Risk Concentrations
Concentrations of credit risk arise when a number of customers are engaged in similar business activities or activities in the same geographic region, or when they have similar economic features that would cause their ability to meet contractual obligations to be similarly affected by changes in economic conditions.
Loans held for investment are primarily secured by real estate located in the Pacific Northwest, California and Hawaii. At
December 31, 2014
we had concentrations representing
10%
or more of the total portfolio by state and property type for the loan classes of single family, commercial real estate and construction/land development within the state of Washington, which represented
28.0%
,
20.7%
and
13.7%
of the total portfolio, respectively. At
December 31, 2013
we had concentrations representing
10%
or more of the total portfolio by state and property type for the loan classes of single family and commercial real estate within the state of Washington, which represented
37.3%
and
21.2%
of the total portfolio, respectively. These loans were mostly located within the metropolitan area of Puget Sound, particularly within King County.
135
Credit Quality
Management considers the level of allowance for loan losses to be appropriate to cover credit losses inherent within the loans held for investment portfolio as of
December 31, 2014
. In addition to the allowance for loan losses, the Company maintains a separate allowance for losses related to unfunded loan commitments, and this amount is included in accounts payable and other liabilities on the consolidated statements of financial condition. Collectively, these allowances are referred to as the allowance for credit losses.
For further information on the policies that govern the determination of the allowance for loan losses levels, see Note 1,
Summary of Significant Accounting Policies.
Activity in the allowance for credit losses was as follows.
|
|
Year Ended December 31,
|
||||||||||
|
(in thousands)
|
2014
|
2013
|
2012
|
||||||||
|
Allowance for credit losses (roll-forward):
|
|||||||||||
|
Beginning balance
|
$
|
24,089
|
|
$
|
27,751
|
|
$
|
42,800
|
|
||
|
Provision for credit losses
|
(1,000
|
)
|
900
|
|
11,500
|
|
|||||
|
(Charge-offs), net of recoveries
|
(565
|
)
|
(4,562
|
)
|
(26,549
|
)
|
|||||
|
Ending balance
|
$
|
22,524
|
|
$
|
24,089
|
|
$
|
27,751
|
|
||
|
Components:
|
|||||||||||
|
Allowance for loan losses
|
$
|
22,021
|
|
$
|
23,908
|
|
$
|
27,561
|
|
||
|
Allowance for unfunded commitments
|
503
|
|
181
|
|
190
|
|
|||||
|
Allowance for credit losses
|
$
|
22,524
|
|
$
|
24,089
|
|
$
|
27,751
|
|
||
Activity in the allowance for credit losses by loan portfolio and loan class was as follows.
|
Year Ended December 31, 2014
|
|||||||||||||||||||
|
(in thousands)
|
Beginning
balance
|
Charge-offs
|
Recoveries
|
Provision
|
Ending
balance
|
||||||||||||||
|
Consumer loans
|
|||||||||||||||||||
|
Single family
|
$
|
11,990
|
|
$
|
(907
|
)
|
$
|
139
|
|
$
|
(1,775
|
)
|
$
|
9,447
|
|
||||
|
Home equity
|
3,987
|
|
(953
|
)
|
566
|
|
(278
|
)
|
3,322
|
|
|||||||||
|
15,977
|
|
(1,860
|
)
|
705
|
|
(2,053
|
)
|
12,769
|
|
||||||||||
|
Commercial loans
|
|||||||||||||||||||
|
Commercial real estate
|
4,012
|
|
(52
|
)
|
493
|
|
(607
|
)
|
3,846
|
|
|||||||||
|
Multifamily
|
942
|
|
—
|
|
—
|
|
(269
|
)
|
673
|
|
|||||||||
|
Construction/land development
|
1,414
|
|
—
|
|
516
|
|
1,888
|
|
3,818
|
|
|||||||||
|
Commercial business
|
1,744
|
|
(596
|
)
|
229
|
|
41
|
|
1,418
|
|
|||||||||
|
8,112
|
|
(648
|
)
|
1,238
|
|
1,053
|
|
9,755
|
|
||||||||||
|
Total allowance for credit losses
|
$
|
24,089
|
|
$
|
(2,508
|
)
|
$
|
1,943
|
|
$
|
(1,000
|
)
|
$
|
22,524
|
|
||||
136
|
Year Ended December 31, 2013
|
|||||||||||||||||||
|
(in thousands)
|
Beginning
balance
|
Charge-offs
|
Recoveries
|
Provision
|
Ending
balance
|
||||||||||||||
|
Consumer loans
|
|||||||||||||||||||
|
Single family
|
$
|
13,388
|
|
$
|
(2,967
|
)
|
$
|
536
|
|
$
|
1,033
|
|
$
|
11,990
|
|
||||
|
Home equity
|
4,648
|
|
(1,960
|
)
|
583
|
|
716
|
|
3,987
|
|
|||||||||
|
18,036
|
|
(4,927
|
)
|
1,119
|
|
1,749
|
|
15,977
|
|
||||||||||
|
Commercial loans
|
|||||||||||||||||||
|
Commercial real estate
|
5,312
|
|
(1,448
|
)
|
134
|
|
14
|
|
4,012
|
|
|||||||||
|
Multifamily
|
622
|
|
—
|
|
—
|
|
320
|
|
942
|
|
|||||||||
|
Construction/land development
|
1,580
|
|
(458
|
)
|
767
|
|
(475
|
)
|
1,414
|
|
|||||||||
|
Commercial business
|
2,201
|
|
(21
|
)
|
272
|
|
(708
|
)
|
1,744
|
|
|||||||||
|
9,715
|
|
(1,927
|
)
|
1,173
|
|
(849
|
)
|
8,112
|
|
||||||||||
|
Total allowance for credit losses
|
$
|
27,751
|
|
$
|
(6,854
|
)
|
$
|
2,292
|
|
$
|
900
|
|
$
|
24,089
|
|
||||
The following table disaggregates our allowance for credit losses and recorded investment in loans by impairment methodology.
|
At December 31, 2014
|
|||||||||||||||||||||||
|
(in thousands)
|
Allowance: collectively
evaluated for
impairment
|
Allowance: individually
evaluated for
impairment
|
Total
|
Loans:
collectively
evaluated for
impairment
|
Loans:
individually
evaluated for
impairment
|
Total
|
|||||||||||||||||
|
Consumer loans
|
|||||||||||||||||||||||
|
Single family
|
$
|
8,743
|
|
$
|
704
|
|
$
|
9,447
|
|
$
|
818,783
|
|
$
|
77,882
|
|
$
|
896,665
|
|
|||||
|
Home equity
|
3,165
|
|
157
|
|
3,322
|
|
132,937
|
|
2,661
|
|
135,598
|
|
|||||||||||
|
11,908
|
|
861
|
|
12,769
|
|
951,720
|
|
80,543
|
|
1,032,263
|
|
||||||||||||
|
Commercial loans
|
|||||||||||||||||||||||
|
Commercial real estate
|
3,806
|
|
40
|
|
3,846
|
|
496,685
|
|
26,779
|
|
523,464
|
|
|||||||||||
|
Multifamily
|
312
|
|
361
|
|
673
|
|
52,011
|
|
3,077
|
|
55,088
|
|
|||||||||||
|
Construction/land development
|
3,818
|
|
—
|
|
3,818
|
|
362,487
|
|
5,447
|
|
367,934
|
|
|||||||||||
|
Commercial business
|
974
|
|
444
|
|
1,418
|
|
144,071
|
|
3,378
|
|
147,449
|
|
|||||||||||
|
8,910
|
|
845
|
|
9,755
|
|
1,055,254
|
|
38,681
|
|
1,093,935
|
|
||||||||||||
|
Total
|
$
|
20,818
|
|
$
|
1,706
|
|
$
|
22,524
|
|
$
|
2,006,974
|
|
$
|
119,224
|
|
$
|
2,126,198
|
|
|||||
137
|
At December 31, 2013
|
|||||||||||||||||||||||
|
(in thousands)
|
Allowance: collectively
evaluated for
impairment
|
Allowance: individually
evaluated for
impairment
|
Total
|
Loans:
collectively
evaluated for
impairment
|
Loans:
individually
evaluated for
impairment
|
Total
|
|||||||||||||||||
|
Consumer loans
|
|||||||||||||||||||||||
|
Single family
|
$
|
10,632
|
|
$
|
1,358
|
|
$
|
11,990
|
|
$
|
831,730
|
|
$
|
73,183
|
|
$
|
904,913
|
|
|||||
|
Home equity
|
3,903
|
|
84
|
|
3,987
|
|
133,006
|
|
2,644
|
|
135,650
|
|
|||||||||||
|
14,535
|
|
1,442
|
|
15,977
|
|
964,736
|
|
75,827
|
|
1,040,563
|
|
||||||||||||
|
Commercial loans
|
|||||||||||||||||||||||
|
Commercial real estate
|
4,012
|
|
—
|
|
4,012
|
|
445,766
|
|
31,876
|
|
477,642
|
|
|||||||||||
|
Multifamily
|
515
|
|
427
|
|
942
|
|
76,053
|
|
3,163
|
|
79,216
|
|
|||||||||||
|
Construction/land development
|
1,414
|
|
—
|
|
1,414
|
|
124,317
|
|
6,148
|
|
130,465
|
|
|||||||||||
|
Commercial business
|
1,042
|
|
702
|
|
1,744
|
|
168,199
|
|
2,855
|
|
171,054
|
|
|||||||||||
|
6,983
|
|
1,129
|
|
8,112
|
|
814,335
|
|
44,042
|
|
858,377
|
|
||||||||||||
|
Total
|
$
|
21,518
|
|
$
|
2,571
|
|
$
|
24,089
|
|
$
|
1,779,071
|
|
$
|
119,869
|
|
$
|
1,898,940
|
|
|||||
138
Impaired Loans
The following tables present impaired loans by loan portfolio segment and loan class.
|
At December 31, 2014
|
|||||||||||
|
(in thousands)
|
Recorded
investment
(1)
|
Unpaid
principal
balance
(2)
|
Related
allowance
|
||||||||
|
With no related allowance recorded:
|
|||||||||||
|
Consumer loans
|
|||||||||||
|
Single family
|
$
|
48,104
|
|
$
|
50,787
|
|
$
|
—
|
|
||
|
Home equity
|
1,824
|
|
1,850
|
|
—
|
|
|||||
|
49,928
|
|
52,637
|
|
—
|
|
||||||
|
Commercial loans
|
|||||||||||
|
Commercial real estate
|
25,540
|
|
27,205
|
|
—
|
|
|||||
|
Multifamily
|
508
|
|
508
|
|
—
|
|
|||||
|
Construction/land development
|
5,447
|
|
14,532
|
|
—
|
|
|||||
|
Commercial business
|
1,302
|
|
3,782
|
|
—
|
|
|||||
|
32,797
|
|
46,027
|
|
—
|
|
||||||
|
$
|
82,725
|
|
$
|
98,664
|
|
$
|
—
|
|
|||
|
With an allowance recorded:
|
|||||||||||
|
Consumer loans
|
|||||||||||
|
Single family
|
$
|
29,778
|
|
$
|
29,891
|
|
$
|
704
|
|
||
|
Home equity
|
837
|
|
837
|
|
157
|
|
|||||
|
30,615
|
|
30,728
|
|
861
|
|
||||||
|
Commercial loans
|
|||||||||||
|
Commercial real estate
|
1,239
|
|
1,399
|
|
40
|
|
|||||
|
Multifamily
|
2,569
|
|
2,747
|
|
361
|
|
|||||
|
Construction/land development
|
—
|
|
—
|
|
—
|
|
|||||
|
Commercial business
|
2,076
|
|
2,204
|
|
444
|
|
|||||
|
5,884
|
|
6,350
|
|
845
|
|
||||||
|
$
|
36,499
|
|
$
|
37,078
|
|
$
|
1,706
|
|
|||
|
Total:
|
|||||||||||
|
Consumer loans
|
|||||||||||
|
Single family
(3)
|
$
|
77,882
|
|
$
|
80,678
|
|
$
|
704
|
|
||
|
Home equity
|
2,661
|
|
2,687
|
|
157
|
|
|||||
|
80,543
|
|
83,365
|
|
861
|
|
||||||
|
Commercial loans
|
|||||||||||
|
Commercial real estate
|
26,779
|
|
28,604
|
|
40
|
|
|||||
|
Multifamily
|
3,077
|
|
3,255
|
|
361
|
|
|||||
|
Construction/land development
|
5,447
|
|
14,532
|
|
—
|
|
|||||
|
Commercial business
|
3,378
|
|
5,986
|
|
444
|
|
|||||
|
38,681
|
|
52,377
|
|
845
|
|
||||||
|
Total impaired loans
|
$
|
119,224
|
|
$
|
135,742
|
|
$
|
1,706
|
|
||
|
(1)
|
Includes partial charge-offs and nonaccrual interest paid.
|
|
(2)
|
Unpaid principal balance does not includes partial charge-offs or nonaccrual interest paid. Related allowance is calculated on net book balances not unpaid principal balances.
|
|
(3)
|
Includes
$73.6 million
in performing TDRs.
|
139
|
At December 31, 2013
|
|||||||||||
|
(in thousands)
|
Recorded
investment
(1)
|
Unpaid
principal
balance
(2)
|
Related
allowance
|
||||||||
|
With no related allowance recorded:
|
|||||||||||
|
Consumer loans
|
|||||||||||
|
Single family
|
$
|
39,341
|
|
$
|
41,935
|
|
$
|
—
|
|
||
|
Home equity
|
1,895
|
|
1,968
|
|
—
|
|
|||||
|
41,236
|
|
43,903
|
|
—
|
|
||||||
|
Commercial loans
|
|||||||||||
|
Commercial real estate
|
31,876
|
|
45,921
|
|
—
|
|
|||||
|
Multifamily
|
508
|
|
508
|
|
—
|
|
|||||
|
Construction/land development
|
6,148
|
|
15,299
|
|
—
|
|
|||||
|
Commercial business
|
1,533
|
|
7,164
|
|
—
|
|
|||||
|
40,065
|
|
68,892
|
|
—
|
|
||||||
|
$
|
81,301
|
|
$
|
112,795
|
|
$
|
—
|
|
|||
|
With an allowance recorded:
|
|||||||||||
|
Consumer loans
|
|||||||||||
|
Single family
|
$
|
33,842
|
|
$
|
33,900
|
|
$
|
1,358
|
|
||
|
Home equity
|
749
|
|
749
|
|
84
|
|
|||||
|
34,591
|
|
34,649
|
|
1,442
|
|
||||||
|
Commercial loans
|
|||||||||||
|
Commercial real estate
|
—
|
|
—
|
|
—
|
|
|||||
|
Multifamily
|
2,655
|
|
2,832
|
|
427
|
|
|||||
|
Construction/land development
|
—
|
|
—
|
|
—
|
|
|||||
|
Commercial business
|
1,322
|
|
1,478
|
|
702
|
|
|||||
|
3,977
|
|
4,310
|
|
1,129
|
|
||||||
|
$
|
38,568
|
|
$
|
38,959
|
|
$
|
2,571
|
|
|||
|
Total:
|
|||||||||||
|
Consumer loans
|
|||||||||||
|
Single family
(3)
|
$
|
73,183
|
|
$
|
75,835
|
|
$
|
1,358
|
|
||
|
Home equity
|
2,644
|
|
2,717
|
|
84
|
|
|||||
|
75,827
|
|
78,552
|
|
1,442
|
|
||||||
|
Commercial loans
|
|||||||||||
|
Commercial real estate
|
31,876
|
|
45,921
|
|
—
|
|
|||||
|
Multifamily
|
3,163
|
|
3,340
|
|
427
|
|
|||||
|
Construction/land development
|
6,148
|
|
15,299
|
|
—
|
|
|||||
|
Commercial business
|
2,855
|
|
8,642
|
|
702
|
|
|||||
|
44,042
|
|
73,202
|
|
1,129
|
|
||||||
|
Total impaired loans
|
$
|
119,869
|
|
$
|
151,754
|
|
$
|
2,571
|
|
||
|
(1)
|
Includes partial charge-offs and nonaccrual interest paid.
|
|
(2)
|
Unpaid principal balance does not includes partial charge-offs or nonaccrual interest paid. Related allowance is calculated on net book balances not unpaid principal balances.
|
|
(3)
|
Includes
$70.3 million
in performing TDRs.
|
140
The following table provides the average recorded investment in impaired loans by portfolio segment and class.
|
Year Ended December 31,
|
|||||||
|
(in thousands)
|
2014
|
2013
|
|||||
|
Consumer loans
|
|||||||
|
Single family
|
$
|
73,683
|
|
$
|
76,910
|
|
|
|
Home equity
|
2,528
|
|
3,204
|
|
|||
|
76,211
|
|
80,114
|
|
||||
|
Commercial loans
|
|||||||
|
Commercial real estate
|
30,364
|
|
28,595
|
|
|||
|
Multifamily
|
3,112
|
|
3,197
|
|
|||
|
Construction/land development
|
5,723
|
|
8,790
|
|
|||
|
Commercial business
|
3,381
|
|
2,108
|
|
|||
|
42,580
|
|
42,690
|
|
||||
|
$
|
118,791
|
|
$
|
122,804
|
|
||
Credit Quality Indicators
Management regularly reviews loans in the portfolio to assess credit quality indicators and to determine appropriate loan classification and grading in accordance with applicable bank regulations. The Company's risk rating methodology assigns risk ratings ranging from 1 to 10, where a higher rating represents higher risk. The Company differentiates its lending portfolios into homogeneous loans and non-homogeneous loans.
The 10 risk rating categories can be generally described by the following groupings for non-homogeneous loans:
Pass.
We have five pass risk ratings which represent a level of credit quality that ranges from no well-defined deficiency or weakness to some noted weakness, however the risk of default on any loan classified as pass is expected to be remote. The five pass risk ratings are described below:
Minimal Risk
. A minimal risk loan, risk rated 1-Exceptional, is to a borrower of the highest quality. The borrower has an unquestioned ability to produce consistent profits and service all obligations and can absorb severe market disturbances with little or no difficulty.
Low Risk.
A low risk loan, risk rated 2-Superior, is similar in characteristics to a minimal risk loan. Balance sheet and operations are slightly more prone to fluctuations within the business cycle; however, debt capacity and debt service coverage remains strong. The borrower will have a strong demonstrated ability to produce profits and absorb market disturbances.
Modest Risk.
A modest risk loan, risk rated 3-Excellent, is a desirable loan with excellent sources of repayment and no currently identifiable risk associated with collection. The borrower exhibits a very strong capacity to repay the loan in accordance with the repayment agreement. The borrower may be susceptible to economic cycles, but will have cash reserves to weather these cycles.
Average Risk.
An average risk loan, risk rated 4-Good, is an attractive loan with sound sources of repayment and no material collection or repayment weakness evident. The borrower has an acceptable capacity to pay in accordance with the agreement. The borrower is susceptible to economic cycles and more efficient competition, but should have modest reserves sufficient to survive all but the most severe downturns or major setbacks.
Acceptable Risk.
An acceptable risk loan, risk rated 5-Acceptable, is a loan with lower than average, but still acceptable credit risk. These borrowers may have higher leverage, less certain but viable repayment sources, have limited financial reserves and may possess weaknesses that can be adequately mitigated through collateral, structural or credit enhancement. The borrower is susceptible to economic cycles and is less resilient to negative market forces or financial events. Reserves may be insufficient to survive a modest downturn.
141
Watch.
A watch loan, risk rated 6-Watch, is still pass-rated, but represents the lowest level of acceptable risk due to an emerging risk element or declining performance trend. Watch ratings are expected to be temporary, with issues resolved or manifested to the extent that a higher or lower rating would be appropriate. The borrower should have a plausible plan, with reasonable certainty of success, to correct the problems in a short period of time. Borrowers rated watch are characterized by elements of uncertainty, such as:
|
•
|
The borrower may be experiencing declining operating trends, strained cash flows or less-than anticipated performance. Cash flow should still be adequate to cover debt service, and the negative trends should be identified as being of a short-term or temporary nature.
|
|
•
|
The borrower may have experienced a minor, unexpected covenant violation.
|
|
•
|
Companies who may be experiencing tight working capital or have a cash cushion deficiency.
|
|
•
|
A loan may also be a watch if financial information is late, there is a documentation deficiency, the borrower has experienced unexpected management turnover, or if they face industry issues that, when combined with performance factors create uncertainty in their future ability to perform.
|
|
•
|
Delinquent payments, increasing and material overdraft activity, request for bulge and/or out- of-formula advances may be an indicator of inadequate working capital and may suggest a lower rating.
|
|
•
|
Failure of the intended repayment source to materialize as expected, or renewal of a loan (other than cash/marketable security secured or lines of credit) without reduction are possible indicators of a watch or worse risk rating.
|
Special Mention.
A special mention loan, risk rated 7-Special Mention, has potential weaknesses that deserve management’s close attention. If left uncorrected, these potential weaknesses may result in deterioration of the repayment prospects for the loans or the institutions credit position at some future date. They contain unfavorable characteristics and are generally undesirable. Loans in this category are currently protected but are potentially weak and constitute an undue and unwarranted credit risk, but not to the point of a substandard classification. A special mention loan has potential weaknesses, which if not checked or corrected, weaken the loan or inadequately protect the Company’s position at some future date. Such weaknesses include:
|
•
|
Performance is poor or significantly less than expected. There may be a temporary debt-servicing deficiency or inadequate working capital as evidenced by a cash cushion deficiency, but not to the extent that repayment is compromised. Material violation of financial covenants is common.
|
|
•
|
Loans with unresolved material issues that significantly cloud the debt service outlook, even though a debt servicing deficiency does not currently exist.
|
|
•
|
Modest underperformance or deviation from plan for real estate loans where absorption of rental/sales units is necessary to properly service the debt as structured. Depth of support for interest carry provided by owner/guarantors may mitigate and provide for improved rating
|
|
•
|
This rating may be assigned when a loan officer is unable to supervise the credit properly, an inadequate loan agreement, an inability to control collateral, failure to obtain proper documentation, or any other deviation from prudent lending practices.
|
|
•
|
Unlike a substandard credit, there should be a reasonable expectation that these temporary issues will be corrected within the normal course of business, rather than liquidation of assets, and in a reasonable period of time.
|
Substandard.
A substandard loan, risk rated 8-Substandard, is inadequately protected by the current sound worth and paying capacity of the borrower or of the collateral pledged, if any. Loans so classified must have a well-defined weakness or weaknesses that jeopardize the liquidation of the loan. They are characterized by the distinct possibility that the Company will sustain some loss if the deficiencies are not corrected. Loss potential, while existing in the aggregate amount of substandard loans, does not have to exist in individual loans classified substandard. Loans are classified as substandard when they have unsatisfactory characteristics causing unacceptable levels of risk. A substandard loan normally has one or more well-defined weaknesses that could jeopardize repayment of the loan. The likely need to liquidate assets to correct the problem, rather than repayment from successful operations is the key distinction between special mention and substandard. The following are examples of well-defined weaknesses:
|
•
|
Cash flow deficiencies or trends are of a magnitude to jeopardize current and future payments with no immediate relief. A loss is not presently expected, however the outlook is sufficiently uncertain to preclude ruling out the possibility.
|
|
•
|
The borrower has been unable to adjust to prolonged and unfavorable industry or economic trends.
|
142
|
•
|
Material underperformance or deviation from plan for real estate loans where absorption of rental/sales units is necessary to properly service the debt and risk is not mitigated by willingness and capacity of owner/guarantor to support interest payments.
|
|
•
|
Management character or honesty has become suspect. This includes instances where the borrower has become uncooperative.
|
|
•
|
Due to unprofitable or unsuccessful business operations, some form of restructuring of the business, including liquidation of assets, has become the primary source of loan repayment. Cash flow has deteriorated, or been diverted, to the point that sale of collateral is now the Company’s primary source of repayment (unless this was the original source of repayment). If the collateral is under the Company’s control and is cash or other liquid, highly marketable securities and properly margined, then a more appropriate rating might be special mention or watch.
|
|
•
|
The borrower is involved in bankruptcy proceedings where collateral liquidation values are expected to fully protect the Company against loss.
|
|
•
|
There is material, uncorrectable faulty documentation or materially suspect financial information.
|
Doubtful.
Loans classified as doubtful, risk rated 9-Doubtful, have all the weaknesses inherent in one classified substandard with the added characteristic that the weaknesses make collection or liquidation in full, on the basis of currently existing facts, conditions and values, highly questionable and improbable. The possibility of loss is extremely high, but because of certain important and reasonably specific pending factors, which may work towards strengthening of the loan, classification as a loss (and immediate charge-off) is deferred until more exact status may be determined. Pending factors include proposed merger, acquisition, liquidation procedures, capital injection, and perfection of liens on additional collateral and refinancing plans. In certain circumstances, a doubtful rating will be temporary, while the Company is awaiting an updated collateral valuation. In these cases, once the collateral is valued and appropriate margin applied, the remaining un-collateralized portion will be charged-off. The remaining balance, properly margined, may then be upgraded to substandard, however must remain on non-accrual.
Loss.
Loans classified as loss, risk rated 10-Loss, are considered un-collectible and of such little value that the continuance as an active Company asset is not warranted. This rating does not mean that the loan has no recovery or salvage value, but rather that the loan should be charged-off now, even though partial or full recovery may be possible in the future.
Impaired.
Loans are classified as impaired when, based on current information and events, it is probable that the Company will be unable to collect the scheduled payments of principal and interest when due, in accordance with the terms of the original loan agreement, without unreasonable delay. This generally includes all loans classified as non-accrual and troubled debt restructurings. Impaired loans are risk rated for internal and regulatory rating purposes, but presented separately for clarification.
Homogeneous loans maintain their original risk rating until they are greater than 30 days past due, and risk rating reclassification is based primarily on the past due status of the loan. The risk rating categories can be generally described by the following groupings for commercial and commercial real estate homogeneous loans:
Watch.
A homogeneous watch loan, risk rated 6, is 30-59 days past due from the required payment date at month-end.
Special Mention.
A homogeneous special mention loan, risk rated 7, is 60-89 days past due from the required payment date at month-end.
S
ubstandard.
A homogeneous substandard loan, risk rated 8, is 90-179 days past due from the required payment date at month-end.
Loss.
A homogeneous loss loan, risk rated 10, is 180 days and more past due from the required payment date. These loans are generally charged-off in the month in which the 180 day time period elapses.
The risk rating categories can be generally described by the following groupings for residential and home equity and other homogeneous loans:
Watch.
A homogeneous retail watch loan, risk rated 6, is 60-89 days past due from the required payment date at month-end.
143
Substandard.
A homogeneous retail substandard loan, risk rated 8, is 90-180 days past due from the required payment date at month-end.
Loss.
A homogeneous retail loss loan, risk rated 10, becomes past due 180 cumulative days from the contractual due date. These loans are generally charged-off in the month in which the 180 day period elapses.
Residential and home equity loans modified in a troubled debt restructure are not considered homogeneous. The risk rating classification for such loans are based on the non-homogeneous definitions noted above.
The following tables summarize designated loan grades by loan portfolio segment and loan class.
|
At December 31, 2014
|
|||||||||||||||||||
|
(in thousands)
|
Pass
|
Watch
|
Special mention
|
Substandard
|
Total
|
||||||||||||||
|
Consumer loans
|
|||||||||||||||||||
|
Single family
|
$
|
865,641
|
|
$
|
361
|
|
$
|
21,714
|
|
$
|
8,949
|
|
$
|
896,665
|
|
||||
|
Home equity
|
133,338
|
|
82
|
|
652
|
|
1,526
|
|
135,598
|
|
|||||||||
|
998,979
|
|
443
|
|
22,366
|
|
10,475
|
|
1,032,263
|
|
||||||||||
|
Commercial loans
|
|||||||||||||||||||
|
Commercial real estate
|
441,509
|
|
67,434
|
|
13,066
|
|
1,455
|
|
523,464
|
|
|||||||||
|
Multifamily
|
50,495
|
|
1,516
|
|
3,077
|
|
—
|
|
55,088
|
|
|||||||||
|
Construction/land development
|
361,167
|
|
2,830
|
|
1,261
|
|
2,676
|
|
367,934
|
|
|||||||||
|
Commercial business
|
115,665
|
|
25,724
|
|
3,690
|
|
2,370
|
|
147,449
|
|
|||||||||
|
968,836
|
|
97,504
|
|
21,094
|
|
6,501
|
|
1,093,935
|
|
||||||||||
|
$
|
1,967,815
|
|
$
|
97,947
|
|
$
|
43,460
|
|
$
|
16,976
|
|
$
|
2,126,198
|
|
|||||
|
At December 31, 2013
|
|||||||||||||||||||
|
(in thousands)
|
Pass
|
Watch
|
Special mention
|
Substandard
|
Total
|
||||||||||||||
|
Consumer loans
|
|||||||||||||||||||
|
Single family
|
$
|
817,877
|
|
$
|
53,711
|
|
$
|
12,746
|
|
$
|
20,579
|
|
$
|
904,913
|
|
||||
|
Home equity
|
132,086
|
|
1,442
|
|
276
|
|
1,846
|
|
135,650
|
|
|||||||||
|
949,963
|
|
55,153
|
|
13,022
|
|
22,425
|
|
1,040,563
|
|
||||||||||
|
Commercial loans
|
|||||||||||||||||||
|
Commercial real estate
|
368,817
|
|
63,579
|
|
37,758
|
|
7,488
|
|
477,642
|
|
|||||||||
|
Multifamily
|
74,509
|
|
1,544
|
|
3,163
|
|
—
|
|
79,216
|
|
|||||||||
|
Construction/land development
|
121,026
|
|
3,414
|
|
2,895
|
|
3,130
|
|
130,465
|
|
|||||||||
|
Commercial business
|
145,760
|
|
20,062
|
|
586
|
|
4,646
|
|
171,054
|
|
|||||||||
|
710,112
|
|
88,599
|
|
44,402
|
|
15,264
|
|
858,377
|
|
||||||||||
|
$
|
1,660,075
|
|
$
|
143,752
|
|
$
|
57,424
|
|
$
|
37,689
|
|
$
|
1,898,940
|
|
|||||
The Company considers ‘adversely classified assets’ to include loans graded as Substandard, Doubtful, and Loss as well as other real estate owned ("OREO"). As of
December 31, 2014
and
2013
, none of the Company's loans were rated Doubtful or Loss. The total amount of adversely classified assets was
$26.4 million
and
$50.6 million
as of
December 31, 2014
and
2013
, respectively.
144
Nonaccrual and Past Due Loans
Loans are placed on nonaccrual status when the full and timely collection of principal and interest is doubtful, generally when the loan becomes 90 days or more past due for principal or interest payment or if part of the principal balance has been charged off. Loans whose repayments are insured by the FHA or guaranteed by the VA are generally maintained on accrual status even if 90 days or more past due.
The following table presents an aging analysis of past due loans by loan portfolio segment and loan class.
|
At December 31, 2014
|
|||||||||||||||||||||||||||
|
(in thousands)
|
30-59 days
past due
|
60-89 days
past due
|
90 days or
more
past due
|
Total past
due
|
Current
|
Total
loans
|
90 days or
more past
due and accruing
(1)
|
||||||||||||||||||||
|
Consumer loans
|
|||||||||||||||||||||||||||
|
Single family
|
$
|
7,832
|
|
$
|
2,452
|
|
$
|
43,105
|
|
$
|
53,389
|
|
$
|
843,276
|
|
$
|
896,665
|
|
$
|
34,737
|
|
||||||
|
Home equity
|
371
|
|
81
|
|
1,526
|
|
1,978
|
|
133,620
|
|
135,598
|
|
—
|
|
|||||||||||||
|
8,203
|
|
2,533
|
|
44,631
|
|
55,367
|
|
976,896
|
|
1,032,263
|
|
34,737
|
|
||||||||||||||
|
Commercial loans
|
|||||||||||||||||||||||||||
|
Commercial real estate
|
—
|
|
—
|
|
4,843
|
|
4,843
|
|
518,621
|
|
523,464
|
|
—
|
|
|||||||||||||
|
Multifamily
|
—
|
|
—
|
|
—
|
|
—
|
|
55,088
|
|
55,088
|
|
—
|
|
|||||||||||||
|
Construction/land development
|
—
|
|
1,261
|
|
—
|
|
1,261
|
|
366,673
|
|
367,934
|
|
—
|
|
|||||||||||||
|
Commercial business
|
611
|
|
3
|
|
1,527
|
|
2,141
|
|
145,308
|
|
147,449
|
|
250
|
|
|||||||||||||
|
611
|
|
1,264
|
|
6,370
|
|
8,245
|
|
1,085,690
|
|
1,093,935
|
|
250
|
|
||||||||||||||
|
$
|
8,814
|
|
$
|
3,797
|
|
$
|
51,001
|
|
$
|
63,612
|
|
$
|
2,062,586
|
|
$
|
2,126,198
|
|
$
|
34,987
|
|
|||||||
|
At December 31, 2013
|
|||||||||||||||||||||||||||
|
(in thousands)
|
30-59 days
past due
|
60-89 days
past due
|
90 days or
more
past due
|
Total past
due
|
Current
|
Total
loans
|
90 days or
more past
due and accruing
(1)
|
||||||||||||||||||||
|
Consumer loans
|
|||||||||||||||||||||||||||
|
Single family
|
$
|
6,466
|
|
$
|
4,901
|
|
$
|
55,672
|
|
$
|
67,039
|
|
$
|
837,874
|
|
$
|
904,913
|
|
$
|
46,811
|
|
||||||
|
Home equity
|
375
|
|
75
|
|
1,846
|
|
2,296
|
|
133,354
|
|
135,650
|
|
—
|
|
|||||||||||||
|
6,841
|
|
4,976
|
|
57,518
|
|
69,335
|
|
971,228
|
|
1,040,563
|
|
46,811
|
|
||||||||||||||
|
Commercial loans
|
|||||||||||||||||||||||||||
|
Commercial real estate
|
—
|
|
—
|
|
12,257
|
|
12,257
|
|
465,385
|
|
477,642
|
|
—
|
|
|||||||||||||
|
Multifamily
|
—
|
|
—
|
|
—
|
|
—
|
|
79,216
|
|
79,216
|
|
—
|
|
|||||||||||||
|
Construction/land development
|
—
|
|
—
|
|
—
|
|
—
|
|
130,465
|
|
130,465
|
|
—
|
|
|||||||||||||
|
Commercial business
|
—
|
|
—
|
|
2,743
|
|
2,743
|
|
168,311
|
|
171,054
|
|
—
|
|
|||||||||||||
|
—
|
|
—
|
|
15,000
|
|
15,000
|
|
843,377
|
|
858,377
|
|
—
|
|
||||||||||||||
|
$
|
6,841
|
|
$
|
4,976
|
|
$
|
72,518
|
|
$
|
84,335
|
|
$
|
1,814,605
|
|
$
|
1,898,940
|
|
$
|
46,811
|
|
|||||||
|
(1)
|
FHA-insured and VA-guaranteed single family loans that are 90 days or more past due are maintained on accrual status if they are determined to have little to no risk of loss.
|
145
The following tables present performing and nonperforming loan balances by loan portfolio segment and loan class.
|
At December 31, 2014
|
|||||||||||
|
(in thousands)
|
Accrual
|
Nonaccrual
|
Total
|
||||||||
|
Consumer loans
|
|||||||||||
|
Single family
|
$
|
888,297
|
|
$
|
8,368
|
|
$
|
896,665
|
|
||
|
Home equity
|
134,072
|
|
1,526
|
|
135,598
|
|
|||||
|
1,022,369
|
|
9,894
|
|
1,032,263
|
|
||||||
|
Commercial loans
|
|||||||||||
|
Commercial real estate
|
518,621
|
|
4,843
|
|
523,464
|
|
|||||
|
Multifamily
|
55,088
|
|
—
|
|
55,088
|
|
|||||
|
Construction/land development
|
367,934
|
|
—
|
|
367,934
|
|
|||||
|
Commercial business
|
146,172
|
|
1,277
|
|
147,449
|
|
|||||
|
1,087,815
|
|
6,120
|
|
1,093,935
|
|
||||||
|
$
|
2,110,184
|
|
$
|
16,014
|
|
$
|
2,126,198
|
|
|||
|
At December 31, 2013
|
|||||||||||
|
(in thousands)
|
Accrual
|
Nonaccrual
|
Total
|
||||||||
|
Consumer loans
|
|||||||||||
|
Single family
|
$
|
896,052
|
|
$
|
8,861
|
|
$
|
904,913
|
|
||
|
Home equity
|
133,804
|
|
1,846
|
|
135,650
|
|
|||||
|
1,029,856
|
|
10,707
|
|
1,040,563
|
|
||||||
|
Commercial loans
|
|||||||||||
|
Commercial real estate
|
465,385
|
|
12,257
|
|
477,642
|
|
|||||
|
Multifamily
|
79,216
|
|
—
|
|
79,216
|
|
|||||
|
Construction/land development
|
130,465
|
|
—
|
|
130,465
|
|
|||||
|
Commercial business
|
168,311
|
|
2,743
|
|
171,054
|
|
|||||
|
843,377
|
|
15,000
|
|
858,377
|
|
||||||
|
$
|
1,873,233
|
|
$
|
25,707
|
|
$
|
1,898,940
|
|
|||
146
The following tables present information about TDR activity during the periods presented.
|
|
Year Ended December 31, 2014
|
|||||||||||
|
(dollars in thousands)
|
Concession type
|
Number of loan
modifications
|
Recorded
investment
|
Related charge-
offs
|
||||||||
|
Consumer loans
|
||||||||||||
|
Single family
|
||||||||||||
|
Interest rate reduction
|
62
|
|
$
|
12,012
|
|
$
|
—
|
|
||||
|
Payment restructure
|
10
|
|
1,991
|
|
—
|
|
||||||
|
72
|
|
14,003
|
|
—
|
|
|||||||
|
Home equity
|
||||||||||||
|
Interest rate reduction
|
3
|
|
430
|
|
—
|
|
||||||
|
Payment restructure
|
1
|
|
58
|
|
—
|
|
||||||
|
4
|
|
$
|
488
|
|
—
|
|
||||||
|
Total consumer
|
||||||||||||
|
Interest rate reduction
|
65
|
|
12,442
|
|
—
|
|
||||||
|
Payment restructure
|
11
|
|
2,049
|
|
—
|
|
||||||
|
76
|
|
14,491
|
|
—
|
|
|||||||
|
Commercial loans
|
||||||||||||
|
Commercial real estate
|
||||||||||||
|
Interest rate reduction
|
1
|
|
$
|
1,181
|
|
$
|
—
|
|
||||
|
Payment restructure
|
3
|
|
4,248
|
|
—
|
|
||||||
|
4
|
|
$
|
5,429
|
|
$
|
—
|
|
|||||
|
Commercial business
|
||||||||||||
|
Interest rate reduction
|
2
|
|
$
|
117
|
|
$
|
—
|
|
||||
|
Payment restructure
|
3
|
|
1,270
|
|
—
|
|
||||||
|
Forgiveness of principal
|
2
|
|
599
|
|
554
|
|
||||||
|
7
|
|
$
|
1,986
|
|
$
|
554
|
|
|||||
|
Total commercial
|
||||||||||||
|
Interest rate reduction
|
3
|
|
$
|
1,298
|
|
$
|
—
|
|
||||
|
Payment restructure
|
6
|
|
5,518
|
|
—
|
|
||||||
|
Forgiveness of principal
|
2
|
|
599
|
|
554
|
|
||||||
|
11
|
|
$
|
7,415
|
|
$
|
554
|
|
|||||
|
Total loans
|
||||||||||||
|
Interest rate reduction
|
68
|
|
13,740
|
|
—
|
|
||||||
|
Payment restructure
|
17
|
|
7,567
|
|
—
|
|
||||||
|
Forgiveness of principal
|
2
|
|
599
|
|
554
|
|
||||||
|
87
|
|
$
|
21,906
|
|
$
|
554
|
|
|||||
147
|
|
Year Ended December 31, 2013
|
|||||||||||
|
(dollars in thousands)
|
Concession type
|
Number of loan
modifications
|
Recorded
investment
|
Related charge-
offs
|
||||||||
|
Consumer loans
|
||||||||||||
|
Single family
|
||||||||||||
|
Interest rate reduction
|
104
|
|
$
|
22,605
|
|
$
|
—
|
|
||||
|
104
|
|
$
|
22,605
|
|
$
|
—
|
|
|||||
|
Home equity
|
||||||||||||
|
Interest rate reduction
|
9
|
|
$
|
571
|
|
$
|
—
|
|
||||
|
9
|
|
$
|
571
|
|
$
|
—
|
|
|||||
|
Total consumer
|
||||||||||||
|
Interest rate reduction
|
113
|
|
$
|
23,176
|
|
$
|
—
|
|
||||
|
113
|
|
$
|
23,176
|
|
$
|
—
|
|
|||||
|
Total loans
|
||||||||||||
|
Interest rate reduction
|
113
|
|
$
|
23,176
|
|
$
|
—
|
|
||||
|
113
|
|
$
|
23,176
|
|
$
|
—
|
|
|||||
148
|
|
Year Ended December 31, 2012
|
|||||||||||
|
(dollars in thousands)
|
Concession type
|
Number of loan
modifications
|
Recorded
investment
|
Related charge-
offs
|
||||||||
|
Consumer loans
|
||||||||||||
|
Single family
|
||||||||||||
|
Interest rate reduction
|
84
|
|
$
|
15,487
|
|
$
|
—
|
|
||||
|
Payment restructure
|
1
|
|
280
|
|
—
|
|
||||||
|
85
|
|
$
|
15,767
|
|
$
|
—
|
|
|||||
|
Home equity
|
||||||||||||
|
Interest rate reduction
|
7
|
|
$
|
527
|
|
$
|
—
|
|
||||
|
7
|
|
$
|
527
|
|
$
|
—
|
|
|||||
|
Total consumer
|
||||||||||||
|
Interest rate reduction
|
91
|
|
$
|
16,014
|
|
$
|
—
|
|
||||
|
Payment restructure
|
1
|
|
280
|
|
—
|
|
||||||
|
92
|
|
$
|
16,294
|
|
$
|
—
|
|
|||||
|
Commercial loans
|
||||||||||||
|
Commercial real estate
|
||||||||||||
|
Interest rate reduction
|
2
|
|
$
|
6,070
|
|
$
|
1,000
|
|
||||
|
2
|
|
$
|
6,070
|
|
$
|
1,000
|
|
|||||
|
Construction/land development
|
||||||||||||
|
Forgiveness of principal
|
2
|
|
$
|
304
|
|
$
|
—
|
|
||||
|
2
|
|
$
|
304
|
|
$
|
—
|
|
|||||
|
Total commercial
|
||||||||||||
|
Interest rate reduction
|
2
|
|
$
|
6,070
|
|
$
|
1,000
|
|
||||
|
Forgiveness of principal
|
2
|
|
304
|
|
—
|
|
||||||
|
4
|
|
$
|
6,374
|
|
$
|
1,000
|
|
|||||
|
Total loans
|
||||||||||||
|
Interest rate reduction
|
93
|
|
$
|
22,084
|
|
$
|
1,000
|
|
||||
|
Payment restructure
|
1
|
|
280
|
|
—
|
|
||||||
|
Forgiveness of principal
|
2
|
|
304
|
|
—
|
|
||||||
|
96
|
|
$
|
22,668
|
|
$
|
1,000
|
|
|||||
149
The following table presents loans that were modified as TDRs within the previous 12 months and subsequently re-defaulted during the years ended
December 31, 2014
and
2013
, respectively. A TDR loan is considered re-defaulted when it becomes doubtful that the objectives of the modifications will be met, generally when a consumer loan TDR becomes
60
days or more past due on principal or interest payments or when a commercial loan TDR becomes
90
days or more past due on principal or interest payments.
|
Year Ended December 31,
|
|||||||||||||
|
2014
|
2013
|
||||||||||||
|
(dollars in thousands)
|
Number of loan relationships that subsequently re-defaulted
|
Recorded
investment
|
Number of loan relationships that subsequently re-defaulted
|
Recorded
investment
|
|||||||||
|
Consumer loans
|
|||||||||||||
|
Single family
|
7
|
|
$
|
1,010
|
|
17
|
|
$
|
2,840
|
|
|||
|
Home equity
|
1
|
|
190
|
|
1
|
|
22
|
|
|||||
|
8
|
|
1,200
|
|
18
|
|
2,862
|
|
||||||
|
Commercial loans
|
|||||||||||||
|
Commercial real estate
|
—
|
|
—
|
|
1
|
|
770
|
|
|||||
|
—
|
|
—
|
|
1
|
|
770
|
|
||||||
|
8
|
|
$
|
1,200
|
|
19
|
|
$
|
3,632
|
|
||||
Other real estate owned consisted of the following.
|
|
At December 31,
|
||||||
|
(in thousands)
|
2014
|
2013
|
|||||
|
Single family
|
$
|
1,613
|
|
$
|
5,522
|
|
|
|
Commercial real estate
|
2,062
|
|
958
|
|
|||
|
Construction/land development
|
7,076
|
|
8,128
|
|
|||
|
10,751
|
|
14,608
|
|
||||
|
Valuation allowance
|
(1,303
|
)
|
(1,697
|
)
|
|||
|
$
|
9,448
|
|
$
|
12,911
|
|
||
Activity in other real estate owned was as follows.
|
|
Year Ended December 31,
|
||||||
|
(in thousands)
|
2014
|
2013
|
|||||
|
Beginning balance
|
$
|
12,911
|
|
$
|
23,941
|
|
|
|
Additions
|
4,130
|
|
8,199
|
|
|||
|
Loss provisions
|
(69
|
)
|
(603
|
)
|
|||
|
Reductions related to sales
|
(7,524
|
)
|
(18,626
|
)
|
|||
|
Ending balance
|
$
|
9,448
|
|
$
|
12,911
|
|
|
150
Activity in the valuation allowance for other real estate owned was as follows.
|
|
Year Ended December 31,
|
||||||||||
|
(in thousands)
|
2014
|
2013
|
2012
|
||||||||
|
Beginning balance
|
$
|
1,697
|
|
$
|
14,965
|
|
$
|
21,502
|
|
||
|
Loss provisions
|
69
|
|
603
|
|
12,171
|
|
|||||
|
(Charge-offs), net of recoveries
|
(463
|
)
|
(13,871
|
)
|
(18,708
|
)
|
|||||
|
Ending balance
|
$
|
1,303
|
|
$
|
1,697
|
|
$
|
14,965
|
|
||
The components of the net cost of operation and sale of other real estate owned are as follows.
|
|
Year Ended December 31,
|
||||||||||
|
(in thousands)
|
2014
|
2013
|
2012
|
||||||||
|
Maintenance costs
|
$
|
436
|
|
$
|
840
|
|
$
|
1,289
|
|
||
|
Loss provisions
|
69
|
|
603
|
|
12,171
|
|
|||||
|
Net gain on sales
|
(890
|
)
|
(722
|
)
|
(2,508
|
)
|
|||||
|
Gain on transfer
|
—
|
|
(119
|
)
|
(489
|
)
|
|||||
|
Net operating income (loss)
|
(85
|
)
|
1,209
|
|
(378
|
)
|
|||||
|
Net cost of operation and sale of other real estate owned
|
$
|
(470
|
)
|
$
|
1,811
|
|
$
|
10,085
|
|
||
At
December 31, 2014
, we had concentrations within the state of Washington, primarily in Thurston County, representing
88.5%
of the total balance of other real estate owned. At
December 31, 2013
, we had concentrations within the state of Washington representing
70.5%
of the total balance of other real estate owned.
Premises and equipment consisted of the following.
|
|
December 31,
|
||||||
|
(in thousands)
|
2014
|
2013
|
|||||
|
Furniture and equipment
|
$
|
59,425
|
|
$
|
47,247
|
|
|
|
Leasehold improvements
|
22,516
|
|
17,525
|
|
|||
|
Land and buildings
|
985
|
|
2,095
|
|
|||
|
82,926
|
|
66,867
|
|
||||
|
Less: accumulated depreciation
|
(37,675
|
)
|
(30,255
|
)
|
|||
|
$
|
45,251
|
|
$
|
36,612
|
|
||
Depreciation expense for the years ending
December 31, 2014
,
2013
, and
2012
, was
$7.4 million
,
$4.6 million
, and
$2.7 million
, respectively.
151
Deposit balances, including stated rates, were as follows.
|
|
At December 31,
|
||||||
|
(
in thousands)
|
2014
|
2013
|
|||||
|
Noninterest-bearing accounts
|
$
|
470,663
|
|
$
|
322,952
|
|
|
|
NOW accounts, 0.00% to 1.00% at December 31, 2014 and 0.00% to 0.75% at December 31, 2013
|
272,390
|
|
297,966
|
|
|||
|
Statement savings accounts, due on demand, 0.00% to 1.99% at December 31, 2014 and 0.20% to 2.00% at December 31, 2013
|
200,638
|
|
156,181
|
|
|||
|
Money market accounts, due on demand, 0.00% to 1.45% at December 31, 2014 and 0.00% to 1.50% at December 31, 2013
|
1,007,214
|
|
919,322
|
|
|||
|
Certificates of deposit, 0.05% to 3.80% at December 31, 2014 and December 31, 2013
|
494,525
|
|
514,400
|
|
|||
|
$
|
2,445,430
|
|
$
|
2,210,821
|
|
||
There were
$2.2 million
of public funds included in deposits as of
December 31, 2014
and
$4.4 million
at
December 31, 2013
.
Interest expense on deposits was as follows.
|
|
Year Ended December 31,
|
||||||||||
|
(in thousands)
|
2014
|
2013
|
2012
|
||||||||
|
NOW accounts
|
$
|
1,122
|
|
$
|
924
|
|
$
|
498
|
|
||
|
Statement savings accounts
|
929
|
|
546
|
|
395
|
|
|||||
|
Money market accounts
|
4,362
|
|
3,899
|
|
3,248
|
|
|||||
|
Certificates of deposit
|
3,018
|
|
5,047
|
|
12,600
|
|
|||||
|
$
|
9,431
|
|
$
|
10,416
|
|
$
|
16,741
|
|
|||
The weighted-average interest rates on certificates of deposit at
December 31, 2014
,
2013
, and
2012
were
0.60%
,
0.71%
, and
1.59%
, respectively.
Certificates of deposit outstanding mature as follows.
|
(in thousands)
|
At December 31, 2014
|
|||
|
Within one year
|
$
|
319,578
|
|
|
|
One to two years
|
137,736
|
|
||
|
Two to three years
|
27,793
|
|
||
|
Three to four years
|
5,476
|
|
||
|
Four to five years
|
3,942
|
|
||
|
$
|
494,525
|
|
||
The aggregate amount of time deposits in denominations of
$100 thousand
or more at
December 31, 2014
and
2013
, was
$188.7 million
and
$216.5 million
, respectively. The aggregate amount of time deposits in denominations of more than
$250 thousand
at
December 31, 2014
and
2013
was
$30.2 million
and
$26.3 million
, respectively. There were
$176.1 million
and
$144.3 million
of brokered deposits as of
December 31, 2014
and
December 31, 2013
.
152
Federal Home Loan Bank
The Company borrows through advances from the FHLB. FHLB advances totaled
$597.6 million
and
$446.6 million
as of
December 31, 2014
, and
December 31, 2013
, respectively.
Weighted-average interest rates on the advances were
0.41%
,
0.43%
, and
0.60%
at
December 31, 2014
,
2013
and
2012
, respectively. The advances may be collateralized by stock in the FHLB, pledged securities, and unencumbered qualifying loans. The Company has an available line of credit with the FHLB equal to
30 percent
of assets, subject to collateralization requirements. Based on the amount of qualifying collateral available, borrowing capacity from the FHLB was
$317.9 million
as of
December 31, 2014
. The FHLB is not contractually bound to continue to offer credit to the Company, and the Company’s access to credit from this agency for future borrowings may be discontinued at any time.
FHLB advances outstanding by contractual maturities were as follows.
|
At December 31, 2014
|
||||||
|
(in thousands)
|
Advances
outstanding
|
Weighted-average
interest rate
|
||||
|
2015
|
$
|
532,000
|
|
0.28
|
%
|
|
|
2016
|
50,000
|
|
0.52
|
|
||
|
2017
|
—
|
|
—
|
|
||
|
2018
|
—
|
|
—
|
|
||
|
2019 and thereafter
|
15,590
|
|
4.64
|
|
||
|
$
|
597,590
|
|
0.41
|
%
|
||
The Company, as a member of the FHLB, is required to own shares of FHLB stock. This requirement is based upon the amount of either the eligible collateral or advances outstanding from the FHLB. As of
December 31, 2014
and
2013
, the Company held
$33.9 million
and
$35.3 million
, respectively, of FHLB stock. FHLB stock is carried at par value and is restricted to transactions between the FHLB and its member institutions. FHLB stock can only be purchased or redeemed at par value. Both cash and dividends received on FHLB stock are reported in earnings.
On November 6, 2009, the Federal Housing Finance Agency (the "Finance Agency") regulator reaffirmed its capital classification of the FHLB as undercapitalized. Under the Finance Agency regulations, a FHLB that fails to meet any regulatory capital requirement may not declare a dividend or redeem or repurchase capital stock. As such, the FHLB will not be able to redeem, repurchase, or declare dividends on stock outstanding while the risk-based capital deficiency exists. In September 2012, the Finance Agency reclassified the FHLB as adequately capitalized but the FHLB remained subject to the Consent Order. On November 22, 2013, the Finance Agency issued an amended Consent Order, which modifies and supersedes the October 2010 Consent Order. The amended Consent Order acknowledges the FHLB’s fulfillment of many of the requirements set forth in the 2010 Consent Order and improvements in the FHLB’s financial performance, while continuing to impose certain restrictions on its ability to repurchase, redeem, and pay dividends on its capital stock. As such, Finance Agency approval or non-objection will continue to be required for all repurchases, redemptions, and dividend payments on capital stock.
In September 2014, the FHLB entered into a merger agreement with the Federal Home Loan Bank of Des Moines (the “Des Moines Bank”). If the merger agreement is consummated, the FHLB will merge with and into the Des Moines Bank, with the Des Moines Bank being the surviving entity. As a result, the Bank will become a member of the Des Moines Bank and its shares of FHLB stock will be converted into shares of stock of the Des Moines Bank.
At
December 31, 2014
, there has been no change in the restrictions regarding the FHLB's ability to redeem, repurchase or declare dividends on stock outstanding.
Management periodically evaluates FHLB stock for other-than-temporary impairment. Management’s determination of whether these investments are impaired is based on its assessment of ultimate recoverability of par value rather than recognizing temporary declines in value. The determination of whether the decline affects the ultimate recoverability is influenced by criteria such as: (1) the significance of the decline in net assets of the FHLB as compared to the capital stock amount for the
153
FHLB and the length of time this situation has persisted; (2) commitments by the FHLB to make payments required by law or regulation and the level of such payments in relation to the operating performance of the FHLB; (3) the impact of legislative and regulatory changes on institutions and, accordingly, on the customer base of the FHLB; and (4) the liquidity position of the FHLB. Based on this evaluation, the Company determined there is not an other-than-temporary impairment of the FHLB stock investment as of
December 31, 2014
, or
2013
.
Federal Reserve Bank of San Francisco
The Company may also borrow on a collateralized basis from the Federal Reserve Bank of San Francisco (“FRBSF”). At
December 31, 2014
and
2013
, there were
no
outstanding borrowings from the FRBSF. Based on the amount of qualifying collateral available, borrowing capacity from the FRBSF was
$316.1 million
at
December 31, 2014
. The FRB of San Francisco is not contractually bound to offer credit to the Company, and the Company’s access to credit from this agency for future borrowings may be discontinued at any time.
Federal Funds Purchased and Securities Sold Under Agreements to Repurchase
Federal funds transactions involve lending reserve balances on a short-term basis. Securities borrowed or purchased under agreements to resell are collateralized lending transactions utilized to accommodate customer transactions, earn interest rate spreads, and obtain securities for settlement and for collateral. At
December 31, 2014
, we had
$50.0 million
in federal funds purchased and no balance of securities sold under agreements to repurchase. At
December 31, 2013
, we had no outstanding balances of these short-term borrowings.
The Company raised capital by issuing trust preferred securities ("TruPS") during the period from 2005 through 2007, resulting in a debt balance of
$61.9 million
at December 31, 2012. We acquired
$3.1 million
of TruPS debt through the acquisition of YNB in 2013, bringing our total TruPS long-term debt to
$64.8 million
at
December 31, 2013
. During the first quarter of 2014, we redeemed the TruPS that were acquired as part of the acquisition of YNB, bringing our TruPS balance to
$61.9 million
at
December 31, 2014
. In connection with the issuance of TruPS, HomeStreet, Inc. issued to HomeStreet Statutory Trust Junior Subordinated Deferrable Interest Debentures.
The Subordinated Debt Securities are as follows:
|
HomeStreet Statutory
|
|||||||
|
(in thousands)
|
I
|
II
|
III
|
IV
|
|||
|
|
|
|
|
||||
|
Date issued
|
June 2005
|
September 2005
|
February 2006
|
March 2007
|
|||
|
Amount
|
$5,155
|
$20,619
|
$20,619
|
$15,464
|
|||
|
Interest rate
|
3 MO LIBOR + 1.70%
|
3 MO LIBOR + 1.50%
|
3 MO LIBOR + 1.37%
|
3 MO LIBOR + 1.68%
|
|||
|
Maturity date
|
June 2035
|
December 2035
|
March 2036
|
June 2037
|
|||
|
Call option
(1)
|
5 years
|
5 years
|
5 years
|
5 years
|
|||
(1) Call options are exercisable at par.
Following the first call date, the HomeStreet Statutory TruPS debt adjusts quarterly with the change in the three-month LIBOR rate. The sole assets of the HomeStreet Statutory Trust are the Subordinated Debt Securities I, II, III, and IV.
During 2014, we recorded a loss on debt extinguishment of
$573 thousand
upon the early retirement of senior debt, which the remaining net acquired amount totaled
$2.9 million
and was settled for
$3.5 million
.
154
To reduce the risk of significant interest rate fluctuations on the value of certain assets and liabilities, such as certain mortgage loans held for sale or mortgage servicing rights ("MSRs"), the Company utilizes derivatives, such as forward sale commitments, futures, option contracts, interest rate swaps and swaptions as risk management instruments in its hedging strategy. Derivative transactions are measured in terms of notional amount, which is not recorded in the consolidated statements of financial condition. The notional amount is generally not exchanged and is used as the basis for interest and other contractual payments.
The use of derivatives as interest rate risk management instruments helps minimize significant, unplanned fluctuations in earnings, fair value of assets and liabilities, and cash flows caused by interest rate volatility. This approach involves mitigating the repricing characteristics of certain assets or liabilities so that changes in interest rates do not have a significant adverse effect on net interest margin and cash flows. As a result of interest rate fluctuations, hedged assets and liabilities will gain or lose market value. In a fair value hedging strategy, the effect of this gain or loss will generally be offset by the gain or loss on the derivatives linked to hedged assets or liabilities. In a cash flow hedging strategy, management manages the variability of cash payments due to interest rate fluctuations by the effective use of derivatives linked to hedged assets and liabilities. We held no derivatives designated as a fair value, cash flow or foreign currency hedge instrument at
December 31, 2014
. We held no derivatives designated as a cash flow or foreign currency hedge instrument at
2013
. Derivatives are reported at their respective fair values in the other assets or accounts payable and other liabilities line items on the consolidated statements of financial condition, with changes in fair value reflected in current period earnings.
As permitted under U.S. GAAP, the Company nets derivative assets and liabilities when a legally enforceable master netting agreement exists between the Company and the derivative counterparty, which are documented under industry standard master agreements and credit support annexes. The Company's master netting agreements provide that following an uncured payment default or other event of default the non-defaulting party may promptly terminate all transactions between the parties and determine a net amount due to be paid to, or by, the defaulting party. An event of default may also occur under a credit support annex if a party fails to make a collateral delivery (which remains uncured following applicable notice and grace periods). The Company's right of offset requires that master netting agreements are legally enforceable and that the exercise of rights by the non-defaulting party under these agreements will not be stayed, or avoided under applicable law upon an event of default including bankruptcy, insolvency or similar proceeding.
The collateral used under the Company's master netting agreements is typically cash, but securities may be used under agreements with certain counterparties. Receivables related to cash collateral that has been paid to counterparties is included in other assets on the Company's consolidated statements of financial condition. Any securities pledged to counterparties as collateral remain on the consolidated statement of financial condition. Refer to Note 4,
Investment Securities
of this Form 10-K for further information on securities collateral pledged. At
December 31, 2014
and
2013
, the Company did not hold any collateral received from counterparties under derivative transactions.
The Company’s derivative activities are monitored by the asset/liability management committee. The treasury function, which includes asset/liability management, is responsible for hedging strategies developed through analysis of data from financial models and other internal and industry sources. The resulting hedging strategies are incorporated into the overall risk management strategies.
For further information on the policies that govern derivative and hedging activities, see Note1,
Summary of Significant Accounting Policies
of this form 10-K.
155
The notional amounts and fair values for derivatives consist of the following:
|
At December 31, 2014
|
|||||||||||
|
Notional amount
|
Fair value derivatives
|
||||||||||
|
(in thousands)
|
|
Asset
|
Liability
|
||||||||
|
Forward sale commitments
|
$
|
934,986
|
|
$
|
1,071
|
|
$
|
(5,658
|
)
|
||
|
Interest rate swaptions
|
15,000
|
|
—
|
|
—
|
|
|||||
|
Interest rate lock commitments
|
392,687
|
|
11,939
|
|
(6
|
)
|
|||||
|
Interest rate swaps
|
610,150
|
|
11,689
|
|
(972
|
)
|
|||||
|
Total derivatives before netting
|
$
|
1,952,823
|
|
$
|
24,699
|
|
$
|
(6,636
|
)
|
||
|
Netting adjustments
(1)
|
(5,858
|
)
|
5,858
|
|
|||||||
|
Carrying value on consolidated statements of financial position
|
$
|
18,841
|
|
$
|
(778
|
)
|
|||||
|
At December 31, 2013
|
|||||||||||
|
Notional amount
|
Fair value derivatives
|
||||||||||
|
(in thousands)
|
|
Asset
|
Liability
|
||||||||
|
Forward sale commitments
|
$
|
526,382
|
|
$
|
3,630
|
|
$
|
(578
|
)
|
||
|
Interest rate swaptions
|
110,000
|
|
858
|
|
(199
|
)
|
|||||
|
Interest rate lock commitments
|
261,070
|
|
6,012
|
|
(40
|
)
|
|||||
|
Interest rate swaps
|
508,004
|
|
1,088
|
|
(9,548
|
)
|
|||||
|
Total derivatives before netting
|
$
|
1,405,456
|
|
$
|
11,588
|
|
$
|
(10,365
|
)
|
||
|
Netting adjustments
|
(1,363
|
)
|
1,363
|
|
|||||||
|
Carrying value on consolidated statements of financial position
|
$
|
10,225
|
|
$
|
(9,002
|
)
|
|||||
The following tables present gross and net information about derivative instruments.
|
At December 31, 2014
|
|||||||||||||||||||||||
|
(in thousands)
|
Gross fair value
|
Netting adjustments
|
Carrying value
|
Cash collateral paid
(1)
|
Securities pledged
|
Net amount
|
|||||||||||||||||
|
Derivative assets
|
$
|
24,699
|
|
$
|
(5,858
|
)
|
$
|
18,841
|
|
$
|
—
|
|
$
|
—
|
|
$
|
18,841
|
|
|||||
|
Derivative liabilities
|
$
|
(6,636
|
)
|
$
|
5,858
|
|
$
|
(778
|
)
|
$
|
—
|
|
$
|
762
|
|
$
|
(16
|
)
|
|||||
|
At December 31, 2013
|
|||||||||||||||||||||||
|
(in thousands)
|
Gross fair value
|
Netting adjustments
|
Carrying value
|
Cash collateral paid
(1)
|
Securities pledged
|
Net amount
|
|||||||||||||||||
|
Derivative assets
|
$
|
11,588
|
|
$
|
(1,363
|
)
|
$
|
10,225
|
|
$
|
—
|
|
$
|
—
|
|
$
|
10,225
|
|
|||||
|
Derivative liabilities
|
$
|
(10,365
|
)
|
$
|
1,363
|
|
$
|
(9,002
|
)
|
$
|
8,491
|
|
$
|
451
|
|
$
|
(60
|
)
|
|||||
|
(1)
|
Excludes cash collateral of
$20.4 million
and
$18.5 million
at
December 31, 2014
and
2013
, which predominantly consists of collateral transferred by the Company at the initiation of derivative transactions and held by the counterparty as security. These amounts were not netted against the derivative receivables and payables, because, at an individual counterparty level, the collateral exceeded the fair value exposure at both
December 31, 2014
and
2013
.
|
156
Management uses derivatives that are designated as qualifying hedge contracts as defined by Accounting Standards Codification (ASC) 815,
Derivatives and Hedging,
as fair value hedges, which are comprised of interest rate swap contracts. Interest rate swap contracts are used to convert commercial business loans held for investment from fixed to floating rates to hedge against exposure to changes in benchmark interest rates. All parts of the gain or loss due to the hedged risk (e.g., fair value changes due to changes in benchmark interest rates) are included in the assessment of hedge effectiveness. These swap contracts are carried at fair value, with the net settlement of the derivatives reported in noninterest income and ineffectiveness for these swap contracts reported in other noninterest income.
For fair value hedging relationships, the dollar-offset method is used to assess hedge effectiveness, both at the inception of the hedging relationship and on an ongoing basis. Hedge effectiveness is evaluated prospectively as well as through retrospective evaluations. For prospective considerations, we develop an expectation that the relationship will be highly effective over future periods. For retrospective evaluations management determines whether the hedging relationship has been highly effective. The dollar-offset method compares the change in the fair value of the hedging instrument with the changes in the fair value of the hedged item attributable to the hedged risk. The results of the dollar-offset method along with other relevant information are the basis for evaluating hedge effectiveness prospectively and retrospectively.
The ineffective portion of net gain (loss) on derivatives in fair value hedging relationships, recognized in other noninterest income on the consolidated statements of operations, for loans held for investment were
$86 thousand
and
$151 thousand
for the years ended
December 31, 2014
and
2013
, respectively.
During the year ended
December 31, 2014
, certain fair value hedges were de-designated; therefore, fair value hedge accounting treatment was discontinued. The net gain or loss on the underlying hedged loans is being amortized to other noninterest income over the remaining contractual life of the loans at the time of de-designation. Changes in the fair value of these derivative instruments after de-designation of fair value hedge accounting are recorded in noninterest income in the consolidated statements of operations.
Free-standing derivatives are also used for fair value interest rate risk management purposes that do not qualify for hedge accounting treatment, referred to as economic hedges. Economic hedges are used to hedge against adverse changes in fair value of single family mortgage servicing rights (“single family MSRs”), interest rate lock commitments (“IRLCs”) for single family mortgage loans that the Company intends to sell, and single family mortgage loans held for sale.
Free-standing derivatives used as economic hedges for single family MSRs typically include positions in interest rate futures, options on 10-year treasury contracts, forward sales commitments on mortgage-backed securities, and interest rate swap and swaption contracts. The single family MSRs and the free-standing derivatives are carried at fair value with changes in fair value included in mortgage servicing income.
The free-standing derivatives used as economic hedges for IRLCs and single family mortgage loans held for sale are forward sales commitments on mortgage-backed securities and option contracts. IRLCs, single family mortgage loans held for sale, and the free-standing derivatives (“economic hedges”) are carried at fair value with changes in fair value included in net gain (loss) on mortgage loan origination and sale activities.
The following table presents the net gain (loss) recognized on derivatives, including economic hedge derivatives, within the respective line items in the statement of operations for the periods indicated.
|
|
Year Ended December 31,
|
||||||||||
|
(in thousands)
|
2014
|
2013
|
2012
|
||||||||
|
Recognized in noninterest income:
|
|||||||||||
|
Net gain (loss) on mortgage loan origination and sale activities
(1)
|
$
|
(17,258
|
)
|
$
|
12,904
|
|
$
|
(14,382
|
)
|
||
|
Mortgage servicing income
(2)
|
39,727
|
|
(20,432
|
)
|
21,982
|
|
|||||
|
$
|
22,469
|
|
$
|
(7,528
|
)
|
$
|
7,600
|
|
|||
|
(1)
|
Comprised of IRLCs and forward contracts used as an economic hedge of IRLCs and single family mortgage loans held for sale.
|
|
(2)
|
Comprised of interest rate swaps, interest rate swaptions and forward contracts used as an economic hedge of single family mortgage servicing rights MSRs.
|
157
Loans held for sale consisted of the following.
|
|
At December 31,
|
||||||
|
(in thousands)
|
2014
|
2013
|
|||||
|
Single family
|
$
|
610,350
|
|
(1)
|
$
|
279,385
|
|
|
Multifamily
|
10,885
|
|
556
|
|
|||
|
$
|
621,235
|
|
$
|
279,941
|
|
||
|
(1)
|
The Company transferred
$310.5 million
of loans from the held for investment portfolio into loans held for sale in March of 2014 and subsequently sold
$266.8 million
of these loans. At
December 31, 2014
, the Company had transferred
$92.7 million
of these loans back to the held for investment portfolio.
|
Loans sold consisted of the following.
|
|
Year Ended December 31,
|
||||||||||
|
(in thousands)
|
2014
|
2013
|
2012
|
||||||||
|
Single family
|
$
|
3,979,398
|
|
$
|
4,733,473
|
|
$
|
4,170,840
|
|
||
|
Multifamily
|
141,859
|
|
104,016
|
|
118,805
|
|
|||||
|
$
|
4,121,257
|
|
$
|
4,837,489
|
|
$
|
4,289,645
|
|
|||
Net gain on mortgage loan origination and sale activities, including the effects of derivative risk management instruments, consisted of the following.
|
|
Year Ended December 31,
|
||||||||||
|
(in thousands)
|
2014
|
2013
|
2012
|
||||||||
|
Single family:
|
|||||||||||
|
Servicing value and secondary market gains
(1)
|
$
|
109,063
|
|
$
|
128,391
|
|
$
|
175,655
|
|
||
|
Loan origination and funding fees
|
25,572
|
|
30,051
|
|
30,037
|
|
|||||
|
Total single family
|
134,635
|
|
158,442
|
|
205,692
|
|
|||||
|
Multifamily
|
4,723
|
|
5,306
|
|
4,872
|
|
|||||
|
Other
|
4,764
|
|
(2)
|
964
|
|
—
|
|
||||
|
Total net gain on mortgage loan origination and sale activities
|
$
|
144,122
|
|
$
|
164,712
|
|
$
|
210,564
|
|
||
|
(1)
|
Comprised of gains and losses on interest rate lock commitments (which considers the value of servicing), single family loans held for sale, forward sale commitments used to economically hedge secondary market activities, and changes in the Company's repurchase liability for loans that have been sold.
|
|
(2)
|
Includes
$4.6 million
in pre-tax gain during 2014 from the sale of loans that were originally held for investment.
|
The Company’s portfolio of loans serviced for others is primarily comprised of loans held in U.S. government and agency MBS issued by Fannie Mae, Freddie Mac and Ginnie Mae. Loans serviced for others are not included in the consolidated statements of financial condition as they are not assets of the Company.
158
The composition of loans serviced for others is presented below at the unpaid principal balance.
|
At December 31,
|
|||||||
|
(in thousands)
|
2014
|
2013
|
|||||
|
Single family
|
|||||||
|
U.S. government and agency
|
$
|
10,630,864
|
|
(1)
|
$
|
11,467,853
|
|
|
Other
|
585,344
|
|
327,768
|
|
|||
|
11,216,208
|
|
11,795,621
|
|
||||
|
Commercial
|
|||||||
|
Multifamily
|
752,640
|
|
720,429
|
|
|||
|
Other
|
82,354
|
|
95,673
|
|
|||
|
834,994
|
|
816,102
|
|
||||
|
Total loans serviced for others
|
$
|
12,051,202
|
|
$
|
12,611,723
|
|
|
|
(1)
|
On June 30, 2014, the Company sold the rights to service
$2.96 billion
in total unpaid principal balance of single family mortgage loans serviced for Fannie Mae.
|
The Company has made representations and warranties that the loans sold meet certain requirements. The Company may be required to repurchase mortgage loans or indemnify loan purchasers due to defects in the origination process of the loan, such as documentation errors, underwriting errors and judgments, appraisal errors, early payment defaults and fraud. For further information on the Company's mortgage repurchase liability, see Note 13,
Commitments, Guarantees and Contingencies
. The following is a summary of changes in the Company's liability for estimated mortgage repurchase losses.
|
|
Year Ended December 31,
|
||||||
|
(in thousands)
|
2014
|
2013
|
|||||
|
Balance, beginning of year
|
$
|
1,260
|
|
$
|
1,955
|
|
|
|
Additions
(1)
|
1,430
|
|
1,828
|
|
|||
|
Realized losses
(2)
|
(734
|
)
|
(2,523
|
)
|
|||
|
Balance, end of year
|
$
|
1,956
|
|
$
|
1,260
|
|
|
|
(1)
|
Includes additions for new loan sales and changes in estimated probable future repurchase losses on previously sold loans.
|
|
(2)
|
Includes principal losses and accrued interest on repurchased loans, “make-whole” settlements, settlements with claimants and certain related expense.
|
Advances are made to Ginnie Mae mortgage pools for delinquent loan payments. We also fund foreclosure costs and we repurchase loans from Ginnie Mae mortgage pools prior to recovery of guaranteed amounts. Ginnie Mae advances of
$7.8 million
and
$7.1 million
were recorded in other assets as of
December 31, 2014
, and
December 31, 2013
, respectively.
When the Company has the unilateral right to repurchase Ginnie Mae pool loans it has previously sold (generally loans that are more than
90
days past due), the Company then records the loan on its consolidated statement of financial condition. At
December 31, 2014
and
2013
, delinquent or defaulted mortgage loans currently in Ginnie Mae pools that the Company has recognized on its consolidated statement of financial condition totaled
$21.2 million
and
$14.3 million
, respectively, with a corresponding amount recorded within accounts payable and other liabilities on the consolidated statements of financial condition. The recognition of previously sold loans does not impact the accounting for the previously recognized MSRs.
159
Revenue from mortgage servicing, including the effects of derivative risk management instruments, consisted of the following.
|
|
Year Ended December 31,
|
||||||||||
|
(in thousands)
|
2014
|
2013
|
2012
|
||||||||
|
Servicing income, net:
|
|||||||||||
|
Servicing fees and other
|
$
|
37,818
|
|
$
|
34,173
|
|
$
|
27,833
|
|
||
|
Changes in fair value of single family MSRs due to modeled amortization
(1)
|
(26,112
|
)
|
(24,321
|
)
|
(26,706
|
)
|
|||||
|
Amortization of multifamily MSRs
|
(1,712
|
)
|
(1,803
|
)
|
(2,014
|
)
|
|||||
|
9,994
|
|
8,049
|
|
(887
|
)
|
||||||
|
Risk management, single family MSRs:
|
|||||||||||
|
Changes in fair value due to changes in model inputs and/or assumptions
(2)
|
(15,629
|
)
|
(3)
|
29,456
|
|
(4,974
|
)
|
||||
|
Net gain from derivatives economically hedging MSR
|
39,727
|
|
(20,432
|
)
|
21,982
|
|
|||||
|
24,098
|
|
9,024
|
|
17,008
|
|
||||||
|
Mortgage servicing income
|
$
|
34,092
|
|
$
|
17,073
|
|
$
|
16,121
|
|
||
|
(1)
|
Represents changes due to collection/realization of expected cash flows and curtailments.
|
|
(2)
|
Principally reflects changes in model assumptions, including prepayment speed assumptions, which are primarily affected by changes in mortgage interest rates.
|
|
(3)
|
Includes pre-tax income of
$4.7 million
, net of brokerage fees and prepayment reserves, resulting from the sale of single family MSRs during the second quarter ended June 30, 2014.
|
All MSRs are initially measured and recorded at fair value at the time loans are sold. Single family MSRs are subsequently carried at fair value with changes in fair value reflected in earnings in the periods in which the changes occur, while multifamily MSRs are subsequently carried at the lower of amortized cost or fair value.
The fair value of MSRs is determined based on the price that would be received to sell the MSRs in an orderly transaction between market participants at the measurement date. The Company determines fair value using a valuation model that calculates the net present value of estimated future cash flows. Estimates of future cash flows include contractual servicing fees, ancillary income and costs of servicing, the timing of which are impacted by assumptions, primarily expected prepayment speeds and discount rates, which relate to the underlying performance of the loans.
The initial fair value measurement of MSRs is adjusted up or down depending on whether the underlying loan pool interest rate is at a premium, discount or par. Key economic assumptions used in measuring the initial fair value of capitalized single family MSRs were as follows.
|
Year Ended December 31,
|
||||||||
|
(rates per annum)
(1)
|
2014
|
2013
|
2012
|
|||||
|
Constant prepayment rate
(2)
|
13.30
|
%
|
9.28
|
%
|
11.64
|
%
|
||
|
Discount rate
|
10.50
|
%
|
10.25
|
%
|
10.28
|
%
|
||
|
(1)
|
Weighted average rates for sales during the period for sales of loans with similar characteristics.
|
|
(2)
|
Represents the expected lifetime average.
|
160
Key economic assumptions and the sensitivity of the current fair value for single family MSRs to immediate adverse changes in those assumptions were as follows.
|
(in thousands)
|
At December 31, 2014
|
||
|
|
|||
|
Fair value of single family MSR
|
$
|
112,439
|
|
|
Expected weighted-average life (in years)
|
4.56
|
|
|
|
Constant prepayment rate
(1)
|
18.07
|
%
|
|
|
Impact on 25 basis points adverse change
|
$
|
(8,674
|
)
|
|
Impact on 50 basis points adverse change
|
$
|
(17,115
|
)
|
|
Discount rate
|
10.60
|
%
|
|
|
Impact on fair value of 100 basis points increase
|
$
|
(3,124
|
)
|
|
Impact on fair value of 200 basis points increase
|
$
|
(6,084
|
)
|
|
(1)
|
Represents the expected lifetime average.
|
These sensitivities are hypothetical and should be used with caution. As the table above demonstrates, the Company’s methodology for estimating the fair value of MSRs is highly sensitive to changes in key assumptions. For example, actual prepayment experience may differ and any difference may have a material effect on MSR fair value. Changes in fair value resulting from changes in assumptions generally cannot be extrapolated because the relationship of the change in assumption to the change in fair value may not be linear. Also, in this table, the effect of a variation in a particular assumption on the fair value of the MSRs is calculated without changing any other assumption; in reality, changes in one factor may be associated with changes in another (for example, decreases in market interest rates may provide an incentive to refinance; however, this may also indicate a slowing economy and an increase in the unemployment rate, which reduces the number of borrowers who qualify for refinancing), which may magnify or counteract the sensitivities. Thus, any measurement of MSR fair value is limited by the conditions existing and assumptions made as of a particular point in time. Those assumptions may not be appropriate if they are applied to a different point in time.
The changes in single family MSRs measured at fair value are as follows.
|
|
At December 31,
|
||||||||||
|
(in thousands)
|
2014
|
2013
|
2012
|
||||||||
|
Beginning balance
|
$
|
153,128
|
|
$
|
87,396
|
|
$
|
70,169
|
|
||
|
Originations
|
43,231
|
|
60,576
|
|
48,839
|
|
|||||
|
Purchases
|
19
|
|
21
|
|
68
|
|
|||||
|
Sale of single family MSRs
|
(43,248
|
)
|
(3)
|
—
|
|
—
|
|
||||
|
Changes due to modeled amortization
(1)
|
(26,112
|
)
|
(24,321
|
)
|
(26,706
|
)
|
|||||
|
Net additions and amortization
|
(26,110
|
)
|
36,276
|
|
22,201
|
|
|||||
|
Changes in fair value due to changes in model inputs and/or assumptions
(2)
|
(14,579
|
)
|
(4)
|
29,456
|
|
(4,974
|
)
|
||||
|
Ending balance
|
$
|
112,439
|
|
$
|
153,128
|
|
$
|
87,396
|
|
||
|
(1)
|
Represents changes due to collection/realization of expected cash flows and curtailments.
|
|
(2)
|
Principally reflects changes in model assumptions, including prepayment speed assumptions, which are primarily affected by changes in mortgage interest rates.
|
|
(3)
|
On June 30, 2014, the Company sold the rights to service
$2.96 billion
in total unpaid principal balance of single family mortgage loans serviced for Fannie Mae.
|
|
(4)
|
Includes pre-tax income of
$5.7 million
, excluding transaction costs, resulting from the sale of single family MSRs on June 30, 2014.
|
MSRs resulting from the sale of multifamily loans are subsequently carried at the lower of amortized cost or fair value. Multifamily MSRs are recorded at fair value and are amortized in proportion to, and over, the estimated period the net servicing income will be collected.
161
The changes in multifamily MSRs measured at the lower of amortized cost or fair value were as follows.
|
|
December 31,
|
||||||||||
|
(in thousands)
|
2014
|
2013
|
2012
|
||||||||
|
Beginning balance
|
$
|
9,335
|
|
$
|
8,097
|
|
$
|
7,112
|
|
||
|
Origination
|
3,260
|
|
3,027
|
|
2,999
|
|
|||||
|
Amortization
|
(1,710
|
)
|
(1,789
|
)
|
(2,014
|
)
|
|||||
|
Ending balance
|
$
|
10,885
|
|
$
|
9,335
|
|
$
|
8,097
|
|
||
At
December 31, 2014
, the expected weighted-average life of the Company’s multifamily MSRs was
9.62
years. Projected amortization expense for the gross carrying value of multifamily MSRs is estimated as follows.
|
(in thousands)
|
At December 31, 2014
|
||
|
2015
|
$
|
1,756
|
|
|
2016
|
1,650
|
|
|
|
2017
|
1,527
|
|
|
|
2018
|
1,370
|
|
|
|
2019
|
1,260
|
|
|
|
2020 and thereafter
|
3,322
|
|
|
|
Carrying value of multifamily MSR
|
$
|
10,885
|
|
The projected amortization expense of multifamily MSRs is an estimate and should be used with caution. The amortization expense for future periods was calculated by applying the same quantitative factors, such as actual MSR prepayment experience and discount rates, which were used to determine amortization expense. These factors are inherently subject to significant fluctuations, primarily due to the effect that changes in interest rates may have on expected loan prepayment experience. Accordingly, any projection of MSR amortization in future periods is limited by the conditions that existed at the time the calculations were performed and may not be indicative of actual amortization expense that will be recorded in future periods.
Commitments
Commitments to extend credit are agreements to lend to customers in accordance with predetermined contractual provisions. These commitments may be for specific periods or contain termination clauses and may require the payment of a fee by the borrower. The total amounts of unused commitments do not necessarily represent future credit exposure or cash requirements in that commitments may expire without being drawn upon.
The Company makes certain unfunded loan commitments as part of its lending activities that have not been recognized in the Company’s financial statements. These include commitments to extend credit made as part of the Company's mortgage lending activities and interest rate lock commitments on loans the Company intends to hold in its loans held for investment portfolio. The aggregate amount of these unrecognized unfunded loan commitments was
$72.0 million
and
$18.4 million
at
December 31, 2014
and
December 31, 2013
, respectively.
In the ordinary course of business, the Company extends secured and unsecured open-end loans to meet the financing needs of its customers. Undistributed construction loan commitments, where the Company has an obligation to advance funds for construction progress payments, were
$379.4 million
and
$168.5 million
at
December 31, 2014
and
December 31, 2013
, respectively. Unused home equity and commercial banking funding lines, totaled
$149.4 million
and
$154.0 million
at
December 31, 2014
and
December 31, 2013
, respectively. The Company has recorded an allowance for credit losses on loan commitments, included in accounts payable and other liabilities on the consolidated statements of financial condition, of
$503 thousand
and
$181 thousand
at
December 31, 2014
and
December 31, 2013
, respectively.
162
The Company is obligated under non-cancelable leases for office space. Generally, the office leases also contain five-year renewal and space options. Rental expense under non-cancelable operating leases totaled
$15.3 million
,
$11.4 million
, and
$7.1 million
for the years ended
December 31, 2014
,
2013
, and
2012
, respectively.
Minimum rental payments for all non-cancelable leases were as follows.
|
(in thousands)
|
At December 31, 2014
|
||
|
2015
|
$
|
14,555
|
|
|
2016
|
15,047
|
|
|
|
2017
|
14,081
|
|
|
|
2018
|
12,406
|
|
|
|
2019
|
9,664
|
|
|
|
2020 and thereafter
|
54,047
|
|
|
|
$
|
119,800
|
|
|
Guarantees
In the ordinary course of business, the Company sells multifamily loans through the Fannie Mae Multifamily Delegated Underwriting and Servicing Program (“DUS®”) that are subject to a credit loss sharing arrangement. The Company services the loans for Fannie Mae and shares in the risk of loss with Fannie Mae under the terms of the DUS contracts. Under the program, the DUS lender is contractually responsible for the first
5%
of losses and then shares equally in the remainder of losses with Fannie Mae with a maximum lender loss of
20%
of the original principal balance of each DUS loan. For loans that have been sold through this program, a liability is recorded for this loss sharing arrangement under the accounting guidance for guarantees. As of
December 31, 2014
and
December 31, 2013
, the total unpaid principal balance of loans sold under this program was
$752.6 million
and
$720.4 million
, respectively. The Company’s reserve liability related to this arrangement totaled
$2.3 million
and
$2.0 million
at
December 31, 2014
and
2013
, respectively. There were
no
actual losses incurred under this arrangement during the years ended
December 31, 2014
,
2013
, and
2012
.
Mortgage repurchase liability
In the ordinary course of business, the Company sells residential mortgage loans to GSEs that include the mortgage loans in GSE-guaranteed mortgage securitizations. In addition, the Company sells FHA-insured and VA-guaranteed mortgage loans that are sold to Ginnie Mae and are used to back Ginnie Mae-guaranteed securities. The Company has made representations and warranties that the loans sold meet certain requirements. The Company may be required to repurchase mortgage loans or indemnify loan purchasers due to defects in the origination process of the loan, such as documentation errors, underwriting errors and judgments, early payment defaults and fraud.
These obligations expose the Company to any credit loss on the repurchased mortgage loans after accounting for any mortgage insurance that it may receive. Generally, the maximum amount of future payments the Company would be required to make for breaches of these representations and warranties would be equal to the unpaid principal balance of such loans that are deemed to have defects that were sold to purchasers plus, in certain circumstances, accrued and unpaid interest on such loans and certain expenses.
The Company does not typically receive repurchase requests from Ginnie Mae, FHA or VA. As an originator of FHA-insured or VA-guaranteed loans, the Company is responsible for obtaining the insurance with FHA or the guarantee with the VA. If loans are later found not to meet the requirements of FHA or VA, through required internal quality control reviews or through agency audits, the Company may be required to indemnify FHA or VA against losses. The loans remain in Ginnie Mae pools unless and until they are repurchased by the Company. In general, once a FHA or VA loan becomes 90 days past due, the Company repurchases the FHA or VA residential mortgage loan to minimize the cost of interest advances on the loan. If the loan is cured through borrower efforts or through loss mitigation activities, the loan may be resold into a Ginnie Mae pool. The Company's liability for mortgage loan repurchase losses incorporates probable losses associated with such indemnification.
The total unpaid principal balance of loans sold on a servicing-retained basis that were subject to the terms and conditions of these representations and warranties totaled
$11.30 billion
and
$11.89 billion
as of
December 31, 2014
and
2013
, respectively. At
December 31, 2014
and
2013
, the Company had recorded a mortgage repurchase liability for loans sold on a servicing-
163
retained and servicing-released basis, included in accounts payable and other liabilities on the consolidated statements of financial condition, of
$2.0 million
and
$1.3 million
, respectively. The Company's mortgage repurchase liability reflects management's estimate of losses for loans sold on a servicing-retained and servicing-released basis for which we could have a repurchase obligation. Actual repurchase losses of
$734 thousand
,
$2.5 million
and
$2.8 million
were incurred for the years ended
December 31, 2014
,
2013
, and
2012
, respectively.
Contingencies
In the normal course of business, the Company may have various legal claims and other similar contingent matters outstanding for which a loss may be realized. For these claims, the Company establishes a liability for contingent losses when it is probable that a loss has been incurred and the amount of loss can be reasonably estimated. For claims determined to be reasonably possible but not probable of resulting in a loss, there may be a range of possible losses in excess of the established liability. At
December 31, 2014
, we reviewed our legal claims and determined that there were
no
claims that are considered to be probable or reasonably possible of resulting in a loss. As a result, the Company
did not have any amounts
reserved for legal claims as of
December 31, 2014
.
Income tax expense (benefit) consisted of following:
|
|
Year Ended December 31,
|
||||||||||
|
(in thousands)
|
2014
|
2013
|
2012
|
||||||||
|
Current (benefit) expense
|
$
|
25,303
|
|
$
|
(21,166
|
)
|
$
|
26,656
|
|
||
|
Deferred expense (benefit)
|
(14,247
|
)
|
32,151
|
|
(5,110
|
)
|
|||||
|
Total income tax expense
|
$
|
11,056
|
|
$
|
10,985
|
|
$
|
21,546
|
|
||
Income tax expense differed from amounts computed at the federal income tax statutory rate as follows:
|
|
Year Ended December 31,
|
||||||||||
|
(in thousands)
|
2014
|
2013
|
2012
|
||||||||
|
Income taxes at statutory rate
|
$
|
11,660
|
|
$
|
12,178
|
|
$
|
36,285
|
|
||
|
Tax-exempt interest
|
(1,265
|
)
|
(1,452
|
)
|
(1,162
|
)
|
|||||
|
State income tax expense net of federal tax benefit
|
221
|
|
148
|
|
333
|
|
|||||
|
Valuation allowance
|
—
|
|
—
|
|
(14,423
|
)
|
|||||
|
Tax credits
|
(717
|
)
|
(293
|
)
|
—
|
|
|||||
|
Low Income Housing Tax Credit Partnerships
|
617
|
|
—
|
|
—
|
|
|||||
|
Change in state rate
|
248
|
|
—
|
|
—
|
|
|||||
|
Other, net
|
292
|
|
404
|
|
513
|
|
|||||
|
Total income tax expense
|
$
|
11,056
|
|
$
|
10,985
|
|
$
|
21,546
|
|
||
164
Deferred income taxes reflect the net tax effect of temporary differences between the carrying amounts of assets and liabilities for financial reporting purposes and those amounts used for tax return purposes. The tax effect of temporary differences that give rise to significant portions of deferred tax assets and deferred tax liabilities consisted of the following:
|
At December 31,
|
|||||||
|
(in thousands)
|
2014
|
2013
|
|||||
|
Deferred tax assets:
|
|||||||
|
Provision for loan losses
|
$
|
11,890
|
|
$
|
11,165
|
|
|
|
Federal and state net operating loss carryforwards
|
10,044
|
|
7,056
|
|
|||
|
Section 382 built-in loss limitation
|
5,291
|
|
10,145
|
|
|||
|
Other real estate owned
|
468
|
|
977
|
|
|||
|
Accrued liabilities
|
2,199
|
|
1,975
|
|
|||
|
Other investments
|
330
|
|
326
|
|
|||
|
Leases
|
1,153
|
|
1,018
|
|
|||
|
Unrealized loss on investment securities available for sale
|
—
|
|
7,051
|
|
|||
|
Tax credits
|
3,358
|
|
2,443
|
|
|||
|
Stock options
|
902
|
|
489
|
|
|||
|
Loan valuation
|
497
|
|
—
|
|
|||
|
Other, net
|
236
|
|
176
|
|
|||
|
36,368
|
|
42,821
|
|
||||
|
Deferred tax liabilities:
|
|||||||
|
Mortgage servicing rights
|
(34,030
|
)
|
(48,402
|
)
|
|||
|
Unrealized gain on investment securities available for sale
|
(252
|
)
|
—
|
|
|||
|
FHLB dividends
|
(4,348
|
)
|
(4,310
|
)
|
|||
|
Deferred loan fees and costs
|
(1,943
|
)
|
(2,290
|
)
|
|||
|
Premises and equipment
|
(1,865
|
)
|
(859
|
)
|
|||
|
Other intangibles - core deposit intangible
|
(700
|
)
|
(737
|
)
|
|||
|
Other, net
|
(242
|
)
|
(23
|
)
|
|||
|
(43,380
|
)
|
(56,621
|
)
|
||||
|
Net deferred tax (liability) asset
|
$
|
(7,012
|
)
|
$
|
(13,800
|
)
|
|
Net deferred tax assets are included in the accounts receivable and other assets line item within the consolidated statements of financial condition. Net deferred tax liabilities are included in accounts payable and other liabilities on the consolidated statements of financial condition.
As a consequence of our initial public offering in February 2012, the Company experienced a change of control within the meaning of Section 382 of the Internal Revenue Code of 1986, as amended. Section 382 substantially limits the ability of a corporate taxpayer to use recognized built-in losses and net operating loss carryforwards incurred prior to the change of control against income earned after a change of control. Based on our analysis, the change of control will not result in a loss of deferred tax benefits other than a small impact on deferred tax assets related to state income taxes in Oregon.
Management assesses the available positive and negative evidence to estimate if sufficient future taxable income will be generated to utilize the existing deferred tax assets. During the second quarter of 2012, management analyzed the positive and negative evidence which included the Company reporting its fifth consecutive quarter of profitability, the future reversals of deferred tax assets and deferred tax liabilities over a similar period of time, future expectations of profitability, significant improvement in overall asset quality and related credit/risk metrics and the expectation that we will be able to exit a three-year cumulative pre-tax loss position in 2012. Management continues to assess the positive and negative evidence of the need for a valuation allowance. As of
December 31, 2014
management determined that sufficient evidence exists to support the future utilization of the Company’s deferred tax assets.
165
At
December 31, 2014
, the Company has federal net operating loss carryforwards totaling
$27.9 million
, which expire between
2024
and
2031
. The Company has a Section 382 recognized built-in loss carryforwards of
$14.9 million
as of
December 31, 2014
which expires in
2032
. In addition, as of
December 31, 2014
, the Company has an alternative minimum tax credit of
$3.3 million
that may be carried forward indefinitely. The Company also has state net operating loss carryforwards of
$6.6 million
that expire between 2015 and 2030.
Retained earnings at
December 31, 2014
and
2013
include approximately
$12.7 million
in tax basis bad debt reserves for which no income tax liability has been recorded. In the future, if this tax basis bad debt reserve is used for purposes other than to absorb bad debts or the Company no longer qualifies as a bank, the Company will incur a federal tax liability at the then prevailing corporate tax rate estimated at
$4.4 million
as of
December 31, 2014
.
There were
no
unrecognized tax benefits at
December 31, 2014
and
2013
. The Company does not anticipate a significant increase with respect to its unrecognized tax benefits within the next twelve months.
The Company’s income tax returns are open for examination for the tax years 2012 through 2014.
The Company maintains a 401(k) Savings and Employee Stock Ownership Plan (the “Plan”) for the benefit of its employees. Effective January 1, 2011, the employee stock ownership plan portion of the Plan became a separate plan named the HomeStreet, Inc. Employee Stock Ownership Plan and Trust (the “ESOP”). Net assets of approximately
$6.7 million
were transferred from the Plan to the ESOP. The Plan was renamed the HomeStreet, Inc. 401(k) Savings Plan. The ESOP and 401(k) Savings Plan covers substantially all employees of the Company after completion of the required length of service and provides for payment of retirement benefits to employees pursuant to the provisions of the plans. Effective July 31, 2012, the ESOP was merged into the Plan.
Prior to September 1, 2012, the Company employer-matching contribution to the 401(k) Savings Plan was 50% of the first 6% of an employee’s eligible compensation that was contributed by the employee. Effective September 1, 2012, new employees are automatically enrolled in the 401(k) Savings Plan at a
3%
deferral rate unless they elect otherwise. Participants receive a vested employer matching contribution equal to 100% of the first
3%
of eligible compensation deferred by the participant and 50% of the next
2%
of eligible compensation deferred by the participant.
Salaries and related costs for the years ended
December 31, 2014
,
2013
, and
2012
, included employer contributions of
$4.5 million
,
$3.7 million
and
$1.4 million
, respectively.
For the years ended
December 31, 2014
,
2013
, and
2012
, the Company recognized
$1.5 million
,
$1.1 million
, and
$2.8 million
of compensation cost, respectively, for share-based compensation awards.
2014 Equity Incentive Plan
In May 2014, the shareholders approved the Company's 2014 Equity Incentive Plan (the “2014 EIP”). Under the 2014 EIP, all of the Company’s officers, employees, directors and/or consultants are eligible to receive awards. Awards which may be granted under the 2014 EIP include incentive stock options, non-qualified stock options, stock appreciation rights, restricted stock awards, restricted stock units, unrestricted stock, performance share awards and performance compensation awards. The maximum amount of HomeStreet, Inc. common stock available for grant under the 2014 EIP is
900,000
shares, which includes shares of common stock that were still available for issuance under the 2010 Plan and the 2011 Plan.
2010 Equity Incentive Plan
In January 2010, the shareholders approved the Company's 2010 Equity Incentive Plan (the “2010 EIP”). Under the 2010 EIP, all of the Company’s officers, employees, directors and/or consultants are eligible to receive awards. Awards that may be granted under the 2010 EIP include incentive stock options, nonqualified stock options, stock appreciation rights, restricted stock awards, restricted stock unit awards, stock bonus awards and incentive bonus awards, or a combination of the foregoing. The 2010 EIP became effective during February 2012, upon the completion of the Company’s initial public offering.
166
Under the 2010 EIP, the exercise price of an option may not be less than the fair market value of a share of common stock at the grant date. The options generally vest on a graded schedule from one to five years, depending on the terms of the grant, and generally expire ten years from the grant date.
During the latter part of 2010, nonqualified stock options were granted outside of, but under substantially the same terms as, the 2010 EIP. This issuance was assessed against the maximum number of shares available for grant under the 2010 EIP. This issuance was approved by the Board of Directors and appropriate regulatory agencies and option grants were issued to key senior management personnel.
Nonqualified Stock Options
The Company grants nonqualified options to key senior management personnel. A summary of changes in nonqualified stock options granted for the year ended
December 31, 2014
is as follows:
|
Number
|
Weighted
Average
Exercise Price
|
Weighted
Average
Remaining
Contractual
Term
|
Aggregate
Intrinsic Value
(2)
(in thousands)
|
|||||||||
|
Options outstanding at December 31, 2013
|
654,216
|
|
$
|
11.54
|
|
8.1 years
|
$
|
5,559
|
|
|||
|
Granted
|
—
|
|
—
|
|
0.0 years
|
—
|
|
|||||
|
Cancelled or forfeited
|
(9,688
|
)
|
11.00
|
|
7.1 years
|
62
|
|
|||||
|
Exercised
|
(43,504
|
)
|
2.98
|
|
6.1 years
|
734
|
|
|||||
|
Options outstanding at December 31, 2014
|
601,024
|
|
12.16
|
|
7.2 years
|
3,329
|
|
|||||
|
Options that are exercisable and expected to be exercisable
(1)
|
597,666
|
|
12.17
|
|
7.2 years
|
3,308
|
|
|||||
|
Options exercisable
|
397,981
|
|
$
|
11.97
|
|
7.2 years
|
$
|
2,271
|
|
|||
|
(1)
|
Adjusted for estimated forfeitures.
|
|
(2)
|
Intrinsic value is the amount by which fair value of the underlying stock exceeds the exercise price.
|
Under this plan,
43,504
options have been exercised during the year ended
December 31, 2014
, resulting in cash received and related income tax benefits totaling
$130 thousand
. As of
December 31, 2014
, there was
$301 thousand
of total unrecognized compensation costs related to stock options. Compensation costs are recognized over the requisite service period, which typically is the vesting period. Unrecognized compensation costs are expected to be recognized over the remaining weighted-average requisite service period of
three months
.
As observable market prices are generally not available for estimating the fair value of stock options, an option-pricing model is utilized to estimate fair value. The fair value of the options granted during
2013
and
2012
was estimated as of the grant date using a Black-Scholes Merton (“Black-Scholes”) model and the assumptions noted in the following table. There were no options granted during the year ended
December 31, 2014
.
|
Year Ended December 31,
|
|||||||
|
2013
|
2012
|
||||||
|
Weighted-average fair value per share
|
$
|
8.78
|
|
$
|
4.00
|
|
|
|
Expected term of the option
|
6 years
|
|
6 years
|
|
|||
|
Expected stock price volatility
|
50.04
|
%
|
33.13
|
%
|
|||
|
Annual risk-free interest rate
|
1.18
|
%
|
1.23
|
%
|
|||
|
Expected annual dividend yield
|
2.03
|
%
|
2.26
|
%
|
|||
The weighted-average expected term of
6 years
used to value option awards issued in 2013 and 2012 was an estimate based on an expectation that the holders of the stock options, once vested, will exercise them – ultimately reflecting the settlement of all
167
vested options. As the Company did not have historical exercise behavior to reference for these types of options, the Company leveraged the “simplified” method for estimating the expected term of these “plain vanilla” stock options.
When estimating expected volatility and the dividend yield, the Company considered historical data of other similar entities that were publicly traded over a period commensurate with the life of the options. A single median was derived for each input from this population.
Restricted Shares
The Company grants restricted shares to key senior management personnel and directors. A summary of the status of restricted shares follows.
|
Number
|
Weighted
Average
Grant Date Fair Value
|
|||||
|
Restricted shares outstanding at December 31, 2013
|
53,951
|
|
$
|
18.18
|
|
|
|
Granted
|
74,645
|
|
17.99
|
|
||
|
Cancelled or forfeited
|
—
|
|
—
|
|
||
|
Vested
|
(10,079
|
)
|
15.88
|
|
||
|
Restricted shares outstanding at December 31, 2014
|
118,517
|
|
18.26
|
|
||
|
Nonvested at December 31, 2014
|
118,517
|
|
$
|
18.26
|
|
|
The Company recognized
$644 thousand
in compensation expense for restricted shares during the year ended
December 31, 2014
. At
December 31, 2014
, there was
$1.5 million
of total unrecognized compensation cost related to nonvested restricted shares. Unrecognized compensation cost is generally expected to be recognized over a weighted average period of
2.0 years
. Restricted shares granted to non-employee directors vest one-third at each one year anniversary from the grant date. Restricted shares granted to senior management vest based upon the achievement of certain market conditions. One-third vested when the 30-day rolling average share price exceeded
25%
of the grant date fair value; one-third vested when the 30-day rolling average share price exceeded
40%
of the grant date fair value; and one-third vested when the 30-day rolling average share price exceeded
50%
of the grant date fair value. The Company accrues compensation expense based upon an estimate of the awards' expected vesting period. If a market condition is satisfied prior to the end of the estimated vesting period any unrecognized compensation costs associated with the portion of restricted shares that vested earlier than expected are immediately recognized in earnings.
Certain restricted stock awards granted to senior management during the second quarter of 2014 contain both service conditions and performance conditions. Performance share units ("PSUs") are stock awards where the number of shares ultimately received by the employee depends on the company’s performance against specified targets and vest over a three-year period. The fair value of each PSU is determined on the grant date, based on the company’s stock price, and assumes that performance targets will be achieved. Over the performance period, the number of shares of stock that will be issued is adjusted upward or downward based upon the probability of achievement of performance targets. The ultimate number of shares issued and the related compensation cost recognized as expense will be based on a comparison of the final performance metrics to the specified targets. Compensation cost will be recognized over the requisite three-year service period on a straight-line basis and adjusted for changes in the probability that the performance targets will be achieved.
The term "fair value" is defined as the price that would be received to sell an asset or paid to transfer a liability in an orderly transaction between market participants at the measurement date. A fair value measurement assumes that the transaction to sell the asset or transfer the liability occurs in the principal market for the asset or liability or, in the absence of a principal market, the most advantageous market for the asset or liability. The Company’s approach is to maximize the use of observable inputs and minimize the use of unobservable inputs when developing fair value measurements.
168
Fair Value Hierarchy
A three-level valuation hierarchy has been established under ASC 820 for disclosure of fair value measurements. The valuation hierarchy is based on the observability of inputs to the valuation of an asset or liability as of the measurement date. A financial instrument’s categorization within the valuation hierarchy is based on the lowest level of input that is significant to the fair value measurement. The levels are defined as follows:
|
•
|
Level 1 – Quoted prices (unadjusted) in active markets for identical assets or liabilities that the reporting entity can access at the measurement date. An active market for the asset or liability is a market in which transactions for the asset or liability take place with sufficient frequency and volume to provide pricing information on an ongoing basis.
|
|
•
|
Level 2 – Inputs other than quoted prices included within Level 1 that are observable for the asset or liability, either directly or indirectly. This includes quoted prices for similar assets and liabilities in active markets and inputs that are observable for the asset or liability for substantially the full term of the financial instrument.
|
|
•
|
Level 3 – Unobservable inputs for the asset or liability. These inputs reflect the Company’s assumptions of what market participants would use in pricing the asset or liability.
|
The Company's policy regarding transfers between levels of the fair value hierarchy is that all transfers are assumed to occur at the end of the reporting period.
Valuation Processes
The Company has various processes and controls in place to ensure that fair value measurements are reasonably estimated. The Finance Committee provides oversight and approves the Company’s Asset/Liability Management Policy ("ALMP"). The Company's ALMP governs, among other things, the application and control of the valuation models used to measure fair value. On a quarterly basis, the Company’s Asset/Liability Management Committee ("ALCO") and the Finance Committee of the Board review significant modeling variables used to measure the fair value of the Company’s financial instruments, including the significant inputs used in the valuation of single family MSRs. Additionally, at least annually ALCO obtains an independent review of the MSR valuation process and procedures, including a review of the model architecture and the valuation assumptions. The Company obtains an MSR valuation from an independent valuation firm monthly to assist with the validation of the fair value estimate and the reasonableness of the assumptions used in measuring fair value.
The Company’s real estate valuations are overseen by the Company’s appraisal department, which is independent of the Company’s lending and credit administration functions. The appraisal department maintains the Company’s appraisal policy and recommends changes to the policy subject to approval by the Company’s Loan Committee and the Credit Committee of the Board. The Company’s appraisals are prepared by independent third-party appraisers and the Company’s internal appraisers. Single family appraisals are generally reviewed by the Company’s single family loan underwriters. Single family appraisals with unusual, higher risk or complex characteristics, as well as commercial real estate appraisals, are reviewed by the Company’s appraisal department.
We obtain pricing from third party service providers for determining the fair value of a substantial portion of our investment securities available for sale. We have processes in place to evaluate such third party pricing services to ensure information obtained and valuation techniques used are appropriate. For fair value measurements obtained from third party services, we monitor and review the results to ensure the values are reasonable and in line with market experience for similar classes of securities. While the inputs used by the pricing vendor in determining fair value are not provided, and therefore unavailable for our review, we do perform certain procedures to validate the values received, including comparisons to other sources of valuation (if available), comparisons to other independent market data and a variance analysis of prices by Company personnel that are not responsible for the performance of the investment securities.
Estimation of Fair Value
Fair value is based on quoted market prices, when available. In cases where a quoted price for an asset or liability is not available, the Company uses valuation models to estimate fair value. These models incorporate inputs such as forward yield curves, loan prepayment assumptions, expected loss assumptions, market volatilities, and pricing spreads utilizing market-based inputs where readily available. The Company believes its valuation methods are appropriate and consistent with those that would be used by other market participants. However, imprecision in estimating unobservable inputs and other factors may result in these fair value measurements not reflecting the amount realized in an actual sale or transfer of the asset or liability in a current market exchange.
169
The following table summarizes the fair value measurement methodologies, including significant inputs and assumptions, and classification of the Company’s assets and liabilities.
|
Asset/Liability class
|
|
Valuation methodology, inputs and assumptions
|
|
Classification
|
|
Cash and cash equivalents
|
|
Carrying value is a reasonable estimate of fair value based on the short-term nature of the instruments.
|
|
Estimated fair value classified as Level 1.
|
|
Investment securities available for sale
|
|
Observable market prices of identical or similar securities are used where available.
If market prices are not readily available, value is based on discounted cash flows using the following significant inputs:
• Expected prepayment speeds
• Estimated credit losses
• Market liquidity adjustments
|
|
Level 2 recurring fair value measurement
|
|
Loans held for sale
|
|
|
||
|
Single-family loans
|
|
Fair value is based on observable market data, including:
• Quoted market prices, where available
• Dealer quotes for similar loans
• Forward sale commitments
|
|
Level 2 recurring fair value measurement
|
|
Multifamily loans
|
|
The sale price is set at the time the loan commitment is made, and as such subsequent changes in market conditions have a very limited effect, if any, on the value of these loans carried on the consolidated statements of financial condition, which are typically sold within 30 days of origination.
|
|
Carried at lower of amortized cost or fair value.
Estimated fair value classified as Level 2.
|
|
Loans held for investment
|
|
|
||
|
Loans held for investment, excluding collateral dependent loans
|
|
Fair value is based on discounted cash flows, which considers the following inputs:
• Current lending rates for new loans
• Expected prepayment speeds
• Estimated credit losses
• Market liquidity adjustments
|
|
For the carrying value of loans see Note 1–
Summary of Significant Accounting Policies.
Estimated fair value classified as Level 3.
|
|
Loans held for investment, collateral dependent
|
|
Fair value is based on appraised value of collateral, which considers sales comparison and income approach methodologies. Adjustments are made for various factors, which may include:
• Adjustments for variations in specific property qualities such as location, physical dissimilarities, market conditions at the time of sale, income producing characteristics and other factors
• Adjustments to obtain “upon completion” and “upon stabilization” values (e.g., property hold discounts where the highest and best use would require development of a property over time)
• Bulk discounts applied for sales costs, holding costs and profit for tract development and certain other propertie
s
|
|
Carried at lower of amortized cost or fair value of collateral, less the estimated cost to sell.
Classified as a Level 3 nonrecurring fair value measurement in periods where carrying value is adjusted to reflect the fair value of collateral.
|
170
|
Asset/Liability class
|
|
Valuation methodology, inputs and assumptions
|
|
Classification
|
|
Mortgage servicing rights
|
|
|
||
|
Single family MSRs
|
|
For information on how the Company measures the fair value of its single family MSRs, including key economic assumptions and the sensitivity of fair value to changes in those assumptions, see
|
|
Level 3 recurring fair value measurement
|
|
Multifamily MSRs
|
|
Fair value is based on discounted estimated future servicing fees and other revenue, less estimated costs to service the loans.
|
|
Carried at lower of amortized cost or fair value
Estimated fair value classified as Level 3.
|
|
Derivatives
|
|
|
|
|
|
Interest rate swaps
Interest rate swaptions
Forward sale commitments
|
Fair value is based on quoted prices for identical or similar instruments, when available.
When quoted prices are not available, fair value is based on internally developed modeling techniques, which require the use of multiple observable market inputs including: • Forward interest rates • Interest rate volatilities |
Level 2 recurring fair value measurement
|
||
|
Interest rate lock commitments
|
The fair value considers several factors including:
• Fair value of the underlying loan based on quoted prices in the secondary market, when available.
• Value of servicing
• Fall-out factor
|
Level 3 recurring fair value measurement
|
||
|
Other real estate owned (“OREO”)
|
|
Fair value is based on appraised value of collateral, less the estimated cost to sell. See discussion of "loans held for investment, collateral dependent" above for further information on appraisals.
|
|
Carried at lower of amortized cost or fair value of collateral (Level 3), less the estimated cost to sell.
|
|
Federal Home Loan Bank stock
|
|
Carrying value approximates fair value as FHLB stock can only be purchased or redeemed at par value.
|
|
Carried at par value.
Estimated fair value classified as Level 2.
|
|
Deposits
|
|
|
||
|
Demand deposits
|
|
Fair value is estimated as the amount payable on demand at the reporting date.
|
|
Carried at historical cost.
Estimated fair value classified as Level 2.
|
|
Fixed-maturity certificates of deposit
|
|
Fair value is estimated using discounted cash flows based on market rates currently offered for deposits of similar remaining time to maturity.
|
|
Carried at historical cost.
Estimated fair value classified as Level 2.
|
|
Federal Home Loan Bank advances
|
|
Fair value is estimated using discounted cash flows based on rates currently available for advances with similar terms and remaining time to maturity.
|
|
Carried at historical cost.
Estimated fair value classified as Level 2.
|
|
Long-term debt
|
|
Fair value is estimated using discounted cash flows based on current lending rates for similar long-term debt instruments with similar terms and remaining time to maturity.
|
|
Carried at historical cost.
Estimated fair value classified as Level 2.
|
171
The following table presents the levels of the fair value hierarchy for the Company’s assets and liabilities measured at fair value on a recurring basis.
|
(in thousands)
|
Fair Value at December 31, 2014
|
Level 1
|
Level 2
|
Level 3
|
|||||||||||
|
Assets:
|
|||||||||||||||
|
Investment securities available for sale
|
|||||||||||||||
|
Mortgage backed securities:
|
|||||||||||||||
|
Residential
|
$
|
107,280
|
|
$
|
—
|
|
$
|
107,280
|
|
$
|
—
|
|
|||
|
Commercial
|
13,671
|
|
—
|
|
13,671
|
|
—
|
|
|||||||
|
Municipal bonds
|
122,334
|
|
—
|
|
122,334
|
|
—
|
|
|||||||
|
Collateralized mortgage obligations:
|
|
||||||||||||||
|
Residential
|
43,166
|
|
—
|
|
43,166
|
|
—
|
|
|||||||
|
Commercial
|
20,486
|
|
—
|
|
20,486
|
|
—
|
|
|||||||
|
Corporate debt securities
|
79,400
|
|
—
|
|
79,400
|
|
—
|
|
|||||||
|
U.S. Treasury securities
|
40,989
|
|
—
|
|
40,989
|
|
—
|
|
|||||||
|
Single family mortgage servicing rights
|
112,439
|
|
—
|
|
—
|
|
112,439
|
|
|||||||
|
Single family loans held for sale
|
610,350
|
|
—
|
|
610,350
|
|
—
|
|
|||||||
|
Derivatives
|
|||||||||||||||
|
Forward sale commitments
|
1,071
|
|
—
|
|
1,071
|
|
—
|
|
|||||||
|
Interest rate lock commitments
|
11,939
|
|
—
|
|
—
|
|
11,939
|
|
|||||||
|
Interest rate swaps
|
11,689
|
|
—
|
|
11,689
|
|
—
|
|
|||||||
|
Total assets
|
$
|
1,174,814
|
|
$
|
—
|
|
$
|
1,050,436
|
|
$
|
124,378
|
|
|||
|
Liabilities:
|
|||||||||||||||
|
Derivatives
|
|||||||||||||||
|
Forward sale commitments
|
5,658
|
|
$
|
—
|
|
$
|
5,658
|
|
$
|
—
|
|
||||
|
Interest rate lock commitments
|
6
|
|
—
|
|
—
|
|
6
|
|
|||||||
|
Interest rate swaps
|
972
|
|
—
|
|
972
|
|
—
|
|
|||||||
|
Total liabilities
|
$
|
6,636
|
|
$
|
—
|
|
$
|
6,630
|
|
$
|
6
|
|
|||
172
|
(in thousands)
|
Fair Value at December 31, 2013
|
Level 1
|
Level 2
|
Level 3
|
|||||||||||
|
Assets:
|
|||||||||||||||
|
Investment securities available for sale
|
|||||||||||||||
|
Mortgage backed securities:
|
|||||||||||||||
|
Residential
|
$
|
133,910
|
|
$
|
—
|
|
$
|
133,910
|
|
$
|
—
|
|
|||
|
Commercial
|
13,433
|
|
—
|
|
13,433
|
|
—
|
|
|||||||
|
Municipal bonds
|
130,850
|
|
—
|
|
130,850
|
|
—
|
|
|||||||
|
Collateralized mortgage obligations:
|
|||||||||||||||
|
Residential
|
90,327
|
|
—
|
|
90,327
|
|
—
|
|
|||||||
|
Commercial
|
16,845
|
|
—
|
|
16,845
|
|
—
|
|
|||||||
|
Corporate debt securities
|
68,866
|
|
—
|
|
68,866
|
|
—
|
|
|||||||
|
U.S. Treasury securities
|
27,452
|
|
—
|
|
27,452
|
|
—
|
|
|||||||
|
Single family mortgage servicing rights
|
153,128
|
|
—
|
|
—
|
|
153,128
|
|
|||||||
|
Single family loans held for sale
|
279,385
|
|
—
|
|
279,385
|
|
—
|
|
|||||||
|
Derivatives
|
|
||||||||||||||
|
Forward sale commitments
|
3,630
|
|
—
|
|
3,630
|
|
—
|
|
|||||||
|
Swaptions
|
858
|
|
—
|
|
858
|
|
—
|
|
|||||||
|
Interest rate lock commitments
|
6,012
|
|
—
|
|
—
|
|
6,012
|
|
|||||||
|
Interest rate swaps
|
1,088
|
|
—
|
|
1,088
|
|
—
|
|
|||||||
|
Total assets
|
$
|
925,784
|
|
$
|
—
|
|
$
|
766,644
|
|
$
|
159,140
|
|
|||
|
Liabilities:
|
|||||||||||||||
|
Derivatives
|
|||||||||||||||
|
Forward sale commitments
|
$
|
578
|
|
$
|
—
|
|
$
|
578
|
|
$
|
—
|
|
|||
|
Interest rate swaptions
|
199
|
|
—
|
|
199
|
|
—
|
|
|||||||
|
Interest rate lock commitments
|
40
|
|
—
|
|
—
|
|
40
|
|
|||||||
|
Interest rate swaps
|
9,548
|
|
—
|
|
9,548
|
|
—
|
|
|||||||
|
Total liabilities
|
$
|
10,365
|
|
$
|
—
|
|
$
|
10,325
|
|
$
|
40
|
|
|||
Level 3 Recurring Fair Value Measurements
The Company's level 3 recurring fair value measurements consist of single family mortgage servicing rights and interest rate lock commitments, which are accounted for as derivatives. For information regarding fair value changes and activity for single family MSRs during the years ended
December 31, 2014
and
2013
, see Note 12,
Mortgage Banking Operations
.
The fair value of IRLCs considers several factors including the fair value in the secondary market of the underlying loan resulting from the exercise of the commitment, the expected net future cash flows related to the associated servicing of the loan (referred to as the value of servicing) and the probability that the commitment will not be converted into a funded loan (referred to as a fall-out factor). The fair value of IRLCs on loans held for sale, while based on interest rates observable in the market, is highly dependent on the ultimate closing of the loans. The significance of the fall-out factor to the fair value measurement of an individual IRLC is generally highest at the time that the rate lock is initiated and declines as closing procedures are performed and the underlying loan gets closer to funding. The fall-out factor applied is based on historical experience. The value of servicing is impacted by a variety of factors, including prepayment assumptions, discount rates, delinquency rates, contractually specified servicing fees, servicing costs, and underlying portfolio characteristics. Because these inputs are not observable in market trades, the fall-out factor and value of servicing are considered to be level 3 inputs. The fair value of IRLCs decreases in value upon an increase in the fall-out factor and increases in value upon an increase in the value of servicing. Changes in the fall-out factor and value of servicing do not increase or decrease based on movements in other significant unobservable inputs.
The Company recognizes unrealized gains and losses from the time that an IRLC is initiated until the gain or loss is realized at the time the loan closes, which generally occurs within 30-90 days. For IRLCs that fall out, any unrealized gain or loss is reversed, which generally occurs at the end of the commitment period. The gains and losses recognized on IRLC derivatives generally correlates to volume of single family interest rate lock commitments made during the reporting period (after adjusting
173
for estimated fallout) while the amount of unrealized gains and losses realized at settlement generally correlates to the volume of single family closed loans during the reporting period.
The following table presents fair value changes and activity for level 3 interest rate lock commitments.
|
Year Ended December 31,
|
||||||||
|
(in thousands)
|
2014
|
2013
|
||||||
|
Beginning balance, net
|
$
|
5,972
|
|
$
|
22,528
|
|
||
|
Total realized/unrealized gains
(1)
|
118,708
|
|
123,068
|
|
||||
|
Settlements
|
(112,747
|
)
|
(139,624
|
)
|
||||
|
Ending balance, net
|
$
|
11,933
|
|
$
|
5,972
|
|
||
|
(1)
|
All realized and unrealized gains and losses are recognized in earnings as net gain from mortgage loan origination and sale activities on the consolidated statement of operations. There were net unrealized gains (losses) of
$11.9 million
and
$6.0 million
for the years ended
December 31, 2014
and
2013
, respectively, recognized on interest rate lock commitments outstanding at
December 31, 2014
and
2013
, respectively.
|
In the first quarter of 2013, the Company refined the valuation methodology used for interest rate lock commitments to reflect assumptions that the Company believes a market participant would consider under current market conditions. This change in accounting estimate resulted in an increase in fair value of
$4.3 million
to the Company's interest rate lock commitments outstanding at March 31, 2013.
The following information presents significant Level 3 unobservable inputs used to measure fair value of interest rate lock commitments.
|
(dollars in thousands)
|
At December 31, 2014
|
||||||||||||
|
Fair Value
|
Valuation
Technique
|
Significant Unobservable
Input
|
Low
|
High
|
Weighted Average
|
||||||||
|
Interest rate lock commitments, net
|
$
|
11,933
|
|
Income approach
|
Fall out factor
|
0.6%
|
77.9%
|
21.4%
|
|||||
|
Value of servicing
|
0.56%
|
1.94%
|
0.93%
|
||||||||||
|
(dollars in thousands)
|
At December 31, 2013
|
||||||||||||
|
Fair Value
|
Valuation
Technique
|
Significant Unobservable
Input
|
Low
|
High
|
Weighted Average
|
||||||||
|
Interest rate lock commitments, net
|
$
|
5,972
|
|
Income approach
|
Fall out factor
|
0.5%
|
97.0%
|
17.8%
|
|||||
|
Value of servicing
|
0.62%
|
2.65%
|
1.22%
|
||||||||||
Nonrecurring Fair Value Measurements
Certain assets held by the Company are not included in the tables above, but are measured at fair value on a nonrecurring basis. These assets include certain loans held for investment and other real estate owned that are carried at the lower of cost or fair value of the underlying collateral, less the estimated cost to sell. The estimated fair values of real estate collateral are generally based on internal evaluations and appraisals of such collateral, which use the market approach and income approach methodologies. All impaired loans are subject to an internal evaluation completed quarterly by management as part of the allowance process.
The fair value of commercial properties are generally based on third-party appraisals that consider recent sales of comparable properties, including their income generating characteristics, adjusted (generally based on unobservable inputs) to reflect the general assumptions that a market participant would make when analyzing the property for purchase. The Company uses a fair value of collateral technique to apply adjustments to the appraisal value of certain commercial loans held for investment that are collateralized by real estate. During the year ended
December 31, 2014
, the Company recorded no adjustments to the
174
appraisal values of certain commercial loans held for investment that are collateralized by real estate. The Company uses a fair value of collateral technique to apply adjustments to the stated value of certain commercial loans held for investment that are not collateralized by real estate. During the year ended
December 31, 2014
, the Company applied a range of stated value adjustments of
10.0%
to
100.0%
, with a weighted average rate of
41.8%
. During the year ended
December 31, 2014
, the Company did not apply any adjustment to the appraisal value of OREO. During the year ended
December 31, 2013
, the Company did not apply any adjustments to the appraisal value of loans held for investment or OREO.
Residential properties are generally based on unadjusted third-party appraisals. Factors considered in determining the fair value include geographic sales trends, the value of comparable surrounding properties as well as the condition of the property.
These adjustments may increase or decrease an appraised value and can vary significantly depending on the location, physical characteristics and income producing potential of each individual property. The quality and volume of market information available at the time of the appraisal can vary from period-to-period and cause significant changes to the nature and magnitude of the unobservable inputs used. Given these variations, changes in these unobservable inputs are generally not a reliable indicator for how fair value will increase or decrease from period to period.
The following table presents assets that had changes in their recorded at fair value during the years ended
December 31, 2014
and
2013
and still held at the end of the respective reporting period.
|
Twelve Months Ended December 31, 2014
|
|||||||||||||||||||
|
(in thousands)
|
Fair Value of Assets Held at December 31, 2014
|
Level 1
|
Level 2
|
Level 3
|
Total Gains (Losses)
|
||||||||||||||
|
Loans held for investment
(1)
|
$
|
19,021
|
|
—
|
|
—
|
|
$
|
19,021
|
|
$
|
(207
|
)
|
||||||
|
Other real estate owned
(2)
|
6,706
|
|
—
|
|
—
|
|
6,706
|
|
(41
|
)
|
|||||||||
|
Total
|
$
|
25,727
|
|
$
|
—
|
|
$
|
—
|
|
$
|
25,727
|
|
$
|
(248
|
)
|
||||
|
Twelve Months Ended December 31, 2013
|
|||||||||||||||||||
|
(in thousands)
|
Fair Value of Assets Held at December 31, 2013
|
Level 1
|
Level 2
|
Level 3
|
Total Losses
|
||||||||||||||
|
Loans held for investment
(1)
|
$
|
44,422
|
|
—
|
|
—
|
|
$
|
44,422
|
|
$
|
(1,629
|
)
|
||||||
|
Other real estate owned
(2)
|
12,959
|
|
—
|
|
—
|
|
12,959
|
|
574
|
|
|||||||||
|
Total
|
$
|
57,381
|
|
$
|
—
|
|
$
|
—
|
|
$
|
57,381
|
|
$
|
(1,055
|
)
|
||||
|
(1)
|
Represents the carrying value of loans for which adjustments are based on the fair value of the collateral.
|
|
(2)
|
Represents other real estate owned where an updated fair value of collateral is used to adjust the carrying amount subsequent to the initial classification as other real estate owned.
|
175
Fair Value of Financial Instruments
The following presents the carrying value, estimated fair value and the levels of the fair value hierarchy for the Company’s financial instruments other than assets and liabilities measured at fair value on a recurring basis.
|
|
At December 31, 2014
|
||||||||||||||||||
|
(in thousands)
|
Carrying
Value
|
Fair
Value
|
Level 1
|
Level 2
|
Level 3
|
||||||||||||||
|
Assets:
|
|||||||||||||||||||
|
Cash and cash equivalents
|
$
|
30,502
|
|
$
|
30,502
|
|
$
|
30,502
|
|
$
|
—
|
|
$
|
—
|
|
||||
|
Investment securities held to maturity
|
28,006
|
|
28,537
|
|
—
|
|
28,537
|
|
—
|
|
|||||||||
|
Loans held for investment
|
2,099,129
|
|
2,150,672
|
|
—
|
|
—
|
|
2,150,672
|
|
|||||||||
|
Loans held for sale – multifamily
|
10,885
|
|
10,855
|
|
—
|
|
10,855
|
|
—
|
|
|||||||||
|
Mortgage servicing rights – multifamily
|
10,885
|
|
12,540
|
|
—
|
|
—
|
|
12,540
|
|
|||||||||
|
Federal Home Loan Bank stock
|
33,915
|
|
33,915
|
|
—
|
|
33,915
|
|
—
|
|
|||||||||
|
Liabilities:
|
|||||||||||||||||||
|
Deposits
|
$
|
2,445,430
|
|
$
|
2,445,635
|
|
$
|
—
|
|
$
|
2,445,635
|
|
$
|
—
|
|
||||
|
Federal Home Loan Bank advances
|
597,590
|
|
600,599
|
|
—
|
|
600,599
|
|
—
|
|
|||||||||
|
Federal funds purchased and securities sold under agreements to repurchase
|
50,000
|
|
50,000
|
|
—
|
|
50,000
|
|
—
|
|
|||||||||
|
Long-term debt
|
61,857
|
|
60,235
|
|
—
|
|
60,235
|
|
—
|
|
|||||||||
|
|
At December 31, 2013
|
||||||||||||||||||
|
(in thousands)
|
Carrying
Value
|
Fair
Value
|
Level 1
|
Level 2
|
Level 3
|
||||||||||||||
|
Assets:
|
|||||||||||||||||||
|
Cash and cash equivalents
|
$
|
33,908
|
|
$
|
33,908
|
|
$
|
33,908
|
|
$
|
—
|
|
$
|
—
|
|
||||
|
Investment securities held to maturity
|
17,133
|
|
16,887
|
|
—
|
|
16,887
|
|
—
|
|
|||||||||
|
Loans held for investment
|
1,871,813
|
|
1,900,349
|
|
—
|
|
—
|
|
1,900,349
|
|
|||||||||
|
Loans held for sale – multifamily
|
556
|
|
556
|
|
—
|
|
556
|
|
—
|
|
|||||||||
|
Mortgage servicing rights – multifamily
|
9,335
|
|
10,839
|
|
—
|
|
—
|
|
10,839
|
|
|||||||||
|
Federal Home Loan Bank stock
|
35,288
|
|
35,288
|
|
—
|
|
35,288
|
|
—
|
|
|||||||||
|
Liabilities:
|
|||||||||||||||||||
|
Deposits
|
$
|
2,210,821
|
|
$
|
2,058,533
|
|
$
|
—
|
|
$
|
2,058,533
|
|
$
|
—
|
|
||||
|
Federal Home Loan Bank advances
|
446,590
|
|
449,109
|
|
—
|
|
449,109
|
|
—
|
|
|||||||||
|
Long-term debt
|
64,811
|
|
63,849
|
|
—
|
|
63,849
|
|
—
|
|
|||||||||
Excluded from the fair value tables above are certain off-balance sheet loan commitments such as unused home equity lines of credit, business banking line funds and undisbursed construction funds. A reasonable estimate of the fair value of these instruments is the carrying value of deferred fees plus the related allowance for credit losses, which amounted to
$3.4 million
and
$977 thousand
at
December 31, 2014
and
2013
, respectively.
176
The following table summarizes the calculation of earnings per share.
|
Year Ended December 31,
|
|||||||||||
|
(in thousands, except share data)
|
2014
|
2013
|
2012
|
||||||||
|
Net income
|
$
|
22,259
|
|
$
|
23,809
|
|
$
|
82,126
|
|
||
|
Weighted-average shares:
|
|||||||||||
|
Basic weighted-average number of common shares outstanding
|
14,800,689
|
|
14,412,059
|
|
13,312,939
|
|
|||||
|
Dilutive effect of outstanding common stock equivalents
(1)
|
160,392
|
|
386,109
|
|
426,459
|
|
|||||
|
Diluted weighted-average number of common stock outstanding
|
14,961,081
|
|
14,798,168
|
|
13,739,398
|
|
|||||
|
Earnings per share:
|
|||||||||||
|
Basic earnings per share
|
$
|
1.50
|
|
$
|
1.65
|
|
$
|
6.17
|
|
||
|
Diluted earnings per share
|
$
|
1.49
|
|
$
|
1.61
|
|
$
|
5.98
|
|
||
|
Dividends per share
|
$
|
0.11
|
|
$
|
0.33
|
|
$
|
—
|
|
||
|
(1)
|
Excluded from the computation of diluted earnings per share (due to their antidilutive effect) for the
twelve
months ended
December 31, 2014
,
2013
and
2012
were certain stock options and unvested restricted stock issued to key senior management personnel and directors of the Company. The aggregate number of common stock equivalents related to such options and unvested restricted shares, which could potentially be dilutive in future periods, was
143,400
,
103,674
and
121,283
at
December 31, 2014
,
December 31, 2013
and
December 31, 2012
, respectively.
|
The Company's business segments are determined based on the products and services provided, as well as the nature of the related business activities, and they reflect the manner in which financial information is currently evaluated by management.
As a result of a change in the manner in which the chief operating decision maker evaluates strategic decisions, commencing with the second quarter of 2013, the Company realigned its business segments and organized them into
two
lines of business: Commercial and Consumer Banking segment and Mortgage Banking segment. In conjunction with this realignment, the Company modified its internal reporting to provide discrete financial information to management for these two business segments. The information that follows has been revised to reflect the current business segments.
A description of the Company's business segments and the products and services that they provide is as follows.
Commercial and Consumer Banking
provides diversified financial products and services to our commercial and consumer customers through bank branches and through ATMs, online, mobile and telephone banking. These products and services include deposit products; residential, consumer, business and agricultural portfolio loans; non-deposit investment products; insurance products and cash management services. We originate construction loans, bridge loans and permanent loans for our portfolio primarily on single family residences, and on office, retail, industrial and multifamily property types. We originate multifamily real estate loans through our Fannie Mae DUS business, whereby loans are sold to or securitized by Fannie Mae, while the Company generally retains the servicing rights. This segment is also responsible for the management of the Company's portfolio of investment securities.
Mortgage Banking
originates single family residential mortgage loans for sale in the secondary markets. We have become a rated originator and servicer of non-conforming jumbo loans, allowing us to sell these loans to other securitizers. We also purchase loans from WMS Series LLC through a correspondent arrangement with that company. The majority of our mortgage loans are sold to or securitized by Fannie Mae, Freddie Mac or Ginnie Mae, while we retain the right to service these loans. On occasion, we may sell a portion of our MSR portfolio. A small percentage of our loans are brokered to other lenders or sold on a servicing-released basis to correspondent lenders. We manage the loan funding and the interest rate risk associated with the secondary market loan sales and the retained single family mortgage servicing rights within this business segment.
177
We use various management accounting methodologies to assign certain income statement items to the responsible operating segment, including:
|
•
|
a funds transfer pricing (“FTP”) system, which allocates interest income credits and funding charges between the segments, assigning to each segment a funding credit for its liabilities, such as deposits, and a charge to fund its assets;
|
|
•
|
an allocation of charges for services rendered to the segments by centralized functions, such as corporate overhead, which are generally based on each segment’s consumption patterns; and
|
|
•
|
an allocation of the Company's consolidated income taxes which are based on the effective tax rate applied to the segment's pretax income or loss.
|
Effective January 1, 2012 management updated the FTP methodology it uses for reviewing segment results and managing the Company’s lines of business. Under the previous FTP methodology, we computed the cost of funds from our current period’s financial results and then allocated a portion of that cost of funds to each respective operating segment. This approach was based on internal financial results and updated for current period information, thereby providing an updated funding cost applied to certain assets or liabilities originated in prior periods.
The updated methodology is based on external market factors and more closely aligns the expected weighted-average life of the financial asset or liability to external economic data, such as the U.S. Dollar LIBOR/Swap curve, and provides a more consistent basis for determining the cost of funds to be allocated to each operating segment. The updated approach is also more consistent with FTP measurement techniques employed by other industry participants. We have reclassified all prior period amounts to conform to the current period’s methodology and presentation.
In general, the impact of the FTP change resulted in a lower cost of funds as compared with the previous method as the Company’s funding costs have generally been higher than market prices due to the historical structure of the deposit portfolio and wholesale borrowings.
Financial highlights by operating segment were as follows.
|
|
Year Ended December 31, 2014
|
||||||||||
|
(in thousands)
|
Mortgage
Banking
|
Commercial and
Consumer Banking
|
Total
|
||||||||
|
Condensed income statement:
|
|||||||||||
|
Net interest income
(1)
|
$
|
16,683
|
|
$
|
81,986
|
|
$
|
98,669
|
|
||
|
Provision (reversal of provision) for loan losses
|
—
|
|
(1,000
|
)
|
(1,000
|
)
|
|||||
|
Noninterest income
|
166,991
|
|
18,666
|
|
185,657
|
|
|||||
|
Noninterest expense
|
172,199
|
|
79,812
|
|
252,011
|
|
|||||
|
Income before income taxes
|
11,475
|
|
21,840
|
|
33,315
|
|
|||||
|
Income tax expense
|
3,964
|
|
7,092
|
|
11,056
|
|
|||||
|
Net income
|
$
|
7,511
|
|
$
|
14,748
|
|
$
|
22,259
|
|
||
|
Total assets
|
$
|
788,681
|
|
$
|
2,746,409
|
|
$
|
3,535,090
|
|
||
178
|
|
Year Ended December 31, 2013
|
||||||||||
|
(in thousands)
|
Mortgage
Banking
|
Commercial and
Consumer Banking
|
Total
|
||||||||
|
Condensed income statement:
|
|||||||||||
|
Net interest income
(1)
|
$
|
15,272
|
|
$
|
59,172
|
|
$
|
74,444
|
|
||
|
Provision for loan losses
|
—
|
|
900
|
|
900
|
|
|||||
|
Noninterest income
|
175,654
|
|
15,091
|
|
190,745
|
|
|||||
|
Noninterest expense
|
163,354
|
|
66,141
|
|
229,495
|
|
|||||
|
Income before income taxes
|
27,572
|
|
7,222
|
|
34,794
|
|
|||||
|
Income tax expense
|
9,736
|
|
1,249
|
|
10,985
|
|
|||||
|
Net income
|
$
|
17,836
|
|
$
|
5,973
|
|
$
|
23,809
|
|
||
|
Total assets
|
$
|
489,292
|
|
$
|
2,576,762
|
|
$
|
3,066,054
|
|
||
|
|
Year Ended December 31, 2012
|
||||||||||
|
(in thousands)
|
Mortgage
Banking
|
Commercial and
Consumer Banking
|
Total
|
||||||||
|
Condensed income statement:
|
|||||||||||
|
Net interest income
(1)
|
$
|
14,117
|
|
$
|
46,626
|
|
$
|
60,743
|
|
||
|
Provision for loan losses
|
—
|
|
11,500
|
|
11,500
|
|
|||||
|
Noninterest income
|
225,555
|
|
12,465
|
|
238,020
|
|
|||||
|
Noninterest expense
|
119,981
|
|
63,610
|
|
183,591
|
|
|||||
|
Income (loss) before income taxes
|
119,691
|
|
(16,019
|
)
|
103,672
|
|
|||||
|
Income tax expense (benefit)
|
24,862
|
|
(3,316
|
)
|
21,546
|
|
|||||
|
Net income (loss)
|
$
|
94,829
|
|
$
|
(12,703
|
)
|
$
|
82,126
|
|
||
|
Total assets
|
$
|
768,915
|
|
$
|
1,862,315
|
|
$
|
2,631,230
|
|
||
|
(1)
|
Net interest income is the difference between interest earned on assets and the cost of liabilities to fund those assets. Interest earned includes actual interest earned on segment assets and, if the segment has excess liabilities, interest credits for providing funding to the other segment. The cost of liabilities includes interest expense on segment liabilities and, if the segment does not have enough liabilities to fund its assets, a funding charge based on the cost of excess liabilities from another segment.
|
179
Condensed financial information for HomeStreet, Inc. is as follows.
|
Condensed Statements of Financial Condition
|
At December 31,
|
||||||
|
(in thousands)
|
2014
|
2013
|
|||||
|
Assets:
|
|||||||
|
Cash and cash equivalents
|
$
|
5,270
|
|
$
|
4,334
|
|
|
|
Other assets
|
7,137
|
|
10,340
|
|
|||
|
Investment in stock of subsidiaries
|
353,992
|
|
316,384
|
|
|||
|
$
|
366,399
|
|
$
|
331,058
|
|
||
|
Liabilities
:
|
|||||||
|
Other liabilities
|
2,304
|
|
321
|
|
|||
|
Long-term debt
|
61,857
|
|
64,811
|
|
|||
|
64,161
|
|
65,132
|
|
||||
|
Shareholders’ Equity:
|
|||||||
|
Preferred stock, no par value
|
—
|
|
—
|
|
|||
|
Common stock, no par value
|
511
|
|
511
|
|
|||
|
Additional paid-in capital
|
96,615
|
|
94,474
|
|
|||
|
Retained earnings
|
203,567
|
|
182,935
|
|
|||
|
Accumulated other comprehensive (loss) income
|
1,545
|
|
(11,994
|
)
|
|||
|
302,238
|
|
265,926
|
|
||||
|
$
|
366,399
|
|
$
|
331,058
|
|
||
|
Condensed Statements of Operations
|
Year Ended December 31,
|
||||||||||
|
(in thousands)
|
2014
|
2013
|
2012
|
||||||||
|
Net interest expense
|
$
|
(1,059
|
)
|
$
|
(2,545
|
)
|
$
|
(1,324
|
)
|
||
|
Noninterest income
|
561
|
|
970
|
|
800
|
|
|||||
|
Income (loss) before income tax benefit and equity in income of subsidiaries
|
(498
|
)
|
(1,575
|
)
|
(524
|
)
|
|||||
|
Dividend from HomeStreet Capital to parent
|
4,200
|
|
19,600
|
|
—
|
|
|||||
|
Income from subsidiaries
|
21,394
|
|
6,591
|
|
84,504
|
|
|||||
|
25,096
|
|
24,616
|
|
83,980
|
|
||||||
|
Noninterest expense
|
4,664
|
|
2,281
|
|
3,152
|
|
|||||
|
Income before income tax benefit
|
20,432
|
|
22,335
|
|
80,828
|
|
|||||
|
Income tax benefit
|
(1,827
|
)
|
(1,474
|
)
|
(1,298
|
)
|
|||||
|
Net income
|
$
|
22,259
|
|
$
|
23,809
|
|
$
|
82,126
|
|
||
|
Other comprehensive income
|
13,540
|
|
(21,184
|
)
|
5,071
|
|
|||||
|
Comprehensive income
|
$
|
35,799
|
|
$
|
2,625
|
|
$
|
87,197
|
|
||
180
|
Condensed Statements of Cash Flows
|
Year Ended December 31,
|
||||||||||
|
(in thousands)
|
2014
|
2013
|
2012
|
||||||||
|
Net cash (used in) provided by operating activities
|
$
|
5,693
|
|
$
|
(483
|
)
|
$
|
(2,023
|
)
|
||
|
Cash flows from investing activities
|
|||||||||||
|
Purchases of and proceeds from investment securities
|
1,000
|
|
(5,797
|
)
|
1,058
|
|
|||||
|
Net payments for investments in and advances to subsidiaries
|
(732
|
)
|
(12,172
|
)
|
(65,000
|
)
|
|||||
|
Net cash (used in) provided by investing activities
|
268
|
|
(17,969
|
)
|
(63,942
|
)
|
|||||
|
Cash flows from financing activities
|
|||||||||||
|
Proceeds from issuance of common stock
|
130
|
|
188
|
|
88,178
|
|
|||||
|
Dividends paid
|
(1,628
|
)
|
—
|
|
—
|
|
|||||
|
Proceeds from and repayment of advances from subsidiaries
|
(3,527
|
)
|
30
|
|
34
|
|
|||||
|
Net cash provided by financing activities
|
(5,025
|
)
|
218
|
|
88,212
|
|
|||||
|
(Decrease) increase in cash and cash equivalents
|
936
|
|
(18,234
|
)
|
22,247
|
|
|||||
|
Cash and cash equivalents at beginning of year
|
4,334
|
|
22,568
|
|
321
|
|
|||||
|
Cash and cash equivalents at end of year
|
$
|
5,270
|
|
$
|
4,334
|
|
$
|
22,568
|
|
||
181
Our supplemental quarterly consolidated financial information is as follows.
|
Quarter ended
|
Quarter ended
|
||||||||||||||||||||||||||||||
|
(in thousands, except share data)
|
Dec. 31, 2014
|
Sept. 30, 2014
|
June 30, 2014
|
Mar. 31, 2014
|
Dec. 31, 2013
|
Sept. 30, 2013
|
June 30, 2013
|
Mar. 31, 2013
|
|||||||||||||||||||||||
|
Interest income
|
$
|
30,780
|
|
$
|
28,478
|
|
$
|
26,225
|
|
$
|
25,810
|
|
$
|
24,422
|
|
$
|
23,348
|
|
$
|
20,468
|
|
$
|
20,738
|
|
|||||||
|
Interest expense
|
3,278
|
|
3,170
|
|
3,078
|
|
3,098
|
|
3,040
|
|
2,936
|
|
3,053
|
|
5,503
|
|
|||||||||||||||
|
Net interest income
|
27,502
|
|
25,308
|
|
23,147
|
|
22,712
|
|
21,382
|
|
20,412
|
|
17,415
|
|
15,235
|
|
|||||||||||||||
|
Provision (reversal of provision) for credit losses
|
500
|
|
—
|
|
—
|
|
(1,500
|
)
|
—
|
|
(1,500
|
)
|
400
|
|
2,000
|
|
|||||||||||||||
|
Net interest income after provision for credit losses
|
27,002
|
|
25,308
|
|
23,147
|
|
24,212
|
|
21,382
|
|
21,912
|
|
17,015
|
|
13,235
|
|
|||||||||||||||
|
Noninterest income
|
51,487
|
|
45,813
|
|
53,650
|
|
34,707
|
|
36,072
|
|
38,174
|
|
57,556
|
|
58,943
|
|
|||||||||||||||
|
Noninterest expense
|
68,791
|
|
64,158
|
|
62,971
|
|
56,091
|
|
58,868
|
|
58,116
|
|
56,712
|
|
55,799
|
|
|||||||||||||||
|
(Loss) income before income tax expense
|
9,698
|
|
6,963
|
|
13,826
|
|
2,828
|
|
(1,414
|
)
|
1,970
|
|
17,859
|
|
16,379
|
|
|||||||||||||||
|
Income tax (benefit) expense
|
4,077
|
|
1,988
|
|
4,464
|
|
527
|
|
(553
|
)
|
308
|
|
5,791
|
|
5,439
|
|
|||||||||||||||
|
Net (loss) income
|
$
|
5,621
|
|
$
|
4,975
|
|
$
|
9,362
|
|
$
|
2,301
|
|
$
|
(861
|
)
|
$
|
1,662
|
|
$
|
12,068
|
|
$
|
10,940
|
|
|||||||
|
Basic (loss) earnings per share
|
$
|
0.38
|
|
$
|
0.34
|
|
$
|
0.63
|
|
$
|
0.16
|
|
$
|
(0.06
|
)
|
$
|
0.12
|
|
$
|
0.84
|
|
$
|
0.76
|
|
|||||||
|
Diluted (loss) earnings per share
|
$
|
0.38
|
|
$
|
0.33
|
|
$
|
0.63
|
|
$
|
0.15
|
|
$
|
(0.06
|
)
|
$
|
0.11
|
|
$
|
0.82
|
|
$
|
0.74
|
|
|||||||
The Company has evaluated the effects of events that have occurred subsequent to the year ended
December 31, 2014
, and has included all material events that would require recognition in the
2014
consolidated financial statements or disclosure in the notes to the consolidated financial statements.
On March 1, 2015, the Company completed its acquisition of Simplicity Bancorp, Inc., a Maryland corporation and Simplicity’s wholly owned subsidiary, Simplicity Bank. The acquisition was accomplished by the merger of Simplicity Bancorp, Inc. with and into HomeStreet, Inc. with HomeStreet, Inc. as the surviving corporation, followed by the merger of Simplicity Bank with and into HomeStreet Bank with HomeStreet Bank as the surviving subsidiary. The results of operations of Simplicity will be included in the consolidated results of operations from the date of acquisition.
Because the merger occurred on March 1, 2015, the initial accounting for the business combination is incomplete as of the filing date of this Form 10-K. HomeStreet is in the process of determining the fair values which are subject to refinement for up to one year after the closing date of the acquisition.
For a detailed discussion of the terms of the Simplicity acquisition, see Note 2,
Business Combinations
of this Form 10-K.
|
ITEM 9
|
CHANGES IN AND DISAGREEMENTS WITH ACCOUNTANTS ON ACCOUNTING AND FINANCIAL DISCLOSURE
|
No disclosure required pursuant to Item 304 of Regulation S-K.
182
|
ITEM 9A
|
CONTROLS AND PROCEDURES
|
Evaluation of Disclosure Controls and Procedures
The Company carried out an evaluation, with the participation of our management, and under the supervision of our Chief Executive Officer and Chief Accounting Officer, of the effectiveness of our disclosure controls and procedures (as defined under Rule 13a-15(e) and Rule 15d-15(e) under the Exchange Act) as of the end of the period covered by this report. Based on that evaluation, our Chief Executive Officer and Chief Accounting Officer have concluded that, due to a material weakness in our internal control over financial reporting as of
December 31, 2014
, our disclosure controls and procedures were not effective as of such date to ensure that the information required to be disclosed in reports that we file or submit under the Exchange Act is (i) recorded, processed, summarized and reported within the time periods specified in SEC rules and forms and (ii) accumulated and communicated to our management, including our Chief Executive Officer and Chief Accounting Officer, as appropriate to allow timely decisions regarding required disclosure.
Notwithstanding such material weakness, which is described below in Management’s Report on Internal Control over Financial Reporting, our management has concluded that the consolidated financial statements included in this Form 10-K present fairly, in all material respects, our financial position, results of operations and cash flows for the periods presented in conformity with accounting principles generally accepted in the U.S.
Management's Report on Internal Controls Over Financial Reporting
The Company's management is responsible for establishing and maintaining adequate internal control over financial reporting for the Company. Management assessed the effectiveness of the Company's internal control over financial reporting as of
December 31, 2014
, using the criteria set forth by the Committee of Sponsoring Organizations of the Treadway Commission (COSO) in Internal Control - Integrated Framework (2013). Our internal controls over financial reporting include those policies and procedures that (i) pertain to the maintenance of records that, in reasonable detail, accurately and fairly reflect the transactions and dispositions of the assets of the company; (ii) provide reasonable assurance that transactions are recorded as necessary to permit preparation of financial statements in accordance with accounting principles generally accepted in the United States of America and that receipts and expenditures of the company are being made only in accordance with authorizations of management and directors of the company; and (iii) provide reasonable assurance regarding prevention or timely detection of unauthorized acquisition, use or disposition of the company’s assets that could have a material effect on the financial statements.
Because of its inherent limitations, internal control over financial reporting may not prevent or detect misstatements. Also, changing conditions may affect our projections of any evaluation of effectiveness to future periods, and our compliance with policies or procedures may deteriorate.
With the participation of the Chief Executive Officer and the Chief Accounting Officer, our management conducted an evaluation of the effectiveness of our internal control over financial reporting. Based on this evaluation, our management has concluded that our internal control over financial reporting was not effective as of
December 31, 2014
, because of a material weakness in our internal control over financial reporting described below. A material weakness is defined as a deficiency, or a combination of deficiencies, in internal control over financial reporting, such that there is a reasonable possibility that a material misstatement of a company’s annual or interim financial statements will not be prevented or detected on a timely basis. In connection with management’s assessment of our internal control over financial reporting described above, management has identified the following material weakness in our internal control over financial reporting as of
December 31, 2014
:
Inadequate Controls Over New Software and Systems -
During 2014, management implemented certain new software systems and related processes, primarily related to accounts payable processing and payroll processing. However, the Company’s risk assessment process failed to identify that the design and operating effectiveness of controls were insufficient in certain areas, and as a consequence, management has determined that our controls over these activities were not fully effective. This determination stemmed, in part, from a lack of verifiable evidence that we maintained effective monitoring activities as of
December 31, 2014
. As a result, management has concluded that its risk assessment process did not adequately evaluate risk associated with these changes at an appropriate level of detail to allow for (i) the design of controls with the appropriate precision and responsiveness to address those risks, (ii) the timely and effective implementation of controls, including evidence of operating effectiveness, and (iii) effective monitoring of the controls. Accordingly, management determined that as of
December 31, 2014
, in the aggregate, a reasonable possibility existed that material misstatements in the Company’s financial statements would not be prevented or detected on a timely basis. In each of the instances in which deficiencies gave rise to a risk of loss or misstatement, management determined that no material loss occurred, and that we did not have a material misstatement of our financial statements.
183
Management thus determined that these outcomes in the aggregate reflect a material weakness in our internal controls over financial reporting relating to our implementation and oversight of key systems and processes, and that, as a result, our internal controls over financial reporting were not effective as of
December 31, 2014
.
The effectiveness of our internal control over financial reporting as of
December 31, 2014
has been audited by Deloitte & Touche LLP, our independent registered public accounting firm, as stated in its report which is included elsewhere herein.
Changes in Internal Controls Over Financial Reporting
As required by Rule 13a-15(d), our management including our Chief Executive Officer and Chief Accounting Officer, also conducted an evaluation of our internal control over financial reporting to determine whether any changes occurred during the quarter ended
December 31, 2014
that have materially affected, or are reasonably likely to materially affect, our internal control over financial reporting. We implemented a change in internal control over financial reporting during the quarter ended
December 31, 2014
related to fair value hedge accounting. Management implemented certain changes in the Registrant’s internal accounting controls and other actions during the fourth quarter of 2014, including:
|
•
|
enhanced oversight by the Accounting Department of complex accounting for financial instruments within the Registrant’s Treasury Department;
|
|
•
|
termination of the swaps related to affected loans during the fourth quarter of 2014, an action which had no material impact upon the Registrant’s results of operations or financial condition;
|
|
•
|
terminated all fair value hedge accounting relationships as a result of the termination of the hedging instruments; and
|
|
•
|
began amortizing the previously recorded changes in value of the affected loans over the remaining life of those loans, an amount that in the aggregate is immaterial to the Registrant’s results of operations and financial condition.
|
In addition, the Registrant had ceased the lending and hedging practices from 2008 that gave rise to these errors and management has no plans to reestablish any similar practices or products.
There were no other changes to our internal control over financial reporting that occurred during the quarter ended
December 31, 2014
that have materially affected, or are reasonably likely to materially affect, our internal control over financial reporting.
Remediation Efforts to Address Newly Identified Material Weakness in Internal Controls Over Financial Reporting
As part of our remediation of the material weakness, we have reviewed our system implementation process and internal controls associated with the accounts payable and payroll systems. As a result of this review, management has implemented an enhanced system interface, enhanced controls related to the segregation of duties and enhanced monitoring controls related to new software systems. We are in the process of testing these control enhancements that have been implemented to evaluate their operating effectiveness.
Additionally, we are currently reviewing our risk assessment process to identify needed improvements in controls related to new systems planning, implementation and post-implementation monitoring. We anticipate completing this review and implementing any associated changes in controls prior to the implementation of any future significant new systems.
We believe these corrective measures will remediate the material weakness identified above and will strengthen our internal control over financial reporting for the implementation and operation of our financial and transaction processing systems and procedures. Management will consider the material weakness remediated after the applicable remedial controls are deemed to be operating effectively.
184
REPORT OF INDEPENDENT REGISTERED PUBLIC ACCOUNTING FIRM
To the Board of Directors and Shareholders of
HomeStreet, Inc.
Seattle, Washington
We have audited the internal control over financial reporting of HomeStreet, Inc. and subsidiaries (the “Company”) as of December 31, 2014, based on criteria established in
Internal Control
-
Integrated Framework (2013)
issued by the Committee of Sponsoring Organizations of the Treadway Commission.
Because management’s assessment and our audit were conducted to meet the reporting requirements of Section 112 of the Federal Deposit Insurance Corporation Improvement Act (FDICIA), management’s assessment and our audit of the Company’s internal control over financial reporting included controls over the preparation of the schedules equivalent to the basic financial statements in accordance with the instructions for the Consolidated Reports of Condition and Income for Schedules RC, RI, and RI-A. The Company’s management is responsible for maintaining effective internal control over financial reporting and for its assessment of the effectiveness of internal control over financial reporting, included in the accompanying Management’s Report On Internal Control Over Financial Reporting. Our responsibility is to express an opinion on the Company’s internal control over financial reporting based on our audit.
We conducted our audit in accordance with the standards of the Public Company Accounting Oversight Board (United States). Those standards require that we plan and perform the audit to obtain reasonable assurance about whether effective internal control over financial reporting was maintained in all material respects. Our audit included obtaining an understanding of internal control over financial reporting, assessing the risk that a material weakness exists, testing and evaluating the design and operating effectiveness of internal control based on the assessed risk, and performing such other procedures as we considered necessary in the circumstances. We believe that our audit provides a reasonable basis for our opinion.
A company’s internal control over financial reporting is a process designed by, or under the supervision of, the company’s principal executive and principal financial officers, or persons performing similar functions, and effected by the company’s board of directors, management, and other personnel to provide reasonable assurance regarding the reliability of financial reporting and the preparation of financial statements for external purposes in accordance with generally accepted accounting principles. A company’s internal control over financial reporting includes those policies and procedures that (1) pertain to the maintenance of records that, in reasonable detail, accurately, and fairly reflect the transactions and dispositions of the assets of the company; (2) provide reasonable assurance that transactions are recorded as necessary to permit preparation of financial statements in accordance with generally accepted accounting principles, and that receipts and expenditures of the company are being made only in accordance with authorizations of management and directors of the company; and (3) provide reasonable assurance regarding prevention or timely detection of unauthorized acquisition, use, or disposition of the company’s assets that could have a material effect on the financial statements.
Because of the inherent limitations of internal control over financial reporting, including the possibility of collusion or improper management override of controls, material misstatements due to error or fraud may not be prevented or detected on a timely basis. Also, projections of any evaluation of the effectiveness of the internal control over financial reporting to future periods are subject to the risk that the controls may become inadequate because of changes in conditions, or that the degree of compliance with the policies or procedures may deteriorate.
185
A material weakness is a deficiency, or a combination of deficiencies, in internal control over financial reporting, such that there is a reasonable possibility that a material misstatement of the company’s annual or interim financial statements will not be prevented or detected on a timely basis. The following material weakness has been identified and included in management's assessment:
Inadequate Controls Over New Software and Systems
- During 2014, management implemented certain new software systems and related processes, primarily related to accounts payable processing and payroll processing. However, the Company’s risk assessment process failed to identify that the design and operating effectiveness of controls were insufficient in certain areas, and as a consequence, management has determined that the Company’s controls over these activities were not fully effective. This determination stemmed, in part, from a lack of verifiable evidence that the Company maintained effective monitoring activities as of December 31, 2014. As a result, management has concluded that its risk assessment process did not adequately evaluate risk associated with these changes at an appropriate level of detail to allow for (i) the design of controls with the appropriate precision and responsiveness to address those risks, (ii) the timely and effective implementation of controls, including evidence of operating effectiveness, and (iii) effective monitoring of the controls. Accordingly, management determined that as of December 31, 2014, in the aggregate, a reasonable possibility existed that material misstatements in the Company’s financial statements would not be prevented or detected on a timely basis. Management thus determined that these outcomes in the aggregate reflect a material weakness in the Company’s internal controls over financial reporting relating to the Company’s implementation and oversight of key systems and processes, and that, as a result, the Company’s internal controls over financial reporting were not effective as of December 31, 2014.
This material weakness was considered in determining the nature, timing, and extent of audit tests applied in our audit of the consolidated financial statements as of and for the year ended December 31, 2014, of the Company and this report does not affect our report on such financial statements.
In our opinion, because of the effect of the material weakness identified above on the achievement of the objectives of the control criteria, the Company has not maintained effective internal control over financial reporting as of December 31, 2014, based on the criteria established in
Internal Control
-
Integrated Framework (2013)
issued by the Committee of Sponsoring Organizations of the Treadway Commission.
We have also audited, in accordance with the standards of the Public Company Accounting Oversight Board (United States), the consolidated financial statements as of and for the year ended December 31, 2014, of the Company and our report dated March 24, 2015, expressed an unqualified opinion on those financial statements.
/s/ Deloitte & Touche LLP
Seattle, Washington
March 24, 2015
186
None.
|
ITEM 10
|
DIRECTORS, EXECUTIVE OFFICERS AND CORPORATE GOVERNANCE
|
The information required by this item will be set forth in our definitive proxy statement with respect to our 2015 annual meeting of stockholders (the “2015 Proxy Statement”) to be filed with the SEC, which is expected to be filed not later than 120 days after the end of our fiscal year ended
December 31, 2014
, and is incorporated herein by reference.
We have adopted a Code of Business Conduct and Ethics that applies to all of our directors, officers and employees, including our principal executive officer and principal financial officer. The Code of Business Conduct and Ethics is posted on our website at http://ir.homestreet.com.
We intend to satisfy the disclosure requirement under Item 5.05 of Form 8-K regarding an amendment to, or waiver from, a provision of this Code of Business Conduct and Ethics by posting such information on our corporate website, at the address and location specified above and, to the extent required by the listing standards of the Nasdaq Global Select Market, by filing a Current Report on Form 8-K with the SEC, disclosing such information.
|
ITEM 11
|
EXECUTIVE COMPENSATION
|
The information required by this item will be set forth in the 2015 Proxy Statement and is incorporated herein by reference.
|
ITEM 12
|
SECURITY OWNERSHIP OF CERTAIN BENEFICIAL OWNERS AND MANAGEMENT AND RELATED STOCKHOLDER MATTERS
|
The information required by this item will be set forth in the 2015 Proxy Statement and is incorporated herein by reference.
|
ITEM 13
|
CERTAIN RELATIONSHIPS AND RELATED TRANSACTIONS AND DIRECTOR INDEPENDENCE
|
The information required by this item will be set forth in the 2015 Proxy Statement and is incorporated herein by reference.
|
ITEM 14
|
PRINCIPAL ACCOUNTANT FEES AND SERVICES
|
The information required by this item will be set forth in the 2015 Proxy Statement and is incorporated herein by reference.
187
|
ITEM 15
|
EXHIBITS AND FINANCIAL STATEMENT SCHEDULES
|
|
(a)
|
Financial Statements and Financial Statement Schedules
|
|
(i)
|
Financial Statements
|
The following consolidated financial statements of the registrant and its subsidiaries are included in Part II Item 8:
Report of Independent Registered Public Accounting Firm
Consolidated Statements of Financial Condition as of
December 31, 2014
and
2013
Consolidated Statements of Operations for the three years ended
December 31, 2014
Consolidated Statements of Comprehensive Income for the three years ended
December 31, 2014
Consolidated Statements of Shareholders’ Equity for the three years ended
December 31, 2014
Consolidated Statements of Cash Flows for the three years ended
December 31, 2014
Notes to Consolidated Financial Statements
|
(ii)
|
Financial Statement Schedules
|
II—Valuation and Qualifying Accounts
All financial statement schedules for the Company have been included in the consolidated financial statements or the related footnotes, or are either inapplicable or not required.
|
(iii)
|
Exhibits
|
EXHIBIT INDEX
|
Exhibit
Number
|
Description
|
|
|
3.1
(1)
|
Amended and Restated Articles of Incorporation of HomeStreet, Inc.
|
|
|
3.2
(1)
|
Amended and Restated Bylaws of HomeStreet, Inc.
|
|
|
3.3
(3)
|
Second Amended and Restated Bylaws of HomeStreet, Inc.
|
|
|
3.4
(4)
|
Second Amended and Restated Articles of Incorporation of HomeStreet, Inc.
|
|
|
3.5
(6)
|
First Amendment to Second Amended and Restated Articles of Incorporation of HomeStreet, Inc.
|
|
|
3.6
(7)
|
Amendment to Second Amended and Restated Articles of Incorporation of HomeStreet, Inc.
|
|
|
4.1
(5)
|
Form of Common Stock Certificate
|
|
|
4.2
|
Reference is made to Exhibit 3.1
|
|
|
4.3
|
Instruments with respect to long-term debt of HomeStreet, Inc. and its consolidated subsidiaries are omitted pursuant to Item 601(b)(4)(iii) of Regulation S-K since the total amount of securities authorized thereunder does not exceed 10 percent of the total assets of HomeStreet, Inc. and its subsidiaries on a consolidated basis. HomeStreet, Inc. hereby agrees to furnish a copy of any such instrument to the Securities and Exchange Commission upon request.
|
|
|
10.1
(1)
|
HomeStreet, Inc. 2010 Equity Incentive Plan
|
|
|
10.2
|
HomeStreet, Inc. 2014 Equity Incentive Plan
|
|
|
10.3
|
Standard Form of Restricted Stock Unit Agreement under the 2014 Plan
|
|
|
10.4
|
Standard Form of Performance Share Unit Agreement under the 2014 Plan
|
|
|
10.5
(8)
|
HomeStreet, Inc. 401(k) Savings Plan, restated as of January 1, 2011, and amendments to the HomeStreet, Inc. 401(k) Savings Plan adopted as of February 24, 2011, November 1, 2011, January 1, 2012, July 26, 2012, September 1, 2012 and January 1, 2014
|
|
188
|
10.6
|
Amendment to the HomeStreet, Inc. 401(k) Savings Plan adopted as of January 1, 2015
|
|
|
10.7
(1)
|
HomeStreet, Inc. Directors’ Deferred Compensation Plan, effective February 1, 2004, as amended and restated December 19, 2008, executed by HomeStreet, Inc. and HomeStreet Bank
|
|
|
10.8
(1)
|
HomeStreet, Inc. Executive Deferred Compensation Plan, effective February 1, 2004, as amended and restated December 19, 2008, executed by HomeStreet, Inc., HomeStreet Bank and HomeStreet Capital Corporation
|
|
|
10.9
(2)
|
Form of HomeStreet, Inc. Award Agreement for Nonqualified Stock Options and Standard Terms and Conditions for Nonqualified Stock Options, granted October 22, 2010 and November 29, 2010
|
|
|
10.10
(2)
|
Employment Agreement between HomeStreet, Inc., HomeStreet Bank, and Mark Mason, dated May 26, 2011
|
|
|
10.11
|
Employment Agreement between HomeStreet, Inc., HomeStreet Bank, and Mark Mason, dated March 11, 2015
|
|
|
10.12
(1)
|
Form of Officer Indemnification Agreement for HomeStreet, Inc.
|
|
|
10.13
(1)
|
Form of Director Indemnification Agreement for HomeStreet, Inc.
|
|
|
10.14
(1)
|
Form of 2011 Director and Officer Indemnification for HomeStreet, Inc.
|
|
|
10.15
(8)†
|
Office Lease, dated March 5, 1992, between Continental, Inc. and One Union Square Venture ("Office Lease"), as amended by Supplemental Lease Agreement dated August 25, 1992, Second Amendment to Lease dated May 6, 1998, Third Amendment to Lease dated June 17, 1998, Fourth Amendment to Lease dated February 15, 2000, Fifth Amendment to Lease dated July 30, 2001, Sixth Amendment to Lease dated March 5, 2002, Seventh Amendment to Lease dated May 19, 2004, Eighth Amendment to Lease dated August 31, 2004, Ninth Amendment to Lease dated April 19, 2006, Tenth Amendment to Lease dated July 20, 2006, Eleventh Amendment to Lease dated December 27, 2006, Twelfth Amendment to Lease dated October 1, 2007, Thirteenth Amendment to Lease dated January 26, 2010, Fourteenth Amendment to Lease dated January 19, 2012, Fifteenth Amendment to Lease dated May 24, 2012, Sixteenth Amendment to Lease dated September 12, 2012, Seventeenth Amendment to Lease dated November 8, 2012, Eighteenth Amendment to Lease dated May 3, 2013, Nineteenth Amendment to Lease dated May 28, 2013 and Twentieth Amendment to Lease dated June 19, 2013.
|
|
|
10.16
|
Twenty-First Amendment to Office Lease dated December 24, 2014.
|
|
|
10.17
(8)
|
Advances, Security and Deposit Agreement, dated as of February 1, 2013, between HomeStreet Bank and the Federal Home Loan Bank of Seattle
|
|
|
10.18
(8)
|
Letter Agreement, dated January 15, 2013, by HomeStreet Bank to Federal Reserve Bank of San Francisco
|
|
|
10.19
(1)
|
Master Custodial Agreement for Custody of Single Family MBS Pool Mortgage Loans, dated October 2009, between HomeStreet Bank, Federal National Mortgage Association, and U.S. Bank, N.A.
|
|
|
10.20
(2)
†
|
Master Agreement ML 02783 between HomeStreet Bank and Fannie Mae, dated March 15, 2010, amended by Letter Agreement dated March 15, 2011
|
|
|
10.21
(1)
|
Master Agreement, dated as of June 17, 2010, between HomeStreet Bank and Freddie Mac
|
|
|
10.22
(2)
†
|
Cash Pledge Agreement, dated as of June 1, 2010, between HomeStreet Bank and Federal Home Loan Mortgage Corporation
|
|
|
10.23
(3)
|
Amended and Restated Limited Liability Company Agreement of Windermere Mortgage Services Series LLC, dated May 1, 2005, including form of separate series designation
|
|
|
10.24
(1)
|
Correspondent Purchase and Sale Agreement, effective September 1, 2010, between HomeStreet Bank and Windermere Mortgage Services Series LLC
|
|
|
10.25
|
HomeStreet, Inc. 2014 Management/Support Performance-Based Annual Incentive Compensation Plan
|
|
|
10.26
(2)
|
Master Agreement between HomeStreet Bank and Government National Mortgage Association effective January 3, 2011
|
|
|
10.27
(9) †
|
Servicing Rights Purchase and Sale Agreement between HomeStreet Bank and SunTrust Mortgage, Inc. dated June 30, 2014.
|
|
|
10.28
(10)
|
Agreement and Plan of Merger dated as of September 27, 2014 between HomeStreet, Inc. and Simplicity Bancorp, Inc.
|
|
189
|
16.1
(11)
|
Letter from KPMG LLP regarding change in certifying accountant
|
|
|
21
|
Subsidiaries of HomeStreet, Inc.
|
|
|
23.1
|
Consent of Deloitte & Touche LLP
|
|
|
23.2
|
Consent of KPMG LLP
|
|
|
31.1
|
Certification of Chief Executive Officer Pursuant to Section 302 of the Sarbanes-Oxley Act of 2002. Filed herewith.
|
|
|
31.2
|
Certification of Chief Accounting Officer Pursuant to Section 302 of the Sarbanes-Oxley Act of 2002. Filed herewith.
|
|
|
32
|
Certification of Chief Executive Officer and Chief Accounting Officer pursuant to 18 U.S.C. Section 1350, as adopted pursuant to Section 906 of the Sarbanes-Oxley Act of 2002. Furnished herewith.
|
|
|
101.INS
(12)(13)
|
|
XBRL Instance Document
|
|
101.SCH
(12)
|
|
XBRL Taxonomy Extension Schema Document
|
|
101.CAL
(12)
|
|
XBRL Taxonomy Extension Calculation Linkbase Document
|
|
101.DEF
(12)
|
|
XBRL Taxonomy Extension Label Linkbase Document
|
|
101.LAB
(12)
|
|
XBRL Taxonomy Extension Presentation Linkbase Document
|
|
101.PRE
(12)
|
|
XBRL Taxonomy Extension Definitions Linkbase Document
|
190
|
(1)
|
Filed as an exhibit to HomeStreet, Inc.’s Amendment No. 1 to Registration Statement on Form S-1 (SEC File No. 333-173980) filed on May 19, 2011, and incorporated herein by reference.
|
|
(2)
|
Filed as an exhibit to HomeStreet, Inc.’s Amendment No. 2 to Registration Statement on Form S-1 (SEC File No. 333-173980) filed on June 21, 2011, and incorporated herein by reference.
|
|
(3)
|
Filed as an exhibit to HomeStreet, Inc.’s Amendment No. 3 to Registration Statement on Form S-1 (SEC File No. 333-173980) filed on July 8, 2011, and incorporated herein by reference.
|
|
(4)
|
Filed as an exhibit to HomeStreet, Inc.’s Amendment No. 4 to Registration Statement on Form S-1 (SEC File No. 333-173980) filed on July 26, 2011, and incorporated herein by reference.
|
|
(5)
|
Filed as an exhibit to HomeStreet, Inc.’s Amendment No. 5 to Registration Statement on Form S-1 (SEC File No. 333-173980) filed on August 9, 2011, and incorporated herein by reference.
|
|
(6)
|
Filed as an exhibit to HomeStreet, Inc.’s Current Report on Form 8-K (SEC File No. 001-35424) filed on February 29, 2012, and incorporated herein by reference.
|
|
(7)
|
Filed as an exhibit to HomeStreet, Inc.’s Current Report on Form 8-K (SEC File No. 001-35424) filed on October 25, 2012, and incorporated herein by reference.
|
|
(8)
|
Filed as an exhibit to HomeStreet, Inc.’s Annual Report on Form 10-K (SEC File No. 001-35424) filed on March 17, 2014, and incorporated herein by reference.
|
|
(9)
|
Filed as an exhibit to HomeStreet, Inc.’s Current Report on Form 8-K (SEC File No. 001-35424) filed on July 7, 2014, and incorporated herein by reference.
|
|
(10)
|
Filed as an exhibit to HomeStreet, Inc.’s Current Report on Form 8-K (SEC File No. 001-35424) filed on September 29, 2014, and incorporated herein by reference.
|
|
(11)
|
Filed as an exhibit to HomeStreet Inc.’s Current Report on Form 8-K (SEC File No. 001-35424) filed on March 21, 2013, and incorporated herein by reference.
|
|
(12)
|
As provided in Rule 406T of Regulation S-T, this information shall not be deemed “filed” for purposes of Section 11 and 12 of the Securities Act of 1933 and Section 18 of the Securities Exchange Act of 1934 or otherwise subject to liability under those sections.
|
|
(13)
|
Pursuant to Rule 405 of Regulation S-T, includes the following financial information included in the Company’s Annual Report on Form 10-K for the year ended December 31, 2012, formatted in XBRL (eXtensible Business Reporting Language) interactive data files: (i) the Consolidated Statements of Operations for the three years ended December 31, 2012, (ii) the Consolidated Statements of Financial Condition as of December 31, 2012 and December 31, 2011, (iii) the Consolidated Statements of Shareholders’ Equity and Comprehensive Income for the three years ended December 31, 2012, (iv) the Consolidated Statements of Cash Flows for the three years ended December 31, 2012, and (v) the Notes to Consolidated Financial Statements.
|
|
†
|
Portions of this exhibit have been omitted pursuant to a confidential treatment order by the Securities and Exchange Commission.
|
191
SIGNATURES
Pursuant to the requirements of Section 13 or 15(d) of the Securities Exchange Act of 1934, the Registrant has duly caused this Report to be signed on its behalf by the undersigned, thereunto duly authorized, in the City of Seattle, State of Washington, on March 24, 2015.
|
HomeStreet, Inc.
|
||
|
By:
|
/s/ Mark K. Mason
|
|
|
|
Mark K. Mason
|
|
|
|
President and Chief Executive Officer
|
|
|
HomeStreet, Inc.
|
||
|
By:
|
/s/ Cory D. Stewart
|
|
|
|
Cory D. Stewart
|
|
|
|
Executive Vice President and
Chief Accounting Officer
|
|
192
POWER OF ATTORNEY
KNOW BY ALL PERSONS BY THESE PRESENTS, that each person whose signature appears below constitutes and appoints Mark K. Mason and Cory D. Stewart, and each of them his attorney-in-fact, with the power of substitution, for him in any and all capacities, to sign any amendment to this Report on Form 10-K and to file the same, with exhibits thereto and other documents in connection therewith, with the Securities and Exchange Commission, hereby ratifying and confirming all that said attorney-in-fact, or his substitute or substitutes, may do or cause to be done by virtue hereof.
Pursuant to the requirements of the Securities Exchange Act of 1934, this Report has been signed below by the following persons on behalf of the registrant and in the capacities and on the dates indicated.
|
Signature
|
Title
|
Date
|
||
|
/s/ David A. Ederer
|
Chairman of the Board and Director
|
March 24, 2015
|
||
|
David A. Ederer, Chairman
|
||||
|
/s/ Mark K. Mason
|
President, Chief Executive Officer and Director (Principal Executive Officer)
|
March 24, 2015
|
||
|
Mark K. Mason
|
||||
|
/s/ Cory D. Stewart
|
Executive Vice President, Chief Accounting Officer (Principal Accounting Officer and Principal Financial Officer)
|
March 24, 2015
|
||
|
Cory D. Stewart
|
||||
|
/s/ Scott M. Boggs
|
Director
|
March 24, 2015
|
||
|
Scott M. Boggs
|
||||
|
/s/ Timothy R. Chrisman
|
Director
|
March 24, 2015
|
||
|
Timothy R. Chrisman
|
||||
|
/s/ Victor H. Indiek
|
Director
|
March 24, 2015
|
||
|
Victor H. Indiek
|
||||
|
/s/ Thomas E. King
|
Director
|
March 24, 2015
|
||
|
Thomas E. King
|
||||
|
/s/ George Kirk
|
Director
|
March 24, 2015
|
||
|
George Kirk
|
||||
|
/s/ Douglas I. Smith
|
Director
|
March 24, 2015
|
||
|
Douglas I. Smith
|
||||
|
/s/ Donald R. Voss
|
Director
|
March 24, 2015
|
||
|
Donald R. Voss
|
||||
|
/s/ Bruce W. Williams
|
Director
|
March 24, 2015
|
||
|
Bruce W. Williams
|
||||
193
TABLE OF CONTENTS
Part 1Item 1 BusinessItem 1A Risk FactorsItem 1B Unresolved Staff CommentsItem 2 PropertiesItem 3 Legal ProceedingsItem 4 Mine Safety DisclosuresPart IIItem 5 Market For Registrant S Common Equity, Related Stockholder Matters and Issuer Purchases Of Equity SecuritiesItem 6 Selected Financial DataItem 7 Management S Discussion and Analysis Of Financial Condition and Results Of OperationsItem 7A Quantitative and Qualitative Disclosures About Market RiskItem 8 Financial Statements and Supplementary DataNote 1 Summary Of Significant Accounting Policies:Note 2 Business Combinations:Note 3 Regulatory Capital Requirements:Note 4 Investment Securities:Note 5 Loans and Credit Quality:Note 6 Other Real Estate Owned:Note 7 Premises and Equipment, Net:Note 8 Deposits:Note 9 Federal Home Loan Bank and Other Borrowings:Note 10 Long-term Debt:Note 11 Derivatives and Hedging Activities:Note 12 Mortgage Banking Operations:Note 13 Commitments, Guarantees, and Contingencies:Note 14 Income Taxes:Note 15 401(k) Savings and Employee Stock Ownership Plan:Note 16 Share-based Compensation Plans:Note 17 Fair Value Measurement:Note 12, Mortgage Banking OperationsNote 18 Earnings Per Share:Note 19 Business Segments:Note 20 Parent Company Financial Statements:Note 21 Unaudited Quarterly Financial Data:Note 22 Subsequent Events:Item 9 Changes in and Disagreements with Accountants on Accounting and Financial DisclosureItem 9A Controls and ProceduresItem 9B Other InformationPart IIIItem 10 Directors, Executive Officers and Corporate GovernanceItem 11 Executive CompensationItem 12 Security Ownership Of Certain Beneficial Owners and Management and Related Stockholder MattersItem 13 Certain Relationships and Related Transactions and Director IndependenceItem 14 Principal Accountant Fees and ServicesPart IVItem 15 Exhibits and Financial Statement Schedules