MOODYS CORP /DE/
10-Ks and 10-Qs
|
|
|
|
|
|
|
|
|
|
|
|
|
|
|
|
|
|
|
|
|
|
|
|
|
|
|
|
|
|
|
|
|
|
|
|
|
|
|
|
|
|
|
|
|
|
|
|
|
|
|
|
|
|
|
|
UNITED STATES
SECURITIES AND EXCHANGE COMMISSION
Washington, D.C. 20549
| Form |
|
||||
(Mark one)
|
|
QUARTERLY REPORT PURSUANT TO SECTION 13 OR 15(d) OF THE SECURITIES EXCHANGE ACT OF 1934
|
||||
For the quarterly period ended
September 30, 2023
Or
|
|
TRANSITION REPORT PURSUANT TO SECTION 13 OR 15(d) OF THE SECURITIES EXCHANGE ACT OF 1934 | ||||
For the transition period from to
Commission file number
1-14037
____________________
(Exact name of registrant as specified in its charter)
|
|
|
||||||||||
| (State of Incorporation) | (I.R.S. Employer Identification No.) | ||||||||||
(Address of Principal Executive Offices)
(Zip Code)
Registrant’s telephone number, including area code:
Securities registered pursuant to Section 12(b) of the Act:
| Title of each class | Trading Symbol(s) | Name of each exchange on which registered | ||||||||||||
|
|
|
|
||||||||||||
|
|
|
|
||||||||||||
|
|
|
|
||||||||||||
Indicate by check mark whether the registrant (1) has filed all reports required to be filed by Sections 13 or 15(d) of the Securities Exchange Act of 1934 during the preceding 12 months (or for such shorter period that the registrant was required to file such reports), and (2) has been subject to such filing requirements for the past 90 days.
Yes
☑ No ☐
Indicate by check mark whether the registrant has submitted electronically, every Interactive Data File required to be submitted pursuant to Rule 405 of Regulation S-T during the preceding 12 months (or for such shorter period that the registrant was required to submit such files).
Yes
☑ No ☐
Indicate by check mark whether the registrant is a large accelerated filer, an accelerated filer, a non-accelerated filer, smaller reporting company, or an emerging growth company. See the definitions of “large accelerated filer,” “accelerated filer,” “smaller reporting company,” and “emerging growth company” in Rule 12b-2 of the Exchange Act. (Check one):
|
|
☑ |
Accelerated filer
|
☐ | |||||||||||
| Non-accelerated filer | ☐ |
Smaller reporting company
|
|
|||||||||||
|
Emerging growth company
|
|
|||||||||||||
If an emerging growth company, indicate by check mark if the registrant has elected not to use the extended transition period for complying with any new or revised financial accounting standards provided pursuant to Section 13(a) of the Exchange Act. ☐
Indicate by check mark whether the registrant is a shell company (as defined in Rule 12b-2 of the Exchange Act). Yes
☐
No ☑
Indicate the number of shares outstanding of each of the issuer’s classes of common stock, as of the latest practicable date:
| Shares Outstanding at September 30, 2023 | ||
|
|
||
1
|
MOODY’S CORPORATION
INDEX TO FORM 10-Q |
||||||||
| Page(s) | ||||||||
|
3
-6
|
||||||||
|
Consolidated Statements of Operations (Unaudited) for the Three Months Ended and
Nine
Months Ended
September 30, 2023
and
2022
|
||||||||
|
Consolidated Statements of Cash Flows (Unaudited) for the
Nine
Months Ended
September 30, 2023
and
2022
|
||||||||
|
43
-44
|
||||||||
|
|
||||||||
2
GLOSSARY OF TERMS AND ABBREVIATIONS
The following terms, abbreviations and acronyms are used to identify frequently used terms in this report:
|
TERM
|
DEFINITION
|
||||
|
Acquisition-Related Intangible Amortization Expense
|
Amortization of definite-lived intangible assets acquired by the Company from all business combination transactions
|
||||
|
Adjusted Diluted EPS
|
Diluted EPS excluding the impact of certain items as detailed in the section entitled “Non-GAAP Financial Measures”
|
||||
|
Adjusted Net Income
|
Net Income excluding the impact of certain items as detailed in the section entitled “Non-GAAP Financial Measures”
|
||||
|
Adjusted Operating Income
|
Operating income excluding the impact of certain items as detailed in the section entitled “Non-GAAP Financial Measures”
|
||||
|
Adjusted Operating Margin
|
Adjusted Operating Income divided by revenue
|
||||
|
Americas
|
Represents countries within North and South America, excluding the U.S.
|
||||
|
AOCI(L)
|
Accumulated other comprehensive income/loss; a separate component of shareholders’ equity
|
||||
|
ARR
|
Annualized Recurring Revenue; a supplemental performance metric to provide additional insight on the estimated value of MA's recurring revenue contracts at a given point in time, excluding the impact of FX and contracts related to acquisitions
|
||||
|
ASC
|
The FASB Accounting Standards Codification; the sole source of authoritative GAAP as of July 1, 2009 except for rules and interpretive releases of the SEC, which are also sources of authoritative GAAP for SEC registrants
|
||||
|
Asia-Pacific
|
Represents Australia and countries in Asia including but not limited to: China, India, Indonesia, Japan, Republic of South Korea, Malaysia, Singapore, Sri Lanka and Thailand
|
||||
|
ASR
|
Accelerated Share Repurchase
|
||||
|
ASU
|
The FASB Accounting Standards Update to the ASC. Provides background information for accounting guidance and the bases for conclusions on the changes in the ASC. ASUs are not considered authoritative until codified into the ASC
|
||||
| BitSight | A provider that helps global market participants understand cyber risk through ratings, analytics, and performance management tools | ||||
|
Board
|
The board of directors of the Company
|
||||
|
BPS
|
Basis points
|
||||
| CCXI | China Cheng Xin International Credit Rating Co. Ltd.; China’s first and largest domestic credit rating agency approved by the People’s Bank of China; currently Moody’s owns 30% of CCXI | ||||
| CDP |
Carbon Disclosure Project; an international nonprofit organization that helps companies, cities, states and regions manage their environmental impact through a global disclosure system
|
||||
|
CFG
|
Corporate finance group; an LOB of MIS
|
||||
|
CMBS
|
Commercial mortgage-backed securities; an asset class within SFG
|
||||
| COLI | Corporate-Owned Life Insurance | ||||
|
Common Stock
|
The Company’s common stock
|
||||
|
Company
|
Moody’s Corporation and its subsidiaries; MCO; Moody’s
|
||||
| COVID-19 | An outbreak of a novel strain of coronavirus resulting in an international public health crisis and a global pandemic | ||||
|
CP
|
Commercial Paper
|
||||
|
CP Program
|
A program entered into on August 3, 2016 allowing the Company to privately place CP up to a maximum of $1 billion for which the maturity may not exceed 397 days from the date of issue, and which is backstopped by the 2021 Facility
|
||||
|
D&A
|
Depreciation and amortization
|
||||
| Data and Information (D&I) |
LOB within MA which provides vast data sets on companies and securities via data feeds and data applications products
|
||||
| Decision Solutions (DS) |
LOB within MA that provides SaaS solutions supporting banking, insurance, and KYC workflows. This LOB utilizes components from the Data & Information and Research & Insights LOBs to provide risk assessment solutions
|
||||
|
EMEA
|
Represents countries within Europe, the Middle East and Africa
|
||||
|
EPS
|
Earnings per share
|
||||
3
|
TERM
|
DEFINITION
|
||||
|
ESG
|
Environmental, Social, and Governance
|
||||
| ESTR | Euro Short-Term Rate | ||||
|
ETR
|
Effective tax rate
|
||||
|
EU
|
European Union
|
||||
|
EURIBOR
|
The Euro Interbank Offered Rate
|
||||
|
Excess Tax Benefits
|
The difference between the tax benefit realized at exercise of an option or delivery of a restricted share and the tax benefit recorded at the time the option or restricted share is expensed under GAAP
|
||||
|
Exchange Act
|
The Securities Exchange Act of 1934, as amended
|
||||
|
External Revenue
|
Revenue excluding any intersegment amounts
|
||||
|
FASB
|
Financial Accounting Standards Board
|
||||
|
FIG
|
Financial institutions group; an LOB of MIS
|
||||
|
Free Cash Flow
|
Net cash provided by operating activities less cash paid for capital additions
|
||||
|
FX
|
Foreign exchange
|
||||
|
GAAP
|
U.S. Generally Accepted Accounting Principles
|
||||
|
GBP
|
British pounds
|
||||
| GCR | Global Credit Rating Company Limited; a credit rating agency in Africa with operations spanning the continent, including in South Africa, Nigeria, Senegal, Kenya, and Mauritius | ||||
| GDP | Gross domestic product | ||||
| GRI | Global Reporting Initiative; an international independent standards organization that helps organizations understand and disclose their impact on climate change, human rights and corruption | ||||
|
ICRA
|
ICRA Limited; a provider of credit ratings and research in India | ||||
| kompany | 360kompany AG (kompany); a Vienna, Austria-based platform for business verification and Know Your Customer (KYC) technology solutions, acquired by the Company in February 2022 | ||||
| KYC | Know-your-customer | ||||
|
LIBOR
|
London Interbank Offered Rate
|
||||
|
LOB
|
Line of business
|
||||
|
MA
|
Moody’s Analytics - a reportable segment of MCO which provides a wide range of products and services that support financial analysis and risk management activities of institutional participants in global financial markets; consists of three LOBs - Decision Solutions; Research and Insights; and Data and Information
|
||||
|
MAKS
|
Moody’s Analytics Knowledge Services; formerly known as Copal Amba; provided offshore research and analytic services to the global financial and corporate sectors; business was divested in the fourth quarter of 2019 and was formerly a reporting unit within the MA reportable segment | ||||
|
MCO
|
Moody’s Corporation and its subsidiaries; the Company; Moody’s
|
||||
|
MD&A
|
Management’s Discussion and Analysis of Financial Condition and Results of Operations
|
||||
|
MIS
|
Moody’s Investors Service - a reportable segment of MCO; consists of five LOBs - SFG; CFG; FIG; PPIF; and MIS Other
|
||||
|
MIS Other
|
Consists of financial instruments pricing services in the Asia-Pacific region, ICRA non-ratings revenue, and revenue from professional services. These businesses are components of MIS; MIS Other is an LOB of MIS
|
||||
|
Moody’s
|
Moody’s Corporation and its subsidiaries; MCO; the Company
|
||||
| MSS | Moody's Shared Services; primarily consists of information technology and support staff such as finance, human resources and legal that support both MA and MIS | ||||
|
Net Income
|
Net income attributable to Moody’s Corporation, which excludes net income from consolidated noncontrolling interests belonging to the minority interest holder
|
||||
|
NM
|
Percentage change is not meaningful
|
||||
4
|
TERM
|
DEFINITION
|
||||
|
Non-GAAP
|
A financial measure not in accordance with GAAP; these measures, when read in conjunction with the Company’s reported results, can provide useful supplemental information for investors analyzing period-to-period comparisons of the Company’s performance, facilitate comparisons to competitors’ operating results and to provide greater transparency to investors of supplemental information used by management in its financial and operational decision making
|
||||
|
NRSRO
|
Nationally Recognized Statistical Rating Organization, which is a credit rating agency registered with the SEC
|
||||
|
Operating segment
|
Term defined in the ASC relating to segment reporting; the ASC defines an operating segment as a component of a business entity that has each of the three following characteristics: i) the component engages in business activities from which it may recognize revenue and incur expenses; ii) the operating results of the component are regularly reviewed by the entity’s chief operating decision maker; and iii) discrete financial information about the component is available
|
||||
|
PPIF
|
Public, project and infrastructure finance; an LOB of MIS
|
||||
|
Recurring Revenue
|
For MA, represents subscription-based revenue and software maintenance revenue. For MIS, represents recurring monitoring fees of a rated debt obligation and/or entities that issue such obligations, as well as revenue from programs such as commercial paper, medium-term notes and shelf registrations. For MIS Other, represents subscription-based revenue
|
||||
|
Reporting unit
|
The level at which Moody’s evaluates its goodwill for impairment under GAAP; defined as an operating segment or one level below an operating segment
|
||||
| Research and Insights (R&I) |
LOB within MA that
provides models, scores, expert insights and commentary. This LOB includes credit research; credit models and analytics; economics data and models; and structured finance solutions
|
||||
|
RMBS
|
Residential mortgage-backed securities; an asset class within SFG
|
||||
| RMS |
Risk Management Solutions, Inc., a global provider of climate and natural disaster risk modeling and analytics; acquired by the Company in September 2021
|
||||
| SaaS |
Software-as-a-Service
|
||||
| SASB |
Sustainability Accounting Standards Board
|
||||
|
SEC
|
U.S. Securities and Exchange Commission
|
||||
|
SFG
|
Structured finance group; an LOB of MIS
|
||||
|
SG&A
|
Selling, general and administrative expenses
|
||||
| SOFR | Secured Overnight Financing Rate | ||||
|
Tax Act
|
The “Tax Cuts and Jobs Act” enacted into U.S. law on December 22, 2017 which significantly amends the tax code in the U.S.
|
||||
| TCFD | Task Force on Climate-Related Financial Disclosures | ||||
|
Total Debt
|
All indebtedness of the Company as reflected on the consolidated balance sheets
|
||||
|
Transaction Revenue
|
For MA, represents perpetual software license fees and revenue from software implementation services, risk management advisory projects, and training and certification services. For MIS (excluding MIS Other), represents the initial rating of a new debt issuance as well as other one-time fees. For MIS Other, represents revenue from professional services.
|
||||
|
U.K.
|
United Kingdom
|
||||
|
U.S.
|
United States
|
||||
|
USD
|
U.S. dollar
|
||||
|
UTPs
|
Uncertain tax positions
|
||||
| 2001 Plan | 2001 Moody's Corporation Key Employees' Stock Incentive Plan, as amended and restated December 20, 2022 | ||||
| 2022 - 2023 Geolocation Restructuring Program |
Restructuring program approved by the chief executive officer of Moody’s on June 30, 2022 relating to the Company's post-COVID-19 geolocation strategy
|
||||
|
2013 Senior Notes due 2024
|
Principal amount of $500 million, 4.875% senior unsecured notes due in February 2024
|
||||
|
2014 Senior Notes due 2044
|
Principal amount of $600 million, 5.25% senior unsecured notes due in July 2044
|
||||
|
2015 Senior Notes due 2027
|
Principal amount of €500 million, 1.75% senior unsecured notes due in March 2027
|
||||
|
2017 Senior Notes due 2028
|
Principal amount of $500 million, 3.250% senior unsecured notes due January 15, 2028
|
||||
|
2018 Senior Notes due 2029
|
Principal amount of $400 million, 4.25% senior unsecured notes due February 1, 2029
|
||||
5
|
TERM
|
DEFINITION
|
||||
|
2018 Senior Notes due 2048
|
Principal amount of $400 million, 4.875% senior unsecured notes due December 17, 2048
|
||||
| 2019 Senior Notes due 2030 | Principal amount of €750 million, 0.950% senior unsecured notes due February 25, 2030 | ||||
| 2020 Senior Notes due 2025 | Principal amount of $700 million, 3.75% senior unsecured notes due March 24, 2025 | ||||
| 2020 Senior Notes due 2050 | Principal amount of $300 million, 3.25% senior unsecured notes due May 20, 2050 | ||||
| 2020 Senior Notes due 2060 | Principal amount of $500 million, 2.55% senior unsecured notes due August 18, 2060 | ||||
| 2021 Facility | Five-year unsecured revolving credit facility, with capacity to borrow up to $1.25 billion; backstops CP issued under the CP Program | ||||
| 2021 Senior Notes due 2031 | Principal amount of $600 million, 2.00% senior unsecured notes due August 19, 2031 | ||||
| 2021 Senior Notes due 2041 | Principal amount of $600 million, 2.75% senior unsecured notes due August 19, 2041 | ||||
| 2021 Senior Notes due 2061 | Principal amount of $500 million, 3.10% senior unsecured notes due November 15, 2061 | ||||
| 2022 Senior Notes due 2052 | Principal amount of $500 million, 3.75% senior unsecured notes due February 25, 2052 | ||||
| 2022 Senior Notes due 2032 | Principal amount of $500 million, 4.25% senior unsecured notes due January 15, 2032 | ||||
6
PART I. FINANCIAL INFORMATION
Item 1. Financial Statements
MOODY’S CORPORATION
CONSOLIDATED STATEMENTS OF OPERATIONS (UNAUDITED)
(Amounts in millions, except per share data)
|
Three Months Ended
September 30,
|
Nine Months Ended
September 30, |
||||||||||||||||||||||
| 2023 | 2022 | 2023 | 2022 | ||||||||||||||||||||
| Revenue | $ |
|
$ |
|
$ |
|
$ |
|
|||||||||||||||
| Expenses | |||||||||||||||||||||||
| Operating |
|
|
|
|
|||||||||||||||||||
| Selling, general, and administrative |
|
|
|
|
|||||||||||||||||||
| Depreciation and amortization |
|
|
|
|
|||||||||||||||||||
| Restructuring |
|
|
|
|
|||||||||||||||||||
| Total expenses |
|
|
|
|
|||||||||||||||||||
| Operating income |
|
|
|
|
|||||||||||||||||||
| Non-operating (expense) income, net | |||||||||||||||||||||||
| Interest expense, net |
(
|
(
|
(
|
(
|
|||||||||||||||||||
| Other non-operating income, net |
|
|
|
|
|||||||||||||||||||
| Total non-operating (expense) income, net |
(
|
(
|
(
|
(
|
|||||||||||||||||||
| Income before provision for income taxes |
|
|
|
|
|||||||||||||||||||
| Provision for income taxes |
|
|
|
|
|||||||||||||||||||
| Net income |
|
|
|
|
|||||||||||||||||||
|
Less: Net income attributable to noncontrolling interests
|
|
|
|
|
|||||||||||||||||||
| Net income attributable to Moody's | $ |
|
$ |
|
$ |
|
$ |
|
|||||||||||||||
| Earnings per share attributable to Moody's common shareholders | |||||||||||||||||||||||
| Basic | $ |
|
$ |
|
$ |
|
$ |
|
|||||||||||||||
| Diluted | $ |
|
$ |
|
$ |
|
$ |
|
|||||||||||||||
| Weighted average number of shares outstanding | |||||||||||||||||||||||
| Basic |
|
|
|
|
|
||||||||||||||||||
| Diluted |
|
|
|
|
|
||||||||||||||||||
The accompanying notes are an integral part of the consolidated financial statements.
7
MOODY’S CORPORATION
CONSOLIDATED STATEMENTS OF COMPREHENSIVE INCOME (UNAUDITED)
(Amounts in millions)
|
Three Months Ended
September 30, 2023
|
Three Months Ended
September 30, 2022
|
||||||||||||||||||||||||||||||||||
|
Pre-tax
amounts |
Tax
amounts |
After-tax
amounts |
Pre-tax
amounts |
Tax
amounts |
After-tax
amounts |
||||||||||||||||||||||||||||||
| Net Income | $ |
|
$ |
|
|||||||||||||||||||||||||||||||
| Other Comprehensive Income (Loss): | |||||||||||||||||||||||||||||||||||
| Foreign Currency Adjustments: | |||||||||||||||||||||||||||||||||||
| Foreign currency translation adjustments, net | $ |
(
|
$ |
(
|
(
|
$ |
(
|
$ |
|
(
|
|||||||||||||||||||||||||
|
Net gains on net investment hedges
|
|
(
|
|
|
(
|
|
|||||||||||||||||||||||||||||
| Cash Flow Hedges: | |||||||||||||||||||||||||||||||||||
| Reclassification of losses included in net income |
|
|
|
|
(
|
|
|||||||||||||||||||||||||||||
| Pension and Other Retirement Benefits: | |||||||||||||||||||||||||||||||||||
|
Amortization of actuarial gains/prior service credits and settlement credit included in net income
|
(
|
|
(
|
|
|
|
|||||||||||||||||||||||||||||
| Net actuarial gains and prior service costs |
|
(
|
|
|
|
|
|||||||||||||||||||||||||||||
|
Total other comprehensive loss
|
$ |
(
|
$ |
(
|
$ |
(
|
$ |
(
|
$ |
(
|
$ |
(
|
|||||||||||||||||||||||
| Comprehensive income |
|
|
|||||||||||||||||||||||||||||||||
| Less: comprehensive income (loss) attributable to noncontrolling interests |
|
(
|
|||||||||||||||||||||||||||||||||
| Comprehensive Income Attributable to Moody's | $ |
|
$ |
|
|||||||||||||||||||||||||||||||
|
Nine Months Ended
September 30, 2023 |
Nine Months Ended
September 30, 2022 |
||||||||||||||||||||||||||||||||||
|
Pre-tax
amounts |
Tax
amounts |
After-tax
amounts |
Pre-tax
amounts |
Tax
amounts |
After-tax
amounts |
||||||||||||||||||||||||||||||
| Net Income | $ |
|
$ |
|
|||||||||||||||||||||||||||||||
| Other Comprehensive Income (Loss): | |||||||||||||||||||||||||||||||||||
| Foreign Currency Adjustments: | |||||||||||||||||||||||||||||||||||
| Foreign currency translation adjustments, net | $ |
(
|
$ |
(
|
(
|
$ |
(
|
$ |
|
(
|
|||||||||||||||||||||||||
| Foreign currency translation adjustments - reclassification of losses included in net income |
|
|
|
|
|
|
|||||||||||||||||||||||||||||
|
Net gains on net investment hedges
|
|
(
|
|
|
(
|
|
|||||||||||||||||||||||||||||
| Cash Flow Hedges: | |||||||||||||||||||||||||||||||||||
| Reclassification of losses included in net income |
|
(
|
|
|
(
|
|
|||||||||||||||||||||||||||||
| Pension and Other Retirement Benefits: | |||||||||||||||||||||||||||||||||||
|
Amortization of actuarial gains/prior service credits and settlement credit included in net income
|
(
|
|
(
|
|
|
|
|||||||||||||||||||||||||||||
| Net actuarial gains and prior service costs |
|
(
|
|
|
(
|
|
|||||||||||||||||||||||||||||
|
Total other comprehensive loss
|
$ |
(
|
$ |
(
|
$ |
(
|
$ |
(
|
$ |
(
|
$ |
(
|
|||||||||||||||||||||||
| Comprehensive income |
|
|
|||||||||||||||||||||||||||||||||
| Less: comprehensive loss attributable to noncontrolling interests |
(
|
(
|
|||||||||||||||||||||||||||||||||
| Comprehensive Income Attributable to Moody's | $ |
|
$ |
|
|||||||||||||||||||||||||||||||
The accompanying notes are an integral part of the consolidated financial statements.
8
MOODY’S CORPORATION
CONSOLIDATED BALANCE SHEETS (UNAUDITED)
(Amounts in millions, except share and per share data)
| September 30, 2023 | December 31, 2022 | ||||||||||
| ASSETS | |||||||||||
| Current assets: | |||||||||||
| Cash and cash equivalents | $ |
|
$ |
|
|||||||
| Short-term investments |
|
|
|||||||||
|
Accounts receivable, net of allowance for credit losses of $
|
|
|
|||||||||
| Other current assets |
|
|
|||||||||
| Total current assets |
|
|
|||||||||
|
Property and equipment, net of accumulated depreciation of $
|
|
|
|||||||||
| Operating lease right-of-use assets |
|
|
|||||||||
| Goodwill |
|
|
|||||||||
| Intangible assets, net |
|
|
|||||||||
| Deferred tax assets, net |
|
|
|||||||||
| Other assets |
|
|
|||||||||
| Total assets | $ |
|
$ |
|
|||||||
| LIABILITIES AND SHAREHOLDERS' EQUITY | |||||||||||
| Current liabilities: | |||||||||||
| Accounts payable and accrued liabilities | $ |
|
$ |
|
|||||||
| Current portion of operating lease liabilities |
|
|
|||||||||
| Deferred revenue |
|
|
|||||||||
| Total current liabilities |
|
|
|||||||||
| Non-current portion of deferred revenue |
|
|
|||||||||
| Long-term debt |
|
|
|||||||||
| Deferred tax liabilities, net |
|
|
|||||||||
| Uncertain tax positions |
|
|
|||||||||
| Operating lease liabilities |
|
|
|||||||||
| Other liabilities |
|
|
|||||||||
| Total liabilities |
|
|
|||||||||
|
Contingencies (Note 16)
|
|
|
|||||||||
| Shareholders' equity: | |||||||||||
|
Preferred stock, par value $
|
|
|
|||||||||
|
Series common stock, par value $
|
|
|
|||||||||
|
Common stock, par value $
|
|
|
|||||||||
| Capital surplus |
|
|
|||||||||
| Retained earnings |
|
|
|||||||||
|
Treasury stock, at cost;
|
(
|
(
|
|||||||||
| Accumulated other comprehensive loss |
(
|
(
|
|||||||||
| Total Moody's shareholders' equity |
|
|
|||||||||
| Noncontrolling interests |
|
|
|||||||||
| Total shareholders' equity |
|
|
|||||||||
| Total liabilities, noncontrolling interests, and shareholders' equity | $ |
|
$ |
|
|||||||
The accompanying notes are an integral part of the consolidated financial statements.
9
MOODY’S CORPORATION
CONSOLIDATED STATEMENTS OF CASH FLOWS (UNAUDITED)
(Amounts in millions)
| Nine Months Ended September 30, | |||||||||||
| 2023 | 2022 | ||||||||||
| Cash flows from operating activities | |||||||||||
| Net income | $ |
|
$ |
|
|||||||
| Reconciliation of net income to net cash provided by operating activities: | |||||||||||
| Depreciation and amortization |
|
|
|||||||||
| Stock-based compensation |
|
|
|||||||||
| Deferred income taxes |
(
|
|
|||||||||
| ROU Asset impairment & other non-cash restructuring/impairment charges |
|
|
|||||||||
| FX translation losses reclassified to net income |
|
|
|||||||||
| Changes in assets and liabilities: | |||||||||||
| Accounts receivable |
|
|
|||||||||
| Other current assets |
|
(
|
|||||||||
| Other assets |
(
|
|
|||||||||
| Lease obligations |
(
|
(
|
|||||||||
| Accounts payable and accrued liabilities |
(
|
(
|
|||||||||
| Deferred revenue |
(
|
(
|
|||||||||
| Uncertain tax positions |
(
|
(
|
|||||||||
| Other liabilities |
(
|
(
|
|||||||||
| Net cash provided by operating activities |
|
|
|||||||||
| Cash flows from investing activities | |||||||||||
| Capital additions |
(
|
(
|
|||||||||
| Purchases of investments |
(
|
(
|
|||||||||
| Sales and maturities of investments |
|
|
|||||||||
| Receipts from settlements of net investment hedges |
|
|
|||||||||
| Cash paid for acquisitions, net of cash acquired |
(
|
(
|
|||||||||
| Net cash used in investing activities |
(
|
(
|
|||||||||
| Cash flows from financing activities | |||||||||||
| Repayment of notes |
(
|
(
|
|||||||||
| Issuance of notes |
|
|
|||||||||
| Proceeds from stock-based compensation plans |
|
|
|||||||||
| Treasury shares |
(
|
(
|
|||||||||
| Repurchase of shares related to stock-based compensation |
(
|
(
|
|||||||||
| Dividends |
(
|
(
|
|||||||||
| Dividends to noncontrolling interest |
(
|
(
|
|||||||||
| Debt issuance costs and related fees |
|
(
|
|||||||||
| Net cash used in financing activities |
(
|
(
|
|||||||||
| Effect of exchange rate changes on cash and cash equivalents |
(
|
(
|
|||||||||
| Increase (decrease) in cash and cash equivalents |
|
(
|
|||||||||
| Cash and cash equivalents, beginning of period |
|
|
|||||||||
| Cash and cash equivalents, end of period | $ |
|
$ |
|
|||||||
The accompanying notes are an integral part of the consolidated financial statements.
10
MOODY’S CORPORATION
CONSOLIDATED STATEMENTS OF SHAREHOLDERS’ EQUITY (UNAUDITED)
(Amounts in millions, except per share data)
|
Shareholders of Moody's Corporation
|
|||||||||||||||||||||||||||||||||||||||||||||||||||||||||||
| Common Stock | Capital Surplus | Retained Earnings | Treasury Stock |
Accumulated
Other Comprehensive Loss |
Total Moody's
Shareholders' Equity |
Non- Controlling
Interests |
Total
Shareholders' Equity |
||||||||||||||||||||||||||||||||||||||||||||||||||||
| Shares | Amount | Shares | Amount | ||||||||||||||||||||||||||||||||||||||||||||||||||||||||
|
Balance at June 30, 2022
|
|
$ |
|
$ |
|
$ |
|
(
|
$ |
(
|
$ |
(
|
$ |
|
$ |
|
$ |
|
|||||||||||||||||||||||||||||||||||||||||
| Net income |
|
|
|
|
|||||||||||||||||||||||||||||||||||||||||||||||||||||||
|
Dividends ($
|
(
|
(
|
(
|
(
|
|||||||||||||||||||||||||||||||||||||||||||||||||||||||
| Stock-based compensation |
|
|
|
||||||||||||||||||||||||||||||||||||||||||||||||||||||||
| Shares issued for stock-based compensation plans at average cost, net |
|
|
|
|
|
||||||||||||||||||||||||||||||||||||||||||||||||||||||
| Treasury shares repurchased |
|
(
|
(
|
(
|
(
|
||||||||||||||||||||||||||||||||||||||||||||||||||||||
|
Currency translation adjustment, net of net investment hedge activity (net of tax of $
|
(
|
(
|
(
|
(
|
|||||||||||||||||||||||||||||||||||||||||||||||||||||||
| Amortization of prior service costs and actuarial losses |
|
|
|
||||||||||||||||||||||||||||||||||||||||||||||||||||||||
|
Balance at September 30, 2022
|
|
$ |
|
$ |
|
$ |
|
(
|
$ |
(
|
$ |
(
|
$ |
|
$ |
|
$ |
|
|||||||||||||||||||||||||||||||||||||||||
The accompanying notes are an integral part of the consolidated financial statements.
11
MOODY'S CORPORATION
CONSOLIDATED STATEMENTS OF SHAREHOLDERS' EQUITY (UNAUDITED)
(Amounts in millions, except per share data)
|
Shareholders of Moody's Corporation
|
|||||||||||||||||||||||||||||||||||||||||||||||||||||||||||
| Common Stock |
Capital
Surplus |
Retained
Earnings |
Treasury Stock |
Accumulated
Other Comprehensive Loss |
Total Moody's
Shareholders' Equity |
Non- Controlling
Interests |
Total
Shareholders' Equity |
||||||||||||||||||||||||||||||||||||||||||||||||||||
| Shares | Amount | Shares | Amount | ||||||||||||||||||||||||||||||||||||||||||||||||||||||||
|
Balance at December 31, 2021
|
|
$ |
|
$ |
|
$ |
|
(
|
$ |
(
|
$ |
(
|
$ |
|
$ |
|
$ |
|
|||||||||||||||||||||||||||||||||||||||||
| Net income |
|
|
|
|
|||||||||||||||||||||||||||||||||||||||||||||||||||||||
|
Dividends ($
|
(
|
(
|
(
|
(
|
|||||||||||||||||||||||||||||||||||||||||||||||||||||||
| Stock-based compensation |
|
|
|
||||||||||||||||||||||||||||||||||||||||||||||||||||||||
| Shares issued for stock-based compensation plans at average cost, net |
(
|
|
(
|
(
|
(
|
||||||||||||||||||||||||||||||||||||||||||||||||||||||
|
Shares issued as consideration to acquire kompany
(1)
|
|
|
|
|
|
||||||||||||||||||||||||||||||||||||||||||||||||||||||
| Treasury shares repurchased |
(
|
(
|
(
|
(
|
(
|
||||||||||||||||||||||||||||||||||||||||||||||||||||||
|
Currency translation adjustment, net of net investment hedge activity (net of tax of $
|
(
|
(
|
(
|
(
|
|||||||||||||||||||||||||||||||||||||||||||||||||||||||
|
Net actuarial gains and prior service costs (net of tax of $
|
|
|
|
||||||||||||||||||||||||||||||||||||||||||||||||||||||||
| Amortization of prior service costs and actuarial losses |
|
|
|
||||||||||||||||||||||||||||||||||||||||||||||||||||||||
| Net realized and unrealized gain on cash flow hedges |
|
|
|
||||||||||||||||||||||||||||||||||||||||||||||||||||||||
| Balance at September 30, 2022 |
|
$ |
|
$ |
|
$ |
|
(
|
$ |
(
|
$ |
(
|
$ |
|
$ |
|
$ |
|
|||||||||||||||||||||||||||||||||||||||||
The accompanying notes are an integral part of the consolidated financial statements.
(1)
Represents a non-cash investing activity relating to the issuance of common stock to fund a portion of the purchase price for kompany
.
12
MOODY'S CORPORATION
CONSOLIDATED STATEMENTS OF SHAREHOLDERS' EQUITY (UNAUDITED)
(Amounts in millions, except per share data)
|
Shareholders of Moody's Corporation
|
|||||||||||||||||||||||||||||||||||||||||||||||||||||||||||
| Common Stock |
Capital
Surplus |
Retained
Earnings |
Treasury Stock |
Accumulated
Other Comprehensive Loss |
Total Moody's
Shareholders' Equity |
Non- Controlling
Interests |
Total
Shareholders' Equity |
||||||||||||||||||||||||||||||||||||||||||||||||||||
| Shares | Amount | Shares | Amount | ||||||||||||||||||||||||||||||||||||||||||||||||||||||||
|
Balance at June 30, 2023
|
|
$ |
|
$ |
|
$ |
|
(
|
$ |
(
|
$ |
(
|
$ |
|
$ |
|
$ |
|
|||||||||||||||||||||||||||||||||||||||||
| Net income |
|
|
|
|
|||||||||||||||||||||||||||||||||||||||||||||||||||||||
|
Dividends ($
|
(
|
(
|
(
|
(
|
|||||||||||||||||||||||||||||||||||||||||||||||||||||||
| Stock-based compensation |
|
|
|
||||||||||||||||||||||||||||||||||||||||||||||||||||||||
| Shares issued for stock-based compensation plans at average cost, net |
|
|
|
|
|
||||||||||||||||||||||||||||||||||||||||||||||||||||||
| Treasury shares repurchased |
(
|
(
|
(
|
(
|
|||||||||||||||||||||||||||||||||||||||||||||||||||||||
|
Currency translation adjustment, net of net investment hedge activity (net of tax of $
|
(
|
(
|
|
(
|
|||||||||||||||||||||||||||||||||||||||||||||||||||||||
|
Net actuarial gains and prior service costs (net of tax of $
|
|
|
|
||||||||||||||||||||||||||||||||||||||||||||||||||||||||
|
Amortization of prior service credits/ actuarial gains and settlement credit
|
(
|
(
|
(
|
||||||||||||||||||||||||||||||||||||||||||||||||||||||||
|
Net realized and unrealized gain on cash flow hedges
|
|
|
|
||||||||||||||||||||||||||||||||||||||||||||||||||||||||
|
Balance at September 30, 2023
|
|
$ |
|
$ |
|
$ |
|
(
|
$ |
(
|
$ |
(
|
$ |
|
$ |
|
$ |
|
|||||||||||||||||||||||||||||||||||||||||
The accompanying notes are an integral part of the consolidated financial statements.
13
MOODY'S CORPORATION
CONSOLIDATED STATEMENTS OF SHAREHOLDERS' EQUITY (UNAUDITED)
(Amounts in millions, except per share data)
|
Shareholders of Moody's Corporation
|
|||||||||||||||||||||||||||||||||||||||||||||||||||||||||||
| Common Stock |
Capital
Surplus |
Retained
Earnings |
Treasury Stock |
Accumulated
Other Comprehensive Loss |
Total Moody's
Shareholders' Equity |
Non- Controlling
Interests |
Total
Shareholders' Equity |
||||||||||||||||||||||||||||||||||||||||||||||||||||
| Shares | Amount | Shares | Amount | ||||||||||||||||||||||||||||||||||||||||||||||||||||||||
| Balance at December 31, 2022 |
|
$ |
|
$ |
|
$ |
|
(
|
$ |
(
|
$ |
(
|
$ |
|
$ |
|
$ |
|
|||||||||||||||||||||||||||||||||||||||||
| Net income |
|
|
|
|
|||||||||||||||||||||||||||||||||||||||||||||||||||||||
|
Dividends ($
|
(
|
(
|
(
|
(
|
|||||||||||||||||||||||||||||||||||||||||||||||||||||||
| Stock-based compensation |
|
|
|
||||||||||||||||||||||||||||||||||||||||||||||||||||||||
| Shares issued for stock-based compensation plans at average cost, net |
(
|
|
(
|
(
|
(
|
||||||||||||||||||||||||||||||||||||||||||||||||||||||
| Treasury shares repurchased |
|
(
|
(
|
(
|
(
|
||||||||||||||||||||||||||||||||||||||||||||||||||||||
|
Currency translation adjustment, net of net investment hedge activity (net of tax of $
|
(
|
(
|
(
|
(
|
|||||||||||||||||||||||||||||||||||||||||||||||||||||||
|
Net actuarial gains and prior service costs (net of tax of $
|
|
|
|
||||||||||||||||||||||||||||||||||||||||||||||||||||||||
|
Amortization of prior service credits/ actuarial gains and settlement credit (net of tax of $
|
(
|
(
|
(
|
||||||||||||||||||||||||||||||||||||||||||||||||||||||||
|
Net realized and unrealized gain on cash flow hedges (net of tax of $
|
|
|
|
||||||||||||||||||||||||||||||||||||||||||||||||||||||||
| Balance at September 30, 2023 |
|
$ |
|
$ |
|
$ |
|
(
|
$ |
(
|
$ |
(
|
$ |
|
$ |
|
$ |
|
|||||||||||||||||||||||||||||||||||||||||
The accompanying notes are an integral part of the consolidated financial statements.
14
MOODY’S CORPORATION
NOTES TO CONSOLIDATED FINANCIAL STATEMENTS (UNAUDITED)
(tabular dollar and share amounts in millions, except per share data)
NOTE 1.
DESCRIPTION OF BUSINESS AND BASIS OF PRESENTATION
Moody’s is a global risk assessment firm that empowers organizations and investors to make better decisions. Moody’s reports in
two
reportable segments: MA and MIS.
MA is a global provider of: i) data and information; ii) research and insights; and iii) decision solutions, which help companies make better and faster decisions. MA leverages its industry expertise across multiple risks such as credit, market, financial crime, supply chain, catastrophe and climate to deliver risk assessment solutions that enable business leaders to identify, measure and manage the implications of interrelated risks and opportunities.
MIS publishes credit ratings and provides assessment services on a wide range of debt obligations, programs and facilities, and the entities that issue such obligations in markets worldwide, including various corporate, financial institution and governmental obligations, and structured finance securities.
These interim financial statements have been prepared in accordance with the instructions to Form 10-Q and should be read in conjunction with the Company’s consolidated financial statements and related notes in the Company’s 2022 annual report on Form 10-K filed with the SEC on February 15, 2023. The results of interim periods are not necessarily indicative of results for the full year or any subsequent period. In the opinion of management, all adjustments (including normal recurring accruals) considered necessary for a fair presentation of financial position, results of operations and cash flows at the dates and for the periods presented have been included. The year-end consolidated balance sheet data was derived from audited financial statements, but does not include all disclosures required by GAAP.
Certain reclassifications have been made to prior period amounts to conform to the current presentation.
During the first quarter of 2023, the Company modified the contractual terms of certain of its interest rate swaps designated as fair value hedges and cross-currency swaps designated as net investment hedges. These modifications replaced the previous LIBOR/EURIBOR-based reference rates included in the swap agreements to SOFR/ESTR-based rates. Pursuant to the modification of the contractual terms of these instruments, the Company utilized the optional expedients set forth in ASC Topic 848 relating to derivative instruments used in hedging relationships. The aggregate notional amounts of these swaps is disclosed in Note 8.
Reclassification of Previously Reported Revenue by LOB
In the second quarter of 2023, the Company expanded its disaggregation of revenue disclosures for MA's Decision Solutions LOB to enhance insight and transparency into this business. In conjunction with this new presentation, the Company reclassified certain immaterial revenue relating to structured finance solutions from the Decision Solutions LOB to the Research & Insights LOB.
Prior year revenue by LOB disclosures have been reclassified to conform to this new presentation, which is disclosed in Note 2.
15
NOTE 2.
REVENUES
Revenue by Category
The following table presents the Company’s revenues disaggregated by LOB:
|
Three Months Ended
September 30,
|
Nine Months Ended
September 30, |
||||||||||||||||||||||
| 2023 | 2022 | 2023 | 2022 | ||||||||||||||||||||
| MA: | |||||||||||||||||||||||
| Decision Solutions (DS) | |||||||||||||||||||||||
| Banking | $ |
|
$ |
|
$ |
|
$ |
|
|||||||||||||||
| Insurance |
|
|
|
|
|||||||||||||||||||
| KYC |
|
|
|
|
|||||||||||||||||||
| Total DS |
|
|
|
|
|||||||||||||||||||
| Research and Insights (R&I) |
|
|
|
|
|||||||||||||||||||
| Data and Information (D&I) |
|
|
|
|
|||||||||||||||||||
| Total external revenue |
|
|
|
|
|||||||||||||||||||
| Intersegment revenue |
|
|
|
|
|||||||||||||||||||
| Total MA |
|
|
|
|
|||||||||||||||||||
| MIS: | |||||||||||||||||||||||
| Corporate Finance (CFG) | |||||||||||||||||||||||
| Investment-grade |
|
|
|
|
|||||||||||||||||||
| High-yield |
|
|
|
|
|||||||||||||||||||
| Bank loans |
|
|
|
|
|||||||||||||||||||
|
Other accounts
(1)
|
|
|
|
|
|||||||||||||||||||
| Total CFG |
|
|
|
|
|||||||||||||||||||
| Structured Finance (SFG) | |||||||||||||||||||||||
| Asset-backed securities |
|
|
|
|
|||||||||||||||||||
| RMBS |
|
|
|
|
|||||||||||||||||||
| CMBS |
|
|
|
|
|||||||||||||||||||
| Structured credit |
|
|
|
|
|||||||||||||||||||
| Other accounts |
|
|
|
|
|||||||||||||||||||
| Total SFG |
|
|
|
|
|||||||||||||||||||
| Financial Institutions (FIG) | |||||||||||||||||||||||
| Banking |
|
|
|
|
|||||||||||||||||||
| Insurance |
|
|
|
|
|||||||||||||||||||
| Managed investments |
|
|
|
|
|||||||||||||||||||
| Other accounts |
|
|
|
|
|||||||||||||||||||
| Total FIG |
|
|
|
|
|||||||||||||||||||
| Public, Project and Infrastructure Finance (PPIF) | |||||||||||||||||||||||
| Public finance / sovereign |
|
|
|
|
|||||||||||||||||||
| Project and infrastructure |
|
|
|
|
|||||||||||||||||||
| Total PPIF |
|
|
|
|
|||||||||||||||||||
| Total ratings revenue |
|
|
|
|
|||||||||||||||||||
| MIS Other |
|
|
|
|
|||||||||||||||||||
| Total external revenue |
|
|
|
|
|||||||||||||||||||
| Intersegment revenue |
|
|
|
|
|||||||||||||||||||
| Total MIS |
|
|
|
|
|||||||||||||||||||
| Eliminations |
(
|
(
|
(
|
(
|
|||||||||||||||||||
| Total MCO | $ |
|
$ |
|
$ |
|
$ |
|
|||||||||||||||
(1)
Other includes: recurring monitoring fees of a rated debt obligation and/or entities that issue such obligations as well as fees from programs such as commercial paper, medium term notes, and ICRA corporate finance revenue.
16
The following table presents the Company’s revenues disaggregated by LOB and geographic area:
| Three Months Ended September 30, 2023 | Three Months Ended September 30, 2022 | ||||||||||||||||||||||||||||||||||
| U.S. | Non-U.S | Total | U.S. | Non-U.S | Total | ||||||||||||||||||||||||||||||
| MA: | |||||||||||||||||||||||||||||||||||
| Decision Solutions | $ |
|
$ |
|
$ |
|
$ |
|
$ |
|
$ |
|
|||||||||||||||||||||||
| Research and Insights |
|
|
|
|
|
|
|||||||||||||||||||||||||||||
| Data and Information |
|
|
|
|
|
|
|||||||||||||||||||||||||||||
| Total MA |
|
|
|
|
|
|
|||||||||||||||||||||||||||||
| MIS: | |||||||||||||||||||||||||||||||||||
| Corporate Finance |
|
|
|
|
|
|
|||||||||||||||||||||||||||||
| Structured Finance |
|
|
|
|
|
|
|||||||||||||||||||||||||||||
| Financial Institutions |
|
|
|
|
|
|
|||||||||||||||||||||||||||||
| Public, Project and Infrastructure Finance |
|
|
|
|
|
|
|||||||||||||||||||||||||||||
| Total ratings revenue |
|
|
|
|
|
|
|||||||||||||||||||||||||||||
| MIS Other |
|
|
|
|
|
|
|||||||||||||||||||||||||||||
| Total MIS |
|
|
|
|
|
|
|||||||||||||||||||||||||||||
| Total MCO | $ |
|
$ |
|
$ |
|
$ |
|
$ |
|
$ |
|
|||||||||||||||||||||||
| Nine Months Ended September 30, 2023 | Nine Months Ended September 30, 2022 | ||||||||||||||||||||||||||||||||||
| U.S. | Non-U.S | Total | U.S. | Non-U.S | Total | ||||||||||||||||||||||||||||||
| MA: | |||||||||||||||||||||||||||||||||||
| Decision Solutions | $ |
|
$ |
|
$ |
|
$ |
|
$ |
|
$ |
|
|||||||||||||||||||||||
| Research and Insights |
|
|
|
|
|
|
|||||||||||||||||||||||||||||
| Data and Information |
|
|
|
|
|
|
|||||||||||||||||||||||||||||
| Total MA |
|
|
|
|
|
|
|||||||||||||||||||||||||||||
| MIS: | |||||||||||||||||||||||||||||||||||
| Corporate Finance |
|
|
|
|
|
|
|||||||||||||||||||||||||||||
| Structured Finance |
|
|
|
|
|
|
|||||||||||||||||||||||||||||
| Financial Institutions |
|
|
|
|
|
|
|||||||||||||||||||||||||||||
| Public, Project and Infrastructure Finance |
|
|
|
|
|
|
|||||||||||||||||||||||||||||
| Total ratings revenue |
|
|
|
|
|
|
|||||||||||||||||||||||||||||
| MIS Other |
|
|
|
|
|
|
|||||||||||||||||||||||||||||
| Total MIS |
|
|
|
|
|
|
|||||||||||||||||||||||||||||
| Total MCO | $ |
|
$ |
|
$ |
|
$ |
|
$ |
|
$ |
|
|||||||||||||||||||||||
17
The following table presents the Company’s reportable segment revenues disaggregated by segment and geographic region:
|
Three Months Ended
September 30,
|
Nine Months Ended
September 30, |
||||||||||||||||||||||
| 2023 | 2022 | 2023 | 2022 | ||||||||||||||||||||
| MA: | |||||||||||||||||||||||
| U.S. | $ |
|
$ |
|
$ |
|
$ |
|
|||||||||||||||
| Non-U.S.: | |||||||||||||||||||||||
| EMEA |
|
|
|
|
|||||||||||||||||||
| Asia-Pacific |
|
|
|
|
|||||||||||||||||||
| Americas |
|
|
|
|
|||||||||||||||||||
| Total Non-U.S. |
|
|
|
|
|||||||||||||||||||
| Total MA |
|
|
|
|
|||||||||||||||||||
| MIS: | |||||||||||||||||||||||
| U.S. |
|
|
|
|
|||||||||||||||||||
| Non-U.S.: | |||||||||||||||||||||||
| EMEA |
|
|
|
|
|||||||||||||||||||
| Asia-Pacific |
|
|
|
|
|||||||||||||||||||
| Americas |
|
|
|
|
|||||||||||||||||||
| Total Non-U.S. |
|
|
|
|
|||||||||||||||||||
| Total MIS |
|
|
|
|
|||||||||||||||||||
| Total MCO | $ |
|
$ |
|
$ |
|
$ |
|
|||||||||||||||
The following tables summarize the split between Transaction Revenue and Recurring Revenue.
|
Three Months Ended September 30,
|
|||||||||||||||||||||||||||||||||||
| 2023 | 2022 | ||||||||||||||||||||||||||||||||||
| Transaction | Recurring | Total | Transaction | Recurring | Total | ||||||||||||||||||||||||||||||
| Decision Solutions | $ |
|
$ |
|
$ |
|
$ |
|
$ |
|
$ |
|
|||||||||||||||||||||||
|
|
% |
|
% |
|
% |
|
% |
|
% |
|
% | ||||||||||||||||||||||||
| Research and Insights | $ |
|
$ |
|
$ |
|
$ |
|
$ |
|
$ |
|
|||||||||||||||||||||||
|
|
% |
|
% |
|
% |
|
% |
|
% |
|
% | ||||||||||||||||||||||||
| Data and Information | $ |
|
$ |
|
$ |
|
$ |
|
$ |
|
$ |
|
|||||||||||||||||||||||
|
|
% |
|
% |
|
% |
|
% |
|
% |
|
% | ||||||||||||||||||||||||
| Total MA | $ |
|
(1)
|
$ |
|
$ |
|
$ |
|
$ |
|
$ |
|
||||||||||||||||||||||
|
|
% |
|
% |
|
% |
|
% |
|
% |
|
% | ||||||||||||||||||||||||
| Corporate Finance | $ |
|
$ |
|
$ |
|
$ |
|
$ |
|
$ |
|
|||||||||||||||||||||||
|
|
% |
|
% |
|
% |
|
% |
|
% |
|
% | ||||||||||||||||||||||||
| Structured Finance | $ |
|
$ |
|
$ |
|
$ |
|
$ |
|
$ |
|
|||||||||||||||||||||||
|
|
% |
|
% |
|
% |
|
% |
|
% |
|
% | ||||||||||||||||||||||||
| Financial Institutions | $ |
|
$ |
|
$ |
|
$ |
|
$ |
|
$ |
|
|||||||||||||||||||||||
|
|
% |
|
% |
|
% |
|
% |
|
% |
|
% | ||||||||||||||||||||||||
| Public, Project and Infrastructure Finance | $ |
|
$ |
|
$ |
|
$ |
|
$ |
|
$ |
|
|||||||||||||||||||||||
|
|
% |
|
% |
|
% |
|
% |
|
% |
|
% | ||||||||||||||||||||||||
| MIS Other | $ |
|
$ |
|
$ |
|
$ |
|
$ |
|
$ |
|
|||||||||||||||||||||||
|
|
% |
|
% |
|
% |
|
% |
|
% |
|
% | ||||||||||||||||||||||||
| Total MIS | $ |
|
$ |
|
$ |
|
$ |
|
$ |
|
$ |
|
|||||||||||||||||||||||
|
|
% |
|
% |
|
% |
|
% |
|
% |
|
% | ||||||||||||||||||||||||
| Total Moody's Corporation | $ |
|
$ |
|
$ |
|
$ |
|
$ |
|
$ |
|
|||||||||||||||||||||||
|
|
% |
|
% |
|
% |
|
% |
|
% |
|
% | ||||||||||||||||||||||||
18
| Nine Months Ended September 30, | |||||||||||||||||||||||||||||||||||
| 2023 | 2022 | ||||||||||||||||||||||||||||||||||
| Transaction | Recurring | Total | Transaction | Recurring | Total | ||||||||||||||||||||||||||||||
| Decision Solutions | $ |
|
$ |
|
$ |
|
$ |
|
$ |
|
$ |
|
|||||||||||||||||||||||
|
|
% |
|
% |
|
% |
|
% |
|
% |
|
% | ||||||||||||||||||||||||
| Research and Insights | $ |
|
$ |
|
$ |
|
$ |
|
$ |
|
$ |
|
|||||||||||||||||||||||
|
|
% |
|
% |
|
% |
|
% |
|
% |
|
% | ||||||||||||||||||||||||
| Data and Information | $ |
|
$ |
|
$ |
|
$ |
|
$ |
|
$ |
|
|||||||||||||||||||||||
|
|
% |
|
% |
|
% |
|
% |
|
% |
|
% | ||||||||||||||||||||||||
| Total MA | $ |
|
(1)
|
$ |
|
$ |
|
$ |
|
$ |
|
$ |
|
||||||||||||||||||||||
|
|
% |
|
% |
|
% |
|
% |
|
% |
|
% | ||||||||||||||||||||||||
| Corporate Finance | $ |
|
$ |
|
$ |
|
$ |
|
$ |
|
$ |
|
|||||||||||||||||||||||
|
|
% |
|
% |
|
% |
|
% |
|
% |
|
% | ||||||||||||||||||||||||
| Structured Finance | $ |
|
$ |
|
$ |
|
$ |
|
$ |
|
$ |
|
|||||||||||||||||||||||
|
|
% |
|
% |
|
% |
|
% |
|
% |
|
% | ||||||||||||||||||||||||
| Financial Institutions | $ |
|
$ |
|
$ |
|
$ |
|
$ |
|
$ |
|
|||||||||||||||||||||||
|
|
% |
|
% |
|
% |
|
% |
|
% |
|
% | ||||||||||||||||||||||||
| Public, Project and Infrastructure Finance | $ |
|
$ |
|
$ |
|
$ |
|
$ |
|
$ |
|
|||||||||||||||||||||||
|
|
% |
|
% |
|
% |
|
% |
|
% |
|
% | ||||||||||||||||||||||||
| MIS Other | $ |
|
$ |
|
$ |
|
$ |
|
$ |
|
$ |
|
|||||||||||||||||||||||
|
|
% |
|
% |
|
% |
|
% |
|
% |
|
% | ||||||||||||||||||||||||
| Total MIS | $ |
|
$ |
|
$ |
|
$ |
|
$ |
|
$ |
|
|||||||||||||||||||||||
|
|
% |
|
% |
|
% |
|
% |
|
% |
|
% | ||||||||||||||||||||||||
| Total Moody's Corporation | $ |
|
$ |
|
$ |
|
$ |
|
$ |
|
$ |
|
|||||||||||||||||||||||
|
|
% |
|
% |
|
% |
|
% |
|
% |
|
% | ||||||||||||||||||||||||
The following table presents the timing of revenue recognition:
|
Three Months Ended September 30, 2023
|
Nine Months Ended September 30, 2023 | ||||||||||||||||||||||||||||||||||
| MA | MIS | Total | MA | MIS | Total | ||||||||||||||||||||||||||||||
| Revenue recognized at a point in time | $ |
|
$ |
|
$ |
|
$ |
|
$ |
|
$ |
|
|||||||||||||||||||||||
| Revenue recognized over time |
|
|
|
|
|
|
|||||||||||||||||||||||||||||
| Total | $ |
|
$ |
|
$ |
|
$ |
|
$ |
|
$ |
|
|||||||||||||||||||||||
| Three Months Ended September 30, 2022 | Nine Months Ended September 30, 2022 | ||||||||||||||||||||||||||||||||||
| MA | MIS | Total | MA | MIS | Total | ||||||||||||||||||||||||||||||
| Revenue recognized at a point in time | $ |
|
$ |
|
$ |
|
$ |
|
$ |
|
$ |
|
|||||||||||||||||||||||
| Revenue recognized over time |
|
|
|
|
|
|
|||||||||||||||||||||||||||||
| Total | $ |
|
$ |
|
$ |
|
$ |
|
$ |
|
$ |
|
|||||||||||||||||||||||
Unbilled receivables, deferred revenue and remaining performance obligations
Unbilled receivables
For certain MA arrangements, the timing of when the Company has the unconditional right to consideration and recognizes revenue occurs prior to invoicing the customer. In addition, certain MIS arrangements contain contractual terms whereby the customers are billed in arrears for annual monitoring services, requiring revenue to be accrued as an unbilled receivable as such services are provided.
19
The following table presents the Company's unbilled receivables, which are included within accounts receivable, net, at September 30, 2023 and December 31, 2022:
|
As of September 30, 2023
|
As of December 31, 2022
|
||||||||||||||||||||||
| MA | MIS | MA | MIS | ||||||||||||||||||||
| Unbilled Receivables | $ |
|
$ |
|
$ |
|
$ |
|
|||||||||||||||
Deferred revenue
The Company recognizes deferred revenue when a contract requires a customer to pay consideration to the Company in advance of when revenue related to that contract is recognized. This deferred revenue is relieved when the Company satisfies the related performance obligation and revenue is recognized.
Significant changes in the deferred revenue balances during the three and nine months ended September 30, 2023 and 2022 are as follows:
|
Three Months Ended September 30, 2023
|
Three Months Ended September 30, 2022
|
||||||||||||||||||||||||||||||||||
| MA | MIS | Total | MA | MIS | Total | ||||||||||||||||||||||||||||||
|
Balance at June 30,
|
$ |
|
$ |
|
$ |
|
$ |
|
$ |
|
$ |
|
|||||||||||||||||||||||
| Changes in deferred revenue | |||||||||||||||||||||||||||||||||||
| Revenue recognized that was included in the deferred revenue balance at the beginning of the period |
(
|
(
|
(
|
(
|
(
|
(
|
|||||||||||||||||||||||||||||
| Increases due to amounts billable excluding amounts recognized as revenue during the period |
|
|
|
|
|
|
|||||||||||||||||||||||||||||
| Effect of exchange rate changes |
(
|
(
|
(
|
(
|
(
|
(
|
|||||||||||||||||||||||||||||
| Total changes in deferred revenue |
(
|
(
|
(
|
(
|
(
|
(
|
|||||||||||||||||||||||||||||
|
Balance at September 30,
|
$ |
|
$ |
|
$ |
|
$ |
|
$ |
|
$ |
|
|||||||||||||||||||||||
| Nine Months Ended September 30, 2023 | Nine Months Ended September 30, 2022 | ||||||||||||||||||||||||||||||||||
| MA | MIS | Total | MA | MIS | Total | ||||||||||||||||||||||||||||||
| Balance at December 31, | $ |
|
$ |
|
$ |
|
$ |
|
$ |
|
$ |
|
|||||||||||||||||||||||
| Changes in deferred revenue | |||||||||||||||||||||||||||||||||||
| Revenue recognized that was included in the deferred revenue balance at the beginning of the period |
(
|
(
|
(
|
(
|
(
|
(
|
|||||||||||||||||||||||||||||
| Increases due to amounts billable excluding amounts recognized as revenue during the period |
|
|
|
|
|
|
|||||||||||||||||||||||||||||
| Increases due to acquisitions during the period |
|
|
|
|
|
|
|||||||||||||||||||||||||||||
| Effect of exchange rate changes |
(
|
(
|
(
|
(
|
(
|
(
|
|||||||||||||||||||||||||||||
| Total changes in deferred revenue |
(
|
|
(
|
(
|
|
(
|
|||||||||||||||||||||||||||||
|
Balance at September 30,
|
$ |
|
$ |
|
$ |
|
$ |
|
$ |
|
$ |
|
|||||||||||||||||||||||
| Deferred revenue - current | $ |
|
$ |
|
$ |
|
$ |
|
$ |
|
$ |
|
|||||||||||||||||||||||
| Deferred revenue - non-current | $ |
|
$ |
|
$ |
|
$ |
|
$ |
|
$ |
|
|||||||||||||||||||||||
For the MA segment, the decrease in deferred revenue for the three months ended September 30, 2023 was primarily due to the recognition of annual subscription and maintenance billings from December 2022 and January 2023. For the nine months ended September 30, 2023, the decrease in the deferred revenue balance is attributable to recognition of revenues related to the aforementioned December 2022 billings and unfavorable changes in FX translation rates being mostly offset by the impact of the high concentration of billings in the first quarter of 2023.
20
For the MIS segment, the changes in the deferred revenue balance during the three and nine months ended September 30, 2023 were primarily related to the significant portion of contract renewals that occurred during the first quarter of 2023 and are generally recognized over a one year period.
Remaining performance obligations
Remaining performance obligations in the MA segment include both amounts recorded as deferred revenue on the balance sheet as of September 30, 2023 as well as amounts not yet invoiced to customers as of September 30, 2023, largely reflecting future revenue related to signed multi-year arrangements for hosted and installed subscription-based products. As of September 30, 2023, the aggregate amount of the transaction price allocated to remaining performance obligations was approximately $
3.1
billion. The Company expects to recognize into revenue approximately
65
% of this balance within
one year
, approximately
25
% of this balance between
to
two years
and the remaining amount thereafter.
Remaining performance obligations in the MIS segment largely reflect deferred revenue related to monitoring fees for certain structured finance products, primarily CMBS, where the issuers can elect to pay the monitoring fees for the life of the security in advance. As of September 30, 2023, the aggregate amount of the transaction price allocated to remaining performance obligations was approximately $
91
million. The Company expects to recognize into revenue approximately
25
% of this balance within
one year
, approximately
50
% of this balance between
to
five years
and the remaining amount thereafter. With respect to the remaining performance obligations for the MIS segment, the Company has applied a practical expedient set forth in ASC Topic 606 permitting the omission from the amounts stated above relating to unsatisfied performance obligations for contracts with an original expected length of one year or less.
NOTE 3.
STOCK-BASED COMPENSATION
Presented below is a summary of the stock-based compensation cost and associated tax benefit included in the accompanying consolidated statements of operations:
|
Three Months Ended September 30,
|
Nine Months Ended September 30, | ||||||||||||||||||||||
| 2023 | 2022 | 2023 | 2022 | ||||||||||||||||||||
| Stock-based compensation cost | $ |
|
$ |
|
$ |
|
$ |
|
|||||||||||||||
| Tax benefit | $ |
|
$ |
|
$ |
|
$ |
|
|||||||||||||||
In April 2023, stockholders approved an amendment to the 2001 Plan increasing the number of shares of Common Stock authorized for issuance by
4.0
million. This results in the 2001 Plan now permitting for the grant of up to
54.6
million shares, of which not more than
10.7
million shares are available for grants of awards other than stock options. During the first nine months of 2023, the Company granted
0.1
million employee stock options, which had a weighted average grant date fair value of $
95.66
per share. The Company also granted
0.6
million shares of restricted stock in the first nine months of 2023, which had a weighted average grant date fair value of $
296.05
per share. Both the employee stock options and restricted stock generally vest ratably over
four years
. Additionally, the Company granted
0.1
million shares of performance-based awards whereby the number of shares that ultimately vest are based on the achievement of certain non-market-based performance metrics of the Company over
three years
. The weighted average grant date fair value of these awards was $
287.70
per share.
The following weighted average assumptions were used in determining the fair value using the Black-Scholes option-pricing model for options granted in 2023:
| Expected dividend yield |
|
% | |||
| Expected stock volatility |
|
% | |||
| Risk-free interest rate |
|
% | |||
| Expected holding period |
|
||||
Unrecognized stock-based compensation expense at September 30, 2023 was $
12
million and $
261
million for unvested stock options and restricted stock, respectively, which is expected to be recognized over a weighted average period of
1.9
years and
2.5
years, respectively. Additionally, there was $
29
million of unrecognized stock-based compensation expense relating to the aforementioned non-market-based performance-based awards, which is expected to be recognized over a weighted average period of
2.1
years.
21
The following table summarizes information relating to stock option exercises and restricted stock vesting:
|
Nine Months Ended
September 30, |
|||||||||||
| 2023 |
2022
|
||||||||||
| Exercise of stock options: | |||||||||||
| Proceeds from stock option exercises | $ |
|
$ |
|
|||||||
| Aggregate intrinsic value | $ |
|
$ |
|
|||||||
| Tax benefit realized upon exercise | $ |
|
$ |
|
|||||||
|
Number of shares exercised
(1)
|
|
|
|||||||||
| Vesting of restricted stock: | |||||||||||
| Fair value of shares vested | $ |
|
$ |
|
|||||||
| Tax benefit realized upon vesting | $ |
|
$ |
|
|||||||
| Number of shares vested |
|
|
|||||||||
| Vesting of performance-based restricted stock: | |||||||||||
| Fair value of shares vested | $ |
|
$ |
|
|||||||
| Tax benefit realized upon vesting | $ |
|
$ |
|
|||||||
| Number of shares vested |
|
|
|||||||||
NOTE 4.
INCOME TAXES
Moody’s ETR was
19.9
% and
20.5
% for the three months ended September 30, 2023 and 2022, respectively; the difference was primarily driven by return-to-accrual adjustments recorded during the current period. Furthermore, Moody’s ETR for the nine months ended September 30, 2023 and 2022 was
14.6
% and
21.3
%, respectively. The
6.7
% decrease in the ETR for the nine months ended September 30, 2023 compared to the same period in the prior year was primarily due to tax benefits recognized in the first quarter of 2023, which reflect the resolutions of UTPs in various U.S. and non-U.S. tax jurisdictions. The Company’s year-to-date provision for income taxes differs from the tax computed by applying its estimated annual effective tax rate to the pre-tax earnings primarily due to the following items recognized in 2023: i) benefits of $
116
million related to the resolutions of UTPs; and ii) excess tax benefits from stock-based compensation of $
13
million.
The Company classifies interest related to UTPs in interest expense, net in its consolidated statements of operations. Penalties, if incurred, would be recognized in other non-operating income (expense), net. The Company had an increase in its UTPs of $
5
million ($
4
million, net of federal tax) during the third quarter of 2023 and a decrease in its UTPs of $
114
million ($
115
million, net of federal tax) during the nine months of 2023.
For ongoing audits, it is possible the balance of UTPs could decrease in the next twelve months as a result of the settlement of such audits, which might involve the payment of additional taxes, the adjustment of certain deferred taxes and/or the recognition of tax benefits. It is also possible that new issues will be raised by tax authorities which could necessitate increases to the balance of UTPs. As the Company is unable to predict the timing or outcome of these audits, it is unable to estimate the amount of changes to the balance of UTPs at this time. However, the Company believes that it has adequately provided for its financial exposure relating to all open tax years, by tax jurisdiction, in accordance with the applicable provisions of ASC Topic 740 regarding UTPs.
| Nine Months Ended September 30, | |||||||||||
| 2023 | 2022 | ||||||||||
| Income taxes paid | $ |
|
$ |
|
|||||||
22
NOTE 5.
RECONCILIATION OF WEIGHTED AVERAGE SHARES OUTSTANDING
|
Three Months Ended September 30,
|
Nine Months Ended September 30, | ||||||||||||||||||||||
| 2023 | 2022 | 2023 | 2022 | ||||||||||||||||||||
| Basic |
|
|
|
|
|||||||||||||||||||
| Dilutive effect of shares issuable under stock-based compensation plans |
|
|
|
|
|||||||||||||||||||
| Diluted |
|
|
|
|
|||||||||||||||||||
| Anti-dilutive options to purchase common shares and restricted stock as well as contingently issuable restricted stock which are excluded from the table above |
|
|
|
|
|||||||||||||||||||
The calculation of basic shares outstanding is based on the weighted average number of shares of common stock outstanding during the reporting period. The calculation of diluted EPS requires certain assumptions regarding the use of both cash proceeds and assumed proceeds that would be received upon the exercise of stock options and vesting of restricted stock outstanding as of September 30, 2023 and 2022.
NOTE 6.
ACCELERATED SHARE REPURCHASE PROGRAM
On March 1, 2022, the Company entered into an ASR agreement with a financial institution counterparty to repurchase $
500
million of its outstanding common stock. The Company paid $
500
million to the counterparty and received an initial delivery of
1.2
million shares of its common stock. Final settlement of the ASR agreement was completed in April 2022 and the Company received delivery of an additional
0.3
million shares of the Company’s common stock.
In total, the Company repurchased
1.5
million shares of the Company’s common stock during the term of the ASR Agreement, based on the volume-weighted average price (net of discount) of $
324.20
per share over the duration of the program. The initial share repurchase and final share settlement were recorded as a reduction to shareholders’ equity.
NOTE 7.
CASH EQUIVALENTS AND INVESTMENTS
The table below provides additional information on the Company’s cash equivalents and investments:
| As of September 30, 2023 | |||||||||||||||||||||||||||||||||||
|
Balance sheet location
|
|||||||||||||||||||||||||||||||||||
| Cost | Gains/(Losses) | Fair Value | Cash and cash equivalents |
Short-term
investments |
Other
assets |
||||||||||||||||||||||||||||||
|
Certificates of deposit and money market deposit accounts/funds
(1)
|
$ |
|
$ |
|
$ |
|
$ |
|
$ |
|
$ |
|
|||||||||||||||||||||||
| Mutual funds | $ |
|
$ |
|
$ |
|
$ |
|
$ |
|
$ |
|
|||||||||||||||||||||||
| As of December 31, 2022 | |||||||||||||||||||||||||||||||||||
|
Balance sheet location
|
|||||||||||||||||||||||||||||||||||
|
Cost |
Gains/(Losses) |
Fair Value |
Cash and cash
equivalents |
Short-term
investments |
Other
assets |
||||||||||||||||||||||||||||||
|
Certificates of deposit and money market deposit accounts
(1)
|
$ |
|
$ |
|
$ |
|
$ |
|
$ |
|
$ |
|
|||||||||||||||||||||||
| Mutual funds | $ |
|
$ |
|
$ |
|
$ |
|
$ |
|
$ |
|
|||||||||||||||||||||||
(1)
Consists of time deposits, money market deposit accounts and money market funds. The remaining contractual maturities for the certificates of deposits classified as short-term investments are
one month
to
12
months at both September 30, 2023 and December 31, 2022. The remaining contractual maturities for the certificates of deposits classified in other assets are
13
months to
15
months at September 30, 2023 and
13
months to
24
months at December 31, 2022. Time deposits with a maturity of less than
90
days at time of purchase are classified as cash and cash equivalents.
In addition, the Company invested in Corporate-Owned Life Insurance (COLI). As of September 30, 2023 and December 31, 2022, the contract value of the COLI was $
46
million and $
40
million, respectively.
23
NOTE 8.
DERIVATIVE INSTRUMENTS AND HEDGING ACTIVITIES
The Company is exposed to global market risks, including risks from changes in FX rates and changes in interest rates. Accordingly, the Company uses derivatives in certain instances to manage financial exposures that occur in the normal course of business. The Company does not hold or issue derivatives for speculative purposes.
Derivatives and non-derivative instruments designated as accounting hedges:
Fair Value Hedges
Interest Rate Swaps
The Company has entered into interest rate swaps to convert the fixed interest rate on certain of its long-term debt to a floating interest rate based on the SOFR. The purpose of these hedges is to mitigate the risk associated with changes in the fair value of the long-term debt, thus the Company has designated these swaps as fair value hedges. The fair value of the swaps is adjusted quarterly with a corresponding adjustment to the carrying value of the debt. The changes in the fair value of the swaps and the underlying hedged item generally offset and the net cash settlements on the swaps are recorded each period within interest expense, net in the Company’s consolidated statements of operations.
The following table summarizes the Company’s interest rate swaps designated as fair value hedges:
|
As of September 30, 2023
|
As of December 31, 2022
|
|||||||||||||||||||||||||||||||
| Hedged Item | Nature of Swap | Notional Amount |
Floating Interest Rate
(1)
|
Notional Amount | Floating Interest Rate | |||||||||||||||||||||||||||
| 2017 Senior Notes due 2028 | Pay Floating/Receive Fixed | $ |
|
|
$ |
|
|
|||||||||||||||||||||||||
| 2020 Senior Notes due 2025 | Pay Floating/Receive Fixed |
|
|
|
|
|||||||||||||||||||||||||||
| 2014 Senior Notes due 2044 | Pay Floating/Receive Fixed |
|
|
|
|
|||||||||||||||||||||||||||
| 2018 Senior Notes due 2048 | Pay Floating/Receive Fixed |
|
|
|
|
|||||||||||||||||||||||||||
| 2018 Senior Notes due 2029 | Pay Floating/Receive Fixed |
|
|
|
|
|||||||||||||||||||||||||||
| 2022 Senior Notes due 2052 | Pay Floating/Receive Fixed |
|
|
|
|
|||||||||||||||||||||||||||
| 2022 Senior Notes due 2032 | Pay Floating/Receive Fixed |
|
|
|
|
|||||||||||||||||||||||||||
| Total | $ |
|
$ |
|
||||||||||||||||||||||||||||
(1)
Contractual terms of instruments using the 3-month or 6-month LIBOR at December 31, 2022 were modified to the SOFR reference rate in the first quarter of 2023.
Refer to Note 14 for information on the cumulative amount of fair value hedging adjustments included in the carrying amount of the above hedged items.
The following table summarizes the impact to the statements of operations of the Company’s interest rate swaps designated as fair value hedges:
| Total amounts of financial statement line item presented in the statements of operations in which the effects of fair value hedges are recorded | Amount of income/(loss) recognized in the consolidated statements of operations | ||||||||||||||||||||||||||||||||||
|
Three Months Ended September 30,
|
Nine Months Ended September 30,
|
||||||||||||||||||||||||||||||||||
| 2023 | 2022 | 2023 | 2022 | ||||||||||||||||||||||||||||||||
| Interest expense, net | $ |
(
|
$ |
(
|
$ |
(
|
$ |
(
|
|||||||||||||||||||||||||||
|
Descriptions |
Location on Consolidated Statements of Operations | ||||||||||||||||||||||||||||||||||
| Net interest settlements and accruals on interest rate swaps |
Interest expense, net
|
$ |
(
|
$ |
(
|
$ |
(
|
$ |
|
||||||||||||||||||||||||||
| Fair value changes on interest rate swaps | Interest expense, net | $ |
(
|
$ |
(
|
$ |
(
|
$ |
(
|
||||||||||||||||||||||||||
| Fair value changes on hedged debt | Interest expense, net | $ |
|
$ |
|
$ |
|
$ |
|
||||||||||||||||||||||||||
24
Net investment hedges
Debt designated as net investment hedges
The Company has designated €
500
million of the 2015 Senior Notes Due 2027 and €
750
million of the 2019 Senior Notes due 2030 as net investment hedges to mitigate FX exposure related to a portion of the Company’s euro net investment in certain foreign subsidiaries against changes in euro/USD exchange rates. These hedges are designated as accounting hedges under the applicable sections of ASC Topic 815 and will end upon the repayment of the notes in 2027 and 2030, respectively, unless terminated early at the discretion of the Company.
Cross currency swaps designated as net investment hedges
The Company enters into cross-currency swaps to mitigate FX exposure related to a portion of the Company’s euro net investment in certain foreign subsidiaries against changes in euro/USD exchange rates.
The following table provides information on the cross-currency swaps designated as net investment hedges under ASC Topic 815:
| September 30, 2023 | ||||||||||||||||||||||||||
| Pay | Receive | |||||||||||||||||||||||||
| Nature of Swap | Notional Amount | Weighted Average Interest Rate | Notional Amount | Weighted Average Interest Rate | ||||||||||||||||||||||
| Pay Fixed/Receive Fixed | € |
|
|
$ |
|
|
||||||||||||||||||||
| Pay Floating/Receive Floating |
|
|
|
|
||||||||||||||||||||||
| Total | € |
|
$ |
|
||||||||||||||||||||||
| December 31, 2022 | ||||||||||||||||||||||||||
| Pay | Receive | |||||||||||||||||||||||||
| Nature of Swap | Notional Amount | Weighted Average Interest Rate | Notional Amount | Weighted Average Interest Rate | ||||||||||||||||||||||
| Pay Fixed/Receive Fixed | € |
|
|
$ |
|
|
||||||||||||||||||||
| Pay Floating/Receive Floating |
|
|
|
|
||||||||||||||||||||||
| Pay Floating/Receive Floating |
|
|
|
|
||||||||||||||||||||||
| Total | € |
|
$ |
|
||||||||||||||||||||||
As of September 30, 2023 these hedges will expire and the notional amounts will be settled as follows unless terminated early at the discretion of the Company:
| Years Ending December 31, | ||||||||
| 2026 | € |
|
||||||
| 2027 | € |
|
||||||
| 2028 | € |
|
||||||
| 2029 | € |
|
||||||
| 2031 | € |
|
||||||
| 2032 | € |
|
||||||
| Total | € |
|
||||||
25
The following tables provide information on the gains/(losses) on the Company’s net investment and cash flow hedges:
| Derivative and Non-Derivative Instruments in Net Investment Hedging Relationships | Amount of Gain/(Loss) Recognized in AOCL on Derivative, net of Tax | Amount of Loss Reclassified from AOCL into Income, net of Tax | Gain Recognized in Income on Derivative (Amount Excluded from Effectiveness Testing) | |||||||||||||||||||||||||||||||||||
|
Three Months Ended
September 30,
|
Three Months Ended
September 30,
|
Three Months Ended
September 30,
|
||||||||||||||||||||||||||||||||||||
| 2023 | 2022 | 2023 | 2022 | 2023 | 2022 | |||||||||||||||||||||||||||||||||
| Cross currency swaps | $ |
|
$ |
|
$ |
|
$ |
|
$ |
|
$ |
|
||||||||||||||||||||||||||
| Long-term debt |
|
|
|
|
|
|
||||||||||||||||||||||||||||||||
| Total net investment hedges | $ |
|
$ |
|
$ |
|
$ |
|
$ |
|
$ |
|
||||||||||||||||||||||||||
| Derivatives in Cash Flow Hedging Relationships | ||||||||||||||||||||||||||||||||||||||
| Interest rate contracts | $ |
|
$ |
|
$ |
(
|
$ |
|
$ |
|
$ |
|
||||||||||||||||||||||||||
| Total cash flow hedges | $ |
|
$ |
|
$ |
(
|
$ |
|
$ |
|
$ |
|
||||||||||||||||||||||||||
| Total | $ |
|
$ |
|
$ |
(
|
$ |
|
$ |
|
$ |
|
||||||||||||||||||||||||||
| Derivative and Non-Derivative Instruments in Net Investment Hedging Relationships | Amount of Gain/(Loss) Recognized in AOCL on Derivative, net of Tax | Amount of Loss Reclassified from AOCL into Income, net of Tax | Gain Recognized in Income on Derivative (Amount Excluded from Effectiveness Testing) | |||||||||||||||||||||||||||||||||||
|
Nine Months Ended
September 30,
|
Nine Months Ended
September 30,
|
Nine Months Ended
September 30,
|
||||||||||||||||||||||||||||||||||||
| 2023 | 2022 | 2023 | 2022 | 2023 | 2022 | |||||||||||||||||||||||||||||||||
| Cross currency swaps | $ |
|
$ |
|
$ |
|
$ |
|
$ |
|
$ |
|
||||||||||||||||||||||||||
| Long-term debt |
|
|
|
|
|
|
||||||||||||||||||||||||||||||||
| Total net investment hedges | $ |
|
$ |
|
$ |
|
$ |
|
$ |
|
$ |
|
||||||||||||||||||||||||||
| Derivatives in Cash Flow Hedging Relationships | ||||||||||||||||||||||||||||||||||||||
|
Cross currency swaps
|
$ |
|
$ |
|
$ |
|
$ |
|
$ |
|
$ |
|
||||||||||||||||||||||||||
| Interest rate contracts |
|
|
(
|
(
|
|
|
||||||||||||||||||||||||||||||||
| Total cash flow hedges | $ |
|
$ |
|
$ |
(
|
$ |
(
|
$ |
|
$ |
|
||||||||||||||||||||||||||
| Total | $ |
|
$ |
|
$ |
(
|
$ |
(
|
$ |
|
$ |
|
||||||||||||||||||||||||||
| Cumulative Gains/(Losses), net of tax | |||||||||||
| September 30, 2023 | December 31, 2022 | ||||||||||
|
Net investment hedges
|
|||||||||||
| Cross currency swaps | $ |
|
$ |
|
|||||||
| FX forwards |
|
|
|||||||||
| Long-term debt |
|
|
|||||||||
| Total net investment hedges | $ |
|
$ |
|
|||||||
| Cash flow hedges | |||||||||||
| Interest rate contracts | $ |
(
|
$ |
(
|
|||||||
| Cross currency swaps |
|
|
|||||||||
| Total cash flow hedges |
(
|
(
|
|||||||||
| Total net gain in AOCL | $ |
|
$ |
|
|||||||
26
Derivatives not designated as accounting hedges:
Foreign exchange forwards
The Company also enters into foreign exchange forward contracts to mitigate the change in fair value on certain assets and liabilities denominated in currencies other than a subsidiary’s functional currency. These forward contracts are not designated as accounting hedges under the applicable sections of ASC Topic 815. Accordingly, changes in the fair value of these contracts are recognized immediately in other non-operating income, net, in the Company’s consolidated statements of operations along with the FX gain or loss recognized on the assets and liabilities denominated in a currency other than the subsidiary’s functional currency. These contracts have expiration dates at various times through August 2024.
| September 30, 2023 | December 31, 2022 | ||||||||||||||||||||||||||||
| Notional amount of currency pair: | Sell | Buy | Sell | Buy | |||||||||||||||||||||||||
| Contracts to sell USD for GBP | $ |
|
£ |
|
$ |
|
£ |
|
|||||||||||||||||||||
| Contracts to sell USD for Japanese yen | $ |
|
¥ |
|
$ |
|
¥ |
|
|||||||||||||||||||||
| Contracts to sell USD for Canadian dollars | $ |
|
C$ |
|
$ |
|
C$ |
|
|||||||||||||||||||||
| Contracts to sell USD for Singapore dollars | $ |
|
S$ |
|
$ |
|
S$ |
|
|||||||||||||||||||||
| Contracts to sell USD for euros | $ |
|
€ |
|
$ |
|
€ |
|
|||||||||||||||||||||
| Contracts to sell USD for Indian rupee | $ |
|
₹ |
|
$ |
|
₹ |
|
|||||||||||||||||||||
| Contracts to sell euros for USD | € |
|
$ |
|
€ |
|
$ |
|
|||||||||||||||||||||
| Contracts to sell AUD for USD | A$ |
|
$ |
|
A$ |
|
$ |
|
|||||||||||||||||||||
|
NOTE: € = euro, £ = British pound, S$ = Singapore dollar, $ = U.S. dollar, ¥ = Japanese yen, C$ = Canadian dollar, ₹= Indian Rupee, A$ = Australian dollar
|
|||||||||||||||||||||||||||||||||||||||||||||||
Total Return Swaps
Beginning in the second quarter of 2023, the Company entered into total return swaps to mitigate market-driven changes in the value of certain liabilities associated with the Company's deferred compensation plans. The fair value of these swaps at September 30, 2023 and related gains in the three and nine months ended September 30, 2023 were not material. The notional amount of the total return swaps as of September 30, 2023 was $
52
million.
The following table summarizes the impact to the consolidated statements of operations relating to the net losses on the Company’s derivatives which are not designated as hedging instruments:
| Derivatives not designated as accounting hedges | Location on Consolidated Statements of Operations |
Three Months Ended
September 30,
|
Nine Months Ended
September 30,
|
|||||||||||||||||||||||||||||
| 2023 | 2022 | 2023 | 2022 | |||||||||||||||||||||||||||||
| FX forwards | Other non-operating income, net | $ |
(
|
$ |
(
|
$ |
(
|
$ |
(
|
|||||||||||||||||||||||
27
The table below shows the classification between assets and liabilities on the Company’s consolidated balance sheets for the fair value of the derivative instrument as well as the carrying value of its non-derivative debt instruments designated and qualifying as net investment hedges:
| Derivative and Non-Derivative Instruments | ||||||||||||||||||||
| Balance Sheet Location | September 30, 2023 | December 31, 2022 | ||||||||||||||||||
| Assets: | ||||||||||||||||||||
| Derivatives designated as accounting hedges: | ||||||||||||||||||||
| Cross-currency swaps designated as net investment hedges | Other assets | $ |
|
$ |
|
|||||||||||||||
| Derivatives not designated as accounting hedges: | ||||||||||||||||||||
| FX forwards on certain assets and liabilities | Other current assets |
|
|
|||||||||||||||||
| Total assets | $ |
|
$ |
|
||||||||||||||||
| Liabilities: | ||||||||||||||||||||
| Derivatives designated as accounting hedges: | ||||||||||||||||||||
| Cross-currency swaps designated as net investment hedges | Other liabilities | $ |
|
$ |
|
|||||||||||||||
| Interest rate swaps designated as fair value hedges | Other liabilities |
|
|
|||||||||||||||||
| Total derivatives designated as accounting hedges |
|
|
||||||||||||||||||
| Non-derivatives designated as accounting hedges: | ||||||||||||||||||||
| Long-term debt designated as net investment hedge | Long-term debt |
|
|
|||||||||||||||||
| Derivatives not designated as accounting hedges: | ||||||||||||||||||||
| FX forwards on certain assets and liabilities | Accounts payable and accrued liabilities |
|
|
|||||||||||||||||
| Total liabilities | $ |
|
$ |
|
||||||||||||||||
28
NOTE 9.
GOODWILL AND OTHER ACQUIRED INTANGIBLE ASSETS
The following table summarizes the activity in goodwill for the periods indicated:
| Nine Months Ended September 30, 2023 | |||||||||||||||||||||||||||||||||||||||||||||||||||||
| MA | MIS | Consolidated | |||||||||||||||||||||||||||||||||||||||||||||||||||
| Gross goodwill |
Accumulated
impairment charge |
Net
goodwill |
Gross goodwill |
Accumulated impairment
charge |
Net
goodwill |
Gross goodwill |
Accumulated
impairment charge |
Net
goodwill |
|||||||||||||||||||||||||||||||||||||||||||||
|
Balance at beginning
of year |
$ |
|
$ |
(
|
$ |
|
$ |
|
$ |
|
$ |
|
$ |
|
$ |
(
|
$ |
|
|||||||||||||||||||||||||||||||||||
|
Additions/
adjustments
(1)
|
|
— |
|
(
|
— |
(
|
|
— |
|
||||||||||||||||||||||||||||||||||||||||||||
| Foreign currency translation adjustments |
(
|
— |
(
|
(
|
— |
(
|
(
|
— |
(
|
||||||||||||||||||||||||||||||||||||||||||||
| Ending balance | $ |
|
$ |
(
|
$ |
|
$ |
|
$ |
|
$ |
|
$ |
|
$ |
(
|
$ |
|
|||||||||||||||||||||||||||||||||||
| Year Ended December 31, 2022 | |||||||||||||||||||||||||||||||||||||||||||||||||||||
| MA | MIS | Consolidated | |||||||||||||||||||||||||||||||||||||||||||||||||||
| Gross goodwill |
Accumulated
impairment
charge
|
Net
goodwill
|
Gross goodwill |
Accumulated impairment
charge
|
Net
goodwill
|
Gross goodwill |
Accumulated
impairment
charge
|
Net
goodwill
|
|||||||||||||||||||||||||||||||||||||||||||||
|
Balance at beginning
of year |
$ |
|
$ |
(
|
$ |
|
$ |
|
$ |
|
$ |
|
$ |
|
$ |
(
|
$ |
|
|||||||||||||||||||||||||||||||||||
|
Additions/
adjustments
(2)
|
|
— |
|
|
— |
|
|
— |
|
||||||||||||||||||||||||||||||||||||||||||||
|
Foreign currency translation
adjustments |
(
|
— |
(
|
(
|
— |
(
|
(
|
— |
(
|
||||||||||||||||||||||||||||||||||||||||||||
| Ending balance | $ |
|
$ |
(
|
$ |
|
$ |
|
$ |
|
$ |
|
$ |
|
$ |
(
|
$ |
|
|||||||||||||||||||||||||||||||||||
(1)
The 2023 additions/adjustments primarily relate to a reallocation of goodwill pursuant to a realignment of certain components of the Company's ESG business in the first quarter of 2023.
(2)
The 2022 additions/adjustments for the MA segment in the table above primarily relate to the acquisition of kompany in the first quarter of 2022.
29
Acquired intangible assets and related amortization consisted of:
|
September 30,
2023 |
December 31,
2022 |
||||||||||
| Customer relationships | $ |
|
$ |
|
|||||||
| Accumulated amortization |
(
|
(
|
|||||||||
| Net customer relationships |
|
|
|||||||||
| Software/product technology |
|
|
|||||||||
| Accumulated amortization |
(
|
(
|
|||||||||
| Net software/product technology |
|
|
|||||||||
| Database |
|
|
|||||||||
| Accumulated amortization |
(
|
(
|
|||||||||
| Net database |
|
|
|||||||||
| Trade names |
|
|
|||||||||
| Accumulated amortization |
(
|
(
|
|||||||||
| Net trade names |
|
|
|||||||||
|
Other
(1)
|
|
|
|||||||||
| Accumulated amortization |
(
|
(
|
|||||||||
| Net other |
|
|
|||||||||
| Total acquired intangible assets, net | $ |
|
$ |
|
|||||||
(1)
Other intangible assets primarily consist of trade secrets, covenants not to compete, and acquired ratings methodologies and models.
Amortization expense relating to acquired intangible assets is as follows:
|
Three Months Ended
September 30,
|
Nine Months Ended
September 30, |
||||||||||||||||||||||
| 2023 | 2022 | 2023 | 2022 | ||||||||||||||||||||
|
Amortization expense
|
$ |
|
$ |
|
$ |
|
$ |
|
|||||||||||||||
NOTE 10.
RESTRUCTURING
30
Total expense included in the accompanying consolidated statements of operations relating to the aforementioned restructuring program is below:
| Three months ended September 30, | |||||||||||||||||||||||||||||||||||
| 2023 | 2022 | ||||||||||||||||||||||||||||||||||
|
Employee
Termination Costs
|
Real Estate Related Costs
(1)
|
Total |
Employee
Termination Costs
(1)
|
Real Estate Related Costs
|
Total | ||||||||||||||||||||||||||||||
| 2022 - 2023 Geolocation Restructuring Program | $ |
|
$ |
|
$ |
|
$ |
|
$ |
|
$ |
|
|||||||||||||||||||||||
| Total Restructuring | $ |
|
$ |
|
$ |
|
$ |
|
$ |
|
$ |
|
|||||||||||||||||||||||
| Nine months ended September 30, | |||||||||||||||||||||||||||||||||||
| 2023 | 2022 | ||||||||||||||||||||||||||||||||||
|
Employee
Termination Costs
|
Real Estate Related Costs
(1)
|
Total |
Employee
Termination Costs
|
Real Estate Related Costs
|
Total | ||||||||||||||||||||||||||||||
| 2020 MA Strategic Reorganization Restructuring Program | $ |
|
$ |
|
$ |
|
$ |
(
|
$ |
|
$ |
(
|
|||||||||||||||||||||||
| 2022 - 2023 Geolocation Restructuring Program |
|
|
|
|
|
|
|||||||||||||||||||||||||||||
| Total Restructuring | $ |
|
$ |
|
$ |
|
$ |
|
$ |
|
$ |
|
|||||||||||||||||||||||
(1)
Primarily includes ROU Asset impairment charges for the three and nine months ended September 30, 2023. The fair value of the impaired asset was determined by utilizing the present value of the estimated future cash flows attributable to the asset. The fair value of the asset subsequent to the impairment was $
4
million.
Changes to the restructuring liability for the aforementioned restructuring programs during the first nine months of 2023 were as follows:
|
Balance as of December 31, 2022
|
$ |
|
|||
| 2022 - 2023 Geolocation Restructuring Program: | |||||
|
|
|||||
| Cash payments and adjustments |
(
|
||||
|
Balance as of September 30, 2023
|
$ |
|
|||
|
Cumulative expense incurred through September 30, 2023
|
Employee
Termination Costs |
Real Estate Related
Costs |
Other Costs | Total | |||||||||||||||||||
| 2022 - 2023 Geolocation Restructuring Program | $ |
|
$ |
|
$ |
|
$ |
|
|||||||||||||||
NOTE 11.
FAIR VALUE
The table below presents information about items that are carried at fair value at September 30, 2023 and December 31, 2022:
| Fair Value Measurement as of September 30, 2023 | |||||||||||||||||
| Description | Balance | Level 1 | Level 2 | ||||||||||||||
|
Assets:
|
|||||||||||||||||
|
Derivatives
(1)
|
$ |
|
$ |
|
$ |
|
|||||||||||
|
Money market funds/mutual funds
|
|
|
|
||||||||||||||
| Total | $ |
|
$ |
|
$ |
|
|||||||||||
| Liabilities: | |||||||||||||||||
|
Derivatives
(1)
|
$ |
|
$ |
|
$ |
|
|||||||||||
| Total | $ |
|
$ |
|
$ |
|
|||||||||||
31
| Fair Value Measurement as of December 31, 2022 | |||||||||||||||||
| Description | Balance | Level 1 | Level 2 | ||||||||||||||
| Assets: | |||||||||||||||||
|
Derivatives
(1)
|
$ |
|
$ |
|
$ |
|
|||||||||||
| Mutual funds |
|
|
|
||||||||||||||
| Total | $ |
|
$ |
|
$ |
|
|||||||||||
| Liabilities: | |||||||||||||||||
|
Derivatives
(1)
|
$ |
|
$ |
|
$ |
|
|||||||||||
| Total | $ |
|
$ |
|
$ |
|
|||||||||||
(1)
Represents fair value of certain derivative contracts as more fully described in Note 8 to the consolidated financial statements.
The following are descriptions of the methodologies utilized by the Company to estimate the fair value of its derivative contracts, mutual funds and money market mutual funds:
Derivatives:
In determining the fair value of the derivative contracts in the table above, the Company utilizes industry standard valuation models. Where applicable, these models project future cash flows and discount the future amounts to a present value using spot rates, forward points, currency volatilities, interest rates as well as the risk of non-performance of the Company and the counterparties with whom it has derivative contracts. The Company established strict counterparty credit guidelines and only enters into transactions with financial institutions that adhere to these guidelines. Accordingly, the risk of counterparty default is deemed to be minimal.
Money market funds and mutual funds:
The mutual funds in the table above are deemed to be equity securities with readily determinable fair values with changes in the fair value recognized through net income under ASC Topic 321. The fair value of these instruments is determined using Level 1 inputs as defined in the ASC Topic 820.
32
NOTE 12.
OTHER BALANCE SHEET AND STATEMENTS OF OPERATIONS INFORMATION
The following tables contain additional detail related to certain balance sheet captions:
| September 30, 2023 | December 31, 2022 | ||||||||||
| Other current assets: | |||||||||||
| Prepaid taxes | $ |
|
$ |
|
|||||||
| Prepaid expenses |
|
|
|||||||||
| Capitalized costs to obtain and fulfill sales contracts |
|
|
|||||||||
| Foreign exchange forwards on certain assets and liabilities |
|
|
|||||||||
| Interest receivable on interest rate and cross currency swaps |
|
|
|||||||||
| Other |
|
|
|||||||||
| Total other current assets | $ |
|
$ |
|
|||||||
| Other assets: | |||||||||||
| Investments in non-consolidated affiliates | $ |
|
$ |
|
|||||||
| Deposits for real-estate leases |
|
|
|||||||||
| Indemnification assets related to acquisitions |
|
|
|||||||||
| Mutual funds and fixed deposits |
|
|
|||||||||
| Company owned life insurance (at contract value) |
|
|
|||||||||
| Costs to obtain sales contracts |
|
|
|||||||||
| Derivative instruments designated as accounting hedges |
|
|
|||||||||
| Pension and other retirement employee benefits |
|
|
|||||||||
| Other |
|
|
|||||||||
| Total other assets | $ |
|
$ |
|
|||||||
| Accounts payable and accrued liabilities: | |||||||||||
| Salaries and benefits | $ |
|
$ |
|
|||||||
| Incentive compensation |
|
|
|||||||||
| Customer credits, advanced payments and advanced billings |
|
|
|||||||||
| Dividends |
|
|
|||||||||
| Professional service fees |
|
|
|||||||||
| Accrued interest |
|
|
|||||||||
| Accounts payable |
|
|
|||||||||
| Income taxes |
|
|
|||||||||
| Pension and other retirement employee benefits |
|
|
|||||||||
| Accrued royalties |
|
|
|||||||||
| Foreign exchange forwards on certain assets and liabilities |
|
|
|||||||||
| Restructuring liability |
|
|
|||||||||
| Interest payable on interest rate and cross currency swaps |
|
|
|||||||||
| Other |
|
|
|||||||||
| Total accounts payable and accrued liabilities | $ |
|
$ |
|
|||||||
33
| September 30, 2023 | December 31, 2022 | ||||||||||
| Other liabilities: | |||||||||||
| Pension and other retirement employee benefits | $ |
|
$ |
|
|||||||
| Interest accrued on UTPs |
|
|
|||||||||
| MAKS indemnification provisions |
|
|
|||||||||
| Income tax liability - non-current portion |
|
|
|||||||||
| Derivative instruments designated as accounting hedges |
|
|
|||||||||
| Other |
|
|
|||||||||
| Total other liabilities | $ |
|
$ |
|
|||||||
Investments in non-consolidated affiliates:
The following table provides additional detail regarding Moody's investments in non-consolidated affiliates, as included in other assets in the consolidated balance sheets:
| September 30, 2023 | December 31, 2022 | ||||||||||
|
Equity method investments
(1)
|
$ |
|
$ |
|
|||||||
|
Investments measured using the measurement alternative
(2)
|
|
|
|||||||||
| Other |
|
|
|||||||||
| Total investments in non-consolidated affiliates | $ |
|
$ |
|
|||||||
|
(1)
Equity securities in which the Company has significant influence over the investee but does not have a controlling financial interest in accordance with ASC Topic 323.
|
|||||||||||
|
(2)
Equity securities without readily determinable fair value for which the Company has elected to apply the measurement alternative in accordance with ASC Topic 321.
|
|||||||||||
Moody's holds various investments accounted for under the equity method, the most significant of which is the Company's minority investment in CCXI. Moody's also holds various investments measured using the measurement alternative, the most significant of which is the Company's minority interest in BitSight.
Earnings from non-consolidated affiliates, which are included within other non-operating income, net, are disclosed within the table below.
Other non-operating income, net:
The following table summarizes the components of other non-operating income, net:
|
Three Months Ended September 30,
|
Nine Months Ended September 30, | ||||||||||||||||||||||
| 2023 | 2022 | 2023 | 2022 | ||||||||||||||||||||
|
FX gain (loss)
(1)
|
$ |
|
$ |
|
$ |
(
|
$ |
(
|
|||||||||||||||
| Net periodic pension costs - other components |
|
|
|
|
|||||||||||||||||||
| Income from investments in non-consolidated affiliates |
|
|
|
|
|||||||||||||||||||
|
Gain (loss) on investments
|
|
(
|
|
(
|
|||||||||||||||||||
|
Other
(2)
|
(
|
|
|
|
|||||||||||||||||||
| Total | $ |
|
$ |
|
$ |
|
$ |
|
|||||||||||||||
(1)
The amount for the nine months ended September 30, 2023 includes a $
23
million loss recorded pursuant to an immaterial out-of-period adjustment relating to the 2022 fiscal year. The amount for the nine months ended September 30, 2022 includes FX translation losses of $
20
million reclassified to earnings resulting from the Company no longer conducting commercial operations in Russia.
(2)
The amount for the nine months ended September 30, 2023 reflects a benefit of $
9
million related to the favorable resolutions of various tax matters. The amount for the nine months ended September 30, 2022 reflects an $
11
million benefit from a statute of limitations lapse relating to reserves established pursuant to the divestiture of MAKS.
34
NOTE 13.
COMPREHENSIVE INCOME AND ACCUMULATED OTHER COMPREHENSIVE LOSS
|
Three Months Ended September 30,
|
Location in the consolidated statements of operations | ||||||||||||||||
|
Losses on cash flow hedges
|
2023 | 2022 | |||||||||||||||
| Interest rate contract |
(
|
(
|
Other non-operating income, net | ||||||||||||||
| Income tax effect of item above |
|
|
Provision for income taxes | ||||||||||||||
|
Total net losses on cash flow hedges
|
(
|
|
|||||||||||||||
| Pension and other retirement benefits | |||||||||||||||||
|
Amortization of actuarial gains/prior service credits and settlement credit included in net income
|
|
(
|
Other non-operating income, net | ||||||||||||||
| Total pension and other retirement benefits |
|
(
|
|||||||||||||||
|
Total net losses included in Net Income attributable to reclassifications out of AOCL
|
$ |
|
$ |
(
|
|||||||||||||
| Nine Months Ended September 30, | Location in the consolidated statements of operations | ||||||||||||||||
| Losses on currency translation adjustments | 2023 | 2022 | |||||||||||||||
| Foreign currency translation adjustments - reclassification of losses included in net income | $ |
|
$ |
(
|
Other non-operating income, net | ||||||||||||
| Total losses on currency translation adjustments |
|
(
|
|||||||||||||||
| Losses on cash flow hedges | |||||||||||||||||
| Interest rate contract |
(
|
(
|
Other non-operating income, net | ||||||||||||||
| Income tax effect of item above |
|
|
Provision for income taxes | ||||||||||||||
| Total net losses on cash flow hedges |
(
|
(
|
|||||||||||||||
| Pension and other retirement benefits | |||||||||||||||||
|
Amortization of actuarial gains/prior service credits and settlement credit included in net income
|
|
(
|
Other non-operating income, net | ||||||||||||||
| Income tax effect of item above |
(
|
|
Provision for income taxes | ||||||||||||||
| Total pension and other retirement benefits |
|
(
|
|||||||||||||||
| Total net gains (losses) included in Net Income attributable to reclassifications out of AOCL | $ |
|
$ |
(
|
|||||||||||||
|
Three Months Ended September 30,
|
|||||||||||||||||||||||||||||||||||
| 2023 | 2022 | ||||||||||||||||||||||||||||||||||
| Gains/(Losses) | Pension and Other Retirement Benefits | Cash Flow Hedges | Foreign Currency Translation Adjustments | Net Investment Hedges | Total | Pension and Other Retirement Benefits | Cash Flow Hedges | Foreign Currency Translation Adjustments | Net Investment Hedges | Total | |||||||||||||||||||||||||
|
Balance at June 30,
|
$ |
(
|
$ |
(
|
$ |
(
|
$ |
|
$ |
(
|
$ |
(
|
$ |
(
|
$ |
(
|
$ |
|
$ |
(
|
|||||||||||||||
| Other comprehensive income/(loss) before reclassifications |
|
|
(
|
|
(
|
|
|
(
|
|
(
|
|||||||||||||||||||||||||
| Amounts reclassified from AOCL |
(
|
|
|
|
|
|
|
|
|
|
|||||||||||||||||||||||||
| Other comprehensive income/(loss) |
|
|
(
|
|
(
|
|
|
(
|
|
(
|
|||||||||||||||||||||||||
|
Balance at September 30,
|
$ |
(
|
$ |
(
|
$ |
(
|
$ |
|
$ |
(
|
$ |
(
|
$ |
(
|
$ |
(
|
$ |
|
$ |
(
|
|||||||||||||||
35
| Nine Months Ended September 30, | |||||||||||||||||||||||||||||||||||
| 2023 | 2022 | ||||||||||||||||||||||||||||||||||
| Gains/(Losses) | Pension and Other Retirement Benefits | Cash Flow Hedges | Foreign Currency Translation Adjustments | Net Investment Hedges | Total | Pension and Other Retirement Benefits | Cash Flow Hedges | Foreign Currency Translation Adjustments | Net Investment Hedges | Total | |||||||||||||||||||||||||
|
Balance at December 31,
|
$ |
(
|
$ |
(
|
$ |
(
|
$ |
|
$ |
(
|
$ |
(
|
$ |
(
|
$ |
(
|
$ |
|
$ |
(
|
|||||||||||||||
| Other comprehensive income/(loss) before reclassifications |
|
|
(
|
|
(
|
|
|
(
|
|
(
|
|||||||||||||||||||||||||
| Amounts reclassified from AOCL |
(
|
|
|
|
(
|
|
|
|
|
|
|||||||||||||||||||||||||
| Other comprehensive income/(loss) |
(
|
|
(
|
|
(
|
|
|
(
|
|
(
|
|||||||||||||||||||||||||
|
Balance at September 30,
|
$ |
(
|
$ |
(
|
$ |
(
|
$ |
|
$ |
(
|
$ |
(
|
$ |
(
|
$ |
(
|
$ |
|
$ |
(
|
|||||||||||||||
36
NOTE 14.
INDEBTEDNESS
The Company’s debt is recorded at its carrying amount, which represents the issuance amount plus or minus any issuance premium or discount, except for certain debt as depicted in the table below, which is recorded at the carrying amount adjusted for the fair value of an interest rate swap used to hedge the fair value of the note.
The following table summarizes total indebtedness:
| September 30, 2023 | |||||||||||||||||||||||||||||
| Notes Payable: | Principal Amount |
Fair Value of Interest Rate Swaps
(1)
|
Unamortized (Discount) Premium
|
Unamortized Debt Issuance Costs | Carrying Value | ||||||||||||||||||||||||
|
|
$ |
|
$ |
(
|
$ |
|
$ |
(
|
$ |
|
|||||||||||||||||||
|
|
|
|
|
(
|
|
||||||||||||||||||||||||
|
|
|
(
|
(
|
(
|
|
||||||||||||||||||||||||
|
|
|
(
|
(
|
(
|
|
||||||||||||||||||||||||
|
|
|
(
|
(
|
(
|
|
||||||||||||||||||||||||
|
|
|
|
(
|
(
|
|
||||||||||||||||||||||||
|
|
|
(
|
|
(
|
|
||||||||||||||||||||||||
|
|
|
|
(
|
(
|
|
||||||||||||||||||||||||
|
|
|
|
(
|
(
|
|
||||||||||||||||||||||||
|
|
|
|
(
|
(
|
|
||||||||||||||||||||||||
|
|
|
|
(
|
(
|
|
||||||||||||||||||||||||
|
|
|
|
(
|
(
|
|
||||||||||||||||||||||||
|
|
|
(
|
(
|
(
|
|
||||||||||||||||||||||||
|
|
|
(
|
(
|
(
|
|
||||||||||||||||||||||||
|
Total long-term debt
|
$ |
|
$ |
(
|
$ |
(
|
$ |
(
|
$ |
|
|||||||||||||||||||
| December 31, 2022 | |||||||||||||||||||||||||||||
| Notes Payable: | Principal Amount |
Fair Value of Interest Rate Swaps
(1)
|
Unamortized (Discount) Premium
|
Unamortized Debt Issuance Costs | Carrying Value | ||||||||||||||||||||||||
|
|
$ |
|
$ |
|
$ |
(
|
$ |
(
|
$ |
|
|||||||||||||||||||
|
|
|
(
|
|
(
|
|
||||||||||||||||||||||||
|
|
|
|
|
(
|
|
||||||||||||||||||||||||
|
|
|
(
|
(
|
(
|
|
||||||||||||||||||||||||
|
|
|
(
|
(
|
(
|
|
||||||||||||||||||||||||
|
|
|
(
|
(
|
(
|
|
||||||||||||||||||||||||
|
|
|
|
(
|
(
|
|
||||||||||||||||||||||||
|
|
|
(
|
(
|
(
|
|
||||||||||||||||||||||||
|
|
|
|
(
|
(
|
|
||||||||||||||||||||||||
|
|
|
|
(
|
(
|
|
||||||||||||||||||||||||
|
|
|
|
(
|
(
|
|
||||||||||||||||||||||||
|
|
|
|
(
|
(
|
|
||||||||||||||||||||||||
|
|
|
|
(
|
(
|
|
||||||||||||||||||||||||
|
|
|
(
|
(
|
(
|
|
||||||||||||||||||||||||
|
|
|
(
|
(
|
(
|
|
||||||||||||||||||||||||
| Total long-term debt | $ |
|
$ |
(
|
$ |
(
|
$ |
(
|
$ |
|
|||||||||||||||||||
(1)
The fair value of interest rate swaps in the tables above represents the cumulative amount of fair value hedging adjustments included in the carrying amount of the hedged debt.
Notes Payable
In the first nine months of 2023, the Company fully repaid $
500
million of the 2013 Senior Notes due 202
4
.
37
The repayment schedule for the Company’s borrowings is as follows:
| Year Ending December 31, | Year Ending Total | |||||||
|
2023 (After September 30,)
|
$ |
|
||||||
| 2024 |
|
|||||||
| 2025 |
|
|||||||
| 2026 |
|
|||||||
| 2027 |
|
|||||||
| Thereafter |
|
|||||||
| Total | $ |
|
||||||
Interest expense, net
The following table summarizes the components of interest as presented in the consolidated statements of operations and the cash paid for interest:
|
Three Months Ended
September 30,
|
Nine Months Ended September 30, | ||||||||||||||||||||||
| 2023 | 2022 | 2023 | 2022 | ||||||||||||||||||||
| Income | $ |
|
$ |
|
$ |
|
$ |
|
|||||||||||||||
|
Expense on borrowings
(1)
|
(
|
(
|
(
|
(
|
|||||||||||||||||||
|
Income (expense) on UTPs and other tax related liabilities
(2)
|
(
|
(
|
|
(
|
|||||||||||||||||||
| Net periodic pension costs - interest component |
(
|
(
|
(
|
(
|
|||||||||||||||||||
| Interest expense, net | $ |
(
|
$ |
(
|
$ |
(
|
$ |
(
|
|||||||||||||||
|
Interest paid
(3)
|
$ |
|
$ |
|
$ |
|
$ |
|
|||||||||||||||
(1)
Expense on borrowings includes interest on long-term debt, as well as realized gains/losses related to interest rate swaps and cross currency swaps, which are more fully discussed in Note 8.
(2)
The amount for the nine months ended September 30, 2023 reflects a $
22
million reduction of tax-related interest expense primarily related to the resolutions of outstanding tax matters.
(3)
Interest paid includes net settlements on interest rate swaps, which are more fully discussed in Note 8.
The fair value and carrying value of the Company’s debt as of September 30, 2023 and December 31, 2022 are as follows:
| September 30, 2023 | December 31, 2022 | ||||||||||||||||||||||
| Carrying Amount | Estimated Fair Value | Carrying Amount | Estimated Fair Value | ||||||||||||||||||||
| Total debt | $ |
|
$ |
|
$ |
|
$ |
|
|||||||||||||||
The fair value of the Company’s debt is estimated based on quoted prices in active markets as of the reporting date, which are considered Level 1 inputs within the fair value hierarchy.
NOTE 15.
LEASES
38
The following table presents the components of the Company’s lease cost:
|
Three Months Ended September 30,
|
Nine Months Ended September 30, | ||||||||||||||||||||||
| 2023 | 2022 | 2023 | 2022 | ||||||||||||||||||||
| Operating lease cost | $ |
|
$ |
|
$ |
|
$ |
|
|||||||||||||||
| Sublease income |
(
|
(
|
(
|
(
|
|||||||||||||||||||
| Variable lease cost |
|
|
|
|
|||||||||||||||||||
| Total lease cost | $ |
|
$ |
|
$ |
|
$ |
|
|||||||||||||||
During the three and nine months ended September 30, 2023, the Company recorded charges of $
10
million and $
12
million, respectively, related to the exit of certain real estate leases. The charges were primarily related to ROU asset impairment and were recorded within restructuring expense in the consolidated statements of operations. Refer to Note 10 for further details.
The following tables present other information related to the Company’s operating leases:
|
Three Months Ended September 30,
|
Nine Months Ended September 30, | ||||||||||||||||||||||
| 2023 | 2022 | 2023 | 2022 | ||||||||||||||||||||
| Cash paid for amounts included in the measurement of operating lease liabilities | $ |
|
$ |
|
$ |
|
$ |
|
|||||||||||||||
|
Right-of-use assets obtained in exchange for new operating lease liabilities
|
$ |
|
$ |
|
$ |
|
$ |
|
|||||||||||||||
| September 30, 2023 | September 30, 2022 | ||||||||||
|
Weighted-average remaining lease term
|
|
|
|||||||||
|
Weighted-average discount rate applied to operating leases
|
|
% |
|
% | |||||||
The following table presents a maturity analysis of the future minimum lease payments included within the Company’s operating lease liabilities at September 30, 2023:
| Year Ending December 31, | Operating Leases | |||||||
|
2023 (After September 30,)
|
$ |
|
||||||
| 2024 |
|
|||||||
| 2025 |
|
|||||||
| 2026 |
|
|||||||
| 2027 |
|
|||||||
| After 2027 |
|
|||||||
| Total lease payments (undiscounted) |
|
|||||||
| Less: Interest |
|
|||||||
| Present value of lease liabilities: | $ |
|
||||||
| Lease liabilities - current | $ |
|
||||||
| Lease liabilities - noncurrent | $ |
|
||||||
NOTE 16.
CONTINGENCIES
Given the nature of the Company's activities, Moody’s is subject to legal and tax proceedings, governmental, regulatory and legislative investigations, subpoenas and other inquiries, and claims and litigation by governmental and private parties that are based on ratings assigned by MIS or that are otherwise incidental to the Company’s business. Moody’s and, in particular, MIS also are subject to periodic reviews, inspections, examinations and investigations by regulators in the U.S. and other jurisdictions, any of which may result in claims, legal proceedings, assessments, fines, penalties or restrictions on business activities. MIS is responding to SEC requests for documents and information in connection with an investigation of MIS’s compliance with record preservation requirements relating to certain business communications sent over electronic messaging channels that have not been approved by MIS. The SEC is conducting similar investigations of the record preservation practices of other NRSROs and other registrants subject to record preservation requirements. Moody’s also is subject to ongoing tax audits as addressed in Note 4 to the consolidated financial statements.
Management periodically assesses the Company’s liabilities and contingencies in connection with these matters based upon the latest information available. For claims, litigation and proceedings and governmental investigations and inquiries not related to income taxes, the Company records liabilities in the consolidated financial statements when it is both probable that a liability has
39
been incurred and the amount of loss can be reasonably estimated and periodically adjusts these as appropriate. When the reasonable estimate of the loss is within a range of amounts, the minimum amount of the range is accrued unless some higher amount within the range is a better estimate than another amount within the range. In instances when a loss is reasonably possible but uncertainties exist related to the probable outcome and/or the amount or range of loss, management does not record a liability but discloses the contingency if material. As additional information becomes available, the Company adjusts its assessments and estimates of such matters accordingly. Moody’s also discloses material pending legal proceedings pursuant to SEC rules and other pending matters as it may determine to be appropriate.
In view of the inherent difficulty of assessing the potential outcome of legal proceedings, governmental, regulatory and legislative investigations and inquiries, claims and litigation and similar matters and contingencies, particularly when the claimants seek large or indeterminate damages or assert novel legal theories or the matters involve a large number of parties, the Company often cannot predict what the eventual outcome of the pending matters will be or the timing of any resolution of such matters. The Company also may be unable to predict the impact (if any) that any such matters may have on how its business is conducted, on its competitive position or on its financial position, results of operations or cash flows. As the process to resolve any pending matters progresses, management will continue to review the latest information available and assess its ability to predict the outcome of such matters and the effects, if any, on its operations and financial condition and to accrue for and disclose such matters as and when required. However, because such matters are inherently unpredictable and unfavorable developments or resolutions can occur, the ultimate outcome of such matters, including the amount of any loss, may differ from those estimates.
NOTE 17.
SEGMENT INFORMATION
The Company is organized into
two
operating segments: MA and MIS and accordingly, the Company reports in
two
reportable segments: MA and MIS.
The MA segment develops a wide range of products and services that support the risk management activities of institutional participants in global financial markets. The MA segment consists of
three
LOBs - Decision Solutions, Research and Insights, and Data and Information.
The MIS segment consists of
five
LOBs. The CFG, FIG, PPIF and SFG LOBs generate revenue principally from fees for the assignment and ongoing monitoring of credit ratings on debt obligations and the entities that issue such obligations in markets worldwide. The MIS Other LOB primarily consists of financial instruments pricing services in the Asia-Pacific region, ICRA non-ratings revenue and revenue from providing professional services.
Revenue for MA and expenses for MIS include an intersegment fee charged to MIS from MA for certain MA products and services utilized in MIS’s ratings process. Additionally, revenue for MIS and expenses for MA include intersegment fees charged to MA for the rights to use and distribute content, data and products developed by MIS. These intersegment fees are generally based on the market value of the products and services being transferred between the segments.
Overhead expenses include costs such as rent and occupancy, information technology and support staff such as finance, human resources and legal. Such costs and corporate expenses that exclusively benefit one segment are fully charged to that segment.
For overhead costs and corporate expenses that benefit both segments, costs are allocated to each segment based on the segment’s share of full-year 2018 actual revenue which comprises a “Baseline Pool” established in 2019, which will remain fixed over time. In subsequent periods, incremental overhead costs (or reductions thereof) will be allocated to each segment based on the prevailing shares of total revenue represented by each segment.
“Eliminations” in the following table represent intersegment revenue/expense. Moody’s does not report the Company’s assets by reportable segment, as this metric is not used by the chief operating decision maker to allocate resources to the segments. Consequently, it is not practical to show assets by reportable segment.
Financial Information by Segment
40
|
Three Months Ended September 30,
|
|||||||||||||||||||||||||||||||||||||||||||||||
| 2023 | 2022 | ||||||||||||||||||||||||||||||||||||||||||||||
| MA |
MIS
|
Eliminations
|
Consolidated
|
MA
|
MIS
|
Eliminations
|
Consolidated
|
||||||||||||||||||||||||||||||||||||||||
| Total external revenue | $ |
|
$ |
|
$ | — | $ |
|
$ |
|
$ |
|
$ | — | $ |
|
|||||||||||||||||||||||||||||||
| Intersegment revenue |
|
|
(
|
— |
|
|
(
|
— | |||||||||||||||||||||||||||||||||||||||
| Revenue |
|
|
(
|
|
|
|
(
|
|
|||||||||||||||||||||||||||||||||||||||
| Operating, SG&A |
|
|
(
|
|
|
|
(
|
|
|||||||||||||||||||||||||||||||||||||||
| Adjusted Operating Income | $ |
|
$ |
|
$ |
|
$ |
|
$ |
|
$ |
|
$ |
|
$ |
|
|||||||||||||||||||||||||||||||
| Add: |
|
||||||||||||||||||||||||||||||||||||||||||||||
|
Depreciation and
amortization |
|
|
|
|
|
|
|
|
|||||||||||||||||||||||||||||||||||||||
| Restructuring |
|
|
|
|
|
|
|
|
|||||||||||||||||||||||||||||||||||||||
| Operating Income | $ |
|
$ |
|
|||||||||||||||||||||||||||||||||||||||||||
| Nine Months Ended September 30, | |||||||||||||||||||||||||||||||||||||||||||||||
| 2023 | 2022 | ||||||||||||||||||||||||||||||||||||||||||||||
|
MA
|
MIS
|
Eliminations
|
Consolidated
|
MA
|
MIS
|
Eliminations
|
Consolidated
|
||||||||||||||||||||||||||||||||||||||||
| Total external revenue | $ |
|
$ |
|
$ | — | $ |
|
$ |
|
$ |
|
$ | — | $ |
|
|||||||||||||||||||||||||||||||
| Intersegment revenue |
|
|
(
|
— |
|
|
(
|
— | |||||||||||||||||||||||||||||||||||||||
| Revenue |
|
|
(
|
|
|
|
(
|
|
|||||||||||||||||||||||||||||||||||||||
| Operating, SG&A |
|
|
(
|
|
|
|
(
|
|
|||||||||||||||||||||||||||||||||||||||
| Adjusted Operating Income | $ |
|
$ |
|
$ |
|
$ |
|
$ |
|
$ |
|
$ |
|
$ |
|
|||||||||||||||||||||||||||||||
| Add: | |||||||||||||||||||||||||||||||||||||||||||||||
| Depreciation and amortization |
|
|
|
|
|
|
|
|
|||||||||||||||||||||||||||||||||||||||
| Restructuring |
|
|
|
|
|
|
|
|
|||||||||||||||||||||||||||||||||||||||
| Operating Income | $ |
|
$ |
|
|||||||||||||||||||||||||||||||||||||||||||
The table below shows cumulative restructuring expense incurred through September 30, 2023 by reportable segment.
| MA | MIS | Total | |||||||||||||||
| 2022 - 2023 Geolocation Restructuring Program | $ |
|
$ |
|
$ |
|
|||||||||||
The costs expected to be incurred related to the 2022 - 2023 Geolocation Restructuring Program are $
100
million - $
110
million for the MA segment and $
85
million - $
95
million for the MIS segment.
The restructuring program is more fully discussed in Note 10.
Consolidated Revenue Information by Geographic Area
|
Three Months Ended September 30,
|
Nine Months Ended September 30, | ||||||||||||||||||||||
| 2023 | 2022 | 2023 | 2022 | ||||||||||||||||||||
| United States | $ |
|
$ |
|
$ |
|
$ |
|
|||||||||||||||
| Non-U.S.: | |||||||||||||||||||||||
| EMEA |
|
|
|
|
|||||||||||||||||||
| Asia-Pacific |
|
|
|
|
|||||||||||||||||||
| Americas |
|
|
|
|
|||||||||||||||||||
| Total Non-U.S. |
|
|
|
|
|||||||||||||||||||
| Total | $ |
|
$ |
|
$ |
|
$ |
|
|||||||||||||||
41
NOTE 18.
SUBSEQUENT EVENT
42
Item 2. Management's Discussion and Analysis of Financial Condition and Results of Operations
This discussion and analysis of financial condition and results of operations should be read in conjunction with the Moody’s Corporation consolidated financial statements and notes thereto included elsewhere in this quarterly report on Form 10
–
Q.
This Management’s Discussion and Analysis of Financial Condition and Results of Operations contains Forward-Looking Statements. See “Forward-Looking Statements” commencing on page
80
for a discussion of uncertainties, risks and other factors associated with these statements.
THE COMPANY
Moody’s is a global risk assessment firm that empowers organizations and investors to make better decisions. Moody’s reports activities in two segments: MA and MIS.

|

|

|
|||||||||||||||

|
Provider of financial intelligence and analytical tools supporting customers’ growth, efficiency and risk management objectives
|

|
Global leader in risk assessment providing credit rating opinions, analytical solutions and insights that empower organizations to make better decisions
|

|
Independent provider of credit rating opinions and related information for over 100 years
|
||||||||||||
MA is a global provider of: i) data and information; ii) research and insights; and iii) decision solutions, which help companies make better and faster decisions. MA leverages its industry expertise across multiple risks such as credit, market, financial crime, supply chain, catastrophe and climate to deliver risk assessment solutions that enable business leaders to identify, measure and manage the implications of interrelated risks and opportunities.
MIS publishes credit ratings and provides assessment services on a wide range of debt obligations, programs and facilities, and the entities that issue such obligations in markets worldwide, including various corporate, financial institution and governmental obligations, and structured finance securities.
Sustainability
Moody’s manages its business with the goal of delivering value to all of its stakeholders, including its customers, employees, business partners, local communities and stockholders. As part of this effort, Moody’s advances its commitment to sustainability by considering ESG factors in its operations, value chain, products and services. It uses its expertise and assets to make a positive difference through technology tools, research and analytical services that help other organizations and the investor community better understand the links between sustainability considerations and the global markets. Moody’s efforts to promote sustainability-related thought leadership, assessments and data to market participants involve adhering to globally recognized standards including the GRI, SASB and TCFD recommendations. Moody’s sustainability-related achievements during 2023 included the following:
–
Named 2022 CDP Supplier Engagement Leader on Climate Action for third consecutive year;
–
Recognized among America’s 100 Most JUST Companies by JUST Capital and CNBC for its commitment to serving its workforce, customers, communities, the environment, and stockholders;
–
Named to Bloomberg Gender-Equality Index for fourth consecutive year; and
–
Ranked #1 on Forbes' Net Zero Leaders list.
The Board oversees sustainability matters via the Audit, Governance & Nominating and Compensation & Human Resources Committees, as part of its oversight of management and the Company’s overall strategy. The Audit Committee oversees financial, risk and other disclosures made in the Company’s annual and quarterly reports related to sustainability and has overseen the expanded voluntary disclosures the Company has made in its periodic filings. The Governance & Nominating Committee oversees sustainability matters, including significant issues of corporate social and environmental responsibility, as they pertain to the Company’s business and to long-term value creation for the Company and its stockholders, and makes recommendations to the Board regarding these issues. This has helped to develop the Company’s robust ESG strategy. Finally, the Compensation & Human Resources Committee oversees inclusion of sustainability-related performance goals for determining compensation of all senior executives. This oversight has resulted in the Company more fully integrating sustainability-related performance metrics into the strategic & operational compensation metric of all senior executives. The Board also oversees Moody’s policies for assessing and managing the Company's exposure to risk, including climate-related risks such as business continuity disruption and reputational or credibility concerns stemming from incorporation of climate-related risks into the credit methodologies and credit ratings of MIS.
43
|
Three Pillars of Moody's Sustainability Strategy
|
|||||||||||||||||||||||

|

|

|
|||||||||||||||||||||
| Better Business | Better Lives | Better Solutions | |||||||||||||||||||||
|
For Moody's operations and value chain
|
For Moody's people and communities
|
For market transformation
|
|||||||||||||||||||||
| Strive to embed responsible, sustainable decision-making into our operations and value chain. | Aim to foster a nurturing and inclusive culture across Moody's people and communities. | Deliver trusted perspectives that inform a clear and holistic understanding of risk, including ESG and climate considerations. | |||||||||||||||||||||
Current Matters Impacting Moody's Business
Current Macroeconomic Uncertainties/Market Volatility
The Company continues to monitor current macroeconomic and geopolitical uncertainties that have contributed to volatility in rated issuance volumes, which began in 2022 and has continued into 2023. These uncertainties include, but are not limited to: i) inflation levels; ii) higher interest rates; and iii) volatility in the global capital markets partly resulting from the ongoing military conflicts further discussed below and the failures of certain banking institutions in the first half of 2023. A substantial portion of MIS’s revenue is impacted by the level of issuance activity in the fixed income capital markets, both in the U.S. and internationally. While market volatility has resulted in suppressed rated issuance volumes in certain sectors, the Company believes that these suppressed volumes are predominantly transitory in nature. However, due to various uncertainties, Moody's is unable to predict the severity and duration of current macroeconomic and geopolitical uncertainties and their potential impact on future rated issuance volumes. Refer to Item 1A. “Risk Factors” contained in the Company’s annual report on Form 10-K for the year ended December 31, 2022 for further disclosure relating to these risks.
Military Conflicts
The Company continues to closely monitor the impact of the ongoing Russia-Ukraine military conflict, and more recently is monitoring the military conflict in Israel and surrounding areas on all aspects of its business. In response to the Russia-Ukraine military conflict, the Company is no longer conducting commercial operations in Russia for both MA and MIS and is complying with all applicable regulatory restrictions set forth by authorities in the jurisdictions in which Moody's operates. Furthermore, the Company also has withdrawn MIS credit ratings on Russian entities.
While Moody's Russian and Israeli operations and net assets are not material, broader global market volatility, which partially relates to uncertainties surrounding these military conflicts, has contributed and may continue to contribute to volatility in rated issuance volumes. This impact to rated issuance volumes is more fully discussed in the "Results of Operations" section of this MD&A. The Company is unable to predict either the near-term or longer-term impact that these military conflicts may have on its financial position and operating results due to numerous uncertainties regarding the severity and duration of military conflicts and their broader potential macroeconomic impact.
Critical Accounting Estimates
Moody’s discussion and analysis of its financial condition and results of operations are based on the Company’s consolidated financial statements, which have been prepared in accordance with GAAP. The preparation of these financial statements requires Moody’s to make estimates and judgments that affect reported amounts of assets and liabilities and related disclosures of contingent assets and liabilities at the dates of the financial statements and revenue and expenses during the reporting periods. These estimates are based on historical experience and on other assumptions that are believed to be reasonable under the circumstances. On an ongoing basis, Moody’s evaluates its estimates, including those related to revenue recognition, accounts receivable allowances, contingencies, goodwill and acquired intangible assets, pension and other retirement benefits, investments in non-consolidated affiliates, and income taxes. Actual results may differ from these estimates under different assumptions or conditions. Item 7, MD&A, in the Company’s annual report on Form 10-K for the year ended December 31, 2022, includes descriptions of some of the judgments that Moody’s makes in applying its accounting estimates in these areas. Since the date of the annual report on Form 10-K, there have been no material changes to the Company’s critical accounting estimates disclosures.
Reportable Segments
The Company is organized into two reportable segments as of September 30, 2023: MA and MIS, which are more fully described in the section entitled “The Company” above and in Note 17 to the consolidated financial statements.
44
RESULTS OF OPERATIONS
The following footnotes are applicable throughout the discussion of the Company's results of operations:
(1)
Refer to the section entitled "Non-GAAP Financial Measures" of this MD&A for the definition and methodology that the Company utilizes to calculate this metric.
(2)
Refer to the section entitled "Key Performance Metrics" of this MD&A for the definition and methodology that the Company utilizes to calculate this metric.
Three months ended September 30, 2023 compared with three months ended September 30, 2022
Executive Summary
The following table provides an executive summary of key operating results for the quarter ended September 30, 2023. Following this executive summary is a more detailed discussion of the Company’s operating results as well as a discussion of the operating results of the Company’s reportable segments.
|
Three Months Ended
September 30,
|
||||||||||||||
| Financial measure: | 2023 | 2022 |
% Change Favorable
(Unfavorable) |
Insight and Key Drivers of Change Compared to Prior Year
|
||||||||||
| Moody's total revenue | $ | 1,472 | $ | 1,275 | 15 | % |
— reflects growth in both segments
|
|||||||
| MA external revenue | $ | 776 | $ | 685 | 13 | % |
— ongoing strong retention and new sales for ratings data feeds and credit research;
— continued growth from SaaS-based banking offerings; and
— sustained demand for KYC solutions
|
|||||||
| MIS external revenue | $ | 696 | $ | 590 | 18 | % |
— reflects strong growth in rated issuance volumes across all ratings LOBs excluding SFG compared to suppressed issuance activity in the prior year
|
|||||||
| Total operating and SG&A expenses | $ | 815 | $ | 778 | (5 | %) |
— higher salaries and benefits primarily reflecting hiring and salary increases in MA to support business growth; and
— higher incentive compensation accruals aligned with actual/expected financial and operating performance
|
|||||||
| Depreciation and amortization | $ | 95 | $ | 83 | (14 | %) | — higher amortization of internally developed software, primarily related to the development of MA SaaS solutions | |||||||
| Restructuring | $ | 27 | $ | 1 | NM |
— relates to the Company's 2022 - 2023 Geolocation Restructuring Program, more fully discussed in Note 10 to the consolidated financial statements
|
||||||||
| Total non-operating (expense) income, net | $ | (48) | $ | (32) | (50 %) |
Expense growth primarily due to:
— higher realized losses of $21 million on fixed-to-floating interest rate swaps resulting from higher interest rates (more fully discussed in Note 8 to the consolidated financial statements); and
— decreases in FX gains of $11 million,
partially offset by:
— higher interest income of $14 million resulting from higher cash balances and interest yields
|
||||||||
| Operating margin | 36.3 | % | 32.4 | % | 390 | BPS |
— operating margin and Adjusted Operating Margin
(1)
growth reflects strong revenue growth outpacing an increase in operating and SG&A expenses
|
|||||||
|
Adjusted Operating Margin
(1)
|
44.6 | % | 39.0 | % | 560 | BPS | ||||||||
| ETR | 19.9 | % | 20.5 | % | 60 | BPS |
— in line with the prior year
|
|||||||
| Diluted EPS | $ | 2.11 | $ | 1.65 | 28 | % |
— mainly reflects higher operating income and Adjusted Operating Income
(1)
|
|||||||
|
Adjusted Diluted EPS
(1)
|
$ | 2.43 | $ | 1.85 | 31 | % | ||||||||
45
Moody's Corporation
|
Three Months Ended September 30,
|
% Change Favorable
(Unfavorable)
|
||||||||||||||||
| 2023 | 2022 | ||||||||||||||||
| Revenue: | |||||||||||||||||
| United States | $ | 768 | $ | 668 | 15 | % | |||||||||||
| Non-U.S.: | |||||||||||||||||
| EMEA | 455 | 393 | 16 | % | |||||||||||||
| Asia-Pacific | 145 | 129 | 12 | % | |||||||||||||
| Americas | 104 | 85 | 22 | % | |||||||||||||
| Total Non-U.S. | 704 | 607 | 16 | % | |||||||||||||
| Total | 1,472 | 1,275 | 15 | % | |||||||||||||
| Expenses: | |||||||||||||||||
| Operating | 412 | 393 | (5 | %) | |||||||||||||
| SG&A | 403 | 385 | (5 | %) | |||||||||||||
| Depreciation and amortization | 95 | 83 | (14 | %) | |||||||||||||
| Restructuring | 27 | 1 | NM | ||||||||||||||
| Total | 937 | 862 | (9 | %) | |||||||||||||
| Operating income | $ | 535 | $ | 413 | 30 | % | |||||||||||
|
Adjusted Operating Income
(1)
|
$ | 657 | $ | 497 | 32 | % | |||||||||||
| Interest expense, net | $ | (66) | $ | (58) | (14 | %) | |||||||||||
| Other non-operating income, net | 18 | 26 | (31 | %) | |||||||||||||
| Non-operating (expense) income, net | $ | (48) | $ | (32) | (50 | %) | |||||||||||
| Net income attributable to Moody's | $ | 389 | $ | 303 | 28 | % | |||||||||||
| Diluted weighted average shares outstanding | 184.0 | 183.9 | — | % | |||||||||||||
| Diluted EPS attributable to Moody's common shareholders | $ | 2.11 | $ | 1.65 | 28 | % | |||||||||||
|
Adjusted Diluted EPS
(1)
|
$ | 2.43 | $ | 1.85 | 31 | % | |||||||||||
| Operating margin | 36.3 | % | 32.4 | % | |||||||||||||
|
Adjusted Operating Margin
(1)
|
44.6 | % | 39.0 | % | |||||||||||||
| Effective tax rate | 19.9 | % | 20.5 | % | |||||||||||||
The table below shows Moody’s global staffing by geographic area:
| September 30, | Change | ||||||||||||||||||||||
| 2023 | 2022 | % | |||||||||||||||||||||
| MA | U.S. | 3,060 | 2,830 | 8 | % | ||||||||||||||||||
| Non-U.S. | 4,823 | 4,294 | 12 | % | |||||||||||||||||||
| Total | 7,883 | 7,124 | 11 | % | |||||||||||||||||||
| MIS | U.S. | 1,470 | 1,576 | (7 | %) | ||||||||||||||||||
| Non-U.S. | 3,782 | 4,043 | (6 | %) | |||||||||||||||||||
| Total | 5,252 | 5,619 | (7 | %) | |||||||||||||||||||
| MSS | U.S. | 718 | 785 | (9 | %) | ||||||||||||||||||
| Non-U.S. | 1,165 | 1,043 | 12 | % | |||||||||||||||||||
| Total | 1,883 | 1,828 | 3 | % | |||||||||||||||||||
| Total MCO | U.S. | 5,248 | 5,191 | 1 | % | ||||||||||||||||||
| Non-U.S. | 9,770 | 9,380 | 4 | % | |||||||||||||||||||
| Total | 15,018 | 14,571 | 3 | % | |||||||||||||||||||
46
GLOBAL REVENUE
|
Three months ended September 30,
|
||||||||||||||
2023
-----------------------------------------------------------------------------------
2022
_______________________________________________
_________
_______________________________________________
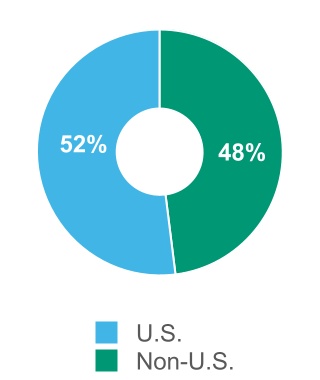

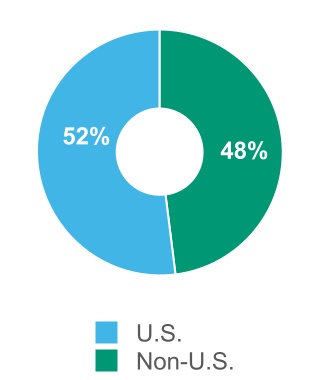
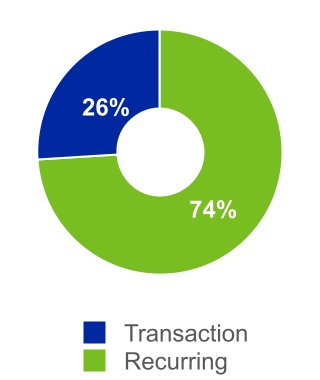
|
Global revenue ⇑ $197 million
|
U.S. Revenue ⇑ $100 million
|
Non-U.S. Revenue ⇑ $97 million
|
|||||||||||||||
The increase in global revenue reflected growth in both MA and MIS, both in the U.S. and internationally. Refer to the section entitled “Segment Results” of this MD&A for a more comprehensive discussion of the Company’s segment revenue.
|
Third Quarter Operating Expense ⇑ $19 million
|
Third Quarter SG&A Expense ⇑ $18 million
|
|||||||
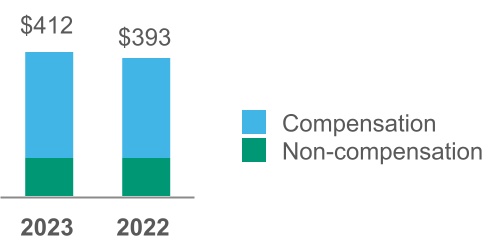 --------- ---------

|
Compensation expenses increased $21 million reflecting:
|
Compensation expenses increased $22 million reflecting:
|
|||||||
|
— approximately 50% of the increase is attributable to higher incentive compensation accruals, which aligns with actual/projected financial and operating performance; and
|
— approximately 60% of the increase is attributable to higher salaries and benefits primarily reflecting hiring and salary increases in MA to support continued growth in the business; and
|
|||||||
|
— approximately 40% of the increase is attributable to higher salaries and benefits, primarily reflecting hiring and salary increases in MA to support continued growth in the business.
|
— approximately 30% of the increase is attributable to higher incentive compensation accruals, which aligns with actual/projected financial and operating performance.
|
|||||||
|
Non-compensation expenses decreased $4 million reflecting:
|
||||||||
|
— ongoing cost control initiatives
|
||||||||
| Depreciation and amortization | ||
The increase is driven by amortization of internally developed software, which is primarily related to the development of MA SaaS solutions.
| Restructuring | ||
The restructuring charge in both periods relates to the Company's 2022 - 2023 Geolocation Restructuring Program as more fully discussed in Note 10 to the consolidated financial statements.
47
|
Operating margin 36.3%, up 390 BPS
|
Adjusted Operating Margin
(1)
44.6%, up 560 BPS
|
||||
Both operating margin and Adjusted Operating Margin
(1)
expanded with strong revenue growth outpacing an increase in operating and SG&A expenses.
|
Interest Expense, net ⇑ $8 million
|
Other non-operating income ⇓ $8 million
|
||||
| Increase in expense is primarily due to: |
Decrease in income is primarily due to:
|
|||||||||||||
|
— higher realized losses of $21 million on fixed-to-floating interest rate swaps resulting from higher interest rates (more fully discussed in Note 8 to the consolidated financial statements);
partially offset by
|
— decrease in FX gains of $11 million.
|
|||||||||||||
|
— higher interest income of $14 million reflecting higher cash balances and interest yields.
|
||||||||||||||
|
ETR ⇓ 60 BPS
|
||
The ETR was generally in line with the prior year.
|
Diluted EPS ⇑ $0.46
|
Adjusted Diluted EPS
(1)
⇑ $0.58
|
||||
Diluted EPS and Adjusted Diluted EPS
(1)
increased mainly due to higher operating income and Adjusted Operating Income
(1)
, respectively, the components of which are more fully described above.
48
Segment Results
Moody’s Analytics
The table below provides a summary of revenue and operating results, followed by further insight and commentary:
|
Three Months Ended September 30,
|
% Change Favorable
(Unfavorable)
|
||||||||||||||||
| 2023 | 2022 | ||||||||||||||||
| Revenue: | |||||||||||||||||
| Decision Solutions (DS) | $ | 354 | $ | 308 | 15 | % | |||||||||||
| Research and Insights (R&I) | 222 | 201 | 10 | % | |||||||||||||
| Data and Information (D&I) | 200 | 176 | 14 | % | |||||||||||||
| Total external revenue | 776 | 685 | 13 | % | |||||||||||||
| Intersegment revenue | 3 | 2 | 50 | % | |||||||||||||
| Total MA revenue | 779 | 687 | 13 | % | |||||||||||||
| Expenses: | |||||||||||||||||
| Operating and SG&A (external) | 470 | 436 | (8 | %) | |||||||||||||
| Operating and SG&A (intersegment) | 47 | 43 | (9 | %) | |||||||||||||
| Total operating and SG&A | 517 | 479 | (8 | %) | |||||||||||||
|
Adjusted Operating Income
|
$ | 262 | $ | 208 | 26 | % | |||||||||||
|
Adjusted Operating Margin
|
33.6 | % | 30.3 | % | |||||||||||||
| Depreciation and amortization | 76 | 62 | (23 | %) | |||||||||||||
| Restructuring | 22 | 1 | NM | ||||||||||||||
MOODY'S ANALYTICS REVENUE
|
Three months ended September 30,
|
||
2023
-----------------------------------------------------------------------------------
2022
_______________________________________________
_________
_______________________________________________
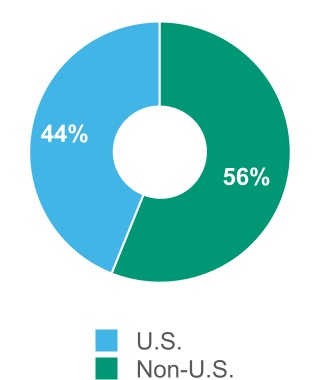
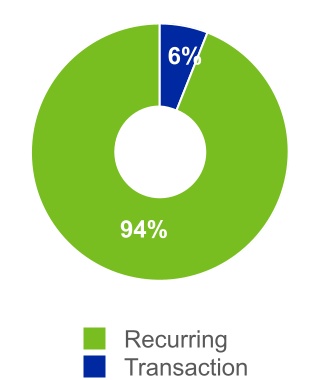
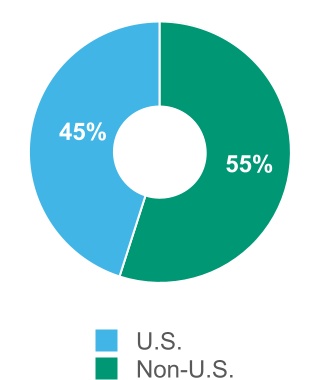

|
MA: Global revenue ⇑ $91 million
|
U.S. Revenue ⇑ $34 million
|
Non-U.S. Revenue ⇑ $57 million
|
||||||
The 13% increase in global MA revenue reflects growth both in the U.S. (11%) and internationally (15%).
–
Constant currency revenue
(1)
growth was 11%, reflecting increases across all LOBs.
–
ARR
(2)
increased 10% reflecting strong growth across all LOBs.
49
DECISION SOLUTIONS REVENUE
|
Three months ended September 30,
|
||||||||||||||
2023
-----------------------------------------------------------------------------------
2022
_______________________________________________
_________
_______________________________________________

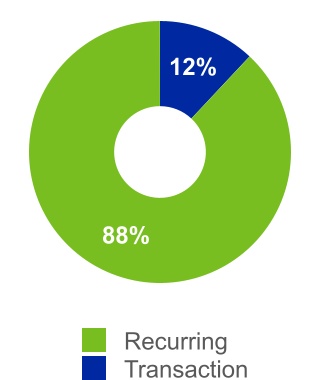
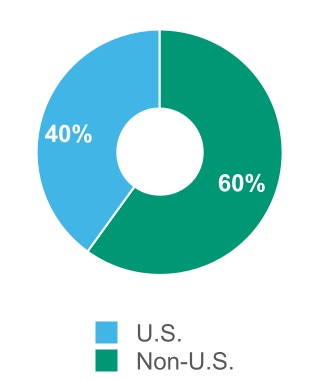
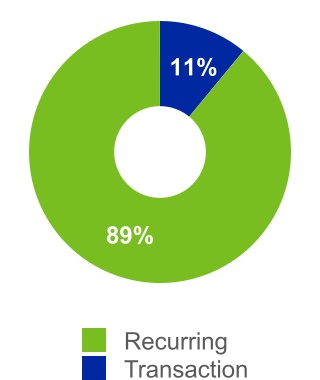
|
DS: Global revenue ⇑ $46 million
|
U.S. Revenue ⇑ $24 million
|
Non-U.S. Revenue ⇑ $22 million
|
||||||
Global DS revenue for the three months ended September 30, 2023 and 2022 was comprised as follows:
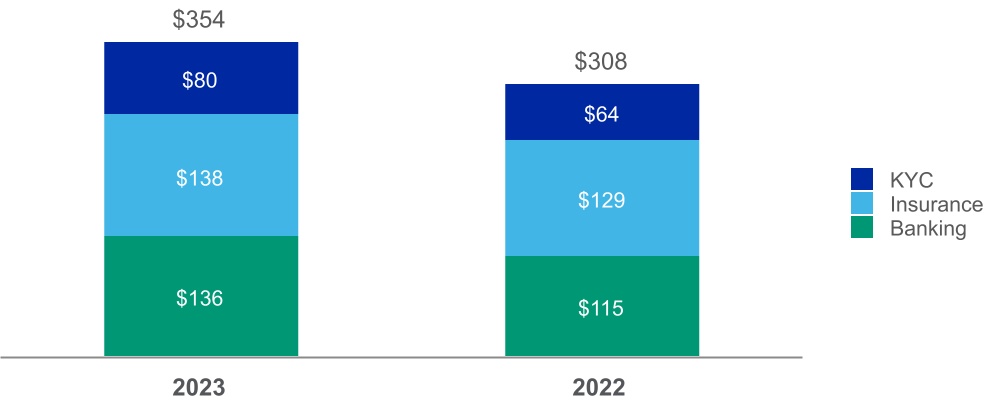
Global DS revenue grew 15% compared to the third quarter of 2022 and reflects increases in both the U.S. (20%) and internationally (12%).
The most notable drivers of the growth reflect:
–
growth across banking offerings following Moody's investments in SaaS-based solutions for lending, risk management and finance workflows, which resulted in ARR
(2)
growth of 10%;
–
continued demand for KYC and compliance solutions reflecting increased customer and supplier risk data usage which also drove ARR
(2)
growth of 18% for these solutions; and
–
growth in subscription-based revenue for actuarial modeling and regulatory reporting solutions which resulted in ARR
(2)
increasing by 8%.
Changes in foreign currency translation rates favorably impacted DS revenue by 2%.
Constant currency revenue
(1)
growth was 13%.
The aforementioned revenue growth drivers also resulted in overall ARR
(2)
growth of 11% for DS.
50
RESEARCH AND INSIGHTS REVENUE
|
Three months ended September 30,
|
||
2023
-----------------------------------------------------------------------------------
2022
_________________________________________________
__
________________________________________________
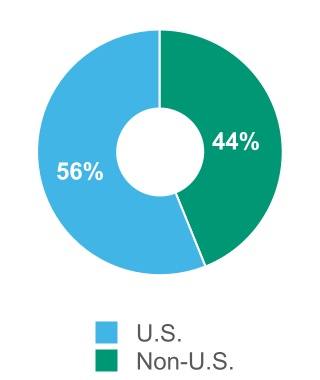
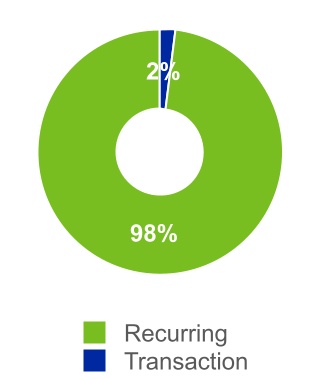
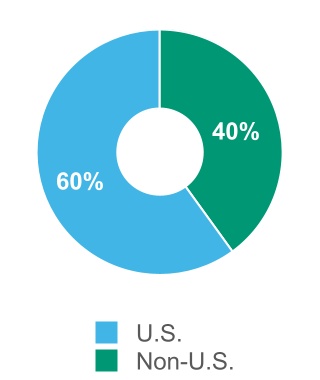
|
R&I: Global revenue ⇑ $21 million
|
U.S. Revenue ⇑ $4 million
|
Non-U.S. Revenue ⇑ $17 million
|
||||||
Global R&I revenue increased 10% compared to the third quarter of 2022 and reflects growth in both the U.S. (3%) and internationally (21%). This growth was mainly driven by demand for credit research, analytics and models, which also contributed to R&I ARR
(2)
growth of 8%.
DATA AND INFORMATION REVENUE
|
Three months ended September 30,
|
||
2023
-----------------------------------------------------------------------------------
2022
__________________________________________________
__
____________________________________________________

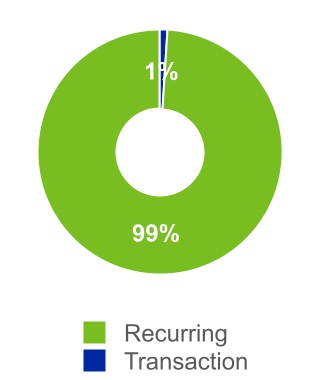
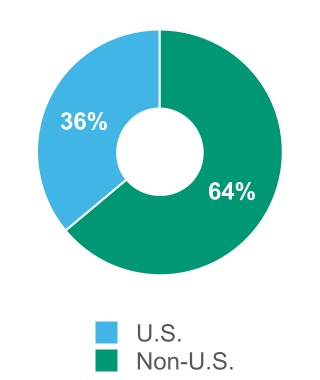

|
D&I: Global revenue ⇑ $24 million
|
U.S. Revenue ⇑ $6 million
|
Non-U.S. Revenue ⇑ $18 million
|
||||||
Global D&I revenue increased 14% compared to the third quarter of 2022 and reflects growth in both the U.S. (10%) and internationally (16%), mainly driven by:
–
strong retention and new sales for ratings feeds coupled with higher pricing realization; and
–
continued demand for company data.
Changes in foreign currency translation rates favorably impacted D&I revenue by 5%.
Constant currency revenue
(1)
growth was 9%.
The aforementioned revenue growth factors also contributed to ARR
(2)
growth of 10% for D&I.
51
|
MA: Third Quarter Operating and SG&A Expense ⇑ $34 million
|
||
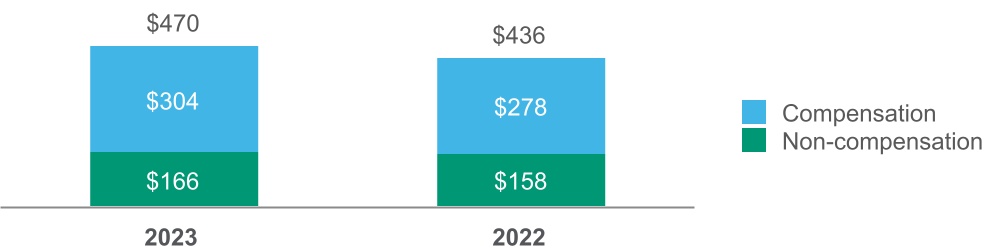
The increase in operating and SG&A expenses compared to the third quarter of 2022 reflects growth in both compensation and non-compensation costs of $26 million and $8 million, respectively. The most notable drivers of these changes were:
| Compensation costs | Non-compensation costs | |||||||
| Notable drivers of expense growth: | Notable drivers of expense growth: | |||||||
|
— the majority of the growth relates to higher salaries and benefits resulting from headcount growth and annual salary increases.
|
— approximately 60% of the increase reflects higher costs to support strategic investments in technology, innovation and product development; and
|
|||||||
|
— approximately 40% of the increase reflects higher travel and entertainment costs correlated with business growth.
|
||||||||
|
MA: Adjusted Operating Margin 33.6% ⇑ 330 BPS
|
||
The Adjusted Operating Margin expansion for MA is primarily due to the 13% increase in global MA revenue, partially offset by increases in operating and SG&A expenses of 8%.
| Depreciation and amortization | ||
The increase in depreciation and amortization expense primarily reflects higher amortization of internally developed software relating to the development of SaaS-based solutions.
| Restructuring Charge | ||
The restructuring charges in both periods relate to the Company's 2022 - 2023 Geolocation Restructuring Program as more fully discussed in Note 10 to the consolidated financial statements.
52
Moody’s Investors Service
The table below provides a summary of revenue and operating results, followed by further insight and commentary:
|
Three Months Ended
September 30,
|
% Change Favorable
(Unfavorable)
|
||||||||||||||||
| 2023 | 2022 | ||||||||||||||||
| Revenue: | |||||||||||||||||
| Corporate finance (CFG) | $ | 346 | $ | 277 | 25 | % | |||||||||||
| Structured finance (SFG) | 102 | 101 | 1 | % | |||||||||||||
| Financial institutions (FIG) | 126 | 109 | 16 | % | |||||||||||||
| Public, project and infrastructure finance (PPIF) | 115 | 92 | 25 | % | |||||||||||||
| Total ratings revenue | 689 | 579 | 19 | % | |||||||||||||
| MIS Other | 7 | 11 | (36 | %) | |||||||||||||
| Total external revenue | 696 | 590 | 18 | % | |||||||||||||
| Intersegment revenue | 47 | 43 | 9 | % | |||||||||||||
| Total MIS revenue | 743 | 633 | 17 | % | |||||||||||||
| Expenses: | |||||||||||||||||
| Operating and SG&A (external) | 345 | 342 | (1 | %) | |||||||||||||
| Operating and SG&A (intersegment) | 3 | 2 | (50 | %) | |||||||||||||
| Total operating and SG&A | 348 | 344 | (1 | %) | |||||||||||||
|
Adjusted Operating Income
|
$ | 395 | $ | 289 | 37 | % | |||||||||||
|
Adjusted Operating Margin
|
53.2 | % | 45.7 | % | |||||||||||||
| Depreciation and amortization | 19 | 21 | 10 | % | |||||||||||||
| Restructuring | 5 | — | NM | ||||||||||||||
The following chart presents changes in rated issuance volumes compared to the third quarter of 2022. To the extent that changes in rated issuance volumes had a material impact to MIS's revenue compared to the prior year, those impacts are discussed below.

53
MOODY'S INVESTORS SERVICE REVENUE
|
Three months ended September 30,
|
||||||||||||||
2023
-----------------------------------------------------------------------------------
2022
_______________________________________________
_________
_______________________________________________
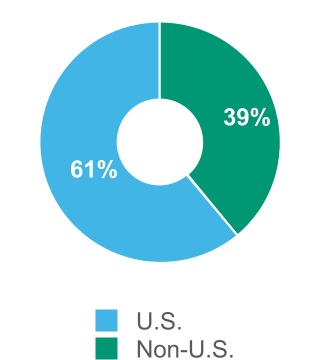
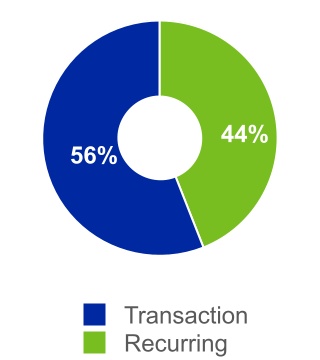

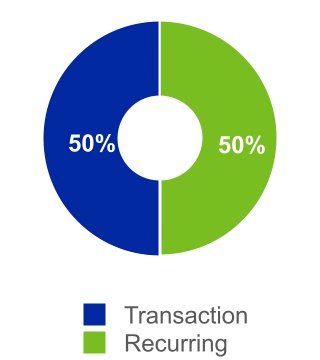
|
MIS: Global revenue ⇑ $106 million
|
U.S. Revenue ⇑ $66 million
|
Non-U.S. Revenue ⇑ $40 million
|
||||||
The increase in global MIS revenue primarily reflects growth in rated issuance volumes across all ratings LOBs excluding SFG compared to suppressed issuance activity in the prior year.
CFG REVENUE
|
Three months ended September 30,
|
||||||||||||||
2023
-----------------------------------------------------------------------------------
2022
_______________________________________________
_________
_______________________________________________
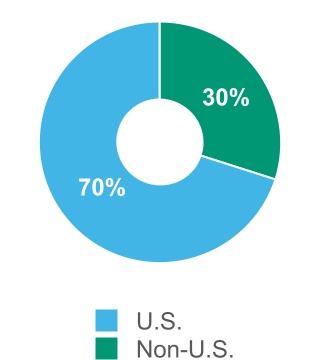
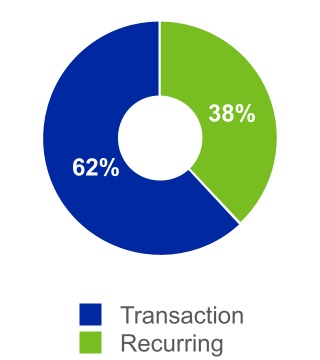
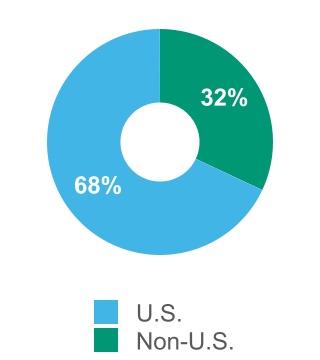

|
CFG: Global revenue ⇑ $69 million
|
U.S. Revenue ⇑ $54 million
|
Non-U.S. Revenue ⇑ $15 million
|
||||||
54
Global CFG revenue for the three months ended September 30, 2023 and 2022 was comprised as follows:
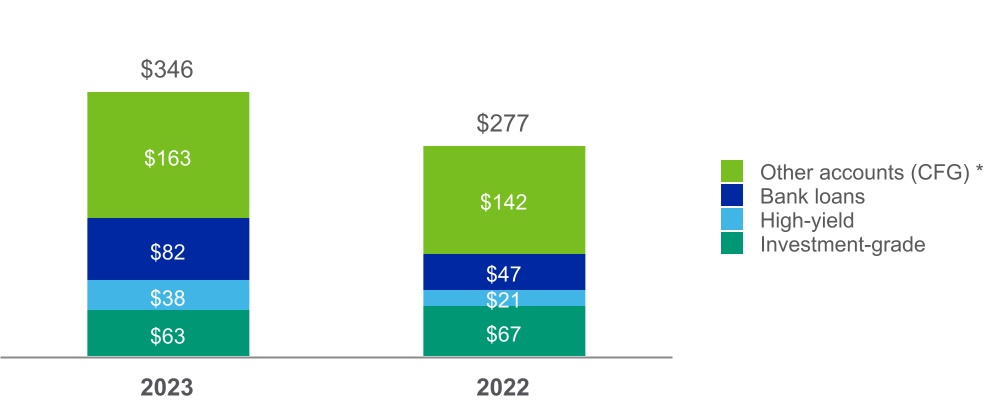
* Other includes: recurring monitoring fees of a rated debt obligation and/or entities that issue such obligations as well as fees from programs such as commercial paper, medium term notes, and ICRA corporate finance revenue.
The increase in CFG revenue of 25% reflects increases in both U.S. (29%) and internationally (17%).
Transaction revenue increased $63 million compared to the same period in the prior year, with the most notable drivers of the growth reflecting:
–
higher leveraged loan refinancing activity compared to suppressed rated issuance volumes in the prior year, including issuance to support leveraged buy-out / M&A activity; and
–
higher speculative-grade rated issuance volumes compared to suppressed issuance in the prior year, which resulted from market volatility in 2022 relating to macroeconomic uncertainties, rising borrowing costs and the Russia/Ukraine military conflict.
SFG REVENUE
|
Three months ended September 30,
|
||||||||||||||
2023
---------------------------------------------------------------------------
2022
_______________________________________________
_________
_______________________________________________
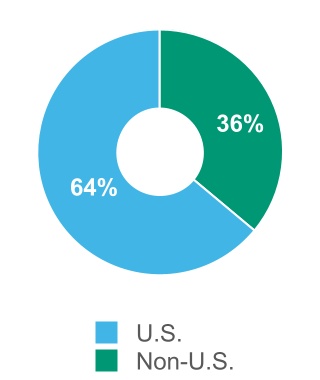

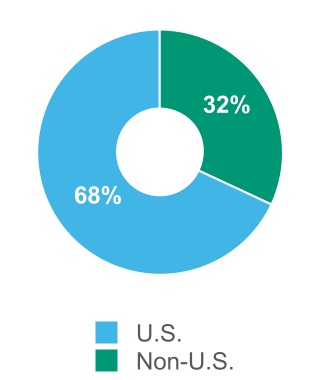
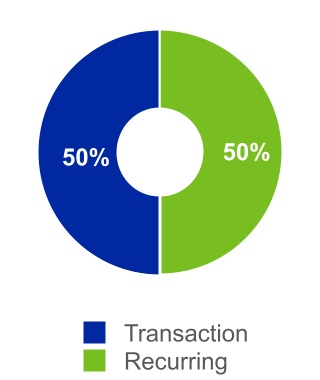
|
SFG: Global revenue ⇑ $1 million
|
U.S. Revenue ⇓ $4 million
|
Non-U.S. Revenue ⇑ $5 million
|
||||||
55
Global SFG revenue for the three months ended September 30, 2023 and 2022 was comprised as follows:
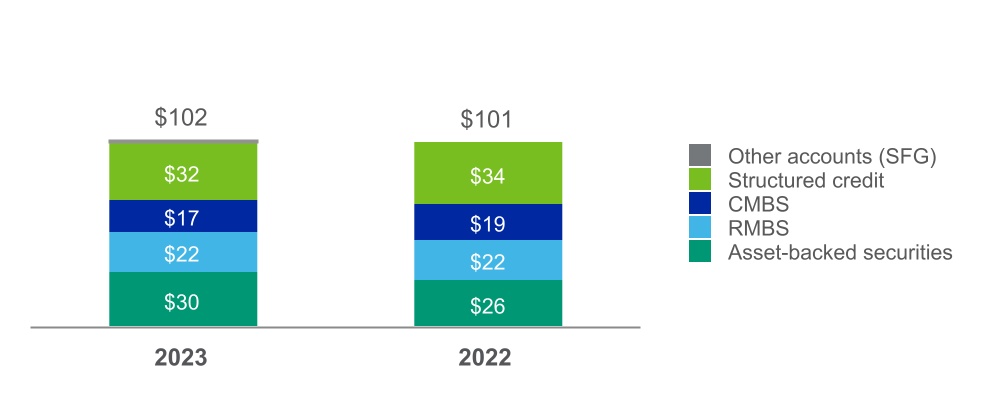
SFG revenue was broadly in line with prior year and reflected declines in the U.S. (6%) offset by an increase internationally (16%).
Transaction revenue decreased $3 million compared to the third quarter of 2022.
SFG revenue continues to be suppressed by lower securitization activity resulting from higher credit spreads and market volatility given ongoing geopolitical and macroeconomic uncertainties.
FIG REVENUE
|
Three months ended September 30,
|
||||||||||||||
2023
-----------------------------------------------------------------------------------
2022
_______________________________________________
_________
_______________________________________________
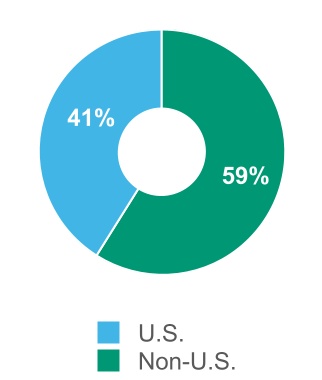
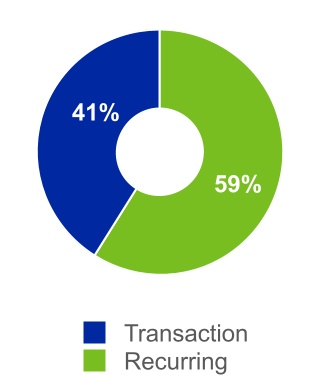
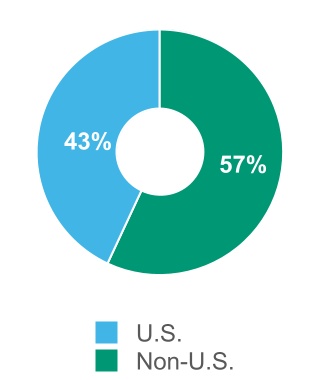
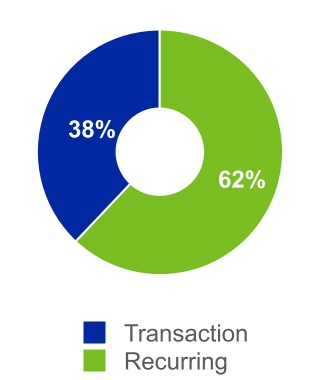
|
FIG: Global revenue ⇑ $17 million
|
U.S. Revenue ⇑ $5 million
|
Non-U.S. Revenue ⇑ $12 million
|
||||||
Global FIG revenue for the three months ended September 30, 2023 and 2022 was comprised as follows:
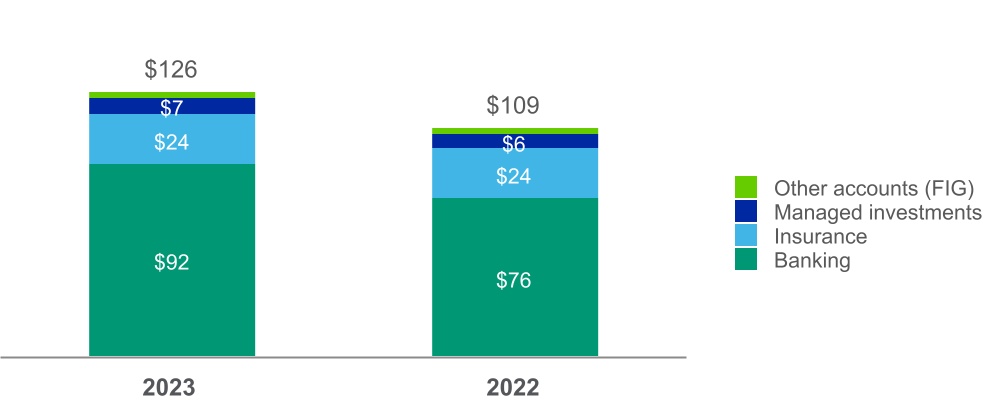
56
The increase in FIG revenue of 16% reflected revenue growth in both the U.S. (11%) and internationally (19%).
Transaction revenue increased $11 million compared to the third quarter of 2022.
The growth primarily reflects:
–
an increase in banking revenue on issuance growth against a weak comparative period; and
–
a favorable product mix from infrequent bank issuers.
Changes in foreign currency translation favorably impacted FIG revenue by 2%.
Constant currency revenue
(1)
growth was 14%.
PPIF REVENUE
|
Three months ended September 30,
|
||||||||||||||
2023
-----------------------------------------------------------------------------------
2022
_______________________________________________
_________
_______________________________________________
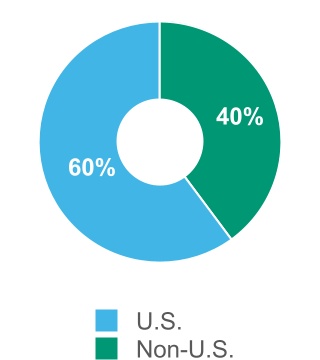
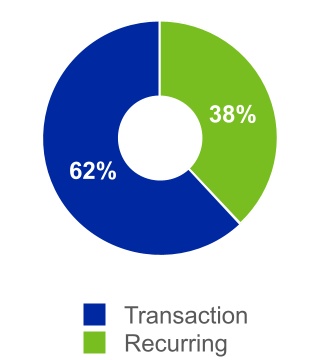


|
PPIF: Global revenue ⇑ $23 million
|
U.S. Revenue ⇑ $12 million
|
Non-U.S. Revenue ⇑ 11 million
|
||||||
Global PPIF revenue for the three months ended September 30, 2023 and 2022 was comprised as follows:
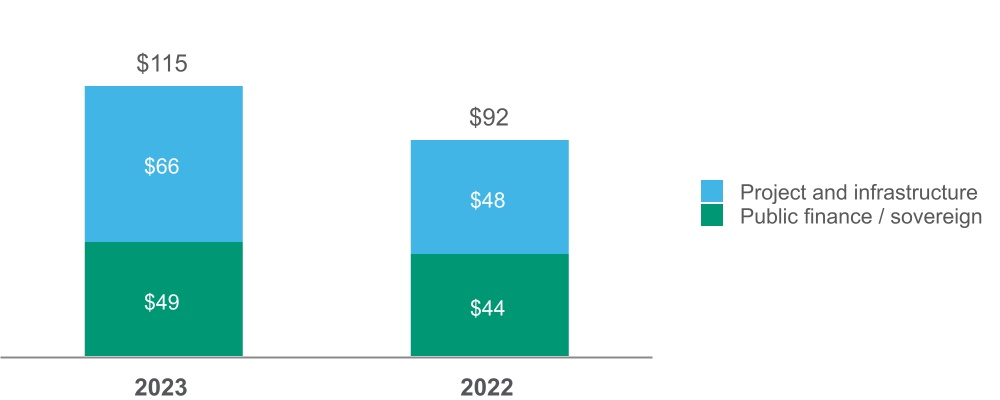
Transaction revenue increased $21 million compared to the third quarter of 2022.
The increase in PPIF revenue of 25% reflected growth in both the U.S. (21%) and internationally (31%).
The main driver of the growth was an increase in project and infrastructure finance activity both in the U.S. and internationally compared to suppressed issuance in the prior year.
57
|
MIS: Third Quarter Operating and SG&A Expense ⇑ $3 million
|
||

The modest increase is primarily due to higher compensation costs of $17 million, partially offset by a $14 million decrease in non-compensation expenses. The most notable drivers of these changes are as follows:
| Compensation costs | Non-compensation costs | |||||||
|
Notable driver of expense growth:
|
Notable driver of decline in expense:
|
|||||||
|
— higher incentive compensation accruals, which aligns with actual and projected financial and operating performance.
|
— mainly relates to ongoing cost control initiatives
|
|||||||
|
MIS: Adjusted Operating Margin 53.2% ⇑ 750 BPS
|
||
The MIS Adjusted Operating Margin expansion primarily reflected the aforementioned 18% increase in revenue.
| Restructuring Charge | ||
The restructuring charges in both periods relate to the Company's 2022 - 2023 Geolocation Restructuring Program, as more fully discussed in Note 10 to the consolidated financial statements.
58
Nine months ended September 30, 2023 compared with nine months ended September 30, 2022
Executive Summary
–
The following table provides an executive summary of key operating results for the nine months ended September 30, 2023. Following this executive summary is a more detailed discussion of the Company’s operating results as well as a discussion of the operating results of the Company’s reportable segments.
59
| Nine Months Ended September 30, | ||||||||||||||
| Financial measure: | 2023 | 2022 | % Change | Insight and Key Drivers of Change Compared to Prior Year | ||||||||||
| Moody's total revenue | $ | 4,436 | $ | 4,178 | 6 | % |
— reflects growth in both segments
|
|||||||
| MA external revenue | $ | 2,260 | $ | 2,055 | 10 | % |
— sustained demand for KYC solutions, as well as continued growth from SaaS-based banking offerings;
— elevated usage and demand for credit and economic research; and
— ongoing strong retention for ratings data feeds
|
|||||||
| MIS external revenue | $ | 2,176 | $ | 2,123 | 2 | % |
— increased investment-grade/speculative-grade corporate debt issuance coupled with higher infrastructure finance issuance relative to suppressed activity in the prior year; and
— increases in banking-related revenue mainly due to a favorable product mix from infrequent issuers;
partially offset by:
— declines across most asset classes in SFG reflecting a decrease in securitization activity amidst capital market volatility
|
|||||||
| Total operating and SG&A expenses | $ | 2,470 | $ | 2,327 | (6 | %) |
— higher incentive compensation accruals and performance-based equity compensation aligned with actual/expected financial and operating performance; and
— higher salaries and benefits primarily reflecting hiring and salary increases in MA to support business growth
|
|||||||
| Depreciation and amortization | $ | 276 | $ | 242 | (14 | %) | — higher amortization relating to internally developed software, primarily related to the development of MA SaaS solutions | |||||||
| Restructuring | $ | 51 | $ | 32 | (59 | %) |
— relates to the Company's 2022 - 2023 Geolocation Restructuring Program, more fully discussed in Note 10 to the consolidated financial statements
|
|||||||
| Total non-operating (expense) income, net | $ | (154) | $ | (144) | (7 | %) |
— higher realized losses of $69 million on fixed-to-floating interest rate swaps resulting from higher interest rates (more fully discussed in Note 8 to the consolidated financial statements); and
— a $20 million net increase in foreign exchange losses recorded during the year;
partially offset by:
— an increase in interest income of $35 million related to higher cash balances and interest yields;
— higher gains on certain of the Company's investments of $30 million; and
— a $22 million benefit related to the resolutions of tax matters in the first quarter of 2023
|
|||||||
| Operating margin | 36.9 | % | 37.7 | % | (80 BPS) |
— operating margin decline is primarily due to the increase in operating, SG&A, D&A and restructuring costs outpacing revenue growth
— Adjusted Operating Margin
(1)
was flat, with revenue growth offset by an increase in operating and SG&A costs
|
||||||||
|
Adjusted Operating Margin
(1)
|
44.3 | % | 44.3 | % | — BPS | |||||||||
| ETR | 14.6 | % | 21.3 | % | 670 BPS |
— lower ETR primarily reflects tax benefits recognized in the first quarter of 2023, which resulted from the resolutions of UTPs in various U.S. and non-U.S. tax jurisdictions
|
||||||||
| Diluted EPS | $ | 6.88 | $ | 6.10 | 13 | % |
— increase includes a $0.75/share benefit related to the resolutions of tax matters in the first quarter of 2023, compared to $0.12/share for similar matters in the first quarter of 2022, coupled with growth in operating income/Adjusted Operating Income
(1)
|
|||||||
|
Adjusted Diluted EPS
(1)
|
$ | 7.71 | $ | 6.96 | 11 | % | ||||||||
60
Moody’s Corporation
| Nine Months Ended September 30, |
% Change Favorable
(Unfavorable) |
||||||||||||||||
| 2023 | 2022 | ||||||||||||||||
| Revenue: | |||||||||||||||||
| United States | $ | 2,320 | $ | 2,214 | 5 | % | |||||||||||
| Non-U.S.: | |||||||||||||||||
| EMEA | 1,376 | 1,271 | 8 | % | |||||||||||||
| Asia-Pacific | 442 | 422 | 5 | % | |||||||||||||
| Americas | 298 | 271 | 10 | % | |||||||||||||
| Total Non-U.S. | 2,116 | 1,964 | 8 | % | |||||||||||||
| Total | 4,436 | 4,178 | 6 | % | |||||||||||||
| Expenses: | |||||||||||||||||
| Operating | 1,266 | 1,203 | (5 | %) | |||||||||||||
| SG&A | 1,204 | 1,124 | (7 | %) | |||||||||||||
| Depreciation and amortization | 276 | 242 | (14 | %) | |||||||||||||
| Restructuring | 51 | 32 | (59 | %) | |||||||||||||
| Total | 2,797 | 2,601 | (8 | %) | |||||||||||||
| Operating income | 1,639 | 1,577 | 4 | % | |||||||||||||
|
Adjusted Operating Income
(1)
|
1,966 | 1,851 | 6 | % | |||||||||||||
| Interest expense, net | (185) | (166) | (11 | %) | |||||||||||||
| Other non-operating income, net | 31 | 22 | 41 | % | |||||||||||||
| Non-operating (expense) income, net | (154) | (144) | (7 | %) | |||||||||||||
| Net income attributable to Moody’s | $ | 1,267 | $ | 1,128 | 12 | % | |||||||||||
| Diluted weighted average shares outstanding | 184.1 | 184.9 | — | % | |||||||||||||
| Diluted EPS attributable to Moody’s common shareholders | $ | 6.88 | $ | 6.10 | 13 | % | |||||||||||
|
Adjusted Diluted EPS
(1)
|
$ | 7.71 | $ | 6.96 | 11 | % | |||||||||||
| Operating margin | 36.9 | % | 37.7 | % | |||||||||||||
|
Adjusted Operating Margin
(1)
|
44.3 | % | 44.3 | % | |||||||||||||
| Effective tax rate | 14.6 | % | 21.3 | % | |||||||||||||
GLOBAL REVENUE
|
Nine months ended September 30,
|
||
2023
-----------------------------------------------------------------------------------
2022
_______________________________________________
_________
_______________________________________________

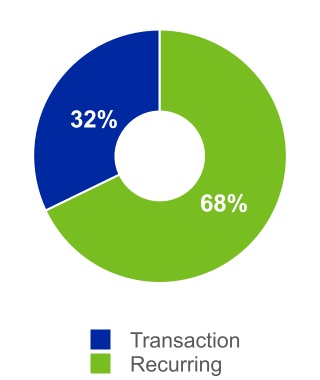
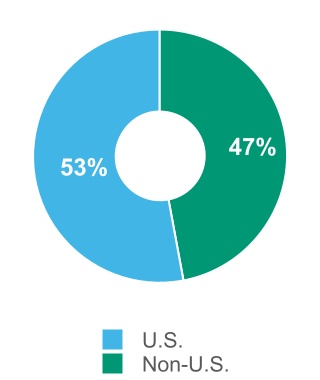
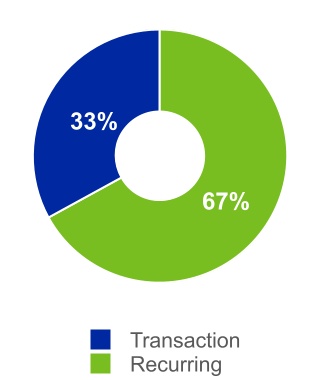
|
Global revenue ⇑ $258 million
|
U.S. Revenue ⇑ $106 million
|
Non-U.S. Revenue ⇑ $152 million
|
|||||||||||||||
61
Growth in global revenue reflected growth in both MA and MIS, both in the U.S. and internationally. Refer to the section entitled “Segment Results” of this MD&A for a more comprehensive discussion of the Company’s segment revenue.
|
YTD Operating Expense ⇑ $63 million
|
YTD SG&A Expense ⇑ $80 million
|
|||||||
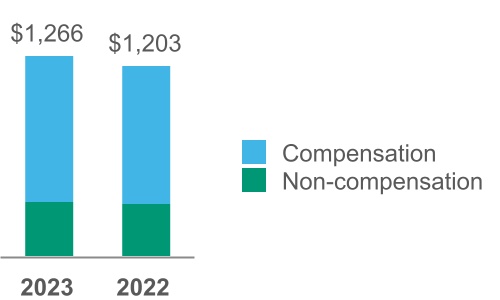 ------------------------------------
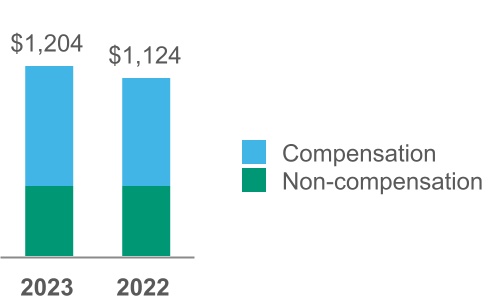
|
Compensation expenses increased $50 million reflecting:
|
Compensation expenses increased $81 million reflecting:
|
|||||||
|
— approximately 70% of the increase is attributable to higher incentive compensation accruals and performance-based equity compensation, which aligns with actual/projected financial and operating performance.
|
— approximately 55% of the increase is attributable to higher incentive compensation accruals and performance-based equity compensation, which aligns with actual/projected financial and operating performance; and
|
|||||||
|
— approximately 30% of the increase is attributable to higher salaries primarily relating to hiring and salary increases in MA to support continued growth in the business.
|
||||||||
|
Non-compensation expenses increased $13 million reflecting:
|
||||||||
|
— approximately 90% of the increase is attributable to higher costs to support strategic investments in technology, innovation and product development.
|
||||||||
| Depreciation and amortization | ||
The increase in depreciation and amortization expense is driven by amortization of internally developed software, which is primarily related to the development of MA SaaS solutions.
| Restructuring | ||
The restructuring charge in both periods relates to the Company's 2022 - 2023 Geolocation Restructuring Program, as more fully discussed in Note 10 to the consolidated financial statements.
|
Operating margin 36.9%, down 80 BPS
|
Adjusted Operating Margin
(1)
44.3%, flat compared to prior year
|
||||
Operating margin decline is primarily due to the aforementioned increase in operating, SG&A, D&A and restructuring expenses outpacing revenue growth.
Adjusted Operating Margin
(1)
was flat, with revenue growth offset by an increase in operating and SG&A expenses.
|
Interest Expense, net ⇑ $19 million
|
Other non-operating income ⇑ $9 million
|
||||
| Increase in expense is primarily due to: | Increase in income is primarily due to: | |||||||
|
— higher realized losses of $69 million on fixed-to-floating interest rate swaps resulting from higher interest rates (more fully discussed in Note 8 to the consolidated financial statements);
partially offset by
|
— higher gains on certain of the Company's investments of $30 million;
partially offset by
|
|||||||
|
— higher interest income of $35 million reflecting higher cash balances and interest yields; and
|
— A $20 million net increase in foreign currency losses mainly attributable to an immaterial out-of-period adjustment relating to the 2022 fiscal year, partially offset by foreign currency translation losses reclassified to earnings resulting from the Company no longer conducting commercial operations in Russia.
|
|||||||
|
— a $22 million benefit related to the resolutions of tax matters in the first quarter of 2023.
|
||||||||
62
|
ETR ⇓ 670 BPS
|
||
The decrease in ETR primarily reflects the resolutions of UTPs in various U.S. and non-U.S. tax jurisdictions in the first quarter of 2023, which resulted in a decrease to the provision for income taxes of $113 million.
|
Diluted EPS ⇑ $0.78
|
Adjusted Diluted EPS
(1)
⇑ $0.75
|
||||
Both diluted EPS and Adjusted Diluted EPS
(1)
growth includes a $0.75/share benefit related to the resolutions of tax matters in the first quarter of 2023, compared to $0.12/share for similar matters in the first quarter of 2022. This is coupled with growth in operating income and Adjusted Operating Income
(1)
, respectively, the components of which are more fully described above. Refer to the section entitled “Non-GAAP Financial Measures” of this MD&A for items excluded in the derivation of Adjusted Diluted EPS
(1)
.
63
Moody’s Analytics
The table below provides a summary of revenue and operating results, followed by further insight and commentary:
| Nine Months Ended September 30, |
% Change Favorable
(Unfavorable) |
||||||||||||||||
| 2023 | 2022 | ||||||||||||||||
| Revenue: | |||||||||||||||||
| Decision Solutions (DS) | $ | 1,022 | $ | 916 | 12 | % | |||||||||||
| Research and Insights (R&I) | 654 | 607 | 8 | % | |||||||||||||
| Data and Information (D&I) | 584 | 532 | 10 | % | |||||||||||||
| Total external revenue | 2,260 | 2,055 | 10 | % | |||||||||||||
| Intersegment revenue | 10 | 5 | 100 | % | |||||||||||||
| Total MA Revenue | 2,270 | 2,060 | 10 | % | |||||||||||||
| Expenses: | |||||||||||||||||
| Operating and SG&A (external) | 1,446 | 1,294 | (12 | %) | |||||||||||||
| Operating and SG&A (intersegment) | 138 | 129 | (7 | %) | |||||||||||||
| Total operating and SG&A expense | 1,584 | 1,423 | (11 | %) | |||||||||||||
|
Adjusted Operating Income
|
$ | 686 | $ | 637 | 8 | % | |||||||||||
|
Adjusted Operating Margin
|
30.2 | % | 30.9 | % | |||||||||||||
| Depreciation and amortization | 220 | 182 | (21 | %) | |||||||||||||
| Restructuring | 38 | 17 | (124 | %) | |||||||||||||
MOODY'S ANALYTICS REVENUE
|
Nine months ended September 30,
|
||
2023
-----------------------------------------------------------------------------------
2022
_______________________________________________
_________
_______________________________________________

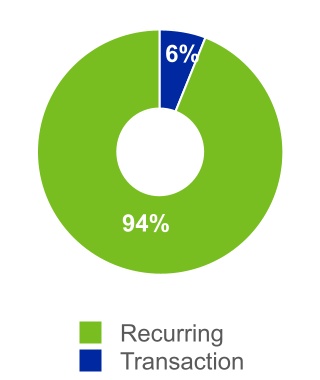
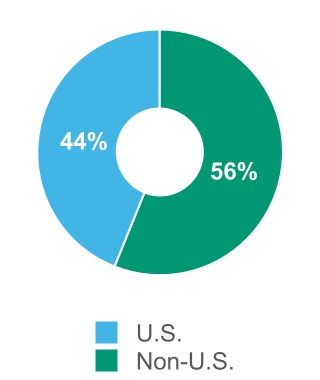

|
MA: Global revenue ⇑ $205 million
|
U.S. Revenue ⇑ $78 million
|
Non-U.S. Revenue ⇑ $127 million
|
||||||
The 10% increase in global MA revenue reflects growth both in the U.S. (9%) and internationally (11%) across all LOBs.
–
ARR
(2)
grew 10% reflecting strong growth across all LOBs.
.
64
DECISION SOLUTIONS REVENUE
|
Nine months ended September 30,
|
||
2023
-----------------------------------------------------------------------------------
2022
_______________________________________________
_________
_______________________________________________
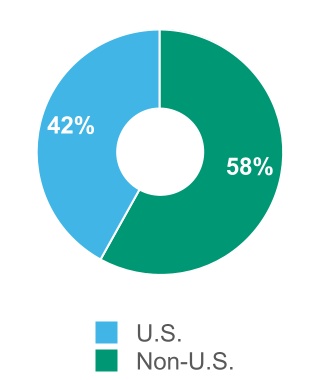
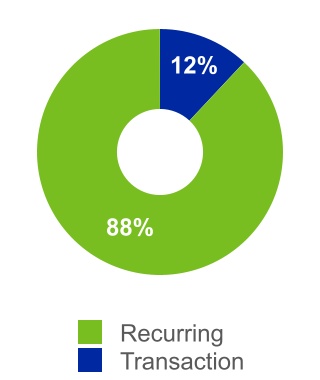
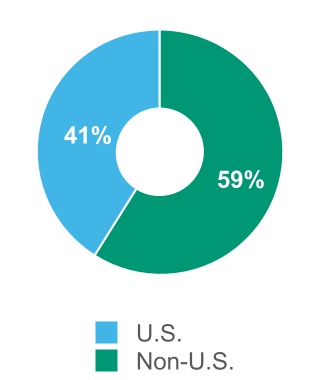
|
DS: Global revenue ⇑ $106 million
|
U.S. Revenue ⇑ $50 million
|
Non-U.S. Revenue ⇑ $56 million
|
||||||
Global DS revenue for the nine months ended September 30, 2023 and 2022 was comprised as follows:
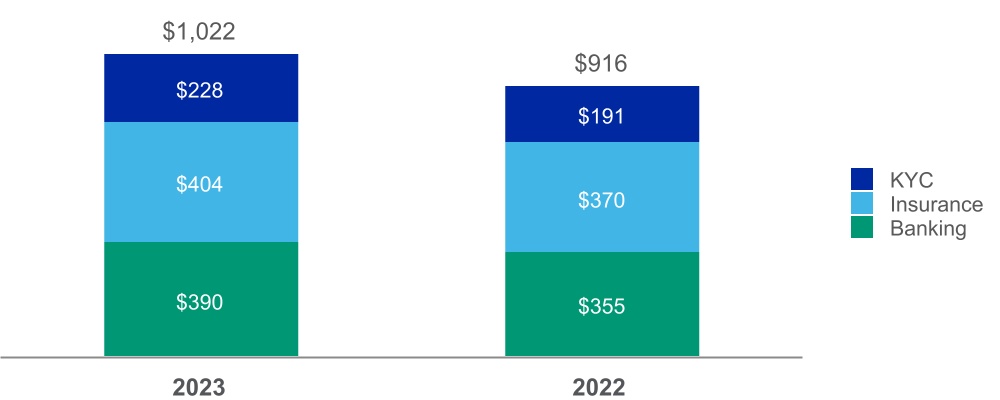
Global DS revenue grew 12% compared to the first nine months of 2022 and reflects increases in both the U.S. (13%) and internationally (10%).
The most notable drivers of the growth reflect:
–
continued demand for KYC and compliance solutions reflecting increased customer and supplier risk data usage, which also drove ARR
(2)
growth of 18%;
–
broad growth across banking offerings following Moody's investments in SaaS-based solutions, which also resulted in ARR
(2)
growth of 10%;
–
growth in subscription-based revenue for actuarial modeling tools and products supporting the adoption of certain international accounting standards relating to insurance contracts which resulted in ARR
(2)
growth of 8%; and
–
higher revenue from RMS primarily due to a reduction of revenue in 2022 pursuant to a fair value adjustment to deferred revenue previously required as part of acquisition accounting.
The aforementioned factors also contributed to overall ARR
(2)
growth for DS of 11%.
65
RESEARCH AND INSIGHTS REVENUE
|
Nine months ended September 30,
|
||
2023
-----------------------------------------------------------------------------------
2022
_______________________________________________
_________
_______________________________________________

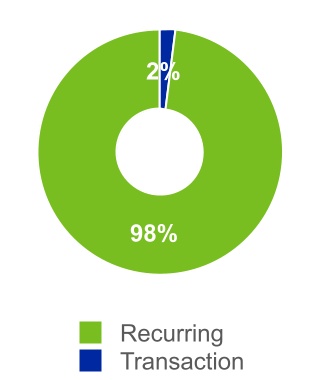

|
R&I: Global revenue ⇑ $47 million
|
U.S. Revenue ⇑ $9 million
|
Non-U.S. Revenue ⇑ $38 million
|
||||||
Global R&I revenue increased 8% compared to the first nine months of 2022 and reflects growth in both the U.S. (3%) and internationally (15%). This growth was mainly driven by continued strong retention and demand for credit research, analytics and models, which also drove ARR
(2)
growth of 8%.
DATA AND INFORMATION REVENUE
|
Nine months ended September 30,
|
||
2023
-----------------------------------------------------------------------------------
2022
_______________________________________________
_________
_______________________________________________


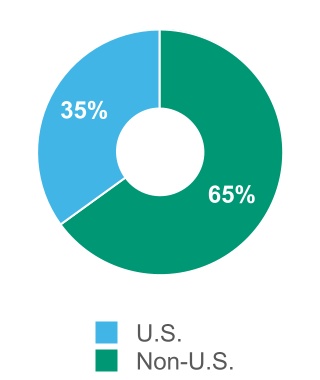
|
D&I: Global revenue ⇑ $52 million
|
U.S. Revenue ⇑ $19 million
|
Non-U.S. Revenue ⇑ $33 million
|
||||||
Global D&I revenue increased 10% compared to the first nine months of 2022 and reflects growth in both the U.S. (10%) and internationally (10%), mainly driven by:
–
continued strong retention and new sales for ratings feeds coupled with higher price realization; and
–
increased demand for company data.
The aforementioned factors also contributed to ARR
(2)
growth of 10% for D&I.
66
|
MA: YTD Operating and SG&A Expense ⇑ $152 million
|
||

The increase in operating and SG&A expenses compared to the first nine months of 2022 is due to growth in both compensation and non-compensation costs of $88 million and $64 million, respectively, reflecting:
| Compensation costs | Non-compensation costs | |||||||
| Notable drivers of expense growth: | Notable drivers of expense growth: | |||||||
|
— approximately 65% of the growth is related to an increase in salaries reflecting higher headcount and annual salary increases; and
|
— approximately 55% of the increase reflects higher costs to support strategic investments in technology, innovation and product development; and
|
|||||||
|
— approximately 30% of the increase reflects higher incentive and performance-based equity compensation aligned with actual/expected financial and operational performance as well as headcount growth.
|
||||||||
| — approximately 25% of the increase reflects higher travel and entertainment expenses correlated with business growth. | ||||||||
|
MA: Adjusted Operating Margin 30.2% ⇓ 70BPS
|
||
The slight Adjusted Operating Margin contraction for MA is primarily due to operating and SG&A expense growth of 12% outpacing the 10% increase in global MA revenue.
| Depreciation and amortization | ||
| Restructuring | ||
The restructuring charges in both periods relate to the Company's 2022 - 2023 Geolocation Restructuring Program as more fully discussed in Note 10 to the consolidated financial statements.
67
Moody’s Investors Service
The table below provides a summary of revenue and operating results, followed by further insight and commentary:
| Nine Months Ended September 30, |
% Change Favorable
(Unfavorable) |
||||||||||||||||
| 2023 | 2022 | ||||||||||||||||
| Revenue: | |||||||||||||||||
| Corporate finance (CFG) | $ | 1,067 | $ | 1,016 | 5 | % | |||||||||||
| Structured finance (SFG) | 303 | 368 | (18 | %) | |||||||||||||
| Financial institutions (FIG) | 413 | 368 | 12 | % | |||||||||||||
| Public, project and infrastructure finance (PPIF) | 371 | 337 | 10 | % | |||||||||||||
| Total ratings revenue | 2,154 | 2,089 | 3 | % | |||||||||||||
| MIS Other | 22 | 34 | (35 | %) | |||||||||||||
| Total external revenue | 2,176 | 2,123 | 2 | % | |||||||||||||
| Intersegment royalty | 138 | 129 | 7 | % | |||||||||||||
| Total | 2,314 | 2,252 | 3 | % | |||||||||||||
| Expenses: | |||||||||||||||||
| Operating and SG&A (external) | 1,024 | 1,033 | 1 | % | |||||||||||||
| Operating and SG&A (intersegment) | 10 | 5 | (100 | %) | |||||||||||||
| Total operating and SG&A expense | 1,034 | 1,038 | — | % | |||||||||||||
|
Adjusted Operating Income
|
$ | 1,280 | $ | 1,214 | 5 | % | |||||||||||
|
Adjusted Operating Margin
|
55.3 | % | 53.9 | % | |||||||||||||
| Depreciation and amortization | 56 | 60 | 7 | % | |||||||||||||
| Restructuring | 13 | 15 | 13 | % | |||||||||||||
The following chart presents changes in rated issuance volumes compared to the first nine months of
2022. To the extent that changes in rated issuance volumes had a material impact to MIS's revenue compared to the prior year, those impacts are discussed below.

68
MOODY'S INVESTORS SERVICE REVENUE
|
Nine months ended September 30,
|
||
2023
-----------------------------------------------------------------------------------
2022
_______________________________________________
_________
_______________________________________________

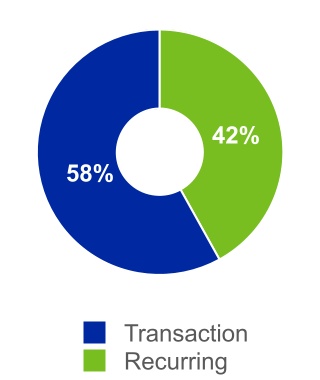
|
MIS: Global revenue ⇑ $53 million
|
U.S. Revenue ⇑ $28 million
|
Non-U.S. Revenue ⇑ $25 million
|
||||||
The modest increase in global MIS revenue reflects growth in CFG, FIG and PPIF revenue being mostly offset by declines in SFG activity across most asset classes.
CFG REVENUE
|
Nine months ended September 30,
|
||
2023
-----------------------------------------------------------------------------------
2022
_______________________________________________
_________
_______________________________________________
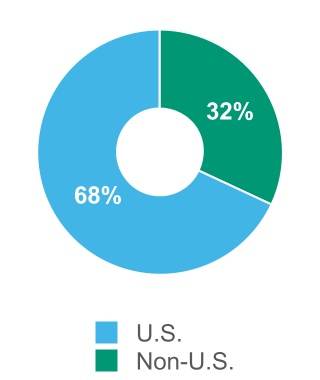
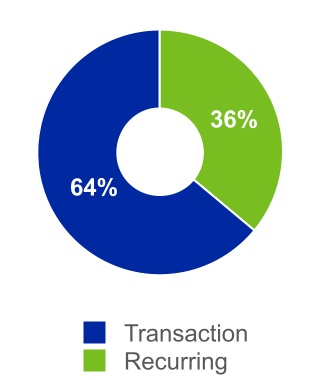
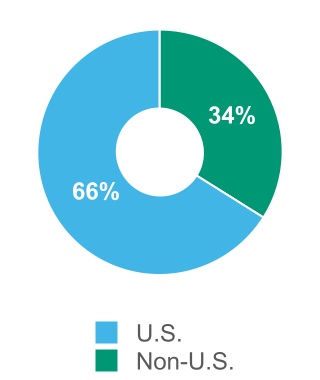
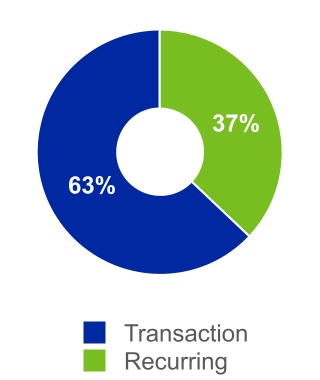
|
CFG: Global revenue ⇑ $51 million
|
U.S. Revenue ⇑ 54 million
|
Non-U.S. Revenue ⇓ $3 million
|
||||||
69
Global CFG revenue for the nine months ended September 30, 2023 and 2022 was comprised as follows
:
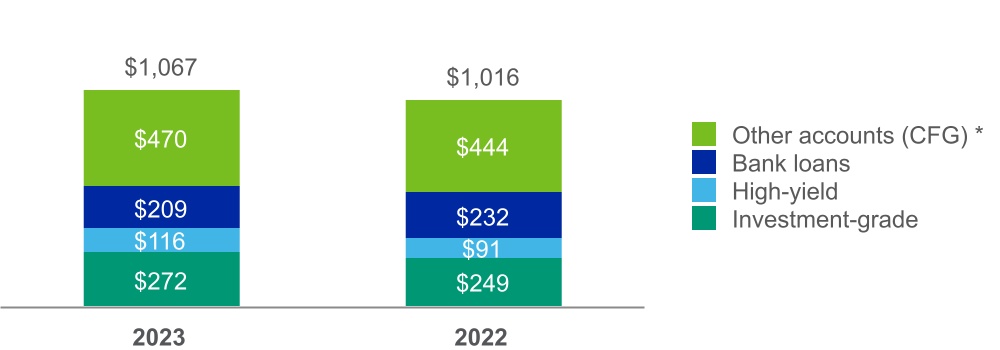
* Other includes: recurring monitoring fees of a rated debt obligation and/or entities that issue such obligations as well as fees from programs such as commercial paper, medium term notes, and ICRA corporate finance revenue.
The growth in CFG revenue reflected increases in the U.S (8%) partially offset by declines internationally of 1%.
Transaction revenue increased $37 million compared to the same period in the prior year, with the most notable drivers reflecting:
–
higher speculative and investment-grade rated issuance volumes reflecting both refinancing activity and issuance to fund certain large M&A transactions compared to suppressed issuance activity in these sectors in the prior year;
partially offset by:
–
lower bank loan revenue in the U.S. and EMEA as geopolitical and macroeconomic uncertainties have continued to impact leveraged loan issuance levels and general M&A activity.
SFG REVENUE
|
Nine months ended September 30,
|
||
2023
-----------------------------------------------------------------------------------
2022
_______________________________________________
_________
_______________________________________________
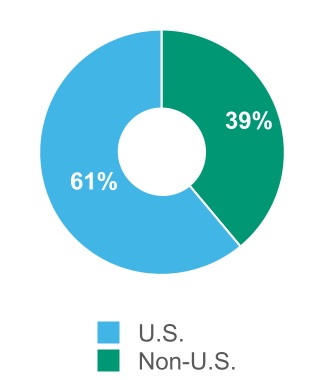


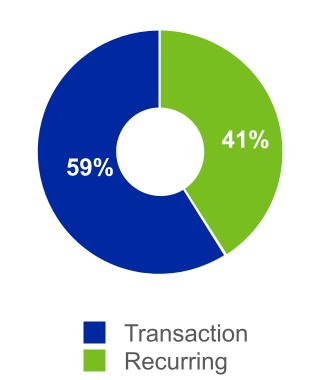
|
SFG: Global revenue ⇓ $65 million
|
U.S. Revenue ⇓ $63 million
|
Non-U.S. Revenue ⇓ $2 million
|
||||||
70
Global SFG revenue for the nine months ended September 30, 2023 and 2022 was comprised as follows:

The decrease in SFG revenue of 18% reflected declines in both the U.S. (25%) and internationally (2%). Transaction revenue decreased $75 million compared to the first nine months of 2022.
The decline in SFG revenue reflected lower securitization activity across almost all asset classes, most notably in CMBS, resulting from higher credit spreads and market volatility given ongoing geopolitical and macroeconomic uncertainties.
FIG REVENUE
|
Nine months ended September 30,
|
||
2023
-----------------------------------------------------------------------------------
2022
_______________________________________________
_________
_______________________________________________
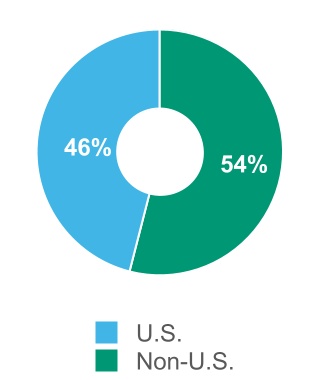
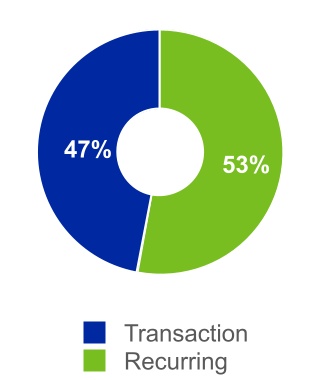
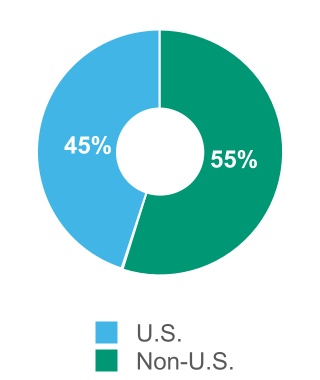
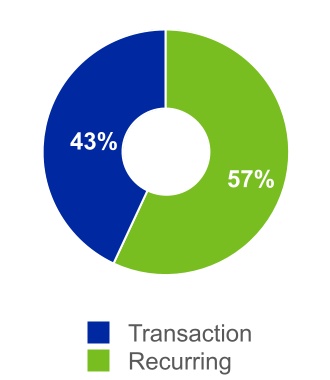
|
FIG: Global revenue ⇑ $45 million
|
U.S. Revenue ⇑ $23 million
|
Non-U.S. Revenue ⇑ $22 million
|
||||||
71
Global FIG revenue for the nine months ended September 30, 2023 and 2022 was comprised as follows:
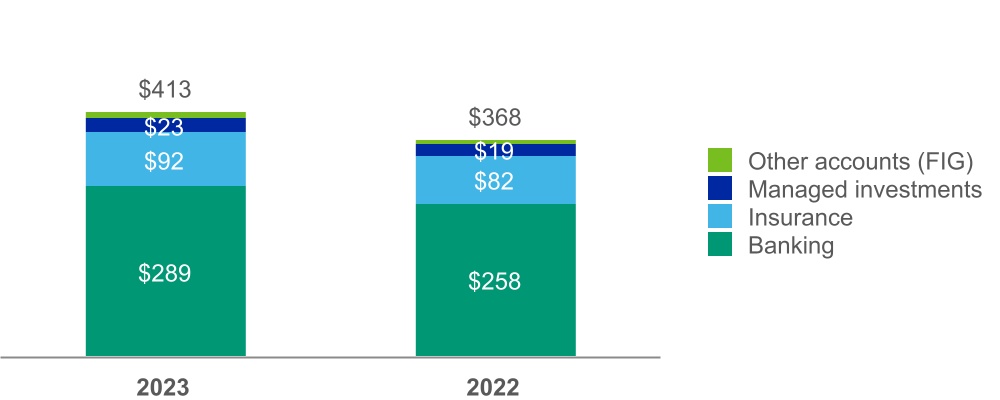
The increase in FIG revenue of 12% reflected growth in both the U.S. (14%) and internationally (11%) which resulted in a $36 million increase in transaction revenue compared to the same period in the prior year.
The most notable drivers of the increase reflected:
–
a favorable product mix from infrequent bank and insurance issuers; and
–
modestly higher rated issuance volumes in the insurance sector which included certain large deals in the sector for refinancing purposes.
PPIF REVENUE
|
Nine months ended September 30,
|
||
2023
-----------------------------------------------------------------------------------
2022
_______________________________________________
_________
_______________________________________________
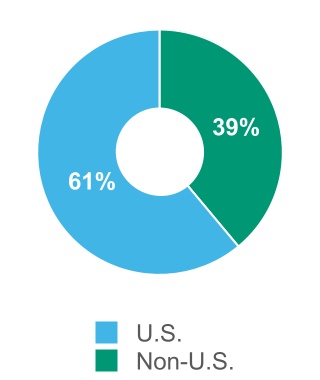


|
PPIF: Global revenue ⇑ $34 million
|
U.S. Revenue ⇑ $18 million
|
Non-U.S. Revenue ⇑ $16 million
|
||||||
72
Global PPIF revenue for the nine months ended September 30, 2023 and 2022 was comprised as follows:
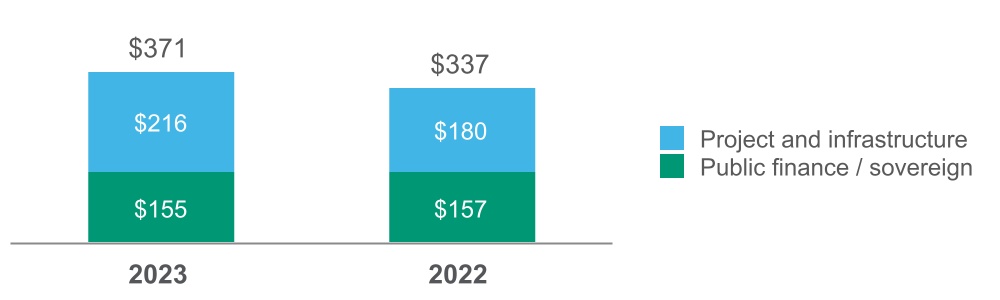
Transaction revenue increased $29 million compared to the same period in the prior year.
The 10% increase in PPIF revenue reflected increases in both the U.S. (9%) and internationally (13%).
The main driver of the growth reflected increases in investment-grade infrastructure finance activity in the U.S. and internationally.
|
MIS: YTD Operating and SG&A Expense ⇓ $9 million
|
||
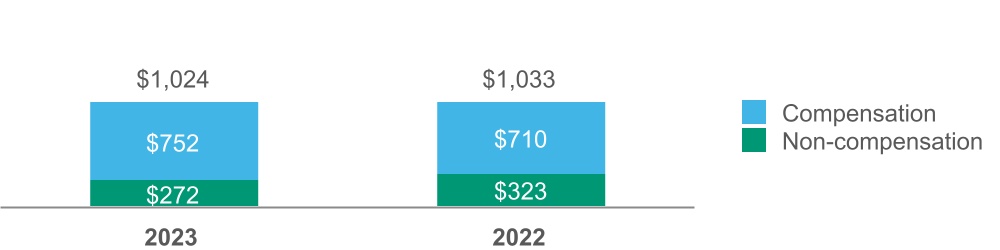
The decrease in operating and SG&A expense reflects a $51 million decrease in non-compensation expenses, partially offset by a $42 million increase in compensation costs. The most notable drivers of these changes are as follows:
| Compensation costs | Non-compensation costs | |||||||
|
Notable driver of expense growth:
|
Notable drivers of decline in expense: | |||||||
|
— higher incentive compensation accruals, which aligns with actual/projected financial and operating performance.
|
— approximately 70% of the decrease relates to ongoing cost control initiatives; and
|
|||||||
|
— higher bad debt expense in the prior year resulting from the impact of the Russia/Ukraine military conflict contributed approximately 30% of the decrease.
|
||||||||
| Other Expenses | ||
The restructuring charges in both periods relates to the Company's 2022 - 2023 Geolocation Restructuring Program as more fully discussed in Note 10 to the consolidated financial statements.
|
Adjusted Operating Margin of 55.3% ⇑ 140 BPS
|
||
The MIS Adjusted Operating Margin growth primarily reflected the aforementioned 2% increase in revenue coupled with ongoing disciplined cost management.
LIQUIDITY AND CAPITAL RESOURCES
Moody's remains committed to using its cash flow to create value for shareholders by both investing in the Company's employees and growing the business through targeted organic initiatives and inorganic acquisitions aligned with strategic priorities. Additional excess capital is returned to the Company’s shareholders via a combination of dividends and share repurchases.
Cash Flow
The Company is currently financing its operations, capital expenditures and share repurchases from operating and financing cash flows.
73
The following is a summary of the changes in the Company’s cash flows followed by a brief discussion of these changes:
| Nine Months Ended September 30, |
$ Change
Favorable (Unfavorable) |
||||||||||||||||
| 2023 | 2022 | ||||||||||||||||
| Net cash provided by operating activities | $ | 1,674 | $ | 1,097 | $ | 577 | |||||||||||
| Net cash used in investing activities | $ | (193) | $ | (172) | $ | (21) | |||||||||||
| Net cash used in financing activities | $ | (1,231) | $ | (957) | $ | (274) | |||||||||||
|
Free Cash Flow
(1)
|
$ | 1,476 | $ | 893 | $ | 583 | |||||||||||
(1)
Free Cash Flow is a non-GAAP measure and is defined by the Company as net cash provided by operating activities minus cash paid for capital expenditures. Refer to “Non-GAAP Financial Measures” of this MD&A for further information on this financial measure.
Net cash provided by operating activities
Net cash flows from operating activities in the nine months ended September 30, 2023 increased by $577 million compared to the same period in 2022, with the most notable drivers reflecting:
–
$181 million in higher income tax payments in the prior year;
–
approximately $140 million in higher incentive compensation payments in the first nine months of 2022 (based on full-year 2021 financial and operating results) compared to payments made in the current year (based on full-year 2022 financial and operating results); and
–
the remaining increase is primarily due to higher cash flows correlated with operating income growth and various changes in working capital.
Net cash used in investing activities
The $21 million increase in cash used in investing activities in the nine months ended September 30, 2023 compared to the same period in 2022 was primarily attributed to:
–
higher net cash receipts of $220 million in 2022 relating to the settlement of net investment hedges;
mostly offset by:
–
higher net purchases of investments in the prior year of $99 million, reflecting the purchase of Moody's equity interest in GCR in the prior year coupled with lower net purchases of investments in 2023; and
–
higher cash paid of $94 million in the prior year for acquisitions, primarily reflecting the acquisition of kompany in 2022.
Net cash used in financing activities
The $274 million increase in cash used in financing activities in the nine months ended September 30, 2023 compared to the same period in the prior year was primarily attributed to:
–
long-term debt issuance of $988 million in 2022 that did not recur in 2023 (refer to the section "Material Cash Requirements" below for further discussion on the Company's financing arrangements);
partially offset by:
–
higher cash paid for treasury share repurchases in 2022 of $705 million, which includes payment for shares made under an ASR agreement executed in the first quarter of 2022.
Cash and cash equivalents and short-term investments
The Company’s aggregate cash and cash equivalents and short-term investments of $2.1 billion at September 30, 2023 included approximately $1.5 billion located outside of the U.S. Approximately 35% of the Company’s aggregate cash and cash equivalents and short-term investments is denominated in euros and GBP. The Company manages both its U.S. and non-U.S. cash flow to maintain sufficient liquidity in all regions to effectively meet its operating needs.
As a result of the Tax Act, all previously net undistributed foreign earnings have now been subject to U.S. tax. The Company continues to evaluate which entities it will indefinitely reinvest earnings outside the U.S. The Company has provided deferred taxes for those entities whose earnings are not considered indefinitely reinvested. Accordingly, the Company continues to repatriate a portion of its non-U.S. cash in these subsidiaries and will continue to repatriate certain of its offshore cash in a manner that addresses compliance with local statutory requirements, sufficient offshore working capital and any other factors that may be relevant in certain jurisdictions. Notwithstanding the Tax Act, which generally eliminated federal income tax on future cash repatriation to the U.S., cash repatriation may be subject to state and local taxes or withholding or similar taxes.
74
Material Cash Requirements
The Company's material cash requirements consist of the following contractual and other obligations:
Financing Arrangements
Indebtedness
At September 30, 2023, Moody’s had $6.9 billion of outstanding debt and approximately $1 billion of additional capacity available under the Company’s CP Program, which is backstopped by the $1.25 billion 2021 Facility.
The repayment schedule for the Company’s borrowings outstanding at September 30, 2023 is as follows:
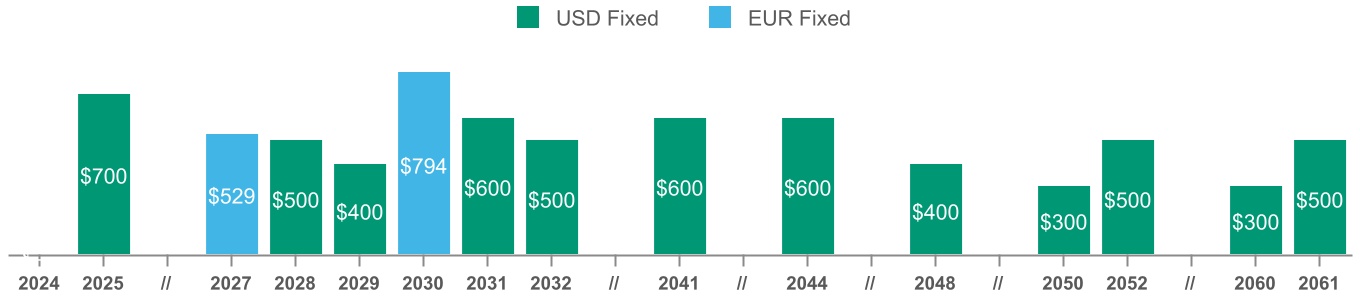
For additional information on the Company's outstanding debt, refer to Note 14 to the consolidated financial statements.
Future interest payments and fees associated with the Company's debt and credit facility are expected to be $4.9 billion, of which approximately $300 million is expected to be paid in each of the next five years, and the remaining amount expected to be paid thereafter.
Management may consider pursuing additional long-term financing when it is appropriate in light of cash requirements for operations, share repurchases and other strategic opportunities, which could result in higher financing costs.
Purchase Obligations
Purchase obligations generally include multi-year agreements with vendors to purchase goods or services and mainly include data center/cloud hosting fees and fees for information technology licensing and maintenance. As of September 30, 2023, these purchase obligations totaled $697 million, of which approximately 40% is expected to be paid in the next twelve months and another approximate 40% expected to be paid over the next two subsequent years.
Leases
The Company has remaining payments relating to its operating leases of $452 million at September 30, 2023, primarily related to real estate leases, of which $115 million in payments are expected over the next twelve months. For more information on the expected cash flows relating to the Company's operating leases, refer to Note 15 to the consolidated financial statements.
Pension and Other Retirement Plan Obligations
The Company does not anticipate making significant contributions to its funded pension plan in the next twelve months. This plan is overfunded at September 30, 2023, and accordingly holds sufficient investments to fund future benefit obligations. Payments for the Company's unfunded plans are not expected to be material in either the short or long-term.
Dividends and share repurchases
On October 23, 2023, the Board approved the declaration of a quarterly dividend of $0.77 per share for Moody’s common stock, payable December 15, 2023 to shareholders of record at the close of business on November 24, 2023. The continued payment of dividends at this rate, or at all, is subject to the discretion of the Board.
On February 7, 2022, the Board approved $750 million in share repurchase authority. At September 30, 2023, the Company had approximately $572 million of remaining authority. There is no established expiration date for the remaining authorization.
Restructuring
As more fully discussed in Note 10 to the consolidated financial statements, the Company is currently in the process of executing the 2022 - 2023 Geolocation Restructuring Program. This program relates to the Company's post-COVID-19 geolocation strategy and includes the rationalization and exit of certain real estate leases and a reduction in staff, including the relocation of certain job functions. Future cash outlays associated with this program, which will primarily consist of personnel-related costs, are expected to be approximately $40 million to $50 million, which are expected to be paid through 2024.
75
Sources of Funding to Satisfy Material Cash Requirements
The Company believes that it has the financial resources needed to meet its cash requirements and expects to have positive operating cash flow over the next twelve months. Cash requirements for periods beyond the next twelve months will depend, among other things, on the Company’s profitability and its ability to manage working capital requirements. The Company may also borrow from various sources as described above.
NON-GAAP FINANCIAL MEASURES
In addition to its reported results, Moody’s has included in this MD&A certain adjusted results that the SEC defines as “Non-GAAP financial measures.” Management believes that such adjusted financial measures, when read in conjunction with the Company’s reported results, can provide useful supplemental information for investors analyzing period-to-period comparisons of the Company’s performance, facilitate comparisons to competitors’ operating results and can provide greater transparency to investors of supplemental information used by management in its financial and operational decision-making. These adjusted measures, as defined by the Company, are not necessarily comparable to similarly defined measures of other companies. Furthermore, these adjusted measures should not be viewed in isolation or used as a substitute for other GAAP measures in assessing the operating performance or cash flows of the Company. Below are brief descriptions of the Company’s adjusted financial measures accompanied by a reconciliation of the adjusted measure to its most directly comparable GAAP measure:
Adjusted Operating Income and Adjusted Operating Margin
:
The Company presents Adjusted Operating Income and Adjusted Operating Margin because management deems these metrics to be useful measures to provide additional perspective on Moody's operating performance. Adjusted Operating Income excludes the impact of: i) depreciation and amortization; and ii) restructuring charges/adjustments. Depreciation and amortization are excluded because companies utilize productive assets of different estimated useful lives and use different methods of acquiring and depreciating productive assets. Restructuring charges/adjustments are excluded as the frequency and magnitude of these charges may vary widely across periods and companies.
Management believes that the exclusion of the aforementioned items, as detailed in the reconciliation below, allows for an additional perspective on the Company’s operating results from period to period and across companies. The Company defines Adjusted Operating Margin as Adjusted Operating Income divided by revenue.
|
Three Months Ended September 30,
|
Nine Months Ended September 30, | ||||||||||||||||||||||
| 2023 | 2022 | 2023 | 2022 | ||||||||||||||||||||
| Operating income | $ | 535 | $ | 413 | $ | 1,639 | $ | 1,577 | |||||||||||||||
| Adjustments: | |||||||||||||||||||||||
| Depreciation and amortization | 95 | 83 | 276 | 242 | |||||||||||||||||||
| Restructuring | 27 | 1 | 51 | 32 | |||||||||||||||||||
| Adjusted Operating Income | $ | 657 | $ | 497 | $ | 1,966 | $ | 1,851 | |||||||||||||||
| Operating margin | 36.3 | % | 32.4 | % | 36.9 | % | 37.7 | % | |||||||||||||||
| Adjusted Operating Margin | 44.6 | % | 39.0 | % | 44.3 | % | 44.3 | % | |||||||||||||||
Adjusted Net Income and Adjusted Diluted EPS attributable to Moody's common shareholders:
The Company presents Adjusted Net Income and Adjusted Diluted EPS because management deems these metrics to be useful measures to provide additional perspective on Moody’s operating performance. Adjusted Net Income and Adjusted Diluted EPS exclude the impact of: i) amortization of acquired intangible assets; ii) restructuring charges/adjustments; and iii) FX translation losses reclassified to earnings resulting from the Company no longer conducting commercial operations in Russia.
The Company excludes the impact of amortization of acquired intangible assets as companies utilize intangible assets with different estimated useful lives and have different methods of acquiring and amortizing intangible assets. These intangible assets were recorded as part of acquisition accounting and contribute to revenue generation. The amortization of intangible assets related to acquisitions will recur in future periods until such intangible assets have been fully amortized. Furthermore, the timing and magnitude of business combination transactions are not predictable and the purchase price allocated to amortizable intangible assets and the related amortization period are unique to each acquisition and can vary significantly from period to period and across companies. Restructuring charges/adjustments and FX translation losses resulting from the Company no longer conducting commercial operations in Russia are excluded as the frequency and magnitude of these items may vary widely across periods and companies.
The Company excludes the aforementioned items to provide additional perspective when comparing net income and diluted EPS from period to period and across companies as the frequency and magnitude of similar transactions may vary widely across periods.
76
|
Three Months Ended September 30,
|
Nine Months Ended September 30, | ||||||||||||||||||||||||||||||||||
|
Amounts in millions
|
2023 | 2022 | 2023 | 2022 | |||||||||||||||||||||||||||||||
| Net income attributable to Moody's common shareholders | $ | 389 | $ | 303 | $ | 1,267 | $ | 1,128 | |||||||||||||||||||||||||||
| Pre-Tax Acquisition-Related Intangible Amortization Expenses | $ | 49 | $ | 48 | $ | 150 | $ | 150 | |||||||||||||||||||||||||||
| Tax on Acquisition-Related Intangible Amortization Expenses | (12) | (11) | (36) | (35) | |||||||||||||||||||||||||||||||
| Net Acquisition-Related Intangible Amortization Expenses |
|
37 |
|
37 |
|
114 |
|
115 | |||||||||||||||||||||||||||
| Pre-Tax Restructuring | $ | 27 | $ | 1 | $ | 51 | $ | 32 | |||||||||||||||||||||||||||
| Tax on Restructuring | (6) | (1) | (12) | (8) | |||||||||||||||||||||||||||||||
| Net Restructuring | 21 | — | 39 | 24 | |||||||||||||||||||||||||||||||
|
FX losses resulting from the Company no longer conducting commercial operations in Russia
|
— | — | — | 20 | |||||||||||||||||||||||||||||||
| Adjusted Net Income |
|
$ | 447 |
|
$ | 340 |
|
$ | 1,420 |
|
$ | 1,287 | |||||||||||||||||||||||
|
Three Months Ended September 30,
|
Nine Months Ended September 30, | ||||||||||||||||||||||||||||||||||
| 2023 | 2022 | 2023 | 2022 | ||||||||||||||||||||||||||||||||
| Diluted earnings per share attributable to Moody's common shareholders | $ | 2.11 | $ | 1.65 | $ | 6.88 | $ | 6.10 | |||||||||||||||||||||||||||
| Pre-Tax Acquisition-Related Intangible Amortization Expenses | $ | 0.27 | $ | 0.26 | $ | 0.81 | $ | 0.81 | |||||||||||||||||||||||||||
| Tax on Acquisition-Related Intangible Amortization Expenses | (0.06) | (0.06) | (0.19) | (0.19) | |||||||||||||||||||||||||||||||
| Net Acquisition-Related Intangible Amortization Expenses | 0.21 | 0.20 | 0.62 | 0.62 | |||||||||||||||||||||||||||||||
| Pre-Tax Restructuring | $ | 0.15 | $ | 0.01 | $ | 0.28 | $ | 0.17 | |||||||||||||||||||||||||||
| Tax on Restructuring | (0.04) | (0.01) | (0.07) | (0.04) | |||||||||||||||||||||||||||||||
| Net Restructuring | 0.11 | — | 0.21 | 0.13 | |||||||||||||||||||||||||||||||
| FX losses resulting from the Company no longer conducting commercial operations in Russia | — | — | — | 0.11 | |||||||||||||||||||||||||||||||
| Adjusted Diluted EPS | $ | 2.43 | $ | 1.85 | $ | 7.71 | $ | 6.96 | |||||||||||||||||||||||||||
Note: the tax impacts in the table above were calculated using tax rates in effect in the jurisdiction for which the item relates.
Free Cash Flow
:
The Company defines Free Cash Flow as net cash provided by operating activities minus payments for capital additions. Management believes that Free Cash Flow is a useful metric in assessing the Company’s cash flows to service debt, pay dividends and to fund acquisitions and share repurchases. Management deems capital expenditures essential to the Company’s product and service innovations and maintenance of Moody’s operational capabilities. Accordingly, capital expenditures are deemed to be a recurring use of Moody’s cash flow. Below is a reconciliation of the Company’s net cash flows from operating activities to Free Cash Flow:
| Nine Months Ended September 30, | |||||||||||
| 2023 | 2022 | ||||||||||
| Net cash provided by operating activities | $ | 1,674 | $ | 1,097 | |||||||
| Capital additions | (198) | (204) | |||||||||
| Free Cash Flow | $ | 1,476 | $ | 893 | |||||||
| Net cash used in investing activities | $ | (193) | $ | (172) | |||||||
| Net cash used in financing activities | $ | (1,231) | $ | (957) | |||||||
77
Constant Currency Revenue Growth (Decline):
The Company presents constant currency revenue growth (decline) as its non-GAAP measure of revenue growth (decline). Management deems this measure to be useful in providing additional perspective in assessing the Company's revenue growth (decline) excluding the impacts of changes in foreign exchange rates. The Company calculates the dollar impact of foreign exchange as the difference between the translation of its current period non-USD functional currency results using comparative prior period weighted average foreign exchange translation rates and current year reported results.
Below is a reconciliation of the Company's reported revenue and growth (decline) rates to its constant currency revenue growth (decline) measures:
|
Three Months Ended September 30,
|
||||||||||||||||||||||||||
| Amounts in millions | 2023 | 2022 | Change | Growth | ||||||||||||||||||||||
| MA revenue | $ | 776 | $ | 685 | $ | 91 | 13% | |||||||||||||||||||
| FX impact | (17) | — | (17) | |||||||||||||||||||||||
| Constant currency MA revenue | $ | 759 | $ | 685 | $ | 74 | 11% | |||||||||||||||||||
| Decision Solutions revenue | $ | 354 | $ | 308 | $ | 46 | 15% | |||||||||||||||||||
| FX impact | (5) | — | (5) | |||||||||||||||||||||||
| Constant currency Decision Solutions revenue | $ | 349 | $ | 308 | $ | 41 | 13% | |||||||||||||||||||
| Data and Information revenue | $ | 200 | $ | 176 | $ | 24 | 14% | |||||||||||||||||||
| FX impact | (9) | — | (9) | |||||||||||||||||||||||
| Constant currency Data and Information revenue | $ | 191 | $ | 176 | $ | 15 | 9% | |||||||||||||||||||
| FIG revenue | $ | 126 | $ | 109 | $ | 17 | 16% | |||||||||||||||||||
| FX impact | (2) | — | (2) | |||||||||||||||||||||||
| Constant currency FIG revenue | $ | 124 | $ | 109 | $ | 15 | 14% | |||||||||||||||||||
78
Key Performance Metrics:
The Company presents Annualized Recurring Revenue (“ARR”) on a constant currency organic basis for its MA business as a supplemental performance metric to provide additional insight on the estimated value of MA's recurring revenue contracts at a given point in time. The Company uses ARR to manage and monitor performance of its MA operating segment and believes that this metric is a key indicator of the trajectory of MA's recurring revenue base.
The Company calculates ARR by taking the total recurring contract value for each active renewable contract as of the reporting date, divided by the number of days in the contract and multiplied by 365 days to create an annualized value. The Company defines renewable contracts as subscriptions, term licenses, maintenance and renewable services. ARR excludes transaction sales including training, one-time services and perpetual licenses. In order to compare period-over-period ARR excluding the effects of foreign currency translation, the Company bases the calculation on currency rates utilized in its current year operating budget and holds these FX rates constant for the duration of all current and prior periods being reported. Additionally, ARR excludes contracts related to acquisitions to provide additional perspective in assessing growth excluding the impacts from certain acquisition activity.
The Company’s definition of ARR may differ from definitions utilized by other companies reporting similarly named measures, and this metric should be viewed in addition to, and not as a substitute for, financial measures presented in accordance with U.S. GAAP.
| Amounts in millions | September 30, 2023 | September 30, 2022 | Change | Growth | |||||||||||||||||||
| MA ARR | |||||||||||||||||||||||
| Decision Solutions (DS) | |||||||||||||||||||||||
| Banking | $ | 397 | $ | 362 | $ | 35 | 10% | ||||||||||||||||
| Insurance | 511 | 475 | 36 | 8% | |||||||||||||||||||
| KYC | 308 | 260 | 48 | 18% | |||||||||||||||||||
| Total DS | $ | 1,216 | $ | 1,097 | $ | 119 | 11% | ||||||||||||||||
| Research and Insights | 853 | 787 | 66 | 8% | |||||||||||||||||||
| Data and Information | 782 | 711 | 71 | 10% | |||||||||||||||||||
| Total MA ARR | $ | 2,851 | $ | 2,595 | $ | 256 | 10% | ||||||||||||||||
RECENTLY ISSUED ACCOUNTING STANDARDS
Refer to Note 1 to the consolidated financial statements located in Part I of this Form 10-Q for a discussion on the impact to the Company relating to recently issued accounting pronouncements.
CONTINGENCIES
Legal proceedings in which the Company is involved also may impact Moody’s liquidity or operating results. No assurance can be provided as to the outcome of such proceedings. In addition, litigation inherently involves significant costs. For information regarding legal proceedings, see Item 1 - "Financial Statements," Note 16 "Contingencies” in this Form 10-Q.
79
FORWARD-LOOKING STATEMENTS
Certain statements contained in this quarterly report on Form 10-Q are forward-looking statements and are based on future expectations, plans and prospects for the Company's business and operations that involve a number of risks and uncertainties. Such statements involve estimates, projections, goals, forecasts, assumptions and uncertainties that could cause actual results or outcomes to differ materially from those contemplated, expressed, projected, anticipated or implied in the forward-looking statements. Those statements appear at various places throughout this quarterly report on Form 10-Q, including in the sections entitled “Contingencies” under Item 2, “MD&A,” commencing on page
43
of this quarterly report on Form 10-Q, under “Legal Proceedings” in Part II, Item 1, of this Form 10-Q, and elsewhere in the context of statements containing the words “believe,” “expect,” “anticipate,” “intend,” “plan,” “will,” “predict,” “potential,” “continue,” “strategy,” “aspire,” “target,” “forecast,” “project,” “estimate,” “should,” “could,” “may,” and similar expressions or words and variations thereof relating to the Company’s views on future events, trends and contingencies or otherwise convey the prospective nature of events or outcomes generally indicative of forward-looking statements. Stockholders and investors are cautioned not to place undue reliance on these forward-looking statements. The forward-looking statements and other information in this document are made as of the date of this quarterly report on Form 10-Q, and the Company undertakes no obligation (nor does it intend) to publicly supplement, update or revise such statements on a going-forward basis, whether as a result of subsequent developments, changed expectations or otherwise, except as required by applicable law or regulation. In connection with the “safe harbor” provisions of the Private Securities Litigation Reform Act of 1995, the Company is identifying certain factors that could cause actual results to differ, perhaps materially, from those indicated by these forward-looking statements.
Those factors, risks and uncertainties include, but are not limited to:
•
the impact of current economic conditions, including capital market disruptions, inflation and related monetary policy actions by governments in response to inflation, on worldwide credit markets and on economic activity, including on the volume of mergers and acquisitions, and their effects on the volume of debt and other securities issued in domestic and/or global capital markets;
•
the uncertain effectiveness and possible collateral consequences of U.S. and foreign government initiatives and monetary policy to respond to the current economic climate, including instability of financial institutions, credit quality concerns, and other potential impacts of volatility in financial and credit markets;
•
the global impacts of the Russia-Ukraine military conflict and the military conflict in Israel and the surrounding areas on volatility in world financial markets, on general economic conditions and GDP in the U.S. and worldwide, on global relations and on the Company's own operations and personnel;
•
other matters that could affect the volume of debt and other securities issued in domestic and/or global capital markets, including regulation, increased utilization of technologies that have the potential to intensify competition and accelerate disruption and disintermediation in the financial services industry, as well as the number of issuances of securities without ratings or securities which are rated or evaluated by non-traditional parties;
•
the level of merger and acquisition activity in the U.S. and abroad;
•
the uncertain effectiveness and possible collateral consequences of U.S. and foreign government actions affecting credit markets, international trade and economic policy, including those related to tariffs, tax agreements and trade barriers;
•
the impact of MIS’s withdrawal of its credit ratings on countries or entities within countries and of Moody’s no longer conducting commercial operations in countries where political instability warrants such actions;
•
concerns in the marketplace affecting our credibility or otherwise affecting market perceptions of the integrity or utility of independent credit agency ratings;
•
the introduction or development of competing and/or emerging technologies and products;
•
pricing pressure from competitors and/or customers;
•
the level of success of new product development and global expansion;
•
the impact of regulation as an NRSRO, the potential for new U.S., state and local legislation and regulations;
•
the potential for increased competition and regulation in the EU and other foreign jurisdictions;
•
exposure to litigation related to our rating opinions, as well as any other litigation, government and regulatory proceedings, investigations and inquiries to which Moody’s may be subject from time to time;
•
provisions in U.S. legislation modifying the pleading standards and EU regulations modifying the liability standards, applicable to credit rating agencies in a manner adverse to credit rating agencies;
•
provisions of EU regulations imposing additional procedural and substantive requirements on the pricing of services and the expansion of supervisory remit to include non-EU ratings used for regulatory purposes;
•
uncertainty regarding the future relationship between the U.S. and China;
•
the possible loss of key employees and the impact of the global labor environment;
80
•
failures or malfunctions of our operations and infrastructure;
•
any vulnerabilities to cyber threats or other cybersecurity concerns;
•
the timing and effectiveness of our restructuring programs, such as the 2022 - 2023 Geolocation Restructuring Program;
•
currency and foreign exchange volatility;
•
the outcome of any review by controlling tax authorities of Moody’s global tax planning initiatives;
•
exposure to potential criminal sanctions or civil remedies if Moody’s fails to comply with foreign and U.S. laws and regulations that are applicable in the jurisdictions in which Moody’s operates, including data protection and privacy laws, sanctions laws, anti-corruption laws, and local laws prohibiting corrupt payments to government officials;
•
the impact of mergers, acquisitions, such as our acquisition of RMS, or other business combinations and the ability of Moody’s to successfully integrate acquired businesses;
•
the level of future cash flows;
•
the levels of capital investments; and
•
a decline in the demand for risk management tools by financial institutions.
These factors, risks and uncertainties as well as other risks and uncertainties that could cause Moody’s actual results to differ materially from those contemplated, expressed, projected, anticipated or implied in the forward-looking statements are described in greater detail under “Risk Factors” in Part I, Item 1A of Moody’s annual report on Form 10-K for the year ended December 31, 2022, and in other filings made by the Company from time to time with the SEC or in materials incorporated herein or therein. Stockholders and investors are cautioned that the occurrence of any of these factors, risks and uncertainties may cause the Company’s actual results to differ materially from those contemplated, expressed, projected, anticipated or implied in the forward-looking statements, which could have a material and adverse effect on the Company’s business, results of operations and financial condition. New factors may emerge from time to time, and it is not possible for the Company to predict new factors, nor can the Company assess the potential effect of any new factors on it. Forward-looking and other statements in this document may also address our corporate responsibility progress, plans, and goals (including sustainability and environmental matters), and the inclusion of such statements is not an indication that these contents are necessarily material to investors or required to be disclosed in the Company’s filings with the Securities and Exchange Commission. In addition, historical, current, and forward-looking sustainability-related statements may be based on standards for measuring progress that are still developing, internal controls and processes that continue to evolve, and assumptions that are subject to change in the future.
Item 3. Quantitative and Qualitative Disclosures About Market Risk
There have been no material changes to the Company's market risk during the nine months ended September 30, 2023. For a discussion of the Company’s exposure to market risk, refer to the Company’s market risk disclosures set forth in Part II, Item 7A, “Quantitative and Qualitative Disclosures About Market Risk” of our Form 10-K for the year ended December 31, 2022.
Item 4. Controls and Procedures
Evaluation of Disclosure Controls and Procedures: The Company carried out an evaluation, as required by Rule 13a-15(b) under the Exchange Act, under the supervision and with the participation of the Company’s management, including the Company’s Chief Executive Officer and Interim Chief Financial Officer, of the effectiveness of the design and operation of the Company’s disclosure controls and procedures, as defined in Rule 13a-15(e) of the Exchange Act, as of the end of the period covered by this report (the “Evaluation Date”). Based on such evaluation, such officers have concluded that, as of the Evaluation Date, the Company’s disclosure controls and procedures were effective to provide reasonable assurance that information required to be disclosed by the Company in reports that it files or submits under the Exchange Act is recorded, processed, summarized and reported within the time periods specified in the communication to the Company’s management, including the Company’s Chief Executive Officer and Interim Chief Financial Officer, as appropriate to allow timely decisions regarding required disclosure.
The Company’s management, including the Company’s Chief Executive Officer and Interim Chief Financial Officer, has determined that there were no changes in the Company’s internal control over financial reporting that have materially affected, or are reasonably likely to materially affect, these internal controls over financial reporting during the three-month period ended September 30, 2023.
The Company's disclosure controls and procedures are designed to provide reasonable assurance of achieving the objectives as specified above. The Company's management does not expect, however, that these disclosure controls and procedures will prevent or detect all instances of error or fraud. Any control system, regardless of how well designed and operated, is based upon certain assumptions and can provide only reasonable, not absolute, assurance that its objectives will be met. Further, no evaluation of controls can provide absolute assurance that misstatements due to error or fraud will not occur, or that all control issues and instances of fraud, if any, within the Company have been detected.
81
PART II. OTHER INFORMATION
Item 1. Legal Proceedings
For information regarding legal proceedings, see Item 1 – “Financial Statements – Notes to Consolidated Financial Statements (Unaudited),” Note 16 “Contingencies” in this Form 10-Q.
Item 1A. Risk Factors
There have been no material changes from the significant risk factors and uncertainties previously disclosed under the heading "Risk Factors" in the Company's annual report on Form 10-K for the year ended December 31, 2022, that if they were to occur, could materially adversely affect the Company’s business, financial condition, operating results and/or cash flow. For a discussion of the Company’s risk factors, refer to Item 1A. “Risk Factors” contained in the Company’s annual report on Form 10-K for the year ended December 31, 2022.
Item 2. Unregistered Sales of Equity Securities and Use of Proceeds
MOODY'S PURCHASES OF EQUITY SECURITIES
For the three months ended September 30, 2023
| Period |
Total Number of Shares Purchased
(1)
|
Average Price Paid per Share |
Total Number of Shares Purchased as Part of Publicly Announced Program |
Approximate Dollar Value of Shares That May Yet be Purchased Under the Program
(2)
|
||||||||||||||||||||||
| July 1- 31 | 66,773 | $ | 350.47 | 60,350 | $ | 719 | million | |||||||||||||||||||
| August 1- 31 | 212,773 | $ | 335.32 | 212,569 | $ | 648 | million | |||||||||||||||||||
| September 1- 30 | 227,997 | $ | 336.01 | 227,390 | $ | 572 | million | |||||||||||||||||||
| Total | 507,543 | $ | 337.46 | 500,309 | ||||||||||||||||||||||
(1)
Includes surrender to the Company of 6,423; 204; and 607 shares of common stock in July, August, and September, respectively, to satisfy tax withholding obligations in connection with the vesting of restricted stock issued to employees.
(2)
As of the last day of each of the months. On February 7, 2022, the Board of Directors authorized $750 million in share repurchase authority. At September 30, 2023 there was approximately $572 million of share repurchase authority remaining. There is no established expiration date for the remaining authorization.
During the third quarter of 2023, Moody’s issued a net 100,000 shares under employee stock-based compensation plans.
Item 5. Other Information
Not applicable.
82
Item 6. Exhibits
|
Exhibit No
|
Description
|
|||||||
| 3 |
ARTICLES OF INCORPORATION AND BY-LAWS
|
|||||||
| .1 | ||||||||
| .2 | ||||||||
| 31 |
CERTIFICATIONS PURSUANT TO SECTION 302 OF THE SARBANES-OXLEY ACT OF 2002
|
|||||||
| .1* | ||||||||
| .2* | ||||||||
| 32 |
CERTIFICATIONS PURSUANT TO SECTION 906 OF THE SARBANES-OXLEY ACT OF 2002
|
|||||||
| .1* | ||||||||
| .2* | ||||||||
| 101.INS* | Inline XBRL Instance Document (the instance document does not appear in the Interactive Data File because its XBRL tags are embedded within the Inline XBRL document) | |||||||
| 101.SCH* | Inline XBRL Taxonomy Extension Schema Document | |||||||
| 101.CAL* | Inline XBRL Taxonomy Extension Calculation Linkbase Document | |||||||
| 101.DEF* | Inline XBRL Definitions Linkbase Document | |||||||
| 101.LAB* | Inline XBRL Taxonomy Extension Labels Linkbase Document | |||||||
| 101.PRE* | Inline XBRL Taxonomy Extension Presentation Linkbase Document | |||||||
| 104* | Cover Page Interactive Data File (formatted as inline XBRL and contained in Exhibit 101) | |||||||
| * Filed herewith | ||||||||
83
SIGNATURES
Pursuant to the requirements of the Securities Exchange Act of 1934, the registrant has duly caused this report to be signed on its behalf by the undersigned thereunto duly authorized.
| MOODY’S CORPORATION | ||||||||
| By: | / S / CAROLINE SULLIVAN | |||||||
| Caroline Sullivan | ||||||||
|
Interim Chief Financial Officer, Chief Accounting Officer and Corporate Controller
|
||||||||
|
(principal financial and accounting officer)
|
||||||||
| Date: October 26, 2023 | ||||||||
84
TABLE OF CONTENTS
Part I. Financial InformationItem 1. Financial StatementsNote 1. Description Of Business and Basis Of PresentationNote 2. RevenuesNote 3. Stock-based CompensationNote 4. Income TaxesNote 5. Reconciliation Of Weighted Average Shares OutstandingNote 6. Accelerated Share Repurchase ProgramNote 7. Cash Equivalents and InvestmentsNote 8. Derivative Instruments and Hedging ActivitiesNote 9. Goodwill and Other Acquired Intangible AssetsNote 10. RestructuringNote 11. Fair ValueNote 12. Other Balance Sheet and Statements Of Operations InformationNote 13. Comprehensive Income and Accumulated Other Comprehensive LossNote 14. IndebtednessNote 15. LeasesNote 16. ContingenciesNote 17. Segment InformationNote 18. Subsequent EventItem 2. Management's Discussion and Analysis Of Financial Condition and Results Of OperationsItem 3. Quantitative and Qualitative Disclosures About Market RiskItem 4. Controls and ProceduresPart II. Other InformationItem 1. Legal ProceedingsItem 1A. Risk FactorsItem 2. Unregistered Sales Of Equity Securities and Use Of ProceedsItem 5. Other InformationItem 6. Exhibits