MEDTRONIC PLC
10-Ks and 10-Qs
|
|
|
|
|
|
|
|
|
|
|
|
|
|
|
|
|
|
|
|
|
|
|
|
|
|
|
|
|
|
|
|
|
|
|
|
|
|
|
|
|
UNITED STATES
SECURITIES AND EXCHANGE COMMISSION
Washington, D.C. 20549
FORM 10-K
|
x
|
Annual report pursuant to section 13 or 15(d) of the Securities Exchange Act of 1934.
For the fiscal year ended April 29, 2016.
|
|
|
|
|
o
|
Transition report pursuant to Section 13 or 15(d) of the Securities Exchange Act of 1934.
For the transition period from __________ to __________
|
Commission File No. 1-36820

MEDTRONIC PUBLIC LIMITED COMPANY
(Exact name of registrant as specified in its charter)
|
Ireland
|
|
98-1183488
|
|
(Jurisdiction of incorporation)
|
|
(I.R.S. Employer Identification No.)
|
20 On Hatch, Lower Hatch Street
Dublin 2, Ireland
(Address of principal executive office)
+353 1 438-1700
(Registrant's telephone number)
Securities registered pursuant to Section 12(b) of the Act:
|
Title of each class
|
Name of each exchange on which registered
|
|
Ordinary shares, par value $0.0001 per share
|
New York Stock Exchange, Inc.
|
Securities registered pursuant to section 12(g) of the Act:
None
Indicate by check mark if the registrant is a well-known seasoned issuer, as defined in Rule 405 of the Securities Act. Yes
x
No
o
Indicate by check mark if the registrant is not required to file reports pursuant to Section 13 or 15(d) of the Exchange Act. Yes
o
No
x
Indicate by check mark whether the registrant (1) has filed all reports required to be filed by Section 13 or 15(d) of the Securities Exchange Act of 1934 during the preceding 12 months (or for such shorter period that the registrant was required to file such reports), and (2) has been subject to such filing requirements for the past 90 days. Yes
x
No
o
Indicate by check mark whether the registrant has submitted electronically and posted on its corporate Website, if any, every Interactive Data File required to be submitted and posted pursuant to Rule 405 of Regulation S-T (§229.405 of this chapter) during the preceding 12 months (or for such shorter period that the registrant was required to submit and post such files). Yes
x
No
o
Indicate by check mark if disclosure of delinquent filers pursuant to Item 405 of Regulation S-K is not contained herein, and will not be contained, to the best of the registrant’s knowledge, in definitive proxy or information statements incorporated by reference in Part III of this Form 10-K or any amendment to this Form 10-K.
o
Indicate by check mark whether the registrant is a large accelerated filer, an accelerated filer, a non-accelerated filer, or a smaller reporting company. See definition of “large accelerated filer,” “accelerated filer” and “smaller reporting company” in Rule 12b-2 of the Exchange Act.
Large accelerated filer
x
Accelerated filer
o
Non-accelerated filer
o
Smaller reporting company
o
Indicate by check mark whether the registrant is a shell company (as defined in Rule 12b-2 of the Exchange Act). Yes
o
No
x
Aggregate market value of voting and non-voting common equity of Medtronic PLC held by non-affiliates of the registrant as of October 30, 2015, based on the closing price of $73.92, as reported on the New York Stock Exchange: approximately $104.2 billion. Number of Ordinary Shares outstanding on June 20, 2016: 1,394,731,892
DOCUMENTS INCORPORATED BY REFERENCE
Portions of Registrant’s Proxy Statement for its
2016
Annual General Meeting are incorporated by reference into Part III hereto.
TABLE OF CONTENTS
|
Item
|
|
Description
|
|
Page
|
|
|
|
|
|
|
|
|
|
|
|
|
|
|
|
|||
|
|
|
|||
|
|
|
|||
|
|
|
|||
|
|
|
|||
|
|
|
|||
|
|
|
|
|
|
|
|
|
|||
|
|
|
|||
|
|
|
|||
|
|
|
|||
|
|
|
|||
|
|
|
|||
|
|
|
|||
|
|
|
|||
|
|
|
|
|
|
|
|
|
|||
|
|
|
|||
|
|
|
|||
|
|
|
|||
|
|
|
|||
|
|
|
|
|
|
|
|
|
|||
Investor Information
Annual Meeting and Record Dates
Medtronic Public Limited Company, organized under the laws of Ireland (Medtronic plc, Medtronic, the Company, or we, us, or our) will hold its 2016 Annual General Meeting of Shareholders (2016 Annual Meeting) on Friday, December 9, 2016 at 8:00 a.m., local Dublin time at the Conrad Dublin Hotel Earlsfort Terrace Dublin 2, Ireland. The record date for the 2016 Annual Meeting is October 11, 2016 and all shareholders of record at the close of business on that day will be entitled to vote at the 2016 Annual Meeting.
Medtronic Website
Our Annual Reports on Form 10-K, Quarterly Reports on Form 10-Q, Current Reports on Form 8-K, and amendments to those reports filed or furnished pursuant to Section 13(a) or 15(d) of the Securities Exchange Act of 1934, as amended (Exchange Act) are available through our website (
www.medtronic.com
under the "About Medtronic - Investors" caption and “Financial Information - SEC Filings” subcaption) free of charge as soon as reasonably practicable after we electronically file such material with, or furnish it to, the Securities and Exchange Commission (SEC).
Information relating to corporate governance at Medtronic, including our Principles of Corporate Governance, Code of Conduct (including our Code of Ethics for Senior Financial Officers), Code of Business Conduct and Ethics for Members of the Board of Directors, and information concerning our executive officers, directors and Board committees (including committee charters) is available through our website at
www.medtronic.com
under the "About Medtronic - Corporate Governance” caption. Information relating to transactions in Medtronic securities by directors and officers is available through our website at
www.medtronic.com
under the "About Medtronic - Investors" caption and the "Financial Information - SEC Filings" subcaption.
The information listed above may also be obtained upon request from the Medtronic Investor Relations Department, 710 Medtronic Parkway, Minneapolis (Fridley), MN 55432 USA.
We are not including the information on our website as a part of, or incorporating it by reference into, our Form 10-K.
Available Information
The SEC maintains a website that contains reports, proxy and information statements, and other information regarding issuers, including the Company, that file electronically with the SEC. The public can obtain any documents that the Company files with the SEC at
http://www.sec.gov
. The Company files annual reports, quarterly reports, proxy statements, and other documents with the SEC under the Exchange Act. The public may read and copy any materials that the Company files with the SEC at the SEC’s Public Reference Room at 100 F Street, N.E., Room 1580, Washington, D.C. 20549. The public may obtain information on the operation of the Public Reference Room by calling the SEC at 800-SEC-0330.
Stock Transfer Agent and Registrar
Wells Fargo Shareowner Services
SM
acts as transfer agent and registrar, dividend paying agent, and direct stock purchase plan agent for Medtronic and maintains all shareholder records for the Company. If you are a registered shareholder, you may access your account information online at
www.shareowneronline.com
. If you have questions regarding the Medtronic stock you own, stock transfers, address or name changes, direct deposit of dividends, lost dividend checks, lost stock certificates, or duplicate mailings, please contact Wells Fargo Shareowner Services
SM
by writing or calling: Wells Fargo Shareowner Services
SM
, 1110 Centre Pointe Curve, Suite 101, Mendota Heights, MN 55120 USA, Telephone: 888-648-8154 or 651-450-4064, Fax: 651-450-4033,
www.wellsfargo.com/shareownerservices
.
Direct Stock Purchase Plan
Medtronic’s transfer agent, Wells Fargo Bank N.A, administers the direct stock purchase plan, which is called the Shareowner Service Plus Plan
SM
. Features of this plan include direct stock purchase and reinvestment of dividends to purchase whole or fractional shares of Medtronic stock. All registered shareholders and potential investors may participate.
To request information on the Shareowner Service Plus Plan
SM
, or to enroll in the plan, contact Wells Fargo Shareowner Services
SM
at 888-648-8154 or 651-450-4064. You may also enroll via the Internet by visiting
www.shareowneronline.com
and selecting “Direct Purchase Plan.”
OVERVIEW
Medtronic plc, headquartered in Dublin, Ireland, is among the world's largest medical technology, services and solutions companies - alleviating pain, restoring health, and extending life for millions of people around the world. Medtronic was founded in 1949 and today serves hospitals, physicians, clinicians, and patients in approximately
160
countries worldwide. We remain committed to a mission written by our founder 56 years ago that directs us “to contribute to human welfare by the application of biomedical engineering in the research, design, manufacture, and sale of products to alleviate pain, restore health, and extend life.”
With innovation and market leadership, we have pioneered advances in medical technology in all of our businesses. Our commitment to enhance our offerings by developing and acquiring new products, wrap-around programs, and solutions to meet the needs of a broader set of stakeholders is driven by the following primary strategies:
|
•
|
Therapy Innovation: Delivering a strong launch cadence of meaningful therapies and procedures.
|
|
•
|
Globalization: Addressing the inequity in health care access globally, primarily in emerging markets.
|
|
•
|
Economic Value: Becoming a leader in value-based health care by offering new services and solutions to improve outcomes and efficiencies, lower costs by reducing hospitalizations, improve remote clinical management, and increase patient engagement.
|
Our primary customers include hospitals, clinics, third-party health care providers, distributors, and other institutions, including governmental health care programs and group purchasing organizations (GPOs).
On January 26, 2015 (Acquisition Date), Medtronic completed the acquisition of Covidien plc, a public limited company organized under the laws of Ireland (Covidien) in a cash and stock transaction valued at $50.0 billion. In connection with the transaction, Medtronic, Inc., a Minnesota corporation (Medtronic, Inc.), and Covidien were combined under and became subsidiaries of Medtronic plc. Covidien was a global leader in the development, manufacture and sale of healthcare products for use in clinical and home settings and had net sales for its fiscal year ended September 26, 2014 of $10.7 billion. On a pro forma basis, as if the Covidien merger had occurred at the beginning of fiscal year 2014, our combined net sales would have been
$28.4 billion
for fiscal year 2015 and
$27.4 billion
for fiscal year 2014; see Note 2 to the consolidated financial statements in “Item 8. Financial Statements and Supplementary Data” in this Annual Report on Form 10-K. The merger with Covidien provides the combined company with increased financial strength and flexibility and is expected to meaningfully accelerate all three strategies discussed above.
We reorganized our reporting structure and aligned our segments and the underlying divisions and businesses in fiscal year 2015 due to the acquisition of Covidien. The majority of Covidien’s operations are included in our new Minimally Invasive Therapies Group. For more information on our segments, please see Note 17 to the consolidated financial statements in “Item 8. Financial Statements and Supplementary Data” in this Annual Report on Form 10-K.
We currently function in four operating segments that primarily manufacture and sell device-based medical therapies. Our operating segments with each of their reported net sales for fiscal year 2016, along with their related divisions, are as follows:
Cardiac and Vascular Group
(Fiscal year 2016 net sales of $10.2 billion)
|
•
|
Cardiac Rhythm & Heart Failure
|
|
•
|
Coronary & Structural Heart
|
|
•
|
Aortic & Peripheral Vascular
|
Minimally Invasive Therapies Group
(Fiscal year 2016 net sales of $9.6 billion)
|
•
|
Surgical Solutions
|
|
•
|
Patient Monitoring & Recovery
|
Restorative Therapies Group
(Fiscal year 2016 net sales of $7.2 billion)
|
•
|
Spine
|
|
•
|
Neuromodulation
|
|
•
|
Surgical Technologies
|
|
•
|
Neurovascular
|
1
Diabetes Group
(Fiscal year 2016 net sales of $1.9 billion)
|
•
|
Intensive Insulin Management
|
|
•
|
Non-Intensive Diabetes Therapies
|
|
•
|
Diabetes Service & Solutions
|
CARDIAC AND VASCULAR GROUP
Cardiac Rhythm & Heart Failure Disease Management (CRHF)
Our CRHF division develops, manufactures, and markets products for the diagnosis, treatment, and management of heart rhythm disorders and heart failure. Our products include implantable devices, leads and delivery systems, products for the treatment of atrial fibrillation (AF), products designed to reduce surgical site infections, information systems for the management of patients with CRHF devices, and an integrated health solutions business.
The following are the principal products and services offered by our CRHF division:
Implantable Cardiac Pacemakers (Pacemakers)
Our latest generations of pacemaker systems are the Advisa MRI SureScan models, the Micra Transcatheter Pacing System, and the Ensura MRI SureScan model. The Micra Transcatheter Pacing System, which is leadless and does not have a subcutaneous device pocket like conventional pacemaker, and the Advisa MRI SureScan models have received United States (U.S.) Food and Drug Administration (U.S. FDA) approval and Conformité Européene (CE) Mark approval, while the Ensura MRI SureScan models have received CE Mark approval.
Implantable Cardioverter Defibrillators (ICDs)
Our latest generation ICD is the Evera MRI SureScan, the first ICD system with CE Mark, PMDA (Japan), and U.S. FDA, approval for full-body MRI scans for both 1.5T and 3T scanners. The Evera system is paired with the reliable Sprint Quattro Secure lead, the only defibrillator lead with more than 11 years of proven performance with active monitoring.
Implantable Cardiac Resynchronization Therapy Devices (CRT-Ds and CRT-Ps)
Our latest generation of CRT-Ds is the Amplia/Compia/Claria family of MRI Quad CRT-D SureScan systems. The U.S. FDA and CE Mark approved Amplia and Compia MRI Quad CRT-D SureScan systems are approved for MRI scans on any part of the body. In addition, the Viva/Brava family with Attain Performa quadripolar features a new algorithm, called AdaptivCRT, which improves heart failure patients' response rate to CRT-D therapy. Viva CRT-P is our latest generation device, with respect to CRT-P.
AF Products
Our portfolio of AF products includes the Arctic Front Advance Cardiac Cryoballoon System, which includes the U.S. FDA approved Aortic Front Advance ST Cryoablation Catheter, designed for pulmonary vein isolation in the treatment of patients with drug refractory paroxysmal AF. Additionally, we have a second-generation CE Mark approved Phased RF System, PVAC Gold, which uses duty cycled, phased radio frequency energy for the treatment of symptomatic paroxysmal persistent and long-standing persistent AF.
Diagnostics and Monitoring Devices
Our Reveal LINQ is our newest Insertable Cardiac Monitor (ICM) System. The system is used to record the heart’s electrical activity before, during, and after transient symptoms such as syncope (i.e., fainting) and palpitations to assist in diagnosis.
TYRX Products
Our TYRX products include the Absorbable Antibacterial Envelope and the TYRX Neuro Absorbable Antibacterial Envelope, which are designed to stabilize electronic implantable devices and help prevent infection associated with implantable pacemakers, defibrillators, and spinal cord neurostimulators.
Services and Solutions
Our Care Management Services products and services include remote monitoring and patient-centered software to enable efficient care coordination and specialized telehealth nurse support. Our Cath Lab Managed Services business is focused on developing novel partnerships with hospitals to provide services directly related to hospital operational efficiency.
Coronary & Structural Heart Disease Management (CSH)
Our CSH division includes therapies to treat coronary artery disease (CAD), and heart valve disorders. Our products include coronary stents and related delivery systems, including a broad line of balloon angioplasty catheters, guide catheters, guide wires, diagnostic catheters, and accessories as well as products for the repair and replacement of heart valves, perfusion systems, positioning and stabilization systems for beating heart revascularization surgery, and surgical ablation products.
The following are the principal products offered by our CSH division:
Transcatheter Heart Valves (TCVs)
Our latest generation TCVs include the CoreValve family of aortic valves. CoreValve, which is the only TCV system shown to be superior to open-heart surgery, has received U.S. FDA approval for extreme and high risk
2
patients. Our next-generation recapturable TCV system, CoreValve Evolut R, has received U.S. FDA approval and CE Mark approval for the 23, 26, and 29 millimeter sizes of the valve.
Percutaneous Coronary Intervention (PCI)
Our latest generation PCI stent products include our Resolute Integrity drug-eluting stent systems, which have received U.S. FDA approval, as well as Resolute Onyx drug-eluting stent systems, which have received CE Mark approval.
Heart Surgery
We offer a complete line of surgical valve replacement and repair products for damaged or diseased heart valves. Our replacement products include both tissue and mechanical valves. We also offer a complete line of blood-handling products that form a circulatory support system to maintain and monitor blood circulation and coagulation status, oxygen supply, and body temperature during arrested heart surgery. Additionally, we offer surgical ablation systems and positioning and stabilization technologies.
Aortic & Peripheral Vascular Disease Management (APV)
Our APV division is comprised of a comprehensive line of products and therapies to treat aortic disease (such as aneurysms, dissections, and transections) as well as peripheral vascular disease (PVD), and critical limb ischemia (CLI). Our products include endovascular stent graft systems, peripheral drug coated balloon, stent and angioplasty systems, and carotid embolic protection systems for the treatment of vascular disease outside the heart, as well as products for superficial and deep venous disease.
The following are the principal products offered by our APV division:
Endovascular Stent Grafts (Aortic)
Our products are designed to treat aortic aneurysms in either the abdomen or thoracic regions of the aorta. Our product line includes a range of endovascular stent grafts and accessories including the market-leading Endurant 2S Abdominal Aortic Aneurysm (AAA) Stent Graft System and the Valiant Captivia Thoracic Aortic Aneurysm (TAA) stent graft system and the Aptus endo anchors.
Peripheral Vascular Intervention (PVI)
Our primary PVI products include percutaneous angioplasty balloons including the IN.PACT family of drug-coated balloons, which have U.S. FDA and CE Mark approval, as well as peripheral stents such as the Protégé & Complete Self Expanding Vascular Stents, the Visi-Pro & Assurant Cobalt Balloon Expandable stents and directional atherectomy products such as the TurboHawk plaque excision system, and other procedure support products.
EndoVenous (EV)
Our EndoVenous product lines are used to treat superficial and deep venous diseases in the lower extremities and include the Closure Fast RF ablation system, the VenaSeal medical adhesive system while also now focusing on embolisms with the Concerto detachable coil system, Micro Vascular Plug (MVP), the PV ONYX liquid embolic system and other procedure support products.
MINIMALLY INVASIVE THERAPIES GROUP
Surgical Solutions
Surgical Solutions develops, manufactures, and markets advanced surgical, general surgical, and hernia products and therapies to treat diseases and conditions that are typically, but not exclusively, addressed by surgeons. In addition, we develop, manufacture, and market several unique products in the emerging fields of minimally invasive gastrointestinal diagnostics, ablation, and interventional lung.
The following are the principal products offered by our Surgical Solutions division:
Surgical Innovations
This business includes sales of stapling, vessel sealing, fixation (hernia mechanical devices), mesh, hardware and surgical instruments, as well as wound closure, and electrosurgical products. Key advanced surgical products include: the Tri-Staple technology platform for endoscopic stapling, including the Endo GIA reloads and reinforced reloads with Tri-Staple Technology and the Endo GIA ultra universal stapler; the iDrive and Signia powered stapling systems; the LigaSure vessel sealing system, which features specialty/application specific handpieces powered by proprietary hardware platforms; the Sonicision cordless ultrasonic dissection system; AbsorbaTack absorbable mesh fixation device for hernia repair; Symbotex composite mesh for surgical laparoscopic and open ventral hernia repair; and Parietex ProGrip, a selfgripping, biocompatible solution for inguinal hernias.
Early Technologies
Our products include ablation products, and interventional lung and gastrointestinal solutions. This includes the PillCam SB and PillCam COLON, a minimally-invasive, swallowed optical endoscopy technology; superDimesion to evaluate lung lesions; the Cool-tip radiofrequency ablation system; the Evident microwave ablation system; and the HALO ablation catheters for treatment of Barrett’s esophagus.
3
Patient Monitoring & Recovery (PMR)
Our PMR division develops, manufactures, and markets products and therapies to enable complication-free recovery to enhance patient outcomes.
The following are the principal products offered by our PMR division:
Patient Monitoring
Our products include sensors, monitors, and temperature management products. Key patient monitoring products include: Capnostream with Microstream technology capnography monitors, the Nellcor Bedside SpO2 patient monitoring system, the Bispectral Index (BIS) brain monitoring technology, the INVOS Cerebral/Somatic Oximeter, and related modules and sensors.
Airway & Ventilation
This business primarily includes sales of airway, ventilator and inhalation therapy products. Key airway & ventilation products include: the Puritan Bennett 840 and 980 ventilators, the Newport e360 and HT70 ventilators, the TaperGuard Evac tube, Mallinckrodt Endotracheal Tubes, Shiley Tracheostomy Tubes, DAR Filters, and resuscitation bags.
Nursing Care
This business primarily includes sales of incontinence, wound care, enteral feeding, urology, and suction products. Key nursing care products include Curity and Kerlix gauze and bandages and Kangaroo enteral feeding systems.
Patient Care & Safety (PCS)
Our products include medical surgical products, such as operating room supply products, electrodes, and SharpSafety products, which includes needles, syringes, and sharps disposal products. In addition, we manufacture Original Equipment Manufacturer (OEM) products, which are various medical supplies manufactured for other medical products companies. Under our Medi-Trace brand, we offer a comprehensive line of monitoring, diagnostic, and defibrillation electrodes.
RESTORATIVE THERAPIES GROUP
Spine
Our Spine division develops, manufactures, and markets a comprehensive line of medical devices and implants used in the treatment of the spine and musculoskeletal system. Our products and therapies treat a variety of conditions affecting the spine, including degenerative disc disease, spinal deformity, spinal tumors, fractures of the spine, and stenosis. Our Spine division also provides biologic solutions for the orthopedic and dental markets and, in concert with our Surgical Technologies business, we offer unique and highly differentiated navigation, neuromonitoring, and power technologies designed for spine procedures.
The following are the principal products offered by our Spine division:
Thoracolumbar Products
Our products used to treat conditions in this region of the spine include the CD HORIZON SOLERA and LEGACY Systems, and the CAPSTONE and CLYDESDALE interbody spacers. In addition, Medtronic offers a number of products that facilitate less invasive thoracolumbar surgeries, including the CD HORIZON VOYAGER, SOLERA SEXTANT and LONGITUDE Percutaneous Fixation Systems.
Cervical Products
Products used to treat conditions in this region of the spine include the ZEVO and ATLANTIS VISION ELITE Anterior Cervical Plate Systems, the VERTEX SELECT Reconstruction System, and the PRESTIGE and BRYAN Cervical Artificial Discs.
Biologics Products
Our Biologics platform products include INFUSE Bone Graft (InductOs in the European Union (E.U.)), which contains a recombinant human bone morphogenetic protein, rhBMP-2, for certain spinal, trauma, and oral maxillofacial applications, Demineralized Bone Matrix (DBM) products, including MagniFuse, Grafton/Grafton Plus, and PROGENIX, and the MASTERGRAFT family of synthetic bone graft products - Matrix, Putty, and Granules.
Interventional Products
Our interventional products include the Xpander II Balloon Kyphoplasty system, the Kyphon-V vertebroplastly system and the Osteocool tumor ablation system.
Neuromodulation
Our Neuromodulation division includes implantable neurostimulation and targeted drug delivery systems for the management of chronic pain, common movement disorders, spasticity, and urologic and gastrointestinal disorders. Neurostimulation uses an implantable medical device, similar to a pacemaker, called a neurostimulator.
The following are the principal products offered by our Neuromodulation division:
Neurostimulation Systems for Chronic Pain
We have a large portfolio of neurostimulation systems, including rechargeable and non-rechargeable devices and a large selection of leads used to treat chronic back and/or limb pain. Our portfolio of products
4
includes pain neurostimulation systems with SureScan MRI Technology, including the RestoreSensor (rechargeable) SureScan MRI, with its proprietary AdaptiveStim technology.
Implantable Drug Infusion Systems
Our SynchroMed II Implantable Infusion System delivers small quantities of drug directly into the intrathecal space surrounding the spinal cord. These devices are used to treat chronic, intractable pain and severe spasticity associated with cerebral palsy, multiple sclerosis, spinal cord and traumatic brain injuries, and stroke.
Deep Brain Stimulation (DBS) Systems
DBS is currently approved in many countries around the world for the treatment of the disabling symptoms of essential tremor, Parkinson's disease, refractory epilepsy (outside the U.S.), severe, treatment-resistant obsessive-compulsive disorder (approved under a Humanitarian Device Exemption (HDE) in the U.S.), and chronic, intractable primary dystonia (approved under a HDE in the U.S.). Our family of Activa Neurostimulators for DBS includes Activa SC (single-channel primary cell battery), Activa PC (dual channel primary cell battery), and Activa RC (dual channel rechargeable battery).
Gastroenterology & Urology (Gastro/Uro) Systems
Our Sacral neuromodulation uses InterStim, a neurostimulator, to help control the symptoms of overactive bladder, (non-obstructive) urinary retention, and chronic fecal incontinence. Currently, Enterra Therapy is the only gastric electrical stimulation therapy approved in the U.S. (under a HDE), Europe, and Canada for use in the treatment of intractable nausea and vomiting associated with gastroparesis. The system, which contains a small neurostimulator and two leads, stimulates the smooth muscles of the lower stomach.
Surgical Technologies
Our Surgical Technologies division develops, manufactures, and markets products and therapies to treat diseases and conditions of the ear, nose, and throat (ENT) and certain neurological disorders. In addition, the division develops, manufactures, and markets image-guided surgery and intra-operative imaging systems that facilitate surgical planning during precision cranial, spinal, sinus, and orthopedic surgeries. Our Advanced Energy business includes products in the emerging field of advanced energy surgical incision technology, as well as the haemostatic sealing of soft tissue and bone.
The following are the principal products offered by our Surgical Technologies division:
Neurosurgery
Our portfolio of products include both platform technologies and implant therapies. The StealthStation Navigation System and O-arm Imaging System are both platforms used in cranial, spinal, sinus, and orthopedic procedures. The Midas Rex Surgical Drills are used in cranial, spinal, and orthopedic procedures. Visualase MRI-Guided Laser Ablation is used in neurosurgery procedures, and our CSF Management Portfolio is used in treating hydrocephalus and other conditions impacting the intracranial pressure.
ENT
The following products treat ENT diseases and conditions: Straightshot M5 Microdebrider Handpiece, the IPC system, NIM Nerve Monitoring Systems, Fusion ENT Navigation System, as well as products for hearing restoration and Snoring and Obstructive Sleep Apnea.
Advanced Energy
Our PEAK Surgery System is a tissue dissection system that consists of the PEAK PlasmaBlade and PULSAR Generator and is cleared for use in a variety of settings, including plastic reconstructive surgery, general surgery, and certain conditions of ENT. Our Aquamantys System uses patented transcollation technology to provide haemostatic sealing of soft tissue and bone and is cleared for use in a variety of surgical procedures, including orthopedic surgery, spine, solid organ resection and thoracic procedures.
Neurovascular
Our Neurovascular division, develops, manufactures, and markets products and therapies to treat diseases of the vasculature in and around the brain. Our products include coils, neurovascular stents, and flow diversion products, as well as access and delivery products to support procedures.
The following are the principal products offered by our Neurovascular division:
The Pipeline and Pipeline Flex Embolization Devices, endovascular treatments for large or giant wide-necked brain aneurysms; the Solitaire FR revascularization device for treatment of acute ischemic stroke; and the Apollo Onyx delivery micro catheter, the first detachable tip micro-catheter available in the U.S.
DIABETES GROUP
Our Diabetes group consists of three divisions (Intensive Insulin Management, Non-Intensive Diabetes Therapies, and Diabetes Service & Solutions) that develop, manufacture, and market advanced, integrated diabetes management solutions that include insulin pump therapy, continuous glucose monitoring (CGM) systems, and therapy management software.
5
The following are the principal products offered by our Diabetes divisions:
Integrated Diabetes Management Solutions
We have an integrated insulin pump and CGM system currently available on the market. In the U.S., we offer the MiniMed 530G System featuring SmartGuard technology, which automatically suspends insulin delivery when glucose levels reach a pre-determined threshold, and newest CGM sensor, Enlite, a sensor that can be worn for 6-days and is more comfortable, more accurate, and smaller than our previous generation sensor. Outside the U.S., we offer our MiniMed 640G System, an integrated system with the Enhanced Enlite CGM sensor that features SmartGuard technology, which automatically suspends insulin delivery when sensor glucose levels are predicted to approach a low limit and then resumes insulin delivery once levels recover.
Professional CGM
In addition to our Personal CGM (Enlite), we offer physicians a Professional CGM product called the iPro2/iPro Professional CGM System. Patients wear the iPro2/iPro recorder to capture glucose data that is later uploaded in a physician’s office to reveal glucose patterns and potential problems, including hyperglycemic and hypoglycemic episodes. The data leads to more informed treatment decisions.
Connected Care
We continue to innovate and offer new connected care solutions, including the MiniMed Connect, which is the only system providing remote access to pump and sensor data on the user's smartphone.
CareLink Therapy Management Software
Our web-based therapy management software solutions, including CareLink Personal software for patients and CareLink Pro software for healthcare professionals, to help patients and their health care providers control their diabetes.
CUSTOMERS AND COMPETITORS
Cardiac and Vascular Group
The primary medical specialists who use our Cardiac and Vascular products include electrophysiologists, implanting cardiologists, heart failure specialists, cardiovascular, cardiothorasic, and vascular surgeons and interventional cardiologists and radiologists. Our primary competitors are St. Jude Medical, Inc. (St. Jude), Boston Scientific Corporation (Boston Scientific), Sorin Group (Sorin), Edwards Lifesciences Corporation (Edwards), C.R. Bard Inc. (Bard), and Abbott Laboratories (Abbott).
Minimally Invasive Therapies Group
The products and therapies of this group are used primarily by hospitals, physicians' offices, and ambulatory care centers, other alternate site healthcare providers and less frequently in home settings. Our primary competitors are Johnson & Johnson, Boston Scientific, Baxter International Inc., and Bard.
Restorative Therapies Group
The primary medical specialists who use the products of this group include spinal surgeons, neurosurgeons, neurologists, pain management specialists, anesthesiologists, orthopedic surgeons, urologists, interventional radiologists, and ear, nose, and throat specialists. Our primary competitors include Johnson & Johnson, Boston Scientific, St. Jude, Stryker Corporation (Stryker), NuVasive, Inc., and Zimmer Holdings, Inc. (Zimmer).
Diabetes Group
The primary medical specialists who use and/or prescribe our Diabetes products are endocrinologists, diabetologists, and internists. Our primary competitors are Johnson & Johnson, DexCom, Inc., Tandem Diabetes Care Inc., Insulet Corporation, and F. Hoffmann-La Roche Ltd.
OTHER FACTORS IMPACTING OUR OPERATIONS
Research and Development
The markets in which we participate can be subject to rapid technological advances. Constant improvement of products and introduction of new products is necessary to maintain market leadership. Our research and development (R&D) efforts are directed toward maintaining or achieving technological leadership in each of the markets we serve in order to help ensure that patients using our devices and therapies receive the most advanced and effective treatment possible. We remain committed to developing technological enhancements and new indications for existing products, and less invasive and new technologies for new and emerging markets to address unmet patient needs. That commitment leads to our initiation and participation in many clinical trials each fiscal year as the demand for clinical and economic evidence remains high. Furthermore, our development activities are intended to help reduce patient care costs and the length of hospital stays in the future. We have not engaged in significant customer or government-sponsored research.
During fiscal years
2016
,
2015
, and
2014
, we spent
$2.2 billion
(
7.7
percent of net sales),
$1.6 billion
(
8.1
percent of net sales), and
$1.5 billion
(
8.7
percent of net sales) on R&D, respectively. Our R&D activities include improving existing products and
6
therapies, expanding their indications and applications for use, and developing new therapies and procedures. We continue to focus on optimizing innovation, improving our R&D productivity, driving growth in emerging markets, clinical evidence generation, and assessing our R&D programs based on their ability to deliver economic value to our customers.
Acquisitions and Investments
Our strategy to provide a broad range of therapies to restore patients' health and extend lives requires a wide variety of technologies, products, and capabilities. The rapid pace of technological development in the medical industry and the specialized expertise required in different areas of medicine make it difficult for one company alone to develop an all-encompassing portfolio of technological solutions. In addition to internally generated growth through our R&D efforts, historically we have relied, and expect to continue to rely, upon acquisitions, investments, and alliances to provide access to new technologies both in areas served by our existing businesses as well as in new areas and markets.
We expect to make future investments or acquisitions where we believe that we can stimulate the development of, or acquire new technologies and products to further our strategic objectives, and strengthen our existing businesses. Mergers and acquisitions of medical technology companies are inherently risky and no assurance can be given that any of our previous or future acquisitions will be successful or will not materially adversely affect our consolidated results of operations, financial condition, and/or cash flows.
For additional information, see Note 2 to the consolidated financial statements in “Item 8. Financial Statements and Supplementary Data” in this Annual Report on Form 10-K and "Item 1A. Risk Factors - Failure to integrate acquired businesses into our operations successfully could adversely affect our business."
Acquisition of Covidien plc in Fiscal Year 2015
On January 26, 2015, pursuant to a transaction agreement, dated as of June 15, 2014 (the Transaction Agreement), Medtronic, Inc. and Covidien became subsidiaries of the Company. The total cash and stock value of the Covidien acquisition was $50.0 billion. The operating results for Covidien are included in the Minimally Invasive Therapies Group, Cardiac and Vascular Group and Restorative Therapies Group segments.
Based upon the acquisition valuation, the Company acquired
$18.3 billion
of customer-related intangible assets,
$7.1 billion
of technology-based intangible assets,
$430 million
of tradenames, with weighted average estimated useful lives of
18
,
16
, and
6 years
, respectively,
$420 million
of in-process research and development (IPR&D), and
$30.0 billion
of goodwill.
Fiscal Year 2016 Acquisitions
Twelve, Inc.
On October 2, 2015, the Company's Coronary & Structural Heart division acquired Twelve, Inc. (Twelve), a privately-held medical device company focused on the development of a transcatheter mitral valve replacement device. Total consideration for the transaction was approximately
$472 million
, which included an upfront payment of
$428 million
and the estimated fair value of product development-based contingent consideration of
$44 million
. Based upon the acquisition valuation, the Company acquired
$192 million
of IPR&D and
$291 million
of goodwill.
RF Surgical Systems, Inc.
On August 11, 2015, the Company's Surgical Solutions division acquired RF Surgical Systems, Inc. (RF Surgical), a medical device company focused on the detection and prevention of retained surgical sponges. Total consideration for the transaction was approximately
$240 million
. Based upon the acquisition valuation, the Company acquired
$68 million
of technology-based intangible assets,
$47 million
of customer-related intangible assets, with estimated useful lives of 18 and 16 years, respectively, and
$135 million
of goodwill.
Medina Medical
On August 31, 2015, the Company's Neurovascular division acquired Medina Medical (Medina), a privately-held medical device company focused on commercializing treatments for vascular abnormalities of the brain, including cerebral aneurysms. Total consideration for the transaction was approximately
$219 million
, which includes an upfront payment of
$155 million
and the estimated fair value of revenue-based and product development-based contingent consideration of
$64 million
. Medtronic had previously invested in Medina and held an
11 percent
ownership position. Net of this ownership position, the transaction value was approximately
$195 million
. Based upon the acquisition valuation, the Company acquired
$122 million
of IPR&D and
$126 million
of goodwill.
7
Patents and Licenses
We rely on a combination of patents, trademarks, tradenames, copyrights, trade secrets, and non-disclosure and non-competition agreements to establish and protect our proprietary technology. We have filed and obtained numerous patents in the U.S. and abroad, and regularly file patent applications worldwide in our continuing effort to establish and protect our proprietary technology. U.S. patents typically have a 20-year term from the application date while patent protection outside the U.S. varies from country to country. In addition, we have entered into exclusive and non-exclusive licenses relating to a wide array of third-party technologies. We have also obtained certain trademarks and tradenames for our products to distinguish our genuine products from our competitors’ products, and we maintain certain details about our processes, products, and strategies as trade secrets. In the aggregate, these intellectual property assets and licenses are of material importance to our business; however, we believe that no single patent, technology, trademark, intellectual property asset or license is material in relation to any segment of our business as a whole. Our efforts to protect our intellectual property and avoid disputes over proprietary rights have included ongoing review of third-party patents and patent applications. For additional information see “Item 1A. Risk Factors - We are substantially dependent on patent and other proprietary rights and failing to protect such rights or to be successful in litigation related to our rights or the rights of others may result in our payment of significant monetary damages and/or royalty payments, negatively impact our ability to sell current or future products, or prohibit us from enforcing our patent and other proprietary rights against others.” and Note 15 to the consolidated financial statements in “Item 8. Financial Statements and Supplementary Data” in this Annual Report on Form 10-K.
Markets and Distribution Methods
We sell most of our medical devices and therapies through direct sales representatives in the U.S. and a combination of direct sales representatives and independent distributors in markets outside the U.S. For certain portions of our business acquired through the Covidien acquisition, we also sell through distributors in the U.S. Our medical supplies products are used primarily in hospitals, surgi-centers and alternate care facilities, such as home care and long-term care facilities, and are marketed to materials managers, GPOs and integrated delivery networks (IDNs) primarily through third-party distributors, although we also have direct sales representatives. We often negotiate with GPOs and IDNs, which enter into supply contracts for the benefit of their member facilities. Our three largest markets are the U.S., Western Europe, and Japan. Emerging markets are an area of increasing focus and opportunity as we believe they remain under-penetrated.
Our marketing and sales strategy is focused on rapid, cost-effective delivery of high-quality products to a diverse group of customers worldwide - including physicians, hospitals, other medical institutions, and GPOs. To achieve this objective, we organize our marketing and sales teams around physician specialties. This focus enables us to develop highly knowledgeable and dedicated sales representatives who are able to foster strong relationships with physicians and other customers and enhance our ability to cross-sell complementary products. We believe that we maintain excellent working relationships with physicians and others in the medical industry that enable us to gain a detailed understanding of therapeutic and diagnostic developments, trends, and emerging opportunities and respond quickly to the changing needs of physicians and patients. We attempt to enhance our presence in the medical community through active participation in medical meetings and by conducting comprehensive training and educational activities. We believe that these activities contribute to physician expertise.
In keeping with the increased emphasis on cost-effectiveness in health care delivery, the current trend among hospitals and other customers is to consolidate into larger purchasing groups to enhance purchasing power. This enhanced purchasing power may lead to pressure on pricing and increased use of preferred vendors. Our customer base continues to evolve to reflect such economic changes across the geographic markets we serve. We are not dependent on any single customer for more than 10 percent of our total net sales.
Competition and Industry
We compete in both the therapeutic and diagnostic medical markets in approximately
160
countries throughout the world. These markets are characterized by rapid change resulting from technological advances and scientific discoveries. Our product lines face a mixture of competitors ranging from large manufacturers with multiple business lines to small manufacturers offering a limited selection of products. In addition, we face competition from providers of other medical therapies such as pharmaceutical companies.
Major shifts in industry market share have occurred in connection with product problems, physician advisories, safety alerts, and publications about our products, reflecting the importance of product quality, product efficacy, and quality systems in the medical device industry. In addition, in the current environment of managed care, economically motivated customers, consolidation among health care providers, increased competition, and declining reimbursement rates, we have been increasingly required to compete on the basis of price. In order to continue to compete effectively, we must continue to create or acquire advanced technology, incorporate this technology into proprietary products, obtain regulatory approvals in a timely manner, maintain high-quality manufacturing processes, and successfully market these products.
8
Worldwide Operations
Our global operations are accompanied by certain financial and other risks. Relationships with customers and effective terms of sale vary by country; often with longer-term receivables than are typical in the U.S. Currency exchange rate fluctuations can affect revenues, net of expenses, and cash flows from operations outside the U.S. We use operational and economic hedges, as well as currency exchange rate derivative contracts, to manage the impact of currency exchange rate changes on earnings and cash flow. See “Item 7A. Quantitative and Qualitative Disclosures About Market Risk” and Note 8 to the consolidated financial statements in “Item 8. Financial Statements and Supplementary Data” in this Annual Report on Form 10-K. In addition, the repatriation of earnings of certain subsidiaries outside the U.S. may result in substantial U.S. tax cost.
For financial reporting purposes, net sales and property, plant, and equipment attributable to significant geographic areas are presented in Note 17 to the consolidated financial statements in “Item 8. Financial Statements and Supplementary Data” in this Annual Report on Form 10-K.
Production and Availability of Raw Materials
We manufacture most of our products at 89 manufacturing facilities located in various countries throughout the world. For additional information related to our manufacturing facilities refer to Item 2. in this Annual Report on Form 10-K. We purchase many of the components and raw materials used in manufacturing these products from numerous suppliers in various countries. For reasons of quality assurance, sole source availability, or cost effectiveness, certain components and raw materials are available only from a sole supplier. We work closely with our suppliers to help ensure continuity of supply while maintaining high quality and reliability. Due to the U.S. FDA’s requirements regarding manufacturing of our products, we may not be able to quickly establish additional or replacement sources for certain components or materials. Generally, we have been able to obtain adequate supplies of such raw materials and components. However, a sudden or unexpected reduction or interruption in supply, and an inability to develop alternative sources for such supply, could adversely affect our operations. We have reporting and disclosure requirements related to the use of certain minerals, known as "conflict minerals" (tantalum, tin, tungsten (or their ores), and gold) which are mined from the Democratic Republic of the Congo and adjoining countries. Pursuant to these requirements, we are required to report on Form SD the procedures we employ to determine the sourcing of such minerals and metals produced from those minerals. There are costs associated with complying with these disclosure requirements, including for diligence in regards to the sources of any conflict minerals used in our products, in addition to the cost of remediation and other changes to products, processes, or sources of supply as a consequence of such verification activities. In addition, the implementation of these rules could adversely affect the sourcing, supply, and pricing of materials used in our products. As of the date of our conflict minerals report for the 2015 calendar year, we were unable to obtain the necessary information on conflict minerals from all of our suppliers and were unable to determine that all of our products are conflict free. We may continue to face difficulties in gathering this information in the future. We may face reputational challenges if we determine that certain of our products contain minerals not determined to be conflict free or if we are unable to sufficiently verify the origins for all conflict minerals used in our products through the procedures we implement.
Working Capital Practices
Our goal is to carry sufficient levels of inventory to ensure adequate supply of raw materials from suppliers and meet the product delivery needs of our customers. We also provide payment terms to customers in the normal course of business and rights to return product under warranty to meet the operational demands of our customers.
Employees
On
April 29, 2016
, we employed more than
88,000
full-time employees. Our employees are vital to our success. We believe we have been successful in attracting and retaining qualified personnel in a highly competitive labor market due to our competitive compensation and benefits, and our rewarding work environment.
Seasonality
Worldwide sales, including U.S. sales, do not reflect a significant degree of seasonality; however, the number of medical procedures incorporating Medtronic products is generally lower during summer months, due to summer vacation schedules in the northern hemisphere, particularly in European countries. In addition, pulse oximetry sales can be impacted by flu season.
Government Regulation and Other Considerations
Our products are subject to regulation by numerous government agencies, including the U.S. FDA and similar agencies outside the U.S. To varying degrees, each of these agencies requires us to comply with laws and regulations governing the development, testing, manufacturing, labeling, marketing, and distribution of our products. Our business is also affected by patient privacy laws, cost containment initiatives and environmental health and safety laws and regulations. The primary laws and regulations that affect our business are described below.
9
The laws applicable to us are subject to change and are subject to evolving interpretations. If a governmental authority were to conclude that we are not in compliance with applicable laws and regulations, Medtronic and its officers and employees could be subject to severe criminal and civil penalties including substantial fines and damages, and exclusion from participation as a supplier of product to beneficiaries covered by Medicare or Medicaid.
Product Approval Processes
Authorization to commercially distribute a new medical device or technology in the U.S. is generally received in one of two ways. The first, known as pre-market notification or the 510(k) process, requires us to demonstrate that our new medical device or technology is substantially equivalent to a legally marketed medical device or technology. In this process, we must submit data that supports our equivalence claim. If human clinical data is required, it must be gathered in compliance with U.S. FDA investigational device exemption regulations. We must receive an order from the U.S. FDA finding substantial equivalence to another legally marketed medical device or technology before we can commercially distribute the new medical device or technology. Modifications to cleared medical devices or technologies can be made without using the 510(k) process if the changes do not significantly affect safety or effectiveness. Minimally Invasive Therapies Group products are generally subject to the pre-market notification process. A very small number of our devices are exempt from pre-market review.
The second, more rigorous process, known as pre-market approval (PMA), requires us to independently demonstrate that the new medical device is safe and effective. We do this by collecting data regarding design, materials, bench and animal testing, and human clinical data for the medical device. The U.S. FDA will authorize commercial distribution if it determines there is reasonable assurance that the medical device is safe and effective. This determination is based on the benefit outweighing the risk for the population intended to be treated with the device. This process is much more detailed, time-consuming, and expensive than the 510(k) process. A third, seldom used, process for approval exists for humanitarian use devices, intended for patient populations of less than 4,000 patients per year in the U.S. This exemption is similar to the PMA process; however, a full showing of product effectiveness from large clinical trials is not required. The threshold for approving these products is probable benefit and safety.
Many countries outside the U.S. to which we export medical devices also subject such medical devices and technologies to their own regulatory requirements. Frequently, regulatory approval may first be obtained in a country outside of the U.S. prior to application in the U.S. due to differing regulatory requirements; however, other countries, such as China for example, require approval in the country of origin first. Most countries outside of the U.S. require that product approvals be recertified on a regular basis, generally every five years. The recertification process requires that we evaluate any device or technology changes and any new regulations or standards relevant to the device or technology and, where needed, conduct appropriate testing to document continued compliance. Where recertification applications are required, they must be approved in order to continue selling our products in those countries. Because export control and economic sanctions laws and regulations are complex and constantly changing, it is possible that laws and regulations may be enacted, amended, enforced or interpreted in a manner materially impacting our ability to sell or distribute products.
In the E.U., a single regulatory approval process exists, and conformity with the legal requirements is represented by the CE Mark. To obtain a CE Mark, defined products must meet minimum standards of performance, safety, and quality (i.e., the essential requirements), and then, according to their classification, comply with one or more of a selection of conformity assessment routes. A notified body assesses the quality management systems of the manufacturer and the product conformity to the essential and other requirements within the medical device directive. Medtronic is subject to inspection by notified bodies for compliance. The competent authorities of the E.U. countries, generally in the form of their ministries or departments of health, oversee the clinical research for medical devices and are responsible for market surveillance of products once they are placed on the market. We are required to report device failures and injuries potentially related to product use to these authorities in a timely manner. Various penalties exist for non-compliance with the laws transcribing the medical device directives. We anticipate a new Medical Device Regulation to be published by the European Union in 2016, and it is likely to impose additional premarket and postmarket requirements.
To be sold in Japan, most medical devices must undergo thorough safety examinations and demonstrate medical efficacy before they are granted approval, or “shonin.” The Japanese government, through the Ministry of Health, Labour, and Welfare (MHLW), regulates medical devices under the Pharmaceutical Affairs Law (PAL). Oversight for medical devices is conducted with participation by the Pharmaceutical and Medical Devices Agency (PMDA), a quasi-government organization performing many of the review functions for MHLW. Penalties for a company’s noncompliance with PAL could be severe, including revocation or suspension of a company’s business license and criminal sanctions. MHLW and PMDA also assess the quality management systems of the manufacturer and the product conformity to the requirements of the PAL. Medtronic is subject to inspection for compliance by these agencies.
Our global regulatory environment is becoming increasingly stringent, and unpredictable, which could increase the time, cost and complexity of obtaining regulatory approvals for our products. Several countries that did not have regulatory requirements for medical devices have established such requirements in recent years and other countries have expanded, or plan to expand, on
10
existing regulations. Certain regulators are requiring local clinical data in addition to global clinical data. While harmonization of global regulations has been pursued, requirements continue to differ significantly among countries. We expect this global regulatory environment will continue to evolve, which could impact our ability to obtain future approvals for our products, or could increase the cost and time to obtain such approvals in the future. There can be no assurance that any new medical devices we develop will be approved in a timely or cost-effective manner or approved at all.
Ongoing U.S. FDA Regulations
Both before and after a product is commercially released, we have ongoing responsibilities under U.S. FDA regulations. The U.S. FDA reviews design and manufacturing practices, labeling and record keeping, and manufacturers’ required reports of adverse experiences and other information to identify potential problems with marketed medical devices. We are also subject to periodic inspection by the U.S. FDA for compliance with the U.S. FDA’s quality system regulations, which govern the methods used in, and the facilities and controls used for, the design, manufacture, packaging, and servicing of all finished medical devices intended for human use. In addition, the U.S. FDA and other U.S. regulatory bodies (including the Federal Trade Commission, the Office of the Inspector General of the Department of Health and Human Services, the U. S. Department of Justice, and various state Attorneys General) monitor the manner in which we promote and advertise our products. Although surgeons are permitted to use their medical judgment to employ medical devices for indications other than those cleared or approved by the U.S. FDA, the U.S. FDA has prohibited manufacturers from promoting products for such “off-label” uses, and has taken the position that manufacturers can only market their products for cleared or approved uses.
If the U.S. FDA were to conclude that we are not in compliance with applicable laws or regulations, or that any of our medical devices are ineffective or pose an unreasonable health risk, the U.S. FDA could require us to notify health professionals and others that the devices present unreasonable risks of substantial harm to the public health, order a recall, repair, replacement, or refund of such devices, detain or seize adulterated or misbranded medical devices, or ban such medical devices. The U.S. FDA may also impose operating restrictions, enjoin and/or restrain certain conduct resulting in violations of applicable law pertaining to medical devices, including a hold on approving new devices until issues are resolved to its satisfaction, and assess civil or criminal penalties against our officers, employees, or us. The U.S. FDA may also recommend prosecution to the U. S. Department of Justice. Conduct giving rise to civil or criminal penalties may also form the basis for private civil litigation by third-party payers or other persons allegedly harmed by our conduct.
In April 2015, we entered into a consent decree with the U.S. FDA relating to our Neuromodulation business’ SynchroMed drug infusion system and the Neuromodulation quality system. The consent decree requires the Company to complete certain corrections and enhancements to the SynchroMed pump and the Neuromodulation quality system. The consent decree limits the Company's ability to manufacture and distribute the SynchroMed drug infusion system, unless specific conditions are met. The agreement does not require the retrieval of any of the Company’s products, but the Company must retain a third-party expert to inspect the Neuromodulation quality system and to provide a certification that the system complies with the requirements of the consent decree. Once this certification is accepted by the U.S. FDA, and a U.S. FDA inspection is successfully completed, the limitations on manufacturer and distribution of SynchroMed pumps will be lifted. Thereafter, the Company must submit periodic audit reports to the U.S. FDA to ensure ongoing compliance with the consent decree.
In June 2016, TYRX, Inc. received a Warning Letter from the U.S. FDA following an inspection at the TYRX facility in Monmouth Junction, New Jersey. The Company is taking action to address the Warning Letter and has submitted a response to the U.S. FDA.
Governmental Trade Regulations
The sale and shipment of our products and services across international borders, as well as the purchase of components and products from international sources, subject us to extensive governmental trade regulations. A variety of laws and regulations, both in the U.S. and in the countries in which we transact business, apply to the sale, shipment and provision of goods, services and technology across international borders. Because we are subject to extensive regulations in the countries in which we operate, we are subject to the risk that laws and regulations could change in a way that would expose us to additional costs, penalties or liabilities. These laws and regulations govern, among other things, our import and export activities.
The U.S. FDA, in cooperation with U.S. Customs and Border Protection (CBP), administers controls over the import of medical devices into the U.S. The CBP imposes its own regulatory requirements on the import of our products, including inspection and possible sanctions for noncompliance. Medtronic is also subject to foreign trade controls administered by several U.S. government agencies, including the Bureau of Industry and Security within the Commerce Department and the Office of Foreign Assets Control within the Treasury Department. We import raw materials, components and finished products into the countries in which we transact business. We act as the importer of record in many instances, but we also sell and ship goods to third parties who are themselves responsible for complying with applicable trade laws and regulations. In our role as importer of record, we are directly responsible for complying with customs laws and regulations concerning the importation of our raw materials, components and
11
finished products. If applicable government agencies were to determine that we or such third parties were not in compliance with applicable U.S. FDA or customs laws and regulations when engaging in cross-border transactions involving our products, we may be subject to civil or criminal enforcement action, and varying degrees of liability, depending on the nature of the violation and the extent of our culpability. In addition, such determinations may cause supply chain disruptions and delays in the distribution of our products that impact our business activities.
Many countries, including the U.S., control the export and re-export of goods, technology and services for reasons including public health, national security, regional stability, antiterrorism policies and other reasons. In certain circumstances, approval from governmental authorities may be required before goods, technology or services are exported or re-exported to certain destinations, to certain end-users and for certain end-uses. In addition, international sales of our medical devices that have not received U.S. FDA approval are subject to U.S. FDA export requirements. Some governments may also impose economic sanctions against certain countries, persons or entities. In addition to our need to comply with such regulations in connection with our direct export activities, we also sell and provide goods, technology and services to agents, representatives and distributors who may export such items to customers and end-users. If applicable government agencies were to determine that we, or the third parties through which we export goods, were not in compliance with applicable export control or economic sanctions laws and regulations when engaging in transactions involving our products, we may be subject to civil or criminal enforcement action, and varying degrees of liability, dependent upon the nature of the violation and the extent of our culpability. Similarly, such determinations may cause disruption or delays in the distribution and sales of our products, or result in restrictions being placed upon our international distribution and sales of products which may materially impact our business activities.
Anti-Boycott Laws
Under U.S. laws and regulations, U.S. companies and their controlled-in-fact subsidiaries and affiliates outside the U.S are prohibited from participating or agreeing to participate in unsanctioned foreign boycotts in connection with certain business activities, including the sale, purchase, transfer, shipping or financing of goods or services within the U.S. or between the U.S. and a foreign country. Currently, the U.S. considers the Arab League boycott of Israel to constitute an unsanctioned foreign boycott. We are responsible for ensuring we comply with the requirements of U.S. anti-boycott laws for all transactions in which we are involved. If we, or certain third parties through which we sell or provide goods or services, are determined to have violated U.S. anti-boycott laws and regulations, we may be subject to civil or criminal enforcement action, and varying degrees of liability, dependent upon the nature of the violation and the extent of our culpability. Penalties for any violations of anti-boycott laws and regulations could include criminal penalties and civil sanctions such as fines, imprisonment, debarment from government contracts, loss of export privileges and the denial of certain tax benefits, including foreign tax credits, and outside U.S subsidiary deferrals.
Data Privacy and Security Laws and Regulations
The collection, maintenance, protection, use, transmission, disclosure and disposal of sensitive personal information are regulated at the U.S. federal and state, international and industry levels. U.S. federal and state laws protect the confidentiality of certain patient health information, including patient medical records, and restrict the use and disclosure of patient health information by health care providers. For example, the U.S. FDA has issued guidance advising manufacturers to review their cybersecurity practices and policies to assure that appropriate safeguards are in place to prevent unauthorized access or modification to their medical devices or compromise of the security of the hospital network that may be connected to the device. Moreover, in April 2003, the U.S. Department of Health and Human Services (HHS) published patient privacy rules under the Health Insurance Portability and Accountability Act of 1996 (HIPAA) and, in April 2005, published security rules for protected health information. The HIPAA privacy and security rules govern the use, disclosure, and security of protected health information by “Covered Entities,” which are health care providers that submit electronic claims, health plans, and health care clearinghouses. In 2009, Congress passed the HITECH Act, which modified certain provisions of the HIPAA privacy and security rules for Covered Entities and their Business Associates (which is anyone that performs a service on behalf of a Covered Entity involving the use or disclosure of protected health information and is not a member of the Covered Entity’s workforce). These included directing HHS to publish more specific security standards, and increasing breach notification requirements, as well as tightening certain aspects of the privacy rules. HHS published the final versions of these new rules in January 2013, and Covered Entities and Business Associates were expected to be in compliance by September 2013. In addition, the HITECH Act provided that Business Associates will now be subject to the same security requirements as Covered Entities, and that with regard to both the security and privacy rule, Business Associates will be subject to direct enforcement by HHS, including civil and criminal liability, just as Covered Entities are. In the past, HIPAA has generally affected us indirectly, but these modifications increase the potential for enforcement action against us as a Business Associate. Medtronic is generally not a Covered Entity, except for our Diabetes business, Medtronic Monitoring, Inc. and our health insurance plans. Medtronic only operates as a Business Associate to Covered Entities in a limited number of instances. In those cases, the patient data that we receive and analyze may include protected health information.
A number of states have also adopted laws and regulations that may affect our privacy and security practices, such as state laws that govern the use, disclosure and protection of social security numbers or that are designed to protect credit card account data.
12
State and local authorities increasingly focus on the importance of protecting individuals from identity theft, with a significant number of states enacting laws requiring businesses to notify individuals of security breaches involving personal information. State consumer protection laws may also apply to privacy and security practices related to personally identifiable information, including information related to consumers and care providers.
We are also impacted by the privacy requirements of countries outside the United States. Privacy standards in Europe and Asia are becoming increasingly strict. Enforcement action and financial penalties related to privacy in the E.U. are growing, and new laws and restrictions are being passed. In April of 2016, the European Council and the Parliament adopted the new General Data Protection Regulation, which sets demanding requirements for the management of individually identifiable data in the E.U.
The management of cross border transfers of information among and outside of E.U. member countries is becoming more complex, which may complicate our clinical research activities, as well as product offerings that involve transmission or use of clinical data. China and Russia have passed so-called “data localization” laws, which require multi-national companies that store certain individually identifiable data on their citizens to maintain that data on servers located in their country. Restrictions on transfer or processing of that data may apply as well. The restrictions may complicate our operations in those countries, adding complexity and additional management and oversight needs, and the Chinese and Russian governments are still clarifying how they will apply and enforce these laws.
Cost Containment Initiatives
Government and private sector initiatives to limit the growth of health care costs, including price regulation, competitive pricing, bidding and tender mechanics, coverage and payment policies, comparative effectiveness of therapies, technology assessments, and managed-care arrangements, are continuing in many countries where we do business, including the U.S. These changes are causing the marketplace to put increased emphasis on the delivery of more cost-effective medical devices and therapies. Government programs, including Medicare and Medicaid, private health care insurance, and managed-care plans have attempted to control costs by limiting the amount of reimbursement they will pay for particular procedures or treatments, tying reimbursement to outcomes, shifting to population health management, and other mechanisms designed to constrain utilization and contain costs. Hospitals, which purchase implants, are also seeking to reduce costs through a variety of mechanisms, including, for example, creating centralized purchasing functions that set pricing and in some cases limiting the number of vendors that can participate in the purchasing program. Hospitals are also aligning interests with physicians through employment and other arrangements, such as gainsharing, where a hospital agrees with physicians to share any realized cost savings resulting from the physicians’ collective change in practice patterns such as standardization of devices where medically appropriate. This has created an increasing level of price sensitivity among customers for our products.
Some third-party payers must also approve coverage and set reimbursement levels for new or innovative devices or therapies before they will reimburse health care providers who use the medical devices or therapies. Even though a new medical device may have been cleared for commercial distribution, we may find limited demand for the device until coverage and sufficient reimbursement levels have been obtained from governmental and private third-party payers. In addition, some private third-party payers require that certain procedures or that the use of certain products be authorized in advance as a condition of reimbursement. International examples of cost containment initiatives and health care reforms in markets significant to Medtronic's business include Japan, where the government reviews reimbursement rate benchmarks every two years, which may significantly reduce reimbursement for procedures using our medical devices or deny coverage for those procedures. As a result of our manufacturing efficiencies, cost controls and other cost-savings initiatives, we believe we are well-positioned to respond to changes resulting from the worldwide trend toward cost-containment; however, uncertainty remains as to the nature of any future legislation, new or changed coverage and reimbursement government or private payer policies or decisions, or other reforms, making it difficult for us to predict the potential impact of cost-containment trends on future operating results.
Regulations Governing Reimbursement
The delivery of our devices is subject to regulation by HHS and comparable state and non-U.S. agencies responsible for reimbursement and regulation of health care items and services. U.S. laws and regulations are imposed primarily in connection with the Medicare and Medicaid programs, as well as the government’s interest in regulating the quality and cost of health care. Other governments also impose regulations in connection with their health care reimbursement programs and the delivery of health care items and services.
U.S. federal health care laws apply when we or customers submit claims for items or services that are reimbursed under Medicare, Medicaid, or other federally-funded health care programs. The principal U.S. federal laws include: (1) the Anti-kickback Statute, which prohibits offers to pay or receive remuneration of any kind for the purpose of purchasing, ordering, recommending making referrals to items or services reimbursable by a federal health care program; (2) the False Claims Act which prohibits the submission of false or otherwise improper claims for payment to a federally-funded health care program, including claims resulting from a violation of the Anti-kickback Statute; (3) the Stark law, which prohibits physicians from referring Medicare or Medicaid patients
13
to a provider that bills these programs for the provision of certain designated health services if the physician (or a member of the physician’s immediate family) has a financial relationship with that provider; and (4) health care fraud statutes that prohibit false statements and improper claims to any third-party payer. There are often similar state false claims, anti-kickback, and anti-self-referral and insurance laws that apply to state-funded Medicaid and other health care programs and private third-party payers. Insurance companies can also bring a private cause of action for treble damages against a manufacturer for a pattern of causing false claims to be filed under the federal Racketeer Influenced and Corrupt Organizations Act, or RICO. In addition, as a manufacturer the U.S. FDA-approved devices reimbursable by federal healthcare programs, are subject to the Physician Payments Sunshine Act, which requires us to annually report certain payments and other transfers of value we make to U.S.-licensed physicians or U.S. teaching hospitals. Further, the U.S. Foreign Corrupt Practices Act (FCPA) can be used to prosecute companies in the U.S. for arrangements with physicians, or other parties outside the U.S. if the physician or party is a government official of another country and the arrangement violates the law of that country.
The laws and regulations of health care goods and services that are applicable to us, including those described above, are subject to evolving interpretations and enforcement discretion. If a governmental authority were to conclude that we are not in compliance with applicable laws and regulations, we and our officers and employees could be subject to severe criminal and civil financial penalties, including, for example, exclusion from participation as a supplier of product to beneficiaries covered by Medicare. Any failure to comply with laws and regulations relating to reimbursement and health care goods and services could adversely affect our reputation, business, financial condition and cash flows.
Our profitability and operations are subject to risks relating to changes in legislative, regulatory and reimbursement policies and decisions as well as changes to private payer reimbursement coverage and payment decisions and policies. Implementation of further legislative or administrative reforms to the reimbursement system in the U.S. and abroad, or adverse decisions relating to our products by administrators of these systems in coverage or reimbursement, could significantly reduce reimbursement or result in the denial of coverage, which could have an impact on the acceptance of and demand for our products and the prices that our customers are willing to pay for them.
Environmental Health and Safety Laws
We are also subject to various environmental health and safety laws and regulations both within and outside the U.S. Similar to other companies in our industry, our manufacturing and other operations involve the use and transportation of substances regulated under environmental health and safety laws including those related to the transportation of hazardous materials. To the best of our knowledge at this time, we do not expect that compliance with environmental protection laws will have a material impact on our consolidated results of operations, financial position, and/or cash flows.
Litigation Risks
Patent Litigation
We operate in an industry characterized by extensive patent litigation. Patent litigation can result in significant damage awards and injunctions that could prevent the manufacture and sale of affected products or result in significant royalty payments in order to continue selling the products. At any given time, we are involved as both a plaintiff and a defendant in a number of patent infringement actions, the outcomes of which may not be known for prolonged periods of time. While it is not possible to predict the outcome of patent litigation incidents to our business, we believe the outcomes associated with this type of litigation could have a material adverse impact on our consolidated results of operations, financial position, or cash flows. For additional information, see “Item 1A. Risk Factors - We are substantially dependent on patent and other proprietary rights and failing to protect such rights or to be successful in litigation related to our rights or the rights of others may result in our payment of significant monetary damages and/or royalty payments, negatively impact our ability to sell current or future products, or prohibit us from enforcing our patent and other proprietary rights against others.” and Note 15 to the consolidated financial statements in “Item 8. Financial Statements and Supplementary Data” in this Annual Report on Form 10-K.
Product Liability and Other Claims
We operate in an industry susceptible to significant product liability claims. These claims may be brought by individuals seeking relief on their own behalf or purporting to represent a class. We are also susceptible to other litigation, including private securities litigation, shareholder derivative suits and contract litigation. These claims may be asserted against us in the future based on events we are not aware of at the present time. While it is not possible to predict the outcome of product liability litigation, we believe the outcomes associated with this type of litigation could have a material adverse impact on our consolidated results of operations, financial position, or cash flows. For additional information, see “Item 1A. Risk Factors - Quality problems with, and product liability claims in connection with, our processes, goods, and services, could lead to recalls or safety alerts, harm our reputation and have a material adverse effect on our business, results of operations, financial condition and our cash flows
.
” and Note 15 to the consolidated financial statements in “Item 8. Financial Statements and Supplementary Data” in this Annual Report on Form 10-K.
14
Insurance
We have elected to self-insure most of our insurable risks across the Company, and we made this decision based on costs and availability factors in the insurance marketplace. We continue to maintain a directors' and officers' liability insurance policy providing coverage for the directors and officers of the Company. We continue to monitor the insurance marketplace to evaluate the value to us of obtaining insurance coverage for other categories of losses in the future. Based on historical loss trends, we believe that our self-insurance program accruals and our existing insurance coverage will be adequate to cover future losses. Historical trends, however, may not be indicative of future losses. The absence of third-party insurance coverage for other categories of losses increases our exposure to unanticipated claims and these losses could have a material adverse impact on our consolidated earnings, financial condition and/or cash flows.
Section 13(r) of the Exchange Act
Under Section 13(r) of the Exchange Act, the Company is required to include certain disclosures in its periodic reports if the Company or any of its affiliates knowingly engaged in certain specified activities during the period covered by the report. As a global medical device company, Medtronic conducts business throughout the world, including supplying life enhancing medical products for patient use in Iran in accordance with authorizations issued by the U.S. Department of the Treasury’s Office of Foreign Assets Control (OFAC) and other U.S. and non-U.S. governmental entities, and consistent with the Company’s corporate policies. As part of its ongoing global trade compliance program, the Company identified that certain authorized shipments during the period covered by this report, which were arranged and effectuated by third-party logistics providers, were sent to Iran on aircraft owned or operated by Iran Air. This air carrier was designated under Executive Order 13382 during the relevant time period. Iran Air’s designation under Executive Order 13382 was terminated on January 16, 2016. While Medtronic paid associated freight expenses to the third-party logistics company, there were no gross revenues or net profits accrued by Medtronic as a result of Iran Air being used by the third-party logistics providers. Medtronic is taking corrective actions with regard to its third party logistics providers to confirm that air carriers designated under the Executive Orders are not used to ship Medtronic medical products in the future
,
and will implement additional controls as necessary. The Company has also notified OFAC regarding this matter.
Executive Officers of Medtronic
Set forth below are the names and ages of current Section 16(b) executive officers of Medtronic, as well as information regarding their positions with Medtronic, their periods of service in these capacities, and their business experiences. There are no family relationships among any of the officers named, nor is there any arrangement or understanding pursuant to which any person was selected as an officer.
Omar Ishrak
, age 60, has been Chairman and Chief Executive Officer of the Company since January 2015 and of Medtronic, Inc. since June 2011. Prior to that, Mr. Ishrak served as President and Chief Executive Officer of GE Healthcare Systems, a division of GE Healthcare, from 2009 to 2011. Prior to that, Mr. Ishrak was President and Chief Executive Officer of GE Healthcare Clinical Systems from 2005 to 2008 and President and Chief Executive Officer of GE Healthcare Ultrasound and BMD from 1995 to 2004.
Michael J. Coyle,
age 54, has been Executive Vice President and Group President, Cardiac and Vascular Group of the Company since January 2015 and of Medtronic, Inc. since December 2009. Prior to that, he served as President of the Cardiac Rhythm Management division at St. Jude from 2001 to 2007, and prior positions included serving St. Jude as President of the company’s Daig Catheter division and numerous leadership positions at Eli Lilly & Company.
Gary L. Ellis,
age 59, has served as Executive Vice President of Global Operations and Information Technology since June 2016. Mr. Ellis previously served as Executive Vice President and Chief Financial Officer of the Company beginning in January 2015 and of Medtronic, Inc. beginning in April 2014. Prior to that, he was Senior Vice President and Chief Financial Officer from May 2005 to April 2014; Vice President, Corporate Controller and Treasurer from October 1999 to May 2005, and Vice President and Corporate Controller from August 1994 to October 1999. Mr. Ellis joined Medtronic in 1989 as Assistant Corporate Controller and was promoted to Vice President of Finance for Medtronic Europe in 1992, until being named as Corporate Controller in 1994. Mr. Ellis is a member of the board of directors of The Toro Company and past chairman of the American Heart Association.
Hooman C. Hakami
, age 46, has been Executive Vice President and Group President, Diabetes Group of the Company since January 2015 and of Medtronic, Inc. since June 2014. Prior to that, he was President and Chief Executive Officer of Detection and Guidance Solutions at GE Healthcare from April 2012 to May 2014. Prior to that, he served as President and Chief Executive Officer of Interventional Systems from July 2009 to April 2012; Global Business Transformation leader for GE Healthcare from December 2008 to July 2009; and Vice President and General Manager, Global Ultrasound Services from June 2004 to December 2008. Mr. Hakami started his career with GE and has held the following financial roles: Chief Financial Officer for the Global Ultrasound division from 2001 to 2004; Chief Financial Officer for Clinical and Multi-vendor Services from 1999 to 2001; as well as various finance roles at GE Capital from 1994 to 1999; GE's Aerospace Division from 1992 to 1994 and GE Power Systems from 1991 to 1992.
15
Bryan C. Hanson
, age 49, has been Executive Vice President and Group President, Minimally Invasive Therapies Group of the Company since February 2015. Prior to that, he was Senior Vice President and Group President, Covidien since October 2014; Senior Vice President and Group President, Medical Devices and United States of Covidien from October 2013 to September 2014; Senior Vice President and Group President of Covidien for the Surgical Solutions business from July 2011 to October 2013; and President of Covidien’s Energy-based Devices business from July 2006 to June 2011. Mr. Hanson held several other positions of increasing responsibility in sales, marketing and general management with Covidien from October 1992 to July 2006.
Bradley E. Lerman
, age 59, has been Senior Vice President, General Counsel and Corporate Secretary of the Company since January 2015 and of Medtronic, Inc. since May 2014. Prior to that, he was Executive Vice President, General Counsel, and Corporate Secretary at Federal National Mortgage Association (Fannie Mae) from October 2012 to May 2014; Senior Vice President and Chief Litigation Counsel at Pfizer, Inc. from January 2009 to September 2012; Partner at Winston & Strawn from August 1998 to January 2009; partner at Kirkland & Ellis from March 1996 to July 1998; Associate Independent Counsel from October 1994 to March 1996; and Assistant U.S. Attorney in the Northern District of Illinois from February 1986 to September 1994.
Geoffrey S. Martha
, age 46, has been Executive Vice President and President, Restorative Therapies Group since June 2015. Mr. Martha previously served as Senior Vice President of Strategy and Business Development of the Company beginning in January 2015 and of Medtronic, Inc. beginning in August 2011. Prior to that, he served as Managing Director of Business Development at GE Healthcare from April 2007 to July 2011; General Manager for GE Capital Technology Finance Services from November 2003 to March 2007; Senior Vice President, Business Development for GE Capital Vendor Financial Services from February 2002 to October 2003; General Manager for GE Capital Colonial Pacific Leasing from February 2001 to January 2002; and Vice President, Business Development for Potomac Federal, the GE Capital federal financing investment bank from May 1998 to January 2001.
Karen L. Parkhill
, age 50, joined the Company as Executive Vice President and Chief Financial Officer in June 2016. From 2011 to 2016, Ms. Parkhill served as Vice Chairman and Chief Financial Officer of Comerica Incorporated. Ms. Parkhill was a member of Comerica’s Management Executive Committee and the Comerica Bank Board of Directors. Prior to joining Comerica, Ms. Parkhill worked for J.P. Morgan Chase & Co. in various capacities from 1992 to 2011, including serving as Chief Financial Officer of the Commercial Banking business from 2007 to 2011. Ms. Parkhill is also a current member of the Board of Directors for the Methodist Health System in Dallas.
Carol A. Surface
, age 50, has been Senior Vice President and Chief Human Resources Officer of the Company since January 2015 and of Medtronic, Inc. since September 2013. Prior to that, she was the Executive Vice President and Chief Human Resources Officer at Best Buy Co., Inc. from March 2010 to September 2013, and held a series of HR leadership roles at PepsiCo Inc., from May 2000 to March 2010.
Robert ten Hoedt
, age 55, has been Executive Vice President and President, EMEA of the Company since January 2015 and of Medtronic, Inc. since May 2014. Prior to that, he was Senior Vice President and President, EMEA and Canada from 2009 to 2014; Vice President CardioVascular Europe and Central Asia from 2006 to 2009; Vice President and General Manager, Vitatron from 1999 to 2006; Gastro-Uro leader from 1994 to 1999; and Marketing Manager, Neurological from 1991 to 1994.
Investing in us involves a variety of risks and uncertainties, known and unknown, including, among others, those discussed below. Each of the following risks should be carefully considered. Based on the information currently known to us, we believe the following information identifies the most significant risk factors affecting our Company. However, the risks and uncertainties described below are not the only ones related to our businesses and are not necessarily listed in the order of their importance. Additional risks and uncertainty not presently known to us or that we currently believe to be immaterial may also adversely affect our business.
Risks Relating to the Company
We operate in a highly competitive industry and we may be unable to compete effectively.
We compete in both the therapeutic and diagnostic medical markets in approximately
160
countries throughout the world. These markets are characterized by rapid change resulting from technological advances and scientific discoveries. In the product lines in which we compete, we face a mixture of competitors ranging from large manufacturers with multiple business lines to small manufacturers that offer a limited selection of niche products. Development by other companies of new or improved products, processes, technologies, or the introduction of reprocessed products or generic versions when our proprietary products lose their patent protection may make our products or proposed products less competitive. In addition, we face competition from providers of alternative medical therapies such as pharmaceutical companies.
16
Competitive factors include:
|
•
|
product reliability,
|
|
•
|
product performance,
|
|
•
|
product technology,
|
|
•
|
product quality,
|
|
•
|
breadth of product lines,
|
|
•
|
product services,
|
|
•
|
customer support,
|
|
•
|
price, and
|
|
•
|
reimbursement approval from health care insurance providers.
|
We also face competition for marketing, distribution, and collaborative development agreements, for establishing relationships with academic and research institutions, and for licenses to intellectual property. In addition, academic institutions, governmental agencies and other public and private research organizations also may conduct research, seek patient protection and establish collaborative arrangements for discovery, research, clinical development and marketing of products similar to ours. These companies and institutions compete with us in recruiting and retaining qualified scientific and management personnel, as well as in acquiring necessary product technologies.
Major shifts in industry market share have occurred in connection with product problems, physician advisories, safety alerts, and publications about our products; reflecting the importance of product quality, product efficacy, and quality systems in our industry. In the current environment of managed care, consolidation among health care providers, increased competition, and declining reimbursement rates, we have been increasingly required to compete on the basis of price. In order to continue to compete effectively, we must continue to create, invest in, or acquire advanced technology, incorporate this technology into our proprietary products, obtain regulatory approvals in a timely manner, and manufacture and successfully market our products. Given these factors, we cannot guarantee that we will be able to compete effectively or continue our level of success in our industry.
Reduction or interruption in supply and an inability to develop alternative sources for supply or other manufacturing difficulties, may adversely affect our manufacturing operations and related product sales.
The manufacture of our products requires the timely delivery of sufficient amount of quality components and materials and is highly exacting and complex, due in part to strict regulatory requirements. We manufacture most of our products at numerous manufacturing facilities located throughout the world. We purchase many of the components and raw materials used in manufacturing these products from numerous suppliers in various countries. We have generally been able to obtain adequate supplies of such raw materials and components. However, for reasons of quality assurance, cost effectiveness, or availability, we procure certain components and raw materials from a sole supplier. We work closely with our suppliers to try to ensure continuity of supply while maintaining high quality and reliability. However, we cannot guarantee that these efforts will be successful. In addition, due to the stringent regulations and requirements of the U.S. FDA regarding the manufacture of our products, we may not be able to quickly establish additional or replacement sources for certain components or materials. A reduction or interruption in supply, and an inability to develop alternative sources for such supply, could adversely affect our ability to manufacture our products in a timely or cost-effective manner and to make our related product sales.
Other problems in the manufacturing process, including equipment malfunction, failure to follow specific protocols and procedures, defective raw materials and environmental factors, could lead to launch delays, product shortage, unanticipated costs, lost revenues and damage to our reputation. A failure to identify and address manufacturing problems prior to the release of products to our customers may also result in quality or safety issues.
In addition, several of our key products are manufactured at a single manufacturing facility, with limited alternate facilities. If an event occurs that results in damage to one or more of such facilities, we may be unable to manufacture the relevant products at the previous levels or at all. Because of the time required to approve and license a manufacturing facility, a third-party manufacturer may not be available on a timely basis to replace production capacity in the event manufacturing capacity is lost.
Moreover, pursuant to the conflict minerals requirements promulgated by the SEC as a part of Dodd-Frank, we are required to report on the source of any conflict minerals used in our products, as well as the process we use to determine the source of such materials. We will continue to incur expenses as we work with our suppliers to evaluate the source of any conflict minerals in our products, and compliance with these requirements could adversely affect the sourcing, supply, and pricing of our raw materials.
Our industry is experiencing greater scrutiny and regulation by governmental authorities, which may lead to greater regulation in the future.
Our medical devices and technologies and our business activities are subject to a complex regime of regulations and an aggressive enforcement environment, including by the U.S. FDA, U. S. Department of Justice, Health and Human Services-Office of the
17
Inspector General, and numerous other federal, state, and non-U.S. governmental authorities. These authorities and members of Congress have been increasing their scrutiny of our industry. In addition, certain state governments and the federal government have enacted legislation aimed at increasing transparency of our interactions with health care providers. As a result, we are required by law to disclose payments and other transfers of value to health care providers licensed by certain states and to all U.S. physicians and U.S. teaching hospitals at the federal level. Any failure to comply with these legal and regulatory requirements could impact our business. In addition, we may continue to devote substantial additional time and financial resources to further develop and implement policies, systems, and processes to comply with enhanced legal and regulatory requirements, which may also impact our business. We anticipate that governmental authorities will continue to scrutinize our industry closely, and that additional regulation may increase compliance and legal costs, exposure to litigation, and other adverse effects to our operations.
We are subject to costly and complex laws and governmental regulations and any adverse regulatory action may materially adversely affect our financial condition and business operations.
Our medical devices are subject to regulation by numerous government agencies, including the U.S. FDA and comparable agencies outside the U.S. To varying degrees, each of these agencies requires us to comply with laws and regulations governing the development, testing, manufacturing, labeling, marketing, and distribution of our products. We cannot guarantee that we will be able to obtain or maintain marketing clearance for our new products or enhancements or modifications to existing products, and the failure to maintain approvals or obtain approval or clearance could have a material adverse effect on our business, results of operations, financial conditions and cash flows. Even if we are able to obtain such approval or clearance, it may:
|
•
|
take a significant amount of time,
|
|
•
|
require the expenditure of substantial resources,
|
|
•
|
involve stringent clinical and pre-clinical testing, as well as increased post-market surveillance,
|
|
•
|
involve modifications, repairs, or replacements of our products, and
|
|
•
|
result in limitations on the proposed uses of our products.
|
Both before and after a product is commercially released, we have ongoing responsibilities under U.S. FDA regulations. Many of our facilities and procedures and those of our suppliers are also subject to periodic inspections by the U.S. FDA to determine compliance with the U.S. FDA’s requirements, including primarily the quality system regulations and medical device reporting regulations. The results of these inspections can include inspectional observations on U.S. FDA’s Form-483, warning letters, or other forms of enforcement. Since 2009, the U.S. FDA has significantly increased its oversight of companies subject to its regulations, including medical device companies, by hiring new investigators and stepping up inspections of manufacturing facilities. The U.S. FDA has recently also significantly increased the number of warning letters issued to companies. If the U.S. FDA were to conclude that we are not in compliance with applicable laws or regulations, or that any of our medical devices are ineffective or pose an unreasonable health risk, the U.S. FDA could ban such medical devices, detain or seize adulterated or misbranded medical devices, order a recall, repair, replacement, or refund of such devices, refuse to grant pending pre-market approval applications or require certificates of non-U.S governments for exports, and/or require us to notify health professionals and others that the devices present unreasonable risks of substantial harm to the public health. The U.S. FDA may also assess civil or criminal penalties against us, our officers or employees and impose operating restrictions on a company-wide basis, or enjoin and/or restrain certain conduct resulting in violations of applicable law. The U.S. FDA may also recommend prosecution to the U. S. Department of Justice. Any adverse regulatory action, depending on its magnitude, may restrict us from effectively marketing and selling our products and limit our ability to obtain future pre-market clearances or approvals, and could result in a substantial modification to our business practices and operations.
In addition, the U.S. FDA has taken the position that device manufacturers are prohibited from promoting their products other than for the uses and indications set forth in the approved product labeling. A number of enforcement actions have been taken against manufacturers that promote products for “off-label” uses, including actions alleging that federal health care program reimbursement of products promoted for “off-label” uses constitute false and fraudulent claims to the government. The failure to comply with “off-label” promotion restrictions can result in significant civil or criminal exposure, administrative obligations and costs, and/or other potential penalties from, and/or agreements with, the federal government.
Pursuant to Dodd-Frank, the SEC promulgated final rules regarding disclosure of the use of certain minerals, known as "conflict minerals" (tantalum, tin, tungsten (or their ores), and gold) which are mined from the Democratic Republic of the Congo and adjoining countries. Under the rules, we are now required to disclose the procedures we employ to determine the sourcing of such minerals and metals produced from those minerals. There are costs associated with complying with these disclosure requirements, including for diligence in regards to the sources of any conflict minerals used in our products, in addition to the cost of remediation and other changes to products, processes, or sources of supply as a consequence of such verification activities. In addition, the implementation of these rules could adversely affect the sourcing, supply, and pricing of materials used in our products. As of the date of our conflict minerals report for the 2015 calendar year, we were unable to obtain the necessary information on conflict minerals from all of our suppliers and were unable to determine that all of our products are conflict free. In addition, we may continue to face difficulties in gathering this information in the future. We may face reputational challenges if we determine that
18
certain of our products contain minerals not determined to be conflict free or if we are unable to sufficiently verify the origins for all conflict minerals used in our products through the procedures we implement.
Governmental regulations outside the U.S have become increasingly stringent and more common, and we may become subject to more rigorous regulation by governmental authorities in the future. In the European Union, for example, we anticipate a new Medical Device Regulation to be published in 2016, and it is likely to impose additional premarket and postmarket requirements. Penalties for a company’s non-compliance with governmental regulation could be severe, including fines, revocation or suspension of a company’s business license, mandatory price reductions and criminal sanctions. Any governmental law or regulation imposed in the future may have a material adverse effect on us.
We are subject to environmental laws and regulations and the risk of environmental liabilities, violations and litigation.
We are subject to numerous U.S. federal, state, local and non-U.S. environmental, health and safety laws and regulations concerning, among other things, the generation, storage, use and transportation of hazardous materials, emissions or discharges of substances into the environment, investigation and remediation of hazardous substances or materials at various sites, chemical constituents in medical equipment and end-of-life disposal and take-back programs, and the health and safety of our employees. Our operations involve the use of substances regulated under such laws and regulations, primarily those used in manufacturing and sterilization processes. If we violate these environmental laws and regulations, we could be fined, criminally charged or otherwise sanctioned by regulators. Furthermore, environmental laws outside of the U.S. are becoming more stringent, resulting in increased costs and compliance burdens.
In addition, certain environmental laws assess liability on current or previous owners or operators of real property for the costs of investigation, removal or remediation of hazardous substances or materials at their properties or at properties which they have disposed of hazardous substances. Liability for investigative, removal and remedial costs under certain U.S. federal and state laws are retroactive, strict and joint and several. In addition to cleanup actions brought by governmental authorities, private parties could bring personal injury or other claims due to the presence of, or exposure to, hazardous substances. The ultimate cost of site cleanup and timing of future cash outflows is difficult to predict, given the uncertainties regarding the extent of the required cleanup, the interpretation of applicable laws and regulations, and alternative cleanup methods.
We may in the future be subject to additional environmental claims for personal injury or cleanup based on our past, present or future business activities (including the past activities of companies we have acquired). The costs of complying with current or future environmental protection and health and safety laws and regulations, or liabilities arising from past or future releases of, or exposures to, hazardous substances, may exceed our estimates, or have a material adverse effect on our business, consolidated earnings, financial condition, and/or cash flow.
Our failure to comply with laws and regulations relating to reimbursement of health care goods and services may subject us to penalties and adversely impact our reputation, business, financial condition and cash flows.
Our devices, products and therapies are purchased principally by hospitals or physicians that typically bill various third-party payers, such as governmental programs (e.g., Medicare, Medicaid and comparable non-U.S. programs), private insurance plans and managed care plans, for the healthcare services provided to their patients. The ability of our customers to obtain appropriate reimbursement for products and services from third-party payers is critical because it affects which products customers purchase and the prices they are willing to pay. As a result, our devices, products and therapies are subject to regulation regarding quality and cost by HHS, including the Centers for Medicare & Medicaid Services (CMS) as well as comparable state and non-U.S. agencies responsible for reimbursement and regulation of health care goods and services. The principal U.S. federal laws implicated include those that prohibit (i) the filing of false or improper claims for federal payment, known as the false claims laws, (ii) unlawful inducements for the referral of business reimbursable under federally-funded health care programs, known as the anti-kickback laws, and (iii) health care service providers from seeking reimbursement for providing certain services to a patient who was referred by a physician who has certain types of direct or indirect financial relationships with the service provider, known as the Stark law. Many states have similar laws that apply to reimbursement by state Medicaid and other funded programs as well as in some cases to all payers. Insurance companies can also bring a private cause of action for treble damages against a manufacturer for causing a false claim to be filed under the federal Racketeer Influenced and Corrupt Organizations Act, RICO. In addition, as a manufacturer of U.S. FDA-approved devices reimbursable by federal healthcare programs, we are subject to the Physician Payments Sunshine Act, which requires us to annually report certain payments and other transfers of value we make to U.S.-licensed physicians or U.S. teaching hospitals.
Our profitability and international operations are subject to risks relating to changes in government and private medical reimbursement programs and policies, and changes in legal regulatory requirements in the U.S. and around the world. Implementation of further legislative or administrative reforms to the reimbursement system in the U.S. and abroad, or adverse decisions relating to our products by administrators of these systems in coverage or reimbursement, could significantly reduce
19
reimbursement or result in the denial of coverage, which could have an impact on the acceptance of and demand for our products and the prices that our customers are willing to pay for them.
The laws and regulations of health care goods and services that are applicable to us, including those described above, are subject to evolving interpretations. If a governmental authority were to conclude that we are not in compliance with applicable laws and regulations, we and our officers and employees could be subject to severe criminal and civil penalties, including, for example, exclusion from participation as a supplier of product to beneficiaries covered by CMS. Any failure to comply with laws and regulations relating to reimbursement and health care goods and services could adversely affect our reputation, business, financial condition and cash flows.
We are substantially dependent on patent and other proprietary rights and failing to protect such rights or to be successful in litigation related to our rights or the rights of others may result in our payment of significant monetary damages and/or royalty payments, negatively impact our ability to sell current or future products, or prohibit us from enforcing our patent and other proprietary rights against others.
We are substantially dependent on patent and other proprietary rights and rely on a combination of patents, trade secrets, and non-disclosure and non-competition agreements to protect our proprietary intellectual property. We also operate in an industry characterized by extensive patent litigation. Patent litigation against us can result in significant damage awards and injunctions that could prevent our manufacture and sale of affected products or require us to pay significant royalties in order to continue to manufacture or sell affected products. At any given time, we are generally involved as both a plaintiff and a defendant in a number of patent infringement actions, the outcomes of which may not be known for prolonged periods of time. While it is not possible to predict the outcome of patent litigation, we believe the results associated with any such litigation could result in our payment of significant monetary damages and/or royalty payments, negatively impact our ability to sell current or future products, or prohibit us from enforcing our patent and proprietary rights against others, which would generally have a material adverse impact on our consolidated earnings, financial condition, and/or cash flows.
While we intend to defend against any threats to our intellectual property, our patents, trade secrets, or other agreements may not adequately protect our intellectual property. Further, pending patent applications owned by us may not result in patents being issued to us, patents issued to or licensed by us in the past or in the future may be challenged or circumvented by competitors and such patents may be found invalid, unenforceable or insufficiently broad to protect our technology or to provide us with any competitive advantage. Third parties could obtain patents that may require us to negotiate licenses to conduct our business, and the required licenses may not be available on reasonable terms or at all. We also rely on non-disclosure and non-competition agreements with certain employees, consultants, and other parties to protect, in part, trade secrets and other proprietary rights. We cannot be certain that these agreements will not be breached, that we will have adequate remedies for any breach, that others will not independently develop substantially equivalent proprietary information, or that third parties will not otherwise gain access to our trade secrets or proprietary knowledge.
In addition, the laws of certain countries in which we market some of our products do not protect our intellectual property rights to the same extent as the laws of the U.S., which could make it easier for competitors to capture market position in such countries by utilizing technologies that are similar to those developed or licensed by us. Competitors also may harm our sales by designing products that mirror the capabilities of our products or technology without infringing our intellectual property rights. If we are unable to protect our intellectual property in these countries, it could have a material adverse effect on our business, financial condition or results of operations.
Quality problems with, and product liability claims in connection with, our processes, goods, and services, could lead to recalls or safety alerts, harm our reputation and have a material adverse effect on our business, results of operations, financial condition and our cash flows.
Quality is extremely important to us and our customers due to the serious and costly consequences of product failure and our business exposes us to potential product liability risks that are inherent in the design, manufacture, and marketing of medical devices. In addition, many of our products are often used in intensive care settings with seriously ill patients and some of the medical devices we manufacture and sell are designed to be implanted in the human body for long periods of time or indefinitely. Component failures, manufacturing defects, design flaws, off-label use, or inadequate disclosure of product-related risks or product-related information with respect to our products could result in an unsafe condition or injury to, or death of, a patient. These problems could lead to recall of, or issuance of a safety alert relating to, our products, and could result in product liability claims and lawsuits, including class actions, which could ultimately result, in certain cases, in the removal from the body of such products and claims regarding costs associated therewith. Due to the strong name recognition of the Medtronic and Covidien brands, a material adverse event involving one of our products could result in reduced market acceptance and demand for all products within that brand, and could harm our reputation and ability to market products in the future.
20
Strong product quality is critical to the success of our goods and services. If we fail to meet these standards and our products are the subject of recalls or safety alerts, our reputation could be damaged, we could lose customers, and our revenue and results of operations could decline. Our success also depends generally on our ability to manufacture to exact tolerances precision-engineered components, subassemblies, and finished devices from multiple materials. If our components fail to meet these standards or fail to adapt to evolving standards, our reputation, competitive advantage and market share could be harmed. In certain situations, we may undertake a voluntary recall of products or temporarily shut down production lines based on performance relative to our own internal safety and quality monitoring and testing data.
Further, we have elected to self-insure with respect to product liability risks and any product liability claim brought against us, with or without merit, could be costly to defend. See "Our insurance program may not be adequate to cover future losses." Any of the foregoing problems, including product liability claims or product recalls in the future, regardless of their ultimate outcome, could harm our reputation and have a material adverse effect on our business, results of operations, financial condition, and cash flows.
Health care policy changes, including U.S. health care reform legislation, signed in 2010, may have a material adverse effect on us.
In response to perceived increases in health care costs in recent years, there have been and continue to be proposals by the federal government, state governments, regulators, and third-party payers to control these costs and, more generally, to reform the U.S. health care system. Certain of these proposals could limit the prices we are able to charge for our products or the amounts of reimbursement available for our products and could limit the acceptance and availability of our products. The adoption of some or all of these proposals could have a material adverse effect on our financial condition and results of operations.
The Patient Protection and Affordable Care Act and the Health Care and Education Affordability Reconciliation Act of 2010 provide for a number of healthcare policy changes that are or will be applicable to us. However, certain provisions of the law are not yet effective and there are many programs and requirements for which the details have not yet been fully established or consequences not fully understood, and it is unclear what the full impacts will be from the law. The legislation provides for significant new taxes on medical device makers in the form of a 2.3 percent excise tax on all U.S. medical device sales that commenced in January 2013. Although the excise tax has been suspended by Congress until the end of 2017, its status is unclear for 2018 and subsequent years. Under the legislation, the total cost to the medical device industry is expected to be approximately $20 billion over 10 years. The law also focuses on a number of Medicare provisions aimed at improving quality and decreasing costs. It is uncertain at this point what negative unintended consequences these provisions will have on patient access to new technologies. The Medicare provisions include value-based payment programs, increased funding of comparative effectiveness research, reduced hospital payments for avoidable readmissions and hospital acquired conditions, and pilot programs to evaluate alternative payment methodologies that promote care coordination (such as bundled physician and hospital payments). Additionally, the law includes a reduction in the annual rate of inflation for Medicare payments to hospitals that began in 2011 and the establishment of an independent payment advisory board to recommend ways of reducing the rate of growth in Medicare spending. We cannot predict what health care programs and regulations will be ultimately implemented at the federal or state level, or the effect of any future legislation or regulation. However, any changes that lower reimbursement for our products or reduce medical procedure volumes could adversely affect our business and results of operations.
Our insurance program may not be adequate to cover future losses.
We have elected to self-insure most of our insurable risks across the company, and we made this decision based on cost and availability factors in the insurance marketplace. We manage and maintain a portion of our self-insured program through a wholly-owned captive insurance company. We continue to maintain a directors and officers liability insurance policy with a third party insurer that provides coverage for the directors and officers of the company. We continue to monitor the insurance marketplace to evaluate the value of obtaining insurance coverage for other categories of losses in the future. Although we believe, based on historical loss trends, that our self-insurance program accruals and our existing insurance coverage will be adequate to cover future losses, historical trends may not be indicative of future losses. The absence of third-party insurance coverage for other categories of losses increases our exposure to unanticipated claims and these losses could have a material adverse impact on our consolidated earnings, financial condition and/or cash flows.
If we experience decreasing prices for our goods and services and we are unable to reduce our expenses, our results of operations will suffer.
We may experience decreasing prices for our goods and services due to pricing pressure experienced by our customers from managed care organizations and other third-party payers, increased market power of our customers as the medical device industry consolidates, and increased competition among medical engineering and manufacturing services providers. If the prices for our goods and services decrease and we are unable to reduce our expenses, our results of operations will be adversely affected.
21
We may experience higher costs to produce our products as a result of changes in prices for oil, gas and other commodities.
We use resins, other petroleum-based materials and pulp as raw materials in some of our products. Prices of oil and gas also significantly affect our costs for freight and utilities. Oil, gas and pulp prices are volatile and may increase, resulting in higher costs to produce and distribute our products. New laws or regulations adopted in response to climate change could also increase energy costs and the costs of certain raw materials and components. Due to the highly competitive nature of the healthcare industry and the cost-containment efforts of our customers and third-party payers, we may be unable to pass along cost increases through higher prices. If we are unable to fully recover these costs through price increases or offset these increases through cost reductions, we could experience lower margins and profitability and our business, results of operations, financial condition and cash flows could be materially and adversely affected.
Economic and political instability around the world could adversely affect our revenues, financial condition or results of operations.
There can be no assurance that economic and political instability around the world will not adversely affect our revenues, financial condition or results of operations. Our customers and vendors may experience financial difficulties or be unable to borrow money to fund their operations which may adversely impact their ability to purchase our products or to pay for our products on a timely basis, if at all. As with our customers and vendors, these economic conditions make it more difficult for us to accurately forecast and plan our future business activities. In addition, a significant amount of our trade receivables are with national health care systems in many countries. Repayment of these receivables is dependent upon the political and financial stability of those countries. In light of these global economic fluctuations, we continue to monitor the creditworthiness of customers located outside the U.S. Failure to receive payment of all or a significant portion of these receivables could adversely affect our results of operations.
We are subject to a variety of market and financial risks due to our international operations that could adversely affect those operations or our profitability and operating results.
Although our stock is traded on the New York Stock Exchange, we are a global company. Operations in countries outside of the U.S., which account for approximately 43 percent of our net sales for the fiscal year ended April 29, 2016, are accompanied by certain financial and other risks that would not be faced by a company operating purely within the U.S. We intend to continue to pursue growth opportunities in sales outside the U.S., especially in emerging markets, which could expose us to greater risks associated with international sales and operations. Our profitability and international operations are, and will continue to be, subject to a number of risks and potential costs, including:
|
•
|
fluctuations in currency exchange rates,
|
|
•
|
healthcare reform legislation,
|
|
•
|
multiple non-U.S. regulatory requirements that are subject to change and that could restrict our ability to manufacture and sell our products,
|
|
•
|
local product preferences and product requirements,
|
|
•
|
longer-term receivables than are typical in the U.S.,
|
|
•
|
trade protection measures and import or export licensing requirements,
|
|
•
|
less intellectual property protection in some countries outside the U.S. than exists in the U.S.,
|
|
•
|
different labor regulations and workforce instability,
|
|
•
|
political instability,
|
|
•
|
the potential payment of U.S. income taxes on earnings of certain controlled foreign subsidiaries subject to U.S. taxation upon repatriation,
|
|
•
|
the expiration and non-renewal of foreign tax rulings and/or grants,
|
|
•
|
potentially negative consequences from changes in or interpretations of tax laws, and
|
|
•
|
economic instability and inflation, recession or interest rate fluctuations.
|
There are recent legislative proposals to tax profits of U.S. affiliates which are earned abroad. While it is impossible for us to predict whether these and other proposals will be implemented, or how they will ultimately impact us, they may materially impact our results of operations if, for example, our profits earned abroad are subject to U.S. income tax, or we are otherwise disallowed deductions as a result of these profits.
On June 23, 2016, the United Kingdom (U.K.) held a referendum in which voters approved an exit from the E.U., commonly referred to as “Brexit”. As a result of the referendum, it is expected that the British government will begin negotiating the terms of the U.K.’s future relationship with the E.U. Although it is unknown what those terms will be, it is possible that there will be greater restrictions on imports and exports between the U.K. and E.U. countries and increased regulatory complexities. These changes may adversely affect our operations and financial results.
22
Finally, changes in currency exchange rates may reduce the reported value of our revenues outside the U.S, net of expenses, and cash flows. We cannot predict changes in currency exchange rates, the impact of exchange rate changes, nor the degree to which we will be able to manage the impact of currency exchange rate changes.
The failure to comply with U.S. Foreign Corrupt Practices Act and similar anti-bribery laws in non-U.S. jurisdiction could materially adversely affect our business and result in civil and/or criminal sanctions.
The U.S. Foreign Corrupt Practices Act (FCPA) and similar anti-bribery laws in non-U.S. jurisdictions generally prohibit companies and their intermediaries from making improper payments to non-U.S. government officials for the purpose of obtaining or retaining business. Because of the predominance of government-sponsored healthcare systems around the world, many of our customer relationships outside of the U.S. are with governmental entities and are therefore potentially subject to such laws.
Global enforcement of anti-corruption laws has increased substantially in recent years, with more frequent voluntary self-disclosures by companies, aggressive investigations and enforcement proceedings by U.S. and non-U.S. governmental agencies, and assessment of significant fines and penalties against companies and individuals. Our international operations create the risk of unauthorized payments or offers of payments by one of our employees, consultants, sales agents, or distributors, because these parties are not always subject to our control. It is our policy to implement safeguards to educate our employees and agents on these legal requirements and prohibit improper practices. However, our existing safeguards and any future improvements may not always be effective, and our employees, consultants, sales agents, or distributors may engage in conduct for which we might be held responsible. In addition, the government may seek to hold us liable for successor liability FCPA violations committed by any companies in which we invest or that we acquire. Any alleged or actual violations of these regulations may subject us to government scrutiny, severe criminal or civil sanctions and other liabilities, including exclusion from government contracting, and could disrupt our business, and result in a material adverse effect on our reputation, results of operations, financial condition, and cash flows.
Laws and regulations governing the export of our products could adversely impact our business.
The U.S. Department of the Treasury’s Office of Foreign Assets Control (OFAC), and the Bureau of Industry and Security at the U.S. Department of Commerce (BIS), administer certain laws and regulations that restrict U.S. persons and, in some instances, non-U.S. persons, in conducting activities, transacting business with or making investments in certain countries, governments, entities and individuals subject to U.S. economic sanctions. Due to our international operations, we are subject to such laws and regulations, which are complex, restrict our business dealings with certain countries and individuals, and are constantly changing. Further restrictions may be enacted, amended, enforced or interpreted in a manner that materially impacts our operations.
From time to time, certain of our subsidiaries have limited business dealings in countries subject to comprehensive sanctions, including Iran, Sudan, Syria, Cuba and those in the region of Crimea. Certain of our subsidiaries sell medical devices and surgical tools, and may provide related services, to distributors and other purchasing bodies in such countries. These business dealings represent an insignificant amount of our consolidated revenues and income, but expose us to a heightened risk of violating applicable sanctions regulations. Violations of these regulations are punishable by civil penalties, including fines, denial of export privileges, injunctions, asset seizures, debarment from government contracts and revocations or restrictions of licenses, as well as criminal fines and imprisonment. We have established policies and procedures designed to assist with our compliance with such laws and regulations. However, there can be no assurance that our policies and procedures will effectively prevent us from violating these regulations in every transaction in which we may engage, and such a violation could adversely affect our reputation, business, financial condition, results of operations and cash flows.
Consolidation in the health care industry could have an adverse effect on our revenues and results of operations.
In response to a variety of actions by legislators, regulators, and third party payers to reduce the perceived rise in healthcare costs, many health care industry companies, including health care systems, are consolidating to create new companies with greater market power. As the health care industry consolidates, competition to provide goods and services to industry participants will become more intense. These industry participants may try to use their market power to negotiate price concessions or reductions for medical devices that incorporate components produced by us. If we are forced to reduce our prices because of consolidation in the health care industry, our revenues would decrease and our consolidated earnings, financial condition, and/or cash flows would suffer.
Our business is indirectly subject to health care industry cost-containment measures that could result in reduced sales of medical devices and medical devices containing our components.
Most of our customers, and the health care providers to whom our customers supply medical devices, rely on third-party payers, including government programs and private health insurance plans, to reimburse some or all of the cost of the procedures in which medical devices that incorporate components we manufacture or assemble are used. The continuing efforts of governmental authorities, insurance companies, and other payers of health care costs to contain or reduce these costs could lead to patients being unable to obtain approval for payment from these third-party payers. If third-party payer payment approval cannot be obtained by patients, sales of finished medical devices that include our components may decline significantly and our customers may reduce
23
or eliminate purchases of our components. The cost-containment measures that health care providers are instituting, both in the U.S. and internationally, could harm our ability to operate profitably. For example, managed care organizations have successfully negotiated volume discounts for pharmaceuticals.
In an effort to reduce costs, many existing and potential customers for our products within the U.S. have become members of group purchase organizations (GPOs) and integrated delivery networks (IDNs). GPOs and IDNs negotiate pricing arrangement with healthcare product manufacturers and distributors and offer the negotiated prices to affiliated hospitals and other members. GPOs and IDNs typically award contracts on a category-by-category basis through a competitive bidding process. Bids are generally solicited from multiple manufacturers with the intention of driving down pricing. Due to the highly competitive nature of the GPO and IDN contracting processes, we may not be able to obtain or maintain contract positions with major GPOs and IDNs across our product portfolio. Furthermore, the increasing leverage of organized buying groups may reduce market prices for our products, thereby reducing our profitability.
While having a contract with a GPO and IDN for a given product category can facilitate sales to members of that GPO or IDN, such contract positions can offer no assurance that sales volumes of those products will be maintained. GPOs and IDNs increasingly are awarding contracts to multiple suppliers for the same product category. Even when we are the sole contracted supplier of a GPO or IDN for a certain product category, members of the GPO or IDN generally are free to purchase from other suppliers. Furthermore, GPO and IDN contracts typically are terminable without cause upon 60 to 90 days’ notice. Accordingly, although we have multiple contracts with many major GPOs and IDNs, the members of such groups may choose to purchase from our competitors due to the price or quality offered by such competitors, which could result in a decline in our sales and profitability.
Our research and development efforts rely upon investments and investment collaborations, and we cannot guarantee that any previous or future investments or investment collaborations will be successful.
Our strategy to provide a broad range of therapies to restore patients to fuller, healthier lives requires a wide variety of technologies, products, and capabilities. The rapid pace of technological development in the medical industry and the specialized expertise required in different areas of medicine make it difficult for one company alone to develop a broad portfolio of technological solutions. In addition to internally generated growth through our research and development efforts, historically we have relied, and expect to continue to rely, upon investments and investment collaborations to provide us access to new technologies both in areas served by our existing businesses as well as in new areas.
We expect to make future investments where we believe that we can stimulate the development or acquisition of new technologies and products to further our strategic objectives and strengthen our existing businesses. Investments and investment collaborations in and with medical technology companies are inherently risky, and we cannot guarantee that any of our previous or future investments or investment collaborations will be successful or will not materially adversely affect our consolidated earnings, financial condition, and/or cash flows.
The continuing development of many of our products depends upon us maintaining strong relationships with health care professionals.
If we fail to maintain our working relationships with health care professionals, many of our products may not be developed and marketed in line with the needs and expectations of the professionals who use and support our products, which could cause a decline in our earnings and profitability. The research, development, marketing, and sales of many of our new and improved products is dependent upon our maintaining working relationships with health care professionals. We rely on these professionals to provide us with considerable knowledge and experience regarding the development, marketing, and sale of our products. Physicians assist us as researchers, marketing and product consultants, inventors, and public speakers. If we are unable to maintain our strong relationships with these professionals and continue to receive their advice and input, the development and marketing of our products could suffer, which could have a material adverse effect on our consolidated earnings, financial condition, and/or cash flows.
We are increasingly dependent on sophisticated information technology systems to operate our business and many of our products and services include integrated software and information technology. If we fail to properly maintain the integrity of our systems and data, if our products and services do not operate as intended, or we experience a cyber-attack or other breach of these systems or products, our business could be materially affected.
We are increasingly dependent on sophisticated information technology for our products and infrastructure. We rely on information technology systems to process, transmit and store electronic information in our day-to-day operations, and routinely process, store and transmit large amounts of data in our operations, including sensitive personal information as well as proprietary or confidential information. In addition, many of our products and services incorporate software and information technology that allows patients and physicians to be connected or to collect data regarding a patient and the therapy he or she is receiving.
24
The size and complexity of our information technology systems makes them vulnerable to increasingly sophisticated cyber-attacks, breakdown, destruction, loss or compromise of data, obsolescence or incompatibility among systems, or other significant disruption including power outages and telecommunications failures. Unauthorized persons may attempt to hack into our products or systems to obtain personal data relating to patients or employees, our confidential or proprietary information or confidential information we hold on behalf of third parties. If third parties successfully hack into or interfere with our implanted or connected products or services, they may create issues with product functionality that could pose a risk of loss of data, a risk to patient safety, and a risk of product recall or field activity. We have programs in place to detect, contain and respond to data security incidents, and we make ongoing improvements to our information-sharing products in order to minimize vulnerabilities, in accordance with industry and regulatory standards. However, because the techniques used to obtain unauthorized access or sabotage systems change frequently and may be difficult to detect, we may not be able to anticipate and prevent these intrusions or mitigate them when and if they occur.
We also rely on third party vendors to supply and/or support certain aspects of our information technology systems. Third party systems may contain defects in design or manufacture or other problems that could unexpectedly compromise information security of our own systems, and we are dependent on these third parties to deploy appropriate security programs to protect their systems.
In addition, we continue to grow in part through new business acquisitions. With this growth we will continue to consolidate and integrate the number of systems we operate, and to upgrade and expand our information system capabilities for stable and secure business operations.
If we are unable to maintain reliable information technology systems and prevent data breaches, we may suffer regulatory consequences in addition to business consequences. Our worldwide operations mean that we are subject to data protection and cyber security laws and regulations in many jurisdictions, and that some of the data we process, store and transmit may be transmitted across countries. In the U.S., HIPAA privacy and security rules require certain of our operations to protect the confidentiality of patient medical records and other health information, and the Federal Trade Commission has begun to assert authority over protection of privacy and the use of cyber security in information systems, particularly in the area of online communications and mobile healthcare applications, in which we have a growing presence. In Europe, the General Data Protection Regulation requires us to manage individually identifiable information in the E.U. and, in the event of violations, may impose fines of up to four percent of our global revenue. China and Russia have also passed laws that require individually identifiable data on their citizens to be maintained on local servers and that may restrict transfer or processing of that data. We believe that we meet the expectations of applicable regulations and that the ongoing costs and impacts of ensuring compliance with such rules are not material to our business. However, there is no guarantee that we will avoid enforcement actions by governmental bodies. Enforcement actions can be costly and interrupt regular operations of our business. In addition, there has been a developing trend of civil lawsuits and class actions relating to breaches of consumer data held by large companies. While Medtronic has not been named in any such suits, if a substantial breach or loss of data from our records were to occur, we could become a target of such litigation.
Our information systems require an ongoing commitment of significant resources to maintain, protect, and enhance existing systems and develop new systems to keep pace with continuing changes in information processing technology, evolving legal and regulatory standards, the increasing need to protect patient and customer information, and the information technology needs associated with our changing products and services. There can be no assurance that our process of consolidating the number of systems we operate, upgrading and expanding our information systems capabilities, continuing to build security into the design of our products, protecting and enhancing our systems and developing new systems to keep pace with continuing changes in information processing technology will be successful or that additional systems issues will not arise in the future. Any significant breakdown, intrusion, interruption, corruption, or destruction of these systems, as well as any data breaches, could have a material adverse effect on our business. If we fail to maintain or protect our information systems and data integrity effectively, we could expose patients or employees to financial or medical identity theft, suffer a loss of product functionality, lose existing customers, have difficulty attracting new customers, have difficulty preventing, detecting, and controlling fraud, be exposed to the loss or misuse of confidential information, have disputes with customers, physicians, and other health care professionals, suffer regulatory sanctions or penalties under federal laws, state laws, or the laws of other jurisdictions, experience increases in operating expenses, incur expenses or lose revenues as a result of a data privacy breach, or suffer other adverse consequences including legal action and damage to our reputation.
Negative conditions in global credit markets may impair our ability to issue debt securities, including our commercial paper program and the liquidity and/or market value of investments in marketable debt securities such as our other fixed income securities, which may cause us losses and liquidity issues.
We have investments in marketable debt securities that are classified and accounted for as available-for-sale. Our debt securities include government and agency securities, corporate debt securities, certificates of deposit, debt funds, and mortgage-backed and other asset-backed securities. Market conditions over the past several years have included periods of significant economic uncertainty and at times general market distress. During these periods, we may experience reduced liquidity across the fixed-income investment market, including the securities in which we invest. In the event we need to sell these securities, we may not
25
be able to do so in a timely manner or for a value that is equal to the underlying principal. In addition, we may be required to adjust the carrying value of the securities and record an impairment charge. If we determine that the fair value of such securities is temporarily impaired, we would record a temporary impairment as a component of accumulated other comprehensive (loss) income within shareholders’ equity. If it is determined that the fair value of these securities is other-than-temporarily impaired, we would record a loss in our consolidated statements of earnings, which could materially adversely impact our results of operations and financial condition.
Negative market conditions may also impair our ability to access the capital markets through the issuance of commercial paper or debt securities, or may impact our ability to sell such securities at a reasonable price and may negatively impact our ability to borrow from financial institutions.
Our products are continually the subject of clinical trials conducted by us, our competitors, or other third parties, the results of which may be unfavorable, or perceived as unfavorable, and could have a material adverse effect on our business, financial condition, and results of operations.
As a part of the regulatory process of obtaining marketing clearance for new products and new indications for existing products, we conduct and participate in numerous clinical trials with a variety of study designs, patient populations, and trial endpoints. Unfavorable or inconsistent clinical data from existing or future clinical trials conducted by us, by our competitors, or by third parties, or the market’s or U.S. FDA’s perception of this clinical data, may adversely impact our ability to obtain product approvals, our position in, and share of, the markets in which we participate, and our business, financial condition, and results of operations.
Failure to integrate acquired businesses into our operations successfully could adversely affect our business.
As part of our strategy to develop and identify new products and technologies, we have made several acquisitions in recent years, including the 2015 acquisition of Covidien, and may make additional acquisitions in the future. Our integration of the operations of acquired businesses requires significant efforts, including the coordination of information technologies, research and development, sales and marketing, operations, manufacturing, and finance. These efforts result in additional expenses and involve significant amounts of management’s time that cannot then be dedicated to other projects. Our failure to manage and coordinate the growth of the combined company successfully could also have an adverse impact on our business. In addition, we cannot be certain that the businesses we acquire will become profitable or remain so. Factors that will affect the success of our acquisitions include:
|
•
|
the presence or absence of adequate internal controls and/or significant fraud in the financial systems of acquired companies,
|
|
•
|
our ability or inability to integrate information technology systems of acquired companies in a secure and reliable manner,
|
|
•
|
adverse developments arising out of investigations by governmental entities of the business practices of acquired companies, including potential liability imposed by FCPA,
|
|
•
|
any decrease in customer loyalty and product orders caused by dissatisfaction with the combined companies’ product lines and sales and marketing practices, including price increases,
|
|
•
|
our ability to retain key employees, and
|
|
•
|
the ability of the combined company to achieve synergies among its constituent companies, such as increasing sales of the combined company’s products, achieving cost savings, and effectively combining technologies to develop new products.
|
We also could experience negative effects on our results of operations, cash flows, and financial condition from acquisition-related charges, amortization of intangible assets and asset impairment charges. These effects, individually or in the aggregate, could cause a deterioration of our credit rating and result in increased borrowing costs and interest expense.
The expansion of our services and solutions business may not yield the revenue we expect and will expose us to new risks.
We are increasingly focusing on our services and solutions businesses and the creation of comprehensive value-based healthcare offerings, in which payment is based on measurable patient outcomes over a specific time horizon. These offerings include care management services, cath lab and operating room managed services, and solutions for chronic disease management. We intend to expand our services and solutions model across all of our business groups and across geographic regions. However, we remain in the relatively early stages of developing and implementing this business model. As a result, we will need to invest significant expense and management resources into developing our expertise and executing our strategies, and our efforts may not be profitable.
26
In addition, the expansion of our services and solutions business model will expose us to, or increase our exposure to, a variety of regulations in the various countries we provide services and solutions, including regulations related to government payments, fraud and abuse, patient privacy, and the corporate practice of medicine. Compliance with these regulations may prove to be more costly than we anticipate, and we may not successfully comply with such regulations. These regulatory costs may slow our expansion into these business areas and may have a negative effect on our results of operations, cash flows, and financial condition.
The medical device industry is the subject of numerous governmental investigations into marketing and other business practices. These investigations could result in the commencement of civil and/or criminal proceedings, substantial fines, penalties, and/or administrative remedies, divert the attention of our management, and have an adverse effect on our financial condition and results of operations.
We are subject to rigorous regulation by the U.S. FDA and numerous other federal, state, and non-U.S. governmental authorities. These authorities have been increasing their scrutiny of our industry. We occasionally receive subpoenas or other requests for information from state and federal governmental agencies, including, among others, the U.S. Department of Justice and the Office of Inspector General of HHS. These investigations typically relate primarily to financial arrangements with health care providers, regulatory compliance, and product promotional practices.
We cooperate with these investigations and respond to such requests. However, when an investigation begins, we cannot predict when it will be resolved, the outcome of the investigation, or its impact on us. An adverse outcome in one or more of these investigations could include the commencement of civil and/or criminal proceedings, substantial fines, penalties, and/or administrative remedies, including exclusion from government reimbursement programs, entry into Corporate Integrity Agreements (CIAs) with governmental agencies and amendments to existing CIAs. In addition, resolution of any of these matters could involve the imposition of additional and costly compliance obligations. Finally, if these investigations continue over a long period of time, they could divert the attention of management from the day-to-day operations of our business and impose significant administrative burdens, including cost, on us. These potential consequences, as well as any adverse outcome from these investigations or other investigations initiated by a government at any time, could have a material adverse effect on our financial condition and results of operations.
Our substantial leverage and debt service obligations could adversely affect our business.
As of April 29, 2016, our total consolidated external debt was approximately $31.2 billion. We may also incur additional indebtedness in the future. Our substantial indebtedness could have adverse consequences, including:
|
•
|
making it more difficult for us to satisfy our financial obligations;
|
|
•
|
increasing our vulnerability to adverse economic, regulatory and industry conditions, and placing us at a disadvantage compared to our competitors that are less leveraged;
|
|
•
|
limiting our ability to compete and our flexibility in planning for, or reacting to, changes in our business and the industry in which we operate;
|
|
•
|
limiting our ability to borrow additional funds for working capital, capital expenditures, acquisitions and general corporate or other purposes; and
|
|
•
|
exposing us to greater interest rate risk.
|
Our debt service obligations will require us to use a portion of our operating cash flow to pay interest and principal on indebtedness instead of for other corporate purposes, including funding future expansion of our business, acquisitions, and ongoing capital expenditures, which could impede our growth. Our ability to make payments on, and to refinance, our indebtedness, and to fund capital expenditures will depend on our ability to generate cash in the future. This is subject to general economic, financial, competitive, legislative, regulatory and other factors, many of which are beyond our control.
Changes in tax laws or exposure to additional income tax liabilities could have a material impact on our financial condition and results of operations.
We are subject to income taxes as well as non-income based taxes, in both the U.S. and various jurisdictions outside the U.S. We are subject to ongoing tax audits in various jurisdictions. Tax authorities may disagree with certain positions we have taken and assess additional taxes. We regularly assess the likely outcomes of these audits in order to determine the appropriateness of our tax provision. However, there can be no assurance that we will accurately predict the outcomes of these audits, and the actual outcomes of these audits could have a material impact on our consolidated earnings and financial condition. Additionally, changes in tax laws or tax rulings could materially impact our effective tax rate. For example, legislation in 2010 imposed a 2.3 percent excise tax on medical device manufacturers for U.S. sales of medical devices beginning in January 2013. Proposals for fundamental U.S. corporate tax reform, if enacted, could have a material impact on our financial condition and results of operations.
27
Medtronic, Inc. tax court proceeding outcome could have an adverse impact on our financial condition.
In March 2009, the IRS issued its audit report for Medtronic Inc.'s fiscal years 2005 and 2006. Medtronic, Inc. reached agreements with the IRS on some, but not all matters related to these fiscal years. On December 23, 2010, the IRS issued a statutory notice of deficiency with respect to the remaining issues. Medtronic, Inc. filed a petition with the U.S. Tax Court on March 21, 2011 objecting to the deficiency. During October and November 2012, Medtronic, Inc. reached a resolution with the IRS on various matters, including the deductibility of a settlement payment. Medtronic, Inc. and the IRS agreed to hold one issue, the calculation of amounts eligible for the one-time repatriation holiday, because such issue was being addressed by other taxpayers in litigation with the IRS. The remaining unresolved issue relates to the allocation of income between Medtronic, Inc. and its wholly-owned subsidiary operating in Puerto Rico, which is one of the Company's key manufacturing sites. The Tax Court proceeding with respect to this issue began on February 3, 2015 and ended on March 12, 2015. The U.S. Tax Court issued its opinion on June 9, 2016. The U.S. Tax Court generally rejected the IRS’s position, but also made certain modifications to the Medtronic, Inc. tax returns as filed. Final resolution of this matter is not expected until the end of calendar 2016 or later if the tax court opinion is appealed.
Examination and audits by tax authorities could result in additional tax payments, which could have a material adverse effect on our and Covidien’s business, results of operations, financial condition and cash flow.
The Company has provided reserves for potential payments of tax to various tax authorities related to uncertain tax positions. However, the calculation of such tax liabilities involves the application of complex tax regulations in many jurisdictions. Therefore, any dispute with a tax authority may result in a payment that is significantly different from current estimates. If payment of these amounts ultimately proves to be less than the recorded amounts, the reversal of the liabilities generally would result in tax benefits being recognized in the period when we determine the liabilities are no longer necessary. If the Company’s estimate of tax liabilities proves to be less than the amount for which it is ultimately liable, we would incur additional charges to expense and such charges could have a material adverse effect on our business, results of operations, financial condition and cash flows.
If the distribution of Mallinckrodt ordinary shares to Covidien shareholders in 2013, or certain internal transactions undertaken in anticipation of the 2013 separation, are determined to be taxable for U.S. federal income tax purposes, we could incur significant U.S. federal income tax liabilities.
Covidien received an IRS ruling substantially to the effect that, for U.S. federal income tax purposes, (i) certain transactions effected in connection with its 2013 separation of Mallinckrodt qualify as transactions under Sections 355 and/or 368(a) of the Code, and (ii) the distribution qualifies as a transaction under Sections 355 and 368(a)(1)(D) of the Code. In addition to obtaining the IRS ruling, Covidien received a tax opinion from Skadden, Arps, Slate, Meagher & Flom LLP, in form and substance acceptable to Covidien, which relied on the effectiveness of the IRS ruling, substantially to the effect that, for U.S. federal income tax purposes, the distribution and certain transactions entered into in connection with the distribution qualify as transactions under Sections 355 and/or 368(a) of the Code.
The private letter rulings and the opinions relied on certain facts and assumptions, and certain representations and undertakings in the case of the 2013 separation, from Covidien and Mallinckrodt, regarding the past and future conduct of their respective businesses and other matters. Notwithstanding the private letter rulings and the tax opinions, the IRS could determine on audit that the 2013 distribution or the related internal transactions should be treated as taxable transactions if it determines that any of the respective facts, assumptions, representations or undertakings is not correct or has been violated, or that the distributions should be taxable for other reasons, including as a result of significant changes in stock or asset ownership after the distributions, or if the IRS were to disagree with the conclusions of the tax opinions that are not covered by the IRS rulings.
We could incur significant U.S. federal income tax liabilities or tax indemnification obligations, whether under applicable law or the tax matters agreement that was entered into with Mallinckrodt, if it is ultimately determined that certain related transactions undertaken in anticipation of the 2013 distribution are taxable.
Our tax position may be adversely affected by changes in tax law relating to multinational corporations.
Recent legislative proposals have aimed to expand the scope of U.S. corporate tax residence, limit the ability of foreign-owned corporations to deduct interest expense, tax the accumulated unrepatriated earnings of foreign subsidiaries of U.S. corporations, impose a minimum tax on the future offshore earnings of U.S. multinational groups, and to make other changes in the taxation of multinational corporations.
Additionally, the U.S. Congress, government agencies in non-U.S. jurisdictions where we and our affiliates do business, and the Organisation for Economic Co-operation and Development have recently focused on issues related to the taxation of multinational corporations. One example is in the area of “base erosion and profit shifting,” where profits are claimed to be earned for tax purposes in low-tax jurisdictions, or payments are made between affiliates from a jurisdiction with high tax rates to a jurisdiction with lower tax rates. The Organisation for Economic Co-operation and Development has released several components of its
28
comprehensive plan to create an agreed set of international rules for fighting base erosion and profit shifting. As a result, the tax laws in the U.S., Ireland and other countries in which we and our affiliates do business could change on a prospective or retroactive basis, and any such changes could materially adversely affect our business.
Moreover, tax authorities may carefully scrutinize companies that result from a cross-border business combination (such as us), which may lead such authorities to assert that we owe additional taxes, which could have a material adverse effect on our business, results of operations, financial condition, and cash flows.
Risks Relating to Our Jurisdiction of Incorporation
Irish law differs from the laws in effect in the U.S. and may afford less protection to holders of our securities.
It may not be possible to enforce court judgments obtained in the U.S. against us in Ireland based on the civil liability provisions of the U.S. federal or state securities laws. In addition, there is some uncertainty as to whether the courts of Ireland would recognize or enforce judgments of U.S. courts obtained against us or our directors or officers based on the civil liabilities provisions of the U.S. federal or state securities laws or hear actions against us or those persons based on those laws. We have been advised that the U.S. currently does not have a treaty with Ireland providing for the reciprocal recognition and enforcement of judgments in civil and commercial matters. Therefore, a final judgment for the payment of money rendered by any U.S. federal or state court based on civil liability, whether or not based solely on U.S. federal or state securities laws, would not automatically be enforceable in Ireland.
As an Irish company, we are governed by the Irish Companies Acts, which differ in some material respects from laws generally applicable to U.S. corporations and shareholders, including, among others, differences relating to interested director and officer transactions and shareholder lawsuits. Likewise, the duties of directors and officers of an Irish company generally are owed to the company only. Shareholders of Irish companies generally do not have a personal right of action against directors or officers of the company and may exercise such rights of action on behalf of the company only in limited circumstances. Accordingly, holders of our securities may have more difficulty protecting their interests than would holders of securities of a corporation incorporated in a jurisdiction of the U.S.
A transfer of our shares, other than ones effected by means of the transfer of book-entry interests in the Depository Trust Company, may be subject to Irish stamp duty.
Transfers of our shares effected by means of the transfer of book entry interests in the Depository Trust Company (DTC) will not be subject to Irish stamp duty. However, if you hold our shares directly rather than beneficially through DTC, any transfer of your shares could be subject to Irish stamp duty (currently at the rate of 1% of the higher of the price paid or the market value of the shares acquired). Payment of Irish stamp duty is generally a legal obligation of the transferee. The potential for stamp duty could adversely affect the price of your shares.
In certain limited circumstances, dividends we pay may be subject to Irish dividend withholding tax and dividends received by Irish residents and certain other shareholders may be subject to Irish income tax.
In certain limited circumstances, dividend withholding tax (currently at a rate of 20%) may arise in respect of dividends paid on our shares. A number of exemptions from dividend withholding tax exist such that shareholders resident in the U.S. and other specified countries may be entitled to exemptions from dividend withholding tax.
Shareholders resident in the U.S. that hold their shares through DTC will not be subject to dividend withholding tax, provided the addresses of the beneficial owners of such shares in the records of the brokers holding such shares are recorded as being in the U.S. (and such brokers have further transmitted the relevant information to a qualifying intermediary appointed by us). However, other shareholders may be subject to dividend withholding tax, which could adversely affect the price of their shares.
Shareholders entitled to an exemption from Irish dividend withholding tax on dividends received from us will not be subject to Irish income tax in respect of those dividends unless they have some connection with Ireland other than their shareholding in our Company (for example, they are resident in Ireland). Shareholders who receive dividends subject to Irish dividend withholding tax will generally have no further liability to Irish income tax on those dividends.
Our shares received by means of a gift or inheritance could be subject to Irish capital acquisitions tax.
Irish capital acquisitions tax (CAT) could apply to a gift or inheritance of our shares irrespective of the place of residence, ordinary residence or domicile of the parties. This is because our shares will be regarded as property situated in Ireland. The person who receives the gift or inheritance has primary liability for CAT. Gifts and inheritances passing between spouses are exempt from CAT. Children have a tax-free threshold which Irish Revenue typically updates annually in respect of taxable gifts or inheritances received from their parents.
29
Risks Relating to the Covidien Acquisition (the Transaction)
We may not realize all of the anticipated benefits of the Transactions or those benefits may take longer to realize than expected. We may also encounter significant unexpected difficulties in integrating Medtronic, Inc. and Covidien.
Our ability to realize the anticipated benefits of the Transaction will depend, to a large extent, on our ability to integrate the Medtronic, Inc. and Covidien businesses. The combination of two independent businesses is a complex, costly and time-consuming process. As a result, we will be required to devote significant management attention and resources to integrating the business practices and operations of Medtronic, Inc. and Covidien. The integration process may disrupt the businesses and, if implemented ineffectively or if impacted by unforeseen negative economic or market conditions or other factors, we may not realize the full anticipated benefits of the transaction. Our failure to meet the challenges involved in integrating the two businesses to realize the anticipated benefits of the transaction could cause an interruption or a loss of momentum in, our activities and could adversely affect our results of operations.
In addition, the overall integration of the businesses may result in material unanticipated problems, expenses, liabilities, competitive responses, loss of customer relationships, and diversion of management’s attention. The difficulties of combining the operations of the companies include, among others:
|
•
|
the diversion of management’s attention to integration matters;
|
|
•
|
difficulties in achieving anticipated cost savings, synergies, business opportunities and growth prospects from combining the businesses;
|
|
•
|
difficulties in the integration of operations and systems;
|
|
•
|
difficulties in the assimilation of employees;
|
|
•
|
difficulties in managing the expanded operations of a significantly larger and more complex company;
|
|
•
|
challenges in keeping existing customers and obtaining new customers; and
|
|
•
|
challenges in attracting and retaining key personnel.
|
Many of these factors will be outside of our control and any one of them could result in increased costs, decreases in the amount of expected revenues and diversion of management’s time and energy, which could materially impact our business, financial condition and results of operations. In addition, even if the operations of the businesses of Medtronic, Inc. and Covidien are integrated successfully, we may not realize the full benefits of the Transaction, including the synergies, cost savings or sales or growth opportunities that we expect. These benefits may not be achieved within the anticipated time frame, or at all. Furthermore, additional unanticipated costs may be incurred in the integration of the businesses of Medtronic, Inc. and Covidien. All of these factors could negatively impact our earnings per share, decrease or delay the expected accretive effect of the transaction, and negatively impact the price of our ordinary shares. As a result, we cannot assure you that the combination of the Medtronic, Inc. and Covidien businesses will result in the realization of the full benefits anticipated from the transaction.
Future potential changes to the U.S. tax laws could result in us being treated as a U.S. corporation for U.S. federal tax purposes, and the IRS may not agree with the conclusion that we should be treated as a foreign corporation for U.S federal income tax purposes.
Because we are an Irish incorporated entity, we would generally be classified as a foreign corporation under the general rule that a corporation is considered tax resident in the jurisdiction of its organization or incorporation for U.S. federal income tax purposes. Even so, the IRS may assert that we should be treated as a U.S. corporation (and, therefore, a U.S. tax resident) for U.S. federal income tax purposes pursuant to Section 7874 of the U.S. Internal Revenue Code of 1986, as amended (the Code).
Under Section 7874 of the Code, if Medtronic Inc.’s shareholders immediately prior to the Transaction hold 80% or more of the vote or value of our shares by reason of holding stock in Medtronic, Inc. immediately after the Transaction (the ownership test), and our expanded affiliated group after the Transaction does not have substantial business activities in Ireland relative to its worldwide activities (the substantial business activities test), we would be treated as a U.S. corporation for U.S. federal income tax purposes. Based on the rules for determining share ownership under Section 7874 of the Code, Medtronic, Inc.’s shareholders received approximately 70% of our ordinary shares (by both vote and value) by reason of holding stock in Medtronic, Inc. Therefore, under current law, we should not be treated as a U.S. corporation for U.S. federal income tax purposes. However, there is limited guidance regarding the application of Section 7874, including the application of the ownership test.
In addition, changes to Section 7874 or the U.S. Treasury regulations promulgated thereunder could affect our status as a foreign corporation for U.S. federal tax purposes. Any such changes could have prospective or retroactive application.
Since Section 7874 was enacted, there have been various legislative proposals to broaden its scope. Such proposals could, among other things, treat a foreign acquiring corporation as a U.S. corporation under Section 7874 if the former shareholders of the U.S. corporation own more than 50% of the shares of the foreign acquiring corporation after the transaction, or if the foreign corporation’s affiliated group has substantial business activities in the U.S. and the foreign corporation is primarily managed and controlled in
30
the U.S. Accordingly, if enacted in their present form and retroactively effective to apply to the Transactions, such proposals could cause us to be treated as a U.S. corporation for U.S. federal tax purposes.
If we were to be treated as a U.S. corporation for federal tax purposes, based on our existing expected cash flows, we could be subject to substantially greater U.S. tax liability than currently contemplated as a non-U.S. corporation.
Specifically, if we were to be treated as a U.S. corporation for federal tax purposes, we would be subject to U.S. corporate income tax on our worldwide income, and the income of our foreign subsidiaries would be subject to U.S. tax when repatriated or when deemed recognized under the U.S. tax rules for controlled foreign corporations (CFC's). Additionally, Covidien's foreign corporations, which are not currently CFC's, would become CFC's making them potentially subject to current or future U.S. taxation, which could have a material adverse effect on our results of operations, financial condition, and cash flows.
The U.S. Treasury Department and the IRS may promulgate rules that would adversely affect our tax position.
The U.S. Treasury Department has announced that it is examining possible changes in the regulatory rules affecting companies that move their tax domicile outside the U.S. In the event the U.S. Treasury Department and the IRS were to change the applicable regulatory rules, we could face potentially substantial tax costs as a result of the Transactions. We are unable to assess the potential impact of any such possible changes, if adopted, until they are announced.
On September 22, 2014, the U.S. Treasury Department and the IRS issued new guidance announcing their intention to issue regulations interpreting multiple sections of the Code, including Section 7874, to address inversion transactions and transactions that Treasury and the IRS characterize as “post-inversion tax avoidance transactions” (the IRS Notice). When issued, such regulations would apply to transactions completed on or after September 22, 2014. The regulations described in the IRS Notice would expand the set of circumstances under which Section 7874 applies to cause the foreign acquirer of a U.S. corporation to be treated as a U.S. corporation for U.S. federal income tax purposes. Such regulations would also impose additional U.S. taxes on certain transactions involving the acquired U.S. corporation’s CFC’s.
The regulations interpreting Section 7874 of the Code announced in the IRS Notice are not expected to cause us to be treated as a U.S. corporation for U.S. federal tax purposes. However, if ultimately upheld by a reviewing court, the regulations announced in the IRS Notice would be expected to limit our ability to engage in various intercompany transactions involving non-U.S. subsidiaries.
In addition, in the IRS Notice, the U.S. Treasury Department and the IRS announced their intention to issue additional guidance in the future intended to restrict our ability to undertake certain transactions which could reduce our U.S. tax liability. According to the IRS Notice, such guidance may include, among other things, limitations on our ability to deduct interest on certain intercompany debt for U.S federal income tax purposes. We are unable to predict the likelihood that any such guidance will be issued, the nature of regulations that may be promulgated thereunder or the effect such guidance may have on our business.
The Transaction may not allow us to maintain competitive global cash management and a competitive effective corporate tax rate.
While we believe that being incorporated in Ireland should help us maintain a competitive worldwide effective corporate tax rate and provide flexible global cash management, we cannot give any assurance as to what our effective tax rate nor global cash accessibility will be, however, because of, among other things, uncertainty regarding the tax policies of the jurisdictions where we will operate. Additionally, the tax laws of Ireland and other jurisdictions could change in the future, and such changes could cause a material change in our effective tax rate or global cash accessibility.
Legislative or other governmental action relating to the denial of U.S. federal or state governmental contracts to U.S. companies that redomicile abroad could adversely affect our business.
Various U.S. federal and state legislative proposals that would deny governmental contracts to U.S. companies that move their corporate location abroad may affect us. We are unable to predict the likelihood that, or final form in which, any such proposed legislation might become law, the nature of the regulations that may be promulgated under any future legislative enactments, or the effect such enactments and increased regulatory scrutiny may have on our business.
None.
31
Our principal executive office is located in Ireland and is leased by us. Our main operational offices are owned by us and located in the Minneapolis, Minnesota metropolitan area.
Our total manufacturing and research space is approximately 14 million square feet. Approximately 72 percent of the manufacturing or research facilities are owned by us and the balance is leased. The following is a summary of our largest manufacturing or research facilities by location:
|
Location Country or State
|
Square Feet (in thousands)
|
||
|
China
|
1,182
|
|
|
|
South Carolina
|
1,146
|
|
|
|
Connecticut
|
1,098
|
|
|
|
Minnesota
|
1,024
|
|
|
|
Mexico
|
959
|
|
|
|
Puerto Rico
|
831
|
|
|
|
Ireland
|
640
|
|
|
|
Florida
|
550
|
|
|
|
Massachusetts
|
504
|
|
|
|
California
|
502
|
|
|
|
Illinois
|
459
|
|
|
|
Italy
|
454
|
|
|
|
Texas
|
431
|
|
|
|
Switzerland
|
347
|
|
|
|
Arizona
|
294
|
|
|
|
Indiana
|
291
|
|
|
|
Colorado
|
287
|
|
|
|
Nebraska
|
281
|
|
|
|
Georgia
|
236
|
|
|
|
Japan
|
220
|
|
|
|
Dominican Republic
|
217
|
|
|
|
Canada
|
206
|
|
|
We also maintain sales offices in the U.S. at 12 locations in 10 states and outside the U.S. at 202 locations in 67 countries. Most of these locations are leased. We are using substantially all of our currently available productive space to develop, manufacture, and market our products. Our facilities are in good operating condition, suitable for their respective uses, and adequate for current needs.
A discussion of the Company’s legal proceedings is contained in Note 15 to the consolidated financial statements in “Item 8. Financial Statements and Supplementary Data” in this Annual Report on Form 10-K.
Not applicable.
32
The Company’s ordinary shares are listed on the New York Stock Exchange under the symbol “MDT.”
In January 2015, the Company's Board of Directors authorized, subject to the ongoing existence of sufficient distributable reserves, the adoption of the existing Medtronic, Inc. share redemption program. As of
April 29, 2016
, the Company had used all of the 80 million shares authorized under the January 2015 share redemption program. In June 2015, the Company's Board of Directors authorized, subject to the ongoing existence of sufficient distributable reserves, the redemption of an additional
80 million
of the Company's ordinary shares. As of
April 29, 2016
, the Company had used 8 million of the 80 million shares authorized under the June 2015 share redemption program. As authorized by the Board of Directors, our share redemption program expires when the total number of authorized shares have been redeemed.
The following table provides information about shares redeemed by the Company during the fourth quarter of fiscal year 2016:
|
Fiscal Period
|
Total Number of
Shares Purchased
|
Average Price
Paid per Share
|
Total Number of Shares
Purchased as a Part of
Publicly Announced
Program
|
Maximum Number
of Shares that May
Yet Be Purchased
Under the Program
|
|||||||||
|
1/30/2016-2/26/2016
|
2,700,350
|
|
$
|
74.08
|
|
2,700,350
|
|
77,939,900
|
|
||||
|
2/27/2016-4/1/2016
|
3,710,152
|
|
75.47
|
|
3,710,152
|
|
74,229,748
|
|
|||||
|
4/2/2016-4/29/2016
|
2,351,007
|
|
76.56
|
|
2,351,007
|
|
71,878,741
|
|
|||||
|
Total
|
8,761,509
|
|
$
|
75.34
|
|
8,761,509
|
|
71,878,741
|
|
||||
On June 20, 2016, there were approximately 40,100 shareholders of record of the Company’s ordinary shares. Ordinary cash dividends declared and paid totaled 38.0 cents per share for each quarter of fiscal year
2016
and 30.5 cents per share for each quarter of fiscal year
2015
. The following prices are the high and low market sales quotations per share of the Company’s ordinary shares for the quarters indicated:
|
Fiscal
|
1st Quarter
|
2nd Quarter
|
3rd Quarter
|
4th Quarter
|
||||||||||||
|
2016 High
|
$
|
79.08
|
|
$
|
78.91
|
|
$
|
78.92
|
|
$
|
80.74
|
|
||||
|
2016 Low
|
72.20
|
|
55.54
|
|
72.28
|
|
71.03
|
|
||||||||
|
2015 High
|
65.50
|
|
67.11
|
|
77.39
|
|
79.50
|
|
||||||||
|
2015 Low
|
57.81
|
|
59.83
|
|
65.51
|
|
70.91
|
|
||||||||
33
Stock Performance Graph
The following graph compares the cumulative total shareholder return on Medtronic’s ordinary shares with the cumulative total shareholder return on the Standard & Poor’s (S&P) 500 Index and the S&P 500 Health Care Equipment Index for the last five fiscal years. The graph assumes that $100 was invested at market close on April 29, 2011 in Medtronic’s ordinary shares, the S&P 500 Index, and the S&P 500 Health Care Equipment Index and that all dividends were reinvested.
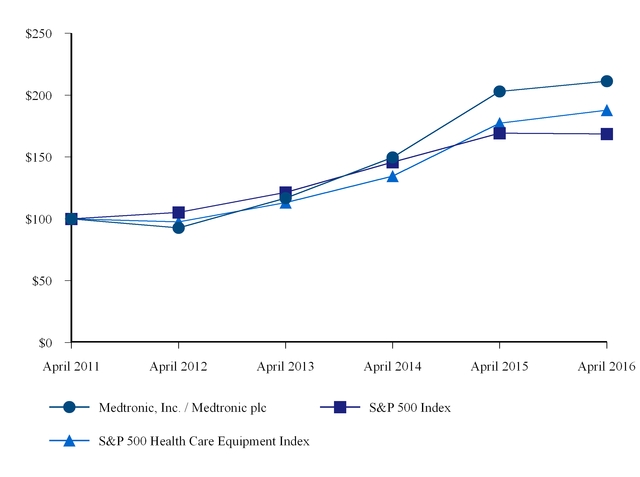
|
Company/Index
|
April 2011
|
April 2012
|
April 2013
|
April 2014
|
April 2015
|
April 2016
|
||||||||||||||||||
|
Medtronic, Inc. / Medtronic plc
|
$
|
100.00
|
|
$
|
92.68
|
|
$
|
116.80
|
|
$
|
149.62
|
|
$
|
203.06
|
|
$
|
211.37
|
|
||||||
|
S&P 500 Index
|
100.00
|
|
105.16
|
|
121.27
|
|
145.85
|
|
169.15
|
|
168.63
|
|
||||||||||||
|
S&P 500 Health Care Equipment Index
|
100.00
|
|
97.46
|
|
113.00
|
|
134.57
|
|
177.23
|
|
187.79
|
|
||||||||||||
For information on our equity compensation plans, see "Item 12. Security Ownership of Certain Beneficial Owners and Management and Related Shareholder Matters" in this Annual Report on Form 10-K.
Irish Restrictions on Import and Export of Capital
The Financial Transfers Act 1992 provides that the Irish Minister for Finance can make provision for the restriction of financial transfers between Ireland and other countries. For the purposes of this Act, “financial transfers” include all transfers which would be movements of capital or payments within the meaning of the treaties governing the European Communities if they had been made between Member States of the Communities. This Act has been used by the Minister for Finance to implement European Council Directives, which provide for the restriction of financial transfers to certain countries, organizations and people including the Al-Qaeda network and the Taliban, Afghanistan, Belarus, Burma (Myanmar), Democratic People’s Republic of Korea, Democratic Republic of Congo, Egypt, Eritrea, Iran, Iraq, Ivory Coast, Lebanon, Liberia, Libya, Republic of Guinea, Somalia, Sudan, and Syria.
34
Irish Taxes Applicable to U.S. Holders
Dividends paid by Medtronic will generally be subject to Irish dividend withholding tax at the standard rate of income tax (currently 20 percent) unless an exemption applies.
Dividends paid to U.S. residents will not be subject to Irish dividend withholding tax provided that:
|
•
|
in the case of a beneficial owner
of Medtronic shares held in the Depository Trust Company (DTC), the address of the beneficial owner in the records of his or her broker is in the United States and this information is provided by the broker to the Company’s qualifying intermediary; or
|
|
•
|
in the case of a record owner, the record owner has provided to the Company’s transfer agent a valid U.S Certification of Residence (Form 6166) or valid Irish Non-Resident Form V2.
|
Irish income tax may also arise with respect to dividends paid on Medtronic’s ordinary shares. A U.S. resident who meets one of the exemptions from dividend withholding tax described above and who does not hold Medtronic shares through a branch or agency in Ireland through which a trade is carried on generally will not have any Irish income tax liability on a dividend paid by Medtronic. In addition, if a U.S. shareholder is subject to the dividend withholding tax, the withholding payment discharges any Irish income tax liability, provided the shareholder furnishes to the Irish Revenue authorities a statement of the dividend withholding tax imposed.
While the U.S./Ireland Double Tax Treaty contains provisions regarding withholding, due to the wide scope of the exemptions from dividend withholding tax available under Irish domestic law, it would generally be unnecessary for a U.S. resident shareholder to rely on the treaty provisions.
35
|
(in millions, except per share data and additional information)
|
Fiscal Year
|
||||||||||||||||||
|
Operating Results for the Fiscal Year:
|
2016
|
2015
(1)
|
2014
|
2013
|
2012
|
||||||||||||||
|
Net sales
|
$
|
28,833
|
|
$
|
20,261
|
|
$
|
17,005
|
|
$
|
16,590
|
|
$
|
16,184
|
|
||||
|
Cost of products sold
|
9,142
|
|
6,309
|
|
4,333
|
|
4,126
|
|
3,889
|
|
|||||||||
|
Research and development expense
|
2,224
|
|
1,640
|
|
1,477
|
|
1,557
|
|
1,490
|
|
|||||||||
|
Selling, general, and administrative expense
|
9,469
|
|
6,904
|
|
5,847
|
|
5,698
|
|
5,623
|
|
|||||||||
|
Special charges (gains), net
|
70
|
|
(38
|
)
|
40
|
|
—
|
|
—
|
|
|||||||||
|
Restructuring charges, net
|
290
|
|
237
|
|
78
|
|
172
|
|
87
|
|
|||||||||
|
Certain litigation charges, net
|
26
|
|
42
|
|
770
|
|
245
|
|
90
|
|
|||||||||
|
Acquisition-related items
|
283
|
|
550
|
|
117
|
|
(49
|
)
|
12
|
|
|||||||||
|
Amortization of intangible assets
|
1,931
|
|
733
|
|
349
|
|
331
|
|
335
|
|
|||||||||
|
Other expense, net
|
107
|
|
118
|
|
181
|
|
108
|
|
364
|
|
|||||||||
|
Operating profit
|
5,291
|
|
3,766
|
|
3,813
|
|
4,402
|
|
4,294
|
|
|||||||||
|
Operating profit margin percentage
|
18.4
|
%
|
18.6
|
%
|
22.4
|
%
|
26.5
|
%
|
26.5
|
%
|
|||||||||
|
Interest expense, net
|
955
|
|
280
|
|
108
|
|
151
|
|
149
|
|
|||||||||
|
Income from continuing operations before income taxes
|
4,336
|
|
3,486
|
|
3,705
|
|
4,251
|
|
4,145
|
|
|||||||||
|
Provision for income taxes
|
798
|
|
811
|
|
640
|
|
784
|
|
730
|
|
|||||||||
|
Income from continuing operations
|
3,538
|
|
2,675
|
|
3,065
|
|
3,467
|
|
3,415
|
|
|||||||||
|
Income from discontinued operations, net of tax
|
—
|
|
—
|
|
—
|
|
—
|
|
202
|
|
|||||||||
|
Net income
|
$
|
3,538
|
|
$
|
2,675
|
|
$
|
3,065
|
|
$
|
3,467
|
|
$
|
3,617
|
|
||||
|
Per Ordinary Share:
|
|
|
|
|
|
|
|
|
|
|
|||||||||
|
Basic - Income from continuing operations
|
$
|
2.51
|
|
$
|
2.44
|
|
$
|
3.06
|
|
$
|
3.40
|
|
$
|
3.24
|
|
||||
|
Basic - Net income
|
2.51
|
|
2.44
|
|
3.06
|
|
3.40
|
|
3.43
|
|
|||||||||
|
Diluted - Income from continuing operations
|
2.48
|
|
2.41
|
|
3.02
|
|
3.37
|
|
3.22
|
|
|||||||||
|
Diluted - Net income
|
2.48
|
|
2.41
|
|
3.02
|
|
3.37
|
|
3.41
|
|
|||||||||
|
Cash dividends declared per ordinary share
|
1.52
|
|
1.22
|
|
1.12
|
|
1.04
|
|
0.97
|
|
|||||||||
|
Financial Position at Fiscal Year-end:
|
|
|
|
|
|
|
|
|
|
|
|||||||||
|
Working capital
|
$
|
16,435
|
|
$
|
21,671
|
|
$
|
15,651
|
|
$
|
13,902
|
|
$
|
10,409
|
|
||||
|
Current ratio
|
3.3:1.0
|
3.4:1.0
|
3.8:1.0
|
4.5:1.0
|
2.8:1.0
|
||||||||||||||
|
Total assets
|
$
|
99,782
|
|
$
|
106,685
|
|
$
|
37,943
|
|
$
|
34,900
|
|
$
|
32,818
|
|
||||
|
Long-term debt
|
30,247
|
|
33,752
|
|
10,315
|
|
9,741
|
|
7,359
|
|
|||||||||
|
Shareholders’ equity
|
52,063
|
|
53,230
|
|
19,443
|
|
18,671
|
|
17,113
|
|
|||||||||
|
Additional Information:
(2)
|
|
|
|
|
|
|
|
|
|
|
|||||||||
|
Full-time employees at year-end
|
88,063
|
|
85,573
|
|
43,305
|
|
42,466
|
|
40,601
|
|
|||||||||
|
Full-time equivalent employees at year-end
|
98,017
|
|
92,500
|
|
49,247
|
|
46,659
|
|
44,944
|
|
|||||||||
(1) Covidien was acquired on January 26, 2015. For further information, see the section entitled "Understanding our Financial Information"
contained in "Item 7. Management's Discussion and Analysis of Financial Condition and Results of Operations."
(2) Employee counts include continuing operations only.
36
Understanding Our Financial Information
The following discussion and analysis provides information management believes to be relevant to understanding the financial condition and results of operations of the Company and its subsidiaries. You should read this discussion and analysis along with our consolidated financial statements and related notes thereto as of
April 29, 2016
and
April 24, 2015
and for each of the three fiscal years ended
April 29, 2016
,
April 24, 2015
, and
April 25, 2014
.
On January 26, 2015, pursuant to the Transaction Agreement, the Company acquired Covidien and Medtronic, Inc. (collectively, the Transactions). Following the consummation of the Transactions, Medtronic, Inc. and Covidien became subsidiaries of the Company. In connection with the Transactions, the Company became the successor registrant to Medtronic, Inc. and re-registered as a public limited company organized under the laws of Ireland. For the fiscal year ended April 24, 2015, the results of operations of Covidien are reflected in Medtronic’s results of operations for only the fourth quarter due to the timing of the Transactions, which will affect comparability throughout this Annual Report on Form 10-K.
For further information regarding the Acquisition, see the section entitled "Acquisition and Investments - Acquisition of Covidien plc in Fiscal Year 2015" contained in "Item 1. Business" and Note 2 to the consolidated financial statements in “Item 8. Financial Statements and Supplementary Data” in this Annual Report on Form 10-K.
Organization of Financial Information
Management’s discussion and analysis provides material historical and prospective disclosures designed to enable investors and other users to assess our financial condition and results of operations.
Statements that are forward-looking and not historical in nature are subject to risks and uncertainties. See "Item 1A. Risk Factors" in this Annual Report on Form 10-K and "Cautionary Factors That May Affect Future Results" in this management's discussion and analysis for more information.
The consolidated financial statements are presented within Item 8 of this Annual Report on Form 10-K and include the consolidated statements of income, consolidated statements of comprehensive income, consolidated balance sheets, consolidated statements of shareholders’ equity, consolidated statements of cash flows, and the related notes, which are an integral part of the consolidated financial statements.
Financial Trends
Throughout this management’s discussion and analysis, we present certain financial measures that management uses to evaluate the operational performance of the Company and as a basis for strategic planning; however, such financial measures are not presented in our financial statements prepared in accordance with generally accepted accounting principles in the United States (U.S. GAAP). These financial measures are considered non-GAAP financial measures.
Management uses non-GAAP financial measures to facilitate management’s review of the operational performance of the Company and as a basis for strategic planning. Management believes that non-GAAP financial measures provide useful information to investors regarding the underlying business trends and performance of the Company’s ongoing operations and are useful for period over period comparisons of such operations. The non-GAAP financial measures reflect an additional way of viewing aspects of the Company’s operations. Investors should not consider results reflecting non-GAAP financial measures in isolation from, or as a substitute for, financial information prepared in accordance with U.S. GAAP and are cautioned that Medtronic may calculate results reflecting non-GAAP financial measures in a manner that is different from other companies.
The GAAP to Non-GAAP Reconciliation presents non-GAAP financial measures that exclude the impact of charges or gains that contribute to or reduce earnings and may affect financial trends but which include charges or benefits that result from transactions or events that management believes may or may not recur with similar materiality or impact to our operations in future periods (Non-GAAP Adjustments).
In the event there is a Non-GAAP Adjustment recognized in our operating results, the tax cost or benefit attributable to that item is separately calculated and recorded. Because the effective rate can be significantly impacted by these Non-GAAP Adjustments that take place in the period, we often refer to our tax rate using both the effective rate and the non-GAAP nominal tax rate (Non-GAAP Nominal Tax Rate). The Non-GAAP Nominal Tax Rate is calculated as the provision for income taxes, adjusted for the impact of Non-GAAP Adjustments, as a percentage of income from operations before income taxes, excluding Non-GAAP Adjustments.
37
Free cash flow is a non-GAAP financial measure calculated by subtracting property, plant, and equipment additions from operating cash flows.
Refer to the “GAAP to Non-GAAP Reconciliation," "Income Taxes," and "Summary of Cash Flows" sections for reconciliations of our results of operations prepared in accordance with U.S. GAAP to the adjusted non-GAAP measurements considered by management.
Our fiscal year-end is the last Friday in April, and therefore, the total weeks in a fiscal year can fluctuate between 52 and 53 weeks. Fiscal year 2016 was a 53-week year, with the additional week occurring in the first quarter. Fiscal years
2015
and
2014
were 52-week years.
Executive Level Overview
Medtronic is among the world's largest medical technology, services, and solutions companies - alleviating pain, restoring health, and extending life for millions of people around the world. We employ more than
88,000
full-time employees worldwide, serving physicians, hospitals, and patients in approximately
160
countries. Our primary products include those for cardiac rhythm disorders, cardiovascular disease, advanced and general surgical care, respiratory and monitoring solutions, neurological disorders, spinal conditions and musculoskeletal trauma, urological and digestive disorders, and ear, nose, and throat and diabetes conditions.
Net income for the fiscal year ended
April 29, 2016
was
$3.5 billion
,
$2.48
per diluted share, as compared to net income of
$2.7 billion
,
$2.41
per diluted share, for the fiscal year ended
April 24, 2015
, representing an increase of 32 percent and 3 percent, respectively.
The table below illustrates net sales by operating segment for fiscal years
2016
and
2015
:
|
|
Net Sales
|
|
|||||||||
|
|
Fiscal Year
|
|
|||||||||
|
(dollars in millions; NM - Not Meaningful)
|
2016
|
2015
|
% Change
|
||||||||
|
Cardiac and Vascular Group
|
$
|
10,196
|
|
$
|
9,361
|
|
9
|
%
|
|||
|
Minimally Invasive Therapies Group
(1)
|
9,563
|
|
2,387
|
|
301
|
|
|||||
|
Restorative Therapies Group
|
7,210
|
|
6,751
|
|
7
|
|
|||||
|
Diabetes Group
|
1,864
|
|
1,762
|
|
6
|
|
|||||
|
Total Net Sales
|
$
|
28,833
|
|
$
|
20,261
|
|
42
|
%
|
|||
|
(1)
|
The Minimally Invasive Therapies Group was a new group in the fourth quarter of fiscal year 2015 that contains the majority of Covidien's former operations. Revenue growth is compared to a full year of operations in fiscal year 2016.
|
Our performance for the fiscal year ended
April 29, 2016
was favorably impacted by an additional selling week during the first quarter of fiscal year 2016 due to our 52/53 week fiscal year calendar. Currency translation had an unfavorable impact of
$1.4 billion
on net sales compared to the prior fiscal year. The Cardiac and Vascular Group’s performance was primarily a result of the addition of the Covidien Peripheral business into the Aortic & Peripheral Vascular division and strong net sales across all three divisions: Cardiac Rhythm & Heart Failure, Coronary & Structural Heart, and Aortic & Peripheral Vascular. The Surgical Solutions and Patient Monitoring & Recovery divisions, within the Minimally Invasive Therapies Group, contributed
$5.3 billion
and
$4.3 billion
of revenue, respectively. The Restorative Therapies Group’s performance was a result of solid growth in Surgical Technologies, and was favorably impacted by the addition of the Covidien Neurovascular division, partially offset by declines in Spine and Neuromodulation. The Diabetes Group's performance was primarily due to growth in international markets, driven by the next-generation MiniMed 640G System with the Enhanced Enlite Sensor. See our discussion in the “Net Sales” section of this management’s discussion and analysis for more information on the results of our operating segments.
Acquisition of Covidien
In fiscal year 2015, we acquired Covidien to continue in our mission to create a medical technology and services company with a comprehensive product portfolio and a broad global reach that is better able to improve healthcare outcomes. Covidien meaningfully accelerates our core strategies of therapy innovation, globalization and economic value. The transaction was accounted for as a business combination using the acquisition method of accounting, which requires, among other things, that assets acquired and liabilities assumed be recognized at their fair values at the Acquisition Date.
For further information regarding the Acquisition, see the section entitled “Acquisition and Investments - Acquisition of Covidien” contained in “Item 1. Business,” and Note 2 to the consolidated financial statements in “Item 8. Financial Statements and Supplementary Data” in this Annual Report on Form 10-K. The full text of the Transaction Agreement was filed as Exhibit 2.1 to our Amendment No. 5 to the Registration Statement on Form S-4 filed with the SEC on November 20, 2014.
38
GAAP to Non-GAAP Reconciliation
The following is a reconciliation of our net sales, operating profit, income from operations before income taxes, net income, provision for income taxes, and effective tax rate prepared in accordance with U.S. GAAP to those results after giving effect to adjustments relating to charges or gains that management believes may or may not recur with similar materiality or impact on net income in future periods. We have provided these non-GAAP financial measures, because we believe they provide meaningful information regarding our results on a consistent and comparable basis for the periods presented. Management uses these non-GAAP financial measures to facilitate management's review of the operational performance of the Company and as a basis for strategic planning. Management believes that the resulting non-GAAP financial measures provide useful information to investors regarding the underlying business trends and performance of the Company's ongoing operations and are useful for period over period comparisons of such operations. These non-GAAP financial measures reflect an additional way of viewing aspects of the Company's operations. Investors should not consider results reflecting non-GAAP financial measures in isolation from, or as a substitute for, financial information prepared in accordance with U.S. GAAP and are cautioned that Medtronic may calculate results reflecting non-GAAP financial measures in a manner that is different from other companies.
Refer to the "Cost and Expenses," "Income Taxes," and "Liquidity and Capital Resources" sections of this Management's Discussion and Analysis for more information on the Non-GAAP Adjustments.
|
|
Fiscal year ended April 29, 2016
|
||||||||||||||||||||||
|
(in millions)
|
Net Sales
|
Operating Profit
|
Income from Operations Before Income Taxes
|
Net Income
|
Provision for Income Taxes
(1)
|
Effective Tax Rate
|
|||||||||||||||||
|
GAAP
|
$
|
28,833
|
|
$
|
5,291
|
|
$
|
4,336
|
|
$
|
3,538
|
|
$
|
798
|
|
18.4
|
%
|
||||||
|
Non-GAAP Adjustments:
|
|||||||||||||||||||||||
|
Impact of inventory step-up
|
—
|
|
226
|
|
226
|
|
165
|
|
61
|
|
27.0
|
|
|||||||||||
|
Special charges
|
—
|
|
70
|
|
70
|
|
44
|
|
26
|
|
37.1
|
|
|||||||||||
|
Restructuring charges, net
|
—
|
|
299
|
|
299
|
|
221
|
|
78
|
|
26.1
|
|
|||||||||||
|
Certain litigation charges, net
|
—
|
|
26
|
|
26
|
|
17
|
|
9
|
|
34.6
|
|
|||||||||||
|
Acquisition-related items
|
—
|
|
283
|
|
283
|
|
212
|
|
71
|
|
25.1
|
|
|||||||||||
|
Amortization of intangible assets
|
—
|
|
1,931
|
|
1,931
|
|
1,467
|
|
464
|
|
24.0
|
|
|||||||||||
|
Loss on previously held forward starting interest rate swaps
|
—
|
|
—
|
|
45
|
|
29
|
|
16
|
|
35.6
|
|
|||||||||||
|
Debt tender premium
|
—
|
|
—
|
|
183
|
|
118
|
|
65
|
|
35.5
|
|
|||||||||||
|
Certain tax adjustments
|
—
|
|
—
|
|
—
|
|
417
|
|
(417
|
)
|
—
|
|
|||||||||||
|
Non-GAAP
|
$
|
28,833
|
|
$
|
8,126
|
|
$
|
7,399
|
|
$
|
6,228
|
|
$
|
1,171
|
|
15.8
|
%
|
||||||
|
(1)
|
The tax effect of each Non-GAAP Adjustment is based on the jurisdictions in which the expense (income) is incurred and the tax laws in effect for each such jurisdiction.
|
39
|
|
Fiscal year ended April 24, 2015
|
||||||||||||||||||||||
|
(in millions)
|
Net Sales
|
Operating Profit
|
Income from Operations Before Income Taxes
|
Net Income
|
Provision for Income Taxes
(1)
|
Effective Tax Rate
|
|||||||||||||||||
|
GAAP
|
$
|
20,261
|
|
$
|
3,766
|
|
$
|
3,486
|
|
$
|
2,675
|
|
$
|
811
|
|
23.3
|
%
|
||||||
|
Non-GAAP Adjustments:
|
|||||||||||||||||||||||
|
Impact of inventory step-up
|
—
|
|
623
|
|
623
|
|
455
|
|
168
|
|
27.0
|
|
|||||||||||
|
Impact of product technology upgrade commitment
|
—
|
|
74
|
|
74
|
|
61
|
|
13
|
|
17.6
|
|
|||||||||||
|
Special (gains) charges, net
|
—
|
|
(38
|
)
|
(38
|
)
|
(23
|
)
|
(15
|
)
|
39.5
|
|
|||||||||||
|
Restructuring charges, net
|
—
|
|
252
|
|
252
|
|
180
|
|
72
|
|
28.6
|
|
|||||||||||
|
Certain litigation charges, net
|
—
|
|
42
|
|
42
|
|
27
|
|
15
|
|
35.7
|
|
|||||||||||
|
Acquisition-related items
|
—
|
|
550
|
|
550
|
|
433
|
|
117
|
|
21.3
|
|
|||||||||||
|
Amortization of intangible assets
|
—
|
|
733
|
|
733
|
|
538
|
|
195
|
|
26.6
|
|
|||||||||||
|
Impact of acquisition on interest expense
|
—
|
|
—
|
|
77
|
|
49
|
|
28
|
|
36.4
|
|
|||||||||||
|
Certain tax adjustments
|
—
|
|
—
|
|
—
|
|
349
|
|
(349
|
)
|
—
|
|
|||||||||||
|
Non-GAAP
|
$
|
20,261
|
|
$
|
6,002
|
|
$
|
5,799
|
|
$
|
4,744
|
|
$
|
1,055
|
|
18.2
|
%
|
||||||
|
(1)
|
The tax effect of each Non-GAAP Adjustment is based on the jurisdictions in which the expense (income) is incurred and the tax laws in effect for each such jurisdiction.
|
|
|
Fiscal year ended April 25, 2014
|
||||||||||||||||||||||
|
(in millions)
|
Net Sales
|
Operating Profit
|
Income from Operations Before Income Taxes
|
Net Income
|
Provision for Income Taxes
(1)
|
Effective Tax Rate
|
|||||||||||||||||
|
GAAP
|
$
|
17,005
|
|
$
|
3,813
|
|
$
|
3,705
|
|
$
|
3,065
|
|
$
|
640
|
|
17.3
|
%
|
||||||
|
Non-GAAP Adjustments:
|
|||||||||||||||||||||||
|
Special charges
|
—
|
|
40
|
|
40
|
|
26
|
|
14
|
|
35.0
|
|
|||||||||||
|
Restructuring charges, net
|
—
|
|
88
|
|
88
|
|
60
|
|
28
|
|
31.8
|
|
|||||||||||
|
Certain litigation charges, net
|
—
|
|
770
|
|
770
|
|
701
|
|
69
|
|
9.0
|
|
|||||||||||
|
Acquisition-related items
|
—
|
|
117
|
|
117
|
|
79
|
|
38
|
|
32.5
|
|
|||||||||||
|
Amortization of intangible assets
|
—
|
|
349
|
|
349
|
|
230
|
|
119
|
|
34.1
|
|
|||||||||||
|
Certain tax adjustments
|
—
|
|
—
|
|
—
|
|
(63
|
)
|
63
|
|
—
|
|
|||||||||||
|
Non-GAAP
|
$
|
17,005
|
|
$
|
5,177
|
|
$
|
5,069
|
|
$
|
4,098
|
|
$
|
971
|
|
19.2
|
%
|
||||||
|
(1)
|
The tax effect of each Non-GAAP Adjustment is based on the jurisdictions in which the expense (income) is incurred and the tax laws in effect for each such jurisdiction.
|
Critical Accounting Estimates
The preparation of the consolidated financial statements, in conformity with U.S. GAAP, requires management to use judgment in making estimates and assumptions that affect the reported amounts of assets, liabilities, revenues, and expenses. These estimates reflect managements' best judgment about economic and market conditions and their potential effects on the valuation and/or carrying value of assets and liabilities based upon relevant information available. We base our estimates on historical experience and on various assumptions that are believed to be reasonable under the circumstances, the results of which form the basis for making judgments about the carrying values of assets and liabilities that are not readily apparent from other sources. See also Note 1 to the consolidated financial statements in “Item 8. Financial Statements and Supplementary Data” in this Annual Report on Form 10-K, which discusses our significant accounting policies.
40
Our critical accounting estimates include the following:
Revenue Recognition
Based upon the lag time between the original sale to distributors at list price and the related distributor rebate earned at time of sale to the end customer and the judgments involved in estimating such rebates, we consider certain Minimally Invasive Therapies Group price adjustment rebates to be a critical accounting estimate. We adjust reserves to reflect differences between estimated and actual experience, and record such adjustment as a reduction of sales in the period of adjustment. Adjustments to recorded reserves have not been significant. Price adjustment rebates charged against gross sales for the fiscal year ended
April 29, 2016
and the fourth quarter of fiscal year 2015 were $2.9 billion and $679 million, respectively.
Litigation Contingencies
We are involved in a number of legal actions involving product liability, intellectual property disputes, shareholder derivative actions, securities class actions, other class actions, income tax matters, and environmental matters. The outcomes of these legal actions are not within our complete control and may not be known for prolonged periods of time. In some actions, the claimants seek damages, as well as other relief (including injunctions barring the sale of products that are the subject of the lawsuit), that could require significant expenditures or result in lost revenues. Estimates of probable losses resulting from litigation, governmental proceedings, and income tax matters involving the Company are inherently difficult to predict, particularly when the matters are in early procedural stages, with incomplete scientific facts or legal discovery; involve unsubstantiated or indeterminate claims for damages; potentially involve penalties, fines, or punitive damages; or could result in a change in business practice. Our significant legal proceedings are discussed in Note 15 to the consolidated financial statements in “Item 8. Financial Statements and Supplementary Data” in this Annual Report on Form 10-K. While it is not possible to predict the outcome for most of the matters discussed in Note 15 to the consolidated financial statements, we believe it is possible that costs associated with these matters could have a material adverse impact on our consolidated earnings, financial position, and/or cash flows.
Income Tax Reserves
We establish reserves when, despite our belief that our tax return positions are fully supportable, we believe that certain positions are likely to be challenged and that we may or may not prevail. These reserves are established and adjusted in accordance with the principles of U.S. GAAP. Under U.S. GAAP, if we determine that a tax position is more likely than not of being sustained upon audit, based solely on the technical merits of the position, we recognize the benefit. We measure the benefit by determining the amount that is greater than 50 percent likely of being realized upon settlement. We presume that all tax positions will be examined by a taxing authority with full knowledge of all relevant information. The calculation of our tax liabilities involves dealing with uncertainties in the application of complex tax regulations in a multitude of jurisdictions across our global operations. We regularly monitor our tax positions and tax liabilities. We reevaluate the technical merits of our tax positions and recognize an uncertain tax benefit, or derecognize a previously recorded tax benefit, when (i) there is a completion of a tax audit, (ii) effective settlement of an issue (iii) there is a change in applicable tax law including a tax case or legislative guidance, or (iv) there is an expiration of the statute of limitations. Significant judgment is required in accounting for tax reserves. Although we believe that we have adequately provided for liabilities resulting from tax assessments by taxing authorities, positions taken by these tax authorities could have a material impact on our effective tax rate, consolidated earnings, financial position and/or cash flows.
Valuation of Intangible Assets and Goodwill
When we acquire a business, the assets acquired and liabilities assumed are recorded at their respective fair values as of the acquisition date. Goodwill is the excess of the purchase price consideration over the estimated fair value of net assets of acquired businesses. Intangible assets include patents, trademarks, tradenames, customer relationships, purchased technology, and IPR&D. Determining the fair value of intangible assets acquired as part of a business combination requires us to make significant estimates. These estimates include the amount and timing of projected future cash flows of each project or technology, the discount rate used to discount those cash flows to present value, the assessment of the asset’s life cycle, and the consideration of legal, technical, regulatory, economic, and competitive risks.
The test for goodwill impairment requires us to make several estimates about fair value, most of which are based on projected future cash flows. Our estimates associated with the goodwill impairment test are considered critical due to the amount of goodwill recorded on our consolidated balance sheets and the judgment required in determining fair value, including projected future cash flows. The Company assesses the impairment of goodwill annually in the third quarter at the reporting unit level and whenever an event occurs or circumstances change that would indicate that the carrying amount may be impaired. Goodwill was
$41.5 billion
and
$40.5 billion
as of
April 29, 2016
and
April 24, 2015
, respectively.
We test definite-lived intangible assets for impairment when an event occurs or circumstances change that would indicate the carrying amount of the assets or asset group may be impaired. Our tests are based on future cash flows that require significant judgment with respect to future revenue and expense growth rates, appropriate discount rate, asset groupings, and other assumptions and estimates. We use estimates that are consistent with our business plans and a market participant view of the assets being evaluated. Actual results may differ from our estimates due to a number of factors including, among others, changes in competitive conditions, timing of regulatory approval, results of clinical trials, changes in worldwide economic conditions, and fluctuations in currency exchange rates. These risk factors are discussed in “Item 1A. Risk Factors” in this Annual Report on Form 10-K. Definite-lived intangible assets, net of accumulated amortization, were
$26.2 billion
and
$27.4 billion
as of
April 29, 2016
and
April 24, 2015
, respectively.
41
The Company assesses the impairment of indefinite-lived intangibles annually in the third quarter and whenever an event occurs or circumstances change that would indicate that the carrying amount may be impaired. Our impairment tests of indefinite-lived intangibles require the Company to make several estimates about fair value, most of which are based on projected future cash flows. Indefinite-lived intangible assets, were
$721 million
and
$720 million
as of
April 29, 2016
and
April 24, 2015
, respectively.
The results of our annual impairment test are discussed in Note 6 to the consolidated financial statements in “Item 8. Financial Statements and Supplementary Data” in this Annual Report on Form 10-K.
Contingent Consideration
Contingent consideration is recorded at the acquisition date at estimated fair value and is remeasured each reporting period with the change in fair value recognized as income or expense within
acquisition-related items
in our consolidated statements of income. Changes to the fair value of contingent consideration can result from changes in the timing and amount of revenue estimates, in the timing or probability of achieving the milestones which trigger payment, or in discount rates. The fair value of contingent consideration was
$377 million
and
$264 million
as of
April 29, 2016
and
April 24, 2015
, respectively.
Net Sales
In the fourth quarter of fiscal year 2015, we amended the way in which we evaluate performance and allocate resources with the acquisition of Covidien. As a result, we began to operate under four reportable segments and four operating segments, the Cardiac and Vascular Group (composed of Cardiac Rhythm & Heart Failure, Coronary & Structural Heart and Aortic & Peripheral Vascular businesses), the Minimally Invasive Therapies Group (composed of Surgical Solutions and Patient Monitoring & Recovery), the Restorative Therapies Group (composed of the Spine, Neuromodulation, Surgical Technologies, and Neurovascular businesses), and the Diabetes Group. See Note 17 to the consolidated financial statements in “Item 8. Financial Statements and Supplementary Data” in this Annual Report on Form 10-K for additional discussion related to our segment reporting.
The table below illustrates net sales by operating segment and division for fiscal years
2016
,
2015
, and
2014
:
|
|
Net Sales
|
|
Net Sales
|
|
|||||||||||||||||
|
|
Fiscal Year
|
|
Fiscal Year
|
|
|||||||||||||||||
|
(dollars in millions; NC - Not Calculable)
|
2016
|
2015
|
% Change
|
2015
|
2014
|
% Change
|
|||||||||||||||
|
Cardiac Rhythm & Heart Failure
|
$
|
5,465
|
|
$
|
5,245
|
|
4
|
%
|
$
|
5,245
|
|
$
|
4,996
|
|
5
|
%
|
|||||
|
Coronary & Structural Heart
|
3,093
|
|
3,038
|
|
2
|
|
3,038
|
|
2,956
|
|
3
|
|
|||||||||
|
Aortic & Peripheral Vascular
(1)
|
1,638
|
|
1,078
|
|
52
|
|
1,078
|
|
895
|
|
20
|
|
|||||||||
|
Total Cardiac and Vascular Group
|
10,196
|
|
9,361
|
|
9
|
|
9,361
|
|
8,847
|
|
6
|
|
|||||||||
|
Surgical Solutions
(1)
|
5,265
|
|
1,293
|
|
307
|
|
1,293
|
|
—
|
|
NC
|
|
|||||||||
|
Patient Monitoring & Recovery
(1)
|
4,298
|
|
1,094
|
|
293
|
|
1,094
|
|
—
|
|
NC
|
|
|||||||||
|
Total Minimally Invasive Therapies Group
(1)
|
9,563
|
|
2,387
|
|
301
|
|
2,387
|
|
—
|
|
NC
|
|
|||||||||
|
Spine
|
2,924
|
|
2,971
|
|
(2
|
)
|
2,971
|
|
3,041
|
|
(2
|
)
|
|||||||||
|
Neuromodulation
|
1,926
|
|
1,977
|
|
(3
|
)
|
1,977
|
|
1,898
|
|
4
|
|
|||||||||
|
Surgical Technologies
|
1,773
|
|
1,671
|
|
6
|
|
1,671
|
|
1,562
|
|
7
|
|
|||||||||
|
Neurovascular
(1)
|
587
|
|
132
|
|
345
|
|
132
|
|
—
|
|
NC
|
|
|||||||||
|
Total Restorative Therapies Group
|
7,210
|
|
6,751
|
|
7
|
|
6,751
|
|
6,501
|
|
4
|
|
|||||||||
|
Diabetes Group
|
1,864
|
|
1,762
|
|
6
|
|
1,762
|
|
1,657
|
|
6
|
|
|||||||||
|
Total
|
$
|
28,833
|
|
$
|
20,261
|
|
42
|
%
|
$
|
20,261
|
|
$
|
17,005
|
|
19
|
%
|
|||||
|
(1)
|
Growth rates are impacted by the acquisition of Covidien in the fourth quarter of fiscal year 2015. Revenue growth is compared to a full year of operations in fiscal year 2016.
|
Cardiac and Vascular Group
The Cardiac and Vascular Group’s products, with specific focus on comprehensive disease management, include pacemakers, insertable and external cardiac monitors, cardiac resynchronization therapy devices (CRT-D), implantable cardioverter defibrillators (ICD), leads and delivery systems, ablation products, electrophysiology catheters, products for the treatment of atrial fibrillation, information systems for the management of patients with Cardiac Rhythm & Heart Failure devices, products designed to reduce surgical site infections, coronary and peripheral stents, balloon, and related delivery systems, endovascular stent graft systems, heart valve replacement technologies, cardiac tissue ablation systems, and open heart and coronary bypass grafting surgical products. The Cardiac and Vascular Group also includes Care Management Services (formerly known as Cardiocom) and Cath Lab Managed Services (CLMS) within the Cardiac Rhythm & Heart Failure division. The Cardiac and
42
Vascular Group's net sales for fiscal year
2016
were
$10.2 billion
, an increase of
9
percent compared to the prior fiscal year. Currency translation had an unfavorable impact on net sales of $572 million as a result of the change in exchange rates from the prior year. The Cardiac and Vascular Group’s performance was favorably impacted by an additional selling week during the first quarter of fiscal year 2016. The Cardiac and Vascular Group’s performance for fiscal year 2016 also benefited from the addition of the Covidien Peripheral business into the Aortic & Peripheral Vascular division and strong net sales across all three divisions. See the more detailed discussion of each division's performance below.
Cardiac Rhythm & Heart Failure net sales for fiscal year
2016
were
$5.5 billion
, an increase of
4 percent
compared to the prior fiscal year. The increase in Cardiac Rhythm & Heart Failure net sales was driven by strong growth in AF Solutions, with the continued global acceptance of our Arctic Front Advance Cardiac CryoAblation Catheter (Arctic Front) system. Additionally, net sales were driven by the continued adoption of the Reveal LINQ insertable cardiac monitor, and the launch of the Evera MRI SureScan ICD in the U.S. during the second quarter of fiscal year 2016, with continued strong adoption through the fourth quarter fiscal year 2016. Net sales for the Cardiac Rhythm & Heart Failure division were also affected by continued pricing pressures.
Coronary & Structural Heart net sales for fiscal year
2016
were
$3.1 billion
, an increase of
2 percent
compared to the prior fiscal year. Nets sales were driven by the CoreValve Evolut R recapturable system in the U.S., which was launched late in the first quarter of fiscal year 2016, and a strong CoreValve launch in Japan in the fourth quarter of fiscal year 2016. In addition, net sales of Coronary & Structural Heart division were driven by drug-eluting stents, including the Resolute Onyx drug-eluting stent in Europe and the Resolute Integrity drug-eluting stent in the U.S., and the recent launches of the NC Euphora and SC Euphora balloon dilatation catheters
.
Net sales were partially offset by continued pricing pressures in our Coronary business.
Aortic & Peripheral Vascular net sales for fiscal year
2016
were
$1.6 billion
, an increase of
52 percent
compared to the prior fiscal year. The Aortic & Peripheral Vascular division net sales performance benefited from the addition of the Covidien Peripheral business. The increase in Aortic & Peripheral Vascular net sales was driven by strong growth of the IN.PACT Admiral drug-coated balloon in the U.S. and globally, continued strength in Valiant Captiva TAA stent graft sales, continued solid adoption of our Aptus Heli-FX endoanchor, and continued adoption of the Endurant IIs Abdominal Aortic Aneurysm (AAA) 3-piece system in the U.S. Net sales for the Aortic & Peripheral Vascular division were affected by increased competition in international markets and reimbursement cuts in Japan.
The Cardiac and Vascular Group's net sales for fiscal year
2015
were
$9.4 billion
, an increase of
6
percent compared to the prior fiscal year. The Cardiac and Vascular Group’s performance was primarily a result of strong net sales in Cardiac Rhythm & Heart Failure and Aortic & Peripheral Vascular and solid growth in Coronary & Structural Heart.
Cardiac Rhythm & Heart Failure net sales for fiscal year
2015
were
$5.2 billion
, an increase of
5
percent compared to the prior fiscal year. The increase in Cardiac Rhythm & Heart Failure net sales was driven by the ongoing acceptance of the Reveal LINQ insertable cardiac monitor and the launches of the Viva XT CRT-D with Attain Performa quadripolar CRT-D lead system in the U.S. in September 2014 and Evera MRI SureScan ICD in Japan in November 2014. Net sales of the Cardiac Rhythm & Heart failure division were also driven by the continued global acceptance of the Arctic Front Advance Cardiac CryoAblation Catheter (Arctic Front) system, net sales from Cardiocom and our CLMS business, which includes the August 2014 acquisition of NGC Medical S.p.A. (NGC).
Coronary & Structural Heart net sales for fiscal year
2015
were
$3.0 billion
, an increase of
3
percent compared to the prior fiscal year. The increase in Coronary & Structural Heart net sales was driven by ongoing success of the CoreValve transcatheter aortic heart valve in the U.S., the launch of the CoreValve Evolute R recapturable system in international markets, and the international launch of the Resolute Onyx drug-eluting stent in November 2014. Net sales were partially offset by continued pricing pressures in the U.S., Western Europe, Japan, and India in our Coronary business.
Aortic & Peripheral Vascular net sales for fiscal year
2015
were
$1.1 billion
, an increase of
20
percent compared to the prior fiscal year. The Aortic & Peripheral Vascular division includes a portion of the Covidien Peripheral business, which contributed strong performance during the fourth quarter of fiscal year 2015 on the strength of its chronic venous insufficiency products. The increase in Aortic & Peripheral Vascular net sales was driven by IN.PACT Admiral drug-coated balloons in the U.S. and international markets. Aortic & Peripheral Vascular net sales were also driven by strong sales of our Valiant Captivia Thoracic Stent Graft System, and growth from the Endurant 2S Abdominal Aortic Aneurysm (AAA) Stent Graft System in the U.S. and Western Europe. Net sales for the Aortic & Peripheral Vascular division were impacted by increased competitive and pricing pressures in the U.S., Western Europe, and Japan.
Looking ahead, we expect our Cardiac and Vascular Group could be affected by the following:
|
•
|
Increasing competition, fluctuations in currency exchange rates, and continued pricing pressures.
|
|
•
|
Continued acceptance and future growth of the Amplia/Compia/Claria family of MRI Quad CRT-D SureScan systems. The Amplia and Compia MRI Quad CRT-D SureScan systems received U.S. FDA approval in February
|
43
2016 and launched in March 2016. The Amplia/Compia/Claria family of MRI Quad CRT-D SureScan systems received CE Mark approval in February 2016. The systems are approved for MRI scans on any part of the body without positioning restrictions.
|
•
|
Continued acceptance and future growth from the Viva/Brava family of CRT-D devices and the Attain Performa portfolio of quadripolar leads. The Viva/Brava family of CRT-D devices utilizes a new algorithm, called AdaptivCRT, which improves patients’ response rates to CRT-D therapy by preserving the patients’ normal heart rhythms and continually adapts to individual patient needs. Paired with Viva/Brava Quad CRT-D, Attain Performa leads provide additional options for physicians to optimize patient therapy. In the second quarter of fiscal year 2015, we received U.S. FDA approval of our Attain Performa quadripolar lead, Viva Quad XT CRT-D, and Viva Quad S CRT-D.
|
|
•
|
Continued acceptance and future growth from the Evera family of ICDs. The Evera family of ICDs has increased battery longevity, advanced shock reduction technology, and a contoured shape with thin, smooth edges that better fits inside the body. Our Evera MRI SureScan ICD received CE Mark approval late in the fourth quarter of fiscal year 2014 and launched in Japan in November 2014. We received U.S. FDA approval of our Evera MRI SureScan ICD in the second quarter of fiscal year 2016.
|
|
•
|
Continued acceptance and future growth from the Advisa DR MRI SureScan pacing system for use in full-body MRI scans. The Advisa DR MRI SureScan is our second-generation MRI pacing system and is the first system to combine advanced pacing technology with proven MRI access. We received U.S. FDA approval of the Advisa SR MRI SureScan single-chamber pacemaker in the first quarter of fiscal year 2016.
|
|
•
|
Continued future growth from the Arctic Front system, including the second generation Arctic Front Advance Cardiac Cryoballoon. The Arctic Front system is a cryoballoon indicated for the treatment of drug refractory paroxysmal atrial fibrillation. The cryoballoon treatment involves a minimally invasive procedure that efficiently creates circumferential lesions around the pulmonary vein, which studies have indicated is the source of erratic electrical signals that cause irregular heartbeat. We received U.S. FDA approval in the first quarter of fiscal year 2016 for the Aortic Front Advance ST Cryoablation Catheter.
|
|
•
|
Continued future growth from Reveal LINQ, our next-generation insertable cardiac monitor launched in international and U.S. markets in the third and fourth quarters of fiscal year 2014, respectively.
|
|
•
|
Acceptance and future growth of our Micra transcatheter pacing system, which received CE Mark approval in April 2015 and U.S. FDA approval in April 2016. Micra is a miniaturized single chamber pacemaker system that is delivered through the femoral vein and is implanted in the right ventricle of the heart. The system does not use a lead and does not have a subcutaneous device pocket underneath the skin as with conventional pacemaker systems.
|
|
•
|
Continued acceptance and future growth from Care Management Service's remote telemonitoring solutions business for the management of chronic diseases such as heart failure, diabetes, and hypertension. Care Management Services has a readmission reduction program focused on minimizing heart failure readmission penalties for U.S. hospitals.
|
|
•
|
Continued acceptance of our CLMS business. CLMS provides a unique service offering, whereby we enter into long-term contracts with hospitals, both within Europe and in certain other regions around the world, to upgrade and more effectively manage their cath lab and hybrid operating rooms. At the end of fiscal year 2016, we had 88 long-term CLMS agreements.
|
|
•
|
Continued acceptance of CoreValve Evolut R, our next-generation recapturable system with differentiated 14-French equivalent delivery system. We have CE Mark approval for the 23 millimeter size of the valve and received CE Mark approval for the 26 and 29 millimeter sizes early in the fourth quarter of fiscal year 2015. We received U.S. FDA approval of the 23, 26, and 29 millimeter sizes in the first quarter of fiscal year 2016.
|
|
•
|
Acceptance of our CoreValve transcatheter heart valve technologies for the replacement of the aortic valve in Japan. We received Japanese regulatory approval in March 2015 and launched in Japan late in the third quarter of fiscal year 2016 following reimbursement approval. We received U.S. FDA approval for valve-in-valve implantation in March 2015.
|
|
•
|
Acceptance of the Resolute Onyx drug-eluting coronary stent, which received CE Mark approval in November 2014. Resolute Onyx builds on the Resolute Integrity drug-eluting coronary stent with thinner struts to improve deliverability and is the first stent to feature our CoreWire technology, allowing greater visibility during the
|
44
procedure. We added new sizes and indications for Resolute Onyx in Europe in the third quarter of fiscal year 2016.
|
•
|
The global stent market continues to experience pricing pressure resulting from government austerity programs and reimbursement cuts in Europe and Japan.
|
|
•
|
Continued worldwide growth of our Euphora Non-Compliant and Semi-Compliant Balloon Dilatation Catheter and our family of coronary guide catheters.
|
|
•
|
Acceptance of the IN.PACT Admiral drug-coated balloon for the treatment of peripheral artery disease in the upper leg. The IN.PACT Admiral drug-coated balloon was launched in the U.S. early in the fourth quarter of fiscal year 2015, and received CE Mark approval in January 2016 for arteriovenous access to help maintain hemodialysis access in patients with end-stage renal disease.
|
|
•
|
Integration of Aptus Endosystems, Inc. (Aptus), acquired in June 2015, into the Aortic & Peripheral division. Aptus is a medical device company focused on developing advanced technology for endovascular aneurysm repair and thoracic endovascular aneurysm repair.
|
|
•
|
Continued and future acceptance of the Endurant family of AAA stent graft products. We received CE Mark and U.S. FDA approval of the Endurant IIs stent graft late in the second quarter of fiscal year 2015. Continued worldwide growth of the Valiant Captivia Thoracic Stent Graft System.
|
|
•
|
Acceptance of our VenaSeal closure system, which was launched in the U.S. in November 2015. The VenaSeal closure system is a minimally invasive procedure that uses a proprietary medical adhesive to close superficial veins of the lower extremities in patients with symptomatic venous reflux.
|
Minimally Invasive Therapies Group
Minimally
Invasive Therapies Group’s goals are to diagnose and intervene earlier, improve treatments, and help patients recover faster. Our technologies and products span the entire continuum of care. The group looks to enhance patient outcomes through minimally invasive solutions with a focus on diseases of the gastrointestinal tract, lungs, pelvic region, kidneys, obesity, and preventable complications. The Surgical Solutions division's products include those for advanced and general surgical care (stapling, vessel sealing, and other surgical instruments), sutures, electrosurgery products, hernia mechanical devices, mesh implants, and solutions for gastrointestinal (GI), advanced ablation, and interventional lung. The Patient Monitoring & Recovery division's products include ventilators, capnography and other airway products, sensors, monitors, compression and dialysis products, enteral feeding, wound care, and medical surgical products (including operating room supply products, electrodes, needles, syringes, and sharps disposals). The Minimally Invasive Therapies Group’s net sales for fiscal year 2016 were $
9.6 billion
. Currency translation had an unfavorable impact on net sales of $493 million as a result of the change in exchange rates from the prior year. The Minimally Invasive Therapies Group was favorably impacted by an additional selling week during the first quarter of fiscal year 2016. The Minimally Invasive Therapies Group contains the majority of Covidien's former operations. See the more detailed discussion of each business’s performance below.
Net sales contributions in Surgical Solutions for fiscal year 2016 were $
5.3 billion
. The net sales performance in Surgical Solutions was mainly attributable to stapling and energy. Stapling products results benefited from continued worldwide market adoption of the Endo GIA Reinforced Reload and energy products benefited from continued strong adoption of the LigaSure Maryland Jaw and Valleylab FT10 Energy Platform. Further, Early Technologies product performance was driven by gastrointestinal solutions products, more specifically, our gastrointestinal diagnostic product line.
Patient Monitoring & Recovery net sales for fiscal year 2016 were $
4.3 billion
. Net sales contributions in Patient Monitoring & Recovery were driven mainly by U.S. sales within Respiratory and Patient Monitoring, Patient Care and Safety, and Nursing Care. Respiratory and Patient Monitoring performance was attributable to sensors, airway products, and acute ventilator sales. Patient Care and Safety net sales results were primarily due to sales of compression and SharpSafety product lines, and sales within our electrode and dialysis products. The Nursing Care results were largely driven by sales of incontinence, enteral feeding and wound care products.
Looking ahead, we expect Minimally Invasive Therapies Group could be impacted by the following:
|
•
|
Continued acceptance and future growth of Open-to-Minimally Invasive Surgery (MIS) techniques and tools supported by our efforts to transition open surgery to MIS. The Open to MIS initiative focuses on establishing our presence in and working to optimize open surgery globally, while capturing the market opportunity that exists in transitioning open procedures to MIS, whether through traditional MIS, or advanced technologies like robotics. To achieve this transition, we are focused on product training, surgical skill training and continued therapy innovation to advance MIS.
|
45
|
•
|
Changes in procedural volumes, competitive pressure, reimbursement challenges, reprocessed products, impacts from changes in the mix of our product offerings, fluctuations in currency exchange rates and pricing pressure, particularly in developed markets.
|
|
•
|
Our ability to create markets and drive product and procedures into emerging markets. We have high quality and cost-effective surgical products designed for customers in emerging markets such as the ReliaMax reusable stapler, which is reposable (part reusable, part disposable), and the ValleyLab LS10 single channel vessel sealing generator, which is compatible with our line of LigaSure instruments and designed for simplified use and affordability.
|
|
•
|
Continued acceptance and future growth within the end stage renal disease market. The population of patients treated for end stage renal disease globally is expected to double over the next decade. We will grow our therapy innovation with scalable and affordable dialysis delivery and investing in vascular creation and maintenance technologies. Our ability to successfully integrate Bellco into Medtronic. Bellco is a pioneer in hemodialysis treatment solutions that we acquired in February 2016.
|
|
•
|
Continued growth due to cross-selling initiatives of Minimally Invasive Therapies Group within other businesses with Medtronic.
|
|
•
|
Continued elevation of the standard of care for respiratory compromise, a progressive condition impacting a patient’s ability to breathe effectively. The Capnostream35 is expected to launch in fiscal year 2017.
|
|
•
|
Creation of less invasive standards of care in diseases and conditions of the gastrointestinal tract and lung to enable earlier diagnosis and intervention.
|
|
•
|
Continued and future acceptance of advanced and general surgical care products from both physicians and patients of open and minimally invasive procedures in Surgical Solutions, including stapling, vessel sealing, and other surgical instruments.
|
|
•
|
Expanding the use of less invasive treatments and furthering our commitment to improving options for women with abnormal uterine bleeding with the fiscal year 2017 acquisition of a highly profitable and fast-growing gynecology business. The addition will expand and strengthen the Minimally Invasive Therapies Group’s offerings and complement the existing global gynecology business.
|
|
•
|
Ability to develop a surgical robotic platform that reduces the variability of surgical procedures and improves the repeatability and reliability of procedures
|
|
•
|
Continued acceptance of other recently launched products including the Endo GIA Reinforced Reload, the LigaSure Maryland jaw laparoscopic sealer and divider, and three additional sizes of the Sonicision Cordless Ultrasonic Dissection Device and the GastriSail Gastric Positioning System.
|
|
•
|
Future acceptance of the Signia Stapling System, expected to launch in fiscal year 2017. The single-hand use increases patient focus and consistent staple lines reduce leaks and tissue trauma.
|
|
•
|
Future acceptance of the HD multi-pass system, expected to launch in fiscal year 2018. The HD multi-pass system reduces infrastructure by requiring less water, has less start-up costs, and offers high quality ultrapure dialysate treatment.
|
|
•
|
Continued acceptance and growth in respiratory care, ventilation and airway management, patient monitoring, and homecare. Key products in this area include the Puritan Bennett 980 ventilator, Microstream Capnography bedside capnography monitor, portable monitor with Nellcor pulse oximetry system with OxiMax technology and the Nellcor Respiratory Compromise monitor with vital signs of SpO2, pulse rate, End-Tidal CO2, and Respiratory Rate.
|
|
•
|
Continued and future acceptance of Early Technologies, including the areas of GI solutions, advanced ablation, and interventional lung solutions. Recently launched products include the PillCam COLON capsule endoscopy, Emprint ablation system with Thermosphere Technology which maintains predictable spherical ablation zones throughout procedures reducing procedure time and cost, and the GenCut core biopsy system and the superDimension Triple Needle Cytology Brush, lung tissue biopsy tools for use with the superDimension navigation system. The superDimension system enables a minimally invasive approach to accessing difficult-to-reach areas of the lung, which can aid in the diagnosis of lung cancer.
|
46
|
•
|
Ability to generate product innovation and adoption of less invasive surgical techniques to help patients recover faster and at less overall cost to the healthcare system. Opportunities exist to provide advanced solutions that minimize complications and increase efficiency. Our goal is to create localized solutions to improve surgical approaches and increase access to care, address economic and clinical challenges, and advance minimally invasive surgery by minimizing complications, thereby reducing surgical variability and increasing efficiency.
|
|
•
|
Continued and future acceptance of the Valleylab FT10 energy platform, which we launched in fiscal year 2016. The faster sealing of the Valleylab FT10 decreases procedure times and auto-adjusting energy accommodates different tissue types.
|
Restorative Therapies Group
The Restorative Therapies Group includes products for various areas of the spine, bone graft substitutes, biologic products, trauma, implantable neurostimulation therapies and drug delivery systems for the treatment of chronic pain, movement disorders, obsessive-compulsive disorder (OCD), overactive bladder, urinary retention, fecal incontinence and gastroparesis, products to treat conditions of the ear, nose, and throat, and systems that incorporate advanced energy surgical instruments. Additionally, this group manufactures and sells image-guided surgery and intra-operative imaging systems. With the addition of the Neurovascular division through the January 2015 Covidien acquisition, the group manufactures and markets products and therapies to treat diseases of the vasculature in and around the brain and includes sales of coils, neurovascular stents and flow diversion products. The Restorative Therapies Group’s net sales for fiscal year
2016
were
$7.2 billion
, an increase of
7 percent
over the prior fiscal year. Currency translation had an unfavorable impact on net sales of approximately $244 million as a result of the change in exchange rates from the prior year. The Restorative Therapies Group's performance was favorably impacted by an additional selling week during the first quarter of fiscal year 2016. The Restorative Therapies Group’s performance for fiscal year
2016
was favorably impacted by the addition of the Neurovascular division, growth in Surgical Technologies, and by an additional selling week during the first quarter of fiscal 2016, partially offset by declines in Neuromodulation and Spine. See the more detailed discussion of each business's performance below.
Spine net sales for fiscal year
2016
were
$2.9 billion
, a decrease of
2 percent
over the prior fiscal year. The decrease in Spine net sales was driven by declines in Core Spine and Interventional, partially offset by growth in BMP (composed of INFUSE bone graft (InductOs in the E.U.)) in the U.S. The U.S. Core Spine market grew in the low-single digits, with modest procedural growth offset by continued pricing pressures. During fiscal year 2016, new product introductions across several procedures, resulted in a sequential improvement in the Core Spine growth rate. We are seeing incremental revenue from our differentiated OLIF procedures, as well as from the recent Solera, Voyager, Elevate, and PTC Interbody launches for TLIF and MIDLF procedures. In Core Spine, we are also realizing some early benefits from our Speed to Scale initiative, which accelerates innovation and enables rapid deployment of these products and procedures to the market. The Interventional Spine net sales decline was driven by continued pricing pressures. In BMP, strong growth in the U.S. was offset by declines in international BMP due to the InductOs stop shipment in Europe which we expect to continue until the back half of fiscal year 2017.
Neuromodulation net sales for fiscal year
2016
were
$1.9 billion
, a decrease of
3 percent
over the prior fiscal year. The decrease in net sales was primarily due to challenges in Drug Pumps and Pain Stimulation, partially offset by growth in Gastro/Uro, with relatively flat results in DBS. In Drug Pumps, the business was negatively affected by challenges related to its April 2015 U.S. FDA consent decree, as well as the January divestiture of its intrathecal baclofen drug. In Pain Stimulation and DBS, declines were driven by increased competition in the market, however, drivers such as the expanded early onset DBS indication in the U.S. that we received earlier this fiscal year and new strategies that focus our pain products on the growing opioid epidemic could improve future results. In Gastro/Uro, implant growth of our InterStim Therapy for overactive bladder, urinary retention, and bowel incontinence continued in the U.S. during fiscal year 2016.
Surgical Technologies net sales for fiscal year
2016
were
$1.8 billion
, an increase of
6 percent
over the prior fiscal year. The increase in net sales was driven by continued worldwide net sales growth across the portfolio of Advanced Energy, ENT, and Neurosurgery. Performance was driven by strong growth of power systems, Aquamantys Transcollation, and PEAK PlasmaBlade technologies, as well as solid growth of Midas Rex products, monitoring, and O-arm imaging systems.
Neurovascular net sales for fiscal year
2016
were
$587 million
. The division contributed revenue from the strength of its coils, stents, flow diversion, and access product lines. Our Solitaire FR mechanical thrombectomy device delivered strong results, solidifying our leadership position in the rapidly expanding ischemic stroke market. Our Flow Diversion products for the treatment of intracranial aneurysms, Pipeline Flex in the U.S. and Japan and Pipeline Shield in Europe, continue to lead the market.
Spine net sales for fiscal year 2015 were $3.0 billion, a decrease of 2 percent over the prior fiscal year. The decrease in Spine's net sales for fiscal year 2015 was driven by declines in Core Spine and Interventional, partially offset by growth in BMP. Both the global and U.S. Core Spine markets grew in the low-single digits, with modest procedural growth offset by continued pricing pressures. During fiscal year 2015, the Core Spine business continued to focus on differentiating itself over the long-term through portfolio updates, procedural innovation, and continued development and deployment of the its Surgical Synergy program that
47
integrates imaging, navigation, and powered surgical instruments. Fiscal year 2015 included several new product launches, including our Prestige LP cervical disc and Pure Titanium Coated (PTC) interbodies spacers, which partially offset declines in Core Spine. Interventional Spine net sales decline was driven by a decline in European sales, where the business faced pricing pressures in Germany and unfavorable currency translation. Underlying demand for BMP stabilized and returned to slight growth in the latter half of fiscal year 2015.
Neuromodulation net sales for fiscal year 2015 were $2.0 billion, an increase of 4 percent over the prior fiscal year. The increase in net sales was primarily due to strong growth in Gastro/Uro and growth in DBS and Pain Stimulation. Our global focus on our neurologist referral programs, and the strength of the EARLYSTIM data in international markets, continues to drive solid growth of DBS systems. Implant growth of our InterStim Therapy for overactive bladder, urinary retention, and bowel incontinence continued in the U.S. throughout fiscal year 2015. The increase in net sales for fiscal year 2015 was also due to global growth of our RestoreSensor SureScan MRI system. While the U.S. pain stimulation market has weakened as a result of reimbursement changes, net sales of our SureScan MRI system for the fiscal year demonstrate our continued strength in the market.
Surgical Technologies net sales for fiscal year 2015 were $1.7 billion, an increase of 7 percent over the prior fiscal year. The increase in net sales was driven by continued worldwide net sales growth across the portfolio of Advanced Energy, ENT, and Neurosurgery, partially offset by unfavorable currency translation. Performance was driven by strong growth of power systems, Aquamantys Transcollation, and PEAK PlasmaBlade technologies, as well as solid growth of Midas Rex products, monitoring, and O-arm imaging systems. Additionally, net sales growth was positively impacted by launch of our NuVent sinus balloons in the second quarter of fiscal year 2015 and the acquisition of Visualase during the first quarter of fiscal year 2015, adding a MRI-guided laser ablation technology to our broad suite of neuroscience solutions for neurosurgery. The increase in revenue from Visualase and our NuVent sinus balloons was partially offset by our divestiture of the MicroFrance product line during the third quarter of fiscal year 2015.
Neurovascular net sales for fiscal year 2015 were $132 million. The division, formerly part of Covidien, contributed revenue from the strength of its coils, stents, flow diversion, and access product lines. The New England Journal of Medicine published several positive clinical trials on our Solitaire FR revascularization device, resulting in continued customer adoption of the product. Additionally, net sales were positively impacted by the U.S. launch of the Pipeline Flex embolization device, which was launched during the third quarter of fiscal year 2015.
Looking ahead, we expect our Restorative Therapies Group could be affected by the following:
|
•
|
Changes in procedural volumes, competitive and pricing pressure, reimbursement challenges, impacts from changes in the mix of our product offerings, the timing of product registration approvals, and fluctuations in currency exchange rates.
|
|
•
|
Continued commercial integration in the Restorative Therapies group and market acceptance of our new integrated solutions through the Surgical Synergy program, which integrates our spinal implants and Surgical Technologies' imaging and navigation equipment.
|
|
•
|
Market acceptance and continued adoption of innovative new products, such as our CD Horizon Solera Voyager system, our ELEVATE expandable interbody cage, and our OLIF25 and OLIF51 procedure solutions, both of which have recently been augmented with new implant technology.
|
|
•
|
Continued pricing and competitive pressures on premium balloon kyphoplasty (BKP) within Interventional Spine. Though we remain focused on communicating the clinical and economic benefits for premium BKP, we expect pressure in several markets to continue. We believe opportunities for growth exist in the broader vertebral compression fracture (VCF) and adjacent markets, and continue to pursue the development of other therapies to treat more patients with VCF, including the recent U.S. launches of both the Kyphon V vertebroplasty system and the Osteocool tumor ablation system.
|
|
•
|
Acceptance of Kanghui's broad portfolio of trauma, spine, and large-joint reconstruction products focused on the growing global value segment.
|
|
•
|
Continued acceptance and adoption rates of stimulators and leads approved to treat chronic pain in major markets around the world.
|
|
•
|
Ongoing obligations under the U.S. FDA consent decree entered in April 2015 relating to the SynchroMed drug infusion system and the Neuromodulation quality system. We continue to make progress against our U.S FDA consent decree commitments.
|
|
•
|
Continued and future acceptance of our current indications for Medtronic DBS Therapy for the treatment of movement disorders, epilepsy (approved in Europe), and OCD. The DBS Therapy portfolio includes Activa
|
48
PC, our small and advanced primary cell battery, and Activa RC, a rechargeable DBS device. We anticipate continued competitive pressures in Europe and expect competition to enter the U.S. market in the coming year.
|
•
|
Continued acceptance of InterStim Therapy for the treatment of the symptoms of overactive bladder, urinary retention, and bowel incontinence.
|
|
•
|
Continued acceptance and growth of our Surgical Technologies therapies, including Advanced Energy products and strategies to focus on its four core markets of orthopedic, spine, breast surgery, and CRDM replacements, Neurosurgery StealthStation S7 and O-Arm Imaging Systems, Midas and ENT power systems, and intraoperative nerve monitoring during surgical procedures utilizing the NIM-Response 3.0 during head and neck surgical procedures. Additionally, continued growth in nerve monitoring utilizing the NIM Eclipse system during spinal surgical procedures.
|
|
•
|
Acceptance of the recently launched NuVent sinus balloon, with built-in surgical EM navigation, used for chronic sinusitis to restore sinus drainage in a minimally invasive way.
|
|
•
|
Continued acceptance and growth of Neurovascular therapies, including the Solitare FR revascularization device for treatment of acute ischemic stroke and the Pipeline Embolization Devices, endovascular treatments for large or giant wide-necked brain aneurysms.
|
|
•
|
Future acceptance of the Medina mesh coil implant launched in European Union in May 2016. Medina Medical was acquired in August 2015 and focuses on the commercialization of treatments for vascular abnormalities of the brain, including cerebral aneurysms.
|
|
•
|
Efficiencies gained from fiscal year 2017 reorganization to provide a stronger focus on the diseases and conditions that we serve to further innovate, integrate platforms and leverage breadth of product portfolio across Restorative Therapies Group. Beginning in the first quarter of fiscal year 2017, the new reporting structure includes Spine, Brain Therapies (consists of Modulation, Neurovascular, and Neurosurgery), Pain Therapies (consists of Stimulation, Pump, and Interventional), and Specialty Therapies (consists of Pelvic Health, Advanced Energy, and ENT).
|
Diabetes Group
The Diabetes Group is composed of the Intensive Insulin Management (IIM), Non-Intensive Diabetes Therapies (NDT) and Diabetes Service & Solutions (DSS) divisions. The Diabetes Group products include insulin pumps, continuous glucose monitoring (CGM) systems, insulin pump consumables, and therapy management software. The Diabetes Group’s net sales for fiscal year 2016 were
$1.9 billion
, an increase of
6
percent over the prior fiscal year, and were favorably affected by an additional selling week during the first quarter of fiscal year 2016. Net sales in the U.S. increased 6 percent compared to the prior fiscal year, driven by the MiniMed 530G System with Enlite sensor in the IIM division. Currency translation had an unfavorable impact on net sales of $101 million as a result of the change in exchange rates from the prior year. The Diabetes Group's performance in international markets was favorably affected by our next-generation MiniMed 640G System with the Enhanced Enlite sensor.
The Diabetes Group’s net sales for fiscal year
2015
were
$1.8 billion
, an increase of 6 percent over the prior fiscal year. The increase in net sales was primarily driven by 9 percent growth in the U.S., driven by the ongoing launch of the MiniMed 530G System with Enlite Sensor. Approval was obtained late in the second quarter of fiscal year 2014. Net sales in the international markets increased 2 percent compared to the prior fiscal year. Performance in international markets was favorably affected by the launch of our next-generation MiniMed 640G System with the Enhanced Enlite CGM sensor in Australia and Europe, partially offset by unfavorable currency translation.
Looking ahead, we expect our Diabetes Group could be impacted by the following:
|
•
|
Increasing competition, potential risk of pricing pressures, reduction in reimbursement rates, and fluctuations in currency exchange rates.
|
|
•
|
Changes in medical reimbursement policies and programs. Continued acceptance and improved reimbursement of CGM technologies.
|
|
•
|
Continued acceptance from both physicians and patients of insulin-pump and CGM therapy.
|
|
•
|
Continued acceptance and future growth of the MiniMed 530G System, available in the U.S., which includes the insulin pump and Enlite sensor. This is the first system in the U.S. that assists in protecting against the risk of hypoglycemia by automatically suspending insulin delivery when glucose falls below a specified threshold.
|
|
•
|
Continued acceptance and future growth from our next-generation pump systems, the MiniMed 640G with SmartGuard predictive low-glucose management, which has launched in Europe, Australia, and select Latin
|
49
America countries, and the MiniMed 620G, the first integrated system customized for the Japanese market. The Company continues to make progress in bringing the MiniMed 640G to the U.S., and plans to submit the premarket approval to the U.S. FDA in the third quarter of fiscal year 2017. In addition, the Company is on track to file its premarket approval to the U.S. FDA for the first hybrid closed loop system by the end of June 2016.
|
•
|
Acceptance of MiniMed Connect, which allows users to view their insulin pump and CGM data on a smartphone and provides remote monitoring and text message notifications. The Company received U.S. FDA approval during the first quarter of fiscal 2016.
|
|
•
|
Selection by UnitedHealthcare as the preferred in-network provider of insulin pumps, giving their members access to our advanced diabetes technology and comprehensive support services.
|
Operations by Market Geography
The graph below illustrates net sales by market geography for fiscal years
2016
,
2015
, and
2014
:
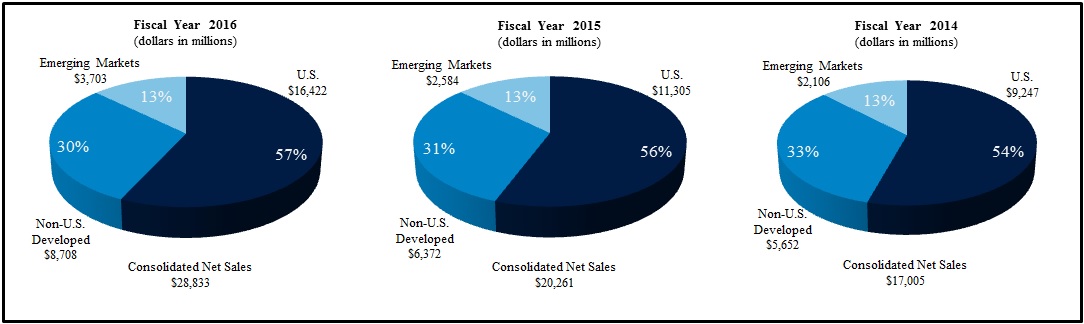
The table below illustrates net sales by market geography for each of our operating segments for fiscal years
2016
and
2015
:
|
Fiscal Year 2016
|
Fiscal Year 2015
|
||||||||||||||||||||||
|
(in millions)
|
U.S.
|
Non-U.S. Developed Markets
|
Emerging Markets
|
U.S.
|
Non-U.S. Developed Markets
|
Emerging Markets
|
|||||||||||||||||
|
Cardiac and Vascular Group
|
$
|
5,347
|
|
$
|
3,283
|
|
$
|
1,566
|
|
$
|
4,435
|
|
$
|
3,412
|
|
$
|
1,514
|
|
|||||
|
Minimally Invasive Therapies Group
|
5,014
|
|
3,299
|
|
1,250
|
|
1,230
|
|
856
|
|
301
|
|
|||||||||||
|
Restorative Therapies Group
|
4,921
|
|
1,542
|
|
747
|
|
4,569
|
|
1,556
|
|
626
|
|
|||||||||||
|
Diabetes Group
|
1,140
|
|
584
|
|
140
|
|
1,071
|
|
548
|
|
143
|
|
|||||||||||
|
Total
|
$
|
16,422
|
|
$
|
8,708
|
|
$
|
3,703
|
|
$
|
11,305
|
|
$
|
6,372
|
|
$
|
2,584
|
|
|||||
For fiscal year
2016
, net sales for the U.S. increased 45 percent, developed markets outside the U.S. increased 37 percent, and emerging markets increased 43 percent compared to the prior fiscal year. Currency translation had an unfavorable impact of $1.4 billion on net sales for fiscal year
2016
. Net sales growth in the U.S. was led by strong growth in the Cardiac and Vascular Group and solid growth in the Restorative Therapies Group and Diabetes. The growth in all markets was primarily driven by the addition of Minimally Invasive Therapies Group net sales totaling $
9.6 billion
for fiscal year 2016 and was also favorably impacted by an additional selling week during the first quarter of fiscal year 2016.
For fiscal year
2015
, net sales for the U.S increased 22 percent, non-U.S. developed markets increased 13 percent, and emerging markets increased 23 percent over the prior fiscal year. Currency translation had an unfavorable impact of $666 million on net sales for fiscal year
2015
. Net sales growth in non-U.S. developed markets was driven by the addition of the Minimally Invasive Therapies Group in the fourth quarter, as a result of the Covidien acquisition, offset by unfavorable currency translation. Emerging markets growth was led by strong growth in the Restorative Therapies Group and Diabetes, solid growth in the Cardiac and Vascular Group, and the addition of the Minimally Invasive Therapies Group in the fourth quarter as a result of the Covidien acquisition, partially offset by unfavorable currency translation.
50
Net sales outside the U.S. are accompanied by certain financial risks, such as changes in currency exchange rates and collection of receivables, which typically have longer payment terms. We monitor the creditworthiness of our customers to which we grant credit terms in the normal course of business. However, a significant amount of our outstanding accounts receivable are with international customers. We continue to monitor the economic conditions in many countries outside the U.S. and the average length of time it takes to collect on our outstanding accounts receivable in these countries. Although we do not currently foresee a significant credit risk associated with a material portion of these receivables, repayment is dependent upon the financial stability of the economies of those countries.
Costs and Expenses
The following is a summary of major costs and expenses as a percent of net sales:
|
|
Fiscal Year
|
|||||||
|
|
2016
|
2015
|
2014
|
|||||
|
Cost of products sold
|
31.7
|
%
|
31.1
|
%
|
25.5
|
%
|
||
|
Research and development expense
|
7.7
|
|
8.1
|
|
8.7
|
|
||
|
Selling, general, and administrative expense
|
32.8
|
|
34.1
|
|
34.4
|
|
||
Cost of Products Sold
We continue to focus on reducing our costs of production through channel optimization, supply chain management, and review of our manufacturing network. Beginning in fiscal year 2015, our product mix has substantially changed with the acquisition of Covidien in fiscal year 2015. The Patient Monitoring & Recovery division within Minimally Invasive Therapies Group, which accounts for approximately 45 percent of Minimally Invasive Therapies Group's net sales, generally realizes a lower average margin due to the type products sold within the division. Therefore, cost of products sold as a percentage of net sales has increased in fiscal years 2016 and 2015. Cost of products sold was
$9.1 billion
,
$6.3 billion
, and
$4.3 billion
in fiscal years
2016
,
2015
, and
2014
, respectively.
We have recognized amortization of the adjustment related to inventory fair value from the Covidien acquisition to cost of products sold totaling $226 million and $623 million in fiscal years 2016 and 2015, respectively. Additionally, in fiscal year 2015, cost of products sold included a $74 million charge related to a CRHF global comprehensive program for home based monitors due to industry conversion from analog to digital technology. Restructuring charges included in cost of products sold totaled $9 million, $15 million, and $10 million in fiscal years
2016
,
2015
, and
2014
, respectively, for inventory write-offs of discontinued product lines. These charges affect the comparability of our operating results between periods, therefore, we consider this a Non-GAAP Adjustment, refer to the "Executive Level Overview" section of this Management's Discussion and Analysis for further analysis related to these charges.
Research and Development
We remain committed to accelerating the development of meaningful innovations to deliver better patient outcomes at appropriate costs, lead to enhanced quality of life, and can be validated by clinical and economic evidence. We are also focused on expanding access to quality healthcare. During fiscal year 2016, we continued to invest in new technologies to support our mission with several new acquisitions, as well as, continued product growth within our business units.
Research and development expense for fiscal year
2016
,
2015
, and
2014
was
$2.2 billion
,
$1.6 billion
, and
$1.5 billion
, respectively. Research and development expense remained fairly flat as a percentage of net sales over the three-year period.
Selling, General, and Administrative
Our goal is to continue selling, general, and administrative expense leverage initiatives and to continue to realize cost synergies expected from the acquisition of Covidien. During fiscal year 2016, we realized a 1.3 percentage point decrease in our selling, general, and administrative expense percentage to net sales as a result of these initiatives.
Selling, general, and administrative expense was
$9.5 billion
,
$6.9 billion
, and
$5.8 billion
during fiscal years
2016
,
2015
, and
2014
, respectively.
51
The following is a summary of other costs and expenses:
|
Fiscal Year
|
|||||||||||
|
(in millions)
|
2016
|
2015
|
2014
|
||||||||
|
Special charges (gains), net
|
$
|
70
|
|
$
|
(38
|
)
|
$
|
40
|
|
||
|
Restructuring charges, net
|
290
|
|
237
|
|
78
|
|
|||||
|
Certain litigation charges, net
|
26
|
|
42
|
|
770
|
|
|||||
|
Acquisition-related items
|
283
|
|
550
|
|
117
|
|
|||||
|
Amortization of intangible assets
|
1,931
|
|
733
|
|
349
|
|
|||||
|
Other expense, net
|
107
|
|
118
|
|
181
|
|
|||||
|
Interest expense, net
|
955
|
|
280
|
|
108
|
|
|||||
Special Charges (Gains), Net
During fiscal year
2016
, we recognized special charges of
$70 million
in connection with the impairment of a debt investment.
During fiscal year 2015, we recognized special gains of
$138 million
, which consisted of a
$41 million
gain on the sale of a product line in the Surgical Technologies division, and a
$97 million
gain on the sale of an equity method investment
.
During fiscal year 2015 and 2014, consistent with our commitment to improving the health of people and communities throughout the world, we made charitable contributions of
$100 million
and
$40 million
, respectively, to the Medtronic Foundation, which is a related party non-profit organization.
Special charges (gains), net will affect the comparability of our operating results between periods, and we consider this a Non-GAAP Adjustment, refer to the "Executive Level Overview" section of this Management's Discussion and Analysis for further analysis related to these charges.
Restructuring Charges, Net
We incur restructuring charges in connection with our cost-reduction and productivity initiatives or with acquisitions when we implement plans to restructure and integrate the acquired operations. Amounts recognized as restructuring charges result from a series of judgments and estimates about future events and uncertainties and rely heavily on assumptions upon implementation of the initiative programs. Restructuring programs will affect the comparability of our operating results between periods, and we consider this a Non-GAAP Adjustment. Refer to the "Executive Level Overview" section of this Management's Discussion and Analysis.
We began our restructuring program related to the acquisition of Covidien, the cost synergies initiative, in the fourth quarter of fiscal year 2015. We anticipate approximately $850 million in cost synergies to be achieved as a result of the Covidien acquisition through fiscal year 2018, including administrative office optimization, manufacturing and supply chain infrastructure, and certain general and administrative savings. Restructuring charges are expected to be incurred in future fiscal years as cost synergy initiatives are finalized. Restructuring charges are expected to be primarily related to employee termination costs and costs related to manufacturing and facility closures.
Currently, we have
several initiative programs in various states of progress with total restructuring liabilities of
$257 million
and
$233 million
at
April 29, 2016
and
April 24, 2015
, respectively. During fiscal year 2016, we incurred
$332 million
in restructuring charges,
$9 million
of which was related to inventory write-offs of discontinued product lines recognized within
cost of products sold
in the consolidated statements of income. These charges were partially offset by a
$33 million
reversal of excess restructuring reserves.
For additional information, see Note 3 to the consolidated financial statements in “Item 8. Financial Statements and Supplementary Data” in this Annual Report on Form 10-K.
Certain Litigation Charges, Net
We classify material litigation charges and gains recognized as certain litigation charges, net. Certain litigation charges, net will affect the comparability of our operating results between periods, and we consider this a Non-GAAP Adjustment, refer to the "Executive Level Overview" section of this Management's Discussion and Analysis. During fiscal years 2016 and 2015, we recorded certain litigation charges, net of
$26 million
and
$42 million
, respectively, which primarily relate to additional accounting charges for probable and reasonably estimable INFUSE product liability litigation, which were recorded as a result of additional filed and unfiled claims, and other litigation matters. See Note 15 to the consolidated financial statements in “Item 8. Financial Statements and Supplementary Data” in this Annual Report on Form 10-K for additional information.
52
During fiscal year 2014, we recorded certain litigation charges, net of
$770 million
, which primarily included the global patent settlement agreement with Edwards Lifesciences Corporation of
$589 million
, and accounting charges for probable and reasonably estimable INFUSE product liability litigation of
$140 million
.
Acquisition-Related Items
During fiscal year
2016
, we recorded charges from acquisition-related items of
$283 million
, primarily related to costs incurred in connection with the Covidien acquisition. The charges incurred in connection with the Covidien acquisition include
$219 million
of professional services and integration costs and
$58 million
of accelerated or incremental stock compensation expense.
During fiscal year 2015, we recorded charges from acquisition-related items of $550 million, primarily related to costs incurred in connection with the Covidien acquisition. The charges incurred in connection with the Covidien acquisition include $275 million of professional services and integration costs, $189 million of accelerated or incremental stock compensation expense, and $69 million of incremental officer and director excise tax.
During fiscal year 2014, we recorded net charges from acquisition-related items of $
117 million
, primarily including IPR&D and long-lived asset impairment charges of $
236 million
related to the Ardian, Inc. acquisition recorded in the third quarter of fiscal year 2014. The impairment charges were partially offset by income of $
138 million
related to the change in fair value of contingent consideration associated with acquisitions subsequent to April 29, 2009.
Acquisition-related items will affect the comparability of our operating results between periods, and we consider this a Non-GAAP Adjustment. Refer to the "Executive Level Overview" section of this Management's Discussion and Analysis. See Note 2 to the consolidated financial statements in “Item 8. Financial Statements and Supplementary Data” in this Annual Report on Form 10-K for further discussion on IPR&D charges.
Amortization of Intangible Assets
Amortization of intangible assets includes the amortization expense of our definite-lived intangible assets consisting of purchased patents, trademarks, tradenames, purchased technology, and other intangible assets. Amortization of intangible assets will affect the comparability of our operating results between periods, therefore we consider this a Non-GAAP Adjustment, refer to the "Executive Level Overview" section of this Management's Discussion and Analysis for further details related to this expense.
In fiscal year
2016
, amortization expense was
$1.9 billion
as compared to
$733 million
in fiscal year
2015
. The $1.2 billion increase in amortization expense in fiscal year
2016
was primarily due to realizing a full year impact of amortization of intangibles acquired with Covidien in the fourth quarter of fiscal year 2015.
In fiscal year
2015
, amortization expense was
$733 million
, an increase of $384 million from
$349 million
in fiscal year
2014
. The increase was primarily due to the fourth quarter fiscal year 2015 acquisition of Covidien, which added $379 million in amortization expense and fiscal year 2014 acquisitions of TYRX, Corventis, Inc. and Visualase, Inc., partially offset by reduced ongoing amortization expense from certain intangible assets that became fully amortized.
Other Expense, Net
Other expense, net includes royalty income and expense, realized equity security gains and losses, realized currency transaction and derivative gains and losses, impairment charges on equity securities, the Puerto Rico excise tax, and the U.S. medical device excise tax. In fiscal year
2016
, other expense, net was $
107 million
, a decrease of $11 million from $
118 million
in the prior fiscal year. The largest contributor to the change in other expense, net was an increase in net realized currency gains, which were partially offset by increased royalty expense within Minimally Invasive Therapies Group, and a write-off of a minority investment in the current year. Total net realized currency gains recorded in
other expense, net
were $314 million in fiscal year
2016
compared to gains of $196 million in the prior fiscal year. Looking ahead, we expect other expense, net will be impacted as a result of the suspension of the U.S. medical device excise tax for two years beginning January 1, 2016 and ending December 31, 2017.
In fiscal year
2015
, other expense, net was $
118 million
, a decrease of $63 million from $
181 million
in the prior fiscal year. The decrease was primarily due to an increase in net realized currency gains partially offset by increased royalties in our Structural Heart business and increased U.S. medical device excise tax, which for fiscal year 2015 was $135 million compared to $112 million in the prior fiscal year. Total net realized currency gains recorded in
other expense, net
were $196 million in fiscal year
2016
compared to gains of $43 million in the prior fiscal year.
Interest Expense, Net
Interest expense, net includes interest earned on our cash, cash equivalents and investments, interest incurred on our outstanding borrowings, amortization of debt issuance costs and debt discounts, the net realized and unrealized gain or loss on trading securities, ineffectiveness on interest rate derivative instruments, and the net realized gain or loss on the sale or impairment of available-for-sale debt securities. In fiscal year
2016
, interest expense, net was
$955 million
, as compared to
$280 million
in fiscal year
2015
. The increase in interest expense, net for fiscal year 2016 was largely driven by an increase in total short-term and long-term borrowings, primarily resulting from the Covidien acquisition, and a
$183 million
charge recorded
53
in connection with the cash tender offer and redemption of certain outstanding debt securities, as discussed within the “Liquidity and Capital Resources" section of this management’s discussion and analysis. In addition, during the second quarter of fiscal year 2016 we incurred a
$45 million
loss on interest rate swaps, which were previously entered into in advance of a planned debt issuance that is no longer expected after the internal reorganization of the ownership of certain legacy Covidien businesses completed in the second quarter of fiscal year 2016. The Company treats this interest expense charge, as well as the
$183 million
charge associated with the cash tender offer and redemption as Non-GAAP Adjustments. The increase in interest expense, net during fiscal year
2016
was partially offset by increased interest income earned on higher investment balances, as compared to fiscal year
2015
. Based on current expected rates, we expect interest expense, net to increase in future quarters as our investment balances decline resulting from the deployment of capital, including incremental share repurchases and net debt reduction.
In fiscal year
2015
, interest expense, net was $
280 million
, as compared to $
108 million
in fiscal year 2014. For fiscal year
2015
, the increase in interest expense, net was primarily due to the impact of the incremental interest expense resulting from the issuance of $17.0 billion of debt to fund the Covidien acquisition and the $3.0 billion term loan funded in January 2015. The $17.0 billion debt resulted in $77 million of incremental interest expense in the third quarter of fiscal year 2015 prior to the close of the Covidien transaction. The Company treated this interest expense item as a Non-GAAP Adjustment.
See our discussion in the “Liquidity and Capital Resources” section of this management’s discussion and analysis for more information regarding our investment portfolio.
Income Taxes
|
|
Fiscal Year
|
||||||||||
|
(in millions)
|
2016
|
2015
|
2014
|
||||||||
|
Provision for income taxes
|
$
|
798
|
|
$
|
811
|
|
$
|
640
|
|
||
|
Income from operations before taxes
|
$
|
4,336
|
|
$
|
3,486
|
|
$
|
3,705
|
|
||
|
Effective tax rate
|
18.4
|
%
|
23.3
|
%
|
17.3
|
%
|
|||||
|
Non-GAAP provision for income taxes
|
$
|
1,171
|
|
$
|
1,055
|
|
$
|
971
|
|
||
|
Non-GAAP income from operations before taxes
|
$
|
7,399
|
|
$
|
5,799
|
|
$
|
5,069
|
|
||
|
Non-GAAP Nominal Tax Rate
|
15.8
|
%
|
18.2
|
%
|
19.2
|
%
|
|||||
|
Difference between the effective tax rate and Non-GAAP Nominal Tax Rate
|
(2.6
|
)%
|
(5.1
|
)%
|
1.9
|
%
|
|||||
Our effective tax rate for fiscal year 2016 was 18.4 percent compared to 23.3 percent in the prior fiscal year. The decrease in our effective tax rate was due to the net tax impact of inventory step-up, debt tender premium, acquisition-related items, certain tax adjustments, amortization of intangible assets, the impact from the acquisition of Covidien, operational tax benefits described below, and year-over-year changes in operational results by jurisdiction.
Our Non-GAAP Nominal Tax Rate for fiscal year 2016 was 15.8 percent compared to 18.2 percent in the prior fiscal year. The decrease in our Non-GAAP Nominal Tax Rate for fiscal year 2016 as compared to the prior fiscal year was primarily due to the impact of the Covidien acquisition, operational tax benefits, and year-over-year changes in operational results by jurisdiction.
During fiscal year 2016, we recorded $97 million in operational tax benefits. The retroactive renewal and extension of the U.S. federal research and development tax credit resulted in a $16 million operational tax benefit for fiscal year 2016. In addition, we recorded a $40 million benefit from the reversal of a valuation allowance associated with foreign net operating losses, and a $41 million net benefit associated with the resolution of certain income tax audits, finalization of certain tax returns, and changes to uncertain tax position reserves.
Our effective tax rate for fiscal year 2015 was 23.3 percent compared to 17.3 percent from the prior fiscal year. The increase in our effective tax rate was due to the net tax impact of special charges (gains), net, restructuring charges, net, certain litigation charges, net, acquisition-related items, certain tax adjustments, the impact from the acquisition of Covidien, the operational tax benefits described below.
Our Non-GAAP Nominal Tax Rate for fiscal year 2015 was 18.2 percent compared to 19.2 percent in the prior fiscal year. The decrease in our Non-GAAP Nominal Tax Rate for fiscal year 2015 as compared to the prior fiscal year was primarily due to the impact of the Covidien acquisition, operational tax benefits described below, and year-over-year changes in operational results by jurisdiction.
54
During fiscal year 2015, we recorded $33 million in operational tax benefits. The retroactive renewal and extension of the U.S. federal research and development tax credit resulted in a $12 million operational tax benefit for fiscal year 2015. In addition, we recorded a $9 million benefit associated with foreign dividend distributions, and a $12 million net benefit associated with the resolution of certain income tax audits, finalization of certain tax returns, and changes to uncertain tax position reserves.
An increase in our Non-GAAP Nominal Tax Rate of 1 percent would result in an additional income tax provision for the fiscal years ended April 29, 2016 and April 24, 2015 of approximately $74 million and $58 million, respectively.
Certain Tax Adjustments
During fiscal year 2016 we recorded certain tax adjustments of $417 million. A $442 million certain tax adjustment charge was recorded, which primarily related to the U.S. income tax expense resulting from our completion of an internal reorganization of the ownership of certain legacy Covidien businesses that reduced the cash and investments held by our U.S.-controlled non-U.S. subsidiaries (the Internal Reorganization). As a result of the Internal Reorganization, approximately $9.7 billion of cash, cash equivalents and investments in marketable debt and equity securities previously held by U.S.-controlled non-U.S. subsidiaries became available for general corporate purposes. This charge was partially offset by a $25 million tax benefit associated with the disposition of a wholly owned U.S. subsidiary. The $417 million net certain tax adjustment was recorded in the
provision for income taxes
in the consolidated statement of income for fiscal year 2016.
In fiscal year 2015, we recorded certain tax adjustments of $349 million, of which $329 million related to the resolution of the Kyphon Inc. (Kyphon) acquisition-related issues with the U.S. Internal Revenue Service (IRS). In addition, the certain tax adjustments include $20 million related to a taxable gain associated with the Covidien acquisition. The $349 million certain tax adjustment was recorded in the
provision for income taxes
in the consolidated statement of income for fiscal year 2015.
In fiscal year 2014, we recorded a $63 million certain tax benefit associated with the resolution of certain issues in the fourth quarter of fiscal year 2014 with the IRS relating to their review of our fiscal year 2009 through 2011 domestic income tax returns. The $63 million certain tax benefit was recorded in the
provision for income taxes
in the consolidated statement of income for fiscal year 2014.
Certain tax adjustments will affect the comparability of our operating results between periods, therefore, we consider these Non-GAAP Adjustments. Refer to the "Executive Level Overview" section of this Management's Discussion and Analysis for further analysis related to these adjustments.
Liquidity and Capital Resources
|
|
Fiscal Year
|
||||||
|
(in millions)
|
2016
|
2015
|
|||||
|
Working capital
|
$
|
16,435
|
|
$
|
21,671
|
|
|
|
Current ratio
(1)
|
3.3:1.0
|
|
3.4:1.0
|
|
|||
|
Cash, cash equivalents, and current investments
|
$
|
12,634
|
|
$
|
19,480
|
|
|
|
Short-term borrowings and long-term debt
|
31,240
|
|
36,186
|
|
|||
|
Net cash position
(2)
|
$
|
(18,606
|
)
|
$
|
(16,706
|
)
|
|
|
Total shareholder's equity
|
$
|
52,063
|
|
$
|
53,230
|
|
|
|
Debt-to-total capital ratio
(3)
|
38
|
%
|
40
|
%
|
|||
|
(1)
|
The ratio of current assets to current liabilities.
|
|
(2)
|
The sum of cash, cash equivalents, and current investments less short-term borrowings and long-term debt and excludes non-current investments that are not considered readily available to fund current operations.
|
|
(3)
|
The ratio of total debt (short-term borrowings and long-term debt) to total capitalization (total debt and total shareholder's equity).
|
As of
April 29, 2016
, we believe our balance sheet and liquidity provide us with flexibility in the future. Approximately
$5 billion
of our cash, cash equivalents, and investments held by certain U.S.-controlled non-U.S. subsidiaries may not represent available liquidity for general corporate purposes. However, we believe our other existing cash, cash equivalents and investments, as well as our $3.5 billion revolving credit facility and related commercial paper program (no commercial paper outstanding as of
April 29, 2016
), will satisfy our foreseeable working capital requirements for at least the next 12 months. We regularly review our capital needs and consider various investing and financing alternatives to support our requirements.
Our net cash position in fiscal year
2016
decreased by
$1.9 billion
as compared to fiscal year
2015
. See the “Summary of Cash Flows” section of this management’s discussion and analysis for further information.
55
In April 2016, the Company completed a cash tender offer and redemption of
$2.7 billion
of senior notes for
$3.0 billion
of total consideration. We recognized a loss on debt extinguishment of
$163 million
, which included cash premiums and accelerated amortization of deferred financing costs and debt discounts and premiums. The loss on debt extinguishment was recorded in the
interest expense
in the consolidated statement of income. In addition to the loss on debt extinguishment, we recognized
$20 million
of interest expense due to the acceleration of net losses on forward starting interest rate derivatives, which had been terminated at the time of original debt issuances, relating to the portion of debt extinguished in the tender offer.
|
Rating for Fiscal Year Ended
(1)
|
||||
|
April 29, 2016
|
April 24, 2015
|
|||
|
Standard & Poor's (S&P) Ratings Services
|
||||
|
Long-term debt
|
A
|
A
|
||
|
Short-term debt
|
A-1
|
A-1
|
||
|
Moody's Investors Service (Moody's)
|
||||
|
Long-term debt
|
A3
|
A3
|
||
|
Short-term debt
|
P-2
|
P-2
|
||
(1) Agency ratings are subject to change, and there can be no assurance that a ratings agency will continue to provide ratings and/or
maintain its current ratings. A security rating is not a recommendation to buy, sell or hold securities, and may be subject to revision or
withdrawal at any time by the rating agency, and each rating should be evaluated independently of any other rating.
Standard & Poor's (S&P) Ratings Services' and Moody's Investors Service long-term debt rating and short-term debt rating at
April 29, 2016
were unchanged as compared to the ratings at
April 24, 2015
. We do not expect the Moody's and S&P Ratings Services' ratings to have a significant impact on our liquidity or future flexibility to access additional liquidity given our balance sheet, our $3.5 billion revolving credit facility and related commercial paper program, discussed above and within the “Debt and Capital” section of this management's discussion and analysis.
We have future contractual obligations and other minimum commercial commitments that are entered into in the normal course of business. We believe our off-balance sheet arrangements do not have a material current or anticipated future effect on our consolidated earnings, financial position, and/or cash flows.
Notes 1 and 15 to the consolidated financial statements in “Item 8. Financial Statements and Supplementary Data” in this Annual Report on Form 10-K provide information regarding amounts we have accrued related to significant legal proceedings. In accordance with U.S. GAAP, we record a liability in our consolidated financial statements for these actions when a loss is known or considered probable and the amount can be reasonably estimated. Actual settlements may be different than estimated and could have a material impact on our consolidated earnings, financial position, and/or cash flows.
We provide for tax liabilities in our financial statements with respect to amounts that we expect to repatriate from subsidiaries (to the extent the repatriation would be subject to tax); however, no tax liabilities are recorded for amounts that we consider to be permanently reinvested. Our current plans do not foresee a need to repatriate funds that are designated as permanently reinvested in order to fund our operations or meet currently anticipated liquidity and capital investment needs. However, we evaluate our legal entity structure supporting our business operations, and to the extent such evaluation results in a change to our overall business structure, we may be required to accrue for additional tax obligations.
We have investments in marketable debt securities that are classified and accounted for as available-for-sale. Our debt securities include U.S. government and agency securities, corporate debt securities, mortgage-backed securities, other asset-backed securities, debt funds, and auction rate securities. Some of our investments may experience reduced liquidity due to changes in market conditions and investor demand. Our auction rate security holdings continue to experience reduced liquidity due to low investor demand. Although our auction rate securities are currently illiquid and other securities could become illiquid, we believe we could liquidate a substantial amount of our portfolio without incurring a material impairment loss.
For the fiscal year ended
April 29, 2016
, the total other-than-temporary impairment losses on available-for-sale debt securities were not significant. Based on our assessment of the credit quality of the underlying collateral and credit support available to each of the remaining securities in which we are invested, we believe we have recorded all necessary other-than-temporary impairments as we do not have the intent to sell, nor is it more likely than not that we will be required to sell, before recovery of the amortized cost. However, as of
April 29, 2016
, we have
$327 million
of gross unrealized losses on our aggregate short-term and long-term available-for-sale debt securities of
$9.7 billion
; if market conditions deteriorate, some of these holdings may experience other-than-temporary impairment in the future which could have a material impact on our financial results. Management is required to use estimates and assumptions in its valuation of our investments, which requires a high degree of judgment, and therefore, actual
56
results could differ materially from those estimates. See Note 5 to the consolidated financial statements in “Item 8. Financial Statements and Supplementary Data” in this Annual Report on Form 10-K for additional information regarding fair value measurements.
Summary of Cash Flows
|
|
Fiscal Year
|
||||||||||
|
(in millions)
|
2016
|
2015
|
2014
|
||||||||
|
Cash provided by (used in):
|
|
|
|
|
|
|
|||||
|
Operating activities
|
$
|
5,218
|
|
$
|
4,902
|
|
$
|
4,959
|
|
||
|
Investing activities
|
2,245
|
|
(17,058
|
)
|
(3,594
|
)
|
|||||
|
Financing activities
|
(9,543
|
)
|
15,949
|
|
(918
|
)
|
|||||
|
Effect of exchange rate changes on cash and cash equivalents
|
113
|
|
(353
|
)
|
37
|
|
|||||
|
Net change in cash and cash equivalents
|
$
|
(1,967
|
)
|
$
|
3,440
|
|
$
|
484
|
|
||
Operating Activities
Our net cash provided by operating activities was
$5.2 billion
for the fiscal year ended
April 29, 2016
compared to
$4.9 billion
provided in the prior year. The $316 million increase was primarily driven by an increase in net income before depreciation and amortization, loss on debt extinguishment, and acquisition-related items of $2.1 billion and a decrease in certain litigation payments of $469 million, partially offset by an increase in cash paid for incomes taxes and interest of $747 million and $688 million, respectively. The increase in cash paid for income taxes was primarily a result of the settlement payments made for the resolution of the Kyphon acquisition-related matters, internal reorganization of the ownership of certain legacy Covidien businesses, and the impacts from the full year of Covidien results. The increase in cash paid for interest was primarily the result of a full year of interest payments on the Senior Notes and Term Loan issued in fiscal year 2015 primarily to fund the $16 billion cash consideration portion of the Covidien acquisition, as well as the interest payments on the outstanding debt assumed as part of the Covidien acquisition. Net cash provided by operating activities was further offset by the impact of a full year of operations post-Covidien acquisition.
Our net cash provided by operating activities was
$4.9 billion
for the fiscal year ended
April 24, 2015
compared to
$5.0 billion
provided in the fiscal year ended
April 25, 2014
. The slight year-over-year decrease is primarily the result of certain Covidien acquisition impacts, including acquisition-related items, accrued liabilities, and deferred income taxes, offset by the $750 million settlement payment made to Edwards in May 2014.
Investing Activities
Our net cash provided by investing activities was
$2.2 billion
for the fiscal year ended
April 29, 2016
compared to
$17.1 billion
used in the prior year. The $19.3 billion increase was primarily attributable to higher levels of cash used in the prior year for acquisitions, primarily related to the Covidien acquisition, as well as an increase in net proceeds from purchases and sales and maturities of marketable securities in the current fiscal year.
Our net cash used in investing activities was
$17.1 billion
for the fiscal year ended
April 24, 2015
compared to
$3.6 billion
used in the fiscal year ended
April 25, 2014
. The $13.5 billion increase was primarily attributable to higher levels of cash used in fiscal year ended
April 24, 2015
for acquisitions, primarily related to the Covidien acquisition, partially offset by a decrease in net purchases and sales and maturities of marketable securities.
Financing Activities
Our net cash used in financing activities was
$9.5 billion
for the fiscal year ended
April 29, 2016
compared to
$15.9 billion
provided in the prior year. The $25.5 billion decrease primarily resulted from a net decrease in debt issued, primarily related to the Covidien acquisition, higher payments of maturing and extinguished long-term debt, an increase in cash paid for dividends to shareholders, and an increase in repurchases of ordinary shares.
Our net cash provided by financing activities was
$15.9 billion
for the fiscal year ended
April 24, 2015
compared to
$918 million
used in the fiscal year ended
April 25, 2014
. The $16.9 billion increase primarily resulted from a net increase in issuances of long-term debt, primarily related to the Covidien acquisition, net of payments on long-term debt and short-term borrowings, partially offset by a decrease in net issuance and repurchases of ordinary shares.
57
Free Cash Flow
Free cash flow, a non-GAAP financial measure, is calculated by subtracting property, plant, and equipment additions from operating cash flows. Management uses this non-GAAP financial measure, in addition to U.S. GAAP financial measures to evaluate our operating results. Free cash flow should be considered supplemental to, and not a substitute for, our reported financial results prepared in accordance with U.S. GAAP. Reconciliations between net cash provided by operating activities (the most comparable U.S. GAAP measure) and free cash flow are as follows:
|
Fiscal Year
|
|||||||||||
|
(in millions)
|
2016
|
2015
|
2014
|
||||||||
|
Net cash provided by operating activities
|
$
|
5,218
|
|
$
|
4,902
|
|
$
|
4,959
|
|
||
|
Net cash provided by (used in) investing activities
|
2,245
|
|
(17,058
|
)
|
(3,594
|
)
|
|||||
|
Net cash (used in) provided by financing activities
|
(9,543
|
)
|
15,949
|
|
(918
|
)
|
|||||
|
Net cash provided by operating activities
|
5,218
|
|
4,902
|
|
4,959
|
|
|||||
|
Additions to property, plant, and equipment
|
(1,046
|
)
|
(571
|
)
|
(396
|
)
|
|||||
|
Free cash flow
|
$
|
4,172
|
|
$
|
4,331
|
|
$
|
4,563
|
|
||
|
Dividends to shareholders
|
$
|
2,139
|
|
$
|
1,337
|
|
$
|
1,116
|
|
||
|
Repurchase of ordinary shares
|
2,830
|
|
1,920
|
|
2,553
|
|
|||||
|
Issuances of ordinary shares
|
(491
|
)
|
(649
|
)
|
(1,307
|
)
|
|||||
|
Return to shareholders
|
$
|
4,478
|
|
$
|
2,608
|
|
$
|
2,362
|
|
||
|
Return of operating cash flow percentage
|
86
|
%
|
53
|
%
|
48
|
%
|
|||||
|
Return of free cash flow percentage
|
107
|
%
|
60
|
%
|
52
|
%
|
|||||
Our capital structure consists of equity and interest-bearing debt. Interest-bearing debt as a percentage of total interest-bearing debt and equity was
38 percent
as of
April 29, 2016
and
40 percent
as of
April 24, 2015
.
As part of our focus on returning value to our shareholders, shares are repurchased from time to time. In January 2015, the Company's Board of Directors authorized, subject to the ongoing existence of sufficient distributable reserves, the adoption of the existing Medtronic, Inc. share redemption program. During fiscal years
2016
and
2015
, we repurchased a total of
38 million
and
30 million
shares at an average price of
$74.92
and
$64.53
, respectively. In June 2015, the Company's Board of Directors authorized, subject to the ongoing existence of sufficient distributable reserves, the redemption of an additional
80 million
of the Company's ordinary shares. As of
April 29, 2016
, we have approximately
72 million
shares remaining under the current Board authorization.
We use a combination of bank borrowings and commercial paper issuances to fund our short-term financing needs. Short-term debt, including the current portion of our long-term debt and capital lease obligations, as of
April 29, 2016
, was
$993 million
compared to
$2.4 billion
as of
April 24, 2015
.
We maintain a commercial paper program for short term financing, which allows us to issue unsecured commercial paper notes on a private placement basis up to a maximum aggregate amount outstanding at any time of $3.5 billion. No amounts were outstanding under this program as of
April 29, 2016
and
April 24, 2015
, respectively.
During fiscal years
2016
and
2015
, the weighted average original maturity of the commercial paper outstanding was approximately 49 and 52 days, respectively, and the weighted average interest rate was
0.57 percent
and
0.13 percent
, respectively. The issuance of commercial paper reduces the amount of credit available under our existing line of credit, as explained below.
We also have a $3.5 billion syndicated line of credit facility ($3.5 Billion Revolving Credit Facility) which expires in January 2020. The $3.5 Billion Revolving Credit Facility provides backup funding for the commercial paper program and may also be used for general corporate purposes. The $3.5 Billion Revolving Credit Facility provides us with the ability to increase its borrowing capacity by an additional $500 million at any time during the term of the agreement. At each anniversary date of the $3.5 Billion Revolving Credit Facility, but not more than twice prior to the maturity date, the Company could also request a
one
-year extension of the maturity date. As of
April 29, 2016
and
April 24, 2015
, no amounts were outstanding on the committed line of credit.
Interest rates on advances on our $3.5 Billion Revolving Credit Facility are determined by a pricing matrix, based on our long-term debt ratings assigned by S&P Ratings Services and Moody’s. For additional information on our credit ratings status by S&P
58
Ratings Services and Moody's refer to "Liquidity and Capital Resources" section of this Management's Discussion and Analysis. Facility fees are payable on the credit facility and are determined in the same manner as the interest rates. The agreements also contain customary covenants, all of which we remain in compliance with as of
April 29, 2016
.
We utilize Senior Notes that are unsecured, senior obligations that rank equally with all other secured and unsubordinated indebtedness to meet our long-term financing needs. We use the net proceeds from the sale of the Senior Notes primarily for working capital and general corporate purposes and in the case of Senior Notes issued on December 10, 2014, to finance the Covidien acquisition and related expenses. Long-term debt as of
April 29, 2016
was
$30.2 billion
compared to
$33.8 billion
as of
April 24, 2015
. The decrease is primarily due to the cash tender offer and redemption of $2.7 billion of senior notes for $3.0 billion of total consideration in April 2016, as discussed within the “Liquidity and Capital Resources" section of this Management’s Discussion and Analysis. The indentures under which the Senior Notes have been issued contain customary covenants, all of which we remain in compliance with as of
April 29, 2016
.
On December 10, 2014, we issued seven tranches of the 2015 Senior Notes with an aggregate face value of $17.0 billion. In addition, on January 26, 2015, we also borrowed $3.0 billion for a term of three years under a term loan agreement. We used these combined proceeds to fund the $16.0 billion cash consideration portion of the Covidien acquisition, to pay certain transaction and financing expenses, and for working capital and general corporate purposes.
For additional information regarding our debt agreements, refer to Note 7 of the consolidated financial statements in “Item 8. Financial Statements and Supplementary Data” in this Annual Report on Form 10-K.
59
Off-Balance Sheet Arrangements and Long-Term Contractual Obligations
Presented below is a summary of contractual obligations and other minimum commercial commitments as of
April 29, 2016
. See Notes 7 and 13 to the consolidated financial statements in “Item 8. Financial Statements and Supplementary Data” in this Annual Report on Form 10-K for additional information regarding long-term debt and lease obligations, respectively. Additionally, see Note 11 to the consolidated financial statements in “Item 8. Financial Statements and Supplementary Data” in this Annual Report on Form 10-K for additional information regarding accrued income tax obligations, which are not reflected in the table below.
|
|
Maturity by Fiscal Year
|
|||||||||||||||||||||||||||
|
(in millions)
|
Total
|
2017
|
2018
|
2019
|
2020
|
2021
|
Thereafter
|
|||||||||||||||||||||
|
Contractual obligations related to off-balance sheet arrangements:
|
|
|
|
|
|
|
|
|
|
|
|
|
|
|
||||||||||||||
|
Operating leases
(1)
|
$
|
544
|
|
$
|
180
|
|
$
|
130
|
|
$
|
90
|
|
$
|
56
|
|
$
|
33
|
|
$
|
55
|
|
|||||||
|
Commitments to fund minority investments/contingent acquisition consideration
(2)
|
520
|
|
89
|
|
72
|
|
155
|
|
48
|
|
41
|
|
115
|
|
||||||||||||||
|
Interest payments
(3)
|
13,925
|
|
1,058
|
|
1,014
|
|
911
|
|
882
|
|
760
|
|
9,300
|
|
||||||||||||||
|
Other
(4)
|
603
|
|
351
|
|
115
|
|
35
|
|
27
|
|
25
|
|
50
|
|
||||||||||||||
|
Contractual obligations related to off-balance sheet arrangements subtotal
|
$
|
15,592
|
|
$
|
1,678
|
|
$
|
1,331
|
|
$
|
1,191
|
|
$
|
1,013
|
|
$
|
859
|
|
$
|
9,520
|
|
|||||||
|
Contractual obligations reflected in the balance sheet:
|
|
|
|
|
|
|
|
|
|
|
|
|
|
|
||||||||||||||
|
Long-term debt, including current portion
(5)
|
$
|
30,805
|
|
$
|
887
|
|
$
|
6,188
|
|
$
|
408
|
|
$
|
3,774
|
|
$
|
1,102
|
|
$
|
18,446
|
|
|||||||
|
Capital leases
|
132
|
|
106
|
|
4
|
|
3
|
|
2
|
|
2
|
|
15
|
|
||||||||||||||
|
Contractual obligations reflected in the balance sheet subtotal
|
$
|
30,937
|
|
$
|
887
|
|
$
|
6,188
|
|
$
|
408
|
|
$
|
3,774
|
|
$
|
1,102
|
|
$
|
18,446
|
|
|||||||
|
Total contractual obligations
|
$
|
46,529
|
|
$
|
2,565
|
|
$
|
7,519
|
|
$
|
1,599
|
|
$
|
4,787
|
|
$
|
1,961
|
|
$
|
27,966
|
|
|||||||
|
(1)
|
Certain leases require us to pay real estate taxes, insurance, maintenance, and other operating expenses associated with the leased premises. These future costs are not included in the schedule above.
|
|
(2)
|
Certain commitments related to the funding of cost or equity method investments and/or previous acquisitions are contingent upon the achievement of certain product-related milestones and various other favorable operational conditions, and estimated royalty obligations. While it is not certain if and/or when these payments will be made, the maturity dates included in this table reflect our best estimates. Contingent consideration includes only the maximum potential amount of undiscounted future contingent consideration associated with all completed business combinations or purchases of intellectual property prior to April 24, 2009. See Note 2 to the consolidated financial statements in “Item 8. Financial Statements and Supplementary Data” in this Annual Report on Form 10-K for additional information regarding our debt agreements.
|
|
(3)
|
Interest payments in the table above reflect the contractual interest payments on our outstanding debt, and exclude the impact of the debt discount amortization and impact of interest rate swap agreements. See Note 7 to the consolidated financial statements in “Item 8. Financial Statements and Supplementary Data” in this Annual Report on Form 10-K for additional information regarding our debt agreements.
|
|
(4)
|
We have included inventory purchase commitments which are legally binding and specify minimum purchase quantities. These purchase commitments do not exceed our projected requirements and are in the normal course of business. These commitments do not include open purchase orders. These obligations also include certain research and development arrangements.
|
|
(5)
|
Long-term debt in the table above includes the $3.0 billion Term Loan Credit Agreement, $3.1 billion of CIFSA Senior Notes, $16.9 billion of 2015 Senior Notes, $1.5 billion of 2014 Senior Notes, $1.9 billion of 2013 Senior Notes, $1.1 billion of 2012 Senior Notes, $500 million of 2011 Senior Notes, $1.3 billion of 2010 Senior Notes, and $700 million of 2009 Senior Notes. The table above excludes the debt premium and discount, the fair value impact of outstanding interest rate swap agreements, and the unamortized gains from terminated interest rate swap agreements. See Notes 7 and 8 to the consolidated financial statements in “Item 8. Financial Statements and Supplementary Data” in this Annual Report on Form 10-K for additional information regarding the interest rate swap agreements.
|
60
Milestone Payments
We acquire assets still in development, enter into research and development arrangements, and sponsor certain clinical trials that often require milestone and/or royalty payments to a third-party, contingent upon the occurrence of certain future events. Milestone payments may be required upon the successful achievement of an important point in the development life cycle of a product or upon certain pre-designated levels of achievement in clinical trials. In addition, if required by the arrangement, we may have to make royalty payments based on a percentage of sales related to the product under development or in the event that regulatory approval for marketing is obtained. In situations where we have no ability to influence the achievement of the milestone or otherwise avoid the payment, we have included those milestone or minimum royalty payments in the preceding table. However, the majority of these arrangements give us the discretion to unilaterally make the decision to stop development of a product or cease progress of a clinical trial, which would allow us to avoid making the contingent payments. Although we are unlikely to cease development if a device successfully achieves clinical testing objectives, these payments are not included in the table of contractual obligations because of the contingent nature of these payments and our ability to avoid them if we decided to pursue a different path of development or testing. See Note 2 to the consolidated financial statements in “Item 8. Financial Statements and Supplementary Data” in this Annual Report on Form 10-K for additional information regarding contingent consideration.
Indemnification provisions
In the normal course of business, we periodically enter into agreements that require us to indemnify customers or suppliers for specific risks, such as claims for injury or property damage arising out of our products or the negligence of our personnel or claims alleging that our products infringe third-party patents or other intellectual property. Our maximum exposure under these indemnification provisions cannot be estimated, and we have not accrued any liabilities within our consolidated financial statements or included any indemnification provisions in our commitments table. Historically, we have not experienced significant losses on these types of indemnification obligations.
Acquisitions
Information regarding acquisitions is included in Note 2 to the consolidated financial statements in “Item 8. Financial Statements and Supplementary Data” in this Annual Report on Form 10-K.
We periodically acquire certain tangible or intangible assets from enterprises that do not otherwise qualify for accounting as a business combination. These transactions are reflected in the consolidated statements of cash flows as a component of investing activities under
other investing activities, net.
New Accounting Pronouncements
Information regarding new accounting pronouncements is included in Note 1 to the consolidated financial statements in “Item 8. Financial Statements and Supplementary Data” in this Annual Report on Form 10-K.
Cautionary Factors That May Affect Future Results
This Annual Report, and other written reports and oral statements made by or with the approval of one of the Company’s executive officers from time to time, may include “forward-looking” statements. Forward-looking statements broadly include our current expectations or forecasts of future results. Our forward-looking statements generally relate to our growth and growth strategies, developments in the markets for our products, financial results, product development launches and effectiveness, research and development strategy, regulatory approvals, competitive strengths, restructuring and cost-saving initiatives, intellectual property rights, litigation and tax matters, government investigations, mergers and acquisitions, divestitures, market acceptance of our products, accounting estimates, financing activities, ongoing contractual obligations, working capital adequacy, value of our investments, our effective tax rate, our expected returns to shareholders, and sales efforts. Such statements can be identified by the use of terminology such as “anticipate,” “believe,” “could,” “estimate,” “expect,” “forecast,” “intend,” “looking ahead,” “may,” “plan,” “possible,” “potential,” “project,” “should,” “will,” and similar words or expressions. Forward-looking statements in this Annual Report include, but are not limited to, statements regarding our ability to drive long-term shareholder value, development and future launches of products and continued or future acceptance of products in our operating segments; expected timing for completion of research studies relating to our products; market positioning and performance of our products, including stabilization of certain product markets; unanticipated issues that may affect U.S. FDA and non-U.S. regulatory approval of new products; increased presence in new markets, including markets outside the U.S.; changes in the market and our market share; acquisitions and investment initiatives, as well as integration of acquired companies into our operations; the resolution of tax matters; the effectiveness of our development activities in reducing patient care costs and hospital stay lengths; our approach towards cost containment; our expectations regarding health care costs; the elimination of certain positions or costs related to restructuring initiatives; outcomes in our litigation matters and government investigations; general economic conditions; the adequacy of available working capital and our working capital needs; our payment of dividends and redemption of shares; the continued strength of our balance sheet and liquidity; our accounts receivable exposure; and the potential impact of our compliance with governmental regulations and accounting guidance. One must carefully consider forward-looking statements and understand that such statements
61
may be affected by inaccurate assumptions and may involve a variety of risks and uncertainties, known and unknown, including, among others, those discussed in the sections entitled “Government Regulation and Other Considerations” within “Item 1. Business” and “Item 1A. Risk Factors” in this Annual Report on Form 10-K, as well as those related to competition in the medical device industry, reduction or interruption in our supply, quality problems, liquidity shortfalls, decreasing prices and pricing pressure, fluctuations in currency exchange rates, changes in applicable tax rates, positions taken by taxing authorities, adverse regulatory action, litigation results, self-insurance, commercial insurance, health care policy changes, international operations, failure to achieve the intended benefits of the Covidien and other acquisitions or disruption of our current plans and operations.
Consequently, no forward-looking statement can be guaranteed and actual results may vary materially. We intend to take advantage of the Safe Harbor provisions of the Private Securities Litigation Reform Act of 1995 regarding our forward-looking statements, and are including this sentence for the express purpose of enabling us to use the protections of the safe harbor with respect to all forward-looking statements.
We undertake no obligation to update any statement we make, but investors are advised to consult all other disclosures by us in our filings with the Securities and Exchange Commission, especially on Forms 10-K, 10-Q, and 8-K, in which we discuss in more detail various important factors that could cause actual results to differ from expected or historical results. In addition, actual results may differ materially from those anticipated due to a number of factors, including, among others, those discussed in the section entitled “Item 1A. Risk Factors” in this Annual Report on Form 10-K. It is not possible to foresee or identify all such factors. As such, investors should not consider any list of such factors to be an exhaustive statement of all risks, uncertainties, or potentially inaccurate assumptions.
62
Currency Exchange Rate Risk
Due to the global nature of our operations, we are exposed to currency exchange rate changes. In a period where the U.S. dollar is strengthening/weakening as compared to other currencies, our revenues and expenses denominated in other currencies are translated into U.S. dollars at a lower/higher value than they would be in an otherwise constant currency exchange rate environment.
We use operational and economic hedges, as well as currency exchange rate derivative instruments, to manage the impact of currency exchange rate fluctuations on earnings and cash flows. In order to minimize earnings and cash flow volatility resulting from currency exchange rate fluctuations, we enter into derivative instruments, principally forward currency exchange rate contracts. These contracts are designed to hedge anticipated currency transactions and changes in the value of specific assets and liabilities. At inception of the contract, the derivative instrument is designated as either a freestanding derivative or a cash flow hedge. The primary currencies of the derivative instruments are the Euro and Japanese Yen. Fluctuations in the currency exchange rates of currency exposures that are unhedged, such as in certain emerging markets, may result in future earnings and cash flow volatility. We do not enter into currency exchange rate derivative instruments for speculative purposes.
The gross notional amount of all currency exchange rate derivative instruments outstanding at
April 29, 2016
and April 24, 2015 was
$10.8 billion
and $9.8 billion, respectively. At
April 29, 2016
, these contracts were in an unrealized loss position of $11 million. A sensitivity analysis of changes in the fair value of all currency exchange rate derivative contracts at
April 29, 2016
indicates that, if the U.S. dollar uniformly strengthened/weakened by 10 percent against all currencies, the fair value of these contracts would increase/decrease by approximately $725 million. Any gains and losses on the fair value of derivative contracts would generally be offset by gains and losses on the underlying transactions. These offsetting gains and losses are not reflected in the above analysis.
Interest Rate Risk
We are subject to interest rate risk on our short-term investments and our borrowings. We manage interest rate risk in the aggregate, while focusing on our immediate and intermediate liquidity needs. Our debt portfolio as of
April 29, 2016
, was comprised of debt predominately denominated in U.S. dollars, of which approximately 90% is fixed rate debt and approximately 10% is floating-rate debt. We are also exposed to interest rate changes affecting our investments in interest rate sensitive instruments, which include our marketable debt securities, fixed-to-floating interest rate swap agreements, and forward starting interest rate swap agreements.
A sensitivity analysis of the impact on our investments in interest rate sensitive financial instruments of a hypothetical 10 basis point change in interest rates, compared to interest rates as of
April 29, 2016
, indicates that the fair value of these instruments would correspondingly change by $85 million.
For a discussion of current market conditions and the impact on our financial condition and results of operations, please see the “Liquidity and Capital Resources” section of “Item 7. Management's Discussion and Analysis of Financial Condition and Results of Operations” in this Annual Report on Form 10-K. For additional discussion of market risk, see Notes 5 and 8 to the consolidated financial statements in “Item 8. Financial Statements and Supplementary Data” in this Annual Report on Form 10-K.
63
Report of Independent Registered Public Accounting Firm
To the Shareholders and Board of Directors of Medtronic plc:
In our opinion, the accompanying consolidated balance sheets and the related consolidated statements of income, comprehensive income, shareholders’ equity and cash flows present fairly, in all material respects, the financial position of Medtronic plc and its subsidiaries (the Company) at April 29, 2016 and April 24, 2015, and the results of their operations and their cash flows for each of the three years in the period ended April 29, 2016 in conformity with accounting principles generally accepted in the United States of America. In addition, in our opinion, the financial statement schedule listed in the index appearing under Item 15(a)(1)
presents fairly, in all material respects, the information set forth therein when read in conjunction with the related consolidated financial statements. Also in our opinion, the Company maintained, in all material respects, effective internal control over financial reporting as of April 29, 2016, based on criteria established in
Internal Control - Integrated Framework
(2013) issued by the Committee of Sponsoring Organizations of the Treadway Commission (COSO). The Company's management is responsible for these financial statements and financial statement schedule, for maintaining effective internal control over financial reporting and for its assessment of the effectiveness of internal control over financial reporting, included in the accompanying Management's Annual Report on Internal Control over Financial Reporting. Our responsibility is to express opinions on these financial statements, on the financial statement schedule, and on the Company's internal control over financial reporting based on our integrated
audits. We conducted our audits in accordance with the standards of the Public Company Accounting Oversight Board (United States). Those standards require that we plan and perform the audits to obtain reasonable assurance about whether the financial statements are free of material misstatement and whether effective internal control over financial reporting was maintained in all material respects. Our audits of the financial statements included examining, on a test basis, evidence supporting the amounts and disclosures in the financial statements, assessing the accounting principles used and significant estimates made by management, and evaluating the overall financial statement presentation. Our audit of internal control over financial reporting included obtaining an understanding of internal control over financial reporting, assessing the risk that a material weakness exists, and testing and evaluating the design and operating effectiveness of internal control based on the assessed risk. Our audits also included performing such other procedures as we considered necessary in the circumstances. We believe that our audits provide a reasonable basis for our opinions.
A company’s internal control over financial reporting is a process designed to provide reasonable assurance regarding the reliability of financial reporting and the preparation of financial statements for external purposes in accordance with generally accepted accounting principles. A company’s internal control over financial reporting includes those policies and procedures that (i) pertain to the maintenance of records that, in reasonable detail, accurately and fairly reflect the transactions and dispositions of the assets of the company; (ii) provide reasonable assurance that transactions are recorded as necessary to permit preparation of financial statements in accordance with generally accepted accounting principles, and that receipts and expenditures of the company are being made only in accordance with authorizations of management and directors of the company; and (iii) provide reasonable assurance regarding prevention or timely detection of unauthorized acquisition, use, or disposition of the company’s assets that could have a material effect on the financial statements.
Because of its inherent limitations, internal control over financial reporting may not prevent or detect misstatements. Also, projections of any evaluation of effectiveness to future periods are subject to the risk that controls may become inadequate because of changes in conditions, or that the degree of compliance with the policies or procedures may deteriorate.
|
/s/ PricewaterhouseCoopers LLP
|
|
|
|
Minneapolis, Minnesota
|
|
June 28, 2016
|
64
Medtronic plc
Consolidated
Statements of Income
|
|
Fiscal Year
|
|||||||||||
|
(in millions, except per share data)
|
2016
|
2015
|
2014
|
|||||||||
|
Net sales
|
$
|
28,833
|
|
$
|
20,261
|
|
$
|
17,005
|
|
|||
|
Costs and expenses:
|
|
|
|
|||||||||
|
Cost of products sold
|
9,142
|
|
6,309
|
|
4,333
|
|
||||||
|
Research and development expense
|
2,224
|
|
1,640
|
|
1,477
|
|
||||||
|
Selling, general, and administrative expense
|
9,469
|
|
6,904
|
|
5,847
|
|
||||||
|
Special charges (gains), net
|
70
|
|
(38
|
)
|
40
|
|
||||||
|
Restructuring charges, net
|
290
|
|
237
|
|
78
|
|
||||||
|
Certain litigation charges, net
|
26
|
|
42
|
|
770
|
|
||||||
|
Acquisition-related items
|
283
|
|
550
|
|
117
|
|
||||||
|
Amortization of intangible assets
|
1,931
|
|
733
|
|
349
|
|
||||||
|
Other expense, net
|
107
|
|
118
|
|
181
|
|
||||||
|
Operating profit
|
5,291
|
|
3,766
|
|
3,813
|
|
||||||
|
Interest income
|
(431
|
)
|
(386
|
)
|
(271
|
)
|
||||||
|
Interest expense
|
1,386
|
|
666
|
|
379
|
|
||||||
|
Interest expense, net
|
955
|
|
280
|
|
108
|
|
||||||
|
Income from operations before income taxes
|
4,336
|
|
3,486
|
|
3,705
|
|
||||||
|
Provision for income taxes
|
798
|
|
811
|
|
640
|
|
||||||
|
Net income
|
$
|
3,538
|
|
$
|
2,675
|
|
$
|
3,065
|
|
|||
|
Basic earnings per share
|
$
|
2.51
|
|
$
|
2.44
|
|
$
|
3.06
|
|
|||
|
Diluted earnings per share
|
$
|
2.48
|
|
$
|
2.41
|
|
$
|
3.02
|
|
|||
|
Basic weighted average shares outstanding
|
1,409.6
|
|
1,095.5
|
|
1,002.1
|
|
||||||
|
Diluted weighted average shares outstanding
|
1,425.9
|
|
1,109.0
|
|
1,013.6
|
|
||||||
|
Cash dividends declared per ordinary share
|
$
|
1.52
|
|
$
|
1.22
|
|
$
|
1.12
|
|
|||
The accompanying notes are an integral part of these consolidated financial statements.
65
Medtronic plc
Consolidated
Statements of Comprehensive Income
|
|
Fiscal Year
|
|||||||||||
|
(in millions)
|
2016
|
2015
|
2014
|
|||||||||
|
Net income
|
$
|
3,538
|
|
$
|
2,675
|
|
$
|
3,065
|
|
|||
|
Other comprehensive loss, net of tax:
|
|
|
|
|
|
|
||||||
|
Unrealized (loss) gain on available-for-sale securities, net of tax (benefit) expense of $(102), $11, and $(58), respectively
|
(121
|
)
|
20
|
|
(103
|
)
|
||||||
|
Translation adjustment
|
(197
|
)
|
(495
|
)
|
13
|
|
||||||
|
Net change in retirement obligations, net of tax (benefit) expense of $(46), $(173), and $72, respectively
|
(66
|
)
|
(366
|
)
|
87
|
|
||||||
|
Unrealized (loss) gain on derivatives, net of tax (benefit) expense of $(172), $146, and $(60), respectively
|
(300
|
)
|
254
|
|
(102
|
)
|
||||||
|
Other comprehensive loss, net of tax
|
(684
|
)
|
(587
|
)
|
(105
|
)
|
||||||
|
Comprehensive income
|
$
|
2,854
|
|
$
|
2,088
|
|
$
|
2,960
|
|
|||
The accompanying notes are an integral part of these consolidated financial statements.
66
Medtronic plc
Consolidated
Balance Sheets
|
(in millions, except per share data)
|
April 29,
2016 |
April 24,
2015 |
||||||
|
ASSETS
|
|
|
||||||
|
Current assets:
|
|
|
||||||
|
Cash and cash equivalents
|
$
|
2,876
|
|
$
|
4,843
|
|
||
|
Investments
|
9,758
|
|
14,637
|
|
||||
|
Accounts receivable, less allowances of $161 and $144, respectively
|
5,562
|
|
5,112
|
|
||||
|
Inventories
|
3,473
|
|
3,463
|
|
||||
|
Tax assets
|
697
|
|
1,335
|
|
||||
|
Prepaid expenses and other current assets
|
1,234
|
|
1,454
|
|
||||
|
Total current assets
|
23,600
|
|
30,844
|
|
||||
|
Property, plant, and equipment, net
|
4,841
|
|
4,699
|
|
||||
|
Goodwill
|
41,500
|
|
40,530
|
|
||||
|
Other intangible assets, net
|
26,899
|
|
28,101
|
|
||||
|
Long-term tax assets
|
1,383
|
|
774
|
|
||||
|
Other assets
|
1,559
|
|
1,737
|
|
||||
|
Total assets
|
$
|
99,782
|
|
$
|
106,685
|
|
||
|
LIABILITIES AND SHAREHOLDERS’ EQUITY
|
|
|
||||||
|
Current liabilities:
|
|
|
||||||
|
Short-term borrowings
|
$
|
993
|
|
$
|
2,434
|
|
||
|
Accounts payable
|
1,709
|
|
1,610
|
|
||||
|
Accrued compensation
|
1,712
|
|
1,611
|
|
||||
|
Accrued income taxes
|
566
|
|
935
|
|
||||
|
Deferred tax liabilities
|
—
|
|
119
|
|
||||
|
Other accrued expenses
|
2,185
|
|
2,464
|
|
||||
|
Total current liabilities
|
7,165
|
|
9,173
|
|
||||
|
Long-term debt
|
30,247
|
|
33,752
|
|
||||
|
Long-term accrued compensation and retirement benefits
|
1,759
|
|
1,535
|
|
||||
|
Long-term accrued income taxes
|
2,903
|
|
2,476
|
|
||||
|
Long-term deferred tax liabilities
|
3,729
|
|
4,700
|
|
||||
|
Other long-term liabilities
|
1,916
|
|
1,819
|
|
||||
|
Total liabilities
|
47,719
|
|
53,455
|
|
||||
|
Commitments and contingencies (Notes 2, 13, and 15)
|
|
|
||||||
|
Shareholders’ equity:
|
|
|
||||||
|
Ordinary shares— par value $0.0001, 2.6 billion shares authorized, 1,399,018,022 and 1,421,648,005 shares issued and outstanding, respectively
|
—
|
|
—
|
|
||||
|
Retained earnings
|
53,931
|
|
54,414
|
|
||||
|
Accumulated other comprehensive (loss) income
|
(1,868
|
)
|
(1,184
|
)
|
||||
|
Total shareholders’ equity
|
52,063
|
|
53,230
|
|
||||
|
Total liabilities and shareholders’ equity
|
$
|
99,782
|
|
$
|
106,685
|
|
||
The accompanying notes are an integral part of these consolidated financial statements.
67
Medtronic plc
Consolidated
Statements of Shareholders’ Equity
|
Ordinary Shares
|
Retained
Earnings
|
Accumulated
Other
Comprehensive
Loss
|
Total
Shareholders’
Equity
|
||||||||||||||||
|
(in millions)
|
Number
|
Par Value
|
|||||||||||||||||
|
Balance as of April 26, 2013
|
1,016
|
|
$
|
102
|
|
$
|
19,061
|
|
$
|
(492
|
)
|
$
|
18,671
|
|
|||||
|
Net income
|
—
|
|
—
|
|
3,065
|
|
—
|
|
3,065
|
|
|||||||||
|
Other comprehensive loss
|
—
|
|
—
|
|
—
|
|
(105
|
)
|
(105
|
)
|
|||||||||
|
Dividends to shareholders
|
—
|
|
—
|
|
(1,116
|
)
|
—
|
|
(1,116
|
)
|
|||||||||
|
Issuance of shares under stock purchase and award plans
|
31
|
|
3
|
|
1,304
|
|
—
|
|
1,307
|
|
|||||||||
|
Repurchase of ordinary shares
|
(48
|
)
|
(5
|
)
|
(2,548
|
)
|
—
|
|
(2,553
|
)
|
|||||||||
|
Tax benefit from exercise of stock-based awards
|
—
|
|
—
|
|
29
|
|
—
|
|
29
|
|
|||||||||
|
Stock-based compensation
|
—
|
|
—
|
|
145
|
|
—
|
|
145
|
|
|||||||||
|
Balance as of April 25, 2014
|
999
|
|
$
|
100
|
|
$
|
19,940
|
|
$
|
(597
|
)
|
$
|
19,443
|
|
|||||
|
Net income
|
—
|
|
—
|
|
2,675
|
|
—
|
|
2,675
|
|
|||||||||
|
Other comprehensive loss
|
—
|
|
—
|
|
—
|
|
(587
|
)
|
(587
|
)
|
|||||||||
|
Ordinary shares issued in connection with the Covidien plc acquisition, net of taxes
|
436
|
|
—
|
|
33,787
|
|
—
|
|
33,787
|
|
|||||||||
|
Result of contribution of Medtronic, Inc. to Medtronic plc
|
—
|
|
(99
|
)
|
99
|
|
—
|
|
—
|
|
|||||||||
|
Dividends to shareholders
|
—
|
|
—
|
|
(1,337
|
)
|
—
|
|
(1,337
|
)
|
|||||||||
|
Issuance of shares under stock purchase and award plans
|
17
|
|
2
|
|
647
|
|
—
|
|
649
|
|
|||||||||
|
Repurchase of ordinary shares
|
(30
|
)
|
(3
|
)
|
(1,917
|
)
|
—
|
|
(1,920
|
)
|
|||||||||
|
Tax benefit from exercise of stock-based awards
|
—
|
|
—
|
|
81
|
|
—
|
|
81
|
|
|||||||||
|
Stock-based compensation
|
|
|
—
|
|
439
|
|
—
|
|
439
|
|
|||||||||
|
Balance as of April 24, 2015
|
1,422
|
|
$
|
—
|
|
$
|
54,414
|
|
$
|
(1,184
|
)
|
$
|
53,230
|
|
|||||
|
Net income
|
—
|
|
—
|
|
3,538
|
|
—
|
|
3,538
|
|
|||||||||
|
Other comprehensive loss
|
—
|
|
—
|
|
—
|
|
(684
|
)
|
(684
|
)
|
|||||||||
|
Dividends to shareholders
|
—
|
|
—
|
|
(2,139
|
)
|
—
|
|
(2,139
|
)
|
|||||||||
|
Issuance of shares under stock purchase and award plans
|
15
|
|
—
|
|
491
|
|
—
|
|
491
|
|
|||||||||
|
Repurchase of ordinary shares
|
(38
|
)
|
—
|
|
(2,830
|
)
|
—
|
|
(2,830
|
)
|
|||||||||
|
Tax benefit from exercise of stock-based awards
|
—
|
|
—
|
|
82
|
|
—
|
|
82
|
|
|||||||||
|
Stock-based compensation
|
—
|
|
—
|
|
375
|
|
—
|
|
375
|
|
|||||||||
|
Balance as of April 29, 2016
|
1,399
|
|
$
|
—
|
|
$
|
53,931
|
|
$
|
(1,868
|
)
|
$
|
52,063
|
|
|||||
The accompanying notes are an integral part of these consolidated financial statements.
68
Medtronic plc
Consolidated
Statements of Cash Flows
|
|
Fiscal Year
|
|||||||||||
|
(in millions)
|
2016
|
2015
|
2014
|
|||||||||
|
Operating Activities:
|
|
|
|
|||||||||
|
Net income
|
$
|
3,538
|
|
$
|
2,675
|
|
$
|
3,065
|
|
|||
|
Adjustments to reconcile net income to net cash provided by operating activities:
|
|
|
|
|||||||||
|
Depreciation and amortization
|
2,820
|
|
1,306
|
|
850
|
|
||||||
|
Amortization of debt discount and issuance costs
|
29
|
|
76
|
|
8
|
|
||||||
|
Acquisition-related items
|
218
|
|
634
|
|
110
|
|
||||||
|
Provision for doubtful accounts
|
49
|
|
35
|
|
43
|
|
||||||
|
Deferred income taxes
|
(460
|
)
|
(926
|
)
|
(207
|
)
|
||||||
|
Stock-based compensation
|
375
|
|
439
|
|
145
|
|
||||||
|
Loss on debt extinguishment
|
163
|
|
—
|
|
—
|
|
||||||
|
Other, net
|
(111
|
)
|
(134
|
)
|
(28
|
)
|
||||||
|
Change in operating assets and liabilities, net of acquisitions:
|
|
|
|
|||||||||
|
Accounts receivable, net
|
(435
|
)
|
(413
|
)
|
(70
|
)
|
||||||
|
Inventories
|
(186
|
)
|
(282
|
)
|
(39
|
)
|
||||||
|
Accounts payable and accrued liabilities
|
(65
|
)
|
1,616
|
|
(117
|
)
|
||||||
|
Other operating assets and liabilities
|
(403
|
)
|
643
|
|
444
|
|
||||||
|
Certain litigation charges, net
|
26
|
|
42
|
|
770
|
|
||||||
|
Certain litigation payments
|
(340
|
)
|
(809
|
)
|
(15
|
)
|
||||||
|
Net cash provided by operating activities
|
5,218
|
|
4,902
|
|
4,959
|
|
||||||
|
Investing Activities:
|
|
|
|
|||||||||
|
Acquisitions, net of cash acquired
|
(1,213
|
)
|
(14,884
|
)
|
(385
|
)
|
||||||
|
Additions to property, plant, and equipment
|
(1,046
|
)
|
(571
|
)
|
(396
|
)
|
||||||
|
Purchases of marketable securities
|
(5,406
|
)
|
(7,582
|
)
|
(10,895
|
)
|
||||||
|
Sales and maturities of marketable securities
|
9,924
|
|
5,890
|
|
8,111
|
|
||||||
|
Other investing activities, net
|
(14
|
)
|
89
|
|
(29
|
)
|
||||||
|
Net cash provided by (used in) investing activities
|
2,245
|
|
(17,058
|
)
|
(3,594
|
)
|
||||||
|
Financing Activities:
|
|
|
|
|||||||||
|
Acquisition-related contingent consideration
|
(22
|
)
|
(85
|
)
|
(1
|
)
|
||||||
|
Change in short-term borrowings, net
|
7
|
|
(1
|
)
|
127
|
|
||||||
|
Repayment of short-term borrowings (maturities greater than 90 days)
|
(139
|
)
|
(150
|
)
|
(1,301
|
)
|
||||||
|
Proceeds from short-term borrowings (maturities greater than 90 days)
|
139
|
|
150
|
|
1,176
|
|
||||||
|
Issuance of long-term debt
|
—
|
|
19,942
|
|
1,994
|
|
||||||
|
Payments on long-term debt
|
(5,132
|
)
|
(1,268
|
)
|
(565
|
)
|
||||||
|
Dividends to shareholders
|
(2,139
|
)
|
(1,337
|
)
|
(1,116
|
)
|
||||||
|
Issuance of ordinary shares
|
491
|
|
649
|
|
1,307
|
|
||||||
|
Repurchase of ordinary shares
|
(2,830
|
)
|
(1,920
|
)
|
(2,553
|
)
|
||||||
|
Other financing activities
|
82
|
|
(31
|
)
|
14
|
|
||||||
|
Net cash (used in) provided by financing activities
|
(9,543
|
)
|
15,949
|
|
(918
|
)
|
||||||
|
Effect of exchange rate changes on cash and cash equivalents
|
113
|
|
(353
|
)
|
37
|
|
||||||
|
Net change in cash and cash equivalents
|
(1,967
|
)
|
3,440
|
|
484
|
|
||||||
|
Cash and cash equivalents at beginning of period
|
4,843
|
|
1,403
|
|
919
|
|
||||||
|
Cash and cash equivalents at end of period
|
$
|
2,876
|
|
$
|
4,843
|
|
$
|
1,403
|
|
|||
|
Supplemental Cash Flow Information
|
|
|
|
|||||||||
|
Cash paid for:
|
|
|
|
|||||||||
|
Income taxes
|
$
|
1,379
|
|
$
|
632
|
|
$
|
521
|
|
|||
|
Interest
|
1,266
|
|
578
|
|
394
|
|
||||||
The accompanying notes are an integral part of these consolidated financial statements.
69
1. Summary of Significant Accounting Policies
Nature of Operations
Medtronic plc (Medtronic or the Company) is the global leader in medical technology – alleviating pain, restoring health, and extending life for millions of people around the world. The Company provides innovative products and therapies to serve hospitals, physicians, clinicians, and patients. Medtronic was founded in 1949 and is headquartered in Dublin, Ireland. Medtronic plc is the successor registrant to Medtronic, Inc.
Principles of Consolidation
The consolidated financial statements include the accounts of Medtronic plc and its consolidated subsidiaries. All significant intercompany transactions and accounts have been eliminated.
Use of Estimates
The preparation of the consolidated financial statements in conformity with generally accepted accounting principles in the United States (U.S. GAAP) requires management to make estimates and assumptions that affect the reported amount of assets and liabilities, contingencies, and revenues and expenses in the consolidated financial statements and accompanying notes, sales discounts, rebates, allowances and incentives, warranty obligations, income tax reserves, depreciation, amortization, employee benefits, contingencies, and intangible asset and liability valuations. Actual results may or may not differ from those estimates.
Fiscal Year-End
The Company utilizes a 52/53-week fiscal year, ending the last Friday in April. The Company’s fiscal years
2016
,
2015
, and
2014
ended on
April 29, 2016
,
April 24, 2015
, and
April 25, 2014
, respectively. Fiscal year 2016 was a 53-week year, with the additional week occurring in the first quarter. Fiscal years
2015
and
2014
were 52-week years.
Cash Equivalents
The Company considers highly liquid investments with maturities of three months or less from the date of purchase to be cash equivalents. These investments are carried at cost, which approximates fair value.
Investments
Investments in marketable equity securities and certain debt securities are classified and accounted for as available-for-sale. Debt securities include corporate debt securities, government and agency securities, certificates of deposit, mortgage-backed securities, other asset-backed securities, debt funds, and auction rate securities. These investments are recorded at fair value in the consolidated balance sheets. The change in fair value for available-for-sale securities is recorded, net of taxes, as a component of
accumulated other comprehensive (loss) income
on the consolidated balance sheets. Management determines the appropriate classification of its investments in debt and equity securities at the time of purchase and reevaluates such determinations at each balance sheet date. The classification of marketable securities as current or long-term is based on the nature of the securities and their availability for use in current operations consistent with how the Company manages its capital structure and liquidity.
Investments in securities that are classified and accounted for as trading securities primarily include exchange-traded funds and are recorded at fair value on the consolidated balance sheets. The Company seeks to offset changes in liabilities related to equity and other market risks of certain deferred compensation arrangements. The change in fair value for trading securities is recorded as a component of
interest expense, net
on the consolidated statements of income.
Certain of the Company’s investments in equity and other securities are long-term, strategic investments in companies that are in varied stages of development. These investments are included in
other assets
on the consolidated balance sheets. The Company accounts for these investments under the cost or the equity method of accounting, as appropriate. Certain of these investments are publicly traded companies and are therefore accounted for as available for sale. The valuation of equity and other securities accounted for under the cost method considers all available financial information related to the investee, including valuations based on recent third-party equity investments in the investee. If an unrealized loss for any investment is considered to be other-than-temporary, the loss is recognized in the consolidated statements of income in the period the determination is made. Equity securities accounted for under the equity method are initially recorded at the amount of the Company’s investment and are adjusted each period for the Company’s share of the investee’s income or loss and dividends paid. Equity securities accounted for under both the cost and equity methods are reviewed quarterly for changes in circumstance or the occurrence of events that suggest the Company’s investment may not be recoverable. See Note 5 for discussion of the gains and losses recognized on equity and other securities.
Inventories
Inventories are stated at the lower of cost or market, with cost determined on a first-in, first-out basis. The Company reduces the carrying value of inventories for those items that are potentially excess, obsolete or slow-moving based on changes in customer demand, technology developments or other economic factors. Inventory balances are as follows:
70
|
(in millions)
|
April 29,
2016 |
April 24,
2015 |
|||||
|
Finished goods
|
$
|
2,242
|
|
$
|
2,268
|
|
|
|
Work in-process
|
499
|
|
509
|
|
|||
|
Raw materials
|
732
|
|
686
|
|
|||
|
Total
|
$
|
3,473
|
|
$
|
3,463
|
|
|
Property, Plant, and Equipment
Property, plant, and equipment is stated at cost. Additions and improvements that extend the lives of the assets are capitalized, while expenditures for repairs and maintenance are expensed as incurred. The Company assesses property, plant, and equipment for impairment whenever events or changes in circumstances indicate that the carrying amount of property, plant, and equipment assets may not be recoverable. Depreciation is provided using the straight-line method over the estimated useful lives of the various assets. Depreciation expense of
$889 million
,
$573 million
, and
$501 million
was recognized in fiscal years
2016
,
2015
, and
2014
, respectively.
Property, plant, and equipment balances and corresponding lives are as follows:
|
(in millions)
|
April 29,
2016 |
April 24,
2015 |
Lives
(in years) |
|||||||
|
Land and land improvements
|
$
|
215
|
|
$
|
217
|
|
Up to 20
|
|
||
|
Buildings and leasehold improvements
|
2,394
|
|
2,314
|
|
Up to 40
|
|
||||
|
Equipment
|
6,328
|
|
5,649
|
|
Generally 3-7, up to 15
|
|
||||
|
Construction in progress
|
777
|
|
683
|
|
—
|
|
||||
|
Subtotal
|
9,714
|
|
8,863
|
|
|
|
||||
|
Less: Accumulated depreciation
|
(4,873
|
)
|
(4,164
|
)
|
|
|
||||
|
Property, plant, and equipment, net
|
$
|
4,841
|
|
$
|
4,699
|
|
|
|
||
Goodwill and Intangible Assets
Goodwill is the excess of the purchase price over the estimated fair value of net assets of acquired businesses. In accordance with U.S. GAAP, goodwill is not amortized. The Company assesses the impairment of goodwill annually in the third quarter and whenever an event occurs or circumstances change that would indicate the carrying amount may be impaired. Impairment testing for goodwill is done at a reporting unit level. An impairment loss is recognized when the carrying amount of the reporting unit’s net assets exceeds the estimated fair value of the reporting unit. The estimated fair value is determined using a discounted future cash flow analysis.
Intangible assets include patents, trademarks, tradenames, customer relationships, purchased technology, and in-process research and development (IPR&D). Intangible assets with a definite life are amortized on a straight-line basis with estimated useful lives ranging from
three
to
20 years
. Intangible assets with a definite life are tested for impairment whenever events or changes in circumstances indicate that the carrying amount of an intangible asset (asset group) may not be recoverable. Indefinite-lived intangible assets are tested for impairment annually in the third quarter and whenever events or changes in circumstances indicate that the carrying amount may be impaired. Impairment is calculated as the excess of the asset’s carrying value over its fair value. Fair value is generally determined using a discounted future cash flow analysis.
IPR&D represents the fair value of those research and development (R&D) projects for which the related products have not received regulatory approval and have no alternative future use. IPR&D acquired in a business combination is initially capitalized at its fair value as an indefinite-lived intangible asset. Determining the fair value of IPR&D requires the Company to make significant estimates. The fair value of IPR&D is determined by estimating the future cash flows of each R&D project or technology and discounting the net cash flows back to their present values. The discount rate used is determined at the time of measurement in accordance with accepted valuation methodologies. IPR&D has an indefinite life and is not amortized until regulatory approval is received and the product is launched, at which time the IPR&D becomes an amortizable asset.
At the time of acquisition, the Company expects that all acquired IPR&D will reach technological feasibility, but there can be no assurance that the commercial viability of these products will actually be achieved. The nature of the efforts to develop the acquired technologies into commercially viable products consists principally of planning, designing, and conducting clinical trials necessary to obtain regulatory approvals. The risks associated with achieving commercialization include, but are not limited to, delays or failure to obtain regulatory approvals to conduct clinical trials, delays or failure to obtain required market clearances, or delays or issues with patent issuance, validity, and litigation. If commercial viability were not achieved, the Company would likely look to
71
other alternatives to provide these therapies. If the related R&D project is not completed in a timely manner or the R&D project is terminated or abandoned, the Company may have an impairment related to the IPR&D, calculated as the excess of the asset’s carrying value over its fair value.
Contingent Consideration
The Company recognizes contingent consideration at fair value at the date of acquisition based on the consideration expected to be transferred, estimated as the probability-weighted future cash flows, discounted back to present value. The discount rate used is determined at the time of measurement in accordance with accepted valuation methodologies. The fair value of the contingent consideration is remeasured each reporting period with the change in fair value, including accretion for the passage of time, recognized as income or expense within
acquisition-related items
in the consolidated statements of income.
Derivatives
U.S. GAAP requires companies to recognize all derivatives as assets and liabilities on the balance sheet and to measure the instruments at fair value through earnings unless the derivative qualifies for hedge accounting. If the derivative qualifies for hedge accounting, depending on the nature of the hedge and hedge effectiveness, changes in the fair value of the derivative will either be recognized immediately in earnings or recorded in
other comprehensive income (loss)
until the hedged item is recognized in earnings upon settlement/termination. The changes in the fair value of the derivative are intended to offset the change in fair value of the hedged asset, liability, or probable commitment. The Company evaluates hedge effectiveness at inception and on an ongoing basis. If a derivative is no longer expected to be highly effective, hedge accounting is discontinued. Hedge ineffectiveness, if any, is recorded in earnings. Cash flows from derivative contracts are reported as operating activities in the consolidated statements of cash flows.
The Company uses operational and economic hedges, as well as currency exchange rate derivative contracts and interest rate derivative instruments, to manage the impact of currency exchange and interest rate changes on earnings and cash flows. In addition, the Company uses cross currency interest rate swaps to manage currency risk related to certain debt. In order to minimize earnings and cash flow volatility resulting from currency exchange rate changes, the Company enters into derivative instruments, principally forward currency exchange rate contracts. These contracts are designed to hedge anticipated transactions in another currency and changes in the value of specific assets and liabilities. At inception of the contract, the derivative is designated as either a freestanding derivative or a cash flow hedge. The primary currencies of the derivative instruments are the Euro and the Japanese Yen. The Company does not enter into currency exchange rate derivative contracts for speculative purposes. All derivative instruments that qualify for hedge accounting are recorded at fair value on the consolidated balance sheets, as a component of
prepaid expenses and other current assets, other assets, other accrued expenses,
or
other long-term liabilities
depending upon the gain or loss position of the contract and contract maturity date.
Forward contracts designated as cash flow hedges are designed to hedge the variability of cash flows associated with forecasted transactions denominated in another currency that will take place in the future. For derivative instruments that are designated and qualify as a cash flow hedge, the effective portion of the gain or loss on the derivative instrument is reported as a component of
accumulated other comprehensive (loss) income
. The effective portion of the gain or loss on the derivative instrument is reclassified into earnings and is included in
other expense, net
or
cost of products sold
in the consolidated statements of income, depending on the underlying transaction that is being hedged, in the same period or periods during which the hedged transaction affects earnings.
The Company uses freestanding derivative contracts to offset its exposure to the change in value of specific non-U.S. dollar currency denominated assets and liabilities and to offset variability of cash flows associated with forecasted transactions denominated other currencies. These derivatives are not designated as hedges, and therefore, changes in the value of these contracts are recognized in earnings, thereby offsetting the current earnings effect of the related change in value of non-U.S dollar denominated assets and liabilities.
The Company uses forward starting interest rate derivative instruments designated as cash flow hedges to manage the exposure to interest rate volatility with regard to future issuances of fixed-rate debt. The effective portion of the gains or losses on the forward starting interest rate derivative instruments that are designated and qualify as cash flow hedges are reported as a component of
accumulated other comprehensive (loss) income.
Beginning in the period in which the planned debt issuance occurs and the related derivative instruments are terminated, the effective portion of the gains or losses are then reclassified into
interest expense, net
over the term of the related debt. Any portion of the gains or losses that are determined to be ineffective are immediately recognized in
interest expense, net
.
The Company uses interest rate derivative instruments designated as fair value hedges to manage the exposure to interest rate movements and to reduce borrowing costs by converting fixed-rate debt into floating-rate debt. Under these agreements, the Company agrees to exchange, at specified intervals, the difference between fixed and floating interest amounts calculated by reference to agreed-upon notional principal amounts. Changes in the fair value of the derivative instrument are recorded in
interest
72
expense, net,
and are offset by changes in the fair value of the underlying debt instrument. The gains (losses) from terminated interest rate swap agreements are recorded in
long-term debt
, increasing (decreasing) the outstanding balances of the debt, and amortized as a reduction of (addition to) interest expense, net over the remaining life of the related debt. The cash flows from the termination of the interest rate swap agreements are reported as operating activities in the consolidated statements of cash flows.
In addition, the Company has collateral credit agreements with its primary derivative counterparties. Under these agreements, either party is required to post eligible collateral when the market value of transactions covered by the agreement exceeds specific thresholds, thus limiting credit exposure for both parties.
Fair Value Measurements
The Company follows the authoritative guidance on fair value measurements and disclosures with respect to assets and liabilities that are measured at fair value on both a recurring and nonrecurring basis. Under this guidance, fair value is defined as the exit price, or the amount that would be received to sell an asset or paid to transfer a liability in an orderly transaction between market participants as of the measurement date. The authoritative guidance also establishes a hierarchy for inputs used in measuring fair value that maximizes the use of observable inputs and minimizes the use of unobservable inputs by requiring that the most observable inputs be used when available. Observable inputs are inputs market participants would use in valuing the asset or liability, based on market data obtained from sources independent of the Company. Unobservable inputs are inputs that reflect the Company’s assumptions about the factors market participants would use in valuing the asset or liability developed based upon the best information available in the circumstances. The categorization of financial assets and financial liabilities within the valuation hierarchy is based upon the lowest level of input that is significant to the fair value measurement. The hierarchy is broken down into three levels defined as follows:
|
•
|
Level 1 - Inputs are quoted prices in active markets for identical assets or liabilities.
|
|
•
|
Level 2 - Inputs include quoted prices for similar assets or liabilities in active markets, quoted prices for identical or similar assets or liabilities in markets that are not active, and inputs (other than quoted prices) that are observable for the asset or liability, either directly or indirectly.
|
|
•
|
Level 3 - Inputs are unobservable for the asset or liability.
|
Financial assets that are classified as Level 1 securities include highly liquid government bonds within U.S. government and agency securities, marketable equity securities, and exchange-traded funds for which quoted market prices are available. In addition, the Company classifies currency forward contracts as Level 1 since they are valued using quoted market prices in active markets which have identical assets or liabilities.
The valuation for most fixed maturity securities are classified as Level 2. Financial assets that are classified as Level 2 include corporate debt securities, government and agency securities, certificates of deposit, other asset-backed securities, debt funds, and certain mortgage-backed securities whose value is determined using inputs that are observable in the market or can be derived principally from, or corroborated by, observable market data such as pricing for similar securities, recently executed transactions, cash flow models with yield curves, and benchmark securities. In addition, interest rate swaps are included in Level 2 as the Company uses inputs other than quoted prices that are observable for the asset. The Level 2 derivative instruments are primarily valued using standard calculations and models that use readily observable market data as their basis.
Financial assets are considered Level 3 when their fair values are determined using pricing models, discounted cash flow methodologies, or similar techniques, and at least one significant model assumption or input is unobservable. Level 3 financial assets also include certain investment securities for which there is limited market activity such that the determination of fair value requires significant judgment or estimation. Level 3 investment securities include certain corporate debt securities, auction rate securities, and certain mortgage-backed securities. With the exception of auction rate securities, these securities were valued using third-party pricing sources that incorporate transaction details such as contractual terms, maturity, timing, and amount of expected future cash flows, as well as assumptions about liquidity and credit valuation adjustments by market participants. The fair value of auction rate securities is estimated by the Company using a discounted cash flow model, which incorporates significant unobservable inputs. The significant unobservable inputs used in the fair value measurement of the Company’s auction rate securities are years to principal recovery and the illiquidity premium that is incorporated into the discount rate. Significant increases (decreases) in any of those inputs in isolation would result in a significantly lower (higher) fair value of the securities.
Warranty Obligation
The Company offers a warranty on various products. The Company estimates the costs that may be incurred under its warranties and records a liability in the amount of such costs at the time the product is sold. The amount of the reserve recorded is equal to the net costs to repair or otherwise satisfy the obligation. The Company includes the warranty obligation in
other accrued expenses
and
other long-term liabilities
on the consolidated balance sheets.
73
Changes in the Company’s product warranty obligations during the years ended
April 29, 2016
and
April 24, 2015
consisted of the following:
|
(in millions)
|
Warranty Obligation
|
|||
|
Balance as of April 25, 2014
|
$
|
32
|
|
|
|
Fair value of warranty obligation acquired from Covidien
|
23
|
|
||
|
Technology upgrade commitment
|
74
|
|
||
|
Warranty claims provision
|
30
|
|
||
|
Settlements made
|
(24
|
)
|
||
|
Balance as of April 24, 2015
|
$
|
135
|
|
|
|
Warranty claims provision
|
64
|
|
||
|
Settlements made
|
(91
|
)
|
||
|
Balance as of April 29, 2016
|
$
|
108
|
|
|
Self-Insurance
It is the Company’s policy to self-insure the vast majority of its insurable risks including medical and dental costs, disability coverage, physical loss to property, business interruptions, workers’ compensation, comprehensive general, and product liability. Insurance coverage is obtained for those risks required to be insured by law or contract. The Company uses claims data and historical experience, as applicable, to estimate liabilities associated with the exposures that the Company has self-insured. Based on historical loss trends, the Company believes that its self-insurance program accruals and its existing insurance coverage will be adequate to cover future losses. Historical trends, however, may not be indicative of future losses. These losses could have a material adverse impact on the Company’s consolidated financial statements.
Retirement Benefit Plan Assumptions
The Company sponsors various retirement benefit plans, including defined benefit pension plans (pension benefits), post-retirement medical plans (post-retirement benefits), defined contribution savings plans, and termination indemnity plans, covering substantially all U.S. employees and many employees outside the U.S. Pension benefit costs include assumptions for the discount rate, retirement age, compensation rate increases, and the expected return on plan assets. Post-retirement benefit costs include assumptions for the discount rate, retirement age, expected return on plan assets, and health care cost trend rate assumptions.
The Company changed the methodology used to estimate the service and interest cost components of net periodic pension cost and net periodic postretirement benefit cost for the Company’s pension and other post-retirement benefits, effective April 30, 2016. Previously, the Company estimated such cost components utilizing a single weighted-average discount rate derived from the market-observed yield curves of high-quality fixed income securities used to measure the pension benefit obligation and accumulated post-retirement benefit obligation. The new methodology utilizes a full yield curve approach in the estimation of these cost components by applying the specific spot rates along the yield curve to their underlying projected cash flows and provides a more precise measurement of service and interest costs by improving the correlation between projected cash flows and their corresponding spot rates. The change does not affect the measurement of the Company’s pension obligation or accumulated post-retirement benefit obligation. The Company has accounted for this change prospectively as a change in accounting estimate.
Revenue Recognition
The Company sells its products through direct sales representatives and independent distributors. The Company recognizes revenue when title to the goods and risk of loss transfers to customers, which may be upon shipment or upon delivery to the customer site, based on the contract terms or legal requirements in non-U.S. jurisdictions, provided there are no material remaining performance obligations required of the Company or any matters requiring customer acceptance. In cases where the Company utilizes distributors or ships product directly to the end user, it generally recognizes revenue upon shipment provided all revenue recognition criteria have been met. A portion of the Company’s revenue is generated from inventory maintained at hospitals or with field representatives. For these products, revenue is recognized at the time the product has been used or implanted.
The Company records estimated sales returns, discounts, and rebates as a reduction of sales in the same period revenue is recognized. Rebates are estimated based on sales terms, historical experience, and trend analysis. In estimating rebates, the Company considers the lag time between the point of sale and the payment of the rebate claim, contractual commitments, including stated rebate rates, and other relevant information. The Company adjusts reserves to reflect differences between estimated and actual experience, and records such adjustment as a reduction of sales in the period of adjustment.
In certain circumstances, the Company enters into arrangements in which it provides multiple deliverables to its customers. Arrangements with multiple deliverables are divided into separate units of accounting. Total revenue is first allocated among the
74
deliverables based upon their relative fair values. Revenue is then recognized for each deliverable in accordance with the principles described above. Fair values are determined based on the prices at which the individual deliverables are regularly sold to other third parties.
Shipping and Handling
Shipping and handling costs incurred were
$316 million
,
$284 million
, and
$194 million
in fiscal years
2016
,
2015
, and
2014
, respectively, and are included in
selling, general, and administrative expense
in the consolidated statements of income.
Research and Development
Research and development costs are expensed when incurred. Research and development costs include costs of all basic research activities as well as other research, engineering, and technical effort required to develop a new product or service or make significant improvement to an existing product or manufacturing process. Research and development costs also include pre-approval regulatory and clinical trial expenses.
Costs Associated with Exit Activities
The Company accrues employee termination costs associated with ongoing benefit arrangements, including benefits provided as part of the Company’s U.S. severance policy or provided in accordance with non-U.S. statutory requirements, if the obligation is attributed to prior services rendered, the rights to the benefits have vested, the payment is probable, and the amount can be reasonably estimated. Other costs associated with exit activities may include distributor cancellation fees, costs related to leased facilities to be abandoned or subleased, and asset impairments.
Contingencies
The Company records a liability in the consolidated financial statements for loss contingencies when a loss is known or considered probable and the amount can be reasonably estimated. If the reasonable estimate of a known or probable loss is a range, and no amount within the range is a better estimate than any other, the minimum amount of the range is accrued. If a loss is reasonably possible but not known or probable, and can be reasonably estimated, the estimated loss or range of loss is disclosed. In accordance with U.S. GAAP, income tax liabilities are not accounted for under the loss contingency rules, but rather specific accounting guidance. Insurance recoveries related to potential claims are recognized up to the amount of the recorded liability when coverage is confirmed and the estimated recoveries are probable of payment. These recoveries are not netted against the related liabilities for financial statement presentation.
Tax Guarantees
As a result of the recent acquisition of Covidien, the Company has guarantee commitments and indemnifications with Tyco International plc (Tyco International) and TE Connectivity Ltd. (TE Connectivity) which relate to certain contingent tax liabilities as part of a tax sharing agreement. These commitments and indemnifications were recorded at their respective fair values as of the Acquisition Date. Each reporting period, the Company evaluates the potential loss that it believes is probable. This guarantee currently has not been amortized into income because there has been no predictable pattern of performance. As a result, the liability generally will be reduced upon the Company’s release from its obligations or as payments are made. As of
April 29, 2016
, liabilities related to guarantee commitments associated with Tyco International's and TE Connectivity's tax obligations totaled
$284 million
and are included in
other accrued expenses
and on the Company’s consolidated balance sheet.
The Company also has current and non-current receivables due from Tyco International and TE Connectivity as a result of the tax sharing agreement. As of
April 29, 2016
, receivables from Tyco International and TE Connectivity totaled
$261 million
and are included in
prepaid expenses and other current assets
on the Company’s consolidated balance sheet. See Notes 15 and 18 for additional background on the tax sharing agreement.
Other Expense, Net
Other expense, net
includes royalty income and expense, realized equity security gains and losses, realized currency transaction and derivative gains and losses, impairment charges on equity securities, Puerto Rico excise tax, and U.S. medical device excise tax.
Currency Translation
Assets and liabilities of non-U.S. dollar functional currency entities are translated to U.S. dollars at period-end exchange rates, and the resulting gains and losses arising from the translation of those net assets are recorded as a cumulative translation adjustment, a component of
accumulated other comprehensive (loss) income
on the consolidated balance sheets. Elements of the consolidated statements of income are translated at the average monthly currency exchange rates in effect during the period and currency transaction gains and losses are included in
other expense, net
in the consolidated statements of income.
Earnings Per Share
Earnings per share is calculated using the two-class method, as the Company's A Preferred Shares are considered participating securities. Accordingly, earnings are allocated to both ordinary shares and participating securities in determining earnings per ordinary share. Due to the limited number of A Preferred Shares outstanding, this allocation had no effect on ordinary earnings per share; therefore, it is not presented below. Basic earnings per share is computed based on the weighted average number of ordinary shares outstanding. Diluted earnings per share is computed based on the weighted average number of ordinary shares outstanding, increased by the number of additional shares that would have been outstanding had the potentially dilutive ordinary shares been issued, and reduced by the number of shares the Company could have repurchased from the proceeds
75
from issuance of the potentially dilutive shares. Potentially dilutive ordinary shares include stock options and other stock-based awards granted under stock-based compensation plans and shares committed to be purchased under the employee stock purchase plan.
The table below sets forth the computation of basic and diluted earnings per share:
|
|
Fiscal Year
|
||||||||||
|
(in millions, except per share data)
|
2016
|
2015
|
2014
|
||||||||
|
Numerator:
|
|
|
|
|
|
|
|||||
|
Net income attributable to ordinary shareholders
|
$
|
3,538
|
|
$
|
2,675
|
|
$
|
3,065
|
|
||
|
Denominator:
|
|
|
|
|
|
|
|||||
|
Basic – weighted average shares outstanding
|
1,409.6
|
|
1,095.5
|
|
1,002.1
|
|
|||||
|
Effect of dilutive securities:
|
|
|
|
|
|
|
|||||
|
Employee stock options
|
12.2
|
|
9.1
|
|
7.1
|
|
|||||
|
Employee restricted stock units
|
4.0
|
|
4.3
|
|
4.3
|
|
|||||
|
Other
|
0.1
|
|
0.1
|
|
0.1
|
|
|||||
|
Diluted – weighted average shares outstanding
|
1,425.9
|
|
1,109.0
|
|
1,013.6
|
|
|||||
|
Basic earnings per share
|
$
|
2.51
|
|
$
|
2.44
|
|
$
|
3.06
|
|
||
|
Diluted earnings per share
|
$
|
2.48
|
|
$
|
2.41
|
|
$
|
3.02
|
|
||
The calculation of weighted average diluted shares outstanding excludes options to purchase approximately
4 million
,
2 million
, and
5 million
ordinary shares in fiscal years
2016
,
2015
, and
2014
, respectively, because their effect would be anti-dilutive on the Company’s earnings per share. Additionally, the calculation of weighted average diluted shares outstanding excludes approximately
20 million
and
5 million
shares for fiscal years
2016
and
2015
respectively, and does not exclude any shares for fiscal year
2014
, because the performance criteria had not yet been met. The calculation of weighted average diluted shares outstanding excludes approximately
1 million
restricted stock units for each fiscal year
2016
,
2015
and
2014
, because the performance criteria had not yet been met.
New Accounting Standards
Recently Adopted
In April 2014, the Financial Accounting Standards Board (FASB) issued amended guidance for reporting discontinued operations. The amended guidance changes the criteria for determining when the results of operations are to be reported as discontinued operations and expands the related disclosure requirements. The guidance defines a discontinued operation as a component or group of components that is disposed of or classified as held for sale, which is a strategic shift that has, or will have, a major effect on financial position and results of operations. The Company prospectively adopted this accounting guidance in the first quarter of fiscal year 2016. Its adoption did not have a material impact on the Company's consolidated financial statements.
In September 2015, the FASB issued accounting guidance which eliminates the requirement for an acquirer in a business combination to restate prior period financial statements for measurement period adjustments. An acquirer in a business combination is required to report provisional amounts when measurements are incomplete at the end of the reporting period covering the business combination. Prior to the issuance of the new guidance, an acquirer was required to adjust such provisional amounts by restating prior period financial statements. Under the new guidance, the acquirer will recognize the measurement-period adjustment in the period the adjustment is determined. The Company prospectively adopted this accounting guidance in the third quarter of fiscal year 2016. Its adoption did not have a material impact on the Company's consolidated financial statements.
In November 2015, the FASB issued accounting guidance that requires all deferred tax assets and liabilities, along with any related valuation allowance, to be classified as noncurrent on the Consolidated Balance Sheets. Current guidance requires the deferred taxes for each jurisdiction to be presented as a net current asset or liability and net noncurrent asset or liability. As a result of the new guidance, each jurisdiction will now only have one net noncurrent deferred tax asset or liability. The new guidance does not change the existing requirement that only permits offsetting deferred tax assets and liabilities within a single jurisdiction. Entities have the option to apply the new guidance prospectively or retrospectively. This accounting guidance is effective for financial statements issued for annual periods beginning after December 15, 2016, with early adoption permitted. The Company prospectively
76
adopted this accounting guidance in the third quarter of fiscal year 2016. Prior periods have not been retrospectively adjusted for adoption of this statement.
In March 2016, the FASB issued accounting guidance which eliminates the requirement to apply the equity method of accounting retrospectively when a reporting entity obtains significant influence over a previously held investment. Instead, the equity method of accounting should be applied prospectively from the date significant influence is obtained. Investors should add the cost of acquiring the additional interest in the investee (if any) to the current basis of their previously held interest. For available-for-sale securities that become eligible for the equity method of accounting, any unrealized gain or loss recorded within accumulated other comprehensive income (AOCI) should be recognized in earnings at the date the investment initially qualifies for the use of the equity method. The Company prospectively adopted this accounting guidance in the fourth quarter of fiscal year 2016. Its adoption did not have a material impact on the Company's consolidated financial statements.
Not Yet Adopted
In May 2014, the FASB issued amended revenue recognition guidance to clarify the principles for recognizing revenue from contracts with customers. The guidance requires an entity to recognize revenue in an amount that reflects the consideration to which an entity expects to be entitled in exchange for the transfer of goods or services. The guidance also requires expanded disclosures relating to the nature, amount, timing, and uncertainty of revenue and cash flows arising from contracts with customers. Additionally, qualitative and quantitative disclosures are required about customer contracts, significant judgments and changes in judgments, and assets recognized from the costs to obtain or fulfill a contract. This accounting guidance is effective for the Company beginning in the first quarter of fiscal year 2019 using one of two prescribed retrospective methods. Early adoption is permitted. The Company is evaluating the impact of the amended revenue recognition guidance on the Company's consolidated financial statements.
In February 2016, the FASB issued guidance which requires lessees to recognize right-of-use assets and lease liabilities on the balance sheet. The guidance is to be applied using a modified retrospective approach at the beginning of the earliest comparative period in the financial statements and is effective for the Company beginning in the first quarter of fiscal year 2020. Early adoption is permitted. The Company is evaluating the impact of the lease guidance on the Company's consolidated financial statements.
In March 2016, the FASB issued guidance to simplify the accounting for share based payment transactions by requiring all excess tax benefits and deficiencies to be recognized in income tax expense or benefit in earnings. An entity can make an entity-wide accounting policy election to either estimate the expected forfeiture awards or account for forfeitures as they occur. This accounting guidance is effective for the Company beginning in the first quarter of fiscal year 2018. Early adoption is permitted for any entity in any interim or annual period. The Company is currently assessing the impact of the guidance on the Company's consolidated financial statements.
2. Acquisitions and Acquisition-Related Items
The Company had various acquisitions and other acquisition-related activity during fiscal years
2016
,
2015
, and
2014
. Certain acquisitions were accounted for as business combinations as noted below. In accordance with authoritative guidance on business combination accounting, the assets and liabilities of the companies acquired were recorded as of the acquisition date, at their respective fair values, and consolidated. With the exception of the Covidien acquisition, and unless otherwise disclosed, the pro forma impact of these acquisitions was not significant, either individually or in the aggregate, to the results of the Company for the fiscal years ended
April 29, 2016
,
April 24, 2015
, or
April 25, 2014
. The results of operations related to each company acquired have been included in the Company’s consolidated statements of income since the date each company was acquired.
Acquisition of Covidien public limited company in Fiscal Year 2015
On January 26, 2015 (Acquisition Date), pursuant to the transaction agreement, dated as of June 15, 2014 (the Transaction Agreement), the Company acquired Covidien plc (Covidien), and Covidien and Medtronic, Inc. became subsidiaries of Medtronic (collectively, the Transactions). In connection with the consummation of the Transactions, Medtronic re-registered as a public limited company organized under the laws of Ireland.
On January 26, 2015, (a) each Covidien ordinary share was converted into the right to receive
$35.19
in cash and
0.956
of a newly issued Medtronic plc share (the Arrangement Consideration) in exchange for each Covidien share held by such shareholders, and (b) each share of Medtronic, Inc. common stock was converted into the right to receive one Medtronic plc ordinary share. Based on the number of outstanding shares of Medtronic, Inc. and Covidien as of January 23, 2015 (the last business day prior to the
77
close of the transaction), former Medtronic, Inc. and Covidien shareholders held approximately
69 percent
and
31 percent
, respectively, of the Company's ordinary shares after giving effect to the acquisition.
Covidien is a global leader in the development, manufacture, and sale of healthcare products for use in clinical and home settings. The operating results for Covidien are included in the Minimally Invasive Therapies Group, Cardiac and Vascular Group and Restorative Therapies Group segments.
Fair Value of Consideration Transferred
Total consideration was
$50.0 billion
, consisting of
$16.0 billion
cash and
$34.0 billion
of non-cash consideration. Total consideration is comprised of the equity value of the shares that were outstanding as of January 23, 2015 and the portion of Covidien's share awards and share options earned as of January 23, 2015 (
$559 million
). Share awards and share options not earned (
$496 million
) as of January 23, 2015 will be expensed over the remaining future vesting period, including
$189 million
and
$70 million
recognized in
acquisition-related items
and
restructuring charges, net
, respectively, for the fiscal year ended
April 24, 2015
. Share award and share options of
$58 million
and
$18 million
were recognized in
acquisition-related items
and
restructuring charges, net
, respectively, for the fiscal year ended
April 29, 2016
.
The following table summarizes the total fair value of consideration transferred:
|
(in millions, except per share data)
|
||||
|
Cash consideration paid to Covidien shareholders ($35.19 per share)
|
$
|
15,994
|
|
|
|
Cash consideration paid for vested Covidien share awards ($35.19 per share)
|
33
|
|
||
|
Total cash consideration
|
$
|
16,027
|
|
|
|
Covidien shares outstanding as of January 23, 2015
|
455
|
|
||
|
Exchange ratio per share
|
0.956
|
|
||
|
Total Medtronic shares issued to Covidien shareholders
(1)
|
435
|
|
||
|
Medtronic per share value as of January 23, 2015
|
$
|
76.95
|
|
|
|
Fair value of Medtronic shares issued to Covidien shareholders
|
$
|
33,435
|
|
|
|
Fair value of shares issued to Covidien share award holders
(1)
|
70
|
|
||
|
Fair value of share options and awards issued to Covidien share option and award holders
|
456
|
|
||
|
Total fair value of consideration transferred
|
$
|
49,988
|
|
|
(1)
1 million
ordinary shares were issued, net, to Covidien share award holders.
Fair Value of Assets Acquired and Liabilities Assumed
The Company accounted for the acquisition of Covidien as a business combination using the acquisition method of accounting. The assets acquired and liabilities assumed were recorded at their respective fair values as of the Acquisition Date. The fair value of assets acquired and liabilities assumed was finalized during the third quarter of fiscal year 2016. During the measurement period, which ended January 26, 2016, adjustments were made to finalize Covidien's preliminary fair value estimates related primarily to other current assets, intangible assets, goodwill, certain property value, contingent liabilities and the related deferred tax impacts. Based upon the acquisition valuation, the Company acquired
$18.3 billion
of customer-related intangible assets,
$7.1 billion
of technology-based intangible assets,
$430 million
of tradenames, with weighted average estimated useful lives of
18
,
16
, and
6
years, respectively,
$420 million
of IPR&D, and
$30.0 billion
of goodwill.
78
The fair values of the assets acquired and liabilities assumed are as follows:
|
(estimated in millions)
|
|||
|
Accounts receivable
|
$
|
1,349
|
|
|
Inventories
|
2,219
|
|
|
|
Other current assets
|
3,181
|
|
|
|
Property, plant, and equipment
|
2,293
|
|
|
|
Goodwill
|
29,979
|
|
|
|
Intangible assets
|
26,210
|
|
|
|
Other assets
|
761
|
|
|
|
Total assets acquired
|
65,992
|
|
|
|
|
|||
|
Short-term borrowings
|
1,011
|
|
|
|
Other current liabilities
|
2,434
|
|
|
|
Long-term debt
|
4,623
|
|
|
|
Long-term deferred tax liabilities
|
4,745
|
|
|
|
Other long-term liabilities
|
3,191
|
|
|
|
Total liabilities assumed
|
16,004
|
|
|
|
Net assets acquired
|
$
|
49,988
|
|
Goodwill has been allocated to the Minimally Invasive Therapies Group, Cardiac and Vascular Group, Restorative Therapies Group, and Diabetes Group. Goodwill is calculated as the excess of the consideration transferred over the net assets recognized and represents the expected revenue and cost synergies of the combined company, which are further described above. Goodwill recognized as a result of the acquisition is not deductible for tax purposes. See Note 6 for additional information about goodwill and other intangible assets.
Contingent liabilities assumed as part of the Acquisition total
$2.7 billion
and are included in
accrued income taxes
,
other accrued expenses
,
long-term accrued income taxes
, and
other long-term liabilities
. These contingent liabilities include
$1.5 billion
related to income taxes (including uncertain tax positions and guarantee commitments), and
$1.2 billion
related to legal claims (including product liability and environmental matters). Contingent liabilities are recorded at their estimated fair values, aside from those pertaining to uncertainty in income taxes which are an exception to the fair value basis of accounting. Legal matters and certain environmental matters that are legal in nature are recorded at their respective probable and estimable amounts. See Note 15 for additional background on contingent liabilities.
Actual and Pro Forma Impact
The Company's consolidated financial statements for the fiscal year ended
April 24, 2015
include Covidien's results of operations from the Acquisition Date through
April 24, 2015
. Net sales and operating loss attributable to Covidien during this period and included in Medtronic's consolidated financial statements for the fiscal year ended
April 24, 2015
total
$2.7 billion
and
$423 million
, respectively. The
$423 million
operating loss includes
$623 million
of amortization from the step-up in fair value of inventory acquired,
$379 million
of intangible asset amortization,
$218 million
of acquisition-related charges, and
$142 million
of restructuring charges, net, all of which relate to the Covidien acquisition.
The following unaudited pro forma information gives effect to Medtronic's acquisition of Covidien as if the acquisition had occurred on April 27, 2013, the first day of fiscal year 2014, and had been included in the Company's consolidated statements of income for fiscal years 2015 and 2014.
|
(in millions)
|
2015
|
2014
|
|||||
|
Pro forma net sales
|
$
|
28,369
|
|
$
|
27,380
|
|
|
|
Pro forma net income
|
$
|
3,944
|
|
$
|
3,280
|
|
|
79
The historical consolidated financial information of the Company and Covidien has been adjusted in the pro forma information to give effect to pro forma events that are (1) directly attributable to the transaction, (2) factually supportable, and (3) expected to have a continuing impact on the combined results. In order to reflect the occurrence of the acquisition on April 27, 2013 as required, the unaudited pro forma results include adjustments to reflect, among other things, the amortization of the inventory step-up, the incremental intangible asset amortization to be incurred based on the values of each identifiable intangible asset, and interest expense from debt financing obtained to fund the cash consideration transferred. Pro forma adjustments were tax-effected at the Company's statutory rate. These pro forma amounts are not necessarily indicative of the results that would have been obtained if the acquisition had occurred as of the beginning of the period presented or that may occur in the future, and does not reflect future synergies, integration costs, or other such costs or savings.
Fiscal Year 2016
The fair values of the assets acquired and liabilities assumed from acquisitions during fiscal year 2016 are as follows:
|
(in millions)
|
Twelve, Inc.
|
RF Surgical Systems, Inc.
|
Medina Medical
|
All Other
|
Total
|
||||||||||||||
|
Other current assets
|
$
|
60
|
|
$
|
40
|
|
$
|
11
|
|
$
|
134
|
|
$
|
245
|
|
||||
|
Property, plant, and equipment
|
—
|
|
2
|
|
—
|
|
39
|
|
41
|
|
|||||||||
|
IPR&D
|
192
|
|
—
|
|
122
|
|
143
|
|
457
|
|
|||||||||
|
Other intangible assets
|
—
|
|
115
|
|
—
|
|
199
|
|
314
|
|
|||||||||
|
Goodwill
|
291
|
|
135
|
|
126
|
|
304
|
|
856
|
|
|||||||||
|
Other assets
|
—
|
|
2
|
|
—
|
|
15
|
|
17
|
|
|||||||||
|
Total assets acquired
|
543
|
|
294
|
|
259
|
|
834
|
|
1,930
|
|
|||||||||
|
|
|||||||||||||||||||
|
Current liabilities
|
37
|
|
27
|
|
6
|
|
91
|
|
161
|
|
|||||||||
|
Long-term deferred tax liabilities, net
|
34
|
|
27
|
|
34
|
|
53
|
|
148
|
|
|||||||||
|
Other liabilities
|
—
|
|
—
|
|
—
|
|
50
|
|
50
|
|
|||||||||
|
Total liabilities assumed
|
71
|
|
54
|
|
40
|
|
194
|
|
359
|
|
|||||||||
|
Net assets acquired
|
$
|
472
|
|
$
|
240
|
|
$
|
219
|
|
$
|
640
|
|
$
|
1,571
|
|
||||
Twelve, Inc.
On October 2, 2015, the Company's Coronary & Structural Heart division acquired Twelve, Inc. (Twelve), a privately-held medical device company focused on the development of a transcatheter mitral valve replacement device. Total consideration for the transaction was approximately
$472 million
, which included an upfront payment of
$428 million
and the estimated fair value of product development-based contingent consideration of
$44 million
. Based upon the acquisition valuation, the Company acquired
$192 million
of IPR&D and
$291 million
of goodwill. The acquired goodwill is not deductible for tax purposes.
RF Surgical Systems, Inc.
On August 11, 2015, the Company's Surgical Solutions division acquired RF Surgical Systems, Inc. (RF Surgical), a medical device company focused on the detection and prevention of retained surgical sponges. Total consideration for the transaction was approximately
$240 million
. Based upon the acquisition valuation, the Company acquired
$68 million
of technology-based intangible assets,
$47 million
of customer-related intangible assets, with estimated useful lives of
18
and
16
years, respectively, and
$135 million
of goodwill. The acquired goodwill is not deductible for tax purposes.
Medina Medical
On August 31, 2015, the Company's Neurovascular division acquired Medina Medical (Medina), a privately-held medical device company focused on commercializing treatments for vascular abnormalities of the brain, including cerebral aneurysms. Total consideration for the transaction was approximately
$219 million
, which includes an upfront payment of
$155 million
and the estimated fair value of revenue-based and product development-based contingent consideration of
$64 million
. Medtronic had previously invested in Medina and held an
11 percent
ownership position. Net of this ownership position, the transaction value was approximately
$195 million
. Based upon the acquisition valuation, the Company acquired
$122 million
of IPR&D and
$126 million
of goodwill. The acquired goodwill is not deductible for tax purposes.
The Company accounted for the acquisitions of Twelve, RF Surgical, and Medina and all other acquisitions as business combinations using the acquisition method of accounting.
80
Fiscal Year 2015
The fair values of the assets acquired and liabilities assumed from acquisitions during fiscal year 2015, other than the Covidien acquisition, are as follows:
|
(in millions)
|
NGC Medical S.p.A.
|
Sapiens Steering Brain Stimulation
|
All Other
|
Total
|
|||||||||||
|
Other current assets
|
$
|
55
|
|
$
|
3
|
|
$
|
12
|
|
$
|
70
|
|
|||
|
Property, plant, and equipment
|
15
|
|
1
|
|
2
|
|
18
|
|
|||||||
|
IPR&D
|
—
|
|
30
|
|
39
|
|
69
|
|
|||||||
|
Other intangible assets
|
159
|
|
—
|
|
157
|
|
316
|
|
|||||||
|
Goodwill
|
197
|
|
170
|
|
108
|
|
475
|
|
|||||||
|
Other assets
|
3
|
|
3
|
|
49
|
|
55
|
|
|||||||
|
Total assets acquired
|
429
|
|
207
|
|
367
|
|
1,003
|
|
|||||||
|
|
|||||||||||||||
|
Current liabilities
|
34
|
|
4
|
|
6
|
|
44
|
|
|||||||
|
Long-term deferred tax liabilities, net
|
51
|
|
—
|
|
66
|
|
117
|
|
|||||||
|
Other liabilities
|
4
|
|
—
|
|
—
|
|
4
|
|
|||||||
|
Total liabilities assumed
|
89
|
|
4
|
|
72
|
|
165
|
|
|||||||
|
Net assets acquired
|
$
|
340
|
|
$
|
203
|
|
$
|
295
|
|
$
|
838
|
|
|||
NGC Medical S.p.A
On August 26, 2014, the Company acquired NGC Medical S.p.A. (NGC), a privately-held Italian company that offers a broad suite of hospital managed services. Total consideration for this transaction was approximately
$340 million
. Medtronic had previously invested in NGC and held a
30 percent
ownership position in that company. Net of this ownership position, the transaction value was approximately
$238 million
. Based upon the acquisition valuation, the Company acquired
$159 million
of customer-related intangible assets and tradenames with an estimated useful life of
20 years
at the time of acquisition and
$197 million
of goodwill. The acquired goodwill is not deductible for tax purposes. During fiscal year 2015, the Company recorded adjustments to
goodwill
, other
intangible assets, net
, and
long-term deferred tax liabilities
.
Sapiens Steering Brain Stimulation
On August 25, 2014, the Company acquired Sapiens Steering Brain Stimulation (Sapiens), a privately-held developer of deep brain stimulation technologies. Total consideration for the transaction was approximately
$203 million
. Based upon the acquisition valuation, the Company acquired
$30 million
of IPR&D and
$170 million
of goodwill. The acquired goodwill is not deductible for tax purposes.
The Company accounted for the acquisitions of NGC and Sapiens as business combinations using the acquisition method of accounting.
81
Fiscal Year 2014
The fair values of the assets acquired and liabilities assumed during fiscal year 2014 are as follows:
|
(in millions)
|
TYRX, Inc.
|
All Other
|
Total
|
||||||||
|
Current assets
|
$
|
6
|
|
$
|
14
|
|
$
|
20
|
|
||
|
Property, plant, and equipment
|
1
|
|
7
|
|
8
|
|
|||||
|
Intangible assets
|
94
|
|
61
|
|
155
|
|
|||||
|
Goodwill
|
132
|
|
123
|
|
255
|
|
|||||
|
Total assets acquired
|
233
|
|
205
|
|
438
|
|
|||||
|
|
|||||||||||
|
Current liabilities
|
4
|
|
12
|
|
16
|
|
|||||
|
Long-term deferred tax liabilities, net
|
7
|
|
—
|
|
7
|
|
|||||
|
Total liabilities assumed
|
11
|
|
12
|
|
23
|
|
|||||
|
Net assets acquired
|
$
|
222
|
|
$
|
193
|
|
$
|
415
|
|
||
TYRX, Inc.
On December 30, 2013, the Company acquired TYRX, Inc. (TYRX), a privately-held developer of antibiotic drug and implanted medical device combinations. TYRX's products include those designed to reduce surgical site infections associated with implantable pacemakers, defibrillators, and spinal cord neurostimulators. Under the terms of the agreement, the transaction included an initial up-front payment of $
159 million
, representing a purchase price amount that was net of acquired cash, including the assumption and settlement of existing TYRX debt and direct acquisition costs. Total consideration for the transaction was approximately $
222 million
, which included estimated fair values for product development-based and revenue-based contingent consideration of $
25 million
and $
35 million
, respectively. The product development-based contingent consideration includes a future potential payment of $
40 million
upon achieving certain milestones, and the revenue-based contingent consideration payments equal TYRX's actual annual revenue growth for the company's fiscal years 2015 and 2016. Based upon the acquisition valuation, the Company acquired $
94 million
of technology-based intangible assets with an estimated useful life of
14 years
and $
132 million
of goodwill. The acquired goodwill is not deductible for tax purposes.
The Company accounted for the acquisition of TYRX as a business combination using the acquisition method of accounting.
Acquisition-Related Items
During fiscal year 2016, the Company recorded charges from acquisition-related items of
$283 million
, primarily related to costs incurred in connection with the Covidien acquisition. The charges incurred in connection with the Covidien acquisition include
$219 million
of professional services and integration costs and
$58 million
of accelerated or incremental stock compensation expense.
During fiscal year 2015, the Company recorded charges from acquisition-related items of
$550 million
, primarily related to costs incurred in connection with the Covidien acquisition. The charges incurred in connection with the Covidien acquisition include
$275 million
of professional services and integration costs,
$189 million
of accelerated or incremental stock compensation expense, and
$69 million
of incremental officer and director excise tax. These amounts are included within
acquisition-related items
in the consolidated statements of income.
During fiscal year 2014, the Company recorded net charges from acquisition-related items of $
117 million
, primarily including IPR&D and long-lived asset impairment charges of $
236 million
related to the Ardian, Inc. (Ardian) acquisition recorded in the third quarter of fiscal year 2014. The impairment charges were partially offset by income of $
138 million
related to the change in fair value of contingent consideration associated with acquisitions subsequent to April 29, 2009. These amounts are included within
acquisition-related items
in the consolidated statements of income.
Contingent Consideration
Certain of the Company’s business combinations and purchases of intellectual property involve the potential for the payment of future contingent consideration upon the achievement of certain product development milestones and/or various other favorable
82
operating conditions. Payment of the additional consideration is generally contingent on the acquired company reaching certain performance milestones, including attaining specified revenue levels or achieving product development targets. For business combinations subsequent to April 24, 2009, a liability is recorded for the estimated fair value of the contingent consideration on the acquisition date. The fair value of the contingent consideration is remeasured at each reporting period with the change in fair value recognized as income or expense within
acquisition-related items
in the consolidated statements of income. The Company measures the liability on a recurring basis using Level 3 inputs.
The fair value of contingent consideration is measured using projected payment dates, discount rates, probabilities of payment, and projected revenues (for revenue-based considerations). Projected contingent payment amounts are discounted back to the current period using a discounted cash flow model. Projected revenues are based on the Company’s most recent internal operational budgets and long-range strategic plans. Increases (decreases) in projected revenues, probabilities of payment, discount rates, or projected payment dates may result in higher (lower) fair value measurements. Fluctuations in any of the inputs may result in a significantly lower (higher) fair value measurement.
The recurring Level 3 fair value measurements of contingent consideration include the following significant unobservable inputs:
|
($ in millions)
|
Fair Value at April 29, 2016
|
Valuation
Technique
|
Unobservable Input
|
Range
|
|||||
|
Discount rate
|
11% - 27%
|
||||||||
|
Revenue-based payments
|
$
|
195
|
|
Discounted cash flow
|
Probability of payment
|
30% - 100%
|
|||
|
|
|
|
|
Projected fiscal year of payment
|
2017 - 2025
|
||||
|
Discount rate
|
0.3% - 5.5%
|
||||||||
|
Product development-based payments
|
$
|
182
|
|
Discounted cash flow
|
Probability of payment
|
75% - 100%
|
|||
|
|
|
|
|
Projected fiscal year of payment
|
2017 - 2025
|
||||
At
April 29, 2016
, the estimated maximum potential amount of undiscounted future contingent consideration that the Company is expected to make associated with all completed business combinations or purchases of intellectual property prior to April 24, 2009 was approximately
$175 million
. The Company estimates the milestones or other conditions associated with the contingent consideration will be reached in fiscal year 2017 and thereafter.
The fair value of contingent consideration associated with acquisitions subsequent to April 24, 2009, as of
April 29, 2016
and
April 24, 2015
, was
$377 million
and
$264 million
, respectively. As of
April 29, 2016
,
$311 million
was reflected in
other long-term liabilities
and
$66 million
was reflected in
other accrued expenses
in the consolidated balance sheets. As of
April 24, 2015
,
$242 million
was reflected in
other long-term liabilities
and
$22 million
was reflected in
other accrued expenses
in the consolidated balance sheets. The portion of the contingent consideration related to the acquisition date fair value is reported as financing activities in the consolidated statements of cash flows. Amounts paid in excess of the original acquisition date fair value are reported as operating activities in the consolidated statements of cash flows. The following table provides a reconciliation of the beginning and ending balances of contingent consideration:
|
|
Fiscal Year
|
||||||
|
(in millions)
|
2016
|
2015
|
|||||
|
Beginning Balance
|
$
|
264
|
|
$
|
68
|
|
|
|
Acquired contingent consideration
|
—
|
|
236
|
|
|||
|
Purchase price contingent consideration
|
149
|
|
40
|
|
|||
|
Contingent consideration payments
|
(22
|
)
|
(85
|
)
|
|||
|
Change in fair value of contingent consideration
|
(14
|
)
|
5
|
|
|||
|
Ending Balance
|
$
|
377
|
|
$
|
264
|
|
|
3. Restructuring Charges, Net
Cost Synergies Initiative
The cost synergies initiative, initially referred to as the fiscal year 2015 initiative, was the beginning of the Company's restructuring program primarily related to the acquisition of Covidien. This initiative is expected to contribute to the approximately
$850 million
in cost synergies expected to be achieved as a result of the Covidien acquisition through fiscal year 2018, including
83
administrative office optimization, manufacturing and supply chain infrastructure, certain program cancellations, and certain general and administrative savings. Restructuring charges are expected to be incurred in future fiscal years as cost synergy strategies are finalized. Restructuring accruals resulting from restructuring charges are scheduled to be substantially complete within
one year
from the period in which the restructuring charge was initially incurred.
A summary of the activity related to the cost synergies initiative is presented below:
|
(in millions)
|
Employee
Termination
Costs
|
Asset
Write-downs
|
Other
Costs
|
Total
|
|||||||||||
|
Balance as of April 25, 2014
|
$
|
—
|
|
$
|
—
|
|
$
|
—
|
|
$
|
—
|
|
|||
|
Restructuring charges
|
213
|
|
28
|
|
7
|
|
248
|
|
|||||||
|
Payments/write-downs
|
(77
|
)
|
(28
|
)
|
—
|
|
(105
|
)
|
|||||||
|
Balance as of April 24, 2015
|
$
|
136
|
|
$
|
—
|
|
$
|
7
|
|
$
|
143
|
|
|||
|
Restructuring charges
|
248
|
|
23
|
|
61
|
|
332
|
|
|||||||
|
Payments/write-downs
|
(153
|
)
|
(23
|
)
|
(31
|
)
|
(207
|
)
|
|||||||
|
Reversal of excess accrual
|
(18
|
)
|
$
|
—
|
|
$
|
—
|
|
(18
|
)
|
|||||
|
Balance as of April 29, 2016
|
$
|
213
|
|
$
|
—
|
|
$
|
37
|
|
$
|
250
|
|
|||
As a result of certain employees identified for termination finding other positions within the Company and revisions to severance provisions, the Company recorded an
$18 million
reversal of excess restructuring reserves during the fiscal year ended
April 29, 2016
.
As part of the cost synergies initiative for the fiscal year ended
April 29, 2016
, the Company recognized
$23 million
of asset write-downs, which included
$9 million
related to inventory write-offs of discontinued product lines recognized within
cost of products sold
in the consolidated statements of income. In addition, for the fiscal year ended
April 29, 2016
, asset write-downs included
$14 million
related to property, plant, and equipment impairments.
In the fiscal year ended
April 24, 2015
, the Company recognized
$28 million
of asset write-downs, which included
$15 million
related to inventory write-offs of discontinued product lines and production-related asset impairments recognized within
cost of products sold
in the consolidated statements of income. In addition, for the fiscal year ended
April 24, 2015
, asset write-downs included
$13 million
related to property, plant, and equipment impairments.
Covidien Initiative
Covidien's pre-acquisition restructuring program is designed to improve Covidien's cost structure. The program consists of reducing corporate expenses, expanding shared services, consolidating manufacturing locations, and optimizing distribution centers. The Covidien restructuring initiative is scheduled to be substantially complete by the end of fiscal year 2018. At the Acquisition Date, the Company reserved
$103 million
in connection with the Covidien initiative, which consisted of employee termination costs of
$76 million
and other costs of
$27 million
.
84
A summary of the activity related to the Covidien initiative is presented below:
|
|
Covidien Initiative
|
||||||||||
|
(in millions)
|
Employee
Termination
Costs
|
Other
Costs
|
Total
|
||||||||
|
Balance as of January 26, 2015 (Acquisition Date)
|
$
|
76
|
|
$
|
27
|
|
$
|
103
|
|
||
|
Restructuring charges
|
—
|
|
—
|
|
—
|
|
|||||
|
Payments/write-downs
|
(10
|
)
|
(10
|
)
|
(20
|
)
|
|||||
|
Reversal of excess accrual
|
(5
|
)
|
—
|
|
(5
|
)
|
|||||
|
Balance as of April 24, 2015
|
$
|
61
|
|
$
|
17
|
|
$
|
78
|
|
||
|
Restructuring charges
|
—
|
|
—
|
|
—
|
|
|||||
|
Payments/write-downs
|
(49
|
)
|
(12
|
)
|
(61
|
)
|
|||||
|
Reversal of excess accrual
|
(10
|
)
|
—
|
|
(10
|
)
|
|||||
|
Balance as of April 29, 2016
|
$
|
2
|
|
$
|
5
|
|
$
|
7
|
|
||
In the fiscal year ended April 29, 2016 and April 24, 2015, the Company recorded reversals of excess restructuring reserves related to the Covidien initiative of
$10 million
and
$5 million
, respectively. The reversals were primarily a result of certain employees identified for termination finding other positions within the Company and early lease termination negotiations in fiscal year 2015.
4. Special Charges (Gains), Net and Certain Litigation Charges, Net
Special Charges (Gains), Net
During fiscal year
2016
, the Company recognized a special charge of
$70 million
in connection with the impairment of a debt investment.
During fiscal year
2015
, the Company recognized a
$138 million
gain, which consisted of a
$41 million
gain on the sale of a product line in the Surgical Technologies division and a
$97 million
gain on the sale of an equity method investment.
During
2015
and
2014
, continuing with the Company's commitment to improving the health of people and communities throughout the world, the Company made charitable contributions of
$100 million
and
$40 million
, respectively, to the Medtronic Foundation, a related party non-profit organization.
Certain Litigation Charges, Net
The Company classifies material litigation charges and gains recognized as certain litigation charges, net. During fiscal years
2016
and
2015
, the Company recorded certain litigation charges, net of
$26 million
and
$42 million
, respectively, which primarily relate to additional accounting charges for probable and reasonably estimable INFUSE product liability litigation, which were recorded as a result of additional filed and unfiled claims, and other litigation matters. Refer to Note 15 for additional information.
During fiscal year 2014, the Company recorded certain litigation charges, net of
$770 million
, which primarily include the global patent settlement agreement with Edwards Lifesciences Corporation of
$589 million
, accounting charges for probable and reasonably estimable INFUSE product liability litigation of
$140 million
, and other litigation matters.
5. Financial Instruments
The Company holds investments consisting primarily of marketable debt and equity securities. The authoritative guidance is principally applied to financial assets and liabilities such as marketable equity securities and debt and equity securities that are classified and accounted for as trading and available-for-sale and are measured on a recurring basis. Further, we also hold cost or equity method investments which are measured at fair value on a nonrecurring basis.
85
The following table summarizes the Company's investments by significant investment categories and the related consolidated balance sheet classification at
April 29, 2016
:
|
Valuation
|
Balance Sheet Classification
|
||||||||||||||||||||||
|
(in millions)
|
Cost
|
Unrealized
Gains
|
Unrealized
Losses
|
Fair Value
|
Investments
|
Other Assets
|
|||||||||||||||||
|
Available-for-sale securities
|
|
|
|
|
|
|
|
|
|||||||||||||||
|
Level 1:
|
|||||||||||||||||||||||
|
U.S. government and agency securities
|
$
|
792
|
|
$
|
14
|
|
$
|
(1
|
)
|
$
|
805
|
|
$
|
805
|
|
$
|
—
|
|
|||||
|
Marketable equity securities
|
75
|
|
21
|
|
(11
|
)
|
85
|
|
|
85
|
|
||||||||||||
|
Total Level 1
|
867
|
|
35
|
|
(12
|
)
|
890
|
|
805
|
|
85
|
|
|||||||||||
|
Level 2:
|
|||||||||||||||||||||||
|
Corporate debt securities
|
3,935
|
|
85
|
|
(24
|
)
|
3,996
|
|
3,996
|
|
—
|
|
|||||||||||
|
U.S. government and agency securities
|
902
|
|
2
|
|
—
|
|
904
|
|
904
|
|
—
|
|
|||||||||||
|
Mortgage-backed securities
|
1,016
|
|
17
|
|
(18
|
)
|
1,015
|
|
1,015
|
|
—
|
|
|||||||||||
|
Other asset-backed securities
|
192
|
|
3
|
|
—
|
|
195
|
|
195
|
|
—
|
|
|||||||||||
|
Debt funds
|
3,040
|
|
5
|
|
(281
|
)
|
2,764
|
|
2,764
|
|
—
|
|
|||||||||||
|
Total Level 2
|
9,085
|
|
112
|
|
(323
|
)
|
8,874
|
|
8,874
|
|
—
|
|
|||||||||||
|
Level 3:
|
|||||||||||||||||||||||
|
Corporate debt securities
|
1
|
|
—
|
|
—
|
|
1
|
|
—
|
|
1
|
|
|||||||||||
|
Auction rate securities
|
47
|
|
—
|
|
(3
|
)
|
44
|
|
—
|
|
44
|
|
|||||||||||
|
Total Level 3
|
48
|
|
—
|
|
(3
|
)
|
45
|
|
—
|
|
45
|
|
|||||||||||
|
Total available-for-sale securities
|
10,000
|
|
147
|
|
(338
|
)
|
9,809
|
|
9,679
|
|
130
|
|
|||||||||||
|
Trading securities:
|
|
|
|
|
|
|
|
|
|||||||||||||||
|
Level 1:
|
|||||||||||||||||||||||
|
Exchange-traded funds
|
65
|
|
15
|
|
(1
|
)
|
79
|
|
79
|
|
—
|
|
|||||||||||
|
Total Level 1:
|
65
|
|
15
|
|
(1
|
)
|
79
|
|
79
|
|
—
|
|
|||||||||||
|
Total trading securities
|
65
|
|
15
|
|
(1
|
)
|
79
|
|
79
|
|
—
|
|
|||||||||||
|
Cost method, equity method, and other investments:
|
|||||||||||||||||||||||
|
Level 3:
|
|||||||||||||||||||||||
|
Cost method, equity method, and other investments
|
506
|
|
—
|
|
—
|
|
N/A
|
|
—
|
|
506
|
|
|||||||||||
|
Total Level 3:
|
506
|
|
—
|
|
—
|
|
N/A
|
|
—
|
|
506
|
|
|||||||||||
|
Total cost method, equity method, and other investments
|
506
|
|
—
|
|
—
|
|
N/A
|
|
—
|
|
506
|
|
|||||||||||
|
Total investments
|
$
|
10,571
|
|
$
|
162
|
|
$
|
(339
|
)
|
|
$
|
9,888
|
|
$
|
9,758
|
|
$
|
636
|
|
||||
86
The following table summarizes the Company's investments by significant investment categories and the related consolidated balance sheet classification at
April 24, 2015
:
|
Valuation
|
Balance Sheet Classification
|
||||||||||||||||||||||
|
(in millions)
|
Cost
|
Unrealized
Gains
|
Unrealized
Losses
|
Fair Value
|
Investments
|
Other Assets
|
|||||||||||||||||
|
Available-for-sale securities:
|
|
|
|
|
|
|
|
|
|||||||||||||||
|
Level 1:
|
|||||||||||||||||||||||
|
U.S. government and agency securities
|
$
|
1,525
|
|
$
|
17
|
|
$
|
(1
|
)
|
$
|
1,541
|
|
$
|
1,541
|
|
$
|
—
|
|
|||||
|
Marketable equity securities
|
64
|
|
35
|
|
(19
|
)
|
80
|
|
—
|
|
80
|
|
|||||||||||
|
Total Level 1
|
1,589
|
|
52
|
|
(20
|
)
|
1,621
|
|
1,541
|
|
80
|
|
|||||||||||
|
Level 2:
|
|||||||||||||||||||||||
|
Corporate debt securities
|
6,282
|
|
105
|
|
(10
|
)
|
6,377
|
|
6,377
|
|
—
|
|
|||||||||||
|
U.S. government and agency securities
|
1,597
|
|
4
|
|
(3
|
)
|
1,598
|
|
1,598
|
|
—
|
|
|||||||||||
|
Mortgage-backed securities
|
1,462
|
|
22
|
|
(6
|
)
|
1,478
|
|
1,478
|
|
—
|
|
|||||||||||
|
Non-U.S. government and agency securities
|
85
|
|
—
|
|
—
|
|
85
|
|
85
|
|
—
|
|
|||||||||||
|
Certificates of deposit
|
44
|
|
—
|
|
—
|
|
44
|
|
44
|
|
—
|
|
|||||||||||
|
Other asset-backed securities
|
504
|
|
3
|
|
—
|
|
507
|
|
507
|
|
—
|
|
|||||||||||
|
Debt funds
|
3,061
|
|
19
|
|
(150
|
)
|
2,930
|
|
2,930
|
|
—
|
|
|||||||||||
|
Total Level 2
|
13,035
|
|
153
|
|
(169
|
)
|
13,019
|
|
13,019
|
|
—
|
|
|||||||||||
|
Level 3:
|
|||||||||||||||||||||||
|
Corporate debt securities
|
1
|
|
—
|
|
—
|
|
1
|
|
—
|
|
1
|
|
|||||||||||
|
Auction rate securities
|
109
|
|
—
|
|
(4
|
)
|
105
|
|
—
|
|
105
|
|
|||||||||||
|
Total Level 3
|
110
|
|
—
|
|
(4
|
)
|
106
|
|
—
|
|
106
|
|
|||||||||||
|
Total available-for-sale securities
|
14,734
|
|
205
|
|
(193
|
)
|
14,746
|
|
14,560
|
|
186
|
|
|||||||||||
|
Trading securities:
|
|
|
|
|
|
|
|
|
|||||||||||||||
|
Level 1:
|
|||||||||||||||||||||||
|
Exchange-traded funds
|
58
|
|
19
|
|
—
|
|
77
|
|
77
|
|
—
|
|
|||||||||||
|
Total Level 1
|
58
|
|
19
|
|
—
|
|
77
|
|
77
|
|
—
|
|
|||||||||||
|
Total trading securities
|
58
|
|
19
|
|
—
|
|
77
|
|
77
|
|
—
|
|
|||||||||||
|
Cost method, equity method, and other investments:
|
|||||||||||||||||||||||
|
Level 3:
|
|||||||||||||||||||||||
|
Cost method, equity method, and other investments
|
520
|
|
—
|
|
—
|
|
N/A
|
|
—
|
|
520
|
|
|||||||||||
|
Total Level 3
|
520
|
|
—
|
|
—
|
|
N/A
|
|
—
|
|
520
|
|
|||||||||||
|
Total cost method, equity method, and other investments
|
520
|
|
—
|
|
—
|
|
N/A
|
|
—
|
|
520
|
|
|||||||||||
|
Total investments
|
$
|
15,312
|
|
$
|
224
|
|
$
|
(193
|
)
|
$
|
14,823
|
|
$
|
14,637
|
|
$
|
706
|
|
|||||
87
Marketable Debt and Equity Securities:
The following tables show the gross unrealized losses and fair values of the Company’s available-for-sale securities that have been in a continuous unrealized loss position deemed to be temporary, aggregated by investment category as of
April 29, 2016
and
April 24, 2015
:
|
|
April 29, 2016
|
||||||||||||||
|
|
Less than 12 months
|
More than 12 months
|
|||||||||||||
|
(in millions)
|
Fair Value
|
Unrealized
Losses |
Fair Value
|
Unrealized
Losses |
|||||||||||
|
Corporate debt securities
|
$
|
756
|
|
$
|
(18
|
)
|
$
|
136
|
|
$
|
(6
|
)
|
|||
|
Auction rate securities
|
—
|
|
—
|
|
44
|
|
(3
|
)
|
|||||||
|
Mortgage-backed securities
|
196
|
|
(5
|
)
|
92
|
|
(5
|
)
|
|||||||
|
U.S. government and agency securities
|
308
|
|
(4
|
)
|
67
|
|
(5
|
)
|
|||||||
|
Debt funds
|
670
|
|
(26
|
)
|
1,601
|
|
(256
|
)
|
|||||||
|
Marketable equity securities
|
45
|
|
(11
|
)
|
—
|
|
—
|
|
|||||||
|
Total
|
$
|
1,975
|
|
$
|
(64
|
)
|
$
|
1,940
|
|
$
|
(275
|
)
|
|||
|
|
April 24, 2015
|
||||||||||||||
|
|
Less than 12 months
|
More than 12 months
|
|||||||||||||
|
(in millions)
|
Fair Value
|
Unrealized
Losses
|
Fair Value
|
Unrealized
Losses
|
|||||||||||
|
Corporate debt securities
|
$
|
944
|
|
$
|
(9
|
)
|
$
|
34
|
|
$
|
(1
|
)
|
|||
|
Auction rate securities
|
—
|
|
—
|
|
105
|
|
(4
|
)
|
|||||||
|
Mortgage-backed securities
|
346
|
|
(3
|
)
|
206
|
|
(3
|
)
|
|||||||
|
U.S. government and agency securities
|
356
|
|
(1
|
)
|
267
|
|
(3
|
)
|
|||||||
|
Debt funds
|
1,291
|
|
(109
|
)
|
559
|
|
(41
|
)
|
|||||||
|
Marketable equity securities
|
4
|
|
(19
|
)
|
—
|
|
—
|
|
|||||||
|
Total
|
$
|
2,941
|
|
$
|
(141
|
)
|
$
|
1,171
|
|
$
|
(52
|
)
|
|||
The following table represents the range of the unobservable inputs utilized in the fair value measurement of the auction rate securities classified as Level 3 as of
April 29, 2016
:
|
|
Valuation Technique
|
Unobservable Input
|
Range (Weighted Average)
|
|
Auction rate securities
|
Discounted cash flow
|
Years to principal recovery
|
2 yrs. - 12 yrs. (3 yrs.)
|
|
Illiquidity premium
|
6%
|
||
The Company reviews the fair value hierarchy classification on a quarterly basis. Changes in the ability to observe valuation inputs may result in a reclassification of levels for certain securities within the fair value hierarchy. The Company’s policy is to recognize transfers into and out of levels within the fair value hierarchy at the end of the fiscal quarter in which the actual event or change in circumstances that caused the transfer occurs. There were no transfers between Level 1, Level 2, or Level 3 during the twelve months ended
April 29, 2016
. When a determination is made to classify an asset or liability within Level 3, the determination is based upon the significance of the unobservable inputs to the overall fair value measurement.
88
The following tables provide a reconciliation of the beginning and ending balances of items measured at fair value on a recurring basis that used significant unobservable inputs (Level 3):
|
(in millions)
|
Total Level 3
Investments |
Corporate debt
securities |
Auction rate
securities |
||||||||
|
Balance as of April 24, 2015
|
$
|
106
|
|
$
|
1
|
|
$
|
105
|
|
||
|
Total unrealized gains/(losses) included in other comprehensive income
|
(3
|
)
|
—
|
|
(3
|
)
|
|||||
|
Settlements
|
(58
|
)
|
—
|
|
(58
|
)
|
|||||
|
Balance as of April 29, 2016
|
$
|
45
|
|
$
|
1
|
|
$
|
44
|
|
||
|
(in millions)
|
Total Level 3
Investments |
Corporate debt
securities |
Auction rate
securities |
||||||||
|
Balance as of April 25, 2014
|
$
|
106
|
|
$
|
9
|
|
$
|
97
|
|
||
|
Total realized losses and other-than-temporary impairment losses included in earnings
|
(5
|
)
|
(5
|
)
|
—
|
|
|||||
|
Total unrealized gains/(losses) included in other comprehensive income
|
10
|
|
2
|
|
8
|
|
|||||
|
Settlements
|
(5
|
)
|
(5
|
)
|
—
|
|
|||||
|
Balance as of April 24, 2015
|
$
|
106
|
|
$
|
1
|
|
$
|
105
|
|
||
Activity related to the Company’s investment portfolio is as follows:
|
|
Fiscal Year
|
||||||||||||||||||||||
|
|
2016
|
2015
|
2014
|
||||||||||||||||||||
|
(in millions)
|
Debt
(1)
|
Equity
(2)
|
Debt
(1)
|
Equity
(2)(3)
|
Debt
(1)
|
Equity
(2)(3)
|
|||||||||||||||||
|
Proceeds from sales
|
$
|
9,881
|
|
$
|
42
|
|
$
|
5,640
|
|
$
|
250
|
|
$
|
7,991
|
|
$
|
120
|
|
|||||
|
Gross realized gains
|
36
|
|
38
|
|
33
|
|
164
|
|
15
|
|
69
|
|
|||||||||||
|
Gross realized losses
|
(53
|
)
|
—
|
|
(19
|
)
|
—
|
|
(12
|
)
|
—
|
|
|||||||||||
|
Impairment losses recognized
|
—
|
|
(114
|
)
|
—
|
|
(29
|
)
|
(1
|
)
|
(9
|
)
|
|||||||||||
|
(1)
|
Includes available-for-sale debt securities.
|
|
(2)
|
Includes marketable equity securities, cost method, equity method, exchange-traded funds, and other investments.
|
|
(3)
|
As a result of certain acquisitions that occurred during the fiscal year ended
April 29, 2016
, the Company recognized a non-cash realized gain of
$9 million
on its previously-held minority investment included in
other expense, net
on the consolidated statement of income.
|
|
(4)
|
As a result of certain acquisitions that occurred during the fiscal year ended
April 24, 2015
, the Company recognized a non-cash realized gain of $
41 million
on its previously-held minority investments included in
other expense, net
on the consolidated statement of income. Also, a realized gain on an equity method investment totaling $
97 million
is included in
special (gains) charge
s
, net
on the consolidated statement of income.
|
Credit losses represent the difference between the present value of cash flows expected to be collected on certain mortgage-backed securities and auction rate securities and the amortized cost of these securities. Based on the Company’s assessment of the credit quality of the underlying collateral and credit support available to each of the remaining securities in which invested, the Company believes it has recorded all necessary other-than-temporary impairments as the Company does not have the intent to sell, nor is it more likely than not that the Company will be required to sell, before recovery of the amortized cost.
As of
April 29, 2016
and
April 24, 2015
, the credit loss portion of other-than temporary impairments on debt securities were not significant. The total reductions for available-for-sale debt securities sold during the fiscal years ended
April 29, 2016
and
April 24, 2015
were not significant.
89
The
April 29, 2016
balance of available-for-sale debt securities, excluding debt funds which have no single maturity date, by contractual maturity is shown in the following table. Within the table, maturities of mortgage-backed securities have been allocated based upon timing of estimated cash flows assuming no change in the current interest rate environment. Actual maturities may differ from contractual maturities because the issuers of the securities may have the right to prepay obligations without prepayment penalties.
|
(in millions)
|
April 29, 2016
|
||
|
Due in one year or less
|
$
|
899
|
|
|
Due after one year through five years
|
3,181
|
|
|
|
Due after five years through ten years
|
2,792
|
|
|
|
Due after ten years
|
88
|
|
|
|
Total debt securities
|
$
|
6,960
|
|
The Company holds investments in marketable equity securities, which are classified as
other assets
in the consolidated balance sheets. The aggregate carrying amount of these investments was $
85 million
and
$80 million
as of
April 29, 2016
and
April 24, 2015
, respectively. During the fiscal years ended
April 29, 2016
and
April 24, 2015
, the Company determined that the fair value of certain marketable equity securities were below their carrying values and that the carrying values of these investments were not expected to be recoverable within a reasonable period of time. As a result, the Company recognized
$20 million
and
$7 million
in impairment charges for fiscal years
2016
and
2015
respectively, which were recognized within
other expense, net
in the consolidated statements of income. There were
no
marketable equity securities impairment charges recognized for the fiscal year ended
April 25, 2014
.
Cost method, equity method, and other investments
The Company holds investments in equity and other securities that are accounted for using the cost or equity method, which are classified as
other assets
in the consolidated balance sheets. As of
April 29, 2016
and
April 24, 2015
, the aggregate carrying amount of equity and other securities without a quoted market price and accounted for using the cost or equity method was $
506 million
and
$520 million
, respectively. These cost or equity method investments are measured at fair value on a nonrecurring basis. The total carrying value of these investments is reviewed quarterly for changes in circumstance or the occurrence of events that suggest the Company’s investment may not be recoverable. The value of cost or equity method investments is not adjusted if there are no identified events or changes in circumstances that may have a material adverse effect on the fair value of the investment.
During the fiscal year ended
April 29, 2016
, the Company determined that the fair values of certain cost method investments were below their carrying values and that the carrying values of these investments were not expected to be recoverable within a reasonable period of time. As a result, the Company recognized $
23 million
in impairment charges during the fiscal year ended
April 29, 2016
, which was recorded in
other expense, net
and $
70 million
in impairment charges which was recorded in
special charges (gains), net
in the consolidated statements of income. During the fiscal year ended
April 24, 2015
, and
April 25, 2014
the Company determined that the fair values of certain cost method investments were below their carrying values and that the carrying values of these investments were not expected to be recoverable within a reasonable period of time. As a result, the Company recognized
$7 million
and
$10 million
in impairment charges during fiscal years
2015
and
2014
respectively, which were recorded in
other expense, net
in the consolidated statements of income. These investments fall within Level 3 of the fair value hierarchy, due to the use of significant unobservable inputs to determine fair value, as the investments are privately-held entities without quoted market prices. To determine the fair value of these investments, the Company used all pertinent financial information available related to the entities, including financial statements and market participant valuations from recent and proposed equity offerings.
90
6. Goodwill and Other Intangible Assets, Net
Goodwill
The changes in the carrying amount of goodwill for fiscal years
2016
and
2015
are as follows:
|
(in millions)
|
Cardiac and
Vascular Group
|
Minimally Invasive Therapies Group
|
Restorative
Therapies Group
|
Diabetes Group
|
Total
|
||||||||||||||
|
Balance as of April 25, 2014
|
$
|
2,881
|
|
$
|
—
|
|
$
|
6,368
|
|
$
|
1,344
|
|
$
|
10,593
|
|
||||
|
Goodwill as a result of Covidien acquisition
|
2,795
|
|
23,399
|
|
2,892
|
|
500
|
|
29,586
|
|
|||||||||
|
Goodwill as a result of other acquisitions
|
245
|
|
—
|
|
218
|
|
9
|
|
472
|
|
|||||||||
|
Other adjustments, net
|
—
|
|
—
|
|
(9
|
)
|
—
|
|
(9
|
)
|
|||||||||
|
Currency adjustment, net
|
(66
|
)
|
—
|
|
(45
|
)
|
(1
|
)
|
(112
|
)
|
|||||||||
|
Balance as of April 24, 2015
|
$
|
5,855
|
|
$
|
23,399
|
|
$
|
9,424
|
|
$
|
1,852
|
|
$
|
40,530
|
|
||||
|
Goodwill as a result of acquisitions
|
393
|
|
264
|
|
199
|
|
—
|
|
856
|
|
|||||||||
|
Measurement period adjustments related to Covidien
|
21
|
|
346
|
|
26
|
|
—
|
|
393
|
|
|||||||||
|
Other adjustments, net
|
—
|
|
(34
|
)
|
3
|
|
—
|
|
(31
|
)
|
|||||||||
|
Currency adjustment, net
|
(26
|
)
|
(191
|
)
|
(32
|
)
|
1
|
|
(248
|
)
|
|||||||||
|
Balance as of April 29, 2016
|
$
|
6,243
|
|
$
|
23,784
|
|
$
|
9,620
|
|
$
|
1,853
|
|
$
|
41,500
|
|
||||
The Company assesses goodwill for impairment annually in the third quarter and whenever an event occurs or circumstances change that would indicate that the carrying amount may be impaired. Impairment testing for goodwill is performed at the reporting unit level. The Company included the Minimally Invasive Therapies Group as an additional reporting unit in its annual impairment testing performed in the third quarter of fiscal year 2016. No other changes were made to reporting units during fiscal year 2016. The test for impairment of goodwill requires the Company to make several estimates about fair value, most of which are based on projected future cash flows. The Company calculated the excess of each reporting unit's fair value over its carrying amount, including goodwill, utilizing a discounted cash flow analysis. As a result of the analysis performed, the fair value of each reporting unit's goodwill was deemed to be greater than the carrying value. The Company did not record any goodwill impairments during fiscal years
2016
,
2015
, or
2014
.
Intangible Assets Carrying Value
The gross carrying amount and accumulated amortization of intangible assets at the end of fiscal years
2016
and
2015
are as follows:
|
Fiscal Year 2016
|
Fiscal Year 2015
|
||||||||||||||
|
(in millions)
|
Gross Carrying Amount
|
Accumulated Amortization
|
Gross Carrying Amount
|
Accumulated Amortization
|
|||||||||||
|
Definite-lived
|
|||||||||||||||
|
Customer-related
|
$
|
18,596
|
|
$
|
(1,331
|
)
|
$
|
18,492
|
|
$
|
(273
|
)
|
|||
|
Purchased technology and patents
|
11,397
|
|
(2,976
|
)
|
11,118
|
|
(2,268
|
)
|
|||||||
|
Trademarks and tradenames
|
854
|
|
(403
|
)
|
640
|
|
(363
|
)
|
|||||||
|
Other
|
72
|
|
(31
|
)
|
79
|
|
(44
|
)
|
|||||||
|
Total
|
$
|
30,919
|
|
$
|
(4,741
|
)
|
$
|
30,329
|
|
$
|
(2,948
|
)
|
|||
|
Indefinite-lived
|
|||||||||||||||
|
IPR&D
|
$
|
721
|
|
$
|
470
|
|
|||||||||
|
Tradenames
|
—
|
|
250
|
|
|||||||||||
|
Total
|
$
|
721
|
|
$
|
720
|
|
|||||||||
The Company assesses indefinite-lived assets for impairment annually in the third quarter and whenever an event occurs or circumstances change that would indicate that the carrying amount may be impaired. Similar to the goodwill impairment test, the
91
indefinite-lived assets impairment test requires the Company to make several estimates about fair value, most of which are based on projected future cash flows. The Company calculates the excess of indefinite-lived asset fair values over their carrying values utilizing a discounted future cash flow analysis. The Company did not record any significant indefinite-lived asset impairments during fiscal year 2016. As a result of the analysis performed during fiscal year 2015, the fair value of certain IPR&D indefinite-lived assets were deemed to be less than their carrying value, resulting in an impairment loss of
$5 million
, which was recorded in
acquisition-related items
in the consolidated statements of income. During fiscal year 2014, the fair value of IPR&D indefinite-lived assets were deemed to be less than the carrying value, resulting in a pre-tax impairment loss of
$207 million
primarily related to the Ardian acquisition and was recorded in
acquisition-related items
in the consolidated statements of income. See discussion below for additional information on impairments recorded on the Ardian long-lived asset group. Due to the nature of IPR&D projects, the Company may experience future delays or failures to obtain regulatory approvals to conduct clinical trials, failures of such clinical trials, delays or failures to obtain required market clearances or other failures to achieve a commercially viable product, and as a result, may record impairment losses in the future.
The Company assesses definite-lived intangible assets for impairment whenever events or changes in circumstances indicate that the carrying amount of an intangible asset (asset group) may not be recoverable. When events or changes in circumstances indicate that the carrying amount of an intangible asset may not be recoverable, the Company calculates the excess of an intangible asset's carrying value over its undiscounted future cash flows. If the carrying value is not recoverable, an impairment loss is recorded based on the amount by which the carrying value exceeds the fair value. The inputs used in the fair value analysis fall within Level 3 of the fair value hierarchy due to the use of significant unobservable inputs to determine fair value. The Company did not record any intangible asset impairments during fiscal year
2016
and
2015
. During fiscal year
2014
, the Company determined that a change in events and circumstances indicated that the carrying amount of certain definite-lived intangible assets, representing less than
five percent
of the total aggregate carrying amount of intangible assets, may not be fully recoverable. During fiscal year 2014, the carrying amount of Ardian definite-lived intangible assets was less than the undiscounted future cash flows, therefore, the Company assessed the fair value of the assets and recorded an impairment of
$41 million
that was included in
acquisition-related items
in the consolidated statements of income.
Intangible Asset Amortization
Amortization expense for fiscal years
2016
,
2015
, and
2014
was
$1.9 billion
,
$733 million
, and
$349 million
, respectively.
Estimated aggregate amortization expense by fiscal year based on the current carrying value of definite-lived intangible assets, excluding any possible future amortization associated with acquired IPR&D, which has not met technological feasibility, is as follows:
|
(in millions)
Fiscal Year
|
Amortization
Expense
|
||
|
2017
|
$
|
1,931
|
|
|
2018
|
1,899
|
|
|
|
2019
|
1,805
|
|
|
|
2020
|
1,757
|
|
|
|
2021
|
1,739
|
|
|
92
7. Financing Arrangements
Short-term debt consisted of the following:
|
(in millions)
|
April 29, 2016
|
April 24, 2015
|
||||||
|
Capital lease obligations
|
$
|
106
|
|
$
|
16
|
|
||
|
Bank borrowings
|
387
|
|
303
|
|
||||
|
Floating rate three-year 2014 senior notes
|
250
|
|
—
|
|
||||
|
0.875 percent three-year 2014 senior notes
|
250
|
|
—
|
|
||||
|
2.625 percent five-year 2011 senior notes
|
—
|
|
500
|
|
||||
|
4.750 percent ten-year 2005 senior notes
|
—
|
|
600
|
|
||||
|
1.350 percent 2012 CIFSA senior notes
|
—
|
|
600
|
|
||||
|
2.800 percent 2010 CIFSA senior notes
|
—
|
|
400
|
|
||||
|
Interest rate swaps
|
—
|
|
10
|
|
||||
|
Debt premium
|
—
|
|
5
|
|
||||
|
Total Short-Term Borrowings
|
$
|
993
|
|
$
|
2,434
|
|
||
Commercial Paper
On January 26, 2015, Medtronic Global Holdings S.C.A., an entity organized under the laws of Luxembourg (Medtronic Luxco), entered into various agreements pursuant to which Medtronic Luxco may issue unsecured commercial paper notes (the 2015 Commercial Paper Program) on a private placement basis up to a maximum aggregate amount outstanding at any time of
$3.5 billion
. The Company and Medtronic, Inc. have guaranteed the obligations of Medtronic Luxco under the 2015 Commercial Paper Program.
No
amounts were outstanding as of
April 29, 2016
and April 24,2015.
During fiscal years
2016
and
2015
, the weighted average original maturity of the commercial paper outstanding was approximately
49
and
52
days, respectively, and the weighted average interest rate was
0.57 percent
and
0.13 percent
, respectively. The issuance of commercial paper reduces the amount of credit available under the Company's existing line of credit.
Bank Borrowings
Outstanding bank borrowings as of
April 29, 2016
were short-term advances to certain non-U.S. subsidiaries under credit agreements with various banks. Bank borrowings consist primarily of borrowings at interest rates considered favorable by management ranging from
0.18%
to
0.19%
and the borrowing is a natural hedge of currency and exchange rate risk.
Line of Credit
The Company has a
$3.5 billion
Five
Year Revolving Credit Facility (
$3.5 billion
Five
Year Revolving Credit Facility), by and among Medtronic, Medtronic, Inc., Medtronic Luxco, the lenders from time to time party thereto and Bank of America, N.A., as administrative agent and issuing bank, which expires in January 2020. The
$3.5 billion
Five
Year Revolving Credit Facility provides the Company with the ability to increase its borrowing capacity by an additional
$500 million
at any time during the term of the agreement. At each anniversary date of the
$3.5 billion
Five
Year Revolving Credit Facility, but not more than twice prior to the maturity date, the Company could also request a
one
-year extension of the maturity date. The Company, Medtronic Luxco, and Medtronic, Inc. guarantee the obligations under the Amended and Restated Revolving Credit Agreement. As of
April 29, 2016
and April 24, 2015,
no
amounts were outstanding on the committed line of credit.
Interest rates are determined by a pricing matrix, based on the Company’s long-term debt ratings, assigned by Standard & Poor’s Ratings Services and Moody’s Investors Service. Facility fees are payable on the Credit Facility and are determined in the same manner as the interest rates. The agreement also contains customary covenants, all of which the Company remains in compliance with as of
April 29, 2016
.
93
Long-term debt consisted of the following:
|
|
|
April 29, 2016
|
April 24, 2015
|
||||||||||||
|
(in millions, except interest rates)
|
Maturity by
Fiscal Year
|
Payable
|
Effective
Interest
Rate
|
Payable
|
Effective
Interest
Rate
|
||||||||||
|
Floating rate three-year 2014 senior notes
|
2017
|
$
|
—
|
|
—
|
%
|
$
|
250
|
|
0.32
|
%
|
||||
|
0.875 percent three-year 2014 senior notes
|
2017
|
—
|
|
—
|
|
250
|
|
0.91
|
|
||||||
|
6.000 percent ten-year 2008 CIFSA senior notes
|
2018
|
1,150
|
|
1.41
|
|
1,150
|
|
1.41
|
|
||||||
|
1.375 percent five-year 2013 senior notes
|
2018
|
1,000
|
|
1.41
|
|
1,000
|
|
1.41
|
|
||||||
|
1.500 percent three-year 2015 senior notes
|
2018
|
1,000
|
|
1.59
|
|
1,000
|
|
1.59
|
|
||||||
|
5.600 percent ten-year 2009 senior notes
|
2019
|
400
|
|
5.61
|
|
400
|
|
5.61
|
|
||||||
|
4.450 percent ten-year 2010 senior notes
|
2020
|
766
|
|
4.47
|
|
1,250
|
|
4.47
|
|
||||||
|
2.500 percent five-year 2015 senior notes
|
2020
|
2,500
|
|
2.52
|
|
2,500
|
|
2.52
|
|
||||||
|
Floating rate five-year 2015 senior notes
|
2020
|
500
|
|
1.04
|
|
500
|
|
1.04
|
|
||||||
|
4.200 percent ten-year 2010 CIFSA senior notes
|
2021
|
600
|
|
2.22
|
|
600
|
|
2.22
|
|
||||||
|
4.125 percent ten-year 2011 senior notes
|
2021
|
500
|
|
4.19
|
|
500
|
|
4.19
|
|
||||||
|
3.125 percent ten-year 2012 senior notes
|
2022
|
675
|
|
3.16
|
|
675
|
|
3.16
|
|
||||||
|
3.200 percent ten-year 2012 CIFSA senior notes
|
2023
|
650
|
|
2.66
|
|
650
|
|
2.66
|
|
||||||
|
3.150 percent seven-year 2015 senior notes
|
2022
|
2,500
|
|
3.18
|
|
2,500
|
|
3.18
|
|
||||||
|
2.750 percent ten-year 2013 senior notes
|
2023
|
530
|
|
2.78
|
|
1,250
|
|
2.78
|
|
||||||
|
2.950 percent ten-year 2013 CIFSA senior notes
|
2024
|
310
|
|
2.67
|
|
750
|
|
2.67
|
|
||||||
|
3.625 percent ten-year 2014 senior notes
|
2024
|
850
|
|
3.65
|
|
850
|
|
3.65
|
|
||||||
|
3.500 percent ten-year 2015 senior notes
|
2025
|
4,000
|
|
3.61
|
|
4,000
|
|
3.61
|
|
||||||
|
4.375 percent twenty-year 2015 senior notes
|
2035
|
2,382
|
|
4.44
|
|
2,500
|
|
4.44
|
|
||||||
|
6.550 percent thirty-year 2007 CIFSA senior notes
|
2038
|
374
|
|
3.75
|
|
850
|
|
3.75
|
|
||||||
|
6.500 percent thirty-year 2009 senior notes
|
2039
|
300
|
|
6.52
|
|
300
|
|
6.52
|
|
||||||
|
5.550 percent thirty-year 2010 senior notes
|
2040
|
500
|
|
5.56
|
|
500
|
|
5.56
|
|
||||||
|
4.500 percent thirty-year 2012 senior notes
|
2042
|
400
|
|
4.51
|
|
400
|
|
4.51
|
|
||||||
|
4.000 percent thirty-year 2013 senior notes
|
2043
|
325
|
|
4.12
|
|
750
|
|
4.12
|
|
||||||
|
4.625 percent thirty-year 2014 senior notes
|
2044
|
650
|
|
4.67
|
|
650
|
|
4.67
|
|
||||||
|
4.625 percent thirty-year 2015 senior notes
|
2045
|
4,000
|
|
4.64
|
|
4,000
|
|
4.64
|
|
||||||
|
Three-year term loan
|
2018
|
3,000
|
|
1.12
|
|
3,000
|
|
1.12
|
|
||||||
|
Interest rate swaps
|
2021-2022
|
89
|
|
—
|
|
79
|
|
—
|
|
||||||
|
Deferred gains from interest rate swap terminations, net
|
—
|
—
|
|
—
|
|
3
|
|
—
|
|
||||||
|
Capital lease obligations
|
2018-2026
|
26
|
|
4.66
|
|
129
|
|
3.52
|
|
||||||
|
Bank borrowings
|
2018-2021
|
56
|
|
6.46
|
|
17
|
|
—
|
|
||||||
|
Debt premium (discount)
|
2018-2045
|
214
|
|
—
|
|
499
|
|
—
|
|
||||||
|
Total Long-Term Debt
|
|
$
|
30,247
|
|
|
|
$
|
33,752
|
|
|
|
||||
Senior Notes
The Company has outstanding unsecured senior obligations including those indicated as senior notes in the long-term debt table above (collectively, the Senior Notes). The Senior Notes rank equally with all other unsecured and unsubordinated indebtedness of the Company. The indentures under which the Senior Notes were issued contain customary covenants, all of which the Company remains in compliance with as of
April 29, 2016
. The Company used the net proceeds from the sale of the Senior Notes primarily for working capital and general corporate uses, which includes the repayment of other indebtedness of the Company, and to fund the acquisition of Covidien in fiscal year 2015.
94
In April 2016, the Company completed a cash tender offer and redemption of
$2.7 billion
of senior notes for
$3.0 billion
of total consideration. We recognized a loss on debt extinguishment of
$163 million
, which included cash premiums and accelerated amortization of deferred financing costs and debt discounts and premiums. The loss on debt extinguishment was recorded in the
interest expense
in the consolidated statement of income. In addition to the loss on debt extinguishment, we recognized
$20 million
of interest expense due to the acceleration of net losses on forward starting interest rate derivatives, which had been terminated at the time of original debt issuances, relating to the portion of debt extinguished in the tender offer.
On January 26, 2015, Medtronic and Medtronic Luxco each provided a full and unconditional guarantee of the Senior Note obligations of Medtronic, Inc. and of Covidien International Finance S.A., a Luxembourg company (“CIFSA”).
On December 10, 2014, the Company issued seven tranches of Senior Notes (collectively the 2015 Senior Notes) with an aggregate face value of
$17.0 billion
, resulting in cash proceeds of approximately
$16.8 billion
, net of discounts and issuance costs. The first tranche consisted of
$1.0 billion
of
1.500 percent
Senior Notes due 2018. The second tranche consisted of
$2.5 billion
of
2.500 percent
Senior Notes due 2020. The third tranche consisted of
$500 million
of floating rate Senior Notes due 2020 (the 2020 floating rate notes). The 2020 floating rate notes bear interest at the three-month London InterBank Offered Rate (LIBOR) plus
80 basis points
. The fourth tranche consisted of
$2.5 billion
of
3.150 percent
Senior Notes due 2022. The fifth tranche consisted of
$4.0 billion
of
3.500 percent
Senior Notes due 2025. The sixth tranche consisted of
$2.5 billion
of
4.375 percent
Senior Notes due 2035. The seventh tranche consisted of
$4.0 billion
of
4.625 percent
Senior Notes due 2045. Interest on the 2020 floating rate notes is payable quarterly and interest on each series of the fixed rate notes is payable semi-annually. The Company used the combined proceeds from the 2015 Senior Notes and the
$3.0 billion
borrowed for a term of
three years
under the Term Loan Credit Agreement (as defined below) to fund the approximately
$16 billion
cash consideration portion of the January 26, 2015 estimated
$50 billion
acquisition of Covidien, to pay certain transaction and financing expenses, and for working capital and general corporate purposes, which may include repayment of indebtedness.
As of January 26, 2015, Covidien had
$5.0 billion
aggregate principal amount issued and outstanding consisting of
$750 million
aggregate principal amount of
2.950
percent senior notes due 2023,
$600 million
aggregate principal amount of
1.350
percent senior notes due 2015,
$650 million
aggregate principal amount of
3.200
percent senior notes due 2022,
$400 million
aggregate principal amount of
2.800
percent senior notes due 2015,
$600 million
aggregate principal amount of
4.200
percent senior notes due 2020,
$1.2 billion
aggregate principal amount of
6.000
percent senior notes due 2018 and
$850 million
aggregate principal amount of
6.550
percent senior notes due 2037 (collectively, the “CIFSA Senior Notes”). The Company recorded a fair value adjustment as required upon acquisition and subsequently recorded a premium totaling
$607
million related to CIFSA Senior Notes.
As of
April 29, 2016
and
April 24, 2015
, the Company had interest rate swap agreements designated as fair value hedges of certain underlying fixed-rate obligations including the Company’s
$500 million
4.125 percent
2011 Senior Notes, and
$675 million
3.125 percent
2012 Senior Notes. As of
April 24, 2015
, the Company also had an interest rate swap agreement designated as a fair value hedge underlying the fixed rate obligation related to the Company's
$600 million
4.750 percent
2005 Senior Notes and the
$500 million
2.625 percent
2011 Senior Notes, which were due during fiscal year 2016. For additional information regarding the interest rate swap agreements, refer to Note 8.
Term Loan
On January 26, 2015, Medtronic, Inc. borrowed
$3.0 billion
for a term of
three years
under that certain Senior Unsecured Term Loan Credit Agreement (the “Term Loan Credit Agreement”), among Medtronic, Inc., Medtronic, Medtronic Luxco, the lenders from time to time party thereto and Bank of America, N.A., as administrative agent, to finance, in part, the cash component of the Arrangement Consideration and certain transaction expenses. Medtronic and Medtronic Luxco have guaranteed the obligations of Medtronic, Inc. under the Term Loan Credit Agreement.
95
Contractual maturities of debt for the next five fiscal years and thereafter, excluding the debt premium and discount, and the fair value of outstanding interest rate swap agreements are as follows:
|
(in millions)
Fiscal Year
|
|||
|
2017
|
$
|
993
|
|
|
2018
|
6,176
|
|
|
|
2019
|
411
|
|
|
|
2020
|
3,777
|
|
|
|
2021
|
1,104
|
|
|
|
Thereafter
|
18,476
|
|
|
|
Total debt
|
30,937
|
|
|
|
Less: Current portion of debt
|
993
|
|
|
|
Long-term portion of debt
|
$
|
29,944
|
|
Financial Instruments Not Measured at Fair Value
The estimated fair value of the Company’s long-term debt, including the short-term portion, as of
April 29, 2016
was
$29.8 billion
compared to a principal value of
$27.4 billion
. As of
April 24, 2015
the estimated fair value was
$34.6 billion
compared to a principal value of
$32.1 billion
. Fair value was estimated using quoted market prices for the publicly registered senior notes, classified as Level 2 within the fair value hierarchy. The fair values and principal values consider the terms of the related debt and exclude the impacts of debt discounts and derivative/hedging activity.
8. Derivatives and Currency Exchange Risk Management
The Company uses operational and economic hedges, as well as currency exchange rate derivative contracts and interest rate derivative instruments, to manage the impact of currency exchange and interest rate changes on earnings and cash flows. In addition, the Company uses cross currency interest rate swaps to manage currency risk related to certain debt. In order to minimize earnings and cash flow volatility resulting from currency exchange rate changes, the Company enters into derivative instruments, principally forward currency exchange rate contracts. These contracts are designed to hedge anticipated foreign currency transactions and changes in the value of specific assets and liabilities. At inception of the contract, the derivative is designated as either a freestanding derivative or a cash flow hedge. The primary currencies of the derivative instruments are the Euro and Japanese Yen. The Company does not enter into currency exchange rate derivative contracts for speculative purposes. The gross notional amount of all currency exchange rate derivative instruments outstanding at
April 29, 2016
and
April 24, 2015
was
$10.8 billion
and
$9.8 billion
, respectively. The aggregate currency exchange rate gains (losses) were
$314 million
,
$131 million
, and
$(1) million
, in fiscal years
2016
,
2015
, and
2014
, respectively.
The information that follows explains the various types of derivatives and financial instruments used by the Company, how and why the Company uses such instruments, how such instruments are accounted for, and how such instruments impact the Company’s consolidated balance sheets, statements of income, and statements of cash flows.
Freestanding Derivative Contracts
Freestanding derivative contracts are used to offset the Company’s exposure to the change in value of specific foreign currency denominated assets and liabilities and to offset variability of cash flows associated with forecasted transactions denominated in a foreign currency. The gross notional amount of these contracts, not designated as hedging instruments, outstanding at
April 29, 2016
and
April 24, 2015
was
$5.0 billion
and
$4.7 billion
, respectively.
96
The amount and location of the gains in the consolidated statements of income related to derivative instruments, not designated as hedging instruments, for fiscal years
2016
,
2015
, and
2014
are as follows:
|
(in millions)
|
|
Fiscal Year
|
||||||||||||
|
Derivatives Not Designated as Hedging Instruments
|
Location
|
2016
|
2015
|
2014
|
||||||||||
|
Currency exchange rate contracts
|
Other expense
|
$
|
33
|
|
$
|
210
|
|
$
|
15
|
|
||||
Cash Flow Hedges
Currency Exchange Rate Risk
Forward contracts designated as cash flow hedges are designed to hedge the variability of cash flows associated with forecasted transactions denominated in a foreign currency that will take place in the future. No gains or losses relating to ineffectiveness of cash flow hedges were recognized in earnings during fiscal years
2016
,
2015
, or
2014
. No components of the hedge contracts were excluded in the measurement of hedge ineffectiveness and no hedges were derecognized or discontinued during fiscal years
2016
,
2015
, or
2014
. The gross notional amount of these contracts, designated as cash flow hedges, outstanding at
April 29, 2016
and
April 24, 2015
was
$5.7 billion
and
$5.1 billion
, respectively, and will mature within the subsequent
two
-year period.
The amount of gains (losses) and location of the gains (losses) in the consolidated statements of income and other comprehensive income (OCI) related to foreign currency exchange rate contract derivative instruments designated as cash flow hedges for the fiscal years ended
April 29, 2016
,
April 24, 2015
, and
April 25, 2014
are as follows:
|
April 29, 2016
|
|
|
|
|
|
|||||
|
Gross Gains Recognized in OCI
on Effective Portion of Derivative
|
Effective Portion of Gains (Losses) on Derivative Reclassified from
AOCI into Income
|
|||||||||
|
(in millions)
|
||||||||||
|
Derivatives in Cash Flow Hedging Relationships
|
Amount
|
Location
|
Amount
|
|||||||
|
Currency exchange
rate contracts
|
$
|
(165
|
)
|
Other expense, net
|
$
|
405
|
|
|||
|
|
|
|
Cost of products sold
|
(37
|
)
|
|||||
|
Total
|
$
|
(165
|
)
|
|
$
|
368
|
|
|||
|
April 24, 2015
|
|
|
|
|
|
|||||
|
Gross Losses Recognized in OCI
on Effective Portion of Derivative
|
Effective Portion of Gains (Losses) on Derivative Reclassified from
AOCI into Income
|
|||||||||
|
(in millions)
|
||||||||||
|
Derivatives in Cash Flow Hedging Relationships
|
Amount
|
Location
|
Amount
|
|||||||
|
Currency exchange
rate contracts
|
$
|
707
|
|
Other expense, net
|
$
|
221
|
|
|||
|
|
|
|
Cost of products sold
|
(65
|
)
|
|||||
|
Total
|
$
|
707
|
|
|
$
|
156
|
|
|||
|
April 25, 2014
|
|
|
|
|
|
|||||
|
Gross Gains Recognized in OCI
on Effective Portion of Derivative
|
Effective Portion of Gains (Losses) on Derivative Reclassified from
AOCI into Income
|
|||||||||
|
(in millions)
|
||||||||||
|
Derivatives in Cash Flow Hedging Relationships
|
Amount
|
Location
|
Amount
|
|||||||
|
Currency exchange
rate contracts
|
$
|
(152
|
)
|
Other expense, net
|
$
|
94
|
|
|||
|
|
Cost of products sold
|
(43
|
)
|
|||||||
|
Total
|
$
|
(152
|
)
|
|
$
|
51
|
|
|||
97
Forecasted Debt Issuance Interest Rate Risk
Forward starting interest rate derivative instruments designated as cash flow hedges are designed to manage the exposure to interest rate volatility with regard to future issuances of fixed-rate debt. No gains or losses relating to ineffectiveness of forward starting interest rate derivative instruments were recognized in earnings during fiscal years
2016
,
2015
, or
2014
. No components of the hedge contracts were excluded in the measurement of hedge ineffectiveness. In connection with the closing of the 2015 Senior Notes, the Company entered into forward starting interest rate derivatives with a notional amount of
$5.9 billion
, these swaps were terminated upon the issuance of the 2015 Senior Notes. Upon termination, there was no material ineffectiveness on the contracts which were in a net liability position, resulting in cash payment of
$79 million
. During fiscal year 2016, the Company terminated forward starting interest rate derivatives with a consolidated notional amount of
$500 million
, which were previously entered into in advance of a planned debt issuance that is no longer expected. Upon termination, these swaps were in a net liability position, resulting in a cash payment of
$45 million
. As of
April 29, 2016
, the Company had
$300 million
of fixed pay, forward starting interest rate swaps with a weighted average fixed rate of
3.10 percent
in anticipation of planned debt issuances.
For the fiscal years ended
April 29, 2016
and
April 24, 2015
, the Company reclassified
$12 million
and
$11 million
, respectively, of the effective portion of the net losses on forward starting interest rate derivative instruments from
accumulated other comprehensive (loss) income
to
interest expense, net
. In addition, we reclassified
$20 million
from
accumulated other comprehensive (loss) income
to
interest expense, net
due to the acceleration of net losses on forward starting interest derivatives, which had been terminated at the time of the original debt issuances, relating to the portion of debt extinguished in the tender offer.
The unrealized losses on outstanding forward starting interest rate swap derivative instruments as of
April 29, 2016
and
April 24, 2015
were
$48 million
and
$71 million
, respectively.
As of
April 29, 2016
and
April 24, 2015
, the Company had
$(90) million
and
$210 million
, respectively, in after-tax net unrealized (losses) gains associated with cash flow hedging instruments recorded in
accumulated other comprehensive (loss) income
. The Company expects that
$17 million
of after-tax net unrealized gains as of
April 29, 2016
will be reclassified into the consolidated statements of earnings over the next 12 months.
Fair Value Hedges
Interest rate derivative instruments designated as fair value hedges are designed to manage the exposure to interest rate movements and to reduce borrowing costs by converting fixed-rate debt into floating-rate debt. Under these agreements, the Company agrees to exchange, at specified intervals, the difference between fixed and floating interest amounts calculated by reference to an agreed-upon notional principal amount.
As of
April 29, 2016
and
April 24, 2015
, the Company had interest rate swaps in gross notional amounts of
$1.2 billion
and
$2.0 billion
, respectively, designated as fair value hedges of underlying fixed rate obligations. As of
April 29, 2016
and
April 24, 2015
, the Company had interest rate swap agreements designated as fair value hedges of underlying fixed rate obligations including the Company’s
$500 million
4.125
percent 2011 Senior Notes due 2021, and the
$675 million
3.125 percent
2012 Senior Notes due 2022. As of
April 24, 2015
, the Company also had an interest rate swap agreement designated as a fair value hedge underlying the fixed rate obligation related to the Company's
$600 million
4.750 percent
2005 Senior Notes due 2016 and the
$500 million
2.625
percent 2011 Senior Notes due 2016.
As of
April 29, 2016
and
April 24, 2015
, the market value of outstanding interest rate swap agreements was an unrealized gain of
$89 million
and
$18 million
, respectively, and the market value of the hedged items was an unrealized loss of
$89 million
and
$18 million
, respectively, which was recorded in
other assets, prepaid expenses and other current assets,
and
other long-term liabilities
with the offsets recorded in
long-term debt
and
short-term borrowings
on the consolidated balance sheets. No significant hedge ineffectiveness was recorded as a result of these fair value hedges for fiscal year
2016
,
2015
, and
2014
.
During fiscal years
2016
,
2015
, and
2014
, the Company did not have any ineffective fair value hedging instruments. In addition, the Company did not recognize any gains or losses during fiscal years
2016
,
2015
, or
2014
on firm commitments that no longer qualify as fair value hedges.
98
Balance Sheet Presentation
The following tables summarize the location and fair value amounts of derivative instruments reported in the consolidated balance sheets as of
April 29, 2016
and
April 24, 2015
. The fair value amounts are presented on a gross basis and are segregated between derivatives that are designated and qualify as hedging instruments and those that are not, and are further segregated by type of contract within those two categories.
|
April 29, 2016
|
|
|
|
|
|||||||
|
|
Asset Derivatives
|
Liability Derivatives
|
|||||||||
|
(in millions)
|
Balance Sheet Location
|
Fair Value
|
Balance Sheet Location
|
Fair Value
|
|||||||
|
Derivatives designated as hedging instruments
|
|
|
|
|
|
|
|||||
|
Interest rate contracts
|
Prepaid expenses and other current assets
|
$
|
—
|
|
Other accrued expenses
|
$
|
—
|
|
|||
|
Currency exchange rate contracts
|
Prepaid expenses and other current assets
|
123
|
|
Other accrued expenses
|
89
|
|
|||||
|
Interest rate contracts
|
Other assets
|
89
|
|
Other long-term liabilities
|
48
|
|
|||||
|
Currency exchange rate contracts
|
Other assets
|
9
|
|
Other long-term liabilities
|
54
|
|
|||||
|
Total derivatives designated as hedging instruments
|
|
$
|
221
|
|
|
$
|
191
|
|
|||
|
Derivatives not designated as hedging instruments
|
|
|
|
|
|
|
|||||
|
Commodity derivatives
|
Prepaid expenses and other current assets
|
$
|
—
|
|
Other accrued expenses
|
$
|
1
|
|
|||
|
Currency exchange rate contracts
|
Prepaid expenses and other current assets
|
13
|
|
Other accrued expenses
|
23
|
|
|||||
|
Cross currency interest rate contracts
|
Other assets
|
14
|
|
Other long-term liabilities
|
4
|
|
|||||
|
Total derivatives not designated as hedging instruments
|
|
$
|
27
|
|
|
$
|
28
|
|
|||
|
Total derivatives
|
|
$
|
248
|
|
|
$
|
219
|
|
|||
|
April 24, 2015
|
|
|
|
|
|
|
|||||
|
|
Asset Derivatives
|
Liability Derivatives
|
|||||||||
|
(in millions)
|
Balance Sheet Location
|
Fair Value
|
Balance Sheet Location
|
Fair Value
|
|||||||
|
Derivatives designated as hedging instruments
|
|
|
|
|
|
|
|||||
|
Interest rate contracts
|
Prepaid expenses and other current assets
|
$
|
10
|
|
Other accrued expenses
|
$
|
—
|
|
|||
|
Currency exchange rate contracts
|
Prepaid expenses and other current assets
|
382
|
|
Other accrued expenses
|
12
|
|
|||||
|
Interest rate contracts
|
Other assets
|
79
|
|
Other long-term liabilities
|
71
|
|
|||||
|
Currency exchange rate contracts
|
Other assets
|
143
|
|
Other long-term liabilities
|
3
|
|
|||||
|
Total derivatives designated as hedging instruments
|
|
$
|
614
|
|
|
$
|
86
|
|
|||
|
Derivatives not designated as hedging instruments
|
|
|
|
|
|
|
|||||
|
Currency exchange rate contracts
|
Prepaid expenses and other current assets
|
$
|
119
|
|
Other accrued expenses
|
$
|
30
|
|
|||
|
Total derivatives not designated as hedging instruments
|
|
$
|
119
|
|
|
$
|
30
|
|
|||
|
Total derivatives
|
|
$
|
733
|
|
|
$
|
116
|
|
|||
99
The following table provides information by level for the derivative assets and liabilities that are measured at fair value on a recurring basis as of April 29, 2016 and April 24, 2015:
|
April 29, 2016
|
April 24, 2015
|
|||||||||||||||||||||||
|
(in millions)
|
Level 1
|
Level 2
|
Level 3
|
Level 1
|
Level 2
|
Level 3
|
||||||||||||||||||
|
Derivative Assets
|
$
|
145
|
|
$
|
103
|
|
$
|
—
|
|
$
|
644
|
|
$
|
89
|
|
$
|
—
|
|
||||||
|
Derivative Liabilities
|
166
|
|
53
|
|
—
|
|
45
|
|
71
|
|
—
|
|
||||||||||||
The Company has elected to present the fair value of derivative assets and liabilities within the consolidated balance sheets on a gross basis even when derivative transactions are subject to master netting arrangements and may otherwise qualify for net presentation. The following table provides information as if the Company had elected to offset the asset and liability balances of derivative instruments, netted in accordance with various criteria as stipulated by the terms of the master netting arrangements with each of the counterparties. Derivatives not subject to master netting arrangements are not eligible for net presentation.
|
April 29, 2016
|
Gross Amount Not Offset on the Balance Sheet
|
|||||||||||||||
|
(in millions)
|
Gross Amount of Recognized Assets (Liabilities)
|
Financial Instruments
|
Cash Collateral (Received) or Posted
|
Net Amount
|
||||||||||||
|
Derivative Assets
|
||||||||||||||||
|
Currency exchange rate contracts
|
$
|
145
|
|
$
|
(98
|
)
|
$
|
(1
|
)
|
$
|
46
|
|
||||
|
Interest rate contracts
|
89
|
|
(20
|
)
|
—
|
|
69
|
|
||||||||
|
Cross Currency interest rate contracts
|
14
|
|
—
|
|
—
|
|
14
|
|
||||||||
|
$
|
248
|
|
$
|
(118
|
)
|
$
|
(1
|
)
|
$
|
129
|
|
|||||
|
Derivative Liabilities
|
||||||||||||||||
|
Currency exchange rate contracts
|
$
|
(166
|
)
|
$
|
85
|
|
26
|
|
$
|
(55
|
)
|
|||||
|
Interest rate contracts
|
(48
|
)
|
34
|
|
—
|
|
(14
|
)
|
||||||||
|
Cross currency interest rate contracts
|
(4
|
)
|
—
|
|
—
|
|
(4
|
)
|
||||||||
|
Commodity contracts
|
(1
|
)
|
—
|
|
—
|
|
(1
|
)
|
||||||||
|
$
|
(219
|
)
|
$
|
119
|
|
$
|
26
|
|
$
|
(74
|
)
|
|||||
|
Total
|
$
|
29
|
|
$
|
1
|
|
$
|
25
|
|
$
|
55
|
|
||||
|
April 24, 2015
|
Gross Amount Not Offset on the Balance Sheet
|
|||||||||||||||
|
(in millions)
|
Gross Amount of Recognized Assets (Liabilities)
|
Financial Instruments
|
Cash Collateral (Received) or Posted
|
Net Amount
|
||||||||||||
|
Derivative Assets
|
||||||||||||||||
|
Currency exchange rate contracts
|
$
|
644
|
|
$
|
(61
|
)
|
$
|
(325
|
)
|
$
|
258
|
|
||||
|
Interest rate contracts
|
89
|
|
(10
|
)
|
(13
|
)
|
66
|
|
||||||||
|
$
|
733
|
|
$
|
(71
|
)
|
$
|
(338
|
)
|
$
|
324
|
|
|||||
|
Derivative Liabilities
|
||||||||||||||||
|
Currency exchange rate contracts
|
$
|
(45
|
)
|
$
|
31
|
|
$
|
—
|
|
$
|
(14
|
)
|
||||
|
Interest rate contracts
|
(71
|
)
|
40
|
|
8
|
|
(23
|
)
|
||||||||
|
$
|
(116
|
)
|
$
|
71
|
|
$
|
8
|
|
$
|
(37
|
)
|
|||||
|
Total
|
$
|
617
|
|
$
|
—
|
|
$
|
(330
|
)
|
$
|
287
|
|
||||
100
Concentrations of Credit Risk
Financial instruments, which potentially subject the Company to significant concentrations of credit risk, consist principally of interest-bearing investments, forward exchange derivative contracts, and trade accounts receivable.
The Company maintains cash and cash equivalents, investments, and certain other financial instruments (including currency exchange rate and interest rate derivative contracts) with various major financial institutions. The Company performs periodic evaluations of the relative credit standings of these financial institutions and limits the amount of credit exposure with any one institution. In addition, the Company has collateral credit agreements with its primary derivatives counterparties. Under these agreements, either party is required to post eligible collateral when the market value of transactions covered by the agreement exceeds specific thresholds, thus limiting credit exposure for both parties. As of
April 29, 2016
, the Company posted net cash collateral of
$25 million
to its counterparties. As of
April 24, 2015
, the Company received net cash collateral of
$330 million
from its counterparties. The collateral received was recorded in
cash and cash equivalents
, with the offset recorded as an increase in
other accrued expenses
on the consolidated balance sheets. The collateral posted was recorded in
Prepaid expenses and other current assets
, with the offset recorded as a decrease in
cash and cash equivalents
on the consolidated balance sheets.
Global concentrations of credit risk with respect to trade accounts receivable are limited due to the large number of customers and their dispersion across many geographic areas. The Company monitors the creditworthiness of its customers to which it grants credit terms in the normal course of business. However, a significant amount of trade receivables are with hospitals that are dependent upon governmental health care systems in many countries. The current economic conditions in many countries outside the U.S. may continue to increase the average length of time it takes the Company to collect on its outstanding trade receivables in these countries as certain payment patterns have been impacted. Although the Company does not currently foresee a significant credit risk associated with the outstanding accounts receivable, repayment is dependent upon the financial stability of the economies of these countries.
9. Shareholders’ Equity
Share Capital
Medtronic plc is authorized to issue
2.6 billion
Ordinary Shares,
$0.0001
par value;
40 thousand
Euro Deferred Shares, €
1.00
par value;
128 million
Preferred Shares,
$0.20
par value; and
500 thousand
A Preferred Shares,
$1.00
par value.
Euro Deferred Shares
During the Transactions, the Company issued
40 thousand
Euro Deferred Shares at their par value of €
1.00
per share. The holders of the Euro Deferred Shares are not entitled to receive any dividend or distribution and are not entitled to receive notice of, nor attend, speak or vote at any general meeting of the Company. On a return of assets, whether on liquidation or otherwise, the Euro Deferred Shares are entitled to only the repayment of the amounts paid up on such shares, after repayment of the capital paid up on the ordinary shares. Euro Deferred shareholders are not entitled to any further participation in the assets or profits of the Company. On March 23, 2016, the Euro Deferred Shares were transferred back to the Company and were subsequently canceled.
A Preferred Shares
The Company issued
624
A Preferred Shares, par value
$1.00
, each to three of its advisors in connection with the Transactions, for a total of
1,872
A Preferred Shares outstanding with an aggregate consideration of
$75 thousand
. The holders of A Preferred Shares are entitled to payment of dividends prior to any other class of shares in the Company equal to twice the dividend to be paid per Company ordinary share. On a return of assets, whether on liquidation or otherwise, the A Preferred Shares are entitled to repayment of the capital paid up thereon in priority to any repayment of capital to the holders of any other shares and the holders of the A Preferred Shares shall not be entitled to any further participation in the assets or profits of the Company. The holders of the A Preferred Shares are not entitled to receive notice of, nor to attend, speak, or vote at any general meeting of the Company.
Dividends
The timing, declaration and payment of future dividends to holders of our ordinary and A Preferred shares falls within the discretion of the Company's Board of Directors and depends upon many factors, including the statutory requirements of Irish law, the Company's earnings and financial condition, the capital requirements of our businesses, industry practice and any other factors the Board of Directors deems relevant.
101
Ordinary Share Repurchase Program
Shares are repurchased from time to time to support the Company’s stock-based compensation programs and to return capital to shareholders. During fiscal years
2016
and
2015
, the Company repurchased approximately
38 million
and
30 million
shares at an average price of
$74.92
and
$64.53
, respectively. In June 2015, the Company's Board of Directors authorized, subject to the ongoing existence of sufficient distributable reserves, the redemption of
80 million
of the Company's ordinary shares. As of
April 29, 2016
, the Company had used
8 million
of the
80 million
shares authorized under the repurchase program, leaving
72 million
shares available for future repurchases. The Company accounts for repurchases of ordinary shares using the par value method and shares repurchased are canceled.
10. Stock Purchase and Award Plans
The Company measures stock-based compensation expense at the grant date based on the fair value of the award and recognizes the compensation expense over the requisite service period, which is generally the vesting period.
The Medtronic, Inc. 2013 Stock Award and Incentive Plan was originally approved by the Company's shareholders in August 2013. In January 2015, the Company's Board of Directors approved an amendment to and assumption of the existing Medtronic, Inc. 2013 Stock Award and Incentive Plan, which created the new Medtronic plc 2013 Stock Award and Incentive Plan (2013 Plan). In fiscal year
2016
, the Company granted stock awards under the 2013 Plan. The 2013 Plan provides for the grant of non-qualified and incentive stock options, stock appreciation rights, restricted stock, restricted stock units, performance awards, and other stock and cash-based awards. As of
April 29, 2016
, there were approximately
27 million
shares available for future grants under the 2013 Plan.
Share Options
Options are granted at the exercise price equal to the closing price of the Company’s ordinary share on the grant date. The majority of the Company’s options are non-qualified options with a
10
-year life and a
4
-year ratable vesting term. In fiscal year
2016
, the Company granted share options under the 2013 Plan.
Restricted Stock Awards
Restricted stock and restricted stock units (collectively referred to as restricted stock awards) are granted to officers and key employees. The Company grants restricted stock awards that typically cliff vest after
four
years. The expense recognized for restricted stock awards is equal to the grant date fair value, which is equal to the closing stock price on the date of grant. Restricted stock awards are expensed over the vesting period and are subject to forfeiture if employment terminates prior to the lapse of the restrictions. The Company also grants shares of performance-based restricted stock awards that typically cliff vest after
three
years only if the Company has also achieved certain performance objectives. Performance awards are expensed over the performance period based on the probability of achieving the performance objectives.
Shares of restricted stock are considered issued and outstanding shares of the Company at the grant date and have the same dividend and voting rights as other ordinary shares. Restricted stock units are not considered issued or outstanding ordinary shares of the Company. Dividend equivalent units are accumulated on restricted stock units during the vesting period. In fiscal year
2016
, the Company granted restricted stock units under the 2013 Plan. As of
April 29, 2016
, all restricted stock awards outstanding were restricted stock units.
Employees Stock Purchase Plan
The Medtronic plc Amended and Restated 2014 Employees Stock Purchase Plan (ESPP) allows participating employees to purchase the Company's ordinary shares at a discount through payroll deductions. The expense recognized for shares purchased under the Company’s ESPP is equal to the
15 percent
discount the employee receives at the end of the calendar quarter purchase period.
Employees can contribute between
2
percent and
10 percent
of their wages or the statutory limit under the U.S. Internal Revenue Code toward the purchase of newly issued ordinary shares of the Company at
85 percent
of its market value at the end of the calendar quarter purchase period. Employees purchased
2 million
shares at an average price of
$61.66
per share in the fiscal year ended
April 29, 2016
. As of
April 29, 2016
, plan participants have had approximately
$12 million
withheld to purchase the Company's ordinary shares at
85 percent
of its market value on July 1, 2016, the last trading day before the end of the calendar quarter purchase period. At
April 29, 2016
, approximately
20 million
ordinary shares were available for future purchase under the ESPP.
Stock Option Valuation Assumptions
The Company uses the Black-Scholes option pricing model (Black-Scholes model) to determine the fair value of stock options as of the grant date. The fair value of stock options under the Black-Scholes model requires management to make assumptions regarding projected employee stock option exercise behaviors, risk-free interest rates, volatility of the Company’s stock price, and expected dividends.
102
The following table provides the weighted average fair value of options granted to employees and the related assumptions used in the Black-Scholes model:
|
|
Fiscal Year
|
||||||||||
|
|
2016
|
2015
|
2014
|
||||||||
|
Weighted average fair value of options granted
|
$
|
13.72
|
|
$
|
25.39
|
|
$
|
12.00
|
|
||
|
Assumptions used:
|
|
|
|
|
|
|
|||||
|
Expected life (years)
(1)
|
5.94
|
|
4.24
|
|
6.40
|
|
|||||
|
Risk-free interest rate
(2)
|
1.79
|
%
|
0.99
|
%
|
1.88
|
%
|
|||||
|
Volatility
(3)
|
21.00
|
%
|
21.29
|
%
|
25.20
|
%
|
|||||
|
Dividend yield
(4)
|
1.96
|
%
|
1.66
|
%
|
2.02
|
%
|
|||||
|
(1)
|
Expected life:
The Company analyzes historical employee stock option exercise and termination data to estimate the expected life assumption. The Company calculates the expected life assumption using the midpoint scenario, which combines historical exercise data with hypothetical exercise data, as the Company believes this data currently represents the best estimate of the expected life of a new employee option. The Company also stratifies its employee population into two groups based upon distinctive exercise behavior patterns.
|
|
(2)
|
Risk-free interest rate:
The rate is based on the grant date yield of a zero-coupon U.S. Treasury bond whose maturity period equals the expected term of the option.
|
|
(3)
|
Volatility:
Expected volatility is based on a blend of historical volatility and an implied volatility of the Company’s ordinary shares. Implied volatility is based on market traded options of the Company’s ordinary shares.
|
|
(4)
|
Dividend yield:
The dividend yield rate is calculated by dividing the Company’s annual dividend, based on the most recent quarterly dividend rate, by the closing stock price on the grant date.
|
Stock-Based Compensation Expense
Under the fair value recognition provisions of U.S. GAAP for accounting for stock-based compensation, the Company measures stock-based compensation expense at the grant date based on the fair value of the award and recognizes the compensation expense over the requisite service period, which is generally the vesting period.
The amount of stock-based compensation expense recognized during a period is based on the portion of the awards that are ultimately expected to vest. The Company estimates pre-vesting forfeitures at the time of grant by analyzing historical data and revises those estimates in subsequent periods if actual forfeitures differ from those estimates. Ultimately, the total expense recognized over the vesting period will equal the fair value of awards that actually vest.
Pursuant to the Transaction Agreement, outstanding stock option awards held by Covidien employees upon transaction close were converted into options to acquire the Company's ordinary shares in a manner designed to preserve the intrinsic value of such awards. In addition, unvested restricted stock units granted on or after June 15, 2014 which were held by Covidien employees upon close of the Covidien acquisition were converted into restricted stock units of the Company in a manner designed to preserve the intrinsic value of such awards. The modifications made to the restricted stock units granted on or after June 15, 2014 and all outstanding share options pursuant to the Transaction Agreement that converted such awards constituted modifications under the authoritative guidance for accounting for stock compensation. This guidance requires the Company to revalue the award upon the transaction close and allocate the revised fair value between consideration paid and continuing expense based on the ratio of service performed through the transaction date over the total service period of the award. The revised fair value allocated to post-combination services resulted in incremental expense which is recognized over the remaining service period of the award. The Company recognized $
58 million
of incremental expense related to these modifications during fiscal year 2016 and is included in
acquisition-related items
. Except for the conversion of share options and restricted stock units discussed herein, the material terms of these awards remained unchanged.
103
The following table presents the components and classification of stock-based compensation expense for stock options, restricted stock awards, and ESPP shares recognized for fiscal years
2016
,
2015
, and
2014
:
|
|
Fiscal Year
|
||||||||||
|
(in millions)
|
2016
|
2015
|
2014
|
||||||||
|
Stock options
|
$
|
206
|
|
$
|
140
|
|
$
|
34
|
|
||
|
Restricted stock awards
|
148
|
|
284
|
|
98
|
|
|||||
|
Employees stock purchase plan
|
21
|
|
15
|
|
13
|
|
|||||
|
Total stock-based compensation expense
|
$
|
375
|
|
$
|
439
|
|
$
|
145
|
|
||
|
Cost of products sold
|
$
|
50
|
|
$
|
23
|
|
$
|
14
|
|
||
|
Research and development expense
|
37
|
|
29
|
|
27
|
|
|||||
|
Selling, general, and administrative expense
|
212
|
|
128
|
|
104
|
|
|||||
|
Restructuring charges
|
18
|
|
70
|
|
—
|
|
|||||
|
Acquisition-related items
|
58
|
|
189
|
|
—
|
|
|||||
|
Total stock-based compensation expense
|
375
|
|
439
|
|
145
|
|
|||||
|
Income tax benefits
|
(108
|
)
|
(138
|
)
|
(40
|
)
|
|||||
|
Total stock-based compensation expense, net of tax
|
$
|
267
|
|
$
|
301
|
|
$
|
105
|
|
||
Stock Options
The following table summarizes all stock option activity, including activity from options assumed or issued as a result of acquisitions, during fiscal year
2016
:
|
|
Options (in thousands)
|
Wtd. Avg.
Exercise
Price
|
Wtd. Avg. Remaining Contractual Term (in years)
|
Aggregate Intrinsic Value (in millions)
|
||||||||
|
Outstanding at April 24, 2015
|
62,021
|
|
$
|
53.27
|
|
|||||||
|
Granted
|
5,785
|
|
77.76
|
|
||||||||
|
Exercised
|
(11,103
|
)
|
41.99
|
|
||||||||
|
Expired/Forfeited
|
(3,733
|
)
|
70.62
|
|
||||||||
|
Outstanding at April 29, 2016
|
52,970
|
|
57.09
|
|
6.47
|
$
|
1,168
|
|
||||
|
Vested and expected to vest at April 29, 2016
|
25,542
|
|
69.91
|
|
8.48
|
236
|
|
|||||
|
Exercisable at April 29, 2016
|
23,383
|
|
40.14
|
|
3.90
|
912
|
|
|||||
The following table summarizes the total cash received from the issuance of new shares upon stock option award exercises, the total intrinsic value of options exercised and the related tax benefit during fiscal years
2016
,
2015
, and
2014
:
|
Fiscal Year
|
|||||||||||
|
(in millions)
|
2016
|
2015
|
2014
|
||||||||
|
Cash proceeds from options exercised
|
$
|
452
|
|
$
|
609
|
|
$
|
1,273
|
|
||
|
Intrinsic value of options exercised
|
374
|
|
329
|
|
249
|
|
|||||
|
Tax benefit related to options exercised
|
131
|
|
106
|
|
78
|
|
|||||
Unrecognized compensation expense related to outstanding stock options as of
April 29, 2016
was
$303 million
and is expected to be recognized over a weighted average period of
2.1 years
.
104
Restricted Stock Awards
The following table summarizes restricted stock award activity, including activity from restricted stock awards assumed or issued as a result of acquisitions, during fiscal year
2016
:
|
|
Awards (in thousands)
|
Wtd. Avg.
Grant
Price
|
||||
|
Nonvested at April 24, 2015
|
10,022
|
|
$
|
53.88
|
|
|
|
Granted
|
2,565
|
|
77.68
|
|
||
|
Vested
|
(3,148
|
)
|
42.96
|
|
||
|
Forfeited
|
(619
|
)
|
59.16
|
|
||
|
Nonvested at April 29, 2016
|
8,820
|
|
$
|
64.33
|
|
|
The following table summarizes the weighted-average grant date fair value of restricted stock awards granted, total fair value of restricted stock awards vested and related tax benefit during fiscal years
2016
,
2015
, and
2014
:
|
Fiscal Year
|
|||||||||||
|
(in millions, except per share data)
|
2016
|
2015
|
2014
|
||||||||
|
Weighted-average grant-date fair value per restricted stock award
|
$
|
77.68
|
|
$
|
69.30
|
|
$
|
55.62
|
|
||
|
Fair value of restricted stock awards vested
|
276
|
|
174
|
|
142
|
|
|||||
|
Tax benefit related to restricted stock awards vested
|
76
|
|
50
|
|
40
|
|
|||||
Unrecognized compensation expense related to restricted stock awards as of
April 29, 2016
was
$278 million
and is expected to be recognized over a weighted average period of
2.5 years
.
11. Income Taxes
The provision for income taxes is based on income before income taxes reported for financial statement purposes. The components of income from continuing operations before income taxes, based on tax jurisdiction, are as follows:
|
|
Fiscal Year
|
||||||||||
|
(in millions)
|
2016
|
2015
|
2014
|
||||||||
|
U.S.
|
$
|
333
|
|
$
|
639
|
|
$
|
1,690
|
|
||
|
International
|
4,003
|
|
2,847
|
|
2,015
|
|
|||||
|
Income from continuing operations before income taxes
|
$
|
4,336
|
|
$
|
3,486
|
|
$
|
3,705
|
|
||
The provision for income taxes from continuing operations consists of the following:
|
|
Fiscal Year
|
||||||||||
|
(in millions)
|
2016
|
2015
|
2014
|
||||||||
|
Current tax expense:
|
|
|
|
|
|
|
|||||
|
U.S.
|
$
|
440
|
|
$
|
1,128
|
|
$
|
532
|
|
||
|
International
|
835
|
|
502
|
|
248
|
|
|||||
|
Total current tax expense
|
1,275
|
|
1,630
|
|
780
|
|
|||||
|
Deferred tax (benefit) expense:
|
|
|
|
|
|
|
|||||
|
U.S.
|
(67
|
)
|
(705
|
)
|
(175
|
)
|
|||||
|
International
|
(410
|
)
|
(114
|
)
|
35
|
|
|||||
|
Net deferred tax benefit
|
(477
|
)
|
(819
|
)
|
(140
|
)
|
|||||
|
Total provision for income taxes
|
$
|
798
|
|
$
|
811
|
|
$
|
640
|
|
||
105
Deferred taxes arise because of the different treatment of transactions for financial statement accounting and income tax accounting, known as temporary differences. The Company records the tax effect of these temporary differences as deferred tax assets and deferred tax liabilities. Deferred tax assets generally represent items that can be used as a tax deduction or credit in a tax return in future years for which the Company has already recorded the tax benefit in the consolidated statements of income. The Company establishes valuation allowances for deferred tax assets when the amount of expected future taxable income is not likely to support the use of the deduction or credit. Deferred tax liabilities generally represent tax expense recognized in the consolidated financial statements for which payment has been deferred or expense has already been taken as a deduction on the Company’s tax return but has not yet been recognized as an expense in the consolidated statements of income. Tax assets (liabilities), shown before jurisdictional netting of deferred tax assets (liabilities), are comprised of the following:
|
(in millions)
|
April 29, 2016
|
April 24, 2015
|
|||||
|
Deferred tax assets:
|
|
|
|
|
|||
|
Net operating loss, capital loss, and credit carryforwards
|
$
|
7,568
|
|
$
|
5,912
|
|
|
|
Other accrued liabilities
|
619
|
|
585
|
|
|||
|
Accrued compensation
|
358
|
|
330
|
|
|||
|
Pension and post-retirement benefits
|
530
|
|
449
|
|
|||
|
Stock-based compensation
|
316
|
|
418
|
|
|||
|
Other
|
341
|
|
303
|
|
|||
|
Inventory
|
225
|
|
171
|
|
|||
|
Federal and state benefit on uncertain tax positions
|
308
|
|
296
|
|
|||
|
Unrealized loss on available-for-sale securities and derivative financial instruments
|
107
|
|
—
|
|
|||
|
Gross deferred tax assets
|
10,372
|
|
8,464
|
|
|||
|
Valuation allowance
|
(7,032
|
)
|
(5,607
|
)
|
|||
|
Total deferred tax assets
|
3,340
|
|
2,857
|
|
|||
|
Deferred tax liabilities:
|
|
|
|
|
|||
|
Intangible assets
|
(5,173
|
)
|
(5,393
|
)
|
|||
|
Basis impairment
|
(230
|
)
|
(204
|
)
|
|||
|
Realized loss on derivative financial instruments
|
(112
|
)
|
(112
|
)
|
|||
|
Other
|
(179
|
)
|
(96
|
)
|
|||
|
Accumulated depreciation
|
(189
|
)
|
(217
|
)
|
|||
|
Unrealized gain on available-for-sale securities and derivative financial instruments
|
—
|
|
(160
|
)
|
|||
|
Total deferred tax liabilities
|
(5,883
|
)
|
(6,182
|
)
|
|||
|
Prepaid income taxes
|
365
|
|
427
|
|
|||
|
Income tax receivables
|
529
|
|
188
|
|
|||
|
Tax liabilities, net
|
$
|
(1,649
|
)
|
$
|
(2,710
|
)
|
|
|
Reported as (after valuation allowance and jurisdictional netting):
|
|
|
|
|
|||
|
Tax assets
|
$
|
697
|
|
$
|
1,335
|
|
|
|
Long-term tax assets
|
1,383
|
|
774
|
|
|||
|
Deferred tax liabilities
|
—
|
|
(119
|
)
|
|||
|
Long-term deferred tax liabilities
|
(3,729
|
)
|
(4,700
|
)
|
|||
|
Tax liabilities, net
|
$
|
(1,649
|
)
|
$
|
(2,710
|
)
|
|
At
April 29, 2016
, the Company had approximately
$26.6 billion
of net operating loss carryforwards in certain non-U.S. jurisdictions, of which
$22.4 billion
have no expiration, and the remaining
$4.2 billion
will expire in future years through 2036. Included in these net operating loss carryforwards are
$18.0 billion
of net operating losses related to a subsidiary of the Company, substantially all of which were recorded in fiscal 2008 as a result of the receipt of a favorable tax ruling from certain non-U.S. taxing authorities. The Company has recorded a full valuation allowance against these net operating losses as management does not believe that it is more likely than not that these net operating losses will be utilized. Certain of the remaining non-US net
106
operating loss carryforwards of
$8.6 billion
have a valuation allowance recorded against the carryforwards as management does not believe that it is more likely than not that these net operating losses will be utilized.
At
April 29, 2016
, the Company had
$847 million
of U.S. federal net operating loss carryforwards, which will expire during fiscal 2018 through 2036. For U.S. state purposes, the Company had
$755 million
of net operating loss carryforwards at April 29, 2016, which will expire during fiscal 2017 through 2036.
At April 29, 2016, the Company also had
$202 million
of tax credits available to reduce future income taxes payable, of which
$98 million
have no expiration, and the remaining credits begin to expire during fiscal 2017.
The Company has established valuation allowances of
$7.0 billion
and
$5.6 billion
at
April 29, 2016
and
April 24, 2015
, respectively, primarily related to the uncertainty of the utilization of certain deferred tax assets, primarily tax loss and credit carryforwards in various jurisdictions. These valuation allowances would result in a reduction to the
provision for income taxes
in the consolidated statements of income, if they are ultimately not required.
At
April 29, 2016
, the Company had certain potential non-U.S. tax attributes that had not been recorded in the consolidated financial statements, including
$12.4 billion
of non-U.S. special deductions with an indefinite carryforward period. The Company has treated these amounts as special deductions for financial statement purposes since utilization is contingent upon the annual performance of certain economic factors. The Company intends to recognize the applicable portion of the special deduction annually at an estimated tax rate of between
1%
and
3%
when and if these economic factors are met.
The Company’s effective income tax rate from continuing operations varied from the U.S. federal statutory tax rate as follows:
|
|
Fiscal Year
|
|||||||
|
|
2016
|
2015
|
2014
|
|||||
|
U.S. federal statutory tax rate
|
35.0
|
%
|
35.0
|
%
|
35.0
|
%
|
||
|
Increase (decrease) in tax rate resulting from:
|
|
|
|
|
|
|
||
|
U.S. state taxes, net of federal tax benefit
|
0.9
|
|
0.8
|
|
0.6
|
|
||
|
Research and development credit
|
(1.2
|
)
|
(0.7
|
)
|
(0.5
|
)
|
||
|
Domestic production activities
|
(0.3
|
)
|
(0.4
|
)
|
(0.4
|
)
|
||
|
International
|
(23.4
|
)
|
(24.3
|
)
|
(17.7
|
)
|
||
|
Puerto Rico Excise Tax
|
(1.6
|
)
|
(1.7
|
)
|
(1.6
|
)
|
||
|
Impact of adjustments
(1)
|
11.4
|
|
13.3
|
|
5.6
|
|
||
|
Reversal of excess tax accruals
|
—
|
|
—
|
|
(1.9
|
)
|
||
|
Valuation allowance release
|
(0.9
|
)
|
—
|
|
—
|
|
||
|
Other, net
|
(1.5
|
)
|
1.3
|
|
(1.8
|
)
|
||
|
Effective tax rate
|
18.4
|
%
|
23.3
|
%
|
17.3
|
%
|
||
|
(1)
|
Adjustments include the impact of inventory step-up, impact of product technology upgrade commitment, special charges (gains), net, restructuring charges, net, certain litigation charges, net, acquisition-related items, amortization of intangible assets, and certain tax adjustments.
|
During fiscal year 2016 the Company recorded certain tax adjustments of
$417 million
. A
$442 million
certain tax adjustment charge was recorded, which primarily related to the U.S. income tax expense resulting from our completion of an internal reorganization of the ownership of certain legacy Covidien businesses that reduced the cash and investments held by our U.S.-controlled non-U.S. subsidiaries (the Internal Reorganization). As a result of the Internal Reorganization, approximately
$9.7 billion
of cash, cash equivalents and investments in marketable debt and equity securities previously held by U.S.-controlled non-U.S. subsidiaries became available for general corporate purposes. This charge was partially offset by a
$25 million
tax benefit associated with the disposition of a wholly owned U.S. subsidiary. The
$417 million
net certain tax adjustment was recorded in the
provision for income taxes
in the consolidated statement of income for fiscal year 2016.
During fiscal year 2015, a settlement was reached with the IRS for the Kyphon acquisition-related matters. As a result, the Company recorded a
$329 million
certain tax adjustment associated with the settlement. In addition, the certain tax adjustments includes a
$20 million
charge related to a taxable gain associated with the Covidien acquisition. The
$349 million
net tax cost was recorded in the
provision for income taxes
in the consolidated statement of income for fiscal year 2015.
107
In fiscal year 2014, the Company recorded a
$71 million
net tax benefit associated with the reversal of excess tax accruals. This net tax benefit included
$63 million
related to the settlement of certain issues reached with the IRS involving the review of the Company’s fiscal years 2009 through 2011 domestic income tax returns and the remaining amount related to the resolution of various state and foreign audit proceedings covering multiple years and issues. The
$71 million
net tax benefit was recorded in the
provision for income taxes
in the consolidated statement of income for fiscal year 2014.
No deferred taxes have been provided for any portion of the approximately
$29.0 billion
and
$27.8 billion
of undistributed earnings of the Company’s subsidiaries as of
April 29, 2016
and April 24, 2015, respectively, since these earnings have been, and under current plans will continue to be, permanently reinvested in these subsidiaries. The Company has not provided U.S. income taxes on approximately
$20.5 billion
of undistributed earnings, net, from non-U.S. subsidiaries as of
April 25, 2014
. Due to the number of legal entities and jurisdictions involved and the complexity of the legal entity structure of the Company, the complexity of the tax laws in the relevant jurisdictions, including, but not limited to the rules pertaining to the utilization of foreign tax credits in the United States and the impact of projections of income for future years to any calculations, the Company believes it is not practicable to estimate, within any reasonable range, the amount of additional taxes which may be payable upon distribution of these earnings.
Currently, the Company’s operations in Puerto Rico, Switzerland, Singapore, Dominican Republic, Costa Rica, and Israel have various tax incentive grants. The tax reductions as compared to the local statutory rate favorably impacted earnings per diluted share by
$0.33
in fiscal year 2016,
$0.37
in fiscal year 2015, and
$0.42
in fiscal year 2014. Unless these grants are extended, they will expire between fiscal years 2017 and 2029. The Company’s historical practice has been to renew, extend, or obtain new tax incentive grants upon expiration of existing tax incentive grants. If the Company is not able to renew, extend, or obtain new tax incentive grants, the expiration of existing tax incentive grants could have a material impact on the Company’s financial results in future periods.
The Company had
$2.7 billion
,
$2.9 billion
, and
$1.2 billion
of gross unrecognized tax benefits as of
April 29, 2016
,
April 24, 2015
, and
April 25, 2014
, respectively. A reconciliation of the beginning and ending amount of unrecognized tax benefits for fiscal years
2016
,
2015
, and
2014
is as follows:
|
|
Fiscal Year
|
||||||||||
|
(in millions)
|
2016
|
2015
|
2014
|
||||||||
|
Gross unrecognized tax benefits at beginning of fiscal year
|
$
|
2,860
|
|
$
|
1,172
|
|
$
|
1,068
|
|
||
|
Gross increases:
|
|
|
|
|
|
|
|||||
|
Prior year tax positions
|
36
|
|
331
|
|
64
|
|
|||||
|
Current year tax positions
|
202
|
|
231
|
|
166
|
|
|||||
|
Acquisitions
|
—
|
|
1,199
|
|
—
|
|
|||||
|
Gross decreases:
|
|
|
|
|
|
|
|||||
|
Prior year tax positions
|
(116
|
)
|
(40
|
)
|
(58
|
)
|
|||||
|
Settlements
|
(275
|
)
|
(33
|
)
|
(66
|
)
|
|||||
|
Statute of limitation lapses
|
(4
|
)
|
—
|
|
(2
|
)
|
|||||
|
Gross unrecognized tax benefits at end of fiscal year
|
$
|
2,703
|
|
$
|
2,860
|
|
$
|
1,172
|
|
||
|
Cash advance paid in connection with proposed settlements
|
(384
|
)
|
(378
|
)
|
—
|
|
|||||
|
Gross unrecognized tax benefits at end of fiscal year, net of cash advance
|
$
|
2,319
|
|
$
|
2,482
|
|
$
|
1,172
|
|
||
If all of the Company’s unrecognized tax benefits as of
April 29, 2016
,
April 24, 2015
, and
April 25, 2014
were recognized,
$2.1 billion
,
$2.2 billion
, and
$1.1 billion
would impact the Company’s effective tax rate, respectively. Although the Company believes that it has adequately provided for liabilities resulting from tax assessments by taxing authorities, positions taken by these tax authorities could have a material impact on the Company’s effective tax rate in future periods. The Company has recorded
$7 million
of gross unrecognized tax benefits as a current liability, and
$2.7 billion
as a long-term liability. The Company estimates that within the next 12 months, it is reasonably possible that its uncertain tax positions, excluding interest, could decrease by as much as
$500 million
, net as a result of the resolution of tax matters with the U.S. Tax Court, Appeals Division of the IRS, other settlements with taxing authorities as well as statute of limitation lapses.
The Company recognizes interest and penalties related to income tax matters in the
provision for income taxes
in the consolidated statements of income and records the liability in the current or long-term accrued income taxes in the consolidated balance sheets, as appropriate. The Company had
$609 million
,
$656 million
, and
$141 million
of accrued gross interest and penalties as of
108
April 29, 2016
,
April 24, 2015
, and
April 25, 2014
, respectively. During the fiscal years ended
April 29, 2016
,
April 24, 2015
, and
April 25, 2014
, the Company recognized gross interest expense of approximately
$80 million
,
$142 million
, and
$36 million
, respectively, in the
provision for income taxes
in the consolidated statements of income.
The Company’s reserves for uncertain tax positions relate to unresolved matters with the IRS and other taxing authorities. These reserves are subject to a high degree of estimation and management judgment. Resolution of these significant unresolved matters, or positions taken by the IRS or other tax authorities during future tax audits, could have a material impact on the Company’s financial results in future periods. The Company continues to believe that its reserves for uncertain tax positions are appropriate and that it has meritorious defenses for its tax filings and will vigorously defend them during the audit process, appellate process, and through litigation in courts, as necessary.
The major tax jurisdictions where the Company conducts business which remain subject to examination are as follows:
|
Jurisdiction
|
Earliest Year Open
|
|
|
United States - federal and state
|
1996
|
|
|
Brazil
|
2011
|
|
|
Canada
|
2005
|
|
|
China
|
2009
|
|
|
Costa Rica
|
2012
|
|
|
Dominican Republic
|
2011
|
|
|
France
|
2011
|
|
|
Germany
|
2009
|
|
|
India
|
2001
|
|
|
Ireland
|
2011
|
|
|
Israel
|
2010
|
|
|
Italy
|
2005
|
|
|
Japan
|
2010
|
|
|
Luxembourg
|
2009
|
|
|
Mexico
|
2005
|
|
|
Puerto Rico
|
2009
|
|
|
Singapore
|
2011
|
|
|
Switzerland
|
2003
|
|
|
United Kingdom
|
2009
|
|
See Note 15 for additional information regarding the status of current tax audits and proceedings.
12. Retirement Benefit Plans
The Company sponsors various retirement benefit plans, including defined benefit pension plans (pension benefits), post-retirement medical plans (post-retirement benefits), defined contribution savings plans, and termination indemnity plans, covering substantially all U.S. employees and many employees outside the U.S. The expense related to these plans was
$584 million
,
$433 million
, and
$419 million
in fiscal years
2016
,
2015
, and
2014
, respectively.
In the U.S., the Company maintains a qualified pension plan designed to provide guaranteed minimum retirement benefits to all eligible U.S. employees. Pension coverage for non-U.S. employees is provided, to the extent deemed appropriate, through separate plans. In addition, U.S. and Puerto Rico employees are also eligible to receive specified Company paid health care and life insurance benefits through the Company’s post-retirement benefits. In addition to the benefits provided under the qualified pension plan, retirement benefits associated with wages in excess of the IRS allowable limits are provided to certain employees under a non-qualified plan.
As of
April 29, 2016
and
April 24, 2015
, the net underfunded status of the Company’s benefit plans was
$1.4 billion
and
$1.3 billion
, respectively.
109
Defined Benefit Pension Plans
The change in benefit obligation and funded status of the Company’s U.S. and Non-U.S. pension benefits are as follows:
|
|
U.S. Pension Benefits
|
Non-U.S. Pension Benefits
|
|||||||||||||
|
|
Fiscal Year
|
Fiscal Year
|
|||||||||||||
|
(in millions)
|
2016
|
2015
|
2016
|
2015
|
|||||||||||
|
Accumulated benefit obligation at end of year:
|
$
|
2,757
|
|
$
|
2,699
|
|
$
|
1,367
|
|
$
|
1,462
|
|
|||
|
Change in projected benefit obligation:
|
|
|
|
|
|
|
|
|
|||||||
|
Projected benefit obligation at beginning of year
|
$
|
2,956
|
|
$
|
2,203
|
|
$
|
1,647
|
|
$
|
1,031
|
|
|||
|
Service cost
|
120
|
|
104
|
|
81
|
|
60
|
|
|||||||
|
Interest cost
|
122
|
|
105
|
|
31
|
|
33
|
|
|||||||
|
Benefit obligations assumed in Covidien acquisition
|
—
|
|
214
|
|
—
|
|
472
|
|
|||||||
|
Employee contributions
|
—
|
|
—
|
|
16
|
|
16
|
|
|||||||
|
Plan curtailments and settlements
|
(28
|
)
|
—
|
|
(133
|
)
|
(35
|
)
|
|||||||
|
Actuarial (gain) loss
|
(42
|
)
|
391
|
|
(103
|
)
|
354
|
|
|||||||
|
Benefits paid
|
(80
|
)
|
(61
|
)
|
(49
|
)
|
(34
|
)
|
|||||||
|
Currency exchange rate changes and other
|
—
|
|
—
|
|
45
|
|
(250
|
)
|
|||||||
|
Projected benefit obligation at end of year
|
$
|
3,048
|
|
$
|
2,956
|
|
$
|
1,535
|
|
$
|
1,647
|
|
|||
|
Change in plan assets:
|
|
|
|
|
|
|
|
|
|||||||
|
Fair value of plan assets at beginning of year
|
$
|
2,204
|
|
$
|
1,917
|
|
$
|
1,189
|
|
$
|
889
|
|
|||
|
Actual return on plan assets
|
(70
|
)
|
69
|
|
(44
|
)
|
162
|
|
|||||||
|
Plan assets acquired in Covidien acquisition
|
—
|
|
188
|
|
—
|
|
262
|
|
|||||||
|
Employer contributions
|
112
|
|
91
|
|
93
|
|
80
|
|
|||||||
|
Employee contributions
|
—
|
|
—
|
|
16
|
|
16
|
|
|||||||
|
Plan settlements
|
(28
|
)
|
—
|
|
(118
|
)
|
(1
|
)
|
|||||||
|
Benefits paid
|
(80
|
)
|
(61
|
)
|
(49
|
)
|
(34
|
)
|
|||||||
|
Currency exchange rate changes
|
—
|
|
—
|
|
26
|
|
(185
|
)
|
|||||||
|
Fair value of plan assets at end of year
|
$
|
2,138
|
|
$
|
2,204
|
|
$
|
1,113
|
|
$
|
1,189
|
|
|||
|
Funded status at end of year:
|
|
|
|
|
|
|
|
|
|||||||
|
Fair value of plan assets
|
$
|
2,138
|
|
$
|
2,204
|
|
$
|
1,113
|
|
$
|
1,189
|
|
|||
|
Benefit obligations
|
3,048
|
|
2,956
|
|
1,535
|
|
1,647
|
|
|||||||
|
Underfunded status of the plans
|
$
|
(910
|
)
|
$
|
(752
|
)
|
$
|
(422
|
)
|
$
|
(458
|
)
|
|||
|
Recognized liability
|
$
|
(910
|
)
|
$
|
(752
|
)
|
$
|
(422
|
)
|
$
|
(458
|
)
|
|||
|
Amounts recognized on the consolidated
balance sheets consist of:
|
|||||||||||||||
|
Non-current assets
|
$
|
—
|
|
$
|
21
|
|
$
|
20
|
|
$
|
2
|
|
|||
|
Current liabilities
|
(12
|
)
|
(11
|
)
|
(8
|
)
|
(48
|
)
|
|||||||
|
Non-current liabilities
|
(898
|
)
|
(762
|
)
|
(434
|
)
|
(412
|
)
|
|||||||
|
Recognized liability
|
$
|
(910
|
)
|
$
|
(752
|
)
|
$
|
(422
|
)
|
$
|
(458
|
)
|
|||
|
Amounts recognized in accumulated other
comprehensive (loss) income:
|
|||||||||||||||
|
Prior service cost (benefit)
|
$
|
4
|
|
$
|
4
|
|
$
|
(14
|
)
|
$
|
(2
|
)
|
|||
|
Net actuarial loss
|
1,361
|
|
1,253
|
|
359
|
|
372
|
|
|||||||
|
Ending balance
|
$
|
1,365
|
|
$
|
1,257
|
|
$
|
345
|
|
$
|
370
|
|
|||
110
In certain countries outside the U.S., fully funding pension plans is not a common practice, as funding provides no income tax benefit. Consequently, certain pension plans were partially funded as of
April 29, 2016
and
April 24, 2015
. U.S. and non-U.S. plans with accumulated benefit obligations in excess of plan assets consist of the following:
|
|
Fiscal Year
|
||||||
|
(in millions)
|
2016
|
2015
|
|||||
|
Accumulated benefit obligation
|
$
|
3,922
|
|
$
|
3,678
|
|
|
|
Projected benefit obligation
|
4,333
|
|
4,032
|
|
|||
|
Plan assets at fair value
|
2,981
|
|
2,823
|
|
|||
Plans with projected benefit obligations in excess of plan assets consist of the following:
|
|
Fiscal Year
|
||||||
|
(in millions)
|
2016
|
2015
|
|||||
|
Projected benefit obligation
|
$
|
4,362
|
|
$
|
4,319
|
|
|
|
Plan assets at fair value
|
3,009
|
|
3,086
|
|
|||
The net periodic benefit cost of the plans include the following components:
|
|
U.S. Pension Benefits
|
Non-U.S. Pension Benefits
|
|||||||||||||||||||||
|
|
Fiscal Year
|
Fiscal Year
|
|||||||||||||||||||||
|
(in millions)
|
2016
|
2015
|
2014
|
2016
|
2015
|
2014
|
|||||||||||||||||
|
Service cost
|
$
|
120
|
|
$
|
104
|
|
$
|
107
|
|
$
|
81
|
|
$
|
60
|
|
$
|
54
|
|
|||||
|
Interest cost
|
122
|
|
105
|
|
97
|
|
31
|
|
33
|
|
29
|
|
|||||||||||
|
Expected return on plan assets
|
(180
|
)
|
(160
|
)
|
(141
|
)
|
(48
|
)
|
(41
|
)
|
(35
|
)
|
|||||||||||
|
Amortization of prior service cost
|
—
|
|
—
|
|
1
|
|
—
|
|
—
|
|
1
|
|
|||||||||||
|
Amortization of net actuarial loss
|
98
|
|
65
|
|
85
|
|
20
|
|
12
|
|
11
|
|
|||||||||||
|
Settlement gain
|
$
|
(1
|
)
|
$
|
—
|
|
$
|
—
|
|
$
|
(10
|
)
|
$
|
—
|
|
$
|
—
|
|
|||||
|
Net periodic benefit cost
|
$
|
159
|
|
$
|
114
|
|
$
|
149
|
|
$
|
74
|
|
$
|
64
|
|
$
|
60
|
|
|||||
The other changes in plan assets and projected benefit obligations recognized in
accumulated other comprehensive (loss) income
for fiscal year
2016
are as follows:
|
(in millions)
|
U.S. Pension
Benefits
|
Non-U.S.
Pension
Benefits
|
|||||
|
Net actuarial loss (gain)
|
205
|
|
(11
|
)
|
|||
|
Amortization of net actuarial loss
|
(98
|
)
|
(12
|
)
|
|||
|
Prior service cost
|
$
|
—
|
|
$
|
(12
|
)
|
|
|
Effect of exchange rates
|
1
|
|
10
|
|
|||
|
Total loss (gain) recognized in accumulated other comprehensive (loss) income
|
$
|
108
|
|
$
|
(25
|
)
|
|
|
Total loss recognized in net periodic benefit cost and accumulated other comprehensive (loss) income
|
$
|
267
|
|
$
|
49
|
|
|
The estimated net actuarial loss that will be amortized from
accumulated other comprehensive (loss) income
into net periodic benefit cost, before tax, in fiscal year
2017
for U.S. and non-U.S. pension benefits is expected to be
$89 million
and
$17 million
, respectively.
111
The actuarial assumptions are as follows:
|
|
U.S. Pension Benefits
|
Non-U.S. Pension Benefits
|
|||||||||||||||
|
|
Fiscal Year
|
Fiscal Year
|
|||||||||||||||
|
|
2016
|
2015
|
2014
|
2016
|
2015
|
2014
|
|||||||||||
|
Critical assumptions – projected benefit obligation:
|
|
|
|
|
|
|
|
|
|
|
|
|
|||||
|
Discount rate
|
3.60% - 4.30%
|
|
4.20
|
%
|
4.75
|
%
|
0.25% - 10.20%
|
|
1.88
|
%
|
3.32
|
%
|
|||||
|
Rate of compensation increase
|
3.90
|
%
|
3.90
|
%
|
3.90
|
%
|
2.83
|
%
|
2.92
|
%
|
2.80
|
%
|
|||||
|
Critical assumptions – net periodic benefit cost:
|
|
|
|
|
|
|
|
|
|
|
|
|
|||||
|
Discount rate
|
4.20% - 4.80%
|
|
4.75
|
%
|
4.55
|
%
|
0.80% - 9.00%
|
|
3.32
|
%
|
3.52
|
%
|
|||||
|
Expected return on plan assets
|
8.20
|
%
|
8.25
|
%
|
8.25
|
%
|
4.35
|
%
|
4.77
|
%
|
4.76
|
%
|
|||||
|
Rate of compensation increase
|
3.90
|
%
|
3.90
|
%
|
3.90
|
%
|
2.92
|
%
|
2.80
|
%
|
2.78
|
%
|
|||||
The Company changed the methodology used to estimate the service and interest cost components of net periodic pension cost and net periodic postretirement benefit cost for the Company’s pension and other postretirement benefit plans, effective April 30, 2016. Previously, the Company estimated such cost components utilizing a single weighted-average discount rate derived from the market-observed yield curves of high-quality fixed income securities used to measure the pension benefit obligation and accumulated postretirement benefit obligation. The new methodology utilizes a full yield curve approach in the estimation of these cost components by applying the specific spot rates along the yield curve to their underlying projected cash flows and provides a more precise measurement of service and interest costs by improving the correlation between projected cash flows and their corresponding spot rates. The current yield curves represent high quality, long-term fixed income instruments. The change does not affect the measurement of the Company’s pension obligation or accumulated postretirement benefit obligation. The Company has accounted for this change prospectively as a change in accounting estimate.
The expected long-term rate of return on plan assets assumptions are determined using a building block approach, considering historical averages and real returns of each asset class. In certain countries, where historical returns are not meaningful, consideration is given to local market expectations of long-term returns.
Retirement Benefit Plan Investment Strategy
The Company has an account that holds the assets for both the U.S. pension plan and other U.S. post-retirement benefits, primarily retiree medical benefits. For investment purposes, the plans are managed in an identical way, as their objectives are similar.
The Company has a Qualified Plan Committee (the Plan Committee) that sets investment guidelines for U.S. pension plan and other U.S. post-retirement benefits with the assistance of an external consultant. These guidelines are established based on market conditions, risk tolerance, funding requirements, and expected benefit payments. The Plan Committee also oversees the investment allocation process, selects the investment managers, and monitors asset performance. As pension liabilities are long-term in nature, the Company employs a long-term total return approach to maximize the long-term rate of return on plan assets for a prudent level of risk. An annual analysis on the risk versus the return of the investment portfolio is conducted to justify the expected long-term rate of return assumption.
The investment portfolio contains a diversified portfolio of investment categories, including equities, fixed income securities, hedge funds, and private equity. Securities are also diversified in terms of domestic and international securities, short- and long-term securities, growth and value styles, large cap and small cap stocks, active and passive management, and derivative-based styles.
Outside the U.S., pension plan assets are typically managed by decentralized fiduciary committees. There is significant variation in policy asset allocation from country to country. Local regulations, local funding rules, and local financial and tax considerations are part of the funding and investment allocation process in each country.
The Plan did not hold any investments in the Company’s ordinary shares as of
April 29, 2016
or
April 24, 2015
.
112
The Company’s pension plan target allocations at
April 29, 2016
and
April 24, 2015
, by asset category, are as follows:
|
U.S. Plans
|
|||||
|
|
Target Allocation
|
||||
|
|
April 29, 2016
|
April 24, 2015
|
|||
|
Asset Category
|
|
|
|
|
|
|
Equity securities
|
49
|
%
|
49
|
%
|
|
|
Debt securities
|
23
|
|
23
|
|
|
|
Other
|
28
|
|
28
|
|
|
|
Total
|
100
|
%
|
100
|
%
|
|
|
Non-U.S. Plans
|
|
|
|
|
|
|
|
Target Allocation
|
||||
|
|
April 29, 2016
|
April 24, 2015
|
|||
|
Asset Category
|
|
|
|
|
|
|
Equity securities
|
34
|
%
|
35
|
%
|
|
|
Debt securities
|
27
|
|
29
|
|
|
|
Other
|
39
|
|
36
|
|
|
|
Total
|
100
|
%
|
100
|
%
|
|
Retirement Benefit Plan Asset Fair Values
The following is a description of the valuation methodologies used for retirement benefit plan assets measured at fair value.
Short-term investments:
Valued at the closing price reported in the active markets in which the individual security is traded.
U.S. government securities:
Certain U.S. government securities are valued at the closing price reported in the active markets in which the individual security is traded. Other U.S. government securities are valued based on inputs other than quoted prices that are observable.
Corporate debt securities:
Valued based on inputs other than quoted prices that are observable.
Common stock:
Valued at the closing price reported in the active markets in which the individual security is traded.
Equity mutual funds/Commingled trusts:
Valued based on the year-end net asset values of the investment vehicles. The net asset values of the investment vehicles are based on the fair values of the underlying investments of the commingled trusts valued at the closing price reported in the active markets in which the individual security is traded. Certain equity commingled trusts contain underlying investments that are characterized as Level 1 or Level 2 and provide a daily net asset value. The Company classifies these investments as Level 2. Certain equity commingled trusts contain a material amount underlying investments that are characterized as Level 3 and do not have a daily reported net asset value. The Company classifies these investments as Level 3.
Fixed income/Commingled trusts:
Valued based on the year-end net asset values of the investment vehicles. The net asset values of the investment vehicles are based on the fair values of the underlying investments of the commingled trusts valued based on inputs other than quoted prices that are observable. The Company evaluates fixed income commingled trusts to characterize the underlying investments as Level 1, 2, or 3. Certain fixed income commingled trusts contain underlying investments that are characterized as Level 1 or Level 2 and the Company classifies these investments as Level 2. Certain fixed income commingled trusts could contain a material amount underlying investments that are characterized as Level 3 and the Company would classify these investments as Level 3. As of April 29, 2016, no fixed income commingled trusts are classified as Level 3.
Partnership units:
Valued based on the year-end net asset values of the underlying partnerships. The net asset values of the partnerships are based on the fair values of the underlying investments of the partnerships. Quoted market prices are used to value the underlying investments of the partnerships, where the partnerships consist of the investment pools which invest primarily in common stocks. Partnership units include partnerships, private equity investments, and real asset investments. Partnerships primarily include long/short equity and absolute return strategies. These investments can be redeemed monthly with notice periods ranging from
45
to
95
days. As of
April 29, 2016
, there is one absolute return strategy fund totaling
$1 million
that is in the process of liquidation. The Company expects to receive the proceeds over the next
five
years. Private equity investments consist of common
113
stock and debt instruments of private companies. For private equity funds, the sum of the unfunded commitments as of
April 29, 2016
is
$119 million
, and the estimated liquidation period of these funds is expected to be
one
to
15 years
. Real asset investments consist of commodities, derivatives, Real Estate Investment Trusts, and illiquid real estate holdings. These investments have redemption and liquidation periods ranging from
30 days
to
10 years
. Other valuation procedures are utilized to arrive at fair value if a quoted market price is not available for a partnership investment.
Registered investment companies:
Valued at the quoted market prices of shares held by the plan at year-end in the active market on which the individual securities are traded.
Insurance contracts:
Comprised of investments in collective (group) insurance contracts, consisting of individual insurance policies. The policyholder is the employer and each member is the owner/beneficiary of their individual insurance policy. These policies are a part of the insurance company’s general portfolio and participate in the insurer’s profit-sharing policy on an excess yield basis.
The methods described above may produce fair values that may not be indicative of net realizable value or reflective of future fair values. Furthermore, while the Company believes its valuation methodologies are appropriate and consistent with other market participants, the use of different methodologies or assumptions to determine fair value of certain financial instruments could result in a different fair value measurement at the reporting date.
There were no transfers between Level 1, Level 2, or Level 3 during fiscal years
2016
,
2015
, or
2014
.
The following tables provide information by level for the retirement benefit plan assets that are measured at fair value, as defined by U.S. GAAP. See Note 1 for discussion of the fair value measurement terms of Levels 1, 2, and 3.
U.S. Pension Benefits
|
|
Fair Value
as of
|
|
|||||||||||||
|
|
Fair Value Measurements
Using Inputs Considered as
|
||||||||||||||
|
(in millions)
|
April 29, 2016
|
Level 1
|
Level 2
|
Level 3
|
|||||||||||
|
Short-term investments
|
$
|
127
|
|
$
|
127
|
|
$
|
—
|
|
$
|
—
|
|
|||
|
U.S. government securities
|
146
|
|
137
|
|
9
|
|
—
|
|
|||||||
|
Corporate debt securities
|
216
|
|
—
|
|
216
|
|
—
|
|
|||||||
|
Equity mutual funds/commingled trusts
|
956
|
|
—
|
|
763
|
|
193
|
|
|||||||
|
Fixed income mutual funds
|
231
|
|
—
|
|
231
|
|
—
|
|
|||||||
|
Partnership units
|
462
|
|
—
|
|
—
|
|
462
|
|
|||||||
|
|
$
|
2,138
|
|
$
|
264
|
|
$
|
1,219
|
|
$
|
655
|
|
|||
|
|
Fair Value
as of
|
Fair Value Measurements
Using Inputs Considered as
|
|||||||||||||
|
(in millions)
|
April 24, 2015
|
Level 1
|
Level 2
|
Level 3
|
|||||||||||
|
Short-term investments
|
$
|
247
|
|
$
|
247
|
|
$
|
—
|
|
$
|
—
|
|
|||
|
U.S. government securities
|
155
|
|
109
|
|
46
|
|
—
|
|
|||||||
|
Corporate debt securities
|
5
|
|
—
|
|
4
|
|
1
|
|
|||||||
|
Equity commingled trusts
|
951
|
|
—
|
|
751
|
|
200
|
|
|||||||
|
Fixed income commingled trusts
|
374
|
|
—
|
|
374
|
|
—
|
|
|||||||
|
Partnership units
|
472
|
|
—
|
|
—
|
|
472
|
|
|||||||
|
|
$
|
2,204
|
|
$
|
356
|
|
$
|
1,175
|
|
$
|
673
|
|
|||
114
The following tables provide a reconciliation of the beginning and ending balances of U.S. pension benefit assets measured at fair value that used significant unobservable inputs (Level 3):
|
(in millions)
|
Total Level 3 Investments
|
Corporate Debt Securities
|
Commingled Trusts
|
Partnership Units
|
|||||||||||
|
Balance as of April 24, 2015
|
$
|
673
|
|
$
|
1
|
|
$
|
200
|
|
$
|
472
|
|
|||
|
Total realized gains included in income
|
10
|
|
—
|
|
—
|
|
10
|
|
|||||||
|
Total unrealized losses included in accumulated other comprehensive (loss) income
|
(151
|
)
|
(1
|
)
|
(7
|
)
|
(143
|
)
|
|||||||
|
Purchases and sales, net
|
123
|
|
—
|
|
—
|
|
123
|
|
|||||||
|
Balance as of April 29, 2016
|
$
|
655
|
|
$
|
—
|
|
$
|
193
|
|
$
|
462
|
|
|||
|
(in millions)
|
Total Level 3 Investments
|
Corporate Debt Securities
|
Commingled Trusts
|
Partnership Units
|
|||||||||||
|
Balance as of April 25, 2014
|
$
|
959
|
|
$
|
1
|
|
$
|
285
|
|
$
|
673
|
|
|||
|
Total realized gains included in income
|
162
|
|
—
|
|
65
|
|
97
|
|
|||||||
|
Total unrealized gains included in accumulated other comprehensive (loss) income
|
(130
|
)
|
—
|
|
(31
|
)
|
(99
|
)
|
|||||||
|
Purchases and sales, net
|
(318
|
)
|
—
|
|
(119
|
)
|
(199
|
)
|
|||||||
|
Balance as of April 24, 2015
|
$
|
673
|
|
$
|
1
|
|
$
|
200
|
|
$
|
472
|
|
|||
Non-U.S. Pension Benefits
|
|
Fair Value
as of
|
Fair Value Measurements
Using Inputs Considered as
|
|||||||||||||
|
(in millions)
|
April 29, 2016
|
Level 1
|
Level 2
|
Level 3
|
|||||||||||
|
Registered investment companies
|
$
|
1,037
|
|
$
|
—
|
|
$
|
1,037
|
|
$
|
—
|
|
|||
|
Insurance contracts
|
76
|
|
—
|
|
—
|
|
76
|
|
|||||||
|
|
$
|
1,113
|
|
$
|
—
|
|
$
|
1,037
|
|
$
|
76
|
|
|||
|
|
Fair Value
as of
|
Fair Value Measurements
Using Inputs Considered as
|
|||||||||||||
|
(in millions)
|
April 24, 2015
|
Level 1
|
Level 2
|
Level 3
|
|||||||||||
|
Registered investment companies
|
$
|
1,113
|
|
$
|
—
|
|
$
|
1,113
|
|
$
|
—
|
|
|||
|
Insurance contracts
|
60
|
|
—
|
|
—
|
|
60
|
|
|||||||
|
Partnership units
|
16
|
|
—
|
|
—
|
|
16
|
|
|||||||
|
|
$
|
1,189
|
|
$
|
—
|
|
$
|
1,113
|
|
$
|
76
|
|
|||
The following tables provide a reconciliation of the beginning and ending balances of non-U.S. pension benefit assets measured at fair value that used significant unobservable inputs (Level 3):
|
(in millions)
|
Total Level 3 Investments
|
Insurance Contracts
|
Partnership Units
|
||||||||
|
Balance as of April 24, 2015
|
$
|
76
|
|
$
|
60
|
|
$
|
16
|
|
||
|
Total unrealized gains included in accumulated other comprehensive (loss) income
|
—
|
|
—
|
|
—
|
|
|||||
|
Purchases and sales, net
|
(2
|
)
|
14
|
|
(16
|
)
|
|||||
|
Currency exchange rate changes
|
2
|
|
2
|
|
—
|
|
|||||
|
Balance as of April 29, 2016
|
$
|
76
|
|
$
|
76
|
|
$
|
—
|
|
||
115
|
(in millions)
|
Total Level 3 Investments
|
Insurance Contracts
|
Partnership Units
|
||||||||
|
Balance as of April 25, 2014
|
$
|
21
|
|
$
|
11
|
|
$
|
10
|
|
||
|
Total unrealized gains included in accumulated other comprehensive (loss) income
|
1
|
|
(1
|
)
|
2
|
|
|||||
|
Purchases and sales, net
|
63
|
|
56
|
|
7
|
|
|||||
|
Currency exchange rate changes
|
(9
|
)
|
(6
|
)
|
(3
|
)
|
|||||
|
Balance as of April 24, 2015
|
$
|
76
|
|
$
|
60
|
|
$
|
16
|
|
||
Retirement Benefit Plan Funding
It is the Company’s policy to fund retirement costs within the limits of allowable tax deductions. During fiscal year
2016
, the Company made discretionary contributions of approximately
$112 million
to the U.S. pension plan. Internationally, the Company contributed approximately
$93 million
for pension benefits during fiscal year
2016
. The Company anticipates that it will make contributions of
$73 million
to its pension benefits in fiscal
2017
. Based on the guidelines under the U.S. Employee Retirement Income Security Act of 1974 and the various guidelines which govern the plans outside the U.S., the majority of anticipated fiscal year 2015 contributions will be discretionary. The Company believes that, along with pension assets, the returns on invested pension assets, and Company contributions, the Company will be able to meet its pension and other post-retirement obligations in the future.
Retiree benefit payments, which reflect expected future service, are anticipated to be paid as follows:
|
(in millions)
|
U.S. Pension Benefits
|
Non-U.S. Pension Benefits
|
|||||
|
Fiscal Year
|
Gross Payments
|
Gross Payments
|
|||||
|
2017
|
$
|
87
|
|
$
|
39
|
|
|
|
2018
|
96
|
|
40
|
|
|||
|
2019
|
105
|
|
39
|
|
|||
|
2020
|
116
|
|
40
|
|
|||
|
2021
|
126
|
|
43
|
|
|||
|
2022 – 2026
|
810
|
|
265
|
|
|||
|
Total
|
$
|
1,340
|
|
$
|
466
|
|
|
Post-retirement Benefit Plans
The net periodic benefit cost associated with the Company’s post-retirement benefit plans was
$12 million
,
$14 million
, and
$15 million
in fiscal years
2016
,
2015
, and
2014
, respectively. The Company’s projected benefit obligation for all post-retirement benefit plans was
$369 million
and
$352 million
at
April 29, 2016
and
April 24, 2015
, respectively. The Company’s fair value of plan assets for all post-retirement benefit plans was
$269 million
and
$288 million
at
April 29, 2016
and
April 24, 2015
, respectively. The activity during fiscal
2016
and
2015
related to both the change in projected benefit obligations and the fair value of plan assets was not material.
Defined Contribution Savings Plans
The Company has defined contribution savings plans that cover substantially all U.S. employees and certain non-U.S. employees. The general purpose of these plans is to provide additional financial security during retirement by providing employees with an incentive to make regular savings. Company contributions to the plans are based on employee contributions and Company performance and since fiscal year 2006, the entire match has been made in cash. Expense under these plans was
$269 million
,
$188 million
, and
$145 million
in fiscal years
2016
,
2015
, and
2014
, respectively.
Effective May 1, 2005, the Company froze participation in the original defined benefit pension plan in the U.S. and implemented
two
new plans including an additional defined benefit pension plan and a new defined contribution pension plan, respectively: the Personal Pension Account (PPA) and the Personal Investment Account (PIA). Employees in the U.S. hired on or after May 1, 2005 have the option to participate in either the PPA or the PIA. Participants in the PPA receive an annual allocation of their salary and bonus on which they will receive an annual guaranteed rate of return which is based on the
ten
-year Treasury bond rate. Participants in the PIA also receive an annual allocation of their salary and bonus; however, they are allowed to determine how to invest their funds among identified fund alternatives. The cost associated with the PPA is included in U.S. Pension Benefits in the tables presented earlier. The defined contribution cost associated with the PIA was approximately
$58 million
,
$53 million
, and
$50 million
in fiscal years
2016
,
2015
, and
2014
, respectively.
116
Effective January 1, 2016, the Company froze participation in the existing defined benefit (PPA) and contribution (PIA) pension plans in the U.S. and implemented a new form of benefit under the existing defined contribution plan for legacy Covidien employees and employees in the U.S. hired on or after January 1, 2016. Participants in the Medtronic Core Contribution (MCC) also receive an annual allocation of their salary and bonus and are allowed to determine how to invest their funds among identified fund alternatives. The cost associated with the MCC is included in U.S. Pension Benefits in the tables presented earlier. The defined contribution cost associated with the MCC was approximately $
12 million
in fiscal year
2016
.
13. Leases
The Company leases office, manufacturing, and research facilities and warehouses, as well as transportation, data processing, and other equipment under capital and operating leases. A substantial number of these leases contain options that allow the Company to renew at the fair rental value on the date of renewal.
Future minimum payments under capitalized leases and non-cancelable operating leases at
April 29, 2016
are:
|
(in millions)
Fiscal Year
|
Capitalized
Leases
|
Operating
Leases
|
|||||
|
2017
|
$
|
109
|
|
$
|
180
|
|
|
|
2018
|
5
|
|
130
|
|
|||
|
2019
|
4
|
|
90
|
|
|||
|
2020
|
4
|
|
56
|
|
|||
|
2021
|
3
|
|
33
|
|
|||
|
Thereafter
|
16
|
|
55
|
|
|||
|
Total minimum lease payments
|
$
|
141
|
|
$
|
544
|
|
|
|
Less amounts representing interest
|
(9
|
)
|
N/A
|
|
|||
|
Present value of net minimum lease payments
|
$
|
132
|
|
N/A
|
|
||
Rent expense for all operating leases was
$269 million
,
$195 million
, and
$150 million
in fiscal years
2016
,
2015
, and
2014
, respectively. The increase in fiscal year 2016 rent expense is primarily related to the Covidien acquisition.
117
14. Accumulated Other Comprehensive (Loss) Income
Changes in accumulated other comprehensive (loss) income by component are as follows:
|
(in millions)
|
Unrealized Gain (Loss) on Available-for-Sale Securities
|
Cumulative Translation Adjustments
(1)
|
Net Change in Retirement Obligations
|
Unrealized Gain (Loss) on Derivatives
|
Total Accumulated Other Comprehensive (Loss) Income
|
||||||||||||||
|
Balance as of April 25, 2014, net of tax
|
$
|
(6
|
)
|
$
|
218
|
|
$
|
(765
|
)
|
$
|
(44
|
)
|
$
|
(597
|
)
|
||||
|
Other comprehensive income (loss) before reclassifications, before tax
|
169
|
|
(495
|
)
|
(617
|
)
|
545
|
|
(398
|
)
|
|||||||||
|
Tax (expense) benefit
|
(60
|
)
|
—
|
|
198
|
|
(199
|
)
|
(61
|
)
|
|||||||||
|
Other comprehensive income (loss) before reclassifications, net of tax
|
109
|
|
(495
|
)
|
(419
|
)
|
346
|
|
(459
|
)
|
|||||||||
|
Reclassifications, before tax
|
(138
|
)
|
—
|
|
78
|
|
(145
|
)
|
(205
|
)
|
|||||||||
|
Tax benefit (expense)
|
49
|
|
—
|
|
(25
|
)
|
53
|
|
77
|
|
|||||||||
|
Reclassifications, net of tax
|
(89
|
)
|
(2)
|
—
|
|
53
|
|
(3)
|
(92
|
)
|
(4)
|
(128
|
)
|
||||||
|
Other comprehensive income (loss), net of tax
|
20
|
|
(495
|
)
|
(366
|
)
|
254
|
|
(587
|
)
|
|||||||||
|
Balance as of April 24, 2015, net of tax
|
14
|
|
(277
|
)
|
(1,131
|
)
|
210
|
|
(1,184
|
)
|
|||||||||
|
Other comprehensive loss before reclassifications, before tax
|
(201
|
)
|
(197
|
)
|
(226
|
)
|
(145
|
)
|
(769
|
)
|
|||||||||
|
Tax benefit
|
94
|
|
—
|
|
85
|
|
51
|
|
230
|
|
|||||||||
|
Other comprehensive loss before reclassifications, net of tax
|
(107
|
)
|
(197
|
)
|
(141
|
)
|
(94
|
)
|
(539
|
)
|
|||||||||
|
Reclassifications, before tax
|
(22
|
)
|
—
|
|
114
|
|
(327
|
)
|
(235
|
)
|
|||||||||
|
Tax benefit (expense)
|
8
|
|
—
|
|
(39
|
)
|
121
|
|
90
|
|
|||||||||
|
Reclassifications, net of tax
|
(14
|
)
|
(2)
|
—
|
|
75
|
|
(3)
|
(206
|
)
|
(4)
|
(145
|
)
|
||||||
|
Other comprehensive loss, net of tax
|
(121
|
)
|
(197
|
)
|
(66
|
)
|
(300
|
)
|
(684
|
)
|
|||||||||
|
Balance as of April 29, 2016, net of tax
|
$
|
(107
|
)
|
$
|
(474
|
)
|
$
|
(1,197
|
)
|
$
|
(90
|
)
|
$
|
(1,868
|
)
|
||||
|
(1)
|
Taxes are not provided on cumulative translation adjustments as substantially all translation adjustments relate to earnings that are intended to be indefinitely reinvested outside the U.S.
|
|
(2)
|
Represents net realized losses on sales of available-for-sale securities that were reclassified from AOCI to
other expense, net
(see Note 5).
|
|
(3)
|
Includes net amortization of prior service costs and actuarial losses included in net periodic benefit cost (see Note 12).
|
|
(4)
|
Relates to cash flow hedges that were reclassified from AOCI to
other expense, net
or
cost of products sold
and forward starting interest rate derivative instruments that were reclassified from AOCI to
interest expense, net
(see Note 8).
|
15. Commitments and Contingencies
The Company and its affiliates are involved in a number of legal actions involving product liability, intellectual property disputes, shareholder related matters, environmental proceedings, income tax disputes, governmental proceedings and investigations in the United States and around the world, and other matters, including those described below. With respect to governmental proceedings and investigations our standard practice is to cooperate with regulators and investigators in responding to inquiries. The outcomes of these legal actions are not within the Company’s complete control and may not be known for prolonged periods of time. In some actions, the enforcement agencies or private claimants seek damages, as well as other relief (including injunctions barring the sale of products that are the subject of the proceeding), that could require significant expenditures or result in lost revenues. The Company records a liability in the consolidated financial statements for loss contingencies related to legal actions when a loss is known or considered probable and the amount can be reasonably estimated. If the reasonable estimate of a known or probable loss is a range, and no amount within the range is a better estimate than any other, the minimum amount of the range is accrued. If a loss is reasonably possible but not known or probable, and can be reasonably estimated, the estimated loss or range of loss is disclosed. When determining the estimated loss or range of loss, significant judgment is required. Estimates of probable losses resulting from litigation and governmental proceedings involving the Company are inherently difficult to predict, particularly
118
when the matters are in early procedural stages, with incomplete scientific facts or legal discovery, involve unsubstantiated or indeterminate claims for damages, potentially involve penalties, fines or punitive damages, or could result in a change in business practice. As of April 29, 2016 and April 24, 2015, accrued certain litigation charges were approximately
$1.0 billion
and
$879 million
, respectively. The ultimate cost to the Company with respect to accrued certain litigation charges could be materially different than the amount of the current estimates and accruals and could have a material adverse impact on the Company’s consolidated earnings, financial position, or cash flows. The Company includes accrued certain litigation charges in
other accrued expenses
and
other long-term liabilities
on the consolidated balance sheets.
In addition to litigation contingencies, the Company also has certain guarantee obligations that may potentially result in future costs. While it is not possible to predict the outcome for most of the matters discussed below, the Company believes it is possible that costs associated with them could have a material adverse impact on the Company’s consolidated earnings, financial position, or cash flows.
Product Liability Matters
Sprint Fidelis
In 2007, a putative class action was filed in the Ontario Superior Court of Justice in Canada seeking damages for personal injuries allegedly related to the Company's Sprint Fidelis family of defibrillation leads. On October 20, 2009, the court certified a class proceeding but denied class certification on plaintiffs' claim for punitive damages. Pretrial proceedings are underway. The Company has not recorded an expense related to damages in connection with this matter because any potential loss is not currently probable or reasonably estimable under U.S. GAAP. Additionally, the Company cannot reasonably estimate the range of loss, if any, that may result from this matter.
INFUSE Litigation
The Company estimates law firms representing approximately
6,000
claimants have asserted or intend to assert personal injury claims against Medtronic in the U.S. state and federal courts involving the INFUSE bone graft product. As of June 1, 2016, the Company has reached agreements to settle approximately
3,900
of these claims. The Company recorded an additional expense of
$26 million
in the second quarter of fiscal year 2016 related to probable and reasonably estimable damages in connection with this matter. The Company's accrued expenses for this matter are included within accrued certain litigation charges in
other accrued expenses
and
other long-term liabilities
on the consolidated balance sheets as discussed above.
Other INFUSE Litigation
On June 5, 2014, Humana, Inc. filed a lawsuit for unspecified monetary damages in the U.S. District Court for the Western District of Tennessee, alleging that Medtronic, Inc. violated federal racketeering (RICO) law and various state laws, by conspiring with physicians to promote unapproved uses of INFUSE. In September of 2015 the Court granted Medtronic’s motion to dismiss the primary allegations, including the RICO claims, in Humana’s complaint. In April of 2016 the Court denied Humana’s motion to file an amended complaint. The Company has not recorded an expense related to damages in connection with this matter because any potential loss is not currently probable or reasonably estimable under U.S. GAAP. Additionally, the Company cannot reasonably estimate the range of loss, if any, that may result from this matter.
Pelvic Mesh Litigation
The Company, through the acquisition of Covidien, is currently involved in litigation in various state and federal courts against manufacturers of pelvic mesh products alleging personal injuries resulting from the implantation of those products. Two subsidiaries of Covidien supplied pelvic mesh products to one of the manufacturers, C.R. Bard (Bard), named in the litigation. The litigation includes a federal multi-district litigation in the U.S. District Court for the Northern District of West Virginia and cases in various state courts and jurisdictions outside the U.S. Generally, complaints allege design and manufacturing claims, failure to warn, breach of warranty, fraud, violations of state consumer protection laws and loss of consortium claims. In July 2015, the Company and Bard agreed that Bard would pay the Company
$121 million
towards the settlement of
11,000
of these claims. The
$121 million
settlement was recorded as an opening balance sheet adjustment related to the Covidien acquisition in the first quarter of fiscal year 2016. That agreement does not resolve the dispute between the Company and Bard with respect to claims that do not settle, if any. As part of the agreement, the Company and Bard agreed to dismiss without prejudice their pending litigation with respect to Bard’s obligation to defend and indemnify the Company. The Company estimates law firms representing approximately
15,800
claimants have asserted or may assert claims involving products manufactured by Covidien’s subsidiaries. As of June 1, 2016, the Company has reached agreements to settle approximately
6,200
of these claims. The Company's accrued expenses for this matter
119
are included within accrued certain litigation charges in
other accrued expenses
and
other long-term liabilities
on the consolidated balance sheets as discussed above.
Patent Litigation
Ethicon
On December 14, 2011, Ethicon filed an action against Covidien in the U.S. District Court for the Southern District of Ohio, alleging patent infringement and seeking monetary damages and injunctive relief. On January 22, 2014, the district court entered summary judgment in Covidien's favor, and the majority of this ruling was affirmed by the Federal Circuit on August 7, 2015. Following appeal, the case was remanded back to the District Court with respect to
one
patent. On January 21, 2016, Covidien filed a second action in the U.S. District Court for the Southern District of Ohio, seeking a declaration of non-infringement with respect to a second set of patents held by Ethicon. The court consolidated this second action with the remaining patent issues from the first action. In addition to claims of non-infringement, the Company asserts affirmative defenses of invalidity for each of the patents-in-suit. The case is currently in the early stages of fact discovery. The Company has not recorded an expense related to damages in connection with this matter because any potential loss is not currently probable or reasonably estimable under U.S. GAAP. Additionally, the Company cannot reasonably estimate the range of loss, if any, that may result from this matter.
Shareholder Related Matters
INFUSE
On March 12, 2012, Charlotte Kokocinski (Kokocinski) filed a shareholder derivative action against both Medtronic, Inc. and certain of its current and former officers and directors in the U.S. District Court for the District of Minnesota, setting forth certain allegations, including a claim that defendants violated various purported duties in connection with the INFUSE bone graft product and otherwise. On March 25, 2013, the Court dismissed the case without prejudice, and Kokocinski subsequently filed an amended complaint. On March 30, 2015, the Court granted defendants’ motion to dismiss the amended complaint, dismissing the case with prejudice. Kokocinski sought reconsideration of that decision, and, on September 30, 2015, the Court denied Kokocinski’s request for reconsideration. Kokocinski has appealed the Court’s decision to the U.S. Court of Appeals for the Eighth Circuit.
West Virginia Pipe Trades and Phil Pace, on June 27, 2013 and July 3, 2013, respectively, filed putative class action complaints against Medtronic, Inc. and certain of its officers in the U.S. District Court for the District of Minnesota, alleging that the defendants made false and misleading public statements regarding the INFUSE Bone Graft product during the period of December 8, 2010 through August 3, 2011. The matters were consolidated in September, 2013, and in the consolidated complaint plaintiffs alleged a class period of September 28, 2010 through August 3, 2011. On September 30, 2015, the Court granted defendants’ motion for summary judgment in the consolidated matters. Plaintiffs have appealed the dismissal to the U.S. Court of Appeals for the Eighth Circuit.
Shareholder Related Matters Resulting from the Covidien Acquisition
On July 2, 2014, Lewis Merenstein filed a putative shareholder class action in Hennepin County, Minnesota, District Court seeking to enjoin the then-potential acquisition of Covidien. The lawsuit named Medtronic, Inc., Covidien, and each member of the Medtronic, Inc. Board of Directors at the time as defendants, and alleged that the directors breached their fiduciary duties to shareholders with regard to the then-potential acquisition. On August 21, 2014, Kenneth Steiner filed a putative shareholder class action in Hennepin County, Minnesota, District Court, also seeking an injunction to prevent the potential Covidien acquisition. In September 2014, the
Merenstei
n and
Steiner
matters were consolidated and in December 2014, the plaintiffs filed a preliminary injunction motion seeking to enjoin the Covidien transaction. On December 30, 2014, a hearing was held on plaintiffs’ motion for preliminary injunction and on defendants’ motion to dismiss. On January 2, 2015, the District Court denied the plaintiffs’ motion for preliminary injunction and on January 5, 2015 issued its opinion. On March 20, 2015, the District Court issued its order and opinion granting Medtronic’s motion to dismiss the case. In May of 2015, the plaintiffs filed an appeal, and, in January of 2016, the Minnesota State Court of Appeals affirmed in part, reversed in part, and remanded the case to the District Court for further proceedings. In February of 2016, the Company petitioned the Minnesota Supreme Court to review the decision of the Minnesota State Court of Appeals, and on April 19, 2016 the Minnesota Supreme Court granted the Company’s petition on the issue of whether most of the original claims are properly characterized as direct or derivative under Minnesota law. A decision from the Minnesota Supreme Court is expected in calendar year 2017.
The Company has not recorded an expense related to damages in connection with the shareholder related matters, because any potential loss is not currently probable or reasonably estimable under U.S. GAAP. Additionally, the Company cannot reasonably estimate the range of loss, if any, that may result from these matters.
120
Environmental Proceedings
The Company, through the acquisition of Covidien, is involved in various stages of investigation and cleanup related to environmental remediation matters at a number of sites. These projects relate to a variety of activities, including removal of solvents, metals and other hazardous substances from soil and groundwater. The ultimate cost of site cleanup and timing of future cash flows is difficult to predict given uncertainties regarding the extent of the required cleanup, the interpretation of applicable laws and regulations, and alternative cleanup methods.
The Company is a successor to a company which owned and operated a chemical manufacturing facility in Orrington, Maine from 1967 until 1982, and is responsible for the costs of completing an environmental site investigation as required by the Maine Department of Environmental Protection (MDEP). MDEP served a compliance order on Mallinckrodt LLC and U.S. Surgical Corporation in December 2008. The compliance order included a directive to remove a significant volume of soils at the site. On December 19, 2008, Covidien filed an appeal with the Maine Board of Environmental Protection (Maine Board) to challenge the terms of the compliance order. A hearing before the Maine Board began on January 25, 2010 and concluded on February 4, 2010. On August 19, 2010, the Maine Board modified the MDEP order and issued a final order requiring removal of
two
landfills, capping of the remaining
three
landfills, installation of a groundwater extraction system and long-term monitoring of the site and the
three
remaining landfills.
On April 3, 2014, the Maine Supreme Judicial Court affirmed the Maine Board’s compliance order. The Company has proceeded with implementation of the investigation and remediation at the site in accordance with the MDEP order as modified by the Maine Board order.
The Company has also been involved in a lawsuit filed in the U.S. District Court for the District of Maine by the Natural Resources Defense Council and the Maine People’s Alliance. Plaintiffs sought an injunction requiring Covidien to conduct extensive studies of mercury contamination of the Penobscot River and Bay and options for remediating such contamination, and to perform appropriate remedial activities, if necessary.
On July 29, 2002, following a March 2002 trial, the District Court entered an opinion and order which held that conditions in the Penobscot River and Bay may pose an imminent and substantial endangerment and that Covidien was liable for the cost of performing a study of the river and bay. The District Court subsequently appointed an independent study panel to oversee the study and ordered Covidien to pay costs associated with the study. A report issued by the study panel contains recommendations for a variety of potential remedial options which could be implemented individually or in a variety of combinations, and included preliminary cost estimates for a variety of potential remedial options, which the report describes as “very rough estimates of cost,” ranging from
$25 million
to
$235 million
. The report indicates that these costs are subject to uncertainties, and that before any remedial option is implemented, further engineering studies and engineering design work are necessary to determine the feasibility of the proposed remedial options. In June of 2014, a trial was held to determine if remediation was necessary and feasible, and on September 2, 2015, the District Court issued an order concluding that further engineering study and engineering design work is appropriate to determine the nature and extent of remediation in the Penobscot River and Bay. In January of 2016, the Court appointed an engineering firm to conduct the next phase of the study. The study is targeted for completion late 2017.
The Company's accrued expenses for environmental proceedings are included within accrued certain litigation charges in
other accrued expenses
and
other long-term liabilities
on the consolidated balance sheets as discussed above.
Government Matters
Medtronic has received subpoenas or document requests from the Attorneys General in Massachusetts, California, Oregon, Illinois, and Washington seeking information regarding sales, marketing, clinical, and other information relating to the INFUSE bone graft product. The Company has not recorded an expense related to damages in connection with these matters, because any potential loss is not currently probable or reasonably estimable under U.S. GAAP. Additionally, the Company cannot reasonably estimate the range of loss, if any, that may result from these matters.
On May 2, 2011, the U.S. Attorney’s Office for the District of Massachusetts issued a subpoena to ev3, a subsidiary of the Company, requesting production of documents relating to sales and marketing and other issues in connection with several neurovascular products. The matters under investigation relate to activities prior to Covidien's acquisition of ev3 in 2010. ev3 complied as required with the subpoena and cooperated with the investigation. In the third quarter of fiscal year 2016, the Company accrued expenses in connection with this matter, which are included within accrued certain litigation charges in
other accrued expenses
and
other long-term liabilities
on the consolidated balance sheets as discussed above.
121
On September 2, 2014, the U.S. Department of Health and Human Services, Office of Inspector General and the U.S. Attorney’s Office for the Northern District of California, issued a subpoena requesting production of documents relating to sales and marketing practices associated with certain of ev3’s peripheral vascular products. The Company has not recorded an expense related to damages in connection with this matter, because any potential loss is not currently probable or reasonably estimable under U.S. GAAP. Additionally, the Company cannot reasonably estimate the range of loss, if any, that may result from this matter.
Income Taxes
In March 2009, the U.S. Internal Revenue Service (IRS) issued its audit report on Medtronic, Inc. for fiscal years 2005 and 2006. Medtronic, Inc. reached agreement with the IRS on some, but not all matters related to these fiscal years. On December 23, 2010, the IRS issued a statutory notice of deficiency with respect to the remaining issues. Medtronic, Inc. filed a petition with the U.S. Tax Court on March 21, 2011 objecting to the deficiency. During October and November 2012, Medtronic, Inc. reached resolution with the IRS on various matters, including the deductibility of a settlement payment. Medtronic, Inc. and the IRS agreed to hold one issue, the calculation of amounts eligible for the one-time repatriation holiday, because such specific issue was being addressed by other taxpayers in litigation with the IRS. The remaining unresolved issue for fiscal years 2005 and 2006 relates to the allocation of income between Medtronic, Inc. and its wholly-owned subsidiary operating in Puerto Rico, which is one of the Company's key manufacturing sites. The U.S. Tax Court proceeding with respect to this issue began on February 3, 2015 and ended on March 12, 2015. The U.S. Tax Court issued its opinion on June 9, 2016. Please see Note 18 for additional information regarding this subsequent event.
In October 2011, the IRS issued its audit report on Medtronic, Inc. for fiscal years 2007 and 2008. Medtronic, Inc. reached agreement with the IRS on some but not all matters related to these fiscal years. During the first quarter of fiscal year 2016, the Company finalized its agreement with the IRS on the proposed adjustments associated with the tax effects of the Company's acquisition of Kyphon Inc. (Kyphon). The settlement was consistent with the certain tax adjustment recorded during the fourth quarter of fiscal year 2015. The significant issues that remain unresolved for these tax years relate to the allocation of income between Medtronic, Inc. and its wholly-owned subsidiary operating in Puerto Rico.
In April 2014, the IRS issued its audit report on Medtronic, Inc. for fiscal years 2009, 2010, and 2011. Medtronic, Inc. reached agreement with the IRS on some but not all matters related to these fiscal years. The significant issues that remain unresolved relate to the allocation of income between Medtronic, Inc. and its wholly-owned subsidiary operating in Puerto Rico, and proposed adjustments associated with the tax effects of its acquisition structures for Ardian, CoreValve, Inc., and Ablation Frontiers, Inc. The Company disagrees with the IRS and will attempt to resolve these matters at the IRS Appellate level, however, it will proceed through litigation, if necessary. The IRS continues to audit Medtronic, Inc.'s U.S. federal income tax returns for the fiscal years 2012 through 2014.
Covidien and the IRS have concluded and reached agreement on its audit of Covidien’s U.S. federal income tax returns for the 2008 and 2009 tax years. The IRS continues to audit Covidien’s U.S. federal income tax returns for the years 2010 through 2012. Open periods for examination also include certain periods during which Covidien was a subsidiary of Tyco International plc (Tyco International). The resolution of these matters is subject to the conditions set forth in the Tyco tax sharing agreement (Tax Sharing Agreement). Tyco International has the right to administer, control and settle all U.S. income tax audits for periods prior to the 2007 separation.
The IRS has concluded its field examination of certain of Tyco International’s U.S. federal income tax returns for the years 1997 through 2000 and proposed tax adjustments, several of which also affect Covidien’s income tax returns for certain years after 2000. Tyco International has appealed certain of the tax adjustments proposed by the IRS and has resolved all but one of the matters associated with the proposed tax adjustments. The IRS has asserted that substantially all of Tyco International’s intercompany debt originating during the years 1997 through 2000 should not be treated as debt for U.S. federal income tax purposes, and has disallowed interest deductions related to the intercompany debt and certain tax attribute adjustments recognized on Tyco International’s U.S. income tax returns. The Company disagrees with the IRS’s proposed adjustments and, on July 22, 2013, Tyco International filed a petition with the U.S. Tax Court contesting the IRS assessment. On January 15, 2016, Tyco International, as the audit managing party under the Tax Sharing Agreement, entered into Stipulations of Settled Issues with the IRS intended to resolve all disputes related to the intercompany debt issues for the tax sharing participants for the 1997 - 2000 audit cycle, currently before the U.S. Tax Court. The Stipulations of Settled Issues are contingent upon the IRS Appeals Division applying the same settlement to all intercompany debt issues on appeal for subsequent audit cycles (2001 - 2007) and the approval of the U.S. Congress Joint Committee on Taxation, if required. If finalized, the tentative resolution would cover all aspects of the controversy before the U.S. Tax Court and the Appeals Division of the IRS. During the fourth quarter of fiscal 2016, the Company paid
$10 million
to the IRS related to the settlement. In addition, the Company paid
$183 million
to TE Connectivity Ltd. and received
$2 million
from Tyco International plc, representing its estimated share of the total amount payable to or receivable from the other Tax Sharing
122
Participants in connection with this matter. The resolutions with the U.S. Tax Court and IRS Appeals were finalized during May 2016. Please see Note 18 regarding this subsequent event for additional information.
See Note 11 for additional discussion of income taxes.
Guarantees
As a result of the acquisition of Covidien, the Company has guarantee commitments and indemnifications with Tyco International, TE Connectivity, and Mallinckrodt plc (Mallinckrodt) which relate to certain contingent tax liabilities.
On June 29, 2007, Covidien entered into the Tax Sharing Agreement, under which Covidien shares responsibility for certain of its, Tyco International’s and TE Connectivity’s income tax liabilities for periods prior to Covidien’s 2007 separation from Tyco International (2007 separation). Covidien, Tyco International and TE Connectivity share
42
percent,
27
percent, and
31
percent, respectively, of U.S. income tax liabilities that arise from adjustments made by tax authorities to Covidien's, Tyco International’s and TE Connectivity’s U.S. income tax returns, certain income tax liabilities arising from adjustments made by tax authorities to intercompany transactions or similar adjustments, and certain taxes attributable to internal transactions undertaken in anticipation of the 2007 separation. If Tyco International and TE Connectivity default on their obligations to Covidien under the Tax Sharing Agreement, the Company would be liable for the entire amount of these liabilities. All costs and expenses associated with the management of these tax liabilities are being shared equally among the parties.
In connection with the 2007 separation, all tax liabilities associated with Covidien business became Covidien’s tax liabilities. Following Covidien’s spin-off of its Pharmaceuticals business to Covidien shareholders through a distribution of all the outstanding ordinary shares of Mallinkrodt (2013 separation), Mallinckrodt became the primary obligor to the taxing authorities for the tax liabilities attributable to its subsidiaries, a significant portion of which relate to periods prior to the 2007 separation. However, Covidien remains the sole party subject to the Tax Sharing Agreement. Accordingly, Mallinckrodt does not share in Covidien’s liability to Tyco International and TE Connectivity, nor in the receivable that Covidien has from Tyco International and TE Connectivity.
If any party to the Tax Sharing Agreement were to default in its obligation to another party to pay its share of the distribution taxes that arise as a result of no party’s fault, each non-defaulting party would be required to pay, equally with any other non-defaulting party, the amounts in default. In addition, if another party to the Tax Sharing Agreement that is responsible for all or a portion of an income tax liability were to default in its payment of such liability to a taxing authority, the Company could be legally liable under applicable tax law for such liabilities and be required to make additional tax payments. Accordingly, under certain circumstances, the Company may be obligated to pay amounts in excess of the Company’s agreed upon share of Covidien's, Tyco International’s and TE Connectivity’s tax liabilities.
The Company has used available information to develop its best estimates for certain assets and liabilities related to periods prior to the 2007 separation, including amounts subject to or impacted by the provisions of the Tax Sharing Agreement. The actual amounts that the Company may be required to ultimately accrue or pay under the Tax Sharing Agreement, however, could vary depending upon the outcome of the unresolved tax matters. Final determination of the balances will be made in subsequent periods, primarily related to certain pre-2007 separation tax liabilities and tax years open for examination. These balances will also be impacted by the filing of final or amended income tax returns in certain jurisdictions where those returns include a combination of Tyco International, Covidien and/or TE Connectivity legal entities for periods prior to the 2007 separation. The resolutions with the U.S. Tax Court and IRS Appeals were finalized during May 2016. Please see Note 18 regarding this subsequent event for additional information.
In conjunction with the 2013 separation, Mallinckrodt assumed the tax liabilities that are attributable to its subsidiaries, and Covidien indemnified Mallinckrodt to the extent that such tax liabilities arising from periods prior to 2013 exceed
$200 million
, net of certain tax benefits realized. In addition, in connection with the 2013 separation, Covidien entered into certain other guarantee commitments and indemnifications with Mallinckrodt.
Except as described above in this note or for certain income tax related matters, the Company has not recorded an expense related to losses in connection with these matters because any potential loss is not currently probable or reasonably estimable under U.S. GAAP. Additionally, the Company cannot reasonably estimate the range of loss, if any, that may result from these matters.
In the normal course of business, the Company and/or its affiliates periodically enter into agreements that require one or more of them to indemnify customers or suppliers for specific risks, such as claims for injury or property damage arising out of the Company or its affiliates’ products or the negligence of any of their personnel or claims alleging that any of their products infringe third-party patents or other intellectual property. The Company’s maximum exposure under these indemnification provisions cannot be
123
estimated, and the Company has not accrued any liabilities within the consolidated financial statements. Historically, the Company has not experienced significant losses on these types of indemnifications.
16. Quarterly Financial Data (unaudited)
|
(in millions, except per share data)
|
|
First Quarter
|
Second Quarter
|
Third Quarter
|
Fourth Quarter
|
Fiscal Year
|
|||||||||||||||
|
Net Sales
|
|
|
|
|
|
|
|
|
|
|
|
||||||||||
|
|
2016
|
$
|
7,274
|
|
$
|
7,058
|
|
$
|
6,934
|
|
$
|
7,567
|
|
$
|
28,833
|
|
|||||
|
|
2015
|
4,273
|
|
4,366
|
|
4,318
|
|
7,304
|
|
20,261
|
|
||||||||||
|
Gross Profit
|
|
|
|
|
|
|
|
|
|
|
|
||||||||||
|
|
2016
|
$
|
4,818
|
|
$
|
4,876
|
|
$
|
4,793
|
|
$
|
5,204
|
|
$
|
19,691
|
|
|||||
|
|
2015
|
3,168
|
|
3,224
|
|
3,190
|
|
4,370
|
|
13,952
|
|
||||||||||
|
Net Income (Loss)
|
|||||||||||||||||||||
|
|
2016
|
$
|
820
|
|
$
|
520
|
|
$
|
1,095
|
|
$
|
1,104
|
|
$
|
3,538
|
|
|||||
|
|
2015
|
871
|
|
828
|
|
977
|
|
(1
|
)
|
2,675
|
|
||||||||||
|
Basic Earnings per Share
|
|
|
|
|
|
|
|
|
|
|
|
||||||||||
|
|
2016
|
$
|
0.58
|
|
$
|
0.37
|
|
$
|
0.78
|
|
$
|
0.79
|
|
2.51
|
|
||||||
|
|
2015
|
0.88
|
|
0.84
|
|
0.99
|
|
—
|
|
2.44
|
|
||||||||||
|
Diluted Earnings per Share
|
|
|
|
|
|
|
|
|
|
|
|
||||||||||
|
|
2016
|
$
|
0.57
|
|
$
|
0.36
|
|
$
|
0.77
|
|
$
|
0.78
|
|
2.48
|
|
||||||
|
|
2015
|
0.87
|
|
0.83
|
|
0.98
|
|
—
|
|
2.41
|
|
||||||||||
The data in the schedule above has been intentionally rounded to the nearest million, and therefore, the quarterly amounts may not sum to the fiscal year-to-date amounts.
17. Segment and Geographic Information
The Company’s management evaluates performance and allocates resources based on profit and loss from operations before income taxes and interest expense, net, not including the impact of inventory step-up, the impact of product technology upgrade commitment, special (gains) charges, net, restructuring charges, net, certain litigation charges, net, acquisition-related items, and certain tax adjustments. The accounting policies of the reportable segments are the same as those described in the summary of significant accounting policies in Note 1.
In the fourth quarter of fiscal year 2015, the Company amended the way in which management evaluates performance and allocates resources due to the Covidien acquisition. As a result, the Company began to operate under
four
reportable segments and
four
operating segments. This change had no impact on the Company’s consolidated results for prior periods presented.
The Company’s Cardiac and Vascular Group consists of
three
divisions: Cardiac Rhythm & Heart Failure, Coronary & Structural Heart, and Aortic & Peripheral Vascular. The primary products sold by this operating segment include products for cardiac rhythm disorders and cardiovascular disease, as well as services to diagnose, treat, and manage heart and vascular-related disorders and diseases. The products produced by this operating segment require highly-skilled, technical manufacturing processes and are distributed through direct sales representatives in the U.S. and through direct sales representatives and indirect distributors outside of the U.S. Further, the primary customers of this operating segment are surgeons and specialists and the regulatory approval process for the Cardiac and Vascular Group is similar across all components. The Company’s Minimally Invasive Therapies Group consists of
two
divisions: Surgical Solutions and Patient Monitoring & Recovery. The primary products sold by this operating segment include those which enhance patient outcomes through minimally invasive solutions. These products include those for advanced and general surgical care and patient monitoring, nursing and patient care, and airway and ventilation. Further, the regulatory approval process for the Minimally Invasive Therapies Group is similar across all components. The Company’s Restorative Therapies Group consists of
four
divisions: Spine, Neuromodulation, Surgical Technologies, and Neurovascular. The primary customers of this operating segment include spinal surgeons, neurosurgeons, and pain specialists. The products sold by this operating segment are distributed through direct sales representatives in the U.S. and through direct sales representatives and indirect distributors outside of the U.S. Further, the regulatory approval process for the Restorative Therapies Group is similar
124
across all components. The primary products sold by the Company’s Diabetes Group include those for diabetes management and the approval process for the Diabetes is similar across all divisions.
Net sales of the Company’s reportable segments include end-customer revenues from the sale of products each reportable segment develops and manufactures or distributes. Net sales and income before income taxes by reportable segment are as follows:
|
|
Fiscal Year
|
||||||||||
|
(in millions)
|
2016
|
2015
|
2014
|
||||||||
|
Cardiac and Vascular Group
|
$
|
10,196
|
|
$
|
9,361
|
|
$
|
8,847
|
|
||
|
Minimally Invasive Therapies Group
|
9,563
|
|
2,387
|
|
—
|
|
|||||
|
Restorative Therapies Group
|
7,210
|
|
6,751
|
|
6,501
|
|
|||||
|
Diabetes Group
|
1,864
|
|
1,762
|
|
1,657
|
|
|||||
|
Total Net Sales
|
$
|
28,833
|
|
$
|
20,261
|
|
$
|
17,005
|
|
||
|
|
Fiscal Year
|
||||||||||
|
(in millions)
|
2016
|
2015
|
2014
|
||||||||
|
Cardiac and Vascular Group
|
$
|
3,182
|
|
$
|
3,140
|
|
$
|
2,982
|
|
||
|
Minimally Invasive Therapies Group
|
1,394
|
|
342
|
|
—
|
|
|||||
|
Restorative Therapies Group
|
1,976
|
|
1,828
|
|
1,821
|
|
|||||
|
Diabetes Group
|
543
|
|
540
|
|
457
|
|
|||||
|
Total Reportable Segments’ Income Before Income Taxes
|
7,095
|
|
5,850
|
|
5,260
|
|
|||||
|
Impact of inventory step-up
|
(226
|
)
|
(623
|
)
|
—
|
|
|||||
|
Impact of product technology upgrade commitment
|
—
|
|
(74
|
)
|
—
|
|
|||||
|
Special (gains) charges, net
|
(70
|
)
|
38
|
|
(40
|
)
|
|||||
|
Restructuring charges, net
(1)
|
(299
|
)
|
(252
|
)
|
(88
|
)
|
|||||
|
Certain litigation charges, net
|
(26
|
)
|
(42
|
)
|
(770
|
)
|
|||||
|
Acquisition-related items
|
(283
|
)
|
(550
|
)
|
(117
|
)
|
|||||
|
Interest expense, net
|
(955
|
)
|
(280
|
)
|
(108
|
)
|
|||||
|
Corporate
|
(900
|
)
|
(581
|
)
|
(432
|
)
|
|||||
|
Total Income From Operations Before Income Taxes
|
$
|
4,336
|
|
$
|
3,486
|
|
$
|
3,705
|
|
||
|
(1)
|
Restructuring charges, net within this table include the impact of amounts recorded within cost of products sold in the consolidated statements of income.
|
125
The following table presents the Company’s assets by reportable segment:
|
(in millions)
|
April 29,
2016 |
April 24,
2015 |
|||||
|
Cardiac and Vascular Group
|
$
|
13,563
|
|
$
|
13,642
|
|
|
|
Minimally Invasive Therapies Group
|
52,227
|
|
51,228
|
|
|||
|
Restorative Therapies Group
|
14,564
|
|
15,249
|
|
|||
|
Diabetes Group
|
2,592
|
|
2,597
|
|
|||
|
Total Assets of Reportable Segments
|
82,946
|
|
82,716
|
|
|||
|
Corporate
|
16,836
|
|
23,969
|
|
|||
|
Total Assets
|
$
|
99,782
|
|
$
|
106,685
|
|
|
Geographic Information
The following table presents net sales to external customers and property, plant, and equipment, net by geographic region:
|
(in millions)
|
Americas
(1)
|
EMEA
(2)
|
Asia Pacific
|
Greater China
|
Consolidated
|
||||||||||||||
|
Fiscal Year 2016
|
|
|
|
|
|
|
|
|
|
|
|||||||||
|
Net sales to external customers
|
$
|
17,578
|
|
$
|
6,700
|
|
$
|
3,060
|
|
$
|
1,495
|
|
$
|
28,833
|
|
||||
|
Property, plant, and equipment, net
|
$
|
3,728
|
|
$
|
708
|
|
$
|
220
|
|
$
|
185
|
|
$
|
4,841
|
|
||||
|
Fiscal Year 2015
|
|
|
|
|
|
|
|
|
|
|
|||||||||
|
Net sales to external customers
|
$
|
12,125
|
|
$
|
5,064
|
|
$
|
2,059
|
|
$
|
1,013
|
|
$
|
20,261
|
|
||||
|
Property, plant, and equipment, net
|
$
|
3,626
|
|
$
|
725
|
|
$
|
165
|
|
$
|
183
|
|
$
|
4,699
|
|
||||
|
Fiscal Year 2014
|
|
|
|
|
|
|
|
|
|
|
|||||||||
|
Net sales to external customers
|
$
|
9,922
|
|
$
|
4,483
|
|
$
|
1,776
|
|
$
|
824
|
|
$
|
17,005
|
|
||||
|
Property, plant, and equipment, net
|
$
|
1,833
|
|
$
|
393
|
|
$
|
74
|
|
$
|
92
|
|
$
|
2,392
|
|
||||
|
(1)
|
The U.S., which is included in the Americas, had net sales to external customers of
$16.4 billion
, $
11.3 billion
, and $
9.2 billion
in fiscal years 2016, 2015, and 2014, respectively. Property, plant, and equipment, net includes
$3.3 billion
,
$3.0 billion
, and
$1.7 billion
in the U.S. in fiscal years
2016
,
2015
, and
2014
respectively.
|
|
(2)
|
EMEA consists of the following regions: Europe, Middle East, and Africa. Sales to Ireland were insignificant during all periods presented. Property, plant, and equipment, net includes
$169 million
,
$151 million
, and
$72 million
in Ireland in fiscal years
2016
,
2015
, and
2014
, respectively.
|
No
single customer represented over
10 percent
of the Company’s consolidated net sales in fiscal years
2016
,
2015
, or
2014
.
18. Subsequent Events
Tyco International, as audit managing party under the Tax Sharing Agreement, entered into Stipulations of Settled Issues with the IRS intended to resolve all Federal tax disputes related to the previously disclosed intercompany debt issues for the Tax Sharing Participants for the 1997-2000 audit cycle before the U.S. Tax Court. The Stipulations of Settled Issues were contingent upon the IRS Appeals Division applying the same settlement terms to all intercompany debt issues on appeal for subsequent audit cycles (2001-2007). On May 17, 2016 the IRS Office of Appeals issued fully executed Forms 870-AD that effectively settled the matters on appeal on the same terms as those set forth in the Stipulations of Settled Issues, and on May 31, 2016 the U.S. Tax Court entered decisions consistent with the Stipulations of Settled Issues. As a result, all aspects of this controversy that were before the U.S. Tax Court and Appeals Division of the IRS have been finally resolved for audit cycles from 1997-2007. The Company estimates the adjustments to the income tax reserve and guarantee contingencies will result in the recognition of a benefit of approximately
$425 million
in the Company’s first quarter of fiscal 2017 results.
On May 18, 2016, the Company signed a definitive agreement to acquire Smith & Nephew's gynecology business for approximately
$350 million
. The addition of Smith & Nephew's gynecology business will expand and strengthen Medtronic's minimally invasive surgical offerings and will further complement its existing global gynecology business. The acquisition is expected to close in fiscal year 2017.
126
On June 9, 2016, the U.S. Tax court issued its opinion with respect to the allocation of income between Medtronic, Inc. and its wholly-owned subsidiary operating in Puerto Rico for fiscal years 2005 and 2006. The U.S. Tax Court generally rejected the IRS’s position, but also made certain modifications to the Medtronic, Inc. tax returns as filed. We do not expect the results of the opinion to have a material impact on the financial statements. An Appeal of the U.S. Tax Court Opinion must be filed within 90 days of the final decision by the Tax Court. The final decision will not occur until all issues related to the fiscal years are resolved. As one item remains open, the calculation of amounts eligible for the one-time repatriation holiday, a final decision is not expected until later this fiscal year, and, therefore, an estimate of the financial statement impact cannot yet be made.
On June 27, 2016, the Company announced entry into a definitive agreement to acquire HeartWare International, Inc. for approximately
$1.1 billion
. The addition of HeartWare International, Inc.'s portfolio of heart failure products will expand and strengthen Medtronic's heart failure product offerings and will further complement its existing global cardiac rhythm and heart failure business. The acquisition is expected to close in fiscal year 2017.
19. Guarantor Financial Information
On January 26, 2015, Medtronic plc ("Parent Company Guarantor") and Medtronic Luxco, a subsidiary guarantor, each provided a full and unconditional guarantee of the obligations of Medtronic, Inc. under the Medtronic 2015 Senior Notes. In addition, Medtronic plc and Medtronic Luxco each provided a full and unconditional guarantee of the obligations of CIFSA, assumed as part of the Covidien acquisition, under the CIFSA Senior Notes. These guarantees of the CIFSA Senior Notes were in addition to the guarantees of the CIFSA Senior Notes by acquired Covidien holding companies Covidien Ltd. (f/k/a Covidien plc) and Covidien Group Holdings Ltd. (f/k/a Covidien Ltd.), both of which remain guarantors of the CIFSA Senior Notes. A summary of the guarantees is as follows:
Guarantees of Medtronic Senior Notes
|
•
|
Parent Company Guarantor - Medtronic plc
|
|
•
|
Subsidiary Issuer - Medtronic, Inc.
|
|
•
|
Subsidiary Guarantor - Medtronic Luxco
|
Since Medtronic plc and Medtronic Luxco did not exist in prior years, the Parent Company Guarantor column and Subsidiary Guarantor Column in the consolidating financial information for the guarantees of the Medtronic 2015 Senior Notes appear as zeros for fiscal year 2014. Accordingly, the fiscal year 2014 consolidating financial information is of the predecessor registrant, Medtronic, Inc.
Guarantees of CIFSA Senior Notes
|
•
|
Parent Company Guarantor - Medtronic plc
|
|
•
|
Subsidiary Issuer - CIFSA
|
|
•
|
Subsidiary Guarantors - Medtronic Luxco, Covidien Ltd., and Covidien Group Holdings Ltd.
|
The following presents the Company’s Consolidating Statements of Comprehensive Income and Condensed Consolidating Statements of Cash Flows as of and for the fiscal years ended
April 29, 2016
,
April 24, 2015
, and
April 25, 2014
, and Condensed Consolidating Balance Sheets as of
April 29, 2016
and
April 24, 2015
. The guarantees provided by the Parent Company Guarantor and Subsidiary Guarantors are joint and several. Condensed consolidating financial information for Medtronic plc, Medtronic Luxco, Medtronic, Inc. and CIFSA, on a stand-alone basis, is presented using the equity method of accounting for subsidiaries.
There were no Medtronic plc or Medtronic Luxco guarantees in effect in periods prior to fiscal year 2015, and the CIFSA Senior Notes were assumed as part of the Covidien acquisition. Therefore, no consolidating financial information for the fiscal year ended
April 25, 2014
is presented related to the guarantees of the CIFSA Senior Notes.
During fiscal year 2016, the Company undertook certain steps to reorganize ownership of various subsidiaries. The transactions were entirely among subsidiaries under the common control of Medtronic. This reorganization has been reflected as of the beginning of the earliest period presented.
The Company made revisions to its Condensed Consolidating Balance Sheet of the guarantees of the CIFSA Senior Notes as previously presented in Note 19 in the Company’s Annual Report on Form 10-K for the year ended April 24, 2015. A
$14.7 billion
revision increased
investment in subsidiaries
and
shareholders' equity
in the Subsidiary Issuer (CIFSA) column of the Condensed Consolidating Balance Sheet due to an incorrect presentation primarily related to the investment balance upon acquisition and an
127
intercompany dividend. The Company also made revisions to the Condensed Consolidating Statement of Cash Flows of the guarantees of the CIFSA Senior Notes as previously presented in Note 19 in the Company’s Annual Report on Form 10-K for the year ended April 24, 2015. An approximately
$8.0 billion
revision to cash from investing and financing activities was made in both the Subsidiary Issuer (CIFSA) and Subsidiary Non-Guarantors columns, as well as a
$1.3 billion
revision to cash from investing and operating activities in the Subsidiary Guarantors column related to an incorrect presentation of intercompany loan activity. A
$937 million
revision to cash from operating and investing activities in the Subsidiary Issuer (CIFSA) column and operating and financing activities in the Subsidiary Non-Guarantors column was related to an incorrect presentation of an intercompany capital contribution. The Company made certain revisions to its consolidating financial statements of the guarantees of the Medtronic Senior Notes as previously presented in Note 19 in the Company’s Annual Report on Form 10-K for the years ended April 24, 2015 and April 25, 2014. There is no impact to the consolidated financial statements of Medtronic plc as previously filed in the 2015 Annual Report on Form 10-K or Quarterly Reports on Form 10-Q.
128
Consolidating
Statement of Comprehensive Income
Fiscal Year Ended
April 29, 2016
Medtronic Senior Notes
|
(in millions)
|
Parent Company Guarantor (Medtronic plc)
|
Subsidiary Issuer (Medtronic, Inc.)
|
Subsidiary Guarantors
|
Subsidiary Non-guarantors
|
Consolidating
Adjustments
|
Total
|
|||||||||||||||||
|
Net sales
|
$
|
—
|
|
$
|
1,411
|
|
$
|
—
|
|
$
|
28,832
|
|
$
|
(1,410
|
)
|
$
|
28,833
|
|
|||||
|
Costs and expenses:
|
|||||||||||||||||||||||
|
Cost of products sold
|
—
|
|
991
|
|
—
|
|
9,561
|
|
(1,410
|
)
|
9,142
|
|
|||||||||||
|
Research and development expense
|
—
|
|
627
|
|
—
|
|
1,597
|
|
—
|
|
2,224
|
|
|||||||||||
|
Selling, general, and administrative expense
|
10
|
|
991
|
|
—
|
|
8,468
|
|
—
|
|
9,469
|
|
|||||||||||
|
Special (gains) charges, net
|
—
|
|
70
|
|
—
|
|
—
|
|
—
|
|
70
|
|
|||||||||||
|
Restructuring charges, net
|
—
|
|
17
|
|
—
|
|
273
|
|
—
|
|
290
|
|
|||||||||||
|
Certain litigation charges, net
|
—
|
|
—
|
|
—
|
|
26
|
|
—
|
|
26
|
|
|||||||||||
|
Acquisition-related items
|
—
|
|
135
|
|
—
|
|
148
|
|
—
|
|
283
|
|
|||||||||||
|
Amortization of intangible assets
|
—
|
|
12
|
|
—
|
|
1,919
|
|
—
|
|
1,931
|
|
|||||||||||
|
Other (income) expense, net
|
112
|
|
(2,329
|
)
|
—
|
|
2,324
|
|
—
|
|
107
|
|
|||||||||||
|
Operating profit (loss)
|
(122
|
)
|
897
|
|
—
|
|
4,516
|
|
—
|
|
5,291
|
|
|||||||||||
|
Interest income
|
—
|
|
(237
|
)
|
(706
|
)
|
(448
|
)
|
960
|
|
(431
|
)
|
|||||||||||
|
Interest expense
|
25
|
|
1,906
|
|
10
|
|
405
|
|
(960
|
)
|
1,386
|
|
|||||||||||
|
Interest expense (income), net
|
25
|
|
1,669
|
|
(696
|
)
|
(43
|
)
|
—
|
|
955
|
|
|||||||||||
|
Equity in net (income) loss of subsidiaries
|
(3,676
|
)
|
4,224
|
|
(2,980
|
)
|
—
|
|
2,432
|
|
—
|
|
|||||||||||
|
Income (loss) from operations before income taxes
|
3,529
|
|
(4,996
|
)
|
3,676
|
|
4,559
|
|
(2,432
|
)
|
4,336
|
|
|||||||||||
|
Provision (benefit) for income taxes
|
(9
|
)
|
(96
|
)
|
—
|
|
903
|
|
—
|
|
798
|
|
|||||||||||
|
Net income (loss)
|
3,538
|
|
(4,900
|
)
|
3,676
|
|
3,656
|
|
(2,432
|
)
|
3,538
|
|
|||||||||||
|
Other comprehensive income (loss), net of tax
|
(684
|
)
|
(493
|
)
|
(684
|
)
|
(673
|
)
|
1,850
|
|
(684
|
)
|
|||||||||||
|
Total comprehensive income (loss)
|
$
|
2,854
|
|
$
|
(5,393
|
)
|
$
|
2,992
|
|
$
|
2,983
|
|
$
|
(582
|
)
|
$
|
2,854
|
|
|||||
129
Consolidating
Statement of Comprehensive Income
Fiscal Year Ended
April 24, 2015
Medtronic Senior Notes
|
(in millions)
|
Parent Company Guarantor (Medtronic plc)
|
Subsidiary Issuer (Medtronic, Inc.)
|
Subsidiary Guarantors
|
Subsidiary Non-guarantors
|
Consolidating
Adjustments
|
Total
|
|||||||||||||||||
|
Net sales
|
$
|
—
|
|
$
|
1,261
|
|
$
|
—
|
|
$
|
20,261
|
|
$
|
(1,261
|
)
|
$
|
20,261
|
|
|||||
|
Costs and expenses:
|
|||||||||||||||||||||||
|
Cost of products sold
|
—
|
|
895
|
|
—
|
|
6,659
|
|
(1,245
|
)
|
6,309
|
|
|||||||||||
|
Research and development expense
|
—
|
|
552
|
|
—
|
|
1,088
|
|
—
|
|
1,640
|
|
|||||||||||
|
Selling, general, and administrative expense
|
1
|
|
857
|
|
—
|
|
6,046
|
|
—
|
|
6,904
|
|
|||||||||||
|
Special (gains) charges
|
—
|
|
100
|
|
—
|
|
(138
|
)
|
—
|
|
(38
|
)
|
|||||||||||
|
Restructuring charges, net
|
—
|
|
7
|
|
—
|
|
230
|
|
—
|
|
237
|
|
|||||||||||
|
Certain litigation charges, net
|
—
|
|
—
|
|
—
|
|
42
|
|
—
|
|
42
|
|
|||||||||||
|
Acquisition-related items
|
—
|
|
312
|
|
—
|
|
238
|
|
—
|
|
550
|
|
|||||||||||
|
Amortization of intangible assets
|
—
|
|
11
|
|
—
|
|
722
|
|
—
|
|
733
|
|
|||||||||||
|
Other (income) expense, net
|
103
|
|
(1,618
|
)
|
—
|
|
1,633
|
|
—
|
|
118
|
|
|||||||||||
|
Operating profit (loss)
|
(104
|
)
|
145
|
|
—
|
|
3,741
|
|
(16
|
)
|
3,766
|
|
|||||||||||
|
|
|
|
|
|
|
|
|
|
|
|
|
||||||||||||
|
Interest income
|
—
|
|
(56
|
)
|
(170
|
)
|
(387
|
)
|
227
|
|
(386
|
)
|
|||||||||||
|
Interest expense
|
—
|
|
762
|
|
—
|
|
131
|
|
(227
|
)
|
666
|
|
|||||||||||
|
Interest expense (income), net
|
—
|
|
706
|
|
(170
|
)
|
(256
|
)
|
—
|
|
280
|
|
|||||||||||
|
Equity in net (income) loss of subsidiaries
|
(2,790
|
)
|
(5,830
|
)
|
(2,620
|
)
|
—
|
|
11,240
|
|
—
|
|
|||||||||||
|
Income (loss) from operations before income taxes
|
2,686
|
|
5,269
|
|
2,790
|
|
3,997
|
|
(11,256
|
)
|
3,486
|
|
|||||||||||
|
Provision (benefit) for income taxes
|
11
|
|
(44
|
)
|
—
|
|
844
|
|
—
|
|
811
|
|
|||||||||||
|
Net income
|
2,675
|
|
5,313
|
|
2,790
|
|
3,153
|
|
(11,256
|
)
|
2,675
|
|
|||||||||||
|
Other comprehensive income (loss), net of tax
|
(587
|
)
|
(540
|
)
|
(587
|
)
|
(232
|
)
|
1,359
|
|
(587
|
)
|
|||||||||||
|
Total comprehensive income (loss)
|
$
|
2,088
|
|
$
|
4,773
|
|
$
|
2,203
|
|
$
|
2,921
|
|
$
|
(9,897
|
)
|
$
|
2,088
|
|
|||||
130
Consolidating
Statement of Comprehensive Income
Fiscal Year Ended
April 25, 2014
Medtronic Senior Notes
|
(in millions)
|
Parent Company Guarantor (Medtronic plc)
|
Subsidiary Issuer (Medtronic, Inc.)
|
Subsidiary Guarantors
|
Subsidiary Non-guarantors
|
Consolidating
Adjustments
|
Total
|
|||||||||||||||||
|
Net sales
|
$
|
—
|
|
$
|
1,155
|
|
$
|
—
|
|
$
|
17,005
|
|
$
|
(1,155
|
)
|
$
|
17,005
|
|
|||||
|
Costs and expenses:
|
|||||||||||||||||||||||
|
Cost of products sold
|
—
|
|
787
|
|
—
|
|
4,674
|
|
(1,128
|
)
|
4,333
|
|
|||||||||||
|
Research and development expense
|
—
|
|
540
|
|
—
|
|
937
|
|
—
|
|
1,477
|
|
|||||||||||
|
Selling, general, and administrative expense
|
—
|
|
821
|
|
—
|
|
5,026
|
|
—
|
|
5,847
|
|
|||||||||||
|
Special (gains) charges
|
—
|
|
40
|
|
—
|
|
—
|
|
—
|
|
40
|
|
|||||||||||
|
Restructuring charges, net
|
—
|
|
71
|
|
—
|
|
7
|
|
—
|
|
78
|
|
|||||||||||
|
Certain litigation charges, net
|
—
|
|
(24
|
)
|
—
|
|
794
|
|
—
|
|
770
|
|
|||||||||||
|
Acquisition-related items
|
—
|
|
—
|
|
—
|
|
117
|
|
—
|
|
117
|
|
|||||||||||
|
Amortization of intangible assets
|
—
|
|
12
|
|
—
|
|
337
|
|
—
|
|
349
|
|
|||||||||||
|
Other (income) expense, net
|
—
|
|
(1,623
|
)
|
—
|
|
1,804
|
|
—
|
|
181
|
|
|||||||||||
|
Operating profit (loss)
|
—
|
|
531
|
|
—
|
|
3,309
|
|
(27
|
)
|
3,813
|
|
|||||||||||
|
Interest income
|
—
|
|
(5
|
)
|
—
|
|
(267
|
)
|
1
|
|
(271
|
)
|
|||||||||||
|
Interest expense
|
—
|
|
317
|
|
—
|
|
63
|
|
(1
|
)
|
379
|
|
|||||||||||
|
Interest expense (income), net
|
—
|
|
312
|
|
—
|
|
(204
|
)
|
—
|
|
108
|
|
|||||||||||
|
Equity in net (income) loss of subsidiaries
|
—
|
|
(3,077
|
)
|
—
|
|
—
|
|
3,077
|
|
—
|
|
|||||||||||
|
Income (loss) from operations before income taxes
|
—
|
|
3,296
|
|
—
|
|
3,513
|
|
(3,104
|
)
|
3,705
|
|
|||||||||||
|
Provision (benefit) for income taxes
|
—
|
|
231
|
|
—
|
|
409
|
|
—
|
|
640
|
|
|||||||||||
|
Net income (loss)
|
—
|
|
3,065
|
|
—
|
|
3,104
|
|
(3,104
|
)
|
3,065
|
|
|||||||||||
|
Other comprehensive income (loss), net of tax
|
—
|
|
(105
|
)
|
—
|
|
(286
|
)
|
286
|
|
(105
|
)
|
|||||||||||
|
Total comprehensive income (loss)
|
$
|
—
|
|
$
|
2,960
|
|
$
|
—
|
|
$
|
2,818
|
|
$
|
(2,818
|
)
|
$
|
2,960
|
|
|||||
131
Condensed Consolidating
Balance Sheet
April 29, 2016
Medtronic Senior Notes
|
(in millions)
|
Parent Company Guarantor (Medtronic plc)
|
Subsidiary Issuer (Medtronic, Inc.)
|
Subsidiary Guarantors
|
Subsidiary Non-guarantors
|
Consolidating
Adjustments
|
Total
|
|||||||||||||||||
|
ASSETS
|
|||||||||||||||||||||||
|
Current assets:
|
|||||||||||||||||||||||
|
Cash and cash equivalents
|
$
|
—
|
|
$
|
55
|
|
$
|
—
|
|
$
|
2,821
|
|
$
|
—
|
|
$
|
2,876
|
|
|||||
|
Investments
|
—
|
|
—
|
|
—
|
|
9,758
|
|
—
|
|
9,758
|
|
|||||||||||
|
Accounts receivable, net
|
—
|
|
—
|
|
—
|
|
5,562
|
|
—
|
|
5,562
|
|
|||||||||||
|
Inventories
|
—
|
|
162
|
|
—
|
|
3,511
|
|
(200
|
)
|
3,473
|
|
|||||||||||
|
Intercompany receivable
|
389
|
|
161,868
|
|
—
|
|
162,278
|
|
(324,535
|
)
|
—
|
|
|||||||||||
|
Tax assets
|
—
|
|
122
|
|
—
|
|
575
|
|
—
|
|
697
|
|
|||||||||||
|
Prepaid expenses and other current assets
|
24
|
|
149
|
|
—
|
|
1,061
|
|
—
|
|
1,234
|
|
|||||||||||
|
Total current assets
|
413
|
|
162,356
|
|
—
|
|
185,566
|
|
(324,735
|
)
|
23,600
|
|
|||||||||||
|
Property, plant and equipment, net
|
—
|
|
1,139
|
|
—
|
|
3,702
|
|
—
|
|
4,841
|
|
|||||||||||
|
Goodwill
|
—
|
|
—
|
|
—
|
|
41,500
|
|
—
|
|
41,500
|
|
|||||||||||
|
Other intangible assets, net
|
—
|
|
31
|
|
—
|
|
26,868
|
|
—
|
|
26,899
|
|
|||||||||||
|
Long-term tax assets
|
—
|
|
690
|
|
—
|
|
693
|
|
—
|
|
1,383
|
|
|||||||||||
|
Investment in subsidiaries
|
73,108
|
|
63,806
|
|
70,198
|
|
—
|
|
(207,112
|
)
|
—
|
|
|||||||||||
|
Intercompany loans receivable
|
3,000
|
|
8,884
|
|
10,203
|
|
18,140
|
|
(40,227
|
)
|
—
|
|
|||||||||||
|
Other assets
|
—
|
|
644
|
|
—
|
|
915
|
|
—
|
|
1,559
|
|
|||||||||||
|
Total assets
|
$
|
76,521
|
|
$
|
237,550
|
|
$
|
80,401
|
|
$
|
277,384
|
|
$
|
(572,074
|
)
|
$
|
99,782
|
|
|||||
|
LIABILITIES AND SHAREHOLDERS’ EQUITY
|
|||||||||||||||||||||||
|
Current liabilities:
|
|||||||||||||||||||||||
|
Short-term borrowings
|
$
|
—
|
|
$
|
500
|
|
$
|
—
|
|
$
|
493
|
|
$
|
—
|
|
$
|
993
|
|
|||||
|
Accounts payable
|
—
|
|
288
|
|
—
|
|
1,421
|
|
—
|
|
1,709
|
|
|||||||||||
|
Intercompany payable
|
20,486
|
|
151,687
|
|
—
|
|
152,362
|
|
(324,535
|
)
|
—
|
|
|||||||||||
|
Accrued compensation
|
32
|
|
616
|
|
—
|
|
1,064
|
|
—
|
|
1,712
|
|
|||||||||||
|
Accrued income taxes
|
11
|
|
—
|
|
—
|
|
555
|
|
—
|
|
566
|
|
|||||||||||
|
Deferred tax liabilities
|
—
|
|
—
|
|
—
|
|
—
|
|
—
|
|
—
|
|
|||||||||||
|
Other accrued expenses
|
1
|
|
243
|
|
—
|
|
1,941
|
|
—
|
|
2,185
|
|
|||||||||||
|
Total current liabilities
|
20,530
|
|
153,334
|
|
—
|
|
157,836
|
|
(324,535
|
)
|
7,165
|
|
|||||||||||
|
Long-term debt
|
—
|
|
26,784
|
|
—
|
|
3,463
|
|
—
|
|
30,247
|
|
|||||||||||
|
Long-term accrued compensation and retirement benefits
|
—
|
|
1,258
|
|
—
|
|
501
|
|
—
|
|
1,759
|
|
|||||||||||
|
Long-term accrued income taxes
|
10
|
|
1,422
|
|
—
|
|
1,471
|
|
—
|
|
2,903
|
|
|||||||||||
|
Long-term intercompany loans payable
|
3,918
|
|
10,128
|
|
14,297
|
|
11,884
|
|
(40,227
|
)
|
—
|
|
|||||||||||
|
Long-term deferred tax liabilities
|
—
|
|
—
|
|
—
|
|
3,729
|
|
—
|
|
3,729
|
|
|||||||||||
|
Other long-term liabilities
|
—
|
|
202
|
|
—
|
|
1,714
|
|
—
|
|
1,916
|
|
|||||||||||
|
Total liabilities
|
24,458
|
|
193,128
|
|
14,297
|
|
180,598
|
|
(364,762
|
)
|
47,719
|
|
|||||||||||
|
Shareholders’ equity
|
52,063
|
|
44,422
|
|
66,104
|
|
96,786
|
|
(207,312
|
)
|
52,063
|
|
|||||||||||
|
Total liabilities and shareholders’ equity
|
$
|
76,521
|
|
$
|
237,550
|
|
$
|
80,401
|
|
$
|
277,384
|
|
$
|
(572,074
|
)
|
$
|
99,782
|
|
|||||
132
Condensed Consolidating
Balance Sheet
April 24, 2015
Medtronic Senior Notes
|
(in millions)
|
Parent Company Guarantor (Medtronic plc)
|
Subsidiary Issuer (Medtronic, Inc.)
|
Subsidiary Guarantors
|
Subsidiary Non-guarantors
|
Consolidating
Adjustments
|
Total
|
|||||||||||||||||
|
ASSETS
|
|||||||||||||||||||||||
|
Current assets:
|
|||||||||||||||||||||||
|
Cash and cash equivalents
|
$
|
263
|
|
$
|
1,071
|
|
$
|
170
|
|
$
|
3,339
|
|
$
|
—
|
|
$
|
4,843
|
|
|||||
|
Investments
|
—
|
|
—
|
|
—
|
|
14,637
|
|
—
|
|
14,637
|
|
|||||||||||
|
Accounts receivable, net
|
—
|
|
—
|
|
—
|
|
5,112
|
|
—
|
|
5,112
|
|
|||||||||||
|
Inventories
|
—
|
|
165
|
|
—
|
|
3,497
|
|
(199
|
)
|
3,463
|
|
|||||||||||
|
Intercompany receivable
|
259
|
|
146,942
|
|
—
|
|
144,638
|
|
(291,839
|
)
|
—
|
|
|||||||||||
|
Tax assets
|
—
|
|
295
|
|
—
|
|
1,040
|
|
—
|
|
1,335
|
|
|||||||||||
|
Prepaid expenses and other current assets
|
4
|
|
128
|
|
—
|
|
1,322
|
|
—
|
|
1,454
|
|
|||||||||||
|
Total current assets
|
526
|
|
148,601
|
|
170
|
|
173,585
|
|
(292,038
|
)
|
30,844
|
|
|||||||||||
|
Property, plant and equipment, net
|
—
|
|
976
|
|
—
|
|
3,723
|
|
—
|
|
4,699
|
|
|||||||||||
|
Goodwill
|
—
|
|
—
|
|
—
|
|
40,530
|
|
—
|
|
40,530
|
|
|||||||||||
|
Other intangible assets, net
|
—
|
|
39
|
|
—
|
|
28,062
|
|
—
|
|
28,101
|
|
|||||||||||
|
Long-term tax assets
|
—
|
|
294
|
|
—
|
|
480
|
|
—
|
|
774
|
|
|||||||||||
|
Investment in subsidiaries
|
70,233
|
|
68,710
|
|
63,063
|
|
—
|
|
(202,006
|
)
|
—
|
|
|||||||||||
|
Intercompany loans receivable
|
3,000
|
|
6,516
|
|
10,000
|
|
10,218
|
|
(29,734
|
)
|
—
|
|
|||||||||||
|
Other assets
|
—
|
|
678
|
|
—
|
|
1,059
|
|
—
|
|
1,737
|
|
|||||||||||
|
Total assets
|
$
|
73,759
|
|
$
|
225,814
|
|
$
|
73,233
|
|
$
|
257,657
|
|
$
|
(523,778
|
)
|
$
|
106,685
|
|
|||||
|
LIABILITIES AND SHAREHOLDERS’ EQUITY
|
|||||||||||||||||||||||
|
Current liabilities:
|
|||||||||||||||||||||||
|
Short-term borrowings
|
$
|
—
|
|
$
|
1,110
|
|
$
|
—
|
|
$
|
1,324
|
|
$
|
—
|
|
$
|
2,434
|
|
|||||
|
Accounts payable
|
—
|
|
261
|
|
—
|
|
1,349
|
|
—
|
|
1,610
|
|
|||||||||||
|
Intercompany payable
|
20,506
|
|
135,660
|
|
—
|
|
135,673
|
|
(291,839
|
)
|
—
|
|
|||||||||||
|
Accrued compensation
|
1
|
|
490
|
|
—
|
|
1,120
|
|
—
|
|
1,611
|
|
|||||||||||
|
Accrued income taxes
|
19
|
|
—
|
|
—
|
|
916
|
|
—
|
|
935
|
|
|||||||||||
|
Deferred tax liabilities
|
3
|
|
—
|
|
—
|
|
116
|
|
—
|
|
119
|
|
|||||||||||
|
Other accrued expenses
|
—
|
|
628
|
|
—
|
|
1,836
|
|
—
|
|
2,464
|
|
|||||||||||
|
Total current liabilities
|
20,529
|
|
138,149
|
|
—
|
|
142,334
|
|
(291,839
|
)
|
9,173
|
|
|||||||||||
|
Long-term debt
|
—
|
|
29,004
|
|
—
|
|
4,748
|
|
—
|
|
33,752
|
|
|||||||||||
|
Long-term accrued compensation and retirement benefits
|
—
|
|
965
|
|
—
|
|
570
|
|
—
|
|
1,535
|
|
|||||||||||
|
Long-term accrued income taxes
|
—
|
|
1,048
|
|
—
|
|
1,428
|
|
—
|
|
2,476
|
|
|||||||||||
|
Long-term intercompany loans payable
|
—
|
|
10,218
|
|
10,000
|
|
9,516
|
|
(29,734
|
)
|
—
|
|
|||||||||||
|
Long-term deferred tax liabilities
|
—
|
|
—
|
|
—
|
|
4,700
|
|
—
|
|
4,700
|
|
|||||||||||
|
Other long-term liabilities
|
—
|
|
207
|
|
—
|
|
1,612
|
|
—
|
|
1,819
|
|
|||||||||||
|
Total liabilities
|
20,529
|
|
179,591
|
|
10,000
|
|
164,908
|
|
(321,573
|
)
|
53,455
|
|
|||||||||||
|
Shareholders’ equity
|
53,230
|
|
46,223
|
|
63,233
|
|
92,749
|
|
(202,205
|
)
|
53,230
|
|
|||||||||||
|
Total liabilities and shareholders’ equity
|
$
|
73,759
|
|
$
|
225,814
|
|
$
|
73,233
|
|
$
|
257,657
|
|
$
|
(523,778
|
)
|
$
|
106,685
|
|
|||||
133
Condensed Consolidating
Statement of Cash Flows
Fiscal Year Ended
April 29, 2016
Medtronic Senior Notes
|
(in millions)
|
Parent Company Guarantor (Medtronic plc)
|
Subsidiary Issuer (Medtronic, Inc.)
|
Subsidiary Guarantors
|
Subsidiary Non-guarantors
|
Consolidating
Adjustments
|
Total
|
|||||||||||||||||
|
Operating Activities:
|
|||||||||||||||||||||||
|
Net cash provided by (used in) operating activities
|
$
|
297
|
|
$
|
402
|
|
$
|
696
|
|
$
|
4,635
|
|
$
|
(812
|
)
|
$
|
5,218
|
|
|||||
|
Investing Activities:
|
|||||||||||||||||||||||
|
Acquisitions, net of cash acquired
|
—
|
|
(526
|
)
|
—
|
|
(687
|
)
|
—
|
|
(1,213
|
)
|
|||||||||||
|
Additions to property, plant, and equipment
|
—
|
|
(334
|
)
|
—
|
|
(712
|
)
|
—
|
|
(1,046
|
)
|
|||||||||||
|
Purchases of marketable securities
|
—
|
|
—
|
|
—
|
|
(5,406
|
)
|
—
|
|
(5,406
|
)
|
|||||||||||
|
Sales and maturities of marketable securities
|
—
|
|
—
|
|
—
|
|
9,924
|
|
—
|
|
9,924
|
|
|||||||||||
|
Net (increase) decrease in intercompany loans receivable
|
—
|
|
(2,368
|
)
|
(203
|
)
|
(7,921
|
)
|
10,492
|
|
—
|
|
|||||||||||
|
Capital contributions paid
|
—
|
|
(11
|
)
|
(4,959
|
)
|
(4,900
|
)
|
9,870
|
|
—
|
|
|||||||||||
|
Other investing activities, net
|
—
|
|
—
|
|
—
|
|
(14
|
)
|
—
|
|
(14
|
)
|
|||||||||||
|
Net cash provided by (used in) investing activities
|
—
|
|
(3,239
|
)
|
(5,162
|
)
|
(9,716
|
)
|
20,362
|
|
2,245
|
|
|||||||||||
|
Financing Activities:
|
|||||||||||||||||||||||
|
Acquisition-related contingent consideration
|
—
|
|
—
|
|
—
|
|
(22
|
)
|
—
|
|
(22
|
)
|
|||||||||||
|
Change in short-term borrowings, net
|
—
|
|
—
|
|
—
|
|
7
|
|
—
|
|
7
|
|
|||||||||||
|
Repayment of short-term borrowings (maturities greater than 90 days)
|
—
|
|
—
|
|
(139
|
)
|
—
|
|
—
|
|
(139
|
)
|
|||||||||||
|
Proceeds from short-term borrowings (maturities greater than 90 days)
|
—
|
|
—
|
|
139
|
|
—
|
|
—
|
|
139
|
|
|||||||||||
|
Issuance of long-term debt
|
—
|
|
—
|
|
—
|
|
—
|
|
—
|
|
—
|
|
|||||||||||
|
Payments on long-term debt
|
—
|
|
(2,988
|
)
|
—
|
|
(2,144
|
)
|
—
|
|
(5,132
|
)
|
|||||||||||
|
Dividends to shareholders
|
(2,139
|
)
|
—
|
|
—
|
|
—
|
|
—
|
|
(2,139
|
)
|
|||||||||||
|
Issuance of ordinary shares
|
491
|
|
—
|
|
—
|
|
—
|
|
—
|
|
491
|
|
|||||||||||
|
Repurchase of ordinary shares
|
(2,830
|
)
|
—
|
|
—
|
|
—
|
|
—
|
|
(2,830
|
)
|
|||||||||||
|
Net intercompany loan borrowings (repayments)
|
3,918
|
|
(91
|
)
|
4,296
|
|
2,369
|
|
(10,492
|
)
|
—
|
|
|||||||||||
|
Intercompany dividend paid
|
—
|
|
—
|
|
—
|
|
(812
|
)
|
812
|
|
—
|
|
|||||||||||
|
Capital contributions received
|
—
|
|
4,900
|
|
—
|
|
4,970
|
|
(9,870
|
)
|
—
|
|
|||||||||||
|
Other financing activities
|
—
|
|
—
|
|
—
|
|
82
|
|
—
|
|
82
|
|
|||||||||||
|
Net cash provided by (used in) financing activities
|
(560
|
)
|
1,821
|
|
4,296
|
|
4,450
|
|
(19,550
|
)
|
(9,543
|
)
|
|||||||||||
|
Effect of exchange rate changes on cash and cash equivalents
|
—
|
|
—
|
|
—
|
|
113
|
|
—
|
|
113
|
|
|||||||||||
|
Net change in cash and cash equivalents
|
(263
|
)
|
(1,016
|
)
|
(170
|
)
|
(518
|
)
|
—
|
|
(1,967
|
)
|
|||||||||||
|
Cash and cash equivalents at beginning of period
|
263
|
|
1,071
|
|
170
|
|
3,339
|
|
—
|
|
4,843
|
|
|||||||||||
|
Cash and cash equivalents at end of period
|
$
|
—
|
|
$
|
55
|
|
$
|
—
|
|
$
|
2,821
|
|
$
|
—
|
|
$
|
2,876
|
|
|||||
134
Condensed Consolidating
Statement of Cash Flows
Fiscal Year Ended
April 24, 2015
Medtronic Senior Notes
|
(in millions)
|
Parent Company Guarantor (Medtronic plc)
|
Subsidiary Issuer (Medtronic, Inc.)
|
Subsidiary Guarantors
|
Subsidiary Non-guarantors
|
Consolidating
Adjustments
|
Total
|
|||||||||||||||||
|
Operating Activities:
|
|||||||||||||||||||||||
|
Net cash provided by (used in) operating activities
|
$
|
26
|
|
$
|
1,479
|
|
$
|
170
|
|
$
|
3,640
|
|
$
|
(413
|
)
|
$
|
4,902
|
|
|||||
|
Investing Activities:
|
|||||||||||||||||||||||
|
Acquisitions, net of cash acquired
|
(9,700
|
)
|
(65
|
)
|
—
|
|
(5,119
|
)
|
—
|
|
(14,884
|
)
|
|||||||||||
|
Additions to property, plant, and equipment
|
—
|
|
(187
|
)
|
—
|
|
(384
|
)
|
—
|
|
(571
|
)
|
|||||||||||
|
Purchases of marketable securities
|
—
|
|
—
|
|
—
|
|
(7,582
|
)
|
—
|
|
(7,582
|
)
|
|||||||||||
|
Sales and maturities of marketable securities
|
—
|
|
—
|
|
—
|
|
5,890
|
|
—
|
|
5,890
|
|
|||||||||||
|
Net (increase) decrease in intercompany loans receivable
|
—
|
|
(16,996
|
)
|
—
|
|
53
|
|
16,943
|
|
—
|
|
|||||||||||
|
Other investing activities, net
|
—
|
|
—
|
|
—
|
|
89
|
|
—
|
|
89
|
|
|||||||||||
|
Net cash provided by (used in) investing activities
|
(9,700
|
)
|
(17,248
|
)
|
—
|
|
(7,053
|
)
|
16,943
|
|
(17,058
|
)
|
|||||||||||
|
Financing Activities:
|
|||||||||||||||||||||||
|
Acquisition-related contingent consideration
|
—
|
|
—
|
|
—
|
|
(85
|
)
|
—
|
|
(85
|
)
|
|||||||||||
|
Change in short-term borrowings, net
|
—
|
|
—
|
|
—
|
|
(1
|
)
|
—
|
|
(1
|
)
|
|||||||||||
|
Repayment of short-term borrowings (maturities greater than 90 days)
|
—
|
|
(150
|
)
|
—
|
|
—
|
|
—
|
|
(150
|
)
|
|||||||||||
|
Proceeds from short-term borrowings (maturities greater than 90 days)
|
—
|
|
150
|
|
—
|
|
—
|
|
—
|
|
150
|
|
|||||||||||
|
Issuance of long-term debt
|
—
|
|
19,942
|
|
—
|
|
—
|
|
—
|
|
19,942
|
|
|||||||||||
|
Payments on long-term debt
|
—
|
|
(1,268
|
)
|
—
|
|
—
|
|
—
|
|
(1,268
|
)
|
|||||||||||
|
Dividends to shareholders
|
(435
|
)
|
(902
|
)
|
—
|
|
—
|
|
—
|
|
(1,337
|
)
|
|||||||||||
|
Issuance of ordinary shares
|
172
|
|
477
|
|
—
|
|
—
|
|
—
|
|
649
|
|
|||||||||||
|
Repurchase of ordinary shares
|
(300
|
)
|
(1,620
|
)
|
—
|
|
—
|
|
—
|
|
(1,920
|
)
|
|||||||||||
|
Net intercompany loan borrowings (repayments)
|
10,500
|
|
(53
|
)
|
—
|
|
6,496
|
|
(16,943
|
)
|
—
|
|
|||||||||||
|
Intercompany dividends paid
|
—
|
|
—
|
|
—
|
|
(413
|
)
|
413
|
|
—
|
|
|||||||||||
|
Other financing activities
|
—
|
|
—
|
|
—
|
|
(31
|
)
|
—
|
|
(31
|
)
|
|||||||||||
|
Net cash provided by (used in) financing activities
|
9,937
|
|
16,576
|
|
—
|
|
5,966
|
|
(16,530
|
)
|
15,949
|
|
|||||||||||
|
Effect of exchange rate changes on cash and cash equivalents
|
—
|
|
—
|
|
—
|
|
(353
|
)
|
—
|
|
(353
|
)
|
|||||||||||
|
Net change in cash and cash equivalents
|
263
|
|
807
|
|
170
|
|
2,200
|
|
—
|
|
3,440
|
|
|||||||||||
|
Cash and cash equivalents at beginning of period
|
—
|
|
264
|
|
—
|
|
1,139
|
|
—
|
|
1,403
|
|
|||||||||||
|
Cash and cash equivalents at end of period
|
$
|
263
|
|
$
|
1,071
|
|
$
|
170
|
|
$
|
3,339
|
|
$
|
—
|
|
$
|
4,843
|
|
|||||
135
Condensed Consolidating
Statement of Cash Flows
Fiscal Year Ended
April 25, 2014
Medtronic Senior Notes
|
(in millions)
|
Parent Company Guarantor (Medtronic plc)
|
Subsidiary Issuer (Medtronic, Inc.)
|
Subsidiary Guarantors
|
Subsidiary Non-guarantors
|
Consolidating
Adjustments
|
Total
|
|||||||||||||||||
|
Operating Activities:
|
|||||||||||||||||||||||
|
Net cash provided by (used in) operating activities
|
$
|
—
|
|
$
|
1,384
|
|
$
|
—
|
|
$
|
3,949
|
|
$
|
(374
|
)
|
$
|
4,959
|
|
|||||
|
Investing Activities:
|
|||||||||||||||||||||||
|
Acquisitions, net of cash acquired
|
—
|
|
—
|
|
—
|
|
(385
|
)
|
—
|
|
(385
|
)
|
|||||||||||
|
Additions to property, plant, and equipment
|
—
|
|
(154
|
)
|
—
|
|
(242
|
)
|
—
|
|
(396
|
)
|
|||||||||||
|
Purchases of marketable securities
|
—
|
|
—
|
|
—
|
|
(10,895
|
)
|
—
|
|
(10,895
|
)
|
|||||||||||
|
Sales and maturities of marketable securities
|
—
|
|
—
|
|
—
|
|
8,111
|
|
—
|
|
8,111
|
|
|||||||||||
|
Net (increase) decrease in intercompany loans receivable
|
—
|
|
1
|
|
—
|
|
(12
|
)
|
11
|
|
—
|
|
|||||||||||
|
Other investing activities, net
|
—
|
|
—
|
|
—
|
|
(29
|
)
|
—
|
|
(29
|
)
|
|||||||||||
|
Net cash provided by (used in) investing activities
|
—
|
|
(153
|
)
|
—
|
|
(3,452
|
)
|
11
|
|
(3,594
|
)
|
|||||||||||
|
Financing Activities:
|
|||||||||||||||||||||||
|
Acquisition-related contingent consideration
|
—
|
|
—
|
|
—
|
|
(1
|
)
|
—
|
|
(1
|
)
|
|||||||||||
|
Change in short-term borrowings, net
|
—
|
|
—
|
|
—
|
|
127
|
|
—
|
|
127
|
|
|||||||||||
|
Repayment of short-term borrowings (maturities greater than 90 days)
|
—
|
|
(1,301
|
)
|
—
|
|
—
|
|
—
|
|
(1,301
|
)
|
|||||||||||
|
Proceeds from short-term borrowings (maturities greater than 90 days)
|
—
|
|
1,045
|
|
—
|
|
131
|
|
—
|
|
1,176
|
|
|||||||||||
|
Issuance of long-term debt
|
—
|
|
1,994
|
|
—
|
|
—
|
|
—
|
|
1,994
|
|
|||||||||||
|
Payments on long-term debt
|
—
|
|
(565
|
)
|
—
|
|
—
|
|
—
|
|
(565
|
)
|
|||||||||||
|
Dividends to shareholders
|
—
|
|
(1,116
|
)
|
—
|
|
—
|
|
—
|
|
(1,116
|
)
|
|||||||||||
|
Issuance of ordinary shares
|
—
|
|
1,307
|
|
—
|
|
—
|
|
—
|
|
1,307
|
|
|||||||||||
|
Repurchase of ordinary shares
|
—
|
|
(2,553
|
)
|
—
|
|
—
|
|
—
|
|
(2,553
|
)
|
|||||||||||
|
Net intercompany loan borrowings (repayments)
|
—
|
|
12
|
|
—
|
|
(1
|
)
|
(11
|
)
|
—
|
|
|||||||||||
|
Intercompany dividends paid
|
—
|
|
—
|
|
—
|
|
(374
|
)
|
374
|
|
—
|
|
|||||||||||
|
Other financing activities
|
—
|
|
14
|
|
—
|
|
—
|
|
—
|
|
14
|
|
|||||||||||
|
Net cash provided by (used in) financing activities
|
—
|
|
(1,163
|
)
|
—
|
|
(118
|
)
|
363
|
|
(918
|
)
|
|||||||||||
|
Effect of exchange rate changes on cash and cash equivalents
|
—
|
|
—
|
|
—
|
|
37
|
|
—
|
|
37
|
|
|||||||||||
|
Net change in cash and cash equivalents
|
—
|
|
68
|
|
—
|
|
416
|
|
—
|
|
484
|
|
|||||||||||
|
Cash and cash equivalents at beginning of period
|
—
|
|
196
|
|
—
|
|
723
|
|
—
|
|
919
|
|
|||||||||||
|
Cash and cash equivalents at end of period
|
$
|
—
|
|
$
|
264
|
|
$
|
—
|
|
$
|
1,139
|
|
$
|
—
|
|
$
|
1,403
|
|
|||||
136
Consolidating
Statement of Comprehensive Income
Fiscal Year Ended
April 29, 2016
CIFSA Senior Notes
|
(in millions)
|
Parent Company Guarantor (Medtronic plc)
|
Subsidiary Issuer (CIFSA)
|
Subsidiary Guarantors
|
Subsidiary Non-guarantors
|
Consolidating
Adjustments
|
Total
|
|||||||||||||||||
|
Net sales
|
$
|
—
|
|
$
|
—
|
|
$
|
—
|
|
$
|
28,833
|
|
$
|
—
|
|
$
|
28,833
|
|
|||||
|
Costs and expenses:
|
|||||||||||||||||||||||
|
Cost of products sold
|
—
|
|
—
|
|
—
|
|
9,142
|
|
—
|
|
9,142
|
|
|||||||||||
|
Research and development expense
|
—
|
|
—
|
|
—
|
|
2,224
|
|
—
|
|
2,224
|
|
|||||||||||
|
Selling, general, and administrative expense
|
10
|
|
1
|
|
3
|
|
9,455
|
|
—
|
|
9,469
|
|
|||||||||||
|
Special (gains) charges, net
|
—
|
|
—
|
|
—
|
|
70
|
|
—
|
|
70
|
|
|||||||||||
|
Restructuring charges, net
|
—
|
|
—
|
|
—
|
|
290
|
|
—
|
|
290
|
|
|||||||||||
|
Certain litigation charges, net
|
—
|
|
—
|
|
—
|
|
26
|
|
—
|
|
26
|
|
|||||||||||
|
Acquisition-related items
|
—
|
|
—
|
|
—
|
|
283
|
|
—
|
|
283
|
|
|||||||||||
|
Amortization of intangible assets
|
—
|
|
—
|
|
—
|
|
1,931
|
|
—
|
|
1,931
|
|
|||||||||||
|
Other (income) expense, net
|
112
|
|
1
|
|
(18
|
)
|
12
|
|
—
|
|
107
|
|
|||||||||||
|
Operating profit (loss)
|
(122
|
)
|
(2
|
)
|
15
|
|
5,400
|
|
—
|
|
5,291
|
|
|||||||||||
|
Interest income
|
—
|
|
(434
|
)
|
(710
|
)
|
(451
|
)
|
1,164
|
|
(431
|
)
|
|||||||||||
|
Interest expense
|
25
|
|
138
|
|
10
|
|
2,377
|
|
(1,164
|
)
|
1,386
|
|
|||||||||||
|
Interest (income) expense, net
|
25
|
|
(296
|
)
|
(700
|
)
|
1,926
|
|
—
|
|
955
|
|
|||||||||||
|
Equity in net (income) loss of subsidiaries
|
(3,676
|
)
|
(8,563
|
)
|
(2,961
|
)
|
—
|
|
15,200
|
|
—
|
|
|||||||||||
|
Income (loss) from operations before income taxes
|
3,529
|
|
8,857
|
|
3,676
|
|
3,474
|
|
(15,200
|
)
|
4,336
|
|
|||||||||||
|
Provision (benefit) for income taxes
|
(9
|
)
|
—
|
|
—
|
|
807
|
|
—
|
|
798
|
|
|||||||||||
|
Net income (loss)
|
3,538
|
|
8,857
|
|
3,676
|
|
2,667
|
|
(15,200
|
)
|
3,538
|
|
|||||||||||
|
Other comprehensive income (loss), net of tax
|
(684
|
)
|
(102
|
)
|
(684
|
)
|
(684
|
)
|
1,470
|
|
(684
|
)
|
|||||||||||
|
Total comprehensive income (loss)
|
$
|
2,854
|
|
$
|
8,755
|
|
$
|
2,992
|
|
$
|
1,983
|
|
$
|
(13,730
|
)
|
$
|
2,854
|
|
|||||
137
Consolidating
Statement of Comprehensive Income
Fiscal Year Ended
April 24, 2015
CIFSA Senior Notes
|
(in millions)
|
Parent Company Guarantor (Medtronic plc)
|
Subsidiary Issuer (CIFSA)
|
Subsidiary Guarantors
|
Subsidiary Non-guarantors
|
Consolidating
Adjustments
|
Total
|
|||||||||||||||||
|
Net sales
|
$
|
—
|
|
$
|
—
|
|
$
|
—
|
|
$
|
20,261
|
|
$
|
—
|
|
$
|
20,261
|
|
|||||
|
Costs and expenses:
|
|||||||||||||||||||||||
|
Cost of products sold
|
—
|
|
—
|
|
—
|
|
6,309
|
|
—
|
|
6,309
|
|
|||||||||||
|
Research and development expense
|
—
|
|
—
|
|
—
|
|
1,640
|
|
—
|
|
1,640
|
|
|||||||||||
|
Selling, general, and administrative expense
|
1
|
|
—
|
|
21
|
|
6,882
|
|
—
|
|
6,904
|
|
|||||||||||
|
Special (gains) charges, net
|
—
|
|
—
|
|
—
|
|
(38
|
)
|
—
|
|
(38
|
)
|
|||||||||||
|
Restructuring charges, net
|
—
|
|
—
|
|
—
|
|
237
|
|
—
|
|
237
|
|
|||||||||||
|
Certain litigation charges, net
|
—
|
|
—
|
|
—
|
|
42
|
|
—
|
|
42
|
|
|||||||||||
|
Acquisition-related items
|
—
|
|
—
|
|
—
|
|
550
|
|
—
|
|
550
|
|
|||||||||||
|
Amortization of intangible assets
|
—
|
|
—
|
|
—
|
|
733
|
|
—
|
|
733
|
|
|||||||||||
|
Other (income) expense, net
|
103
|
|
—
|
|
26
|
|
(11
|
)
|
—
|
|
118
|
|
|||||||||||
|
Operating profit (loss)
|
(104
|
)
|
—
|
|
(47
|
)
|
3,917
|
|
—
|
|
3,766
|
|
|||||||||||
|
Interest income
|
—
|
|
(149
|
)
|
(170
|
)
|
(386
|
)
|
319
|
|
(386
|
)
|
|||||||||||
|
Interest expense
|
—
|
|
29
|
|
—
|
|
956
|
|
(319
|
)
|
666
|
|
|||||||||||
|
Interest (income) expense, net
|
—
|
|
(120
|
)
|
(170
|
)
|
570
|
|
—
|
|
280
|
|
|||||||||||
|
Equity in net (income) loss of subsidiaries
|
(2,790
|
)
|
1,412
|
|
(2,667
|
)
|
—
|
|
4,045
|
|
—
|
|
|||||||||||
|
Income (loss) from operations before income taxes
|
2,686
|
|
(1,292
|
)
|
2,790
|
|
3,347
|
|
(4,045
|
)
|
3,486
|
|
|||||||||||
|
Provision (benefit) for income taxes
|
11
|
|
—
|
|
—
|
|
800
|
|
—
|
|
811
|
|
|||||||||||
|
Net income (loss)
|
2,675
|
|
(1,292
|
)
|
2,790
|
|
2,547
|
|
(4,045
|
)
|
2,675
|
|
|||||||||||
|
Other comprehensive income (loss), net of tax
|
(587
|
)
|
200
|
|
(587
|
)
|
(587
|
)
|
974
|
|
(587
|
)
|
|||||||||||
|
Total comprehensive income (loss)
|
$
|
2,088
|
|
$
|
(1,092
|
)
|
$
|
2,203
|
|
$
|
1,960
|
|
$
|
(3,071
|
)
|
$
|
2,088
|
|
|||||
138
Condensed Consolidating
Balance Sheet
April 29, 2016
CIFSA Senior Notes
|
(in millions)
|
Parent Company Guarantor (Medtronic plc)
|
Subsidiary Issuer (CIFSA)
|
Subsidiary Guarantors
|
Subsidiary Non-guarantors
|
Consolidating
Adjustments
|
Total
|
|||||||||||||||||
|
ASSETS
|
|||||||||||||||||||||||
|
Current assets:
|
|||||||||||||||||||||||
|
Cash and cash equivalents
|
$
|
—
|
|
$
|
208
|
|
$
|
—
|
|
$
|
2,668
|
|
$
|
—
|
|
$
|
2,876
|
|
|||||
|
Investments
|
—
|
|
—
|
|
—
|
|
9,758
|
|
—
|
|
9,758
|
|
|||||||||||
|
Accounts receivable, net
|
—
|
|
—
|
|
—
|
|
5,562
|
|
—
|
|
5,562
|
|
|||||||||||
|
Inventories
|
—
|
|
—
|
|
—
|
|
3,473
|
|
—
|
|
3,473
|
|
|||||||||||
|
Intercompany receivable
|
389
|
|
—
|
|
61
|
|
20,469
|
|
(20,919
|
)
|
—
|
|
|||||||||||
|
Tax assets
|
—
|
|
—
|
|
—
|
|
697
|
|
—
|
|
697
|
|
|||||||||||
|
Prepaid expenses and other current assets
|
24
|
|
—
|
|
—
|
|
1,210
|
|
—
|
|
1,234
|
|
|||||||||||
|
Total current assets
|
413
|
|
208
|
|
61
|
|
43,837
|
|
(20,919
|
)
|
23,600
|
|
|||||||||||
|
Property, plant and equipment, net
|
—
|
|
—
|
|
1
|
|
4,840
|
|
—
|
|
4,841
|
|
|||||||||||
|
Goodwill
|
—
|
|
—
|
|
—
|
|
41,500
|
|
—
|
|
41,500
|
|
|||||||||||
|
Other intangible assets, net
|
—
|
|
—
|
|
—
|
|
26,899
|
|
—
|
|
26,899
|
|
|||||||||||
|
Long-term tax assets
|
—
|
|
—
|
|
—
|
|
1,383
|
|
—
|
|
1,383
|
|
|||||||||||
|
Investment in subsidiaries
|
73,108
|
|
41,582
|
|
68,875
|
|
—
|
|
(183,565
|
)
|
—
|
|
|||||||||||
|
Intercompany loans receivable
|
3,000
|
|
8,253
|
|
11,465
|
|
27,724
|
|
(50,442
|
)
|
—
|
|
|||||||||||
|
Other assets
|
—
|
|
—
|
|
—
|
|
1,559
|
|
—
|
|
1,559
|
|
|||||||||||
|
Total assets
|
$
|
76,521
|
|
$
|
50,043
|
|
$
|
80,402
|
|
$
|
147,742
|
|
$
|
(254,926
|
)
|
$
|
99,782
|
|
|||||
|
LIABILITIES AND SHAREHOLDERS’ EQUITY
|
|||||||||||||||||||||||
|
Current liabilities:
|
|||||||||||||||||||||||
|
Short-term borrowings
|
$
|
—
|
|
$
|
—
|
|
$
|
—
|
|
$
|
993
|
|
$
|
—
|
|
$
|
993
|
|
|||||
|
Accounts payable
|
—
|
|
—
|
|
—
|
|
1,709
|
|
—
|
|
1,709
|
|
|||||||||||
|
Intercompany payable
|
20,486
|
|
—
|
|
—
|
|
433
|
|
(20,919
|
)
|
—
|
|
|||||||||||
|
Accrued compensation
|
32
|
|
—
|
|
—
|
|
1,680
|
|
—
|
|
1,712
|
|
|||||||||||
|
Accrued income taxes
|
11
|
|
—
|
|
—
|
|
555
|
|
—
|
|
566
|
|
|||||||||||
|
Deferred tax liabilities
|
—
|
|
—
|
|
—
|
|
—
|
|
—
|
|
—
|
|
|||||||||||
|
Other accrued expenses
|
1
|
|
24
|
|
—
|
|
2,160
|
|
—
|
|
2,185
|
|
|||||||||||
|
Total current liabilities
|
20,530
|
|
24
|
|
—
|
|
7,530
|
|
(20,919
|
)
|
7,165
|
|
|||||||||||
|
Long-term debt
|
—
|
|
3,382
|
|
—
|
|
26,865
|
|
—
|
|
30,247
|
|
|||||||||||
|
Long-term accrued compensation and retirement benefits
|
—
|
|
—
|
|
—
|
|
1,759
|
|
—
|
|
1,759
|
|
|||||||||||
|
Long-term accrued income taxes
|
10
|
|
—
|
|
—
|
|
2,893
|
|
—
|
|
2,903
|
|
|||||||||||
|
Long-term intercompany loans payable
|
3,918
|
|
14,689
|
|
14,298
|
|
17,537
|
|
(50,442
|
)
|
—
|
|
|||||||||||
|
Long-term deferred tax liabilities
|
—
|
|
—
|
|
—
|
|
3,729
|
|
—
|
|
3,729
|
|
|||||||||||
|
Other long-term liabilities
|
—
|
|
—
|
|
—
|
|
1,916
|
|
—
|
|
1,916
|
|
|||||||||||
|
Total liabilities
|
24,458
|
|
18,095
|
|
14,298
|
|
62,229
|
|
(71,361
|
)
|
47,719
|
|
|||||||||||
|
Shareholders’ equity
|
52,063
|
|
31,948
|
|
66,104
|
|
85,513
|
|
(183,565
|
)
|
52,063
|
|
|||||||||||
|
Total liabilities and shareholders’ equity
|
$
|
76,521
|
|
$
|
50,043
|
|
$
|
80,402
|
|
$
|
147,742
|
|
$
|
(254,926
|
)
|
$
|
99,782
|
|
|||||
139
Condensed Consolidating
Balance Sheet
April 24, 2015
CIFSA Senior Notes
|
(in millions)
|
Parent Company Guarantor (Medtronic plc)
|
Subsidiary Issuer (CIFSA)
|
Subsidiary Guarantors
|
Subsidiary Non-guarantors
|
Consolidating
Adjustments
|
Total
|
|||||||||||||||||
|
ASSETS
|
|||||||||||||||||||||||
|
Current assets:
|
|||||||||||||||||||||||
|
Cash and cash equivalents
|
$
|
263
|
|
$
|
728
|
|
$
|
170
|
|
$
|
3,682
|
|
$
|
—
|
|
$
|
4,843
|
|
|||||
|
Investments
|
—
|
|
—
|
|
—
|
|
14,637
|
|
—
|
|
14,637
|
|
|||||||||||
|
Accounts receivable, net
|
—
|
|
—
|
|
—
|
|
5,112
|
|
—
|
|
5,112
|
|
|||||||||||
|
Inventories
|
—
|
|
—
|
|
—
|
|
3,463
|
|
—
|
|
3,463
|
|
|||||||||||
|
Intercompany receivable
|
259
|
|
—
|
|
269
|
|
20,506
|
|
(21,034
|
)
|
—
|
|
|||||||||||
|
Tax assets
|
—
|
|
—
|
|
—
|
|
1,335
|
|
—
|
|
1,335
|
|
|||||||||||
|
Prepaid expenses and other current assets
|
4
|
|
—
|
|
6
|
|
1,444
|
|
—
|
|
1,454
|
|
|||||||||||
|
Total current assets
|
526
|
|
728
|
|
445
|
|
50,179
|
|
(21,034
|
)
|
30,844
|
|
|||||||||||
|
Property, plant and equipment, net
|
—
|
|
—
|
|
1
|
|
4,698
|
|
—
|
|
4,699
|
|
|||||||||||
|
Goodwill
|
—
|
|
—
|
|
—
|
|
40,530
|
|
—
|
|
40,530
|
|
|||||||||||
|
Other intangible assets, net
|
—
|
|
—
|
|
—
|
|
28,101
|
|
—
|
|
28,101
|
|
|||||||||||
|
Long-term tax assets
|
—
|
|
—
|
|
—
|
|
774
|
|
—
|
|
774
|
|
|||||||||||
|
Investment in subsidiaries
|
70,233
|
|
28,663
|
|
61,768
|
|
—
|
|
(160,664
|
)
|
—
|
|
|||||||||||
|
Intercompany loans receivable
|
3,000
|
|
7,401
|
|
11,303
|
|
17,082
|
|
(38,786
|
)
|
—
|
|
|||||||||||
|
Other assets
|
—
|
|
—
|
|
—
|
|
1,737
|
|
—
|
|
1,737
|
|
|||||||||||
|
Total assets
|
$
|
73,759
|
|
$
|
36,792
|
|
$
|
73,517
|
|
$
|
143,101
|
|
$
|
(220,484
|
)
|
$
|
106,685
|
|
|||||
|
LIABILITIES AND SHAREHOLDERS’ EQUITY
|
|||||||||||||||||||||||
|
Current liabilities:
|
|||||||||||||||||||||||
|
Short-term borrowings
|
$
|
—
|
|
$
|
1,002
|
|
$
|
—
|
|
$
|
1,432
|
|
$
|
—
|
|
$
|
2,434
|
|
|||||
|
Accounts payable
|
—
|
|
—
|
|
2
|
|
1,608
|
|
—
|
|
1,610
|
|
|||||||||||
|
Intercompany payable
|
20,506
|
|
—
|
|
279
|
|
249
|
|
(21,034
|
)
|
—
|
|
|||||||||||
|
Accrued compensation
|
1
|
|
—
|
|
—
|
|
1,610
|
|
—
|
|
1,611
|
|
|||||||||||
|
Accrued income taxes
|
19
|
|
—
|
|
—
|
|
916
|
|
—
|
|
935
|
|
|||||||||||
|
Deferred tax liabilities
|
3
|
|
—
|
|
—
|
|
116
|
|
—
|
|
119
|
|
|||||||||||
|
Other accrued expenses
|
—
|
|
40
|
|
1
|
|
2,423
|
|
—
|
|
2,464
|
|
|||||||||||
|
Total current liabilities
|
20,529
|
|
1,042
|
|
282
|
|
8,354
|
|
(21,034
|
)
|
9,173
|
|
|||||||||||
|
Long-term debt
|
—
|
|
4,581
|
|
—
|
|
29,171
|
|
—
|
|
33,752
|
|
|||||||||||
|
Long-term accrued compensation and retirement benefits
|
—
|
|
—
|
|
—
|
|
1,535
|
|
—
|
|
1,535
|
|
|||||||||||
|
Long-term accrued income taxes
|
—
|
|
—
|
|
—
|
|
2,476
|
|
—
|
|
2,476
|
|
|||||||||||
|
Long-term intercompany loans payable
|
—
|
|
8,385
|
|
10,002
|
|
20,399
|
|
(38,786
|
)
|
—
|
|
|||||||||||
|
Long-term deferred tax liabilities
|
—
|
|
—
|
|
—
|
|
4,700
|
|
—
|
|
4,700
|
|
|||||||||||
|
Other long-term liabilities
|
—
|
|
—
|
|
—
|
|
1,819
|
|
—
|
|
1,819
|
|
|||||||||||
|
Total liabilities
|
20,529
|
|
14,008
|
|
10,284
|
|
68,454
|
|
(59,820
|
)
|
53,455
|
|
|||||||||||
|
Shareholders’ equity
|
53,230
|
|
22,784
|
|
63,233
|
|
74,647
|
|
(160,664
|
)
|
53,230
|
|
|||||||||||
|
Total liabilities and shareholders’ equity
|
$
|
73,759
|
|
$
|
36,792
|
|
$
|
73,517
|
|
$
|
143,101
|
|
$
|
(220,484
|
)
|
$
|
106,685
|
|
|||||
140
Condensed Consolidating
Statement of Cash Flows
Fiscal Year Ended
April 29, 2016
CIFSA Senior Notes
|
(in millions)
|
Parent Company Guarantor (Medtronic plc)
|
Subsidiary Issuer (CIFSA)
|
Subsidiary Guarantors
|
Subsidiary Non-guarantors
|
Consolidating
Adjustments
|
Total
|
|||||||||||||||||
|
Operating Activities:
|
|||||||||||||||||||||||
|
Net cash provided by (used in) operating activities
|
$
|
297
|
|
$
|
4,208
|
|
$
|
604
|
|
$
|
4,114
|
|
$
|
(4,005
|
)
|
$
|
5,218
|
|
|||||
|
Investing Activities:
|
|||||||||||||||||||||||
|
Acquisitions, net of cash acquired
|
—
|
|
—
|
|
—
|
|
(1,266
|
)
|
53
|
|
(1,213
|
)
|
|||||||||||
|
Additions to property, plant, and equipment
|
—
|
|
—
|
|
—
|
|
(1,046
|
)
|
—
|
|
(1,046
|
)
|
|||||||||||
|
Purchases of marketable securities
|
—
|
|
—
|
|
—
|
|
(5,406
|
)
|
—
|
|
(5,406
|
)
|
|||||||||||
|
Sales and maturities of marketable securities
|
—
|
|
—
|
|
—
|
|
9,924
|
|
—
|
|
9,924
|
|
|||||||||||
|
Net (increase) decrease in intercompany loans receivable
|
—
|
|
(8,193
|
)
|
(164
|
)
|
(3,302
|
)
|
11,659
|
|
—
|
|
|||||||||||
|
Sales of subsidiaries
|
—
|
|
—
|
|
53
|
|
—
|
|
(53
|
)
|
—
|
|
|||||||||||
|
Capital contributions paid
|
—
|
|
(720
|
)
|
(4,959
|
)
|
—
|
|
5,679
|
|
—
|
|
|||||||||||
|
Other investing activities, net
|
—
|
|
—
|
|
—
|
|
(14
|
)
|
—
|
|
(14
|
)
|
|||||||||||
|
Net cash provided by (used in) investing activities
|
—
|
|
(8,913
|
)
|
(5,070
|
)
|
(1,110
|
)
|
17,338
|
|
2,245
|
|
|||||||||||
|
Financing Activities:
|
|||||||||||||||||||||||
|
Acquisition-related contingent consideration
|
—
|
|
—
|
|
—
|
|
(22
|
)
|
—
|
|
(22
|
)
|
|||||||||||
|
Change in short-term borrowings, net
|
—
|
|
—
|
|
—
|
|
7
|
|
—
|
|
7
|
|
|||||||||||
|
Repayment of short-term borrowings (maturities greater than 90 days)
|
—
|
|
—
|
|
(139
|
)
|
—
|
|
—
|
|
(139
|
)
|
|||||||||||
|
Proceeds from short-term borrowings (maturities greater than 90 days)
|
—
|
|
—
|
|
139
|
|
—
|
|
—
|
|
139
|
|
|||||||||||
|
Issuance of long-term debt
|
—
|
|
—
|
|
—
|
|
—
|
|
—
|
|
—
|
|
|||||||||||
|
Payments on long-term debt
|
—
|
|
(2,121
|
)
|
—
|
|
(3,011
|
)
|
—
|
|
(5,132
|
)
|
|||||||||||
|
Dividends to shareholders
|
(2,139
|
)
|
—
|
|
—
|
|
—
|
|
—
|
|
(2,139
|
)
|
|||||||||||
|
Issuance of ordinary shares
|
491
|
|
—
|
|
—
|
|
—
|
|
—
|
|
491
|
|
|||||||||||
|
Repurchase of ordinary shares
|
(2,830
|
)
|
—
|
|
—
|
|
—
|
|
—
|
|
(2,830
|
)
|
|||||||||||
|
Net intercompany loan borrowings (repayments)
|
3,918
|
|
6,306
|
|
4,296
|
|
(2,861
|
)
|
(11,659
|
)
|
—
|
|
|||||||||||
|
Intercompany dividend paid
|
—
|
|
—
|
|
—
|
|
(4,005
|
)
|
4,005
|
|
—
|
|
|||||||||||
|
Capital Contributions received
|
—
|
|
—
|
|
—
|
|
5,679
|
|
(5,679
|
)
|
—
|
|
|||||||||||
|
Other financing activities
|
—
|
|
—
|
|
—
|
|
82
|
|
—
|
|
82
|
|
|||||||||||
|
Net cash provided by (used in) financing activities
|
(560
|
)
|
4,185
|
|
4,296
|
|
(4,131
|
)
|
(13,333
|
)
|
(9,543
|
)
|
|||||||||||
|
Effect of exchange rate changes on cash and cash equivalents
|
—
|
|
—
|
|
—
|
|
113
|
|
—
|
|
113
|
|
|||||||||||
|
Net change in cash and cash equivalents
|
(263
|
)
|
(520
|
)
|
(170
|
)
|
(1,014
|
)
|
—
|
|
(1,967
|
)
|
|||||||||||
|
Cash and cash equivalents at beginning of period
|
263
|
|
728
|
|
170
|
|
3,682
|
|
—
|
|
4,843
|
|
|||||||||||
|
Cash and cash equivalents at end of period
|
$
|
—
|
|
$
|
208
|
|
$
|
—
|
|
$
|
2,668
|
|
$
|
—
|
|
$
|
2,876
|
|
|||||
141
Condensed Consolidating
Statement of Cash Flows
Fiscal Year Ended
April 24, 2015
CIFSA Senior Notes
|
(in millions)
|
Parent Company Guarantor (Medtronic plc)
|
Subsidiary Issuer (CIFSA)
|
Subsidiary Guarantors
|
Subsidiary Non-guarantors
|
Consolidating
Adjustments
|
Total
|
|||||||||||||||||
|
Operating Activities:
|
|||||||||||||||||||||||
|
Net cash provided by (used in) operating activities
|
$
|
26
|
|
$
|
1,238
|
|
$
|
142
|
|
$
|
4,596
|
|
$
|
(1,100
|
)
|
$
|
4,902
|
|
|||||
|
Investing Activities:
|
|||||||||||||||||||||||
|
Acquisitions, net of cash acquired
|
(9,700
|
)
|
440
|
|
—
|
|
(5,624
|
)
|
—
|
|
(14,884
|
)
|
|||||||||||
|
Additions to property, plant, and equipment
|
—
|
|
—
|
|
(1
|
)
|
(570
|
)
|
—
|
|
(571
|
)
|
|||||||||||
|
Purchases of marketable securities
|
—
|
|
—
|
|
—
|
|
(7,582
|
)
|
—
|
|
(7,582
|
)
|
|||||||||||
|
Sales and maturities of marketable securities
|
—
|
|
—
|
|
—
|
|
5,890
|
|
—
|
|
5,890
|
|
|||||||||||
|
Net (increase) decrease in intercompany loans receivable
|
—
|
|
(59
|
)
|
29
|
|
(10,626
|
)
|
10,656
|
|
—
|
|
|||||||||||
|
Capital contributions paid
|
—
|
|
(937
|
)
|
—
|
|
—
|
|
937
|
|
—
|
|
|||||||||||
|
Other investing activities, net
|
—
|
|
—
|
|
—
|
|
89
|
|
—
|
|
89
|
|
|||||||||||
|
Net cash provided by (used in) investing activities
|
(9,700
|
)
|
(556
|
)
|
28
|
|
(18,423
|
)
|
11,593
|
|
(17,058
|
)
|
|||||||||||
|
Financing Activities:
|
|||||||||||||||||||||||
|
Acquisition-related contingent consideration
|
—
|
|
—
|
|
—
|
|
(85
|
)
|
—
|
|
(85
|
)
|
|||||||||||
|
Change in short-term borrowings, net
|
—
|
|
—
|
|
—
|
|
(1
|
)
|
—
|
|
(1
|
)
|
|||||||||||
|
Repayment of short-term borrowings (maturities greater than 90 days)
|
—
|
|
—
|
|
(150
|
)
|
—
|
|
—
|
|
(150
|
)
|
|||||||||||
|
Proceeds from short-term borrowings (maturities greater than 90 days)
|
—
|
|
—
|
|
150
|
|
—
|
|
—
|
|
150
|
|
|||||||||||
|
Issuance of long-term debt
|
—
|
|
—
|
|
—
|
|
19,942
|
|
—
|
|
19,942
|
|
|||||||||||
|
Payments on long-term debt
|
—
|
|
(51
|
)
|
—
|
|
(1,217
|
)
|
—
|
|
(1,268
|
)
|
|||||||||||
|
Dividends to shareholders
|
(435
|
)
|
—
|
|
—
|
|
(902
|
)
|
—
|
|
(1,337
|
)
|
|||||||||||
|
Issuance of ordinary shares
|
172
|
|
—
|
|
—
|
|
477
|
|
—
|
|
649
|
|
|||||||||||
|
Repurchase of ordinary shares
|
(300
|
)
|
—
|
|
—
|
|
(1,620
|
)
|
—
|
|
(1,920
|
)
|
|||||||||||
|
Net intercompany loan borrowings (repayments)
|
10,500
|
|
97
|
|
—
|
|
59
|
|
(10,656
|
)
|
—
|
|
|||||||||||
|
Intercompany dividend paid
|
—
|
|
—
|
|
—
|
|
(1,100
|
)
|
1,100
|
|
—
|
|
|||||||||||
|
Capital contributions received
|
—
|
|
—
|
|
—
|
|
937
|
|
(937
|
)
|
—
|
|
|||||||||||
|
Other financing activities
|
—
|
|
—
|
|
—
|
|
(31
|
)
|
—
|
|
(31
|
)
|
|||||||||||
|
Net cash provided by (used in) financing activities
|
9,937
|
|
46
|
|
—
|
|
16,459
|
|
(10,493
|
)
|
15,949
|
|
|||||||||||
|
Effect of exchange rate changes on cash and cash equivalents
|
—
|
|
—
|
|
—
|
|
(353
|
)
|
—
|
|
(353
|
)
|
|||||||||||
|
Net change in cash and cash equivalents
|
263
|
|
728
|
|
170
|
|
2,279
|
|
—
|
|
3,440
|
|
|||||||||||
|
Cash and cash equivalents at beginning of period
|
—
|
|
—
|
|
—
|
|
1,403
|
|
—
|
|
1,403
|
|
|||||||||||
|
Cash and cash equivalents at end of period
|
$
|
263
|
|
$
|
728
|
|
$
|
170
|
|
$
|
3,682
|
|
$
|
—
|
|
$
|
4,843
|
|
|||||
142
Not applicable.
Disclosure Controls and Procedures
Our management, with the participation of our Chief Executive Officer and Chief Financial Officer, has evaluated the effectiveness of the design and operation of our disclosure controls and procedures (as defined in Rule 13a-15(e) under the Securities Exchange Act of 1934, as amended (the Exchange Act)) and changes in the Company’s internal control over financial reporting (as defined in Rule 13a-15(f) under the Exchange Act) as of the end of the period covered by this report. Based upon that evaluation, the Chief Executive Officer and Chief Financial Officer have concluded that, as of the end of the period covered by this annual report, our disclosure controls and procedures (as defined in Rule 13a-15(e) of the Exchange Act) are effective.
Management’s Annual Report on Internal Control Over Financial Reporting
Management is responsible for establishing and maintaining adequate internal control over financial reporting for the Company (as defined in Exchange Act Rule 13a-15(f)). Management conducted an evaluation of the effectiveness of internal control over financial reporting based on the framework in
Internal Control – Integrated Framework (2013)
issued by the Committee of Sponsoring Organizations of the Treadway Commission (COSO). Based on this evaluation, management concluded that the Company’s internal control over financial reporting was effective as of
April 29, 2016
. Our internal control over financial reporting as of
April 29, 2016
, has been audited by PricewaterhouseCoopers LLP, an independent registered public accounting firm who has also audited our consolidated financial statements, as stated in their report in the section entitled “Report of Independent Registered Public Accounting Firm,” which expresses an unqualified opinion on the effectiveness of the Company’s internal control over financial reporting as of
April 29, 2016
, which is included in “Item 8. Financial Statements and Supplementary Data” in this Annual Report on Form 10-K.
Changes in Internal Control over Financial Reporting
There have been no changes in the Company's internal control over financial reporting during the Company's most recently completed fiscal quarter that have materially affected, or are reasonably likely to materially affect, the Company's internal control over financial reporting.
None.
143
The sections entitled “Proposal 1 — Election of Directors — Directors and Nominees,” “Governance of Medtronic — Committees of the Board and Meetings,” and “Share Ownership Information — Section 16(a) Beneficial Ownership Reporting Compliance” in our Proxy Statement for our
2016
Annual General Meeting of Shareholders, which will be filed no later than 120 days after
April 29, 2016
, are incorporated herein by reference. See also “Executive Officers of Medtronic” herein.
We have adopted a written Code of Ethics that applies to our Chief Executive Officer, Chief Financial Officer, Corporate Treasurer, Corporate Controller, and other senior financial officers performing similar functions who are identified from time to time by the Chief Executive Officer. We have also adopted a written Code of Business Conduct and Ethics for Members of the Board of Directors. The Code of Ethics for Senior Financial Officers, which is part of our broader Code of Conduct applicable to all employees, and the Code of Business Conduct and Ethics for Members of the Board of Directors are posted on our website,
www.medtronic.com
under the "About Medtronic" menu, under the “Investors” caption, and under the “Corporate Governance” subcaption. Any amendments to, or waivers for executive officers or directors of, these ethics codes will be disclosed on our website promptly following the date of such amendment or waiver.
The sections entitled “Governance of Medtronic — Director Compensation,” “Governance of Medtronic — Compensation Committee — Compensation Committee Interlocks and Insider Participation,” “Compensation Discussion and Analysis (CD&A),” and “Executive Compensation” in our Proxy Statement for our
2016
Annual General Meeting of Shareholders, which will be filed no later than 120 days after
April 29, 2016
, are incorporated herein by reference. The section entitled “Compensation Committee Report” in our Proxy Statement for our
2016
Annual General Meeting of Shareholders, which will be filed no later than 120 days after
April 29, 2016
, is furnished herein by reference.
The sections entitled “Share Ownership Information – Significant Shareholders,” “Share Ownership Information – Beneficial Ownership of Management,” and “Executive Compensation — Equity Compensation Plan Information” in our Proxy Statement for our
2016
Annual General Meeting of Shareholders, which will be filed no later than 120 days after
April 29, 2016
, are incorporated herein by reference.
The sections entitled “Proposal 1 — Election of Directors — Director Independence” and “Proposal 1 — Election of Directors — Related Transactions and Other Matters” in our Proxy Statement for our
2016
Annual General Meeting of Shareholders, which will be filed no later than 120 days after
April 29, 2016
, are incorporated herein by reference.
The sections entitled “Governance of Medtronic — Audit Committee — Audit Committee Pre-Approval Policies” and “Audit and Non-Audit Fees” in our Proxy Statement for our
2016
Annual General Meeting of Shareholders, which will be filed no later than 120 days after
April 29, 2016
, are incorporated herein by reference.
144
|
(a)
|
1. Financial Statement Schedules
|
|
|
Schedule II. Valuation and Qualifying Accounts — years ended April 29, 2016, April 24, 2015, and April 25, 2014.
|
|
|
All other schedules are omitted because they are not applicable or the required information is shown in the financial statements or notes thereto.
|
|
|
2. Exhibits
|
|
Exhibit No.
|
Description
|
||
|
2.1
|
Transaction Agreement, dated as of June 15, 2014, among Medtronic, Inc., Covidien plc, Medtronic plc (formerly known as Kalani I Limited), Makani II Limited, Aviation Acquisition Co., Inc., and Aviation Merger Sub, LLC (incorporated by reference to Exhibit 2.1 to Medtronic plc’s Amendment No. 5 to the Registration Statement on Form S-4, filed on November 20, 2014, File No. 333-197406).
|
||
|
2.2
|
Appendix III to the Rule 2.5 Announcement (Conditions Appendix) (incorporated by reference to Exhibit 2.2 to Medtronic, Inc.’s Current Report on Form 8-K, filed on June 16, 2014, File No. 001-07707).
|
||
|
2.3
|
Expenses Reimbursement Agreement, dated as of June 15, 2014, by and between Covidien plc and Medtronic, Inc. (incorporated by reference to Exhibit 2.3 to Medtronic, Inc.’s Current Report on Form 8-K, filed on June 16, 2014, File No. 001-07707).
|
||
|
2.4
|
Separation and Distribution Agreement, dated as of June 29, 2007, by and among Tyco International Ltd., Covidien Ltd. and Tyco Electronics Ltd. (incorporated by reference to Exhibit 2.1 to Covidien plc’s Current Report on Form 8-K, filed on July 5, 2007, File No. 001-33259).
|
||
|
2.5
|
Separation and Distribution Agreement, dated as of June 28, 2013, between Covidien plc and Mallinckrodt plc (incorporated by reference to Exhibit 2.1 to Covidien plc’s Current Report on Form 8-K filed on July 1, 2013, File No. 001-33259).
|
||
|
3.1
|
Certificate of Incorporation of Medtronic plc (incorporated by reference to Exhibit 3.1 to Medtronic plc’s Current Report on Form 8-K, filed on January 27, 2015, File No. 001-36820).
|
||
|
3.2
|
Amended and Restated Memorandum and Articles of Association of Medtronic plc (incorporated by reference to Exhibit 3.1 to Medtronic plc’s Current Report on Form 8-K12B, filed on January 27, 2015, File No. 001-36820).
|
||
|
4.1
|
Form of Indenture between Medtronic, Inc. and Wells Fargo Bank, National Association (incorporated by reference to Exhibit 4.1 to Medtronic, Inc.’s Amendment No. 2 to the Registration Statement on Form S-4, filed on January 10, 2005, File No. 333-121239).
|
||
|
4.2
|
Indenture, dated as of September 15, 2005, between Medtronic, Inc. and Wells Fargo Bank, N. A. (including the Forms of Notes thereof) (incorporated by reference to Exhibit 4.1 to Medtronic, Inc.’s Registration Statement on Form S-4, filed December 6, 2005, File No. 333-130163).
|
||
|
4.3
|
First Supplemental Indenture, dated as of January 26, 2015, by and among Medtronic plc, Medtronic, Inc., Medtronic Global Holdings S.C.A. and Wells Fargo Bank, National Association (incorporated by reference to Exhibit 4.1 to Medtronic plc’s Current Report on Form 8-K12B, filed on January 27, 2015, File No. 001-36820).
|
||
|
4.4
|
Form of Indenture between Medtronic, Inc. and Wells Fargo Bank, National Association regarding 2009 offering (incorporated by reference to Exhibit 4.1 to Medtronic, Inc.’s Registration Statement on Form S-3, filed on March 9, 2009, File No. 333-157777).
|
||
|
4.5
|
First Supplemental Indenture, dated March 12, 2009, between Medtronic, Inc. and Wells Fargo Bank, National Association (including the Forms of Notes thereof) (incorporated by reference to Exhibit 4.1 to Medtronic, Inc.’s Current Report on Form 8-K, filed on March 12, 2009, File No. 001-07707).
|
||
|
4.6
|
Second Supplemental Indenture, dated March 16, 2010, between Medtronic, Inc. and Wells Fargo Bank, National Association (including the Forms of Notes thereof) (incorporated by reference to Exhibit 4.1 to Medtronic, Inc.’s Current Report on Form 8-K, filed on March 16, 2010, File No. 001-07707).
|
||
145
|
4.7
|
Third Supplemental Indenture, dated March 15, 2011, between Medtronic, Inc. and Wells Fargo Bank, National Association (including the Forms of Notes thereof) (incorporated by reference to Exhibit 4.1 to Medtronic, Inc.’s Current report on Form 8-K, filed on March 16, 2011, File No. 001-07707).
|
||
|
4.8
|
Fourth Supplemental Indenture, dated March 19, 2012, between Medtronic, Inc. and Wells Fargo Bank, National Association (including the Forms of Notes thereof) (incorporated by reference to Exhibit 4.2 to Medtronic, Inc.’s Current Report on Form 8-K, filed on March 20, 2012, File No. 001-07707).
|
||
|
4.9
|
Fifth Supplemental Indenture, dated March 26, 2013, between Medtronic, Inc. and Wells Fargo Bank, National Association (including the Forms of Notes thereof) (incorporated by reference to Exhibit 4.1 to Medtronic, Inc.’s Current Report on Form 8-K, filed on March 26, 2013, File No. 001-07707).
|
||
|
4.10
|
Sixth Supplemental Indenture, dated February 27, 2014, between Medtronic, Inc. and Wells Fargo Bank, National Association (including the Form of Global Note thereof) (incorporated by reference to Exhibit 4.2 to Medtronic, Inc.’s Current Report on Form 8-K, filed on February 27, 2014, File No. 001-07707).
|
||
|
4.11
|
Seventh Supplemental Indenture, dated as of January 26, 2015, by and among Medtronic plc, Medtronic, Inc., Medtronic Global Holdings S.C.A. and Wells Fargo Bank, National Association (incorporated by reference to Exhibit 4.2 to Medtronic plc’s Current Report on Form 8-K12B, filed on January 27, 2015, File No. 001-36820).
|
||
|
4.12
|
Indenture, dated December 10, 2014, between Medtronic, Inc. and Wells Fargo Bank, National Association (incorporated by reference to Exhibit 4.1 to Medtronic, Inc.’s Current Report on Form 8-K filed with the Commission on December 10, 2014, File No. 001-07707).
|
||
|
4.13
|
First Supplemental Indenture, dated December 10, 2014, between Medtronic, Inc. and Wells Fargo Bank, National Association (including Form of Floating Rate Senior Notes due 2020, Form of 1.500% Senior Notes due 2018, Form of 2.500% Senior Notes due 2020, Form of 3.150% Senior Notes due 2022, Form of 3.500% Senior Notes due 2025, Form of 4.375% Senior Notes due 2035 and Form of 4.625% Senior Notes due 2045) (incorporated by reference to Exhibit 4.2 of Medtronic, Inc.’s Current Report on Form 8-K filed with the Commission on December 10, 2014, File No. 001-07707).
|
||
|
4.14
|
Second Supplemental Indenture, dated as of January 26, 2015, by and among Medtronic plc and Wells Fargo Bank, National Association (incorporated by reference to Exhibit 4.3 to Medtronic plc’s Current Report on Form 8-K12B, filed on January 27, 2015, File No. 001-36820).
|
||
|
4.15
|
Third Supplemental Indenture, dated as of January 26, 2015, by and among Medtronic Global Holdings S.C.A. and Wells Fargo Bank, National Association (incorporated by reference to Exhibit 4.4 to Medtronic plc’s Current Report on Form 8-K12B, filed on January 27, 2015, File No. 001-36820).
|
||
|
4.16
|
Indenture, dated as of October 22, 2007, by and among Covidien International Finance S.A., Covidien Ltd. and Deutsche Bank Trust Company Americas (incorporated by reference to Exhibit 4.1(a) to Covidien plc’s Current Report on Form 8-K filed on October 22, 2007, File No. 001-33259).
|
||
|
4.17
|
First Supplemental Indenture, dated as of October 22, 2007, by and among Covidien International Finance S.A., Covidien Ltd. 1and Deutsche Bank Trust Company Americas (incorporated by reference to Exhibit 4.1(b) to the Covidien plc’s Current Report on Form 8-K filed on October 22, 2007, File No. 001-33259).
|
||
|
4.18
|
Second Supplemental Indenture, dated as of October 22, 2007, by and among Covidien International Finance S.A., Covidien Ltd. and Deutsche Bank Trust Company Americas (incorporated by reference to Exhibit 4.1(c) to the Covidien plc’s Current Report on Form 8-K filed on October 22, 2007, File No. 001-33259).
|
||
|
4.19
|
Third Supplemental Indenture, dated as of October 22, 2007, by and among Covidien International Finance S.A., Covidien Ltd. and Deutsche Bank Trust Company Americas (incorporated by reference to Exhibit 4.1(d) to Covidien plc’s Current Report on Form 8-K filed on October 22, 2007, File No. 001-33259).
|
||
|
4.20
|
Fourth Supplemental Indenture, dated as of October 22, 2007, by and among Covidien International Finance S.A., Covidien Ltd. and Deutsche Bank Trust Company Americas (incorporated by reference to Exhibit 4.1(e) to Covidien plc’s Current Report on Form 8-K filed on October 22, 2007, File No. 001-33259).
|
||
146
|
4.21
|
Fifth Supplemental Indenture, dated as of June 4, 2009, by and among Covidien International Finance S.A., Covidien Ltd., Covidien plc and Deutsche Bank Trust Company Americas (incorporated by reference to Exhibit 4.1 to Covidien plc’s Current Report on Form 8-K12G3 filed on June 5, 2009, File No. 001-33259).
|
||
|
4.22
|
Sixth Supplemental Indenture, dated as of June 28, 2010, among Covidien International Finance S.A., Covidien Ltd., Covidien plc and Deutsche Bank Trust Company Americas (incorporated by reference to Exhibit 4.1 to Coviden plc’s Current Report on Form 8-K filed on June 28, 2010, File No. 001-33259).
|
||
|
4.23
|
Seventh Supplemental Indenture, dated as of May 30, 2012, among Covidien International Finance S.A., Covidien Ltd., Covidien plc and Deutsche Bank Trust Company Americas (incorporated by reference to Exhibit 4.1 to Covidien plc’s Current Report on Form 8-K filed on May 30, 2012, File No. 001-33259).
|
||
|
4.24
|
Eighth Supplemental Indenture, dated as of May 16, 2013, among Covidien International Finance S.A., Covidien Ltd., Covidien plc and Deutsche Bank Trust Company Americas (incorporated by reference to Exhibit 4.1 to Covidien plc’s Current Report on Form 8-K filed on May 16, 2013, File No. 001-33259).
|
||
|
4.25
|
Ninth Supplemental Indenture, dated as of January 26, 2015, by and among Medtronic plc, Medtronic Global Holdings S.C.A., Covidien public limited company, Covidien International Finance S.A., Covidien Ltd. and Deutsche Bank Trust Company Americas (incorporated by reference to Exhibit 4.5 to Medtronic plc’s Current Report on Form 8-K12B, filed on January 27, 2015, File No. 001-36820).
|
||
|
4.26
|
Registration Rights Agreement, dated December 10, 2014, by and among Medtronic, Inc. and Merrill Lynch, Pierce, Fenner & Smith Incorporated, Deutsche Bank Securities Inc. and J.P. Morgan Securities LLC, as representatives of the several initial purchasers (incorporated by reference to Exhibit 4.10 to Medtronic, Inc.’s Current Report on Form 8-K filed with the Commission on December 10, 2014, File No. 001-07707)
|
||
|
4.27
|
Joinder Agreement to the Registration Rights Agreement, dated as of January 26, 2015, by and among Medtronic plc and Medtronic Global Holdings S.C.A. (incorporated by reference to Exhibit 4.6 to Medtronic plc’s Current Report on Form 8-K12B, filed on January 27, 2015, File No. 001-36820).
|
||
|
10.1
|
Senior Unsecured Term Loan Credit Agreement, dated as of November 7, 2014, by and among Medtronic, Inc., Medtronic Holdings Limited, Medtronic Global Holdings SCA, the lenders from time to time party thereto and Bank of America, N.A., as administrative agent (incorporated by reference to Exhibit 10.2 to Medtronic Inc.’s Current Report on Form 8-K, filed on November 10, 2014, File No. 001-07707).
|
||
|
10.2
|
Amendment and Restatement Agreement, dated as of November 7, 2014, by and among Medtronic, Inc., Medtronic plc (formerly known as Medtronic Holdings Limited), Medtronic Global Holdings S.C.A., the lenders from time to time party thereto, and Bank of America, N.A., as administrative agent and issuing bank (incorporated by reference to Exhibit 10.3 to Medtronic, Inc.’s Current Report on Form 8-K, filed on November 10, 2014, File No. 001-07707).
|
||
|
10.3
|
Senior Unsecured Bridge Credit Agreement, dated as of November 7, 2014, by and among Medtronic, Inc., Medtronic Holdings Limited, Medtronic Global Holdings SCA, the lenders from time to time party thereto, and Bank of America, N.A., as administrative agent (incorporated by reference to Exhibit 10.1 to Medtronic, Inc.’s Current Report on Form 8-K, filed on November 10, 2014, File No. 001-07707).
|
||
|
10.4
|
Senior Unsecured Bridge Credit Agreement, dated as of June 15, 2014, by and among Medtronic, Inc., Kalani I Limited, the lenders from time to time party thereto, and Bank of America, N.A., as administrative agent (incorporated by reference to Exhibit 10.1 to Medtronic, Inc.’s Current Report on Form 8-K, filed on June 18, 2014, File No. 001-07707).
|
||
|
10.5
|
Senior Unsecured Cash Bridge Credit Agreement, dated as of June 15, 2014, by and among Makani II Limited, Kalani I Limited, the lenders from time to time party thereto, and Bank of America, N.A., as administrative agent (incorporated by reference to Exhibit 10.2 to Medtronic, Inc.’s Current Report on Form 8-K, filed on June 18, 2014, File No. 001-07707).
|
||
|
10.6
|
Amendment dated September 30, 2015, to Senior Unsecured Term Loan Credit Agreement, dated as of November 7, 2014, by and among Medtronic, Inc., Medtronic Holdings Limited, Medtronic Global Holdings, SCA, the lenders from time to time party thereto, and Bank of America, N.A., as administrative agent. (incorporated by reference to Exhibit 10.1 to Medtronic plc’s Form 10-Q for the quarter ended October 30, 2015, filed on December 9, 2015, File No. 001-36820).
|
||
147
|
10.7
|
Amendment dated September 30, 2015, to Amended and Restated Revolving Credit Agreement, dated as of November 7, 2014, by and among Medtronic, Inc., Medtronic Holdings Limited, Medtronic Global Holdings, SCA, the lenders from time to time party thereto, and Bank of America, N.A., as administrative agent and issuing bank (incorporated by reference to Exhibit 10.2 to Medtronic plc’s Form 10-Q for the quarter ended October 30, 2015,
filed on December 9, 2015, File No. 001-36820).
|
||
|
10.8
|
Amended and Restated Five-Year Senior Credit Agreement, dated as of May 23, 2014, among Covidien International Finance S.A., Covidien plc, the lenders party thereto and Citibank, N.A., as administrative agent (incorporated by reference to Exhibit 10.1 to Covidien plc’s Current Report on Form 8-K, filed on May 28, 2014, File No. 001-33259).
|
||
|
10.9
|
Tax Sharing Agreement, dated as of June 29, 2007, by and among Tyco International Ltd., Covidien Ltd. and Tyco Electronics Ltd. (incorporated by reference to Exhibit 10.1 to Covidien plc’s Current Report on Form 8-K, filed on July 5, 2007, File No. 001-33259).
|
||
|
10.10
|
Tax Matters Agreement, dated as of June 28, 2013, between Covidien plc and Mallinckrodt plc (incorporated by reference to Exhibit 10.1 to Covidien plc’s Current Report on Form 8-K filed on July 1, 2013, File No. 001-33259).
|
||
|
10.11
|
Employee Matters Agreement, dated as of June 28, 2013, between Covidien plc and Mallinckrodt plc (incorporated by reference to Exhibit 10.2 to Covidien plc’s Current Report on Form 8-K filed on July 1, 2013, File No. 001-33259).
|
||
|
10.12
|
Transition Services Agreement, dated as of June 28, 2013, between Covidien plc and Mallinckrodt plc (incorporated by reference to Exhibit 10.3 to Covidien plc’s Current Report on Form 8-K filed on July 1, 2013, File No. 001-33259).
|
||
|
10.13
|
Form of Deed of Indemnification (incorporated by reference to Exhibit 10.1 to Medtronic plc’s Current Report on Form 8-K12B, filed on January 27, 2015, File No. 001-36820).
|
||
|
10.14
|
Form of Indemnification Agreement (incorporated by reference to Exhibit 10.2 to Medtronic plc’s Current Report on Form 8-K12B, filed on January 27, 2015, File No. 001-36820).
|
||
|
*10.15
|
Letter Agreement by and between Medtronic, Inc. and Omar Ishrak dated May 11, 2011 (incorporated by reference to Exhibit 10.1 to Medtronic, Inc.’s Current Report on Form 8-K, filed on May 11, 2011, File No. 001-07707).
|
||
|
*10.16
|
Change of Control Severance Plan - Section 16B Officers (as amended and restated as of January 26, 2015) (incorporated by reference to Exhibit 10.14 to Medtronic plc’s Current Report on Form 8-K, filed on January 27, 2015, File No. 001-36820).
|
||
|
*10.17
|
Amendment to Letter Agreement dated May 11, 2011 by and between Medtronic, Inc. and Omar Ishrak (incorporated by reference to Exhibit 10.1 to Medtronic, Inc.’s Quarterly Report on Form 10-Q for the quarter ended July 29, 2011, filed September 7, 2011, File No. 001-07707).
|
||
|
*10.18
|
Amendment dated February 12, 2015 to the Letter Agreement by and between Medtronic, Inc. and Omar Ishrak dated May 11, 2011 (incorporated by reference to Exhibit 10.24 to Medtronic plc’s Quarterly Report on Form 10-Q for the quarter ended January 23, 2015, filed on February 27, 2015, File No. 001-36820).
|
||
|
*10.19
|
Letter Agreement by and between Medtronic, Inc. and Michael J. Coyle dated November 19, 2009 (incorporated by reference to Exhibit 10.55 to Medtronic, Inc.’s Annual Report on Form 10-K for the year ended April 27, 2012, filed on June 26, 2012, File No. 001-07707).
|
||
|
*10.20
|
Letter Agreement by and between Medtronic, Inc. and Carol Surface dated August 22, 2013 (incorporated by reference to Exhibit 10.44 to Medtronic, Inc.’s Annual Report on Form 10-K for the year ended April 25, 2014, filed on June 20, 2014, File No. 001-07707).
|
||
|
*10.21
|
Letter Agreement by and between Medtronic, Inc. and Hooman Hakami dated April 29, 2014 (incorporated by reference to Exhibit 10.5 of Medtronic, Inc.’s Quarterly Report on Form 10-Q for the quarter ended July 25, 2014, filed on August 29, 2014, File No. 001-07707)
|
||
|
*10.22
|
Letter Agreement by and between Medtronic, Inc. and Bradley E. Lerman dated May 2, 2014 (incorporated by reference to Exhibit 10.4 of Medtronic, Inc.’s Quarterly Report on Form 10-Q for the quarter ended July 25, 2014, filed on August 29, 2014, File No. 001-07707)
|
||
|
*10.23
|
Letter Agreement by and between Medtronic plc and Bryan C. Hanson dated February 12, 2015 (incorporated by reference to Exhibit 10.30 to Medtronic plc’s Quarterly Report on Form 10-Q for the quarter ended January 23, 2015, filed on February 27, 2015, File No. 001-36820).
|
||
148
|
*10.24
|
Letter Agreement by and between Medtronic, Inc. and Karen Parkhill dated May 2, 2016 (incorporated by reference to Exhibit 10.1 to Medtronic, plc’s Current Report on Form 8-K, filed on May 4, 2016, File No. 001-36820).
|
||
|
*10.25
|
Form of Offer Letter Amendment (incorporated by reference to Exhibit 10.25 to Medtronic plc’s Quarterly Report on Form 10-Q for the quarter ended January 23, 2015, filed on February 27, 2015, File No. 001-36820).
|
||
|
*10.26
|
1994 Stock Award Plan (amended and restated as of January 1, 2008) (incorporated by reference to Exhibit 10.1 of Medtronic, Inc.’s Quarterly Report on Form 10-Q for the quarter ended January 28, 2008, filed on March 4, 2008, File No. 001-07707).
|
||
|
*10.27
|
Amendment to the 1994 Stock Award Plan (incorporated by reference to Exhibit 10.7 to Medtronic plc’s Current Report on Form 8-K, filed on January 27, 2015, File No. 001-36820).
|
||
|
*10.28
|
1998 Outside Director Stock Compensation Plan (as amended and restated effective as of January 1, 2008) (incorporated by reference to Exhibit 10.3 to Medtronic, Inc.’s Current Report on Form 8-K, filed on February 27, 2014, File No. 001-07707)
|
||
|
*10.29
|
Amendment to the 1998 Outside Director Stock Compensation Plan (incorporated by reference to Exhibit 10.2 to Medtronic plc’s Current Report on Form 8-K, filed on January 27, 2015, File No. 001-36820).
|
||
|
*10.30
|
Form of Initial Option Agreement under the 1998 Outside Director Stock Compensation Plan (incorporated by reference to Exhibit 10.17 to Medtronic, Inc.’s Annual Report on Form 10-K for the year ended April 29, 2005, filed June 29, 2005, File No. 001-07707).
|
||
|
*10.31
|
Form of Annual Option Agreement under the 1998 Outside Director Stock Compensation Plan (incorporated by reference to Exhibit 10.18 to Medtronic, Inc.’s Annual Report on Form 10-K for the year ended April 29, 2005, filed June 29, 2005, File No. 001-07707).
|
||
|
*10.32
|
Form of Replacement Option Agreement under the 1998 Outside Director Stock Compensation Plan (incorporated by reference to Exhibit 10.19 to Medtronic, Inc.’s Annual Report on Form 10-K for the year ended April 29, 2005, filed June 29, 2005, File No. 001-07707).
|
||
|
*10.33
|
Kyphon Inc. 2002 Stock Plan (amended and restated July 26, 2007, as further amended on October 18, 2007) (incorporated by reference to Exhibit 10.6 to Medtronic, Inc.’s Quarterly Report on Form 10-Q for the quarter ended January 25, 2008, filed on March 4, 2008, File No. 001-07707).
|
||
|
*10.34
|
Addendum: Kyphon Inc. 2002 Stock Plan (dated December 13, 2007) (incorporated by reference to Exhibit 10.7 to Medtronic, Inc.’s Quarterly Report on Form 10-Q for the quarter ended January 25, 2008, filed on March 4, 2008, File No. 001-07707).
|
||
|
*10.35
|
Amendment to the Kyphon Inc. 2002 Stock Plan (incorporated by reference to Exhibit 10.1 to Medtronic plc’s Current Report on Form 8-K, filed on January 27, 2015, File No. 001-36820).
|
||
|
*10.36
|
2003 Long-Term Incentive Plan (as amended and restated effective January 1, 2008) (incorporated by reference to Exhibit 10.4 to Medtronic, Inc.’s Quarterly Report on Form 10-Q for the quarter ended January 28, 2008, filed on March 4, 2008, File No. 001-07707).
|
||
|
*10.37
|
Amendment to the 2003 Long-Term Incentive Plan (incorporated by reference to Exhibit 10.3 to Medtronic plc’s Current Report on Form 8-K, filed on January 27, 2015, File No. 001-36820).
|
||
|
*10.38
|
Form of Restricted Stock Award Agreement under 2003 Long-Term Incentive Plan (incorporated by reference to Exhibit 10.3 to Medtronic, Inc.’s Quarterly Report on Form 10-Q for the quarter ended January 28, 2005, filed on March 7, 2005, File No. 001-07707).
|
||
|
*10.39
|
Form of Non-Qualified Stock Option Agreement under 2003 Long-Term Incentive Plan (four year vesting) (incorporated by reference to Exhibit 10.1 to Medtronic, Inc.’s Quarterly Report on Form 10-Q for the quarter ended January 28, 2005, filed on March 7, 2005, File No. 001-07707).
|
||
|
*10.40
|
Form of Non-Qualified Stock Option Agreement under 2003 Long-Term Incentive Plan (immediate vesting) (incorporated by reference to Exhibit 10.2 to Medtronic, Inc.’s Quarterly Report on Form 10-Q for the quarter ended January 28, 2005, filed on March 7, 2005, File No. 001-07707).
|
||
|
*10.41
|
Form of Restricted Stock Units Award Agreement under 2003 Long-Term Incentive Plan (incorporated by reference to Exhibit 10.20 to Medtronic, Inc.’s Annual Report on Form 10-K for the year ended April 29, 2005, filed on June 29, 2005, File No. 001-07707).
|
||
149
|
*10.42
|
Form of Performance Share Award Agreement under 2003 Long-Term Incentive Plan (incorporated by reference to Exhibit 10.21 to Medtronic, Inc.’s Annual Report on Form 10-K for the year ended April 29, 2005, filed on June 29, 2005, File No. 001-07707).
|
||
|
*10.43
|
Form of Non-Qualified Stock Option Agreement under 2003 Long-Term Incentive Plan effective June 22, 2006 (incorporated by reference to Exhibit 10.23 to Medtronic, Inc.’s Annual Report on Form 10-K for the year ended April 28, 2006, filed on June 28, 2006, File No. 001-07707).
|
||
|
*10.44
|
Form of Restricted Stock Award Agreement under 2003 Long-Term Incentive Plan effective June 22, 2006 (incorporated by reference to Exhibit 10.24 to Medtronic, Inc.’s Annual Report on Form 10-K for the year ended April 28, 2006, filed on June 28, 2006, File No. 001-07707).
|
||
|
*10.45
|
Form of Restricted Stock Unit Award Agreement under 2003 Long-Term Incentive Plan effective June 22, 2006 (incorporated by reference to Exhibit 10.25 to Medtronic, Inc.’s Annual Report on Form 10-K for the year ended April 28, 2006, filed on June 28, 2006, File No. 001-07707).
|
||
|
*10.46
|
Form of Performance Award Agreement under 2003 Long-Term Incentive Plan effective June 22, 2006 (incorporated by reference to Exhibit 10.26 to Medtronic, Inc.’s Annual Report on Form 10-K for the year ended April 28, 2006, filed on June 28, 2006, File No. 001-07707).
|
||
|
*10.47
|
Form of Restricted Stock Award Agreement under 2003 Long-Term Incentive Plan (incorporated by reference to Exhibit 10.3 to Medtronic, Inc.’s Quarterly Report on Form 10-Q for the quarter ended October 26, 2007, filed on December 4, 2007, File No. 001-07707).
|
||
|
*10.48
|
Form of Restricted Stock Unit Award Agreement under 2003 Long-Term Incentive Plan (incorporated by reference to Exhibit 10.4 to Medtronic, Inc.’s Quarterly Report on Form 10-Q for the quarter ended October 26, 2007, filed on December 4, 2007, File No. 001-07707).
|
||
|
*10.49
|
Form of Non-Qualified Stock Option Agreement under 2003 Long-Term Incentive Plan (incorporated by reference to Exhibit 10.39 to Medtronic, Inc.’s Annual Report on Form 10-K for the year ended April 25, 2008, filed on June 24, 2008, File No. 001-07707).
|
||
|
*10.50
|
Form of Restricted Stock Unit Award Agreement under 2003 Long-Term Incentive Plan (incorporated by reference to Exhibit 10.40 to Medtronic, Inc.’s Annual Report on Form 10-K for the year ended April 25, 2008, filed on June 24, 2008, File No. 001-07707).
|
||
|
*10.51
|
Form of Restricted Stock Unit Award Agreement under 2003 Long-Term Incentive Plan (incorporated by reference to Exhibit 10.41 to Medtronic, Inc.’s Annual Report on Form 10-K for the year ended April 25, 2008, filed on June 24, 2008, File No. 001-07707).
|
||
|
*10.52
|
Israeli Amendment to the 2003 Long-Term Incentive Plan (incorporated by reference to Exhibit 10.5 to Medtronic, Inc.’s Quarterly Report on Form 10-Q for the quarter ended January 25, 2008, filed on March 4, 2008, File No. 001-07707).
|
||
|
*10.53
|
2008 Stock Award and Incentive Plan (as amended and restated effective August 27, 2009) (incorporated by reference to Exhibit 10.2 to Medtronic, Inc.’s Quarterly Report on Form 10-Q for the quarter ended October 30, 2009, filed on December 9, 2009, File No. 001-07707).
|
||
|
*10.54
|
Amendment to the 2008 Stock Award and Incentive Plan (incorporated by reference to Exhibit 10.4 to Medtronic plc’s Current Report on Form 8-K, filed on January 27, 2015, File No. 001-36820).
|
||
|
*10.55
|
Form of Restricted Stock Unit Award Agreement under 2008 Stock Award and Incentive Plan (incorporated by reference to Exhibit 10.2 to Medtronic, Inc.’s Quarterly Report on Form 10-Q for the quarter ended July 25, 2008, filed on September 3, 2008, File No. 001-07707).
|
||
|
*10.56
|
Form of Restricted Stock Award Agreement under 2008 Stock Award and Incentive Plan (incorporated by reference to Exhibit 10.3 to Medtronic, Inc.’s Quarterly Report on Form 10-Q for the quarter ended July 25, 2008, filed on September 3, 2008, File No. 001-07707).
|
||
|
*10.57
|
Form of Restricted Stock Award Agreement under 2008 Stock Award and Incentive Plan (incorporated by reference to Exhibit 10.4 to Medtronic, Inc.’s Quarterly Report on Form 10-Q for the quarter ended July 25, 2008, filed on September 3, 2008, File No. 001-07707).
|
||
|
*10.58
|
Form of Restricted Stock Unit Award Agreement under 2008 Stock Award and Incentive Plan (incorporated by reference to Exhibit 10.5 to Medtronic, Inc.’s Quarterly Report on Form 10-Q for the quarter ended July 25, 2008, filed on September 3, 2008, File No. 001-07707).
|
||
|
*10.59
|
Form of Non-Qualified Stock Option Agreement under 2008 Stock Award and Incentive Plan (incorporated by reference to Exhibit 10.6 to Medtronic, Inc.’s Quarterly Report on Form 10-Q for the quarter ended July 25, 2008, filed on September 3, 2008, File No. 001-07707).
|
||
150
|
*10.60
|
Terms of Non-Employee Director Compensation under 2008 Stock Award and Incentive Plan (incorporated by reference to Exhibit 10.42 to Medtronic, Inc.’s Annual Report on Form 10-K for the year ended April 27, 2012, filed on June 26, 2012, File No. 001-07707).
|
||
|
*10.61
|
Form of Non-Employee Director Initial Option Agreement under 2008 Stock Award and Incentive Plan (incorporated by reference to Exhibit 10.1 to Medtronic, Inc.’s Quarterly Report on Form 10-Q for the quarter ended October 24, 2008, filed on December 3, 2008, File No. 001-07707).
|
||
|
*10.62
|
Form of Non-Employee Director Annual Option Agreement under 2008 Stock Award and Incentive Plan (incorporated by reference to Exhibit 10.2 to Medtronic, Inc.’s Quarterly Report on Form 10-Q for the quarter ended October 24, 2008, filed on December 3, 2008, File No. 001-07707).
|
||
|
*10.63
|
Form of Non-Employee Director Deferred Unit Award Agreement under 2008 Stock Award and Incentive Plan (incorporated by reference to Exhibit 10.3 to Medtronic, Inc.’s Quarterly Report on Form 10-Q for the quarter ended October 24, 2008, filed on December 3, 2008, File No. 001-07707).
|
||
|
*10.64
|
Form of Non-Employee Restricted Stock Unit Award Agreement under Amended and Restated 2013 Stock Award and Incentive Plan (incorporated by reference to Exhibit 10.65 to Medtronic plc’s Annual Report on Form 10-K for the year ended April 24, 2015, filed on June 23, 2015, File No. 001-36820).
|
||
|
*10.65
|
Medtronic Incentive Plan (amended and restated effective January 1, 2008) (incorporated by reference to Exhibit 10.2 to Medtronic, Inc.’s Quarterly Report on Form 10-Q for the quarter ended January 28, 2008, filed on March 4, 2008, File No. 001-07707).
|
||
|
*10.66
|
Amended and Restated 2013 Stock Award and Incentive Plan (incorporated by reference to Exhibit 10.9 to Medtronic plc’s Current Report on Form 8-K, filed on January 27, 2015, File No. 001-36820).
|
||
|
*10.67
|
Israeli Amendment to the Amended and Restated 2013 Stock Award and Incentive Plan (incorporated by reference to Exhibit 10.10 to Medtronic plc’s Current Report on Form 8-K, filed on January 27, 2015, File No. 001-36820).
|
||
|
*10.68
|
Form of Non-Qualified Stock Option Agreement under Amended and Restated 2013 Stock Award and Incentive Plan (incorporated by reference to Exhibit 10.31 to Medtronic plc’s Quarterly Report on Form 10-Q for the quarter ended January 23, 2015, filed on February 27, 2015, File No. 001-36820).
|
||
|
*10.69
|
Form of Non-Employee Director Deferred Unit Award Agreement under the 2008 Stock Award and Incentive Plan (incorporated by reference to Exhibit 19.3 to Medtronic, Inc.’s Quarterly Report on Form 10-Q for the quarter ended October 24, 2008, filed on December 3, 2008, File No. 001-07707).
|
||
|
*10.70
|
Form of Non-Qualified Stock Option Agreement under 2013 Stock Award and Incentive Plan (incorporated by reference to Exhibit 10.2 to Medtronic, Inc.’s Current Report on Form 8-K, filed on August 27, 2013, File No. 001-07707).
|
||
|
*10.71
|
Form of Restricted Stock Unit Award Agreement (U.S. Employees) under 2013 Stock Award and Incentive Plan (incorporated by reference to Exhibit 10.3 to Medtronic, Inc.’s Current Report on Form 8-K, filed on August 27, 2013, File No. 001-07707).
|
||
|
*10.72
|
Form of Restricted Stock Unit Award Agreement (Non-U.S. Employees) under 2013 Stock Award and Incentive Plan (incorporated by reference to Exhibit 10.4 to Medtronic, Inc.’s Current Report on Form 8-K, filed on August 27, 2013, File No. 001-07707).
|
||
|
*10.73
|
Form of Restricted Stock Unit Award Agreement (Time-Based) under 2013 Stock Award and Incentive Plan (incorporated by reference to Exhibit 10.5 to Medtronic, Inc.’s Current Report on Form 8-K, filed on August 27, 2013, File No. 001-07707).
|
||
|
*10.74
|
Form of Restricted Stock Unit Award Agreement (Israeli-Employees) under 2013 Stock Award and Incentive Plan (incorporated by reference to Exhibit 10.8 to Medtronic, Inc.’s Current Report on Form 8-K, filed on August 27, 2013, File No. 001-07707).
|
||
|
*10.75
|
Form of Non-Qualified Stock Option Agreement under Amended and Restated 2013 Stock Award and Incentive Plan (incorporated by reference to Exhibit 10.48 to Medtronic plc’s Quarterly Report on Form 10-Q for the quarter ended January 23, 2015, filed on February 27, 2015, File No. 001-36820).
|
||
|
*10.76
|
Form of Restricted Stock Unit Award Agreement under Amended and Restated 2013 Stock Award and Incentive Plan (incorporated by reference to Exhibit 10.49 to Medtronic plc’s Quarterly Report on Form 10-Q for the quarter ended January 23, 2015, filed on February 27, 2015, File No. 001-36820).
|
||
151
|
*10.77
|
Form of Restricted Stock Unit Award Agreement under Amended and Restated 2013 Stock Award and Incentive Plan (incorporated by reference to Exhibit 10.50 to Medtronic plc’s Quarterly Report on Form 10-Q for the quarter ended January 23, 2015, filed on February 27, 2015, File No. 001-36820).
|
||
|
*10.78
|
Form of Restricted Stock Unit Award Agreement under Amended and Restated 2013 Stock Award and Incentive Plan (incorporated by reference to Exhibit 10.51 to Medtronic plc’s Quarterly Report on Form 10-Q for the quarter ended January 23, 2015, filed on February 27, 2015, File No. 001-36820).
|
||
|
*10.79
|
Form of Stock Option Agreement under Amended and Restated 2013 Stock Award and Incentive Plan (incorporated by reference to Exhibit 10.53 to Medtronic plc’s Quarterly Report on Form 10-Q for the quarter ended January 23, 2015, filed on February 27, 2015, File No. 001-36820).
|
||
|
*10.80
|
Form of Restricted Stock Unit Award Agreement under Amended and Restated 2013 Stock Award and Incentive Plan (incorporated by reference to Exhibit 10.54 to Medtronic plc’s Quarterly Report on Form 10-Q for the quarter ended January 23, 2015, filed on February 27, 2015, File No. 001-36820).
|
||
|
*10.81
|
Medtronic plc 2014 Amended and Restated Employees Stock Purchase Plan (incorporated by reference to Exhibit 10.8 to Medtronic plc’s Current Report on Form 8-K, filed on January 27, 2015, File No. 001-36820).
|
||
|
*10.82
|
Medtronic plc Incentive Plan (as amended and restated effective January 26, 2015) (incorporated by reference to Exhibit 10.11 to Medtronic plc’s Current Report on Form 8-K, filed on January 27, 2015, File No. 001-36820).
|
||
|
*10.83
|
Medtronic plc Supplemental Executive Retirement Plan (as restated generally effective January 26, 2015) (incorporated by reference to Exhibit 10.15 to Medtronic plc’s Current Report on Form 8-K, filed on January 27, 2015, File No. 001-36820).
|
||
|
*10.84
|
Medtronic plc Savings and Investment Plan (as amended and restated generally effective January 26, 2015) (incorporated by reference to Exhibit 4.22 to Medtronic plc’s Registration Statement on Form S-8 filed on January 28, 2015, File No. 333-201737).
|
||
|
*10.85
|
Medtronic plc Puerto Rico Employees’ Savings and Investment Plan (as amended and restated generally effective January 26, 2015) (incorporated by reference to Exhibit 4.23 to Medtronic plc’s Registration Statement on Form S-8 filed on January 28, 2015, File No. 333-201737).
|
||
|
*10.86
|
Medtronic plc Capital Accumulation Plan Deferral Program (as amended and restated generally effective January 26, 2015) (incorporated by reference to Exhibit 10.13 to Medtronic plc’s Current Report on Form 8-K, filed on January 27, 2015, File No. 001-36820).
|
||
|
*10.87
|
Covidien Savings Related Share Plan (incorporated by reference to Exhibit 99.3 to Covidien plc’s Post-Effective Amendment No. 1 to Registration Statement on Form S-8 filed with the Commission on June 5, 2009, File No. 333-144309).
|
||
|
*10.88
|
Covidien Stock and Incentive Plan (incorporated by reference to Exhibit 10.5 to Covidien plc’s Current Report on Form 8-K filed on March 26, 2013, File No. 001-33259).
|
||
|
*10.89
|
Covidien Separation and Distribution Agreement Equity Awards under the Separation and Distribution Agreement, dates as of June 29, 2007, by and among Tyco International Ltd., Covidien Ltd., and Tyco Electronics Ltd. (incorporated by reference to Exhibit 2.1 to Covidien plc’s Current Report on Form 8-K filed on July 5, 2007, File No. 001-33259).
|
||
|
*10.90
|
Covidien Severance Plan for U.S. Officers and Executives, as amended and restated (incorporated by reference to Exhibit 10.1 to Covidien plc’s Current Report on Form 8-K filed on September 23, 2014, File No. 001-33259).
|
||
|
*10.91
|
Covidien Change in Control Severance Plan for Certain U.S. Officers and Executives (incorporated by reference to Exhibit 10.1 to Covidien plc’s Current Report on Form 8-K filed on March 26, 2013, File No. 001-33259).
|
||
|
*10.92
|
Covidien Supplemental Savings and Retirement Plan, as amended and restated (incorporated by reference to Exhibit 10.1 to Covidien plc’s Quarterly Report on Form 10-Q for the quarter ended December 25, 2009, filed on January 26, 2010, File No. 001-33259).
|
||
|
*10.93
|
Form of Non-Competition, Non-Solicitation and Confidentiality Agreement for executive officers and certain key employees (incorporated by reference to Exhibit 10.4 to Covidien plc’s Quarterly Report on Form 10-Q for the quarter ended December 26, 2008, filed on January 29, 2009, File No. 001-33259).
|
||
152
|
*10.94
|
FY09 Grant U.S. Option Terms and Conditions (incorporated by reference to Exhibit 10.3 to Covidien plc’s Current Report on Form 8-K filed on September 23, 2014, File No. 001-33259).
|
||
|
*10.95
|
FY09 Grant U.S. Restricted Stock Unit Terms and Conditions (incorporated by reference to Exhibit 10.2 to Covidien plc’s Current Report on Form 8-K filed on November 25, 2008, File No. 001-33259).
|
||
|
*10.96
|
Deed Poll of Assumption relating to Covidien Ltd. Employee Equity Plans, dated June 4, 2009 (incorporated by reference to Exhibit 10.3 to Covidien plc’s Current Report on Form 8-K12G3 filed on June 5, 2009, File No. 001-33259).
|
||
|
*10.97
|
Director Grant Restricted Stock Unit Terms and Conditions (incorporated by reference to Exhibit 10.2 to Covidien plc’s Current Report on Form 8-K filed on March 23, 2009, File No. 001-33259).
|
||
|
*10.98
|
Founders’ Grant Standard Option Terms and Conditions (incorporated by reference to Exhibit 10.4 to Covidien plc’s Current Report on Form 8-K filed on September 23, 2014, File No. 001-33259).
|
||
|
*10.99
|
Founders’ Grant Standard Option Terms and Conditions for Directors (incorporated by reference to Exhibit 10.13 to Covidien plc’s Current Report on Form 8-K filed on July 5, 2007, File No. 001-33259).
|
||
|
*10.100
|
Form of Deed of Indemnification by and between Covidien plc and Covidien plc’s Directors and Secretary (incorporated by reference to Exhibit 10.4 to Covidien plc’s Form 10-Q for the quarter ended June 28, 2013, filed on August 5, 2013, File No. 001-33259).
|
||
|
*10.101
|
Form of Terms and Conditions of Option Award (incorporated by reference to Exhibit 10.2 to Covidien plc’s Current Report on Form 8-K filed on September 23, 2014, File No. 001-33259).
|
||
|
*10.102
|
Form of Terms and Conditions of Restricted Unit Award (incorporated by reference to Exhibit 10.3 to Covidien plc’s Quarterly Report on Form 10-Q for the quarter ended December 25, 2009, filed on January 26, 2010, File No. 001-33259).
|
||
|
*10.103
|
Form of Terms and Conditions of Performance Unit Award (incorporated by reference to Exhibit 10.4 to Covidien plc’s Quarterly Report on Form 10-Q for the quarter ended December 25, 2009, filed on January 26, 2010, File No. 001-33259).
|
||
|
*10.104
|
Amended Terms and Conditions of Performance Unit Awards FY12-FY14 (incorporated by reference to Exhibit 10.3 to Covidien plc’s Current Report on Form 8-K filed on March 26, 2013, File No. 001-33259).
|
||
|
*10.105
|
Amended Terms and Conditions of Performance Unit Awards FY13-FY15 (incorporated by reference to Exhibit 10.4 to Covidien plc’s Current Report on Form 8-K filed on March 26, 2013, File No. 001-33259).
|
||
|
*10.106
|
Form of Indemnification Agreement between Covidien Ltd. and Covidien plc’s Directors and Secretary (incorporated by reference to Exhibit 10.5 to Covidien plc’s Form 10-Q for the quarter ended June 28, 2013, filed on August 5, 2013, File No. 001-33259).
|
||
|
12.1
|
Computation of Ratio of Earnings to Fixed Charges.
|
||
|
21
|
List of Subsidiaries of Medtronic plc.
|
||
|
23
|
Consent of Independent Registered Public Accounting Firm.
|
||
|
24
|
Power of Attorney.
|
||
|
31.1
|
Certification of Chief Executive Officer pursuant to Section 302 of the Sarbanes-Oxley Act of 2002.
|
||
|
31.2
|
Certification of Chief Financial Officer pursuant to Section 302 of the Sarbanes-Oxley Act of 2002.
|
||
|
32.1
|
Certification of Chief Executive Officer pursuant to Section 906 of the Sarbanes-Oxley Act of 2002.
|
||
|
32.2
|
Certification of Chief Financial Officer pursuant to Section 906 of the Sarbanes-Oxley Act of 2002.
|
||
|
101
|
The following materials from Medtronic plc’s Annual Report on Form 10-K for the year ended April 29, 2016, formatted in Extensible Business Reporting Language (XBRL): (i) consolidated statements of income, (ii) consolidated statements of comprehensive income, (iii) consolidated balance sheets, (iv) consolidated statements of cash flows, (v) consolidated statements of shareholders’ equity, and (vi) the notes to the consolidated financial statements.
|
||
|
*Exhibits that are management contracts or compensatory plans or arrangements.
|
||
153
MEDTRONIC PLC AND SUBSIDIARIES
SCHEDULE II – VALUATION AND QUALIFYING ACCOUNTS
(in millions)
|
Additions
|
Deductions
|
|||||||||||||||||
|
Balance at
Beginning of
Fiscal Year
|
Charges to Income
|
Charges to Other Accounts
|
Other Changes (Debit) Credit
|
Balance
at End of
Fiscal Year
|
||||||||||||||
|
Allowance for doubtful accounts:
|
|
|
|
|
|
|
|
|
|
|||||||||
|
Year ended 4/29/16
|
$
|
144
|
|
$
|
49
|
|
$
|
—
|
|
$
|
(28
|
)
|
(b)
|
$
|
161
|
|
||
|
|
|
|
|
|
$
|
(4
|
)
|
(c)
|
|
|
||||||||
|
Year ended 4/24/15
|
$
|
115
|
|
$
|
35
|
|
$
|
34
|
|
(a)
|
$
|
(36
|
)
|
(b)
|
$
|
144
|
|
|
|
|
|
|
|
|
$
|
(4
|
)
|
(c)
|
|
|
||||||||
|
Year ended 4/25/14
|
$
|
98
|
|
$
|
43
|
|
$
|
—
|
|
$
|
(30
|
)
|
(b)
|
$
|
115
|
|
||
|
|
|
|
|
|
$
|
4
|
|
(c)
|
|
|
||||||||
|
Deferred tax valuation allowance:
|
||||||||||||||||||
|
Year ended 4/29/16
|
$
|
5,607
|
|
$
|
1,194
|
|
$
|
4
|
|
(a)
|
$
|
(88
|
)
|
(d)
|
$
|
7,032
|
|
|
|
|
$
|
315
|
|
(c)
|
||||||||||||||
|
Year ended 4/24/15
|
$
|
397
|
|
$
|
40
|
|
$
|
5,660
|
|
(a)
|
$
|
(56
|
)
|
(d)
|
$
|
5,607
|
|
|
|
|
$
|
(434
|
)
|
(c)
|
||||||||||||||
|
Year ended 4/25/14
|
$
|
313
|
|
$
|
104
|
|
$
|
5
|
|
$
|
(29
|
)
|
(d)
|
$
|
397
|
|
||
|
$
|
4
|
|
(c)
|
|||||||||||||||
|
(a) Reflects the impact from acquisitions
|
|
|
(b) Uncollectible accounts written off, less recoveries.
|
|
|
(c) Reflects primarily the effects of currency fluctuations.
|
|
|
(d) Decrease in deferred tax valuation allowance due to carryover attribute utilization and expiration.
|
|
154
SIGNATURES
Pursuant to the requirements of Section 13 or 15(d) of the Securities Exchange Act of 1934, the registrant has duly caused this report to be signed on its behalf by the undersigned, thereunto duly authorized.
|
|
MEDTRONIC PUBLIC LIMITED COMPANY
|
|
|
|
|
|
|
Dated: June 28, 2016
|
By:
|
/s/
Omar Ishrak
|
|
|
|
Omar Ishrak
|
|
|
|
Chairman and
|
|
|
|
Chief Executive Officer
|
Pursuant to the requirements of the Securities Exchange Act of 1934, the report has been signed below by the following persons on behalf of the registrant and in the capacities and on the dates indicated.
|
|
MEDTRONIC PUBLIC LIMITED COMPANY
|
|
|
|
|
|
|
Dated: June 28, 2016
|
By:
|
/s/
Omar Ishrak
|
|
|
|
Omar Ishrak
|
|
|
|
Chairman and
|
|
|
|
Chief Executive Officer
|
|
|
|
(Principal Executive Officer)
|
|
|
|
|
|
Dated: June 28, 2016
|
By:
|
/s/
Gary L. Ellis
|
|
|
|
Gary L. Ellis
|
|
|
|
Principal Financial and
|
|
|
|
Accounting Officer
|
|
|
|
|
|
|
Directors
|
|
|
|
|
|
|
|
|
Richard H. Anderson*
|
|
Craig Arnold*
|
||
|
Scott C. Donnelly*
|
||
|
|
|
Randall J. Hogan, III*
|
|
|
|
Omar Ishrak*
|
|
|
|
Shirley Ann Jackson, Ph.D*
|
|
|
|
Michael O. Leavitt*
|
|
|
|
James T. Lenehan*
|
|
Elizabeth G. Nabel*
|
||
|
|
|
Denise M. O’Leary*
|
|
|
|
Kendall J. Powell*
|
|
|
|
Robert C. Pozen*
|
|
|
|
Preetha Reddy*
|
*Bradley E. Lerman, by signing his name hereto, does hereby sign this document on behalf of each of the above named directors of the registrant pursuant to powers of attorney duly executed by such persons.
|
Dated: June 28, 2016
|
By:
|
/s/ Bradley E. Lerman
|
|
|
|
Bradley E. Lerman
|
155
TABLE OF CONTENTS
Part IItem 1. BusinessItem 1A. Risk FactorsItem 1B. Unresolved Staff CommentsItem 2. PropertiesItem 3. Legal ProceedingsItem 4. Mine Safety DisclosuresPart IIItem 5. Market For Medtronic S Common Equity, Related Shareholder Matters, and Issuer Purchases Of Equity SecuritiesItem 6. Selected Financial DataItem 7. Management S Discussion and Analysis Of Financial Condition and Results Of OperationsItem 7A. Quantitative and Qualitative Disclosures About Market RiskItem 8. Financial Statements and Supplementary DataItem 9. Changes in and Disagreements with Accountants on Accounting and Financial DisclosureItem 9A. Controls and ProceduresItem 9B. Other InformationPart IIIPart III Of This Annual Report on Form 10-k Incorporates Information By Reference From OurItem 10. Directors, Executive Officers, and Corporate GovernanceItem 11. Executive CompensationItem 12. Security Ownership Of Certain Beneficial Owners and Management and Related Shareholder MattersItem 13. Certain Relationships and Related Transactions, and Director IndependenceItem 14. Principal Accounting Fees and ServicesPart IVItem 15. Exhibits and Financial Statement Schedules