METLIFE INC
10-Ks and 10-Qs
|
|
|
|
|
|
|
|
|
|
|
|
|
|
|
|
|
|
|
|
|
|
|
|
|
|
|
|
|
|
|
|
|
|
|
|
|
|
|
|
|
|
|
|
|
|
|
|
|
|
|
|
|
|
|
|
|
|
|
UNITED STATES SECURITIES AND EXCHANGE COMMISSION
Washington, D.C. 20549
__________________________
Form 10-K
(Mark One)
|
þ
|
ANNUAL REPORT PURSUANT TO SECTION 13 OR 15(d) OF THE SECURITIES EXCHANGE ACT OF 1934
|
For the fiscal year ended
December 31, 2016
or
|
¨
|
TRANSITION REPORT PURSUANT TO SECTION 13 OR 15(d) OF THE SECURITIES EXCHANGE ACT OF 1934
|
For the transition period from to
Commission file number 001-15787
MetLife, Inc.
(Exact name of registrant as specified in its charter)
|
Delaware
|
|
13-4075851
|
|
(State or other jurisdiction of
incorporation or organization)
|
|
(I.R.S. Employer
Identification No.)
|
|
200 Park Avenue, New York, N.Y.
|
|
10166-0188
|
|
(Address of principal
executive offices)
|
|
(Zip Code)
|
(212) 578-9500
(Registrant’s telephone number, including area code)
Securities registered pursuant to Section 12(b) of the Act:
|
Title of each class
|
|
Name of each exchange on which registered
|
|
Common Stock, par value $0.01
|
|
New York Stock Exchange
|
|
Floating Rate Non-Cumulative Preferred Stock, Series A, par value $0.01
|
|
New York Stock Exchange
|
|
5.375% Senior Notes
|
|
Irish Stock Exchange
|
|
5.25% Senior Notes
|
|
Irish Stock Exchange
|
Securities registered pursuant to Section 12(g) of the Act:
Fixed-to-Floating Rate Non-Cumulative Preferred Stock, Series C, par value $0.01
Indicate by check mark if the registrant is a well-known seasoned issuer, as defined in Rule 405 of the Securities Act. Yes
þ
No
¨
Indicate by check mark if the registrant is not required to file reports pursuant to Section 13 or 15(d) of the Act. Yes
¨
No
þ
Indicate by check mark whether the registrant: (1) has filed all reports required to be filed by Section 13 or 15(d) of the Securities Exchange Act of 1934 during the preceding 12 months (or for such shorter period that the registrant was required to file such reports), and (2) has been subject to such filing requirements for the past 90 days. Yes
þ
No
¨
Indicate by check mark whether the registrant has submitted electronically and posted on its corporate Web site, if any, every Interactive Data File required to be submitted and posted pursuant to Rule 405 of Regulation S-T (§ 232.405 of this chapter) during the preceding 12 months (or for such shorter period that the registrant was required to submit and post such files). Yes
þ
No
¨
Indicate by check mark if disclosure of delinquent filers pursuant to Item 405 of Regulation S-K (§ 229.405 of this chapter) is not contained herein, and will not be contained, to the best of registrant’s knowledge, in definitive proxy or information statements incorporated by reference in Part III of this Form 10-K or any amendment to this Form 10-K.
þ
Indicate by check mark whether the registrant is a large accelerated filer, an accelerated filer, a non-accelerated filer, or a smaller reporting company. See the definitions of “large accelerated filer,” “accelerated filer” and “smaller reporting company” in Rule 12b-2 of the Exchange Act. (Check one):
|
Large accelerated filer
þ
|
|
Accelerated filer
¨
|
|
Non-accelerated filer
¨
(Do not check if a smaller reporting company)
|
Smaller reporting company
¨
|
|
Indicate by check mark whether the registrant is a shell company (as defined in Rule 12b-2 of the Exchange Act). Yes
¨
No
þ
The aggregate market value of the voting and non-voting common equity held by non-affiliates of the registrant at
June 30, 2016
was approximately
$43.8 billion
.
At February 23
,
2017
,
1,087,256,971
shares of the registrant’s common stock were outstanding.
DOCUMENTS INCORPORATED BY REFERENCE
Part III of this Form 10-K incorporates by reference certain information from the registrant’s definitive proxy statement for the Annual Meeting of Shareholders to be held on June 13,
2017
, to be filed by the registrant with the Securities and Exchange Commission pursuant to Regulation 14A not later than 120 days after the year ended
December 31, 2016
.
Table of Contents
|
|
|
|
|
Page
|
|
Part I
|
||||
|
Item 1.
|
|
|||
|
Item 1A.
|
|
|||
|
Item 1B.
|
|
|||
|
Item 2.
|
|
|||
|
Item 3.
|
|
|||
|
Item 4.
|
|
|||
|
Part II
|
||||
|
Item 5.
|
||||
|
Item 6.
|
||||
|
Item 7.
|
||||
|
Item 7A.
|
||||
|
Item 8.
|
||||
|
Item 9.
|
||||
|
Item 9A.
|
||||
|
Item 9B.
|
||||
|
Part III
|
||||
|
Item 10.
|
||||
|
Item 11.
|
||||
|
Item 12.
|
||||
|
Item 13.
|
||||
|
Item 14.
|
||||
|
Part IV
|
||||
|
Item 15.
|
||||
As used in this Form 10-K, “MetLife,” the “Company,” “we,” “our” and “us” refer to MetLife, Inc., a Delaware corporation incorporated in 1999, its subsidiaries and affiliates.
Note Regarding Forward-Looking Statements
This Annual Report on Form 10-K, including Management’s Discussion and Analysis of Financial Condition and Results of Operations, may contain or incorporate by reference information that includes or is based upon forward-looking statements within the meaning of the Private Securities Litigation Reform Act of 1995. Forward-looking statements give expectations or forecasts of future events. These statements can be identified by the fact that they do not relate strictly to historical or current facts. They use words such as “anticipate,” “estimate,” “expect,” “project,” “intend,” “plan,” “believe” and other words and terms of similar meaning, or are tied to future periods, in connection with a discussion of future operating or financial performance. In particular, these include statements relating to future actions, prospective services or products, future performance or results of current and anticipated services or products, sales efforts, expenses, the outcome of contingencies such as legal proceedings, trends in operations and financial results.
Any or all forward-looking statements may turn out to be wrong. They can be affected by inaccurate assumptions or by known or unknown risks and uncertainties. Many such factors will be important in determining the actual future results of MetLife, Inc., its subsidiaries and affiliates. These statements are based on current expectations and the current economic environment. They involve a number of risks and uncertainties that are difficult to predict. These statements are not guarantees of future performance. Actual results could differ materially from those expressed or implied in the forward-looking statements. Risks, uncertainties, and other factors that might cause such differences include the risks, uncertainties and other factors identified in MetLife, Inc.’s filings with the U.S. Securities and Exchange Commission. These factors include: (1) difficult conditions in the global capital markets; (2) increased volatility and disruption of the global capital and credit markets, which may affect our ability to meet liquidity needs and access capital, including through our credit facilities, generate fee income and market-related revenue and finance statutory reserve requirements and may require us to pledge collateral or make payments related to declines in value of specified assets, including assets supporting risks ceded to certain of our captive reinsurers or hedging arrangements associated with those risks; (3) exposure to global financial and capital market risks, including as a result of the pending withdrawal of the United Kingdom from the European Union, other disruption in Europe and possible withdrawal of one or more countries from the Euro zone; (4) impact on us of comprehensive financial services regulation reform, including potential regulation of MetLife, Inc. as a non-bank systemically important financial institution, or otherwise; (5) numerous rulemaking initiatives required or permitted by the Dodd-Frank Wall Street Reform and Consumer Protection Act which may impact how we conduct our business, including those compelling the liquidation of certain financial institutions; (6) regulatory, legislative or tax changes relating to our insurance, international, or other operations that may affect the cost of, or demand for, our products or services, or increase the cost or administrative burdens of providing benefits to employees; (7) adverse results or other consequences from litigation, arbitration or regulatory investigations; (8) unanticipated developments that could delay, prevent or otherwise adversely affect the separation of Brighthouse Financial; (9) our ability to address difficulties, unforeseen liabilities, asset impairments, or rating agency actions arising from (a) business acquisitions and integrating and managing the growth of such acquired businesses, (b) dispositions of businesses via sale, initial public offering, spin-off or otherwise, including failure to achieve projected operational benefit from such transactions and any restrictions, liabilities, losses or indemnification obligations arising from any transitional services or tax arrangements related to the separation of any business, or from the failure of such a separation to quality for any intended tax-free treatment; (c) entry into joint ventures, or (d) legal entity reorganizations; (10) potential liquidity and other risks resulting from our participation in a securities lending program and other transactions; including any separated business’ incurrence of debt in connection with such a separation; (11) investment losses and defaults, and changes to investment valuations; (12) changes in assumptions related to investment valuations, deferred policy acquisition costs, deferred sales inducements, value of business acquired or goodwill; (13) impairments of goodwill and realized losses or market value impairments to illiquid assets; (14) defaults on our mortgage loans; (15) the defaults or deteriorating credit of other financial institutions that could adversely affect us; (16) economic, political, legal, currency and other risks relating to our international operations, including with respect to fluctuations of exchange rates; (17) downgrades in our claims paying ability, financial strength or credit ratings; (18) a deterioration in the experience of the closed block established in connection with the reorganization of Metropolitan Life Insurance Company; (19) availability and effectiveness of reinsurance, hedging or indemnification arrangements, as well as any default or failure of counterparties to perform; (20) differences between actual claims experience and underwriting and reserving assumptions; (21) ineffectiveness of risk management policies and procedures; (22) catastrophe losses; (23) increasing cost and limited market capacity for statutory life insurance reserve financings; (24) heightened competition, including with respect to pricing, entry of new competitors, consolidation of distributors, the development of new products by new and existing competitors, and for personnel; (25) exposure to losses related to variable annuity guarantee benefits, including from significant and sustained downturns or extreme volatility in equity markets, reduced interest rates, unanticipated policyholder behavior, mortality or longevity, and any adjustment for nonperformance risk; (26) legal, regulatory and other restrictions affecting MetLife, Inc.’s ability to pay dividends and repurchase common stock; (27) MetLife,
2
Inc.’s and its subsidiary holding companies’ primary reliance, as holding companies, on dividends from its subsidiaries to meet its free cash flow targets and debt payment obligations and the applicable regulatory restrictions on the ability of the subsidiaries to pay such dividends; (28) the possibility that MetLife, Inc.’s Board of Directors may influence the outcome of stockholder votes through the voting provisions of the MetLife Policyholder Trust; (29) changes in accounting standards, practices and/or policies; (30) increased expenses relating to pension and postretirement benefit plans, as well as health care and other employee benefits; (31) inability to protect our intellectual property rights or claims of infringement of the intellectual property rights of others; (32) difficulties in marketing and distributing products through our distribution channels; (33) provisions of laws and our incorporation documents may delay, deter or prevent takeovers and corporate combinations involving MetLife; (34) the effects of business disruption or economic contraction due to disasters such as terrorist attacks, cyberattacks, other hostilities, or natural catastrophes, including any related impact on the value of our investment portfolio, our disaster recovery systems, cyber- or other information security systems and management continuity planning; (35) any failure to protect the confidentiality of client information; (36) the effectiveness of our programs and practices in avoiding giving our associates incentives to take excessive risks; and (37) other risks and uncertainties described from time to time in MetLife, Inc.’s filings with the U.S. Securities and Exchange Commission.
MetLife, Inc. does not undertake any obligation to publicly correct or update any forward-looking statement if MetLife, Inc. later becomes aware that such statement is not likely to be achieved. Please consult any further disclosures MetLife, Inc. makes on related subjects in reports to the U.S. Securities and Exchange Commission.
Note Regarding Reliance on Statements in Our Contracts
See “Exhibit Index — Note Regarding Reliance on Statements in Our Contracts” for information regarding agreements included as exhibits to this Annual Report on Form 10-K.
3
Index to Business
4
Business Overview
As used in this Form 10-K, “MetLife,” the “Company,” “we,” “our” and “us” refer to MetLife, Inc., a Delaware corporation incorporated in 1999, its subsidiaries and affiliates.
We have grown to become a global provider of life insurance, annuities, employee benefits and asset management. Through our subsidiaries and affiliates, we hold leading market positions in the United States, Japan, Latin America, Asia, Europe and the Middle East.
We are also one of the largest institutional investors in the United States with a $518.3 billion general account portfolio invested primarily in investment grade corporate bonds, structured finance securities, mortgage loans and U.S. Treasury and agency securities, as well as real estate and corporate equity, at
December 31, 2016
.
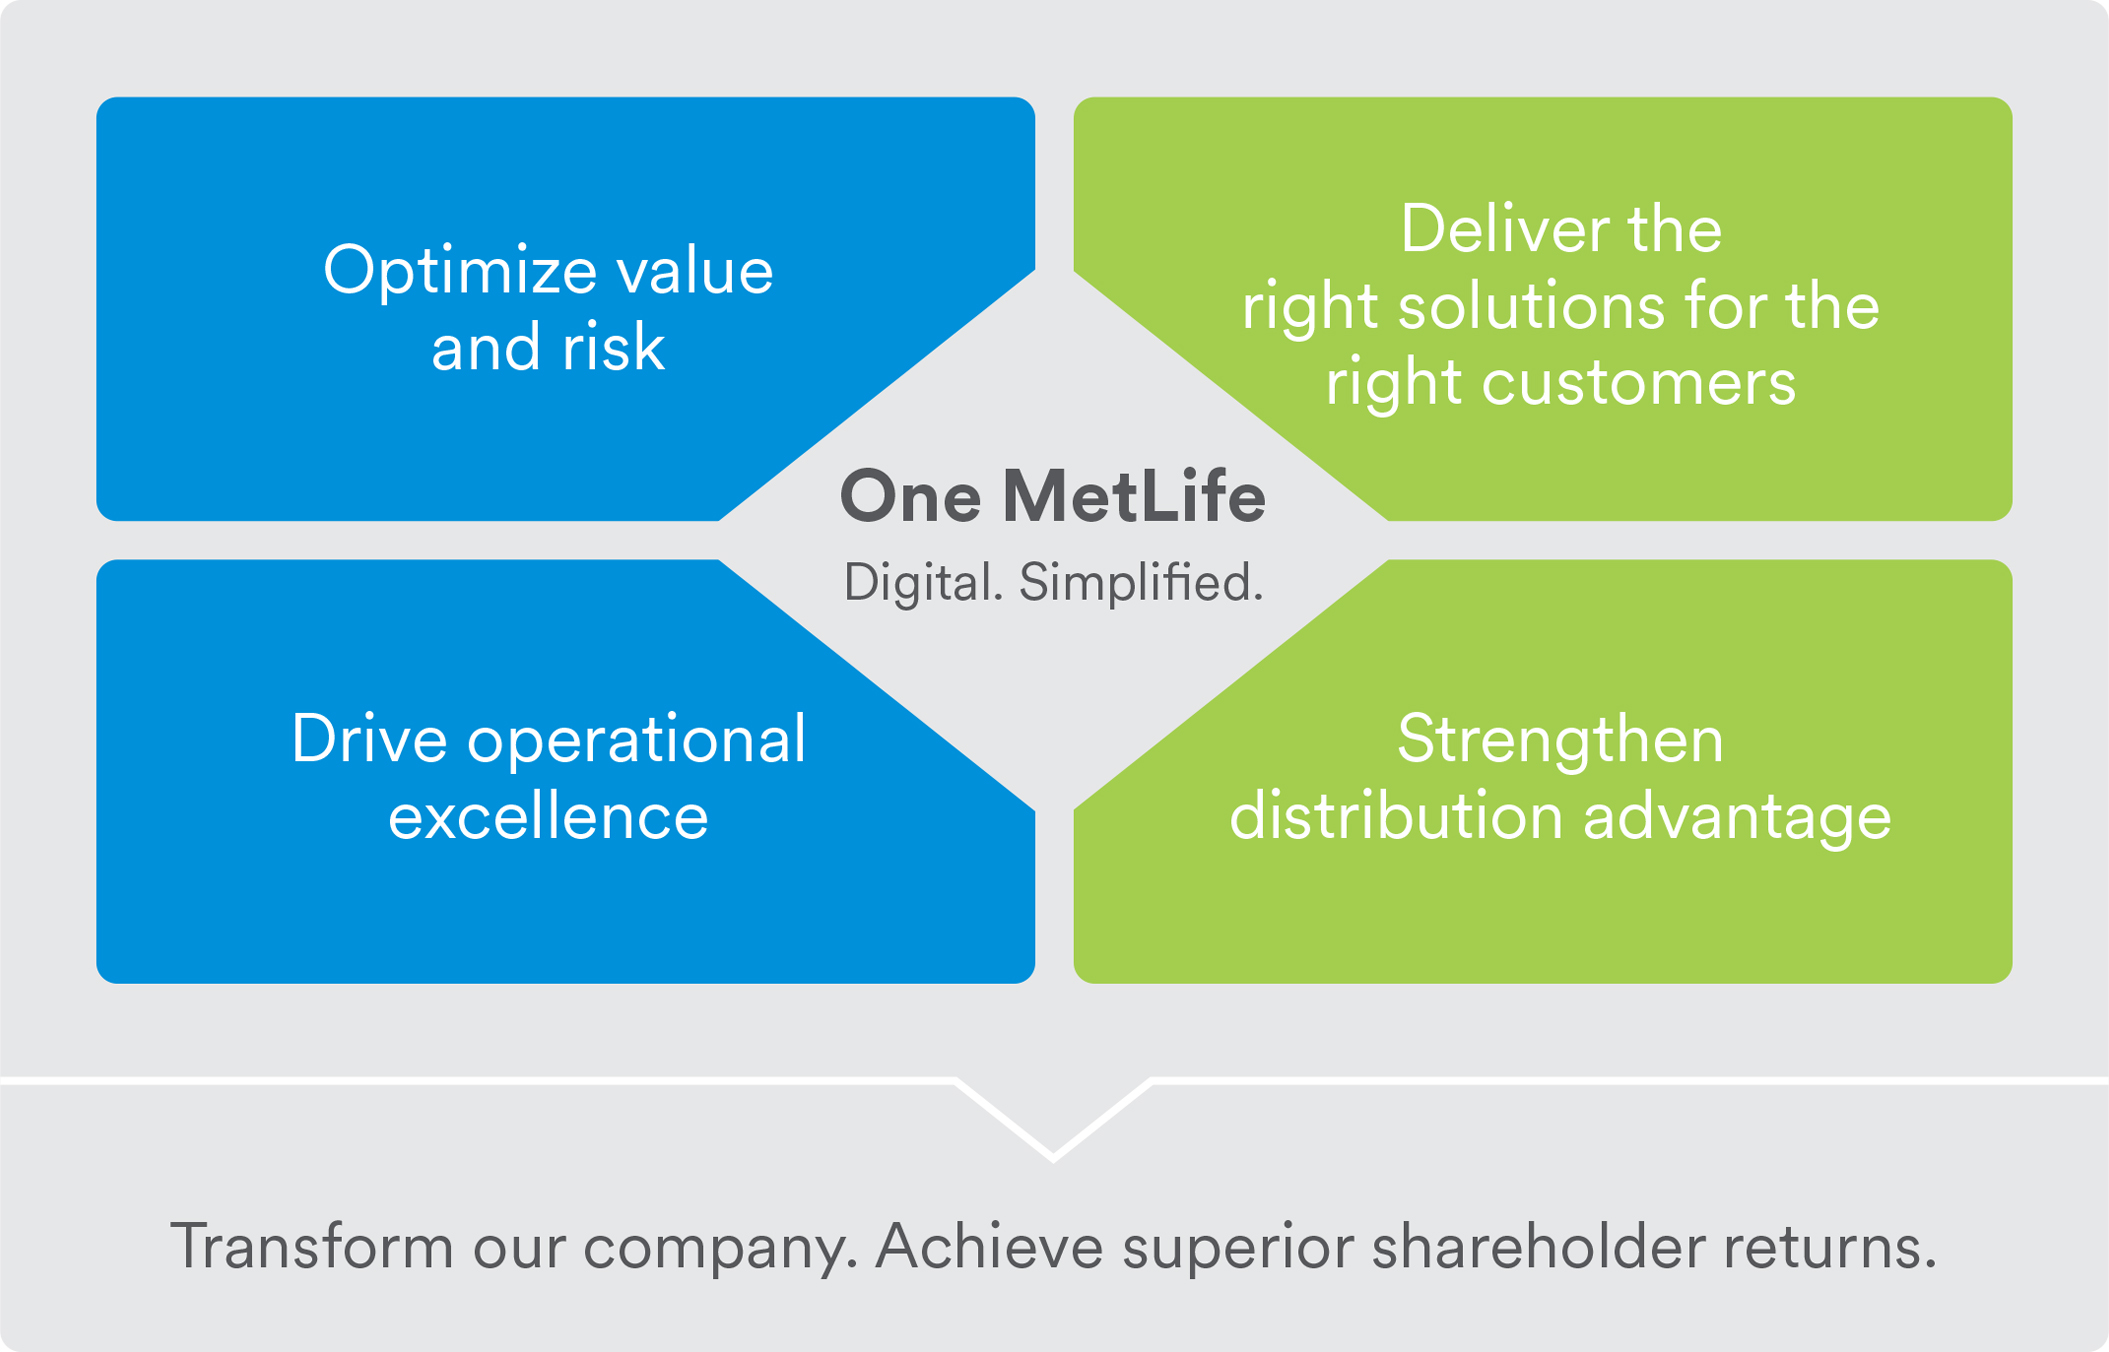
Our well-recognized brand, leading market positions, competitive and innovative product offerings and financial strength and expertise should help drive future growth and enhance shareholder value, building on a long history of fairness, honesty and integrity. Over the course of the next several years, we will pursue our refreshed enterprise strategy, focusing on transforming the Company to become more digital, driving efficiencies and innovation to achieve competitive advantage, and simplified, decreasing the costs and risks associated with our highly complex industry to customers and shareholders. One MetLife remains at the center of everything we do: collaborating, sharing best practices, and putting the enterprise first. Digital and simplified are the key enablers of our new strategic cornerstones, all of which satisfy the criteria of our Accelerating Value strategic initiative by offering customers truly differentiated value propositions that allow us to establish clear competitive advantages and ultimately drive higher levels of free cash flow:
|
●
|
|
Optimize value and risk
|
|
|
|
–
|
|
Focus on in-force and new business opportunities using Accelerating Value analysis
|
|
|
–
|
|
Optimize cash and value
|
|
|
–
|
|
Balance risk across MetLife
|
|
●
|
|
Drive operational excellence
|
|
|
|
–
|
|
Become a more efficient, high performance organization
|
|
|
–
|
|
Focus on the customer with a disciplined approach to unit cost improvement
|
5
|
●
|
|
Strengthen distribution advantage
|
|
|
|
–
|
|
Transform our distribution channels to drive productivity and efficiency through digital enablement, improved customer persistency and deeper customer relationships
|
|
●
|
|
Deliver the right solutions for the right customers
|
|
|
|
–
|
|
Use customer insights to deliver differentiated value propositions - products, services and experiences to win the right customers and earn their loyalty
|
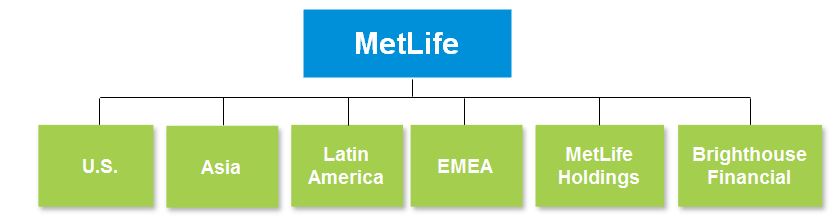
MetLife is organized into six segments: U.S.; Asia; Latin America; Europe, the Middle East and Africa (“EMEA”); MetLife Holdings; and Brighthouse Financial. In addition, the Company reports certain of its results of operations in Corporate & Other. See “— Segments and Corporate & Other,” “Management’s Discussion and Analysis of Financial Condition and Results of Operations — Executive Summary — Other Key Information” and Note
2
of the Notes to the Consolidated Financial Statements for further information on the Company’s segments and Corporate & Other. Management continues to evaluate the Company’s segment performance and allocated resources and may adjust related measurements in the future to better reflect segment profitability.
In the United States, we provide a variety of insurance and financial services products, including life, dental, disability, property & casualty, guaranteed interest, stable value and annuities to both individuals and groups.
Outside the United States, we provide life, medical, dental, credit and other accident & health insurance, as well as annuities, endowment and retirement & savings products to both individuals and groups. We believe these businesses will continue to grow more quickly than our United States businesses.
Our current initiative to separate Brighthouse Financial (comprised of a substantial portion of our former Retail segment, as well as certain portions of our former Corporate Benefit Funding segment and Corporate & Other (the “Separation”)) should enable both companies to compete more effectively, achieve strong operational and financial performance, and create long-term value for our shareholders. See “— Other Key Information.”
Revenues derived from any customer did not exceed 10% of consolidated premiums, universal life and investment-type product policy fees and other revenues for the years ended
December 31, 2016
,
2015
and
2014
. Financial information, including revenues, expenses, operating earnings, and total assets by segment, as well as premiums, universal life and investment-type product policy fees and other revenues by major product groups, is provided in
Note 2
of the Notes to the Consolidated Financial Statements. Operating revenues and operating earnings are performance measures that are not based on accounting principles generally accepted in the United States of America (“GAAP”). See “Management’s Discussion and Analysis of Financial Condition and Results of Operations — Non-GAAP and Other Financial Disclosures” for definitions of such measures.
For financial information related to revenues, total assets, and goodwill balances by geographic region, see Notes
2
and
11
of the Notes to the Consolidated Financial Statements.
6
Other Key Information
On January 12, 2016, MetLife, Inc. announced its plan to pursue the Separation. Additionally, on July 21, 2016, MetLife, Inc. announced that following the Separation, the separated business will be rebranded as “Brighthouse Financial.” On October 5, 2016, Brighthouse Financial, Inc., a subsidiary of MetLife, Inc. (“Brighthouse”), filed a registration statement on Form 10 (the “Form 10”) with the U.S. Securities and Exchange Commission (“SEC”).
On December 6, 2016, Brighthouse filed an amendment to its registration statement on Form 10 with the SEC.
The information statement filed as an exhibit to the Form 10 disclosed that the Company intends to include MetLife Insurance Company USA (“MetLife USA”), New England Life Insurance Company
(“NELICO”)
, First MetLife Investors Insurance Company
(“FMLI”),
MetLife Advisers, LLC and certain captive reinsurance companies in the proposed separated business and distribute at least 80.1% of the shares of Brighthouse’s common stock on a pro rata basis to the holders of MetLife, Inc. common stock. The ultimate form and timing of the Separation will be influenced by a number of factors, including regulatory considerations and economic conditions. MetLife continues to evaluate and pursue structural alternatives for the proposed Separation. MetLife expects that the life insurance closed block and the life and annuity business sold through Metropolitan Life Insurance Company (“MLIC”) will not be a part of Brighthouse Financial. The Separation remains subject to certain conditions, including, among others, obtaining final approval from the MetLife, Inc. Board of Directors, receipt of a favorable ruling from the Internal Revenue Service (“IRS”) and an opinion from MetLife’s tax advisor regarding certain U.S. federal income tax matters, insurance and other regulatory approvals, and an SEC declaration of the effectiveness of the Form 10.
In July 2016, MetLife, Inc. completed the sale to Massachusetts Mutual Life Insurance Company (“MassMutual”) of its U.S. retail advisor force and certain assets associated with the MetLife Premier Client Group, including all of the issued and outstanding shares of MetLife’s affiliated broker-dealer, MetLife Securities, Inc. (“MSI”), a wholly-owned subsidiary of MetLife, Inc. (the “U.S. Retail Advisor Force Divestiture”) for $291 million. MassMutual assumed all of the liabilities related to such assets that arise or occur at or after the closing of the sale. As part of the transactions, MetLife, Inc. and MassMutual entered into a product development agreement under which MetLife’s U.S. retail business will be the exclusive developer of certain annuity products to be issued by MassMutual. In the MassMutual purchase agreement, MetLife, Inc. agreed to indemnify MassMutual for certain claims, liabilities and breaches of representations and warranties up to limits described in the purchase agreement. See
Note 3
of the Notes to the Consolidated Financial Statements for further information.
On December 18, 2014,
the Finan
cial Stability Oversight Council (“FSOC”) designated MetLife, Inc. as a non-bank systemically important financial institution (“non-bank SIFI”) subject to regulation by the Board of Governors of the Federal Reserve System (the “Federal Reserve Board”) and the Federal Reserve Bank of New York (collectively with the Federal Reserve Board, the “Federal Reserve”) and the Federal Deposit Insurance Corporation (the “FDIC”), as well as to enhanced supervision and prudential standards. On March 30, 2016, the D.C. District Court ordered that the designation of MetLife, Inc. as a non-bank SIFI by the FSOC be rescinded. On April 8, 2016, the FSOC appealed the D.C. District Court’s order to the United States Court of Appeals for the District of Columbia, and oral argument was heard on October 24, 2016. If the FSOC prevails on appeal or designates MetLife, Inc. as systemically important as part of its ongoing review of non-bank financial companies, MetLife, Inc. could once again be subject to regulation as a non-bank SIFI. See “— Regulation — U.S. Regulation — Potential Regulation as a Non-Bank SIFI.”
Prior to January 1, 2016, certain international subsidiaries had a fiscal year cutoff of November 30th. Accordingly, the Company’s consolidated financial statements reflect the assets and liabilities of such subsidiaries as of November 30, 2015 and the operating results of such subsidiaries for the years ended November 30, 2015 and 2014. Effective January 1, 2016, the Company converted its Japan operations to calendar year-end reporting. The elimination of a one-month reporting lag of a subsidiary is considered a change in accounting principle and requires retrospective application. While the Company believes that eliminating the lag in the reporting of its Japan operations was preferable in order to consistently reflect events, economic conditions and global trends on the financial statements, the Company determined that it was impracticable to apply the effects of the lag elimination to financial reporting periods prior to January 1, 2015. The effect of not retroactively applying this change in accounting, however, was not material to the 2015 or 2016 consolidated financial statements. Therefore, the Company reported the cumulative effect of the change in accounting principle in net income for the year ended December 31, 2016 and did not retrospectively apply the effects of this change to prior periods. See
Note 2
of the Notes to the Consolidated Financial Statements.
7
Segments and Corporate & Other
U.S.
Product Overview
Our businesses in the U.S. segment offer a broad range of protection products and services aimed at serving the financial needs of our customers throughout their lives. These products are sold to corporations and their respective employees, other institutions and their respective members, as well as individuals. Our U.S. segment is organized into three businesses: Group Benefits, Retirement and Income Solutions and Property & Casualty.
Group Benefits
We have built a leading position in the United States group insurance market through long-standing relationships with many of the largest corporate employers in the United States.
Our Group Benefits insurance products and services include life, dental, group short- and long-term disability, individual disability, accidental death and dismemberment (“AD&D”), critical illness, vision and accident & health coverages, as well as prepaid legal plans. We also sell administrative services-only (“ASO”) arrangements to some employers. Under such ASO arrangements, the employer is at risk, as we have not issued an insurance policy. We pay claims funded by the employer and perform other administrative services on behalf of the employer.
The major products offered by our Group Benefits business are as follows:
Variable Life.
Variable life products provide insurance coverage through a contract that gives the policyholder flexibility in investment choices and, depending on the product, in premium payments and coverage amounts, with certain guarantees. Most importantly, with variable life products, premiums and account balances can be directed by the policyholder into a variety of separate account investment options or directed to the Company’s general account. In the separate account investment options, the policyholder bears the entire risk of the investment results. We collect specified fees for the management of the investment options. The policyholder’s cash value reflects the investment return of the selected investment options, net of management fees and insurance-related and other charges. In some instances, third-party money management firms manage these investment options. With some products, by maintaining a certain premium level, policyholders may have the advantage of various guarantees that may protect the death benefit from adverse investment experience.
Universal Life.
Universal life products provide insurance coverage on the same basis as variable life, except that premiums, and the resulting accumulated balances, are allocated only to the Company’s general account. We credit premiums to an account maintained for the policyholder. Premiums are credited net of specified expenses. Interest is credited to the policyholder’s account at interest rates we determine, subject to specified minimums. Specific charges are made against the policyholder’s account for the cost of insurance protection and for expenses. With some products, by maintaining a certain premium level, policyholders may have the advantage of various guarantees that may protect the death benefit from adverse investment experience.
Term Life.
Term life products provide a guaranteed benefit upon the death of the insured for a specified time period in return for the periodic payment of premiums. Specified coverage periods range from one year to 30 years, but in no event are they longer than the period over which premiums are paid. Death benefits may be level over the period or decreasing. Premiums may be guaranteed at a level amount for the coverage period or may be non-level and non-guaranteed. Term insurance products are sometimes referred to as pure protection products, in that there are typically no savings or investment elements. Term contracts expire without value at the end of the coverage period when the insured party is still living.
Dental
. Dental products provide insurance and ASO arrangements that assist employees, retirees and their families in maintaining oral health while reducing out-of-pocket expenses and providing superior customer service. Dental plans include the Preferred Dentist Program and the Dental Health Maintenance Organization.
Disability.
Group and individual disability products provide a benefit in the event of the disability of the insured. In most instances, this benefit is in the form of monthly income paid until the insured reaches age 65. In addition to income replacement, the product may be used to provide for the payment of business overhead expenses for disabled business owners or mortgage payment protection.
Retirement and Income Solutions
The Retirement and Income Solutions business provides funding and financing solutions that help institutional customers mitigate and manage liabilities primarily associated with their qualified, nonqualified and welfare employee benefit programs using a spectrum of life and annuity-based insurance and investment products.
8
The major products offered by our Retirement and Income Solutions business are as follows:
Stable Value Products.
We offer general account guaranteed interest contracts, separate account guaranteed interest contracts, and trust guaranteed interest contracts used to support the stable value option of defined contribution plans. We also offer private floating rate funding agreements that are used for money market funds, securities lending cash collateral portfolios and short-term investment funds.
General account guaranteed interest contracts are designed to provide stable value investment options within tax-qualified defined contribution plans. Traditional general account guaranteed interest contracts integrate a general account fixed maturity investment with a general account guarantee of liquidity at contract value for participant transactions.
Separate account guaranteed interest contracts are available to defined contribution plan sponsors. These contracts integrate market value returns on separate account investments with a general account guarantee of liquidity at contract value to the extent the separate account assets are not sufficient. The contracts do not have a fixed maturity date and are terminable by each party on notice.
Private floating rate funding agreements are generally privately-placed, unregistered investment contracts issued as general account obligations. Interest is credited based on an external index, generally the three-month London Interbank Offered Rate (“LIBOR”). Contracts may contain put provisions (of 90 days or longer) that allow for the contractholder to receive the account balance prior to the stated maturity date.
Pension Risk Transfers
. We offer general account and separate account annuity products, generally in connection with the termination of defined benefit pension plans. These risk transfer products include single premium buyouts that allow for full or partial transfers of pension liabilities.
General account annuity products include nonparticipating contracts. Under nonparticipating contracts, group annuity benefits may be purchased for retired and terminated employees or employees covered under terminating or ongoing pension plans. Both immediate and deferred annuities may be purchased by a single premium at issue. There are generally no cash surrender rights, with some exceptions including certain contracts that include liabilities for cash balance pension plans.
Separate account annuity products include both participating and non-participating contracts. Under participating contracts, group annuity benefits are purchased for retired, terminated, or active employees covered under active or terminated pension plans. Both immediate and deferred fixed annuities are purchased with a single premium. Under some contracts, additional annuities may be periodically purchased at then current purchase rates. The assets supporting the guaranteed benefits for each contract are held in a separate account. Some contracts require the contractholder to make periodic payments to cover investment and insurance expenses. The Company fully guarantees benefit payments and is ultimately responsible for all benefit payments. The non-participating contracts have economic features similar to our general account product, but offer the added protection of an insulated separate account. Under U.S. GAAP, these annuity contracts are treated as general account products.
Institutional Income Annuities.
These general account contracts are available for purchasing guaranteed payout annuities for employees upon retirement or termination of employment. These annuities can be either life contingent or non-life contingent. These annuities are nonparticipating, do not provide for any loan or cash surrender value and, with few exceptions, do not permit future considerations.
Torts and Settlements
. We offer innovative strategies for complex litigation settlements, primarily structured settlement annuities.
Structured settlement annuities are customized annuities designed to serve as an alternative to a lump sum payment in a lawsuit initiated because of personal injury, wrongful death, or a workers’ compensation claim or other claim for damages. Surrenders are generally not allowed, although commutations are permitted in certain circumstances. Guaranteed payments consist of life contingent annuities, term certain annuities and lump sums.
Capital Markets Investment Products.
Products we offer include funding agreements, funding agreement-backed notes and funding agreement-backed commercial paper.
Funding agreement-backed notes are part of a medium term note program, under which funding agreements are issued to a special-purpose trust that issues marketable notes in U.S. dollars or foreign currencies. The proceeds of the issuance of a series of notes are used by the trust to acquire a funding agreement with matching interest and maturity payment terms from the Company. The notes are underwritten and marketed by major investment banks’ broker-dealer operations and are sold to institutional investors.
9
Funding agreement-backed commercial paper is issued by a special purpose limited liability company which deposits the proceeds under a master funding agreement issued to it by MLIC or MetLife USA. The commercial paper receives the same short-term credit rating as MLIC or MetLife USA and is marketed by major investment banks’ broker-dealer operations. The program allows for funding agreement-backed commercial paper to be issued in U.S. dollars or foreign currencies. Due to the Separation, the MetLife USA program is inactive. Future issuances within MetLife USA will be subject to management’s discretion.
Through the Federal Home Loan Bank (“FHLB”) advance program, funding agreements have been issued by certain of our insurance subsidiaries to various branches of the FHLB. The branch of the FHLB which owns the funding agreements is determined by the insurance company’s state of domicile.
Through the Federal Agricultural Mortgage Corporation (“Farmer Mac”) program, funding agreements have been issued by
a subsidiary of Farmer Mac
, as well as to certain special purpose entities (“SPEs”) that have issued debt securities for which payment of interest and principal is secured by such funding agreements, and such debt securities are also guaranteed as to payment of interest and principal by Farmer Mac.
Other Products and Services
. We offer specialized life insurance products and funding agreements designed specifically to provide solutions for funding postretirement benefits and company-, bank- or trust-owned life insurance used to finance nonqualified benefit programs for executives.
Property & Casualty
The Property & Casualty business offers personal and commercial lines of property and casualty insurance, including private passenger automobile, homeowners’ and personal excess liability insurance. In addition, Property & Casualty offers small business owners property, liability and business interruption insurance.
The major products offered by our Property & Casualty business are as follows:
Auto Insurance.
Auto insurance policies provide coverage for private passenger automobiles, utility automobiles and vans, motorcycles, motor homes, antique or classic automobiles and trailers. We also offer traditional coverage such as liability, uninsured motorist, no fault or personal injury protection, as well as collision and comprehensive insurance.
Homeowners’ Insurance.
Homeowners’ insurance policies provide protection for homeowners, renters, condominium owners and residential landlords against losses arising out of damage to dwellings and contents from a wide variety of perils, as well as coverage for liability arising from ownership or occupancy. Other insurance includes personal excess liability (protection against losses in excess of amounts covered by other liability insurance policies), and coverage for recreational vehicles and boat owners. Most of our homeowners’ policies are traditional insurance policies for dwellings, providing protection for loss on a “replacement cost” basis. These policies also provide additional coverage for reasonable, normal living expenses incurred by policyholders that have been displaced from their homes.
Business Owners’ Insurance.
Business owners insurance provides property, liability and business interruption insurance for small business owners arising out of damages to property and/or business interruption from a variety of perils.
10
Operations
Sales Distribution
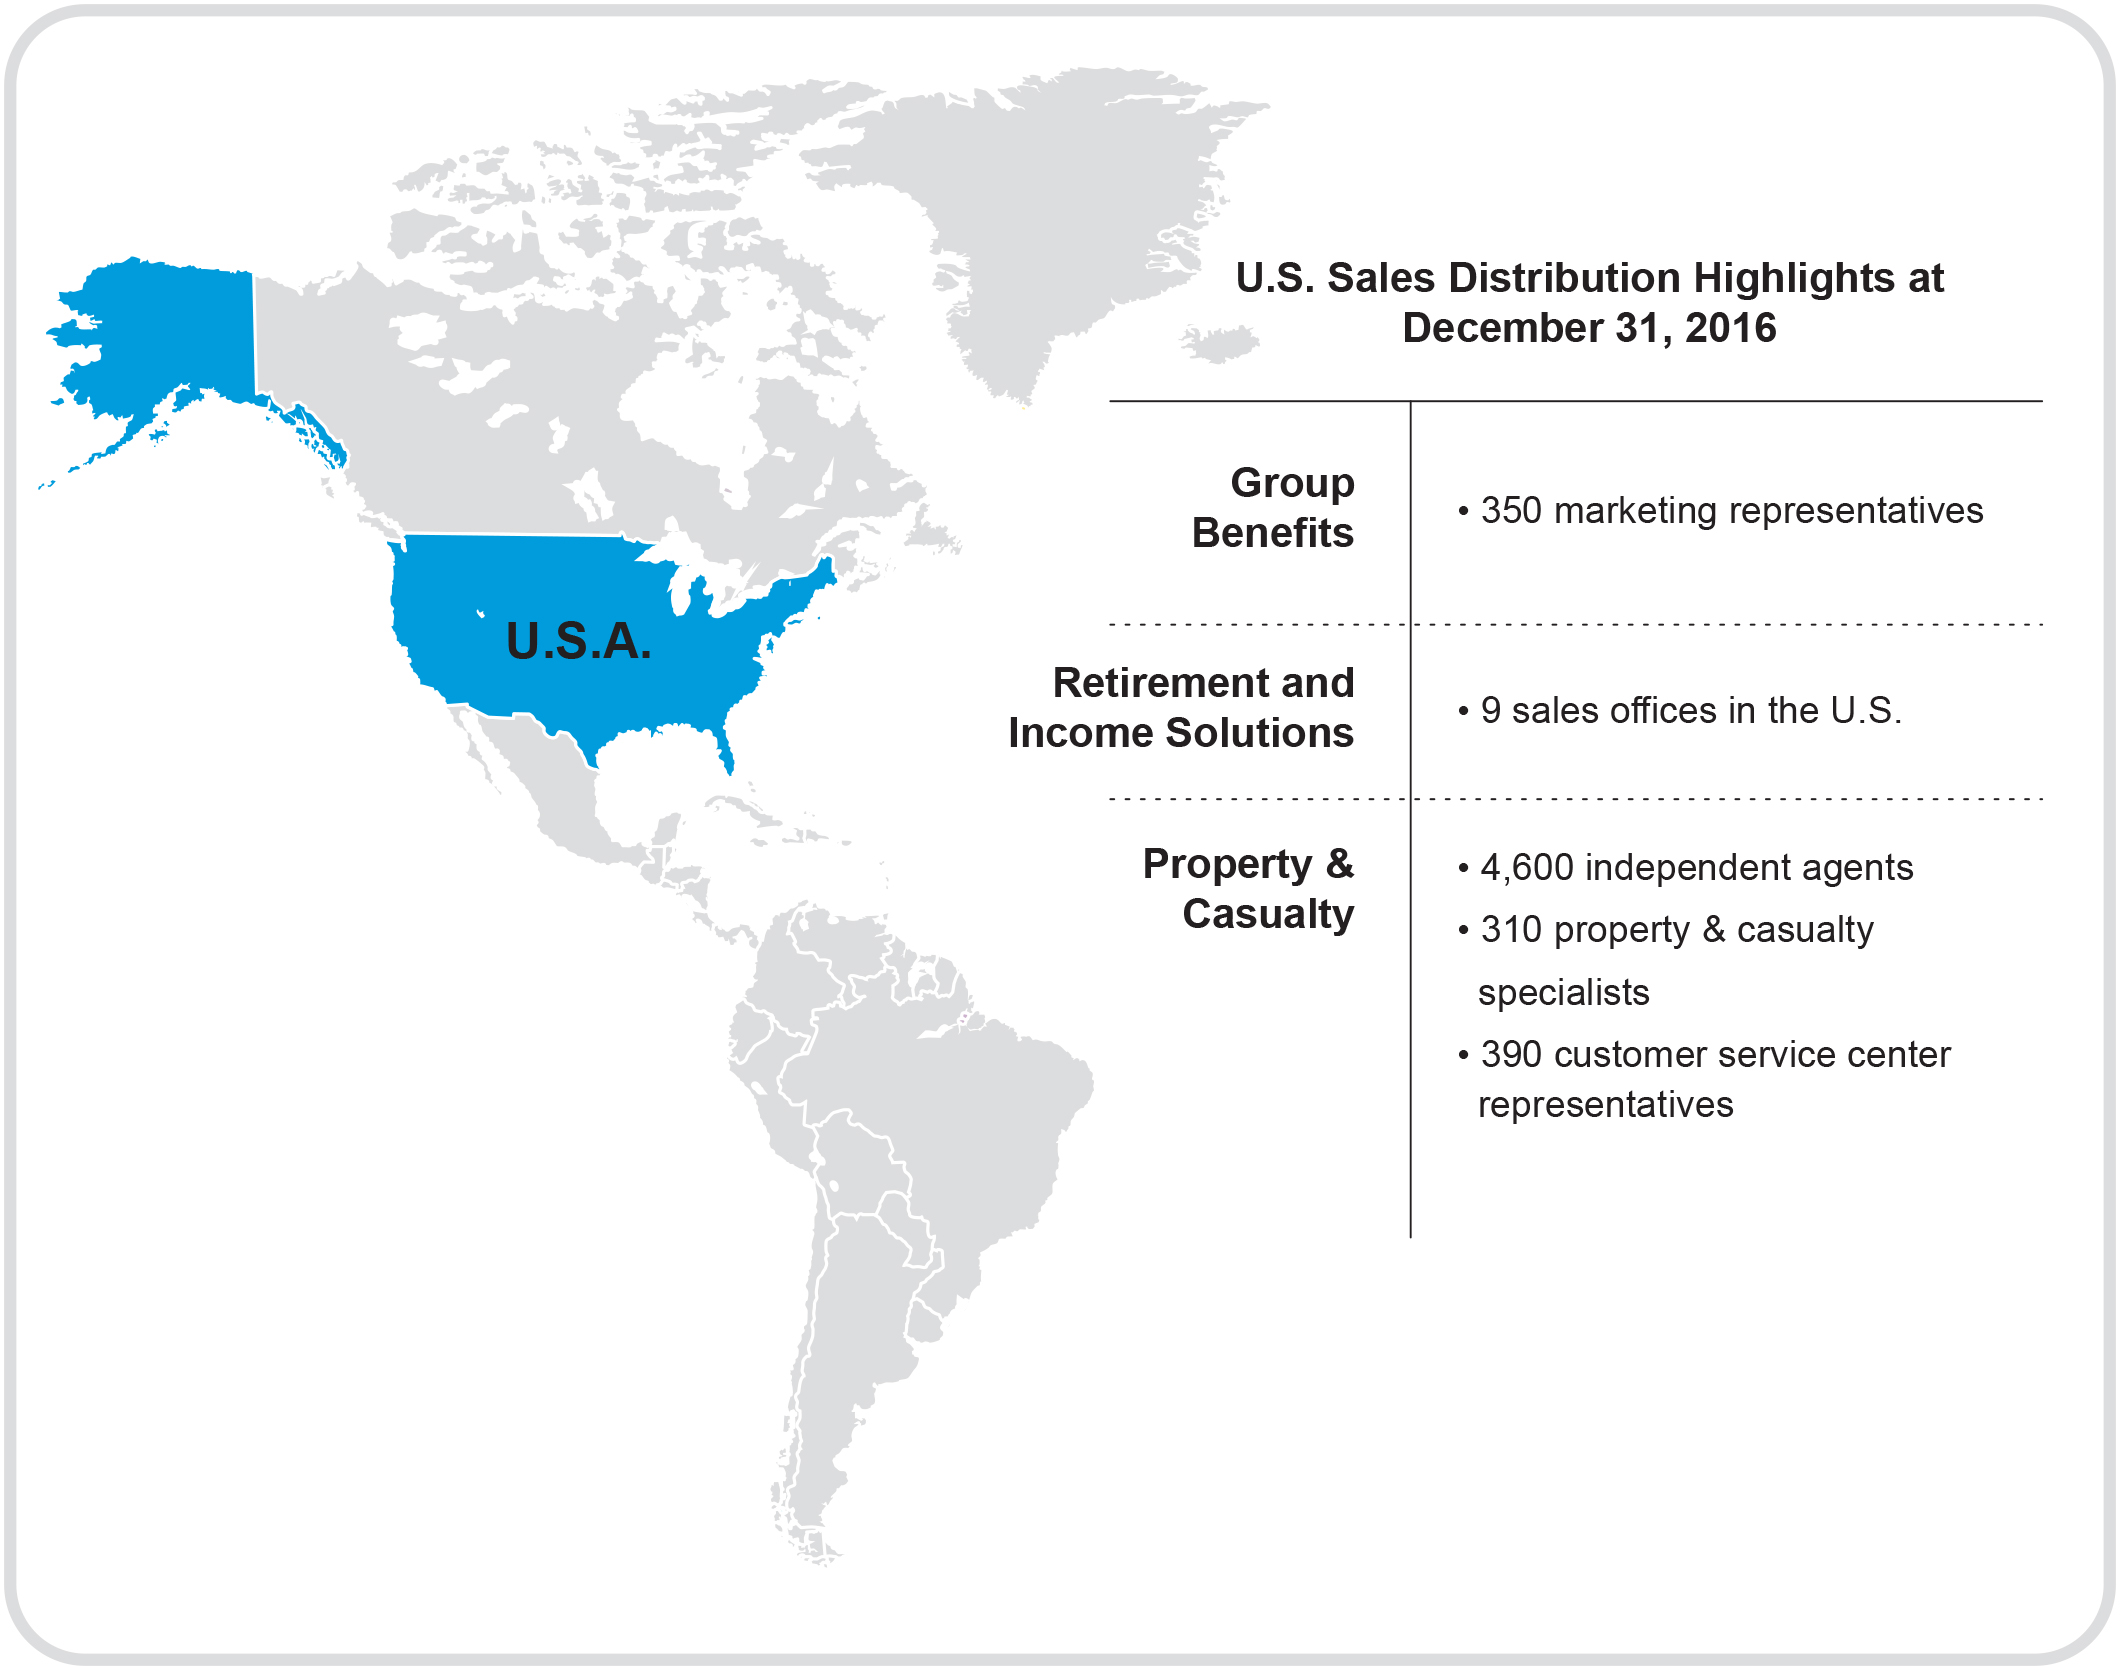
In the U.S, we market our products and services through various distribution channels. Our Group Benefits and Retirement and Income Solutions products are sold via sales forces primarily comprising MetLife employees. Personal lines property & casualty insurance products are directly marketed to employees at their employer’s worksite. Personal and commercial lines property & casualty insurance products are also marketed and sold to individuals and small business owners by independent agents and property & casualty specialists through a direct marketing channel.
Group Benefits Distribution
Group Benefits distributes its products and services through a sales force that is segmented by the size of the target customer. Marketing representatives sell either directly to corporate and other group customers or through an intermediary, such as a broker or consultant. In addition, voluntary products are sold by specialists. Employers have been emphasizing voluntary products and, as a result, we have increased our focus on communicating and marketing to employees in order to further foster sales of those products.
We have entered into several operating joint ventures and other arrangements with third parties to expand opportunities to market and distribute Group Benefits products and services. We also sell our Group Benefits products and services through sponsoring organizations and affinity groups and provide life and dental coverage to certain employees of the U.S. Government.
11
Retirement and Income Solutions Distribution
Retirement and Income Solutions distributes its products and services through dedicated sales teams and relationship managers. Products may be sold directly to benefit plan sponsors and advisors or through brokers, consultants or other intermediaries. In addition, these sales professionals work with individual, group and global distribution areas to better reach and service customers, brokers, consultants and other intermediaries.
Property & Casualty Distribution
Property & Casualty products are marketed and sold through independent agents, property & casualty specialists and association/affinity organizations.
We are a leading provider of personal lines property & casualty insurance products offered to employees at their employer’s worksite. Marketing representatives market personal lines property & casualty insurance products to employers through a variety of means, including broker referrals and cross-selling to group customers. Once permitted by the employer, MetLife commences marketing efforts to employees, enabling them to purchase coverage and to request payroll deduction over the telephone.
We also offer commercial property & casualty products through a variety of sponsored relationships, including association/affinity organizations. Marketing representatives market commercial property & casualty insurance products to small business owners through a variety of means including broker referrals and members of third party professional organizations. Once permitted by the sponsoring organization, MetLife commences marketing to small business owners, enabling them to purchase coverage directly over the internet and/or telephone.
Asia
Product Overview
Our Asia segment offers a broad range of products to both individuals and corporations, as well as other institutions and their respective employees, which include the following major products:
Life Insurance.
We offer both traditional and non-traditional life insurance products, such as whole and term life, endowments, universal and variable life, as well as group products.
Accident & Health Insurance.
We offer personal accident and supplemental health products, hospital indemnity, medical reimbursement plans, and coverage for serious medical conditions. Our largest markets are Japan, Korea and China. In addition, we offer individual and group major medical coverage in select markets.
Retirement and Savings Products.
We offer both fixed and variable annuity products in select markets.
12
Operations
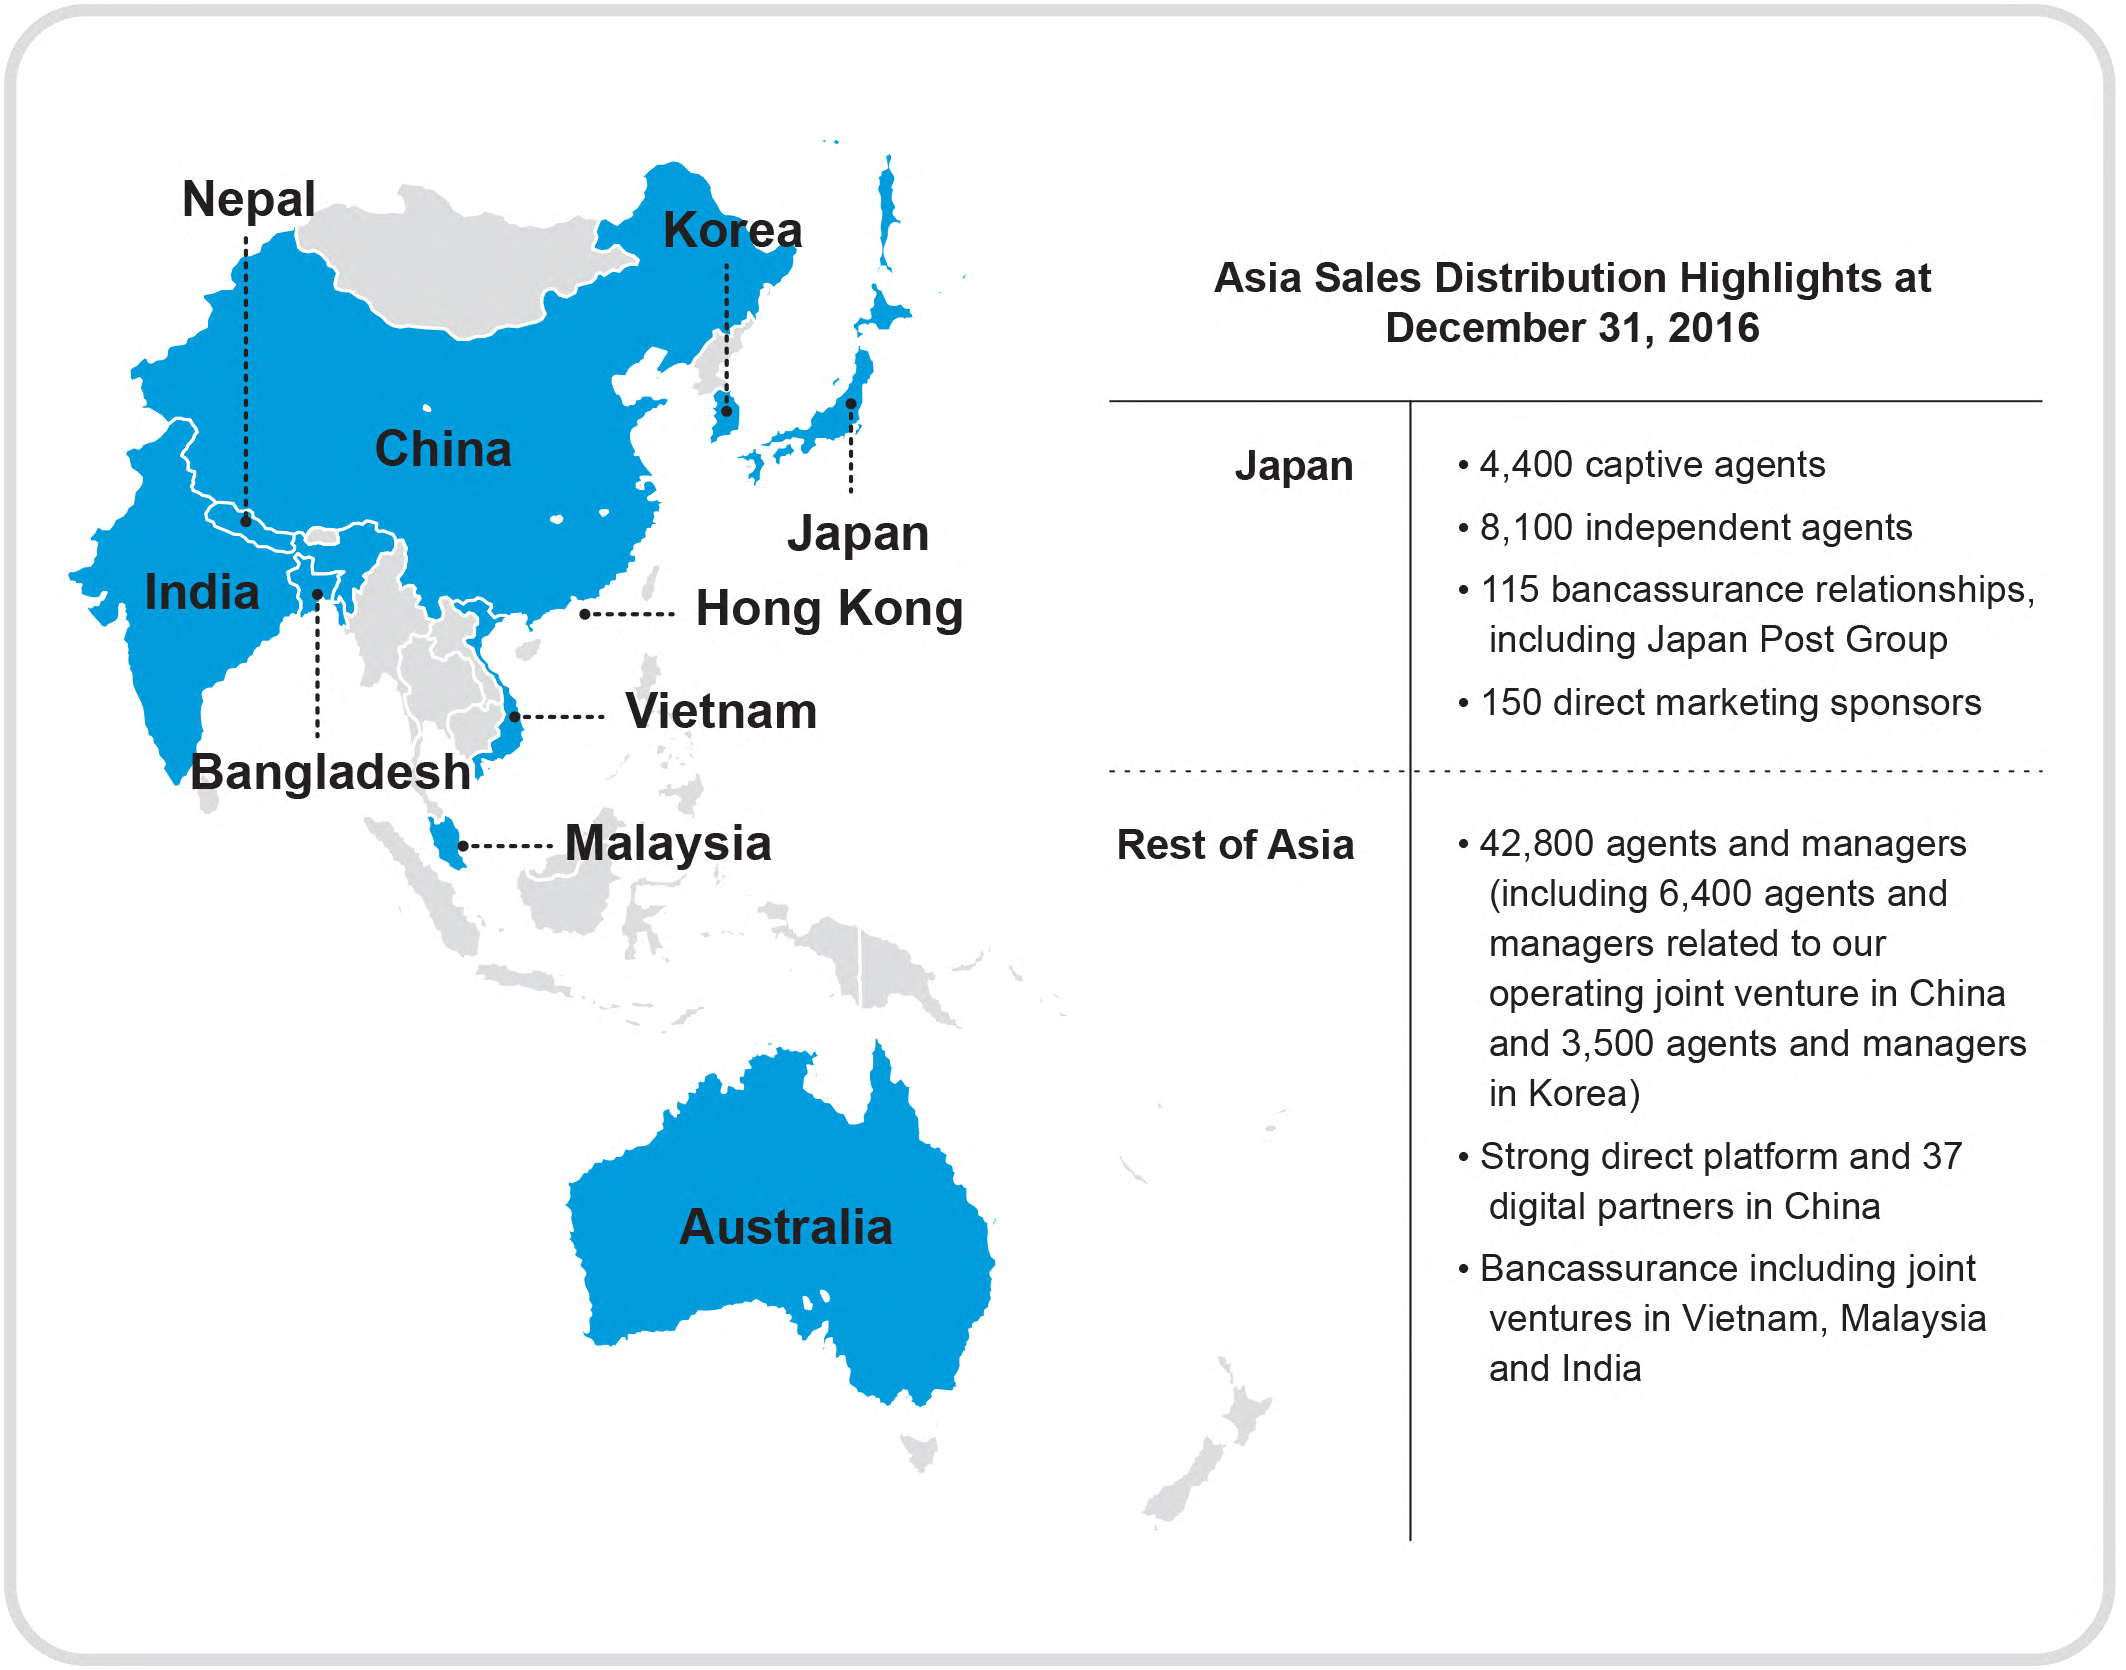
We operate in 10 countries throughout Asia, with our largest operation in Japan. We also maintain a representative office in Myanmar, an innovation center in Singapore and a data analytics center of excellence in Malaysia.
Sales Distribution
Our Asia operations are geographically diverse with developed and emerging markets. We market our products and services through a multi-channel, digitally-enabled distribution strategy, including career agency, bancassurance, direct marketing, brokerage, other third-party distribution and e-commerce.
Japan’s multi-channel distribution strategy consists of captive agents, independent agents, bancassurance, direct marketing and brokers. While face-to-face channels continue to be core to Japan’s business, other channels, including bancassurance and direct marketing, are a critical part of Japan’s distribution strategy. Our Japan operation has maintained its position in bancassurance due to its strong distribution relationship with Japan’s mega banks, trust banks and various regional banks, as well as with the Japan Post. The direct marketing channel is supported by an industry-leading marketing platform, state-of-the-art call center infrastructure and its own campaign management system. Our direct marketing operations, the largest of which is in Japan, deploy both broadcast marketing approaches (e.g. direct response TV and web-based lead generation) and traditional direct marketing techniques such as inbound and outbound telemarketing.
13
Outside of Japan, our distribution strategies differ by market but generally utilize a combination of captive agents, bancassurance relationships, direct marketing and e-commerce. Throughout the region, our Asia operation leverages its expertise in direct marketing operations management to conduct its own campaigns and provide those direct marketing capabilities to third-party sponsors. It also leverages its proprietary
data analytics center of excellence in Malaysia
for improved customer insights and lead enhancement. While not a significant part of the region’s overall business, sales of group life and pension business are primarily achieved through independent brokers and an employee sales force.
Latin America
Product Overview
Our Latin America segment offers a broad range of products to both individuals and corporations, as well as other institutions and their respective employees, which include the following major products:
Life Insurance.
We offer universal, variable and term life products. For a description of these products, see “— U.S. — Product Overview—Group Benefits.”
Retirement and Savings Products.
We offer fixed annuities and pension products. Fixed annuities provide for both asset accumulation and asset distribution needs. Fixed annuities do not allow the same investment flexibility provided by variable annuities, but provide guarantees related to the preservation of principal and interest credited. Deposits made into deferred annuity contracts are allocated to the Company’s general account and are credited with interest at rates we determine, subject to specified minimums. The minimum guarantee is for the whole period of the policy, and the credited rates are a function of the earned rates, subject to the minimum guarantee. Fixed income annuities provide a guaranteed monthly income for a specified period of years and/or for the life of the annuitant. Our savings oriented pension products are offered under a mandatory privatized social security system.
In addition to other various products discussed within the U.S. segment, Latin America also engages in the following businesses:
Accident & Health Insurance.
We offer group and individual major medical, accidental, and supplemental health products, including accidental death and disability, medical reimbursement, hospital indemnity and medical coverage for serious medical conditions.
Credit Insurance.
We offer credit insurance policies designed to fulfill certain loan obligations in the event of the policyholder’s death.
14
Operations
In Latin America, our largest operations are in Mexico and Chile.
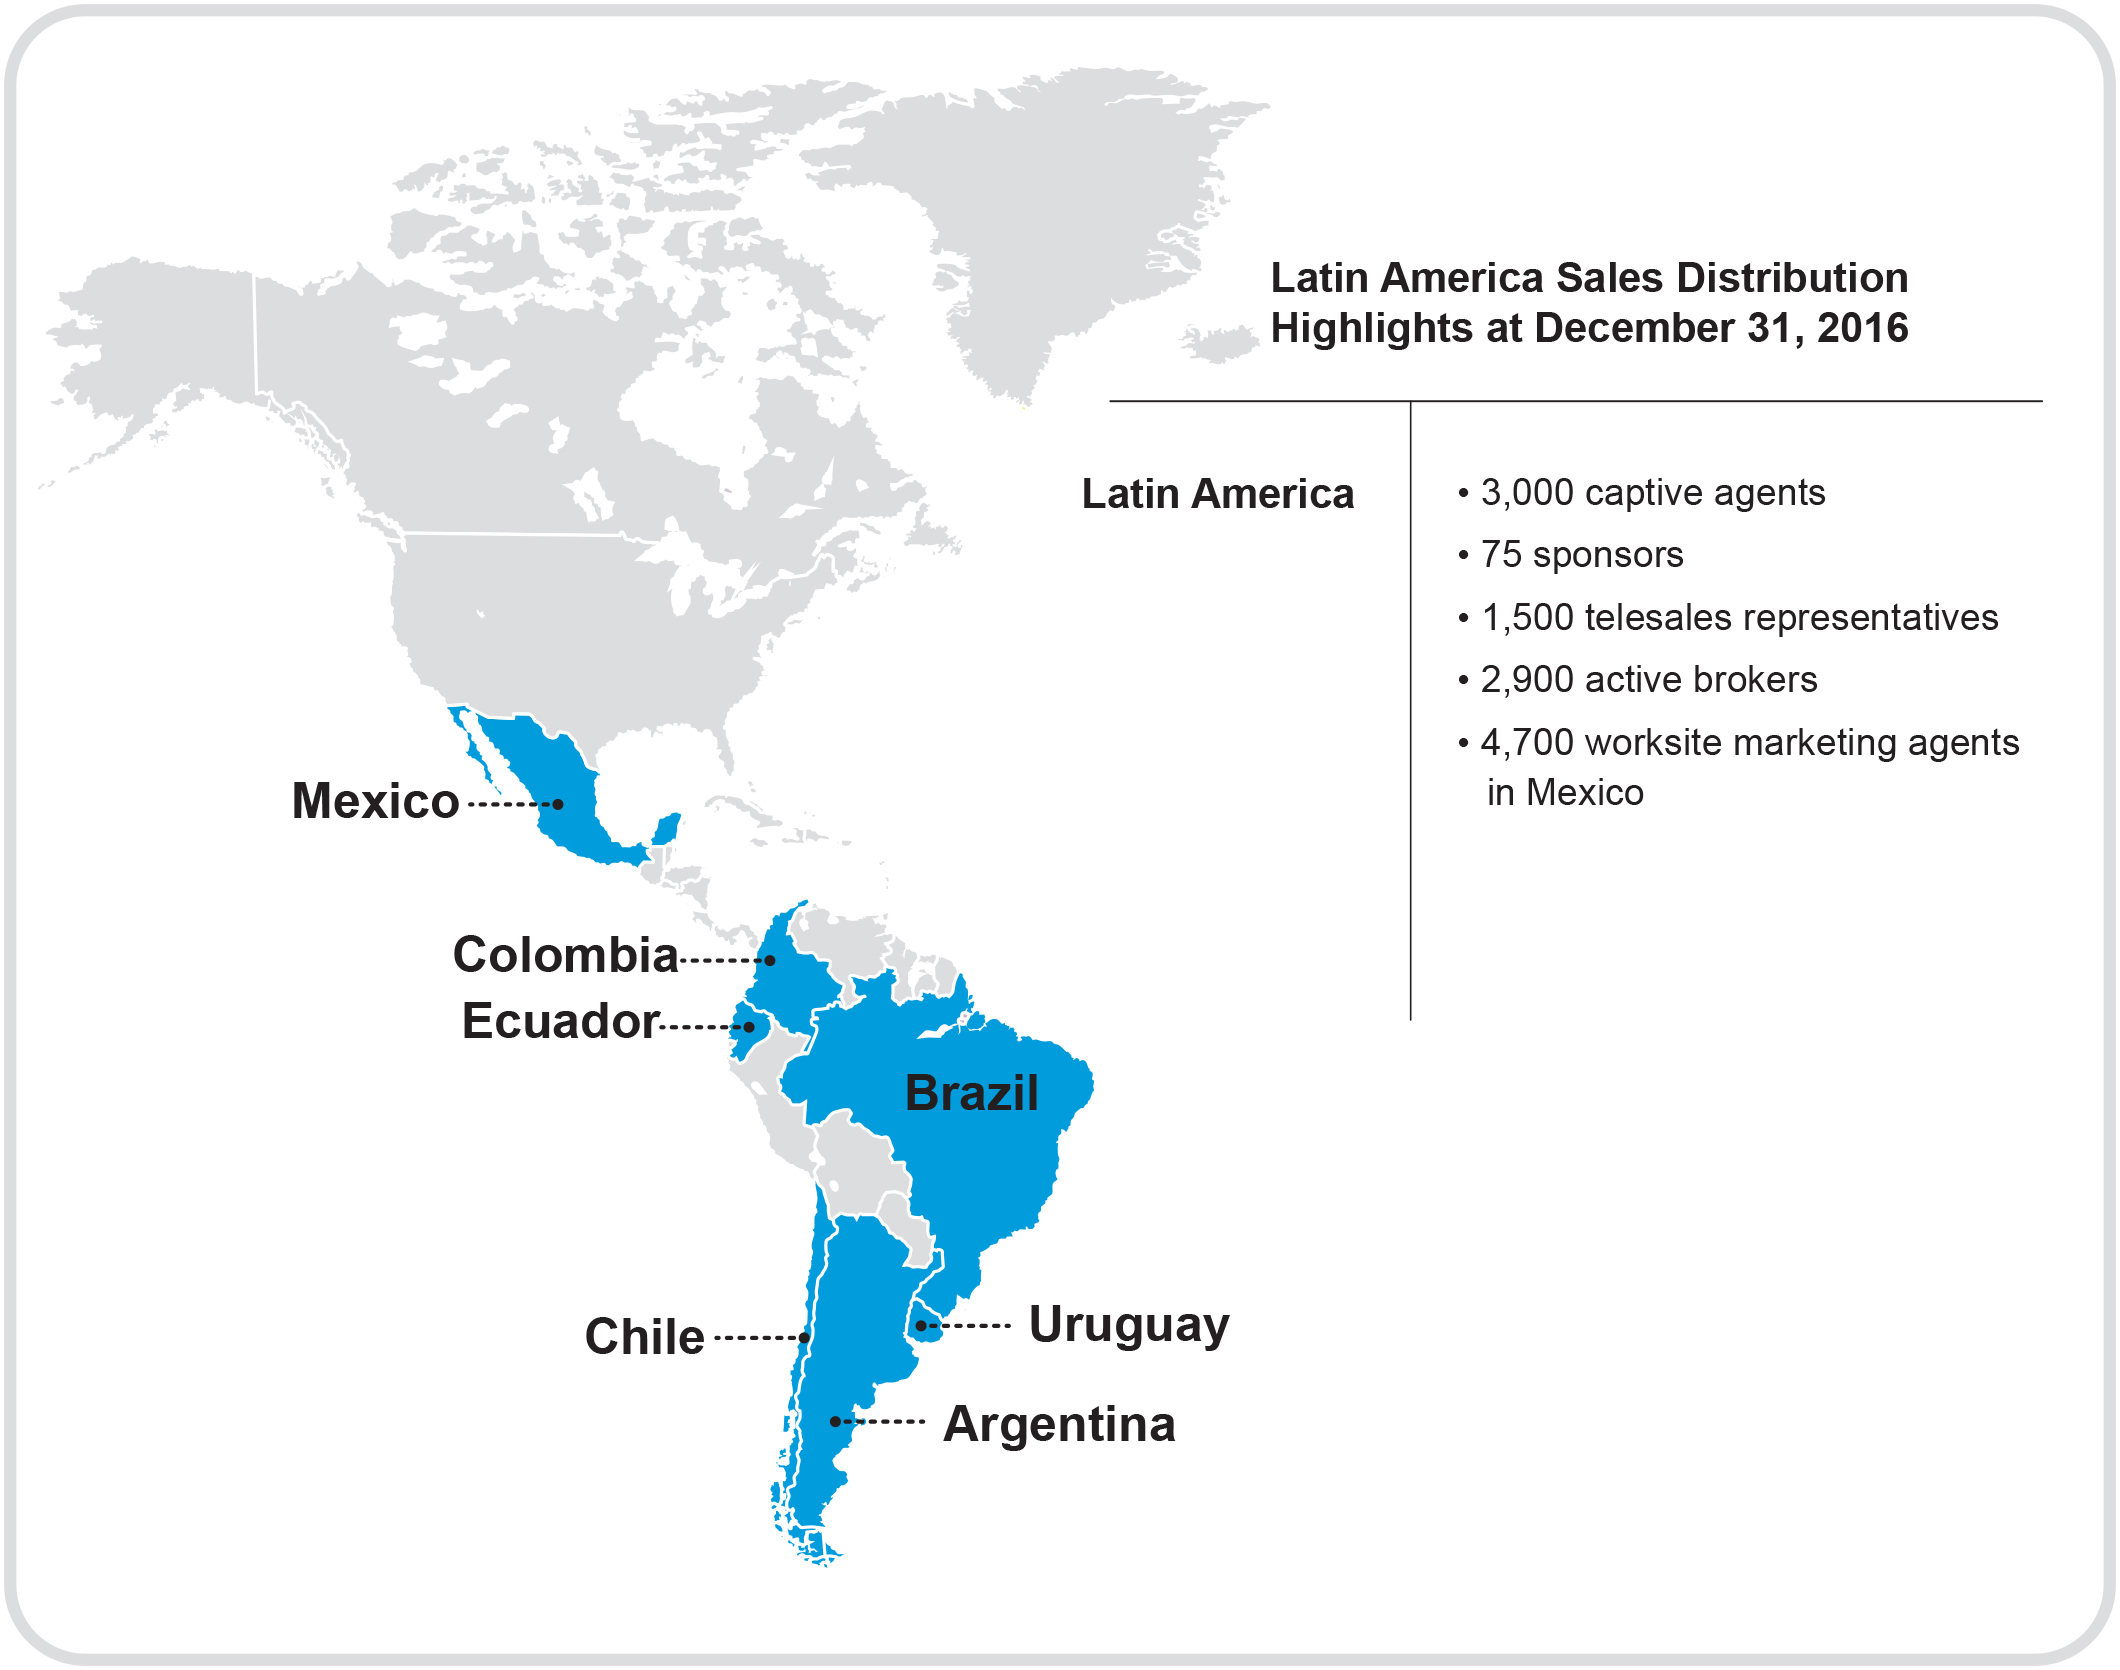
Sales Distribution
In Latin America, we market our products and services through a multi-distribution strategy which varies by geographic region and stage of market development.
Latin America’s distribution channels include captive agents, direct marketing (“sponsored and direct to customer”), large multinational brokers and small and medium-sized brokers, direct and group sales forces (mostly for group policies without broker intermediaries), and worksite marketing. The region has an exclusive and captive agency distribution network which also sells a variety of individual life, accident & health, and pension products. In the direct marketing channel, we work with sponsors and telesales representatives selling mainly accident & health and individual life products directly to consumers. We currently work with active brokers with registered sales of group and individual life, accident & health, group medical, dental and pension products.
EMEA
Product Overview
Our EMEA segment offers a broad range of products to both individuals and corporations, as well as other institutions and their respective employees, which include the following major products:
Life Insurance.
We offer both traditional and non-traditional life insurance products, such as whole and term life, endowments and variable life products. We offer group term life programs in most markets.
15
Accident & Health Insurance.
We offer individual and group personal accident and supplemental health products, including AD&D, hospital indemnity, scheduled medical reimbursement plans, and coverage for serious medical conditions. In addition, we offer individual and group major medical coverage in select markets.
Retirement and Savings Products.
We offer fixed annuity products and pension products, including group pension programs in select markets. In Romania, we offer through a specialized pension company a savings oriented pension product under the mandatory privatized social security systems.
Credit Insurance.
We offer credit insurance policies designed to fulfill certain obligations in the event of the policyholder’s death.
Operations
We operate in several countries across EMEA, with our largest operations in the Gulf, United Kingdom (“U.K.”) and Turkey.
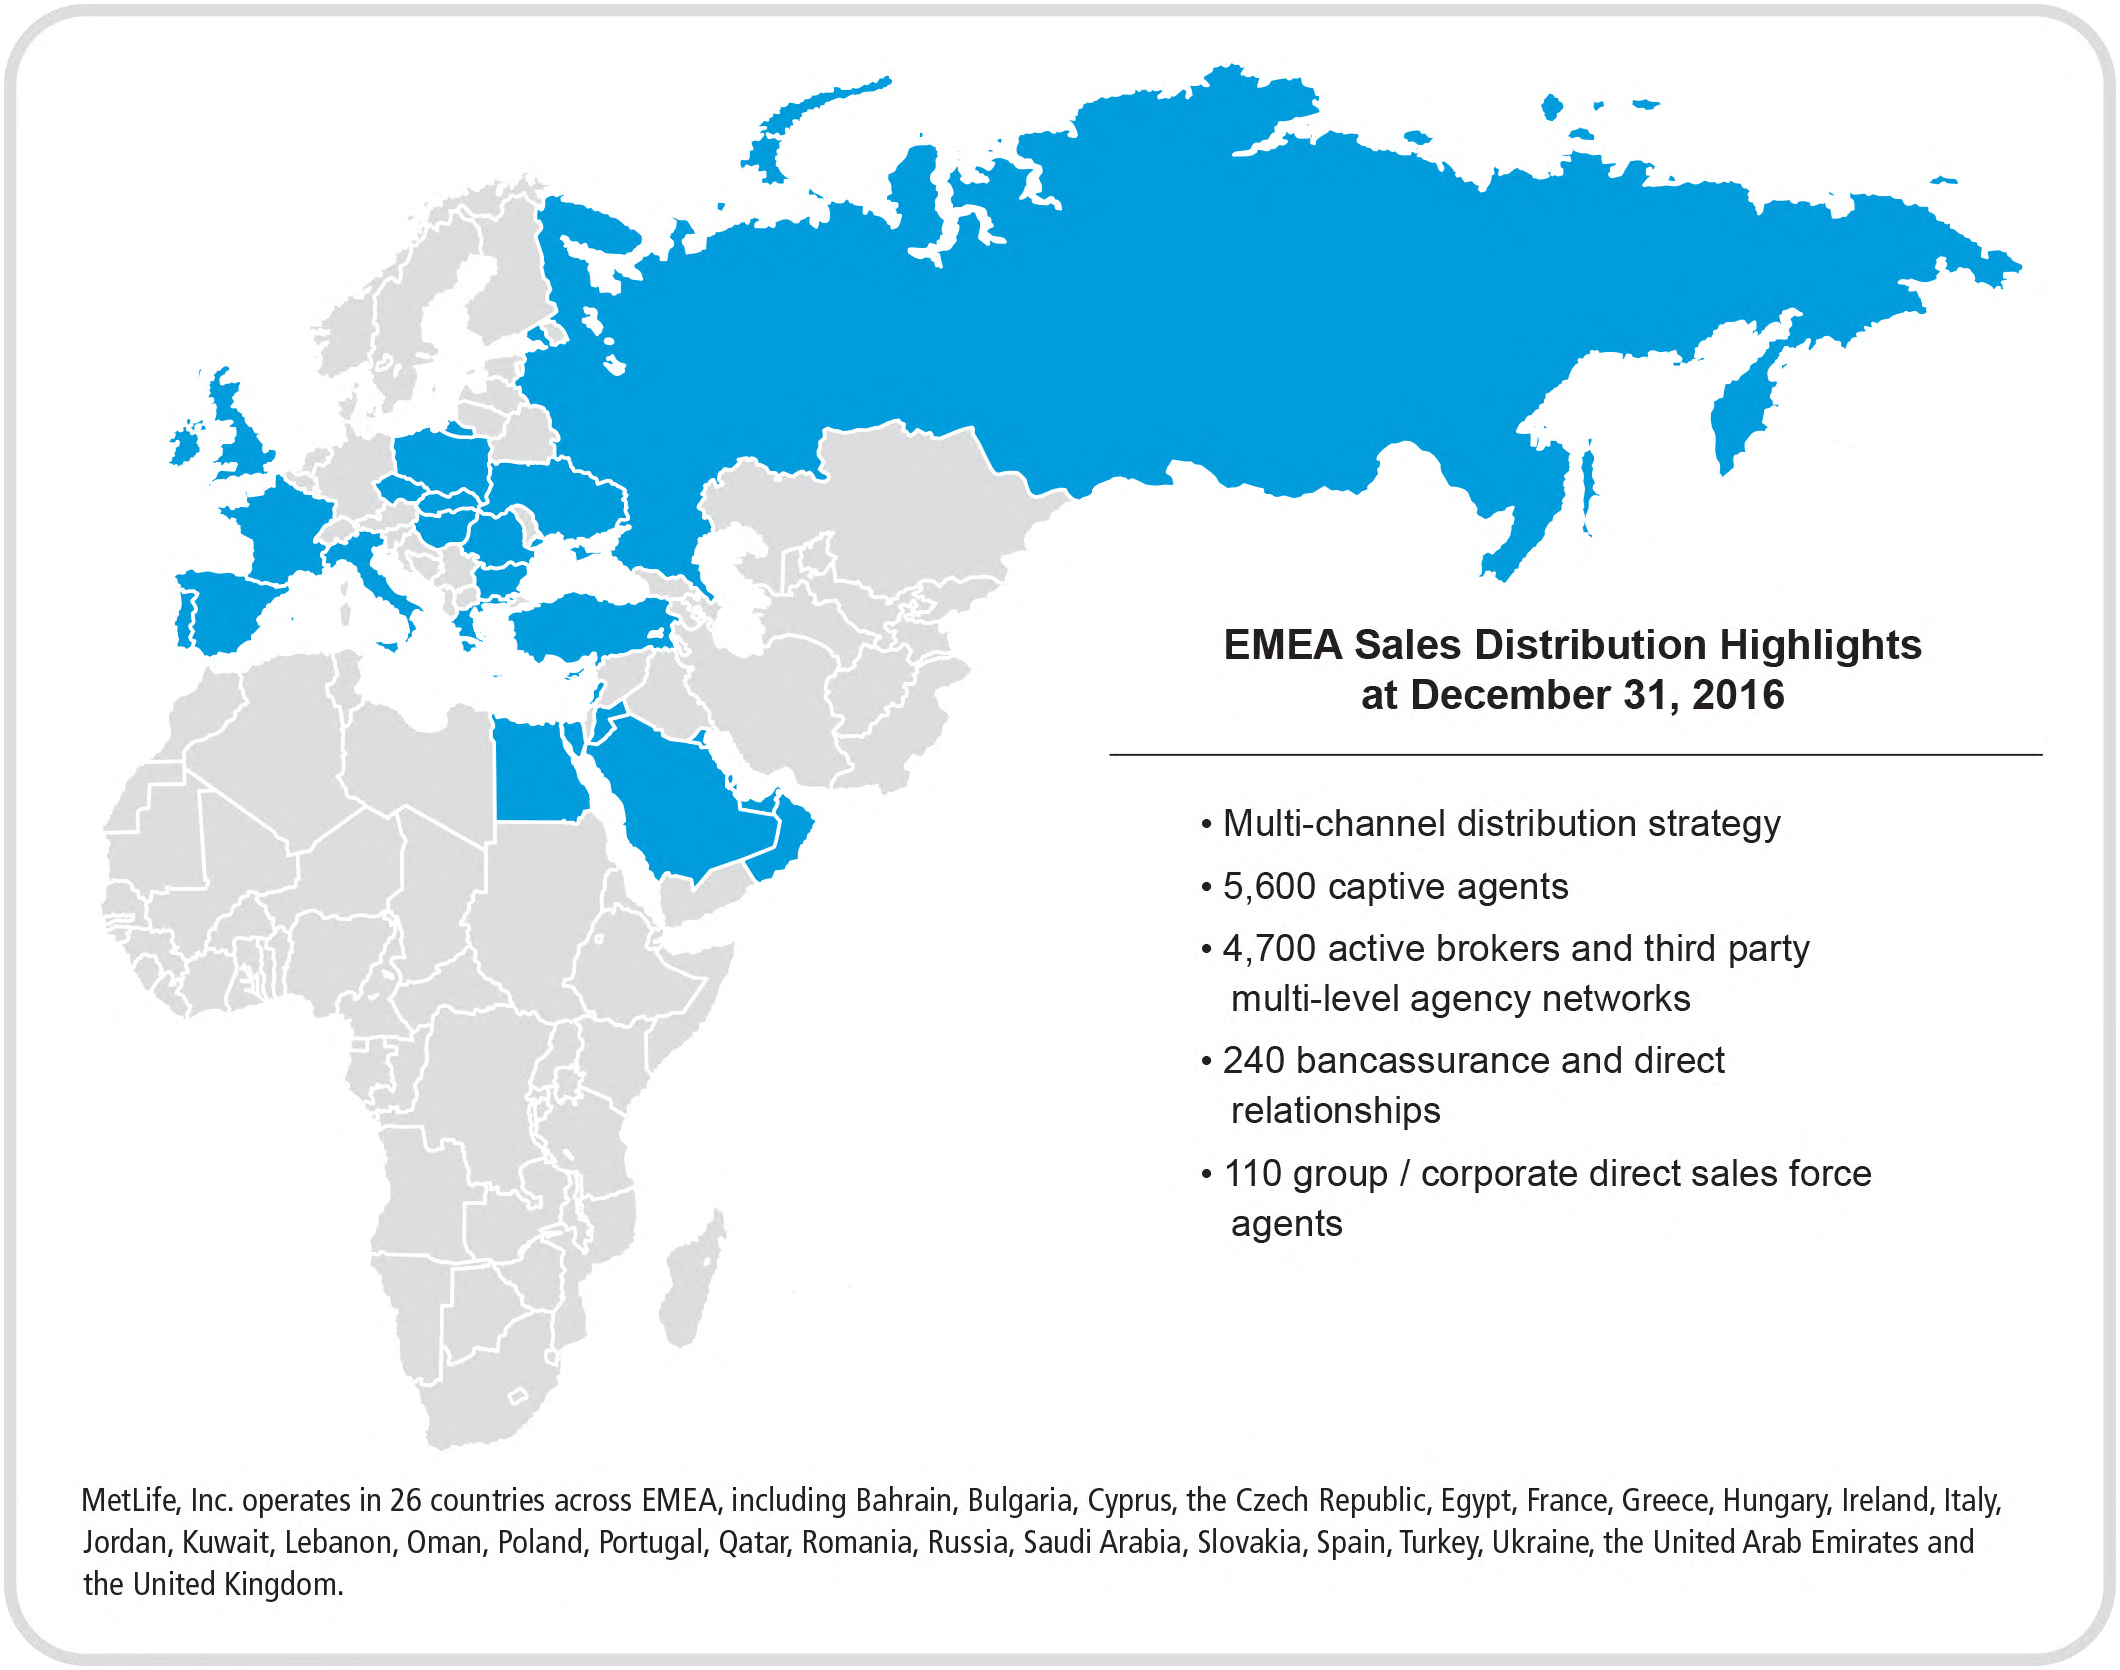
Sales Distribution
Our EMEA operations are geographically diverse with a mix of developed and emerging markets. We hold leading positions in several markets in the Middle East and Central & Eastern Europe,
and focus on attractive niche segments in more developed markets. Emerging markets represent a significant part of the region’s overall earnings.
Our businesses in EMEA employ a multi-channel distribution strategy, including captive and independent agency, bancassurance and direct-to-consumer.
16
MetLife Holdings
Product Overview
Our MetLife Holdings segment consists of operations relating to products and businesses that we no longer actively market in the United States. These products and businesses include variable, universal, term and whole life, as well as variable, fixed and index-linked annuities. Our MetLife Holdings segment also includes our discontinued long-term care business and the assumed reinsurance of certain variable annuity products from our former operating joint venture in Japan.
The major products within our MetLife Holdings segment are as follows:
Variable, Universal and Term Life
.
These life products are similar to those offered by our Group Benefits business, except that these products were marketed to individuals through various retail distribution channels. For a description of these products, see “
—
U.S.
— Product Overview —
Group Benefits.”
Whole Life.
Whole life products provide a benefit upon the death of the insured in return for the periodic payment of a fixed premium over a predetermined period. Premium payments may be required for the entire life of the contract period, to a specified age or period, and may be level or change in accordance with a predetermined schedule. Whole life insurance includes policies that provide a participation feature in the form of dividends. Policyholders may receive dividends in cash, or apply them to increase death benefits, increase cash values available upon surrender or reduce the premiums required to maintain the contract in-force.
Variable Annuities.
Variable annuities provide for both asset accumulation and asset distribution needs. Variable annuities allow the contractholder to allocate deposits into various investment options in a separate account, as determined by the contractholder. The risks associated with such investment options are borne entirely by the contractholder, except where guaranteed minimum benefits are involved. In certain variable annuity products, contractholders may also choose to allocate all or a portion of their account to the Company’s general account and are credited with interest at rates we determine, subject to specified minimums. In addition, contractholders may also elect certain minimum death benefit and minimum living benefit guarantees for which additional fees are charged and where asset allocation restrictions may apply.
Fixed and Indexed-Linked Annuities.
Fixed annuities provide for both asset accumulation and asset distribution needs. Fixed annuities do not allow the same investment option flexibility provided by variable annuities, but provide guarantees related to the preservation of principal and interest credited. Deposits made into deferred annuity contracts are allocated to the Company’s general account and are credited with interest at rates we determine, subject to specified minimums. Credited interest rates may be guaranteed not to change for certain limited periods of time, ranging from one to 10 years. Fixed income annuities provide a guaranteed monthly income for a specified period of years and/or for the life of the annuitant. Additionally, the Company has issued indexed-linked annuities which allow the contractholder to participate in returns from equity indices.
Long-term Care.
Long-term care products provide protection against the potentially high costs of long-term health care services. They generally pay benefits to insureds who need assistance with activities of daily living or have a cognitive impairment. Although we discontinued the sale of these products in 2010, we continue to service our existing inforce policyholders.
Brighthouse Financial
Product Overview
Our Brighthouse Financial segment offers a broad range of products and services which include variable, fixed, index-linked and income annuities, as well as variable, universal, term and whole life products. These products and services are actively marketed through various third party retail distribution channels in the United States. In addition, the Brighthouse Financial segment includes certain run-off businesses which are not actively marketed.
The major products offered by our Brighthouse Financial segment are as follows:
Variable Annuities, Fixed Annuities, Index-Linked Annuities and Whole Life.
These products are similar to those described in MetLife Holdings, except that these products are actively marketed through various third party retail distribution channels.
For a description of these products, see “
— MetLife Holdings — Product Overview.”
Income Annuities.
Fixed income annuities provide a guaranteed monthly income for a specified period of years and/or for the life of the annuitant.
17
Variable, Universal and Term Life
.
These products are similar to those offered by our Group Benefits business, except that these products are actively marketed through various third party retail distribution channels.
For a description of these products, see “
— U.S. — Product Overview —
Group Benefits.
”
Sales Distribution
We distribute our annuity and life insurance products through a diverse network of independent distribution partners. Our partners include over 475 national and regional brokerage firms, banks, other financial institutions and financial planners, in connection with the sale of our annuity products, and general agencies, financial advisors, brokerage general agencies and financial intermediaries, in connection with the distribution of our life insurance products. Until July 2016, we also distributed the aforementioned products through our MetLife Premier Client Group. See Note
3
of the Notes to the Consolidated Financial Statements for further information regarding the U.S. Retail Advisor Force Divestiture.
Corporate & Other
Overview
Corporate & Other contains the excess capital, as well as certain charges and activities, not allocated to the segments, including external integration and disposition costs, internal resource costs for associates committed to acquisitions and dispositions, enterprise-wide strategic initiative restructuring charges and various start-up businesses (including expatriate benefits insurance and the investment management business through which the Company offers fee-based investment management services to institutional clients, as well as the direct to consumer portion of the U.S. Direct business). Corporate & Other also includes interest expense related to the majority of the Company’s outstanding debt and expenses associated with certain legal proceedings and income tax audit issues. In addition, Corporate & Other includes the elimination of intersegment amounts, which generally relate to affiliated reinsurance and intersegment loans, which bear interest rates commensurate with related borrowings.
Policyholder Liabilities
We establish, and carry as liabilities, actuarially determined amounts that are calculated to meet policy obligations when a policy matures or is surrendered, an insured dies or becomes disabled or upon the occurrence of other covered events, or to provide for future annuity payments. Our liabilities for future policy benefits and claims are established based on estimates by actuaries of how much we will need to pay for future benefits and claims. For life insurance and annuity products, we calculate these liabilities based on assumptions and estimates, including estimated premiums to be received over the assumed life of the policy, the timing of the event covered by the insurance policy, the amount of benefits or claims to be paid and the investment returns on the investments we make with the premiums we receive. We establish liabilities for claims and benefits based on assumptions and estimates of losses and liabilities incurred. Amounts for actuarial liabilities are computed and reported on the consolidated financial statements in conformity with GAAP. For more details on policyholder liabilities see “Management’s Discussion and Analysis of Financial Condition and Results of Operations — Summary of Critical Accounting Estimates — Liability for Future Policy Benefits” and “Management’s Discussion and Analysis of Financial Condition and Results of Operations — Policyholder Liabilities.”
Pursuant to applicable insurance laws and regulations, MetLife, Inc.’s insurance subsidiaries, including affiliated captive reinsurers, establish statutory reserves, reported as liabilities, to meet their obligations on their respective policies. These statutory reserves are established in amounts sufficient to meet policy and contract obligations, when taken together with expected future premiums and interest at assumed rates. Statutory reserves and actuarial liabilities for future policy benefits generally differ based on accounting guidance.
U.S. state insurance laws and regulations require certain MetLife entities to submit to superintendents of insurance, with each annual report, an opinion and memorandum of a “qualified actuary” that the statutory reserves and related actuarial amounts recorded in support of specified policies and contracts, and the assets supporting such statutory reserves and related actuarial amounts, make adequate provision for their statutory liabilities with respect to these obligations. See “— Regulation — U.S. Regulation — Insurance Regulation — Policy and Contract Reserve Adequacy Analysis.”
Insurance regulators in many of the non-U.S. countries in which we operate require certain MetLife entities to prepare a sufficiency analysis of the reserves presented in the locally required regulatory financial statements, and to submit that analysis to the regulatory authorities. See “— Regulation — International Regulation.”
18
Underwriting and Pricing
Our Global Risk Management Department (“GRM”) contains a dedicated unit, the primary responsibility of which is the development of product pricing standards and independent pricing and underwriting oversight for MetLife’s insurance businesses. Further important controls around management of underwriting and pricing processes include regular experience studies to monitor assumptions against expectations, formal new product approval processes, periodic updates to product profitability studies and the use of reinsurance to manage our exposures, as appropriate. See “— Reinsurance Activity.”
Underwriting
Underwriting generally involves an evaluation of applications by a professional staff of underwriters and actuaries, who determine the type and the amount of insurance risk that we are willing to accept. We employ detailed underwriting policies, guidelines and procedures designed to assist the underwriter to properly assess and quantify such risks before issuing policies to qualified applicants or groups.
Insurance underwriting considers not only an applicant’s medical history, but also other factors such as financial profile, foreign travel, vocations and alcohol, drug and tobacco use. Group underwriting generally evaluates the risk characteristics of each prospective insured group, although with certain voluntary products and for certain coverages, members of a group may be underwritten on an individual basis. We generally perform our own underwriting; however, certain policies are reviewed by intermediaries under guidelines established by us. Generally, we are not obligated to accept any risk or group of risks from, or to issue a policy or group of policies to, any employer or intermediary. Requests for coverage are reviewed on their merits and a policy is not issued unless the particular risk or group has been examined and approved in accordance with our underwriting guidelines.
The underwriting conducted by our remote underwriting offices and intermediaries, as well as our corporate underwriting office, is subject to periodic quality assurance reviews to maintain high standards of underwriting and consistency. Such offices are also subject to periodic external audits by reinsurers with whom we do business.
We have established oversight of the underwriting process that facilitates quality sales and serves the needs of our customers, while supporting our financial strength and business objectives. Our goal is to achieve the underwriting, mortality and morbidity levels reflected in the assumptions in our product pricing. This is accomplished by determining and establishing underwriting policies, guidelines, philosophies and strategies that are competitive and suitable for the customer, the agent and us.
For our Property & Casualty business, our underwriting function has six principal aspects: evaluating potential voluntary and worksite employer accounts and independent agencies; establishing guidelines for the binding of risks; reviewing coverage bound by agents; underwriting potential insureds, on a case by case basis, presented by agents outside the scope of their binding authority; pursuing information necessary in certain cases to enable issuance of a policy within our guidelines; and ensuring that renewal policies continue to be written at rates commensurate with risk. Subject to very few exceptions, agents in each of the distribution channels have binding authority for risks which fall within our published underwriting guidelines. Risks falling outside the underwriting guidelines may be submitted for approval to the underwriting department; alternatively, agents in such a situation may call the underwriting department to obtain authorization to bind the risk themselves. In most states, we generally have the right within a specified period (usually the first 60 days) to cancel any policy.
We continually review our underwriting guidelines in light of applicable regulations and to ensure that our policies remain competitive and supportive of our marketing strategies and profitability goals.
Pricing
Product pricing reflects our pricing standards, which are consistent for our global businesses. GRM, as well as regional finance and product teams are responsible for pricing and oversight for all of our insurance businesses. Product pricing is based on the expected payout of benefits calculated through the use of assumptions for mortality, morbidity, expenses, persistency and investment returns, as well as certain macroeconomic factors, such as inflation. Investment-oriented products are priced based on various factors, which may include investment return, expenses, persistency and optionality and possible variability of results. For certain products, pricing may include prospective and retrospective experience rating features. Prospective experience rating involves the evaluation of past experience for the purpose of determining future premium rates and we bear all prior year gains and losses. Retrospective experience rating also involves the evaluation of past experience for the purpose of determining the actual cost of providing insurance for the customer; however, the contract includes certain features that allow us to recoup certain losses or distribute certain gains back to the policyholder based on actual prior years’ experience.
19
Rates for group benefit products are based on anticipated earnings and expenses for the book of business being underwritten. Renewals are generally reevaluated annually or biannually and are re-priced to reflect actual experience on such products. Products offered by Retirement and Income Solutions are priced on demand. Pricing reflects expected investment returns, as well as mortality, longevity and expense assumptions appropriate for each product. This business is generally nonparticipating and illiquid, as policyholders have few or no options or contractual rights to cash values.
Rates for individual life insurance products are highly regulated and generally must be approved by the regulators of the jurisdictions in which the product is sold. Generally, such products are renewed annually and may include pricing terms that are guaranteed for a certain period of time. Individual disability income products are based on anticipated results for the occupation being underwritten. Fixed and variable annuity products are also highly regulated and approved by the respective regulators. Such products generally include penalties for early withdrawals and policyholder benefit elections to tailor the form of the product’s benefits to the needs of the opting policyholder. We periodically reevaluate the costs associated with such options and will periodically adjust pricing levels on our guarantees. Further, from time to time, we may also reevaluate the type and level of guarantee features currently being offered.
For our Property & Casualty business, our ability to set and change rates is subject to regulatory oversight. Rates for our major lines of property & casualty insurance are based on our proprietary database, rather than relying on rating bureaus. We determine prices in part from a number of variables specific to each risk. The pricing of personal lines insurance products takes into account, among other things, the expected frequency and severity of losses, the costs of providing coverage (including the costs of acquiring policyholders and administering policy benefits and other administrative and overhead costs such as reinsurance), competitive factors and profit considerations. The major pricing variables for personal lines insurance include characteristics of the insured property, such as age, make and model or construction type, as well as characteristics of the insureds, such as driving record and loss experience, and the insured’s personal financial management. As a condition of our license to do business in each state, we, like all other personal lines insurers, are required to write or share the cost of private passenger automobile and homeowners insurance for higher risk individuals who would otherwise be unable to obtain such insurance. This “involuntary” market, also called the “shared market,” is governed by the applicable laws and regulations of each state, and policies written in this market are generally written at rates higher than standard rates and typically afford less coverage.
We continually review our pricing guidelines in light of applicable regulations and to ensure that our policies remain competitive and supportive of our marketing strategies and profitability goals.
Reinsurance Activity
We enter into reinsurance agreements primarily as a purchaser of reinsurance for our various insurance products and also as a provider of reinsurance for some insurance products issued by third parties. We participate in reinsurance activities in order to limit losses, minimize exposure to significant risks, and provide additional capacity for future growth. We enter into various agreements with reinsurers that cover individual risks, group risks or defined blocks of business, primarily on a coinsurance, yearly renewable term, excess or catastrophe excess basis. These reinsurance agreements spread risk and minimize the effect of losses. The extent of each risk retained by us depends on our evaluation of the specific risk, subject, in certain circumstances, to maximum retention limits based on the characteristics of coverages. We also cede first dollar mortality risk under certain contracts. In addition to reinsuring mortality risk, we reinsure other risks, as well as specific coverages. We obtain reinsurance for capital requirement purposes and also when the economic impact of the reinsurance agreement makes it appropriate to do so.
Under the terms of the reinsurance agreements, the reinsurer agrees to reimburse us for the ceded amount in the event a claim is paid. Cessions under reinsurance agreements do not discharge our obligations as the primary insurer. In the event that reinsurers do not meet their obligations under the terms of the reinsurance agreements, reinsurance recoverable balances could become uncollectible.
20
We reinsure our business through a diversified group of well-capitalized, highly rated reinsurers. We analyze recent trends in arbitration and litigation outcomes in disputes, if any, with our reinsurers. We monitor ratings and evaluate the financial strength of our reinsurers by analyzing their financial statements. In addition, the reinsurance recoverable balance due from each reinsurer is evaluated as part of the overall monitoring process. Recoverability of reinsurance recoverable balances is evaluated based on these analyses. We generally secure large reinsurance recoverable balances with various forms of collateral, including secured trusts, funds withheld accounts and irrevocable letters of credit. Additionally, we enter into reinsurance agreements for risk and capital management purposes with several affiliated captive reinsurers. Captive reinsurers are affiliated insurance companies licensed under specific provisions of insurance law of their respective jurisdictions, such as the Special Purpose Financial Captive law adopted by several states including Vermont and Delaware, and have a very narrow business plan that specifically restricts the majority or all of their activity to reinsuring business from their affiliates. See “Management’s Discussion and Analysis of Financial Condition and Results of Operations — Liquidity and Capital Resources — The Company — Capital — Affiliated Captive Reinsurance Transactions.”
U.S.
For our Group Benefits business, we generally retain most of the risk and only cede particular risk on certain client arrangements. The majority of our reinsurance activity within this business relates to the following client agreements:
|
•
|
Employer sponsored captive programs: through these programs, employers buy a group life insurance policy with the condition that a portion of the risk is reinsured back to a captive insurer sponsored by the client.
|
|
•
|
Risk-sharing agreements: through these programs, clients require that we reinsure a portion of the risk back to third parties, such as minority-owned reinsurers.
|
|
•
|
Multinational pooling: through these agreements, employers buy many group insurance policies which are aggregated in a single insurer via reinsurance.
|
The risks ceded under these agreements are generally quota shares of group life and disability policies. The cessions vary from 50% to 90% of all the risks of the policies.
For our Property & Casualty business, we purchase reinsurance to manage our exposure to large losses (primarily catastrophe losses) and to protect statutory surplus. We cede losses and premiums based upon the exposure of the policies subject to reinsurance. To manage exposure to large property & casualty losses, we purchase property catastrophe, casualty and property per risk excess of loss reinsurance protection.
For our Retirement and Income Solutions business, we have periodically engaged in reinsurance activities on an opportunistic basis. There were no such transactions during the periods presented.
Asia, Latin America and EMEA
For certain of our life insurance products, we currently reinsure risks in excess of $5 million to external reinsurers on a yearly renewable term basis. We may also reinsure certain risks with external reinsurers depending upon the nature of the risk and local regulatory requirements.
For selected large corporate clients, we reinsure group employee benefits or credit insurance business with various client-affiliated reinsurance companies, covering policies issued to the employees or customers of the clients. Additionally, we cede and assume risk with other insurance companies when either company requires a business partner with the appropriate local licensing to issue certain types of policies in certain countries. In these cases, the assuming company typically underwrites the risks, develops the products and assumes most or all of the risk.
We also have reinsurance agreements in-force that reinsure a portion of the living and death benefit guarantees issued in connection with variable annuity products. Under these agreements, we pay reinsurance fees associated with the guarantees collected from policyholders, and receive reimbursement for benefits paid or accrued in excess of account values, subject to certain limitations.
21
MetLife Holdings
For our life products, we have historically reinsured the mortality risk primarily on an excess of retention basis or on a quota share basis. We currently reinsure 90% of the mortality risk in excess of $2 million for most products. In addition to reinsuring mortality risk as described above, we reinsure other risks, as well as specific coverages. Placement of reinsurance is done primarily on an automatic basis and also on a facultative basis for risks with specified characteristics. On a case by case basis, we may retain up to $20 million per life and reinsure 100% of amounts in excess of the amount we retain. We also assume portions of the risk associated with certain whole life policies issued by an affiliate and reinsure certain term life policies and universal life policies with secondary death benefit guarantees to an affiliate. We evaluate our reinsurance programs routinely and may increase or decrease our retention at any time.
For annuities, we reinsure 100% of the living and death benefit guarantees issued in connection with certain variable annuities issued since 2004 to an affiliate and portions of the living and death benefit guarantees issued in connection with our variable annuities issued prior to 2004 to affiliated and unaffiliated reinsurers. Under these reinsurance agreements, we pay a reinsurance premium generally based on fee associated with the guarantees collected from policyholders, and receive reimbursement for benefits paid or accrued in excess of account values, subject to certain limitations. We also assume 100% of certain variable annuity risks issued by certain affiliates.
In addition, for our other products we have a reinsurance agreement in-force to reinsure the living and death benefit guarantees issued in connection with certain variable annuity products. Under this agreement, we receive reinsurance fees associated with the guarantees collected from policyholders, and provide reimbursement for benefits paid or accrued in excess of account values, subject to certain limitations.
Brighthouse Financial
For our life products, we have historically reinsured the mortality risk primarily on an excess of retention basis or on a quota share basis. We currently reinsure 90% of the mortality risk in excess of $2 million for most products. In addition to reinsuring mortality risk as described above, we reinsure other risks, as well as specific coverages. Placement of reinsurance is done primarily on an automatic basis and also on a facultative basis for risks with specified characteristics. On a case by case basis, we may retain up to $20 million per life and reinsure 100% of amounts in excess of the amount we retain. We also reinsure portions of the risk associated with certain whole life policies to an affiliate and we assume certain term life policies and universal life policies with secondary death benefit guarantees issued by an affiliate. We evaluate our reinsurance programs routinely and may increase or decrease our retention at any time.
For annuities, we reinsure portions of the living and death benefit guarantees issued in connection with our variable annuities to unaffiliated reinsurers. Under these reinsurance agreements, we pay a reinsurance premium generally based on fees associated with the guarantees collected from policyholders, and receive reimbursement for benefits paid or accrued in excess of account values, subject to certain limitations. We reinsure 100% of certain variable annuity risks to an affiliate. We also assume 100% of the living and death benefit guarantees issued in connection with certain variable annuities issued by certain affiliates.
In addition, for our other products we reinsure through 100% quota share reinsurance agreements certain run-off long-term care and workers’ compensation business written by MetLife USA.
Catastrophe Coverage
We have exposure to catastrophes which could contribute to significant fluctuations in our results of operations. We use excess reinsurance agreements, under which the direct writing company reinsures risk in excess of a specific dollar value for each policy within a class of policies, to provide greater diversification of risk and minimize exposure to larger risks. Such excess reinsurance agreements include retention reinsurance agreements and quota share reinsurance agreements. Retention reinsurance agreements provide for a portion of a risk to remain with the direct writing company, and quota share reinsurance agreements provide for the direct writing company to transfer a fixed percentage of all risks of a class of policies. Our life insurance products, particularly group life, subject us to catastrophe risk which we do not reinsure other than through our ongoing mortality reinsurance program which transfers risk at the individual policy level. Currently, for Asia, Latin America and EMEA, we purchase catastrophe coverage to insure risks within certain countries deemed by management to be exposed to the greatest catastrophic risks. For all of our other segments, we use excess of retention and quota share reinsurance agreements to provide greater diversification of risk and minimize exposure to larger risks.
Reinsurance Recoverables
For information regarding ceded reinsurance recoverable balances, included in premiums, reinsurance and other receivables on the consolidated balance sheets, see
Note 6
of the Notes to the Consolidated Financial Statements.
22
Regulation
Index to Regulation
|
Page
|
|
23
Overview
In the U.S., our life insurance companies are regulated primarily at the state level, with some products and services also subject to federal regulation. In addition, MetLife, Inc. and its U.S. insurance subsidiaries are subject to regulation under the insurance holding company laws of various U.S. jurisdictions. Furthermore, some of MetLife’s operations, products and services are subject to consumer protection laws, securities, broker-dealer and investment adviser regulations, environmental and unclaimed property laws and regulations, and to the Employee Retirement Income Security Act of 1974 (“ERISA”). If MetLife, Inc. were re-designated as a non-bank SIFI, it could also be subject to regulation by the Federal Reserve and the FDIC. See “— U.S. Regulation.”
The Dodd-Frank Wall Street Reform and Consumer Protection Act (“Dodd-Frank”) effected the most far-reaching overhaul of financial regulation in the United States in decades. However, President Trump and the majority party have expressed goals to dismantle or roll back Dodd-Frank. See “
— U.S. Regulation” and “
Risk Factors
—
Regulatory and Legal Risks
—
Our Insurance and Brokerage Businesses Are Highly Regulated, and Changes in Regulation and In Supervisory and Enforcement Policies May Reduce Our Profitability and Limit Our Growth” for the discussion of Dodd-Frank.
Our international insurance operations are principally regulated by insurance regulatory authorities in the jurisdictions in which they are located or operate. In addition, our investment and pension companies outside of the U.S. are subject to oversight by the relevant securities, pension and other authorities of the countries in which the companies operate. Our non-U.S. insurance businesses are also subject to current and developing solvency regimes which impose various capital and other requirements. As a global systemically important insurer (“G-SII”), MetLife, Inc. may also become subject to additional capital requirements. See “— International Regulation.”
U.S. Regulation
Insurance Regulation
State insurance regulation generally aims at supervising and regulating insurers, with the goal of protecting policyholders and ensuring that insurance companies remain solvent. Insurance regulators have increasingly sought information about the potential impact of activities in holding company systems as a whole, and some jurisdictions have adopted laws and regulations enhancing “group-wide” supervision, as supported by the National Association of Insurance Commissioners’ (“NAIC”) Solvency Modernization Initiative. See “— NAIC” for information regarding group-wide supervision.
24
Each of MetLife’s insurance subsidiaries operating in the United States is licensed and regulated in each U.S. jurisdiction where it conducts insurance business. The extent of such regulation varies, but most jurisdictions have laws and regulations governing the financial aspects and business conduct of insurers. State laws in the U.S. grant insurance regulatory authorities broad administrative powers with respect to, among other things:
|
•
|
licensing companies and agents to transact business;
|
|
•
|
calculating the value of assets to determine compliance with statutory requirements;
|
|
•
|
mandating certain insurance benefits;
|
|
•
|
regulating certain premium rates;
|
|
•
|
reviewing and approving certain policy forms, including required policyholder disclosures;
|
|
•
|
regulating unfair trade and claims practices, including through the imposition of restrictions on marketing and sales practices, distribution arrangements and payment of inducements, and identifying and paying to the states benefits and other property that is not claimed by the owners;
|
|
•
|
regulating advertising;
|
|
•
|
protecting privacy;
|
|
•
|
establishing statutory capital and reserve requirements and solvency standards;
|
|
•
|
specifying the conditions under which a ceding company can take credit for reinsurance in its statutory financial statements (i.e., reduce its reserves by the amount of reserves ceded to a reinsurer);
|
|
•
|
fixing maximum interest rates on insurance policy loans and minimum rates for guaranteed crediting rates on life insurance policies and annuity contracts;
|
|
•
|
adopting and enforcing suitability standards with respect to the sale of annuities and other insurance products;
|
|
•
|
approving changes in control of insurance companies;
|
|
•
|
restricting the payment of dividends and other transactions between affiliates; and
|
|
•
|
regulating the types, amounts and valuation of investments.
|
Each insurance subsidiary is required to file reports, generally including detailed annual financial statements, with insurance regulatory authorities in each of the jurisdictions in which it does business, and its operations and accounts are subject to periodic examination by such authorities. These subsidiaries must also file, and in many jurisdictions and in some lines of insurance obtain regulatory approval for, rules, rates and forms relating to the insurance written in the jurisdictions in which they operate.
State and federal insurance and securities regulatory authorities and other state law enforcement agencies and attorneys general from time to time make inquiries regarding compliance by MetLife, Inc. and its insurance subsidiaries with insurance, securities and other laws and regulations regarding the conduct of our insurance and securities businesses. We cooperate with such inquiries and take corrective action when warranted. See
Note 21
of the Notes to the Consolidated Financial Statements.
Holding Company Regulation
Insurance holding company laws and regulations vary from jurisdiction to jurisdiction, but generally require a controlled insurance company (i.e., insurers that are subsidiaries of insurance holding companies) to register with state regulatory authorities and to file with those authorities certain reports, including information concerning its capital structure, ownership, financial condition, certain intercompany transactions and general business operations. The NAIC adopted revisions to the NAIC Insurance Holding Company System Model Act (“Model Holding Company Act”) and the Insurance Holding Company System Model Regulation (“Regulation”) in December 2010 and December 2014. The Model Holding Company Act and Regulation serve as a basis for action by the states. See “— NAIC” for further information on the Model Holding Company Act and Regulation.
25
State insurance statutes also typically place restrictions and limitations on the amount of dividends or other distributions payable by insurance company subsidiaries to their parent companies, as well as on transactions between an insurer and its affiliates. Dividends in excess of prescribed limits and transactions above a specified size between an insurer and its affiliates require the approval of the insurance regulator in the insurer’s state of domicile. See “Management’s Discussion and Analysis of Financial Condition and Results of Operations — Liquidity and Capital Resources — MetLife, Inc. — Liquidity and Capital Sources — Dividends from Subsidiaries.” See also “Dividend Restrictions” in
Note 16
of the Notes to the Consolidated Financial Statements for further information regarding such limitations, as well as an amendment to the New York Insurance Law permitting MLIC to pay stockholder dividends to MetLife, Inc. in any calendar year without prior insurance regulatory clearance under one of two alternative formulations during 2016 and going forward.
Federal Initiatives
Although the insurance business in the United States is primarily regulated by the states, federal initiatives often have an impact on our business in a variety of ways. From time to time, federal measures are proposed which may significantly affect the insurance business. These areas include financial services regulation, securities regulation, derivatives regulation, pension regulation, health care regulation, privacy, tort reform legislation and taxation. In addition, various forms of direct and indirect federal regulation of insurance have been proposed from time to time, including proposals for the establishment of an optional federal charter for insurance companies. See “— Health Care Regulation,” “Risk Factors — Regulatory and Legal Risks — Legislative and Regulatory Activity in Health Care and Other Employee Benefits Could Affect our Profitability as a Provider of Life Insurance, Annuities, and Non-Medical Health Insurance Benefit Products” and “Risk Factors — Regulatory and Legal Risks — Our Insurance and Brokerage Businesses Are Highly Regulated, and Changes in Regulation and in Supervisory and Enforcement Policies May Reduce Our Profitability and Limit Our Growth.”
Dodd-Frank effected the most far-reaching overhaul of financial regulation in the United States in decades. The full impact of Dodd-Frank on us will depend on whether MetLife, Inc. again becomes subject to supervision and regulation as a non-bank SIFI, as well as the adoption and implementation of final rules for insurance non-bank SIFIs required or permitted by Dodd-Frank, a number of which remain to be completed. Additionally, President Trump and the majority party have expressed goals to dismantle or roll back Dodd-Frank and President Trump has issued an Executive Order that calls for a comprehensive review of Dodd-Frank in light of certain enumerated core principles of financial system regulation. We are not able to predict with certainty whether any such proposal would have a material effect on our business operations and cannot currently identify all of the risks or opportunities, if any, that may be posed to our businesses as a result of changes to, or legislative replacements for, Dodd-Frank. See “Risk Factors — Regulatory and Legal Risks — Our Insurance and Brokerage Businesses Are Highly Regulated, and Changes in Regulation and In Supervisory and Enforcement Policies May Reduce Our Profitability and Limit Our Growth.”
Dodd-Frank established the Federal Insurance Office (“FIO”) within the Department of the Treasury, which has the authority to participate in the negotiations of international insurance agreements with foreign regulators for the U.S., as well as to collect information about the insurance industry and recommend prudential standards. While not having a general supervisory or regulatory authority over the business of insurance, the director of this office performs various functions with respect to insurance, including serving as a non-voting member of the FSOC and making recommendations to the FSOC regarding insurers to be designated for more stringent regulation. On December 12, 2013, the FIO issued a report, mandated by Dodd-Frank, which, among other things, urged the states to modernize and promote greater uniformity in insurance regulation. However, the report also discussed potential federal solutions if states failed to modernize and improve regulation and some of the report’s recommendations, for instance, favored a greater federal role in monitoring financial stability and identifying issues or gaps in the regulation of large national and internationally active insurers.
Dodd-Frank also includes provisions that may impact the investments and investment activities of MetLife, Inc. and its subsidiaries, including the federal regulation of such activities. Until the various final regulations are promulgated pursuant to Dodd-Frank, and perhaps for some time thereafter, the full impact of Dodd-Frank on such activities will remain unclear. Such provisions and regulations include, but are not limited to, the potential application of enhanced prudential standards and capital requirements, including additional quantitative limits with respect to proprietary trading and sponsoring or investing in hedge funds or private equity funds, to non-bank SIFIs, all of which could potentially affect MetLife, Inc. See “— Potential Regulation as a Non-Bank SIFI.” However, following the transition occurring in the United States government and the priorities of the Trump Administration, we cannot predict with certainty whether any such regulations will be adopted. See “Risk Factors — Regulatory and Legal Risks — Our Insurance and Brokerage Businesses Are Highly Regulated, and Changes in Regulation and in Supervisory and Enforcement Policies May Reduce Our Profitability and Limit Our Growth” for information regarding the Trump Administration’s expressed goals to dismantle or roll back Dodd-Frank.
26
Health Care Regulation
The Patient Protection and Affordable Care Act (“PPACA”), signed into law on March 23, 2010, and The Health Care and Education Reconciliation Act of 2010, signed into law on March 30, 2010 (together, the “Affordable Care Act”), impose obligations on MetLife as an enterprise, and as a provider of non-medical health insurance benefits and as a purchaser of certain of these products. In 2014, we became subject to an excise tax called the “health insurer fee,” the cost of which is primarily passed on to group purchasers of certain of our dental and vision insurance products. Additionally, with respect to dental insurance products sold to groups with 50 or fewer employees, we have changed certain of our product offerings in response to the Affordable Care Act. The cost of these product changes will also be reflected in our pricing of such products. The Affordable Care Act and its related regulations have already resulted in increased and unpredictable costs to provide certain products and may have additional adverse effects. See “Risk Factors — Regulatory and Legal Risks — Legislative and Regulatory Activity in Health Care and Other Employee Benefits Could Affect our Profitability as a Provider of Life Insurance, Annuities, and Non-Medical Health Insurance Benefit Products.” It has also harmed our competitive position, as the Affordable Care Act has a disparate impact on our products compared to products offered by our not-for-profit competitors.
On July 14, 2014, the District of Columbia (“DC”) adopted a law that imposes an assessment on health insurers doing business in DC, including those that issue non-medical health-related products that are not subject to regulation under the Affordable Care Act. While the financial impact to the Company of DC’s action will be minimal, if other states decide to adopt this model, there could be an impact on product pricing and sales. Currently 16 states and DC have created their own public healthcare exchanges. One other state (Connecticut) has levied an assessment and other states may also consider levying assessments on both medical and non-medical health insurers to fund their healthcare exchanges. On June 25, 2015, the U.S. Supreme Court, in the
King v. Burwell
decision, upheld the payment of tax credits to individuals who purchase coverage in states that have a federally facilitated exchange rather than a state exchange. Had the Supreme Court not upheld this payment, it is likely more states would have been compelled to create their own exchanges and possibly assess insurers for the fees of running these exchanges.
The Preservation of Access to Care for Medicare Beneficiaries and Pension Relief Act of 2010 also includes certain provisions for defined benefit pension plan funding relief. As part of our Retirement and Income Solutions business, we offer general account and separate account group annuity products that enable a plan sponsor to transfer these risks, often in connection with the termination of defined benefit pension plans. See “Risk Factors — Regulatory and Legal Risks — Legislative and Regulatory Activity in Health Care and Other Employee Benefits Could Affect our Profitability as a Provider of Life Insurance, Annuities, and Non-Medical Health Insurance Benefit Products” for further information regarding the potential effect of such regulation.
Guaranty Associations and Similar Arrangements
Most of the U.S. jurisdictions in which our insurance subsidiaries are admitted to transact business require life, health and property & casualty insurers doing business within the jurisdiction to participate in guaranty associations, which are organized to pay certain contractual insurance benefits owed pursuant to insurance policies issued by impaired, insolvent or failed insurers, or those that may become impaired, insolvent or fail, for example, following the occurrence of one or more catastrophic events. These associations levy assessments, up to prescribed limits, on all member insurers in a particular state on the basis of the proportionate share of the premiums written by member insurers in the lines of business in which the impaired, insolvent or failed insurer is engaged. Some states permit member insurers to recover assessments paid through full or partial premium tax offsets.
In the past five years, the aggregate assessments levied against MetLife have not been material. We have established liabilities for guaranty fund assessments that we consider adequate. See
Note 21
of the Notes to the Consolidated Financial Statements for additional information on the guaranty association assessments.
Insurance Regulatory Examinations and Other Activities
As part of their regulatory oversight process, state insurance departments conduct periodic detailed examinations of the books, records, accounts, and business practices of insurers domiciled in their states. State insurance departments also have the authority to conduct examinations of non-domiciliary insurers that are licensed in their states. Except as otherwise disclosed in Note
21
of the Notes to the Consolidated Financial Statements, during the years ended
December 31, 2016
,
2015
and
2014
, MetLife did not receive any material adverse findings resulting from state insurance department examinations of its insurance subsidiaries.
27
Regulatory authorities in a small number of states, Financial Industry Regulatory Authority (“FINRA”) and, occasionally, the SEC, have had investigations or inquiries relating to sales of individual life insurance policies or annuities or other products by MLIC, MetLife USA, NELICO, General American Life Insurance Company (“GALIC”), FMLI, and MSI, a broker-dealer which was part of the U.S. Retail Advisor Force Divestiture. These investigations have focused on the conduct of particular financial services representatives, the sale of unregistered or unsuitable products, the misuse of client assets, and sales and replacements of annuities and certain riders on such annuities. Over the past several years, these and a number of investigations by other regulatory authorities were resolved for monetary payments and certain other relief, including restitution payments. We may continue to receive, and may resolve, further investigations and actions on these matters in a similar manner. See
Note 21
of the Notes to the Consolidated Financial Statements.
In addition, claims payment practices by insurance companies have received increased scrutiny from regulators. See
Note 21
of the Notes to the Consolidated Financial Statements for further information regarding retained asset accounts and unclaimed property inquiries and related litigation and sales practices claims.
We also received an inquiry relating to licensing. See
Note 21
of the Notes to the Consolidated Financial Statements for further information regarding the settlement of a licensing matter with the New York State Department of Financial Services (the “NYDFS”) and the District Attorney, New York County, and a related amendment to the New York Insurance Law.
The International Association of Insurance Supervisors (“IAIS”) has encouraged U.S. insurance supervisors, such as the NYDFS, to establish Supervisory Colleges for U.S.-based insurance groups with international operations, including MetLife, to facilitate cooperation and coordination among the insurance groups’ supervisors and to enhance the member regulators’ understanding of an insurance group’s risk profile. In September 2016, a Supervisory College meeting was chaired by the NYDFS and attended by MetLife’s key U.S. and international regulators. We have not received any reports or recommendations from the Supervisory College meeting, and we do not expect any outcome of the meeting to have a material adverse effect on our business.
Policy and Contract Reserve Adequacy Analysis
Annually, our U.S. insurance subsidiaries, including affiliated captive reinsurers, are required to conduct an analysis of the adequacy of all statutory reserves. In each case, a qualified actuary must submit an opinion which states that the statutory reserves make adequate provision, according to accepted actuarial standards of practice, for the anticipated cash flows required by the contractual obligations and related expenses of the U.S. insurance subsidiary. The adequacy of the statutory reserves is considered in light of the assets held by the insurer with respect to such reserves and related actuarial items including, but not limited to, the investment earnings on such assets, and the consideration anticipated to be received and retained under the related policies and contracts. The Company may increase reserves in order to submit an opinion without qualification. Since the inception of this requirement, our U.S. insurance subsidiaries which are required by their states of domicile to provide these opinions have provided such opinions without qualifications.
NAIC
The NAIC is an organization, the mission of which is to assist state insurance regulatory authorities in serving the public interest and achieving the insurance regulatory goals of its members, the state insurance regulatory officials. Through the NAIC, state insurance regulators establish standards and best practices, conduct peer reviews, and coordinate their regulatory oversight. The NAIC provides standardized insurance industry accounting and reporting guidance through its Accounting Practices and Procedures Manual (the “Manual”), which states have largely adopted by regulation. However, statutory accounting principles continue to be established by individual state laws, regulations and permitted practices, which may differ from the Manual. Changes to the Manual or modifications by the various state insurance departments may impact the statutory capital and surplus of MetLife, Inc.’s U.S. insurance subsidiaries.
The Model Holding Company Act and Regulation include a requirement that the ultimate controlling person of a U.S. insurer file an annual enterprise risk report with the lead state of the insurance holding company system identifying risks likely to have a material adverse effect upon the financial condition or liquidity of the insurer or its insurance holding company system as a whole. To date, all of the states where MetLife has domestic insurers have enacted a version of the revised Model Holding Company Act, including the enterprise risk reporting requirement. In December 2014, the NAIC adopted amendments to the Model Holding Company Act that would authorize state insurance commissioners to act as global group-wide supervisors for internationally active insurance groups, as well as other insurers that choose to opt in for the group-wide supervision. The amendments create a selection process for the group-wide supervisor, extend confidentiality protection to communications with the group-wide supervisor, and outline the duties of the group-wide supervisor. To date, a number of jurisdictions have adopted laws and regulations enhancing group-wide supervision.
28
The NAIC has concluded its “Solvency Modernization Initiative,” which was designed to review the U.S. financial regulatory system and all aspects of financial regulation affecting insurance companies. Though broad in scope, the NAIC’s Solvency Modernization Initiative focused on: (1) capital requirements; (2) corporate governance and risk management; (3) group supervision; (4) statutory accounting and financial reporting; and (5) reinsurance. In furtherance of this initiative, the NAIC adopted the Corporate Governance Annual Filing Model Act and Regulation at its August 2014 meeting. The model, which requires insurers to make an annual confidential filing regarding their corporate governance policies, has been adopted in approximately ten states. In addition, in September 2012, the NAIC adopted the Risk Management and Own Risk and Solvency Assessment Model Act (“ORSA Model Act”), which has been enacted by our insurance subsidiaries’ domiciliary states. The ORSA Model Act requires that insurers maintain a risk management framework and conduct an internal own risk and solvency assessment of the insurer’s material risks in normal and stressed environments. The assessment must be documented in a confidential annual summary report, a copy of which must be made available to regulators as required or upon request. MetLife, Inc. has submitted on behalf of the enterprise an Own Risk and Solvency Assessment (“ORSA”) summary report to the NYDFS annually since this requirement became effective.
In December 2012, the NAIC approved a new valuation manual containing a principle-based approach to the calculation of life insurance reserves. Principle-based reserving is designed to better address reserving for products, including the current generation of products for which the current formulaic basis for reserve determination does not work effectively. The principle-based approach became effective on January 1, 2017 in the states where it had been adopted, to be followed by a three-year phase-in period (at the option of insurance companies on a product-by-product basis) for new business since it was enacted into law by the required number of state legislatures. To date, principle-based reserving has been adopted by all of the states where our insurance subsidiaries are domiciled, except in New York where the NYDFS has publicly stated its intention to implement this approach beginning in January 2018, subject to a working group of the NYDFS establishing the necessary reserves safeguards, and in Massachusetts where the legislature is considering legislation in this area.
In 2015, the NAIC commenced an initiative to study variable annuity solvency regulations, with the goal of curtailing the use of variable annuity captives. In connection with this study, the NAIC engaged a third-party consultant to develop recommendations in 2016. The NAIC has asked the third-party consultant to conduct an additional study and develop new recommendations in 2017. The NAIC will consider the 2017 recommendations, which, if adopted, would apply to insurers’ existing and new business and likely would materially change the sensitivity of the balance sheet (including reserve and capital requirements) to capital markets. It is not possible to predict whether the amount of reserves or capital required to support our variable annuity contracts would increase or decrease if any such 2017 recommendations are adopted, nor is it possible to predict the extent to which any such recommendations would affect the effectiveness and design of our risk mitigation and hedging programs. Furthermore, no assurances can be given to whether any such recommendations will be adopted or to the timing of any such adoption.
We cannot predict the capital and reserve impacts or compliance costs, if any, that may result from the above initiatives, or what impact these initiatives will have on our business, financial condition or results of operations, although after the Separation, principle-based reserving will have less of an impact, given our discontinuance of retail life sales.
Surplus and Capital; Risk-Based Capital
Insurers are required to maintain their capital and surplus at or above minimum levels prescribed by the laws of their respective jurisdictions. Regulators have discretionary authority, in connection with the continued licensing of our U.S. insurance subsidiaries, to limit or prohibit an insurer’s sales to policyholders if, in their judgment, the regulators determine that such insurer has not maintained the minimum surplus or capital or that the further transaction of business will be hazardous to policyholders. Most of our U.S. insurance subsidiaries are subject to risk-based capital (“RBC”) requirements that were developed by the NAIC and adopted by their respective states of domicile. RBC is based on a formula calculated by applying factors to various asset, premium, claim, expense and statutory reserve items. The formula takes into account the risk characteristics of the insurer and is calculated on an annual basis. The major categories of risk involved are asset risk, insurance risk, interest rate risk, market risk and business risk. The formula is used as an early warning regulatory tool to identify possible inadequately capitalized insurers for purposes of initiating regulatory action, and not as a means to rank insurers generally. State insurance laws provide insurance regulators the authority to require various actions by, or take various actions against, insurers whose total adjusted capital does not meet or exceed certain RBC levels. As of the date of the most recent annual statutory financial statements filed with insurance regulators, the total adjusted capital of each of our subsidiaries subject to these requirements was in excess of each of those RBC levels. See “Statutory Equity and Income” in
Note 16
of the Notes to the Consolidated Financial Statements and “Management’s Discussion and Analysis of Financial Condition and Results of Operations — Liquidity and Capital Resources — The Company — Capital — Statutory Capital and Dividends.”
29
While not required by or filed with insurance regulators, we calculate internally defined combined RBC ratios (“Combined RBC Ratios”), which are determined by dividing the sum of total adjusted capital for MetLife, Inc.’s principal U.S. insurance subsidiaries, excluding American Life Insurance Company (“American Life”), by the sum of company action level RBC for such subsidiaries. We calculate Combined RBC Ratios based on NAIC capital and reserving requirements (“NAIC-Based Combined RBC Ratios”). We also calculate Combined RBC Ratios derived from the statutory-basis financial statements as filed with insurance regulators (“Statement-Based Combined RBC Ratios”), which include additional reserve and capital requirements as required by the NYDFS for the Company’s New York domiciled insurance subsidiaries.
Our NAIC-Based Combined RBC Ratios were 465% and 537% at December 31, 2016 and 2015, respectively. Our Statement-Based Combined RBC Ratios were 446% and 513% at December 31, 2016 and 2015, respectively. Lower total adjusted capital coupled with higher company action level RBC resulted in a decrease of 72 points in the NAIC-Based Combined RBC Ratio at December 31, 2016 as compared to 2015 and contributed to the decrease of 67 points in the Statement-Based Combined RBC Ratio at December 31, 2016 as compared to 2015. The decrease in total adjusted capital is primarily due to dividends paid to MetLife, Inc. and derivative losses exceeding combined statutory operating earnings. Combined statutory net income of MetLife, Inc.’s U.S. insurance subsidiaries, excluding American Life, was $4.8 billion (see Note 16 of the Notes to the Consolidated Financial Statements) and $4.6 billion on a statement-basis and NAIC-basis, respectively, for the year ended December 31, 2016. The increase in combined statutory net income is primarily driven by a decrease in variable annuity rider reserves.
We are not aware of any NAIC adoptions that would have a material impact on the RBC of our U.S. insurance subsidiaries.
Regulation of Investments
Each of our U.S. insurance subsidiaries is subject to state laws and regulations that require diversification of investment portfolios and limit the amount of investments that an insurer may have in certain asset categories, such as below investment grade fixed income securities, real estate equity, other equity investments, and derivatives. Failure to comply with these laws and regulations would cause investments exceeding regulatory limitations to be treated as non-admitted assets for purposes of measuring surplus and, in some instances, would require divestiture of such non-qualifying investments. We believe that the investments made by each of MetLife, Inc.’s U.S. insurance subsidiaries complied, in all material respects, with such regulations at December 31, 2016.
New York’s Cybersecurity Regulation
On February 16, 2017, the NYDFS announced the adoption of a new cybersecurity regulation for financial services institutions, including banking and insurance entities, under its jurisdiction. The new regulations will become effective on March 1, 2017, and will be implemented in stages commencing 180 days later. Among other things, this new regulation requires these entities to establish and maintain a cybersecurity program designed to protect consumers’ private data. The new regulation specifically provides for: (i) controls relating to the governance framework for a cybersecurity program, including funding and staffing requirements, management oversight, and periodic reporting to senior management; (ii) risk-based minimum standards for technology systems including access controls, for data protection; (iii) minimum standards for cyber breach responses, including an incident response plan, preservation of data to respond to such breaches, and notice to NYDFS of material events; and (iv) identification and documentation of material deficiencies, remediation plans and annual certifications of regulatory compliance to the NYDFS.
ERISA Considerations
We provide products and services to certain employee benefit plans that are subject to ERISA or the Internal Revenue Code of 1986, as amended (the “Code”). As such, our activities are subject to the restrictions imposed by ERISA and the Code, including the requirement under ERISA that fiduciaries must perform their duties solely in the interests of ERISA plan participants and beneficiaries, and that fiduciaries may not cause a covered plan to engage in certain prohibited transactions. The applicable provisions of ERISA and the Code are subject to enforcement by the Department of Labor (“DOL”), the Internal Revenue Service and the Pension Benefit Guaranty Corporation.
The prohibited transaction rules of ERISA and the Code generally restrict the provision of investment advice to ERISA plans and participants and Individual Retirement Accounts (“IRAs”) if the investment recommendation results in fees paid to an individual advisor, the firm that employs the advisor or their affiliates that vary according to the investment recommendation chosen.
30
The DOL issued new regulations on April 6, 2016 with an applicable date for most provisions of April 10, 2017. These regulations substantially expand the definition of “investment advice” and thereby broaden the circumstances under which MetLife or its representatives, in providing investment advice with respect to ERISA plans, plan participants or IRAs, could be deemed a fiduciary under ERISA or the Code. Pursuant to the final regulations, certain communications with plans, plan participants and IRA holders, including the sales of products, and investment management or advisory services, could be deemed fiduciary investment advice, thus causing increased exposure to fiduciary liability if the distributor does not recommend what is in the client’s best interests. The DOL also issued amendments to certain of its prohibited transaction exemptions, and issued a new exemption, that applies more onerous disclosure and contract requirements to, and increases fiduciary requirements and fiduciary liability exposure in respect of, transactions involving ERISA plans, plan participants and IRAs. On September 27, 2016, the DOL released Frequently Asked Questions on the new exemption and amendments to certain existing exemptions, which provide guidance concerning the application and implementation of the new and amended prohibited transaction exemptions.
We anticipate that we will need to undertake certain additional tasks in order to comply with certain of the exemptions provided in the DOL regulations, including additional compliance reviews of material shared with distributors, wholesaler and call center training and product reporting and analysis. However, in light of action by President Trump on February 3, 2017, the applicability date of April 10, 2017 may well be delayed. It is also possible that the substance of the regulation could be substantially modified or replaced due to the change in Administration. We cannot predict with certainty what other proposals may be made or what legislation or regulations may be introduced or enacted, or what impact any such legislation or regulations may have on our business, results of operations and financial condition. See “Risk Factors — Regulatory and Legal Risks — Our Insurance and Brokerage Businesses Are Highly Regulated, and Changes in Regulation and In Supervisory and Enforcement Policies May Reduce Our Profitability and Limit Our Growth.
On July 11, 2016, the DOL, the IRS and the Pension Benefit Guaranty Corporation proposed revisions to the Form 5500, the form used for ERISA annual reporting. The revisions affect employee pension and welfare benefit plans, including our ERISA plans, and require audits of information, self-directed brokerage account disclosure and additional extensive disclosure. We cannot predict the effect these proposals will have on our business, if enacted, or what other proposals may be made, what legislation may be introduced or enacted, or what impact any such legislation may have on our results of operations and financial condition.
In addition, the DOL has issued a number of regulations that increase the level of disclosure that must be provided to plan sponsors and participants. The participant disclosure regulations and the regulations which require service providers to disclose fee and other information to plan sponsors took effect in 2012. In
John Hancock Mutual Life Insurance Company v. Harris Trust and Savings Bank
(1993), the U.S. Supreme Court held that certain assets in excess of amounts necessary to satisfy guaranteed obligations under a participating group annuity general account contract are “plan assets.” Therefore, these assets are subject to certain fiduciary obligations under ERISA, which requires fiduciaries to perform their duties solely in the interest of ERISA plan participants and beneficiaries. On January 5, 2000, the Secretary of Labor issued final regulations indicating, in cases where an insurer has issued a policy backed by the insurer’s general account to or for an employee benefit plan, the extent to which assets of the insurer constitute plan assets for purposes of ERISA and the Code. The regulations apply only with respect to a policy issued by an insurer on or before December 31, 1998 (“Transition Policy”). No person will generally be liable under ERISA or the Code for conduct occurring prior to July 5, 2001, where the basis of a claim is that insurance company general account assets constitute plan assets. An insurer issuing a new policy that is backed by its general account and is issued to or for an employee benefit plan after December 31, 1998 will generally be subject to fiduciary obligations under ERISA, unless the policy is a guaranteed benefit policy.
The regulations indicate the requirements that must be met so that assets supporting a Transition Policy will not be considered plan assets for purposes of ERISA and the Code. These requirements include detailed disclosures to be made to the employee benefits plan and the requirement that the insurer must permit the policyholder to terminate the policy on 90 days’ notice and receive without penalty, at the policyholder’s option, either (i) the unallocated accumulated fund balance (which may be subject to market value adjustment) or (ii) a book value payment of such amount in annual installments with interest. We have taken and continue to take steps designed to ensure compliance with these regulations.
31
Potential Regulation as a Non-Bank SIFI
On December 18, 2014, the FSOC designated MetLife, Inc. as a non-bank SIFI subject to regulation by the Federal Reserve and the FDIC, as well as to enhanced supervision and prudential standards. On January 13, 2015, MetLife, Inc. filed an action in the D.C. District Court asking the Court to review and rescind the FSOC’s designation. On March 30, 2016, the D.C. District Court ordered that the designation of MetLife, Inc. as a non-bank SIFI by the FSOC be rescinded. On April 8, 2016, the FSOC appealed the D.C. District Court’s order to the D.C. Circuit Court of Appeals, and oral argument was heard on October 24, 2016. If the FSOC prevails on appeal or re-designates MetLife, Inc. as systemically important as part of its ongoing review of non-bank financial companies, MetLife, Inc. could once again be subject to regulation as a non-bank SIFI.
Regulation of MetLife, Inc. as a non-bank SIFI could materially and adversely affect our business. For example, the Federal Reserve Board has issued an advance notice of proposed rulemaking but not yet finally determined the enhanced capital requirements that would apply to insurance non-bank SIFIs. If MetLife, Inc. were re-designated as a non-bank SIFI, those capital requirements may adversely affect our ability to compete with other insurers that are not subject to those requirements, and our ability to issue guarantees could be constrained. In addition, if re-designated as a non-bank SIFI, MetLife, Inc. would need to obtain Federal Reserve approval before directly or indirectly acquiring, merging or consolidating with a financial company having more than $10 billion of assets or acquiring 5% or more of any voting class of securities of a bank or bank holding company and, depending on the extent of the combined company’s liabilities, would be subject to additional restrictions regarding its ability to merge. The Federal Reserve would also have the right to require any of our insurance companies, or insurance company affiliates, to take prompt action to correct any financial weaknesses.
Together with other large financial institutions and non-bank SIFIs, if MetLife, Inc. were re-designated as a non-bank SIFI, it would be subject to a number of Dodd-Frank requirements including responsibility to pay certain assessments and other charges (i) equal to the total expenses the Federal Reserve Board thinks is necessary for its supervision of bank holding companies and non-bank SIFIs, and (ii) in connection with the Financial Research Fund within the U.S. Department of Treasury that funds the Office of Financial Research, an agency established by Dodd-Frank to improve the quality of financial data available to policymakers and facilitate more robust and sophisticated analysis of the financial system. See “Risk Factors — Regulatory and Legal Risks — Our Insurance and Brokerage Businesses Are Highly Regulated, and Changes in Regulation and in Supervisory and Enforcement Policies May Reduce Our Profitability and Limit Our Growth — U.S. Regulation — Potential Regulation of MetLife, Inc. as a Non-Bank SIFI.” See also “Risk Factors — Regulatory and Legal Risks — Our Insurance and Brokerage Businesses Are Highly Regulated, and Changes in Regulation and in Supervisory and Enforcement Policies May Reduce Our Profitability and Limit Our Growth” for information regarding the Trump Administration’s expressed goals to dismantle or roll back Dodd-Frank.
Enhanced Prudential Standards for Non-Bank SIFIs
The Federal Reserve Board has indicated that it plans to apply enhanced prudential standards, including enhanced capital requirements, governance, risk management and liquidity requirements, to non-bank SIFIs by rule or order. Once capital requirements for non-bank SIFIs are determined, non-bank SIFIs will be required to undergo three stress tests each year. Companies will be required to take the results of the stress tests into consideration in their annual capital planning and resolution and recovery planning. Non-bank SIFIs are also required to submit a resolution plan (annually and upon change of circumstances) setting forth how the company could be resolved under the Bankruptcy Code in the event of material financial distress. A failure to submit a “credible” resolution plan could result in the imposition of a variety of measures, including additional capital, leverage, or liquidity requirements, and forced divestiture of assets or operations.
In addition, if MetLife, Inc. were re-designated as a non-bank SIFI and if it were determined that MetLife, Inc. posed a substantial threat to U.S. financial stability, the applicable federal regulators would have the right to require it to take one or more other mitigating actions to reduce that risk.
Following the transition occurring in the United States government and the priorities of the Trump Administration, however, we cannot predict with certainty whether any such regulations will be adopted, nor how they might apply to MetLife, Inc. were it to be re-designated as a non-bank SIFI. See “Risk Factors
—
Regulatory and Legal Risks
—
Our Insurance and Brokerage Businesses Are Highly Regulated, and Changes in Regulation and in Supervisory and Enforcement Policies May Reduce Our Profitability and Limit Our Growth” for information regarding the Trump Administration’s expressed goals to dismantle or roll back Dodd-Frank.
32
Orderly Liquidation Authority
Under the provisions of Dodd-Frank relating to the resolution or liquidation of certain types of financial institutions, if MetLife, Inc. or another financial institution were to become insolvent or were in danger of defaulting on its obligations, it could be compelled to undergo liquidation with the FDIC as receiver. For this new regime to be applicable, a number of determinations would have to be made, including that a default by the affected company would have serious adverse effects on financial stability in the U.S. While under this new regime an insurance company would be resolved in accordance with state insurance law, if the FDIC were to be appointed as the receiver for another type of company (including an insurance holding company such as MetLife, Inc.), the liquidation of that company would occur under the provisions of the new liquidation authority, and not under the Bankruptcy Code, which ordinarily governs liquidations. The FDIC’s purpose under the liquidation regime is to mitigate the systemic risks the institution’s failure poses, which is different from that of a bankruptcy trustee under the Bankruptcy Code. In such a liquidation, the holders of such company’s debt could in certain respects be treated differently than under the Bankruptcy Code. As required by Dodd-Frank, the FDIC has established rules relating to the priority of creditors’ claims and the potentially dissimilar treatment of similarly situated creditors. These provisions could apply to some financial institutions whose outstanding debt securities we hold in our investment portfolios. Dodd-Frank also provides for the assessment of bank holding companies with assets of $50 billion or more and non-bank SIFIs to cover the costs of liquidating any financial company subject to the new liquidation authority.
Volcker Rule
Under the Volcker Rule, Dodd-Frank authorizes through rulemaking additional capital requirements and quantitative limits on proprietary trading and sponsoring or investing in funds (hedge funds and private equity funds) that rely on certain exemptions from the Investment Company Act of 1940, as amended (the “Investment Company Act”), by a non-bank SIFI. Regulations defining and governing such requirements and limits on non-bank SIFIs have not been proposed and were not addressed in the final regulations issued on December 10, 2013 implementing the Volcker Rule for insured depository institutions and their affiliates (“Volcker Rule Regulations”). After designation as a non-bank SIFI, a non-bank SIFI will have a two-year period, subject to further extension by the Federal Reserve Board, to conform to any such requirements and limits that may be set forth in final regulations applicable to non-bank SIFIs. Subject to safety and soundness determinations as part of rulemaking that could require additional capital requirements and quantitative limits, Dodd-Frank provides that the exemptions under the Volcker Rule also are available to exempt any additional capital requirements and quantitative limits on non-bank SIFIs. The Volcker Rule Regulations provide an exemption, subject to certain requirements, for trading activities and fund sponsorship and investments by a regulated insurance company and its affiliates solely for the general account or separate account of such insurance company. Until final regulations applicable to non-bank SIFIs have been promulgated, it is unclear whether MetLife, Inc., were it to be re-designated as a non-bank SIFI, would have to alter any of its future activities to comply.
Consumer Protection Laws
Numerous federal and state laws affect MetLife, Inc.’s earnings and activities, including federal and state consumer protection laws. As part of Dodd-Frank, Congress established the Consumer Financial Protection Bureau (“CFPB”) to supervise and regulate institutions that provide certain financial products and services to consumers. Although the consumer financial services subject to the CFPB’s jurisdiction generally exclude insurance business of the kind in which we engage, the CFPB does have authority to regulate non-insurance consumer services we provide.
In August 2013, MetLife Bank, National Association (“MetLife Bank”) merged with and into MetLife Home Loans LLC (“MLHL”), its former subsidiary, with MLHL as the surviving, non-bank entity. The sole purpose of MLHL is to wind-down the limited remaining activities and fulfill remaining obligations and duties of MetLife Bank, some of which subject MLHL to certain federal consumer financial protection laws and certain state laws.
33
Regulation of Over-the-Counter Derivatives
Dodd-Frank includes a framework of regulation of the over-the-counter (“OTC”) derivatives markets which requires clearing of certain types of transactions currently traded OTC and imposes additional costs, including new reporting and margin requirements, and will likely impose additional regulation on the Company, including new capital requirements. Our costs of risk mitigation are increasing under Dodd-Frank. For example, Dodd-Frank imposes requirements, including the requirement to pledge initial margin (i) for “OTC-cleared” transactions (OTC derivatives that are cleared and settled through central clearing counterparties), and (ii) for “OTC-bilateral” transactions (OTC derivatives that are bilateral contracts between two counterparties) entered into after the phase-in period; these requirements will likely be applicable to us in September 2020 as the Office of the Comptroller of the Currency, the Federal Reserve Board, FDIC, Farm Credit Administration and Federal Housing Finance Agency (collectively, the “Prudential Regulators”) and the U.S. Commodity Futures Trading Commission (“CFTC”) adopted final margin requirements for non-centrally cleared derivatives during the fourth quarter of 2015, which are broadly consistent with the requirements published by the Bank of International Settlements and International Organization of Securities. These increased margin requirements, combined with increased capital charges for our counterparties and central clearinghouses with respect to non-cash collateral, will likely require increased holdings of cash and highly liquid securities with lower yields causing a reduction in income and less favorable pricing for OTC-cleared and OTC-bilateral transactions. Centralized clearing of certain OTC derivatives exposes us to the risk of a default by a clearing member or clearinghouse with respect to our cleared derivative transactions. We use derivatives to mitigate a wide range of risks in connection with our businesses, including the impact of increased benefit exposures from certain of our annuity products that offer guaranteed benefits. We have always been subject to the risk that hedging and other management procedures might prove ineffective in reducing the risks to which insurance policies expose us or that unanticipated policyholder behavior or mortality, combined with adverse market events, could produce economic losses beyond the scope of the risk management techniques employed. Any such losses could be increased by higher costs of writing derivatives (including customized derivatives) and the reduced availability of customized derivatives that might result from the implementation of Dodd-Frank and comparable international derivatives regulations.
Dodd-Frank also expanded the definition of “swap” and mandated the SEC and CFTC (collectively, the “Commissions”) to study whether “stable value contracts” should be treated as swaps. Pursuant to the new definition and the Commissions’ interpretive regulations, products offered by our insurance subsidiaries other than stable value contracts might also be treated as swaps, even though we believe otherwise. Should such products become regulated as swaps, we cannot predict how the rules would be applied to them or the effect on such products’ profitability or attractiveness to our clients.
See “Risk Factors — Regulatory and Legal Risks — Our Insurance and Brokerage Businesses Are Highly Regulated, and Changes in Regulation and in Supervisory and Enforcement Policies May Reduce Our Profitability and Limit Our Growth” for information regarding the Trump Administration’s expressed goals to dismantle or roll back Dodd-Frank.
Securities, Broker-Dealer and Investment Adviser Regulation
Some of our subsidiaries and their activities in offering and selling variable insurance products as well as certain fixed interest rate or index-linked contracts are subject to extensive regulation under the federal securities laws administered by the SEC. These subsidiaries issue variable annuity contracts and variable life insurance policies through separate accounts that are registered with the SEC as investment companies under the Investment Company Act. Each registered separate account is generally divided into sub-accounts, each of which invests in an underlying mutual fund which is itself a registered investment company under the Investment Company Act. In addition, the variable annuity contracts and variable life insurance policies issued by these registered separate accounts are registered with the SEC under the Securities Act of 1933 (“Securities Act”). One subsidiary also issues fixed interest rate or index-linked contracts with features that require them to be registered as securities under the Securities Act. Other subsidiaries are registered with the SEC as broker-dealers under the Securities Exchange Act of 1934 (“Exchange Act”), and are members of, and subject to regulation by, FINRA. Further, some of our subsidiaries are registered as investment advisers with the SEC under the Investment Advisers Act of 1940, as amended, and are also registered as investment advisers in various states, as applicable. Certain variable contract separate accounts sponsored by our subsidiaries are exempt from registration, but may be subject to other provisions of the federal securities laws.
Federal and state securities regulatory authorities and FINRA from time to time make inquiries and conduct examinations regarding compliance by MetLife, Inc. and its subsidiaries with securities and other laws and regulations. We cooperate with such inquiries and examinations and take corrective action when warranted.
34
Federal and state securities laws and regulations are primarily intended to protect investors in the securities markets and generally grant regulatory agencies broad rulemaking and enforcement powers, including the power to limit or restrict the conduct of business for failure to comply with such laws and regulations. We may also be subject to similar laws and regulations in the foreign countries in which we provide investment advisory services, offer products similar to those described above, or conduct other activities.
Environmental Considerations
As an owner and operator of real property, we are subject to extensive federal, state and local environmental laws and regulations. Inherent in such ownership and operation is also the risk that there may be potential environmental liabilities and costs in connection with any required remediation of such properties. In addition, we hold equity interests in companies that could potentially be subject to environmental liabilities. We routinely have environmental assessments performed with respect to real estate being acquired for investment and real property to be acquired through foreclosure. We cannot provide assurance that unexpected environmental liabilities will not arise. However, based on information currently available to us, we believe that any costs associated with compliance with environmental laws and regulations or any remediation of such properties will not have a material adverse effect on our business, results of operations or financial condition.
Unclaimed Property
We are subject to the laws and regulations of states and other jurisdictions concerning identification, reporting and escheatment of unclaimed or abandoned funds, and are subject to audit and examination for compliance with these requirements. See Note
21
of the Notes of the Consolidated Financial Statements.
International Regulation
Regulation of our insurance operations outside of the U.S. includes minimum capital, solvency and operational requirements. The authority of our international operations to conduct business is subject to licensing requirements, permits and approvals, and these authorizations are subject to modification and revocation. Periodic examinations of insurance company books and records, financial reporting requirements, market conduct examinations and policy filing requirements are among the techniques used by regulators to supervise our non-U.S. insurance businesses. We also have investment and pension companies in certain foreign jurisdictions that provide mutual fund, pension and other financial products and services. Those entities are subject to securities, investment, pension and other laws and regulations. In some jurisdictions, some of our insurance products are considered “securities” under local law and may be subject to local securities regulations and oversight by local securities regulators.
Our international operations are exposed to increased political, legal, financial, operational and other risks. See “Risk Factors — Risks Related to Our Business — Our International Operations Face Political, Legal, Operational and Other Risks, Including Exposure to Local and Regional Economic Conditions, That Could Negatively Affect Those Operations or Our Profitability” and “Risk Factors — Regulatory and Legal Risks — Our Insurance and Brokerage Businesses Are Highly Regulated, and Changes in Regulation and in Supervisory and Enforcement Policies May Reduce Our Profitability and Limit Our Growth.”
On June 23, 2016, the U.K. held a referendum regarding its membership in the European Union (“EU”), resulting in a narrow vote in favor of leaving the EU. The U.K. Prime Minister, Theresa May, has indicated that she intends to initiate the withdrawal process by the end of March 2017. The relevant treaty provides that the U.K. and the EU will negotiate a withdrawal agreement during a maximum two-year period (unless such period is extended by unanimous vote of the other EU member states). In the meantime, however, the U.K. remains a member of the EU with unchanged rights to access the single EU market in goods and services. Our U.K. business model utilizes certain rights to operate cross-border insurance and investment operations which may be modified or eliminated as a result of the U.K. exiting the EU. Operating expenses within our businesses could increase as a result of uncertainties during the negotiation period and in the event of an eventual U.K. withdrawal.
Other changes in the laws and regulations of jurisdictions that affect our customers and independent sales intermediaries or their operations also may affect our business relationships with them and their ability to purchase or distribute our products. Such actions may negatively affect our business in these jurisdictions.
Poland.
The Polish Ministry of Economic Development recently proposed the transfer of certain pension fund assets to the government, the creation of private individual retirement accounts using certain other pension fund assets, and the implementation of additional pension plan options intended to boost savings and long-term investment. It is premature to predict the impact that such measures, if implemented, would have on our business in Poland.
Chile.
In Chile, in September 2015, a Presidential Advisory Committee issued several recommendations to reform the pension system. In August 2016, Chilean President Bachelet proposed further changes to the pension system, including the (i)
35
creation of a state-owned pension fund which may have the benefit of certain exceptions unavailable to private pension funds, (ii) implementation of a competitive bidding process for existing customers, which could result in loss of such customers to funds with lower commissions, and (iii) obligation for pension funds to refund commissions in the event of negative returns, which could, in turn, cause fund managers to invest in instruments which have lower volatility, but lower returns. These proposals, if enacted, may have a significant adverse effect on our business in Chile. In fact, the recent unrest in Chile related to such pension system has already had, and continues to have, an adverse effect on our business in Chile. On July 21, 2016, the Chilean Pension Funds Superintendency instituted a proceeding to consider the validity of the action taken by the Superintendency in 2015 approving the merger of Administradora de Fondos de Pensiones ProVida, S.A. into a subsidiary of MetLife, Inc., which was effective on September 1, 2015. On December 13, 2016, the Superintendency upheld the legality of the merger for the third time.
The European Insurance and Occupational Pensions Authority (“EIOPA”), along with European legislation, requires European regulators, such as the Central Bank of Ireland (“CBI”), to establish Supervisory Colleges for European Economic Area (“EEA”)-based insurance groups with significant European operations, including MetLife, to facilitate cooperation and coordination among the insurance groups’ European supervisors and to enhance the member regulators’ understanding of an insurance group’s risk profile. An October 2016 Supervisory College was chaired by the CBI and was attended by MetLife’s key European regulators. We received feedback from such Supervisory College meeting regarding two areas of focus for the College in 2017, risk management and product governance, and we do not expect the outcome of the meeting to have a material adverse effect on our business.
Part of our international insurance operations may be subject to assessments, generally based on their proportionate share of business written in the relevant jurisdiction, for certain obligations to policyholders and claimants resulting from the insolvency of insurance companies. See “— Japan.” Annually, many of our international insurance operations are required to conduct an analysis of the sufficiency of all statutory reserves. In most of those cases, a locally qualified actuary must submit an analysis of the likelihood that the reserves make good and sufficient provision for the associated contractual obligations and related expenses of the insurer. Local regulatory and actuarial standards for this vary widely; the required implied certainty of the signing actuary’s opinion varies equally widely.
We expect the scope and extent of regulation outside of the U.S., as well as regulatory oversight, generally, to continue to increase. The regulatory environment in the countries in which we operate and changes in laws could have a material adverse effect on our results of operations.
Solvency Regimes
Our insurance business throughout the EEA is subject to Solvency II, which became effective on January 1, 2016, after an extensive preparatory phase. Solvency II codifies and harmonizes the EU insurance regulation. Capital requirements are forward-looking and based on the risk profile of each individual insurance company in order to promote comparability, transparency and competitiveness. In line with the requirements, MetLife entities calculate and report their capital requirement using a standard formula prescribed by the EU Directive and further regulation by the EIOPA. In addition, as required, the entities have performed their regular ORSA and submitted their respective annual reports to the Central Bank of Ireland, the Bank of Greece and the Polish Financial Supervisory Authority by December 31, 2016.
Mexico adopted a reform of its Insurance Law in February 2013. In accordance with this reform, a Solvency II-type regulatory framework became effective on January 1, 2016 which instituted changes to reserve and capital requirements and corporate governance and fostered greater transparency. In line with the requirements of the local Solvency II, insurance companies calculate and report their capital requirement using a standard formula designed by the local regulators (“CNSF”). In addition, as required, the Company completed and submitted its first ORSA report to the CNSF on October 31, 2016, as previously approved by the Board of Directors.
In Chile, the law implementing Solvency II-like regulation continues in the studies stage. However, the Chilean insurance regulator has already issued two resolutions, one for governance, and the other for risk management and control framework requirements. MetLife Chile has already implemented governance changes and risk policies to comply with these resolutions. A fourth impact study was completed and submitted in July 2016. On March 31, 2016, the local regulator issued a final regulation which requires insurance companies to implement a risk appetite framework and produce an ORSA. The first such report must be submitted to the local regulator no later than September 30, 2017. Even though a formal implementation date has not yet been set, it is estimated that the new solvency and supervisory regime could be in force between 2018 and 2019.
36
In July 2015, the Superintendence of Private Insurance, the Brazilian insurance regulator (“SUSEP”), issued a regulation establishing (i) a framework for minimum capital requirements based on risk and (ii) criteria for investment activities in insurance companies. In November 2015, SUSEP issued an additional regulation requiring insurance companies operating in Brazil to adopt a formal risk management function by the end of 2016 and to implement a formal enterprise risk management framework in 2017. In December 2016, MetLife Brazil formalized the designation of a local Risk Manager in Brazil in compliance with local regulation.
In China, the business of our joint venture (as well as the industry) will be impacted by China Risk Oriented Solvency System (“C-ROSS”), a new risk-based solvency regime. Like Solvency II, C-ROSS focuses on risk management and has three pillars (strengthen quantitative capital requirements, enhance qualitative supervision and establish a governance and market discipline process). C-ROSS became effective as of January 1, 2016, and as of the first quarter of 2016, C-ROSS solvency has become the mandated reporting for the industry.
Global Systemically Important Insurers
The IAIS, an association of insurance supervisors and regulators and a member of the Financial Stability Board (“FSB”), an international entity established to coordinate, develop and promote regulatory, supervisory and other financial sector policies in the interest of financial stability, is participating in the FSB’s initiative to identify and manage global systemically important financial institutions. To this end, the IAIS published a methodology to assess the systemic relevance of global insurers and a framework of policy measures to be applied to G-SIIs. The IAIS/FSB process is separate from the U.S. FSOC designation process and MetLife, Inc. remains a G-SII in spite of the rescission of its U.S. non-bank SIFI designation on March 30, 2016.
The global designation process is an annual process and IAIS policy requires that the IAIS evaluate whether updates to its assessment methodology are necessary every three years. Accordingly, the IAIS published an updated assessment methodology on June 16, 2016, which was used as the basis for the 2016 assessment of a pool of approximately 50 insurers, including MetLife, Inc. The new methodology reflects changes in the previous definitions of non-traditional and non-insurance activity, along with certain other changes in both quantitative and qualitative assessments, most notably introducing greater transparency into the process. On November 21, 2016, the FSB issued its 2016 list of GSIIs, which included MetLife, Inc.
Current standards call for G-SIIs to be subject to higher loss absorbency requirements (“HLA”). Given the absence of a common global base on which to calculate HLA for insurers, the FSB directed the IAIS to develop basic capital requirements (“BCR”). The first version of the IAIS HLA framework was endorsed by the FSB and the G20 in September and November 2015, respectively.
On December 17, 2014, the IAIS released a first exposure draft of its risk-based global insurance capital standard (“ICS”) which will apply to all internationally active insurance groups, including G-SIIs. A second exposure draft was published for comment on July 19, 2016. The IAIS expects to publish a draft of an interim version of the ICS in 2017 for further consultation and refinement by the end of 2019, the target for implementation by individual jurisdictions. It is now anticipated that, before its expected adoption and implementation in 2019, the BCR will be replaced by the ICS as the basis for HLA requirements. The date by which the ICS will be finalized has not yet been specified. The IAIS intends to request confidential reporting to supervisors as of the release of the interim draft of the ICS.
The FSB and IAIS propose that national authorities consider additional requirements for G-SIIs, which include preparation of a systemic risk management plan, preparation of a recovery and resolution plan, enhanced liquidity planning and management, more intensive supervision, closer coordination among regulators through global supervisory colleges led by a regulator with group-wide supervisory authority, and a policy bias that targets non-traditional insurance and non-insurance activities as transmitters of systemic risk to the financial system. The IAIS proposals would need to be implemented at the consolidated group level by legislation or regulation in each applicable jurisdiction. As MetLife, Inc. is no longer a U.S. non-bank SIFI and none of its regulators have proposed implementing the G-SII requirements, the impact on MetLife, Inc. of such global proposals is uncertain.
Japan
Our operations in Japan are subject to regulation and examination by Japan’s Financial Services Agency (“FSA”). Our operations in Japan are required to file with the FSA annual reports for each fiscal year (ending March 31) which include financial statements. These annual reports are not prepared on a U.S. GAAP basis. Similar to the U.S., Japanese law provides that insurers in Japan must maintain specified solvency standards for the protection of policyholders and to support the financial strength of licensed insurers. As of December 31, 2016, the date of our most recent regulatory filing in Japan, the solvency margin ratio of our Japan operations was in excess of four times the 200% solvency margin ratio that would require corrective action. Most Japanese life insurers maintain a solvency margin ratio well in excess of the legally mandated minimum.
37
A portion of the annual earnings of our Japan operations may be repatriated each year, and may further be distributed to MetLife, Inc. as a dividend. We may determine not to repatriate profits from the Japan operations or to repatriate a reduced amount in order to maintain or improve the solvency margin of the Japan operations or for other reasons. In addition, the FSA may limit or not permit profit repatriations or other transfers of funds to the U.S. if such transfers would be detrimental to the solvency or financial strength of our Japan operations or for other reasons.
Our operations in Japan are subject to assessments to cover obligations to policyholders in the event of insolvency of other insurance companies. Under the Japanese Insurance Business Law, all licensed life insurers in Japan are assessed on an annual basis by the Life Insurance Policyholders Protection Corporation of Japan. These assessments are aggregated across all licensed life insurers in Japan and, in the event of a life insurance company insolvency, are used to satisfy certain obligations to policyholders and claimants of such insolvent company.
Company Ratings
Insurer financial strength ratings represent the opinions of rating agencies, including A.M. Best Company (“A.M. Best”), Fitch Ratings (“Fitch”), Moody’s Investors Service (“Moody’s”) and Standard & Poor’s
Global
Ratings (“S&P”), regarding the ability of an insurance company to meet its financial obligations to policyholders and contractholders.
Rating Stability Indicators
Rating agencies use an “outlook statement” of “positive,” “stable,” ‘‘negative’’ or “developing” to indicate a medium- or long-term trend in credit fundamentals which, if continued, may lead to a rating change. A rating may have a “stable” outlook to indicate that the rating is not expected to change; however, a “stable” rating does not preclude a rating agency from changing a rating at any time, without notice. Certain rating agencies assign rating modifiers such as “CreditWatch” or “under review” to indicate their opinion regarding the potential direction of a rating. These ratings modifiers are generally assigned in connection with certain events such as potential mergers, acquisitions, dispositions or material changes in a company’s results, in order for the rating agency to perform its analysis to fully determine the rating implications of the event.
Insurer Financial Strength Ratings
The following insurer financial strength ratings represent each rating agency’s opinion of MetLife, Inc.’s principal insurance subsidiaries’ ability to pay obligations under insurance policies and contracts in accordance with their terms and are not evaluations directed toward the protection of investors in MetLife, Inc.’s securities. Insurer financial strength ratings are not statements of fact nor are they recommendations to purchase, hold or sell any security, contract or policy. Each rating should be evaluated independently of any other rating.
Our insurer financial strength ratings at the date of this filing are indicated in the following table.
Additional information about financial strength ratings can be found on the websites of the respective rating agencies.
|
A.M. Best
|
Fitch
|
Moody's
|
S&P
|
||||
|
Ratings Structure
|
“A++ (superior)” to “S (suspended)”
|
“AAA (exceptionally strong)” to “C (distressed)”
|
“Aaa (highest quality)” to “C (lowest rated)”
|
“AAA (extremely strong)” to “SD (Selective Default)” or “D (Default)”
|
|||
|
American Life Insurance Company
|
NR
|
NR
|
A1
|
AA-
|
|||
|
5th of 21
|
4th of 22
|
||||||
|
First MetLife Investors Insurance Company
|
A
|
NR
|
NR
|
A+
1
|
|||
|
3rd of 16
|
5th of 22
|
||||||
|
General American Life Insurance Company
|
A+
|
AA-
|
Aa3
|
AA-
|
|||
|
2nd of 16
|
4th of 19
|
4th of 21
|
4th of 22
|
||||
|
MetLife Insurance Company USA
|
A
|
A+
|
A3
|
A+
1
|
|||
|
3rd of 16
|
5th of 19
|
7th of 21
|
5th of 22
|
||||
|
Metropolitan Life Insurance Company
|
A+
|
AA-
|
Aa3
|
AA-
|
|||
|
2nd of 16
|
4th of 19
|
4th of 21
|
4th of 22
|
||||
|
MetLife Insurance K.K. (MetLife Japan)
|
NR
|
NR
|
NR
|
AA-
|
|||
|
4th of 22
|
|||||||
|
New England Life Insurance Company
|
A
|
A+
|
A3
|
A+
1
|
|||
|
3rd of 16
|
5th of 19
|
7th of 21
|
5th of 22
|
||||
__________________
38
NR = Not rated
1
Negative outlook.
Rating agencies may continue to review and adjust our ratings, including in connection with the proposed Separation. See “— Business Overview — Other Key Information” for further details on the proposed Separation and “Risk Factors — Risks Related to Our Business — A Downgrade or a Potential Downgrade in Our Financial Strength or Credit Ratings Could Result in a Loss of Business and Materially Adversely Affect Our Financial Condition and Results of Operations.” See also “Management’s Discussion and Analysis of Financial Condition and Results of Operations — Liquidity and Capital Resources — The Company — Capital — Rating Agencies” for an in depth description of the impact of a ratings downgrade.
Competition
We believe that the competition we face is based on a number of factors, including service, product features, scale, price, financial strength, claims-paying ratings, credit ratings, e-business capabilities and name recognition. We compete globally with a large number of other insurance companies, as well as non-insurance financial services companies, such as banks, broker-dealers and asset managers, for individual consumers, employer and other group customers, as well as agents and other distributors of insurance and investment products. Some of these companies offer a broader array of products, have more competitive pricing or, with respect to other insurance companies, have higher claims paying ability ratings. In the United States and Japan, we compete with a large number of domestic and foreign-owned life insurance companies, many of which offer products in categories on which we focus. Elsewhere, we compete with the foreign insurance operations of large U.S. insurers and with global insurance groups and local companies. Many of our group insurance products are underwritten annually and, accordingly, there is a risk that group purchasers may be able to obtain more favorable terms from competitors rather than renewing coverage with us.
We believe that the continued volatility of the financial markets, its impact on the capital position of many competitors, and subsequent actions by regulators and rating agencies have altered the competitive environment. In particular, we believe that these factors have highlighted financial strength as the most significant differentiator from the perspective of some customers and certain distributors. We believe the Company is well positioned to compete in this environment. In particular, since the U.S. Retail Advisor Force Divestiture, the Company primarily distributes its products through a variety of third-party distribution channels, including banks and broker-dealers. These distribution partners are currently placing greater emphasis on the financial strength of the company whose products they sell. An increase in bank and broker-dealer consolidation activity could increase competition for access to distributors. In addition, the financial market turbulence has highlighted the extent of the risk associated with certain variable annuity products and has led us, along with many companies in our industry, to re-examine the pricing and features of the products offered. The effects of current market conditions may also lead to consolidation in the life insurance industry. Although we cannot predict the ultimate impact of these conditions, we believe that the strongest companies will enjoy a competitive advantage as a result of the current circumstances.
Competition for employees in our industry is intense, and we need to be able to attract and retain highly skilled people with knowledge of our business and industry experience to support our business. In selected global markets, we continue to undertake several initiatives to grow our career agency forces, while continuing to enhance the efficiency and production of our sales representatives. These initiatives may not succeed in attracting and retaining productive agents. See “— Segments and Corporate & Other” for information on sales distribution.
Numerous aspects of our business are subject to regulation. Legislative and other changes affecting the regulatory environment can affect our competitive position within the life insurance industry and within the broader financial services industry. See “— Regulation.”
Employees
At December 31,
2016
, we had approximately 58,000 employees. We believe that our relations with our employees are satisfactory.
39
Executive Officers
Set forth below is information regarding the executive officers of MetLife, Inc.:
|
Name
|
Age
|
Position with MetLife and Business Experience
|
||||
|
Steven A. Kandarian
|
64
|
•
|
Chairman of the Board of MetLife, Inc. (January 2012-present) (Director of MetLife, Inc. since 2011)
|
|||
|
•
|
President and Chief Executive Officer (May 2011-present) of MetLife, Inc.
|
|||||
|
•
|
Executive Vice President and Chief Investment Officer of MetLife, Inc. (April 2005-April 2011)
|
|||||
|
Ricardo A. Anzaldua
|
63
|
•
|
Executive Vice President and General Counsel of MetLife, Inc. (December 2012-present)
|
|||
|
•
|
The Hartford Financial Services Group, Inc., an insurance and financial services company (February 2007-December 2012)
|
|||||
|
•Associate general counsel and senior vice president, director of commercial and consumer markets law (October 2010-December 2012)
|
||||||
|
• Associate general counsel and senior vice president, director of corporate law (February 2007-October 2010); corporate secretary (February 2008-October 2010)
|
||||||
|
Steven J. Goulart
|
58
|
•
|
Executive Vice President and Chief Investment Officer of MetLife, Inc. (May 2011-present)
|
|||
|
•
|
Head of the Portfolio Management Unit as Senior Managing Director of MLIC (January 2011-April 2011)
|
|||||
|
•
|
Senior Vice President and Treasurer, MetLife, Inc. (July 2009-April 2011)
|
|||||
|
John C.R. Hele
|
58
|
•
|
Executive Vice President and Chief Financial Officer of MetLife, Inc. (September 2012-present)
|
|||
|
•
|
Executive vice president, chief financial officer and treasurer, Arch Capital Group Ltd., an insurance and reinsurance company (April 2009-August 2012)
|
|||||
|
Michel Khalaf
|
53
|
•
|
President, EMEA of MetLife, Inc. (November 2011-present)
|
|||
|
•
|
Executive Vice President of MLIC (January 2011-November 2011)
|
|||||
|
•
|
Regional President, Middle East, Africa and South Asia, Alico (November 2008-November 2011) (Mr. Khalaf joined MetLife as a result of the acquisition of ALICO)
|
|||||
|
Esther S. Lee
|
58
|
•
|
Executive Vice President and Global Chief Marketing Officer of MetLife, Inc. (January 2015-present)
|
|||
|
•
|
Senior Vice President, Brand Marketing, Advertising and Sponsorships of AT&T, Inc., a communications company (August 2011-December 2014)
|
|||||
|
•
|
Senior Vice President, Brand Marketing and Advertising of AT&T, Inc. (June 2009-July 2011)
|
|||||
|
Martin J. Lippert
|
57
|
•
|
Executive Vice President and Head of Global Technology and Operations of MetLife, Inc. (November 2011-present)
|
|||
|
•
|
Executive Vice President and Head of Global Technology of MetLife, Inc. (September 2011-November 2011)
|
|||||
|
Maria R. Morris
|
54
|
•
|
Executive Vice President and Head of Global Employee Benefits of MetLife, Inc. (November 2011-present)
|
|||
|
•
|
Executive Vice President, Global Operations, Integration of MetLife, Inc. (September 2011-November 2011)
|
|||||
|
•
|
Executive Vice President, Technology and Operations of MetLife, Inc. (January 2008-September 2011)
|
|||||
|
Christopher G. Townsend
|
48
|
•
|
President, Asia of MetLife, Inc. (August 2012-present)
|
|||
|
•
|
Chief executive officer of the Asia Pacific region, Chartis, a unit of AIG, an insurance and financial services company (January 2010-April 2012)
|
|||||
40
Trademarks
We have a worldwide trademark portfolio that we consider important in the marketing of our products and services, including, among others, the trademark “MetLife.” We also have the exclusive global license to use the Peanuts
®
characters in the area of financial services under an advertising and premium agreement with Peanuts Worldwide, LLC up to December 31, 2019. As a result of the acquisition of American Life and Delaware American Life Insurance Company (“DelAm”) (collectively, “ALICO”), we acquired trademarks of American Life, including the “ALICO” trademark. In addition, as a result of our acquisition of ProVida, we acquired “PROVIDA” and other trademarks. We believe that our rights in our trademarks and under our Peanuts
®
characters license are well protected.
Available Information
MetLife files periodic reports, proxy statements and other information with the SEC. Such reports, proxy statements and other information may be obtained by visiting the Public Reference Room of the SEC at its Headquarters Office, 100 F Street, N.E., Washington D.C. 20549 or by calling the SEC at 1-202-551-8090 or 1-800-SEC-0330 (Office of Investor Education and Advocacy). In addition, the SEC maintains an internet website (www.sec.gov) that contains reports, proxy statements, and other information regarding issuers that file electronically with the SEC, including MetLife, Inc.
MetLife makes available, free of charge, on its website (www.metlife.com) through the Investor Relations web page, its annual reports on Form 10-K, quarterly reports on Form 10-Q, current reports on Form 8-K, and amendments to all those reports, as soon as reasonably practicable after filing (furnishing) such reports to the SEC. MetLife encourages investors to visit the Investor Relations web page from time to time, where it announces additional financial and other information about it to its investors, including in press releases, public conference calls and webcasts. The information found on MetLife’s website is not incorporated by reference into this Annual Report on Form 10-K or in any other report or document MetLife files with the SEC, and any references to MetLife’s website are intended to be inactive textual references only.
Economic Environment and Capital Markets-Related Risks
If Difficult Conditions in the Global Capital Markets and the Economy Generally Persist, They May Materially Adversely Affect Our Business and Results of Operations
Our business and results of operations are materially affected by conditions in the global capital markets and the economy generally. Stressed conditions, volatility and disruptions in financial asset classes or various markets, including global capital markets, can have an adverse effect on us, in part because we have a large investment portfolio and our insurance liabilities are sensitive to changing market factors. Global market factors, including interest rates, credit spreads, equity prices, derivative prices and availability, real estate markets, foreign currency exchange rates, consumer spending, business investment, government spending, the volatility and strength of the capital markets, deflation and inflation, all affect our financial condition, as well as the volume, profitability and results of our business operations and our ability to receive dividends from our insurance subsidiaries and meet our obligations at MetLife, Inc., either directly or by virtue of their impact on the business and economic environment generally and on general levels of economic activity, employment and customer behavior specifically. Disruptions in one market or asset class can also spread to other markets or asset classes. Upheavals in the financial markets can also affect our financial condition (including our liquidity and capital levels) as a result of mismatched impacts on the value of our assets and our liabilities. While our diversified business mix and geographically diverse business operations partially mitigate these risks, correlation across regions, countries and global market factors may reduce the benefits of diversification.
At times throughout the past several years, volatile conditions have characterized financial markets. Significant market volatility, and government actions taken in response, may exacerbate some of the risks we face. Concerns about the political and/or economic stability in the U.K., Italy, Mexico, Turkey and Puerto Rico have recently contributed to global market volatility. This market volatility has affected the performance of various asset classes at various times, and it could continue. See “Management’s Discussion and Analysis of Financial Condition and Results of Operations
—
Investments
—
Current Environment.” Events following the U.K.’s referendum on June 23, 2016 and the uncertainties, including foreign currency exchange risks, associated with its potential withdrawal from the EU, have contributed to market volatility, both in the United States and beyond. Such events and uncertainties could contribute to weakening gross domestic product (“GDP”) growth, primarily in the U.K. and Europe. The magnitude and longevity of the potential negative economic impacts would depend on the detailed agreements reached by the U.K. and EU as a result of the exit negotiations and negotiations regarding trade and other arrangements. In addition, the impact on global capital markets, the economy and MetLife of the transition occurring in the United States government and the priorities of the Trump Administration is uncertain. See “Management’s Discussion and Analysis of Financial Condition and Results of Operations
—
Industry Trends
—
Financial and Economic Environment.” Any of these factors could have significant adverse effects on the economy and financial markets generally.
41
To the extent these uncertain financial market conditions persist, our revenues, reserves and net investment income, as well as the demand for certain of our products, are likely to remain under pressure. Similarly, sustained periods of low interest rates and risk asset returns could reduce income from our investment portfolio, increase our liabilities for claims and future benefits, and increase the cost of risk transfer measures such as hedging, causing our profit margins to erode as a result of reduced income from our investment portfolio and increase in insurance liabilities. See “Management’s Discussion and Analysis of Financial Condition and Results of Operations
—
Industry Trends
—
Impact of a Sustained Low Interest Rate Environment.” Also, in the event of extreme prolonged market events, such as the global credit crisis, we could incur significant capital and/or operating losses due to, among other reasons, losses incurred in our general account and as a result of the impact on us of guarantees, including increases in liabilities, capital maintenance obligations and/or collateral requirements associated with our affiliated reinsurers and other similar arrangements. Even in the absence of a market downturn, we are exposed to substantial risk of loss due to sustained periods of low market returns, low levels of U.S. interest rates, and/or heightened market volatility, which may also increase the cost and limit the availability of the hedging instruments and other protective measures we take to mitigate such risk, or increase the cost of our insurance liabilities, which could have a material adverse effect on the statutory capital and earnings of our insurance subsidiaries, as well as impair our financial strength ratings.
We are a significant writer of variable insurance products and certain other products issued through separate accounts. The account values of these products decrease as a result of declining equity markets. Lower interest rates generally increase account values in the near term, but may result in lower returns in fixed income vehicles in the future. Decreases in account values reduce certain fees generated by these products, cause the amortization of deferred policy acquisition costs (“DAC”) to accelerate, could increase the level of insurance liabilities we must carry to support such products issued with any associated guarantees and could require us to provide additional funding to our captive reinsurers.
In an economic downturn characterized by higher unemployment, lower family income, lower corporate earnings, lower business investment and lower consumer spending, the demand for our financial and insurance products could be adversely affected. Group insurance, in particular, is affected by higher unemployment rates. In addition, we may experience an elevated incidence of claims, adverse utilization of benefits relative to our best estimate expectations and lapses or surrenders of policies. Furthermore, our policyholders may choose to defer paying insurance premiums or stop paying insurance premiums altogether. Such adverse changes in the economy could negatively affect our earnings and capitalization and have a material adverse effect on our business, results of operations and financial condition.
Difficult conditions in the global capital markets and the economy may continue to raise the possibility of legislative, judicial, regulatory and other governmental actions. The Trump Administration has released a memorandum that generally delayed all pending regulations from publication in the Federal Register pending their review and approval by a department or agency head appointed or designated by President Trump, and has issued an Executive Order that calls for a comprehensive review of Dodd-Frank. In addition, the Trump Administration has discussed potentially putting in place a tax on goods and services imported into the United States and the intention to renegotiate certain international trade agreements with other countries, including the North American Free Trade Agreement (“NAFTA”). We cannot predict with certainty what other proposals may be made or what legislation or regulations may be introduced or enacted, or what impact any such legislation or regulations may have on our business, results of operations and financial condition. See “
—
Regulatory and Legal Risks
—
Our Insurance and Brokerage Businesses Are Highly Regulated, and Changes in Regulation and in Supervisory and Enforcement Policies May Reduce Our Profitability and Limit Our Growth,” and “
—
Risks Related to Our Business
—
Competitive Factors May Adversely Affect Our Market Share and Profitability” below.
Adverse Global Capital and Credit Market Conditions May Significantly Affect Our Ability to Meet Liquidity Needs, Our Access to Capital and Our Cost of Capital
The global capital and credit markets may be subject to periods of extreme volatility. Disruptions in capital markets could cause our liquidity and credit capacity to be limited.
We need liquidity to pay claims and other operating expenses, interest on our debt and dividends on our capital stock, provide our subsidiaries with cash or collateral, maintain our securities lending activities and replace certain maturing liabilities. Without sufficient liquidity, we could be forced to curtail our operations and limit our investments, and our business and financial results may suffer. See “Management’s Discussion and Analysis of Financial Condition and Results of Operations
—
Liquidity and Capital Resources.”
42
In the event global capital market or other conditions have an adverse impact on our capital and liquidity, or our stress-testing indicates that such conditions could have such an impact beyond expectations and our current resources do not satisfy our needs or regulatory requirements, we may have to seek additional financing. The availability of additional financing will depend on a variety of factors such as the then current market conditions, regulatory considerations, availability of credit to us and the financial services industry generally, our credit ratings and credit capacity, and the perception of our customers and lenders regarding our long- or short-term financial prospects if we incur large operating or investment losses or if the level of our business activity decreases due to a market downturn. Similarly, our access to funds may be impaired if regulatory authorities or rating agencies take negative actions against us. Our internal sources of liquidity may prove to be insufficient and, in such case, we may not be able to successfully obtain additional financing on favorable terms, or at all.
Our liquidity requirements may change if, among other things, we are required to return significant amounts of cash collateral on short notice under securities lending or derivatives agreements or are required to post collateral or make payments related to declines in market value of specified counterparty credit risk. See “
—
Investments-Related Risks
—
Should the Need Arise, We May Have Difficulty Selling Certain Holdings in Our Investment Portfolio or in Our Securities Lending Program in a Timely Manner and Realizing Full Value Given Their Illiquid Nature,” “Management’s Discussion and Analysis of Financial Condition and Results of Operations
—
Investments
—
Securities Lending” an
d “Management’s Discussion and Analysis of Financial Condition and Results of Operations
—
Liquidity and Capital Resources
—
The Company
—
Liquidity.”
Disruptions, uncertainty or volatility in the capital and credit markets may also limit our access to capital needed to operate our business, most significantly in our insurance operations. Such market conditions may limit our ability to replace, in a timely manner, maturing liabilities, satisfy regulatory capital requirements, and access the capital necessary to grow our business. See “
—
Regulatory and Legal Risks
—
Our Insurance and Brokerage Businesses Are Highly Regulated, and Changes in Regulation and in Supervisory and Enforcement Policies May Reduce Our Profitability and Limit Our Growth.” As a result, we may be forced to delay raising capital, issue different types of securities than we would have otherwise, less effectively deploy such capital, issue shorter tenor securities than we prefer, or bear an unattractive cost of capital, which could decrease our profitability and significantly reduce our financial flexibility. Our results of operations, financial condition, cash flows and statutory capital position could be materially adversely affected by disruptions in the financial markets.
We Are Exposed to Significant Global Financial and Capital Markets Risks Which May Adversely Affect Our Results of Operations, Financial Condition and Liquidity, and May Cause Our Net Investment Income to Vary from Period to Period
We are exposed to significant global financial and capital markets risks, including changes in interest rates, credit spreads, equity prices, real estate markets, foreign currency exchange rates, market volatility, global economic performance in general, the performance of specific obligors, including governments, included in our investment portfolio, derivatives and other factors outside our control. See “Management’s Discussion and Analysis of Financial Condition and Results of Operations
—
Industry Trends
—
Financial and Economic Environment” and “Management’s Discussion and Analysis of Financial Condition and Results of Operations
—
Investments
—
Current Environment.”
Interest Rate Risk
Some of our products, principally traditional life, universal life, fixed annuities and guaranteed interest contracts, expose us to the risk that changes in interest rates will reduce our investment margin or “spread,” or the difference between the amounts that we are required to pay under the contracts in our general account and the rate of return we earn on general account investments intended to support obligations under such contracts. Our spread is a key component of our net income.
In a low interest rate environment, we may be forced to reinvest proceeds from investments that have matured or have been prepaid or sold at lower yields, which will reduce our investment margin. Moreover, borrowers may prepay or redeem the fixed income securities and commercial, agricultural or residential mortgage loans in our investment portfolio with greater frequency in order to borrow at lower market rates, thereby exacerbating this risk. Although lowering interest crediting rates can help offset decreases in spreads on some products, our ability to lower these rates is limited to the portion of our in-force product portfolio that has adjustable interest crediting rates, and could be limited by competition or contractually guaranteed minimum rates and may not match the timing or magnitude of changes in asset yields. As a result, our spread could decrease or potentially become negative, which could have a material adverse effect on our results of operations and financial condition. See “
—
Risks Related to Our Business
—
Guarantees Within Certain of Our Products May Decrease Our Earnings, Increase the Volatility of Our Results, Result in Higher Risk Management Costs and Expose Us to Increased Counterparty Risk.”
43
Our expectation for future spreads is an important component in the amortization of DAC and value of business acquired (“VOBA”). Significantly lower spreads may cause us to accelerate amortization, thereby reducing net income in the affected reporting period and potentially negatively affecting our credit instrument covenants or rating agency assessment of our financial condition. In addition, during periods of declining interest rates, life insurance and annuity products may be relatively more attractive investments to consumers. This could result in increased premium payments on products with flexible premium features, repayment of policy loans and increased persistency, or a higher percentage of insurance policies remaining in-force from year to year, during a period when our new investments carry lower returns. A decline in market interest rates could also reduce our return on investments that do not support particular policy obligations. During periods of sustained lower interest rates, our reserves for policy liabilities may not be sufficient to meet future policy obligations and may need to be strengthened. Accordingly, declining and sustained lower interest rates may materially affect our results of operations, financial position, cash flows, and ability to take dividends from operating insurance companies, as well as significantly reduce our profitability. See “Management’s Discussion and Analysis of Financial Condition and Results of Operations
—
Industry Trends
—
Impact of a Sustained Low Interest Rate Environment.”
As a global insurance company, we are also affected by the monetary policies of the Federal Reserve Board and of central banks around the world. Actions resulting from these policies may have an impact on the pricing levels of risk-bearing investments, and may adversely impact the income we earn on our investments or the level of product sales. See “Management’s Discussion and Analysis of Financial Condition and Results of Operations
—
Investments
—
Current Environment.”
Increases in interest rates could also negatively affect our profitability. In periods of rapidly increasing interest rates, we may not be able to replace, in a timely manner, the investments in our general account with higher yielding investments needed to fund the higher crediting rates necessary to keep interest rate sensitive products competitive. We, therefore, may have to accept a lower credit spread and, thus, lower profitability or face a decline in sales and greater loss of existing contracts and related assets. In addition, policy loans, surrenders and withdrawals may tend to increase as policyholders seek investments with higher perceived returns as interest rates rise. This process may result in cash outflows requiring that we sell investments at a time when the prices of those investments are adversely affected by the increase in interest rates, which may result in realized investment losses. Unanticipated withdrawals, terminations and substantial policy amendments may cause us to accelerate the amortization of DAC and VOBA, which reduces net income and potentially negatively affects our credit instrument covenants and rating agency assessment of our financial condition, and may also cause us to accelerate the amortization of negative VOBA, which increases net income. An increase in interest rates could also have a material adverse effect on the value of our investment portfolio, for example, by decreasing the estimated fair values of the fixed income securities that comprise a substantial portion of our investment portfolio. Finally, an increase in interest rates could result in decreased fee income associated with a decline in the value of variable annuity account balances invested in fixed income funds. However, this increase in interest rates would typically cause any guaranteed living benefits to decline in value. See “Management’s Discussion and Analysis of Financial Condition and Results of Operations
—
Industry Trends
—
Impact of a Sustained Low Interest Rate Environment.”
We manage interest rate risk as part of our asset and liability management strategies, which include maintaining an investment portfolio with diversified maturities that has a weighted average duration that reflects the duration of our estimated liability cash flow profile. We also use derivatives to mitigate interest rate risk. Although we take measures to manage the economic risks of investing in a changing interest rate environment, we may not be able to mitigate the interest rate risk of our fixed income investments relative to our interest rate sensitive liabilities. In addition, asymmetrical and non-economic accounting may cause material changes to our net income and stockholders’ equity in any given period because our non-qualified derivatives are recorded at fair value through earnings, while the related hedged items either follow an accrual-based accounting model, such as insurance liabilities, or are recorded at fair value through other comprehensive income. See Note 9 of the Notes to the Consolidated Financial Statements for the primary reasons why many of the Company’s derivatives do not qualify for hedge accounting, even though they may be effective economic hedges.
Significant volatility in the markets could cause changes in the risks set forth above which, individually or in tandem, could have a material adverse effect on our results of operations, financial condition, liquidity or cash flows through realized investment losses, derivative losses, changes in insurance liabilities, impairments, increased valuation allowances, increases in reserves for future policyholder benefits, reduced net investment income and changes in unrealized gain or loss positions.
44
Credit Spreads
Our exposure to credit spreads primarily relates to market price volatility and cash flow variability associated with changes in such spreads. Market price volatility can make it difficult to value certain of our securities if trading becomes less frequent, as was the case, for example, during the financial crisis which commenced in 2008. In such case, valuations may include assumptions or estimates that may have significant period-to-period changes, which could have a material adverse effect on our results of operations or financial condition and may require additional reserves. If there is a resumption of significant volatility in the markets, it could cause changes in credit spreads and defaults and a lack of pricing transparency which, individually or in tandem, could have a material adverse effect on our results of operations, financial condition, liquidity or cash flows. See “Management’s Discussion and Analysis of Financial Condition and Results of Operations
—
Investments
—
Investment Risks.” An increase in credit spreads relative to U.S. Treasury benchmarks can also adversely affect the cost of our borrowing should we need to access credit markets.
Equity Risk
Our primary exposure to equity risk relates to the potential for lower earnings associated with certain of our businesses where fee income is earned based upon the estimated fair value of the assets under management. Downturns and volatility in equity markets can have a material adverse effect on the revenues and investment returns from our savings and investment products and services. The retail variable annuity business in particular is highly sensitive to equity markets, and a sustained weakness or stagnation in the equity markets could decrease revenues and earnings with respect to those products. Furthermore, certain of our variable annuity products offer guaranteed benefits which increase our potential benefit exposure should equity markets decline or stagnate. We use derivatives and reinsurance to mitigate the impact of such increased potential benefit exposures.
We are also exposed to interest rate and equity risk based upon the discount rate and expected long-term rate of return assumptions associated with our pension and other postretirement benefit obligations. Sustained declines in long-term interest rates or equity returns likely would have a negative effect on the funded status of these plans.
In addition, we invest a portion of our investments in leveraged buy-out funds, hedge funds and other private equity funds. The amount and timing of net investment income from such funds tends to be uneven as a result of the performance of the underlying investments. The timing of distributions from such funds, which depends on particular events relating to the underlying investments, as well as the funds’ schedules for making distributions and their needs for cash, can be difficult to predict. As a result, the amount of net investment income from these investments can vary substantially from period to period. Significant volatility could adversely impact returns and net investment income on these alternative investment classes. In addition, the estimated fair value of such investments may be impacted by downturns or volatility in equity markets. See “Quantitative and Qualitative Disclosures About Market Risk.”
Real Estate Risk
Our primary exposure to real estate risk relates to commercial, agricultural and residential real estate. Our exposure to these risks stems from various factors, including the supply and demand of leasable commercial space, creditworthiness of tenants and partners, capital markets volatility, interest rate fluctuations, commodity prices and farm incomes, which have recently been declining. Although we manage credit risk and market valuation risk for our commercial, agricultural and residential real estate assets through geographic, property type and product type diversification, as well as asset allocation, general economic conditions in the commercial, agricultural and residential real estate sectors will continue to influence the performance of these investments. These factors, which are beyond our control, could have a material adverse effect on our results of operations, financial condition, liquidity or cash flows.
Obligor-Related Risks
Recent country specific volatility due to local economic and/or political concerns has affected the performance of certain of our investments. We have exposure to such volatility, as we maintain general account investments in such countries to support our insurance operations and related policyholder liabilities in these countries and we also have exposure through our global portfolio diversification. See “Management’s Discussion and Analysis of Financial Condition and Results of Operations
—
Industry Trends
—
Financial and Economic Environment” and Management’s Discussion and Analysis of Financial Condition and Results of Operations
—
Investments
—
Current Environment
—
Selected Country Investments.”
45
Our investment portfolio also contains investments in revenue bonds issued under the auspices of U.S. states and municipalities, and a limited amount of general obligation bonds of U.S. states and municipalities (collectively, “State and political subdivision securities”). Various U.S. states and municipalities have faced budget deficits and financial difficulties. The financial difficulties of such U.S. states and municipalities could have an adverse impact on our State and political subdivision securities and the value of our investment portfolio.
Fixed income securities and mortgage loans represent a significant portion of our investment portfolio. We are subject to the risk that the issuers, or guarantors, of fixed income securities and mortgage loans we own may default on principal and interest payments they owe us. We are also subject to the risk that the underlying collateral within asset-backed securities, including mortgage-backed securities, may default on principal and interest payments causing an adverse change in cash flows. The occurrence of a major economic downturn, acts of corporate malfeasance, widening mortgage or credit spreads, or other events that adversely affect the issuers, guarantors or underlying collateral of these securities and mortgage loans could cause the estimated fair value of our portfolio of fixed income securities and mortgage loans and our earnings to decline and the default rate of the fixed income securities and mortgage loans in our investment portfolio to increase.
Foreign Currency Exchange Rate Risks
Our primary foreign currency exchange rate risks are described under “
—
Risks Related to Our Business
—
Fluctuations in Foreign Currency Exchange Rates Could Negatively Affect Our Profitability.” Changes in foreign currency exchange rates can significantly affect our net investment income in any period, and such changes can be substantial. This risk will increase if a country withdraws from the Euro zone. In such case, the national currency to which such a country may revert will likely be devalued and contracts using the Euro will need to be renegotiated. Any such devaluation and its related consequences for our contracts and investments in any such country could be significant and materially adversely affect our operations and earnings in that country. Any operations we may have in any such withdrawing country could also be materially adversely affected by legal or governmental actions related to conversion from the Euro to a national currency. See “Quantitative and Qualitative Disclosures About Market Risk.”
Derivatives Risk
We use the payments we receive from counterparties pursuant to derivative instruments into which we have entered to offset future changes in the fair value of our assets and liabilities and current or future changes in cash flows. We enter into a variety of derivative instruments, including options, futures, forwards, and interest rate and credit default swaps with a number of counterparties. Amounts that we expect to collect under current and future derivatives are subject to counterparty risk. Our obligations under our products are not changed by our hedging activities and we are liable for our obligations even if our derivative counterparties do not pay us. Such defaults could have a material adverse effect on our financial condition and results of operations. Substantially all of our derivatives require us to pledge or receive collateral or make payments related to any decline in the net estimated fair value of such derivatives executed through a specific broker at a clearinghouse or entered into with a specific counterparty on a bilateral basis. In addition, ratings downgrades or financial difficulties of derivative counterparties may require us to utilize additional capital with respect to the impacted businesses.
Summary
Significant volatility in the markets could cause changes in interest rates, declines in equity prices, and the strengthening or weakening of foreign currencies against the U.S. dollar which, individually or in tandem, could have a material adverse effect on our results of operations, financial condition, liquidity or cash flows through realized investment losses, derivative losses, changes in insurance liabilities, impairments, increased valuation allowances, increases in reserves for future policyholder benefits, reduced net investment income and changes in unrealized gain or loss positions.
46
Regulatory and Legal Risks
Our Insurance and Brokerage Businesses Are Highly Regulated, and Changes in Regulation and in Supervisory and Enforcement Policies May Reduce Our Profitability and Limit Our Growth
Our insurance operations and brokerage businesses are subject to a wide variety of insurance and other laws and regulations. Additionally, Dodd-Frank, discussed further below, effected the most far-reaching overhaul of financial regulation in the United States in decades. However, President Trump and the majority party have expressed goals to dismantle or roll back Dodd-Frank and President Trump has issued an Executive Order that calls for a comprehensive review of Dodd-Frank in light of certain enumerated core principles of financial system regulation. We are not able to predict with certainty whether any such proposal would have a material effect on our business operations and cannot currently identify all of the risks or opportunities, if any, that may be posed to our businesses as a result of changes to, or legislative replacements for, Dodd-Frank. See “Business
—
Regulation,” as supplemented by discussions of regulatory developments in our subsequently filed Quarterly Reports on Form 10-Q under the caption “Management’s Discussion and Analysis of Financial Condition and Results of Operations
—
Industry Trends
—
Regulatory Developments.”
U.S. Regulation
Insurance Regulation
The NAIC is an organization whose mission is to assist state insurance regulatory authorities in serving the public interest and achieving the insurance regulatory goals of its members, the state insurance regulatory officials. State insurance regulators may act independently or adopt regulations proposed by the NAIC. State insurance regulators and the NAIC regularly re-examine existing laws and regulations applicable to insurance companies and their products. Changes in these laws and regulations, or in interpretations thereof, can sometimes lead to additional expense for the insurer and, thus, could have a material adverse effect on our financial condition and results of operations.
In 2015, the NAIC commenced an initiative to study variable annuity solvency regulations, with the goal of curtailing the use of variable annuity captives. In connection with this study, the NAIC engaged a third-party consultant to develop recommendations in 2016 regarding reserve and capital requirements. The NAIC plans to ask the third-party consultant to conduct an additional study and develop new recommendations in 2017. The NAIC will consider the 2017 recommendations which, if adopted, would apply to insurers’ existing and new business and likely would materially change the sensitivity of the balance sheet (including reserve and capital requirements) to capital markets. It is not possible to predict whether the amount of reserves or capital required to support our variable annuity contracts would increase or decrease if any such 2017 recommendations are adopted, nor is it possible to predict the extent to which any such recommendations would affect the effectiveness and design of our risk mitigation and hedging programs. Furthermore, no assurances can be given as to whether any such recommendations will be adopted or to the timing of any such adoption.
The NAIC is also studying its RBC factors for bonds, real estate and collateral pledged to support FHLB advances. It is premature to project the impact of any such adoption.
The NAIC has also been working on the modernization of the calculation of life insurance reserves, including principle-based reserving, which became operative on January 1, 2017 in those states where it has been adopted, with a three-year phase-in period, at the option of insurance companies on a product-by-product basis, for new business. To date, principle-based reserving has been adopted by all of the states where our insurance subsidiaries are domiciled, except in New York where the NYDFS has publicly stated its intention to implement this approach beginning in January 2018, subject to a working group of the NYDFS establishing the necessary reserves safeguards, and in Massachusetts where the legislature is considering legislation in this area. We cannot predict how principle-based reserving will impact the reserves or compliance costs, if any, of our insurance subsidiaries, although after the Separation, principle-based reserving will have less of an impact, given our discontinuance of retail life sales. See “Business
— Regulation —
U.S. Regulation
—
Insurance Regulation
—
NAIC.”
47
U.S. Federal Regulation Affecting Insurance
Currently, the business of insurance is primarily regulated at the state level. However, Dodd-Frank established the FIO within the Department of the Treasury, which has the authority to participate in the negotiations of international insurance agreements with foreign regulators for the U.S., as well as to collect information about the insurance industry and recommend prudential standards. On December 12, 2013, the FIO issued a report, mandated by Dodd-Frank, which, among other things, urged the states to modernize and promote greater uniformity in insurance regulation. The report raised the possibility of a greater role for the federal government if states do not achieve greater uniformity in their laws and regulations. Following the transition occurring in the United States government and the priorities of the Trump Administration, we cannot predict with certainty whether any such legislation or regulatory changes will be adopted, or what impact they will have on our business, financial condition or results of operations. See “Business — Regulation — U.S. Regulation — Insurance Regulation — Federal Initiatives.”
Federal legislation and administrative policies can significantly and adversely affect insurance companies, including policies regarding financial services regulation, securities regulation, derivatives regulation, pension regulation, health care regulation, privacy, tort reform legislation and taxation. In addition, various forms of direct and indirect federal regulation of insurance have been proposed from time to time, including proposals for the establishment of an optional federal charter for insurance companies.
ERISA Considerations
We provide products and services to certain employee benefit plans that are subject to ERISA or the Code. As such, our activities are subject to the restrictions imposed by ERISA and the Code, including the requirement under ERISA that fiduciaries must perform their duties solely in the interests of ERISA plan participants and beneficiaries, and those fiduciaries may not cause a covered plan to engage in certain prohibited transactions. The prohibited transaction rules of ERISA and the Code generally restrict the provision of investment advice to ERISA plans and participants and IRAs if the investment recommendation results in fees paid to the individual advisor, the firm that employs the advisor or their affiliates that vary according to the investment recommendation chosen, unless an exemption or exception is available. Similarly, without an exemption or exception, fiduciary advisors are prohibited from receiving compensation from third parties in connection with their advice. ERISA also affects certain of our in-force insurance policies and annuity contracts, as well as insurance policies and annuity contracts we may sell in the future.
The DOL issued new regulations on April 6, 2016 with an applicable date for most provisions of April 10, 2017. These regulations substantially expand the definition of “investment advice” and thereby broaden the circumstances under which MetLife or its representatives, in providing investment advice with respect to ERISA plans, plan participants or IRAs, could be deemed a fiduciary under ERISA or the Code. Pursuant to the final regulations, certain communications with plans, plan participants and IRA holders, including the sales of products, and investment management or advisory services, could be deemed fiduciary investment advice, thus causing increased exposure to fiduciary liability if the distributor does not recommend what is in the client’s best interests. While the final regulations also provide that, to a limited extent, contracts sold and advice provided prior to April 10, 2017 do not have to be modified to comply with the new investment advice regulations, there is lack of clarity surrounding some of the conditions for qualifying for this limited exception. There can be no assurance that the DOL will agree with our interpretation of the provisions of the new regulations, in which case the DOL and IRS could assess significant penalties against a portion of products sold prior to April 10, 2017. The assessment of such penalties could also trigger substantial litigation risk. Any such penalties and related litigation could adversely affect our results of operations and financial condition.
The DOL also issued amendments to certain of its prohibited transaction exemptions, and issued a new exemption that applies more onerous disclosure and contract requirements to, and increases fiduciary requirements and fiduciary liability exposure in respect of, certain transactions involving ERISA plans, plan participants and IRAs.
While we continue to analyze the impact of the final regulations on our business as we plan for their implementation, we believe they could have an adverse effect on sales of annuity products to ERISA qualified plans such as IRAs through our independent distribution partners. The new regulations deem advisors, including independent distributors, who sell fixed index-linked annuities to IRAs, IRA rollovers or 401(k) plans, fiduciaries and prohibit them from receiving compensation unless they comply with a prohibited transaction exemption. The exemption requires advisors to comply with impartial conduct standards and may require us to exercise additional oversight of the sales process. Compliance with the prohibited transaction exemption will likely result in increased regulatory burdens on us and our independent distribution partners, changes to our compensation practices and product offerings and increased litigation risk, which could adversely affect our results of operations and financial condition. See “Business
—
Regulation
—
U.S. Regulation
—
ERISA Considerations.”
48
However, in light of action by President Trump on February 3, 2017, the applicability date of April 10, 2017 may well be delayed. It is also possible that the substance of the regulation could be substantially modified or replaced due to the change in Administration. We cannot predict with certainty what other proposals may be made or what legislation or regulations may be introduced or enacted, or what impact any such legislation or regulations may have on our business, results of operations and financial condition.
Potential Regulation of MetLife, Inc. as a Non-Bank SIFI
On December 18, 2014, the FSOC designated MetLife, Inc. as a non-bank SIFI. On January 13, 2015, MetLife, Inc. filed an action in the D.C. District Court asking the Court to review and rescind the FSOC’s designation. On March 30, 2016, the D.C. District Court ordered that the designation of MetLife, Inc. as a non-bank SIFI by the FSOC be rescinded. On April 8, 2016, the FSOC appealed the D.C. District Court’s order to the D.C. Circuit Court of Appeals, and oral argument was heard on October 24, 2016.
If the FSOC prevails on appeal or re-designates MetLife, Inc. as systemically important as part of its ongoing review of non-bank financial companies, MetLife, Inc. could once again be subject to regulation that could materially and adversely affect our business and competitive position. Non-bank SIFIs are supervised by the Federal Reserve Board and subject to enhanced prudential standards which Dodd-Frank requires the Federal Reserve Board to adopt. These enhanced prudential standards, include RBC requirements and leverage limits, liquidity requirements, overall risk management requirements, resolution plan and credit exposure report requirements, and concentration limits. Dodd-Frank also authorizes the Federal Reserve Board to adopt other standards applicable to non-bank SIFIs, including contingent capital requirements, enhanced public disclosures, short-term debt limits, and other appropriate standards. In addition, non-bank SIFIs are subject to stress testing and must pay a variety of assessments, including those relating to any uncovered costs arising in connection with the resolution of a systemically important financial company, expenses incurred by the Federal Reserve Board in fulfilling its oversight role, and funding the Office of Financial Research within the U.S. Department of Treasury. The Federal Reserve Board has not yet fully implemented most of the standards that will apply to non-bank SIFIs. Accordingly, the manner in which the ultimate standards might apply to MetLife, Inc. were it to be re-designated as a non-bank SIFI and the full impact of such standards, remains unclear. If MetLife, Inc. were to be re-designated as a non-bank SIFI, however, it is possible that such regulations could constrain our ability to pay dividends, repurchase common stock or other securities or engage in other transactions that could affect our capital, or cause us to raise the price of the products we offer, reduce the amount of risk we take on, or stop offering certain products altogether.
The Trump Administration has released a memorandum that generally delayed all pending regulations from publication in the Federal Register pending their review and approval by a department or agency head appointed or designated by President Trump. President Trump has also issued an Executive Order that calls for a comprehensive review of Dodd-Frank and requires the Secretary of the Treasury to consult with the heads of the member agencies of FSOC to identify any laws, regulations or requirements that inhibit Federal regulation of the financial system in a manner consistent with the core principles identified in the Executive Order. We cannot predict with certainty what other proposals may be made or what legislation or regulations may be introduced or enacted, or what impact any such legislation or regulations may have on our business, results of operations and financial condition.
On January 12, 2016, MetLife, Inc. announced its plan to pursue the Separation. See “Management’s Discussion and Analysis of Financial Condition and Results of Operations
—
Executive Summary
—
Other Key Information
—
Significant Events.” There can be no assurance that any actions taken in furtherance of this plan will affect any decision the FSOC may make to re-designate MetLife, Inc. as a non-bank SIFI. We may consider further structural and other business alternatives that may be available to us in response to any re-designation of MetLife as a non-bank SIFI, and we cannot predict the impact that any such alternatives, if implemented, may have on the Company or its security holders. See “Business
—
Regulation
—
U.S. Regulation
—
Potential Regulation as a Non-Bank SIFI” for additional information regarding potential regulation of MetLife, Inc. as a non-bank SIFI.
49
International Regulation
Our international insurance operations are principally regulated by insurance regulatory authorities in the jurisdictions in which they are located or operate. A significant portion of our revenues is generated through operations in foreign jurisdictions, including many countries in early stages of economic and political development. Our international operations may be materially adversely affected by the actions and decisions of foreign authorities and regulators. See “
—
Risks Related to Our Business
—
Our International Operations Face Political, Legal, Operational and Other Risks, Including Exposure to Local and Regional Economic Conditions, That Could Negatively Affect Those Operations or Our Profitability.” This may also impact many of our customers and independent sales intermediaries. Changes in the laws and regulations that affect these customers and independent sales intermediaries or their operations also may affect our business relationships with them and their ability to purchase or distribute our products. Accordingly, these changes and actions may negatively affect our business in these jurisdictions. We expect the scope and extent of regulation outside of the U.S., as well as regulatory oversight, generally, to continue to increase. The authority of our international operations to conduct business is subject to licensing requirements, permits and approvals, and these authorizations are subject to modification and revocation. The regulatory environment in the countries in which we operate and changes in laws could have a material adverse effect on our results of operations. See “Business
—
Regulation
—
International Regulation.”
Solvency Regimes
We are subject to Solvency II which became effective on January 1, 2016 in the EEA, and are subject to Solvency II-like frameworks in Mexico and China, with other similar solvency standards under development in other markets such as Brazil and Chile. See “Business
—
Regulation
—
International Regulation
—
Solvency Regimes.” As requirements are finalized by the regulators, capital requirements might be impacted in a number of jurisdictions. In addition, our legal entity structure throughout Europe may impact our capital requirements, risk management infrastructure and reporting by country.
Global Systemically Important Insurers
In the wake of the financial crisis, national and international authorities have proposed measures intended to increase the intensity of regulation of large financial institutions, requiring greater coordination among regulators and efforts to harmonize regulatory regimes. For example, the IAIS is participating in the FSB’s initiative to identify and manage global systemically important financial institutions. To this end, the IAIS published a methodology to assess the systemic relevance of global insurers and a framework of policy measures to be applied to G-SIIs. G-SII designation is an annual process. The IAIS published revised assessment methodology in June 2016 as the new basis for annual designation and, on this basis, the FSB again so designated MetLife, Inc. in 2016. While the regulatory standards that would apply to G-SIIs are still being developed, they may include enhanced capital standards and supervision and other additional requirements that would not apply to companies that are not G-SIIs. The IAIS proposals would need to be implemented at the consolidated group level by legislation or regulation in each applicable jurisdiction. As MetLife, Inc. is no longer a U.S. non-bank SIFI and none of its regulators have proposed implementing the G-SII requirements, the impact on MetLife, Inc. of such global proposals is uncertain. See “Business
—
Regulation
—
International Regulation
—
Global Systemically Important Insurers.”
General
From time to time, regulators raise issues during examinations or audits of MetLife, Inc.’s regulated subsidiaries that could, if determined adversely, have a material impact on us. In addition, the interpretations of regulations by regulators may change and statutes may be enacted with retroactive impact, particularly in areas such as accounting or statutory reserve requirements. Compliance with applicable laws and regulations is time consuming and personnel-intensive, and changes in these laws and regulations may materially increase our direct and indirect compliance and other expenses of doing business, thus having a material adverse effect on our financial condition and results of operations.
50
The Dodd-Frank Provisions Compelling the Liquidation of Certain Types of Financial Institutions Could Materially and Adversely Affect MetLife, Inc., as Such a Financial Institution and as an Investor in Other Such Financial Institutions, as well as Our Investors
Under provisions of Dodd-Frank, if MetLife, Inc. or another financial institution were to become insolvent or were in danger of defaulting on its obligations and it was determined that such default would have serious effects on financial stability in the U.S., it could be compelled to undergo liquidation with the FDIC as receiver. While under this new regime an insurance company would be resolved in accordance with state insurance law, if the FDIC were appointed as the receiver for another type of a company (including an insurance holding company such as MetLife, Inc.), liquidation of that company would occur under the provisions of the new liquidation authority, and not under the Bankruptcy Code, which ordinarily governs liquidations. In an FDIC-managed liquidation, holders of a company’s debt could in certain respects be treated differently than under the Bankruptcy Code and similarly-situated creditors could be treated differently. In particular, unsecured creditors and shareholders are intended to bear the losses of the company being liquidated. These provisions could also apply to financial institutions whose debt securities we hold in our investment portfolio and could adversely affect our position as a creditor and the value of our holdings.
Dodd-Frank also provides for the assessment of charges against certain financial institutions, including non-bank SIFIs and bank holding companies and other financial companies with assets of $50 billion or more, to cover the costs of liquidating any financial company subject to the new liquidation authority. The liquidation authority could increase our funding costs. See “Business — Regulation — U.S. Regulation — Potential Regulation as a Non-Bank SIFI — Orderly Liquidation Authority.” See also “— Our Insurance and Brokerage Businesses Are Highly Regulated, and Changes in Regulation and in Supervisory and Enforcement Policies May Reduce Our Profitability and Limit Our Growth” for information regarding the Trump Administration’s expressed goals to dismantle or roll back Dodd-Frank.
Legislative and Regulatory Activity in Health Care and Other Employee Benefits Could Affect our Profitability as a Provider of Life Insurance, Annuities, and Non-Medical Health Insurance Benefit Products
The Affordable Care Act has led to fundamental changes in the way that employers, including us, provide health care benefits and other forms of compensation to their employees and former employees. In addition to imposing obligations on MetLife as an enterprise, the Affordable Care Act also imposes requirements on us as a provider of non-medical health insurance benefits and as a purchaser of certain of these products. See “Business
—
Regulation
—
U.S. Regulation
—
Insurance Regulation
—
Health Care Regulation” for information regarding such requirements, including the effect of assessments related to public healthcare exchanges. The Affordable Care Act or other related regulations or regulatory actions may adversely affect our ability to continue to offer certain non-medical health and dental insurance products in the same manner as we do today and may continue to result in increased and unpredictable costs to provide certain products thereby harming our competitive position.
In addition, we employ a substantial number of employees in the United States to whom we offer employment-related benefits. We also currently provide benefits to certain of our retirees. These benefits are provided under complex plans that are subject to a variety of regulatory requirements. The Affordable Care Act or related regulations or regulatory actions could adversely affect our ability to attract, retain and motivate our associates. They could also result in increased or unpredictable costs to provide employee benefits, and could harm our competitive position if we are subject to fees, penalties, tax provisions or other limitations in the Affordable Care Act and our competitors are not.
The Preservation of Access to Care for Medicare Beneficiaries and Pension Relief Act of 2010 also includes certain provisions for defined benefit pension plan funding relief. These provisions may impact the likelihood and/or timing of corporate plan sponsors terminating their plans and/or engaging in transactions to partially or fully transfer pension obligations to an insurance company. Consequently, this law could indirectly affect the mix of our business, with fewer pension risk transfers and more non-guaranteed funding products, and adversely impact our results of operations.
Changes in U.S. Federal, State Securities and State Insurance Laws and Regulations May Affect Our Operations and Our Profitability
Federal and state securities laws and regulations apply to insurance products that are also “securities,” including variable annuity contracts and variable life insurance policies, as well as certain fixed interest rate or index-linked contracts with features that require them to be registered as securities (“registered fixed contracts”). As a result, some of MetLife, Inc.’s subsidiaries and their activities in offering and selling variable insurance contracts and policies are subject to extensive regulation under these securities laws.
51
Federal and state securities laws and regulations are primarily intended to ensure the integrity of the financial markets and to protect investors in the securities markets, and to protect investment advisory or brokerage clients. These laws and regulations generally grant regulatory agencies broad rulemaking and enforcement powers, including the power to adopt new rules impacting new and/or existing products, regulate the issuance, sales and distribution of our products and limit or restrict the conduct of business for failure to comply with the securities laws and regulations.
As a result of Dodd-Frank, there have been a number of changes proposed or adopted to the laws and regulations that govern the conduct of our variable and registered fixed insurance products business and the firms that distribute these products. The future impact of recently adopted revisions to laws and regulations, as well as revisions that are still in the proposal stage, on the way we conduct our business and the products we sell is unclear. Such impact could adversely affect our operations and profitability, including increasing the regulatory and compliance burden upon us, resulting in increased costs, or limiting the type, amount or structure of compensation arrangements into which we may enter with certain of our employees, negatively impacting our ability to compete with other companies in recruiting and maintaining key personnel. See “Business
—
Regulation
—
U.S. Regulation
—
ERISA Considerations” and “Business
—
Regulation
—
U.S. Regulation
—
Securities, Broker-Dealer and Investment Adviser Regulation.” However, following the change of Administration, we cannot predict with certainty whether any such proposals will be adopted, or what impact adopted revisions will have on our business, financial condition or results of operations. See “
—
Our Insurance and Brokerage Businesses Are Highly Regulated, and Changes in Regulation and in Supervisory and Enforcement Policies May Reduce Our Profitability and Limit Our Growth” for information regarding the Trump Administration’s expressed goals to dismantle or roll back Dodd-Frank. We also may be subject to similar laws and regulations in the foreign countries in which we offer products or conduct other activities similar to those described above. See “Business
—
Regulation
—
International Regulation.”
The global financial crisis has led to significant changes in economic and financial markets that have, in turn, led to a dynamic competitive landscape for variable and registered fixed product issuers. Our ability to react to rapidly changing market and economic conditions will depend on the continued efficacy of provisions we have incorporated into our product design allowing frequent and contemporaneous revisions of key pricing elements and our ability to work collaboratively with federal securities regulators. Changes in regulatory approval processes, rules and other dynamics in the regulatory process could adversely impact our ability to react to such changing conditions.
Changes in Tax Laws or Interpretations of Such Laws Could Reduce Our Earnings and Materially Impact Our Operations by Increasing Our Corporate Taxes and Making Some of Our Products Less Attractive to Consumers
Changes in domestic or foreign tax laws or interpretations of such laws could increase our corporate taxes and reduce our earnings. For example, in the third quarter of 2015, MetLife, Inc. recorded a $792 million after-tax charge, or $.70 per share, under accounting guidance for the recognition of tax uncertainties as a result of our consideration of decisions of the U.S. Court of Appeals for the Second Circuit upholding the disallowance of foreign tax credits claimed by other corporate entities not affiliated with us (in transactions different from ours), based upon a changed interpretation of the proper method of determining that a transaction has economic substance. Additionally, global budget deficits make it likely that governments’ need for additional revenue will result in future tax proposals that will increase our effective tax rate. However, it remains difficult to predict the timing and effect that future tax law changes could have on our earnings both in the U.S. and in foreign jurisdictions. Such changes could not only directly impact our corporate taxes but also could adversely impact our products (both life insurance and retirement plans) by making some of our products less attractive to consumers. A shift away from life insurance and annuity contracts and other tax-deferred products by our customers would reduce our income from sales of these products, as well as the asset base upon which we earn investment income and fees, thereby reducing our earnings and potentially affecting the value of our deferred tax assets.
Additionally, the Trump Administration and Congress have publicly stated that fundamental U.S. tax reform is a priority. The substance, timing and likelihood of such reform are all uncertain. Such reform could impact the Company’s corporate taxes and products, whether favorably or adversely. While current tax reform proposals generally include a reduction of the U.S. corporate tax rate, given the overall U.S. budget deficit it is likely that any tax reform will include provisions which would raise revenues. Thus, it is not possible to predict with certainty whether the reform would be beneficial or adverse to MetLife, Inc.
52
Litigation and Regulatory Investigations Are Increasingly Common in Our Businesses and May Result in Significant Financial Losses and/or Harm to Our Reputation
We face a significant risk of litigation and regulatory investigations and actions in the ordinary course of operating our businesses, including the risk of class action lawsuits. Our pending legal and regulatory actions include proceedings specific to us and others generally applicable to business practices in the industries in which we operate. In connection with our insurance operations, plaintiffs’ lawyers may bring or are bringing class actions and individual suits alleging, among other things, issues relating to sales or underwriting practices, claims payments and procedures, product design, disclosure, administration, investments, denial or delay of benefits and breaches of fiduciary or other duties to customers. Plaintiffs in class action and other lawsuits against us may seek very large and/or indeterminate amounts, including punitive and treble damages. Due to the vagaries of litigation, the outcome of a litigation matter and the amount or range of potential loss at particular points in time may normally be difficult to ascertain. Uncertainties can include how fact finders will evaluate documentary evidence and the credibility and effectiveness of witness testimony, and how trial and appellate courts will apply the law in the context of the pleadings or evidence presented, whether by motion practice, or at trial or on appeal. Disposition valuations are also subject to the uncertainty of how opposing parties and their counsel will themselves view the relevant evidence and applicable law. Material pending litigation and regulatory matters affecting us and risks to our business presented by these proceedings are discussed in
Note 21
of the Notes to the Consolidated Financial Statements. Updates are provided in the notes to our interim condensed consolidated financial statements included in our subsequently filed quarterly reports on Form 10-Q, as well as in Part II, Item 1 (“Legal Proceedings”) of those quarterly reports.
A substantial legal liability or a significant federal, state or other regulatory action against us, as well as regulatory inquiries or investigations, could harm our reputation, result in material fines or penalties, result in significant legal costs and otherwise have a material adverse effect on our business, financial condition and results of operations. Even if we ultimately prevail in the litigation, regulatory action or investigation, our ability to attract new customers, retain our current customers and recruit and retain employees could be materially and adversely impacted. Regulatory inquiries and litigation may also cause volatility in the price of stocks of companies in our industry.
Current claims, litigation, unasserted claims probable of assertion, investigations and other proceedings against us could have a material adverse effect on our business, financial condition or results of operations. It is also possible that related or unrelated claims, litigation, unasserted claims probable of assertion, investigations and proceedings may be commenced in the future, and we could become subject to further investigations and have lawsuits filed or enforcement actions initiated against us. We currently have a market presence in numerous countries and may be subject to additional investigations and lawsuits in these jurisdictions. Increased regulatory scrutiny and any resulting investigations or proceedings in any of the countries where we operate could result in new legal actions and precedents and industry-wide regulations that could adversely affect our business, financial condition and results of operations.
Risks Related to Acquisitions, Dispositions or Other Structural Changes
We May Not Complete the Separation of Brighthouse Financial on the Terms or Timeline Currently Contemplated, if at All
On October 5, 2016, our wholly-owned subsidiary, Brighthouse, filed a registration statement on Form 10 with the SEC in connection with the previously announced separation of a substantial portion of our former Retail segment, as well as certain portions of our former Corporate Benefit Funding segment. The Form 10, as amended, reflects our current plan to initiate the Separation in the form of an initial spin-off of 80.1% of the outstanding common stock of Brighthouse. While we and Brighthouse are currently preparing for a spin-off transaction, the ultimate form and timing of a separation will be influenced by a number of factors, including regulatory considerations and economic conditions. We continue to evaluate and pursue structural alternatives for the proposed Separation. MetLife has initiated the regulatory process for the proposed separation of Brighthouse Financial. Unanticipated developments could delay, prevent or otherwise adversely affect the currently proposed spin-off of Brighthouse, including possible problems or delays in obtaining various insurance and other regulatory approvals, tax approvals (including the failure of such a separation to qualify for any intended tax-free treatment) and disruptions in the capital and financial markets. In addition, consummation of the currently proposed spin-off will require final approval from our Board of Directors. Therefore, we cannot assure that we will complete the Separation in the form, on the terms or on the timeline that we announced, if at all.
53
In order to position ourselves for the proposed Separation, we are actively pursuing strategic, structural and process realignment and restructuring actions within our former Retail segment (now, the Brighthouse Financial and MetLife Holdings segments). These actions could lead to disruption of our operations, loss of, or inability to recruit, key personnel needed to operate and grow our businesses and complete the proposed Separation, weakening of our internal standards, controls or procedures, and impairment of our relationship with key customers and counterparties. We have and will continue to incur significant expenses in connection with the proposed Separation. We also may not achieve certain of the benefits that we expect to achieve in connection with the Separation, including dividends from Brighthouse to MetLife, Inc., due to, among other things, the inability of Brighthouse to raise sufficient funds by the incurrence of debt or otherwise, or lower than expected dividends received by Brighthouse from its subsidiaries. In addition, completion of the proposed Separation will require significant amounts of our management’s time and effort which may divert management’s attention from operating and growing our remaining businesses and could adversely affect our business, results of operations and financial condition.
We Could Face Difficulties, Unforeseen Liabilities, Asset Impairments or Rating Actions Arising from Business Acquisitions or Integrating and Managing Growth of Such Businesses, Dispositions of Businesses, or Legal Entity Reorganizations
We have engaged in dispositions and acquisitions of businesses in the past, and expect to continue to do so in the future. See “Management’s Discussion and Analysis of Financial Condition and Results of Operations
—
Executive Summary
—
Other Key Information
—
Significant Events” for information regarding MetLife, Inc.’s plan to pursue the Separation, as well as the U.S. Retail Advisor Force Divestiture. Such activity exposes us to a number of risks arising from (i) potential difficulties achieving projected financial results, including the costs and benefits of integration or deconsolidation; (ii) unforeseen liabilities or asset impairments; (iii) the scope and duration of rights to indemnification for losses; (iv) the use of capital which could be used for other purposes; (v) rating agency reactions; (vi) regulatory requirements that could impact our operations or capital requirements; (vii) changes in statutory or U.S. GAAP accounting principles, practices or policies; and (viii) certain other risks specifically arising from activities relating to an initial public offering, spin-off, joint venture or legal entity reorganization, including in connection with the proposed Separation.
The valuation and structure for any transaction reflect our financial projections and other qualitative and quantitative factors. Every transaction exposes us to the risk that actual results may materially differ from what we have projected. Factors that can cause our ultimate experience to vary materially from financial projections made at the time we enter into a transaction include, but are not limited to, macroeconomic, business growth, demographic, policyholder behavior and other actuarial assumptions, regulatory and political conditions.
Risks Relating to Acquisition
s
Our ability to achieve certain financial benefits we anticipate from any acquisitions of businesses will depend in part upon our ability to successfully integrate such businesses in an efficient and effective manner. We may not be able to integrate such businesses smoothly or successfully, and the process may take longer than expected. The integration of operations and differences in organizational culture may require the dedication of significant management resources, which may distract management’s attention from day-to-day business. If we are unable to successfully integrate the operations of such acquired businesses, we may be unable to realize the benefits we expect to achieve as a result of such acquisitions and our business and results of operations may be less than expected.
54
The success with which we are able to integrate acquired operations will depend on our ability to manage a variety of issues, including the following:
|
•
|
Loss of key personnel or higher than expected employee attrition rates could adversely affect the performance of the acquired business and our ability to integrate it successfully.
|
|
•
|
Customers of the acquired business may reduce, delay or defer decisions concerning their use of its products and services as a result of the acquisition or uncertainty related to the consummation of the acquisition, including, for example, potential unfamiliarity with the MetLife brand in regions where we did not have a market presence prior to the acquisition.
|
|
•
|
If the acquired business relies upon independent distributors to distribute its products, these distributors may not continue to generate the same volume of business for us after the acquisition. Independent distributors may reexamine the scope of their relationship with the acquired business or us as a result of the acquisition and decide to curtail or eliminate distribution of our products.
|
|
•
|
If the acquired business relies on continued distribution access with another party, we are also exposed to the risk of loss of exclusivity or change in access due to regulatory changes.
|
|
•
|
Integrating acquired operations with our existing operations may require us to coordinate geographically separated organizations, address possible differences in corporate culture and management philosophies, merge financial processes and risk and compliance procedures, combine separate information technology platforms and integrate operations that were previously closely tied to the former parent of the acquired business or other service providers.
|
|
•
|
In cases where we or an acquired business operates in certain markets through joint ventures, the acquisition may affect the continued success and prospects of the joint venture.
|
|
•
|
We may incur significant costs in connection with any acquisition and the related integration. The costs and liabilities actually incurred in connection with an acquisition and subsequent integration process may exceed those anticipated.
|
There could be unforeseen liabilities or asset impairments, including goodwill impairments, which arise in connection with the businesses that we may sell or the businesses that we may acquire in the future.
In addition, there may be liabilities or asset impairments that we fail, or are unable, to discover in the course of performing acquisition-related due diligence investigations. Furthermore, even for obligations and liabilities that we do discover during the due diligence process, neither the valuation adjustment nor the contractual protections we negotiate may be sufficient to fully protect us from losses. Although we generally have rights to indemnification for certain losses, our rights may be limited by survival periods for bringing claims and limitations on the nature and amount of losses we may recover, and we cannot be certain that indemnification will be, among other things, collectible or sufficient in amount, scope or duration to fully offset any loss we may suffer. The use of our own funds as consideration in any acquisition would consume capital resources, which could affect our capital plan and render those funds unavailable for other corporate purposes. We also may not be able to raise sufficient funds to consummate an acquisition if, for example, we are unable to sell our securities or close related bridge credit facilities.
Risks Relating to Dispositions
We may from time to time dispose of business or blocks of in-force business through an outright sale, reinsurance transaction or by alternate means such as a public offering of shares in an independent, publicly traded company or a spin-off, which would also result in a separate, possibly independent and publicly traded, company. See “Management’s Discussion and Analysis of Financial Condition and Results of Operations
—
Executive Summary
—
Other Key Information
—
Significant Events” for information on MetLife, Inc.’s announcement of its plan to pursue the Separation, as well as the U.S. Retail Advisor Force Divestiture. The Separation, depending on the specific form, would be subject to the satisfaction of various conditions and approvals, including, among other things, approval of any transaction by the MetLife, Inc. Board of Directors, satisfaction of any applicable requirements of the SEC, and receipt of insurance and other regulatory approvals and other anticipated conditions. See “
—
We May Not Complete the Separation of Brighthouse Financial on the Terms or Timeline Currently Contemplated, If at All.” In addition, transitional services or tax arrangements related to the Separation may impose restrictions, liabilities, losses or indemnification obligations on us. Furthermore, a distributor has elected to suspend, and other distributors may elect to suspend, alter, reduce or terminate their distribution relationships with us for various reasons, including uncertainty related to the proposed Separation, changes in our distribution strategy, adverse developments in our business, adverse rating agency actions or concerns about market-related risks.
55
When we dispose of subsidiaries or operations, we may remain liable to the acquiror or to third parties for certain losses or costs arising from the divested business or on other bases. We may also not realize the anticipated profit on a disposition or incur a loss on the disposition. In anticipation of any disposition, we may need to restructure our operations, which could disrupt such operations and affect our ability to recruit key personnel needed to operate and grow such business pending the completion of such transaction. In addition, the actions of key employees of the business to be divested could adversely affect the success of such disposition as they may be more focused on obtaining employment, or the terms of their employment, than on maximizing the value of the business to be divested. Furthermore, transitional services or tax arrangements related to any such separation could further disrupt our operations and may impose restrictions, liabilities, losses or indemnification obligations on us. Depending on its particulars, a separation could increase our exposure to certain risks, such as by decreasing the diversification of our sources of revenue or by changing the percentage of our revenue being derived from non-U.S. sources. See “
—
Risks Related to Our Business
—
Our International Operations Face Political, Legal, Operational and Other Risks, Including Exposure to Local and Regional Economic Conditions, That Could Negatively Affect Those Operations or Our Profitability.” Any such separation could also affect the dividends available to be paid to MetLife, Inc. by the subsidiaries that are part of such separation. Furthermore, we may be unable to timely dissolve all contractual relationships with the divested business in the course of the proposed transaction, which may materially adversely affect our ability to realize value from the disposition. Such restructuring could also adversely affect our internal controls and procedures and impair our relationships with key customers, distributors and suppliers. An interruption or significant change in certain key relationships could materially affect our ability to market our products and could have a material adverse effect on our business, operating results and financial condition. After any such disposition, shares of our Common Stock will represent an investment in a company different in size and characteristics from the present. These changes may cause some existing shareholders to sell their shares of our Common Stock, which could, if excessive, cause the market price of our Common Stock to decrease.
Risks Relating to Joint Ventures
We participate in joint ventures, which may also include exclusive or semi-exclusive distribution relationships, in several countries, including China and India. We may enter into joint ventures with other companies or government sponsored enterprises in various other international markets, including joint ventures where we may have a lesser degree of control over the business operations, which may expose us to additional operational, financial, legal or compliance risks. We may be dependent on a joint venture counterparty for capital, product distribution, local market knowledge, or other resources. Limits on our ownership levels under local laws or regulations may increase our dependence on joint venture counterparties and subsequent changes to such laws or regulations may impact how we account for our joint venture ownership interests or manage the joint venture. Regulations regarding the level of foreign ownership or operations of such entities or limitation on distribution exclusivity may affect the value of a joint venture. See “
—
Risks Related to Our Business
—
Our International Operations Face Political, Legal, Operational and Other Risks, Including Exposure to Local and Regional Economic Conditions, That Could Negatively Affect Those Operations or Our Profitability.”
A joint venture may require an investment of considerable management, financial and operational resources to establish sufficient infrastructure such as underwriting, actuarial, risk management, compliance or other processes. If we are unable to effectively cooperate with joint venture counterparties, or any joint venture counterparty fails to meets its obligations under the joint venture arrangement, encounters financial difficulty, or elects to alter, modify or terminate the relationship, we may be unable to exercise management control or influence over these joint venture operations and our ability to achieve our objectives and our results of operations may be negatively impacted thereby impairing our investment.
Risks Relating to Legal Entity Reorganizations
In addition, we may reorganize or consolidate the legal entities through which we conduct business. The implementation of legal entity reorganizations is a complex undertaking and involves a number of risks similar to those outlined above that are present in the case of an acquisition, including additional costs and expenses, information technology-related delays and problems, loss of key personnel and distraction of management. Over the past several years, we have pursued two significant reorganizations. For example, in November 2014, the Company completed the mergers into MetLife USA of certain of its affiliates and a subsidiary. In 2015, we substantially completed a reorganization of many of our foreign entities under a single holding company. Many aspects of these transactions are subject to regulatory approvals from a number of different jurisdictions. We may not obtain needed regulatory approvals in the timeframe anticipated or at all, which could reduce or prevent us from realizing the anticipated benefits of these transactions. These transactions or the related regulatory approvals may entail modifications of certain aspects of our operations, the composition of certain of our investment portfolios, and/or the cost of our derivatives hedging activities, which could result in additional costs or reduce net investment income. These transactions are often effected to achieve certain operational, capital or tax benefits and to the extent not realized could affect the ongoing value and financial results of such entities. Any of these risks, if realized, could result in a material adverse effect on our business, results of operations or financial condition.
56
Investments-Related Risks
Should the Need Arise, We May Have Difficulty Selling Certain Holdings in Our Investment Portfolio or in Our Securities Lending Program in a Timely Manner and Realizing Full Value Given Their Illiquid Nature
There may be a limited market for certain investments we hold in our investment portfolio, making them relatively illiquid. These include privately-placed fixed maturity securities, certain derivative instruments, mortgage loans, policy loans, leveraged leases, other limited partnership interests, and real estate equity, such as real estate joint ventures and funds. In recent years, even some of our very high quality investments experienced reduced liquidity during periods of market volatility or disruption. If we were forced to sell certain of our investments during periods of market volatility or disruption, market prices may be lower than our carrying value in such investments. This could result in realized losses which could have a material adverse effect on our results of operations and financial condition, as well as our financial ratios, which could affect compliance with our credit instruments and rating agency capital adequacy measures.
Similarly, we loan blocks of our securities to third parties (primarily brokerage firms and commercial banks) through our securities lending program, including fixed maturity (primarily U.S. government and U.S. government-backed securities) and equity securities, short-term investments and cash equivalents. Under this program, we obtain collateral, usually cash, at the inception of a loan and typically purchase securities with the cash collateral. Upon the return to us of these loaned securities, we must return to the third party the cash collateral we received. If the cash collateral has been invested in securities, we need to sell the securities. However, in some cases, the maturity of those securities may exceed the term of the related securities on loan and the estimated fair value of the securities we need to sell may fall below the amount of cash received.
If we are required to return significant amounts of cash collateral under our securities lending program or otherwise need significant amounts of cash on short notice and we are forced to sell securities, we may have difficulty selling such collateral that is invested in securities in a timely manner, be forced to sell securities in a volatile or illiquid market for less than we otherwise would have been able to realize under normal market conditions, or both. In the event of a forced sale, accounting guidance requires the recognition of a loss for securities in an unrealized loss position and may require the impairment of other securities based on our ability to hold those securities, which would negatively impact our financial condition, as well as our financial ratios, which could affect compliance with our credit instruments and rating agency capital adequacy measures. In addition, under stressful capital market and economic conditions, liquidity broadly deteriorates, which may further restrict our ability to sell securities. Furthermore, if we decrease the amount of our securities lending activities over time, the amount of net investment income generated by these activities will also likely decline. See “Management’s Discussion and Analysis of Financial Condition and Results of Operations
—
Investments” and “Management’s Discussion and Analysis of Financial Condition and Results of Operations
—
Liquidity and Capital Resources
—
The Company
—
Liquidity and Capital Uses
—
Securities Lending.”
Our Requirements to Pledge Collateral or Make Payments Related to Declines in Estimated Fair Value of Derivatives Transactions or Specified Assets in Connection with OTC-Cleared and OTC-Bilateral Transactions May Adversely Affect Our Liquidity, Expose Us to Central Clearinghouse and Counterparty Credit Risk, and Increase our Costs of Hedging
Substantially all of our derivatives transactions require us to pledge collateral related to any decline in the net estimated fair value of such derivatives transactions executed through a specific broker at a clearinghouse or entered into with a specific counterparty on a bilateral basis. Certain derivatives financing transactions require us to pledge collateral or make payments related to declines in the estimated fair value of the specified assets under certain circumstances to central clearinghouses or our counterparties. The amount of collateral we may be required to pledge and the payments we may be required to make under our derivatives transactions may increase under certain circumstances and will increase as a result of the requirement to pledge initial margin for OTC-cleared transactions and for OTC-bilateral transactions entered into after the phase-in period, which will likely be applicable to us in September 2020 as a result of the adoption by the Prudential Regulators and the CFTC of final margin requirements for non-centrally cleared derivatives. Although the final rules allow us to pledge a broad range of non-cash collateral as initial and variation margin, the Prudential Regulators, CFTC, central clearinghouses and counterparties may restrict or eliminate certain types of previously eligible collateral or charge us to pledge such non-cash collateral, which would increase our costs and could adversely affect the liquidity of our investments and the composition of our investment portfolio. See “Business
—
Regulation
—
U.S. Regulation
—
Regulation of Over-the-Counter Derivatives,” “Management’s Discussion and Analysis of Financial Condition and Results of Operations
—
Liquidity and Capital Resources
—
The Company
—
Liquidity and Capital Uses
—
Pledged Collateral,” and
Note 9
of the Notes to the Consolidated Financial Statements.
57
Gross Unrealized Losses on Fixed Maturity and Equity Securities and Defaults, Downgrades or Other Events May Result in Future Impairments to the Carrying Value of Such Securities, Resulting in a Reduction in Our Net Income
Fixed maturity and equity securities classified as available-for-sale (“AFS”) securities are reported at their estimated fair value. Unrealized gains or losses on AFS securities are recognized as a component of other comprehensive income (loss) (“OCI”) and are, therefore, excluded from net income. In recent periods, as a result of low interest rates, the unrealized gains on our fixed maturity securities have exceeded the unrealized losses. However, if interest rates rise, our unrealized gains would decrease and our unrealized losses would increase, perhaps substantially. The accumulated change in estimated fair value of these AFS securities is recognized in net income when the gain or loss is realized upon the sale of the security or in the event that the decline in estimated fair value is determined to be other-than-temporary and an impairment charge to earnings is taken. See “Management’s Discussion and Analysis of Financial Condition and Results of Operations
—
Investments
—
Fixed Maturity and Equity Securities AFS.”
The occurrence of a major economic downturn, acts of corporate malfeasance, widening credit risk spreads, or other events that adversely affect the issuers or guarantors of securities or the underlying collateral of structured securities could cause the estimated fair value of our fixed maturity securities portfolio and corresponding earnings to decline and cause the default rate of the fixed maturity securities in our investment portfolio to increase. A ratings downgrade affecting issuers or guarantors of particular securities, or similar trends that could worsen the credit quality of issuers, such as the corporate issuers of securities in our investment portfolio, could also have a similar effect. With economic uncertainty, credit quality of issuers or guarantors could be adversely affected. Similarly, a ratings downgrade affecting a security we hold could indicate the credit quality of that security has deteriorated and could increase the capital we must hold to support that security to maintain our RBC levels. Levels of writedowns or impairments are impacted by intent to sell, or our assessment of the likelihood that we will be required to sell, fixed maturity securities, as well as our intent and ability to hold equity securities which have declined in value until recovery. Realized losses or impairments on these securities may have a material adverse effect on our net income in a particular quarterly or annual period.
Our Valuation of Securities and Investments and the Determination of the Amount of Allowances and Impairments Taken on Our Investments Are Subjective and Include Methodologies, Estimations and Assumptions Which Are Subject to Differing Interpretations and Market Conditions and, if Changed, Could Materially Adversely Affect Our Results of Operations or Financial Condition
Fixed maturity, equity, fair value option (“FVO”) and trading securities, as well as short-term investments that are reported at estimated fair value represent the majority of our total cash and investments. We define fair value generally as the price that would be received to sell an asset or paid to transfer a liability. Considerable judgment is often required in interpreting market data to develop estimates of fair value, and the use of different assumptions or valuation methodologies may have a material effect on the estimated fair value amounts. During periods of market disruption including periods of significantly rising or high interest rates, rapidly widening credit spreads or illiquidity, it may be difficult to value certain of our securities if trading becomes less frequent and/or market data becomes less observable. In addition, in times of financial market disruption, certain asset classes that were in active markets with significant observable data may become illiquid. In those cases, the valuation process includes inputs that are less observable and require more subjectivity and management judgment. Valuations may result in estimated fair values which vary significantly from the amount at which the investments may ultimately be sold. Further, rapidly changing and unprecedented credit and equity market conditions could materially impact the valuation of securities as reported within our consolidated financial statements and the period-to-period changes in estimated fair value could vary significantly. Decreases in the estimated fair value of securities we hold may have a material adverse effect on our results of operations or financial condition. See “Management’s Discussion and Analysis of Financial Condition and Results of Operations
—
Investments” and Notes
1
and
10
of the Notes to the Consolidated Financial Statements.
The determination of the amount of allowances and impairments varies by investment type and is based upon our periodic evaluation and assessment of known and inherent risks associated with the respective asset class. Such evaluations and assessments are revised as conditions change and new information becomes available. We reflect any changes in allowances and impairments in earnings as such evaluations are revised. However, historical trends may not be indicative of future impairments or allowances. In addition, any such future impairments or allowances could have a materially adverse effect on our earnings and financial position. See “Management’s Discussion and Analysis of Financial Condition and Results of Operations
—
Summary of Critical Accounting Estimates
—
Investment Impairments” and
Note 8
of the Notes to the Consolidated Financial Statements.
58
Defaults on Our Mortgage Loans and Volatility in Performance May Adversely Affect Our Profitability
Our mortgage loans face default risk and are principally collateralized by commercial, agricultural and residential properties. We establish valuation allowances for estimated impairments, which are based on loan risk characteristics, historical default rates and loss severities, real estate market fundamentals and outlooks, as well as other relevant factors. In addition, substantially all of our commercial and agricultural mortgage loans held-for-investment have balloon payment maturities. An increase in the default rate of our mortgage loan investments or fluctuations in their performance could have a material adverse effect on our business, results of operations and financial condition.
Further, any geographic or property type concentration of our mortgage loans may have adverse effects on our investment portfolio and consequently on our results of operations or financial condition. While we seek to mitigate this risk by having a broadly diversified portfolio, events or developments that have a negative effect on any particular geographic region or sector may have a greater adverse effect on the investment portfolio to the extent that the portfolio is concentrated. Moreover, our ability to sell assets relating to such particular groups of related assets may be limited if other market participants are seeking to sell at the same time. In addition, legislative proposals that would allow or require modifications to the terms of mortgage loans could be enacted. We cannot predict whether these proposals will be adopted, or what impact, if any, such proposals or, if enacted, such laws, could have on our business or investments. See “Management’s Discussion and Analysis of Financial Condition and Results of Operations
—
Investments
—
Mortgage Loans.”
The Defaults or Deteriorating Credit of Other Financial Institutions Could Adversely Affect Us
We have exposure to many different industries and counterparties, and routinely execute transactions with counterparties in the financial services industry, including brokers and dealers, central clearinghouses, commercial banks, investment banks, hedge funds and investment funds and other financial institutions. Many of these transactions expose us to credit risk in the event of default of our counterparty. In addition, with respect to secured transactions, our credit risk may be exacerbated when the collateral held by us cannot be realized or is liquidated at prices not sufficient to recover the full amount of the loan or derivative exposure due to us. We also have exposure to these financial institutions in the form of unsecured debt instruments, non-redeemable and redeemable preferred securities, derivatives, joint venture, hedge fund and equity investments. Further, potential action by governments and regulatory bodies in response to the financial crisis affecting the global banking system and financial markets, such as investment, nationalization, conservatorship, receivership and other intervention, whether under existing legal authority or any new authority that may be created, or lack of action by governments and central banks, as well as deterioration in the banks’ credit standing, could negatively impact these instruments, securities, transactions and investments or limit our ability to trade with them. Any such losses or impairments to the carrying value of these investments or other changes may materially and adversely affect our business and results of operations.
Risks Related to Our Business
Our International Operations Face Political, Legal, Operational and Other Risks, Including Exposure to Local and Regional Economic Conditions, That Could Negatively Affect Those Operations or Our Profitability
Our international operations face political, legal, financial, operational and other risks. These operations may be materially adversely affected by the actions and decisions of foreign authorities and regulators, such as through nationalization or expropriation of assets; the imposition of limits on foreign ownership of local companies which may increase our dependence on joint venture counterparties and/or impact how we account for our joint venture ownership interests; changes in laws (including tax laws and regulations), their application or interpretation; political instability (including any resulting economic or trade sanctions); dividend limitations; price controls; changes in applicable currency; currency exchange controls or other restrictions that prevent us from transferring funds from these operations out of the countries in which they operate or converting local currencies we hold into U.S. dollars or other currencies, as well as other adverse actions by foreign governmental authorities and regulators, such as the retroactive application of new requirements on our current and prior activities or operations and the imposition of regulations limiting our ability to distribute our products. Such actions may negatively affect our business in these jurisdictions and could indirectly affect our business in other jurisdictions as well. Some of our foreign insurance operations are, and are likely to continue to be, in emerging markets where these risks are heightened. For example, proposed reform of the Chilean pension system, if enacted, may have a significant adverse effect on our business in Chile. See “Business
— Regulation
—
International Regulation.”
59
The Trump Administration has discussed potentially putting in place a tax on goods and services imported into the United States, including from countries in which we have international operations, such as Mexico. For example, President Trump has in the past referred to renegotiating NAFTA, which had eliminated most trade tariffs between the United States, Canada and Mexico. Our business in Mexico is not related to any trade agreements and is tied to the general economy and the growth of the market. We cannot predict with certainty what proposals may be made in connection with international trade agreements or what legislation or regulations may be introduced or enacted, or what impact any such legislation or regulations may have on our business, results of operations and financial condition.
Part of our international insurance operations may be subject to assessments, generally based on their proportionate share of business written in the relevant jurisdiction, for certain obligations to policyholders and claimants resulting from the insolvency of insurance companies. We cannot predict the timing and scope of any assessments that may be made in the future, which may materially affect the results of operations of our international insurance operations in particular quarterly or annual periods. See “Business
—
Regulation
—
International Regulation” and “Quantitative and Qualitative Disclosures About Market Risk,” as well as “
—
Regulatory and Legal Risks
—
Our Insurance and Brokerage Businesses Are Highly Regulated, and Changes in Regulation and in Supervisory and Enforcement Policies May Reduce Our Profitability and Limit Our Growth.”
We have market presence in numerous countries and increased exposure to risks posed by local and regional economic conditions. Concerns about the political and/or economic stability in the U.K., Italy, Mexico, Turkey and Puerto Rico have recently contributed to global market volatility. Lack of legal certainty and stability in these regions exposes our operations there to increased risk of disruption and to adverse or unpredictable actions by regulators and may make it more difficult for us to enforce our contracts, which may negatively impact our business in these regions. See “Management’s Discussion and Analysis of Financial Condition and Results of Operations
—
Industry Trends
—
Financial and Economic Environment.”
On June 23, 2016, the U.K. held a referendum regarding its membership in the EU, resulting in a narrow vote in favor of leaving the EU. The U.K. subsequently indicated that it will initiate the withdrawal process by the end of March 2017. The member withdrawal provisions in the applicable EU treaty have not been used before so it is unclear how the provisions will work in practice. Assuming the U.K. initiates the withdrawal process by giving notice that it is withdrawing from the EU, the relevant treaty provides that the U.K. and the EU will negotiate a withdrawal agreement during a maximum two-year period (unless such period is extended by unanimous vote of the other EU member states). It is currently anticipated that the withdrawal agreement would deal with the details of the immediate exit but would not set out final trade arrangements or deal comprehensively with other potentially significant matters. Upon effectiveness of the withdrawal agreement, or, if no agreement is concluded in the two-year period, at the end of the period, the U.K. will no longer be a member of the EU. In the meantime, however, the U.K. remains a member of the EU with unchanged rights to access the single EU market in goods and services. Our U.K. business model utilizes certain rights to operate cross-border insurance and investment operations which may be modified or eliminated as a result of the U.K. exiting the EU. Operating expenses within our businesses could increase as a result of uncertainties during the negotiation period and in the event of an eventual U.K. withdrawal.
We face substantial exposure to the Japanese economy given the size of our business there, and Japan continues to experience overall sluggish economic performance. Economic slowdowns and volatility may impact other markets where we have a material presence, including Latin America and Europe. Unfavorable economic conditions could adversely impact the demand for our products, negatively impact earnings, adversely affect the performance of our investments or result in impairments, all of which could have a material adverse effect on our business, results of operations and financial condition. See “
—
Economic Environment and Capital Markets-Related Risks
—
If Difficult Conditions in the Global Capital Markets and the Economy Generally Persist, They May Materially Adversely Affect Our Business and Results of Operations”
and “Management’s Discussion and Analysis of Financial Condition and Results of Operations
—
Investments
—
Current Environment
—
Selected Country Investments.”
Furthermore, we rely on local sales forces in these countries and may encounter labor problems resulting from workers’ associations and trade unions in some countries. If our business model is not successful in a particular country, we may lose all or most of our investment in building and training the sales force in that country.
We are continuing to expand our international operations in certain markets where we operate and in selected new markets. This may require considerable management time, as well as start-up expenses for market development before any significant revenues and earnings are generated. The prospects of our business also may be materially and adversely affected if we are not able to manage the growth of such international operations successfully. There can be no assurance that we will be successful in managing such future growth. Further, operations in new foreign markets may achieve low margins or may be unprofitable, and expansion in existing markets may be affected by local political, economic and market conditions. Therefore, as we expand internationally, we may not achieve expected operating margins and our results of operations may be negatively impacted.
60
Fluctuations in Foreign Currency Exchange Rates Could Negatively Affect Our Profitability
We are exposed to risks associated with fluctuations in foreign currency exchange rates against the U.S. dollar resulting from our holdings of non-U.S. dollar denominated investments, investments in foreign subsidiaries, net income from foreign operations and issuance of non-U.S. dollar denominated instruments, including guaranteed interest contracts and funding agreements. In general, the weakening of foreign currencies versus the U.S. dollar will adversely affect the estimated fair value of our non-U.S. dollar denominated investments, our investments in foreign subsidiaries, and our net income from foreign operations. In addition, from time to time, various emerging market countries have experienced severe economic and financial disruptions, including significant devaluations of their currencies. Our exposure to foreign currency exchange rate risk is exacerbated by our investments in these emerging markets. See “Quantitative and Qualitative Disclosures About Market Risk.”
In addition, certain of our life and annuity products are exposed to foreign exchange rate risk. Payments under these contracts, depending on the circumstances, may be required to be made in different currencies and may not be the legal tender in the country whose law governs the particular product. Changes in exchange rate movements and the imposition of capital controls may also directly impact the liability valuation that may not be entirely hedged. If the currency upon which expected future payments are made strengthens, the liability valuation may increase, which may result in a reduction of net income.
Historically, we have matched substantially all of our foreign currency denominated liabilities in our foreign subsidiaries with investments denominated in their respective foreign currency, which limits the effect of currency exchange rate fluctuations on local operating results; however, fluctuations in such rates affect the translation of these results into our U.S. dollar basis consolidated financial statements. Although we take certain actions to address this risk, including entering into foreign currency derivatives, foreign currency exchange rate fluctuations could materially adversely affect our reported results due to unhedged positions, asymmetrical and non-economic accounting resulting from derivative gains (losses) on non-qualifying hedges, or the failure of hedges to effectively offset the impact of the foreign currency exchange rate fluctuation. Our reported results could also be adversely affected if the economy of one or more of our foreign subsidiaries is determined to be “highly inflationary,” generally defined by a cumulative inflation rate of approximately 100% or more over a three-year period.
We face significant exposure to risks associated with fluctuations in the yen/U.S. dollar exchange rate because we have substantial operations in Japan and a large portion of our premiums and investment income in Japan are received in yen. Most claims and expenses associated with our operations in Japan are also paid in yen and we primarily purchase yen-denominated assets to support yen-denominated policy liabilities. These and other yen-denominated financial statement items are, however, translated into U.S. dollars for financial reporting purposes. Accordingly, fluctuations in the yen/U.S. dollar exchange rate can have a significant effect on our reported financial position and results of operations. Our Japan operation does assume some currency exposure by backing a portion of surplus and yen-denominated liabilities with U.S. dollar assets. Although this represents risk to our Japan operation, this activity reduces yen exposure at the enterprise level. Additionally, our Japan operation sells U.S. dollar and Australian dollar life and annuity products to Japanese customers. We may experience elevated levels of early policy terminations when the Japanese yen weakens against these currencies. While the cost of early policy terminations is offset by surrender charges, foreign exchange rate fluctuations will impact both our sales volumes and the amount of business we have in-force.
Due to our significant international operations, during periods when any foreign currency from which we derive our revenues weakens (strengthens), translating amounts expressed in that currency into U.S. dollars causes fewer (more) U.S. dollars to be reported. Any unrealized foreign currency translation adjustments (“FCTA”) are reported in accumulated other comprehensive income (loss) (“AOCI”). The weakening of a foreign currency relative to the U.S. dollar will generally adversely affect the value of investments in U.S. dollar terms and reduce the level of reserves denominated in that currency.
An Inability to Access Our Credit Facility Could Result in a Reduction in Our Liquidity and Lead to Downgrades in Our Credit and Financial Strength Ratings
We rely on our unsecured credit facility maintained by MetLife, Inc. and MetLife Funding, Inc. (“MetLife Funding”), an indirect wholly-owned subsidiary of MetLife, Inc. (the “Credit Facility”), as a potential source of liquidity. The availability of this Credit Facility, which is currently $4.0 billion but which is expected to decrease to $3.0 billion upon the completion of the proposed Separation, could be critical to our credit and financial strength ratings and our ability to meet our obligations as they come due in a market when alternative sources of credit are tight. The Credit Facility contains certain administrative, reporting, legal and financial covenants, including a requirement to maintain a specified minimum consolidated net worth. See “Management’s Discussion and Analysis of Financial Condition and Results of Operations
—
Liquidity and Capital Resources
—
The Company
—
Liquidity and Capital Sources
—
Global Funding Sources
—
Credit and Committed Facilities” and
Note 12
of the Notes to the Consolidated Financial Statements.
61
Our right to borrow funds under the Credit Facility is subject to the fulfillment of certain important conditions, including our compliance with all covenants, and our ability to borrow under the Credit Facility is also subject to the continued willingness and ability of the lenders that are parties to the Credit Facility to provide funds. Our failure to comply with the covenants in the Credit Facility or fulfill the conditions to borrowings, or the failure of lenders to fund their lending commitments (whether due to insolvency, illiquidity or other reasons) in the amounts provided for under the terms of the Credit Facility, would restrict our ability to access the Credit Facility when needed and, consequently, could have a material adverse effect on our financial condition and results of operations.
We May Need to Fund Deficiencies in Our Closed Block; Assets Allocated to the Closed Block Benefit Only the Holders of Closed Block Policies
MLIC’s plan of reorganization, as amended, established in connection with its demutualization, required that we establish and operate an accounting mechanism, known as a closed block, to ensure that the reasonable dividend expectations of policyholders who own individual participating whole life insurance policies of MLIC in force at the time of the demutualization are met. We allocated assets to the closed block in an amount that will produce cash flows which, together with anticipated revenue from the policies included in the closed block, are reasonably expected to be sufficient to support obligations and liabilities relating to these policies, including, but not limited to, provisions for the payment of claims and certain expenses and tax, and to provide for the continuation of the policyholder dividend scales in effect for 1999, if the experience underlying such scales continues, and for appropriate adjustments in such scales if the experience changes. The closed block assets, the cash flows generated by the closed block assets and the anticipated revenue from the policies included in the closed block may not be sufficient to provide for the benefits guaranteed under these policies. If they are not, we must fund the shortfall. Even if they are sufficient, we may choose, for competitive reasons, to support policyholder dividend payments with our general account funds.
The closed block assets, the cash flows generated by the closed block assets and the anticipated revenues from the policies in the closed block will benefit only the holders of the policies in the closed block. In addition, to the extent that these amounts are greater than the amounts estimated at the time the closed block was funded, dividends payable in respect of the policies included in the closed block may be greater than they would be in the absence of a closed block. Any excess earnings will be available for distribution over time only to closed block policyholders. See
Note 7
of the Notes to the Consolidated Financial Statements.
A Downgrade or a Potential Downgrade in Our Financial Strength or Credit Ratings Could Result in a Loss of Business and Materially Adversely Affect Our Financial Condition and Results of Operations
Financial strength ratings are published by various Nationally Recognized Statistical Rating Organizations (“NRSROs”) and similar entities not formally recognized as NRSROs. They indicate the NRSROs’ opinion regarding an insurance company’s ability to meet contractholder and policyholder obligations, and are important to maintaining public confidence in our products and our competitive position.
See “Business
—
Company Ratings” for additional information regarding our financial strength ratings.
Downgrades in our financial strength ratings or changes to our rating outlooks could have a material adverse effect on our financial condition and results of operations in many ways, including:
|
•
|
reducing new sales of insurance products, annuities and other investment products;
|
|
•
|
adversely affecting our relationships with our sales force and independent sales intermediaries;
|
|
•
|
materially increasing the number or amount of policy surrenders and withdrawals by contractholders and policyholders;
|
|
•
|
requiring us to post additional collateral under certain of our financing and derivative transactions;
|
|
•
|
requiring us to reduce prices for many of our products and services to remain competitive;
|
|
•
|
providing termination rights for the benefit of our derivative instrument counterparties;
|
|
•
|
adversely affecting our ability to obtain reinsurance at reasonable prices or at all;
|
|
•
|
limiting our access to the capital markets;
|
|
•
|
potentially increasing the cost of debt;
|
|
•
|
requiring us to post collateral; and
|
|
•
|
subjecting us to potentially increased regulatory scrutiny.
|
62
In addition to the financial strength ratings of our insurance subsidiaries, various NRSROs also publish credit ratings for MetLife, Inc. and several of its subsidiaries. Credit ratings indicate the NRSROs’ opinion regarding a debt issuer’s ability to meet the terms of debt obligations in a timely manner and are important factors in our overall funding profile and ability to access certain types of liquidity. See
Note 9
of the Notes to the Consolidated Financial Statements for information regarding the impact of a one-notch downgrade with respect to derivative transactions with credit rating downgrade triggers and “Management’s Discussion and Analysis of Financial Condition and Results of Operations
—
Liquidity and Capital Resources
—
The Company
—
Liquidity and Capital Uses
—
Pledged Collateral” for further information on the impact of a one-notch downgrade. See also “Management’s Discussion and Analysis of Financial Condition and Results of Operations
—
Liquidity and Capital Resources
—
The Company
—
Capital
—
Rating Agencies.”
In view of the difficulties experienced by many financial institutions as a result of the financial crisis and ensuing global recession, including our competitors in the insurance industry, we believe it is possible that the NRSROs will continue to heighten the level of scrutiny that they apply to insurance companies, will continue to increase the frequency and scope of their credit reviews, will continue to request additional information from the companies that they rate, and may adjust upward the capital and other requirements employed in the models for maintenance of certain ratings levels. Our ratings could be downgraded at any time and without notice by any NRSRO.
Reinsurance May Not Be Available, Affordable or Adequate to Protect Us Against Losses
As part of our overall risk management strategy, we purchase reinsurance for certain risks underwritten by our various business segments. While reinsurance agreements generally bind the reinsurer for the life of the business reinsured at generally fixed pricing, market conditions beyond our control determine the availability and cost of the reinsurance protection for new business. In certain circumstances, the price of reinsurance for business already reinsured may also increase. For example, for some of our group businesses under which the policies and related reinsurance are subject to periodic (typically annual) renewal, prices may increase at any renewal. Also, for most of our traditional life reinsurance agreements, it is common for the reinsurer to have a right to increase reinsurance rates on in-force business if there is a systematic deterioration of mortality in the market as a whole. Any decrease in the amount of reinsurance will increase our risk of loss and any increase in the cost of reinsurance will, absent a decrease in the amount of reinsurance, reduce our earnings. Accordingly, we may be forced to incur additional expenses for reinsurance or may not be able to obtain sufficient reinsurance on acceptable terms, which could adversely affect our ability to write future business or result in the assumption of more risk with respect to those policies we issue. See “Business
—
Reinsurance Activity” and “
—
If the Counterparties to Our Reinsurance or Indemnification Arrangements or to the Derivatives We Use to Hedge Our Business Risks Default or Fail to Perform, We May Be Exposed to Risks We Had Sought to Mitigate, Which Could Materially Adversely Affect Our Financial Condition and Results of Operations.”
If the Counterparties to Our Reinsurance or Indemnification Arrangements or to the Derivatives We Use to Hedge Our Business Risks Default or Fail to Perform, We May Be Exposed to Risks We Had Sought to Mitigate, Which Could Materially Adversely Affect Our Financial Condition and Results of Operations
We use reinsurance, indemnification and derivatives to mitigate our risks in various circumstances. In general, reinsurance, indemnification and derivatives do not relieve us of our direct liability to our policyholders, even when the reinsurer is liable to us. Accordingly, we bear credit risk with respect to our reinsurers, indemnitors, counterparties and central clearinghouses. A reinsurer’s, indemnitor’s, counterparty’s or central clearinghouse’s insolvency, inability or unwillingness to make payments under the terms of reinsurance agreements, indemnity agreements or derivatives agreements with us or inability or unwillingness to return collateral could have a material adverse effect on our financial condition and results of operations, including our liquidity. See “Business
—
Reinsurance Activity.”
In addition, we use derivatives to hedge various business risks. We enter into a variety of derivatives, including options, forwards, interest rate, credit default and currency swaps with a number of counterparties on a bilateral basis for uncleared OTC derivatives and with clearing brokers and central clearinghouses for OTC-cleared derivatives. See “Management’s Discussion and Analysis of Financial Condition and Results of Operations
—
Derivatives.” If our counterparties, clearing brokers or central clearinghouses fail or refuse to honor their obligations under these derivatives, our hedges of the related risk will be ineffective. This risk is more pronounced in light of the stresses suffered by financial institutions over the past few years. Such failure could have a material adverse effect on our financial condition and results of operations.
63
Differences Between Actual Claims Experience and Underwriting and Reserving Assumptions May Adversely Affect Our Financial Results
Our earnings significantly depend upon the extent to which our actual claims experience is consistent with the assumptions we use in setting prices for our products and establishing liabilities for future policy benefits and claims. Such amounts are established based on estimates by actuaries of how much we will need to pay for future benefits and claims. To the extent that actual claims experience is less favorable than the underlying assumptions we used in establishing such liabilities, we could be required to reduce DAC and/or VOBA, increase our liabilities and/or incur higher costs.
Due to the nature of the underlying risks and the uncertainty associated with the determination of liabilities for future policy benefits and claims, we cannot determine precisely the amounts which we will ultimately pay to settle our liabilities. Such amounts may vary from the estimated amounts, particularly when those payments may not occur until well into the future. We evaluate our liabilities periodically based on accounting requirements, which change from time to time, the assumptions used to establish the liabilities, as well as our actual experience. If the liabilities originally established for future benefit payments prove inadequate, we must increase them and/or reduce associated DAC and/or VOBA. Such adjustments could affect earnings negatively and have a material adverse effect on our business, results of operations and financial condition. See “Business — Policyholder Liabilities” and “Management’s Discussion and Analysis of Financial Condition and Results of Operations — Policyholder Liabilities.” See also “Management’s Discussion and Analysis of Financial Condition and Results of Operations — Summary of Critical Accounting Estimates — Deferred Policy Acquisition Costs and Value of Business Acquired,” “Management’s Discussion and Analysis of Financial Condition and Results of Operations — Summary of Critical Accounting Estimates — Derivatives,” and “Management’s Discussion and Analysis of Financial Condition and Results of Operations — Results of Operations — Consolidated Results — Year Ended December 31, 2016 Compared with the Year Ended December 31, 2015 — Actuarial Assumption Review” for further information regarding the manner in which policyholder behavior and other events may differ from our assumptions and, thereby affect our financial results.
Catastrophes May Adversely Impact Liabilities for Policyholder Claims and Reinsurance Availability
Our insurance operations are exposed to the risk of catastrophic events. The extent of losses from a catastrophe is a function of both the total amount of insured exposure in the area affected by the event and the severity of the event. Most catastrophes are restricted to small geographic areas; however, hurricanes, earthquakes, tsunamis and man-made catastrophes may produce significant damage or loss of life or property damage in larger areas, especially those that are heavily populated. Claims resulting from catastrophic events could cause substantial volatility in our financial results for any fiscal quarter or year and could materially reduce our profitability or harm our financial condition. In addition, catastrophic events could harm the financial condition of issuers of obligations we hold in our investment portfolio, resulting in impairments to these obligations, and the financial condition of our reinsurers, thereby increasing the probability of default on reinsurance recoveries. Large-scale catastrophes may also reduce the overall level of economic activity in affected countries which could hurt our business and the value of our investments or our ability to write new business. It is possible that increases in the value, caused by the effects of inflation or other factors, and geographic concentration of insured lives or property, could increase the severity of claims we receive from future catastrophic events.
Our life insurance operations are exposed to the risk of catastrophic mortality, such as a pandemic or other event that causes a large number of deaths. Significant influenza pandemics have occurred three times in the last century; however, the likelihood, timing, and severity of a future pandemic cannot be predicted. A significant pandemic could have a major impact on the global economy or the economies of particular countries or regions, including travel, trade, tourism, the health system, food supply, consumption, overall economic output and, eventually, on the financial markets. In addition, a pandemic that affected our employees or the employees of our distributors or of other companies with which we do business could disrupt our business operations. The effectiveness of external parties, including governmental and non-governmental organizations, in combating the spread and severity of such a pandemic could have a material impact on the losses we experience. In our group insurance operations, a localized event that affects the workplace of one or more of our group insurance customers could cause a significant loss due to mortality or morbidity claims. These events could cause a material adverse effect on our results of operations in any period and, depending on their severity, could also materially and adversely affect our financial condition.
64
Our property & casualty businesses have experienced, and will likely in the future experience, catastrophe losses that may have a material adverse impact on their business, results of operations and financial condition. Although we make every effort to limit our exposure to catastrophic risks through volatility management and reinsurance programs, these efforts do not eliminate all risk. Catastrophes can be caused by various events, including hurricanes, windstorms, earthquakes, hail, tornadoes, explosions, severe winter weather (including snow, freezing water, ice storms and blizzards), fires and man-made events such as terrorist attacks. Historically, most of our property & casualty catastrophe-related claims have related to homeowners coverages. However, catastrophes may also affect other property & casualty coverages. Due to their nature, we cannot predict the incidence, timing and severity of catastrophes. In addition, changing climate conditions, primarily rising global temperatures, may increase the frequency and severity of natural catastrophes such as hurricanes, tornadoes and floods.
We have hurricane exposure in coastal sections of the northeastern U.S. (including lower New York, New Jersey, Connecticut, Rhode Island and Massachusetts), the south Atlantic states (including Virginia, North Carolina, South Carolina, Georgia and Florida) and the Gulf Coast (including Alabama, Mississippi, Louisiana and Texas). We also have some earthquake exposure, primarily along the New Madrid fault line in the central U.S. and in the Pacific Northwest.
Consistent with industry practice and accounting standards, we establish liabilities for claims arising from a catastrophe only after assessing the probable losses arising from the event. We cannot be certain that the liabilities we have established will be adequate to cover actual claim liabilities. From time to time, states have passed legislation that has the effect of limiting the ability of insurers to manage risk, such as legislation restricting an insurer’s ability to withdraw from catastrophe-prone areas. While we attempt to limit our exposure to acceptable levels, subject to restrictions imposed by insurance regulatory authorities, a catastrophic event or multiple catastrophic events could have a material adverse effect on our business, results of operations and financial condition.
Most of the jurisdictions in which our U.S. insurance subsidiaries are admitted to transact business require life, health, and property & casualty insurers doing business within the jurisdiction to participate in guaranty associations. These associations are organized to pay contractual benefits owed pursuant to insurance policies issued by impaired, insolvent or failed insurers, who may become impaired, insolvent or fail, for example, following the occurrence of one or more catastrophic events. These associations levy assessments, up to prescribed limits, on all member insurers in a particular state on the basis of the proportionate share of the premiums written by member insurers in the lines of business in which the impaired, insolvent or failed insurer is engaged. In addition, certain states have government owned or controlled organizations providing life, health, and property & casualty insurance to their citizens. The activities of such organizations could also place additional stress on the adequacy of guaranty fund assessments. Many of these organizations also have the power to levy assessments similar to those of the guaranty associations described above. Some states permit member insurers to recover assessments paid through full or partial premium tax offsets. See “Business
—
Regulation
—
U.S. Regulation
—
Insurance Regulation
—
Guaranty Associations and Similar Arrangements” and “Business
—
Regulation
—
International Regulation.”
While in the past five years, the aggregate assessments levied against MetLife have not been material, it is possible that a large catastrophic event could render such guaranty funds inadequate and we may be called upon to contribute additional amounts, which may have a material impact on our financial condition or results of operations in a particular period. We have established liabilities for guaranty fund assessments that we consider adequate, but additional liabilities may be necessary. See
Note 21
of the Notes to the Consolidated Financial Statements.
Our ability to manage this risk and the profitability of our property & casualty, health and life insurance businesses depends in part on our ability to obtain catastrophe reinsurance, which may not be available at commercially acceptable rates in the future. See “
—
Reinsurance May Not Be Available, Affordable or Adequate to Protect Us Against Losses.”
Our Statutory Life Insurance Reserve Financings May Be Subject to Cost Increases and New Financings May Be Subject to Limited Market Capacity
We currently utilize capital markets solutions to finance a portion of our statutory reserve requirements for several products, including, but not limited to, our level premium term life subject to the NAIC Model Regulation Valuation of Life Insurance Policies (commonly referred to as XXX), and universal and variable life policies with secondary guarantees (“ULSG”) subject to NAIC Actuarial Guideline 38 (commonly referred to as AXXX), as well as MLIC’s closed block. While we have financing facilities in place for certain previously written business, certain of these facilities are subject to cost increases upon the occurrence of specified ratings downgrades of MetLife or are subject to periodic re-pricing. Any resulting cost increases could negatively impact our financial results.
65
Future capacity for these statutory reserve funding structures in the marketplace is not guaranteed. Currently, state insurance regulators and the NAIC are investigating the use of captive reinsurers and offshore entities to reinsure insurance risks. See “
—
Regulatory and Legal Risks
—
Our Insurance and Brokerage Businesses are Highly Regulated, and Changes in Regulation and in Supervisory and Enforcement Policies May Reduce Our Profitability and Limit Our Growth.” Insurance regulators in a few states, including New York and California, have imposed a moratorium on new reinsurance transactions between life insurers domiciled in those states and captive reinsurers. If additional state insurance regulators determine to restrict the use of captive reinsurers for purposes of funding reserve requirements or capacity in the capital markets otherwise becomes unavailable for a prolonged period of time, thereby hindering our ability to obtain funding for these new structures, our ability to continue the financing of our statutory reserve requirements for our previously written business in a cost effective manner may be impacted. After the Separation, statutory life financing will be less of a risk factor, given our discontinuance of retail life sales.
Competitive Factors May Adversely Affect Our Market Share and Profitability
We believe competition amongst insurance companies is based on a number of factors, including service, product features, scale, price, financial strength, claims-paying ratings, credit ratings, e-business capabilities and name recognition. We compete globally with a large number of other insurance companies, as well as non-insurance financial services companies, such as banks, broker-dealers and asset managers, for individual consumers, employers and other group customers and agents and other distributors of insurance and investment products. Some of these companies offer a broader array of products, have more competitive pricing or, with respect to other insurance companies, have higher claims paying ability ratings. Some may also have greater financial resources with which to compete. In some circumstances, national banks that sell annuity products of life insurers may also have pre-existing customer bases for financial services products. Additionally, many of our group insurance products are underwritten annually. There is a risk that group purchasers may be able to obtain more favorable terms from competitors than they could renewing coverage with us. These competitive pressures may adversely affect the persistency of these and other products, as well as our ability to sell our products in the future. Furthermore, the investment management and securities brokerage businesses have relatively few barriers to entry and continually attract new entrants. See “Business
—
Competition.”
The insurance industry distributes many of its individual products through other financial institutions such as banks and broker-dealers. An increase in bank and broker-dealer consolidation activity may negatively impact the industry’s sales, and such consolidation could increase competition for access to distributors, result in greater distribution expenses and impair our ability to market insurance products to our current customer base or to expand our customer base. Consolidation of distributors and/or other industry changes may also increase the likelihood that distributors will try to renegotiate the terms of any existing selling agreements to terms less favorable to us.
In addition, since numerous aspects of our business are subject to regulation, legislative and other changes affecting the regulatory environment for our business may have, over time, the effect of supporting or burdening some aspects of the financial services industry more than others. This can affect our competitive position within the life insurance industry and within the broader financial services industry. See “Business
—
Regulation,” “
—
Regulatory and Legal Risks
—
Our Insurance and Brokerage Businesses Are Highly Regulated, and Changes in Regulation and in Supervisory and Enforcement Policies May Reduce Our Profitability and Limit Our Growth,” and “
—
Regulatory and Legal Risks
—
Changes in U.S. Federal, State Securities and State Insurance Laws and Regulations May Affect Our Operations and Our Profitability.”
If Our Business Does Not Perform Well, We May Be Required to Recognize an Impairment of Our Goodwill or Other Long-Lived Assets or to Establish a Valuation Allowance Against the Deferred Income Tax Asset, Which Could Adversely Affect Our Results of Operations or Financial Condition
We perform our goodwill impairment testing using the fair value approach, which requires the use of estimates and judgment, at the “reporting unit” level. A reporting unit is the operating segment or a business one level below the operating segment under certain circumstances.
The estimated fair value of the reporting unit is impacted by the performance of the business, which may be adversely impacted by prolonged market declines. If it is determined that the goodwill has been impaired, we must write down the goodwill by the amount of the impairment, with a corresponding charge to net income. Such writedowns could have an adverse effect on our results of operations or financial position. See “Management’s Discussion and Analysis of Financial Condition and Results of Operations
—
Summary of Critical Accounting Estimates
—
Goodwill” and Notes
1
and
11
of the Notes to the Consolidated Financial Statements.
Long-lived assets, including assets such as real estate, also require impairment testing. This testing is done to determine whether changes in circumstances indicate that we will be unable to recover the carrying amount of the asset group. Such writedowns could have a material adverse effect on our results of operations or financial position.
66
Deferred income tax represents the tax effect of the differences between the book and tax bases of assets and liabilities. Deferred tax assets are assessed periodically by management to determine if they are realizable. Factors in management’s determination include the performance of the business including the ability to generate future taxable income. If, based on available information, it is more likely than not that the deferred income tax asset will not be realized then a valuation allowance must be established with a corresponding charge to net income. Such charges could have a material adverse effect on our results of operations or financial position. In addition, changes in the corporate tax rates could affect the value of our deferred tax assets and may require a write-off of some of those assets. See “Management’s Discussion and Analysis of Financial Condition and Results of Operations
—
Summary of Critical Accounting Estimates
—
Income Taxes.”
If Our Business Does Not Perform Well or if Actual Experience Versus Estimates Used in Valuing and Amortizing DAC, Deferred Sales Inducements (“DSI”) and VOBA Vary Significantly, We May Be Required to Accelerate the Amortization and/or Impair the DAC, DSI and VOBA Which Could Adversely Affect Our Results of Operations or Financial Condition
We incur significant costs in connection with acquiring new and renewal insurance business. Costs that are related directly to the successful acquisition of new and renewal insurance business are deferred and referred to as DAC. Bonus amounts credited to certain policyholders, either immediately upon receiving a deposit or as excess interest credits for a period of time, are deferred and referred to as DSI. VOBA represents the excess of book value over the estimated fair value of acquired insurance, annuity, and investment-type contracts in-force at the acquisition date. The estimated fair value of the acquired liabilities is based on actuarially determined projections, by each block of business, of future policy and contract charges, premiums, mortality and morbidity, separate account performance, surrenders, operating expenses, investment returns, nonperformance risk adjustment and other factors. DAC, DSI and VOBA related to fixed and variable universal life and deferred annuity contracts are amortized in proportion to actual and expected future gross profits and for most participating contracts in proportion to actual and expected future gross margins. The amount of future gross profit or margin is dependent principally on investment returns in excess of the amounts credited to policyholders, mortality, morbidity, persistency, interest crediting rates, dividends paid to policyholders, expenses to administer the business, creditworthiness of reinsurance counterparties and certain economic variables, such as inflation. Of these factors, we anticipate that investment returns are most likely to impact the rate of amortization of DAC for the aforementioned contracts.
If actual gross profits or margins are less than originally expected, then the amortization of such costs would be accelerated in the period the actual experience is known and would result in a charge to net income. Significant or sustained equity market declines could result in an acceleration of amortization of DAC, DSI and VOBA related to variable annuity and variable universal life contracts, resulting in a charge to net income. Such adjustments could have a material adverse effect on our results of operations or financial condition. See “Management’s Discussion and Analysis of Financial Condition and Results of Operations
—
Industry Trends
—
Impact of a Sustained Low Interest Rate Environment” for a discussion of how significantly lower spreads may cause us to accelerate amortization, thereby reducing net income in the affected reporting period.
See “Management’s Discussion and Analysis of Financial Condition and Results of Operations
—
Summary of Critical Accounting Estimates
—
Deferred Policy Acquisition Costs and Value of Business Acquired” and Note
1
of the Notes to the Consolidated Financial Statements for further consideration of DAC and VOBA.
Guarantees Within Certain of Our Products May Decrease Our Earnings, Increase the Volatility of Our Results, Result in Higher Risk Management Costs and Expose Us to Increased Counterparty Risk
Certain of our variable annuity products include guaranteed benefits, including guaranteed minimum death benefits (“GMDBs”), guaranteed minimum withdrawal benefits (“GMWBs”), guaranteed minimum accumulation benefits (“GMABs”), and guaranteed minimum income benefits (“GMIBs”). Certain of our interest rate sensitive products include a minimum crediting rate feature which could be guaranteed for a period of time or life time of the policies. These guarantees are designed to protect policyholders against significant downturns in equity markets and interest rates. Any such periods of significant and sustained downturns in equity markets, increased equity volatility, or reduced interest rates could result in an increase in the valuation of our liabilities associated with those products. An increase in these liabilities would result in a decrease in our net income.
We use derivatives and other risk management strategies to hedge the economic exposure inherent in these liabilities. These economically effective hedges do not always qualify for hedge accounting treatment, and, as result, such non-qualifying derivatives may introduce volatility in the results of our operations, including net income, to the extent the financial measurement of the hedged liability does not fully reflect the sensitivity to the underlying economic exposure.
67
We also use derivatives and other risk management strategies to directly mitigate the volatility in net income associated with certain of these liabilities that are measured at fair value. These strategies involve the use of reinsurance and derivatives, which may not be completely effective. For example, in the event that reinsurers, derivative counterparties or central clearinghouses are unable or unwilling to pay, we remain liable for the guaranteed benefits. See “
—
If the Counterparties to Our Reinsurance or Indemnification Arrangements or to the Derivatives We Use to Hedge Our Business Risks Default or Fail to Perform, We May Be Exposed to Risks We Had Sought to Mitigate, Which Could Materially Adversely Affect Our Financial Condition and Results of Operations.”
In addition, hedging instruments may not effectively offset the costs of guarantees or may otherwise be insufficient in relation to our obligations. Furthermore, we are subject to the risk that changes in policyholder behavior or mortality, combined with adverse market events, produce economic losses not addressed by the risk management techniques employed. These, individually or collectively, may have a material adverse effect on our results of operations, including net income, capitalization, financial condition or liquidity, including our ability to receive dividends from our operating insurance companies. See “Management’s Discussion and Analysis of Financial Condition and Results of Operations
—
Policyholder Liabilities
—
Variable Annuity Guarantees” and Note
1
of the Notes to the Consolidated Financial Statements for further consideration of the risks associated with guaranteed benefits.
Capital-Related Risks
Legal and Regulatory Restrictions and Uncertainty and Restrictions Under the Terms of Certain of Our Securities May Prevent Us from Repurchasing Our Stock and Paying Dividends at the Level We Wish
The declaration and payment of dividends is subject to the discretion of our Board of Directors, and will depend on our financial condition, results of operations, cash requirements, future prospects, regulatory restrictions on the payment of dividends by MetLife, Inc.’s insurance subsidiaries and other factors deemed relevant by the Board. There is no requirement or assurance that we will declare and pay any dividends. If MetLife, Inc.’s designation as a non-bank SIFI is reinstated, we also may be subject to restrictions arising from Federal Reserve regulation, including capital planning and stress testing requirements. The capital requirements that will apply to non-bank SIFIs are unclear. Furthermore, if additional capital requirements are imposed on MetLife, Inc. as a G-SII, its ability to pay dividends could be reduced by any such additional capital requirements that might be imposed. See “
—
Regulatory and Legal Risks
—
Our Insurance and Brokerage Businesses Are Highly Regulated, and Changes in Regulation and in Supervisory and Enforcement Policies May Reduce Our Profitability and Limit Our Growth.”
In addition, our ability to pay dividends on our common stock and repurchase our common stock is subject to restrictions under the terms of our preferred stock, junior subordinated debentures and trust securities. These instruments have so called “dividend stopper” provisions for situations where we may be experiencing financial stress. “Junior subordinated debentures” include MetLife’s Fixed-to-Floating Exchangeable Surplus Trust Securities, which are exchangeable for junior subordinated debentures, and which contain terms with the same substantive effects for these purposes as do the terms of MetLife, Inc.’s junior subordinated debentures. In addition, our ability to pay dividends on our preferred stock and interest on our junior subordinated debentures is also restricted by the terms of those securities.
We may also be restricted from time to time in our ability to repurchase shares or to enter into share repurchase programs under Rule 10b5-1 of the Exchange Act. That rule requires, among other things, that we establish any share repurchase program in good faith at a time when we are not aware of any material non-public information in order for us to have an affirmative defense against accusations of insider trading. Therefore, we may be unable to repurchase shares or to enter into share repurchase programs during various periods of time, including periods of significant corporate reorganization such as a spin-off or a sale of a substantial portion of the Company.
Regulatory Restrictions
MetLife, Inc. may not be able to pay dividends if it does not receive sufficient funds from its operating subsidiaries, which are themselves subject to separate regulatory restrictions on their ability to pay dividends. See “
—
As A Holding Company, MetLife, Inc. Depends on the Ability of Its Subsidiaries to Pay Dividends, a Major Component of Holding Company Free Cash Flow.” Our ability to pay dividends, repurchase common stock or other securities or engage in other transactions that could affect our capital may also be affected if MetLife, Inc. is reinstated as a non-bank SIFI or if restrictions applicable to G-SIIs are imposed upon us. See “
—
Regulatory and Legal Risks
—
Our Insurance and Brokerage Businesses Are Highly Regulated, and Changes in Regulation and in Supervisory and Enforcement Policies May Reduce Our Profitability and Limit Our Growth,” “Business
—
Regulation
—
U.S. Regulation
—
Potential Regulation as a Non-Bank SIFI” and “Business
—
Regulation
—
International Regulation
—
Global Systemically Important Insurers.”
68
“Dividend Stopper” Provisions in Our Preferred Stock and Junior Subordinated Debentures
Certain terms of our preferred stock and our junior subordinated debentures may prevent us from repurchasing our common stock or paying dividends on our common stock in certain circumstances. MetLife, Inc. also has entered into certain replacement capital covenants. These covenants limit our ability to eliminate these restrictions through the repayment, redemption or purchase of preferred stock or junior subordinated debentures by requiring MetLife, with some limitations, to receive cash proceeds during a specified period from the sale of specified replacement securities prior to any repayment, redemption or purchase. See
Note 14
of the Notes to the Consolidated Financial Statements for a description of such covenants in effect with respect to junior subordinated debentures.
If we have not paid the full dividends on our preferred stock for the latest completed dividend period, we may not repurchase or pay dividends on our common stock during a dividend period. Under our junior subordinated debentures, if we have not paid in full the accrued interest through the most recent interest payment date on our junior subordinated debentures, we may not repurchase or pay dividends on our common stock or other capital stock (including the preferred stock), subject to certain exceptions.
Trigger Events for the Restrictions on the Payment of Dividends on Our Preferred Stock and Restrictions on the Payment of Interest on Our Junior Subordinated Debentures
In addition, the preferred stock and the junior subordinated debentures contain provisions that would automatically suspend the payment of preferred stock dividends and interest on junior subordinated debentures if MetLife, Inc. fails to meet certain tests (“Trigger Events”). In such cases, and subject to the terms of the instruments, MetLife, Inc. could make payments up to the amount of net proceeds from
sales of (i) common stock during the 90 days preceding the dividend declaration date or (ii) common stock or certain kinds of
warrants to purchase common stock generally during the 180 days prior to the interest payment date (the “New Equity Proceeds”).
A “Trigger Event” would occur if:
|
•
|
the RBC ratio of MetLife’s largest U.S. insurance subsidiaries in the aggregate (as defined in the applicable instrument) were to be less than 175% of the company action level based on the subsidiaries’ prior year annual financial statements filed (generally around March 1) with state insurance commissioners; or
|
|
•
|
at the end of a quarter (“Final Quarter End Test Date”), consolidated GAAP net income for the four-quarter period ending two quarters before such quarter-end (the “Preliminary Quarter End Test Date”) is zero or a negative amount and the consolidated GAAP stockholders’ equity, minus AOCI (the “adjusted stockholders’ equity amount”), as of the Final Quarter End Test Date and the Preliminary Quarter End Test Date, declined by 10% or more from its level 10 quarters before the Final Quarter End Test Date (the “Benchmark Quarter End Test Date”).
|
The Trigger Event would continue until there is no longer a Trigger Event at the specified time, and the adjusted stockholders’ equity amount is no longer 10% or more below its level at each Benchmark Quarter End Test Date that is associated with a “Trigger Event.”
We currently expect that, when we separate Brighthouse Financial, our adjusted stockholders’ equity amount will decline by at least 10% in the quarter of the Separation. The adjusted stockholders’ equity amount on the Preliminary Quarter End Test Date at the end of that quarter, and seven subsequent quarters, will be at least 10% less than the amount on the applicable Benchmark Quarter End Test Date (in the absence of some other increase in the adjusted stockholders’ equity amount). If, on any of those Preliminary Quarter End Test Dates, four quarter consolidated GAAP net income is zero or less, a “Trigger Event” would occur unless, prior to the corresponding Final Quarter End Test Date, the adjusted stockholders’ equity amount is greater than 90% of the amount of the adjusted stockholders’ equity on the Benchmark Quarter End Test Date.
After a Trigger Event, we would only be permitted to pay dividends on the preferred stock and interest on the junior subordinated debentures to the extent the New Equity Proceeds were sufficient to do so. In addition, if the New Equity Proceeds were insufficient to make such payments, the “dividend stopper” provisions would come into effect and we would be unable to repurchase or pay dividends on our common stock.
69
If, for example, we complete the Separation in the third quarter of 2017 and the four quarter consolidated GAAP net income is zero or less at the end of that quarter (the Preliminary Quarter End Test Date), a Trigger Event may occur that would restrict payments of dividends on the preferred stock and interest on the junior subordinated debentures beginning in the second quarter of 2018 after the Final Quarter End Test Date. In that case, we would have to suspend our dividend payments on, and repurchases of, our common stock, unless we could make payments in full on the preferred and the junior subordinated debentures, in each case, using the available applicable New Equity Proceeds. The payment restrictions on the preferred and junior subordinated debt instruments, and the restrictions on repurchases of and payments of dividends on common stock, could continue until there is no longer a Trigger Event and the adjusted stockholders’ equity amount is greater than 90% of its level at the Benchmark Quarter End Test Date, which in this example would be the level at the end of the third quarter of 2015.
We are considering measures that would reduce or eliminate these potential risks. Among other possibilities, we may seek to exclude the impact of the Separation on shareholders’ equity for purposes of the restrictions on payments of dividends and interest in respect of the preferred stock and junior subordinated debentures, respectively. However, there can be no assurance we will take these or any other mitigating actions.
Dividends on Our Preferred Stock Are Subject to Declaration by Our Board of Directors
In addition, dividends on our preferred stock are subject to declaration each quarter by our Board of Directors. If our Board of Directors does not declare dividends on the preferred stock for any quarterly dividend period, the “dividend stopper” provisions in our preferred stock would prevent us from repurchasing or paying dividends on our common stock for that period.
Optional Deferral of Interest on the Junior Subordinated Debentures
The junior subordinated debentures provide that we may, at our option and provided that certain conditions are met, defer payment of interest without giving rise to an event of default for periods of up to 10 years. In that case, after five years MetLife, Inc. would be obligated to use commercially reasonable efforts to sell equity securities to raise proceeds to pay the interest. We would not be subject to limitations on the number of deferral periods that we could begin, so long as all accrued and unpaid interest is paid with respect to prior deferral periods. If we were to defer payments of interest, the “dividend stopper” provisions in the junior subordinated debentures would thus prevent us from repurchasing or paying dividends on our common stock or other capital stock (including the preferred stock) during the period of deferral, subject to exceptions.
See
Note 16
of the Notes to the Consolidated Financial Statements for additional information about these restrictions.
As a Holding Company, MetLife, Inc. Depends on the Ability of Its Subsidiaries to Pay Dividends, a Major Component of Holding Company Free Cash Flow
MetLife, Inc. is a holding company for its insurance and financial subsidiaries and does not have any significant operations of its own. Dividends from its subsidiaries and permitted payments to it under its tax sharing agreement with its subsidiaries are its principal sources of cash to meet its obligations and to pay preferred and common stock dividends. If the cash MetLife, Inc. receives from its subsidiaries is insufficient for it to fund its debt service and other holding company obligations, MetLife, Inc. may be required to raise cash through the incurrence of debt, the issuance of additional equity or the sale of assets.
Dividends that MetLife, Inc. expects to receive from Brighthouse and other companies in connection with the Separation are subject to contingencies that include investor interest, ratings actions, and the macroeconomic environment, among others. These contingencies may affect Brighthouse’s ability to incur debt to pay a portion of these dividends and otherwise affect those companies’ ability to pay these dividends.
The payment of dividends and other distributions to MetLife, Inc. by its U.S. insurance subsidiaries is regulated by insurance laws and regulations. In general, dividends in excess of prescribed limits require insurance regulatory approval. In addition, insurance regulators may prohibit the payment of dividends or other payments by its insurance subsidiaries to MetLife, Inc. if they determine that the payment could be adverse to our policyholders or contractholders. The payment of dividends and other distributions by insurance companies is also influenced by business conditions and rating agency considerations. See “Business — Regulation — U.S. Regulation — Insurance Regulation” and “Management’s Discussion and Analysis of Financial Condition and Results of Operations — Liquidity and Capital Resources — MetLife, Inc. — Liquidity and Capital Sources — Dividends from Subsidiaries.” See also “— Regulatory and Legal Risks — Our Insurance and Brokerage Businesses Are Highly Regulated, and Changes in Regulation and in Supervisory and Enforcement Policies May Reduce Our Profitability and Limit Our Growth.”
70
Any payment of interest, dividends, distributions, loans or advances by our foreign subsidiaries and branches to MetLife, Inc. could be subject to taxation, insurance regulatory or other restrictions on dividends or repatriation of earnings under applicable law, monetary transfer restrictions and foreign currency exchange regulations in the jurisdiction in which such foreign subsidiaries operate. See “Business — Regulation — International Regulation” and “— Risks Related to Our Business — Our International Operations Face Political, Legal, Operational and Other Risks, Including Exposure to Local and Regional Economic Conditions, That Could Negatively Affect Those Operations or Our Profitability.”
From time to time, MetLife, Inc. or its subsidiaries may establish net worth maintenance or other support agreements with other subsidiaries. Those commitments may limit such supported subsidiary’s ability to pay MetLife, Inc. dividends, or require MetLife, Inc. or another subsidiary to transfer capital to such supported subsidiary, in either case limiting capital that is available for other purposes. See “Management’s Discussion and Analysis of Financial Condition and Results of Operations — Liquidity and Capital Resources — MetLife, Inc. — Liquidity and Capital Uses — Support Agreements.”
Dividends from operating subsidiaries are a major component of holding company free cash flow. See “Management’s Discussion and Analysis of Financial Condition and Results of Operations — Non-GAAP and Other Financial Disclosures.” If MetLife, Inc.’s operating subsidiaries were unable to make expected dividend payments to MetLife, Inc., we may be unable to meet our free cash flow goals and our ability to distribute cash to shareholders could be adversely affected.
Operational Risks
Our Risk Management Policies and Procedures May Leave Us Exposed to Unidentified or Unanticipated Risk, Which Could Negatively Affect Our Business
Our enterprise risk management program is designed to mitigate material risks and loss to the Company. We have developed and continue to develop our risk management policies and procedures to reflect the ongoing review of our risks and expect to continue to do so in the future. Nonetheless, our policies and procedures may not be comprehensive and may not identify every risk to which we are exposed. Many of our methods for managing risk and exposures are based upon the use of observed historical market behavior to model or project potential future exposure.
Models used by our business are based on assumptions and projections which may be inaccurate. Business decisions based on incorrect or misused model output and reports could have a material adverse impact on our results of operations. Model risk may be the result of a model being misspecified for its intended purpose, being misused or producing incorrect or inappropriate results. Models used by our business may not operate properly and could contain errors related to model inputs, data, assumptions, calculations, or output. We perform model validations which are conducted by experienced professionals with the requisite authority and technical ability to effectively challenge the models. The ongoing model validation process could give rise to adjustments to models that may adversely impact our results of operations. As a result, these methods may not fully predict future exposures, which can be significantly greater than our historical measures indicate.
Other risk management methods depend upon the evaluation of information regarding markets, clients, catastrophe occurrence or other matters that are publicly available or otherwise accessible to us. This information may not always be accurate, complete, up-to-date or properly evaluated. Furthermore, there can be no assurance that we can effectively review and monitor all risks or that all of our employees will follow our risk management policies and procedures, nor can there be any assurance that our risk management policies and procedures will enable us to accurately identify all risks and limit our exposures based on our assessments. In addition, we may have to implement more extensive and perhaps different risk management policies and procedures under pending regulations. See “Business
—
Regulation
—
U.S. Regulation
—
Potential Regulation as a Non-Bank SIFI,” “Business
—
Regulation
—
International Regulation
—
Global Systemically Important Insurers” and “Quantitative and Qualitative Disclosures About Market Risk.”
The Continued Threat of Terrorism and Ongoing Military Actions May Adversely Affect the Value of Our Investment Portfolio and the Level of Claim Losses We Incur
The continued threat of terrorism, both within the U.S. and abroad, ongoing military and other actions and heightened security measures in response to these types of threats may cause significant volatility in global financial markets and result in loss of life, property damage, additional disruptions to commerce and reduced economic activity. The value of assets in our investment portfolio may be adversely affected by declines in the credit and equity markets and reduced economic activity caused by the continued threat of terrorism. Companies in which we maintain investments may suffer losses as a result of financial, commercial or economic disruptions and such disruptions might affect the ability of those companies to pay interest or principal on their securities or mortgage loans. Terrorist actions also could disrupt our operations centers in the U.S. or abroad and result in higher than anticipated claims under our insurance policies. See “
—
Economic Environment and Capital Markets-Related Risks
—
If Difficult Conditions in the Global Capital Markets and the Economy Generally Persist, They May Materially Adversely Affect Our Business and Results of Operations.”
71
The Failure in Cyber- or Other Information Security Systems, as well as the Occurrence of Events Unanticipated in Our Disaster Recovery Systems and Management Continuity Planning, Could Result in a Loss or Disclosure of Confidential Information, Damage to Our Reputation and Impairment of Our Ability to Conduct Business Effectively
Our business is highly dependent upon the effective operation of our computer systems. We rely on these systems throughout our business for a variety of functions, including processing claims, transactions and applications, providing information to customers and distributors, performing actuarial analyses and maintaining financial records. We also retain confidential and proprietary information on our computer systems and we rely on sophisticated technologies to maintain the security of that information. Our computer systems have been, and will likely continue to be, subject to computer viruses or other malicious codes, unauthorized access, cyberattacks or other computer-related penetrations. While, to date, MetLife has not experienced a material breach of cybersecurity, administrative and technical controls and other preventive actions we take to reduce the risk of cyber-incidents and protect our information technology may be insufficient to prevent physical and electronic break-ins, cyber-attacks or other security breaches to our computer systems. In some cases, such physical and electronic break-ins, cyber-attacks or other security breaches may not be immediately detected. This may impede or interrupt our business operations and could adversely affect our business, financial condition and results of operations. In addition, the availability and cost of insurance for operational and other risks relating to our business and systems may change and any such change may affect our results of operations.
In the event of a disaster such as a natural catastrophe, epidemic, industrial accident, blackout, computer virus, terrorist attack, cyberattack or war, unanticipated problems with our disaster recovery systems could have a material adverse impact on our ability to conduct business and on our results of operations and financial position, particularly if those problems affect our computer-based data processing, transmission, storage and retrieval systems and destroy valuable data. In addition, in the event that a significant number of our managers, or employees generally, were unavailable following a disaster, our ability to effectively conduct business could be severely compromised. These interruptions also may interfere with our suppliers’ ability to provide goods and services and our employees’ ability to perform their job responsibilities.
The failure of our computer systems and/or our disaster recovery plans for any reason could cause significant interruptions in our operations and result in a failure to maintain the security, confidentiality or privacy of sensitive data, including personal information relating to our customers. Such a failure could harm our reputation, subject us to regulatory sanctions and legal claims, lead to a loss of customers and revenues and otherwise adversely affect our business and financial results. Although we conduct due diligence, negotiate contractual provisions and, in many cases, conduct periodic reviews of our vendors, distributors, and other third parties that provide operational or information technology services to us to confirm compliance with MetLife’s information security standards, the failure of such third parties’ computer systems and/or their disaster recovery plans for any reason might cause significant interruptions in our operations and result in a failure to maintain the security, confidentiality or privacy of sensitive data, including personal information relating to our customers. Such a failure could harm our reputation, subject us to regulatory sanctions and legal claims, lead to a loss of customers and revenues and otherwise adversely affect our business and financial results. While we maintain cyber liability insurance that provides both third-party liability and first-party liability coverages, our insurance may not be sufficient to protect us against all losses. MetLife, Inc. and its subsidiaries maintain a primary cybersecurity and privacy liability insurance policy with a limit of $15 million, and have additional coverage for cybersecurity and privacy liability available under blended professional liability excess coverage policies with a total limit of $210 million. There can be no assurance that our information security policies and systems in place can prevent unauthorized use or disclosure of confidential information, including nonpublic personal information.
72
Any Failure To Protect The Confidentiality Of Client Information Could Adversely Affect Our Reputation And Have A Material Adverse Effect On Our Business, Financial Condition And Results Of Operations
Pursuant to U.S. federal and state laws, and laws of other jurisdictions in which we operate, various government agencies have established rules protecting the privacy and security of personal information. In addition, most U.S. states and a number of jurisdictions outside the United States, have enacted laws, which vary significantly from jurisdiction to jurisdiction, to safeguard the privacy and security of personal information. Many of our employees have access to, and routinely process, personal information of clients through a variety of media, including information technology systems. We rely on various internal processes and controls to protect the confidentiality of client information that is accessible to, or in the possession of, our company and our employees. It is possible that an employee could, intentionally or unintentionally, disclose or misappropriate confidential client information or our data could be the subject of a cybersecurity attack. If we fail to maintain adequate internal controls or if our employees fail to comply with our policies and procedures, misappropriation or intentional or unintentional inappropriate disclosure or misuse of client information could occur. Such internal control inadequacies or non-compliance could materially damage our reputation or lead to civil or criminal penalties, which, in turn, could have a material adverse effect on our business, financial condition and results of operations. In addition, we analyze customer data to better manage our business. There has been increased scrutiny, including from U.S. state regulators, regarding the use of “big data” techniques such as price optimization. We cannot predict what, if any, actions may be taken with regard to “big data,” but any inquiries could cause reputational harm and any limitations could have a material impact on our business, financial condition and results of operations.
Our Associates May Take Excessive Risks Which Could Negatively Affect Our Financial Condition and Business
As an insurance enterprise, we are in the business of accepting certain risks. The associates who conduct our business, including executive officers and other members of management, sales managers, investment professionals, product managers, sales agents, wholesalers, underwriters, and other associates, do so in part by making decisions and choices that involve exposing us to risk. These include decisions such as setting underwriting guidelines and standards, product design and pricing, determining what assets to purchase for investment and when to sell them, which business opportunities to pursue, and other decisions. We endeavor, in the design and implementation of our compensation programs and practices, to avoid giving our associates incentives to take excessive risks; however, associates may take such risks regardless of the structure of our compensation programs and practices. Similarly, although we employ controls and procedures designed to monitor associates’ business decisions and prevent us from taking excessive risks, and to prevent employee misconduct, these controls and procedures may not be effective. If our associates take excessive risks, the impact of those risks could harm our reputation and have a material adverse effect on our financial condition and business operations.
General Risks
MetLife, Inc.’s Board of Directors May Influence the Outcome of Stockholder Votes on Many Matters Due to the Voting Provisions of the MetLife Policyholder Trust
Under the Plan, we established the MetLife Policyholder Trust to hold the shares of MetLife, Inc. common stock allocated to eligible policyholders not receiving cash or policy credits under the plan. As of February 23, 2017, the Trust held 162,077,300 shares, or 14.9%, of the outstanding shares of MetLife, Inc. common stock. Because of voting provisions of the Trust and the number of shares held by it, the Trust may affect the outcome of matters brought to a stockholder vote. Except on votes regarding certain fundamental corporate actions described below, the trustee will vote all of the shares of common stock held in the Trust in accordance with the recommendations given by MetLife, Inc.’s Board of Directors to its stockholders or, if the Board gives no such recommendations, as directed by the Board. As a result of the voting provisions of the Trust, the Board of Directors may be able to influence the outcome of votes on matters submitted to a vote of stockholders, excluding certain fundamental corporate actions, so long as the Trust holds a substantial number of shares of common stock.
73
If the vote relates to fundamental corporate actions specified in the Trust, the trustee will solicit instructions from the Trust beneficiaries and vote all shares held in the Trust in proportion to the instructions it receives. These actions include:
|
•
|
an election or removal of directors in which a stockholder has properly nominated one or more candidates in opposition to a nominee or nominees of MetLife, Inc.’s Board of Directors or a vote on a stockholder’s proposal to oppose a Board nominee for director, remove a director for cause or fill a vacancy caused by the removal of a director by stockholders, subject to certain conditions;
|
|
•
|
a merger or consolidation, a sale, lease or exchange of all or substantially all of the assets, or a recapitalization or dissolution, of MetLife, Inc., in each case requiring a vote of stockholders under applicable Delaware law;
|
|
•
|
any transaction that would result in an exchange or conversion of shares of common stock held by the Trust for cash, securities or other property; and
|
|
•
|
any proposal requiring MetLife, Inc.’s Board of Directors to amend or redeem the rights under MetLife, Inc.’s stockholder rights plan, other than a proposal with respect to which we have received advice of nationally-recognized legal counsel to the effect that the proposal is not a proper subject for stockholder action under Delaware law. MetLife, Inc. does not currently have a stockholder rights plan.
|
If a vote concerns any of these fundamental corporate actions, the trustee will vote all of the shares of common stock held by the Trust in proportion to the instructions it received, which will give disproportionate weight to the instructions actually given by Trust beneficiaries.
The MetLife Policyholder Trust Agreement provides that we may terminate the Trust once the percentage of outstanding shares held in the Trust falls to 25%. The winding up of the Trust must commence 90 days after we provide the trustee with notice that the percentage of outstanding shares held in the Trust is 10% or less. In connection with any termination of the Trust, all of the shares of common stock then held in the Trust will need to be distributed to the respective Trust beneficiaries, unless we offer to purchase all or a portion of such Trust shares. In connection with the termination of the Trust and such a distribution, we may incur costs related to regulatory filings, mailings to Trust beneficiaries or others, and costs related to an increase in the number of shareholders, which may include increased mailing and proxy solicitation expenses. After such a distribution, the addition of the respective Trust beneficiaries to our shareholder base with full voting rights may have a significant impact on matters brought to a stockholder vote and other aspects of our corporate governance.
Changes in Accounting Standards Issued by the Financial Accounting Standards Board or Other Standard-Setting Bodies May Adversely Affect Our Financial Statements
Our financial statements are subject to the application of GAAP, which is periodically revised and/or expanded. Accordingly, from time to time we are required to adopt new or revised accounting standards issued by recognized authoritative bodies, including the Financial Accounting Standards Board (the “FASB”). The impact of accounting pronouncements that have been issued but not yet implemented is disclosed in our reports filed with the SEC. See Note
1
of the Notes to the Consolidated Financial Statements. An assessment of proposed standards is not provided as such proposals are subject to change through the exposure process and official positions of the FASB are determined only after extensive due process and deliberations. Therefore, the effects on our financial statements cannot be meaningfully assessed. The required adoption of future accounting standards could have a material adverse effect on our financial condition and results of operations.
Changes in Our Assumptions Regarding the Discount Rate, Expected Rate of Return, Mortality Rates and Expected Increase in Compensation Used for Our Pension and Other Postretirement Benefit Plans May Result in Increased Expenses and Reduce Our Profitability
We determine our pension and other postretirement benefit plan costs based on our best estimates of future plan experience. These assumptions are reviewed regularly and include discount rates, expected rates of return on plan assets, mortality rates, expected increases in compensation levels and expected medical inflation. Changes in these assumptions may result in increased expenses and reduce our profitability. See
Note 18
of the Notes to the Consolidated Financial Statements for details on how changes in these assumptions would affect plan costs.
74
We May Not be Able to Protect Our Intellectual Property and May be Subject to Infringement Claims
We rely on a combination of contractual rights with third parties and copyright, trademark, patent and trade secret laws to establish and protect our intellectual property. Although we endeavor to protect our rights, third parties may infringe or misappropriate our intellectual property. We may have to litigate to enforce and protect our copyrights, trademarks, patents, trade secrets and know-how or to determine their scope, validity or enforceability. This would represent a diversion of resources that may be significant and our efforts may not prove successful. The inability to secure or protect our intellectual property assets could harm our reputation and have a material adverse effect on our business and our ability to compete with other insurers and financial institutions.
In addition, we may be subject to claims by third parties for (i) patent, trademark or copyright infringement, (ii) breach of patent, trademark or copyright license usage rights, or (iii) misappropriation of trade secrets. Any such claims or resulting litigation could result in significant expense and liability for damages. If we were found to have infringed or misappropriated a third-party patent or other intellectual property right, we could in some circumstances be enjoined from providing certain products or services to our customers or from utilizing and benefiting from certain patents, copyrights, trademarks, trade secrets or licenses. Alternatively, we could be required to enter into costly licensing arrangements with third parties or implement a costly alternative. Any of these scenarios could harm our reputation and have a material adverse effect on our business and results of operations.
We May Experience Difficulty in Marketing and Distributing Products Through Our Distribution Channels
Since the completion of the U.S. Retail Advisor Force Divestiture in July 2016, we primarily distribute our products through a variety of third-party distribution channels. We may periodically negotiate the terms of these relationships, and there can be no assurance that such terms will remain acceptable to us or such third parties. An interruption in certain key relationships could materially affect our ability to market our products and could have a material adverse effect on our business, operating results and financial condition. A distributor has elected to suspend, and other distributors may elect to suspend, alter, reduce or terminate their distribution relationships with us for various reasons, including uncertainty related to the proposed Separation, changes in our distribution strategy, adverse developments in our business, adverse rating agency actions or concerns about market-related risks. We are also at risk that key distribution partners may merge, change their business models in ways that affect how our products are sold, or terminate their distribution contracts with us, or that new distribution channels could emerge and adversely impact the effectiveness of our distribution efforts. An increase in bank and broker-dealer consolidation activity could increase competition for access to distributors, result in greater distribution expenses and impair our ability to market products through these channels. Consolidation of distributors and/or other industry changes may also increase the likelihood that distributors will try to renegotiate the terms of any existing selling agreements to terms less favorable to us.
When our products are distributed through unaffiliated firms, we may not be able to monitor or control the manner of their distribution despite our training and compliance programs. If our products are distributed by such firms in an inappropriate manner, or to customers for whom they are unsuitable, we may suffer reputational and other harm to our business.
State Laws, Federal Laws, Our Certificate of Incorporation and Our By-Laws May Delay, Deter or Prevent Takeovers and Business Combinations that Stockholders Might Consider in Their Best Interests
State laws, federal laws and our certificate of incorporation and by-laws may delay, deter or prevent a takeover attempt that stockholders might consider in their best interests. For instance, such restrictions may prevent stockholders from receiving the benefit from any premium over the market price of MetLife, Inc.’s common stock offered by a bidder in a takeover context. Even in the absence of a takeover attempt, the existence of these provisions may adversely affect the prevailing market price of MetLife, Inc.’s common stock if they are viewed as discouraging takeover attempts in the future.
75
Any person seeking to acquire a controlling interest in us would face various regulatory obstacles, including:
|
•
|
applicable state insurance laws and regulations may delay or impede a business combination involving us by prohibiting an entity from acquiring control (generally presumed to exist at direct or indirect ownership of 10% or more of voting stock) of an insurance company domiciled in the United States without the prior approval of the domestic insurance regulator. Many foreign jurisdictions in which we operate have similar regulatory approval requirements.
|
|
•
|
if the acquiring entity is a bank or non-bank SIFI, Dodd-Frank provisions that restrict or impede consolidations, mergers and acquisitions by systemically significant firms. See “Business — Regulation — U.S. Regulation — Potential Regulation as a Non-Bank SIFI — Enhanced Prudential Standards for Non-Bank SIFIs.”
|
|
•
|
Provisions of the Investment Company Act that require approval by the contract owners of our variable contracts in order to effectuate a change of control of any affiliated investment adviser to a mutual fund underlying our variable contracts.
|
|
•
|
FINRA approval requirements for a change of control of any FINRA registered broker-dealer that is a direct or indirect subsidiary of MetLife, Inc.
|
|
•
|
Provisions of the Delaware General Corporation Law may affect the ability of an “interested stockholder” (the owner of 15% or more of the outstanding voting stock of a corporation) to engage in certain business combinations for a period of three years following the time that the stockholder becomes an “interested stockholder.”
|
In addition, MetLife, Inc.’s certificate of incorporation and by-laws also contain provisions that may delay, deter or prevent a takeover attempt that stockholders might consider in their best interests or may otherwise adversely affect prevailing market prices for MetLife, Inc.’s common stock. These provisions include: a prohibition on the calling of special meetings or action by written consent by stockholders; and advance notice procedures for the nomination of candidates to the Board of Directors and stockholder proposals to be considered at stockholder meetings.
A majority of the combined voting power of the outstanding shares entitled to vote generally in the election of Directors may amend MetLife, Inc.’s certificate of incorporation or by-laws. This may allow shareholders to change the Company’s corporate governance and, therefore, make it more difficult for the Board of Directors to protect shareholders’ interests, e.g., if they are presented with an acquisition proposal that undervalues the Company.
MetLife has no unresolved comments from the SEC staff regarding its periodic or current reports under the Exchange Act.
We lease 418,000 rentable square feet in an office building in Manhattan, New York. The term of that lease commenced in February 2008 and continues until April 2029. We have subleased 66,000 rentable square feet of that space to two subtenants, which met our standards of review with respect to creditworthiness. We also lease 595,000 rentable square feet at 200 Park Avenue, New York (the “MetLife Building”) under multiple leases beginning in May 2005 and expiring on various dates through September 2027. This space includes MetLife, Inc.’s boardroom. We have leased 12,000 rentable square feet in the MetLife Building to a subtenant for a term that began July 2016 and extends through December 2019. We have retained rights to existing signage for 20 years with optional renewal periods through 2205. Each of these spaces under lease is occupied by all of our segments, as well as Corporate & Other. The Company began to consolidate its existing New York City area offices to the MetLife Building in December 2016 and expects to complete the consolidation by May 2017. As a result of the consolidation, we are actively marketing the spaces to be vacated for sublease.
We lease 512,000 rentable square feet in Charlotte, North Carolina in two buildings, which are predominantly occupied by the Brighthouse Financial segment, as well as Corporate & Other. We have leased 69,000 rentable square feet in these buildings to subtenants through December 2017. The leases for these two buildings commenced in April 2013 and in November 2014 and both extend through September 2026. We lease 436,000 rentable square feet in two buildings in Cary, North Carolina, which are occupied primarily by Global Technology & Operations, which supports all of our segments, as well as Corporate & Other. The initial lease, commencing in February 2015, was expanded in April 2015, and continues through April 2030.
76
We own eight buildings in the United States that we use in the operation of our business. These buildings contain 1.7 million rentable square feet and are located in the following states: Florida, Illinois, Missouri, New York, Oklahoma and Pennsylvania. Our computer center in Rensselaer, New York is not owned in fee but rather is occupied pursuant to a long-term ground lease. In addition to the aforementioned leases in New York and North Carolina, we have 100 leases in over 90 other locations throughout the United States including our Long Island City, New York, facility. These additional leased facilities consist of 4.3 million rentable square feet. Of these leases, over 35 are occupied as sales offices while the balance of the space is utilized for corporate functions supporting business activities. We also own over 90 properties and lease close to 950 sites in various locations outside the United States. We believe that these properties are suitable and adequate for our current and anticipated business operations.
We arrange for property & casualty coverage on our properties, taking into consideration our risk exposures and the cost and availability of commercial coverages, including deductible loss levels. In connection with the renewal of those coverages, we have arranged $500 million of property insurance, including coverage for terrorism, on our real estate portfolio through May 1, 2017, its renewal date.
See Note
21
of the Notes to the Consolidated Financial Statements.
Not applicable.
77
Issuer Common Equity
MetLife, Inc.’s common stock, par value $0.01 per share, began trading on the New York Stock Exchange (“NYSE”) under the symbol “MET” on April 5, 2000.
The following table presents high and low closing prices for our common stock on the NYSE for the periods indicated:
|
2016
|
|||||||||||||||
|
1st Quarter
|
2nd Quarter
|
3rd Quarter
|
4th Quarter
|
||||||||||||
|
Common Stock Price
|
|||||||||||||||
|
High
|
$
|
47.32
|
|
$
|
46.90
|
|
$
|
44.70
|
|
$
|
57.39
|
|
|||
|
Low
|
$
|
35.21
|
|
$
|
36.53
|
|
$
|
37.85
|
|
$
|
44.37
|
|
|||
|
2015
|
|||||||||||||||
|
1st Quarter
|
2nd Quarter
|
3rd Quarter
|
4th Quarter
|
||||||||||||
|
Common Stock Price
|
|||||||||||||||
|
High
|
$
|
53.91
|
|
$
|
57.70
|
|
$
|
57.70
|
|
$
|
51.69
|
|
|||
|
Low
|
$
|
46.50
|
|
$
|
50.25
|
|
$
|
46.07
|
|
$
|
46.42
|
|
|||
At February 23, 2017, there were 79,510 stockholders of record of our common stock.
The following table presents common stock dividend declaration, record and payment dates, as well as per share and aggregate dividend amounts, for the years ended
December 31, 2016
and
2015
:
|
Dividend
|
||||||||||||
|
Declaration Date
|
Record Date
|
Payment Date
|
Per Share
|
Aggregate
|
||||||||
|
|
(In millions)
|
|||||||||||
|
October 25, 2016
|
November 7, 2016
|
December 13, 2016
|
$
|
0.400
|
|
$
|
441
|
|
||||
|
July 7, 2016
|
August 8, 2016
|
September 13, 2016
|
$
|
0.400
|
|
441
|
|
|||||
|
April 26, 2016
|
May 9, 2016
|
June 13, 2016
|
$
|
0.400
|
|
441
|
|
|||||
|
January 6, 2016
|
February 5, 2016
|
March 14, 2016
|
$
|
0.375
|
|
413
|
|
|||||
|
$
|
1,736
|
|
||||||||||
|
October 27, 2015
|
November 6, 2015
|
December 11, 2015
|
$
|
0.375
|
|
$
|
419
|
|
||||
|
July 7, 2015
|
August 7, 2015
|
September 11, 2015
|
$
|
0.375
|
|
420
|
|
|||||
|
April 28, 2015
|
May 11, 2015
|
June 12, 2015
|
$
|
0.375
|
|
420
|
|
|||||
|
January 6, 2015
|
February 6, 2015
|
March 13, 2015
|
$
|
0.350
|
|
394
|
|
|||||
|
$
|
1,653
|
|
||||||||||
78
The declaration and payment of common stock dividends is subject to the discretion of our Board of Directors, and will depend on MetLife, Inc.’s financial condition, results of operations, cash requirements, future prospects, regulatory restrictions on the payment of dividends by MetLife, Inc.’s insurance subsidiaries and other factors deemed relevant by the Board. The payment of dividends and other distributions by MetLife, Inc. to its security holders may be subject to regulation by the Federal Reserve if MetLife, Inc. is re-designated by the FSOC as a non-bank SIFI. See “Business — Regulation — U.S. Regulation — Potential Regulation as a Non-Bank SIFI.” Furthermore, if additional capital requirements are imposed on MetLife, Inc. as a G-SII, its ability to pay dividends could be reduced by any such additional capital requirements that might be imposed. See “Business — Regulation — International Regulation — Global Systemically Important Insurers.” The payment of dividends is also subject to restrictions under the terms of our preferred stock and junior subordinated debentures in situations where we may be experiencing financial stress. See “Risk Factors — Capital-Related Risks — Legal and Regulatory Restrictions and Uncertainty and Restrictions Under the Terms of Certain of Our Securities May Prevent Us from Repurchasing Our Stock and Paying Dividends at the Level We Wish” and Note
16
of the Notes to the Consolidated Financial Statements. See also “Management’s Discussion and Analysis of Financial Condition and Results of Operations — Liquidity and Capital Resources — The Company — Liquidity and Capital Uses — Dividends” and Note
23
of the Notes to the Consolidated Financial Statements for further information regarding preferred and common stock dividends.
See Item 12 for information about our equity compensation plans.
Issuer Purchases of Equity Securities
Purchases of common stock made by or on behalf of MetLife, Inc. or its affiliates during the quarter ended
December 31, 2016
are set forth below:
|
Period
|
(a) Total Number of Shares Purchased (1)
|
(b) Average Price Paid per Share
|
(c) Total Number of Shares Purchased as Part of Publicly Announced Plans or Programs
|
(d) Maximum Number(or Approximate Dollar Value) of Shares that May Yet Be Purchased Under the Plans or Programs (2)
|
|||||||
|
October 1 - October 31, 2016
|
—
|
|
—
|
|
—
|
|
$0
|
||||
|
November 1 - November 30, 2016
|
1,774,766
|
|
$54.44
|
1,774,227
|
|
$2,903,411,978
|
|||||
|
December 1 - December 31, 2016
|
3,729,653
|
|
$55.21
|
3,728,648
|
|
$2,697,567,522
|
|||||
|
(1)
|
Except for the foregoing, there were no shares of common stock which were repurchased by MetLife, Inc. During the periods October 1 through October 31,
2016
, November 1 through November 30,
2016
, and December 1 through December 31,
2016
, separate account index funds purchased 0 shares, 539 shares and 1,005 shares, respectively, of common stock on the open market in nondiscretionary transactions.
|
|
(2)
|
On November 10, 2016, MetLife, Inc. announced that its Board of Directors authorized $3.0 billion of common stock repurchases. At December 31,
2016
, MetLife, Inc. had
$2.7 billion
of common stock repurchases remaining under the authorization. For more information on common stock repurchases, see “Management’s Discussion and Analysis of Financial Condition and Results of Operations — Liquidity and Capital Resources — The Company — Liquidity and Capital Uses — Common Stock Repurchases,” “Risk Factors — Capital-Related Risks — Legal and Regulatory Restrictions and Uncertainty and Restrictions Under the Terms of Certain of Our Securities May Prevent Us from Repurchasing Our Stock and Paying Dividends at the Level We Wish” and Notes
16
and
23
of the Notes to the Consolidated Financial Statements.
|
Common Stock Performance Graph
The graph and table below compare the total return on our common shares with the total return on the S&P 500, S&P 500 Insurance, and S&P 500 Financials indices, respectively, for the five year period ending on December 31, 2016. The graph and table show the total return on a hypothetical $100 investment in our common shares and in each index, respectively, on December 31, 2011, including the reinvestment of all dividends. The graph and table below shall not be deemed to be “soliciting material” or to be “filed,” or to be incorporated by reference in future filings with the SEC, or to be subject to the liabilities of Section 18 of the Exchange Act, except to the extent that we specifically incorporate it by reference into a document filed under the Securities Act or the Exchange Act.
79
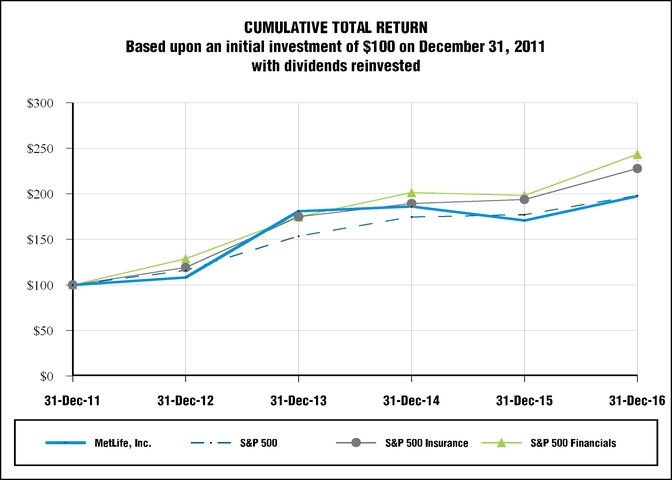
|
As of December 31 of,
|
|||||||||||||||||||||||
|
2011
|
2012
|
2013
|
2014
|
2015
|
2016
|
||||||||||||||||||
|
MetLife, Inc. common stock
|
$
|
100
|
|
$
|
108.00
|
|
$
|
180.83
|
|
$
|
185.97
|
|
$
|
170.60
|
|
$
|
197.41
|
|
|||||
|
S&P 500
|
100
|
|
116.00
|
|
153.57
|
|
174.60
|
|
177.01
|
|
198.18
|
|
|||||||||||
|
S&P 500 Insurance
|
100
|
|
119.09
|
|
174.72
|
|
189.20
|
|
193.60
|
|
227.64
|
|
|||||||||||
|
S&P 500 Financials
|
100
|
|
128.82
|
|
174.71
|
|
201.27
|
|
198.20
|
|
243.38
|
|
|||||||||||
80
The following selected financial data has been derived from the Company’s audited consolidated financial statements. The statement of operations data for the years ended December 31,
2016
,
2015
and
2014
, and the balance sheet data at December 31,
2016
and
2015
have been derived from the Company’s audited consolidated financial statements included elsewhere herein. The statement of operations data for the years ended December 31,
2013
and
2012
, and the balance sheet data at December 31,
2014
,
2013
and
2012
have been derived from the Company’s audited consolidated financial statements not included herein. The selected financial data set forth below should be read in conjunction with “Management’s Discussion and Analysis of Financial Condition and Results of Operations” and the audited consolidated financial statements and related notes included elsewhere herein.
|
Years Ended December 31,
|
||||||||||||||||||||
|
2016
|
2015
|
2014
|
2013
|
2012
|
||||||||||||||||
|
(In millions)
|
||||||||||||||||||||
|
Statement of Operations Data
|
||||||||||||||||||||
|
Revenues
|
||||||||||||||||||||
|
Premiums
|
$
|
39,153
|
|
$
|
38,545
|
|
$
|
39,067
|
|
$
|
37,674
|
|
$
|
37,975
|
|
|||||
|
Universal life and investment-type product policy fees
|
9,206
|
|
9,507
|
|
9,946
|
|
9,451
|
|
8,556
|
|
||||||||||
|
Net investment income
|
19,947
|
|
19,281
|
|
21,153
|
|
22,232
|
|
21,984
|
|
||||||||||
|
Other revenues
|
1,759
|
|
1,983
|
|
2,030
|
|
1,920
|
|
1,906
|
|
||||||||||
|
Net investment gains (losses)
|
171
|
|
597
|
|
(197
|
)
|
161
|
|
(352
|
)
|
||||||||||
|
Net derivative gains (losses)
|
(6,760
|
)
|
38
|
|
1,317
|
|
(3,239
|
)
|
(1,919
|
)
|
||||||||||
|
Total revenues
|
63,476
|
|
69,951
|
|
73,316
|
|
68,199
|
|
68,150
|
|
||||||||||
|
Expenses
|
|
|
||||||||||||||||||
|
Policyholder benefits and claims
|
40,804
|
|
38,714
|
|
39,102
|
|
38,107
|
|
37,987
|
|
||||||||||
|
Interest credited to policyholder account balances
|
6,282
|
|
5,610
|
|
6,943
|
|
8,179
|
|
7,729
|
|
||||||||||
|
Policyholder dividends
|
1,256
|
|
1,388
|
|
1,376
|
|
1,259
|
|
1,369
|
|
||||||||||
|
Goodwill impairment
|
260
|
|
—
|
|
—
|
|
—
|
|
1,868
|
|
||||||||||
|
Other expenses
|
15,069
|
|
16,769
|
|
17,091
|
|
16,602
|
|
17,755
|
|
||||||||||
|
Total expenses
|
63,671
|
|
62,481
|
|
64,512
|
|
64,147
|
|
66,708
|
|
||||||||||
|
Income (loss) from continuing operations before provision for income tax
|
(195
|
)
|
7,470
|
|
8,804
|
|
4,052
|
|
1,442
|
|
||||||||||
|
Provision for income tax expense (benefit)
|
(999
|
)
|
2,148
|
|
2,465
|
|
661
|
|
128
|
|
||||||||||
|
Income (loss) from continuing operations, net of income tax
|
804
|
|
5,322
|
|
6,339
|
|
3,391
|
|
1,314
|
|
||||||||||
|
Income (loss) from discontinued operations, net of income tax
|
—
|
|
—
|
|
(3
|
)
|
2
|
|
48
|
|
||||||||||
|
Net income (loss)
|
804
|
|
5,322
|
|
6,336
|
|
3,393
|
|
1,362
|
|
||||||||||
|
Less: Net income (loss) attributable to noncontrolling interests
|
4
|
|
12
|
|
27
|
|
25
|
|
38
|
|
||||||||||
|
Net income (loss) attributable to MetLife, Inc.
|
800
|
|
5,310
|
|
6,309
|
|
3,368
|
|
1,324
|
|
||||||||||
|
Less: Preferred stock dividends
|
103
|
|
116
|
|
122
|
|
122
|
|
122
|
|
||||||||||
|
Preferred stock repurchase premium
|
—
|
|
42
|
|
—
|
|
—
|
|
—
|
|
||||||||||
|
Net income (loss) available to MetLife, Inc.’s common shareholders
|
$
|
697
|
|
$
|
5,152
|
|
$
|
6,187
|
|
$
|
3,246
|
|
$
|
1,202
|
|
|||||
81
|
Years Ended December 31,
|
||||||||||||||||||||
|
2016
|
2015
|
2014
|
2013
|
2012
|
||||||||||||||||
|
EPS Data (1)
|
||||||||||||||||||||
|
Income (loss) from continuing operations, net of income tax, available to MetLife, Inc.’s common shareholders per common share:
|
||||||||||||||||||||
|
Basic
|
$
|
0.63
|
|
$
|
4.61
|
|
$
|
5.48
|
|
$
|
2.94
|
|
$
|
1.08
|
|
|||||
|
Diluted
|
$
|
0.63
|
|
$
|
4.57
|
|
$
|
5.42
|
|
$
|
2.91
|
|
$
|
1.08
|
|
|||||
|
Income (loss) from discontinued operations, net of income tax, per common share:
|
||||||||||||||||||||
|
Basic
|
$
|
—
|
|
$
|
—
|
|
$
|
—
|
|
$
|
—
|
|
$
|
0.04
|
|
|||||
|
Diluted
|
$
|
—
|
|
$
|
—
|
|
$
|
—
|
|
$
|
—
|
|
$
|
0.04
|
|
|||||
|
Net income (loss) available to MetLife, Inc.’s common shareholders per common share:
|
||||||||||||||||||||
|
Basic
|
$
|
0.63
|
|
$
|
4.61
|
|
$
|
5.48
|
|
$
|
2.94
|
|
$
|
1.12
|
|
|||||
|
Diluted
|
$
|
0.63
|
|
$
|
4.57
|
|
$
|
5.42
|
|
$
|
2.91
|
|
$
|
1.12
|
|
|||||
|
Cash dividends declared per common share
|
$
|
1.575
|
|
$
|
1.475
|
|
$
|
1.325
|
|
$
|
1.010
|
|
$
|
0.740
|
|
|||||
|
December 31,
|
||||||||||||||||||||
|
2016
|
2015
|
2014
|
2013
|
2012
|
||||||||||||||||
|
(In millions)
|
||||||||||||||||||||
|
Balance Sheet Data
|
||||||||||||||||||||
|
Separate account assets
|
$
|
308,620
|
|
$
|
301,598
|
|
$
|
316,994
|
|
$
|
317,201
|
|
$
|
235,393
|
|
|||||
|
Total assets
|
$
|
898,764
|
|
$
|
877,933
|
|
$
|
902,337
|
|
$
|
885,296
|
|
$
|
836,781
|
|
|||||
|
Policyholder liabilities and other policy-related balances (2)
|
$
|
427,231
|
|
$
|
411,359
|
|
$
|
417,141
|
|
$
|
418,487
|
|
$
|
438,191
|
|
|||||
|
Short-term debt
|
$
|
242
|
|
$
|
100
|
|
$
|
100
|
|
$
|
175
|
|
$
|
100
|
|
|||||
|
Long-term debt
|
$
|
16,502
|
|
$
|
18,023
|
|
$
|
16,286
|
|
$
|
18,653
|
|
$
|
19,062
|
|
|||||
|
Collateral financing arrangements
|
$
|
4,071
|
|
$
|
4,139
|
|
$
|
4,196
|
|
$
|
4,196
|
|
$
|
4,196
|
|
|||||
|
Junior subordinated debt securities
|
$
|
3,169
|
|
$
|
3,194
|
|
$
|
3,193
|
|
$
|
3,193
|
|
$
|
3,192
|
|
|||||
|
Separate account liabilities
|
$
|
308,620
|
|
$
|
301,598
|
|
$
|
316,994
|
|
$
|
317,201
|
|
$
|
235,393
|
|
|||||
|
Accumulated other comprehensive income (loss)
|
$
|
5,347
|
|
$
|
4,771
|
|
$
|
10,649
|
|
$
|
5,104
|
|
$
|
11,397
|
|
|||||
|
Total MetLife, Inc.’s stockholders’ equity
|
$
|
67,309
|
|
$
|
67,949
|
|
$
|
72,053
|
|
$
|
61,553
|
|
$
|
64,453
|
|
|||||
|
Noncontrolling interests
|
$
|
171
|
|
$
|
470
|
|
$
|
507
|
|
$
|
543
|
|
$
|
384
|
|
|||||
|
Years Ended December 31,
|
|||||||||||||||
|
2016
|
2015
|
2014
|
2013
|
2012
|
|||||||||||
|
Other Data (3)
|
|||||||||||||||
|
Return on MetLife, Inc.’s common stockholders’ equity
|
1.0
|
%
|
7.5
|
%
|
9.4
|
%
|
5.4
|
%
|
2.0
|
%
|
|||||
__________________
|
(1)
|
For the year ended December 31, 2012, all shares related to the assumed issuance of shares in settlement of the applicable stock purchase contracts relating to previously issued common equity units have been excluded from the calculation of diluted earnings per common share, as these assumed shares are anti-dilutive.
|
|
(2)
|
Policyholder liabilities and other policy-related balances include future policy benefits, policyholder account balances, other policy-related balances, policyholder dividends payable and the policyholder dividend obligation.
|
|
(3)
|
Return on MetLife, Inc.’s common stockholders’ equity is defined as net income (loss) available to MetLife, Inc.’s common shareholders divided by MetLife, Inc.’s average common stockholders’ equity.
|
82
Index to Management’s Discussion and Analysis of Financial Condition and Results of Operations
|
Page
|
|
83
Forward-Looking Statements and Other Financial Information
For purposes of this discussion, “MetLife,” the “Company,” “we,” “our” and “us” refer to MetLife, Inc., a Delaware corporation incorporated in 1999, its subsidiaries and affiliates. Following this summary is a discussion addressing the consolidated results of operations and financial condition of the Company for the periods indicated. This discussion should be read in conjunction with “Note Regarding Forward-Looking Statements,” “Risk Factors,” “Selected Financial Data,” “Quantitative and Qualitative Disclosures About Market Risk” and the Company’s consolidated financial statements included elsewhere herein.
This Management’s Discussion and Analysis of Financial Condition and Results of Operations may contain or incorporate by reference information that includes or is based upon forward-looking statements within the meaning of the Private Securities Litigation Reform Act of 1995. Forward-looking statements give expectations or forecasts of future events. These statements can be identified by the fact that they do not relate strictly to historical or current facts. They use words such as “anticipate,” “estimate,” “expect,” “project,” “intend,” “plan,” “believe” and other words and terms of similar meaning, or are tied to future periods, in connection with a discussion of future operating or financial performance. In particular, these include statements relating to future actions, prospective services or products, future performance or results of current and anticipated services or products, sales efforts, expenses, the outcome of contingencies such as legal proceedings, trends in operations and financial results. Any or all forward-looking statements may turn out to be wrong. Actual results could differ materially from those expressed or implied in the forward-looking statements. See “Note Regarding Forward-Looking Statements.”
This Management’s Discussion and Analysis of Financial Condition and Results of Operations includes references to our performance measures, operating earnings and operating earnings available to common shareholders, that are not based on GAAP. These measures are used by management to evaluate performance and allocate resources. Consistent with GAAP guidance for segment reporting, operating earnings is also our GAAP measure of segment performance. Operating earnings and other financial measures based on operating earnings are also the measures by which senior management’s and many other employees’ performance is evaluated for the purposes of determining their compensation under applicable compensation plans.
Operating earnings and other financial measures based on operating earnings allow analysis of our performance relative to our business plan and facilitate comparisons to industry results.
Forward-looking guidance provided on a non-GAAP basis cannot be reconciled to the most directly comparable GAAP measures on a forward-looking basis because net income may fluctuate significantly if net investment gains and losses and net derivative gains and losses move outside of estimated ranges. See “
—
Non-GAAP and Other Financial Disclosures” for definitions and a discussion of these measures, and “
—
Results of Operations” for reconciliations of historical non-GAAP financial measures to the most directly comparable GAAP measures.
84
Executive Summary
Overview
MetLife is a global provider of life insurance, annuities, employee benefits and asset management. MetLife is organized into six segments: U.S.; Asia; Latin America; EMEA, MetLife Holdings; and Brighthouse Financial. In addition, the Company reports certain of its results of operations in Corporate & Other. See “
—
Other Key Information,” “Business
—
Segments and Corporate & Other” and
Note 2
of the Notes to the Consolidated Financial Statements for further information on the Company’s segments and Corporate & Other.
Management continues to evaluate the Company’s segment performance and allocated resources and may adjust related measurements in the future to better reflect segment profitability.
Current Year Highlights
During the year ended December 31, 2016, overall sales increased slightly as compared to the year ended December 31, 2015, reflecting an increase in sales of our Retirement and Income Solutions products, offset by declines in our life and annuity products. We experienced a significant amount of derivative losses in 2016, primarily as a result of our annual actuarial assumption review. A
symmetrical and non-economic accounting also resulted from derivative losses on non-qualifying hedges, driven by
changes in interest rates, foreign currencies and equity markets
.
In addition, while positive net flows drove an increase in our investment portfolio, yields declined as a result of
low interest rates, volatile equity markets, and foreign currency fluctuations
. Our results for 2016 also reflect
a write-off of DAC and an increase in our insurance-related liabilities due to loss recognition testing upon re-segmentation, unfavorable reserve adjustments resulting from modeling improvements in the reserving process, and charges related to goodwill impairment
.
The following represents segment level results and percentage contributions to total segment level operating earnings for the year ended December 31, 2016:
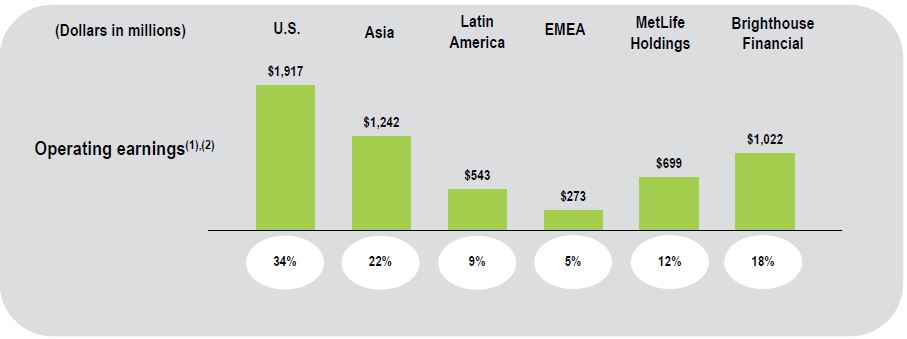
_______________
(1) Excludes Corporate & Other.
(2)
Consistent with GAAP guidance for segment reporting, operating earnings is our GAAP measure of segment performance.
See “— Non-GAAP and Other Financial Disclosures.”
85
Year Ended December 31,
2016
Compared with the Year Ended December 31,
2015
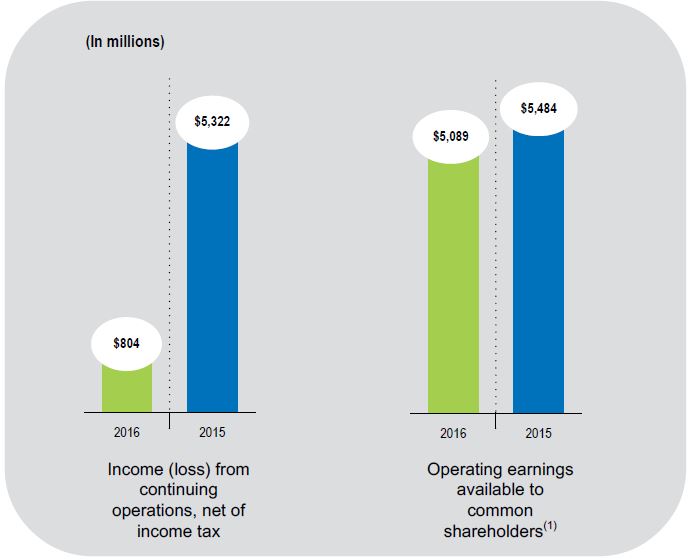
|
Consolidated Results – Highlights
|
|||
|
Income (loss) from continuing operations, net of income tax, down $4.5 billion:
|
||||
|
•
|
Unfavorable change in net derivative gains (losses) of $6.8 billion ($4.4 billion, net of income tax) primarily driven by the impact of the annual actuarial assumption review on certain variable annuity products that contain embedded derivatives. Asymmetrical and non-economic accounting also resulted from derivative losses on non-qualifying hedges, driven by changes in interest rates, foreign currencies and equity markets.
|
|||
|
•
|
Unfavorable change in net investment gains (losses) of $426 million ($277 million, net of income tax)
|
|||
|
•
|
Operating earnings available to common shareholders down $395 million
|
|||
|
•
|
Goodwill impairment charges of $260 million ($223 million, net of income tax)
|
|||
|
•
|
Results for 2016 include the financial impact of converting the Company’s Japan operations to calendar year-end reporting without retrospective application of this change to prior years
|
|||
|
(1) See “— Results of Operations — Consolidated Results” and “— Non-GAAP and Other Financial Disclosures” for reconciliations and definitions of non-GAAP financial measures.
|
||||
|
Consolidated Results - Operating Highlights
|
||||
|
Operating earnings available to common shareholders down $395 million:
|
||||
|
•
|
Results of operations impacted by: (i) lower investment yields; (ii) refinements made to DAC and certain insurance-related liabilities; (iii) unfavorable underwriting; (iv) the impact of our annual actuarial assumption review; (v) lower asset-based fee income; (vi) lower tax and related interest expenses; and (vii) higher net investment income from portfolio growth
.
|
|||
|
•
|
Our 2016 results included the following:
|
|||
|
•
|
a $340 million, net of income tax, charge from the re-segmentation of our business, driven by the Brighthouse Financial segment’s variable and universal life policies. Of this amount, the Company recorded $254 million, net of income tax, as a charge in the third quarter of 2016, which was mostly recognized as a write-off of DAC, with the remaining $86 million, net of income tax,
recognized as an increase in insurance-related liabilities over the third and fourth quarters of 2016.
|
|||
|
•
|
unfavorable reserve adjustments of $257 million, net of income tax, resulting from modeling improvements in the reserving process
|
|||
|
•
|
unfavorable DAC unlockings of $161 million, net of income tax, related to our annual actuarial assumption review of our U.S. variable annuity business
|
|||
|
•
|
a $44 million, net of income tax, charge related to an adjustment to reinsurance receivables in Australia
|
|||
|
•
|
tax benefit of $25 million related to a change in tax rate in Japan, which includes a benefit of $20 million that pertains to prior periods
|
|||
|
•
|
tax charge in Chile of $12 million as a result of tax reform legislation, which includes a charge of $10 million that pertains to prior periods
|
|||
|
•
|
Our 2015 results included the following:
|
|||
|
•
|
a $557 million tax charge and a $362 million ($235 million, net of income tax) charge for interest on uncertain tax positions that were recorded under accounting guidance for the recognition of tax uncertainties related to the U.S. tax treatment of taxes paid by a wholly-owned U.K. investment subsidiary of MLIC
|
|||
|
•
|
$183 million of tax benefits related to (i) restructuring in Chile; (ii) a change in tax rate in Japan; (iii) the repatriation of earnings from Japan; and (iv) the devaluation of the peso in Argentina
|
|||
86
For a more in-depth discussion of our consolidated results, see “— Results of Operations — Consolidated Results” and “— Results of Operations — Consolidated Results — Operating.”
Year Ended December 31,
2015
Compared with the Year Ended December 31,
2014
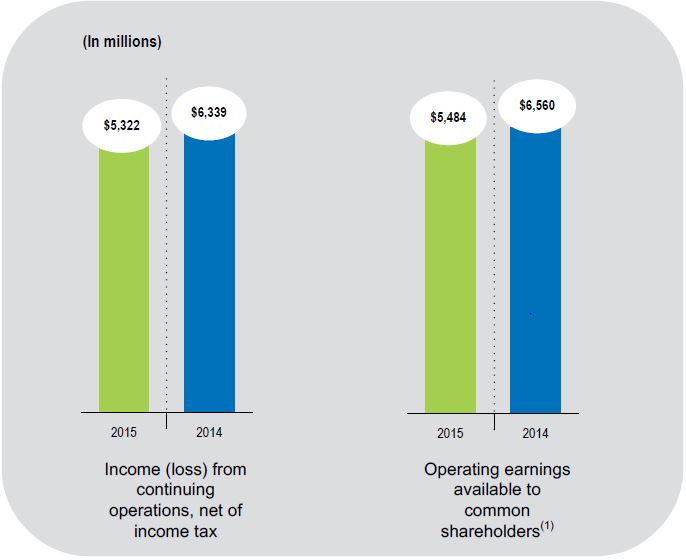
|
Consolidated Results - Highlights
|
||||
|
Income (loss) from continuing operations, net of income tax, down $1.0 billion:
|
|||||
|
•
|
Operating earnings available to common shareholders down $1.1 billion
|
||||
|
•
|
Net derivative gains (losses) unfavorable change of $1.3 billion ($831 million, net of income tax) driven by unfavorable changes in market and other risks in embedded derivatives, as well as changes in interest rates
|
||||
|
•
|
Net investment gains (losses) favorable change of $794 million ($516 million, net of income tax) primarily driven by a 2014 loss on the disposition of MetLife Assurance Limited (“MAL”)
|
||||
|
•
|
Includes a tax benefit in Japan of $174 million in 2015
|
||||
|
(1) See “— Results of Operations — Consolidated Results” and “— Non-GAAP and Other Financial Disclosures” for reconciliations and definitions of non-GAAP financial measures.
|
|||||
|
Consolidated Results - Operating Highlights
|
|||||
|
Operating earnings available to common shareholders down $1.1 billion:
|
|||||
|
•
|
Results of operations impacted by: (i) lower investment yields; (ii) less favorable underwriting; (iii) unfavorable impact from annual reviews of assumptions; (iv) higher net investment income from portfolio growth; and (v) additional items described below.
|
||||
|
•
|
Our 2015 results also included the following:
|
||||
|
•
|
$557 million tax charge and a $362 million ($235 million, net of income tax) charge for interest on uncertain tax positions r
ecorded under accounting guidance for the recognition of tax uncertainties related to the U.S. tax treatment of taxes paid by a wholly-owned U.K. investment subsidiary of MLIC
|
||||
|
•
|
$183 million of tax benefits related to (i) restructuring in Chile; (ii) a change in tax rate in Japan; (iii) the repatriation of earnings from Japan; and (iv) the devaluation of the peso in Argentina
|
||||
|
•
|
Our 2014 results also included the following:
|
||||
|
•
|
$104 million, net of income tax, of favorable reserve adjustments related to disability premium waivers in the life businesses in our MetLife Holdings and Brighthouse Financial segments
|
||||
|
•
|
$117 million, net of income tax, increase in the litigation reserve related to asbestos
|
||||
|
•
|
Charge of $57 million, net of income tax, related to delayed settlement interest on unclaimed funds held by state governments in the life business
|
||||
|
•
|
Charges totaling $57 million, net of income tax, related to a settlement of a licensing matter with the NYDFS and the District Attorney, New York County
|
||||
|
•
|
Net tax charge of $9 million related to: (i) charge related to a tax reform bill in Chile; and (ii) benefit related to the filing of the Company’s U.S. federal tax return
|
||||
For a more in-depth discussion of our consolidated results, see “— Results of Operations — Consolidated Results” and “— Results of Operations — Consolidated Results — Operating.”
87
Consolidated Company Outlook
The proposed Separation and the completion of our U.S Retail Advisor Force Divestiture evidence our commitment to Accelerating Value and our refreshed enterprise strategy, the center of which is still One MetLife. Digital and simplified are the key enablers of our strategic initiatives which include (i) optimizing value and risk by prioritizing businesses with high internal rates of return, lower capital intensity, and maximum cash generation, (ii) driving operational excellence, by becoming a high-performance operating company with a competitive cost structure, (iii) transforming our distribution channels to drive efficiency and productivity through digital enablement and improved customer persistency, and (iv) undertaking a targeted approach to find the right solutions for the right customers through the commitment to creating differentiated customer value propositions. This new enterprise strategy will enhance our ability to focus on the right markets, build clear differentiators, and continue to make the right investments to deliver shareholder value.
In 2017, we will focus on executing the Separation and making critical investments to drive efficiency. While this will put downward pressure on operating earnings in 2017, we expect post-Separation MetLife operating earnings to grow in 2018 driven by both business growth and expense discipline. Following the Separation, MetLife will also be significantly less sensitive to interest rates. Notably, the Separation will also make MetLife a more globally diversified company; we expect MetLife will generate over 40% of its operating earnings from outside the United States and that percentage should continue to grow over time.
We have engaged and expect to continue to engage in a number of Separation-related transactions that will impact our holding companies’ liquid assets.
In 2016, we incurred
$2.3 billion
of Separation-related items which reduced our holding companies’ liquid assets, as well as our free cash flow. These Separation-related items consisted of Separation-related outflows comprised of an incremental capital contribution to MetLife USA, capital contributions to Brighthouse subsidiaries and Separation-related costs, forgone subsidiary dividends from MetLife USA and forgone incremental debt at MetLife, Inc., net of Separation-related inflows comprised of incremental subsidiary dividends from NELICO and MetLife USA. However
, we have increased and expect to continue to increase our holding companies’ liquid assets over time as a result of (i) $291 million in cash proceeds that we received in 2016 from the U.S. Retail Advisor Force Divestiture; (ii) dividends in the range of $3.3 billion to $3.8 billion that we expect to receive in 2017 from Brighthouse (which may be partially funded by the issuance of debt by Brighthouse) and a MetLife-affiliated reinsurance company prior to the Separation; and (iii) proceeds from the disposition of our retained shares of Brighthouse common stock that we expect to receive over time. In addition to these Separation-related items, we expect to have cash commitments of between $1.0 billion and $2.0 billion over the two-year period of 2017 and 2018 relating to liability management transactions, including the repayment of certain debt maturities. Following the Separation, we plan to maintain a liquidity buffer of $3.0 to $4.0 billion of liquid assets at the holding companies. See “Risk Factors
—
Risks Related to Acquisitions, Dispositions or Other Structural Changes
—
We May Not Complete the Separation of Brighthouse Financial on the Terms or Timeline Currently Contemplated, if at All” and “Risk Factors
—
Capital-Related Risks
—
Legal and Regulatory Restrictions and Uncertainty and Restrictions Under the Terms of Certain of Our Securities May Prevent Us from Repurchasing Our Stock and Paying Dividends at the Level We Wish.”
Assuming interest rates follow the observable forward yield curves as of December 31, 2016, we expect the average ratio of free cash flow to operating earnings over the two-year period of 2017 and 2018, excluding the impact of the Separation, to be 65% to 75%. This expectation reflects our unit cost improvement program and the related initiative to invest $1 billion by 2020 to generate $800 million pre-tax run rate annual savings, net of stranded overhead. We believe that free cash flow is a key determinant of dividends and share repurchases.
When making these and other projections, we must rely on the accuracy of our assumptions about future economic and business conditions, which can be affected by known and unknown risks and other uncertainties. Our assumptions have been and will continue to be impacted by (i) MetLife, Inc.’s plan to pursue the Separation, (ii) regulatory uncertainty regarding capital requirements that would have been applicable to MetLife, Inc. as a result of the FSOC’s former designation of MetLife, Inc. as a non-bank SIFI, which, among other things, impacted the level of our share repurchases, (iii) lower investment margins (primarily in the United States) as a result of the sustained low interest rate environment, (iv) lower than anticipated merger and acquisition activity, and (v) the effect on our foreign operations of the strengthening of the U.S. dollar. See “— Other Key Information — Significant Events” for information regarding the Separation, U.S. Retail Advisor Force Divestiture, and the status of court proceedings relating to MetLife, Inc.’s challenge to the FSOC’s former designation of it as a non-bank SIFI.
88
Other Key Information
Basis of Presentation
Prior to January 1, 2016, certain international subsidiaries had a fiscal year cutoff of November 30th. Accordingly, the Company’s consolidated financial statements reflect the assets and liabilities of such subsidiaries as of November 30, 2015 and the operating results of such subsidiaries for the years ended November 30, 2015 and 2014. Effective January 1, 2016, the Company converted its Japan operations to calendar year-end reporting. The elimination of a one-month reporting lag of a subsidiary is considered a change in accounting principle and requires retrospective application. While the Company believes that eliminating the lag in the reporting of its Japan operations was preferable in order to consistently reflect events, economic conditions and global trends on the financial statements, the Company determined that it was impracticable to apply the effects of the lag elimination to financial reporting periods prior to January 1, 2015. The effect of not retroactively applying this change in accounting, however, was not material to the 2015 or 2016 consolidated financial statements. Therefore, the Company reported the cumulative effect of the change in accounting principle in net income for the year ended December 31, 2016 and did not retrospectively apply the effects of this change to prior periods. See
Note 2
of the Notes to the Consolidated Financial Statements.
Segment Information
Based on the proposed Separation, in the third quarter of 2016, the Company reorganized its businesses. This re-segmentation resulted in a $340 million, net of income tax, charge to earnings in 2016, all in the Brighthouse Financial segment, driven by the segment’s variable and universal life products. This charge is the direct result of the Company, beginning in the third quarter, no longer being able to aggregate, for loss recognition testing, the variable and universal life products of the Brighthouse Financial segment with the variable and universal life products remaining in the MetLife Holdings segment. Of this amount, the Company recorded $254 million, net of income tax, as a charge in the third quarter of 2016, which was mostly recognized as a write-off of DAC, with the remaining $86 million, net of income tax, recognized as an increase in insurance-related liabilities over the third and fourth quarters of 2016. We expect the ongoing impact to the Brighthouse Financial segment from the loss of the aggregation benefit to be approximately $40 million, net of income tax, per quarter, which began in the third quarter of 2016, gradually declining over time.
Significant Events
On January 12, 2016, MetLife, Inc. announced its plan to pursue the Separation. Additionally, on July 21, 2016, MetLife, Inc. announced that following the Separation, the separated business will be rebranded as “Brighthouse Financial.” On October 5, 2016, Brighthouse Financial, Inc., a subsidiary of MetLife, Inc. (“Brighthouse”), filed a registration statement on Form 10 (the “Form 10”) with the SEC. On December 6, 2016, Brighthouse filed an amendment to its registration statement on Form 10 with the SEC. The information statement filed as an exhibit to the Form 10 disclosed that the Company intends to include MetLife USA, NELICO, FMLI, MetLife Advisers, LLC and certain captive reinsurance companies in the proposed separated business and distribute at least 80.1% of the shares of Brighthouse’s common stock on a
pro rata
basis to the holders of MetLife, Inc. common stock. The ultimate form and timing of the Separation will be influenced by a number of factors, including regulatory considerations and economic conditions. MetLife continues to evaluate and pursue structural alternatives for the proposed Separation. MetLife expects that the life insurance closed block and the life and annuity business sold through MLIC will not be a part of Brighthouse Financial. The Separation remains subject to certain conditions including, among others, obtaining final approval from the MetLife, Inc. Board of Directors, receipt of a favorable ruling from the IRS and an opinion from MetLife’s tax advisor regarding certain U.S. federal income tax matters, insurance and other regulatory approvals, and an SEC declaration of the effectiveness of the Form 10.
In July 2016, MetLife, Inc. completed the U.S. Retail Advisor Force Divestiture for $291 million. MassMutual assumed all of the liabilities related to such assets that arise or occur at or after the closing of the sale. As part of the transactions, MetLife, Inc. and MassMutual entered into a product development agreement under which MetLife’s U.S. retail business will be the exclusive developer of certain annuity products to be issued by MassMutual. In the MassMutual purchase agreement, MetLife, Inc. agreed to indemnify MassMutual for certain claims, liabilities and breaches of representations and warranties up to limits described in the purchase agreement. See
Note 3
of the Notes to the Consolidated Financial Statements for further information.
89
On December 18, 2014, the FSOC designated MetLife, Inc. as a non-bank SIFI subject to regulation by the Federal Reserve and the FDIC, as well as to enhanced supervision and prudential standards. On March 30, 2016, the D.C. District Court ordered that the designation of MetLife, Inc. as a non-bank SIFI by the FSOC be rescinded. On April 8, 2016, the FSOC appealed the D.C. District Court’s order to the United States Court of Appeals for the District of Columbia, and oral argument was heard on October 24, 2016. If the FSOC prevails on appeal or designates MetLife, Inc. as systemically important as part of its ongoing review of non-bank financial companies, MetLife, Inc. could once again be subject to regulation as a non-bank SIFI. See “Business — Regulation — U.S. Regulation — Potential Regulation as a Non-Bank SIFI.”
Industry Trends
We continue to be impacted by the unstable global financial and economic environment that has been affecting the industry.
Financial and Economic Environment
Our business and results of operations are materially affected by conditions in the global capital markets and the economy generally. Stressed conditions, volatility and disruptions in global capital markets, particular markets, or financial asset classes can have an adverse effect on us, in part because we have a large investment portfolio and our insurance liabilities and derivatives are sensitive to changing market factors. See “Risk Factors — Economic Environment and Capital Markets-Related Risks — We Are Exposed to Significant Global Financial and Capital Markets Risks Which May Adversely Affect Our Results of Operations, Financial Condition and Liquidity, and May Cause Our Net Investment Income to Vary from Period to Period.” The impact on global capital markets and the economy generally of the transition occurring in the United States government and the priorities of the Trump Administration is uncertain. See “Risk Factors — Economic Environment and Capital Markets-Related Risks — If Difficult Conditions in the Global Capital Markets and the Economy Generally Persist, They May Materially Adversely Affect Our Business and Results of Operations.”
We have market presence in numerous countries and increased exposure to risks posed by local and regional economic conditions. See “Risk Factors — Risks Related to Our Business — Our International Operations Face Political, Legal, Operational and Other Risks, Including Exposure to Local and Regional Economic Conditions, That Could Negatively Affect Those Operations or Our Profitability.” Concerns about the political and/or economic stability in the U.K., Italy, Mexico, Turkey and Puerto Rico have recently contributed to global market volatility. See “— Investments — Current Environment — Selected Country Investments.” Events following the U.K.’s referendum on June 23, 2016 and the uncertainties, including foreign currency exchange risks, associated with its pending withdrawal from the EU, have also contributed to market volatility, both in the U.S. and beyond.
These factors could contribute to weakening GDP growth, primarily in the U.K. and Europe. The magnitude and longevity of the potential negative economic impacts would depend on the detailed agreements reached by the U.K. and the EU as a result of the exit negotiations and negotiations regarding trade and other arrangements.
Central banks around the world have used monetary policy to combat global market volatility. For example, the European Central Bank continues to institute support measures, including quantitative easing, to lessen the risk of deflation, lower borrowing costs in the Euro zone and encourage corporations to issue more asset-backed securities. These measures, however, could affect the Euro exchange rate and have uncertain impacts on interest rates and risk markets. In Japan, the Japanese government and the Bank of Japan have implemented a coordinated strategy which includes the imposition of a negative rate on commercial bank deposits, continued government bond purchases and tax reform, including the lowering of the Japanese corporate tax rate and the delay until 2019 of an increase in the consumption tax to 10%. Going forward, Japan’s structural and demographic challenges may continue to limit its potential growth unless reforms that boost productivity are put into place. Japan’s high public sector debt levels are mitigated by low refinancing risks and its nominal yields on government debt have remained at a lower level than that of any other developed country. However, frequent changes in government have prevented policy makers from implementing fiscal reform measures to put public finances on a sustainable path.
For information regarding actions taken by the Federal Reserve Board’s Federal Open Market Committee (“FOMC”) in the United States, see “
—
Impact of a Sustained Low Interest Rate Environment.”
Impact of a Sustained Low Interest Rate Environment
As a global insurance company, we are affected by the monetary policy of central banks around the world, as well as the monetary policy of the Federal Reserve Board in the United States. The Federal Reserve Board has taken a number of actions in recent years to spur economic activity, including asset purchases and keeping interest rates low. However, in December 2015, the FOMC increased the federal funds rate for the first time in 10 years and raised it again at the December 2016 meeting. Further increases in the federal funds rate in the future may affect interest rates and risk markets in the U.S. and other developed and emerging economies. However, we cannot predict with certainty the effect of these programs and policies on interest rates or the impact on the pricing levels of risk-bearing investments at this time. See “— Investments — Current Environment.”
90
During periods of declining interest rates, we may have to invest insurance cash flows and reinvest the cash flows we received as interest or return of principal on our investments in lower yielding instruments. Moreover, borrowers may prepay or redeem the fixed income securities, mortgage loans and mortgage-backed securities in our investment portfolio with greater frequency in order to borrow at lower market rates. Therefore, some of our products expose us to the risk that a reduction in interest rates will reduce the difference between the amounts that we are required to credit on contracts in our general account and the rate of return we are able to earn on investments intended to support obligations under these contracts. This difference between interest earned and interest credited, or margin, is a key metric for the management of, and reporting for, many of our businesses.
Our expectations regarding future margins are an important component impacting the amortization of certain intangible assets such as DAC and VOBA. Significantly lower margins may cause us to accelerate the amortization, thereby reducing net income in the affected reporting period. Additionally, lower margins may also impact the recoverability of intangible assets such as goodwill, require the establishment of additional liabilities or trigger loss recognition events on certain policyholder liabilities. We review this long-term margin assumption, along with other assumptions, as part of our annual actuarial assumption review.
Mitigating Actions
The Company continues to be proactive in its investment and interest crediting rate strategies, as well as its product design and product mix. To mitigate the risk of unfavorable consequences from the low interest rate environment in the U.S., the Company applies disciplined asset/liability management (“ALM”) strategies, including the use of interest rate derivatives. In some cases, the Company has entered into offsetting positions as part of its overall ALM strategy and to reduce volatility in net income. Lowering interest crediting rates on some products, or adjusting the dividend scale on traditional products, can help offset decreases in investment margins on some products. Our ability to lower interest crediting rates could be limited by competition, requirements to obtain regulatory approval, or contractual guarantees of minimum rates and may not match the timing or magnitude of changes in asset yields. As a result, our margins could decrease or potentially become negative. We are able to limit or close certain products to new sales in order to manage exposures. Business actions, such as shifting the sales focus to less interest rate sensitive products, can also mitigate this risk. In addition, the Company is well diversified across product, distribution, and geography. Certain of our non-U.S. businesses, reported within our Latin America, EMEA, and Asia (exclusive of our Japan business) segments, which accounted for approximately 19% of our operating earnings in 2016, are not significantly interest rate or market sensitive; in particular, they do not have any direct sensitivity to U.S. interest rates. The Company’s primary exposure within these segments is insurance risk. We expect our non-U.S. businesses to grow faster than our U.S. businesses and, over time, to become a larger percentage of our total business. As a result of the foregoing, the Company expects to be able to substantially mitigate the negative impact of a sustained low interest rate environment in the U.S. on the Company’s profitability. Based on a near to intermediate term analysis of a sustained lower interest rate environment in the U.S., the Company anticipates operating earnings will continue to increase, although at a slower growth rate.
Low Interest Rate Scenario
In formulating economic assumptions for its insurance contract assumptions, the Company uses projections that it makes regarding interest rates. Included in these assumptions is the projection that the 10-year Treasury rate will rise from 2.45% at December 31, 2016 to 4.25% in 10 years, by 2026 and that 10-year yields will reach 2.73%, 2.93% and 3.08% by December 31, 2017, 2018 and 2019, respectively. Also included is the projection that the three-month LIBOR rate will move from 1.00% at December 31, 2016 to 1.55%, 1.95% and 2.22% by December 31, 2017, 2018 and 2019, respectively. The low interest rate scenario reflects an assumed constant 10-year Treasury rate of 1.50% and a constant three-month LIBOR rate of 0.65%, with the corresponding consensus of interest rate views and credit spreads (the “Low Interest Rate Scenario”).
The following summarizes the impact of the Low Interest Rate Scenario on our U.S. dollar and non-U.S. dollar denominated positions. In addition, we have included disclosure on the potential impact on 2017, 2018 and
2019
net income using the same Low Interest Rate Scenario on the mark-to-market of derivative positions that do not qualify as accounting hedges.
91
Below is a summary of the rates we used for the Low Interest Rate Scenario versus our business plan through 2019. These rates represent the most relevant short-term and long-term rates for our business plan.
|
Years Ended December 31,
|
|||||||||||||||
|
2016
|
2017
|
2018
|
2019
|
||||||||||||
|
Low Interest Rate Scenario
|
Business Plan
|
Low Interest Rate Scenario
|
Business Plan
|
Low Interest Rate Scenario
|
Business Plan
|
Low Interest Rate Scenario
|
Business Plan
|
||||||||
|
Three-month LIBOR
|
0.65%
|
1.00%
|
0.65%
|
1.55%
|
0.65%
|
1.95%
|
0.65%
|
2.22%
|
|||||||
|
10-year U.S. Treasury
|
1.50%
|
2.45%
|
1.50%
|
2.73%
|
1.50%
|
2.93%
|
1.50%
|
3.08%
|
|||||||
The Low Interest Rate Scenario assumes three-month LIBOR to be 0.65% and the 10-year U.S. Treasury rate to be 1.50% at December 31,
2016
and remain constant at those levels until December 31,
2019
. We make similar assumptions for interest rates at other maturities, and hold this interest rate curve constant through December 31,
2019
. In addition, in the Low Interest Rate Scenario, we assume credit spreads remain constant from December
2016
through the end of
2019
as compared to our business plan which assumes rising credit spreads through
2017
and thereafter remaining constant through the end of
2019
. Further, we also include the impact of low interest rates on our pension and postretirement plan expenses. We allocate this impact across our segments and it is included in the segment discussion below. The discount rate used to value these plans is tied to high quality corporate bond yields. Accordingly, an extended low interest rate environment will result in increased pension and other postretirement benefit liabilities.
However, these liabilities are offset by corresponding returns on the fixed income portfolio of pension and other postretirement benefit plan assets resulting in an overall decrease in expense.
Hypothetical Impact to Operating Earnings
Based on the above assumptions, we estimate an unfavorable combined long-term and short-term interest rate impact on our consolidated operating earnings from the Low Interest Rate Scenario of approximately $65 million in
2017
, $120 million in
2018
and $210 million in
2019
. Under the Low Interest Rate Scenario, our long-term businesses are negatively impacted by the larger gap between new money yields and the yield on assets rolling off the portfolio. However, there are positive offsets under the Low Interest Rate Scenario as short-term rates are much lower than the business plan rates and the yield curve is steeper than that of the business plan. For example, our securities lending business performs better than our business plan because it is driven by the slope of the yield curve rather than by the level of interest rates. In addition, derivative income is higher primarily due to our receiver swaps where we receive a fixed rate and pay a floating rate.
Hypothetical Impact to Our Mark-to-Market Derivative Positions
In addition to its impact on operating earnings, we estimated the effect of the Low Interest Rate Scenario on the mark-to-market of our derivative positions that do not qualify as accounting hedges. We applied the Low Interest Rate Scenario to these derivatives and compared the impact to that from interest rates in our business plan. We hold a significant position in long-duration receive-fixed interest rate swaps to hedge reinvestment risk. These swaps are most sensitive to the 30-year and 10-year swap rates and we recognize gains as rates drop and recognize losses as rates rise. This estimated impact on the derivative mark-to-market does not include that of our VA program derivatives as the impact of low interest rates in the freestanding derivatives would be largely offset by the mark-to-market in net derivative gains (losses) for the related embedded derivative.
Based on these additional assumptions, we estimate the combined long-term and short-term interest rate impact of the Low Interest Rate Scenario on the mark-to-market of our derivative positions that do not qualify as accounting hedges to be an increase in net income of $140 million in 2017, $145 million in
2018
and $80 million in
2019
. See “— Results of Operations — Consolidated Results” for information regarding our actual gains and losses on the Company’s non-VA program derivatives due to interest rate changes which are included in net income.
Segments and Corporate & Other
The following discussion summarizes the impact of the above Low Interest Rate Scenario on the operating earnings of our segments, as well as Corporate & Other. See also “— Policyholder Liabilities — Policyholder Account Balances” for information regarding the account values subject to minimum guaranteed crediting rates.
92
U.S.
Group Benefits
In general, most of our group life insurance products in the U.S. segment are renewable term insurance and, therefore, have significant repricing flexibility. Interest rate risk arises mainly from minimum interest rate guarantees on retained asset accounts. These accounts have minimum interest crediting rate guarantees which range from 0.5% to 3.0%. All of these account balances are currently at their respective minimum interest crediting rates and we would expect to experience margin compression as we reinvest at lower interest rates. We have used interest rate derivatives to partially mitigate the risks of a sustained U.S. low interest rate environment. We also have exposure to interest rate risk in this business arising from our disability policy claim reserves. For these products, lower reinvestment rates cannot be offset by a reduction in liability crediting rates for established claim reserves. Group disability policies are generally renewable term policies. Rates may be adjusted on in-force policies at renewal based on the retrospective experience rating and current interest rate assumptions.
We estimate a favorable combined long-term and short-term interest rate impact on the operating earnings of our Group Benefits business from the Low Interest Rate Scenario of $5 million, $15 million and $20 million in
2017
,
2018
and
2019
, respectively.
Retirement and Income Solutions
Retirement and Income Solutions contains both short and long-duration products consisting of capital market products, pension risk transfers, structured settlements, and other benefit funding products. The majority of short- duration products are managed on a floating rate basis, which mitigates the impact of the low interest rate environment in the U.S. The long-duration products have very predictable cash flows and we have matched these cash flows through our ALM strategies. We also use interest rate swaps to help protect income in this segment against a low interest rate environment in the U.S. Based on the cash flow estimates, only a small component is subject to reinvestment risk. Reinvestment risk is defined for this purpose as the amount of reinvestment in
2017
,
2018
and
2019
that would impact operating earnings due to reinvesting cash flows in the Low Interest Rate Scenario. For the long-duration business, $0.1 billion of the asset base in
2017
will be subject to reinvestment risk on an average asset base of $52.4 billion. In
2018
and
2019
, none of the asset base will be subject to reinvestment risk on an average asset base of $54.0 billion and $54.7 billion, respectively.
We estimate an unfavorable combined long-term and short-term interest rate impact on operating earnings on our Retirement and Income Solutions business from the Low Interest Rate Scenario of $35 million, $65 million and $35 million in
2017
,
2018
and
2019
, respectively.
Property & Casualty
The product portfolio within Property & Casualty is primarily made up of six-month and annual term renewable policies, which allow for significant re-pricing flexibility with no policyholder benefits tied to interest rates. As a result, the interest rate risk for the Property & Casualty business is minimal, tied only to our portfolio reinvestment rates and our ability to offset the change of those rates through re-pricing efforts.
We estimate a combined long-term and short-term interest rate impact on operating earnings on our Property and Casualty business from the Low Interest Rate Scenario not to be material in 2017, and an unfavorable impact of $5 million and $10 million in 2018 and 2019, respectively.
Asia
Our Japan business offers traditional life insurance and accident & health products. To the extent the Japan life insurance portfolio is U.S. interest rate and LIBOR sensitive and we are unable to lower crediting rates to the customer, operating earnings will decline. We manage interest rate risk on our life products through a combination of product design features and ALM strategies.
We sell annuities in Japan which are predominantly single premium products with crediting rates set at the time of issue. This allows us to tightly manage product ALM, cash flows and net spreads, thus maintaining profitability.
We estimate an unfavorable combined long-term and short-term interest rate impact on the operating earnings of our Asia segment from the Low Interest Rate Scenario of $25 million, $65 million and $120 million in
2017
,
2018
and
2019
, respectively.
93
MetLife Holdings
Our interest rate sensitive life products include traditional and universal life products. Because the majority of our traditional life insurance business is participating, we can largely offset lower investment returns on assets backing our traditional life products through adjustments to the applicable dividend scale. In our universal life products, we manage interest rate risk through a combination of product design features and ALM strategies, including the use of interest rate derivative hedges. While we have the ability to lower crediting rates on certain in-force universal life policies to mitigate margin compression, such actions would be partially offset by increases in our liabilities related to policies with secondary guarantees.
In annuities, the impact on operating earnings from margin compression is concentrated in our deferred annuities where there are minimum interest rate guarantees. Under the Low Interest Rate Scenario, we assume that a larger percentage of customers will maintain their funds with us to take advantage of the attractive minimum guaranteed crediting rates and we expect to experience margin compression as we reinvest cash flows at lower interest rates. Partially offsetting this margin compression, we assume we will lower crediting rates on contractual reset dates for the portion of business that is not currently at minimum crediting rates. Additionally, we have various interest rate derivative positions to partially mitigate this risk.
Long-term care and retained assets accounts are interest rate sensitive. Long-term care reserves have exposure to lower reinvestment rates that cannot be offset by a reduction in liability crediting rates for established claim reserves. Long-term care policies are guaranteed renewable, and rates may be adjusted on a class basis with regulatory approval to reflect emerging experience. Our long-term care block is closed to new business.
We review the discount rate assumptions and other assumptions associated with our long-term disability claim reserves no less frequently than annually and, with respect to interest rates, we set the discount rate on these reserves based on the prevailing interest rate environment at the time.
Our retained asset accounts have minimum interest crediting rate guarantees which range from 0.5% to 4.0%, all of which are currently at their respective minimum interest crediting rates. While we expect to experience margin compression as we reinvest at lower rates, the interest rate derivatives held in this portfolio should partially mitigate this risk.
Reinvestment risk is defined for this purpose as the amount of reinvestment in
2017
,
2018
and
2019
that would impact operating earnings due to reinvesting cash flows in the Low Interest Rate Scenario. For the life business, $3.3 billion, $2.7 billion and $2.5 billion in 2017, 2018 and 2019, respectively, of the asset base will be subject to reinvestment risk on an average asset base of $61.1 billion, $60.9 billion and $60.6 billion in 2017, 2018 and 2019, respectively. For our deferred annuities business, $1.3 billion, $0.8 billion, and $1.0 billion in
2017
,
2018
, and
2019
, respectively, of the asset base will be subject to reinvestment risk on an average asset base of $18.1 billion, $17.8 billion and $17.4 billion in
2017
,
2018
and 2019, respectively.
For our long-term care portfolio, $0.7 billion, $0.5 billion and $0.5 billion of the asset base in
2017
,
2018
and
2019
, respectively, will be subject to reinvestment risk on an average asset base of $11.3 billion, $12.1 billion and $12.7 billion in
2017
,
2018
and
2019
, respectively.
We estimate an unfavorable combined long-term and short-term interest rate impact on the operating earnings of our MetLife Holdings segment from the Low Interest Rate Scenario of $10 million, $25 million and $50 million in
2017
,
2018
and
2019
, respectively.
Brighthouse Financial
Our interest rate sensitive products include deferred annuities and universal life products. In our universal life products, we manage interest rate risk through a combination of product design features and ALM strategies, including the use of interest rate derivatives. While we have the ability to lower crediting rates on certain in-force universal life policies to mitigate margin compression, such actions would be partially offset by increases in our liabilities related to policies with secondary guarantees.
The impact on operating earnings from margin compression is concentrated in our fixed deferred annuities, as well as the fixed account allocations in our variable annuities, where there are minimum interest rate guarantees. Under the Low Interest Rate Scenario, we assume that a larger percentage of customers will maintain their funds with us to take advantage of the attractive minimum guaranteed crediting rates and we expect to experience margin compression as we reinvest cash flows at lower interest rates. Partially offsetting this margin compression, we assume we will lower crediting rates on contractual reset dates for the portion of business that is not currently at minimum crediting rates. Additionally, we have various interest rate derivative positions to partially mitigate this risk.
94
Reinvestment risk is defined for this purpose as the amount of reinvestment in 2017, 2018 and 2019 that would impact operating earnings due to reinvesting cash flows in the Low Interest Rate Scenario. For the deferred annuities business, $1.2 billion, $0.6 billion, and $1.0 billion in 2017, 2018, and 2019, respectively, of the asset base will be subject to reinvestment risk on an average asset base of $22.6 billion, $24.5 billion and $26.4 billion in 2017, 2018 and 2019, respectively.
We estimate a favorable combined long-term and short-term interest rate impact on operating earnings on our Brighthouse Financial segment from the Low Interest Rate Scenario of $30 million and $5 million in 2017 and 2018, respectively and an unfavorable impact of $45 million in 2019.
Additionally, we have mark-to-market interest rate risk in our variable annuity guarantees, where reduced interest rates could result in an increase in the valuation of our liabilities associated with these products. Because this risk is largely hedged, we have not included the impact of such interest rate risk in the foregoing estimates.
Corporate & Other
Corporate & Other contains the surplus portfolios for the enterprise, the portfolios used to fund the capital needs of the Company and various reinsurance agreements. The surplus portfolios are subject to reinvestment risk; however, lower net investment income is significantly offset by lower interest expense on both fixed and variable rate debt. Under a lower interest rate environment, fixed rate debt is assumed to be either paid off when it matures or refinanced at a lower interest rate resulting in lower overall interest expense. Variable rate debt is indexed to the three-month LIBOR, which results in lower interest expense incurred.
We estimate an unfavorable combined long-term and short-term interest rate impact on the operating earnings of Corporate & Other from the Low Interest Rate Scenario of $30 million in 2017 and a favorable impact of $20 million and $30 million in
2018
and
2019
, respectively.
Competitive Pressures
The life insurance industry remains highly competitive. The product development and product life cycles have shortened in many product segments, leading to more intense competition with respect to product features. Larger companies have the ability to invest in brand equity, product development, technology and risk management, which are among the fundamentals for sustained profitable growth in the life insurance industry. In addition, several of the industry’s products can be quite homogeneous and subject to intense price competition. Sufficient scale, financial strength and financial flexibility are becoming prerequisites for sustainable growth in the life insurance industry. Larger market participants tend to have the capacity to invest in additional distribution capability and the information technology needed to offer the superior customer service demanded by an increasingly sophisticated industry client base. We believe that the continued volatility of the financial markets, its impact on the capital position of many competitors, and subsequent actions by regulators and rating agencies have altered the competitive environment. In particular, we believe that these factors have highlighted financial strength as the most significant differentiator and, as a result, we believe the Company is well positioned to compete in this environment.
Regulatory Developments
In the United States, our life insurance companies are regulated primarily at the state level, with some products and services also subject to federal regulation. As life insurers introduce new and often more complex products, regulators refine capital requirements and introduce new reserving standards for the life insurance industry. Regulations recently adopted or currently under review can potentially impact the statutory reserve and capital requirements of the industry. In addition, regulators have undertaken market and sales practices reviews of several markets or products, including equity-indexed annuities, variable annuities and group products, as well as reviews of the utilization of affiliated captive reinsurers and offshore entities to reinsure insurance risks.
95
The regulation of the global financial services industry has received renewed scrutiny as a result of the disruptions in the financial markets. Significant regulatory reforms have been adopted and additional reforms proposed, and these or other reforms could be implemented. See “Business — Regulation,” “Risk Factors — Regulatory and Legal Risks — Our Insurance and Brokerage Businesses Are Highly Regulated, and Changes in Regulation and in Supervisory and Enforcement Policies May Reduce Our Profitability and Limit Our Growth,” “Risk Factors — Risks Related to Our Business — Our Statutory Life Insurance Reserve Financings May Be Subject to Cost Increases and New Financings May Be Subject to Limited Market Capacity,” and “Risk Factors — Regulatory and Legal Risks — Changes in U.S. Federal, State Securities and State Insurance Laws and Regulations May Affect Our Operations and Our Profitability.” For example, Dodd-Frank effected the most far-reaching overhaul of financial regulation in the United States in decades. The full impact of Dodd-Frank on us will depend on whether MetLife, Inc. again becomes subject to supervision and regulation as a non-bank SIFI, as well as the adoption and implementation of final rules for insurance non-bank SIFIs required or permitted by Dodd-Frank, a number of which remain to be completed. See “Risk Factors — Regulatory and Legal Risks — Our Insurance and Brokerage Businesses Are Highly Regulated, and Changes in Regulation and In Supervisory and Enforcement Policies May Reduce Our Profitability and Limit Our Growth” for information regarding the proposal by President Trump and the majority party to dismantle or roll back Dodd-Frank and the related Executive Order calling for a comprehensive review of Dodd-Frank.
Mortgage and Foreclosure-Related Exposures
MetLife no longer engages in the origination, sale and servicing of forward and reverse residential mortgage loans. See Note
21
of the Notes to the Consolidated Financial Statements for further information regarding our mortgage and foreclosure-related exposures.
Notwithstanding MetLife Bank’s exit from the origination and servicing businesses, MLHL remains obligated to repurchase loans or compensate for losses upon demand due to alleged defects by MetLife Bank or its predecessor servicers in past servicing of the loans and material representations made in connection with MetLife Bank’s sale of the loans.
Reserves for representation and warranty repurchases and indemnifications were $34 million and $72 million at
December 31, 2016
and
2015
, respectively. Reserves for estimated future losses due to alleged deficiencies on loans originated and sold, as well as servicing of the loans including servicing acquired, are estimated based on unresolved claims and projected losses under investor servicing contracts where MetLife Bank’s past actions or inactions are likely to result in missing certain stipulated investor timelines. Reserves for servicing defects were $11 million and $31 million at
December 31, 2016
and
2015
, respectively. Management is satisfied that adequate provision has been made in the Company’s consolidated financial statements for those representation and warranty obligations that are currently probable and reasonably estimable.
Summary of Critical Accounting Estimates
The preparation of financial statements in conformity with GAAP requires management to adopt accounting policies and make estimates and assumptions that affect amounts reported on the Consolidated Financial Statements. For a discussion of our significant accounting policies, see Note
1
of the Notes to the Consolidated Financial Statements. The most critical estimates include those used in determining:
|
(i)
|
liabilities for future policy benefits and the accounting for reinsurance;
|
|
(ii)
|
capitalization and amortization of DAC and the establishment and amortization of VOBA;
|
|
(iii)
|
estimated fair values of investments in the absence of quoted market values;
|
|
(iv)
|
investment impairments;
|
|
(v)
|
estimated fair values of freestanding derivatives and the recognition and estimated fair value of embedded derivatives requiring bifurcation;
|
|
(vi)
|
measurement of goodwill and related impairment;
|
|
(vii)
|
measurement of employee benefit plan liabilities;
|
|
(viii)
|
measurement of income taxes and the valuation of deferred tax assets; and
|
|
(ix)
|
liabilities for litigation and regulatory matters.
|
96
In addition, the application of acquisition accounting requires the use of estimation techniques in determining the estimated fair values of assets acquired and liabilities assumed — the most significant of which relate to aforementioned critical accounting estimates. In applying these policies and estimates, management makes subjective and complex judgments that frequently require assumptions about matters that are inherently uncertain. Many of these policies, estimates and related judgments are common in the insurance and financial services industries; others are specific to our business and operations. Actual results could differ from these estimates.
Liability for Future Policy Benefits
Generally, future policy benefits are payable over an extended period of time and related liabilities are calculated as the present value of future expected benefits to be paid, reduced by the present value of future expected premiums. Such liabilities are established based on methods and underlying assumptions in accordance with GAAP and applicable actuarial standards. Principal assumptions used in the establishment of liabilities for future policy benefits are mortality, morbidity, policy lapse, renewal, retirement, disability incidence, disability terminations, investment returns, inflation, expenses and other contingent events as appropriate to the respective product type and geographical area. These assumptions are established at the time the policy is issued and are intended to estimate the experience for the period the policy benefits are payable. Utilizing these assumptions, liabilities are established on a block of business basis. If experience is less favorable than assumed, additional liabilities may be established, resulting in a charge to policyholder benefits and claims.
Future policy benefit liabilities for disabled lives are estimated using the present value of benefits method and experience assumptions as to claim terminations, expenses and interest.
Liabilities for unpaid claims are estimated based upon our historical experience and other actuarial assumptions that consider the effects of current developments, anticipated trends and risk management programs, reduced for anticipated salvage and subrogation.
Future policy benefit liabilities for minimum death and income benefit guarantees relating to certain annuity contracts are based on estimates of the expected value of benefits in excess of the projected account balance, recognizing the excess ratably over the accumulation period based on total expected assessments. Liabilities for ULSG and paid-up guarantees are determined by estimating the expected value of death benefits payable when the account balance is projected to be zero and recognizing those benefits ratably over the accumulation period based on total expected assessments. The assumptions used in estimating the secondary and paid-up guarantee liabilities are consistent with those used for amortizing DAC, and are thus subject to the same variability and risk. The assumptions of investment performance and volatility for variable products are consistent with historical experience of the appropriate underlying equity index, such as the S&P 500 Index.
We regularly review our estimates of liabilities for future policy benefits and compare them with our actual experience. Differences between actual experience and the assumptions used in pricing these policies and guarantees, as well as in the establishment of the related liabilities, result in variances in profit and could result in losses.
See Note
4
of the Notes to the Consolidated Financial Statements for additional information on our liability for future policy benefits.
Reinsurance
Accounting for reinsurance requires extensive use of assumptions and estimates, particularly related to the future performance of the underlying business and the potential impact of counterparty credit risks. We periodically review actual and anticipated experience compared to the aforementioned assumptions used to establish assets and liabilities relating to ceded and assumed reinsurance and evaluate the financial strength of counterparties to our reinsurance agreements using criteria similar to that evaluated in our security impairment process. See “— Investment Impairments.” Additionally, for each of our reinsurance agreements, we determine whether the agreement provides indemnification against loss or liability relating to insurance risk, in accordance with applicable accounting standards. We review all contractual features, including those that may limit the amount of insurance risk to which the reinsurer is subject or features that delay the timely reimbursement of claims. If we determine that a reinsurance agreement does not expose the reinsurer to a reasonable possibility of a significant loss from insurance risk, we record the agreement using the deposit method of accounting.
See Note
6
of the Notes to the Consolidated Financial Statements for additional information on our reinsurance programs.
97
Deferred Policy Acquisition Costs and Value of Business Acquired
We incur significant costs in connection with acquiring new and renewal insurance business. Costs that relate directly to the successful acquisition or renewal of insurance contracts are capitalized as DAC. In addition to commissions, certain direct-response advertising expenses and other direct costs, deferrable costs include the portion of an employee’s total compensation and benefits related to time spent selling, underwriting or processing the issuance of new and renewal insurance business only with respect to actual policies acquired or renewed. We utilize various techniques to estimate the portion of an employee’s time spent on qualifying acquisition activities that result in actual sales, including surveys, interviews, representative time studies and other methods. These estimates include assumptions that are reviewed and updated on a periodic basis or more frequently to reflect significant changes in processes or distribution methods.
VOBA represents the excess of book value over the estimated fair value of acquired insurance, annuity, and investment-type contracts in force at the acquisition date. For certain acquired blocks of business, the estimated fair value of the in-force contract obligations exceeded the book value of assumed in-force insurance policy liabilities, resulting in negative VOBA, which is presented separately from VOBA as an additional insurance liability included in other policy-related balances. The estimated fair value of the acquired obligations is based on projections, by each block of business, of future policy and contract charges, premiums, mortality and morbidity, separate account performance, surrenders, operating expenses, investment returns, nonperformance risk adjustment and other factors. Actual experience on the purchased business may vary from these projections. The recovery of DAC and VOBA is dependent upon the future profitability of the related business.
Separate account rates of return on variable universal life contracts and variable deferred annuity contracts affect in-force account balances on such contracts each reporting period, which can result in significant fluctuations in amortization of DAC and VOBA. Our practice to determine the impact of gross profits resulting from returns on separate accounts assumes that long-term appreciation in equity markets is not changed by short-term market fluctuations, but is only changed when sustained interim deviations are expected. We monitor these events and only change the assumption when our long-term expectation changes. The effect of an increase (decrease) by 100 basis points in the assumed future rate of return is reasonably likely to result in a decrease (increase) in the DAC and VOBA amortization with an offset to our unearned revenue liability which nets to approximately $230 million. We use a mean reversion approach to separate account returns where the mean reversion period is five years with a long-term separate account return after the five-year reversion period is over. The current long-term rate of return assumption for the variable universal life contracts and variable deferred annuity contracts is 7.0%.
We periodically review long-term assumptions underlying the projections of estimated gross margins and profits. These assumptions primarily relate to investment returns, policyholder dividend scales, interest crediting rates, mortality, persistency, and expenses to administer business. Assumptions used in the calculation of estimated gross margins and profits which may have significantly changed are updated annually. We expect these assumptions to be the ones most reasonably likely to cause significant changes in the future. Changes in these assumptions can be offsetting and we are unable to predict their movement or offsetting impact over time.
In 2016, as part of the annual actuarial assumption review, the Company made changes to policyholder behavior and long-term economic assumptions, as well as risk margins, resulting in changes to the actual and expected future gross profits. Other assumptions, such as expenses, in-force or persistency assumptions and policyholder dividends on participating traditional life contracts, variable and universal life contracts were also reviewed. See “— Results of Operations — Consolidated Results — Year Ended December 31, 2016 Compared with the Year Ended December 31, 2015 — Actuarial Assumption Review” for further information.
98
At December 31,
2016
,
2015
and
2014
, DAC and VOBA for the Company was $24.8 billion, $24.1 billion and $24.4 billion, respectively. In addition to assumption updates, amortization of DAC and VOBA associated with the variable and universal life and annuity contracts was significantly impacted by movements in equity markets. The following illustrates the effect on DAC and VOBA of changing each of the respective assumptions, as well as updating estimated gross margins or profits with actual gross margins or profits during the years ended December 31,
2016
,
2015
and
2014
. Increases (decreases) in DAC and VOBA balances, as presented below, resulted in a corresponding decrease (increase) in amortization.
|
|
Years Ended December 31,
|
||||||||||
|
|
2016
|
2015
|
2014
|
||||||||
|
|
(In millions)
|
||||||||||
|
General account investment return
|
$
|
25
|
|
$
|
(72
|
)
|
$
|
(45
|
)
|
||
|
Separate account investment return
|
(12
|
)
|
(31
|
)
|
43
|
|
|||||
|
Net investment gains (losses)/Net derivative gains (losses)
|
1,627
|
|
(9
|
)
|
(42
|
)
|
|||||
|
Guaranteed minimum income benefits
|
(92
|
)
|
(125
|
)
|
(63
|
)
|
|||||
|
Expense
|
(8
|
)
|
(93
|
)
|
24
|
|
|||||
|
In-force/Persistency
|
(2
|
)
|
220
|
|
94
|
|
|||||
|
Policyholder dividends and other
|
(584
|
)
|
(39
|
)
|
(74
|
)
|
|||||
|
Total
|
$
|
954
|
|
$
|
(149
|
)
|
$
|
(63
|
)
|
||
The following represent significant items contributing to the changes to DAC and VOBA amortization in
2016
:
|
•
|
Changes in net investment and net derivative gains (losses) resulted in the following changes in DAC and VOBA amortization:
|
|
–
|
Actual gross profits decreased as a result of an increase in liabilities associated with guarantee obligations on variable annuities, resulting in a decrease of DAC and VOBA amortization of approximately $420 million, excluding the impact from our nonperformance risk and risk margins, which are described below. The increase in the guarantee liability valuations on variable annuities was mostly attributable to the annual actuarial assumption review, which is described more fully in “— Results of Operations — Consolidated Results — Year Ended December 31, 2016 Compared with the Year Ended December 31, 2015 — Actuarial Assumption Review.” Mark-to-market changes on the freestanding derivatives hedging such guarantee obligations resulted in a decrease in DAC and VOBA amortization of approximately $920
million.
|
|
–
|
The Company’s nonperformance risk adjustment decreased the valuation of guaranteed liabilities, increased actual gross profits and increased DAC and VOBA amortization by approximately $120 million. This is more than offset by higher risk margins, which increased the guarantee liability valuations, decreased actual gross profits and decreased DAC and VOBA amortization by approximately $380 million.
|
|
•
|
The change in current and projected GMIB liabilities, mostly attributable to long-term investment rate of return and policyholder behavior related assumptions updates, as well as hedge gains, resulted in an increase to DAC and VOBA amortization of approximately $90 million.
|
99
|
•
|
The change in policyholder dividends and other is primarily driven by:
|
|
–
|
An acceleration of approximately $360 million of DAC amortization associated with universal life products resulting from the re-segmentation of MetLife businesses to establish a Brighthouse Financial segment.
|
|
–
|
An increase of approximately $110 million of DAC amortization resulting from the annual actuarial assumption update of the closed block.
|
|
–
|
An increase of approximately $70 million of DAC amortization resulting from the dividend scale update.
|
The following represent significant items contributing to the changes to DAC and VOBA amortization in
2015
:
|
•
|
Changes in net investment and net derivative gains (losses) resulted in the following changes in DAC and VOBA amortization:
|
|
–
|
Actual gross profits decreased as a result of an increase in liabilities associated with guarantee obligations on variable annuities, resulting in a decrease of DAC and VOBA amortization of $338 million, excluding the impact from our nonperformance risk and risk margins, which are described below. Mark-to-market changes on the freestanding derivatives hedging such guarantee obligations resulted in an increase in DAC and VOBA amortization of $114 million.
|
|
–
|
The Company’s nonperformance risk adjustment decreased the valuation of guaranteed liabilities, increased actual gross profits and increased DAC and VOBA amortization by $17 million. This was partially offset by the lower risk margins, which increased the guarantee liability valuations, decreased actual gross profits and decreased DAC and VOBA amortization by $10 million.
|
|
–
|
The remainder of the impact increased DAC and VOBA amortization by $226 million and was attributable to 2015 investment activities, methodology refinement
, and assumption updates.
|
|
•
|
The change in GMIBs resulted in an increase to DAC amortization of $125 million mostly attributable to hedge gains.
|
|
•
|
Better than expected persistency and updates in persistency assumptions caused an increase in actual and expected future gross profits resulting in a net decrease in DAC and VOBA amortization of $220 million.
|
The following represent significant items contributing to the changes to DAC and VOBA amortization in
2014
:
|
•
|
The increase in equity markets during the year increased separate account balances, which led to higher actual and expected future gross profits on variable universal life contracts and variable deferred annuity contracts resulting in a decrease of $43 million in DAC and VOBA amortization.
|
•
Changes in net investment gains (losses) resulted in the following changes in DAC and VOBA amortization.
|
–
|
Actual gross profits decreased as a result of an increase in liabilities associated with guarantee obligations on variable annuities, resulting in a decrease of DAC and VOBA amortization of $118 million, excluding the impact from our nonperformance risk and risk margins, which are described below. This decrease in actual gross profits was more than offset by freestanding net derivative gains associated with the hedging of such guarantee obligations, which resulted in an increase in DAC and VOBA amortization of $219 million.
|
|
–
|
The widening of the Company’s nonperformance risk adjustment decreased the valuation of guaranteed liabilities, increased actual gross profits and increased DAC and VOBA amortization by $44 million. This was more than offset by the higher risk margins, which increased the guarantee liability valuations, decreased actual gross profits and decreased DAC and VOBA amortization by $53 million.
|
|
–
|
The remainder of the impact of net investment gains (losses), which decreased DAC and VOBA amortization by $50 million, was primarily attributable to 2014 investment activities.
|
|
•
|
The change in current and future projected GMIBs liability resulted in an increase to DAC amortization of $63 million.
|
|
•
|
Better than expected persistency and changes in assumptions regarding persistency caused an increase in actual and expected future gross profits resulting in a net decrease in DAC and VOBA amortization of $94 million.
|
100
Our DAC and VOBA balance is also impacted by unrealized investment gains (losses) and the amount of amortization which would have been recognized if such gains and losses had been realized. The increase in unrealized investment gains (losses) decreased the DAC and VOBA balance by $158 million in 2016, while the change in unrealized investment gains increased the DAC and VOBA balance by $638 million and decreased by $702 billion in 2015 and 2014, respectively. See Notes
5
and
8
of the Notes to the Consolidated Financial Statements for information regarding the DAC and VOBA offset to unrealized investment losses.
Estimated Fair Value of Investments
In determining the estimated fair value of our investments, fair values are based on unadjusted quoted prices for identical investments in active markets that are readily and regularly obtainable. When such quoted prices are not available, fair values are based on quoted prices in markets that are not active, quoted prices for similar but not identical investments, or other observable inputs. If these inputs are not available, or observable inputs are not determinable, unobservable inputs and/or adjustments to observable inputs requiring management judgment are used to determine the estimated fair value of investments.
The methodologies, assumptions and inputs utilized are described in Note
10
of the Notes to the Consolidated Financial Statements.
Financial markets are susceptible to severe events evidenced by rapid depreciation in asset values accompanied by a reduction in asset liquidity. Our ability to sell investments, or the price ultimately realized for investments, depends upon the demand and liquidity in the market and increases the use of judgment in determining the estimated fair value of certain investments.
Investment Impairments
One of the significant estimates related to AFS securities is our impairment evaluation. The assessment of whether an other-than-temporary impairment (“OTTI”) occurred is based on our case-by-case evaluation of the underlying reasons for the decline in estimated fair value on a security-by-security basis. Our review of each fixed maturity and equity security for OTTI includes an analysis of gross unrealized losses by three categories of severity and/or age of gross unrealized loss. An extended and severe unrealized loss position on a fixed maturity security may not have any impact on the ability of the issuer to service all scheduled interest and principal payments. Accordingly, such an unrealized loss position may not impact our evaluation of recoverability of all contractual cash flows or the ability to recover an amount at least equal to its amortized cost based on the present value of the expected future cash flows to be collected. In contrast, for certain equity securities, greater weight and consideration are given to a decline in estimated fair value and the likelihood such estimated fair value decline will recover.
Additionally, we consider a wide range of factors about the security issuer and use our best judgment in evaluating the cause of the decline in the estimated fair value of the security and in assessing the prospects for near-term recovery. Inherent in our evaluation of the security are assumptions and estimates about the operations of the issuer and its future earnings potential. Factors we consider in the OTTI evaluation process are described in Note
8
of the Notes to the Consolidated Financial Statements.
The determination of the amount of allowances and impairments on the remaining invested asset classes is highly subjective and is based upon our periodic evaluation and assessment of known and inherent risks associated with the respective asset class. Such evaluations and assessments are revised as conditions change and new information becomes available.
See Notes
1
and
8
of the Notes to the Consolidated Financial Statements for additional information relating to our determination of the amount of allowances and impairments.
Derivatives
The determination of the estimated fair value of freestanding derivatives, when quoted market values are not available, is based on market standard valuation methodologies and inputs that management believes are consistent with what other market participants would use when pricing the instruments. Derivative valuations can be affected by changes in interest rates, foreign currency exchange rates, financial indices, credit spreads, default risk, nonperformance risk, volatility, liquidity and changes in estimates and assumptions used in the pricing models. See Note
10
of the Notes to the Consolidated Financial Statements for additional details on significant inputs into the OTC derivative pricing models and credit risk adjustment.
101
We issue variable annuity products with guaranteed minimum benefits, some of which are embedded derivatives measured at estimated fair value separately from the host variable annuity product, with changes in estimated fair value reported in net derivative gains (losses). The estimated fair values of these embedded derivatives are determined based on the present value of projected future benefits minus the present value of projected future fees. The projections of future benefits and future fees require capital market and actuarial assumptions, including expectations concerning policyholder behavior. A risk neutral valuation methodology is used under which the cash flows from the guarantees are projected under multiple capital market scenarios using observable risk-free rates. The valuation of these embedded derivatives also includes an adjustment for our nonperformance risk and risk margins for non-capital market inputs. The nonperformance risk adjustment, which is captured as a spread over the risk-free rate in determining the discount rate to discount the cash flows of the liability, is determined by taking into consideration publicly available information relating to spreads in the secondary market for MetLife, Inc.’s debt, including related credit default swaps. These observable spreads are then adjusted, as necessary, to reflect the priority of these liabilities and the claims paying ability of the issuing insurance subsidiaries compared to MetLife, Inc. Risk margins are established to capture the non-capital market risks of the instrument which represent the additional compensation a market participant would require to assume the risks related to the uncertainties in certain actuarial assumptions. The establishment of risk margins requires the use of significant management judgment, including assumptions of the amount and cost of capital needed to cover the guarantees.
The table below illustrates the impact that a range of reasonably likely variances in credit spreads would have on our consolidated balance sheet, excluding the effect of income tax, related to the embedded derivative valuation on certain variable annuity products measured at estimated fair value. In determining the ranges, we have considered current market conditions, as well as the market level of spreads that can reasonably be anticipated over the near term. The ranges do not reflect extreme market conditions such as those experienced during the 2008-2009 financial crisis, as we do not consider those to be reasonably likely events in the near future.
In 2016, the Company made changes to the actuarial assumptions that resulted in an increase in the fair value of the embedded derivatives. The impact of the range of reasonably likely variances in credit spreads also increased significantly as compared to prior periods. However, these estimated effects do not take into account potential changes in other variables, such as equity price levels and market volatility, which can also contribute significantly to changes in carrying values. Therefore, the table does not necessarily reflect the ultimate impact on the consolidated financial statements under the credit spread variance scenarios presented below.
|
|
|
||||||
|
|
Policyholder Account Balances
|
DAC and VOBA
|
|||||
|
|
(In millions)
|
||||||
|
100% increase in our credit spread
|
$
|
3,177
|
|
$
|
591
|
|
|
|
As reported
|
$
|
3,978
|
|
$
|
756
|
|
|
|
50% decrease in our credit spread
|
$
|
4,469
|
|
$
|
852
|
|
|
The accounting for derivatives is complex and interpretations of accounting standards continue to evolve in practice. If it is determined that hedge accounting designations were not appropriately applied, reported net income could be materially affected. Assessments of hedge effectiveness and measurements of ineffectiveness of hedging relationships are also subject to interpretations and estimations and different interpretations or estimates may have a material effect on the amount reported in net income.
Variable annuities with guaranteed minimum benefits may be more costly than expected in volatile or declining equity markets. Market conditions including, but not limited to, changes in interest rates, equity indices, market volatility and foreign currency exchange rates, changes in our nonperformance risk, variations in actuarial assumptions regarding policyholder behavior, mortality and risk margins related to non-capital market inputs, may result in significant fluctuations in the estimated fair value of the guarantees that could materially affect net income. If interpretations change, there is a risk that features previously not bifurcated may require bifurcation and reporting at estimated fair value on the consolidated financial statements and respective changes in estimated fair value could materially affect net income.
102
Additionally, we ceded the risk associated with certain of the variable annuities with guaranteed minimum benefits described in the preceding paragraphs. The value of the embedded derivatives on the ceded risk is determined using a methodology consistent with that described previously for the guarantees directly written by us with the exception of the input for nonperformance risk that reflects the credit of the reinsurer. Because certain of the direct guarantees do not meet the definition of an embedded derivative and, thus are not accounted for at fair value, significant fluctuations in net income may occur since the change in fair value of the embedded derivative on the ceded risk is being recorded in net income without a corresponding and offsetting change in fair value of the direct guarantee.
See Note
9
of the Notes to the Consolidated Financial Statements for additional information on our derivatives and hedging programs.
Goodwill
Goodwill is tested for impairment at least annually or more frequently if events or circumstances, such as adverse changes in the business climate, indicate that there may be justification for conducting an interim test.
For purposes of goodwill impairment testing, if the carrying value of a reporting unit exceeds its estimated fair value, the implied fair value of the reporting unit goodwill is compared to the carrying value of that goodwill to measure the amount of impairment loss, if any. In such instances, the implied fair value of the goodwill is determined in the same manner as the amount of goodwill that would be determined in a business acquisition. The key inputs, judgments and assumptions necessary in determining estimated fair value of the reporting units include projected operating earnings, current book value, the level of economic capital required to support the mix of business, long-term growth rates, comparative market multiples, the account value of in-force business, projections of new and renewed business, as well as margins on such business, the level of interest rates, credit spreads, equity market levels, and the discount rate that we believe is appropriate for the respective reporting unit.
We apply significant judgment when determining the estimated fair value of our reporting units and when assessing the relationship of market capitalization to the aggregate estimated fair value of our reporting units. The valuation methodologies utilized are subject to key judgments and assumptions that are sensitive to change. Estimates of fair value are inherently uncertain and represent only management’s reasonable expectation regarding future developments. These estimates and the judgments and assumptions upon which the estimates are based will, in all likelihood, differ in some respects from actual future results. Declines in the estimated fair value of our reporting units could result in goodwill impairments in future periods which could materially adversely affect our results of operations or financial position.
In connection with the reorganization, the Company realigned certain businesses among its existing and new segments. As a result, the Company reallocated goodwill according to the relative fair values of the realigned businesses and reporting units. The Company performed an analysis to identify all reporting units under this revised structure.
In the third quarter of 2016, the Company performed its annual goodwill impairment test on the life and run-off reporting units in its Brighthouse Financial segment based upon its best available data at June 30, 2016. The Company utilized an actuarial based cash flow testing valuation and embedded value approaches, respectively, which estimate the net worth of the reporting unit and the value of existing and new business, if applicable. Under these actuarial-based methodologies, the estimated fair value of each of these reporting units was less than its carrying value, indicating a potential for goodwill impairment. The fair value of the life reporting unit was negatively impacted by a concentration in universal life products, including those with secondary guarantees, as it did not have the benefit of having a significant book of traditional life insurance. The run-off reporting unit, as a closed block, used a higher discount rate reflective of expected risk-adjusted returns associated with such business which negatively impacted its estimated fair value. As a result, the Company performed the second step of its goodwill impairment process, which compares the implied fair value of the reporting unit’s goodwill with its carrying value. This analysis indicated that the allocated goodwill associated with each of these reporting units was not recoverable. Therefore, the Company recorded a non-cash charge of $147 million ($126 million, net of income tax) and $113 million ($97 million, net of income tax) for the life and run-off reporting units, respectively, impairing the entire goodwill balance which is reported in goodwill impairment on the consolidated statements of operations and comprehensive income for the year ended December 31, 2016.
In addition, in the third quarter of 2016, the Company performed the annual goodwill impairment test on the life reporting unit of its MetLife Holdings segment using the actuarial based embedded value fair valuation approach. The estimated fair value of the reporting unit exceeded its carrying value by approximately 13% and, therefore, the reporting unit was not impaired. If we had assumed that the discount rate was 100 basis points higher than the discount rate used, the estimated fair value of the MetLife Holdings life reporting unit would have been less than the carrying value by approximately 7%. The MetLife Holdings Life reporting unit consists of operations relating to products and businesses no longer actively marketed by the Company. As of December 31, 2016, the life reporting unit of the MetLife Holdings segment had a $887 million goodwill balance.
103
The Company also performed its annual goodwill impairment tests of all other reporting units during the third quarter of 2016 using a qualitative assessment and/or quantitative assessments under the market multiple, discounted cash flow and/or actuarial-based valuation approaches based on best available data as of June 30, 2016 and concluded that the estimated fair values of all such reporting units were in excess of their carrying values and, therefore, goodwill was not impaired.
See Note
11
of the Notes to the Consolidated Financial Statements for additional information on our goodwill.
Employee Benefit Plans
Certain subsidiaries of MetLife, Inc. sponsor and/or administer various plans that provide defined benefit pension and other postretirement benefits covering eligible employees and sales representatives. The calculation of the obligations and expenses associated with these plans requires an extensive use of assumptions such as the discount rate, expected rate of return on plan assets, rate of future compensation increases and healthcare cost trend rates, as well as assumptions regarding participant demographics such as rate and age of retirement, withdrawal rates and mortality. In consultation with external actuarial firms, we determine these assumptions based upon a variety of factors such as historical experience of the plan and its assets, currently available market and industry data, and expected benefit payout streams.
We determine the expected rate of return on plan assets based upon an approach that considers inflation, real return, term premium, credit spreads, equity risk premium and capital appreciation, as well as expenses, expected asset manager performance, asset weights and the effect of rebalancing. Given the amount of plan assets as of
December 31, 2015
,
the beginning of the measurement year, if we had assumed an expected rate of return for both our pension and other postretirement benefit plans that was 100 basis points higher or 100 basis points lower than the rates we assumed, the change in our net periodic benefit costs would have been a decrease of $100 million and an increase of $100 million, respectively, in
2016
. This considers only changes in our assumed long-term rate of return given the level and mix of invested assets at the beginning of the year, without consideration of possible changes in any of the other assumptions described above that could ultimately accompany any changes in our assumed long-term rate of return.
We determine the discount rates used to value the Company’s pension and postretirement obligations, based upon rates commensurate with current yields on high quality corporate bonds. Given our pension and postretirement obligations as of
December 31, 2015
, the beginning of the measurement year, if we had assumed a discount rate for both our pension and postretirement benefit plans that was 100 basis points higher or 100 basis points lower than the rates we assumed, the change in our net periodic benefit costs would have been a decrease of $110 million and an increase of $123 million, respectively, in
2016
. This considers only changes in our assumed discount rates without consideration of possible changes in any of the other assumptions described above that could ultimately accompany any changes in our assumed discount rate. The assumptions used may differ materially from actual results due to, among other factors, changing market and economic conditions and changes in participant demographics. These differences may have a significant effect on the Company’s consolidated financial statements and liquidity.
See Note
18
of the Notes to the Consolidated Financial Statements for additional discussion of assumptions used in measuring liabilities relating to our employee benefit plans.
Income Taxes
We provide for federal, state and foreign income taxes currently payable, as well as those deferred due to temporary differences between the financial reporting and tax bases of assets and liabilities. Our accounting for income taxes represents our best estimate of various events and transactions. Tax laws are often complex and may be subject to differing interpretations by the taxpayer and the relevant governmental taxing authorities. In establishing a provision for income tax expense, we must make judgments and interpretations about the application of inherently complex tax laws. We must also make estimates about when in the future certain items will affect taxable income in the various tax jurisdictions, both domestic and foreign.
In establishing a liability for unrecognized tax benefits, assumptions may be made in determining whether, and to what extent, a tax position may be sustained. Once established, unrecognized tax benefits are adjusted when there is more information available or when events occur requiring a change.
Valuation allowances are established against deferred tax assets when management determines, based on available information, that it is more likely than not that deferred income tax assets will not be realized. Significant judgment is required in determining whether valuation allowances should be established, as well as the amount of such allowances. See Note
1
of the Notes to the Consolidated Financial Statements for additional information relating to our determination of such valuation allowances.
104
We may be required to change our provision for income taxes when estimates used in determining valuation allowances on deferred tax assets significantly change, or when receipt of new information indicates the need for adjustment in valuation allowances. Additionally, future events, such as changes in tax laws, tax regulations, or interpretations of such laws or regulations, could have an impact on the provision for income tax and the effective tax rate. Any such changes could significantly affect the amounts reported on the financial statements in the year these changes occur.
See Notes
1
and
19
of the Notes to the Consolidated Financial Statements for additional information on our income taxes.
Litigation Contingencies
We are a party to a number of legal actions and are involved in a number of regulatory investigations. Given the inherent unpredictability of these matters, it is difficult to estimate the impact on our financial position. Liabilities are established when it is probable that a loss has been incurred and the amount of the loss can be reasonably estimated. Liabilities related to certain lawsuits, including our asbestos-related liability, are especially difficult to estimate due to the limitation of available data and uncertainty regarding numerous variables that can affect liability estimates. The data and variables that impact the assumptions used to estimate our asbestos-related liability include the number of future claims, the cost to resolve claims, the disease mix and severity of disease in pending and future claims, the impact of the number of new claims filed in a particular jurisdiction and variations in the law in the jurisdictions in which claims are filed, the possible impact of tort reform efforts, the willingness of courts to allow plaintiffs to pursue claims against us when exposure to asbestos took place after the dangers of asbestos exposure were well known, and the impact of any possible future adverse verdicts and their amounts. On a quarterly and annual basis, we review relevant information with respect to liabilities for litigation, regulatory investigations and litigation-related contingencies to be reflected in our consolidated financial statements. It is possible that an adverse outcome in certain of our litigation and regulatory investigations, including asbestos-related cases, or the use of different assumptions in the determination of amounts recorded could have a material effect upon our consolidated net income or cash flows in particular quarterly or annual periods.
See Note
21
of the Notes to the Consolidated Financial Statements for additional information regarding our assessment of litigation contingencies.
Economic Capital
Economic capital is an internally developed risk capital model, the purpose of which is to measure the risk in the business and to provide a basis upon which capital is deployed. The economic capital model accounts for the unique and specific nature of the risks inherent in our business.
Our economic capital model, coupled with considerations of local capital requirements, aligns segment allocated equity with emerging standards and consistent risk principles. The model applies statistics-based risk evaluation principles to the material risks to which the Company is exposed. These consistent risk principles include calibrating required economic capital shock factors to a specific confidence level and time horizon while applying an industry standard method for the inclusion of diversification benefits among risk types. Economic capital-based risk estimation is an evolving science and industry best practices have emerged and continue to evolve. Areas of evolving industry best practices include stochastic liability valuation techniques, alternative methodologies for the calculation of diversification benefits, and the quantification of appropriate shock levels. MetLife’s management is responsible for the ongoing production and enhancement of the economic capital model and reviews its approach periodically to ensure that it remains consistent with emerging industry practice standards.
Segment net investment income, with the exception of the Brighthouse Financial segment, is credited or charged based on the level of allocated equity; however, changes in allocated equity do not impact our consolidated net investment income, income (loss) from continuing operations, net of income tax or operating earnings. The Brighthouse Financial segment’s net investment income represents that of the legal entities which comprise Brighthouse and its subsidiaries on a historical basis, however, may not be indicative of that on a combined standalone basis.
Net investment income is based upon the actual results of each segment’s specifically identifiable investment portfolios adjusted for allocated equity. Other costs are allocated to each of the segments based upon: (i) a review of the nature of such costs; (ii) time studies analyzing the amount of employee compensation costs incurred by each segment; and (iii) cost estimates included in the Company’s product pricing.
105
Acquisitions and Dispositions
In 2014, the life insurance joint venture in Vietnam among MetLife, Inc. (through MetLife Limited), Joint Stock Commercial Bank for Investment & Development of Vietnam and Bank for Investment & Development of Vietnam Insurance Joint Stock Corporation was established. Operations of the joint venture (BIDV MetLife Life Insurance Limited Liability Company) commenced in 2014.
In 2014, MetLife, Inc. and Malaysia’s AMMB Holdings Bhd (“AMMB”) completed the formation of their strategic partnership, in which each holds approximately 50% of both AmMetLife Insurance Berhad and AmMetTakaful Berhad, each of which became parties to exclusive 20-year distribution agreements with AMMB bank affiliates.
See “— Executive Summary — Other Key Information — Significant Events” for information regarding the U.S. Retail Advisor Force Divestiture and the proposed Separation.
See also
Note 3
of the Notes to the Consolidated Financial Statements for additional information regarding the Company’s dispositions.
106
Results of Operations
Consolidated Results
Business Overview.
Overall sales for the year ended December 31, 2016 increased slightly over 2015 levels reflecting an increase in sales of certain products. An overall increase in sales from our U.S. segment was primarily driven by sales of stable value products as well as funding agreement issuances. Sales of pension risk transfers and structured settlements improved slightly while sales in the income annuities and pension businesses were slightly lower. In our Latin America segment, improved sales of medical, accident & health and property & casualty products were partially offset by lower sales of pension and life products. For our EMEA segment, improved 2016 sales in the Middle East and the U.K. were partially offset by strong sales in Poland in 2015. In our MetLife Holdings and Brighthouse Financial segments, the U.S. Retail Advisor Force Divestiture and the proposed Separation negatively impacted sales, including the suspension of sales through one distributor. Sales in our Asia segment declined primarily due to management actions taken to improve product value.
|
|
Years Ended December 31,
|
||||||||||
|
|
2016
|
2015
|
2014
|
||||||||
|
|
(In millions)
|
||||||||||
|
Revenues
|
|||||||||||
|
Premiums
|
$
|
39,153
|
|
$
|
38,545
|
|
$
|
39,067
|
|
||
|
Universal life and investment-type product policy fees
|
9,206
|
|
9,507
|
|
9,946
|
|
|||||
|
Net investment income
|
19,947
|
|
19,281
|
|
21,153
|
|
|||||
|
Other revenues
|
1,759
|
|
1,983
|
|
2,030
|
|
|||||
|
Net investment gains (losses)
|
171
|
|
597
|
|
(197
|
)
|
|||||
|
Net derivative gains (losses)
|
(6,760
|
)
|
38
|
|
1,317
|
|
|||||
|
Total revenues
|
63,476
|
|
69,951
|
|
73,316
|
|
|||||
|
Expenses
|
|||||||||||
|
Policyholder benefits and claims and policyholder dividends
|
42,060
|
|
40,102
|
|
40,478
|
|
|||||
|
Interest credited to policyholder account balances
|
6,282
|
|
5,610
|
|
6,943
|
|
|||||
|
Goodwill impairment
|
260
|
|
—
|
|
—
|
|
|||||
|
Capitalization of DAC
|
(3,589
|
)
|
(3,837
|
)
|
(4,183
|
)
|
|||||
|
Amortization of DAC and VOBA
|
2,641
|
|
3,936
|
|
4,132
|
|
|||||
|
Amortization of negative VOBA
|
(269
|
)
|
(361
|
)
|
(442
|
)
|
|||||
|
Interest expense on debt
|
1,201
|
|
1,208
|
|
1,216
|
|
|||||
|
Other expenses
|
15,085
|
|
15,823
|
|
16,368
|
|
|||||
|
Total expenses
|
63,671
|
|
62,481
|
|
64,512
|
|
|||||
|
Income (loss) from continuing operations before provision for income tax
|
(195
|
)
|
7,470
|
|
8,804
|
|
|||||
|
Provision for income tax expense (benefit)
|
(999
|
)
|
2,148
|
|
2,465
|
|
|||||
|
Income (loss) from continuing operations, net of income tax
|
804
|
|
5,322
|
|
6,339
|
|
|||||
|
Income (loss) from discontinued operations, net of income tax
|
—
|
|
—
|
|
(3
|
)
|
|||||
|
Net income (loss)
|
804
|
|
5,322
|
|
6,336
|
|
|||||
|
Less: Net income (loss) attributable to noncontrolling interests
|
4
|
|
12
|
|
27
|
|
|||||
|
Net income (loss) attributable to MetLife, Inc.
|
800
|
|
5,310
|
|
6,309
|
|
|||||
|
Less: Preferred stock dividends
|
103
|
|
116
|
|
122
|
|
|||||
|
Preferred stock repurchase premium
|
—
|
|
42
|
|
—
|
|
|||||
|
Net income (loss) available to MetLife, Inc.’s common shareholders
|
$
|
697
|
|
$
|
5,152
|
|
$
|
6,187
|
|
||
107
Year Ended December 31,
2016
Compared with the Year Ended December 31,
2015
During the year ended December 31, 2016, income (loss) from continuing operations before provision for income tax decreased $7.7 billion ($4.5 billion, net of income tax) from 2015 primarily driven by an unfavorable change in net derivative gains (losses) of $6.8 billion ($4.4 billion, net of income tax). Unfavorable changes in operating earnings and net investment gains (losses), as well as a 2016 goodwill impairment charge, also contributed to the decrease. In addition, in 2016, income (loss) from continuing operations before provision for income tax includes the
financial impact of converting the Company’s Japan operations to calendar year-end reporting without retrospective application of this change to prior years.
Management of Investment Portfolio and Hedging Market Risks with Derivatives
.
We manage our investment portfolio using disciplined ALM principles, focusing on cash flow and duration to support our current and future liabilities. Our intent is to match the timing and amount of liability cash outflows with invested assets that have cash inflows of comparable timing and amount, while optimizing risk-adjusted net investment income and risk-adjusted total return. Our investment portfolio is heavily weighted toward fixed income investments, with over 80% of our portfolio invested in fixed maturity securities and mortgage loans. These securities and loans have varying maturities and other characteristics which cause them to be generally well suited for matching the cash flow and duration of insurance liabilities. In addition, our general account investment portfolio includes, within FVO and trading securities, contractholder-directed unit-linked investments supporting unit-linked variable annuity type liabilities, which do not qualify as separate account assets. The returns on these contractholder-directed unit-linked investments, which can vary significantly from period to period, include changes in estimated fair value subsequent to purchase, inure to contractholders and are offset in earnings by a corresponding change in policyholder account balances through interest credited to policyholder account balances.
We purchase investments to support our insurance liabilities and not to generate net investment gains and losses. However, net investment gains and losses are incurred and can change significantly from period to period due to changes in external influences, including changes in market factors such as interest rates, foreign currency exchange rates, credit spreads and equity markets; counterparty specific factors such as financial performance, credit rating and collateral valuation; and internal factors such as portfolio rebalancing. Changes in these factors from period to period can significantly impact the levels of both impairments and realized gains and losses on investments sold.
We also use derivatives as an integral part of our management of the investment portfolio and insurance liabilities to hedge certain risks, including changes in interest rates, foreign currency exchange rates, credit spreads and equity market levels. We continually reexamine our strategy for managing such risks.
We use freestanding interest rate, equity, credit and currency derivatives to hedge certain invested assets and insurance liabilities. A small portion of these hedges are designated and qualify as accounting hedges, which reduce volatility in earnings. For those hedges not designated as accounting hedges, changes in market factors lead to the recognition of fair value changes in net derivative gains (losses) generally without an offsetting gain or loss recognized in earnings for the item being hedged, which creates volatility in earnings.
Certain variable annuity products with guaranteed minimum benefits contain embedded derivatives that are measured at estimated fair value separately from the host variable annuity contract, with changes in estimated fair value recorded in net derivative gains (losses). We use freestanding derivatives to hedge the market risks inherent in these variable annuity guarantees. The valuation of these embedded derivatives includes a nonperformance risk adjustment, which is unhedged, and can be a significant driver of net derivative gains (losses) and volatility in earnings, but does not have an economic impact on us.
108
Net Derivative Gains (Losses)
. The variable annuity embedded derivatives and associated freestanding derivative hedges are collectively referred to as “VA program derivatives” in the following table. All other derivatives that are economic hedges of certain invested assets and insurance liabilities are referred to as “non-VA program derivatives” in the following table. The table below presents the impact on net derivative gains (losses) from non-VA program derivatives and VA program derivatives:
|
|
Years Ended December 31,
|
||||||
|
|
2016
|
2015
|
|||||
|
|
(In millions)
|
||||||
|
Non-VA program derivatives
|
|||||||
|
Interest rate
|
$
|
(1,728
|
)
|
$
|
171
|
|
|
|
Foreign currency exchange rate
|
433
|
|
397
|
|
|||
|
Credit
|
127
|
|
10
|
|
|||
|
Equity
|
(32
|
)
|
(172
|
)
|
|||
|
Non-VA embedded derivatives
|
(179
|
)
|
38
|
|
|||
|
Total non-VA program derivatives
|
(1,379
|
)
|
444
|
|
|||
|
VA program derivatives
|
|||||||
|
Market risks in embedded derivatives
|
2,158
|
|
511
|
|
|||
|
Nonperformance risk adjustment on embedded derivatives
|
520
|
|
163
|
|
|||
|
Other risks in embedded derivatives
|
(4,723
|
)
|
(951
|
)
|
|||
|
Total embedded derivatives
|
(2,045
|
)
|
(277
|
)
|
|||
|
Freestanding derivatives hedging embedded derivatives
|
(3,336
|
)
|
(129
|
)
|
|||
|
Total VA program derivatives
|
(5,381
|
)
|
(406
|
)
|
|||
|
Net derivative gains (losses)
|
$
|
(6,760
|
)
|
$
|
38
|
|
|
The unfavorable change in net derivative gains (losses) on non-VA program derivatives was $1.8 billion ($1.2 billion, net of income tax). This was primarily due to long-term interest rates increasing during 2016 and decreasing during 2015, unfavorably impacting receive-fixed interest rate swaps and total rate of return swaps primarily hedging long-duration liability portfolios. Because certain of these hedging strategies are not designated or do not qualify as accounting hedges, the changes in the estimated fair value of these freestanding derivatives are recognized in net derivative gains (losses) without an offsetting gain or loss recognized in earnings for the item being hedged.
The unfavorable change in net derivative gains (losses) on VA program derivatives was $5.0 billion ($3.2 billion, net of income tax). This was due to an unfavorable change of $3.8 billion ($2.5 billion, net of income tax) in other risks in embedded derivatives and an unfavorable change of $1.6 billion ($1.0 billion, net of income tax) in market risks in embedded derivatives, net of the impact of freestanding derivatives hedging those risks, partially offset by a favorable change of $357 million ($232 million, net of income tax) related to the change in the nonperformance risk adjustment on embedded derivatives. Other risks relate primarily to the impact of policyholder behavior and other non-market risks that generally cannot be hedged.
The foregoing $3.8 billion ($2.5 billion, net of income tax) unfavorable change in other risks in embedded derivatives reflected:
|
•
|
Updates to actuarial policyholder behavior assumptions within the valuation model. For details, see “— Actuarial Assumption Review”; and
|
|
•
|
An increase in the risk margin adjustment, measuring policyholder behavior risks, which was also affected by the 2016 actuarial assumption update, along with market and interest rate changes; partially offset by
|
|
•
|
The cross effect of capital market changes and the mismatch of fund performance between actual and modeled funds; and
|
|
•
|
A combination of other factors, including reserve changes influenced by benefit features and actual policyholder behavior, as well as FCTA.
|
The foregoing $1.6 billion ($1.0 billion, net of income tax) unfavorable change reflects a $3.2 billion ($2.1 billion, net of income tax) unfavorable change in freestanding derivatives hedging market risks in embedded derivatives, partially offset by a $1.6 billion ($1.1 billion, net of income tax) favorable change in market risks in embedded derivatives.
109
The primary changes in market factors are summarized as follows:
|
•
|
Long-term interest rates increased in 2016 and decreased in 2015, contributing to an unfavorable change in our freestanding derivatives and a favorable change in our embedded derivatives. For example, the 10-year U.S. swap rate increased 15 basis points in 2016 and decreased 10 basis points in 2015.
|
|
•
|
Key equity index levels mostly increased in 2016 and decreased in 2015, contributing to an unfavorable change in our freestanding derivatives and a favorable change in our embedded derivatives. For example, the S&P 500 Index increased 10% in 2016 and decreased 1% in 2015.
|
The aforementioned $357 million ($232 million, net of income tax) favorable change in the nonperformance risk adjustment on embedded derivatives resulted from a favorable change of $547 million, before income tax, as a result of model changes and changes in capital market inputs, such as long-term interest rates and key equity index levels, on variable annuity guarantees, partially offset by an unfavorable change of $190 million, before income tax, related to changes in our own credit spread.
When equity index levels decrease in isolation, the variable annuity guarantees become more valuable to policyholders, which results in an increase in the undiscounted embedded derivative liability. Discounting this unfavorable change by the risk adjusted rate yields a smaller loss than by discounting at the risk-free rate, thus creating a gain from including an adjustment for nonperformance risk.
When the risk-free interest rate decreases in isolation, discounting the embedded derivative liability produces a higher valuation of the liability than if the risk-free interest rate had remained constant. Discounting this unfavorable change by the risk adjusted rate yields a smaller loss than by discounting at the risk-free interest rate, thus creating a gain from including an adjustment for nonperformance risk.
When our own credit spread increases in isolation, discounting the embedded derivative liability produces a lower valuation of the liability than if our own credit spread had remained constant. As a result, a gain is created from including an adjustment for nonperformance risk. For each of these primary market drivers, the opposite effect occurs when they move in the opposite direction.
Net Investment Gains (Losses)
. The unfavorable change in net investment gains (losses) of $426 million ($277 million, net of income tax) primarily reflects higher gains on sales of real estate, fixed maturity securities and equity securities in 2015 than in 2016 and an increase in the provision for mortgage loan losses in 2016. These unfavorable changes were partially offset by lower foreign currency transaction losses, as well as a gain from the U.S. Retail Advisor Force Divestiture in 2016.
Goodwill.
The year ended December 31, 2016 includes $260 million ($223 million, net of income tax) of non-cash charges for goodwill impairment associated with our Brighthouse Financial segment. See
Note 11
of the Notes to the Consolidated Financial Statements.
Actuarial Assumption Review
. Results for 2016 include a $3.2 billion ($2.1 billion, net of income tax) non-cash charge associated with the annual review of assumptions related to reserves and DAC, of which a $3.7 billion loss ($2.4 billion, net of income tax) was recognized in net derivative gains (losses) and a loss of $103 million ($67 million, net of income tax) was recognized in updates to the closed block projection. Of the $3.2 billion charge, $3.9 billion ($2.5 billion, net of income tax) was related to reserves and a benefit of $732 million ($478 million, net of income tax) was associated with DAC.
The $3.7 billion loss recognized in net derivative gains (losses) associated with this review of assumptions was included within the other risks in embedded derivatives caption in the table above.
The significant impacts of the annual actuarial assumption review were on the U.S. variable annuity block of business and are summarized as follows:
|
•
|
Changes in policyholder behavior assumptions resulted in reserve increases, partially offset by favorable DAC amortization, resulting in a net charge of $2.3 billion ($1.5 billion, net of income tax). The policyholder behavior assumption changes included:
|
– Lower utilization of the elective annuitization option on the guarantee riders on the contracts;
– Lower election of the guaranteed principal option in certain of our GMIBs, which, if exercised, returns to the policyholder the original purchase payment amounts;
– Adjusting the rate at which policyholders withdrew funds through systematic withdrawals; and
– Higher policyholder persistency related to the portion of the business that will remain with the Company after the proposed Separation, dependent on the amount a contract is in-the-money.
110
|
•
|
Changes in economic assumptions resulted in reserve increases and unfavorable DAC amortization resulting in a charge of $487 million ($316 million, net of income tax). These changes include reducing the long-term separate account return assumption from 7.25% to 7.00% (from 7.00% to 6.75% for GMIB’s invested in managed volatility funds), and reducing the projected ultimate 10-year treasury rate from 4.50% to 4.25%.
|
|
•
|
The remaining updates resulted in reserve increases from changes in risk margins, partially offset by favorable DAC, resulting in a charge of $428 million ($277 million, net of income tax).
|
Results for 2015 include a $313 million ($203 million, net of income tax) charge associated with our annual assumption review related to reserves and DAC, of which a $3 million loss ($2 million, net of income tax) was recognized in net derivative gains (losses). Of the $313 million charge, $60 million ($39 million, net of income tax) was related to DAC and $253 million ($164 million, net of income tax) was associated with reserves.
Divested Businesses and Lag Elimination.
Income (loss) from continuing operations before provision for income tax related to the divested businesses and lag elimination, excluding net investment gains (losses) and net derivative gains (losses), decreased $228 million ($159 million, net of income tax) to a loss of $225 million ($154 million, net of income tax) in 2016 from income of $3 million ($5 million, net of income tax) in 2015. Included in this decline was an increase in total revenues of $659 million, before income tax, and an increase in total expenses of $887 million, before income tax. Results for 2016 include the
financial impact of converting the Company’s Japan operations to calendar year-end reporting without retrospective application of this change to prior years, as well as expenses and charges associated with the
U.S Retail Advisor Force Divestiture
and the proposed Separation
.
Taxes
.
Income tax benefit for the year ended December 31, 2016 was $999 million, or 512% of income (loss) from continuing operations before provision for income tax, compared with income tax expense of $2.1 billion, or 29% of income (loss) from continuing operations before provision for income tax, for the year ended December 31, 2015. The Company’s effective tax rates differ from the U.S. statutory rate of 35% typically due to non-taxable investment income, tax credits for low income housing, and foreign earnings taxed at lower rates than the U.S. statutory rate. Our 2016 results include the following tax items: (i) a $110 million benefit related to a change in tax rate in Japan, (ii) a $66 million benefit due to a deferred tax adjustment related to goodwill, (iii) a $46 million benefit for tax audit settlements, and (iv) a $22 million benefit related to an investment tax credit, partially offset by (v) a $22 million charge related to the filing of the Company’s U.S. federal tax return, and (vi) a $19 million charge related to a change in tax rate in Chile. Our 2016 results also include the aforementioned $260 million ($223 million, net of income tax) non-cash charges for goodwill impairment. The tax benefit on these charges was limited to $37 million on the associated tax goodwill. Our 2015 results include tax charges of $681 million, of which $557 million was recorded under accounting guidance for the recognition of tax uncertainties, $88 million was related to foreign exchange-related gains on investments in Argentina and $36 million was the result of a deferred tax liability true-up in Japan. These charges were partially offset by the following tax benefits: (i) $174 million related to a change in tax rate in Japan, (ii) $61 million related to the restructuring of our business in Chile, (iii) $57 million related to the repatriation of earnings from Japan, and (iv) $31 million related to the devaluation of the peso in Argentina.
Operating Earnings.
As more fully described in “— Non-GAAP and Other Financial Disclosures,” we use operating earnings, which does not equate to income (loss) from continuing operations, net of income tax, as determined in accordance with GAAP, to analyze our performance, evaluate segment performance, and allocate resources. We believe that the presentation of operating earnings and operating earnings available to common shareholders, as we measure it for management purposes, enhances the understanding of our performance by highlighting the results of operations and the underlying profitability drivers of the business. Operating earnings and other financial measures based on operating earnings allow analysis of our performance relative to our business plan and facilitate comparisons to industry results. Operating earnings and operating earnings available to common shareholders should not be viewed as substitutes for income (loss) from continuing operations, net of income tax, and net income (loss) available to MetLife, Inc.’s common shareholders, respectively. Operating earnings available to common shareholders decreased $395 million, net of income tax, to $5.1 billion, net of income tax, for the year ended December 31, 2016 from $5.5 billion, net of income tax, for the year ended December 31, 2015.
Year Ended December 31,
2015
Compared with the Year Ended December 31,
2014
During the year ended December 31, 2015, income (loss) from continuing operations, before provision for income tax, decreased $1.3 billion ($1.0 billion, net of income tax) from 2014 primarily due to an unfavorable change in operating earnings, driven by the aforementioned tax charge and related charge for interest on uncertain tax positions, and an unfavorable change in net derivative gains (losses), partially offset by a favorable change in net investment gains (losses).
111
Net Derivative Gains (Losses).
The variable annuity embedded derivatives and associated freestanding derivative hedges are collectively referred to as “VA program derivatives” in the following table. All other derivatives that are economic hedges of certain invested assets and insurance liabilities are referred to as “non-VA program derivatives” in the following table. The table below presents the impact on net derivative gains (losses) from non-VA program derivatives and VA program derivatives:
|
|
Years Ended December 31,
|
||||||
|
|
2015
|
2014
|
|||||
|
|
(In millions)
|
||||||
|
Non-VA program derivatives
|
|||||||
|
Interest rate
|
$
|
171
|
|
$
|
927
|
|
|
|
Foreign currency exchange rate
|
397
|
|
(25
|
)
|
|||
|
Credit
|
10
|
|
89
|
|
|||
|
Equity
|
(172
|
)
|
(62
|
)
|
|||
|
Non-VA embedded derivatives
|
38
|
|
(99
|
)
|
|||
|
Total non-VA program derivatives
|
444
|
|
830
|
|
|||
|
VA program derivatives
|
|||||||
|
Market risks in embedded derivatives
|
511
|
|
31
|
|
|||
|
Nonperformance risk on embedded derivatives
|
163
|
|
13
|
|
|||
|
Other risks in embedded derivatives
|
(951
|
)
|
(266
|
)
|
|||
|
Total embedded derivatives
|
(277
|
)
|
(222
|
)
|
|||
|
Freestanding derivatives hedging embedded derivatives
|
(129
|
)
|
709
|
|
|||
|
Total VA program derivatives
|
(406
|
)
|
487
|
|
|||
|
Net derivative gains (losses)
|
$
|
38
|
|
$
|
1,317
|
|
|
The unfavorable change in net derivative gains (losses) on non-VA program derivatives was $386 million ($251 million, net of income tax). This was primarily due to long-term interest rates decreasing less in 2015 than in 2014, unfavorably impacting receive-fixed interest rate swaptions and interest rate swaps primarily hedging long-duration liability portfolios.
These unfavorable changes were partially offset by the strengthening of the U.S. dollar relative to other key currencies favorably impacting foreign currency forwards and futures that primarily hedge foreign denominated fixed maturity securities. In addition, a change in the value of the underlying assets favorably impacted non-VA embedded derivatives related to funds withheld on a certain reinsurance agreement. Because certain of these hedging strategies are not designated or do not qualify as accounting hedges, the changes in the estimated fair value of these freestanding derivatives are recognized in net derivative gains (losses) without an offsetting gain or loss recognized in earnings for the item being hedged.
The unfavorable change in net derivative gains (losses) on VA program derivatives was $893 million ($580 million, net of income tax). This was due to an unfavorable change of $685 million ($445 million, net of income tax) in other risks in embedded derivatives and an unfavorable change of $358 million ($233 million, net of income tax) in market risks in embedded derivatives, net of the impact of freestanding derivatives hedging those risks, partially offset by a favorable change of $150 million ($98 million, net of income tax) related to the change in the nonperformance risk adjustment on embedded derivatives. Other risks relate primarily to the impact of policyholder behavior and other non-market risks that generally cannot be hedged.
The foregoing $685 million ($445 million, net of income tax) unfavorable change in other risks in embedded derivatives reflecte
d:
|
•
|
Refinements in the valuation model, which resulted in an unfavorable year over year change in the valuation of the embedded derivatives.
|
|
•
|
The cross effect of capital markets changes, which resulted in an unfavorable year over year change in the valuation of the embedded derivatives.
|
|
•
|
A combination of other factors, including reserve changes influenced by benefit features and policyholder behavior, as well as FCTA, which resulted in an unfavorable year over year change in the valuation of embedded derivatives.
|
112
The foregoing $358 million ($233 million, net of income tax) unfavorable change was comprised of an $838 million ($545 million, net of income tax) unfavorable change in freestanding derivatives hedging market risks in embedded derivatives, which was partially offset by a $480 million ($312 million, net of income tax) favorable change in market risks in embedded derivatives.
The primary changes in market factors are summarized as follows:
|
•
|
Long-term interest rates decreased less in 2015 than in 2014, contributing to an unfavorable change in our freestanding derivatives and a favorable change in our embedded derivatives. For example, the 30-year U.S. swap rate decreased 3% in 2015 and 31% in 2014.
|
|
•
|
Key equity index levels decreased in 2015 and increased in 2014, contributing to a favorable change in our freestanding derivatives and an unfavorable change in our embedded derivatives. For example, the S&P 500 Index decreased 1% in 2015 and increased 11% in 2014.
|
|
•
|
Changes in foreign currency exchange rates contributed to a favorable change in our freestanding derivatives and an unfavorable change in our embedded derivatives related to the assumed reinsurance of certain variable annuity products from the Company’s former operating joint venture in Japan. For example, the Japanese yen strengthened against the euro 10% in 2015 as compared with a weakening of less than 1% against the euro in 2014.
|
The aforementioned $150 million ($98 million, net of income tax) favorable change in the nonperformance risk adjustment on embedded derivatives was due to a favorable change of $148 million, before income tax, related to changes in our own credit spread and a favorable change of $2 million, before income tax, as a result of changes in capital market inputs, such as long-term interest rates and key equity index levels, on the variable annuity guarantees.
Net Investment Gains (Losses).
The favorable change in net investment gains (losses) of $794 million ($516 million, net of income tax) primarily reflects a loss in 2014 on the disposition of MAL and higher net gains on sales of real estate in 2015, partially offset by lower net gains on sales and disposals of fixed maturity securities in 2015.
For further information on MAL, see
Note 3
of the Notes to the Consolidated Financial Statements.
Actuarial Assumption Review.
Results for 2015 include a $313 million ($203 million, net of income tax) charge associated with our annual assumption review related to reserves and DAC, of which a $3 million loss ($2 million, net of income tax) was recognized in net derivative gains (losses). Of the $313 million charge, $60 million ($39 million, net of income tax) was related to DAC and $253 million ($164 million, net of income tax) was associated with reserves.
The $3 million loss recognized in net derivative gains (losses) associated with our annual assumption review was included within the other risks in embedded derivatives caption in the table above.
As a result of our annual assumption review, changes were made to economic, policyholder behavior, mortality and other assumptions. The most significant impacts were in the MetLife Holdings segment and are summarized as follows:
|
•
|
Changes in economic assumptions resulted in an increase of DAC and reserves, resulting in a net charge of $122 million ($79 million, net of income tax).
|
|
•
|
Changes in policyholder behavior and mortality assumptions resulted in reserve increases, offset by favorable DAC, resulting in a net charge of $91 million ($59 million, net of income tax).
|
|
•
|
The remaining updates resulted in an increase in reserves, coupled with unfavorable DAC, resulting in a charge of $100 million ($65 million, net of income tax). The most notable update was related to our projection of closed block results.
|
Results for 2014 include a $161 million ($105 million, net of income tax) benefit associated with our annual assumption review related to reserves and DAC, of which $137 million ($89 million, net of income tax) was recognized in net derivative gains (losses). Of the $161 million benefit, $82 million ($53 million, net of income tax) was related to DAC and $79 million ($52 million, net of income tax) was associated with reserves.
113
Taxes
. Income tax expense for the year ended December 31, 2015 was $2.1 billion, or 29% of income (loss) from continuing operations before provision for income tax, compared with $2.5 billion, or 28% of income (loss) from continuing operations before provision for income tax, for the year ended December 31, 2014. The Company’s 2015 effective tax rate differs from the U.S. statutory rate of 35% primarily due to non-taxable investment income, tax credits for low income housing, and foreign earnings taxed at lower rates than the U.S. statutory rate. Our 2015 results include tax charges of $681 million, of which $557 million was recorded under accounting guidance for the recognition of tax uncertainties, $88 million was related to foreign exchange-related gains on investments in Argentina and $36 million was the result of a deferred tax liability true-up in Japan. These charges were partially offset by tax benefits of $174 million in Japan related to a change in tax rate, $61 million related to restructuring in Chile, $57 million related to the repatriation of earnings from Japan and $31 million related to the devaluation of the peso in Argentina. The Company’s 2014 effective tax rate was different from the U.S. statutory rate of 35% primarily due to non-taxable investment income, tax credits for low income housing, foreign earnings taxed at lower rates than the U.S. statutory rate, and the tax effects of the MAL divestiture. The 2014 period also includes a $54 million tax charge related to tax reform in Chile, a $45 million tax charge related to the repatriation of earnings from Japan and an $18 million tax charge related to a portion of the aforementioned settlement of a licensing matter which was not deductible for income tax purposes, partially offset by a $32 million tax benefit related to the filing of the Company’s U.S. federal tax return.
Operating Earnings
.
Operating earnings available to common shareholders decreased $1.1 billion, net of income tax, to $5.5 billion, net of income tax, for the year ended
December 31, 2015
from $6.6 billion, net of income tax, for the year ended
December 31, 2014
.
114
Reconciliation of income (loss) from continuing operations, net of income tax, to operating earnings available to common shareholders
Year Ended December 31,
2016
|
U.S.
|
Asia
|
Latin
America
|
EMEA
|
MetLife Holdings
|
Brighthouse Financial
|
Corporate & Other
|
Total
|
||||||||||||||||||||||||
|
|
(In millions)
|
||||||||||||||||||||||||||||||
|
Income (loss) from continuing operations, net of income tax
|
$
|
1,782
|
|
$
|
1,396
|
|
$
|
629
|
|
$
|
311
|
|
$
|
187
|
|
$
|
(2,648
|
)
|
$
|
(853
|
)
|
$
|
804
|
|
|||||||
|
Less: Net investment gains (losses)
|
(6
|
)
|
188
|
|
93
|
|
42
|
|
203
|
|
(78
|
)
|
(271
|
)
|
171
|
|
|||||||||||||||
|
Less: Net derivative gains (losses)
|
53
|
|
(47
|
)
|
3
|
|
24
|
|
(941
|
)
|
(5,851
|
)
|
(1
|
)
|
(6,760
|
)
|
|||||||||||||||
|
Less: Goodwill impairment
|
—
|
|
—
|
|
—
|
|
—
|
|
—
|
|
(260
|
)
|
—
|
|
(260
|
)
|
|||||||||||||||
|
Less: Other adjustments to continuing operations (1)
|
(263
|
)
|
26
|
|
58
|
|
33
|
|
(50
|
)
|
504
|
|
(228
|
)
|
80
|
|
|||||||||||||||
|
Less: Provision for income tax (expense) benefit
|
81
|
|
(13
|
)
|
(68
|
)
|
(61
|
)
|
276
|
|
2,015
|
|
151
|
|
2,381
|
|
|||||||||||||||
|
Operating earnings
|
$
|
1,917
|
|
$
|
1,242
|
|
$
|
543
|
|
$
|
273
|
|
$
|
699
|
|
$
|
1,022
|
|
(504
|
)
|
5,192
|
|
|||||||||
|
Less: Preferred stock dividends
|
103
|
|
103
|
|
|||||||||||||||||||||||||||
|
Operating earnings available to common shareholders
|
$
|
(607
|
)
|
$
|
5,089
|
|
|||||||||||||||||||||||||
Year Ended December 31,
2015
|
U.S.
|
Asia
|
Latin
America
|
EMEA
|
MetLife Holdings
|
Brighthouse Financial
|
Corporate & Other
|
Total
|
||||||||||||||||||||||||
|
|
(In millions)
|
||||||||||||||||||||||||||||||
|
Income (loss) from continuing operations, net of income tax
|
$
|
2,136
|
|
$
|
1,807
|
|
$
|
438
|
|
$
|
288
|
|
$
|
1,133
|
|
$
|
1,042
|
|
$
|
(1,522
|
)
|
$
|
5,322
|
|
|||||||
|
Less: Net investment gains (losses)
|
255
|
|
501
|
|
82
|
|
27
|
|
(41
|
)
|
7
|
|
(234
|
)
|
597
|
|
|||||||||||||||
|
Less: Net derivative gains (losses)
|
98
|
|
67
|
|
(135
|
)
|
40
|
|
307
|
|
(441
|
)
|
102
|
|
38
|
|
|||||||||||||||
|
Less: Other adjustments to continuing operations (1)
|
(149
|
)
|
(120
|
)
|
(72
|
)
|
3
|
|
(434
|
)
|
(291
|
)
|
(28
|
)
|
(1,091
|
)
|
|||||||||||||||
|
Less: Provision for income tax (expense) benefit
|
(72
|
)
|
(21
|
)
|
(62
|
)
|
(22
|
)
|
59
|
|
254
|
|
42
|
|
178
|
|
|||||||||||||||
|
Operating earnings
|
$
|
2,004
|
|
$
|
1,380
|
|
$
|
625
|
|
$
|
240
|
|
$
|
1,242
|
|
$
|
1,513
|
|
(1,404
|
)
|
5,600
|
|
|||||||||
|
Less: Preferred stock dividends
|
116
|
|
116
|
|
|||||||||||||||||||||||||||
|
Operating earnings available to common shareholders
|
$
|
(1,520
|
)
|
$
|
5,484
|
|
|||||||||||||||||||||||||
Year Ended December 31,
2014
|
U.S.
|
Asia
|
Latin
America
|
EMEA
|
MetLife Holdings
|
Brighthouse Financial
|
Corporate & Other
|
Total
|
||||||||||||||||||||||||
|
|
(In millions)
|
||||||||||||||||||||||||||||||
|
Income (loss) from continuing operations, net of income tax
|
$
|
2,430
|
|
$
|
1,200
|
|
$
|
401
|
|
$
|
330
|
|
$
|
1,939
|
|
$
|
973
|
|
$
|
(934
|
)
|
$
|
6,339
|
|
|||||||
|
Less: Net investment gains (losses)
|
130
|
|
512
|
|
30
|
|
(17
|
)
|
(61
|
)
|
(484
|
)
|
(307
|
)
|
(197
|
)
|
|||||||||||||||
|
Less: Net derivative gains (losses)
|
485
|
|
(532
|
)
|
(62
|
)
|
114
|
|
825
|
|
357
|
|
130
|
|
1,317
|
|
|||||||||||||||
|
Less: Other adjustments to continuing operations (1)
|
(128
|
)
|
(122
|
)
|
(242
|
)
|
36
|
|
(114
|
)
|
(720
|
)
|
(86
|
)
|
(1,376
|
)
|
|||||||||||||||
|
Less: Provision for income tax (expense) benefit
|
(158
|
)
|
35
|
|
49
|
|
(88
|
)
|
(226
|
)
|
267
|
|
34
|
|
(87
|
)
|
|||||||||||||||
|
Operating earnings
|
$
|
2,101
|
|
$
|
1,307
|
|
$
|
626
|
|
$
|
285
|
|
$
|
1,515
|
|
$
|
1,553
|
|
(705
|
)
|
6,682
|
|
|||||||||
|
Less: Preferred stock dividends
|
122
|
|
122
|
|
|||||||||||||||||||||||||||
|
Operating earnings available to common shareholders
|
$
|
(827
|
)
|
$
|
6,560
|
|
|||||||||||||||||||||||||
__________________
|
(1)
|
See definitions of operating revenues and operating expenses under “— Non-GAAP and Other Financial Disclosures” for the components of such adjustments.
|
115
Reconciliation of revenues to operating revenues and expenses to operating expenses
Year Ended December 31,
2016
|
U.S.
|
Asia
|
Latin
America
|
EMEA
|
MetLife Holdings
|
Brighthouse Financial
|
Corporate & Other
|
Total
|
||||||||||||||||||||||||
|
|
(In millions)
|
||||||||||||||||||||||||||||||
|
Total revenues
|
$
|
29,263
|
|
$
|
11,930
|
|
$
|
4,816
|
|
$
|
3,810
|
|
$
|
11,547
|
|
$
|
3,019
|
|
$
|
(909
|
)
|
$
|
63,476
|
|
|||||||
|
Less: Net investment gains (losses)
|
(6
|
)
|
188
|
|
93
|
|
42
|
|
203
|
|
(78
|
)
|
(271
|
)
|
171
|
|
|||||||||||||||
|
Less: Net derivative gains (losses)
|
53
|
|
(47
|
)
|
3
|
|
24
|
|
(941
|
)
|
(5,851
|
)
|
(1
|
)
|
(6,760
|
)
|
|||||||||||||||
|
Less: Adjustments related to net investment gains (losses) and net derivative gains (losses)
|
—
|
|
31
|
|
—
|
|
(1
|
)
|
—
|
|
(2
|
)
|
—
|
|
28
|
|
|||||||||||||||
|
Less: Other adjustments to revenues (1)
|
(264
|
)
|
601
|
|
48
|
|
936
|
|
(182
|
)
|
(1
|
)
|
21
|
|
1,159
|
|
|||||||||||||||
|
Total operating revenues
|
$
|
29,480
|
|
$
|
11,157
|
|
$
|
4,672
|
|
$
|
2,809
|
|
$
|
12,467
|
|
$
|
8,951
|
|
$
|
(658
|
)
|
$
|
68,878
|
|
|||||||
|
Total expenses
|
$
|
26,574
|
|
$
|
10,029
|
|
$
|
3,961
|
|
$
|
3,396
|
|
$
|
11,348
|
|
$
|
7,321
|
|
$
|
1,042
|
|
$
|
63,671
|
|
|||||||
|
Less: Adjustments related to net investment gains (losses) and net derivative gains (losses)
|
—
|
|
42
|
|
—
|
|
—
|
|
(268
|
)
|
(1,402
|
)
|
—
|
|
(1,628
|
)
|
|||||||||||||||
|
Less: Goodwill impairment
|
—
|
|
—
|
|
—
|
|
—
|
|
—
|
|
260
|
|
—
|
|
260
|
|
|||||||||||||||
|
Less: Other adjustments to expenses (1)
|
(1
|
)
|
564
|
|
(10
|
)
|
902
|
|
136
|
|
895
|
|
249
|
|
2,735
|
|
|||||||||||||||
|
Total operating expenses
|
$
|
26,575
|
|
$
|
9,423
|
|
$
|
3,971
|
|
$
|
2,494
|
|
$
|
11,480
|
|
$
|
7,568
|
|
$
|
793
|
|
$
|
62,304
|
|
|||||||
Year Ended December 31,
2015
|
|
U.S.
|
Asia
|
Latin
America
|
EMEA
|
MetLife Holdings
|
Brighthouse Financial
|
Corporate & Other
|
Total
|
|||||||||||||||||||||||
|
|
(In millions)
|
||||||||||||||||||||||||||||||
|
Total revenues
|
$
|
28,954
|
|
$
|
11,986
|
|
$
|
4,736
|
|
$
|
2,930
|
|
$
|
13,179
|
|
$
|
8,770
|
|
$
|
(604
|
)
|
$
|
69,951
|
|
|||||||
|
Less: Net investment gains (losses)
|
255
|
|
501
|
|
82
|
|
27
|
|
(41
|
)
|
7
|
|
(234
|
)
|
597
|
|
|||||||||||||||
|
Less: Net derivative gains (losses)
|
98
|
|
67
|
|
(135
|
)
|
40
|
|
307
|
|
(441
|
)
|
102
|
|
38
|
|
|||||||||||||||
|
Less: Adjustments related to net investment gains (losses) and net derivative gains (losses)
|
—
|
|
12
|
|
—
|
|
(5
|
)
|
—
|
|
(2
|
)
|
—
|
|
5
|
|
|||||||||||||||
|
Less: Other adjustments to revenues (1)
|
(163
|
)
|
147
|
|
12
|
|
21
|
|
(245
|
)
|
64
|
|
5
|
|
(159
|
)
|
|||||||||||||||
|
Total operating revenues
|
$
|
28,764
|
|
$
|
11,259
|
|
$
|
4,777
|
|
$
|
2,847
|
|
$
|
13,158
|
|
$
|
9,142
|
|
$
|
(477
|
)
|
$
|
69,470
|
|
|||||||
|
Total expenses
|
$
|
25,706
|
|
$
|
9,701
|
|
$
|
4,199
|
|
$
|
2,599
|
|
$
|
11,524
|
|
$
|
7,427
|
|
$
|
1,325
|
|
$
|
62,481
|
|
|||||||
|
Less: Adjustments related to net investment gains (losses) and net derivative gains (losses)
|
—
|
|
9
|
|
—
|
|
(5
|
)
|
141
|
|
(130
|
)
|
—
|
|
15
|
|
|||||||||||||||
|
Less: Other adjustments to expenses (1)
|
(14
|
)
|
270
|
|
84
|
|
18
|
|
48
|
|
483
|
|
33
|
|
922
|
|
|||||||||||||||
|
Total operating expenses
|
$
|
25,720
|
|
$
|
9,422
|
|
$
|
4,115
|
|
$
|
2,586
|
|
$
|
11,335
|
|
$
|
7,074
|
|
$
|
1,292
|
|
$
|
61,544
|
|
|||||||
Year Ended December 31,
2014
|
|
U.S.
|
Asia
|
Latin
America
|
EMEA
|
MetLife Holdings
|
Brighthouse Financial
|
Corporate & Other
|
Total
|
|||||||||||||||||||||||
|
|
(In millions)
|
||||||||||||||||||||||||||||||
|
Total revenues
|
$
|
28,490
|
|
$
|
12,613
|
|
$
|
5,296
|
|
$
|
4,227
|
|
$
|
13,801
|
|
$
|
9,257
|
|
$
|
(368
|
)
|
$
|
73,316
|
|
|||||||
|
Less: Net investment gains (losses)
|
130
|
|
512
|
|
30
|
|
(17
|
)
|
(61
|
)
|
(484
|
)
|
(307
|
)
|
(197
|
)
|
|||||||||||||||
|
Less: Net derivative gains (losses)
|
485
|
|
(532
|
)
|
(62
|
)
|
114
|
|
825
|
|
357
|
|
130
|
|
1,317
|
|
|||||||||||||||
|
Less: Adjustments related to net investment gains (losses) and net derivative gains (losses)
|
—
|
|
11
|
|
—
|
|
10
|
|
(15
|
)
|
14
|
|
—
|
|
20
|
|
|||||||||||||||
|
Less: Other adjustments to revenues (1)
|
(109
|
)
|
371
|
|
41
|
|
857
|
|
(338
|
)
|
243
|
|
31
|
|
1,096
|
|
|||||||||||||||
|
Total operating revenues
|
$
|
27,984
|
|
$
|
12,251
|
|
$
|
5,287
|
|
$
|
3,263
|
|
$
|
13,390
|
|
$
|
9,127
|
|
$
|
(222
|
)
|
$
|
71,080
|
|
|||||||
|
Total expenses
|
$
|
24,829
|
|
$
|
10,866
|
|
$
|
4,815
|
|
$
|
3,780
|
|
$
|
10,922
|
|
$
|
7,981
|
|
$
|
1,319
|
|
$
|
64,512
|
|
|||||||
|
Less: Adjustments related to net investment gains (losses) and net derivative gains (losses)
|
—
|
|
(3
|
)
|
—
|
|
12
|
|
(175
|
)
|
201
|
|
—
|
|
35
|
|
|||||||||||||||
|
Less: Other adjustments to expenses (1)
|
19
|
|
507
|
|
283
|
|
819
|
|
(64
|
)
|
776
|
|
117
|
|
2,457
|
|
|||||||||||||||
|
Total operating expenses
|
$
|
24,810
|
|
$
|
10,362
|
|
$
|
4,532
|
|
$
|
2,949
|
|
$
|
11,161
|
|
$
|
7,004
|
|
$
|
1,202
|
|
$
|
62,020
|
|
|||||||
__________________
|
(1)
|
See definitions of operating revenues and operating expenses under “— Non-GAAP and Other Financial Disclosures” for the components of such adjustments.
|
116
Consolidated Results — Operating
Year Ended December 31,
2016
Compared with the Year Ended December 31,
2015
Unless otherwise stated, all amounts discussed below are net of income tax.
Overview.
The primary drivers of the decrease in operating earnings were lower investment yields, refinements made to DAC and certain insurance-related liabilities, unfavorable underwriting, the impact of our annual actuarial assumption review and lower asset-based fee income, partially offset by 2015 charges for taxes and related interest expenses, as well as higher net investment income from portfolio growth.
Foreign Currency.
Changes in foreign currency exchange rates had a
$51 million
negative impact on operating earnings compared to 2015.
Unless otherwise stated, all amounts discussed below are net of foreign currency fluctuations. Foreign currency fluctuations can result in significant variances in the financial statement line items.
Business Growth
.
A
$524 million
increase in operating earnings was attributable to business growth.
We benefited from positive net flows from many of our products. As a result, growth in the investment portfolios of our Brighthouse Financial, U.S., Asia and Latin America segments generated higher net investment income.
However, this was partially offset by a corresponding increase in interest credited expense on certain insurance-related liabilities.
In addition,
improved results from our start-up operations also increased operating earnings.
Market Factors
. Market factors, including low interest rates, volatile equity markets, and foreign currency exchange rate fluctuations, continued to impact our investment yields; however, certain impacts were mitigated by derivatives used to hedge these risks. Excluding the impact of changes in foreign currency exchange rates on reported net investment income in our non-U.S. segments and inflation-indexed investments, investment yields decreased. Investment yields were negatively affected by the adverse impact of the low interest rate environment on fixed maturity securities and mortgage loans, as proceeds from maturing investments and the growth in the investment portfolio were invested at lower yields than the portfolio average. In addition, we experienced a decrease in returns on real estate joint ventures and alternative investments. Lower investment earnings on our securities lending program resulted primarily from lower margins due to the impact of a flatter yield curve. These decreases in net investment income were partially offset by higher income on derivatives. In our Brighthouse Financial and MetLife Holdings segments, declines in our average separate account balances resulted in a decrease in asset-based fee income. The changes in market factors discussed above resulted in a
$684 million
decrease in operating earnings.
Underwriting, Actuarial Assumption Review and Other Insurance Adjustments.
Unfavorable underwriting resulted in a
$262 million
decrease in operating earnings as a result of higher non-catastrophe claim costs, less favorable development of prior year non-catastrophe losses and
a charge related to an adjustment to reinsurance receivables in our Asia segment. In addition
, unfavorable mortality and morbidity experience in our Brighthouse Financial and MetLife Holdings segments was partially offset by favorable experience in our Latin America and U.S. segments. The impact of our annual actuarial assumption review, which occurred in both 2016 and 2015, resulted in a
$154 million
decrease in operating earnings. Refinements to DAC and certain insurance-related liabilities, which were recorded in both 2016 and 2015, resulted in a
$643 million
decrease in operating earnings, primarily as a result of the aforementioned 2016 charges in our Brighthouse Financial segment totaling $340 million due to loss recognition testing upon re-segmentation and a 2016
reserve adjustment of $257 million resulting from modeling improvements in the reserving process in our universal life businesses
.
Expenses and Taxes.
Our results for 2015 include the aforementioned
$235 million
charge for interest on uncertain tax positions. In addition, other expenses declined by
$104 million
primarily due to expense savings of
approximately $100 million related to
the
U.S. Retail Advisor Force Divestiture. Excluding these items, expenses were essentially unchanged in total, but included offsetting fluctuations across our businesses. The Company’s effective tax rates differ from the U.S. statutory rate of 35% typically due to non-taxable investment income, tax credits for low income housing, and foreign earnings taxed at lower rates than the U.S. statutory rate. Higher utilization of tax preferenced items and foreign rate differential improved 2016 operating earnings by $41 million over 2015. Our results for 2016 include the following tax items: (i) a $46 million benefit for tax audit settlements, (ii) a $25 million benefit related to a change in the tax rate in Japan, and (iii) a $22 million benefit related to an investment tax credit, partially offset by (iv) a $22 million charge related to the filing of the U.S. federal tax return and (v) a $12 million charge related to a change in the tax rate in Chile. The $25 million benefit in Japan includes a benefit of $20 million that pertains to prior years; the $12 million tax charge in Chile includes a charge of $10 million that pertains to prior years. Our results for 2015 include the following tax items: (i) a charge of $557 million recorded under accounting guidance for the recognition of tax uncertainties, (ii) a benefit of $61 million related to a change in the tax rate in Japan, (iii) a benefit of $60 million related to the restructuring of our business in Chile, (iv) a benefit of $31 million related to the repatriation of earnings from Japan, and (v) a $31 million benefit related to devaluation of the peso in Argentina.
117
Year Ended December 31,
2015
Compared with the Year Ended December 31,
2014
Unless otherwise stated, all amounts discussed below are net of income tax.
Overview.
The primary drivers of the decrease in operating earnings were lower investment yields, a tax charge and a related charge for interest on uncertain tax positions in 2015, less favorable underwriting results and an unfavorable impact from our annual review of actuarial assumptions, partially offset by higher net investment income from portfolio growth.
Foreign Currency
.
Changes in foreign currency exchange rates had a $303 million negative impact on operating earnings compared to 2014.
Business Growth.
We benefited from higher sales and business growth across many of our products. Growth in the investment portfolios of our domestic and Latin America segments generated higher net investment income, which was partially offset by higher surrenders of foreign currency-denominated fixed annuity products in Japan. The changes in business growth discussed above resulted in a $483 million increase in operating earnings.
Market Factors.
Market factors, including the sustained low interest rate environment, continued to impact our investment yields. Excluding the impact of inflation-indexed investments in the Latin America segment, investment yields decreased. Investment yields were negatively impacted by the adverse impact of the sustained low interest rate environment on fixed maturity securities and mortgage loans, as well as by lower returns on other limited partnership interests and our securities lending program. These decreases were partially offset by higher income on currency and interest rate derivatives and higher returns on real estate and real estate joint ventures. The changes in market factors discussed above resulted in a $558 million decrease in operating earnings.
Underwriting, Actuarial Assumption Review and Other Insurance Adjustments.
A $76 million decrease in underwriting results was primarily due to higher non-catastrophe related claim costs, as well as higher catastrophe-related losses in our Property & Casualty businesses, partially offset by favorable mortality. Favorable mortality in our U.S. and Brighthouse Financial segments was partially offset by less favorable mortality in our MetLife Holdings segment. On an annual basis, we review and update our long-term assumptions used in our calculations of certain insurance-related liabilities and DAC. These annual updates, which occurred in both 2015 and 2014, resulted in a net operating earnings decrease of $98 million
and were primarily related to unfavorable DAC unlockings in our MetLife Holdings and Brighthouse Financial segments. Refinements to DAC and certain insurance-related liabilities that were recorded in both 2015 and 2014 resulted in a net decrease of $24 million
in operating earnings. The 2014 refinements include favorable reserve adjustments related to disability premium waivers and a charge related to delayed settlement interest on unclaimed funds held by state governments, in our MetLife Holdings and Brighthouse Financial segments.
Expenses.
In 2015, other expenses include the aforementioned $235 million charge for interest on uncertain tax positions. An additional $77 million increase in expenses was primarily the result of higher employee-related costs and an increase in expenses associated with corporate initiatives and projects, primarily in Asia. These increases were partially offset by
a $117 million accrual in 2014 to increase the litigation reserve related to asbestos, as well as
2014 charges totaling $57 million related to the aforementioned settlement of a licensing matter.
Taxes.
The Company’s 2015 and 2014 effective tax rates differed from the U.S. statutory rate of 35%, primarily due to non-taxable investment income, tax credits for low income housing, and foreign earnings taxed at lower rates than the U.S. statutory rate. Our results for 2015 include the aforementioned tax charge of $557 million recorded under accounting guidance for the recognition of tax uncertainties, partially offset by a $61 million benefit in Japan related to a tax rate change, a tax benefit of $60 million related to restructuring in Chile, a $31 million tax benefit related to the repatriation of earnings from Japan and a $31 million tax benefit related to the devaluation of the peso in Argentina. In 2014, the Company realized a $32 million tax benefit related to the filing of the Company’s U.S. federal tax return. However, this was more than offset by a $41 million tax charge related to tax reform in Chile and an $18 million tax charge related to the aforementioned settlement of a licensing matter which was not deductible for income tax purposes.
118
Segment Results and Corporate & Other
U.S.
Business Overview.
An increase in sales was primarily driven by sales of stable value products, as well as funding agreement issuances in our Retirement and Income Solutions business. In addition, sales of pension risk transfers and structured settlements were slightly higher than in 2015. These increases were partially offset by slightly lower sales in the income annuities and pensions businesses. Changes in premiums for the Retirement and Income Solutions business were almost entirely offset by the related changes in policyholder benefits and claims.
Sales increased 24% compared to 2015 in the Group Benefits business, with strong sales across our core and voluntary products.
In our Property & Casualty business, sales of new policies were slightly lower for both the auto and homeowners lines of business. The number of policies that were not renewed exceeded new policy sales, resulting in a decrease in exposures.
|
|
Years Ended December 31,
|
||||||||||
|
|
2016
|
2015
|
2014
|
||||||||
|
|
(In millions)
|
||||||||||
|
Operating revenues
|
|||||||||||
|
Premiums
|
$
|
21,501
|
|
$
|
20,861
|
|
$
|
20,243
|
|
||
|
Universal life and investment-type product policy fees
|
989
|
|
943
|
|
909
|
|
|||||
|
Net investment income
|
6,206
|
|
6,209
|
|
6,111
|
|
|||||
|
Other revenues
|
784
|
|
751
|
|
721
|
|
|||||
|
Total operating revenues
|
29,480
|
|
28,764
|
|
27,984
|
|
|||||
|
Operating expenses
|
|||||||||||
|
Policyholder benefits and claims and policyholder dividends
|
21,558
|
|
20,837
|
|
20,110
|
|
|||||
|
Interest credited to policyholder account balances
|
1,302
|
|
1,216
|
|
1,168
|
|
|||||
|
Capitalization of DAC
|
(471
|
)
|
(493
|
)
|
(488
|
)
|
|||||
|
Amortization of DAC and VOBA
|
471
|
|
471
|
|
458
|
|
|||||
|
Interest expense on debt
|
9
|
|
4
|
|
12
|
|
|||||
|
Other operating expenses
|
3,706
|
|
3,685
|
|
3,550
|
|
|||||
|
Total operating expenses
|
26,575
|
|
25,720
|
|
24,810
|
|
|||||
|
Provision for income tax expense (benefit)
|
988
|
|
1,040
|
|
1,073
|
|
|||||
|
Operating earnings
|
$
|
1,917
|
|
$
|
2,004
|
|
$
|
2,101
|
|
||
Year Ended December 31,
2016
Compared with the Year Ended December 31,
2015
Unless otherwise stated, all amounts discussed below are net of income tax.
Business Growth.
The impact of deposits, funding agreement issuances and increased premiums in 2016 resulted in higher average invested assets, improving net investment income. However, consistent with the growth in average invested assets from increased premiums, interest credited on long-duration contracts increased. An increase in average premium per policy in both our auto and homeowners businesses improved operating earnings. In addition, an increase in other operating expenses, mainly the result of growth across the segment, was more than offset by the remaining increase in premiums, fees and other revenues. The combined impact of the items discussed above increased operating earnings by $175 million.
119
Market Factors
. Market factors, including
low interest rates, volatile equity markets, and foreign currency exchange rate fluctuations, continued to impact our investment yields; however, certain impacts were mitigated by derivatives used to hedge these risks.
Investment yields decreased as a result of the impact of the low interest rate environment on fixed maturity securities and mortgage loans, as
proceeds from maturing investments and the growth in the investment portfolio were invested at lower yields than the portfolio average. In addition, lower returns on
alternative investments, other limited partnership interests and lower prepayment fees reduced yields. Lower investment earnings on our securities lending program resulted primarily from lower margins due to the impact of a flatter yield curve. These unfavorable changes were partially offset by higher income on derivatives and real estate. Certain of our funding agreements and guaranteed interest contract liabilities have interest credited rates that are contractually tied to current market rates, specifically the 3-month LIBOR and, as a result, a higher average interest credited rate drove an increase in interest credited expense. However, consistent with the decrease in yields on average invested assets, interest credited on certain long-duration insurance contracts decreased.
The changes in market factors discussed above resulted in a $147 million decrease in operating earnings.
Underwriting and Other Insurance Adjustments.
Favorable claims experience in our individual disability and voluntary businesses were partially offset by unfavorable claims experience in our group disability and dental businesses and resulted in a $12 million increase in operating earnings. Favorable mortality in 2016, mainly due to favorable claims experience in our life business, resulted in a $26 million increase in operating earnings. Less favorable mortality from our pension risk transfer business and specialized life insurance products resulted in a $10 million decrease in operating earnings. In our Property & Casualty business, non-catastrophe claim costs increased by $85 million, resulting from higher frequencies and severities in both our auto and homeowners businesses, as well as an increase in claims adjustment expenses. In addition, less favorable development of prior year non-catastrophe losses reduced operating earnings by $43 million. These increases were partially offset by a decrease in catastrophe losses, which improved operating earnings by $3 million. Refinements to certain insurance and other liabilities, which were recorded in both 2016 and 2015, resulted in a $25 million decrease in operating earnings.
Year Ended December 31,
2015
Compared with the Year Ended December 31,
2014
Unless otherwise stated, all amounts discussed below are net of income tax.
Business Growth
. An increase in average premium per policy in both our auto and homeowners businesses improved operating earnings. Growth in premiums, deposits and funding agreement issuances in 2015, as well as an increase in allocated equity resulted in higher average invested assets, improving net investment income. However, consistent with the growth in average invested assets from increased premiums, deposits and funding agreement issuances, interest credited on long-duration contracts increased. An increase in the annual assessment of the PPACA fee increased other expenses in 2015; however, the impact of the assessment was significantly offset by a related increase in premiums from our dental business. In addition, an increase in other operating expenses, mainly the result of growth across the segment, was more than offset by the remaining increase in premiums, fees and other revenues. The combined impact of the items discussed above increased operating earnings by $120 million.
Market Factors
. Market factors, including sustained low interest rates and volatile equity markets, continued to impact our investment yields. The sustained low interest rate environment drove lower investment yields on our fixed maturity securities and mortgage loans. Yields were also negatively impacted by a reduction in the size of our securities lending program. In addition, weaker equity markets in 2015 resulted in lower returns on other limited partnership interests, which were partially offset by higher returns on alternative investments and interest rate derivatives. Many of our funding agreements and guaranteed interest contract liabilities have interest credited rates that are contractually tied to external indices and, as a result, we set lower interest credited rates on new business, as well as on existing business with terms that can fluctuate. The combined impact of lower investment returns partially offset by lower interest credited expense, resulted in a decrease in operating earnings of $95 million.
120
Underwriting and Other Insurance Adjustments
. In our Property & Casualty business, non-catastrophe claim costs increased $63 million, the result of higher severities in both our auto and homeowners businesses, as well as an increase in frequencies in our auto business, partially offset by lower frequencies in our homeowners businesses. In addition, catastrophe-related losses increased by $48 million, mainly due to severe winter weather in 2015. Further, less favorable development of prior year non-catastrophe losses resulted in a slight decrease to operating earnings. Less favorable reserve development in our dental business was partially offset by favorable morbidity experience in our individual and group disability businesses, resulting in a $31 million decrease in operating earnings. Less favorable mortality in our structured settlement and income annuity businesses was partially offset by more favorable mortality from our pension risk transfer and specialized life insurance products, and resulted in a $10 million decrease in operating earnings. Our life and AD&D businesses experienced favorable mortality in 2015, mainly due to favorable claims experience, which resulted in a $48 million increase in operating earnings. Refinements to certain insurance and other liabilities, which were recorded in both 2015 and 2014, resulted in an $8 million decrease in operating earnings.
Asia
Business Overview.
Sales decreased compared to 2015 primarily due to management actions taken to improve product value in the region. In Japan, we have seen a successful shift in sales to foreign currency denominated life products from yen denominated life products, although sales of accident and health products packaged with yen denominated life products declined. Sales increased in emerging markets, including China and Bangladesh, mainly due to business growth.
|
|
Years Ended December 31,
|
||||||||||
|
|
2016
|
2015
|
2014
|
||||||||
|
|
(In millions)
|
||||||||||
|
Operating revenues
|
|||||||||||
|
Premiums
|
$
|
6,902
|
|
$
|
6,937
|
|
$
|
7,566
|
|
||
|
Universal life and investment-type product policy fees
|
1,487
|
|
1,542
|
|
1,693
|
|
|||||
|
Net investment income
|
2,707
|
|
2,675
|
|
2,886
|
|
|||||
|
Other revenues
|
61
|
|
105
|
|
106
|
|
|||||
|
Total operating revenues
|
11,157
|
|
11,259
|
|
12,251
|
|
|||||
|
Operating expenses
|
|||||||||||
|
Policyholder benefits and claims and policyholder dividends
|
5,191
|
|
5,275
|
|
5,724
|
|
|||||
|
Interest credited to policyholder account balances
|
1,298
|
|
1,309
|
|
1,544
|
|
|||||
|
Capitalization of DAC
|
(1,668
|
)
|
(1,720
|
)
|
(1,914
|
)
|
|||||
|
Amortization of DAC and VOBA
|
1,224
|
|
1,256
|
|
1,397
|
|
|||||
|
Amortization of negative VOBA
|
(208
|
)
|
(309
|
)
|
(364
|
)
|
|||||
|
Other operating expenses
|
3,586
|
|
3,611
|
|
3,975
|
|
|||||
|
Total operating expenses
|
9,423
|
|
9,422
|
|
10,362
|
|
|||||
|
Provision for income tax expense (benefit)
|
492
|
|
457
|
|
582
|
|
|||||
|
Operating earnings
|
$
|
1,242
|
|
$
|
1,380
|
|
$
|
1,307
|
|
||
Year Ended December 31,
2016
Compared with the Year Ended December 31,
2015
Unless otherwise stated, all amounts discussed below are net of income tax.
Following a change in the foreign investment law in India, the Company no longer consolidates its India operating joint venture, effective January 1, 2016. While this change in accounting does affect the comparability of the financial statement line items, it did not have a significant impact on operating earnings and, therefore, is not discussed below.
Foreign Currency
. The impact of changes in foreign currency exchange rates increased operating earnings by $46 million for 2016 compared to 2015 primarily due to the strengthening of the Japanese yen against the U.S. dollar. Unless otherwise stated, all amounts discussed below are net of foreign currency fluctuations. Foreign currency fluctuations can result in significant variances in the financial statement line items.
121
Business Growth.
Positive net flows in Japan and Korea resulted in higher average invested assets and an increase in net investment income. Asia’s premiums and fees decreased from 2015 mainly driven by lower fixed annuity surrenders and the shift from premium-based to fee-based products in 2016. The discontinuation of single premium products in our accident & health business in Japan in the third quarter of 2015 also contributed to the decline in premiums. Changes in premiums for these businesses were partially offset by related changes in policyholder benefits. The combined impact of the items discussed above improved operating earnings by $64 million.
Market Factors.
Market factors, including low interest rates, volatile equity markets, and foreign currency exchange rate fluctuations, continued to impact our investment yields; however, certain impacts were mitigated by derivatives used to hedge these risks. Investment returns were unfavorably impacted by lower interest rates on fixed maturity securities, and the impact of
incremental income recognized in
2015 from the recovery of a previously impaired mortgage loan, both in Japan. The decreases in investment returns were partially offset by the favorable impact of increased sales of foreign currency-denominated fixed annuities in Japan, primarily in its Australian currency-denominated portfolio, which drove an increase in higher yielding foreign currency-denominated fixed maturity securities, as well as higher returns on other limited partnership interests. Lower investment yields, partially offset by the impact of credit and foreign currency hedges, decreased operating earnings by $113 million.
Underwriting, Actuarial Assumption Review and Other Insurance Adjustments.
Our results for 2016 include a $44 million charge related to an adjustment to reinsurance receivables in Australia. Excluding this charge, lower fixed annuity surrender gains and higher lapses in Japan, partially offset by favorable claims experience in Australia and Korea, decreased operating earnings by $15 million. The impact of our annual actuarial assumption review, which occurred in both 2016 and 2015, resulted in a net decrease of $35 million in operating earnings. Refinements to certain insurance and other liabilities, which were recorded in 2016, resulted in a $36 million increase in operating earnings.
Expenses and Taxes
. An increase in expenses, primarily driven by costs associated with growth of our agency channel in Hong Kong, information technology, and marketing, partially offset by lower consumption tax in Japan and a decline in corporate overhead, reduced operating earnings by $13 million. Results for 2016 include a $25 million tax benefit related to a change in the corporate tax rate in Japan (which includes a benefit of $20 million that pertains to prior periods). Results for 2015 include tax benefits of $61 million related to a change in tax rates, $12 million for the settlement of an audit and $15 million related to the U.S. taxation of dividends, each related to Japan, as well as a $6 million tax refund in Korea in 2015 related to unclaimed surrender value.
Year Ended December 31,
2015
Compared with the Year Ended December 31,
2014
Unless otherwise stated, all amounts discussed below are net of income tax.
Foreign Currency
. The impact of changes in foreign currency exchange rates reduced operating earnings by $126 million for 2015 compared to 2014 as a result of the weakening of the yen against the U.S. dollar.
This resulted in significant variances on the financial statement line items.
Business Growth
. Asia’s premiums, fees and other revenues increased over the prior year driven by broad based in-force growth across the region, including growth in our ordinary life and accident & health businesses in Japan and Korea, as well as our group insurance business in Australia. Changes in premiums for these businesses were partially offset by related changes in policyholder benefits. During the period, surrenders of foreign currency-denominated fixed annuity products in Japan also contributed to higher fee income. The impact of these surrenders, partially offset by positive net flows in Korea, Bangladesh and India, resulted in lower average invested assets and a decrease in net investment income. In addition, a decrease in interest credited expenses was partially offset by increases in amortization of DAC and VOBA, commissions and variable expenses (net of DAC capitalization), primarily related to the establishment of an agency channel in Hong Kong. The combined impact of the items discussed above improved operating earnings by $61 million.
Market Factors
. Investment returns were positively impacted by higher net investment income resulting from the recovery of a previously impaired mortgage loan in Japan, improved operating results from our China joint venture and higher interest rates on fixed maturity securities in Bangladesh. These improved investment returns were partially offset by the impact of lower interest rates on fixed maturity securities in Korea and the impact in Japan of continued growth of lower yielding Japanese government securities. The decrease in returns from Japanese government securities was offset by the favorable impact of increased foreign currency-denominated fixed annuities in Japan driving an increase in higher yielding foreign currency-denominated fixed maturity securities.
Higher investment yields, combined with the impact of foreign currency hedges, increased operating earnings by $38 million.
122
Underwriting and Actuarial Assumption Review
.
Favorable claims experience, primarily in Japan resulted in a $15 million increase in operating earnings. In addition, on an annual basis, we review and update our long-term assumptions used in our calculations of certain insurance-related liabilities and DAC. This annual update resulted in a net operating earnings increase of $22 million.
Expenses and Taxes
.
Higher expenses, primarily driven by costs associated with corporate initiatives and projects, reduced operating earnings by $32 million. Our 2015 results include tax benefits of $61 million related to a change in tax rates, $12 million for the settlement of an audit and $15 million related to the U.S. taxation of dividends, each related to Japan. In addition, in 2015, Korea received a tax refund of $6 million related to unclaimed surrender value. Our 2014 results include tax benefits of $9 million related to the U.S. taxation of dividends and $4 million resulting from a tax rate change, each related to Japan.
Latin America
Business Overview.
Total sales for Latin America increased over 2015. The region experienced
higher medical, accident & health and property & casualty sales, partially offset by lower sales of pension and life products.
|
|
Years Ended December 31,
|
||||||||||
|
|
2016
|
2015
|
2014
|
||||||||
|
|
(In millions)
|
||||||||||
|
Operating revenues
|
|||||||||||
|
Premiums
|
$
|
2,529
|
|
$
|
2,581
|
|
$
|
2,796
|
|
||
|
Universal life and investment-type product policy fees
|
1,025
|
|
1,117
|
|
1,239
|
|
|||||
|
Net investment income
|
1,084
|
|
1,038
|
|
1,219
|
|
|||||
|
Other revenues
|
34
|
|
41
|
|
33
|
|
|||||
|
Total operating revenues
|
4,672
|
|
4,777
|
|
5,287
|
|
|||||
|
Operating expenses
|
|||||||||||
|
Policyholder benefits and claims and policyholder dividends
|
2,443
|
|
2,408
|
|
2,615
|
|
|||||
|
Interest credited to policyholder account balances
|
328
|
|
349
|
|
394
|
|
|||||
|
Capitalization of DAC
|
(321
|
)
|
(341
|
)
|
(377
|
)
|
|||||
|
Amortization of DAC and VOBA
|
184
|
|
271
|
|
313
|
|
|||||
|
Amortization of negative VOBA
|
(1
|
)
|
(1
|
)
|
(1
|
)
|
|||||
|
Interest expense on debt
|
2
|
|
—
|
|
—
|
|
|||||
|
Other operating expenses
|
1,336
|
|
1,429
|
|
1,588
|
|
|||||
|
Total operating expenses
|
3,971
|
|
4,115
|
|
4,532
|
|
|||||
|
Provision for income tax expense (benefit)
|
158
|
|
37
|
|
129
|
|
|||||
|
Operating earnings
|
$
|
543
|
|
$
|
625
|
|
$
|
626
|
|
||
Year Ended December 31,
2016
Compared with the Year Ended December 31,
2015
Unless otherwise stated, all amounts discussed below are net of income tax.
Foreign Currency
. The impact of changes in foreign currency exchange rates decreased operating earnings by $81 million for 2016 as compared to 2015 mainly due to the weakening of the Mexican and
Argentinean
pesos against the U.S. dollar. Unless otherwise stated, all amounts discussed below are net of foreign currency fluctuations. Foreign currency fluctuations can result in significant variances in the financial statement line items.
Business Growth
. Latin America experienced business growth across several lines of business within Mexico, Chile and Argentina. This business growth resulted in increased premiums and policy fee income which was partially offset by the related changes in policyholder benefits. Positive net flows, primarily from Chile, Mexico and Argentina, resulted in an increase in average invested assets and generated higher net investment income. This was partially offset by an increase in interest credited expense on certain insurance liabilities. Business growth also drove an increase in operating expenses, commissions and DAC amortization, which were partially offset by higher DAC capitalization. The items discussed above resulted in a $59 million increase in operating earnings.
123
Market Factors
. Changes in market factors resulted in a $17 million increase to operating earnings as higher investment yields were partially offset by higher interest credited expense. An increase in investment yields was primarily driven by a 2016 change in the crediting rate on allocated equity in Mexico, Chile and Argentina, as well as higher yields from fixed maturity securities in Mexico. These increases were partially offset by lower returns on fixed maturity securities, alternative investments and mortgage loans in Chile.
Underwriting, Actuarial Assumption Review and Other Insurance Adjustments
. Favorable underwriting resulted in a $38 million increase in operating earnings driven by lower claims experience in Mexico and Chile. The impact of the annual actuarial assumption review, which occurred in both 2016 and 2015, resulted in a net operating earnings increase of $16 million. Refinements to certain insurance liabilities and other adjustments in both 2016 and 2015 resulted in a $26 million decrease to operating earnings.
Taxes
.
Effective September 1, 2015, AFP ProVida was merged into MetLife Chile Acquisition Company resulting in an income tax benefit of $60 million in 2015. In the first quarter of 2016, our Chilean businesses, including ProVida, incurred a tax charge of $12 million as a result of tax reform legislation in Chile (including a charge of $10 million that pertains to prior periods). In addition, other tax-related adjustments in both 2016 and 2015 resulted in a net decrease in operating earnings of $20 million. These adjustments were mainly driven by tax charges related to the filing of local tax returns in Mexico and Chile in 2016 and a tax benefit in 2015 due to the devaluation of the peso in Argentina, partially offset by a 2016 tax benefit due to inflation in Argentina.
Year Ended December 31,
2015
Compared with the Year Ended December 31,
2014
Unless otherwise stated, all amounts discussed below are net of income tax.
Foreign Currency
.
The impact of changes in foreign currency exchange rates decreased operating earnings by $111 million for 2015 compared to 2014 mainly due to the weakening of the peso against the U.S. dollar, which included the impact of changes in foreign currency exchange rates related to the tax charge resulting from tax reform in Chile, as discussed further below.
Business Growth
.
Total sales for the region decreased primarily due to the impact of a large contract in Mexico in 2014. Excluding this large contract, sales increased due to organic growth in several countries but the resulting increase in premiums was partially offset by related changes in policyholder benefits. An increase in average invested assets, primarily in Chile and Mexico, generated higher net investment income. Growth in our businesses resulted in higher policy fee income, as well as increased marketing costs and commissions, which were partially offset by increased DAC capitalization. The items discussed above were the primary drivers of a $135 million increase in operating earnings.
Market Factors
.
The net impact of changes in market factors resulted in an $83 million decrease in operating earnings, driven by lower investment yields and higher interest credited expense. Investment yields decreased on fixed income securities in Chile and Mexico and we experienced lower investment returns on alternative investments in Chile.
Underwriting and Other Insurance Adjustments
.
Unfavorable claims experience in several countries decreased operating earnings by $9 million. Refinements to DAC and other adjustments recorded in both 2015 and 2014 resulted in a $10 million increase in operating earnings.
Expenses and Taxes
.
Effective September 1, 2015, ProVida was merged into MetLife Chile Acquisition Company resulting in an income tax benefit of $60 million in 2015. In the third quarter of 2014, our Chilean businesses, including ProVida, incurred a tax charge of $41 million ($33 million after adjusting for foreign currency fluctuations) as a result of tax reform in Chile. Other tax-related adjustments in both 2015 and 2014 decreased operating earnings by $18 million. These tax-related adjustments include tax charges related to inflation in Chile and Mexico, as well as a 2014 refund claim in Argentina, partially offset by a benefit resulting from the devaluation of the peso in Argentina in both 2015 and 2014. In addition, employee-related costs, which include inflation, were higher across several countries, resulting in an $18 million decrease in operating earnings.
124
EMEA
Business Overview.
Sales increased in 2016 due to growth in the Middle East and the U.K., partially offset by strong 2015 sales in Poland.
|
|
Years Ended December 31,
|
||||||||||
|
|
2016
|
2015
|
2014
|
||||||||
|
|
(In millions)
|
||||||||||
|
Operating revenues
|
|||||||||||
|
Premiums
|
$
|
2,027
|
|
$
|
2,036
|
|
$
|
2,309
|
|
||
|
Universal life and investment-type product policy fees
|
391
|
|
424
|
|
466
|
|
|||||
|
Net investment income
|
318
|
|
326
|
|
428
|
|
|||||
|
Other revenues
|
73
|
|
61
|
|
60
|
|
|||||
|
Total operating revenues
|
2,809
|
|
2,847
|
|
3,263
|
|
|||||
|
Operating expenses
|
|||||||||||
|
Policyholder benefits and claims and policyholder dividends
|
1,067
|
|
988
|
|
1,053
|
|
|||||
|
Interest credited to policyholder account balances
|
112
|
|
120
|
|
148
|
|
|||||
|
Capitalization of DAC
|
(403
|
)
|
(472
|
)
|
(680
|
)
|
|||||
|
Amortization of DAC and VOBA
|
408
|
|
497
|
|
613
|
|
|||||
|
Amortization of negative VOBA
|
(13
|
)
|
(16
|
)
|
(31
|
)
|
|||||
|
Other operating expenses
|
1,323
|
|
1,469
|
|
1,846
|
|
|||||
|
Total operating expenses
|
2,494
|
|
2,586
|
|
2,949
|
|
|||||
|
Provision for income tax expense (benefit)
|
42
|
|
21
|
|
29
|
|
|||||
|
Operating earnings
|
$
|
273
|
|
$
|
240
|
|
$
|
285
|
|
||
Year Ended December 31,
2016
Compared with the Year Ended December 31,
2015
Unless otherwise stated, all amounts discussed below are net of income tax.
Foreign Currency
. The impact of changes in foreign currency exchange rates reduced operating earnings by $16 million for 2016 as compared to 2015, primarily driven by the strengthening of the U.S. dollar against the British pound, Turkish lira, Egyptian pound and Polish zloty. Unless otherwise stated, all amounts discussed below are net of foreign currency fluctuations. Foreign currency fluctuations can result in significant variances in the financial statement line items.
Business Growth
. Operating earnings increased by $35 million as a result of business growth mainly in the employee benefits business in the Middle East and the U.K.
Underwriting, Actuarial Assumption Review and Other Insurance Adjustments
. Favorable underwriting, primarily in our accident & health business in Greece, was largely offset by unfavorable underwriting, primarily in our employee benefits business and resulted in an operating earnings increase of $2 million. The impact of the annual actuarial assumption review, which occurred in both 2016 and 2015, resulted in a net operating earnings decrease of $22 million. Refinements to certain insurance liabilities and other adjustments in 2016 resulted in a $4 million increase to operating earnings.
Expenses.
Operating earnings increased by $43 million primarily due to expense discipline across the region and lower allocated corporate overhead expenses.
Taxes and Other
. The Company received tax benefits in both 2016 and 2015; however, since the 2015 benefit exceeded the 2016 benefit, operating earnings decreased by $19 million. Operating earnings for 2015 were positively impacted by the conversion to calendar year reporting for certain of our subsidiaries; however, this was offset by certain one-time items, including re-branding and legal expenses. Our 2016 operating earnings benefited from the cancellation of a distribution agreement with one of our bancassurance partners, which improved operating earnings by $3 million.
Year Ended December 31,
2015
Compared with the Year Ended December 31,
2014
Unless otherwise stated, all amounts discussed below are net of income tax.
125
Foreign Currency
.
The impact of changes in foreign currency exchange rates reduced operating earnings by $66 million for 2015 as compared to 2014, primarily driven by the strengthening of the U.S. dollar against the euro, Russian ruble and Polish zloty.
Business Growth
.
Operating earnings benefited from growth in the Middle East, primarily in the Gulf and Turkey, as well as growth in the U.K., increasing operating earnings by $30 million.
Actuarial Assumption Review.
On an annual basis, we review and update our long-term assumptions used in our calculations of certain insurance-related liabilities and DAC. These annual updates, which occurred in both 2015 and 2014, resulted in a net operating earnings decrease of $4 million. In addition, operating earnings increased by $5 million due to a 2014 refinement of DAC in the U.K.
Taxes and Other.
The Company had a number of one-time items in both 2015 and 2014, including tax benefits, the conversion of certain of our subsidiaries to calendar year reporting, as well as re-branding and legal expenses. The combined impact of these items decreased operating earnings by $3 million. In addition, our 2014 results included a $7 million benefit related to pension reform in Poland.
MetLife Holdings
Business Overview.
As a result of the proposed Separation and the U.S. Retail Advisor Force Divestiture, we have discontinued the marketing of life and annuity products in this segment, which has led to lower sales. This will result in a declining DAC asset over time and we anticipate an average decline in premiums, fees and other revenues of approximately 5% per year from expected business run-off. A significant portion of our operating earnings is driven by separate account balances. Most directly, these balances determine asset-based fee income but they also impact DAC amortization and asset-based commissions. Separate account balances are driven by sales, movements in the market, surrenders, withdrawals, benefit payments, transfers and policy charges. Separate account balances increased due to equity market performance, partially offset by the impact of negative net flows, as benefits, surrenders and withdrawals exceeded sales. While net flows are still negative, we are seeing stability in surrenders and withdrawals. Although we have discontinued selling our long-term care product, we continue to collect premiums and administer the existing block of business, which contributed to asset growth in the segment, and we expect the related reserves to grow as this block matures.
|
|
Years Ended December 31,
|
||||||||||
|
|
2016
|
2015
|
2014
|
||||||||
|
|
(In millions)
|
||||||||||
|
Operating revenues
|
|||||||||||
|
Premiums
|
$
|
4,506
|
|
$
|
4,545
|
|
$
|
4,545
|
|
||
|
Universal life and investment-type product policy fees
|
1,436
|
|
1,482
|
|
1,374
|
|
|||||
|
Net investment income
|
5,944
|
|
6,201
|
|
6,409
|
|
|||||
|
Other revenues
|
581
|
|
930
|
|
1,062
|
|
|||||
|
Total operating revenues
|
12,467
|
|
13,158
|
|
13,390
|
|
|||||
|
Operating expenses
|
|||||||||||
|
Policyholder benefits and claims and policyholder dividends
|
7,534
|
|
7,357
|
|
7,217
|
|
|||||
|
Interest credited to policyholder account balances
|
1,042
|
|
1,062
|
|
1,098
|
|
|||||
|
Capitalization of DAC
|
(281
|
)
|
(410
|
)
|
(326
|
)
|
|||||
|
Amortization of DAC and VOBA
|
736
|
|
577
|
|
444
|
|
|||||
|
Interest expense on debt
|
57
|
|
55
|
|
58
|
|
|||||
|
Other operating expenses
|
2,392
|
|
2,694
|
|
2,670
|
|
|||||
|
Total operating expenses
|
11,480
|
|
11,335
|
|
11,161
|
|
|||||
|
Provision for income tax expense (benefit)
|
288
|
|
581
|
|
714
|
|
|||||
|
Operating earnings
|
$
|
699
|
|
$
|
1,242
|
|
$
|
1,515
|
|
||
Year Ended December 31,
2016
Compared with the Year Ended December 31,
2015
Unless otherwise stated, all amounts discussed below are net of income tax.
126
Business Growth
. Net investment income increased slightly resulting from a larger invested asset base. Net asset growth in our life, annuities and long-term care businesses was largely offset by negative net flows as a result of the recapture of two assumed single-premium deferred annuity reinsurance agreements (by affiliates included in the Brighthouse Financial segment), which decreased our invested asset base. Consistent with the aforementioned asset growth, interest credited on insurance liabilities also increased. Lower universal life sales resulted in lower fee income. Additionally, operating earnings increased since the operating loss from broker-dealer operations was included in the U.S. Retail Advisor Force Divestiture; this also resulted in declines in both revenues and expenses. The combined impact of the items discussed above resulted in a $6 million decrease in operating earnings.
Market Factors
. Market factors, including low interest rates, volatile equity markets, and foreign currency exchange rate fluctuations, continued to impact our investment yields; however, certain impacts were mitigated by derivatives used to hedge these risks. Investment yields decreased on our fixed maturity securities as proceeds from maturing investments and the growth in the investment portfolio were invested at lower yields than the portfolio average. We also had lower income on derivatives and alternative investments. These decreases in net investment income were partially offset by higher returns on private equities. In our deferred annuity business, lower equity returns in 2015 drove a decline in average separate account balances which resulted in a decrease in asset-based fee income in 2016 relative to 2015. This decrease was partially offset by lower average interest crediting rates and declines in DAC amortization. The changes in market factors discussed above resulted in a $189 million decrease in operating earnings.
Underwriting, Actuarial Assumption Review and Other Insurance Adjustments
. Unfavorable mortality, primarily in our universal life business, and unfavorable claim experience in our long-term care business resulted in a $58 million decrease in operating earnings. The impact of our annual actuarial assumption review, which occurred in both 2016 and 2015, resulted in a net operating earnings decrease of $34 million and was primarily related to unfavorable DAC unlockings. Refinements to DAC and certain insurance-related liabilities that were recorded in both 2016 and 2015, including a 2016 reserve adjustment resulting from modeling improvements in the reserving process in our universal life business, resulted in a $165 million decrease in operating earnings.
Expenses
. Operating earnings increased by $78 million as a result of lower expenses, primarily due to lower costs as a result of the U.S. Retail Advisor Force Divestiture.
Other.
Annuities reinsurance activity with affiliates that are included in the Brighthouse Financial segment decreased operating earnings by $160 million. This was primarily due to t
he
aforementioned recapture of certain single-premium deferred annuity reinsurance agreements that resulted in unfavorable recapture settlements and an increase in the related DAC amortization, partially offset by lower interest credited on the related reinsurance payables. The impact of the lower interest credited was largely offset by the lower net investment income earned on the assets transferred in connection with the recapture. Unfavorable results from our reinsurance agreement with our former operating joint venture in Japan resulted in a $14 million decrease in operating earnings.
Year Ended December 31,
2015
Compared with the Year Ended December 31,
2014
Unless otherwise stated, all amounts discussed below are net of income tax.
Business Growth
. A larger invested asset base, driven by positive net flows in our life business and an increase in allocated equity, generated higher net investment income. This was partially offset by higher interest credited on long-duration contracts consistent with the growth in average invested assets in our long-term care product. Declines in broker-dealer revenue also decreased operating earnings. The combined impact of the items discussed above increased operating earnings by $45 million.
Market Factors
. Market factors, including sustained low interest rates and volatile equity markets, continued to impact our investment yields. The sustained low interest rate environment resulted in a decline in net investment income on our fixed maturity securities as proceeds from maturing investments were reinvested at lower yields. This reduction in 2015 income from lower yields was partially offset by lower interest credited expense in our deferred annuities business as a result of declines in average interest credited rates. The decline in yields was also partially offset by higher returns on real estate, real estate joint ventures and alternative investments. The changes in market factors discussed above resulted in a $182 million decrease in operating earnings.
127
Underwriting, Actuarial Assumption Review and Other Insurance Adjustments
. Less favorable mortality in both our universal life and traditional life businesses resulted in a net decrease of $40 million in operating earnings. Favorable claims experience in our long-term care business, due to higher net closures and the impact of lapses on certain insurance-related liabilities, increased operating earnings by $16 million. On an annual basis, we review and update our long-term assumptions used in our calculations of certain insurance-related liabilities and DAC. These annual updates, which occurred in both 2015 and 2014, resulted in a net operating earnings decrease of $77 million and were primarily related to unfavorable DAC unlockings in the life businesses. Refinements to DAC and certain insurance-related liabilities that were recorded in both 2015 and 2014 resulted in a decrease in operating earnings of $14 million, primarily driven by certain 2014 adjustments in both our life and annuity businesses. The 2014 refinements include favorable reserve adjustments related to disability premium waivers and a charge related to delayed settlement interest on unclaimed funds held by state governments.
Expenses.
A $23 million increase in expenses was primarily related to higher employee-related and project-related costs.
Other.
Favorable results from our reinsurance agreement with our former operating joint venture in Japan contributed $38 million to operating earnings. Annuities reinsurance activity with affiliates that are reported in the Brighthouse Financial segment had a net unfavorable impact to operating earnings of $18 million.
Brighthouse Financial
Business Overview.
Sales from our life business decreased by 27% from 2015, primarily as a result of the U.S. Retail Advisor Force Divestiture. Annuity sales decreased by 23%, primarily driven by a 42% decrease in variable annuity sales as a result of the proposed Separation and the suspension of sales through one distributor. In our annuities business, despite positive market performance in 2016, average separate account balances decreased primarily due to higher negative net flows and the impact of a significant equity market decline in the third quarter of 2015, which was not fully reflected in the 2015 average asset balance.
|
|
Years Ended December 31,
|
||||||||||
|
|
2016
|
2015
|
2014
|
||||||||
|
|
(In millions)
|
||||||||||
|
Operating revenues
|
|||||||||||
|
Premiums
|
$
|
1,222
|
|
$
|
1,675
|
|
$
|
1,474
|
|
||
|
Universal life and investment-type product policy fees
|
3,491
|
|
3,718
|
|
3,963
|
|
|||||
|
Net investment income
|
3,503
|
|
3,327
|
|
3,156
|
|
|||||
|
Other revenues
|
735
|
|
422
|
|
534
|
|
|||||
|
Total operating revenues
|
8,951
|
|
9,142
|
|
9,127
|
|
|||||
|
Operating expenses
|
|||||||||||
|
Policyholder benefits and claims and policyholder dividends
|
3,200
|
|
2,875
|
|
2,711
|
|
|||||
|
Interest credited to policyholder account balances
|
1,162
|
|
1,255
|
|
1,275
|
|
|||||
|
Capitalization of DAC
|
(333
|
)
|
(399
|
)
|
(397
|
)
|
|||||
|
Amortization of DAC and VOBA
|
1,073
|
|
731
|
|
810
|
|
|||||
|
Interest expense on debt
|
128
|
|
128
|
|
133
|
|
|||||
|
Other operating expenses
|
2,338
|
|
2,484
|
|
2,472
|
|
|||||
|
Total operating expenses
|
7,568
|
|
7,074
|
|
7,004
|
|
|||||
|
Provision for income tax expense (benefit)
|
361
|
|
555
|
|
570
|
|
|||||
|
Operating earnings
|
$
|
1,022
|
|
$
|
1,513
|
|
$
|
1,553
|
|
||
Year Ended December 31,
2016
Compared with the Year Ended December 31,
2015
Unless otherwise stated, all amounts discussed below are net of income tax.
Business Growth
. A $228 million increase in operating earnings was attributable to business growth, primarily due to higher net investment income resulting from a larger invested asset base. Almost half of this increase resulted from the recapture of reinsurance agreements (from an affiliate that is included in the MetLife Holdings segment) covering certain single-premium deferred annuity contracts, with the remainder due primarily to a capital contribution from MetLife, Inc. in early 2016 and positive net flows in our general account from our annuities and life businesses, partially offset by funding agreement repayments in our run-off business.
128
Market Factors
.
Market factors, including low interest rates, volatile equity markets, and foreign currency exchange rate fluctuations, continued to impact our investment yields; however, certain impacts were mitigated by derivatives used to hedge these risks.
Investment yields on fixed maturity securities and mortgage loans decreased as a result of the low interest rate environment, as proceeds from maturing investments and the growth in the investment portfolio were invested at lower yields than the portfolio average. Additionally, we recognized lower returns on real estate joint ventures and lower investment earnings on our securities lending program primarily as a result of lower margins due to the impact of a flatter yield curve. These unfavorable yield impacts were partially offset by higher income on derivatives. Higher returns on other limited partnership interests also increased income. In our annuities business, lower equity returns in 2015 drove a decline in our average separate account balances which resulted in a decrease in asset-based fee income in 2016 relative to 2015. In addition, we experienced higher costs associated with our variable annuity GMDBs, partially offset by lower average interest crediting rates on deferred annuities and lower DAC amortization.
The changes in market factors discussed above resulted in a $225 million decrease in operating earnings.
Underwriting, Actuarial Assumption Review and Other Insurance Adjustments
. Unfavorable mortality experience in our universal life business and less favorable mortality experience in our income annuities business, as compared to 2015, resulted in a net decrease in operating earnings of $82 million. The impact of our annual actuarial assumption review, which occurred in both 2016 and 2015, resulted in a net operating earnings decrease of $79 million and was primarily related to unfavorable DAC unlockings in our variable annuity business. Refinements, primarily to DAC and certain insurance-related liabilities recorded in 2016, resulted in a decrease in operating earnings of $467 million. This decrease was primarily driven by a $254 million charge in the third quarter of 2016, mostly recognized as a write-off of DAC, and an $86 million increase in our insurance-related liabilities over the third and fourth quarters of 2016, both due to loss recognition testing upon re-segmentation, as well as a reserve adjustment of $171 million resulting from modeling improvements in the reserving process in our universal life business.
Expenses and Taxes
. Operating earnings increased due to a decrease in expenses of $20 million, primarily driven by the
U.S. Retail Advisor Force Divestiture and lower project-related costs, partially offset by higher amortization of software expenses
. In 2016, we realized lower tax benefits of $46 million, primarily related to the separate account dividends received deduction.
Other.
Annuities reinsurance activity with an affiliate that is included in the MetLife Holdings segment increased operating earnings by $160 million. This was primarily due to the aforementioned recapture of certain single-premium deferred annuity reinsurance agreements that resulted in favorable recapture settlements and the recovery of DAC, partially offset by lower interest credited on the related reinsurance receivables. The impact of the lower interest credited was largely offset by the higher net investment income, noted above, earned on the assets transferred in connection with the same recapture.
Year Ended December 31,
2015
Compared with the Year Ended December 31,
2014
Unless otherwise stated, all amounts discussed below are net of income tax.
Business Growth
. An $88 million increase in operating earnings was attributable to business growth. Net investment income increased primarily due to a higher average invested asset base from positive net flows in our life business, partially offset by funding agreement repayments in our run-off business. Lower DAC amortization was driven by lower average separate account balances in our deferred annuity business. A decrease in policyholder account balances in our run-off business resulted in lower interest credited expense. These increases were partially offset by lower asset-based fees resulting from the lower average separate account balances in our deferred annuities business.
Market Factors
. A $30 million decrease in operating earnings was attributable to market factors, including equity markets and interest rates. Higher DAC amortization due to lower equity market performance was partially offset by favorable impacts from interest rate movements. Higher interest credited resulted primarily from higher crediting rates on funding agreement renewals in our run-off business. While separate account fund returns were down slightly on a full year basis, the positive returns in the first half of the year drove an increase in our average separate account balances which resulted in higher asset-based fee income.
Underwriting, Actuarial Assumption Review and Other Insurance Adjustments
. Favorable mortality in our term life, income annuities and traditional life businesses resulted in an increase in operating earnings of $50 million. On an annual basis, we review and update our long-term assumptions used in our calculations of certain insurance-related liabilities and DAC. These annual updates, which occurred in both 2015 and 2014, resulted in a decrease in operating earnings of $41 million, primarily related to unfavorable DAC unlockings in the life businesses. Other refinements to DAC and insurance-related liabilities decreased operating earnings by $13 million, primarily due to a favorable adjustment recognized in 2014 related to refinements in reserve calculations for traditional life disability waiver premiums.
129
Expenses
. Higher expenses decreased operating earnings by $46 million, primarily due to the impact from a benefit recorded in 2014 for affiliated reinsurance recapture activity in our life business, as well as higher allocated costs related to sales and service support, partially offset by lower project-related costs.
Other.
Annuities reinsurance activity with an affiliate that is part of the MetLife Holdings segment had a net favorable impact to operating earnings of $18 million. This includes recapture activity in 2014 and reflects the favorable increase in the amortization of deferred ceded commissions on new treaties, favorable recapture settlements, as well as lower net guarantee reserves partially offset by a net drop in guarantee fees and unfavorable changes in deposit fund balances for certain variable annuity treaties, which include the base contract. In addition, operating earnings decreased $56 million, as a result of there being no activity in 2015 related to an agreement reinsuring certain variable annuity guaranteed minimum benefits originally assumed from our former operating joint venture in Japan, which we exited in November 2014 through novation.
Corporate & Other
|
|
Years Ended December 31,
|
||||||||||
|
|
2016
|
2015
|
2014
|
||||||||
|
|
(In millions)
|
||||||||||
|
Operating revenues
|
|||||||||||
|
Premiums
|
$
|
40
|
|
$
|
(87
|
)
|
$
|
89
|
|
||
|
Universal life and investment-type product policy fees
|
(119
|
)
|
(113
|
)
|
(103
|
)
|
|||||
|
Net investment income
|
(62
|
)
|
13
|
|
275
|
|
|||||
|
Other revenues
|
(517
|
)
|
(290
|
)
|
(483
|
)
|
|||||
|
Total operating revenues
|
(658
|
)
|
(477
|
)
|
(222
|
)
|
|||||
|
Operating expenses
|
|||||||||||
|
Policyholder benefits and claims and policyholder dividends
|
(23
|
)
|
(175
|
)
|
48
|
|
|||||
|
Interest credited to policyholder account balances
|
5
|
|
23
|
|
34
|
|
|||||
|
Capitalization of DAC
|
(7
|
)
|
(2
|
)
|
—
|
|
|||||
|
Amortization of DAC and VOBA
|
8
|
|
(1
|
)
|
(8
|
)
|
|||||
|
Interest expense on debt
|
1,002
|
|
1,013
|
|
975
|
|
|||||
|
Other operating expenses
|
(192
|
)
|
434
|
|
153
|
|
|||||
|
Total operating expenses
|
793
|
|
1,292
|
|
1,202
|
|
|||||
|
Provision for income tax expense (benefit)
|
(947
|
)
|
(365
|
)
|
(719
|
)
|
|||||
|
Operating earnings
|
(504
|
)
|
(1,404
|
)
|
(705
|
)
|
|||||
|
Less: Preferred stock dividends
|
103
|
|
116
|
|
122
|
|
|||||
|
Operating earnings available to common shareholders
|
$
|
(607
|
)
|
$
|
(1,520
|
)
|
$
|
(827
|
)
|
||
130
The table below presents operating earnings available to common shareholders by source net of income tax:
|
Years Ended December 31,
|
|||||||||||
|
2016
|
2015
|
2014
|
|||||||||
|
(In millions)
|
|||||||||||
|
Other business activities
|
$
|
(5
|
)
|
$
|
(41
|
)
|
$
|
(12
|
)
|
||
|
Other net investment income
|
(33
|
)
|
17
|
|
185
|
|
|||||
|
Interest expense on debt
|
(652
|
)
|
(658
|
)
|
(634
|
)
|
|||||
|
Preferred stock dividends
|
(103
|
)
|
(116
|
)
|
(122
|
)
|
|||||
|
Acquisition costs
|
—
|
|
—
|
|
(4
|
)
|
|||||
|
Corporate initiatives and projects
|
(129
|
)
|
(169
|
)
|
(166
|
)
|
|||||
|
Incremental tax benefit (expense)
|
438
|
|
(256
|
)
|
221
|
|
|||||
|
Other
|
(123
|
)
|
(297
|
)
|
(295
|
)
|
|||||
|
Operating earnings available to common shareholders
|
$
|
(607
|
)
|
$
|
(1,520
|
)
|
$
|
(827
|
)
|
||
Year Ended December 31,
2016
Compared with the Year Ended December 31,
2015
Unless otherwise stated, all amounts discussed below are net of income tax.
Other Business Activities
. Operating earnings from other business activities increased $36 million. This was primarily related to improved results from our start-up operations.
Other Net Investment Income
. A $50 million decrease in other net investment income was primarily driven by lower returns on fixed maturity securities as a result of the low interest rate environment and a decrease in average total portfolio holdings, primarily driven by a capital contribution to MetLife USA which is reported in the Brighthouse Financial segment. Additionally, lower returns on real estate, real estate joint ventures and private equities decreased other net investment income.
Preferred Stock Dividends
. Preferred stock dividends decreased by $13 million. In June 2015, MetLife, Inc. repurchased its 6.50% Non-Cumulative Preferred Stock, Series B (the “Series B preferred stock”) on which dividends had been paid quarterly. Also in June 2015, MetLife, Inc. issued 1,500,000 shares of its 5.25% Fixed-to-Floating Rate Non-Cumulative Preferred Stock, Series C (the “Series C preferred stock”) on which dividends are payable semi-annually until June 15, 2020, and are payable quarterly thereafter.
Corporate Initiatives and Projects
. Expenses associated with corporate initiatives and projects decreased by $40 million, primarily due to lower costs associated with enterprise-wide initiatives taken by the Company.
Incremental Tax Benefit
. Corporate & Other benefits from the impact of certain permanent tax preferenced items, including non-taxable investment income and tax credits for investments in low income housing. As a result, our effective tax rate differs from the U.S. statutory rate of 35%. In 2016, we had higher utilization of tax preferenced investments, which increased our operating earnings by $69 million over 2015.
In addition, our results for 2016 include a tax benefit of $46 million for tax audit settlements and $22 million related to an investment tax credit.
Our 2015 results included the aforementioned tax charge of $557 million, which was recorded under accounting guidance for the recognition of tax uncertainties.
Other
. Our 2015 results include the aforementioned $235 million charge for interest on uncertain tax positions. In 2016, operating earnings decreased by $35 million as a result of net adjustments to certain reinsurance assets and liabilities. In addition, operating earnings decreased $27 million due to higher employee-related costs, including those related to the Separation. An impairment charge on a real estate property in 2015, partially offset by higher real estate costs in 2016, increased operating earnings by $10 million.
Year Ended December 31,
2015
Compared with the Year Ended December 31,
2014
Unless otherwise stated, all amounts discussed below are net of income tax.
Other Business Activities.
Operating earnings from other business activities decreased $29 million primarily due to lower operating earnings from start-up operations.
131
Other Net Investment Income.
A $168 million decrease in other net investment income was driven by an increase in the amount credited to the segments due to growth in the economic capital managed by Corporate & Other on their behalf. This decrease
was also impacted by
the sustained low interest rate environment, which drove lower investment yields on fixed maturity securities and lower returns on alternative investments. This was partially offset by increased income from higher average invested assets and improved returns on real estate investments.
Interest Expense on Debt.
Interest expense on debt increased by $24 million, mainly due to the issuance of $1.5 billion of senior notes in March 2015 and $1.25 billion of senior notes in November 2015.
Incremental Tax Benefit (Expense).
Corporate & Other benefits from the impact of certain permanent tax differences, including non-taxable investment income and tax credits for investments in low income housing. As a result, our effective tax rate differs from the U.S. statutory rate of 35%. Our 2015 results include the aforementioned tax charge of $557 million, which was recorded under accounting guidance for the recognition of tax uncertainties. Our 2014 results include an $18 million tax charge related to a portion of the settlement of a licensing matter that was not deductible for income tax purposes. In addition, in 2015, we had higher utilization of tax preferenced investments, a benefit related to the timing of certain tax credits and other tax benefits, which increased our operating earnings by $62 million over 2014.
Other.
Our 2015 results include the aforementioned charge of $235 million for interest on uncertain tax positions, as well as a $20 million charge associated with company use real estate. These increases in expenses were partially offset by lower corporate expenses of $30 million, a $21 million tax refund received for a favorable outcome on prior year tax audits and a decrease in employee-related costs of $22 million. Our results for 2014 include a $117 million accrual to increase the litigation reserve related to asbestos and charges totaling $57 million related to the settlement of a licensing matter with the NYDFS and the District Attorney, New York County.
Effects of Inflation
Management believes that inflation has not had a material effect on the Company’s consolidated results of operations, except insofar as inflation may affect interest rates.
An increase in inflation could affect our business in several ways. During inflationary periods, the value of fixed income investments falls which could increase realized and unrealized losses. Inflation also increases expenses for labor and other materials, potentially putting pressure on profitability if such costs cannot be passed through in our product prices. Inflation could also lead to increased costs for losses and loss adjustment expenses in certain of our businesses, which could require us to adjust our pricing to reflect our expectations for future inflation. Prolonged and elevated inflation could adversely affect the financial markets and the economy generally, and dispelling it may require governments to pursue a restrictive fiscal and monetary policy, which could constrain overall economic activity, inhibit revenue growth and reduce the number of attractive investment opportunities.
132
Investments
Investment Risks
Our primary investment objective is to optimize, net of income tax, risk-adjusted investment income and risk-adjusted total return while ensuring that assets and liabilities are managed on a cash flow and duration basis. The Investments Department, led by the Chief Investment Officer, manages investment risks using a risk control framework comprised of policies, procedures and limits, as discussed further below. The Investments Risk Committee, chaired by GRM, reviews and monitors investment risk limits and tolerances. We are exposed to the following primary sources of investment risks:
|
•
|
credit risk, relating to the uncertainty associated with the continued ability of a given obligor to make timely payments of principal and interest;
|
|
•
|
interest rate risk, relating to the market price and cash flow variability associated with changes in market interest rates. Changes in market interest rates will impact the net unrealized gain or loss position of our fixed income investment portfolio and the rates of return we receive on both new funds invested and reinvestment of existing funds;
|
|
•
|
liquidity risk, relating to the diminished ability to sell certain investments, in times of strained market conditions;
|
|
•
|
market valuation risk, relating to the variability in the estimated fair value of investments associated with changes in market factors such as credit spreads and equity market levels. A widening of credit spreads will adversely impact the net unrealized gain (loss) position of the fixed income investment portfolio, will increase losses associated with credit-based non-qualifying derivatives where we assume credit exposure, and, if credit spreads widen significantly or for an extended period of time, will likely result in higher OTTI. Credit spread tightening will reduce net investment income associated with purchases of fixed maturity securities and will favorably impact the net unrealized gain (loss) position of the fixed income investment portfolio;
|
|
•
|
currency risk, relating to the variability in currency exchange rates for foreign denominated investments. This risk relates to potential decreases in estimated fair value and net investment income resulting from changes in currency exchange rates versus the U.S. dollar. In general, the weakening of foreign currencies versus the U.S. dollar will adversely affect the estimated fair value of our foreign denominated investments; and
|
|
•
|
real estate risk, relating to commercial, agricultural and residential real estate, and stemming from factors, which include, but are not limited to, market conditions, including the demand and supply of leasable commercial space, creditworthiness of borrowers and their tenants and joint venture partners, capital markets volatility and inherent interest rate movements.
|
We manage investment risk through in-house fundamental credit analysis of the underlying obligors, issuers, transaction structures and real estate properties. We also manage credit risk, market valuation risk and liquidity risk through industry and issuer diversification and asset allocation. Risk limits to promote diversification by asset sector, avoid concentrations in any single issuer and limit overall aggregate credit and equity risk exposure, as measured by our economic capital framework, are approved annually by a committee of directors that oversees our investment portfolio. For real estate assets, we manage credit risk and market valuation risk through geographic, property type and product type diversification and asset allocation. We manage interest rate risk as part of our ALM strategies. These strategies include maintaining an investment portfolio with diversified maturities that has a weighted average duration that reflects the duration of our estimated liability cash flow profile, and utilizing product design, such as the use of market value adjustment features and surrender charges, to manage interest rate risk. We also manage interest rate risk through proactive monitoring and management of certain non-guaranteed elements of our products, such as the resetting of credited interest and dividend rates for policies that permit such adjustments. In addition to hedging with foreign currency derivatives, we manage currency risk by matching much of our foreign currency liabilities in our foreign subsidiaries with their respective foreign currency assets, thereby reducing our risk to foreign currency exchange rate fluctuation. We also use certain derivatives in the management of credit, interest rate, and market valuation risk.
We use purchased credit default swaps to mitigate credit risk in our investment portfolio. Generally, we purchase credit protection by entering into credit default swaps referencing the issuers of specific assets we own. In certain cases, basis risk exists between these credit default swaps and the specific assets we own. For example, we may purchase credit protection on a macro basis to reduce exposure to specific industries or other portfolio concentrations. In such instances, the referenced entities and obligations under the credit default swaps may not be identical to the individual obligors or securities in our investment portfolio. In addition, our purchased credit default swaps may have shorter tenors than the underlying investments they are hedging. However, we dynamically hedge this risk through the rebalancing and rollover of our credit default swaps at their most liquid tenors. We believe that our purchased credit default swaps serve as effective economic hedges of our credit exposure.
133
We enter into market standard purchased and written credit default swap contracts. Payout under such contracts is triggered by certain credit events experienced by the referenced entities. For credit default swaps covering North American corporate issuers, credit events typically include bankruptcy and failure to pay on borrowed money. For European corporate issuers, credit events typically also include involuntary restructuring. With respect to credit default contracts on Western European sovereign debt, credit events typically include failure to pay debt obligations, repudiation, moratorium, or involuntary restructuring. In each case, payout on a credit default swap is triggered only after the Credit Derivatives Determinations Committee of the International Swaps and Derivatives Association determines that a credit event has occurred.
Current Environment
The global economy and markets continue to be affected by stress and volatility, which has adversely affected the financial services sector, in particular, and global capital markets. Recently, political and/or economic instability in the U.K., Mexico, Italy, Turkey and Puerto Rico have contributed to global market volatility. Events following the U.K.’s referendum on June 23, 2016 and the uncertainties associated with its pending withdrawal from the EU have contributed to market volatility. See “— Industry Trends — Financial and Economic Environment.”
As a global insurance company, we are affected by the monetary policy of central banks around the world. See “— Industry Trends — Financial and Economic Environment” for further information on such measures, as well as for information regarding actions taken by Japan’s central government and the Bank of Japan to boost inflation expectations and achieve sustainable economic growth in Japan. See also “— Industry Trends — Impact of a Sustained Low Interest Rate Environment” for information regarding the December 2015 and December 2016 actions taken by the FOMC to raise the federal funds rate. The Federal Reserve may take further actions to influence interest rates in the future, which may have an impact on the pricing levels of risk-bearing investments and may adversely impact the level of product sales. See “Risk Factors — Economic Environment and Capital Markets-Related Risks — We Are Exposed to Significant Global Financial and Capital Markets Risks Which May Adversely Affect Our Results of Operations, Financial Condition and Liquidity, and May Cause Our Net Investment Income to Vary from Period to Period.”
European Investments
We maintain general account investments in Europe to support our insurance operations and related policyholder liabilities in these countries and certain of our non-European operations invest in Europe for diversification. In Europe, we have proactively mitigated risk in both direct and indirect exposures by investing in a diversified portfolio of high quality investments with a focus on the higher-rated countries, including the U.K., Germany, France, the Netherlands, Poland, Norway and Sweden. The sovereign debt of these countries continues to maintain investment grade credit ratings from all major rating agencies. European sovereign fixed maturity securities, at estimated fair value, were
$8.5 billion
at
December 31, 2016
. Our European corporate securities (fixed maturity and perpetual hybrid securities classified as non-redeemable preferred stock) are invested in a diversified portfolio of primarily non-financial services securities, which comprised
$19.7 billion
, or
67%
, of European total corporate securities, at estimated fair value, at
December 31, 2016
. Of these European fixed maturity securities,
94%
were investment grade and, for the
6%
that were below investment grade, the majority were non-financial services corporate securities at
December 31, 2016
. European financial services corporate securities, at estimated fair value, were
$9.9 billion
(including
$6.7 billion
within the banking sector) with
98%
investment grade, at
December 31, 2016
. Total European fixed maturity securities, at estimated fair value, were
$38.9 billion
at
December 31, 2016
, including
$770 million
of structured securities.
Selected Country Investments
Recent country specific volatility due to local economic and/or political concerns has affected the performance of certain of our investments. See “— Industry Trends — Financial and Economic Environment.”
We have exposure to such volatility, as we maintain general account investments in the selected countries as summarized below to support our insurance operations and related policyholder liabilities in these countries and we also have exposure through our global portfolio diversification.
134
The following table presents a summary of fixed maturity securities in these countries. The information below is presented on a country of risk basis (e.g. the country where the issuer primarily conducts business).
|
|
Selected Country Fixed Maturity Securities at December 31, 2016
|
||||||||||||||||||
|
|
Sovereign
|
Financial
Services |
Non-Financial
Services |
Structured
|
Total (1)
|
||||||||||||||
|
|
(Dollars in millions)
|
||||||||||||||||||
|
United Kingdom
|
$
|
95
|
|
$
|
2,690
|
|
$
|
8,066
|
|
$
|
435
|
|
$
|
11,286
|
|
||||
|
Mexico
|
3,907
|
|
508
|
|
1,890
|
|
67
|
|
6,372
|
|
|||||||||
|
Italy
|
48
|
|
81
|
|
485
|
|
104
|
|
718
|
|
|||||||||
|
Turkey
|
276
|
|
52
|
|
183
|
|
—
|
|
511
|
|
|||||||||
|
Puerto Rico (2)
|
9
|
|
—
|
|
124
|
|
—
|
|
133
|
|
|||||||||
|
Total
|
$
|
4,335
|
|
$
|
3,331
|
|
$
|
10,748
|
|
$
|
606
|
|
$
|
19,020
|
|
||||
|
Investment grade %
|
93
|
%
|
96
|
%
|
92
|
%
|
99
|
%
|
93
|
%
|
|||||||||
__________________
|
(1)
|
The par value and amortized cost were
$18.2 billion
and
$19.4 billion
, respectively, at December 31,
2016
.
|
|
(2)
|
Our exposure to Puerto Rico sovereigns is in the form of political subdivision fixed maturity securities and is composed completely of revenue bonds. We have no Puerto Rico general obligation bonds.
|
We manage direct and indirect investment exposure in the selected countries through fundamental credit analysis and we continually monitor and adjust our level of investment exposure. We do not expect that our general account investments in these countries will have a material adverse effect on our results of operations or financial condition.
Current Environment Summary
All of these factors have had and could continue to have an adverse effect on the financial results of companies in the financial services industry, including MetLife. Such global economic conditions, as well as the global financial markets, continue to impact our net investment income, net investment gains (losses), net derivative gains (losses), level of unrealized gains (losses) within the various asset classes in our investment portfolio, and our level of investment in lower yielding cash equivalents, short-term investments and government securities. See “— Industry Trends” and “Risk Factors — Economic Environment and Capital Markets-Related Risks — We Are Exposed to Significant Global Financial and Capital Markets Risks Which May Adversely Affect Our Results of Operations, Financial Condition and Liquidity, and May Cause Our Net Investment Income to Vary from Period to Period.”
135
Investment Portfolio Results
The following yield table presents the yield and net investment income for our investment portfolio for the periods indicated. Yields are calculated using reported net investment income which is not adjusted for the impact of changes in foreign currency exchange rates. As described below, this table reflects certain differences from the presentation of net investment income presented in the GAAP consolidated statements of operations. This yield table presentation is consistent with how we measure our investment performance for management purposes, and we believe it enhances understanding of our investment portfolio results.
|
|
For the Years Ended December 31,
|
|||||||||||||||||||
|
|
2016
|
2015
|
2014
|
|||||||||||||||||
|
|
Yield% (1)
|
Amount
|
Yield% (1)
|
Amount
|
Yield% (1)
|
Amount
|
||||||||||||||
|
|
(Dollars in millions)
|
|||||||||||||||||||
|
Fixed maturity securities (2) (3)
|
4.39
|
|
%
|
$
|
14,217
|
|
4.63
|
|
%
|
$
|
14,201
|
|
4.81
|
|
%
|
$
|
14,946
|
|
||
|
Mortgage loans (3)
|
4.64
|
|
%
|
3,258
|
|
4.97
|
|
%
|
3,135
|
|
5.15
|
|
%
|
2,928
|
|
|||||
|
Real estate and real estate joint ventures
|
3.92
|
|
%
|
353
|
|
4.89
|
|
%
|
488
|
|
3.67
|
|
%
|
376
|
|
|||||
|
Policy loans
|
5.23
|
|
%
|
589
|
|
5.23
|
|
%
|
603
|
|
5.36
|
|
%
|
629
|
|
|||||
|
Equity securities
|
4.88
|
|
%
|
140
|
|
4.71
|
|
%
|
144
|
|
4.30
|
|
%
|
133
|
|
|||||
|
Other limited partnership interests
|
9.24
|
|
%
|
641
|
|
8.45
|
|
%
|
669
|
|
13.01
|
|
%
|
1,033
|
|
|||||
|
Cash and short-term investments
|
1.03
|
|
%
|
113
|
|
1.04
|
|
%
|
129
|
|
1.07
|
|
%
|
161
|
|
|||||
|
Other invested assets
|
1,169
|
|
1,053
|
|
906
|
|
||||||||||||||
|
Investment income
|
4.64
|
|
%
|
20,480
|
|
4.85
|
|
%
|
20,422
|
|
5.01
|
|
%
|
21,112
|
|
|||||
|
Investment fees and expenses
|
(0.14
|
)
|
(614
|
)
|
(0.15
|
)
|
(633
|
)
|
(0.13
|
)
|
(556
|
)
|
||||||||
|
Net investment income including divested businesses and lag elimination (4), (5), (6)
|
4.50
|
|
%
|
19,866
|
|
4.70
|
|
%
|
19,789
|
|
4.88
|
|
%
|
20,556
|
|
|||||
|
Less: net investment income from divested businesses and lag elimination (4), (5), (6)
|
(166
|
)
|
—
|
|
(72
|
)
|
||||||||||||||
|
Net investment income (6)
|
$
|
19,700
|
|
$
|
19,789
|
|
$
|
20,484
|
|
|||||||||||
__________________
|
(1)
|
Yields are calculated as investment income as a percent of average quarterly asset carrying values. Investment income excludes recognized gains and losses and reflects GAAP adjustments presented in footnote (6) below. Asset carrying values exclude unrealized gains (losses), collateral received in connection with our securities lending program, freestanding derivative assets, collateral received from derivative counterparties, the effects of consolidating certain variable interest entities (“VIEs”) under GAAP that are treated as consolidated securitization entities (“CSEs”) and contractholder-directed unit-linked investments. A yield is not presented for other invested assets as it is not considered a meaningful measure of performance for this asset class.
|
|
(2)
|
Investment income includes amounts from FVO and trading securities of
$37 million
,
$21 million
and
$103 million
for the years ended December 31,
2016
,
2015
and
2014
, respectively.
|
|
(3)
|
Investment income from fixed maturity securities and mortgage loans includes prepayment fees.
|
|
(4)
|
Yield calculations include the net investment income and ending carrying values of the divested businesses, as well as lag elimination.
|
|
(5)
|
Net investment income included in yield calculations include earned income on derivatives and amortization of premium on derivatives that are hedges of investments or that are used to replicate certain investments, but do not qualify for hedge accounting treatment (“investment hedge adjustments”). The investment hedge adjustments presented in the table below exclude cash settlements of
$1 million
, $0 and
$1 million
for the years ended December 31,
2016
,
2015
and 2014, respectively.
|
136
|
(6)
|
Net investment income presented in the yield table varies from the most directly comparable GAAP measure due to certain reclassifications and adjustments and excludes the effects of consolidating certain VIEs under GAAP that are treated as CSEs and contractholder-directed unit-linked investments. Such reclassifications and adjustments are presented in the table below.
|
|
|
Years Ended December 31,
|
||||||||||
|
|
2016
|
2015
|
2014
|
||||||||
|
|
(In millions)
|
||||||||||
|
Net investment income — in the above yield table
|
$
|
19,700
|
|
$
|
19,789
|
|
$
|
20,484
|
|
||
|
Real estate discontinued operations
|
—
|
|
—
|
|
(1
|
)
|
|||||
|
Investment hedge adjustments
|
(878
|
)
|
(776
|
)
|
(705
|
)
|
|||||
|
Operating joint ventures adjustment
|
6
|
|
(4
|
)
|
(1
|
)
|
|||||
|
Contractholder-directed unit-linked investments
|
950
|
|
264
|
|
1,266
|
|
|||||
|
Divested businesses and lag elimination (1)
|
166
|
|
—
|
|
72
|
|
|||||
|
Incremental net investment income from CSEs
|
3
|
|
8
|
|
38
|
|
|||||
|
Net investment income — GAAP consolidated statements of operations
|
$
|
19,947
|
|
$
|
19,281
|
|
$
|
21,153
|
|
||
__________________
|
(1)
|
For the year ended
December 31, 2016
,
$166 million
related to the impact of converting the Company’s Japan operations to calendar year-end reporting. See
Note 2
of the Notes to the Consolidated Financial Statements for further information.
|
See “— Results of Operations — Consolidated Results — Year Ended December 31,
2016
Compared with the Year Ended December 31,
2015
” and “— Results of Operations — Consolidated Results —Year Ended December 31,
2015
Compared with the Year Ended December 31,
2014
,” for an analysis of the year over year changes in net investment income.
Fixed Maturity and Equity Securities AFS
The following table presents fixed maturity and equity securities AFS by type (public or private) and information about perpetual and redeemable securities held at:
|
December 31, 2016
|
December 31, 2015
|
|||||||||||
|
Estimated Fair
Value
|
% of
Total
|
Estimated Fair
Value
|
% of
Total
|
|||||||||
|
(Dollars in millions)
|
||||||||||||
|
Fixed maturity securities
|
||||||||||||
|
Publicly-traded
|
$
|
298,604
|
|
85.1
|
%
|
$
|
302,400
|
|
86.1
|
%
|
||
|
Privately-placed
|
52,285
|
|
14.9
|
49,002
|
|
13.9
|
||||||
|
Total fixed maturity securities
|
$
|
350,889
|
|
100.0
|
%
|
$
|
351,402
|
|
100.0
|
%
|
||
|
Percentage of cash and invested assets
|
67.7
|
%
|
69.1
|
%
|
||||||||
|
Equity securities
|
||||||||||||
|
Publicly-traded
|
$
|
2,066
|
|
64.7
|
%
|
$
|
2,184
|
|
65.8
|
%
|
||
|
Privately-held
|
1,128
|
|
35.3
|
1,137
|
|
34.2
|
||||||
|
Total equity securities
|
$
|
3,194
|
|
100.0
|
%
|
$
|
3,321
|
|
100.0
|
%
|
||
|
Percentage of cash and invested assets
|
0.6
|
%
|
0.7
|
%
|
||||||||
|
Perpetual securities included within fixed maturity and equity securities AFS
|
$
|
599
|
|
$
|
819
|
|
||||||
|
Redeemable preferred stock with a stated maturity included within fixed maturity securities AFS
|
$
|
1,080
|
|
$
|
1,216
|
|
||||||
137
Perpetual securities are included within fixed maturity and equity securities. Upon acquisition, we classify perpetual securities that have attributes of both debt and equity as fixed maturity securities if the securities have an interest rate step-up feature which, when combined with other qualitative factors, indicates that the securities have more debt-like characteristics; while those with more equity-like characteristics are classified as equity securities. Many of such securities, commonly referred to as “perpetual hybrid securities,” have been issued by non-U.S. financial institutions that are accorded the highest two capital treatment categories by their respective regulatory bodies (i.e. core capital, or “Tier 1 capital” and perpetual deferrable securities, or “Upper Tier 2 capital”).
Redeemable preferred stock with a stated maturity is included within fixed maturity securities. These securities, which are commonly referred to as “capital securities,” primarily have cumulative interest deferral features and are primarily issued by U.S. financial institutions.
In connection with our investment management business, we manage privately-placed and infrastructure fixed maturity securities on behalf of institutional clients, which are unaffiliated investors. These privately-placed and infrastructure fixed maturity securities had an estimated fair value of
$8.0 billion
and
$6.1 billion
at
December 31, 2016
and
2015
, respectively. As these assets are managed on behalf of, and owned by, our institutional clients, they are not included in our consolidated financial statements.
During 2016, we commenced management of below investment grade fixed maturity securities on behalf of institutional clients, which are unaffiliated investors. These fixed maturity securities had an estimated fair value of
$316 million
at
December 31, 2016
. As these assets are managed on behalf of, and owned by, our institutional clients, they are not included in our consolidated financial statements.
Also in connection with our investment management business, we manage index investment portfolios that track the return of industry fixed income and equity market indices such as the Barclay’s U.S. Aggregate Bond Index and S&P 500
®
Index. These assets had an estimated fair value of
$27.2 billion
and
$26.0 billion
at
December 31, 2016
and
2015
, respectively, and are included within separate account assets in our consolidated financial statements.
Valuation of Securities.
We are responsible for the determination of the estimated fair value of our investments. We determine the estimated fair value of publicly-traded securities after considering one of three primary sources of information: quoted market prices in active markets, independent pricing services, or independent broker quotations. We determine the estimated fair value of privately-placed securities after considering one of three primary sources of information: market standard internal matrix pricing, market standard internal discounted cash flow techniques, or independent pricing services (after we determine the independent pricing services’ use of available observable market data). For publicly-traded securities, the number of quotations obtained varies by instrument and depends on the liquidity of the particular instrument. Generally, we obtain prices from multiple pricing services to cover all asset classes and obtain multiple prices for certain securities, but ultimately utilize the price with the highest placement in the fair value hierarchy. Independent pricing services that value these instruments use market standard valuation methodologies based on data about market transactions and inputs from multiple pricing sources that are market observable or can be derived principally from or corroborated by observable market data. See Note
10
of the Notes to the Consolidated Financial Statements for a discussion of the types of market standard valuation methodologies utilized and key assumptions and observable inputs used in applying these standard valuation methodologies. When a price is not available in the active market or through an independent pricing service, management values the security primarily using market standard internal matrix pricing or discounted cash flow techniques, and non-binding quotations from independent brokers who are knowledgeable about these securities. Independent non-binding broker quotations utilize inputs that may be difficult to corroborate with observable market data. As shown in the following section, less than
1%
of our fixed maturity securities were valued using non-binding quotations from independent brokers at December 31,
2016
.
Senior management, independent of the trading and investing functions, is responsible for the oversight of control systems and valuation policies, including reviewing and approving new transaction types and markets, for ensuring that observable market prices and market-based parameters are used for valuation, wherever possible, and for determining that valuation adjustments, when applied, are based upon established policies and are applied consistently over time. See Note
10
of the Notes to the Consolidated Financial Statements for further information on our valuation controls and procedures including our formal process to challenge any prices received from independent pricing services that are not considered representative of estimated fair value.
We have reviewed the significance and observability of inputs used in the valuation methodologies to determine the appropriate fair value hierarchy level for each of our securities. Based on the results of this review and investment class analysis, each instrument is categorized as Level 1, 2 or 3 based on the lowest level significant input to its valuation. See Note
10
of the Notes to the Consolidated Financial Statements for information regarding the valuation techniques and inputs by level within the three level fair value hierarchy by major classes of invested assets.
138
Fair Value of Fixed Maturity and Equity Securities – AFS
Fixed maturity and equity securities AFS measured at estimated fair value on a recurring basis and their corresponding fair value pricing sources are as follows:
|
|
December 31, 2016
|
||||||||||||
|
|
Fixed Maturity
Securities
|
Equity
Securities
|
|||||||||||
|
|
(Dollars in millions)
|
||||||||||||
|
Level 1
|
|||||||||||||
|
Quoted prices in active markets for identical assets
|
$
|
31,153
|
|
8.9
|
%
|
$
|
1,373
|
|
43.0
|
%
|
|||
|
Level 2
|
|||||||||||||
|
Independent pricing sources
|
296,440
|
|
84.5
|
|
1,122
|
|
35.1
|
|
|||||
|
Internal matrix pricing or discounted cash flow techniques
|
2,187
|
|
0.6
|
|
95
|
|
3.0
|
|
|||||
|
Significant other observable inputs
|
298,627
|
|
85.1
|
|
1,217
|
|
38.1
|
|
|||||
|
Level 3
|
|||||||||||||
|
Independent pricing sources
|
16,156
|
|
4.6
|
|
469
|
|
14.7
|
|
|||||
|
Internal matrix pricing or discounted cash flow techniques
|
3,709
|
|
1.0
|
|
127
|
|
4.0
|
|
|||||
|
Independent broker quotations
|
1,244
|
|
0.4
|
|
8
|
|
0.2
|
|
|||||
|
Significant unobservable inputs
|
21,109
|
|
6.0
|
|
604
|
|
18.9
|
|
|||||
|
Total estimated fair value
|
$
|
350,889
|
|
100.0
|
%
|
$
|
3,194
|
|
100.0
|
%
|
|||
See Note
10
of the Notes to the Consolidated Financial Statements for the fixed maturity securities and equity securities AFS fair value hierarchy.
The composition of fair value pricing sources for and significant changes in Level 3 securities at December 31,
2016
are as follows:
|
•
|
The majority of the Level 3 fixed maturity and equity securities AFS were concentrated in three sectors: United States and foreign corporate securities and residential mortgage-backed securities (“RMBS”).
|
|
•
|
Level 3 fixed maturity securities are priced principally through market standard valuation methodologies, independent pricing services and, to a much lesser extent, independent non-binding broker quotations using inputs that are not market observable or cannot be derived principally from or corroborated by observable market data. Level 3 fixed maturity securities consist of less liquid securities with very limited trading activity or where less price transparency exists around the inputs to the valuation methodologies. Level 3 fixed maturity securities include: sub-prime RMBS; certain below investment grade private securities and less liquid investment grade corporate securities (included in United States and foreign corporate securities) and less liquid asset-backed securities (“ABS”) and foreign government securities.
|
|
•
|
During the year ended December 31,
2016
, Level 3 fixed maturity securities increased by
$295 million
, or
1%
. The increase was driven by purchases in excess of sales and an increase in estimated fair value recognized in OCI.
|
See Note
10
of the Notes to the Consolidated Financial Statements for a rollforward of the fair value measurements for fixed maturity securities and equity securities AFS measured at estimated fair value on a recurring basis using significant unobservable (Level 3) inputs; transfers into and/or out of Level 3; and further information about the valuation techniques and inputs by level by major classes of invested assets that affect the amounts reported above.
Fixed Maturity Securities AFS
See Notes
1
and
8
of the Notes to the Consolidated Financial Statements for information about fixed maturity securities AFS by sector, contractual maturities and continuous gross unrealized losses.
139
Fixed Maturity Securities Credit Quality — Ratings
The Securities Valuation Office of the
NAIC
evaluates the fixed maturity security investments of insurers for regulatory reporting and capital assessment purposes and assigns securities to one of six credit quality categories called “NAIC designations.” If no designation is available from the NAIC, then, as permitted by the NAIC, an internally developed designation is used. The NAIC designations are generally similar to the credit quality ratings of the NRSRO for fixed maturity securities, except for certain structured securities as described below. Rating agency ratings are based on availability of applicable ratings from rating agencies on the NAIC credit rating provider list, including Moody’s, S&P, Fitch, Dominion Bond Rating Service, A.M. Best, Kroll Bond Rating Agency, Egan Jones Ratings Company and Morningstar, Inc. (“Morningstar”). If no rating is available from a rating agency, then an internally developed rating is used.
The NAIC has adopted revised methodologies for certain structured securities comprised of non-agency RMBS, commercial mortgage-backed securities (“CMBS”) and ABS. The NAIC’s objective with the revised methodologies for these structured securities was to increase the accuracy in assessing expected losses, and to use the improved assessment to determine a more appropriate capital requirement for such structured securities. The revised methodologies reduce regulatory reliance on rating agencies and allow for greater regulatory input into the assumptions used to estimate expected losses from structured securities. We apply the revised NAIC methodologies to structured securities held by MetLife, Inc.’s insurance subsidiaries that maintain the NAIC statutory basis of accounting. The NAIC’s present methodology is to evaluate structured securities held by insurers using the revised NAIC methodologies on an annual basis. If MetLife, Inc.’s insurance subsidiaries acquire structured securities that have not been previously evaluated by the NAIC, but are expected to be evaluated by the NAIC in the upcoming annual review, an internally developed designation is used until a final designation becomes available. These revised NAIC designations may not correspond to NRSRO ratings.
The following table presents total fixed maturity securities by NRSRO rating and the applicable NAIC designation from the NAIC published comparison of NRSRO ratings to NAIC designations, except for certain structured securities, which are presented using the revised NAIC methodologies as described above, as well as the percentage, based on estimated fair value that each NAIC designation is comprised of at:
|
|
|
December 31,
|
||||||||||||||||||||||||||||||
|
|
|
2016
|
2015
|
|||||||||||||||||||||||||||||
|
NAIC
Designation
|
NRSRO Rating
|
Amortized
Cost
|
Unrealized
Gain (Loss)
|
Estimated
Fair
Value
|
% of
Total
|
Amortized
Cost
|
Unrealized
Gain (Loss)
|
Estimated
Fair
Value
|
% of
Total
|
|||||||||||||||||||||||
|
|
|
(Dollars in millions)
|
||||||||||||||||||||||||||||||
|
1
|
Aaa/Aa/A
|
$
|
232,875
|
|
$
|
16,191
|
|
$
|
249,066
|
|
71.0
|
%
|
$
|
234,176
|
|
$
|
16,627
|
|
$
|
250,803
|
|
71.4
|
%
|
|||||||||
|
2
|
Baa
|
77,281
|
|
3,816
|
|
81,097
|
|
23.1
|
77,313
|
|
2,210
|
|
79,523
|
|
22.6
|
|||||||||||||||||
|
Subtotal investment grade
|
310,156
|
|
20,007
|
|
330,163
|
|
94.1
|
311,489
|
|
18,837
|
|
330,326
|
|
94.0
|
||||||||||||||||||
|
3
|
Ba
|
13,885
|
|
437
|
|
14,322
|
|
4.1
|
15,314
|
|
(172
|
)
|
15,142
|
|
4.3
|
|||||||||||||||||
|
4
|
B
|
5,410
|
|
84
|
|
5,494
|
|
1.6
|
5,083
|
|
(244
|
)
|
4,839
|
|
1.4
|
|||||||||||||||||
|
5
|
Caa and lower
|
895
|
|
9
|
|
904
|
|
0.2
|
1,036
|
|
5
|
|
1,041
|
|
0.3
|
|||||||||||||||||
|
6
|
In or near default
|
8
|
|
(2
|
)
|
6
|
|
—
|
42
|
|
12
|
|
54
|
|
—
|
|||||||||||||||||
|
Subtotal below investment grade
|
20,198
|
|
528
|
|
20,726
|
|
5.9
|
21,475
|
|
(399
|
)
|
21,076
|
|
6.0
|
||||||||||||||||||
|
Total fixed maturity securities
|
$
|
330,354
|
|
$
|
20,535
|
|
$
|
350,889
|
|
100.0
|
%
|
$
|
332,964
|
|
$
|
18,438
|
|
$
|
351,402
|
|
100.0
|
%
|
||||||||||
140
The following tables present total fixed maturity securities, based on estimated fair value, by sector classification and by NRSRO rating and the applicable NAIC designations from the NAIC published comparison of NRSRO ratings to NAIC designations, except for certain structured securities, which are presented using the NAIC methodologies as described above:
|
|
Fixed Maturity Securities — by Sector & Credit Quality Rating
|
||||||||||||||||||||||||||
|
NAIC Designation:
|
1
|
2
|
3
|
4
|
5
|
6
|
Total
Estimated
Fair Value
|
||||||||||||||||||||
|
NRSRO Rating:
|
Aaa/Aa/A
|
Baa
|
Ba
|
B
|
Caa and
Lower
|
In or Near
Default
|
|||||||||||||||||||||
|
|
(Dollars in millions)
|
||||||||||||||||||||||||||
|
December 31, 2016
|
|||||||||||||||||||||||||||
|
U.S. corporate
|
$
|
44,732
|
|
$
|
43,063
|
|
$
|
8,414
|
|
$
|
3,884
|
|
$
|
760
|
|
$
|
—
|
|
$
|
100,853
|
|
||||||
|
U.S. government and agency
|
57,038
|
|
485
|
|
—
|
|
—
|
|
—
|
|
—
|
|
57,523
|
|
|||||||||||||
|
Foreign government
|
48,951
|
|
5,035
|
|
2,230
|
|
870
|
|
52
|
|
—
|
|
57,138
|
|
|||||||||||||
|
Foreign corporate
|
22,951
|
|
30,189
|
|
3,141
|
|
709
|
|
67
|
|
—
|
|
57,057
|
|
|||||||||||||
|
RMBS
|
35,916
|
|
707
|
|
322
|
|
30
|
|
13
|
|
5
|
|
36,993
|
|
|||||||||||||
|
State and political subdivision
|
15,575
|
|
502
|
|
90
|
|
—
|
|
9
|
|
—
|
|
16,176
|
|
|||||||||||||
|
ABS
|
12,776
|
|
971
|
|
125
|
|
1
|
|
3
|
|
1
|
|
13,877
|
|
|||||||||||||
|
CMBS
|
11,127
|
|
145
|
|
—
|
|
—
|
|
—
|
|
—
|
|
11,272
|
|
|||||||||||||
|
Total fixed maturity securities
|
$
|
249,066
|
|
$
|
81,097
|
|
$
|
14,322
|
|
$
|
5,494
|
|
$
|
904
|
|
$
|
6
|
|
$
|
350,889
|
|
||||||
|
Percentage of total
|
71.0
|
%
|
23.1
|
%
|
4.1
|
%
|
1.6
|
%
|
0.2
|
%
|
—
|
%
|
100.0
|
%
|
|||||||||||||
|
December 31, 2015
|
|||||||||||||||||||||||||||
|
U.S. corporate
|
$
|
43,448
|
|
$
|
44,158
|
|
$
|
9,163
|
|
$
|
3,532
|
|
$
|
493
|
|
$
|
—
|
|
$
|
100,794
|
|
||||||
|
U.S. government and agency
|
61,646
|
|
—
|
|
—
|
|
—
|
|
—
|
|
—
|
|
61,646
|
|
|||||||||||||
|
Foreign government
|
43,911
|
|
4,098
|
|
1,730
|
|
395
|
|
326
|
|
39
|
|
50,499
|
|
|||||||||||||
|
Foreign corporate
|
23,368
|
|
29,362
|
|
3,621
|
|
732
|
|
114
|
|
1
|
|
57,198
|
|
|||||||||||||
|
RMBS
|
37,394
|
|
560
|
|
579
|
|
177
|
|
78
|
|
9
|
|
38,797
|
|
|||||||||||||
|
State and political subdivision
|
14,818
|
|
599
|
|
10
|
|
—
|
|
14
|
|
—
|
|
15,441
|
|
|||||||||||||
|
ABS
|
13,646
|
|
702
|
|
24
|
|
3
|
|
14
|
|
5
|
|
14,394
|
|
|||||||||||||
|
CMBS
|
12,572
|
|
44
|
|
15
|
|
—
|
|
2
|
|
—
|
|
12,633
|
|
|||||||||||||
|
Total fixed maturity securities
|
$
|
250,803
|
|
$
|
79,523
|
|
$
|
15,142
|
|
$
|
4,839
|
|
$
|
1,041
|
|
$
|
54
|
|
$
|
351,402
|
|
||||||
|
Percentage of total
|
71.4
|
%
|
22.6
|
%
|
4.3
|
%
|
1.4
|
%
|
0.3
|
%
|
—
|
%
|
100.0
|
%
|
|||||||||||||
U.S. and Foreign Corporate Fixed Maturity Securities
We maintain a diversified portfolio of corporate fixed maturity securities across industries and issuers. This portfolio does not have any exposure to any single issuer in excess of
1%
of total investments and the top ten holdings comprised
2%
of total investments at both December 31,
2016
and
2015
. The tables below present our U.S. and foreign corporate securities holdings by industry at:
|
|
December 31,
|
||||||||||||
|
|
2016
|
2015
|
|||||||||||
|
|
Estimated
Fair
Value
|
% of
Total
|
Estimated
Fair
Value
|
% of
Total
|
|||||||||
|
|
(Dollars in millions)
|
||||||||||||
|
Industrial
|
$
|
48,109
|
|
30.4
|
%
|
$
|
44,710
|
|
28.3
|
%
|
|||
|
Consumer
|
36,952
|
|
23.4
|
|
37,317
|
|
23.6
|
|
|||||
|
Finance
|
33,431
|
|
21.2
|
|
33,050
|
|
20.9
|
|
|||||
|
Utility
|
23,949
|
|
15.2
|
|
27,770
|
|
17.6
|
|
|||||
|
Communications
|
12,955
|
|
8.2
|
|
11,559
|
|
7.3
|
|
|||||
|
Other
|
2,514
|
|
1.6
|
|
3,586
|
|
2.3
|
|
|||||
|
Total
|
$
|
157,910
|
|
100.0
|
%
|
$
|
157,992
|
|
100.0
|
%
|
|||
141
Structured Securities
We held
$62.1 billion
and
$65.8 billion
of structured securities, at estimated fair value, at December 31,
2016
and
2015
, respectively, as presented in the RMBS, ABS and CMBS sections below.
RMBS
The table below presents our RMBS holdings at:
|
|
December 31,
|
||||||||||||||||||||
|
|
2016
|
2015
|
|||||||||||||||||||
|
|
Estimated
Fair
Value
|
% of
Total
|
Net
Unrealized
Gains (Losses)
|
Estimated
Fair
Value
|
% of
Total
|
Net
Unrealized
Gains (Losses)
|
|||||||||||||||
|
|
(Dollars in millions)
|
||||||||||||||||||||
|
By security type:
|
|||||||||||||||||||||
|
Collateralized mortgage obligations
|
$
|
22,286
|
|
60.2
|
%
|
$
|
624
|
|
$
|
20,604
|
|
53.1
|
%
|
$
|
578
|
|
|||||
|
Pass-through securities
|
14,707
|
|
39.8
|
|
76
|
|
18,193
|
|
46.9
|
|
305
|
|
|||||||||
|
Total RMBS
|
$
|
36,993
|
|
100.0
|
%
|
$
|
700
|
|
$
|
38,797
|
|
100.0
|
%
|
$
|
883
|
|
|||||
|
By risk profile:
|
|||||||||||||||||||||
|
Agency
|
$
|
23,579
|
|
63.7
|
%
|
$
|
276
|
|
$
|
26,214
|
|
67.6
|
%
|
$
|
763
|
|
|||||
|
Prime
|
1,787
|
|
4.8
|
|
81
|
|
1,960
|
|
5.1
|
|
41
|
|
|||||||||
|
Alt-A
|
6,527
|
|
17.7
|
|
180
|
|
5,990
|
|
15.4
|
|
(18
|
)
|
|||||||||
|
Sub-prime
|
5,100
|
|
13.8
|
|
163
|
|
4,633
|
|
11.9
|
|
97
|
|
|||||||||
|
Total RMBS
|
$
|
36,993
|
|
100.0
|
%
|
$
|
700
|
|
$
|
38,797
|
|
100.0
|
%
|
$
|
883
|
|
|||||
|
Ratings profile:
|
|||||||||||||||||||||
|
Rated Aaa/AAA
|
$
|
24,162
|
|
65.3
|
%
|
$
|
26,809
|
|
69.1
|
%
|
|||||||||||
|
Designated NAIC 1
|
$
|
35,916
|
|
97.1
|
%
|
$
|
37,394
|
|
96.4
|
%
|
|||||||||||
Collateralized mortgage obligations are structured by dividing the cash flows of mortgages into separate pools or tranches of risk that create multiple classes of bonds with varying maturities and priority of payments. Pass-through mortgage-backed securities are secured by a mortgage or collection of mortgages. The monthly mortgage payments from homeowners pass from the originating bank through an intermediary, such as a government agency or investment bank, which collects the payments and, for a fee, remits or passes these payments through to the holders of the pass-through securities.
The majority of our RMBS holdings were rated Aaa/AAA by Moody’s, S&P or Fitch; and were designated NAIC 1 by the NAIC at December 31,
2016
and
2015
. Agency RMBS were guaranteed or otherwise supported by Federal National Mortgage Association, Federal Home Loan Mortgage Corporation or Government National Mortgage Association. Non-agency RMBS include prime, alternative residential mortgage loans (“Alt-A”) and sub-prime RMBS. Prime residential mortgage lending includes the origination of residential mortgage loans to the most creditworthy borrowers with high quality credit profiles. Alt-A is a classification of mortgage loans where the risk profile of the borrower is between prime and sub-prime. Sub-prime mortgage lending is the origination of residential mortgage loans to borrowers with weak credit profiles.
Included within prime and Alt-A RMBS are re-securitization of real estate mortgage investment conduit (“Re-REMIC”) securities. Re-REMIC RMBS involve the pooling of previous issues of prime and Alt-A RMBS and restructuring the combined pools to create new senior and subordinated securities. The credit enhancement on the senior tranches is improved through the re-securitization.
Historically, we have managed our exposure to sub-prime RMBS holdings by focusing primarily on senior tranche securities, stress testing the portfolio with severe loss assumptions and closely monitoring the performance of the portfolio. Our sub-prime RMBS portfolio consists predominantly of securities that were purchased after 2012 at significant discounts to par value and discounts to the expected principal recovery value of these securities. The vast majority of these securities are investment grade under the NAIC designations (e.g., NAIC 1 and NAIC 2). The estimated fair value of our sub-prime RMBS holdings purchased since 2012 was
$4.6 billion
and
$4.0 billion
at December 31,
2016
and
2015
, respectively, with unrealized gains (losses) of
$140 million
and
$74 million
at December 31,
2016
and
2015
, respectively.
142
ABS
Our ABS holdings are diversified both by collateral type and by issuer. The following table presents our ABS holdings at:
|
|
December 31,
|
||||||||||||||||||||
|
|
2016
|
2015
|
|||||||||||||||||||
|
|
Estimated
Fair
Value
|
% of
Total
|
Net
Unrealized
Gains (Losses)
|
Estimated
Fair
Value
|
% of
Total
|
Net
Unrealized
Gains (Losses)
|
|||||||||||||||
|
|
(Dollars in millions)
|
||||||||||||||||||||
|
By collateral type:
|
|||||||||||||||||||||
|
Collateralized obligations
|
$
|
6,866
|
|
49.5
|
%
|
$
|
(42
|
)
|
$
|
7,698
|
|
53.5
|
%
|
$
|
(144
|
)
|
|||||
|
Automobile loans
|
1,477
|
|
10.6
|
|
1
|
|
1,153
|
|
8.0
|
|
—
|
|
|||||||||
|
Foreign residential loans
|
1,256
|
|
9.1
|
|
8
|
|
1,365
|
|
9.5
|
|
32
|
|
|||||||||
|
Student loans
|
1,144
|
|
8.2
|
|
(29
|
)
|
1,284
|
|
8.9
|
|
(30
|
)
|
|||||||||
|
Credit card loans
|
1,079
|
|
7.8
|
|
13
|
|
831
|
|
5.8
|
|
27
|
|
|||||||||
|
Other loans
|
2,055
|
|
14.8
|
|
6
|
|
2,063
|
|
14.3
|
|
11
|
|
|||||||||
|
Total
|
$
|
13,877
|
|
100.0
|
%
|
$
|
(43
|
)
|
$
|
14,394
|
|
100.0
|
%
|
$
|
(104
|
)
|
|||||
|
Ratings profile:
|
|||||||||||||||||||||
|
Rated Aaa/AAA
|
$
|
6,811
|
|
49.1
|
%
|
$
|
7,510
|
|
52.2
|
%
|
|||||||||||
|
Designated NAIC 1
|
$
|
12,776
|
|
92.1
|
%
|
$
|
13,646
|
|
94.8
|
%
|
|||||||||||
CMBS
Our CMBS holdings are diversified by vintage year. The following tables present our CMBS holdings by NRSRO rating and by vintage year at:
|
|
December 31, 2016
|
||||||||||||||||||||||||||||||||||||||||||||||
|
|
Aaa
|
Aa
|
A
|
Baa
|
Below
Investment
Grade
|
Total
|
|||||||||||||||||||||||||||||||||||||||||
|
|
Amortized
Cost
|
Estimated
Fair
Value
|
Amortized
Cost
|
Estimated
Fair
Value
|
Amortized
Cost
|
Estimated
Fair
Value
|
Amortized
Cost
|
Estimated
Fair
Value
|
Amortized
Cost
|
Estimated
Fair
Value
|
Amortized
Cost
|
Estimated
Fair
Value
|
|||||||||||||||||||||||||||||||||||
|
|
(Dollars in millions)
|
||||||||||||||||||||||||||||||||||||||||||||||
|
2003 - 2005
|
$
|
120
|
|
$
|
130
|
|
$
|
18
|
|
$
|
18
|
|
$
|
26
|
|
$
|
28
|
|
$
|
21
|
|
$
|
22
|
|
$
|
2
|
|
$
|
3
|
|
$
|
187
|
|
$
|
201
|
|
|||||||||||
|
2006
|
33
|
|
36
|
|
—
|
|
—
|
|
8
|
|
8
|
|
—
|
|
—
|
|
3
|
|
3
|
|
44
|
|
47
|
|
|||||||||||||||||||||||
|
2007
|
180
|
|
181
|
|
43
|
|
43
|
|
68
|
|
69
|
|
3
|
|
3
|
|
23
|
|
26
|
|
317
|
|
322
|
|
|||||||||||||||||||||||
|
2008 - 2010
|
5
|
|
5
|
|
—
|
|
—
|
|
—
|
|
—
|
|
—
|
|
—
|
|
—
|
|
—
|
|
5
|
|
5
|
|
|||||||||||||||||||||||
|
2011
|
458
|
|
486
|
|
52
|
|
54
|
|
32
|
|
32
|
|
—
|
|
—
|
|
—
|
|
—
|
|
542
|
|
572
|
|
|||||||||||||||||||||||
|
2012
|
403
|
|
422
|
|
383
|
|
394
|
|
330
|
|
339
|
|
9
|
|
9
|
|
—
|
|
—
|
|
1,125
|
|
1,164
|
|
|||||||||||||||||||||||
|
2013
|
1,000
|
|
1,059
|
|
846
|
|
893
|
|
410
|
|
397
|
|
—
|
|
—
|
|
—
|
|
—
|
|
2,256
|
|
2,349
|
|
|||||||||||||||||||||||
|
2014
|
972
|
|
986
|
|
940
|
|
952
|
|
265
|
|
258
|
|
—
|
|
—
|
|
—
|
|
—
|
|
2,177
|
|
2,196
|
|
|||||||||||||||||||||||
|
2015
|
2,373
|
|
2,374
|
|
460
|
|
452
|
|
217
|
|
216
|
|
8
|
|
8
|
|
—
|
|
—
|
|
3,058
|
|
3,050
|
|
|||||||||||||||||||||||
|
2016
|
1,052
|
|
1,043
|
|
141
|
|
136
|
|
58
|
|
57
|
|
130
|
|
130
|
|
—
|
|
—
|
|
1,381
|
|
1,366
|
|
|||||||||||||||||||||||
|
Total
|
$
|
6,596
|
|
$
|
6,722
|
|
$
|
2,883
|
|
$
|
2,942
|
|
$
|
1,414
|
|
$
|
1,404
|
|
$
|
171
|
|
$
|
172
|
|
$
|
28
|
|
$
|
32
|
|
$
|
11,092
|
|
$
|
11,272
|
|
|||||||||||
|
Ratings
Distribution
|
59.6
|
%
|
26.1
|
%
|
12.5
|
%
|
1.5
|
%
|
0.3
|
%
|
100.0
|
%
|
|||||||||||||||||||||||||||||||||||
143
|
|
December 31, 2015
|
||||||||||||||||||||||||||||||||||||||||||||||
|
|
Aaa
|
Aa
|
A
|
Baa
|
Below
Investment
Grade
|
Total
|
|||||||||||||||||||||||||||||||||||||||||
|
|
Amortized
Cost
|
Estimated
Fair
Value
|
Amortized
Cost
|
Estimated
Fair
Value
|
Amortized
Cost
|
Estimated
Fair
Value
|
Amortized
Cost
|
Estimated
Fair
Value
|
Amortized
Cost
|
Estimated
Fair
Value
|
Amortized
Cost
|
Estimated
Fair
Value
|
|||||||||||||||||||||||||||||||||||
|
|
(Dollars in millions)
|
||||||||||||||||||||||||||||||||||||||||||||||
|
2003 - 2005
|
$
|
187
|
|
$
|
198
|
|
$
|
95
|
|
$
|
101
|
|
$
|
33
|
|
$
|
35
|
|
$
|
47
|
|
$
|
48
|
|
$
|
10
|
|
$
|
10
|
|
$
|
372
|
|
$
|
392
|
|
|||||||||||
|
2006
|
1,061
|
|
1,070
|
|
79
|
|
79
|
|
76
|
|
77
|
|
50
|
|
56
|
|
—
|
|
—
|
|
1,266
|
|
1,282
|
|
|||||||||||||||||||||||
|
2007
|
477
|
|
486
|
|
144
|
|
145
|
|
84
|
|
87
|
|
—
|
|
—
|
|
123
|
|
125
|
|
828
|
|
843
|
|
|||||||||||||||||||||||
|
2008 - 2010
|
5
|
|
5
|
|
—
|
|
—
|
|
13
|
|
13
|
|
—
|
|
—
|
|
—
|
|
—
|
|
18
|
|
18
|
|
|||||||||||||||||||||||
|
2011
|
560
|
|
593
|
|
23
|
|
24
|
|
63
|
|
64
|
|
—
|
|
—
|
|
—
|
|
—
|
|
646
|
|
681
|
|
|||||||||||||||||||||||
|
2012
|
506
|
|
534
|
|
368
|
|
376
|
|
500
|
|
513
|
|
8
|
|
9
|
|
1
|
|
1
|
|
1,383
|
|
1,433
|
|
|||||||||||||||||||||||
|
2013
|
989
|
|
1,036
|
|
696
|
|
735
|
|
893
|
|
925
|
|
12
|
|
10
|
|
—
|
|
—
|
|
2,590
|
|
2,706
|
|
|||||||||||||||||||||||
|
2014
|
854
|
|
859
|
|
939
|
|
937
|
|
453
|
|
459
|
|
1
|
|
1
|
|
—
|
|
—
|
|
2,247
|
|
2,256
|
|
|||||||||||||||||||||||
|
2015
|
2,258
|
|
2,227
|
|
445
|
|
436
|
|
325
|
|
327
|
|
32
|
|
32
|
|
—
|
|
—
|
|
3,060
|
|
3,022
|
|
|||||||||||||||||||||||
|
Total
|
$
|
6,897
|
|
$
|
7,008
|
|
$
|
2,789
|
|
$
|
2,833
|
|
$
|
2,440
|
|
$
|
2,500
|
|
$
|
150
|
|
$
|
156
|
|
$
|
134
|
|
$
|
136
|
|
$
|
12,410
|
|
$
|
12,633
|
|
|||||||||||
|
Ratings
Distribution
|
55.5
|
%
|
22.4
|
%
|
19.8
|
%
|
1.2
|
%
|
1.1
|
%
|
100.0
|
%
|
|||||||||||||||||||||||||||||||||||
The tables above reflect NRSRO ratings including Moody’s, S&P, Fitch and Morningstar. CMBS designated NAIC 1 were
98.7%
and
99.5%
of total CMBS at December 31,
2016
and
2015
, respectively.
Evaluation of AFS Securities for OTTI and Evaluating Temporarily Impaired AFS Securities
See Notes
1
and
8
of the Notes to the Consolidated Financial Statements for information about the evaluation of fixed maturity securities and equity securities AFS for OTTI and evaluation of temporarily impaired AFS securities.
OTTI Losses on Fixed Maturity and Equity Securities AFS Recognized in Earnings
See Note
8
of the Notes to the Consolidated Financial Statements for information about OTTI losses and gross gains and gross losses on AFS securities sold.
Overview of Fixed Maturity and Equity Security OTTI Losses Recognized in Earnings
Impairments of fixed maturity and equity securities were
$206 million
,
$130 million
and
$96 million
for the years ended December 31,
2016
,
2015
and
2014
, respectively. Impairments of fixed maturity securities were
$129 million
,
$90 million
and
$60 million
for the years ended December 31,
2016
,
2015
and
2014
, respectively. Impairments of equity securities were
$77 million
,
$40 million
and
$36 million
for the years ended December 31,
2016
,
2015
and
2014
, respectively.
Credit-related impairments of fixed maturity securities were
$118 million
,
$90 million
and
$60 million
for the years ended December 31,
2016
,
2015
and
2014
, respectively.
Explanations of changes in fixed maturity and equity securities impairments are as follows:
Year Ended December 31,
2016
Compared with the Year Ended December 31,
2015
Overall OTTI losses recognized in earnings on fixed maturity and equity securities were
$206 million
for the year ended December 31,
2016
, as compared to
$130 million
for the year ended December 31,
2015
. The most significant increase in OTTI losses were in U.S. and foreign corporate securities and common stock, which comprised
$180 million
for the year ended December 31,
2016
, as compared to
$93 million
for the year ended December 31,
2015
. An increase of
$87 million
in OTTI losses on U.S. and foreign corporate securities and common stock was concentrated in industrial securities and was the result of lower oil prices impacting the energy sector.
Year Ended December 31,
2015
Compared with the Year Ended December 31,
2014
Overall OTTI losses recognized in earnings on fixed maturity and equity securities were
$130 million
for the year ended December 31,
2015
as compared to
$96 million
for the year ended December 31,
2014
. The most significant decrease in OTTI losses were in U.S. and foreign corporate securities, which comprised
$54 million
for the year ended December 31,
2015
, as compared to
$9 million
for the year ended December 31,
2014
. An increase of
$45 million
in OTTI losses on U.S. and foreign corporate securities reflected the impact of weakening foreign currencies on non-functional currency denominated fixed maturity securities and lower oil prices impacting the energy sector. The
$45 million
increase in OTTI losses on U.S. and foreign corporate securities was concentrated in the utility and consumer services industries.
144
Future Impairments
Future OTTI will depend primarily on economic fundamentals, issuer performance (including changes in the present value of future cash flows expected to be collected), and changes in credit ratings, collateral valuation, interest rates and credit spreads. If economic fundamentals deteriorate or if there are adverse changes in the above factors, OTTI may be incurred in upcoming periods.
FVO and Trading Securities
FVO and trading securities are primarily comprised of securities for which the FVO has been elected (“FVO Securities”). FVO Securities include contractholder-directed investments supporting unit-linked variable annuity type liabilities which do not qualify for presentation as separate account summary total assets and liabilities, certain fixed maturity and equity securities held-for-investment by the general account to support ALM strategies for certain insurance products and investments in certain separate accounts; securities held by CSEs; and trading securities, as further described in Note
1
of the Notes to the Consolidated Financial Statements. In 2016, the Company reinvested its trading securities portfolio into other asset classes and, at
December 31, 2016
, the Company no longer held any actively traded securities. FVO and trading securities were
$13.9 billion
and
$15.0 billion
at estimated fair value, or
2.7%
and
3.0%
of total cash and invested assets, at December 31,
2016
and
2015
, respectively. See Note
10
of the Notes to the Consolidated Financial Statements for the FVO and trading securities fair value hierarchy and a rollforward of the fair value measurements for FVO and trading securities measured at estimated fair value on a recurring basis using significant unobservable (Level 3) inputs.
Securities Lending
We participate in a securities lending program whereby securities are loaned to third parties, primarily brokerage firms and commercial banks. We obtain collateral, usually cash, in an amount generally equal to 102% of the estimated fair value of the securities loaned, which is obtained at the inception of a loan and maintained at a level greater than or equal to 100% for the duration of the loan. We monitor the estimated fair value of the securities loaned on a daily basis with additional collateral obtained as necessary throughout the duration of the loan. Securities loaned under such transactions may be sold or re-pledged by the transferee. We are liable to return to our counterparties the cash collateral under our control. Security collateral on deposit from counterparties may not be sold or re-pledged, unless the counterparty is in default, and is not reflected on the consolidated financial statements. These transactions are treated as financing arrangements and the associated cash collateral liability is recorded at the amount of the cash received.
See “— Liquidity and Capital Resources — The Company — Liquidity and Capital Uses — Securities Lending” and Note
8
of the Notes to the Consolidated Financial Statements for information regarding our securities lending program.
Repurchase Agreement Transactions
The Company participates in short-term repurchase agreements with unaffiliated financial institutions. Under these agreements, the Company lends fixed maturity securities and receives cash as collateral in an amount generally equal to 85% to 100% of the estimated fair value of the securities loaned at the inception of the transaction. The associated liability is recorded at the amount of cash received. The Company monitors the estimated fair value of the collateral and the securities loaned throughout the duration of the transaction and additional collateral is obtained as necessary. Securities loaned under such transactions may be sold or re-pledged by the transferee.
See Note
8
of the Notes to the Consolidated Financial Statements for information regarding our repurchase agreement transactions.
145
Mortgage Loans
Our mortgage loans are principally collateralized by commercial, agricultural and residential properties. Mortgage loans and the related valuation allowances are summarized as follows at:
|
|
December 31,
|
||||||||||||||||||||||||||
|
|
2016
|
2015
|
|||||||||||||||||||||||||
|
|
Recorded
Investment |
% of
Total |
Valuation
Allowance |
% of
Recorded Investment |
Recorded
Investment |
% of
Total |
Valuation
Allowance |
% of
Recorded Investment |
|||||||||||||||||||
|
|
(Dollars in millions)
|
||||||||||||||||||||||||||
|
Commercial
|
$
|
48,035
|
|
64.7
|
%
|
$
|
234
|
|
0.5
|
%
|
$
|
44,012
|
|
65.8
|
%
|
$
|
217
|
|
0.5
|
%
|
|||||||
|
Agricultural
|
14,456
|
|
19.5
|
|
44
|
|
0.3
|
%
|
13,188
|
|
19.7
|
|
42
|
|
0.3
|
%
|
|||||||||||
|
Residential
|
11,696
|
|
15.8
|
|
66
|
|
0.6
|
%
|
9,734
|
|
14.5
|
|
59
|
|
0.6
|
%
|
|||||||||||
|
Total
|
$
|
74,187
|
|
100.0
|
%
|
$
|
344
|
|
0.5
|
%
|
$
|
66,934
|
|
100.0
|
%
|
$
|
318
|
|
0.5
|
%
|
|||||||
The information presented in the tables herein exclude mortgage loans where we elected the FVO. Such amounts are presented in Note
8
of the Notes to the Consolidated Financial Statements.
We diversify our mortgage loan portfolio by both geographic region and property type to reduce the risk of concentration. Of our commercial and agricultural mortgage loan portfolios,
86%
are collateralized by properties located in the United States, with the remaining
14%
collateralized by properties located outside the United States, which includes
5%
of properties located in the U.K., at December 31,
2016
. The carrying value of our commercial and agricultural mortgage loans located in California, New York and Texas were
20%
,
12%
and
8%
, respectively, of total commercial and agricultural mortgage loans at
December 31, 2016
. Additionally, we manage risk when originating commercial and agricultural mortgage loans by generally lending up to 75% of the estimated fair value of the underlying real estate collateral.
We manage our residential mortgage loan portfolio in a similar manner to reduce risk of concentration, with
92%
collateralized by properties located in the United States, and the remaining
8%
collateralized by properties located outside the United States, at
December 31, 2016
. The carrying value of our residential mortgage loans located in California, Florida, and New York were
33%
,
8%
, and
6%
, respectively, of total residential mortgage loans at December 31, 2016.
In connection with our investment management business, we manage commercial mortgage loans on behalf of institutional clients, which are unaffiliated investors. These commercial mortgage loans had an estimated fair value of
$3.0 billion
and
$2.0 billion
at
December 31, 2016
and
2015
, respectively. As these assets are managed on behalf of, and owned by, our institutional clients, they are not included in our consolidated financial statements.
146
Commercial Mortgage Loans by Geographic Region and Property Type
. Commercial mortgage loans are the largest component of the mortgage loan invested asset class. The tables below present the diversification across geographic regions and property types of commercial mortgage loans at:
|
|
December 31,
|
||||||||||||
|
|
2016
|
2015
|
|||||||||||
|
|
Amount
|
% of
Total
|
Amount
|
% of
Total
|
|||||||||
|
|
(Dollars in millions)
|
||||||||||||
|
Region
|
|||||||||||||
|
Pacific
|
$
|
11,254
|
|
23.4
|
%
|
$
|
9,583
|
|
21.8
|
%
|
|||
|
Middle Atlantic
|
8,708
|
|
18.1
|
|
8,154
|
|
18.5
|
|
|||||
|
International
|
8,084
|
|
16.8
|
|
7,889
|
|
17.9
|
|
|||||
|
South Atlantic
|
6,304
|
|
13.1
|
|
6,127
|
|
13.9
|
|
|||||
|
West South Central
|
4,271
|
|
8.9
|
|
4,311
|
|
9.8
|
|
|||||
|
East North Central
|
2,447
|
|
5.1
|
|
2,346
|
|
5.3
|
|
|||||
|
Mountain
|
1,460
|
|
3.0
|
|
1,117
|
|
2.5
|
|
|||||
|
New England
|
1,414
|
|
3.0
|
|
1,367
|
|
3.1
|
|
|||||
|
West North Central
|
599
|
|
1.3
|
|
520
|
|
1.2
|
|
|||||
|
East South Central
|
436
|
|
0.9
|
|
512
|
|
1.2
|
|
|||||
|
Multi-Region and Other
|
3,058
|
|
6.4
|
|
2,086
|
|
4.8
|
|
|||||
|
Total recorded investment
|
48,035
|
|
100.0
|
%
|
44,012
|
|
100.0
|
%
|
|||||
|
Less: valuation allowances
|
234
|
|
217
|
|
|||||||||
|
Carrying value, net of valuation allowances
|
$
|
47,801
|
|
$
|
43,795
|
|
|||||||
|
Property Type
|
|||||||||||||
|
Office
|
$
|
23,843
|
|
49.6
|
%
|
$
|
21,525
|
|
48.9
|
%
|
|||
|
Retail
|
10,619
|
|
22.1
|
|
10,466
|
|
23.8
|
|
|||||
|
Apartment
|
5,870
|
|
12.2
|
|
5,171
|
|
11.7
|
|
|||||
|
Hotel
|
4,367
|
|
9.1
|
|
4,396
|
|
10.0
|
|
|||||
|
Industrial
|
2,998
|
|
6.3
|
|
2,334
|
|
5.3
|
|
|||||
|
Other
|
338
|
|
0.7
|
|
120
|
|
0.3
|
|
|||||
|
Total recorded investment
|
48,035
|
|
100.0
|
%
|
44,012
|
|
100.0
|
%
|
|||||
|
Less: valuation allowances
|
234
|
|
217
|
|
|||||||||
|
Carrying value, net of valuation allowances
|
$
|
47,801
|
|
$
|
43,795
|
|
|||||||
__________________
Mortgage Loan Credit Quality
—
Monitoring Process.
We monitor our mortgage loan investments on an ongoing basis, including a review of loans that are current, past due, restructured and under foreclosure. See Note
8
of the Notes to the Consolidated Financial Statements for tables that present mortgage loans by credit quality indicator, past due and nonaccrual mortgage loans, as well as impaired mortgage loans. See “— Real Estate and Real Estate Joint Ventures” for real estate acquired through foreclosure.
We review our commercial mortgage loans on an ongoing basis. These reviews may include an analysis of the property financial statements and rent roll, lease rollover analysis, property inspections, market analysis, estimated valuations of the underlying collateral, loan-to-value ratios, debt service coverage ratios and tenant creditworthiness. The monitoring process focuses on higher risk loans, which include those that are classified as restructured, delinquent or in foreclosure, as well as loans with higher loan-to-value ratios and lower debt service coverage ratios. The monitoring process for agricultural mortgage loans is generally similar, with a focus on higher risk loans, such as loans with higher loan-to-value ratios, including reviews on a geographic and sector basis. We review our residential mortgage loans on an ongoing basis. See Note
8
of the Notes to the Consolidated Financial Statements for information on our evaluation of residential mortgage loans and related valuation allowance methodology.
147
Loan-to-value ratios and debt service coverage ratios are common measures in the assessment of the quality of commercial mortgage loans. Loan-to-value ratios are a common measure in the assessment of the quality of agricultural mortgage loans. Loan-to-value ratios compare the amount of the loan to the estimated fair value of the underlying collateral. A loan-to-value ratio greater than 100% indicates that the loan amount is greater than the collateral value. A loan-to-value ratio of less than 100% indicates an excess of collateral value over the loan amount. Generally, the higher the loan-to-value ratio, the higher the risk of experiencing a credit loss. The debt service coverage ratio compares a property’s net operating income to amounts needed to service the principal and interest due under the loan. Generally, the lower the debt service coverage ratio, the higher the risk of experiencing a credit loss. For our commercial mortgage loans, our average loan-to-value ratio was
52%
at both December 31,
2016
and
2015
, and our average debt service coverage ratio was
2.6x
at both December 31,
2016
and
2015
. The debt service coverage ratio, as well as the values utilized in calculating the ratio, is updated annually on a rolling basis, with a portion of the portfolio updated each quarter. In addition, the loan-to-value ratio is routinely updated for all but the lowest risk loans as part of our ongoing review of our commercial mortgage loan portfolio. For our agricultural mortgage loans, our average loan-to-value ratio was
43%
at both December 31,
2016
and
2015
. The values utilized in calculating the agricultural mortgage loan loan-to-value ratio are developed in connection with the ongoing review of the agricultural loan portfolio and are routinely updated.
Mortgage Loan Valuation Allowances.
Our valuation allowances are established both on a loan specific basis for those loans considered impaired where a property specific or market specific risk has been identified that could likely result in a future loss, as well as for pools of loans with similar risk characteristics where a property specific or market specific risk has not been identified, but for which we expect to incur a loss. Accordingly, a valuation allowance is provided to absorb these estimated probable credit losses.
The determination of the amount of valuation allowances is based upon our periodic evaluation and assessment of known and inherent risks associated with our loan portfolios. Such evaluations and assessments are based upon several factors, including our experience for loan losses, defaults and loss severity, and loss expectations for loans with similar risk characteristics. These evaluations and assessments are revised as conditions change and new information becomes available, which can cause the valuation allowances to increase or decrease over time as such evaluations are revised. Negative credit migration, including an actual or expected increase in the level of problem loans, will result in an increase in the valuation allowance. Positive credit migration, including an actual or expected decrease in the level of problem loans, will result in a decrease in the valuation allowance.
See Notes
1
,
8
and
10
of the Notes to the Consolidated Financial Statements for information about how valuation allowances are established and monitored, activity in and balances of the valuation allowance, and the estimated fair value of impaired mortgage loans and related impairments included within net investment gains (losses) as of and for the years ended December 31,
2016
,
2015
and
2014
.
Real Estate and Real Estate Joint Ventures
We diversify our real estate investments by both geographic region and property type to reduce risk of concentration. Of our real estate investments, excluding funds,
72%
were located in the United States, with the remaining
28%
located outside the United States, at December 31, 2016. The carrying value of our real estate investments, excluding funds, located in Japan, California and District of Columbia were
24%
,
16%
and
9%
, respectively, of total real estate investments, excluding funds, at December 31, 2016. Real estate funds, including those classified within traditional, were
12%
of our real estate investments, at December 31, 2016. The majority of these funds hold underlying real estate investments that are well diversified across the United States.
148
Real estate investments by type consisted of the following at:
|
|
December 31,
|
||||||||||||
|
|
2016
|
2015
|
|||||||||||
|
|
Carrying
Value
|
% of
Total
|
Carrying
Value
|
% of
Total
|
|||||||||
|
|
(Dollars in millions)
|
||||||||||||
|
Traditional
|
$
|
8,739
|
|
96.7
|
%
|
$
|
7,859
|
|
93.2
|
%
|
|||
|
Real estate joint ventures and funds
|
243
|
|
2.7
|
|
482
|
|
5.7
|
|
|||||
|
Subtotal
|
8,982
|
|
99.4
|
|
8,341
|
|
98.9
|
|
|||||
|
Foreclosed (commercial, agricultural and residential)
|
59
|
|
0.6
|
|
45
|
|
0.5
|
|
|||||
|
Real estate held-for-investment
|
9,041
|
|
100.0
|
|
8,386
|
|
99.4
|
|
|||||
|
Real estate held-for-sale
|
—
|
|
—
|
|
47
|
|
0.6
|
|
|||||
|
Total real estate and real estate joint ventures
|
$
|
9,041
|
|
100.0
|
%
|
$
|
8,433
|
|
100.0
|
%
|
|||
We classify within traditional, in the above table, income-producing real estate, which is comprised of wholly-owned real estate and joint ventures with interests in single property income-producing real estate. The estimated fair value of the traditional and held-for-sale real estate investment portfolios was
$13.9 billion
and
$12.4 billion
at December 31,
2016
and
2015
, respectively. The total gross market value of such real estate investments was
$19.0 billion
and
$20.3 billion
at December 31, 2016 and 2015, respectively. Gross market value is the total fair value of these investments regardless of encumbering debt.
We classify within real estate joint ventures and funds, in the above table, our investment in joint ventures with interests in multi-property projects with varying strategies ranging from the development of properties to the operation of income-producing properties, as well as a runoff portfolio of real estate private equity funds. From time to time, if we intend to retain an interest in the property, we transfer investments from these development joint ventures to traditional real estate after the completed property commences operations.
Impairments recognized on real estate and real estate joint ventures were
$34 million
,
$93 million
and
$20 million
for the years ended
December 31, 2016
,
2015
and
2014
, respectively. Depreciation expense on real estate investments was
$92 million
,
$162 million
and
$199 million
for the years ended December 31,
2016
,
2015
and
2014
, respectively. Real estate investments were net of accumulated depreciation of
$823 million
and
$1.2 billion
at December 31,
2016
and
2015
, respectively.
In connection with our investment management business, we manage real estate investments on behalf of institutional clients, which are unaffiliated investors. These real estate investments had an estimated fair value of
$4.3 billion
and
$3.8 billion
at
December 31, 2016
and
2015
, respectively. The total gross market value of commercial real estate investments under management for unaffiliated investors was
$6.4 billion
and
$5.8 billion
at December 31, 2016 and 2015, respectively. Gross market value is the total fair value of these investments regardless of encumbering debt. As these assets are managed on behalf of, and owned by our institutional clients, they are not included in our consolidated financial statements.
149
We diversify our real estate investments by both geographic region and property type to reduce risk of concentration.
Real estate and real estate joint venture investments by property type are categorized by sector as follows at:
|
|
December 31,
|
||||||||||||
|
|
2016
|
2015
|
|||||||||||
|
|
Carrying
Value
|
% of
Total
|
Carrying
Value
|
% of
Total
|
|||||||||
|
|
(Dollars in millions)
|
||||||||||||
|
Office
|
$
|
3,507
|
|
38.8
|
%
|
$
|
3,265
|
|
38.7
|
%
|
|||
|
Apartment
|
1,541
|
|
17.0
|
|
1,662
|
|
19.7
|
|
|||||
|
Retail
|
1,040
|
|
11.5
|
|
1,032
|
|
12.2
|
|
|||||
|
Real estate funds
|
976
|
|
10.8
|
|
683
|
|
8.1
|
|
|||||
|
Land
|
558
|
|
6.2
|
|
348
|
|
4.1
|
|
|||||
|
Hotel
|
530
|
|
5.9
|
|
544
|
|
6.5
|
|
|||||
|
Industrial
|
461
|
|
5.1
|
|
483
|
|
5.7
|
|
|||||
|
Agriculture
|
61
|
|
0.7
|
|
32
|
|
0.4
|
|
|||||
|
Other
|
367
|
|
4.0
|
|
384
|
|
4.6
|
|
|||||
|
Total real estate and real estate joint ventures
|
$
|
9,041
|
|
100.0
|
%
|
$
|
8,433
|
|
100.0
|
%
|
|||
Other Limited Partnership Interests
Other limited partnership interests are comprised of private equity funds and hedge funds. The carrying value of other limited partnership interests was
$6.8 billion
and
$7.1 billion
at December 31,
2016
and
2015
, respectively, which included
$1.0 billion
and
$1.9 billion
of hedge funds, at December 31,
2016
and
2015
, respectively. Cash distributions on these investments are generated from investment gains, operating income from the underlying investments of the funds and liquidation of the underlying investments of the funds. We estimate that the underlying investments of the funds will be liquidated over the next two to 10 years.
Other Invested Assets
The following table presents the carrying value of our other invested assets by type at:
|
|
December 31,
|
|||||||||||||
|
|
2016
|
2015
|
||||||||||||
|
|
Carrying
Value
|
% of
Total
|
Carrying
Value
|
% of
Total
|
||||||||||
|
(Dollars in millions)
|
||||||||||||||
|
Freestanding derivatives with positive estimated fair values
|
$
|
15,761
|
|
68.0
|
%
|
$
|
14,406
|
|
64.0
|
%
|
||||
|
Tax credit and renewable energy partnerships
|
3,231
|
|
13.9
|
|
3,145
|
|
13.9
|
|
||||||
|
Leveraged leases, net of non-recourse debt
|
1,590
|
|
6.9
|
|
1,712
|
|
7.6
|
|
||||||
|
Direct financing leases
|
1,115
|
|
4.8
|
|
1,076
|
|
4.8
|
|
||||||
|
Operating joint ventures
|
643
|
|
2.8
|
|
605
|
|
2.7
|
|
||||||
|
Funds withheld
|
110
|
|
0.5
|
|
771
|
|
3.4
|
|
||||||
|
Other
|
735
|
|
3.1
|
|
809
|
|
3.6
|
|
||||||
|
Total
|
$
|
23,185
|
|
100.0
|
%
|
$
|
22,524
|
|
100.0
|
%
|
||||
Leveraged lease impairments were
$77 million
,
$41 million
and
$80 million
for the years ended December 31,
2016
,
2015
and
2014
, respectively.
See Notes
1
,
8
and
9
of the Notes to the Consolidated Financial Statements for information regarding tax credit and renewable energy partnerships, leveraged and direct financing leases, funds withheld and operating joint ventures and freestanding derivatives with positive estimated fair values.
150
Our private placement unit originated
$10.2 billion
and
$9.2 billion
of private investments, comprised primarily of certain privately placed fixed maturity securities, during the years ended December 31,
2016
and
2015
, respectively. The carrying value of such private investments included within our consolidated balance sheets was
$50.6 billion
and
$46.6 billion
at December 31,
2016
and
2015
.
In addition, we originated
$339 million
and
$480 million
of tax credit and renewable energy partnerships during the years ended December 31,
2016
and
2015
, respectively. The carrying value of such tax credit and renewable energy partnerships included on our consolidated balance sheets was
$3.2 billion
and $3.1 billion at December 31,
2016
and
2015
, respectively.
Derivatives
Derivative Risks
We are exposed to various risks relating to our ongoing business operations, including interest rate, foreign currency exchange rate, credit and equity market. We use a variety of strategies to manage these risks, including the use of derivatives. See Note
9
of the Notes to the Consolidated Financial Statements for:
|
•
|
A comprehensive description of the nature of our derivatives, including the strategies for which derivatives are used in managing various risks.
|
|
•
|
Information about the gross notional amount, estimated fair value, and primary underlying risk exposure of our derivatives by type of hedge designation, excluding embedded derivatives held at
December 31, 2016
and
2015
.
|
|
•
|
The statement of operations effects of derivatives in net investments in foreign operations, cash flow, fair value, or nonqualifying hedge relationships for the
years ended December 31, 2016
,
2015
and
2014
.
|
See “Quantitative and Qualitative Disclosures About Market Risk — Management of Market Risk Exposures — Hedging Activities” for more information about our use of derivatives by major hedge program.
Fair Value Hierarchy
See Note
10
of the Notes to the Consolidated Financial Statements for derivatives measured at estimated fair value on a recurring basis and their corresponding fair value hierarchy.
The valuation of Level 3 derivatives involves the use of significant unobservable inputs and generally requires a higher degree of management judgment or estimation than the valuations of Level 1 and Level 2 derivatives. Although Level 3 inputs are unobservable, management believes they are consistent with what other market participants would use when pricing such instruments and are considered appropriate given the circumstances. The use of different inputs or methodologies could have a material effect on the estimated fair value of Level 3 derivatives and could materially affect net income.
Derivatives categorized as Level 3 at
December 31, 2016
include: interest rate forwards with maturities which extend beyond the observable portion of the yield curve; interest rate total return swaps with unobservable repurchase rates; foreign currency swaps and forwards with certain unobservable inputs, including the unobservable portion of the yield curve; credit default swaps priced using unobservable credit spreads, or that are priced through independent broker quotations; equity variance swaps with unobservable volatility inputs; and equity index options with unobservable correlation inputs. At
December 31, 2016
, less than 1% of the estimated fair value of our derivatives was priced through independent broker quotations.
See Note
10
of the Notes to the Consolidated Financial Statements for a rollforward of the fair value measurements for derivatives measured at estimated fair value on a recurring basis using significant unobservable (Level 3) inputs.
The gain (loss) on Level 3 derivatives primarily relates to interest rate total return swaps with unobservable repurchase rates; certain purchased equity index options that are valued using models dependent on an unobservable market correlation input, equity variance swaps that are valued using observable equity volatility data plus an unobservable equity variance spread and foreign currency swaps and forwards that are valued using an unobservable portion of the swap yield curves. Other significant inputs, which are observable, include equity index levels, equity volatility and the swap yield curves. We validate the reasonableness of these inputs by valuing the positions using internal models and comparing the results to broker quotations.
151
The gain (loss) on Level 3 derivatives, percentage of gain (loss) attributable to observable and unobservable inputs, and the primary drivers of observable gain (loss) are summarized as follows:
|
Year Ended December 31, 2016
|
||
|
Gain (loss) recognized in net income (loss)
|
($734) million
|
|
|
Percentage of gain (loss) attributable to observable inputs
|
120%
|
|
|
Primary drivers of observable gain (loss)
|
Increases in interest rates on interest rate total return swaps; decreases in certain equity volatility levels; and increases in certain equity index levels; partially offset by weakening of the U.S. dollar versus foreign currencies on receive inflation-linked foreign currency, pay U.S. dollar forwards and swaps.
|
|
|
Percentage of gain (loss) attributable to unobservable inputs
|
(20%)
|
|
See “— Summary of Critical Accounting Estimates — Derivatives” for further information on the estimates and assumptions that affect derivatives.
Credit Risk
See Note
9
of the Notes to the Consolidated Financial Statements for information about how we manage credit risk related to derivatives and for the estimated fair value of our net derivative assets and net derivative liabilities after the application of master netting agreements and collateral.
Our policy is not to offset the fair value amounts recognized for derivatives executed with the same counterparty under the same master netting agreement. This policy applies to the recognition of derivatives on the consolidated balance sheets, and does not affect our legal right of offset.
Credit Derivatives
The following table presents the gross notional amount and estimated fair value of credit default swaps at:
|
December 31,
|
||||||||||||||||
|
2016
|
2015
|
|||||||||||||||
|
Credit Default Swaps
|
Gross
Notional
Amount
|
Estimated
Fair Value
|
Gross
Notional
Amount
|
Estimated
Fair Value
|
||||||||||||
|
(In millions)
|
||||||||||||||||
|
Purchased (1)
|
$
|
2,038
|
|
$
|
(26
|
)
|
$
|
1,870
|
|
$
|
(6
|
)
|
||||
|
Written (2)
|
12,645
|
|
180
|
|
10,311
|
|
65
|
|
||||||||
|
Total
|
$
|
14,683
|
|
$
|
154
|
|
$
|
12,181
|
|
$
|
59
|
|
||||
__________________
|
(1)
|
At December 31, 2016, the Company no longer maintained a trading portfolio for derivatives. At December 31, 2015, the gross notional amount and estimated fair value for purchased credit default swaps in the trading portfolio were $175 million and ($2) million, respectively.
|
|
(2)
|
At December 31, 2016, the Company no longer maintained a trading portfolio for derivatives. At December 31, 2015, the gross notional amount and estimated fair value for written credit default swaps in the trading portfolio were $20 million and ($2) million, respectively.
|
152
The following table presents the gross gains, gross losses and net gain (losses) recognized in income for credit default swaps as follows:
|
Years Ended December 31,
|
||||||||||||||||||||||||
|
2016
|
2015
|
|||||||||||||||||||||||
|
Credit Default Swaps
|
Gross
Gains
(1)
|
Gross
Losses
(1)
|
Net
Gains
(Losses)
|
Gross
Gains
(1)
|
Gross
Losses
(1)
|
Net
Gains
(Losses)
|
||||||||||||||||||
|
(In millions)
|
||||||||||||||||||||||||
|
Purchased (2), (4)
|
$
|
7
|
|
$
|
(47
|
)
|
$
|
(40
|
)
|
$
|
32
|
|
$
|
(28
|
)
|
$
|
4
|
|
||||||
|
Written (3), (4)
|
109
|
|
(28
|
)
|
81
|
|
29
|
|
(112
|
)
|
(83
|
)
|
||||||||||||
|
Total
|
$
|
116
|
|
$
|
(75
|
)
|
$
|
41
|
|
$
|
61
|
|
$
|
(140
|
)
|
$
|
(79
|
)
|
||||||
__________________
|
(1)
|
Gains (losses) are reported in net derivative gains (losses), except for gains (losses) on the trading portfolio, which are reported in net investment income.
|
|
(2)
|
The gross gains and gross (losses) for purchased credit default swaps in the trading portfolio were $4 million and ($4) million, respectively, for the
year ended December 31, 2016
, and $8 million and ($11) million, respectively, for the
year ended December 31, 2015
.
|
|
(3)
|
The gross gains and gross (losses) for written credit default swaps in the trading portfolio were $3 million and ($3) million, respectively, for both of the years ended
December 31, 2016
and
December 31, 2015
.
|
|
(4)
|
Gains (losses) do not include earned income (expense) on credit default swaps.
|
The unfavorable change in net gains (losses) on purchased credit default swaps of
($44) million
was due to certain credit spreads on credit default swaps hedging certain bonds, narrowing in the current period as compared to the prior period. The favorable change in net gains (losses) on written credit default swaps of
$164 million
was due to certain credit spreads on certain credit default swaps used as replications narrowing in the current period as compared to the prior period.
The maximum amount at risk related to our written credit default swaps is equal to the corresponding gross notional amount. In a replication transaction, we pair an asset on our balance sheet with a written credit default swap to synthetically replicate a corporate bond, a core asset holding of life insurance companies. Replications are entered into in accordance with the guidelines approved by state insurance regulators and the NAIC and are an important tool in managing the overall corporate credit risk within the Company. In order to match our long-dated insurance liabilities, we seek to buy long-dated corporate bonds. In some instances, these may not be readily available in the market, or they may be issued by corporations to which we already have significant corporate credit exposure. For example, by purchasing Treasury bonds (or other high-quality assets) and associating them with written credit default swaps on the desired corporate credit name, we can replicate the desired bond exposures and meet our ALM needs. In addition, given the shorter tenor of the credit default swaps (generally five-year tenors) versus a long-dated corporate bond, we have more flexibility in managing our credit exposures.
Embedded Derivatives
See Note
10
of the Notes to the Consolidated Financial Statements for information about embedded derivatives measured at estimated fair value on a recurring basis and their corresponding fair value hierarchy.
See Note
10
of the Notes to the Consolidated Financial Statements for a rollforward of the fair value measurements for embedded derivatives measured at estimated fair value on a recurring basis using significant unobservable (Level 3) inputs.
See Note
9
of the Notes to the Consolidated Financial Statements for information about the nonperformance risk adjustment included in the valuation of guaranteed minimum benefits accounted for as embedded derivatives.
See “— Summary of Critical Accounting Estimates — Derivatives” for further information on the estimates and assumptions that affect embedded derivatives.
153
Off-Balance Sheet Arrangements
Credit and Committed Facilities
We maintain an unsecured revolving credit facility, as well as committed facilities, with various financial institutions. Brighthouse maintains an unsecured term loan agreement and an unsecured revolving credit facility with various financial institutions. See “— Liquidity and Capital Resources — The Company — Liquidity and Capital Sources — Global Funding Sources — Credit and Committed Facilities” for further descriptions of such arrangements. For the classification of expenses on such credit and committed facilities and the nature of the associated liability for letters of credit issued and drawdowns on these credit and committed facilities, see Note
12
of the Notes to the Consolidated Financial Statements.
Collateral for Securities Lending, Third-Party Custodian Administered Repurchase Programs and Derivatives
We participate in a securities lending program in the normal course of business for the purpose of enhancing the total return on our investment portfolio. Periodically we receive non-cash collateral for securities lending from counterparties on deposit from customers, which cannot be sold or re-pledged, and which has not been recorded on our consolidated balance sheets. The amount of this collateral was
$46 million
and
$50 million
at estimated fair value at December 31,
2016
and
2015
, respectively. See Notes
1
and
8
of the Notes to the Consolidated Financial Statements, as well as “— Investments — Securities Lending” for discussion of our securities lending program, the classification of revenues and expenses, and the nature of the secured financing arrangement and associated liability.
We also participate in third-party custodian administered repurchase programs for the purpose of enhancing the total return on our investment portfolio. We loan certain of our fixed maturity securities to financial institutions and, in exchange, non-cash collateral is put on deposit by the financial institutions on our behalf with third-party custodians. The estimated fair value of securities loaned in connection with these transactions was
$382 million
and
$738 million
at
December 31, 2016
and
December 31, 2015
, respectively. Non-cash collateral on deposit with third-party custodians on our behalf was
$401 million
and
$781 million
at
December 31, 2016
and
December 31, 2015
, respectively, which cannot be sold or re-pledged, and which has not been recorded on our consolidated balance sheets.
We enter into derivatives to manage various risks relating to our ongoing business operations. We have non-cash collateral from counterparties for derivatives, which can be sold or re-pledged subject to certain constraints, and which has not been recorded on our consolidated balance sheets. The amount of this non-cash collateral was
$2.3 billion
and
$2.2 billion
at December 31,
2016
and
2015
, respectively. See “— Liquidity and Capital Resources — The Company — Liquidity and Capital Uses — Pledged Collateral” and “Derivatives” in Note
9
of the Notes to the Consolidated Financial Statements for information regarding the earned income on and the gross notional amount, estimated fair value of assets and liabilities and primary underlying risk exposure of our derivatives.
Lease Commitments
As lessee, we have entered into various lease and sublease agreements for office space, information technology and other equipment. Our commitments under such lease agreements are included within the contractual obligations table. See “— Liquidity and Capital Resources — The Company — Contractual Obligations” and Note
21
of the Notes to the Consolidated Financial Statements.
Guarantees
See “Guarantees” in Note
21
of the Notes to the Consolidated Financial Statements.
Other
We enter into the following additional commitments in the normal course of business for the purpose of enhancing the total return on our investment portfolio: mortgage loan commitments and commitments to fund partnerships, bank credit facilities, bridge loans and private corporate bond investments. See “Net Investment Income” and “Net Investment Gains (Losses)” in Note
8
of the Notes to the Consolidated Financial Statements for information on the investment income, investment expense, and gains and losses from such investments. See also “— Investments — Fixed Maturity and Equity Securities AFS” and “— Investments — Mortgage Loans” for information on our investments in fixed maturity securities and mortgage loans. See “— Investments — Real Estate and Real Estate Joint Ventures” and “— Investments — Other Limited Partnership Interests” for information on our partnership investments.
154
Other than the commitments disclosed in Note
21
of the Notes to the Consolidated Financial Statements, there are no other material obligations or liabilities arising from the commitments to fund mortgage loans, partnerships, bank credit facilities, bridge loans, and private corporate bond investments. For further information on commitments to fund partnership investments, mortgage loans, bank credit facilities, bridge loans and private corporate bond investments, see “— Liquidity and Capital Resources — The Company — Contractual Obligations.”
Insolvency Assessments
See Note
21
of the Notes to the Consolidated Financial Statements.
Policyholder Liabilities
We establish, and carry as liabilities, actuarially determined amounts that are calculated to meet policy obligations or to provide for future annuity payments. Amounts for actuarial liabilities are computed and reported on the consolidated financial statements in conformity with GAAP. For more details on Policyholder Liabilities, see “— Summary of Critical Accounting Estimates.”
Due to the nature of the underlying risks and the uncertainty associated with the determination of actuarial liabilities, we cannot precisely determine the amounts that will ultimately be paid with respect to these actuarial liabilities, and the ultimate amounts may vary from the estimated amounts, particularly when payments may not occur until well into the future.
We periodically review our estimates of actuarial liabilities for future benefits and compare them with our actual experience. We revise estimates, to the extent permitted or required under GAAP, if we determine that future expected experience differs from assumptions used in the development of actuarial liabilities. We charge or credit changes in our liabilities to expenses in the period the liabilities are established or re-estimated. If the liabilities originally established for future benefit payments prove inadequate, we must increase them. Such an increase could adversely affect our earnings and have a material adverse effect on our business, results of operations and financial condition.
We have experienced, and will likely in the future experience, catastrophe losses and possibly acts of terrorism, as well as turbulent financial markets that may have an adverse impact on our business, results of operations, and financial condition. Due to their nature, we cannot predict the incidence, timing, severity or amount of losses from catastrophes and acts of terrorism, but we make broad use of catastrophic and non-catastrophic reinsurance to manage risk from these perils. We also use hedging, reinsurance and other risk management activities to mitigate financial market volatility.
Insurance regulators in many of the non-U.S. countries in which we operate require certain MetLife entities to prepare a sufficiency analysis of the reserves presented in the locally required regulatory financial statements, and to submit that analysis to the regulatory authorities.
See “Business — Regulation — U.S. Regulation — Insurance Regulation — Policy and Contract Reserve Adequacy Analysis” and “Business — Regulation — International Regulation” for further information.
Future Policy Benefits
We establish liabilities for amounts payable under insurance policies. See Notes
1
and
4
of the Notes to the Consolidated Financial Statements, “— Industry Trends — Impact of a Sustained Low Interest Rate Environment — Low Interest Rate Scenario” and “— Variable Annuity Guarantees.” A discussion of future policy benefits by segment (as well as Corporate & Other) follows.
155
U.S.
Amounts payable under insurance policies for this segment are comprised of group insurance and annuities, as well as property & casualty policies. For group insurance, future policyholder benefits are comprised mainly of liabilities for disabled lives under disability waiver of premium policy provisions, liabilities for survivor income benefit insurance, active life policies and premium stabilization and other contingency liabilities held under life insurance contracts. For group annuity contracts, future policyholder benefits are primarily related to payout annuities, including pension risk transfers, structured settlement annuities and institutional income annuities. There is no interest rate crediting flexibility on these liabilities. As a result, a sustained low interest rate environment could negatively impact earnings; however, we mitigate our risks by applying various ALM strategies, including the use of various interest rate derivative positions. The components of future policy benefits related to our property & casualty policies are liabilities for unpaid claims, estimated based upon assumptions such as rates of claim frequencies, levels of severities, inflation, judicial trends, legislative changes or regulatory decisions. Assumptions are based upon our historical experience and analysis of historical development patterns of the relationship of loss adjustment expenses to losses for each line of business, and we consider the effects of current developments, anticipated trends and risk management programs, reduced for anticipated salvage and subrogation.
Asia
Future policy benefits for this segment are held primarily for traditional life, endowment, annuity and accident & health contracts. They are also held for total return pass-through provisions included in certain universal life and savings products. They include certain liabilities for variable annuity and variable life guarantees of minimum death benefits, and longevity guarantees. Factors impacting these liabilities include sustained periods of lower yields than rates established at policy issuance, lower than expected asset reinvestment rates, market volatility, actual lapses resulting in lower than expected income, and actual mortality or morbidity resulting in higher than expected benefit payments. We mitigate our risks by applying various ALM strategies.
Latin America
Future policy benefits for this segment are held primarily for immediate annuities in Chile, Argentina and Mexico and traditional life contracts mainly in Mexico, Brazil and Colombia. There are also liabilities held for total return pass-through provisions included in certain universal life and savings products in Mexico. Factors impacting these liabilities include sustained periods of lower yields than rates established at policy issuance, lower than expected asset reinvestment rates, and mortality and lapses different than expected. We mitigate our risks by applying various ALM strategies.
EMEA
Future policy benefits for this segment include unearned premium reserves for group life and credit insurance contracts. Future policy benefits are also held for traditional life, endowment and annuity contracts with significant mortality risk and accident & health contracts. Factors impacting these liabilities include lower than expected asset reinvestment rates, market volatility, actual lapses resulting in lower than expected income, and actual mortality or morbidity resulting in higher than expected benefit payments. We mitigate our risks by having premiums which are adjustable or cancellable in some cases, and by applying various ALM strategies.
MetLife Holdings
Future policy benefits for the life business are comprised mainly of liabilities for traditional life and for universal and variable life insurance contracts. In order to manage risk, we have often reinsured a portion of the mortality risk on life insurance policies. The reinsurance programs are routinely evaluated and this may result in increases or decreases to existing coverage. We have entered into various interest rate derivative positions to mitigate the risk that investment of premiums received and reinvestment of maturing assets over the life of the policy will be at rates below those assumed in the original pricing of these contracts. For the annuities business, future policy benefits are comprised mainly of liabilities for life-contingent income annuities, and liabilities for the variable annuity guaranteed minimum benefits which are accounted for as insurance. Other future policyholder benefits are comprised mainly of liabilities for disabled lives under disability waiver of premium policy provisions, and active life policies. In addition, for our other products, future policyholder benefits related to the reinsurance of our former Japan joint venture are comprised of liabilities for the variable annuity guaranteed minimum benefits which are accounted for as insurance.
156
Brighthouse Financial
Future policy benefits for the life business are comprised mainly of liabilities for traditional life and for universal and variable life insurance contracts. In order to manage risk, we have often reinsured a portion of the mortality risk on life insurance policies. The reinsurance programs are routinely evaluated and this may result in increases or decreases to existing coverage. We have entered into various interest rate derivative positions to mitigate the risk that investment of premiums received and reinvestment of maturing assets over the life of the policy will be at rates below those assumed in the original pricing of these contracts. For the annuities business, future policy benefits are comprised mainly of liabilities for life-contingent income annuities, and liabilities for the variable annuity guaranteed minimum benefits accounted for as insurance. For our other products, future policyholder benefits are comprised mainly of group annuity contracts, primarily related to payout annuities, including pension risk transfers, structured settlement annuities and institutional income annuities. There is no interest rate crediting flexibility on these liabilities. As a result, a sustained low interest rate environment could negatively impact earnings; however, we mitigate our risks by applying various ALM strategies, including the use of various interest rate derivative positions.
Corporate & Other
Future policy benefits primarily include liabilities for the global employee benefits reinsurance business. Additionally, future policy benefits include liabilities for the U.S. direct business sold directly to consumers.
Policyholder Account Balances
Policyholder account balances are generally equal to the account value, which includes accrued interest credited, but excludes the impact of any applicable charge that may be incurred upon surrender. See “— Industry Trends — Impact of a Sustained Low Interest Rate Environment — Low Interest Rate Scenario” and “— Variable Annuity Guarantees.” See also Notes
1
and
4
of the Notes to the Consolidated Financial Statements for additional information. A discussion of policyholder account balances by segment (as well as Corporate & Other) follows.
U.S.
Policyholder account balances in this segment are comprised of funding agreements, retained asset accounts, universal life policies, the fixed account of variable life insurance policies and specialized life insurance products for benefit programs.
Group Benefits
Policyholder account balances in this business are held for retained asset accounts, universal life policies, the fixed account of variable life insurance policies and specialized life insurance products for benefit programs. Policyholder account balances are credited interest at a rate we determine, which is influenced by current market rates. A sustained low interest rate environment could negatively impact earnings as a result of the minimum credited rate guarantees present in most of these policyholder account balances. We have various interest rate derivative positions to partially mitigate the risks associated with such a scenario.
The table below presents the breakdown of account value subject to minimum guaranteed crediting rates for Group Benefits:
|
|
December 31, 2016
|
||||||
|
Guaranteed Minimum Crediting Rate
|
Account
Value (1)
|
Account
Value at
Guarantee (1)
|
|||||
|
|
(In millions)
|
||||||
|
Greater than 0% but less than 2%
|
$
|
4,992
|
|
$
|
4,866
|
|
|
|
Equal to 2% but less than 4%
|
$
|
1,881
|
|
$
|
1,881
|
|
|
|
Equal to or greater than 4%
|
$
|
712
|
|
$
|
685
|
|
|
__________________
|
(1)
|
These amounts are not adjusted for policy loans.
|
157
Retirement and Income Solutions
Policyholder account balances in this business are comprised of funding agreements. Interest crediting rates vary by type of contract, and can be fixed or variable. Variable interest crediting rates are generally tied to an external index, most commonly (1-month or 3-month) LIBOR. We are exposed to interest rate risks, as well as foreign currency exchange rate risk, when guaranteeing payment of interest and return of principal at the contractual maturity date. We may invest in floating rate assets or enter into receive-floating interest rate swaps, also tied to external indices, as well as caps, to mitigate the impact of changes in market interest rates. We also mitigate our risks by applying various ALM strategies and seek to hedge all foreign currency exchange rate risk through the use of foreign currency hedges, including cross currency swaps.
Asia
Policyholder account balances in this segment are held largely for fixed income retirement and savings plans, fixed deferred annuities, interest sensitive whole life products, universal life and, to a lesser degree, liability amounts for unit-linked-type funds that do not meet the GAAP definition of separate accounts. Also included are certain liabilities for retirement and savings products sold in certain countries in Asia that generally are sold with minimum credited rate guarantees. Liabilities for guarantees on certain variable annuities in Asia are accounted for as embedded derivatives and recorded at estimated fair value and are also included within policyholder account balances. These liabilities are generally impacted by sustained periods of low interest rates, where there are interest rate guarantees. We mitigate our risks by applying various ALM strategies and with reinsurance. Liabilities for unit-linked-type funds are impacted by changes in the fair value of the associated underlying investments, as the return on assets is generally passed directly to the policyholder.
The table below presents the breakdown of account value subject to minimum guaranteed crediting rates for Asia:
|
|
December 31, 2016
|
||||||
|
Guaranteed Minimum Crediting Rate (1)
|
Account
Value (2)
|
Account
Value at
Guarantee (2)
|
|||||
|
|
(In millions)
|
||||||
|
Annuities
|
|||||||
|
Greater than 0% but less than 2%
|
$
|
19,771
|
|
$
|
2,930
|
|
|
|
Equal to 2% but less than 4%
|
$
|
1,076
|
|
$
|
408
|
|
|
|
Equal to or greater than 4%
|
$
|
1
|
|
$
|
1
|
|
|
|
Life & Other
|
|||||||
|
Greater than 0% but less than 2%
|
$
|
7,772
|
|
$
|
7,454
|
|
|
|
Equal to 2% but less than 4%
|
$
|
19,700
|
|
$
|
8,568
|
|
|
|
Equal to or greater than 4%
|
$
|
273
|
|
$
|
273
|
|
|
__________________
|
(1)
|
Excludes negative VOBA liabilities of $935 million at December 31, 2016, primarily held in Japan. These liabilities were established in instances where the estimated fair value of contract obligations exceeded the book value of assumed insurance policy liabilities associated with the acquisition of ALICO. These negative liabilities were established primarily for decreased market interest rates subsequent to the issuance of the policy contracts.
|
|
(2)
|
These amounts are not adjusted for policy loans.
|
Latin America
Policyholder account balances in this segment are held largely for investment-type products and universal life products in Mexico and Chile, and deferred annuities in Brazil. Some of the deferred annuities in Brazil are unit-linked-type funds that do not meet the GAAP definition of separate accounts. The rest of the deferred annuities have minimum credited rate guarantees, and these liabilities and the universal life liabilities are generally impacted by sustained periods of low interest rates. Liabilities for unit-linked-type funds are impacted by changes in the fair value of the associated investments, as the return on assets is generally passed directly to the policyholder.
158
EMEA
Policyholder account balances in this segment are held mostly for universal life, deferred annuity, pension products, and unit-linked-type funds that do not meet the GAAP definition of separate accounts. They are also held for endowment products without significant mortality risk. Where there are interest rate guarantees, these liabilities are generally impacted by sustained periods of low interest rates. We mitigate our risks by applying various ALM strategies. Liabilities for unit-linked-type funds are impacted by changes in the fair value of the associated investments, as the return on assets is generally passed directly to the policyholder.
MetLife Holdings
Life policyholder account balances are held for retained asset accounts, universal life policies, the fixed account of variable life insurance policies, embedded derivatives related to the reinsurance of our former Japan joint venture, and funding agreements. For annuities, policyholder account balances are held for fixed deferred annuities, the fixed account portion of variable annuities, and non-life contingent income annuities. Interest is credited to the policyholder’s account at interest rates we determine which are influenced by current market rates, subject to specified minimums. A sustained low interest rate environment could negatively impact earnings as a result of the minimum credited rate guarantees present in most of these policyholder account balances. We have various interest rate derivative positions to partially mitigate the risks associated with such a scenario. Additionally, for our other products, policyholder account balances are held for variable annuity guaranteed minimum living benefits that are accounted for as embedded derivatives.
The table below presents the breakdown of account value subject to minimum guaranteed crediting rates for the MetLife Holdings segment:
|
|
December 31, 2016
|
||||||
|
Guaranteed Minimum Crediting Rate
|
Account
Value (1)
|
Account
Value at
Guarantee (1)
|
|||||
|
|
(In millions)
|
||||||
|
Greater than 0% but less than 2%
|
$
|
1,936
|
|
$
|
1,832
|
|
|
|
Equal to 2% but less than 4%
|
$
|
20,261
|
|
$
|
17,116
|
|
|
|
Equal to or greater than 4%
|
$
|
9,367
|
|
$
|
6,327
|
|
|
__________________
|
(1)
|
These amounts are not adjusted for policy loans.
|
Brighthouse Financial
Life policyholder account balances are held for universal life policies and the fixed account of variable life insurance policies. For annuities, policyholder account balances are held for fixed deferred annuities, the fixed account portion of variable annuities, and non-life contingent income annuities. For our other products, policyholder account balances are comprised of funding agreements. Interest is credited to the policyholder’s account at interest rates we determine which are influenced by current market rates, subject to specified minimums. Interest crediting rates vary by type of contract, and can be fixed or variable. Variable interest crediting rates are generally tied to an external index, most commonly (1-month or 3-month) LIBOR. We are exposed to interest rate risks, as well as foreign currency exchange rate risk, when guaranteeing payment of interest and return of principal at the contractual maturity date. We may invest in floating rate assets or enter into receive-floating interest rate swaps, also tied to external indices, as well as caps, to mitigate the impact of changes in market interest rates. We also mitigate our risks by applying various ALM strategies and seek to hedge all foreign currency exchange rate risk through the use of foreign currency hedges, including cross currency swaps. A sustained low interest rate environment could negatively impact earnings as a result of the minimum credited rate guarantees present in most of these policyholder account balances. We have various interest rate derivative positions to partially mitigate the risks associated with such a scenario. Additionally, for our other products policyholder account balances are held for variable annuity guaranteed minimum living benefits that are accounted for as embedded derivatives.
159
The table below presents the breakdown of account value subject to minimum guaranteed crediting rates for the Brighthouse Financial segment:
|
|
December 31, 2016
|
||||||
|
Guaranteed Minimum Crediting Rate
|
Account
Value (1)
|
Account
Value at
Guarantee (1)
|
|||||
|
|
(In millions)
|
||||||
|
Greater than 0% but less than 2%
|
$
|
1,725
|
|
$
|
1,042
|
|
|
|
Equal to 2% but less than 4%
|
$
|
22,844
|
|
$
|
15,255
|
|
|
|
Equal to or greater than 4%
|
$
|
3,239
|
|
$
|
2,341
|
|
|
__________________
|
(1)
|
These amounts are not adjusted for policy loans.
|
As a result of acquisitions, we establish additional liabilities known as excess interest reserves for policies with credited rates in excess of market rates as of the applicable acquisition dates. At December 31, 2016, excess interest reserves were $418 million for the Brighthouse Financial segment.
Variable Annuity Guarantees
We issue, directly and through assumed business, certain variable annuity products with guaranteed minimum benefits that provide the policyholder a minimum return based on their initial deposit (i.e., the benefit base) less withdrawals. In some cases, the benefit base may be increased by additional deposits, bonus amounts, accruals or optional market value resets. See Notes
1
and
4
of the Notes to the Consolidated Financial Statements for additional information.
Certain guarantees, including portions thereof, have insurance liabilities established that are included in future policy benefits. Guarantees accounted for in this manner include GMDBs, the life-contingent portion of certain GMWBs, and the non-life contingent portions of both GMWBs and GMIBs that require annuitization. These liabilities are accrued over the life of the contract in proportion to actual and future expected policy assessments based on the level of guaranteed minimum benefits generated using multiple scenarios of separate account returns. The scenarios are based on best estimate assumptions consistent with those used to amortize DAC. When current estimates of future benefits exceed those previously projected or when current estimates of future assessments are lower than those previously projected, liabilities will increase, resulting in a current period charge to net income. The opposite result occurs when the current estimates of future benefits are lower than those previously projected or when current estimates of future assessments exceed those previously projected. At each reporting period, we update the actual amount of business remaining in-force, which impacts expected future assessments and the projection of estimated future benefits resulting in a current period charge or increase to earnings.
Certain guarantees, including portions thereof, accounted for as embedded derivatives, are recorded at estimated fair value and included in policyholder account balances. Guarantees accounted for as embedded derivatives include GMABs, and the non-life contingent portions of both GMWBs and GMIBs that do not require annuitization. The estimated fair values of guarantees accounted for as embedded derivatives are determined based on the present value of projected future benefits minus the present value of projected future fees. The projections of future benefits and future fees require capital market and actuarial assumptions including expectations concerning policyholder behavior. A risk neutral valuation methodology is used to project the cash flows from the guarantees under multiple capital market scenarios to determine an economic liability. The reported estimated fair value is then determined by taking the present value of these risk-free generated cash flows using a discount rate that incorporates a spread over the risk-free rate to reflect our nonperformance risk and adding a risk margin. For more information on the determination of estimated fair value, see Note
10
of the Notes to the Consolidated Financial Statements.
160
The table below contains the carrying value for guarantees at:
|
|
|||||||||||||||
|
|
Future Policy
Benefits
|
Policyholder
Account Balances
|
|||||||||||||
|
|
December 31,
|
December 31,
|
|||||||||||||
|
|
2016
|
2015
|
2016
|
2015
|
|||||||||||
|
|
(In millions)
|
||||||||||||||
|
Asia
|
|
|
|||||||||||||
|
GMDB
|
$
|
29
|
|
$
|
25
|
|
$
|
—
|
|
$
|
—
|
|
|||
|
GMAB
|
—
|
|
—
|
|
36
|
|
37
|
|
|||||||
|
GMWB
|
98
|
|
89
|
|
189
|
|
151
|
|
|||||||
|
EMEA
|
|||||||||||||||
|
GMDB
|
1
|
|
2
|
|
—
|
|
—
|
|
|||||||
|
GMAB
|
—
|
|
—
|
|
17
|
|
16
|
|
|||||||
|
GMWB
|
30
|
|
8
|
|
(50
|
)
|
(63
|
)
|
|||||||
|
MetLife Holdings
|
|||||||||||||||
|
GMDB
|
257
|
|
209
|
|
—
|
|
—
|
|
|||||||
|
GMIB
|
471
|
|
406
|
|
93
|
|
(354
|
)
|
|||||||
|
GMAB
|
—
|
|
—
|
|
13
|
|
13
|
|
|||||||
|
GMWB
|
161
|
|
127
|
|
1,268
|
|
1,009
|
|
|||||||
|
Brighthouse Financial
|
|||||||||||||||
|
GMDB
|
987
|
|
741
|
|
—
|
|
—
|
|
|||||||
|
GMIB
|
2,335
|
|
2,004
|
|
2,024
|
|
(153
|
)
|
|||||||
|
GMAB
|
—
|
|
—
|
|
1
|
|
9
|
|
|||||||
|
GMWB
|
138
|
|
104
|
|
334
|
|
280
|
|
|||||||
|
Total
|
$
|
4,507
|
|
$
|
3,715
|
|
$
|
3,925
|
|
$
|
945
|
|
|||
The carrying amounts for guarantees included in policyholder account balances above include nonperformance risk adjustments of $982 million and $462 million at December 31,
2016
and
2015
, respectively. These nonperformance risk adjustments represent the impact of including a credit spread when discounting the underlying risk neutral cash flows to determine the estimated fair values. The nonperformance risk adjustment does not have an economic impact on us as it cannot be monetized given the nature of these policyholder liabilities. The change in valuation arising from the nonperformance risk adjustment is not hedged.
The carrying values of these guarantees can change significantly during periods of sizable and sustained shifts in equity market performance, equity volatility, interest rates or foreign currency exchange rates. Carrying values are also impacted by our assumptions around mortality, separate account returns and policyholder behavior, including lapse rates.
As discussed below, we use a combination of product design, hedging strategies, reinsurance, and other risk management actions to mitigate the risks related to these benefits. Within each type of guarantee, there is a range of product offerings reflecting the changing nature of these products over time. Changes in product features and terms are in part driven by customer demand but, more importantly, reflect our risk management practices of continuously evaluating the guaranteed benefits and their associated asset-liability matching. Recently, we have been diversifying the concentration of income benefits in the portfolio of the Company’s annuities business by focusing on withdrawal benefits, variable annuities without living benefits and index-linked annuities. To this end, the GMIBs were no longer available for new purchases after February 19, 2016.
The sections below provide further detail by total account value for certain of our most popular guarantees. Total account values include amounts not reported on the consolidated balance sheets from assumed business, contractholder-directed investments which do not qualify for presentation as separate account assets, and amounts included in our general account. The total account values and the net amounts at risk include direct and assumed business, but exclude offsets from hedging or ceded reinsurance, if any.
161
GMDBs
We offer a range of GMDBs to our contractholders. The table below presents GMDBs, by benefit type, at December 31,
2016
:
|
Total Account Value (1)
|
|||||||||||
|
Asia & EMEA
|
MetLife Holdings
|
Brighthouse Financial
|
|||||||||
|
|
(In millions)
|
||||||||||
|
Return of premium or five to seven year step-up
|
$
|
8,243
|
|
$
|
54,165
|
|
$
|
55,559
|
|
||
|
Annual step-up
|
—
|
|
3,667
|
|
23,523
|
|
|||||
|
Roll-up and step-up combination
|
—
|
|
6,412
|
|
29,549
|
|
|||||
|
Total
|
$
|
8,243
|
|
$
|
64,244
|
|
$
|
108,631
|
|
||
__________________
|
(1)
|
Total account value excludes $2.2 billion for contracts with no GMDBs. Further, many of our annuity contracts offer more than one type of guarantee such that GMDB amounts listed above are not mutually exclusive to the amounts in the living benefit guarantees table below.
|
Based on total account value, less than 39% of our GMDBs included enhanced death benefits such as the annual step-up or roll-up and step-up combination products. We expect the above GMDB risk profile to be relatively consistent for the foreseeable future.
Living Benefit Guarantees
The table below presents our living benefit guarantees based on total account values at December 31,
2016
:
|
|
Total Account Value (1)
|
||||||||||
|
Asia & EMEA
|
MetLife Holdings
|
Brighthouse Financial
|
|||||||||
|
|
(In millions)
|
||||||||||
|
GMIB
|
$
|
—
|
|
$
|
24,310
|
|
$
|
64,505
|
|
||
|
GMWB - non-life contingent (2)
|
2,361
|
|
3,621
|
|
3,373
|
|
|||||
|
GMWB - life-contingent
|
3,784
|
|
11,177
|
|
19,212
|
|
|||||
|
GMAB
|
1,212
|
|
814
|
|
697
|
|
|||||
|
$
|
7,357
|
|
$
|
39,922
|
|
$
|
87,787
|
|
|||
__________________
|
(1)
|
Total account value excludes $47.4 billion for contracts with no living benefit guarantees. Further, many of our annuity contracts offer more than one type of guarantee such that living benefit guarantee amounts listed above are not mutually exclusive of the amounts in the GMDBs table above.
|
|
(2)
|
The Asia and EMEA segments include the non-life contingent portion of the GMWB total account value of $1,024 million with a guarantee at annuitization.
|
In terms of total account value, GMIBs are our most significant living benefit guarantee. Our primary risk management strategy for our GMIB products is our derivatives hedging program as discussed below. Additionally, we have engaged in certain reinsurance agreements covering some of our GMIB business. As part of our overall risk management approach for living benefit guarantees, we continually monitor the reinsurance markets for the right opportunity to purchase additional coverage for our GMIB business.
162
The table below presents our GMIB associated total account values, by their guaranteed payout basis, at December 31,
2016
:
|
|
Total
Account Value
|
||
|
|
(In millions)
|
||
|
7-year setback, 2.5% interest rate
|
$
|
31,876
|
|
|
7-year setback, 1.5% interest rate
|
5,352
|
|
|
|
10-year setback, 1.5% interest rate
|
17,762
|
|
|
|
10-year mortality projection, 10-year setback, 1.0% interest rate
|
29,672
|
|
|
|
10-year mortality projection, 10-year setback, 0.5% interest rate
|
4,153
|
|
|
|
$
|
88,815
|
|
|
The annuitization interest rates on GMIBs have been decreased from 2.5% to 0.5% over time, partially in response to the low interest rate environment, accompanied by an increase in the setback period from seven years to 10 years and the introduction of a 10-year mortality projection.
Additionally, 33% of the $88.8 billion of GMIB total account value has been invested in managed volatility funds as of December 31,
2016
. These funds seek to manage volatility by adjusting the fund holdings within certain guidelines based on capital market movements. Such activity reduces the overall risk of the underlying funds while maintaining their growth opportunities. These risk mitigation techniques translate to a reduction or elimination of the need for us to manage the funds’ volatility through hedging or reinsurance.
Our GMIB products typically have a waiting period of 10 years to be eligible for annuitization. As of December 31,
2016
, only 18% of our contracts with GMIBs were eligible for annuitization. The remaining contracts are not eligible for annuitization for an average of six years.
Once eligible for annuitization, contractholders would only be expected to annuitize if their contracts were in-the-money. We calculate in-the-moneyness with respect to GMIBs consistent with net amount at risk as discussed in
Note 4
of the Notes to the Consolidated Financial Statements, by comparing the contractholders’ income benefits based on total account values and current annuity rates versus the guaranteed income benefits. The net amount at risk was $3,834 million at December 31,
2016
, of which $3,641 million was related to GMIB guarantees. For those contracts with GMIB, the table below presents details of contracts that are in-the-money and out-of-the money at December 31,
2016
:
|
In-the-Moneyness
|
Total
Account Value
|
% of Total
|
||||||
|
|
|
(In millions)
|
|
|||||
|
In-the-money
|
30% +
|
$
|
3,652
|
|
4
|
%
|
||
|
20% to 30%
|
2,629
|
|
3
|
%
|
||||
|
10% to 20%
|
4,410
|
|
5
|
%
|
||||
|
0% to 10%
|
7,418
|
|
8
|
%
|
||||
|
18,109
|
|
|||||||
|
Out-of-the-money
|
-10% to 0%
|
13,868
|
|
16
|
%
|
|||
|
-20% to 10%
|
7,833
|
|
9
|
%
|
||||
|
-20% +
|
49,005
|
|
55
|
%
|
||||
|
70,706
|
|
|||||||
|
Total GMIBs
|
$
|
88,815
|
|
|||||
163
Derivatives Hedging Variable Annuity Guarantees
Our risk mitigating hedging strategy uses various OTC and exchange traded derivatives. The table below presents the gross notional amount, estimated fair value and primary underlying risk exposure of the derivatives hedging our variable annuity guarantees:
|
|
|
December 31,
|
||||||||||||||||||||||||
|
|
|
2016
|
2015
|
|||||||||||||||||||||||
|
Primary Underlying Risk Exposure
|
|
Gross Notional
|
Estimated Fair Value
|
Gross Notional
|
Estimated Fair Value
|
|||||||||||||||||||||
|
Instrument Type
|
Amount
|
Assets
|
Liabilities
|
Amount
|
Assets
|
Liabilities
|
||||||||||||||||||||
|
|
|
(In millions)
|
||||||||||||||||||||||||
|
Interest rate
|
Interest rate swaps
|
$
|
36,266
|
|
$
|
2,770
|
|
$
|
1,711
|
|
$
|
23,430
|
|
$
|
2,056
|
|
$
|
966
|
|
|||||||
|
Interest rate futures
|
3,959
|
|
11
|
|
11
|
|
3,915
|
|
4
|
|
5
|
|
||||||||||||||
|
Interest rate options
|
18,943
|
|
585
|
|
1
|
|
24,923
|
|
994
|
|
7
|
|
||||||||||||||
|
Foreign currency exchange rate
|
Foreign currency forwards
|
3,086
|
|
10
|
|
222
|
|
2,305
|
|
29
|
|
7
|
|
|||||||||||||
|
Currency futures
|
85
|
|
—
|
|
—
|
|
135
|
|
—
|
|
—
|
|
||||||||||||||
|
Equity market
|
Equity futures
|
12,320
|
|
67
|
|
3
|
|
7,104
|
|
61
|
|
18
|
|
|||||||||||||
|
Equity index options
|
51,190
|
|
1,298
|
|
1,458
|
|
54,113
|
|
1,541
|
|
1,041
|
|
||||||||||||||
|
Equity variance swaps
|
23,157
|
|
223
|
|
756
|
|
23,437
|
|
195
|
|
636
|
|
||||||||||||||
|
Equity total return swaps
|
3,901
|
|
2
|
|
160
|
|
3,803
|
|
47
|
|
58
|
|
||||||||||||||
|
Total
|
$
|
152,907
|
|
$
|
4,966
|
|
$
|
4,322
|
|
$
|
143,165
|
|
$
|
4,927
|
|
$
|
2,738
|
|
||||||||
The change in estimated fair values of our derivatives is recorded in policyholder benefits and claims if such derivatives are hedging guarantees included in future policy benefits, and in net derivative gains (losses) if such derivatives are hedging guarantees included in policyholder account balances.
Our hedging strategy involves the significant use of static longer-term derivative instruments to avoid the need to execute transactions during periods of market disruption or higher volatility. We continually monitor the capital markets for opportunities to adjust our liability coverage, as appropriate. Futures are also used to dynamically adjust the daily coverage levels as markets and liability exposures fluctuate.
We remain liable for the guaranteed benefits in the event that reinsurers or derivative counterparties are unable or unwilling to pay. Certain of our reinsurance agreements and most derivative positions are collateralized and derivatives positions are subject to master netting agreements, both of which significantly reduce the exposure to counterparty risk. In addition, we are subject to the risk that hedging and other risk management actions prove ineffective or that unanticipated policyholder behavior or mortality, combined with adverse market events, produces economic losses beyond the scope of the risk management techniques employed.
Liquidity and Capital Resources
Overview
Our business and results of operations are materially affected by conditions in the global capital markets and the economy generally. Stressed conditions, volatility and disruptions in global capital markets, particular markets, or financial asset classes can have an adverse effect on us, in part because we have a large investment portfolio and our insurance liabilities and derivatives are sensitive to changing market factors. The global markets and economy continue to experience volatility that may affect our financing costs and market interest for our debt or equity securities. For further information regarding market factors that could affect our ability to meet liquidity and capital needs, see “— Industry Trends” and “— Investments — Current Environment.”
Liquidity Management
Based upon the strength of our franchise, diversification of our businesses, strong financial fundamentals and the substantial funding sources available to us as described herein, we continue to believe we have access to ample liquidity to meet business requirements under current market conditions and reasonably possible stress scenarios. We continuously monitor and adjust our liquidity and capital plans for MetLife, Inc. and its subsidiaries in light of market conditions, as well as changing needs and opportunities.
164
Short-term Liquidity
We maintain a substantial short-term liquidity position, which was $14.2 billion and $11.1 billion at December 31,
2016
and
2015
, respectively. Short-term liquidity includes cash and cash equivalents and short-term investments, excluding assets that are pledged or otherwise committed, including amounts received in connection with securities lending, repurchase agreements, derivatives, and secured borrowings, as well as amounts held in the closed block.
Liquid Assets
An integral part of our liquidity management includes managing our level of liquid assets, which was $230.7 billion and $229.4 billion at December 31,
2016
and
2015
, respectively. Liquid assets include cash and cash equivalents, short-term investments and publicly-traded securities, excluding assets that are pledged or otherwise committed. Assets pledged or otherwise committed include amounts received in connection with securities lending, repurchase agreements, derivatives, regulatory deposits and custodial accounts, collateral financing arrangements, funding agreements and secured borrowings, as well as amounts held in the closed block.
Capital Management
We have established several senior management committees as part of our capital management process. These committees, including the Capital Management Committee and the Enterprise Risk Committee (“ERC”), regularly review actual and projected capital levels (under a variety of scenarios including stress scenarios) and our annual capital plan in accordance with our capital policy. The Capital Management Committee is comprised of members of senior management, including MetLife, Inc.’s Chief Financial Officer (“CFO”), Treasurer and Chief Risk Officer (“CRO”). The ERC is also comprised of members of senior management, including MetLife, Inc.’s CFO, CRO and Chief Investment Officer.
Our Board of Directors and senior management are directly involved in the development and maintenance of our capital policy. The capital policy sets forth, among other things, minimum and target capital levels and the governance of the capital management process. All capital actions, including proposed changes to the annual capital plan, capital targets or capital policy, are reviewed by the Finance and Risk Committee of the Board prior to obtaining full Board approval. The Board approves the capital policy and the annual capital plan and authorizes capital actions, as required.
See “Risk Factors — Capital-Related Risks — Legal and Regulatory Restrictions and Uncertainty and Restrictions Under the Terms of Certain of Our Securities May Prevent Us from Repurchasing Our Stock and Paying Dividends at the Level We Wish” and Note
16
of the Notes to the Consolidated Financial Statements for information regarding restrictions on payment of dividends and stock repurchases. See also “— The Company — Liquidity and Capital Uses — Common Stock Repurchases” for information regarding MetLife, Inc.’s common stock repurchase authorizations.
The Company
Liquidity
Liquidity refers to the ability to generate adequate amounts of cash to meet our needs. We determine our liquidity needs based on a rolling 12-month forecast by portfolio of invested assets which we monitor daily. We adjust the asset mix and asset maturities based on this rolling 12-month forecast. To support this forecast, we conduct cash flow and stress testing, which include various scenarios of the potential risk of early contractholder and policyholder withdrawal. We include provisions limiting withdrawal rights on many of our products, including general account pension products sold to employee benefit plan sponsors. Certain of these provisions prevent the customer from making withdrawals prior to the maturity date of the product. In the event of significant cash requirements beyond anticipated liquidity needs, we have various alternatives available depending on market conditions and the amount and timing of the liquidity need. These available alternatives include cash flows from operations, sales of liquid assets, global funding sources including commercial paper and various credit and committed facilities.
Under certain stressful market and economic conditions, our access to liquidity may deteriorate, or the cost to access liquidity may increase. If we require significant amounts of cash on short notice in excess of anticipated cash requirements or if we are required to post or return cash collateral in connection with derivatives or our securities lending program, we may have difficulty selling investments in a timely manner, be forced to sell them for less than we otherwise would have been able to realize, or both. In addition, in the event of such forced sale, for securities in an unrealized loss position, realized losses would be incurred on securities sold and impairments would be incurred, if there is a need to sell securities prior to recovery, which may negatively impact our financial condition. See “Risk Factors — Investment-Related Risks — Should the Need Arise, We May Have Difficulty Selling Certain Holdings in Our Investment Portfolio or in Our Securities Lending Program in a Timely Manner and Realizing Full Value Given Their Illiquid Nature.”
165
In extreme circumstances, all general account assets within a particular legal entity — other than those which may have been pledged to a specific purpose — are available to fund obligations of the general account of that legal entity.
Capital
We manage our capital position to maintain our financial strength and credit ratings. Our capital position is supported by our ability to generate strong cash flows within our operating companies and borrow funds at competitive rates, as well as by our demonstrated ability to raise additional capital to meet operating and growth needs despite adverse market and economic conditions.
Rating Agencies
Rating agencies assign insurer financial strength ratings to MetLife, Inc.’s domestic life insurance subsidiaries and credit ratings to MetLife, Inc. and certain of its subsidiaries. Financial strength ratings represent the opinion of rating agencies regarding the ability of an insurance company to pay obligations under insurance policies and contracts in accordance with their terms. Credit ratings indicate the rating agency’s opinion regarding a debt issuer’s ability to meet the terms of debt obligations in a timely manner. They are important factors in our overall funding profile and ability to access certain types of liquidity. The level and composition of regulatory capital at the subsidiary level and our equity capital are among the many factors considered in determining our insurer financial strength ratings and credit ratings. Each agency has its own capital adequacy evaluation methodology, and assessments are generally based on a combination of factors. In addition to heightening the level of scrutiny that they apply to insurance companies, rating agencies have increased and may continue to increase the frequency and scope of their credit reviews, may request additional information from the companies that they rate and may adjust upward the capital and other requirements employed in the rating agency models for maintenance of certain ratings levels. See “Business — Company Ratings” for further information on our insurer financial strength ratings.
Downgrades in our insurer financial strength ratings could have a material adverse effect on our financial condition and results of operations in many ways. See “Risk Factors — Risk Related to Business — A Downgrade or a Potential Downgrade in Our Financial Strength or Credit Ratings Could Result in a Loss of Business and Materially Adversely Affect Our Financial Condition and Results of Operations.”
A downgrade in the credit ratings or insurer financial strength ratings of MetLife, Inc. or its subsidiaries would likely impact us in the following ways, including:
|
•
|
impact our ability to generate cash flows from the sale of funding agreements and other capital market products offered by our Retirement and Income Solutions business;
|
|
•
|
impact the cost and availability of financing for MetLife, Inc. and its subsidiaries; and
|
|
•
|
result in additional collateral requirements or other required payments under certain agreements, which are eligible to be satisfied in cash or by posting investments held by the subsidiaries subject to the agreements. See “— Liquidity and Capital Uses — Pledged Collateral.”
|
Statutory Capital and Dividends
Our U.S. insurance subsidiaries have statutory surplus well above levels to meet current regulatory requirements.
RBC requirements are used as minimum capital requirements by the NAIC and the state insurance departments to identify companies that merit regulatory action. RBC is based on a formula calculated by applying factors to various asset, premium, claim, expense and statutory reserve items. The formula takes into account the risk characteristics of the insurer, including asset risk, insurance risk, interest rate risk, market risk and business risk and is calculated on an annual basis. The formula is used as an early warning regulatory tool to identify possible inadequately capitalized insurers for purposes of initiating regulatory action, and not as a means to rank insurers generally. These rules apply to most of our U.S. insurance subsidiaries. State insurance laws provide insurance regulators the authority to require various actions by, or take various actions against, insurers whose total adjusted capital does not meet or exceed certain RBC levels. At the date of the most recent annual statutory financial statements filed with insurance regulators, the total adjusted capital of each of these subsidiaries subject to these requirements was in excess of each of those RBC levels.
As a Delaware corporation, American Life is subject to Delaware law; however, because it does not conduct insurance business in Delaware or any other domestic state, it is exempt from RBC requirements under Delaware law. American Life’s operations are also regulated by applicable authorities of the countries in which it operates and is subject to capital and solvency requirements in those countries.
166
The amount of dividends that our insurance subsidiaries can pay to MetLife, Inc. or to other parent entities is constrained by the amount of surplus we hold to maintain our ratings and provides an additional margin for risk protection and investment in our businesses. We proactively take actions to maintain capital consistent with these ratings objectives, which may include adjusting dividend amounts and deploying financial resources from internal or external sources of capital. Certain of these activities may require regulatory approval. Furthermore, the payment of dividends and other distributions to MetLife, Inc. and other parent entities by their respective insurance subsidiaries is governed by insurance laws and regulations. See “Business — Regulation — U.S. Regulation — Insurance Regulation,” “Business — Regulation — International Regulation,” “— MetLife, Inc. — Liquidity and Capital Sources — Dividends from Subsidiaries” and Note
16
of the Notes to the Consolidated Financial Statements.
Affiliated Captive Reinsurance Transactions
Various subsidiaries of MetLife, Inc. cede specific policy classes, including term and universal life insurance, participating whole life insurance, long-term disability insurance, group life insurance and other business to various wholly-owned captive reinsurers. The reinsurance activities among these affiliated companies are eliminated within our consolidated results of operations. The statutory reserves of such affiliated captive reinsurers are supported by a combination of funds withheld assets, investment assets and letters of credit issued by unaffiliated financial institutions. MetLife, Inc. has committed to maintain the surplus of several of the domestic affiliated captive reinsurers, as well as provided guarantees of the reinsurers’ and other affiliated international insurance entities’ repayment obligations on the letters of credit. MetLife, Inc. has also provided guarantees of these reinsurers’ repayment obligations on derivative and certain reinsurance agreements entered into by these reinsurers. See “— MetLife, Inc. — Liquidity and Capital Uses — Support Agreements” for further details on certain of these guarantees. Various subsidiaries of MetLife, Inc. enter into reinsurance agreements with affiliated captive reinsurers for risk and capital management purposes, as well as to manage statutory reserve requirements related to universal life and term life insurance policies and other business.
The NAIC continues to review insurance companies’ use of affiliated captive reinsurers and off-shore entities. The NYDFS continues to have a moratorium on new reserve financing transactions involving captive insurers. We are not aware of any states other than New York and California implementing such a moratorium. While such a moratorium would not impact our existing reinsurance agreements with captive reinsurers, a moratorium placed on the use of captives for new reserve financing transactions could impact our ability to write certain products and/or impact our RBC ratios and ability to deploy excess capital in the future. This could result in our need to increase prices, modify product features or limit the availability of those products to our customers. While this affects insurers across the industry, it could adversely impact our competitive position and our results of operations in the future. We continue to evaluate product modifications, pricing structure and alternative means of managing risks, capital and statutory reserves and we expect the discontinued use of captive reinsurance on new reserve financing transactions would not have a material impact on our future consolidated financial results.
Our U.S. variable annuity guaranteed minimum benefit risk and certain other risks were previously ceded to an affiliated captive reinsurer. In November 2014, this captive reinsurer merged with and into MetLife USA, further reducing the Company’s exposure to and use of captive reinsurers. See “Risk Factors — Regulatory and Legal Risks — Our Insurance and Brokerage Businesses Are Highly Regulated, and Changes in Regulation and in Supervisory and Enforcement Policies May Reduce Our Profitability and Limit Our Growth — U.S. Regulation — Insurance Regulation” and Note
6
of the Notes to the Consolidated Financial Statements for further information on our reinsurance activities.
167
Summary of the Company’s Primary Sources and Uses of Liquidity and Capital
Our primary sources and uses of liquidity and capital are summarized as follows:
|
Years Ended December 31,
|
|||||||||||
|
2016
|
2015
|
2014
|
|||||||||
|
(In millions)
|
|||||||||||
|
Sources:
|
|||||||||||
|
Operating activities, net
|
$
|
14,827
|
|
$
|
14,129
|
|
$
|
16,376
|
|
||
|
Changes in policyholder account balances, net
|
4,925
|
|
—
|
|
1,483
|
|
|||||
|
Changes in payables for collateral under securities loaned and other transactions, net
|
—
|
|
1,544
|
|
5,031
|
|
|||||
|
Short-term debt issuances, net
|
38
|
|
—
|
|
—
|
|
|||||
|
Long-term debt issued
|
—
|
|
3,893
|
|
1,000
|
|
|||||
|
Financing element on certain derivative instruments
|
—
|
|
181
|
|
—
|
|
|||||
|
Common stock issued, net of issuance costs
|
—
|
|
—
|
|
1,000
|
|
|||||
|
Preferred stock issued, net of issuance costs
|
—
|
|
1,483
|
|
—
|
|
|||||
|
Other, net
|
48
|
|
17
|
|
47
|
|
|||||
|
Total sources
|
19,838
|
|
21,247
|
|
24,937
|
|
|||||
|
Uses:
|
|||||||||||
|
Investing activities, net
|
5,850
|
|
10,398
|
|
15,055
|
|
|||||
|
Changes in policyholder account balances, net
|
—
|
|
1,717
|
|
—
|
|
|||||
|
Changes in payables for collateral under securities loaned and other transactions, net
|
3,636
|
|
—
|
|
—
|
|
|||||
|
Short-term debt repayments, net
|
—
|
|
—
|
|
75
|
|
|||||
|
Long-term debt repaid
|
1,279
|
|
1,438
|
|
2,862
|
|
|||||
|
Collateral financing arrangements repaid
|
68
|
|
57
|
|
—
|
|
|||||
|
Financing element on certain derivative instruments
|
1,367
|
|
—
|
|
747
|
|
|||||
|
Treasury stock acquired in connection with share repurchases
|
372
|
|
1,930
|
|
1,000
|
|
|||||
|
Repurchase of preferred stock
|
—
|
|
1,460
|
|
—
|
|
|||||
|
Preferred stock repurchase premium
|
—
|
|
42
|
|
—
|
|
|||||
|
Dividends on preferred stock
|
103
|
|
116
|
|
122
|
|
|||||
|
Dividends on common stock
|
1,736
|
|
1,653
|
|
1,499
|
|
|||||
|
Effect of change in foreign currency exchange rates on cash and cash equivalents
|
302
|
|
492
|
|
354
|
|
|||||
|
Total uses
|
14,713
|
|
19,303
|
|
21,714
|
|
|||||
|
Net increase (decrease) in cash and cash equivalents
|
$
|
5,125
|
|
$
|
1,944
|
|
$
|
3,223
|
|
||
Cash Flows from Operations
The principal cash inflows from our insurance activities come from insurance premiums, net investment income, annuity considerations and deposit funds. The principal cash outflows are the result of various life insurance, property & casualty, annuity and pension products, operating expenses and income tax, as well as interest expense. A primary liquidity concern with respect to these cash flows is the risk of early contractholder and policyholder withdrawal.
Cash Flows from Investments
The principal cash inflows from our investment activities come from repayments of principal, proceeds from maturities and sales of investments and settlements of freestanding derivatives. The principal cash outflows relate to purchases of investments, issuances of policy loans and settlements of freestanding derivatives. Additional cash outflows relate to purchases of businesses. We typically have a net cash outflow from investing activities because cash inflows from insurance operations are reinvested in accordance with our ALM discipline to fund insurance liabilities. We closely monitor and manage these risks through our comprehensive investment risk management process. The primary liquidity concerns with respect to these cash flows are the risk of default by debtors and market disruption.
168
Cash Flows from Financing
The principal cash inflows from our financing activities come from issuances of debt and other securities, deposits of funds associated with policyholder account balances and lending of securities. The principal cash outflows come from repayments of debt, payments of dividends on and repurchases of MetLife, Inc.’s securities, withdrawals associated with policyholder account balances and the return of securities on loan. The primary liquidity concerns with respect to these cash flows are market disruption and the risk of early contractholder and policyholder withdrawal.
Liquidity and Capital Sources
In addition to the general description of liquidity and capital sources in “— Summary of the Company’s Primary Sources and Uses of Liquidity and Capital,” the following additional information is provided regarding our primary sources of liquidity and capital:
Global Funding Sources
Liquidity is provided by a variety of global funding sources, including funding agreements, credit facilities and commercial paper. Capital is provided by a variety of global funding sources, including short-term and long-term debt, collateral financing arrangements, junior subordinated debt securities, preferred securities, equity securities and equity-linked securities. The diversity of our global funding sources enhances our funding flexibility, limits dependence on any one market or source of funds and generally lowers the cost of funds. Our primary global funding sources include:
Preferred Stock
In June 2015, MetLife, Inc. issued 1,500,000 shares of Series C preferred stock, with a $0.01 par value per share and a liquidation preference of $1,000 per share, for aggregate proceeds of $1.5 billion. See Note
16
of the Notes to the Consolidated Financial Statements
.
Common Stock
In October 2014, MetLife, Inc. issued 22,907,960 new shares of its common stock for $1.0 billion in connection with the remarketing of senior debt securities and settlement of stock purchase contracts. See “— Remarketing of Senior Debt Securities and Settlement of Stock Purchase Contracts.”
Commercial Paper, Reported in Short-term Debt
MetLife, Inc. and MetLife Funding each have a commercial paper program that is supported by our general corporate credit facility (see “— Credit and Committed Facilities”). MetLife Funding raises cash from its commercial paper program and uses the proceeds to extend loans through MetLife Credit Corp., another subsidiary of MLIC, to affiliates in order to enhance the financial flexibility and liquidity of these companies.
Federal Home Loan Bank Funding Agreements, Reported in Policyholder Account Balances
Certain of our domestic insurance subsidiaries are members of a regional FHLB. During the years ended December 31,
2016
,
2015
and
2014
, we issued $21.7 billion, $21.6 billion and $13.9 billion, respectively, and repaid $21.2 billion, $21.1 billion and $14.0 billion, respectively, under funding agreements with certain regional FHLBs. At December 31,
2016
and
2015
, total obligations outstanding under these funding agreements were $16.0 billion and $15.5 billion, respectively. See Note
4
of the Notes to the Consolidated Financial Statements.
Special Purpose Entity Funding Agreements, Reported in Policyholder Account Balances
We issue fixed and floating rate funding agreements which are denominated in either U.S. dollars or foreign currencies, to certain SPEs that have issued either debt securities or commercial paper for which payment of interest and principal is secured by such funding agreements. During the years ended December 31,
2016
,
2015
and
2014
, we issued $41.1 billion, $48.1 billion and $48.9 billion, respectively, and repaid $42.0 billion, $49.9 billion and $45.6 billion, respectively, under such funding agreements. At December 31,
2016
and
2015
, total obligations outstanding under these funding agreements were $30.9 billion and $31.6 billion, respectively. See Note
4
of the Notes to the Consolidated Financial Statements.
169
Federal Agricultural Mortgage Corporation Funding Agreements, Reported in Policyholder Account Balances
We have issued funding agreements to a subsidiary of Farmer Mac, as well as to certain SPEs that have issued debt securities for which payment of interest and principal is secured by such funding agreements, and such debt securities are also guaranteed as to payment of interest and principal by Farmer Mac. The obligations under all such funding agreements are secured by a pledge of certain eligible agricultural mortgage loans. During the years ended December 31,
2016
,
2015
and
2014
, we issued $1.2 billion, $50 million and $200 million, respectively, and repaid $1.2 billion, $250 million and $200 million, respectively, under such funding agreements. At both December 31,
2016
and
2015
, total obligations outstanding under these funding agreements were $2.6 billion. See Note
4
of the Notes to the Consolidated Financial Statements.
Senior Notes Issuances and Other Borrowings
Senior Notes
In November 2015, March 2015, and April 2014, MetLife, Inc. issued $1.3 billion, $1.5 billion and $1.0 billion of senior notes, respectively. Net proceeds from these issuances were used for general corporate purposes, which included the early redemption or repayment upon maturity of certain senior notes.
Other Borrowings
In December 2015, MetLife Private Equity Holdings, LLC, a wholly-owned indirect investment subsidi
ary of MLIC, borrowed $350 million under term loans that mature in December 2020.
See Note
12
of the Notes to the Consolidated Financial Statements.
Remarketing of Senior Debt Securities and Settlement of Stock Purchase Contracts
In October 2014, MetLife, Inc. closed the successful remarketing of $1.0 billion of senior debt securities underlying common equity units issued in November 2010 in connection with the acquisition of ALICO. MetLife, Inc. did not receive any proceeds from the remarketing. Most common equity unit holders used the remarketing proceeds to settle their payment obligations under the applicable stock purchase contracts. The subsequent settlement of the stock purchase contracts provided proceeds to MetLife, Inc. of $1.0 billion in October 2014 in exchange for newly issued shares of MetLife, Inc.’s common stock, as described in “— Common Stock” above. See Note
15
of the Notes to the Consolidated Financial Statements.
Credit and Committed Facilities
At
December 31, 2016
, we maintained a $4.0 billion unsecured revolving credit facility and certain committed facilities aggregating $11.5 billion. When drawn upon, these facilities bear interest at varying rates in accordance with the respective agreements.
The unsecured revolving credit facility is used for general corporate purposes, to support the borrowers’ commercial paper programs and for the issuance of letters of credit. At
December 31, 2016
, we had outstanding $730 million in letters of credit and no drawdowns against this facility. Remaining availability was $3.3 billion at
December 31, 2016
.
The committed facilities are used for collateral for certain of our affiliated reinsurance liabilities. At December 31,
2016
, $6.0 billion in letters of credit and $2.8 billion in aggregate drawdowns under collateral financing arrangements were outstanding. Remaining availability was $2.6 billion at December 31,
2016
.
In December 2016, MetLife, Inc. and MetLife Funding entered into an agreement to amend their existing $4.0 billion unsecured revolving credit facility, which provides, among other things, that the facility will be amended and restated upon the completion of the proposed Separation and the satisfaction of certain other conditions. As amended and restated, the unsecured revolving credit facility will provide for borrowings and the issuance of letters of credit in an aggregate amount of up to $3.0 billion. All borrowings under this amended revolving credit facility must be repaid by December 20, 2021, except that letters of credit outstanding upon termination may remain outstanding until December 20, 2022.
170
In December 2016, Brighthouse Financial, Inc. entered into a $3.0 billion three-year senior unsecured delayed draw term loan agreement with a bank syndicate. Borrowings under the term loan agreement may be used for general corporate purposes, including payment of a portion of the dividends to be paid by Brighthouse Financial, Inc. to MetLife, Inc. in connection with the Separation. The term loan agreement provides that borrowings may be made during the period prior to the Separation. There were no outstanding borrowings as of December 31, 2016. In December 2016, Brighthouse Financial, Inc. also entered into a $2.0 billion five-year senior unsecured revolving credit facility with a bank syndicate. Borrowings and letters of credit under the revolving credit agreement may be used for general corporate purposes, including payment of a portion of the dividends to be paid by Brighthouse Financial, Inc. to MetLife, Inc. in connection with the Separation (the three-year and the five-year Brighthouse credit facilities, collectively, the “Brighthouse Credit Facilities”). The Brighthouse Credit Facilities contain certain administrative, reporting, legal and financial covenants, including requirements by Brighthouse Financial, Inc. to maintain a specified minimum consolidated net worth and to maintain a maximum ratio of indebtedness to total capitalization, and limitations on the dollar amount of indebtedness that may be incurred by Brighthouse Financial, Inc., which could restrict Brighthouse Financial, Inc. operations and use of funds.
See Note
12
of the Notes to the Consolidated Financial Statements for further information about these facilities, including the circumstances under which Brighthouse may draw upon such facilities in connection with and after the Separation.
We have no reason to believe that our lending counterparties will be unable to fulfill their respective contractual obligations under these facilities. As commitments associated with letters of credit and financing arrangements may expire unused, these amounts do not necessarily reflect our actual future cash funding requirements.
Outstanding Debt Under Global Funding Sources
The following table summarizes our outstanding debt at:
|
|
December 31,
|
||||||
|
|
2016
|
2015 (1)
|
|||||
|
|
(In millions)
|
||||||
|
Short-term debt
|
$
|
242
|
|
$
|
100
|
|
|
|
Long-term debt (2), (3)
|
$
|
16,467
|
|
$
|
17,889
|
|
|
|
Collateral financing arrangements (4)
|
$
|
4,071
|
|
$
|
4,139
|
|
|
|
Junior subordinated debt securities (4)
|
$
|
3,169
|
|
$
|
3,168
|
|
|
|
(1)
|
Net of $100 million of unamortized issuance costs, which were reported in other assets at December 31, 2015.
|
|
(2)
|
Excludes
$35 million
and
$60 million
at December 31,
2016
and
2015
, respectively, of long-term debt relating to CSEs — FVO (see Note
10
of the Notes to the Consolidated Financial Statements). For more information regarding long-term debt, see Note
12
of the Notes to the Consolidated Financial Statements.
|
|
(3)
|
Includes $402 million and $403 million of non-recourse debt at
December 31, 2016
and
2015
, respectively, for which creditors have no access, subject to customary exceptions, to the general assets of the Company other than recourse to certain investment subsidiaries.
|
|
(4)
|
For information regarding collateral financing arrangements and junior subordinated debt securities, see Notes
13
and
14
of the Notes to the Consolidated Financial Statements, respectively.
|
Debt and Facility Covenants
Certain of our debt instruments and committed facilities, as well as our unsecured credit facility, contain various administrative, reporting, legal and financial covenants. We believe we were in compliance with all applicable covenants at
December 31, 2016
.
Dispositions
Cash proceeds from dispositions during the years ended December 31,
2016
,
2015
and
2014
were $291 million, $0, and $759 million, respectively. See Note
3
of the Notes to the Consolidated Financial Statements.
171
Liquidity and Capital Uses
In addition to the general description of liquidity and capital uses in “— Summary of the Company’s Primary Sources and Uses of Liquidity and Capital” and “— Contractual Obligations,” the following additional information is provided regarding our primary uses of liquidity and capital:
Preferred Stock Repurchase
In June 2015, MetLife, Inc. repurchased and canceled all of its Series B preferred stock for $1.5 billion in a series of related transactions as described in
Note 16
of the Notes to the Consolidated Financial Statements.
Common Stock Repurchases
As described in
Note 16
of the Notes to the Consolidated Financial Statements, the Board of Directors has authorized the repurchase of MetLife, Inc. common stock. Pursuant to such repurchase authorizations, during the years ended
December 31, 2016
,
2015
, and
2014
, MetLife, Inc. repurchased
6,948,739
shares,
39,491,991
shares and
18,876,363
shares of common stock in the open market for
$372 million
,
$1.9 billion
and
$1.0 billion
, respectively.
At
December 31, 2016
, MetLife, Inc. had
$2.7 billion
remaining under the November 2016 common stock repurchase authorization. Under these authorizations, MetLife, Inc. may purchase its common stock from the MetLife Policyholder Trust, in the open market (including pursuant to the terms of a pre-set trading plan meeting the requirements of Rule 10b5-1 under the Exchange Act) and in privately negotiated transactions. In 2017, through
February 23, 2017
, MetLife, Inc. repurchased
8,718,054
shares of its common stock in the open market for
$468 million
.
Common stock repurchases are dependent upon several factors, including our capital position, liquidity, financial strength and credit ratings, general market conditions, the market price of MetLife, Inc.’s common stock compared to management’s assessment of the stock’s underlying value and applicable regulatory approvals, as well as other legal and accounting factors. See “Business — Regulation — U.S. Regulation — Potential Regulation as a Non-Bank SIFI,” “Business — Regulation — International Regulation — Global Systemically Important Insurers,” “Risk Factors — Capital-Related Risks — Legal and Regulatory Restrictions and Uncertainty and Restrictions Under the Terms of Certain of Our Securities May Prevent Us from Repurchasing Our Stock and Paying Dividends at the Level We Wish.” and
Note 16
of the Notes to the Consolidated Financial Statements.
Dividends
During the years ended December 31,
2016
,
2015
and
2014
, MetLife, Inc. paid dividends on its common stock of
$1.7 billion
,
$1.7 billion
and
$1.5 billion
, respectively. During the years ended December 31,
2016
,
2015
and
2014
, MetLife, Inc. paid dividends on its preferred stock of
$103 million
,
$116 million
, and
$122 million
, respectively. See Note
16
of the Notes to the Consolidated Financial Statements for information regarding the calculation and timing of these dividend payments.
The declaration and payment of common stock dividends is subject to the discretion of our Board of Directors, and will depend on MetLife, Inc.’s financial condition, results of operations, cash requirements, future prospects, regulatory restrictions on the payment of dividends by MetLife, Inc.’s insurance subsidiaries and other factors deemed relevant by the Board. See
Note 23
of the Notes to the Consolidated Financial Statements for information regarding a common stock dividend declared subsequent to
December 31, 2016
.
Preferre
d stock dividends are paid quarterly in accordance with the terms of MetLife, Inc.’s Floating Rate Non-Cumulative Preferred Stock, Series A. MetLife, Inc. paid dividends on its Series B preferred stock through the
June 15, 2015 payment date. D
ividends are paid semi-annually on MetLife, Inc.’s Series C preferred stock commencing December 15, 2015 and ending on June 15, 2020, and thereafter will be paid quarterly.
The payment of dividends and other distributions by MetLife, Inc. to its security holders may be subject to regulation by the Federal Reserve as a result of MetLife, Inc.’s designation as a non-bank SIFI. See “Business — Regulation — U.S. Regulation — Potential Regulation as a Non-Bank SIFI.” In addition, if additional capital requirements are imposed on MetLife, Inc. as a G-SII, its ability to pay dividends could be reduced by any such additional capital requirements that might be imposed. See “Business — Regulation — International Regulation — Global Systemically Important Insurers.” The payment of dividends is also subject to restrictions under the terms of our preferred stock and junior subordinated debentures in situations where we may be experiencing financial stress. See “Risk Factors — Capital-Related Risks — Legal and Regulatory Restrictions and Uncertainty and Restrictions Under the Terms of Certain of Our Securities May Prevent Us from Repurchasing Our Stock and Paying Dividends at the Level We Wish” and Note
16
of the Notes to the Consolidated Financial Statements.
172
Debt Repayments
See Notes
12
and
13
of the Notes to the Consolidated Financial Statements for further information on long-term and short-term debt and collateral financing arrangements, respectively, including:
|
•
|
In June 2016, MetLife, Inc. repaid at maturity its $1.3 billion 6.750% senior notes;
|
|
•
|
During 2016, following regulatory approval, MetLife Reinsurance Company of Charleston (“MRC”), a wholly-owned subsidiary of MetLife, Inc., repurchased and canceled $68 million in aggregate principal amount of its surplus notes, which were reported in collateral financing arrangements on the consolidated balance sheet;
|
|
•
|
In June 2015, MetLife, Inc. repaid at maturity its $1.0 billion 5.0% senior notes;
|
|
•
|
During 2015, following regulatory approval, MRC, repurchased and canceled $57 million in aggregate principal amount of its surplus notes; and
|
|
•
|
In June and February 2014, MetLife, Inc. repaid at maturity its $350 million and $1.0 billion senior notes, respectively; and
|
|
•
|
In May 2014, MetLife, Inc. redeemed $200 million aggregate principal amount of its 5.875% senior notes due in November 2033 at par.
|
Debt Repurchases
We may from time to time seek to retire or purchase our outstanding debt through cash purchases and/or exchanges for other securities, in open market purchases, privately negotiated transactions or otherwise. Any such repurchases or exchanges will be dependent upon several factors, including our liquidity requirements, contractual restrictions, general market conditions, and applicable regulatory, legal and accounting factors. Whether or not to repurchase any debt and the size and timing of any such repurchases will be determined at our discretion.
Support Agreements
MetLife, Inc. and several of its subsidiaries (each, an “Obligor”) are parties to various capital support commitments and guarantees with subsidiaries. Under these arrangements, each Obligor, with respect to the applicable entity, has agreed to cause such entity to meet specified capital and surplus levels or has guaranteed certain contractual obligations. We anticipate that in the event that these arrangements place demands upon us, there will be sufficient liquidity and capital to enable us to meet anticipated demands. See “— MetLife, Inc. — Liquidity and Capital Uses — Support Agreements.”
Insurance Liabilities
Liabilities arising from our insurance activities primarily relate to benefit payments under various life insurance, property & casualty, annuity and group pension products, as well as payments for policy surrenders, withdrawals and loans. For annuity or deposit type products, surrender or lapse behavior differs somewhat by segment. In the MetLife Holdings and Brighthouse Financial segments, which include individual annuities, lapses and surrenders tend to occur in the normal course of business. During the years ended December 31,
2016
and
2015
, general account surrenders and withdrawals from annuity products were $3.4 billion and $3.8 billion, respectively. In the Retirement and Income Solutions business within the U.S. segment, which includes pension risk transfers, bank-owned life insurance and other fixed annuity contracts, as well as funding agreements and other capital market products, most of the products offered have fixed maturities or fairly predictable surrenders or withdrawals. With regard to the Retirement and Income Solutions business products that provide customers with limited rights to accelerate payments, as of December 31,
2016
, there were no funding agreements or other capital market products that could be put back to the Company.
173
Pledged Collateral
We pledge collateral to, and have collateral pledged to us by, counterparties in connection with our derivatives. At December 31,
2016
and
2015
, we had received pledged cash collateral of $
6.5 billion
and
$6.6 billion
, respectively. At December 31,
2016
and
2015
, we had pledged cash collateral of
$1.6 billion
and
$241 million
, respectively. With respect to OTC-bilateral derivatives in a net liability position that have credit contingent provisions, a one-notch downgrade in the Company’s credit or financial strength rating, as applicable, would have required
$6 million
of additional collateral be provided to our counterparties as of December 31,
2016
. See Note
9
of the Notes to the Consolidated Financial Statements for additional information about collateral pledged to us, collateral we pledge and derivatives subject to credit contingent provisions.
We pledge collateral and have had collateral pledged to us, and may be required from time to time to pledge additional collateral or be entitled to have additional collateral pledged to us, in connection with collateral financing arrangements related to the reinsurance of closed block and ULSG liabilities. See Note
13
of the Notes to the Consolidated Financial Statements.
We pledge collateral from time to time in connection with funding agreements. See Note
4
of the Notes to the Consolidated Financial Statements.
Securities Lending
We participate in a securities lending program whereby securities are loaned to third parties, primarily brokerage firms and commercial banks. We obtain collateral, usually cash, from the borrower, which must be returned to the borrower when the loaned securities are returned to us. Under our securities lending program, we were liable for cash collateral under our control of
$26.8 billion
and
$30.2 billion
at December 31,
2016
and
2015
, respectively. Of these amounts,
$6.6 billion
and
$10.1 billion
at December 31,
2016
and
2015
, respectively, were on open, meaning that the related loaned security could be returned to us on the next business day requiring the immediate return of cash collateral we hold. The estimated fair value of the securities on loan related to the cash collateral on open at December 31,
2016
was
$6.5 billion
, over
99%
of which were U.S. government and agency securities which, if put to us, could be immediately sold to satisfy the cash requirements to immediately return the cash collateral. See Note
8
of the Notes to the Consolidated Financial Statements.
Litigation
Putative or certified class action litigation and other litigation, and claims and assessments against us, in addition to those discussed elsewhere herein and those otherwise provided for on the consolidated financial statements, have arisen in the course of our business, including, but not limited to, in connection with our activities as an insurer, employer, investor, investment advisor, taxpayer and, formerly, a mortgage lending bank. Further, state insurance regulatory authorities and other federal and state authorities regularly make inquiries and conduct investigations concerning our compliance with applicable insurance and other laws and regulations. See Note
21
of the Notes to the Consolidated Financial Statements.
We establish liabilities for litigation and regulatory loss contingencies when it is probable that a loss has been incurred and the amount of the loss can be reasonably estimated. For material matters where a loss is believed to be reasonably possible but not probable, no accrual is made but we disclose the nature of the contingency and an aggregate estimate of the reasonably possible range of loss in excess of amounts accrued, when such an estimate can be made. It is not possible to predict or determine the ultimate outcome of all pending investigations and legal proceedings. In some of the matters referred to herein, very large and/or indeterminate amounts, including punitive and treble damages, are sought. Although in light of these considerations, it is possible that an adverse outcome in certain cases could have a material adverse effect upon our financial position, based on information currently known by us, in our opinion, the outcome of such pending investigations and legal proceedings are not likely to have such an effect. However, given the large and/or indeterminate amounts sought in certain of these matters and the inherent unpredictability of litigation, it is possible that an adverse outcome in certain matters could, from time to time, have a material adverse effect on our consolidated net income or cash flows in particular quarterly or annual periods.
Acquisitions
Cash outflows for acquisitions and investments in strategic partnerships during the years ended December 31,
2016
,
2015
and
2014
were $0, $0 and $277 million, respectively.
174
Contractual Obligations
The following table summarizes our major contractual obligations at December 31,
2016
:
|
Total
|
One Year
or Less
|
More than
One Year to
Three Years
|
More than
Three Years
to Five Years
|
More than Five Years
|
|||||||||||||||
|
|
(In millions)
|
||||||||||||||||||
|
Insurance liabilities
|
$
|
392,034
|
|
$
|
24,356
|
|
$
|
21,729
|
|
$
|
21,259
|
|
$
|
324,690
|
|
||||
|
Policyholder account balances
|
300,987
|
|
28,954
|
|
34,347
|
|
21,464
|
|
216,222
|
|
|||||||||
|
Payables for collateral under securities loaned and other transactions
|
33,264
|
|
33,264
|
|
—
|
|
—
|
|
—
|
|
|||||||||
|
Debt
|
41,472
|
|
2,468
|
|
4,275
|
|
3,811
|
|
30,918
|
|
|||||||||
|
Investment commitments
|
12,495
|
|
12,209
|
|
185
|
|
99
|
|
2
|
|
|||||||||
|
Operating leases
|
2,160
|
|
289
|
|
475
|
|
400
|
|
996
|
|
|||||||||
|
Other
|
23,805
|
|
23,319
|
|
22
|
|
—
|
|
464
|
|
|||||||||
|
Total
|
$
|
806,217
|
|
$
|
124,859
|
|
$
|
61,033
|
|
$
|
47,033
|
|
$
|
573,292
|
|
||||
Insurance Liabilities
Insurance liabilities include future policy benefits, other policy-related balances, policyholder dividends payable and the policyholder dividend obligation, which are all reported on the consolidated balance sheet and are more fully described in Notes
1
and
4
of the Notes to the Consolidated Financial Statements. The amounts presented reflect future estimated cash payments and (i) are based on mortality, morbidity, lapse and other assumptions comparable with our experience and expectations of future payment patterns; and (ii) consider future premium receipts on current policies in-force. All estimated cash payments presented are undiscounted as to interest, net of estimated future premiums on in-force policies and gross of any reinsurance recoverable. Payment of amounts related to policyholder dividends left on deposit are projected based on assumptions of policyholder withdrawal activity. Because the exact timing and amount of the ultimate policyholder dividend obligation is subject to significant uncertainty and the amount of the policyholder dividend obligation is based upon a long-term projection of the performance of the closed block, we have reflected the obligation at the amount of the liability, if any, presented on the consolidated balance sheet in the more than five years category. Additionally, the more than five years category includes estimated payments due for periods extending for more than 100 years.
The sum of the estimated cash flows of $392.0 billion exceeds the liability amounts of $216.7 billion included on the consolidated balance sheet principally due to (i) the time value of money, which accounts for a substantial portion of the difference; and (ii) differences in assumptions, most significantly mortality, between the date the liabilities were initially established and the current date; and (iii) liabilities related to accounting conventions, or which are not contractually due, which are excluded.
Actual cash payments may differ significantly from the liabilities as presented on the consolidated balance sheets and the estimated cash payments as presented due to differences between actual experience and the assumptions used in the establishment of these liabilities and the estimation of these cash payments.
For the majority of our insurance operations, estimated contractual obligations for future policy benefits and policyholder account balances, as presented, are derived from the annual asset adequacy analysis used to develop actuarial opinions of statutory reserve adequacy for state regulatory purposes. These cash flows are materially representative of the cash flows under GAAP. See “— Policyholder Account Balances.”
Policyholder Account Balances
See Notes
1
and
4
of the Notes to the Consolidated Financial Statements for a description of the components of policyholder account balances. See “— Insurance Liabilities” regarding the source and uncertainties associated with the estimation of the contractual obligations related to future policy benefits and policyholder account balances.
Amounts presented represent the estimated cash payments undiscounted as to interest and including assumptions related to the receipt of future premiums and deposits; withdrawals, including unscheduled or partial withdrawals; policy lapses; surrender charges; annuitization; mortality; future interest credited; policy loans and other contingent events as appropriate for the respective product type. Such estimated cash payments are also presented net of estimated future premiums on policies currently in-force and gross of any reinsurance recoverable. For obligations denominated in foreign currencies, cash payments have been estimated using current spot foreign currency rates.
175
The sum of the estimated cash flows of $301.0 billion exceeds the liability amount of $210.2 billion included on the consolidated balance sheets principally due to (i) the time value of money, which accounts for a substantial portion of the difference; (ii) differences in assumptions, between the date the liabilities were initially established and the current date; and (iii) liabilities related to accounting conventions, or which are not contractually due, which are excluded.
Payables for Collateral Under Securities Loaned and Other Transactions
We have accepted cash collateral in connection with securities lending and derivatives. As the securities lending transactions expire within the next year and the timing of the return of the derivatives collateral is uncertain, the return of the collateral has been included in the one year or less category in the table. We also held non-cash collateral, which is not reflected as a liability on the consolidated balance sheet of $2.3 billion at December 31,
2016
.
Debt
Amounts presented for debt include short-term debt, long-term debt, collateral financing arrangements and junior subordinated debt securities, the total of which differs from the total of the corresponding amounts presented on the consolidated balance sheet as the amounts presented herein (i) do not include premiums or discounts upon issuance or purchase accounting fair value adjustments; (ii) include future interest on such obligations for the period from January 1,
2017
through maturity; and (iii) do not include $35 million at December 31,
2016
of long-term debt relating to CSEs — FVO as such debt does not represent our contractual obligation. Future interest on variable rate debt was computed using prevailing rates at December 31,
2016
and, as such, does not consider the impact of future rate movements. Future interest on fixed rate debt was computed using the stated rate on the obligations for the period from January 1,
2017
through maturity, except with respect to junior subordinated debt which was computed using the stated rates through the scheduled redemption dates as it is our expectation that such obligations will be redeemed as scheduled. Inclusion of interest payments on junior subordinated debt securities through the final maturity dates would increase the contractual obligation by $7.7 billion. Pursuant to collateral financing arrangements, MetLife, Inc. may be required to deliver cash or pledge collateral to the respective unaffiliated financial institutions. See Note
13
of the Notes to the Consolidated Financial Statements.
Investment Commitments
To enhance the return on our investment portfolio, we commit to lend funds under mortgage loans, bank credit facilities, bridge loans and private corporate bond investments and we commit to fund partnership investments. In the table, the timing of the funding of mortgage loans and private corporate bond investments is based on the expiration dates of the corresponding commitments. As it relates to commitments to fund partnerships and bank credit facilities, we anticipate that these amounts could be invested any time over the next five years; however, as the timing of the fulfillment of the obligation cannot be predicted, such obligations are generally presented in the one year or less category. Commitments to fund bridge loans are short-term obligations and, as a result, are presented in the one year or less category. See Note
21
of the Notes to the Consolidated Financial Statements and “— Off-Balance Sheet Arrangements.”
Operating Leases
As a lessee, we have various operating leases, primarily for office space. Contractual provisions exist that could increase or accelerate those lease obligations presented, including various leases with early buyouts and/or escalation clauses. However, the impact of any such transactions would not be material to our financial position or results of operations. See Note
21
of the Notes to the Consolidated Financial Statements.
Other
Other obligations presented are principally comprised of amounts due under reinsurance agreements, payables related to securities purchased but not yet settled, securities sold short, accrued interest on debt obligations, estimated fair value of derivative obligations, deferred compensation arrangements, guaranty liabilities, and accruals and accounts payable due under contractual obligations, which are all reported in other liabilities on the consolidated balance sheets. If the timing of any of these other obligations is sufficiently uncertain, the amounts are included within the one year or less category. Items reported in other liabilities on the consolidated balance sheets that were excluded from the table represent accounting conventions or are not liabilities due under contractual obligations. Unrecognized tax benefits and related accrued interest totaling $1.8 billion was excluded as the timing of payment cannot be reliably determined.
Separate account liabilities are excluded as they are fully funded by cash flows from the corresponding separate account assets and are set equal to the estimated fair value of separate account assets.
We also enter into agreements to purchase goods and services in the normal course of business; however, such amounts are excluded as these purchase obligations were not material to our consolidated results of operations or financial position at December 31,
2016
.
176
Additionally, we have agreements in place for services we conduct, generally at cost, between subsidiaries relating to insurance, reinsurance, loans and capitalization. Intercompany transactions have been eliminated in consolidation. Intercompany transactions among insurance subsidiaries and affiliates have been approved by the appropriate insurance regulators as required.
MetLife, Inc.
Liquidity and Capital Management
Liquidity and capital are managed to preserve stable, reliable and cost-effective sources of cash to meet all current and future financial obligations and are provided by a variety of sources, including a portfolio of liquid assets, a diversified mix of short- and long-term funding sources from the wholesale financial markets and the ability to borrow through credit and committed facilities. Liquidity is monitored through the use of internal liquidity risk metrics, including the composition and level of the liquid asset portfolio, timing differences in short-term cash flow obligations, access to the financial markets for capital and debt transactions and exposure to contingent draws on MetLife, Inc.’s liquidity. MetLife, Inc. is an active participant in the global financial markets through which it obtains a significant amount of funding. These markets, which serve as cost-effective sources of funds, are critical components of MetLife, Inc.’s liquidity and capital management. Decisions to access these markets are based upon relative costs, prospective views of balance sheet growth and a targeted liquidity profile and capital structure. A disruption in the financial markets could limit MetLife, Inc.’s access to liquidity.
MetLife, Inc.’s ability to maintain regular access to competitively priced wholesale funds is fostered by its current credit ratings from the major credit rating agencies. We view our capital ratios, credit quality, stable and diverse earnings streams, diversity of liquidity sources and our liquidity monitoring procedures as critical to retaining such credit ratings. See “— The Company — Capital — Rating Agencies.”
See “— Executive Summary — Consolidated Company Outlook” for a discussion of expected impacts to liquidity and capital resources in connection with the Separation including incremental sources of liquidity and capital from subsidiary dividends that we expect to receive from Brighthouse (expected to be partially funded from the issuance of debt by Brighthouse) and a MetLife-affiliated reinsurance subsidiary, and proceeds over time from the disposition of our retained shares of Brighthouse common stock, as well as incremental uses of liquidity and capital from foregone subsidiary dividends and foregone incremental debt issuances and ongoing uses of liquidity and capital from the repayment of debt maturities.
Liquidity
For a summary of MetLife, Inc.’s liquidity, see “— The Company — Liquidity.”
Capital
For a summary of MetLife, Inc.’s capital, see “— The Company — Capital.” For further information regarding potential capital restrictions and limitations on MetLife, Inc. as a non-bank SIFI and G-SII, see “Business — Regulation — U.S. Regulation — Potential Regulation as a Non-Bank SIFI” and “Business — Regulation — International Regulation — Global Systemically Important Insurers.” See also “— The Company — Liquidity and Capital Uses — Common Stock Repurchases” and “— The Company — Liquidity and Capital Uses — Preferred Stock Repurchase” for information regarding MetLife, Inc.’s common and preferred stock repurchases, respectively.
Liquid Assets
At December 31,
2016
and
2015
, MetLife, Inc. and other MetLife holding companies had $5.8 billion and $6.4 billion, respectively, in liquid assets. Of these amounts, $3.7 billion and $5.3 billion were held by MetLife, Inc. and $2.1 billion and $1.1 billion were held by other MetLife holding companies at December 31,
2016
and
2015
, respectively. Liquid assets include cash and cash equivalents, short-term investments and publicly-traded securities excluding, assets that are pledged or otherwise committed. Assets pledged or otherwise committed include amounts received in connection with derivatives and collateral financing arrangements.
Liquid assets held in non-U.S. holding companies are generated in part through dividends from non-U.S. insurance operations. Such dividends are subject to local insurance regulatory requirements, as discussed in “— Liquidity and Capital Sources — Dividends from Subsidiaries.” The cumulative earnings of certain active non-U.S. operations have been reinvested indefinitely in such non-U.S. operations, as described in Note
19
of the Notes to the Consolidated Financial Statements. Under current tax laws, should we repatriate such earnings, we may be subject to additional U.S. income taxes and foreign withholding taxes.
177
MetLife, Inc. and Other MetLife Holding Companies Sources and Uses of Liquid Assets and Sources and Uses of Liquid Assets included in Free Cash Flow
MetLife, Inc.’s sources and uses of liquid assets, as well as sources and uses of liquid assets included in free cash flow are summarized as follows.
|
Year Ended December 31, 2016
|
Year Ended December 31, 2015
|
Year Ended December 31, 2014
|
||||||||||||||||||||||
|
Sources and Uses of Liquid Assets
|
Sources and Uses of Liquid Assets Included in Free Cash Flow
|
Sources and Uses of Liquid Assets
|
Sources and Uses of Liquid Assets Included in Free Cash Flow
|
Sources and Uses of Liquid Assets
|
Sources and Uses of Liquid Assets Included in Free Cash Flow
|
|||||||||||||||||||
|
(In millions)
|
||||||||||||||||||||||||
|
MetLife, Inc. (Parent Company Only)
|
||||||||||||||||||||||||
|
Sources:
|
||||||||||||||||||||||||
|
Dividends and returns of capital from subsidiaries (1)
|
$
|
4,550
|
|
$
|
4,550
|
|
$
|
2,340
|
|
$
|
2,340
|
|
$
|
2,388
|
|
$
|
2,388
|
|
||||||
|
Long-term debt issued (2)
|
—
|
|
—
|
|
2,739
|
|
1,750
|
|
1,000
|
|
445
|
|
||||||||||||
|
Common stock issued, net of issuance costs
|
—
|
|
—
|
|
—
|
|
—
|
|
1,000
|
|
—
|
|
||||||||||||
|
Repayments on and (issuances of) loans to subsidiaries and related interest, net (3)
|
—
|
|
—
|
|
383
|
|
383
|
|
597
|
|
597
|
|
||||||||||||
|
Other, net (4)
|
120
|
|
(210
|
)
|
755
|
|
795
|
|
1,333
|
|
1,333
|
|
||||||||||||
|
Total sources
|
4,670
|
|
4,340
|
|
6,217
|
|
5,268
|
|
6,318
|
|
4,763
|
|
||||||||||||
|
Uses:
|
||||||||||||||||||||||||
|
Capital contributions to subsidiaries (5)
|
1,733
|
|
1,733
|
|
667
|
|
667
|
|
1,262
|
|
1,011
|
|
||||||||||||
|
Long-term debt repaid - unaffiliated
|
1,250
|
|
—
|
|
1,000
|
|
—
|
|
1,550
|
|
—
|
|
||||||||||||
|
Interest paid on debt and financing arrangements - unaffiliated
|
983
|
|
983
|
|
965
|
|
965
|
|
968
|
|
968
|
|
||||||||||||
|
Dividends on common stock
|
1,736
|
|
—
|
|
1,653
|
|
—
|
|
1,499
|
|
—
|
|
||||||||||||
|
Treasury stock acquired in connection with share repurchases
|
372
|
|
—
|
|
1,930
|
|
—
|
|
1,000
|
|
—
|
|
||||||||||||
|
Dividends on preferred stock
|
103
|
|
103
|
|
116
|
|
116
|
|
122
|
|
122
|
|
||||||||||||
|
Issuances of and (repayments on) loans to subsidiaries and related interest, net (3) (5)
|
99
|
|
99
|
|
—
|
|
—
|
|
—
|
|
—
|
|
||||||||||||
|
Total uses
|
6,276
|
|
2,918
|
|
6,331
|
|
1,748
|
|
6,401
|
|
2,101
|
|
||||||||||||
|
Net increase (decrease) in liquid assets, MetLife, Inc. (Parent Company Only)
|
(1,606
|
)
|
(114
|
)
|
(83
|
)
|
||||||||||||||||||
|
Liquid assets, beginning of year
|
5,289
|
|
5,403
|
|
5,486
|
|
||||||||||||||||||
|
Liquid assets, end of year
|
$
|
3,683
|
|
$
|
5,289
|
|
$
|
5,403
|
|
|||||||||||||||
|
Free Cash Flow, MetLife, Inc. (Parent Company Only)
|
1,422
|
|
3,520
|
|
2,662
|
|
||||||||||||||||||
|
Net cash provided by operating activities, MetLife, Inc. (Parent Company Only)
|
$
|
3,747
|
|
$
|
1,606
|
|
$
|
2,615
|
|
|||||||||||||||
|
Other MetLife Holding Companies
|
||||||||||||||||||||||||
|
Sources:
|
||||||||||||||||||||||||
|
Dividends and returns of capital from subsidiaries
|
$
|
1,485
|
|
$
|
1,485
|
|
$
|
1,354
|
|
$
|
1,354
|
|
$
|
1,339
|
|
$
|
1,339
|
|
||||||
|
Capital contributions from MetLife, Inc.
|
—
|
|
—
|
|
150
|
|
150
|
|
—
|
|
—
|
|
||||||||||||
|
Total sources
|
1,485
|
|
1,485
|
|
1,504
|
|
1,504
|
|
1,339
|
|
1,339
|
|
||||||||||||
|
Uses:
|
||||||||||||||||||||||||
|
Capital contributions to subsidiaries
|
53
|
|
53
|
|
27
|
|
27
|
|
48
|
|
48
|
|
||||||||||||
|
Repayments on and (issuance of) loans to subsidiaries and affiliates and related interest, net
|
307
|
|
307
|
|
510
|
|
510
|
|
458
|
|
458
|
|
||||||||||||
|
Other, net
|
123
|
|
123
|
|
506
|
|
506
|
|
605
|
|
605
|
|
||||||||||||
|
Total uses
|
483
|
|
483
|
|
1,043
|
|
1,043
|
|
1,111
|
|
1,111
|
|
||||||||||||
|
Net increase (decrease) in liquid assets, Other MetLife Holding Companies
|
1,002
|
|
|
|
461
|
|
228
|
|
||||||||||||||||
|
Liquid assets, beginning of year
|
1,142
|
|
|
|
681
|
|
453
|
|
||||||||||||||||
|
Liquid assets, end of year
|
$
|
2,144
|
|
$
|
1,142
|
|
$
|
681
|
|
|||||||||||||||
|
Free Cash Flow, Other MetLife Holding Companies
|
1,002
|
|
461
|
|
228
|
|
||||||||||||||||||
|
Net increase (decrease) in liquid assets, All Holding Companies
|
$
|
(604
|
)
|
$
|
347
|
|
$
|
145
|
|
|||||||||||||||
|
Free Cash Flow, All Holding Companies (6) (7)
|
$
|
2,424
|
|
$
|
3,981
|
|
$
|
2,890
|
|
|||||||||||||||
__________________
178
|
(1)
|
All dividends and returns of capital to MetLife, Inc. were from operating subsidiaries and none were from other MetLife holding companies during the years ended December 31,
2016
,
2015
and
2014
.
|
|
(2)
|
Included in free cash flow is the portion of long-term debt issued that represents incremental debt to be at or below target leverage ratios.
|
|
(3)
|
See MetLife, Inc. (Parent Company Only) Condensed Statements of Cash Flows included in Schedule II of the Financial Statement Schedules for the source of liquid assets from receipts on loans to subsidiaries (excluding interest) and for the use of liquid assets for the issuances of loans to subsidiaries (excluding interest).
|
|
(4)
|
Other, net includes $433 million, $171 million and $862 million of net receipts by MetLife, Inc. to and from subsidiaries under a tax sharing agreement and tax payments to tax agencies during the years ended December 31,
2016
,
2015
and
2014
, respectively.
|
|
(5)
|
Amounts to fund business acquisitions were $0, $0 and $251 million (included in capital contributions to subsidiaries) during the years ended December 31,
2016
,
2015
and
2014
, respectively.
|
|
(6)
|
In 2016, we incurred $2,256 million of Separation-related items which reduced liquid assets and free cash flow. Excluding these Separation-related items, adjusted free cash flow would be $4,680 million for the year ended December 31, 2016. See “
—
Sources and Uses of Liquid Assets from Separation-related Transactions.”
|
|
(7)
|
See
“— Non-GAAP and Other Financial Disclosures” for the reconciliation of net cash provided by operating activities of MetLife, Inc. to free cash flow of all holding companies.
|
The primary sources of MetLife, Inc.’s liquid assets are dividends and returns of capital from subsidiaries, long-term debt issued, common stock issued, and net receipts from subsidiaries under a tax sharing agreement. MetLife, Inc.’s insurance subsidiaries are subject to regulatory restrictions on the payment of dividends imposed by the regulators of their respective domiciles. See “— Liquidity and Capital Sources — Dividends from Subsidiaries.”
The primary uses of MetLife, Inc.’s liquid assets are principal and interest payments on long-term debt, dividends on or repurchases of common and preferred stock, capital contributions to subsidiaries, funding of business acquisitions, income taxes and operating expenses. MetLife, Inc. is party to various capital support commitments and guarantees with certain of its subsidiaries. See “— Liquidity and Capital Uses — Support Agreements.”
In addition, MetLife, Inc. issues loans to subsidiaries or subsidiaries issue loans to MetLife, Inc. Accordingly, changes in MetLife, Inc. liquid assets include issuances of loans to subsidiaries, proceeds of loans from subsidiaries and the related repayment of principal and payment of interest on such loans. See “— Liquidity and Capital Sources — Senior Notes Issuances and Other Borrowings — Maturities and Issuances of Affiliated Long-term Debt” and “— Liquidity and Capital Uses — Affiliated Capital and Debt Transactions.”
Sources and Uses of Liquid Assets of Other MetLife Holding Companies
The primary sources of liquid assets of other MetLife holding companies are dividends, returns of capital and remittances from their subsidiaries and branches, principally non-U.S. insurance companies; capital contributions received; receipts of principal and interest on loans to subsidiaries and affiliates and borrowings from subsidiaries and affiliates. MetLife, Inc.’s non-U.S. operations are subject to regulatory restrictions on the payment of dividends imposed by local regulators. See “— Liquidity and Capital Sources — Dividends from Subsidiaries.”
The primary uses of liquid assets of other MetLife holding companies are capital contributions paid to their subsidiaries and branches, principally non-U.S. insurance companies; loans to subsidiaries and affiliates; principal and interest paid on loans from subsidiaries and affiliates; and the following items, which are reported within other, net: dividends and returns of capital; business acquisitions; and operating expenses. There were no uses of liquid assets of other MetLife holding companies to fund business acquisitions during the years ended December 31,
2016
,
2015
, and
2014
.
179
Sources and Uses of Liquid Assets from Separation-related Transactions
We have engaged and expect to continue to engage in a number of Separation-related transactions that will impact our holding companies’ liquid assets. In 2016, we incurred
$2.3 billion
of Separation-related items which reduced our holding companies’ liquid assets, as well as our free cash flow. These Separation-related items consisted of Separation-related outflows comprised of an incremental capital contribution to MetLife USA, capital contributions to Brighthouse subsidiaries and Separation-related costs, forgone subsidiary dividends from MetLife USA and forgone incremental debt at MetLife, Inc., net of Separation-related inflows comprised of incremental subsidiary dividends from NELICO and MetLife USA. However, we have increased and expect to continue to increase our holding companies’ liquid assets over time as a result of (i) $291 million in cash proceeds that we received in 2016 from the U.S. Retail Advisor Force Divestiture; (ii) dividends in the range of $3.3 billion to $3.8 billion that we expect to receive in 2017 from Brighthouse (which may be partially funded by the issuance of debt by Brighthouse) and a MetLife-affiliated reinsurance company prior to the Separation; and (iii) proceeds from the disposition of our retained shares of Brighthouse common stock that we expect to receive over time. In addition to these Separation-related items, we expect to have cash commitments of between $1.0 billion and $2.0 billion over the two-year period of 2017 and 2018 relating to liability management transactions, including the repayment of certain debt maturities. Following the Separation, we plan to maintain a liquidity buffer of $3.0 to $4.0 billion of liquid assets at the holding companies. See “— Executive Summary — Consolidated Company Outlook.”
Liquidity and Capital Sources
In addition to the description of liquidity and capital sources in “— The Company — Summary of the Company’s Primary Sources and Uses of Liquidity and Capital” and “— The Company — Liquidity and Capital Sources,” the following additional information is provided regarding MetLife, Inc.’s primary sources of liquidity and capital.
Dividends from Subsidiaries
MetLife, Inc. relies, in part, on dividends from its subsidiaries to meet its cash requirements. MetLife, Inc.’s insurance subsidiaries are subject to regulatory restrictions on the payment of dividends imposed by the regulators of their respective domiciles. The dividend limitation for U.S. insurance subsidiaries is generally based on the surplus to policyholders at the end of the immediately preceding calendar year and statutory net gain from operations for the immediately preceding calendar year. Statutory accounting practices, as prescribed by insurance regulators of various states in which we conduct business, differ in certain respects from accounting principles used in financial statements prepared in conformity with GAAP. The significant differences relate to the treatment of DAC, certain deferred income tax, required investment liabilities, statutory reserve calculation assumptions, goodwill and surplus notes.
180
The table below sets forth the dividends permitted to be paid by MetLife, Inc.’s primary insurance subsidiaries without insurance regulatory approval and the respective dividends paid:
|
|
2017
|
2016
|
2015
|
2014
|
|||||||||||||||||||||||||||
|
Company
|
Permitted without Approval (1)
|
Paid (2)
|
|
Permitted without Approval (3)
|
Paid (2)
|
|
Permitted without Approval (3)
|
Paid (2)
|
|
Permitted without Approval (3)
|
|||||||||||||||||||||
|
|
(In millions)
|
||||||||||||||||||||||||||||||
|
Metropolitan Life Insurance Company (4)
|
$
|
2,723
|
|
$
|
5,740
|
|
(6)
|
$
|
3,753
|
|
$
|
1,489
|
|
$
|
1,200
|
|
$
|
821
|
|
(6)
|
$
|
1,163
|
|
||||||||
|
American Life Insurance Company
|
$
|
—
|
|
$
|
—
|
|
$
|
—
|
|
$
|
—
|
|
$
|
—
|
|
$
|
—
|
|
|
$
|
—
|
|
|||||||||
|
MetLife Insurance Company USA
|
$
|
473
|
|
$
|
261
|
|
$
|
586
|
|
$
|
500
|
|
|
$
|
3,056
|
|
$
|
155
|
|
(5)
|
$
|
1,013
|
|
||||||||
|
Metropolitan Property and Casualty Insurance Company
|
$
|
98
|
|
$
|
228
|
|
|
$
|
130
|
|
$
|
235
|
|
|
$
|
239
|
|
$
|
200
|
|
|
$
|
218
|
|
|||||||
|
Metropolitan Tower Life Insurance Company
|
$
|
66
|
|
$
|
60
|
|
$
|
70
|
|
$
|
102
|
|
|
$
|
102
|
|
$
|
73
|
|
$
|
73
|
|
|||||||||
|
MetLife Investors Insurance Company (5)
|
N/A
|
|
N/A
|
|
|
N/A
|
|
N/A
|
|
|
N/A
|
|
N/A
|
|
|
$
|
120
|
|
|||||||||||||
|
New England Life Insurance Company
|
$
|
106
|
|
$
|
295
|
|
(7)
|
$
|
156
|
|
$
|
199
|
|
(7)
|
$
|
199
|
|
$
|
227
|
|
(8)
|
$
|
102
|
|
|||||||
|
General American Life Insurance Company
|
$
|
91
|
|
$
|
—
|
|
$
|
136
|
|
$
|
—
|
|
$
|
88
|
|
$
|
—
|
|
$
|
81
|
|
||||||||||
|
(1)
|
Reflects dividend amounts that may be paid during
2017
without prior regulatory approval. However, because dividend tests may be based on dividends previously paid over rolling 12-month periods, if paid before a specified date during
2017
, some or all of such dividends may require regulatory approval.
|
|
(2)
|
Reflects all amounts paid, including those requiring regulatory approval.
|
|
(3)
|
Reflects dividend amounts that could have been paid during the relevant year without prior regulatory approval.
|
|
(4)
|
The New York Insurance Law was amended, permitting MLIC to pay dividends without prior regulatory approval under one of two alternative formulations beginning in 2016. See Note
16
of the Notes to the Consolidated Financial Statements. The dividend amount that MLIC was permitted to pay during 2016 and will be permitted to pay during 2017 were calculated using the new formulation.
|
|
(5)
|
Prior to the mergers into MetLife USA of certain of its affiliates and a subsidiary, Exeter Reinsurance Company, Ltd. paid dividends of $155 million on its preferred stock. In August 2014, MetLife Insurance Company of Connecticut (“MICC”), MetLife USA’s predecessor, redeemed for $1.4 billion and retired 4,595,317 shares of its common stock owned by MetLife Investors Group, LLC (“MLIG”). Following the redemption, in August 2014, MLIG paid a dividend of $1.4 billion to MetLife, Inc. MetLife USA did not pay dividends in 2014.
|
|
(6)
|
In 2016, MLIC paid an ordinary cash dividend to MetLife, Inc. in the amount of $3.6 billion. In addition, in December 2016, MLIC distributed all of the issued and outstanding shares of common stock of each of NELICO and GALIC to MetLife, Inc. in the form of a non-cash extraordinary dividend in the amount of $981 million and $1.2 billion, respectively, as calculated on a statutory basis. During December 2014, MLIC distributed shares of New England Securities Corporation (“NES”) to MetLife, Inc. as an in-kind dividend of $113 million.
|
|
(7)
|
Dividends paid by NELICO in 2015 were paid to its former parent, MLIC. Dividends paid by NELICO in 2016, including a
$295 million
extraordinary cash dividend, were paid to its new parent, MetLife, Inc.
|
|
(8)
|
In December 2014, NELICO distributed shares of NES to MLIC as an extraordinary in-kind dividend of $113 million, as calculated on a statutory basis. Also, in December 2014, NELICO paid an extraordinary cash dividend to MLIC in the amount of $114 million.
|
In addition to the amounts presented in the table above, for the years ended December 31,
2016
,
2015
and
2014
, cash dividends in the aggregate amount of $26 million, $9 million and $17 million, respectively, were paid to MetLife, Inc. by certain of its other subsidiaries. Additionally, for the years ended December 31,
2016
,
2015
and
2014
, MetLife, Inc. received cash of $80 million, $5 million and $0, respectively, representing returns of capital from certain subsidiaries.
181
The dividend capacity of our non-U.S. operations is subject to similar restrictions established by the local regulators. The non-U.S. regulatory regimes also commonly limit the dividend payments to the parent to a portion of the prior year’s statutory income, as determined by the local accounting principles. The regulators of our non-U.S. operations, including the FSA, may also limit or not permit profit repatriations or other transfers of funds to the U.S. if such transfers are deemed to be detrimental to the solvency or financial strength of the non-U.S. operations, or for other reasons. Most of the non-U.S. subsidiaries are second tier subsidiaries which are owned by various non-U.S. holding companies. The capital and rating considerations applicable to the first tier subsidiaries may also impact the dividend flow into MetLife, Inc.
We actively manage target and excess capital levels and dividend flows on a proactive basis and forecast local capital positions as part of the financial planning cycle. The dividend capacity of certain U.S. and non-U.S. subsidiaries is also subject to business targets in excess of the minimum capital necessary to maintain the desired rating or level of financial strength in the relevant market. See “Risk Factors — Capital-Related Risks — As a Holding Company, MetLife, Inc. Depends on the Ability of Its Subsidiaries to Pay Dividends, a Major Component of Holding Company Free Cash Flow” and Note
16
of the Notes to the Consolidated Financial Statements.
Short-term Debt
MetLife, Inc. maintains a commercial paper program, the proceeds of which can be used to finance the general liquidity needs of MetLife, Inc. and its subsidiaries. MetLife, Inc. had no short-term debt outstanding at either December 31,
2016
or
2015
.
Preferred Stock
For information on MetLife, Inc.’s preferred stock, see “— The Company — Liquidity and Capital Sources — Global Funding Sources — Preferred Stock.”
Senior Notes Issuances and Other Borrowings
For information on MetLife, Inc.’s unaffiliated senior notes issuances and other borrowings, see “— The Company — Liquidity and Capital Sources — Global Funding Sources — Senior Notes Issuances and Other Borrowings.”
Maturities and Issuances of Affiliated Long-term Debt
In September 2016, a $250 million senior note issued to MLIC matured and, subsequently, in September 2016 MetLife, Inc. issued a new $250 million senior note to MLIC. The note matures in September 2020 and bears interest at a rate per annum of 3.03%, payable semi-annually.
In June 2014, a $500 million senior note payable to MLIC matured and, subsequently, MetLife, Inc. issued a new $500 million senior note to MLIC. The note matures in June 2019 and bears interest at a fixed rate of 3.54%, payable semi-annually.
Collateral Financing Arrangements and Junior Subordinated Debt Securities
For information on MetLife, Inc.’s collateral financing arrangements and junior subordinated debt securities, see Notes
13
and
14
of the Notes to the Consolidated Financial Statements, respectively.
Credit and Committed Facilities
In June 2016, MetLife, Inc. entered into a five-year agreement with an indirect wholly-owned subsidiary, MetLife Ireland Treasury d.a.c. (formerly known as MetLife Ireland Treasury Limited) (“MIT”), to borrow up to $1.3 billion on a revolving basis, at interest rates based on the United States Internal Revenue Service’s safe harbor interest rate in effect at the time of the borrowing. MetLife, Inc. may borrow funds under the agreement at MIT’s discretion and subject to the availability of funds. There were no outstanding borrowings at
December 31, 2016
.
See “— The Company — Liquidity and Capital Sources — Global Funding Sources — Credit and Committed Facilities” for information about MetLife, Inc.’s unsecured credit facility.
MetLife, Inc. maintains a committed facility with a capacity of $425 million. At December 31,
2016
, MetLife, Inc. had outstanding $425 million in letters of credit, no drawdowns outstanding and no remaining availability against this facility. In addition, MetLife, Inc. is a party and/or guarantor to committed facilities of certain of its subsidiaries, which aggregated $11.1 billion at December 31,
2016
. The committed facilities are used as collateral for certain of the Company’s affiliated reinsurance liabilities.
See “— The Company — Liquidity and Capital Sources — Global Funding Sources — Credit and Committed Facilities,” as well as Note
12
of the Notes to the Consolidated Financial Statements, for further information regarding these facilities.
182
Long-term Debt Outstanding
The following table summarizes the outstanding long-term debt of MetLife, Inc. at:
|
|
December 31,
|
||||||
|
|
2016
|
2015 (1)
|
|||||
|
|
(In millions)
|
||||||
|
Long-term debt — unaffiliated
|
$
|
15,505
|
|
$
|
16,927
|
|
|
|
Long-term debt — affiliated
|
$
|
3,100
|
|
$
|
3,314
|
|
|
|
Collateral financing arrangements
|
$
|
2,797
|
|
$
|
2,797
|
|
|
|
Junior subordinated debt securities
|
$
|
1,734
|
|
$
|
1,733
|
|
|
__________________
|
(1)
|
Net of $82 million of unamortized issuance costs, which were reported in other assets at December 31, 2015.
|
See Note 6 in Schedule II of
the Notes to the MetLife, Inc. (Parent Company Only) Condensed Financial Statements for information regarding the
Junior Subordinated Debt Securities exchange transaction in February 2017.
Debt and Facility Covenants
Certain of MetLife, Inc.’s debt instruments and committed facilities, as well as its credit facility, contain various administrative, reporting, legal and financial covenants. MetLife, Inc. believes it was in compliance with all applicable covenants at December 31,
2016
.
Dispositions
Cash proceeds from dispositions during the years ended December 31,
2016
,
2015
and
2014
were $291 million, $0, and $7 million, respectively. See Note
3
of the Notes to the Consolidated Financial Statements.
Liquidity and Capital Uses
The primary uses of liquidity of MetLife, Inc. include debt service, cash dividends on common and preferred stock, capital contributions to subsidiaries, common and preferred stock repurchases, payment of general operating expenses and acquisitions. Based on our analysis and comparison of our current and future cash inflows from the dividends we receive from subsidiaries that are permitted to be paid without prior insurance regulatory approval, our investment portfolio and other cash flows and anticipated access to the capital markets, we believe there will be sufficient liquidity and capital to enable MetLife, Inc. to make payments on debt, pay cash dividends on its common and preferred stock, contribute capital to its subsidiaries, repurchase its common and preferred stock, pay all general operating expenses and meet its cash needs.
In addition to the description of liquidity and capital uses in “— The Company — Liquidity and Capital Uses” and “— The Company — Contractual Obligations,” the following additional information is provided regarding MetLife, Inc.’s primary uses of liquidity and capital:
Affiliated Capital and Debt Transactions
During the years ended December 31,
2016
,
2015
and
2014
, MetLife, Inc. invested a net amount of $1.5 billion, $88 million and $1.8 billion, respectively, in various subsidiaries. The investment in 2016 included a cash capital contribution of $1.5 billion to MetLife USA in connection with the Separation.
MetLife, Inc. lends funds, as necessary, to its subsidiaries and affiliates, some of which are regulated, to meet their capital requirements. MetLife, Inc. had loans to subsidiaries outstanding of $1.2 billion at both December 31,
2016
and
2015
.
In April 2016, American Life issued a $140 million short-term note to MetLife, Inc. which was repaid in June 2016. The short-term note bore interest at six-month LIBOR plus 1.00%.
In May 2015, American Life issued a $150 million short-term note to MetLife, Inc. which was repaid in June 2015. The short-term note bore interest at six-month LIBOR plus 1.00%.
In April 2015, American Life issued a $150 million short-term note to MetLife, Inc. which was repaid in May 2015. The short-term note bore interest at six-month LIBOR plus 0.875%.
183
In December 2014, MetLife, Inc. entered into a five-year agreement with MetLife Reinsurance Company of Bermuda, Ltd. (“MrB”), a Bermuda insurance affiliate and an indirect, wholly-owned subsidiary of MetLife, Inc., to lend up to $500 million to MrB on a revolving basis. There were no loans outstanding at December 31,
2016
and
2015
.
In December 2014, American Life issued a $100 million surplus note to MetLife, Inc. The surplus note bears interest at a fixed rate of 3.17%, payable semi-annually, and matures in June 2020.
In August 2014, MICC paid to MLIG $1.4 billion to redeem and retire its common stock owned by MLIG; as a result, all of the outstanding shares of common stock of MICC were directly held by MetLife, Inc. Following the redemption, in August 2014, MLIG paid a dividend of $1.4 billion to MetLife, Inc., and MetLife, Inc. made a capital contribution to MICC of $231 million.
In August 2014, American Life issued a $120 million short-term note to MetLife, Inc. which was repaid in December 2014. In February 2014, American Life issued a $150 million short-term note to MetLife, Inc. which was repaid in June 2014. Both short-term notes bore interest at six-month LIBOR plus 0.875%.
In July 2013, MIT borrowed the Chilean peso equivalent of $1.5 billion from MetLife, Inc., which was due July 2023. The loan bore interest at a fixed rate of 8.5%, payable annually. In December, September and June 2015, MIT made loan payments of the Chilean peso equivalent of $77 million, $153 million and $231 million, respectively. In December 2014 and June 2014, MIT made loan payments of the Chilean peso equivalent of $493 million and $69 million, respectively. At December 31, 2015, the loan was fully paid.
Debt Repayments
For information on MetLife, Inc.’s debt repayments, see “— The Company — Liquidity and Capital Uses — Debt Repayments.” MetLife, Inc. intends to repay or refinance, in whole or in part, all the debt that is due in
2017
.
Repayments of Affiliated Long-term Debt
In June 2016, March 2016 and December 2015, MetLife, Inc. repaid $204 million, $10 million and $286 million, respectively, of affiliated long-term debt to MetLife Exchange Trust I, at maturity, in exchange for returns of capital. The long-term notes bore interest at three-month LIBOR plus 0.70%.
Maturities of Senior Notes
The following table summarizes MetLife, Inc.’s outstanding senior notes by year of maturity through 2021 and 2022 to 2046, excluding any premium or discount and unamortized issuance costs, at December 31,
2016
:
|
Year of Maturity
|
Principal
|
Interest Rate
|
||||
|
|
(In millions)
|
|
||||
|
2017
|
$
|
500
|
|
1.76%
|
||
|
2017
|
$
|
500
|
|
1.90%
|
||
|
2018
|
$
|
1,035
|
|
6.82%
|
||
|
2019
|
$
|
1,035
|
|
7.72%
|
||
|
2019
|
$
|
500
|
|
3.54%
|
||
|
2019
|
$
|
250
|
|
3.57%
|
||
|
2020
|
$
|
494
|
|
5.25%
|
||
|
2020
|
$
|
250
|
|
3.03%
|
||
|
2021
|
$
|
1,000
|
|
4.75%
|
||
|
2021
|
$
|
500
|
|
5.64%
|
||
|
2021
|
$
|
500
|
|
5.86%
|
||
|
2022 - 2046
|
$
|
12,133
|
|
Ranging from 3.00% - 6.50%
|
||
Support Agreements
MetLife, Inc. is party to various capital support commitments and guarantees with certain of its subsidiaries. Under these arrangements, MetLife, Inc. has agreed to cause each such entity to meet specified capital and surplus levels or has guaranteed certain contractual obligations. See “— The Company — Liquidity and Capital Uses — Support Agreements.”
184
MetLife, Inc., in connection with MetLife Reinsurance Company of Delaware’s (“MRD”) reinsurance of certain universal life and term life risks, entered into capital maintenance agreements pursuant to which MetLife, Inc. agreed, without limitation as to amount, to cause the first and second protected cells of MRD to maintain total adjusted capital equal to or greater than 200% of each such protected cell’s company action level RBC, as defined in state insurance statutes. In addition, MetLife, Inc. entered into an agreement with the Delaware Department of Insurance to increase such capital maintenance threshold to 300% of each such protected cell’s company action level RBC, in the event of specified downgrades in the senior unsecured debt ratings of MetLife, Inc.
MetLife, Inc. guarantees the obligations of its subsidiary, DelAm, under a stop loss reinsurance agreement with RGA Reinsurance (Barbados) Inc. (“RGARe”), pursuant to which RGARe retrocedes to DelAm a portion of the whole life medical insurance business that RGARe assumed from American Life on behalf of its Japan operations. Also, MetLife, Inc. guarantees the obligations of its subsidiary, Missouri Reinsurance, Inc. (“MoRe”), under a retrocession agreement with RGARe, pursuant to which MoRe retrocedes certain group term life insurance liabilities (which retrocession was terminated effective as of January, 2016) and a portion of the closed block liabilities associated with industrial life and ordinary life insurance policies that it assumed from MLIC.
MetLife, Inc. guarantees the obligations of MrB, a Bermuda insurance affiliate and an indirect, wholly-owned subsidiary of MetLife, Inc. under a reinsurance agreement with Mitsui Sumitomo Primary Life Insurance Co., Ltd. (“Mitsui”), a former affiliate that is now an unaffiliated third party, under which MrB reinsures certain variable annuity business written by Mitsui.
MetLife, Inc. guarantees the obligations of MrB in an aggregate amount up to $1.0 billion, under a reinsurance agreement with MetLife Europe d.a.c. (“MEL”) (formerly known as MetLife Europe Limited), under which MrB reinsured the guaranteed living benefits and guaranteed death benefits associated with certain unit-linked annuity contracts issued by MEL.
MetLife, Inc., in connection with MetLife Reinsurance Company of Vermont’s (“MRV”) reinsurance of certain universal life and term life insurance risks, committed to the Vermont Department of Banking, Insurance, Securities and Health Care Administration to take necessary action to cause the three protected cells of MRV to maintain total adjusted capital in an amount that is equal to or greater than 200% of each such protected cell’s authorized control level RBC, as defined in Vermont state insurance statutes. See Note
12
of the Notes to the Consolidated Financial Statements.
MetLife, Inc., in connection with the collateral financing arrangement associated with MRC’s reinsurance of a portion of the liabilities associated with the closed block, committed to the South Carolina Department of Insurance to make capital contributions, if necessary, to MRC so that MRC may at all times maintain its total adjusted capital in an amount that is equal to or greater than 200% of the company action level RBC, as defined in South Carolina state insurance statutes as in effect on the date of determination or December 31, 2007, whichever calculation produces the greater capital requirement, or as otherwise required by the South Carolina Department of Insurance. See Note
13
of the Notes to the Consolidated Financial Statements.
MetLife, Inc., in connection with the collateral financing arrangement associated with MetLife Reinsurance Company of South Carolina’s (“MRSC”) reinsurance of ULSG, committed to the South Carolina Department of Insurance to take necessary action to cause MRSC to maintain the greater of capital and surplus of $250,000 or total adjusted capital in an amount that is equal to or greater than 100% of authorized control level RBC, as defined in South Carolina state insurance statutes. See Note
13
of the Notes to the Consolidated Financial Statements.
MetLife, Inc. has a net worth maintenance agreement with its insurance subsidiary, First MetLife. Under this agreement, as amended, MetLife, Inc. agreed, without limitation as to the amount, to cause First MetLife to have capital and surplus of $10 million, total adjusted capital in an amount that is equal to or greater than 150% of the company action level RBC, as defined by applicable state insurance statutes, and liquidity necessary to enable it to meet its current obligations on a timely basis. In connection with the Separation, this support agreement will be terminated.
185
MetLife, Inc. guarantees obligations arising from derivatives of the following subsidiaries: MrB, MetLife International Holdings, LLC and MetLife Worldwide Holdings, LLC. These subsidiaries are exposed to various risks relating to their ongoing business operations, including interest rate, foreign currency exchange rate, credit and equity market. These subsidiaries use a variety of strategies to manage these risks, including the use of derivatives. Further, all of the subsidiaries’ derivatives are subject to industry standard netting agreements and collateral agreements that limit the unsecured portion of any open derivative position. On a net counterparty basis at December 31,
2016
and
2015
, derivative transactions with positive mark-to-market values (in-the-money) were
$495 million
and $583 million, respectively, and derivative transactions with negative mark-to-market values (out-of-the-money) were
$237 million
and $32 million, respectively. To secure the obligations represented by the out of-the-money transactions, the subsidiaries had provided collateral to their counterparties with an estimated fair value of
$233 million
and $32 million at December 31,
2016
and
2015
, respectively. Accordingly, unsecured derivative liabilities guaranteed by MetLife, Inc. were
$4 million
and $0 at December 31,
2016
and
2015
, respectively.
MetLife, Inc. also guarantees the obligations of certain of its subsidiaries under committed facilities with third-party banks. See Note
12
of the Notes to the Consolidated Financial Statements.
Acquisitions
During the years ended December 31,
2016
,
2015
and
2014
, there were no cash outflows from MetLife, Inc. for acquisitions.
Adoption of New Accounting Pronouncements
See Note
1
of the Notes to the Consolidated Financial Statements.
Future Adoption of New Accounting Pronouncements
See Note
1
of the Notes to the Consolidated Financial Statements.
Non-GAAP and Other Financial Disclosures
In this report, the Company presents certain measures of its performance that are not calculated in accordance with GAAP. We believe that these non-GAAP financial measures enhance the understanding of our performance by highlighting the results of operations and the underlying profitability drivers of our business.
The following non-GAAP financial measures should not be viewed as substitutes for the most directly comparable financial measures calculated in accordance with GAAP:
|
Non-GAAP financial measures:
|
Comparable GAAP financial measures:
|
||
|
(i)
|
operating revenues
|
(i)
|
revenues
|
|
(ii)
|
operating expenses
|
(ii)
|
expenses
|
|
(iii)
|
operating earnings
|
(iii)
|
income (loss) from continuing operations, net of income tax
|
|
(iv)
|
operating earnings available to common shareholders
|
(iv)
|
net income (loss) available to MetLife, Inc.’s common shareholders
|
|
(v)
|
free cash flow of all holding companies
|
(v)
|
MetLife, Inc.’s net cash provided by operating activities
|
Reconciliations of these non-GAAP measures to the most directly comparable historical GAAP measures are included in this section and the results of operations, see “— Results of Operations.” Reconciliations of these non-GAAP measures to the most directly comparable GAAP measures is not accessible on a forward-looking basis because we believe it is not possible without unreasonable efforts to provide other than a range of net investment gains and losses and net derivative gains and losses, which can fluctuate significantly within or outside the range and from period to period and may have a material impact on net income.
Our definitions of the various non-GAAP and other financial measures discussed in this report may differ from those used by other companies:
186
Operating earnings and related measures:
|
•
|
operating earnings; and
|
|
•
|
operating earnings available to common shareholders.
|
These measures are used by management to evaluate performance and allocate resources. Consistent with GAAP guidance for segment reporting, operating earnings is also our GAAP measure of segment performance. Operating earnings and other financial measures based on operating earnings are also the measures by which senior management’s and many other employees’ performance is evaluated for the purposes of determining their compensation under applicable compensation plans. Operating earnings and other financial measures based on operating earnings allow analysis of our performance relative to our business plan and facilitate comparisons to industry results.
Operating earnings is defined as operating revenues less operating expenses, both net of income tax. Operating earnings available to common shareholders is defined as operating earnings less preferred stock dividends.
Operating revenues and operating expenses
These financial measures focus on our primary businesses principally by excluding the impact of market volatility, which could distort trends, and revenues and costs related to non-core products and divested businesses and certain entities required to be consolidated under GAAP. Also, these measures exclude results of discontinued operations and other businesses that have been or will be sold or exited by MetLife and are referred to as divested businesses. In addition, for the year ended December 31, 2016, operating revenues and operating expenses exclude the financial impact of converting the Company’s Japan operations to calendar year-end reporting without retrospective application of this change to prior periods and is referred to as lag elimination. Operating revenues also excludes net investment gains (losses) and net derivative gains (losses). Operating expenses also excludes goodwill impairments.
The following additional adjustments are made to revenues, in the line items indicated, in calculating operating revenues:
|
•
|
Universal life and investment-type product policy fees excludes the amortization of unearned revenue related to net investment gains (losses) and net derivative gains (losses) and certain variable annuity GMIB fees (“GMIB Fees”);
|
|
•
|
Net investment income: (i) includes investment hedge adjustments, (ii) includes income from discontinued real estate operations, (iii) excludes post-tax operating earnings adjustments relating to insurance joint ventures accounted for under the equity method, (iv) excludes certain amounts related to contractholder-directed unit-linked investments, and (v) excludes certain amounts related to securitization entities that are VIEs consolidated under GAAP; and
|
|
•
|
Other revenues are adjusted for settlements of foreign currency earnings hedges.
|
The following additional adjustments are made to expenses, in the line items indicated, in calculating operating expenses:
|
•
|
Policyholder benefits and claims and policyholder dividends excludes: (i) changes in the policyholder dividend obligation related to net investment gains (losses) and net derivative gains (losses), (ii) inflation-indexed benefit adjustments associated with contracts backed by inflation-indexed investments and amounts associated with periodic crediting rate adjustments based on the total return of a contractually referenced pool of assets and other pass through adjustments, (iii) benefits and hedging costs related to GMIBs (“GMIB Costs”), and (iv) market value adjustments associated with surrenders or terminations of contracts (“Market Value Adjustments”);
|
|
•
|
Interest credited to policyholder account balances includes adjustments for earned income on derivatives and amortization of premium on derivatives that are hedges of policyholder account balances but do not qualify for hedge accounting treatment and excludes amounts related to net investment income earned on contractholder-directed unit-linked investments;
|
|
•
|
Amortization of DAC and VOBA excludes amounts related to: (i) net investment gains (losses) and net derivative gains (losses), (ii) GMIB Fees and GMIB Costs, and (iii) Market Value Adjustments;
|
|
•
|
Amortization of negative VOBA excludes amounts related to Market Value Adjustments;
|
|
•
|
Interest expense on debt excludes certain amounts related to securitization entities that are VIEs consolidated under GAAP; and
|
|
•
|
Other expenses excludes costs related to: (i) noncontrolling interests, (ii) implementation of new insurance regulatory requirements, and (iii) acquisition, integration and other costs.
|
Operating earnings also excludes the recognition of certain contingent assets and liabilities that could not be recognized at acquisition or adjusted for during the measurement period under GAAP business combination accounting guidance.
187
The tax impact of the adjustments mentioned above are calculated net of the U.S. or foreign statutory tax rate, which could differ from the Company’s effective tax rate. Additionally, the provision for income tax (expense) benefit also includes the impact related to the timing of certain tax credits, as well as certain tax reforms.
Return on equity, allocated equity and related measures:
|
•
|
MetLife, Inc.’s common stockholders’ equity, excluding AOCI other than FCTA, is defined as MetLife, Inc.’s common stockholders’ equity, excluding the net unrealized investment gains (losses) and defined benefit plans adjustment components of AOCI, net of income tax.
|
|
•
|
Operating ROE is defined as operating earnings available to common shareholders, divided by average GAAP common stockholders’ equity.
|
|
•
|
Operating ROE, excluding AOCI other than FCTA, is defined as operating earnings available to common shareholders divided by average GAAP common stockholders’ equity, excluding AOCI other than FCTA.
|
|
•
|
Allocated equity is the portion of MetLife, Inc.’s common stockholders’ equity that management allocates to each of its segments and sub-segments based on local capital requirements and economic capital. See “— Economic Capital.” Allocated equity excludes the impact of AOCI other than FCTA.
|
The above measures represent a level of equity consistent with the view that, in the ordinary course of business, we do not plan to sell most investments for the sole purpose of realizing gains or losses. Also refer to the utilization of operating earnings and other financial measures based on operating earnings mentioned above.
The following additional information is relevant to an understanding of our performance results:
|
•
|
The impact of changes in our foreign currency exchange rates is calculated using the average foreign currency exchange rates for the current period and is applied to each of the comparable periods (“Constant Currency Basis”).
|
|
•
|
We sometimes refer to sales activity for various products. These sales statistics do not correspond to revenues under GAAP, but are used as relevant measures of business activity. Further, sales statistics for our Latin America, Asia and EMEA segments are on a Constant Currency Basis.
|
|
•
|
Asymmetrical and non-economic accounting refers to: (i) the portion of net derivative gains (losses) on embedded derivatives attributable to the inclusion of our credit spreads in the liability valuations, (ii) hedging activity that generates net derivative gains (losses) and creates fluctuations in net income because hedge accounting cannot be achieved and the item being hedged does not a have an offsetting gain or loss recognized in earnings, (iii) inflation-indexed benefit adjustments associated with contracts backed by inflation-indexed investments and amounts associated with periodic crediting rate adjustments based on the total return of a contractually referenced pool of assets and other pass through adjustments, and (iv) impact of changes in foreign currency exchange rates on the re-measurement of foreign denominated unhedged funding agreements and financing transactions to the U.S. dollar and the re-measurement of certain liabilities from non-functional currencies to functional currencies.
|
|
•
|
The Company uses a measure of free cash flow to facilitate an understanding of its ability to generate cash for reinvestment into its businesses or use in non-mandatory capital actions. The Company defines free cash flow as the sum of cash available at MetLife’s holding companies from dividends from operating subsidiaries, expenses and other net flows of the holding companies (including capital contributions to subsidiaries), and net contributions from debt to be at or below target leverage ratios. This measure of free cash flow is prior to capital actions, such as common stock dividends and repurchases, debt reduction and mergers and acquisitions. Free cash flow should not be viewed as a substitute for net cash provided by (used in) operating activities calculated in accordance with GAAP. The free cash flow ratio is typically expressed as a percentage of annual operating earnings available to common shareholders. A reconciliation of net cash provided by operating activities of MetLife, Inc. to free cash flow of all holding companies for the years ended December 31, 2016, 2015 and 2014 is provided below.
|
188
|
Reconciliation of Net Cash Provided by Operating Activities of MetLife, Inc. to Free Cash Flow of All Holding Companies
|
Years Ended December 31,
|
||||||||||
|
2016
|
2015
|
2014
|
|||||||||
|
|
(In millions)
|
||||||||||
|
MetLife, Inc. (parent company only) net cash provided by operating activities
|
$
|
3,747
|
|
$
|
1,606
|
|
$
|
2,615
|
|
||
|
Adjustments from net cash provided by operating activities to free cash flow:
|
|
|
|
|
|
||||||
|
Add: Incremental debt to be at or below target leverage ratios
|
—
|
|
1,750
|
|
445
|
|
|||||
|
Add: Capital contributions to subsidiaries
|
(1,733
|
)
|
(667
|
)
|
(1,011
|
)
|
|||||
|
Add: Returns of capital from subsidiaries
|
80
|
|
5
|
|
—
|
|
|||||
|
Add: Repayments on and (issuances of) loans to subsidiaries, net
|
—
|
|
461
|
|
462
|
|
|||||
|
Add: Investment portfolio and derivatives changes and other, net
|
(672
|
)
|
365
|
|
151
|
|
|||||
|
MetLife, Inc. (parent company only) free cash flow
|
1,422
|
|
3,520
|
|
2,662
|
|
|||||
|
Other MetLife, Inc. holding companies:
|
|||||||||||
|
Add: Dividends and returns of capital from subsidiaries
|
1,485
|
|
1,354
|
|
1,339
|
|
|||||
|
Add: Capital contributions from MetLife, Inc.
|
—
|
|
150
|
|
—
|
|
|||||
|
Add: Capital contributions to subsidiaries
|
(53
|
)
|
(27
|
)
|
(48
|
)
|
|||||
|
Add: Repayments on and (issuances of) loans to subsidiaries, net
|
(307
|
)
|
(510
|
)
|
(458
|
)
|
|||||
|
Add: Other expenses
|
(671
|
)
|
(729
|
)
|
(637
|
)
|
|||||
|
Add: Investment portfolio and derivative changes and other, net
|
548
|
|
223
|
|
32
|
|
|||||
|
Total other MetLife, Inc. holding companies free cash flow
|
1,002
|
|
461
|
|
228
|
|
|||||
|
Free cash flow of all holding companies (1)
|
$
|
2,424
|
|
$
|
3,981
|
|
$
|
2,890
|
|
||
|
Ratio of net cash provided by operating activities to consolidated net income (loss) available to MetLife, Inc.'s common shareholders:
|
|||||||||||
|
MetLife, Inc. (parent company only) net cash provided by operating activities
|
$
|
3,747
|
|
$
|
1,606
|
|
$
|
2,615
|
|
||
|
Consolidated net income (loss) available to MetLife, Inc.’s common
shareholders (1) |
$
|
697
|
|
$
|
5,152
|
|
$
|
6,187
|
|
||
|
Ratio of net cash provided by operating activities (parent company only) to
consolidated net income (loss) available to MetLife, Inc.'s common shareholders (1) (2) |
538
|
%
|
31
|
%
|
42
|
%
|
|||||
|
Ratio of free cash flow to operating earnings available to common shareholders:
|
|||||||||||
|
Free cash flow of all holding companies (3)
|
$
|
2,424
|
|
$
|
3,981
|
|
$
|
2,890
|
|
||
|
Consolidated operating earnings available to common shareholders (3)
|
$
|
5,089
|
|
$
|
5,484
|
|
$
|
6,560
|
|
||
|
Ratio of free cash flow of all holding companies to consolidated operating
earnings available to common shareholders (3) |
48
|
%
|
73
|
%
|
44
|
%
|
|||||
__________________
|
(1)
|
Consolidated net income (loss) available to MetLife, Inc.'s common shareholders for 2016 includes Separation-related costs of $73 million, net of income tax. Excluding this amount from the denominator of the ratio, this ratio, as adjusted, would be 487%. Consolidated net income (loss) available to MetLife, Inc.'s common shareholders for 2015 includes a non-cash charge of $792 million, net of income tax, related to an uncertain tax position. Excluding this charge from the denominator of the ratio, this ratio, as adjusted, would be 27%. See “
—
Liquidity and Capital Resources
—
MetLife, Inc.
—
Liquid Assets
—
MetLife, Inc. and Other MetLife Holding Companies Sources and Uses of Liquid Assets and Sources and Uses of Liquid Assets included in Free Cash Flow.”
|
|
(2)
|
Including the free cash flow of other MetLife, Inc. holding companies of
$1.0 billion
, $461 million and $228 million for the years ended December 31, 2016, 2015 and 2014, respectively, in the numerator of the ratio, this ratio, as adjusted, would be 681%, 40% and 46%, respectively. Including the free cash flow of other MetLife, Inc. holding companies in the numerator of the ratio and excluding the Separation-related costs and uncertain tax position non-cash charge from the denominator of the ratio, this ratio, as adjusted, would be 617% and 35% for the years ended December 31, 2016 and 2015, respectively.
|
189
|
(3)
|
In 2016, we incurred
$2.3 billion
of Separation-related items which reduced our holding companies’ liquid assets, as well as our free cash flow. Excluding these Separation-related items, adjusted free cash flow would be
$4.7 billion
for the year ended December 31, 2016. Consolidated operating earnings available to common shareholders for 2016 was negatively impacted by notable items, primarily related to the actuarial assumption review and other insurance adjustments, of
$1.0 billion
, net of income tax, and Separation-related costs of $15 million, net of income tax. Excluding the Separation-related items, which reduced free cash flow, from the numerator of the ratio and excluding such notable items and Separation-related costs negatively impacting consolidated operating earnings available to common shareholders from the denominator of the ratio, the adjusted free cash flow ratio for 2016 would be 77%. Consolidated operating earnings available to common shareholders for 2015 includes a non-cash charge of $792 million, net of income tax, related to an uncertain tax position. Excluding this charge from the denominator of the ratio, the adjusted free cash flow ratio for 2015 would be 63%. See “
—
Liquidity and Capital Resources
—
MetLife, Inc.
—
Liquid Assets
—
MetLife, Inc. and Other MetLife Holding Companies Sources and Uses of Liquid Assets and Sources and Uses of Liquid Assets included in Free Cash Flow
—
Sources and Uses of Liquid Assets from Separation-related Transactions” for information about the 2016 Separation-related items.
|
Subsequent Events
See Note
23
of the Notes to the Consolidated Financial Statements.
Risk Management
We have developed an integrated process for managing risk, which we conduct through multiple Board and senior management committees (financial and non-financial) within the GRM, ALM Unit, Treasury Department and Investments Department. The risk committee structure is designed to provide a consolidated enterprise-wide assessment and management of risk. The ERC is responsible for reviewing all material risks to the enterprise and deciding on actions, if necessary, in the event risks exceed desired tolerances, taking into consideration industry best practices and the current environment to resolve or mitigate those risks. Additional committees at the MetLife, Inc. and subsidiary insurance company level manage capital and risk positions, approve ALM strategies and establish corporate business standards.
Global Risk Management
Independent from the lines of business, the centralized GRM, led by the CRO, collaborates and coordinates across all committees to ensure that all material risks are properly identified, measured, aggregated, managed and reported across the Company. The CRO reports to the CEO and is primarily responsible for maintaining and communicating the Company’s enterprise risk policies and for monitoring and analyzing all material risks.
GRM considers and monitors a full range of risks against the Company’s solvency, liquidity, earnings, business operations and reputation. GRM’s primary responsibilities consist of:
|
•
|
implementing a corporate risk framework, which outlines our enterprise approach for managing risk;
|
|
•
|
developing policies and procedures for managing, measuring, monitoring and controlling those risks identified in the corporate risk framework;
|
|
•
|
coordinating
Own Risk and Solvency Assessments for the Board, senior management and regulator use;
|
|
•
|
establishing appropriate corporate risk tolerance levels;
|
|
•
|
recommending risk appetite statements and investment general authorizations to the Board;
|
|
•
|
managing capital on an economic basis;
|
|
•
|
recommending capital allocations on an economic capital basis; and
|
|
•
|
reporting to (i) the Finance and Risk Committee of MetLife, Inc.’s Board of Directors; (ii) the Investment Committee of MetLife, Inc.’s Board of Directors (iii) the Compensation Committee of MetLife, Inc.’s Board of Directors; and (iv) the financial and non-financial senior management committees on various aspects of risk.
|
190
Asset/Liability Management
We actively manage our assets using an approach that balances quality, diversification, asset/liability matching, liquidity, concentration and investment return. The goals of the investment process are to optimize, net of income tax, risk-adjusted investment income and risk-adjusted total return while ensuring that the assets and liabilities are reasonably managed on a cash flow and duration basis. The ALM process is the shared responsibility of the ALM Unit, GRM, the Portfolio Management Unit, and the senior members of the business segments and is governed by the ALM Committees. The ALM Committees’ duties include reviewing and approving target portfolios, establishing investment guidelines and limits and providing oversight of the ALM process on a periodic basis. The directives of the ALM Committees are carried out and monitored through ALM Working Groups which are set up by product type. Generally, our ALM Steering Committee oversees the activities of the underlying ALM Committees. The ALM Steering Committee reports to the ERC.
We establish target asset portfolios for each major insurance product or product group, which represent the investment strategies used to profitably fund our liabilities within acceptable levels of risk. The ALM Working Groups monitor these strategies through regular review of portfolio metrics, such as effective duration, yield curve sensitivity, convexity, liquidity, asset sector concentration and credit quality.
Market Risk Exposures
We regularly analyze our exposure to interest rate, foreign currency exchange rate and equity market price risk. As a result of that analysis, we have determined that the estimated fair values of certain assets and liabilities are materially exposed to changes in interest rates, foreign currency exchange rates and equity markets. We have exposure to market risk through our insurance operations and investment activities. For purposes of this disclosure, “market risk” is defined as the risk of loss resulting from changes in interest rates, foreign currency exchange rates and equity markets.
Interest Rates
Our exposure to interest rate changes results most significantly from our holdings of fixed maturity securities, as well as our interest rate sensitive liabilities. The fixed maturity securities include U.S. and foreign government bonds, securities issued by government agencies, corporate bonds, mortgage-backed securities and ABS, all of which are mainly exposed to changes in medium- and long-term interest rates. The interest rate sensitive liabilities for purposes of this disclosure include debt, policyholder account balances related to certain investment type contracts, and embedded derivatives on variable annuities with guaranteed minimum benefits which have the same type of interest rate exposure (medium- and long-term interest rates) as fixed maturity securities. See “Risk Factors — Economic Environment and Capital Markets-Related Risks — We Are Exposed to Significant Global Financial and Capital Markets Risks Which May Adversely Affect Our Results of Operations, Financial Condition and Liquidity, and May Cause Our Net Investment Income to Vary from Period to Period.”
Foreign Currency Exchange Rates
Our exposure to fluctuations in foreign currency exchange rates against the U.S. dollar results from our holdings in non-U.S. dollar denominated fixed maturity and equity securities, mortgage loans, and certain liabilities, as well as through our investments in foreign subsidiaries. The principal currencies that create foreign currency exchange rate risk in our investment portfolios and liabilities are the Euro, the Japanese yen and the British pound. Selectively, we use U.S. dollar assets to support certain long-duration foreign currency liabilities. Through our investments in foreign subsidiaries and joint ventures, we are primarily exposed to the Japanese yen, the Euro, the Polish zloty, the British pound, the Mexican peso, the Chilean peso and the Korean won. In addition to hedging with foreign currency swaps, forwards and options, local surplus in some countries is held entirely or in part in U.S. dollar assets which further minimizes exposure to foreign currency exchange rate fluctuation risk. We have matched much of our foreign currency liabilities in our foreign subsidiaries with their respective foreign currency assets, thereby reducing our risk to foreign currency exchange rate fluctuation. See “Risk Factors — Risks Related to Our Business — Fluctuations in Foreign Currency Exchange Rates Could Negatively Affect Our Profitability.”
Equity Market
Along with investments in equity securities, we have exposure to equity market risk through certain liabilities that involve long-term guarantees on equity performance such as embedded derivatives on variable annuities with guaranteed minimum benefits and certain policyholder account balances. Equity exposures associated with other limited partnership interests are excluded from this discussion as they are not considered financial instruments under GAAP.
Management of Market Risk Exposures
We use a variety of strategies to manage interest rate, foreign currency exchange rate and equity market risk, including the use of derivatives.
191
Interest Rate Risk Management
To manage interest rate risk, we analyze interest rate risk using various models, including multi-scenario cash flow projection models that forecast cash flows of the liabilities and their supporting investments, including derivatives. These projections involve evaluating the potential gain or loss on most of our in-force business under various increasing and decreasing interest rate environments. The NYDFS regulations require that we perform some of these analyses annually as part of our review of the sufficiency of our regulatory reserves. For several of our legal entities, we maintain segmented operating and surplus asset portfolios for the purpose of ALM and the allocation of investment income to product lines. For each segment, invested assets greater than or equal to the GAAP liabilities and any non-invested assets allocated to the segment are maintained, with any excess allocated to Corporate & Other. The business segments may reflect differences in legal entity, statutory line of business and any product market characteristic which may drive a distinct investment strategy with respect to duration, liquidity or credit quality of the invested assets. Certain smaller entities make use of unsegmented general accounts for which the investment strategy reflects the aggregate characteristics of liabilities in those entities. We measure relative sensitivities of the value of our assets and liabilities to changes in key assumptions utilizing internal models. These models reflect specific product characteristics and include assumptions based on current and anticipated experience regarding lapse, mortality and interest crediting rates. In addition, these models include asset cash flow projections reflecting interest payments, sinking fund payments, principal payments, bond calls, mortgage loan prepayments and defaults.
We employ product design, pricing and ALM strategies to reduce the potential effects of interest rate movements. Product design and pricing strategies include the use of surrender charges or restrictions on withdrawals in some products and the ability to reset crediting rates for certain products. ALM strategies include the use of derivatives and duration mismatch limits. We also use reinsurance to mitigate interest rate risk.
Common industry metrics, such as duration and convexity, are also used to measure the relative sensitivity of assets and liability values to changes in interest rates. In computing the duration of liabilities, consideration is given to all policyholder guarantees and to how we intend to set indeterminate policy elements such as interest credits or dividends. Each asset portfolio has a duration target based on the liability duration and the investment objectives of that portfolio. Where a liability cash flow may exceed the maturity of available assets, we may support such liabilities with equity investments, derivatives or interest rate curve mismatch strategies.
Foreign Currency Exchange Rate Risk Management
MetLife, Inc. has a well-established Enterprise FX (Foreign Exchange) Risk Policy to ensure MetLife manages foreign currency exchange rate exposures within the Company’s risk tolerance. In general, investments backing specific liabilities are currency matched. This is achieved through direct investments in matching currency or through the use of FX derivatives.
Management of each of the Company’s segments, with oversight from the Company’s FX Risk Committee, is responsible for establishing limits and managing any foreign currency exchange rate exposure.
We use foreign currency swaps, forwards and options to mitigate the liability exposure, risk of loss and financial statement volatility associated with our investments in foreign subsidiaries, foreign currency denominated fixed income investments and the sale of certain insurance products.
Equity Market Risk Management
We manage equity market risk on an integrated basis with other risks through our ALM strategies, including the dynamic hedging of certain variable annuity guarantee benefits, as well as reinsurance, in order to limit losses, minimize exposure to large risks, and provide additional capacity for future growth. We also manage equity market risk exposure in our investment portfolio through the use of derivatives. These derivatives include exchange-traded equity futures, equity index options contracts, total rate of return swaps and equity variance swaps. This risk is managed by our ALM Unit in partnership with the Investments Department.
192
Hedging Activities
We use derivative contracts primarily to hedge a wide range of risks including interest rate risk, foreign currency exchange rate risk, and equity market risk. Derivative hedges are designed to reduce risk on an economic basis while considering their impact on financial results under different accounting regimes, including U.S. GAAP and local statutory accounting. Our derivative hedge programs vary depending on the type of risk being hedged. Some hedge programs are asset or liability specific while others are portfolio hedges that reduce risk related to a group of liabilities or assets. Our use of derivatives by major hedge programs is as follows:
|
•
|
Risks Related to Guarantee Benefits — We use a wide range of derivative contracts to mitigate the risk associated with variable annuity living guarantee benefits. These derivatives include equity and interest rate futures, interest rate swaps, currency futures/forwards, equity indexed options, total rate of return swaps, interest rate option contracts and equity variance swaps.
|
|
•
|
Minimum Interest Rate Guarantees — For certain liability contracts, we provide the contractholder a guaranteed minimum interest rate. These contracts include certain fixed annuities and other insurance liabilities. We purchase interest rate floors to reduce risk associated with these liability guarantees.
|
|
•
|
Reinvestment Risk in Long-Duration Liability Contracts — Derivatives are used to hedge interest rate risk related to certain long-duration liability contracts. Hedges include interest rate swaps and swaptions.
|
|
•
|
Foreign Currency Exchange Rate Risk — We use currency swaps, forwards and options to hedge foreign currency exchange rate risk. These hedges are generally used to swap foreign currency denominated bonds, investments in foreign subsidiaries or equity market exposures to U.S. dollars. Our foreign subsidiaries also use these hedges to swap non-local currency assets to local currency, to match liabilities
.
|
|
•
|
General ALM Hedging Strategies — In the ordinary course of managing our asset/liability risks, we use interest rate futures, interest rate swaps, interest rate caps, interest rate floors and inflation swaps. These hedges are designed to reduce interest rate risk or inflation risk related to the existing assets or liabilities or related to expected future cash flows.
|
Risk Measurement: Sensitivity Analysis
We measure market risk related to our market sensitive assets and liabilities based on changes in interest rates, foreign currency exchange rates and equity market prices utilizing a sensitivity analysis. This analysis estimates the potential changes in estimated fair value based on a hypothetical 10% change (increase or decrease) in interest rates, foreign currency exchange rates and equity market prices. We believe that a 10% change (increase or decrease) in these market rates and prices is reasonably possible in the near term. In performing the analysis summarized below, we used market rates at December 31,
2016
. The sensitivity analysis separately calculates each of our market risk exposures (interest rate, foreign currency exchange rate and equity market) relating to our trading and non-trading assets and liabilities. We modeled the impact of changes in market rates and prices on the estimated fair values of our market sensitive assets and liabilities as follows:
|
•
|
the net present values of our interest rate sensitive exposures resulting from a 10% change (increase or decrease) in interest rates;
|
|
•
|
the U.S. dollar equivalent estimated fair values of our foreign currency exposures due to a 10% change (increase in the value of the U.S. dollar compared to all foreign currencies or decrease in the value of the U.S. dollar compared to all foreign currencies) in foreign currency exchange rates; and
|
|
•
|
the estimated fair value of our equity positions due to a 10% change (increase or decrease) in equity market prices.
|
193
The sensitivity analysis is an estimate and should not be viewed as predictive of our future financial performance. We cannot ensure that our actual losses in any particular period will not exceed the amounts indicated in the table below. Limitations related to this sensitivity analysis include:
|
•
|
interest sensitive liabilities do not include
$214.4 billion
of insurance contracts, which are accounted for on a book value basis. Management believes that the changes in the economic value of those contracts under changing interest rates would offset a significant portion of the fair value changes of interest sensitive assets.
|
|
•
|
the market risk information is limited by the assumptions and parameters established in creating the related sensitivity analysis, including the impact of prepayment rates on mortgage loans;
|
|
•
|
foreign currency risk is not isolated for certain embedded derivatives within host asset and liability contracts, as the risk on these instruments is reflected as equity;
|
|
•
|
for the derivatives that qualify as hedges, the impact on reported earnings may be materially different from the change in market values;
|
|
•
|
the analysis excludes liabilities pursuant to insurance contracts and real estate holdings; and
|
|
•
|
the model assumes that the composition of assets and liabilities remains unchanged throughout the period.
|
Accordingly, we use such models as tools and not as substitutes for the experience and judgment of our management. Based on our analysis of the impact of a 10% change (increase or decrease) in market rates and prices, we have determined that such a change could have a material adverse effect on the estimated fair value of certain assets and liabilities from interest rate, foreign currency exchange rate and equity market exposures.
The table below illustrates the potential loss in estimated fair value for each market risk exposure of our market sensitive assets and liabilities at:
|
|
December 31, 2016 (1)
|
||
|
|
(In millions)
|
||
|
Interest rate risk (2)
|
$
|
7,540
|
|
|
Foreign currency exchange rate risk (2)
|
$
|
6,823
|
|
|
Equity market risk (2)
|
$
|
502
|
|
__________________
|
(1)
|
In 2016, the Company reinvested its trading securities portfolio into other asset classes and, at December 31, 2016, the Company no longer held any actively traded securities. The potential losses in estimated fair value presented are for non-trading securities.
|
|
(2)
|
The risk sensitivities derived used a 10% increase to interest rates, a 10% strengthening of the U.S. dollar against foreign currencies, and a 10% increase in equity prices.
|
194
The table below provides additional detail regarding the potential loss in estimated fair value of our interest sensitive financial instruments due to a 10% increase in yield curve by type of asset or liability at:
|
December 31, 2016
|
|||||||||||
|
Notional
Amount
|
Estimated
Fair
Value (1)
|
Assuming a
10% Increase
in the Yield
Curve
|
|||||||||
|
(In millions)
|
|||||||||||
|
Assets
|
|||||||||||
|
Fixed maturity securities
|
$
|
350,889
|
|
$
|
(6,251
|
)
|
|||||
|
Equity securities
|
$
|
3,194
|
|
(1
|
)
|
||||||
|
FVO general account securities
|
611
|
|
(2
|
)
|
|||||||
|
Mortgage loans
|
$
|
75,129
|
|
(687
|
)
|
||||||
|
Policy loans
|
$
|
13,015
|
|
(126
|
)
|
||||||
|
Short-term investments
|
$
|
7,810
|
|
(3
|
)
|
||||||
|
Other invested assets
|
$
|
662
|
|
—
|
|
||||||
|
Cash and cash equivalents
|
$
|
17,877
|
|
—
|
|
||||||
|
Accrued investment income
|
$
|
3,988
|
|
—
|
|
||||||
|
Premiums, reinsurance and other receivables
|
$
|
5,161
|
|
(244
|
)
|
||||||
|
Other assets
|
$
|
269
|
|
(5
|
)
|
||||||
|
Embedded derivatives within asset host contracts (2)
|
$
|
380
|
|
(23
|
)
|
||||||
|
Total assets
|
$
|
(7,342
|
)
|
||||||||
|
Liabilities (3)
|
|||||||||||
|
Policyholder account balances
|
$
|
122,908
|
|
$
|
657
|
|
|||||
|
Payables for collateral under securities loaned and other transactions
|
$
|
33,264
|
|
—
|
|
||||||
|
Short-term debt
|
$
|
242
|
|
—
|
|
||||||
|
Long-term debt
|
$
|
18,016
|
|
382
|
|
||||||
|
Collateral financing arrangements
|
$
|
3,775
|
|
—
|
|
||||||
|
Junior subordinated debt securities
|
$
|
3,982
|
|
105
|
|
||||||
|
Other liabilities
|
$
|
2,028
|
|
41
|
|
||||||
|
Embedded derivatives within liability host contracts (2)
|
$
|
4,105
|
|
621
|
|
||||||
|
Total liabilities
|
$
|
1,806
|
|
||||||||
|
Derivative Instruments
|
|||||||||||
|
Interest rate and interest rate total return swaps
|
$
|
94,365
|
|
$
|
4,507
|
|
$
|
(1,582
|
)
|
||
|
Interest rate floors
|
$
|
14,201
|
|
$
|
178
|
|
(20
|
)
|
|||
|
Interest rate caps
|
$
|
90,400
|
|
$
|
135
|
|
46
|
|
|||
|
Interest rate futures
|
$
|
6,081
|
|
$
|
—
|
|
(60
|
)
|
|||
|
Interest rate options
|
$
|
20,854
|
|
$
|
763
|
|
(126
|
)
|
|||
|
Interest rate forwards
|
$
|
4,645
|
|
$
|
(395
|
)
|
(137
|
)
|
|||
|
Synthetic GICs
|
$
|
5,566
|
|
$
|
—
|
|
—
|
|
|||
|
Foreign currency swaps
|
$
|
42,306
|
|
$
|
958
|
|
(91
|
)
|
|||
|
Foreign currency forwards
|
$
|
18,059
|
|
$
|
(863
|
)
|
(4
|
)
|
|||
|
Currency futures
|
$
|
915
|
|
$
|
—
|
|
—
|
|
|||
|
Currency options
|
$
|
12,493
|
|
$
|
281
|
|
(12
|
)
|
|||
|
Credit default swaps
|
$
|
14,683
|
|
$
|
154
|
|
—
|
|
|||
|
Equity futures
|
$
|
12,494
|
|
$
|
65
|
|
(2
|
)
|
|||
|
Equity index options
|
$
|
54,028
|
|
$
|
(135
|
)
|
(18
|
)
|
|||
|
Equity variance swaps
|
$
|
23,157
|
|
$
|
(533
|
)
|
2
|
|
|||
|
Equity total return swaps
|
$
|
3,901
|
|
$
|
(158
|
)
|
—
|
|
|||
|
Total derivative instruments
|
$
|
(2,004
|
)
|
||||||||
|
Net Change
|
$
|
(7,540
|
)
|
||||||||
|
(1)
|
Separate account assets and liabilities and contractholder-directed unit-linked investments and associated policyholder account balances, which are interest rate sensitive, are not included herein as any interest rate risk is borne by the contractholder. Mortgage loans, FVO general account securities and long-term debt exclude $
136 million
, $8 million and $35 million, respectively, related to CSEs. See Note
8
of the Notes to the Consolidated Financial Statements for information regarding CSEs.
|
195
|
(2)
|
Embedded derivatives are recognized on the consolidated balance sheet in the same caption as the host contract.
|
|
(3)
|
Excludes $
214.4 billion
of liabilities, at carrying value, pursuant to insurance contracts reported within future policy benefits and other policy-related balances. These liabilities would economically offset a significant portion of the net change in fair value of our financial instruments resulting from a 10% increase in the yield curve.
|
Sensitivity to rising interest rates increased by $1.7 billion, or 29%, to $7.5 billion at December 31, 2016 from $5.8 billion at December 31, 2015. The change was primarily due to an increase of $1.1 billion from the use of derivatives, used by the Company as hedges against low interest rates. Sensitivity also increased as a result of increased rates, since the sensitivity is calculated based on a 10% increase in the yield curve, and lengthening of asset durations.
196
The table below provides additional detail regarding the potential loss in estimated fair value of our portfolio due to a 10% increase in the U.S. dollar compared to all foreign currencies at:
|
December 31, 2016
|
|||||||||||
|
Notional
Amount
|
Estimated
Fair
Value (1)
|
Assuming a
10% Increase in the Foreign Exchange Rate |
|||||||||
|
(In millions)
|
|||||||||||
|
Assets
|
|||||||||||
|
Fixed maturity securities
|
$
|
350,889
|
|
$
|
(8,830
|
)
|
|||||
|
Equity securities
|
$
|
3,194
|
|
(79
|
)
|
||||||
|
FVO general account securities
|
611
|
|
(6
|
)
|
|||||||
|
Mortgage loans
|
$
|
75,129
|
|
(745
|
)
|
||||||
|
Policy loans
|
$
|
13,015
|
|
(147
|
)
|
||||||
|
Short-term investments
|
$
|
7,810
|
|
(293
|
)
|
||||||
|
Other invested assets
|
$
|
662
|
|
(157
|
)
|
||||||
|
Cash and cash equivalents
|
$
|
17,877
|
|
(393
|
)
|
||||||
|
Accrued investment income
|
$
|
3,988
|
|
(75
|
)
|
||||||
|
Premiums, reinsurance and other receivables
|
$
|
5,161
|
|
(110
|
)
|
||||||
|
Other assets
|
$
|
269
|
|
(6
|
)
|
||||||
|
Embedded derivatives within asset host contracts (2)
|
$
|
380
|
|
(14
|
)
|
||||||
|
Total assets
|
$
|
(10,855
|
)
|
||||||||
|
Liabilities (3)
|
|||||||||||
|
Policyholder account balances
|
$
|
122,908
|
|
$
|
3,278
|
|
|||||
|
Payables for collateral under securities loaned and other transactions
|
$
|
33,264
|
|
101
|
|
||||||
|
Long-term debt
|
$
|
18,016
|
|
110
|
|
||||||
|
Other liabilities
|
$
|
2,028
|
|
4
|
|
||||||
|
Embedded derivatives within liability host contracts (2)
|
$
|
4,105
|
|
140
|
|
||||||
|
Total liabilities
|
$
|
3,633
|
|
||||||||
|
Derivative Instruments
|
|||||||||||
|
Interest rate and interest rate total return swaps
|
$
|
94,365
|
|
$
|
4,507
|
|
$
|
(67
|
)
|
||
|
Interest rate floors
|
$
|
14,201
|
|
$
|
178
|
|
—
|
|
|||
|
Interest rate caps
|
$
|
90,400
|
|
$
|
135
|
|
—
|
|
|||
|
Interest rate futures
|
$
|
6,081
|
|
$
|
—
|
|
1
|
|
|||
|
Interest rate options
|
$
|
20,854
|
|
$
|
763
|
|
(46
|
)
|
|||
|
Interest rate forwards
|
$
|
4,645
|
|
$
|
(395
|
)
|
—
|
|
|||
|
Synthetic GICs
|
$
|
5,566
|
|
$
|
—
|
|
—
|
|
|||
|
Foreign currency swaps
|
$
|
42,306
|
|
$
|
958
|
|
686
|
|
|||
|
Foreign currency forwards
|
$
|
18,059
|
|
$
|
(863
|
)
|
(558
|
)
|
|||
|
Currency futures
|
$
|
915
|
|
$
|
—
|
|
(90
|
)
|
|||
|
Currency options
|
$
|
12,493
|
|
$
|
281
|
|
472
|
|
|||
|
Credit default swaps
|
$
|
14,683
|
|
$
|
154
|
|
(5
|
)
|
|||
|
Equity futures
|
$
|
12,494
|
|
$
|
65
|
|
4
|
|
|||
|
Equity index options
|
$
|
54,028
|
|
$
|
(135
|
)
|
1
|
|
|||
|
Equity variance swaps
|
$
|
23,157
|
|
$
|
(533
|
)
|
—
|
|
|||
|
Equity total return swaps
|
$
|
3,901
|
|
$
|
(158
|
)
|
1
|
|
|||
|
Total derivative instruments
|
$
|
399
|
|
||||||||
|
Net Change
|
$
|
(6,823
|
)
|
||||||||
__________________
|
(1)
|
Does not necessarily represent those financial instruments solely subject to foreign currency exchange rate risk. Separate account assets and liabilities and contractholder-directed unit-linked investments and associated policyholder account balances, which are foreign currency exchange rate sensitive, are not included herein as any foreign currency exchange rate risk is borne by the contractholder. Mortgage loans, FVO general securities and long-term debt exclude $
136 million
, $8 million and $35 million, respectively, related to CSEs. See Note
8
of the Notes to Consolidated Financial Statements for information regarding CSEs.
|
197
|
(2)
|
Embedded derivatives are recognized on the consolidated balance sheet in the same caption as the host contract.
|
|
(3)
|
Excludes $
214.4 billion
of liabilities, at carrying value, pursuant to insurance contracts reported within future policy benefits and other policy-related balances. These liabilities would economically offset a significant portion of the net change in fair value of our financial instruments resulting from a 10% increase in foreign currency exchange rates.
|
Sensitivity to foreign currency exchange rates increased by $1.2 billion, or 20%, to $6.8 billion at December 31, 2016 from $5.7 billion at December 31, 2015. This change was primarily due to an increase in the fair value of foreign currency assets which may be backing foreign currency liabilities that are not included in this analysis.
The table below provides additional detail regarding the potential loss in estimated fair value of our portfolio due to a 10% increase in equity prices by type of asset or liability at:
|
|
December 31, 2016
|
||||||||||
|
|
Notional
Amount
|
Estimated
Fair Value (1) |
Assuming a
10% Increase
in Equity
Prices
|
||||||||
|
|
(In millions)
|
||||||||||
|
Assets
|
|||||||||||
|
Equity securities
|
$
|
3,194
|
|
$
|
319
|
|
|||||
|
Embedded derivatives within asset host contracts (2)
|
$
|
380
|
|
(21
|
)
|
||||||
|
Total assets
|
$
|
298
|
|
||||||||
|
Liabilities
|
|||||||||||
|
Policyholder account balances
|
$
|
122,908
|
|
$
|
—
|
|
|||||
|
Embedded derivatives within liability host contracts (2)
|
$
|
4,105
|
|
1,001
|
|
||||||
|
Total liabilities
|
$
|
1,001
|
|
||||||||
|
Derivative Instruments
|
|||||||||||
|
Interest rate and interest rate total return swaps
|
$
|
94,365
|
|
$
|
4,507
|
|
$
|
—
|
|
||
|
Interest rate floors
|
$
|
14,201
|
|
$
|
178
|
|
—
|
|
|||
|
Interest rate caps
|
$
|
90,400
|
|
$
|
135
|
|
—
|
|
|||
|
Interest rate futures
|
$
|
6,081
|
|
$
|
—
|
|
—
|
|
|||
|
Interest rate options
|
$
|
20,854
|
|
$
|
763
|
|
—
|
|
|||
|
Interest rate forwards
|
$
|
4,645
|
|
$
|
(395
|
)
|
—
|
|
|||
|
Synthetic GICs
|
$
|
5,566
|
|
$
|
—
|
|
—
|
|
|||
|
Foreign currency swaps
|
$
|
42,306
|
|
$
|
958
|
|
—
|
|
|||
|
Foreign currency forwards
|
$
|
18,059
|
|
$
|
(863
|
)
|
—
|
|
|||
|
Currency futures
|
$
|
915
|
|
$
|
—
|
|
—
|
|
|||
|
Currency options
|
$
|
12,493
|
|
$
|
281
|
|
—
|
|
|||
|
Credit default swaps
|
$
|
14,683
|
|
$
|
154
|
|
—
|
|
|||
|
Equity futures
|
$
|
12,494
|
|
$
|
65
|
|
(1,205
|
)
|
|||
|
Equity index options
|
$
|
54,028
|
|
$
|
(135
|
)
|
(183
|
)
|
|||
|
Equity variance swaps
|
$
|
23,157
|
|
$
|
(533
|
)
|
15
|
|
|||
|
Equity total return swaps
|
$
|
3,901
|
|
$
|
(158
|
)
|
(428
|
)
|
|||
|
Total derivative instruments
|
$
|
(1,801
|
)
|
||||||||
|
Net Change
|
$
|
(502
|
)
|
||||||||
__________________
|
(1)
|
Does not necessarily represent those financial instruments solely subject to equity price risk. Additionally, separate account assets and liabilities and contractholder-directed unit-linked investments and associated policyholder account balances, which are equity market sensitive, are not included herein as any equity market risk is borne by the contractholder.
|
|
(2)
|
Embedded derivatives are recognized on the consolidated balance sheet in the same caption as the host contract.
|
Sensitivity to rising equity prices increased by $483 million to $502 million at December 31, 2016 from $19 million at December 31, 2015. This increase was primarily due to the expansion of our macro hedge programs, which we use as hedges against equity declines.
198
Index to Consolidated Financial Statements, Notes and Schedules
|
Page
|
|
|
Financial Statements at December 31, 2016 and 2015 and for the Years Ended December 31, 2016, 2015 and 2014:
|
|
|
Financial Statement Schedules at December 31, 2016 and 2015 and for the Years Ended December 31, 2016, 2015 and 2014:
|
|
199
REPORT OF INDEPENDENT REGISTERED PUBLIC ACCOUNTING FIRM
To the Board of Directors and Stockholders of
MetLife, Inc.
New York, New York
We have audited the accompanying consolidated balance sheets of MetLife, Inc. and subsidiaries (the “Company”) as of December 31,
2016
and
2015
, and the related consolidated statements of operations, comprehensive income (loss), equity, and cash flows for each of the three years in the period ended December 31,
2016
. Our audits also included the financial statement schedules listed in the Index to Consolidated Financial Statements, Notes and Schedules. These consolidated financial statements and financial statement schedules are the responsibility of the Company’s management. Our responsibility is to express an opinion on the consolidated financial statements and financial statement schedules based on our audits.
We conducted our audits in accordance with the standards of the Public Company Accounting Oversight Board (United States). Those standards require that we plan and perform the audit to obtain reasonable assurance about whether the consolidated financial statements are free of material misstatement. An audit includes examining, on a test basis, evidence supporting the amounts and disclosures in the consolidated financial statements. An audit also includes assessing the accounting principles used and significant estimates made by management, as well as evaluating the overall financial statement presentation. We believe that our audits provide a reasonable basis for our opinion.
In our opinion, such consolidated financial statements present fairly, in all material respects, the financial position of MetLife, Inc. and subsidiaries as of December 31,
2016
and
2015
, and the results of their operations and their cash flows for each of the three years in the period ended December 31,
2016
, in conformity with accounting principles generally accepted in the United States of America. Also, in our opinion, such financial statement schedules, when considered in relation to the basic consolidated financial statements taken as a whole, present fairly, in all material respects, the information set forth therein.
We have also audited, in accordance with the standards of the Public Company Accounting Oversight Board (United States), the Company’s internal control over financial reporting as of December 31,
2016
, based on the criteria established in
Internal Control—Integrated Framework (2013)
issued by the Committee of Sponsoring Organizations of the Treadway Commission, and our report dated February 28, 2017, expressed an unqualified opinion on the Company’s internal control over financial reporting.
/s/ DELOITTE & TOUCHE LLP
New York, New York
February 28, 2017
200
MetLife, Inc.
Consolidated Balance Sheets
December 31,
2016
and
2015
(In millions, except share and per share data)
|
2016
|
2015
|
|||||||
|
Assets
|
||||||||
|
Investments:
|
||||||||
|
Fixed maturity securities available-for-sale, at estimated fair value (amortized cost: $330,354 and $332,964, respectively; includes $3,422 and $4,277, respectively, relating to variable interest entities)
|
$
|
350,889
|
|
$
|
351,402
|
|
||
|
Equity securities available-for-sale, at estimated fair value (cost: $2,744 and $2,997, respectively)
|
3,194
|
|
3,321
|
|
||||
|
Fair value option and trading securities, at estimated fair value (includes $0 and $404, respectively, of actively traded securities; and $8 and $13, respectively, relating to variable interest entities)
|
13,923
|
|
15,024
|
|
||||
|
Mortgage loans (net of valuation allowances of $344 and $318, respectively; includes $136 and $172, respectively, at estimated fair value, relating to variable interest entities; includes $566 and $314, respectively, under the fair value option)
|
74,545
|
|
67,102
|
|
||||
|
Policy loans (includes $0 and $4, respectively, relating to variable interest entities)
|
11,028
|
|
11,258
|
|
||||
|
Real estate and real estate joint ventures (includes $59 and $47, respectively, of real estate held-for-sale)
|
9,041
|
|
8,433
|
|
||||
|
Other limited partnership interests (includes $14 and $27, respectively, relating to variable interest entities)
|
6,778
|
|
7,096
|
|
||||
|
Short-term investments, principally at estimated fair value (includes $0 and $26, respectively, relating to variable interest entities)
|
7,810
|
|
9,299
|
|
||||
|
Other invested assets, principally at estimated fair value (includes $31 and $43, respectively, relating to variable interest entities)
|
23,185
|
|
22,524
|
|
||||
|
Total investments
|
500,393
|
|
495,459
|
|
||||
|
Cash and cash equivalents, principally at estimated fair value (includes $1 and $85, respectively, relating to variable interest entities)
|
17,877
|
|
12,752
|
|
||||
|
Accrued investment income (includes $1 and $23, respectively, relating to variable interest entities)
|
3,988
|
|
3,988
|
|
||||
|
Premiums, reinsurance and other receivables (includes $2 and $21, respectively, relating to variable interest entities)
|
26,081
|
|
22,702
|
|
||||
|
Deferred policy acquisition costs and value of business acquired (includes $0 and $240, respectively, relating to variable interest entities)
|
24,798
|
|
24,130
|
|
||||
|
Current income tax recoverable
|
20
|
|
161
|
|
||||
|
Goodwill
|
9,220
|
|
9,477
|
|
||||
|
Other assets (includes $3 and $148, respectively, relating to variable interest entities)
|
7,767
|
|
7,666
|
|
||||
|
Separate account assets (includes $0 and $1,022, respectively, relating to variable interest entities)
|
308,620
|
|
301,598
|
|
||||
|
Total assets
|
$
|
898,764
|
|
$
|
877,933
|
|
||
|
Liabilities and Equity
|
||||||||
|
Liabilities
|
||||||||
|
Future policy benefits (includes $0 and $716, respectively, relating to variable interest entities)
|
$
|
199,971
|
|
$
|
191,879
|
|
||
|
Policyholder account balances (includes $0 and $21, respectively, relating to variable interest entities)
|
210,235
|
|
202,722
|
|
||||
|
Other policy-related balances (includes $0 and $238, respectively, relating to variable interest entities)
|
14,386
|
|
14,255
|
|
||||
|
Policyholder dividends payable
|
708
|
|
720
|
|
||||
|
Policyholder dividend obligation
|
1,931
|
|
1,783
|
|
||||
|
Payables for collateral under securities loaned and other transactions
|
33,264
|
|
36,871
|
|
||||
|
Short-term debt
|
242
|
|
100
|
|
||||
|
Long-term debt (includes $35 and $63, respectively, at estimated fair value, relating to variable interest entities)
|
16,502
|
|
18,023
|
|
||||
|
Collateral financing arrangements
|
4,071
|
|
4,139
|
|
||||
|
Junior subordinated debt securities
|
3,169
|
|
3,194
|
|
||||
|
Deferred income tax liability
|
9,367
|
|
10,592
|
|
||||
|
Other liabilities (includes $0 and $81, respectively, relating to variable interest entities)
|
28,818
|
|
23,561
|
|
||||
|
Separate account liabilities (includes $0 and $1,022, respectively, relating to variable interest entities)
|
308,620
|
|
301,598
|
|
||||
|
Total liabilities
|
831,284
|
|
809,437
|
|
||||
|
Contingencies, Commitments and Guarantees (Note 21)
|
|
|
||||||
|
Redeemable noncontrolling interests in partially-owned consolidated subsidiaries
|
—
|
|
77
|
|
||||
|
Equity
|
||||||||
|
MetLife, Inc.’s stockholders’ equity:
|
||||||||
|
Preferred stock, par value $0.01 per share; $2,100 aggregate liquidation preference
|
—
|
|
—
|
|
||||
|
Common stock, par value $0.01 per share; 3,000,000,000 shares authorized; 1,164,029,985 and 1,159,590,766 shares issued, respectively; 1,095,519,005 and 1,098,028,525 shares outstanding, respectively
|
12
|
|
12
|
|
||||
|
Additional paid-in capital
|
30,944
|
|
30,749
|
|
||||
|
Retained earnings
|
34,480
|
|
35,519
|
|
||||
|
Treasury stock, at cost; 68,510,980 and 61,562,241 shares, respectively
|
(3,474
|
)
|
(3,102
|
)
|
||||
|
Accumulated other comprehensive income (loss)
|
5,347
|
|
4,771
|
|
||||
|
Total MetLife, Inc.’s stockholders’ equity
|
67,309
|
|
67,949
|
|
||||
|
Noncontrolling interests
|
171
|
|
470
|
|
||||
|
Total equity
|
67,480
|
|
68,419
|
|
||||
|
Total liabilities and equity
|
$
|
898,764
|
|
$
|
877,933
|
|
||
See accompanying notes to the consolidated financial statements.
201
MetLife, Inc.
For the Years Ended December 31, 2016, 2015 and 2014
(In millions, except per share data)
|
2016
|
2015
|
2014
|
||||||||||
|
Revenues
|
||||||||||||
|
Premiums
|
$
|
39,153
|
|
$
|
38,545
|
|
$
|
39,067
|
|
|||
|
Universal life and investment-type product policy fees
|
9,206
|
|
9,507
|
|
9,946
|
|
||||||
|
Net investment income
|
19,947
|
|
19,281
|
|
21,153
|
|
||||||
|
Other revenues
|
1,759
|
|
1,983
|
|
2,030
|
|
||||||
|
Net investment gains (losses):
|
||||||||||||
|
Other-than-temporary impairments on fixed maturity securities
|
(115
|
)
|
(84
|
)
|
(43
|
)
|
||||||
|
Other-than-temporary impairments on fixed maturity securities transferred to other comprehensive income (loss)
|
(14
|
)
|
(6
|
)
|
(17
|
)
|
||||||
|
Other net investment gains (losses)
|
300
|
|
687
|
|
(137
|
)
|
||||||
|
Total net investment gains (losses)
|
171
|
|
597
|
|
(197
|
)
|
||||||
|
Net derivative gains (losses)
|
(6,760
|
)
|
38
|
|
1,317
|
|
||||||
|
Total revenues
|
63,476
|
|
69,951
|
|
73,316
|
|
||||||
|
Expenses
|
||||||||||||
|
Policyholder benefits and claims
|
40,804
|
|
38,714
|
|
39,102
|
|
||||||
|
Interest credited to policyholder account balances
|
6,282
|
|
5,610
|
|
6,943
|
|
||||||
|
Policyholder dividends
|
1,256
|
|
1,388
|
|
1,376
|
|
||||||
|
Goodwill impairment
|
260
|
|
—
|
|
—
|
|
||||||
|
Other expenses
|
15,069
|
|
16,769
|
|
17,091
|
|
||||||
|
Total expenses
|
63,671
|
|
62,481
|
|
64,512
|
|
||||||
|
Income (loss) from continuing operations before provision for income tax
|
(195
|
)
|
7,470
|
|
8,804
|
|
||||||
|
Provision for income tax expense (benefit)
|
(999
|
)
|
2,148
|
|
2,465
|
|
||||||
|
Income (loss) from continuing operations, net of income tax
|
804
|
|
5,322
|
|
6,339
|
|
||||||
|
Income (loss) from discontinued operations, net of income tax
|
—
|
|
—
|
|
(3
|
)
|
||||||
|
Net income (loss)
|
804
|
|
5,322
|
|
6,336
|
|
||||||
|
Less: Net income (loss) attributable to noncontrolling interests
|
4
|
|
12
|
|
27
|
|
||||||
|
Net income (loss) attributable to MetLife, Inc.
|
800
|
|
5,310
|
|
6,309
|
|
||||||
|
Less: Preferred stock dividends
|
103
|
|
116
|
|
122
|
|
||||||
|
Preferred stock repurchase premium
|
—
|
|
42
|
|
—
|
|
||||||
|
Net income (loss) available to MetLife, Inc.’s common shareholders
|
$
|
697
|
|
$
|
5,152
|
|
$
|
6,187
|
|
|||
|
Income (loss) from continuing operations, net of income tax, available to MetLife, Inc.’s common shareholders per common share:
|
||||||||||||
|
Basic
|
$
|
0.63
|
|
$
|
4.61
|
|
$
|
5.48
|
|
|||
|
Diluted
|
$
|
0.63
|
|
$
|
4.57
|
|
$
|
5.42
|
|
|||
|
Net income (loss) available to MetLife, Inc.’s common shareholders per common share:
|
||||||||||||
|
Basic
|
$
|
0.63
|
|
$
|
4.61
|
|
$
|
5.48
|
|
|||
|
Diluted
|
$
|
0.63
|
|
$
|
4.57
|
|
$
|
5.42
|
|
|||
|
Cash dividends declared per common share
|
$
|
1.575
|
|
$
|
1.475
|
|
$
|
1.325
|
|
|||
See accompanying notes to the consolidated financial statements.
202
MetLife, Inc.
Consolidated Statements of Comprehensive Income (Loss)
For the Years Ended December 31, 2016, 2015 and 2014
(In millions)
|
2016
|
2015
|
2014
|
|||||||||
|
Net income (loss) (1)
|
$
|
804
|
|
$
|
5,322
|
|
$
|
6,336
|
|
||
|
Other comprehensive income (loss):
|
|||||||||||
|
Unrealized investment gains (losses), net of related offsets
|
760
|
|
(7,443
|
)
|
10,103
|
|
|||||
|
Unrealized gains (losses) on derivatives
|
573
|
|
589
|
|
1,386
|
|
|||||
|
Foreign currency translation adjustments
|
(363
|
)
|
(1,624
|
)
|
(1,444
|
)
|
|||||
|
Defined benefit plans adjustment
|
131
|
|
354
|
|
(970
|
)
|
|||||
|
Other comprehensive income (loss), before income tax
|
1,101
|
|
(8,124
|
)
|
9,075
|
|
|||||
|
Income tax (expense) benefit related to items of other comprehensive income (loss)
|
(437
|
)
|
2,266
|
|
(3,528
|
)
|
|||||
|
Other comprehensive income (loss), net of income tax
|
664
|
|
(5,858
|
)
|
5,547
|
|
|||||
|
Comprehensive income (loss)
|
1,468
|
|
(536
|
)
|
11,883
|
|
|||||
|
Less: Comprehensive income (loss) attributable to noncontrolling interest, net of income tax
|
92
|
|
32
|
|
29
|
|
|||||
|
Comprehensive income (loss) attributable to MetLife, Inc.
|
$
|
1,376
|
|
$
|
(568
|
)
|
$
|
11,854
|
|
||
__________________
|
(1)
|
Net income (loss) attributable to noncontrolling interests did not exclude any gains (losses) of redeemable noncontrolling interests in partially-owned consolidated subsidiaries for the year ended December 31, 2016. Net income (loss) attributable to noncontrolling interests excludes losses of redeemable noncontrolling interests in partially-owned consolidated subsidiaries of less than
$1 million
for the year ended December 31, 2015. Net income (loss) attributable to noncontrolling interests excludes gains of redeemable noncontrolling interests in partially-owned consolidated subsidiaries of less than
$1 million
for the year ended December 31, 2014.
|
See accompanying notes to the consolidated financial statements.
203
MetLife, Inc.
Consolidated Statements of Equity
For the Years Ended
December 31, 2016
,
2015
and
2014
(In millions)
|
Preferred
Stock
|
Common
Stock
|
Additional
Paid-in
Capital
|
Retained
Earnings
|
Treasury
Stock
at Cost
|
Accumulated
Other
Comprehensive
Income (Loss)
|
Total
MetLife, Inc.’s
Stockholders’
Equity
|
Noncontrolling
Interests (1)
|
Total
Equity
|
||||||||||||||||||||||||||||
|
Balance at December 31, 2013
|
$
|
1
|
|
$
|
11
|
|
$
|
29,277
|
|
$
|
27,332
|
|
$
|
(172
|
)
|
$
|
5,104
|
|
$
|
61,553
|
|
$
|
543
|
|
$
|
62,096
|
|
|||||||||
|
Treasury stock acquired in connection with share repurchases
|
(1,000
|
)
|
(1,000
|
)
|
(1,000
|
)
|
||||||||||||||||||||||||||||||
|
Common stock issuance
|
1
|
|
999
|
|
1,000
|
|
1,000
|
|
||||||||||||||||||||||||||||
|
Stock-based compensation
|
267
|
|
267
|
|
267
|
|
||||||||||||||||||||||||||||||
|
Dividends on preferred stock
|
(122
|
)
|
(122
|
)
|
(122
|
)
|
||||||||||||||||||||||||||||||
|
Dividends on common stock
|
(1,499
|
)
|
(1,499
|
)
|
(1,499
|
)
|
||||||||||||||||||||||||||||||
|
Change in equity of noncontrolling interests
|
—
|
|
(65
|
)
|
(65
|
)
|
||||||||||||||||||||||||||||||
|
Net income (loss)
|
6,309
|
|
6,309
|
|
27
|
|
6,336
|
|
||||||||||||||||||||||||||||
|
Other comprehensive income (loss), net of income tax
|
5,545
|
|
5,545
|
|
2
|
|
5,547
|
|
||||||||||||||||||||||||||||
|
Balance at December 31, 2014
|
1
|
|
12
|
|
30,543
|
|
32,020
|
|
(1,172
|
)
|
10,649
|
|
72,053
|
|
507
|
|
72,560
|
|
||||||||||||||||||
|
Repurchase of preferred stock
|
(1
|
)
|
(1,459
|
)
|
(1,460
|
)
|
(1,460
|
)
|
||||||||||||||||||||||||||||
|
Preferred stock repurchase premium
|
(42
|
)
|
(42
|
)
|
(42
|
)
|
||||||||||||||||||||||||||||||
|
Preferred stock issuance
|
1,483
|
|
1,483
|
|
1,483
|
|
||||||||||||||||||||||||||||||
|
Treasury stock acquired in connection with share repurchases
|
(1,930
|
)
|
(1,930
|
)
|
(1,930
|
)
|
||||||||||||||||||||||||||||||
|
Stock-based compensation
|
182
|
|
182
|
|
182
|
|
||||||||||||||||||||||||||||||
|
Dividends on preferred stock
|
(116
|
)
|
(116
|
)
|
(116
|
)
|
||||||||||||||||||||||||||||||
|
Dividends on common stock
|
(1,653
|
)
|
(1,653
|
)
|
(1,653
|
)
|
||||||||||||||||||||||||||||||
|
Change in equity of noncontrolling interests
|
—
|
|
(69
|
)
|
(69
|
)
|
||||||||||||||||||||||||||||||
|
Net income (loss)
|
5,310
|
|
5,310
|
|
12
|
|
5,322
|
|
||||||||||||||||||||||||||||
|
Other comprehensive income (loss), net of income tax
|
(5,878
|
)
|
(5,878
|
)
|
20
|
|
(5,858
|
)
|
||||||||||||||||||||||||||||
|
Balance at December 31, 2015
|
—
|
|
12
|
|
30,749
|
|
35,519
|
|
(3,102
|
)
|
4,771
|
|
67,949
|
|
470
|
|
68,419
|
|
||||||||||||||||||
|
Treasury stock acquired in connection with share repurchases
|
(372
|
)
|
(372
|
)
|
(372
|
)
|
||||||||||||||||||||||||||||||
|
Stock-based compensation
|
195
|
|
195
|
|
195
|
|
||||||||||||||||||||||||||||||
|
Dividends on preferred stock
|
(103
|
)
|
(103
|
)
|
(103
|
)
|
||||||||||||||||||||||||||||||
|
Dividends on common stock
|
(1,736
|
)
|
(1,736
|
)
|
(1,736
|
)
|
||||||||||||||||||||||||||||||
|
Change in equity of noncontrolling interests
|
—
|
|
(391
|
)
|
(391
|
)
|
||||||||||||||||||||||||||||||
|
Net income (loss)
|
800
|
|
800
|
|
4
|
|
804
|
|
||||||||||||||||||||||||||||
|
Other comprehensive income (loss), net of income tax
|
576
|
|
576
|
|
88
|
|
664
|
|
||||||||||||||||||||||||||||
|
Balance at December 31, 2016
|
$
|
—
|
|
$
|
12
|
|
$
|
30,944
|
|
$
|
34,480
|
|
$
|
(3,474
|
)
|
$
|
5,347
|
|
$
|
67,309
|
|
$
|
171
|
|
$
|
67,480
|
|
|||||||||
__________________
|
(1)
|
Net income (loss) attributable to noncontrolling interests did not exclude any gains (losses) of redeemable noncontrolling interests in partially-owned consolidated subsidiaries for the year ended December 31, 2016. Net income (loss) attributable to noncontrolling interests excludes losses of redeemable noncontrolling interests in partially-owned consolidated subsidiaries of less than
$1 million
for the year ended December 31, 2015. Net income (loss) attributable to noncontrolling interests excludes gains of redeemable noncontrolling interests in partially-owned consolidated subsidiaries of less than
$1 million
for the year ended December 31, 2014.
|
See accompanying notes to the consolidated financial statements.
204
MetLife, Inc.
For the Years Ended
December 31, 2016
,
2015
and
2014
(In millions)
|
2016
|
2015
|
2014
|
|||||||||
|
Cash flows from operating activities
|
|||||||||||
|
Net income (loss)
|
$
|
804
|
|
$
|
5,322
|
|
$
|
6,336
|
|
||
|
Adjustments to reconcile net income (loss) to net cash provided by (used in) operating activities:
|
|||||||||||
|
Depreciation and amortization expenses
|
652
|
|
693
|
|
713
|
|
|||||
|
Amortization of premiums and accretion of discounts associated with investments, net
|
(1,110
|
)
|
(1,141
|
)
|
(611
|
)
|
|||||
|
(Gains) losses on investments and from sales of businesses, net
|
(171
|
)
|
(597
|
)
|
202
|
|
|||||
|
(Gains) losses on derivatives, net
|
8,963
|
|
1,451
|
|
(21
|
)
|
|||||
|
(Income) loss from equity method investments, net of dividends or distributions
|
475
|
|
481
|
|
327
|
|
|||||
|
Interest credited to policyholder account balances
|
6,282
|
|
5,610
|
|
6,943
|
|
|||||
|
Universal life and investment-type product policy fees
|
(9,206
|
)
|
(9,507
|
)
|
(9,946
|
)
|
|||||
|
Goodwill impairment
|
260
|
|
—
|
|
—
|
|
|||||
|
Change in fair value option and trading securities
|
111
|
|
784
|
|
(739
|
)
|
|||||
|
Change in accrued investment income
|
(31
|
)
|
138
|
|
207
|
|
|||||
|
Change in premiums, reinsurance and other receivables
|
(2,125
|
)
|
(837
|
)
|
(650
|
)
|
|||||
|
Change in deferred policy acquisition costs and value of business acquired, net
|
(949
|
)
|
491
|
|
1,134
|
|
|||||
|
Change in income tax
|
(1,557
|
)
|
825
|
|
2,075
|
|
|||||
|
Change in other assets
|
3,248
|
|
2,752
|
|
2,573
|
|
|||||
|
Change in insurance-related liabilities and policy-related balances
|
6,279
|
|
6,366
|
|
5,847
|
|
|||||
|
Change in other liabilities
|
2,766
|
|
1,134
|
|
1,885
|
|
|||||
|
Other, net
|
136
|
|
164
|
|
101
|
|
|||||
|
Net cash provided by (used in) operating activities
|
14,827
|
|
14,129
|
|
16,376
|
|
|||||
|
Cash flows from investing activities
|
|||||||||||
|
Sales, maturities and repayments of:
|
|||||||||||
|
Fixed maturity securities
|
150,658
|
|
146,732
|
|
118,526
|
|
|||||
|
Equity securities
|
1,241
|
|
1,117
|
|
490
|
|
|||||
|
Mortgage loans
|
12,977
|
|
12,647
|
|
14,128
|
|
|||||
|
Real estate and real estate joint ventures
|
826
|
|
3,256
|
|
1,012
|
|
|||||
|
Other limited partnership interests
|
1,542
|
|
1,827
|
|
823
|
|
|||||
|
Purchases of:
|
|||||||||||
|
Fixed maturity securities
|
(146,397
|
)
|
(148,799
|
)
|
(130,197
|
)
|
|||||
|
Equity securities
|
(1,006
|
)
|
(996
|
)
|
(530
|
)
|
|||||
|
Mortgage loans
|
(21,017
|
)
|
(20,449
|
)
|
(17,464
|
)
|
|||||
|
Real estate and real estate joint ventures
|
(1,515
|
)
|
(1,298
|
)
|
(2,282
|
)
|
|||||
|
Other limited partnership interests
|
(1,313
|
)
|
(1,429
|
)
|
(1,764
|
)
|
|||||
|
Cash received in connection with freestanding derivatives
|
4,259
|
|
2,690
|
|
1,760
|
|
|||||
|
Cash paid in connection with freestanding derivatives
|
(6,963
|
)
|
(4,211
|
)
|
(4,003
|
)
|
|||||
|
Cash received under repurchase agreements
|
—
|
|
199
|
|
—
|
|
|||||
|
Cash paid under repurchase agreements
|
—
|
|
(199
|
)
|
—
|
|
|||||
|
Cash received under reverse repurchase agreements
|
—
|
|
199
|
|
—
|
|
|||||
|
Cash paid under reverse repurchase agreements
|
—
|
|
(199
|
)
|
—
|
|
|||||
|
Sales of businesses, net of cash and cash equivalents disposed of $135, $0 and $323, respectively
|
156
|
|
—
|
|
436
|
|
|||||
|
Purchases of investments in operating joint ventures
|
(39
|
)
|
—
|
|
(277
|
)
|
|||||
|
Net change in policy loans
|
195
|
|
287
|
|
(27
|
)
|
|||||
|
Net change in short-term investments
|
1,270
|
|
(777
|
)
|
5,167
|
|
|||||
|
Net change in other invested assets
|
(267
|
)
|
(936
|
)
|
(512
|
)
|
|||||
|
Other, net
|
(457
|
)
|
(59
|
)
|
(341
|
)
|
|||||
|
Net cash provided by (used in) investing activities
|
$
|
(5,850
|
)
|
$
|
(10,398
|
)
|
$
|
(15,055
|
)
|
||
See accompanying notes to the consolidated financial statements.
205
MetLife, Inc.
Consolidated Statements of Cash Flows — (continued)
For the Years Ended
December 31, 2016
,
2015
and
2014
(In millions)
|
2016
|
2015
|
2014
|
|||||||||
|
Cash flows from financing activities
|
|||||||||||
|
Policyholder account balances:
|
|||||||||||
|
Deposits
|
$
|
88,188
|
|
$
|
92,904
|
|
$
|
89,520
|
|
||
|
Withdrawals
|
(83,263
|
)
|
(94,621
|
)
|
(88,037
|
)
|
|||||
|
Net change in payables for collateral under securities loaned and other transactions
|
(3,636
|
)
|
1,544
|
|
5,031
|
|
|||||
|
Net change in short-term debt
|
38
|
|
—
|
|
(75
|
)
|
|||||
|
Long-term debt issued
|
—
|
|
3,893
|
|
1,000
|
|
|||||
|
Long-term debt repaid
|
(1,279
|
)
|
(1,438
|
)
|
(2,862
|
)
|
|||||
|
Collateral financing arrangements repaid
|
(68
|
)
|
(57
|
)
|
—
|
|
|||||
|
Financing element on certain derivative instruments, net
|
(1,367
|
)
|
181
|
|
(747
|
)
|
|||||
|
Common stock issued, net of issuance costs
|
—
|
|
—
|
|
1,000
|
|
|||||
|
Treasury stock acquired in connection with share repurchases
|
(372
|
)
|
(1,930
|
)
|
(1,000
|
)
|
|||||
|
Preferred stock issued, net of issuance costs
|
—
|
|
1,483
|
|
—
|
|
|||||
|
Repurchase of preferred stock
|
—
|
|
(1,460
|
)
|
—
|
|
|||||
|
Preferred stock repurchase premium
|
—
|
|
(42
|
)
|
—
|
|
|||||
|
Dividends on preferred stock
|
(103
|
)
|
(116
|
)
|
(122
|
)
|
|||||
|
Dividends on common stock
|
(1,736
|
)
|
(1,653
|
)
|
(1,499
|
)
|
|||||
|
Other, net
|
48
|
|
17
|
|
47
|
|
|||||
|
Net cash provided by (used in) financing activities
|
(3,550
|
)
|
(1,295
|
)
|
2,256
|
|
|||||
|
Effect of change in foreign currency exchange rates on cash and cash equivalents balances
|
(302
|
)
|
(492
|
)
|
(354
|
)
|
|||||
|
Change in cash and cash equivalents
|
5,125
|
|
1,944
|
|
3,223
|
|
|||||
|
Cash and cash equivalents, beginning of year
|
12,752
|
|
10,808
|
|
7,585
|
|
|||||
|
Cash and cash equivalents, end of year
|
$
|
17,877
|
|
$
|
12,752
|
|
$
|
10,808
|
|
||
|
Supplemental disclosures of cash flow information:
|
|||||||||||
|
Net cash paid (received) for:
|
|||||||||||
|
Interest
|
$
|
1,202
|
|
$
|
1,178
|
|
$
|
1,213
|
|
||
|
Income tax
|
$
|
672
|
|
$
|
1,127
|
|
$
|
748
|
|
||
|
Non-cash transactions
|
|||||||||||
|
Fixed maturity securities received in connection with pension risk transfer transactions
|
$
|
985
|
|
$
|
903
|
|
$
|
—
|
|
||
|
Reduction of fixed maturity securities in connection with a reinsurance transaction
|
$
|
224
|
|
$
|
—
|
|
$
|
—
|
|
||
|
Reduction of other invested assets in connection with a reinsurance transaction
|
$
|
676
|
|
$
|
—
|
|
$
|
—
|
|
||
|
Deconsolidation of operating joint venture (Note 8):
|
|||||||||||
|
Reduction of fixed maturity securities
|
$
|
917
|
|
$
|
—
|
|
$
|
—
|
|
||
|
Reduction of noncontrolling interests
|
$
|
373
|
|
$
|
—
|
|
$
|
—
|
|
||
|
Deconsolidation of real estate investment vehicles:
|
|||||||||||
|
Reduction of redeemable noncontrolling interests
|
$
|
—
|
|
$
|
—
|
|
$
|
774
|
|
||
|
Reduction of long-term debt
|
$
|
—
|
|
$
|
571
|
|
$
|
413
|
|
||
|
Reduction of real estate and real estate joint ventures
|
$
|
—
|
|
$
|
688
|
|
$
|
1,132
|
|
||
See accompanying notes to the consolidated financial statements.
206
1. Business, Basis of Presentation and Summary of Significant Accounting Policies
Business
“MetLife” and the “Company” refer to MetLife, Inc., a Delaware corporation incorporated in 1999, its subsidiaries and affiliates. MetLife is a global provider of life insurance, annuities, employee benefits and asset management. MetLife is organized into
six
segments: U.S.; Asia; Latin America; Europe, the Middle East and Africa (“EMEA”); MetLife Holdings; and Brighthouse Financial.
Basis of Presentation
The preparation of financial statements in conformity with accounting principles generally accepted in the United States of America (“GAAP”) requires management to adopt accounting policies and make estimates and assumptions that affect amounts reported on the consolidated financial statements. In applying these policies and estimates, management makes subjective and complex judgments that frequently require assumptions about matters that are inherently uncertain. Many of these policies, estimates and related judgments are common in the insurance and financial services industries; others are specific to the Company’s business and operations. Actual results could differ from these estimates.
Consolidation
The accompanying consolidated financial statements include the accounts of MetLife, Inc. and its subsidiaries, as well as partnerships and joint ventures in which the Company has control, and variable interest entities (“VIEs”) for which the Company is the primary beneficiary. Intercompany accounts and transactions have been eliminated.
Prior to January 1, 2016, certain international subsidiaries had a fiscal year cutoff of November 30th. Accordingly, the Company’s consolidated financial statements reflect the assets and liabilities of such subsidiaries as of November 30, 2015 and the operating results of such subsidiaries for the years ended November 30, 2015 and 2014. Effective January 1, 2016, the Company converted its Japan operations to calendar year-end reporting. The elimination of a one-month reporting lag of a subsidiary is considered a change in accounting principle and requires retrospective application. While the Company believes that eliminating the lag in the reporting of its Japan operations was preferable in order to consistently reflect events, economic conditions and global trends on the financial statements, the Company determined that it was impracticable to apply the effects of the lag elimination to financial reporting periods prior to January 1, 2015. The effect of not retroactively applying this change in accounting, however, was not material to the 2015 or 2016 consolidated financial statements. Therefore, the Company reported the cumulative effect of the change in accounting principle in net income for the year ended December 31, 2016 and did not retrospectively apply the effects of this change to prior periods.
Discontinued Operations
The results of operations of a component of the Company that has either been disposed of or is classified as held-for-sale are reported in discontinued operations if certain criteria are met. Effective January 1, 2014, the Company adopted new guidance regarding reporting of discontinued operations for disposals or classifications as held-for-sale that have not been previously reported on the consolidated financial statements. A disposal of a component is reported in discontinued operations if the disposal represents a strategic shift that has or will have a major effect on the Company’s operations and financial results. See “— Adoption of New Accounting Pronouncements.”
Separate Accounts
Separate accounts are established in conformity with insurance laws. Generally, the assets of the separate accounts cannot be used to settle the liabilities that arise from any other business of the Company. Separate account assets are subject to general account claims only to the extent the value of such assets exceeds the separate account liabilities. The Company reports separately, as assets and liabilities, investments held in separate accounts and liabilities of the separate accounts if:
|
•
|
such separate accounts are legally recognized;
|
|
•
|
assets supporting the contract liabilities are legally insulated from the Company’s general account liabilities;
|
|
•
|
investments are directed by the contractholder; and
|
|
•
|
all investment performance, net of contract fees and assessments, is passed through to the contractholder.
|
207
MetLife, Inc.
Notes to the Consolidated Financial Statements — (continued)
1. Business, Basis of Presentation and Summary of Significant Accounting Policies (continued)
The Company reports separate account assets at their fair value which is based on the estimated fair values of the underlying assets comprising the individual separate account portfolios. Investment performance (including investment income, net investment gains (losses) and changes in unrealized gains (losses)) and the corresponding amounts credited to contractholders of such separate accounts are offset within the same line on the statements of operations. Separate accounts credited with a contractual investment return are combined on a line-by-line basis with the Company’s general account assets, liabilities, revenues and expenses and the accounting for these investments is consistent with the methodologies described herein for similar financial instruments held within the general account. Unit-linked separate account investments that are directed by contractholders but do not meet one or more of the other above criteria are included in fair value option (“FVO”) and trading securities.
The Company’s revenues reflect fees charged to the separate accounts, including mortality charges, risk charges, policy administration fees, investment management fees and surrender charges. Such fees are included in universal life and investment-type product policy fees on the statements of operations.
Reclassifications
Certain amounts in the prior years’ consolidated financial statements and related footnotes thereto have been reclassified to conform with the current year presentation as discussed throughout the Notes to the Consolidated Financial Statements.
Summary of Significant Accounting Policies
The following are the Company’s significant accounting policies with references to notes providing additional information on such policies and critical accounting estimates relating to such policies.
|
Accounting Policy
|
Note
|
|
Insurance
|
4
|
|
Deferred Policy Acquisition Costs, Value of Business Acquired and Other Intangibles
|
5
|
|
Reinsurance
|
6
|
|
Investments
|
8
|
|
Derivatives
|
9
|
|
Fair Value
|
10
|
|
Goodwill
|
11
|
|
Employee Benefit Plans
|
18
|
|
Income Tax
|
19
|
|
Litigation Contingencies
|
21
|
Insurance
Future Policy Benefit Liabilities and Policyholder Account Balances
The Company establishes liabilities for amounts payable under insurance policies. Generally, amounts are payable over an extended period of time and related liabilities are calculated as the present value of future expected benefits to be paid, reduced by the present value of future expected premiums. Such liabilities are established based on methods and underlying assumptions in accordance with GAAP and applicable actuarial standards. Principal assumptions used in the establishment of liabilities for future policy benefits are mortality, morbidity, policy lapse, renewal, retirement, disability incidence, disability terminations, investment returns, inflation, expenses and other contingent events as appropriate to the respective product type and geographical area. These assumptions are established at the time the policy is issued and are intended to estimate the experience for the period the policy benefits are payable. Utilizing these assumptions, liabilities are established on a block of business basis. For long duration insurance contracts, assumptions such as mortality, morbidity and interest rates are “locked in” upon the issuance of new business. However, significant adverse changes in experience on such contracts may require the establishment of premium deficiency reserves. Such reserves are determined based on the then current assumptions and do not include a provision for adverse deviation.
208
MetLife, Inc.
Notes to the Consolidated Financial Statements — (continued)
1. Business, Basis of Presentation and Summary of Significant Accounting Policies (continued)
Premium deficiency reserves may also be established for short-duration contracts to provide for expected future losses. These reserves are based on actuarial estimates of the amount of loss inherent in that period, including losses incurred for which claims have not been reported. The provisions for unreported claims are calculated using studies that measure the historical length of time between the incurred date of a claim and its eventual reporting to the Company. Anticipated investment income is considered in the calculation of premium deficiency losses for short-duration contracts.
Liabilities for universal and variable life policies with secondary guarantees (“ULSG”) and paid-up guarantees are determined by estimating the expected value of death benefits payable when the account balance is projected to be zero and recognizing those benefits ratably over the accumulation period based on total expected assessments. The assumptions used in estimating the secondary and paid-up guarantee liabilities are consistent with those used for amortizing deferred policy acquisition costs (“DAC”), and are thus subject to the same variability and risk as further discussed herein. The assumptions of investment performance and volatility for variable products are consistent with historical experience of appropriate underlying equity indices, such as the Standard & Poor’s Global Ratings (“S&P”) 500 Index. The benefits used in calculating the liabilities are based on the average benefits payable over a range of scenarios.
The Company regularly reviews its estimates of liabilities for future policy benefits and compares them with its actual experience. Differences result in changes to the liability balances with related charges or credits to benefit expenses in the period in which the changes occur.
Policyholder account balances relate to contracts or contract features where the Company has no significant insurance risk.
The Company issues directly and assumes through reinsurance certain variable annuity products with guaranteed minimum benefits that provide the policyholder a minimum return based on their initial deposit (i.e., the benefit base) less withdrawals. These guarantees are accounted for as insurance liabilities or as embedded derivatives depending on how and when the benefit is paid. Specifically, a guarantee is accounted for as an embedded derivative if a guarantee is paid without requiring (i) the occurrence of specific insurable event, or (ii) the policyholder to annuitize. Alternatively, a guarantee is accounted for as an insurance liability if the guarantee is paid only upon either (i) the occurrence of a specific insurable event, or (ii) annuitization. In certain cases, a guarantee may have elements of both an insurance liability and an embedded derivative and in such cases the guarantee is split and accounted for under both models.
Guarantees accounted for as insurance liabilities in future policy benefits include guaranteed minimum death benefits (“GMDBs”), the portion of guaranteed minimum income benefits (“GMIBs”) that require annuitization, and the life-contingent portion of guaranteed minimum withdrawal benefits (“GMWBs”).
Guarantees accounted for as embedded derivatives in policyholder account balances include the non life-contingent portion of GMWBs, guaranteed minimum accumulation benefits (“GMABs”) and the portion of GMIBs that do not require annuitization. At inception, the Company attributes to the embedded derivative a portion of the projected future guarantee fees to be collected from the policyholder equal to the present value of projected future guaranteed benefits. Any additional fees represent “excess” fees and are reported in universal life and investment-type product policy fees.
Other Policy-Related Balances
Other policy-related balances include policy and contract claims, unearned revenue liabilities, premiums received in advance, policyholder dividends due and unpaid, policyholder dividends left on deposit and negative value of business acquired.
The liability for policy and contract claims generally relates to incurred but not reported (“IBNR”) death, disability, long-term care and dental claims, as well as claims which have been reported but not yet settled. The liability for these claims is based on the Company’s estimated ultimate cost of settling all claims. The Company derives estimates for the development of IBNR claims principally from analyses of historical patterns of claims by business line. The methods used to determine these estimates are continually reviewed. Adjustments resulting from this continuous review process and differences between estimates and payments for claims are recognized in policyholder benefits and claims expense in the period in which the estimates are changed or payments are made.
The unearned revenue liability relates to universal life-type and investment-type products and represents policy charges for services to be provided in future periods. The charges are deferred as unearned revenue and amortized using the product’s estimated gross profits and margins, similar to DAC as discussed further herein. Such amortization is recorded in universal life and investment-type product policy fees.
209
MetLife, Inc.
Notes to the Consolidated Financial Statements — (continued)
1. Business, Basis of Presentation and Summary of Significant Accounting Policies (continued)
The Company accounts for the prepayment of premiums on its individual life, group life and health contracts as premiums received in advance and applies the cash received to premiums when due.
See “— Deferred Policy Acquisition Costs, Value of Business Acquired and Other Intangibles” for a discussion of negative value of business acquired.
Recognition of Insurance Revenues and Deposits
Premiums related to traditional life, annuity contracts with life contingencies, long-duration accident & health, and credit insurance policies are recognized as revenues when due from policyholders. Policyholder benefits and expenses are provided to recognize profits over the estimated lives of the insurance policies. When premiums are due over a significantly shorter period than the period over which benefits are provided, any excess profit is deferred and recognized into earnings in a constant relationship to insurance in-force or, for annuities, the amount of expected future policy benefit payments.
Premiums related to short-duration non-medical health and disability, accident & health, and certain credit insurance contracts are recognized on a pro rata basis over the applicable contract term.
Deposits related to universal life-type and investment-type products are credited to policyholder account balances. Revenues from such contracts consist of fees for mortality, policy administration and surrender charges and are recorded in universal life and investment-type product policy fees in the period in which services are provided. Amounts that are charged to earnings include interest credited and benefit claims incurred in excess of related policyholder account balances.
Premiums related to property & casualty contracts are recognized as revenue on a pro rata basis over the applicable contract term. Unearned premiums, representing the portion of premium written related to the unexpired coverage, are also included in future policy benefits.
All revenues and expenses are presented net of reinsurance as applicable.
Deferred Policy Acquisition Costs, Value of Business Acquired and Other Intangibles
The Company incurs significant costs in connection with acquiring new and renewal insurance business. Costs that are related directly to the successful acquisition or renewal of insurance contracts are capitalized as DAC. Such costs include:
|
•
|
incremental direct costs of contract acquisition, such as commissions;
|
|
•
|
the portion of an employee’s total compensation and benefits related to time spent selling, underwriting or processing the issuance of new and renewal insurance business only with respect to actual policies acquired or renewed;
|
|
•
|
other essential direct costs that would not have been incurred had a policy not been acquired or renewed; and
|
|
•
|
the costs of direct-response advertising, the primary purpose of which is to elicit sales to customers who could be shown to have responded specifically to the advertising and that results in probable future benefits.
|
All other acquisition-related costs, including those related to general advertising and solicitation, market research, agent training, product development, unsuccessful sales and underwriting efforts, as well as all indirect costs, are expensed as incurred.
Value of business acquired (“VOBA”) is an intangible asset resulting from a business combination that represents the excess of book value over the estimated fair value of acquired insurance, annuity, and investment-type contracts in-force at the acquisition date. The estimated fair value of the acquired liabilities is based on projections, by each block of business, of future policy and contract charges, premiums, mortality and morbidity, separate account performance, surrenders, operating expenses, investment returns, nonperformance risk adjustment and other factors. Actual experience on the purchased business may vary from these projections.
210
MetLife, Inc.
Notes to the Consolidated Financial Statements — (continued)
1. Business, Basis of Presentation and Summary of Significant Accounting Policies (continued)
DAC and VOBA are amortized as follows:
|
Products:
|
In proportion to the following over estimated lives of the contracts:
|
||||
|
•
|
Nonparticipating and non-dividend-paying traditional contracts:
|
Actual and expected future gross premiums.
|
|||
|
•
|
Term insurance
|
||||
|
•
|
Nonparticipating whole life insurance
|
||||
|
•
|
Traditional group life insurance
|
||||
|
•
|
Non-medical health insurance
|
||||
|
•
|
Accident & health insurance
|
||||
|
•
|
Participating, dividend-paying traditional contracts
|
Actual and expected future gross margins.
|
|||
|
•
|
Fixed and variable universal life contracts
|
Actual and expected future gross profits.
|
|||
|
•
|
Fixed and variable deferred annuity contracts
|
||||
|
•
|
Credit insurance contracts
|
Actual and future earned premiums.
|
|||
|
•
|
Property & casualty insurance contracts
|
||||
|
•
|
Other short-duration contracts
|
||||
See Note
5
for additional information on DAC and VOBA amortization. Amortization of DAC and VOBA is included in other expenses.
The recovery of DAC and VOBA is dependent upon the future profitability of the related business. DAC and VOBA are aggregated on the financial statements for reporting purposes.
The Company generally has two different types of sales inducements which are included in other assets: (i) the policyholder receives a bonus whereby the policyholder’s initial account balance is increased by an amount equal to a specified percentage of the customer’s deposit; and (ii) the policyholder receives a higher interest rate using a dollar cost averaging method than would have been received based on the normal general account interest rate credited. The Company defers sales inducements and amortizes them over the life of the policy using the same methodology and assumptions used to amortize DAC. The amortization of sales inducements is included in policyholder benefits and claims. Each year, or more frequently if circumstances indicate a potential recoverability issue exists, the Company reviews deferred sales inducements (“DSI”) to determine the recoverability of the asset.
Value of distribution agreements acquired (“VODA”) is reported in other assets and represents the present value of expected future profits associated with the expected future business derived from the distribution agreements acquired as part of a business combination. Value of customer relationships acquired (“VOCRA”) is also reported in other assets and represents the present value of the expected future profits associated with the expected future business acquired through existing customers of the acquired company or business. The VODA and VOCRA associated with past business combinations are amortized over useful lives ranging from
10
to
40 years
and such amortization is included in other expenses. Each year, or more frequently if circumstances indicate a possible impairment exists, the Company reviews VODA and VOCRA to determine whether the asset is impaired.
For certain acquired blocks of business, the estimated fair value of the in-force contract obligations exceeded the book value of assumed in-force insurance policy liabilities, resulting in negative VOBA, which is presented separately from VOBA as an additional insurance liability. The fair value of the in-force contract obligations is based on projections by each block of business. Negative VOBA is amortized over the policy period in proportion to the approximate consumption of losses included in the liability usually expressed in terms of insurance in-force or account value. Such amortization is recorded as a contra-expense in other expenses.
Reinsurance
For each of its reinsurance agreements, the Company determines whether the agreement provides indemnification against loss or liability relating to insurance risk in accordance with applicable accounting standards. Cessions under reinsurance agreements do not discharge the Company’s obligations as the primary insurer. The Company reviews all contractual features, including those that may limit the amount of insurance risk to which the reinsurer is subject or features that delay the timely reimbursement of claims.
211
MetLife, Inc.
Notes to the Consolidated Financial Statements — (continued)
1. Business, Basis of Presentation and Summary of Significant Accounting Policies (continued)
For reinsurance of existing in-force blocks of long-duration contracts that transfer significant insurance risk, the difference, if any, between the amounts paid (received), and the liabilities ceded (assumed) related to the underlying contracts is considered the net cost of reinsurance at the inception of the reinsurance agreement. The net cost of reinsurance is recorded as an adjustment to DAC and recognized as a component of other expenses on a basis consistent with the way the acquisition costs on the underlying reinsured contracts would be recognized. Subsequent amounts paid (received) on the reinsurance of in-force blocks, as well as amounts paid (received) related to new business, are recorded as ceded (assumed) premiums; and ceded (assumed) premiums, reinsurance and other receivables (future policy benefits) are established.
For prospective reinsurance of short-duration contracts that meet the criteria for reinsurance accounting, amounts paid (received) are recorded as ceded (assumed) premiums and ceded (assumed) unearned premiums. Unearned premiums are reflected as a component of premiums, reinsurance and other receivables (future policy benefits). Such amounts are amortized through earned premiums over the remaining contract period in proportion to the amount of insurance protection provided. For retroactive reinsurance of short-duration contracts that meet the criteria of reinsurance accounting, amounts paid (received) in excess of the related insurance liabilities ceded (assumed) are recognized immediately as a loss and are reported in the appropriate line item within the statement of operations. Any gain on such retroactive agreement is deferred and is amortized as part of DAC, primarily using the recovery method.
Amounts currently recoverable under reinsurance agreements are included in premiums, reinsurance and other receivables and amounts currently payable are included in other liabilities. Assets and liabilities relating to reinsurance agreements with the same reinsurer may be recorded net on the balance sheet, if a right of offset exists within the reinsurance agreement. In the event that reinsurers do not meet their obligations to the Company under the terms of the reinsurance agreements, reinsurance recoverable balances could become uncollectible. In such instances, reinsurance recoverable balances are stated net of allowances for uncollectible reinsurance.
Premiums, fees and policyholder benefits and claims include amounts assumed under reinsurance agreements and are net of reinsurance ceded. Amounts received from reinsurers for policy administration are reported in other revenues. With respect to GMIBs, a portion of the directly written GMIBs are accounted for as insurance liabilities, but the associated reinsurance agreements contain embedded derivatives. These embedded derivatives are included in premiums, reinsurance and other receivables with changes in estimated fair value reported in policyholder benefits and claims.
If the Company determines that a reinsurance agreement does not expose the reinsurer to a reasonable possibility of a significant loss from insurance risk, the Company records the agreement using the deposit method of accounting. Deposits received are included in other liabilities and deposits made are included within premiums, reinsurance and other receivables. As amounts are paid or received, consistent with the underlying contracts, the deposit assets or liabilities are adjusted. Interest on such deposits is recorded as other revenues or other expenses, as appropriate. Periodically, the Company evaluates the adequacy of the expected payments or recoveries and adjusts the deposit asset or liability through other revenues or other expenses, as appropriate.
Investments
Net Investment Income and Net Investment Gains (Losses)
Income from investments is reported within net investment income, unless otherwise stated herein. Gains and losses on sales of investments, impairment losses and changes in valuation allowances are reported within net investment gains (losses), unless otherwise stated herein.
Fixed Maturity and Equity Securities
The majority of the Company’s fixed maturity and equity securities are classified as available-for-sale (“AFS”) and are reported at their estimated fair value. Unrealized investment gains and losses on these securities are recorded as a separate component of other comprehensive income (loss) (“OCI”), net of policy-related amounts and deferred income taxes. All security transactions are recorded on a trade date basis. Investment gains and losses on sales are determined on a specific identification basis.
212
MetLife, Inc.
Notes to the Consolidated Financial Statements — (continued)
1. Business, Basis of Presentation and Summary of Significant Accounting Policies (continued)
Interest income and prepayment fees are recognized when earned. Interest income is recognized using an effective yield method giving effect to amortization of premiums and accretion of discounts, and is
based on the estimated economic life of the securities, which for mortgage-backed and asset-backed securities considers the estimated timing and amount of prepayments of the underlying loans. See
Note 8
“— Investments — Fixed Maturity and Equity Securities AFS — Methodology for Amortization of Premium and Accretion of Discount on Structured Securities.” The amortization of premium and accretion of discount of fixed maturity securities also takes into consideration call and maturity dates.
Dividends on equity securities are recognized when declared.
The Company periodically evaluates fixed maturity and equity securities for impairment. The assessment of whether impairments have occurred is based on management’s case-by-case evaluation of the underlying reasons for the decline in estimated fair value, as well as an analysis of the gross unrealized losses by severity and/or age as described in
Note 8
“— Evaluation of AFS Securities for OTTI and Evaluating Temporarily Impaired AFS Securities.”
For fixed maturity securities in an unrealized loss position, an other-than-temporary impairment (“OTTI”) is recognized in earnings when it is anticipated that the amortized cost will not be recovered. When either: (i) the Company has the intent to sell the security; or (ii) it is more likely than not that the Company will be required to sell the security before recovery, the OTTI recognized in earnings is the entire difference between the security’s amortized cost and estimated fair value. If neither of these conditions exists, the difference between the amortized cost of the security and the present value of projected future cash flows expected to be collected is recognized as an OTTI in earnings (“credit loss”). If the estimated fair value is less than the present value of projected future cash flows expected to be collected, this portion of OTTI related to other-than-credit factors (“noncredit loss”) is recorded in OCI.
With respect to equity securities, the Company considers in its OTTI analysis its intent and ability to hold a particular equity security for a period of time sufficient to allow for the recovery of its estimated fair value to an amount equal to or greater than cost. If a sale decision is made for an equity security and recovery to an amount at least equal to cost prior to the sale is not expected, the security will be deemed to be other-than-temporarily impaired in the period that the sale decision was made and an OTTI loss will be recorded in earnings. The OTTI loss recognized is the entire difference between the security’s cost and its estimated fair value.
FVO and Trading Securities
FVO and trading securities are stated at estimated fair value and include investments for which the FVO has been elected (“FVO Securities”) and investments that are actively purchased and sold (“Actively traded securities”). FVO Securities include:
|
•
|
fixed maturity and equity securities held-for-investment by the general account to support asset and liability management strategies for certain insurance products and investments in certain separate accounts (“FVO general account securities”); and
|
|
•
|
contractholder-directed investments supporting unit-linked variable annuity type liabilities which do not qualify for presentation and reporting as separate account summary total assets and liabilities. These investments are primarily mutual funds and, to a lesser extent, fixed maturity and equity securities, short-term investments and cash and cash equivalents. The investment returns on these investments inure to contractholders and are offset by a corresponding change in Policyholder account balances through interest credited to policyholder account balances (“FVO contractholder-directed unit-linked investments”).
|
Actively traded securities principally include fixed maturity securities and short sale agreement liabilities, which are included in other liabilities.
Changes in estimated fair value of these securities are included in net investment income, except for certain securities included in FVO Securities, where changes are included in net investment gains (losses).
Mortgage Loans
The Company disaggregates its mortgage loan investments into three portfolio segments: commercial, agricultural and residential. The accounting policies that are applicable to all portfolio segments are presented below and the accounting policies related to each of the portfolio segments are included in
Note 8
.
213
MetLife, Inc.
Notes to the Consolidated Financial Statements — (continued)
1. Business, Basis of Presentation and Summary of Significant Accounting Policies (continued)
Mortgage loans are stated at unpaid principal balance, adjusted for any unamortized premium or discount, deferred fees or expenses, and are net of valuation allowances. Interest income and prepayment fees are recognized when earned. Interest income is recognized using an effective yield method giving effect to amortization of premiums and accretion of discounts.
Also included in mortgage loans are commercial mortgage loans held by consolidated securitization entities (“CSEs”) and residential mortgage loans for which the FVO was elected, and which are stated at estimated fair value. Changes in estimated fair value are recognized in net investment gains (losses) for commercial mortgage loans held by CSEs — FVO, and net investment income for residential mortgage loans — FVO.
Policy Loans
Policy loans are stated at unpaid principal balances. Interest income is recorded as earned using the contractual interest rate. Generally, accrued interest is capitalized on the policy’s anniversary date. Valuation allowances are not established for policy loans, as they are fully collateralized by the cash surrender value of the underlying insurance policies. Any unpaid principal and accrued interest is deducted from the cash surrender value or the death benefit prior to settlement of the insurance policy.
Real Estate
Real estate held-for-investment is stated at cost less accumulated depreciation. Depreciation is recorded on a straight-line basis over the estimated useful life of the asset (typically
20
to
55 years
). Rental income is recognized on a straight-line basis over the term of the respective leases. The Company periodically reviews its real estate held-for-investment for impairment and tests for recoverability whenever events or changes in circumstances indicate the carrying value may not be recoverable and exceeds its estimated fair value. Properties whose carrying values are greater than their undiscounted cash flows are written down to their estimated fair value, which is generally computed using the present value of expected future cash flows discounted at a rate commensurate with the underlying risks.
Real estate for which the Company commits to a plan to sell within one year and actively markets in its current condition for a reasonable price in comparison to its estimated fair value is classified as held-for-sale. Real estate held-for-sale is stated at the lower of depreciated cost or estimated fair value less expected disposition costs and is not depreciated.
Real Estate Joint Ventures and Other Limited Partnership Interests
The Company uses the equity method of accounting for equity securities when it has significant influence or at least 20% interest and for real estate joint ventures and other limited partnership interests (“investees”) when it has more than a minor ownership interest or more than a minor influence over the investee’s operations. The Company generally recognizes its share of the investee’s earnings on a three-month lag in instances where the investee’s financial information is not sufficiently timely or when the investee’s reporting period differs from the Company’s reporting period.
The Company uses the cost method of accounting for investments in which it has virtually no influence over the investee’s operations. The Company recognizes distributions on cost method investments when such distributions become payable or received. Because of the nature and structure of these cost method investments, they do not meet the characteristics of an equity security in accordance with applicable accounting standards.
The Company routinely evaluates its equity method and cost method investments for impairment. For equity method investees, the Company considers financial and other information provided by the investee, other known information and inherent risks in the underlying investments, as well as future capital commitments, in determining whether an impairment has occurred. The Company considers its cost method investments for impairment when the carrying value of such investments exceeds the net asset value (“NAV”). The Company takes into consideration the severity and duration of this excess when determining whether the cost method investment is impaired.
Short-term Investments
Short-term investments include securities and other investments with remaining maturities of one year or less, but greater than three months, at the time of purchase and are stated at estimated fair value or amortized cost, which approximates estimated fair value.
214
MetLife, Inc.
Notes to the Consolidated Financial Statements — (continued)
1. Business, Basis of Presentation and Summary of Significant Accounting Policies (continued)
Other Invested Assets
Other invested assets consist principally of the following:
|
•
|
Freestanding derivatives with positive estimated fair values which are described in “— Derivatives” below.
|
|
•
|
Tax credit and renewable energy partnerships which derive a significant source of investment return in the form of income tax credits or other tax incentives. Where tax credits are guaranteed by a creditworthy third party, the investment is accounted for under the effective yield method. Otherwise, the investment is accounted for under the equity method.
|
|
•
|
Leveraged leases which are recorded net of non-recourse debt. Income is recognized by applying the leveraged lease’s estimated rate of return to the net investment in the lease. The Company regularly reviews residual values for impairment.
|
|
•
|
Direct financing leases gross investment is equal to the minimum lease payments plus the unguaranteed residual value. Income is recorded by applying the pre-tax internal rate of return to the investment balance. The Company regularly reviews lease receivables for impairment. Certain direct financing leases are linked to inflation.
|
|
•
|
Funds withheld represent a receivable for amounts contractually withheld by ceding companies in accordance with reinsurance agreements. The Company recognizes interest on funds withheld at rates defined by the terms of the agreement which may be contractually specified or directly related to the underlying investments.
|
|
•
|
Investments in operating joint ventures that engage in insurance underwriting activities are accounted for under the equity method.
|
Securities Lending Program
Securities lending transactions, whereby blocks of securities are loaned to third parties, primarily brokerage firms and commercial banks, are treated as financing arrangements and the associated liability is recorded at the amount of cash received. The Company obtains collateral at the inception of the loan, usually cash, in an amount generally equal to
102%
of the estimated fair value of the securities loaned, and maintains it at a level greater than or equal to
100%
for the duration of the loan. Securities loaned under such transactions may be sold or re-pledged by the transferee. The Company is liable to return to the counterparties the cash collateral received. Security collateral on deposit from counterparties in connection with securities lending transactions may not be sold or re-pledged, unless the counterparty is in default, and is not reflected on the Company’s financial statements. The Company monitors the estimated fair value of the securities loaned on a daily basis and additional collateral is obtained as necessary throughout the duration of the loan. Income and expenses associated with securities lending transactions are reported as investment income and investment expense, respectively, within net investment income.
Repurchase Agreement Transactions
The Company participates in short-term repurchase agreements with unaffiliated financial institutions. Under these agreements, the Company lends fixed maturity securities and receives cash as collateral in an amount generally equal to
85%
to
100%
of the estimated fair value of the securities loaned at the inception of the transaction. The associated liability is recorded at the amount of cash received. The Company monitors the estimated fair value of the collateral and the securities loaned throughout the duration of the transaction and additional collateral is obtained as necessary. Securities loaned under such transactions may be sold or re-pledged by the transferee.
Derivatives
Freestanding Derivatives
Freestanding derivatives are carried on the Company’s balance sheet either as assets within other invested assets or as liabilities within other liabilities at estimated fair value. The Company does not offset the estimated fair value amounts recognized for derivatives executed with the same counterparty under the same master netting agreement.
Accruals on derivatives are generally recorded in accrued investment income or within other liabilities. However, accruals that are not scheduled to settle within one year are included with the derivatives carrying value in other invested assets or other liabilities.
215
MetLife, Inc.
Notes to the Consolidated Financial Statements — (continued)
1. Business, Basis of Presentation and Summary of Significant Accounting Policies (continued)
If a derivative is not designated as an accounting hedge or its use in managing risk does not qualify for hedge accounting, changes in the estimated fair value of the derivative are reported in net derivative gains (losses) except as follows:
|
Statement of Operations Presentation:
|
Derivative:
|
|
|
Policyholder benefits and claims
|
•
|
Economic hedges of variable annuity guarantees included in future policy benefits
|
|
Net investment income
|
•
|
Economic hedges of equity method investments in joint ventures
|
|
•
|
All derivatives held in relation to trading portfolios
|
|
|
•
|
Derivatives held within contractholder-directed unit-linked investments
|
|
Hedge Accounting
To qualify for hedge accounting, at the inception of the hedging relationship, the Company formally documents its risk management objective and strategy for undertaking the hedging transaction, as well as its designation of the hedge. Hedge designation and financial statement presentation of changes in estimated fair value of the hedging derivatives are as follows:
|
•
|
Fair value hedge
(a hedge of the estimated fair value of a recognized asset or liability) - in net derivative gains (losses), consistent with the change in estimated fair value of the hedged item attributable to the designated risk being hedged.
|
|
•
|
Cash flow hedge
(a hedge of a forecasted transaction or of the variability of cash flows to be received or paid related to a recognized asset or liability) - effectiveness in OCI (deferred gains or losses on the derivative are reclassified into the statement of operations when the Company’s earnings are affected by the variability in cash flows of the hedged item); ineffectiveness in net derivative gains (losses).
|
|
•
|
Net investment in a foreign operation hedge
- effectiveness in OCI, consistent with the translation adjustment for the hedged net investment in the foreign operation; ineffectiveness in net derivative gains (losses).
|
The changes in estimated fair values of the hedging derivatives are exclusive of any accruals that are separately reported on the statement of operations within interest income or interest expense to match the location of the hedged item. Accruals on derivatives in net investment hedges are recognized in OCI.
In its hedge documentation, the Company sets forth how the hedging instrument is expected to hedge the designated risks related to the hedged item and sets forth the method that will be used to retrospectively and prospectively assess the hedging instrument’s effectiveness and the method that will be used to measure ineffectiveness. A derivative designated as a hedging instrument must be assessed as being highly effective in offsetting the designated risk of the hedged item. Hedge effectiveness is formally assessed at inception and at least quarterly throughout the life of the designated hedging relationship. Assessments of hedge effectiveness and measurements of ineffectiveness are also subject to interpretation and estimation and different interpretations or estimates may have a material effect on the amount reported in net income.
The Company discontinues hedge accounting prospectively when: (i) it is determined that the derivative is no longer highly effective in offsetting changes in the estimated fair value or cash flows of a hedged item; (ii) the derivative expires, is sold, terminated, or exercised; (iii) it is no longer probable that the hedged forecasted transaction will occur; or (iv) the derivative is de-designated as a hedging instrument.
When hedge accounting is discontinued because it is determined that the derivative is not highly effective in offsetting changes in the estimated fair value or cash flows of a hedged item, the derivative continues to be carried on the balance sheet at its estimated fair value, with changes in estimated fair value recognized in net derivative gains (losses). The carrying value of the hedged recognized asset or liability under a fair value hedge is no longer adjusted for changes in its estimated fair value due to the hedged risk, and the cumulative adjustment to its carrying value is amortized into income over the remaining life of the hedged item. Provided the hedged forecasted transaction is still probable of occurrence, the changes in estimated fair value of derivatives recorded in OCI related to discontinued cash flow hedges are released into the statement of operations when the Company’s earnings are affected by the variability in cash flows of the hedged item.
216
MetLife, Inc.
Notes to the Consolidated Financial Statements — (continued)
1. Business, Basis of Presentation and Summary of Significant Accounting Policies (continued)
When hedge accounting is discontinued because it is no longer probable that the forecasted transactions will occur on the anticipated date or within two months of that date, the derivative continues to be carried on the balance sheet at its estimated fair value, with changes in estimated fair value recognized currently in net derivative gains (losses). Deferred gains and losses of a derivative recorded in OCI pursuant to the discontinued cash flow hedge of a forecasted transaction that is no longer probable are recognized immediately in net derivative gains (losses).
In all other situations in which hedge accounting is discontinued, the derivative is carried at its estimated fair value on the balance sheet, with changes in its estimated fair value recognized in the current period as net derivative gains (losses).
Embedded Derivatives
The Company sells variable annuities and issues certain insurance products and investment contracts and is a party to certain reinsurance agreements that have embedded derivatives. The Company assesses each identified embedded derivative to determine whether it is required to be bifurcated. The embedded derivative is bifurcated from the host contract and accounted for as a freestanding derivative if:
|
•
|
the combined instrument is not accounted for in its entirety at estimated fair value with changes in estimated fair value recorded in earnings;
|
|
•
|
the terms of the embedded derivative are not clearly and closely related to the economic characteristics of the host contract; and
|
|
•
|
a separate instrument with the same terms as the embedded derivative would qualify as a derivative instrument.
|
Such embedded derivatives are carried on the balance sheet at estimated fair value with the host contract and changes in their estimated fair value are generally reported in net derivative gains (losses), except for those in policyholder benefits and claims related to ceded reinsurance of GMIB. If the Company is unable to properly identify and measure an embedded derivative for separation from its host contract, the entire contract is carried on the balance sheet at estimated fair value, with changes in estimated fair value recognized in the current period in net investment gains (losses) or net investment income. Additionally, the Company may elect to carry an entire contract on the balance sheet at estimated fair value, with changes in estimated fair value recognized in the current period in net investment gains (losses) or net investment income if that contract contains an embedded derivative that requires bifurcation. At inception, the Company attributes to the embedded derivative a portion of the projected future guarantee fees to be collected from the policyholder equal to the present value of projected future guaranteed benefits. Any additional fees represent “excess” fees and are reported in universal life and investment-type product policy fees.
Fair Value
Fair value is defined as the price that would be received to sell an asset or paid to transfer a liability (an exit price) in the principal or most advantageous market for the asset or liability in an orderly transaction between market participants on the measurement date. In most cases, the exit price and the transaction (or entry) price will be the same at initial recognition.
Subsequent to initial recognition, fair values are based on unadjusted quoted prices for identical assets or liabilities in active markets that are readily and regularly obtainable. When such quoted prices are not available, fair values are based on quoted prices in markets that are not active, quoted prices for similar but not identical assets or liabilities, or other observable inputs. If these inputs are not available, or observable inputs are not determinable, unobservable inputs and/or adjustments to observable inputs requiring management judgment are used to determine the estimated fair value of assets and liabilities.
Goodwill
Goodwill represents the future economic benefits arising from net assets acquired in a business combination that are not individually identified and recognized. Goodwill is calculated as the excess of cost over the estimated fair value of such net assets acquired, is not amortized, and is tested for impairment based on a fair value approach at least annually or more frequently if events or circumstances indicate that there may be justification for conducting an interim test. The Company performs its annual goodwill impairment testing during the third quarter of each year based upon data as of the close of the second quarter. Goodwill associated with a business acquisition is not tested for impairment during the year the business is acquired unless there is a significant identified impairment event.
217
MetLife, Inc.
Notes to the Consolidated Financial Statements — (continued)
1. Business, Basis of Presentation and Summary of Significant Accounting Policies (continued)
The impairment test is performed at the reporting unit level, which is the operating segment or a business one level below the operating segment, if discrete financial information is prepared and regularly reviewed by management at that level. For purposes of goodwill impairment testing, if the carrying value of a reporting unit exceeds its estimated fair value, there may be an indication of impairment. In such instances, the implied fair value of the goodwill is determined in the same manner as the amount of goodwill that would be determined in a business combination. The excess of the carrying value of goodwill over the implied fair value of goodwill would be recognized as an impairment and recorded as a charge against net income.
On an ongoing basis, the Company evaluates potential triggering events that may affect the estimated fair value of the Company’s reporting units to assess whether any goodwill impairment exists. Deteriorating or adverse market conditions for certain reporting units may have a significant impact on the estimated fair value of these reporting units and could result in future impairments of goodwill.
Employee Benefit Plans
Certain subsidiaries of MetLife, Inc. sponsor and/or administer various plans that provide defined benefit pension and other postretirement benefits covering eligible employees and sales representatives. Measurement dates used for all of the subsidiaries’ defined benefit pension and other postretirement benefit plans correspond with the fiscal year ends of sponsoring subsidiaries, which is December 31 for U.S. and non-U.S. subsidiaries.
The Company recognizes the funded status of each of its defined pension and postretirement benefit plans, measured as the difference between the fair value of plan assets and the benefit obligation, which is the projected benefit obligation (“PBO”) for pension benefits and the accumulated postretirement benefit obligation (“APBO”) for other postretirement benefits in other assets or other liabilities.
Actuarial gains and losses result from differences between the actual experience and the assumed experience on plan assets or PBO during a particular period and are recorded in accumulated OCI (“AOCI”). To the extent such gains and losses exceed 10% of the greater of the PBO or the estimated fair value of plan assets, the excess is amortized into net periodic benefit costs, generally over the average projected future service years of the active employees. In addition, prior service costs (credit) are recognized in AOCI at the time of the amendment and then amortized to net periodic benefit costs over the average projected future service years of the active employees.
Net periodic benefit costs are determined using management estimates and actuarial assumptions and are comprised of service cost, interest cost, settlement and curtailment costs, expected return on plan assets, amortization of net actuarial (gains) losses, and amortization of prior service costs (credit). Fair value is used to determine the expected return on plan assets.
The subsidiaries also sponsor defined contribution plans for substantially all U.S. employees under which a portion of employee contributions is matched. Applicable matching contributions are made each payroll period. Accordingly, the Company recognizes compensation cost for current matching contributions. As all contributions are transferred currently as earned to the defined contribution plans, no liability for matching contributions is recognized on the balance sheets.
Income Tax
MetLife, Inc. and its includable life insurance and non-life insurance subsidiaries file a consolidated U.S. federal income tax return in accordance with the provisions of the Internal Revenue Code of 1986, as amended. Non-includable subsidiaries file either separate individual corporate tax returns or separate consolidated tax returns.
The Company’s accounting for income taxes represents management’s best estimate of various events and transactions.
Deferred tax assets and liabilities resulting from temporary differences between the financial reporting and tax bases of assets and liabilities are measured at the balance sheet date using enacted tax rates expected to apply to taxable income in the years the temporary differences are expected to reverse.
218
MetLife, Inc.
Notes to the Consolidated Financial Statements — (continued)
1. Business, Basis of Presentation and Summary of Significant Accounting Policies (continued)
The realization of deferred tax assets depends upon the existence of sufficient taxable income within the carryback or carryforward periods under the tax law in the applicable tax jurisdiction. Valuation allowances are established against deferred tax assets when management determines, based on available information, that it is more likely than not that deferred income tax assets will not be realized. Significant judgment is required in determining whether valuation allowances should be established, as well as the amount of such allowances. When making such determination the Company considers many factors, including:
|
•
|
the nature, frequency, and amount of cumulative financial reporting income and losses in recent years;
|
|
•
|
the jurisdiction in which the deferred tax asset was generated;
|
|
•
|
the length of time that carryforward can be utilized in the various taxing jurisdiction;
|
|
•
|
future taxable income exclusive of reversing temporary differences and carryforwards;
|
|
•
|
future reversals of existing taxable temporary differences;
|
|
•
|
taxable income in prior carryback years; and
|
|
•
|
tax planning strategies.
|
The Company may be required to change its provision for income taxes when estimates used in determining valuation allowances on deferred tax assets significantly change or when receipt of new information indicates the need for adjustment in valuation allowances. Additionally, the effect of changes in tax laws, tax regulations, or interpretations of such laws or regulations, is recognized in net income tax expense (benefit) in the period of change.
The Company determines whether it is more likely than not that a tax position will be sustained upon examination by the appropriate taxing authorities before any part of the benefit can be recorded on the financial statements. A tax position is measured at the largest amount of benefit that is greater than
50%
likely of being realized upon settlement. Unrecognized tax benefits due to tax uncertainties that do not meet the threshold are included within other liabilities and are charged to earnings in the period that such determination is made.
The Company classifies interest recognized as interest expense and penalties recognized as a component of income tax expense.
Litigation Contingencies
The Company is a party to a number of legal actions and is involved in a number of regulatory investigations. Given the inherent unpredictability of these matters, it is difficult to estimate the impact on the Company’s financial position. Liabilities are established when it is probable that a loss has been incurred and the amount of the loss can be reasonably estimated. Except as otherwise disclosed in Note
21
, legal costs are recognized as incurred. On a quarterly and annual basis, the Company reviews relevant information with respect to liabilities for litigation, regulatory investigations and litigation-related contingencies to be reflected on the Company’s financial statements.
Other Accounting Policies
Stock-Based Compensation
The Company grants certain employees and directors stock-based compensation awards under various plans that are subject to specific vesting conditions. With the exception of performance shares granted in 2013 and after which are re-measured quarterly, the cost of all stock-based transactions is measured at fair value at grant date and recognized over the period during which a grantee is required to provide services in exchange for the award. Although the terms of the Company’s stock-based plans do not accelerate vesting upon the attainment of the applicable criteria for post-employment award continuation, the requisite service period subsequent to attaining such criteria is considered non-substantive. Accordingly, the Company recognizes compensation expense related to stock-based awards over the shorter of the requisite service period or the period to attainment of such criteria. An estimation of future forfeitures of stock-based awards is incorporated into the determination of compensation expense when recognizing expense over the requisite service period.
219
MetLife, Inc.
Notes to the Consolidated Financial Statements — (continued)
1. Business, Basis of Presentation and Summary of Significant Accounting Policies (continued)
Cash and Cash Equivalents
The Company considers all highly liquid securities and other investments purchased with an original or remaining maturity of three months or less at the date of purchase to be cash equivalents. Cash equivalents are stated at amortized cost, which approximates estimated fair value.
Property, Equipment, Leasehold Improvements and Computer Software
Property, equipment and leasehold improvements, which are included in other assets, are stated at cost, less accumulated depreciation and amortization. Depreciation is determined using the straight-line method over the estimated useful lives of the assets, as appropriate. The estimated life is generally
40 years
for company occupied real estate property, from
one
to
25 years
for leasehold improvements, and from
three
to
seven years
for all other property and equipment. The cost basis of the property, equipment and leasehold improvements was
$2.4 billion
and
$2.0 billion
at December 31,
2016
and
2015
, respectively. Accumulated depreciation and amortization of property, equipment and leasehold improvements was
$1.1 billion
at both December 31,
2016
and
2015
. Related depreciation and amortization expense was
$207 million
,
$216 million
and
$182 million
for the years ended December 31,
2016
,
2015
and
2014
, respectively.
Computer software, which is included in other assets, is stated at cost, less accumulated amortization. Purchased software costs, as well as certain internal and external costs incurred to develop internal-use computer software during the application development stage, are capitalized. Such costs are amortized generally over a
four
-year period using the straight-line method. The cost basis of computer software was
$2.5 billion
and
$2.2 billion
at December 31,
2016
and
2015
, respectively. Accumulated amortization of capitalized software was
$1.7 billion
and
$1.5 billion
at December 31,
2016
and
2015
, respectively. Related amortization expense was
$248 million
,
$212 million
and
$212 million
for the years ended December 31,
2016
,
2015
and
2014
, respectively.
Other Revenues
Other revenues include, in addition to items described elsewhere herein, advisory fees, broker-dealer commissions and fees, administrative service fees, and changes in account value relating to corporate-owned life insurance (“COLI”). Such fees and commissions are recognized in the period in which services are performed. Under certain COLI contracts, if the Company reports certain unlikely adverse results in its financial statements, withdrawals would not be immediately available and would be subject to market value adjustment, which could result in a reduction of the account value.
Policyholder Dividends
Policyholder dividends are approved annually by the insurance subsidiaries’ boards of directors. The aggregate amount of policyholder dividends is related to actual interest, mortality, morbidity and expense experience for the year, as well as management’s judgment as to the appropriate level of statutory surplus to be retained by the insurance subsidiaries.
Foreign Currency
Assets, liabilities and operations of foreign affiliates and subsidiaries are recorded based on the functional currency of each entity. The determination of the functional currency is made based on the appropriate economic and management indicators.
For most of the Company’s foreign operations, the local currency is the functional currency. For certain other foreign operations, such as Japan, the local currency and one or more other currencies qualify as functional currencies.
Assets and liabilities of foreign affiliates and subsidiaries are translated from the functional currency to U.S. dollars at the exchange rates in effect at each year-end and revenues and expenses are translated at the average exchange rates during the year. The resulting translation adjustments are charged or credited directly to OCI, net of applicable taxes. Gains and losses from foreign currency transactions, including the effect of re-measurement of monetary assets and liabilities to the appropriate functional currency, are reported as part of net investment gains (losses) in the period in which they occur.
Earnings Per Common Share
Basic earnings per common share are computed based on the weighted average number of common shares, or their equivalent, outstanding during the period. Diluted earnings per common share include the dilutive effect of the assumed: (i) exercise or issuance of stock-based awards using the treasury stock method; and (ii) settlement of stock purchase contracts underlying common equity units using the treasury stock method. Under the treasury stock method, exercise or issuance of stock-based awards and settlement of stock purchase contracts underlying common equity units is assumed to occur with the proceeds used to purchase common stock at the average market price for the period. The difference between the number of shares assumed issued and number of shares assumed purchased represents the dilutive shares.
220
MetLife, Inc.
Notes to the Consolidated Financial Statements — (continued)
1. Business, Basis of Presentation and Summary of Significant Accounting Policies (continued)
Adoption of New Accounting Pronouncements
Effective January 1, 2016, the Company retrospectively adopted guidance relating to short-duration contracts. The new guidance requires insurance entities to provide users of financial statements with more transparent information about initial claim estimates and subsequent adjustments to these estimates, including information on: (i) reconciling from the claim development table to the balance sheet liability, (ii) methodologies and judgments in estimating claims, and (iii) the timing, and frequency of claims. The adoption did not have an impact on the Company’s consolidated financial statements other than expanded disclosures in
Note 4
.
Effective January 1, 2016, the Company retrospectively adopted new guidance relating to the consolidation of certain entities. The objective of the new standard is to improve targeted areas of the consolidation guidance and to reduce the number of consolidation models. The new consolidation standard provides guidance on how a reporting entity (i) evaluates whether the entity should consolidate limited partnerships and similar entities, (ii) assesses whether the fees paid to a decisionmaker or service provider are variable interests in a VIE, and (iii) assesses the variable interests in a VIE held by related parties of the reporting entity. The new guidance also eliminates the VIE consolidation model based on majority exposure to variability that applied to certain investment companies and similar entities. The adoption of the new guidance did not impact which entities are consolidated by the Company. The consolidated VIE assets and liabilities and unconsolidated VIE carrying amounts and maximum exposure to loss as of December 31, 2016, disclosed in
Note 8
, reflect the application of the new guidance.
Effective November 18, 2014, the Company adopted new guidance on when, if ever, the cost of acquiring an entity should be used to establish a new accounting basis (“pushdown”) in the acquired entity’s separate financial statements. The guidance provides an acquired entity and its subsidiaries with an irrevocable option to apply pushdown accounting in its separate financial statements upon occurrence of an event in which an acquirer obtains control of the acquired entity. If a reporting entity elects to apply pushdown accounting, its stand-alone financial statements would reflect the acquirer’s new basis in the acquired entity’s assets and liabilities. The election to apply pushdown accounting should be determined by an acquired entity for each individual change-in-control event in which an acquirer obtains control of the acquired entity; however, an entity that does not elect to apply pushdown accounting in the period of a change-in-control can later elect to retrospectively apply pushdown accounting to the most recent change-in-control transaction as a change in accounting principle. The new guidance did not have a material impact on the consolidated financial statements upon adoption.
Effective January 1, 2014, the Company adopted new guidance regarding reporting of discontinued operations and disclosures of disposals of components of an entity. The guidance increases the threshold for a disposal to qualify as a discontinued operation, expands the disclosures for discontinued operations and requires new disclosures for certain disposals that do not meet the definition of a discontinued operation. Disposals must now represent a strategic shift that has or will have a major effect on the entity’s operations and financial results to qualify as discontinued operations.
Effective January 1, 2014, the Company adopted new guidance regarding the presentation of an unrecognized tax benefit. The new guidance requires that an unrecognized tax benefit, or a portion of an unrecognized tax benefit, be presented on the financial statements as a reduction to a deferred tax asset for a net operating loss carryforward, a similar tax loss, or a tax credit carryforward. However, when the carryforwards are not available at the reporting date to settle any additional income taxes that would result from the disallowance of a tax position or the applicable tax law does not require, and the entity does not intend to use, the deferred tax asset for such purpose, the unrecognized tax benefit will be presented on the financial statements as a liability and will not be combined with the related deferred tax asset. The adoption was prospectively applied and resulted in a reduction to other liabilities and a corresponding increase to deferred income tax liability in the amount of
$277 million
.
Effective January 1, 2014, the Company adopted new guidance on other expenses. The objective of this standard is to address how health insurers should recognize and classify in their income statements fees mandated by the Patient Protection and Health Care and Education Reconciliation Act of 2010, signed into law on March 30, 2010, as amended by the Health Care and Education Reconciliation Act. The amendments in this standard specify that the liability for the fee should be estimated and recorded in full once the entity provides qualifying health insurance in the applicable calendar year in which the fee is payable with a corresponding deferred cost that is amortized to expense using the straight-line method of allocation unless another method better allocates the fee over the calendar year that it is payable. In accordance with the adoption of the new accounting pronouncement on January 1, 2014, the Company recorded
$57 million
in other liabilities, and a corresponding deferred cost, in other assets.
221
MetLife, Inc.
Notes to the Consolidated Financial Statements — (continued)
1. Business, Basis of Presentation and Summary of Significant Accounting Policies (continued)
Future Adoption of New Accounting Pronouncements
In February 2017, the Financial Accounting Standards Board (“FASB”) issued new guidance on derecognition of nonfinancial assets (Accounting Standards Update (“ASU”) 2017- 05,
Other Income-Gains and Losses from the Derecognition of Nonfinancial Assets (Subtopic 610-20): Clarifying the Scope of Asset Derecognition Guidance and Accounting for Partial Sales of Nonfinancial Assets
). The new guidance is effective for fiscal years beginning after December 15, 2017 and interim periods within those years. Early adoption is permitted for interim or annual reporting periods beginning after December 15, 2016. The guidance may be applied retrospectively for all periods presented or retrospectively with a cumulative-effect adjustment at the date of adoption. The new guidance clarifies the scope and accounting of a financial asset that meets the definition of an “in-substance nonfinancial asset” and defines the term, “in-substance nonfinancial asset.” The ASU also adds guidance for partial sales of nonfinancial assets. The Company is currently evaluating the impact of this guidance on its consolidated financial statements.
In January 2017, the FASB issued new guidance on goodwill impairment (ASU 2017- 04,
Intangibles-Goodwill and Other (Topic 350): Simplifying the Test for Goodwill Impairment
). The new guidance is effective for fiscal years beginning after December 15, 2019 and interim periods within those fiscal years, and should be applied on a prospective basis. Early adoption is permitted for interim or annual goodwill impairment tests performed on testing dates after January 1, 2017. The new guidance simplifies the current two-step goodwill impairment test by eliminating Step 2 of the test. The new guidance requires a one-step impairment test in which an entity compares the fair value of a reporting unit with its carrying amount and recognizes an impairment charge for the amount by which the carrying amount exceeds the reporting unit’s fair value, if any. The Company is currently evaluating the impact of this guidance on its consolidated financial statements.
In January 2017, the FASB issued new guidance on business combinations (ASU 2017- 01,
Business Combinations (Topic 805): Clarifying the Definition of a Business
). The new guidance is effective for fiscal years beginning after December 15, 2017 and interim periods within those fiscal years, and should be applied on a prospective basis. Early adoption is permitted as specified in the guidance. The new guidance clarifies the definition of a business and requires that an entity apply certain criteria in order to determine when a set of assets and activities qualifies as a business. The adoption of this standard will result in fewer acquisitions qualifying as businesses and, accordingly, acquisition costs for those acquisitions that do not qualify as businesses will be capitalized rather than expensed. The Company is currently evaluating the impact of this guidance on its consolidated financial statements.
In November 2016, the FASB issued new guidance on restricted cash (ASU 2016-18,
Statement of Cash Flows (Topic 230): a consensus of the FASB Emerging Issues Task Force
). The new guidance is effective for fiscal years beginning after December 15, 2017 and interim periods within those fiscal years, and should be applied on a retrospective basis. Early adoption is permitted. The new guidance requires that a statement of cash flows explain the change during the period in the total of cash, cash equivalents, and amounts generally described as restricted cash or restricted cash equivalents. As a result, the new guidance requires that amounts generally described as restricted cash and restricted cash equivalents should be included with cash and cash equivalents when reconciling the beginning-of-period and end-of-period total amounts shown on the statement of cash flows. The new guidance does not provide a definition of restricted cash or restricted cash equivalents. The Company is currently evaluating the impact of this guidance on its consolidated financial statements.
In October 2016, the FASB issued new guidance on consolidation evaluation for entities under common control (ASU 2016-17,
Consolidation (Topic 810): Interests Held through Related Parties That Are under Common Control
). The new guidance is effective for fiscal years beginning after December 15, 2016 and interim periods within those fiscal years, and should be applied on a retrospective basis. Early adoption is permitted. The new guidance does not change the characteristics of a primary beneficiary under current GAAP. It changes how a reporting entity evaluates whether it is the primary beneficiary of a VIE by changing how a reporting entity that is a single decisionmaker of a VIE handles indirect interests in the entity held through related parties that are under common control with the reporting entity. The adoption of this new guidance will not have a material impact on the Company’s consolidated financial statements.
222
MetLife, Inc.
Notes to the Consolidated Financial Statements — (continued)
1. Business, Basis of Presentation and Summary of Significant Accounting Policies (continued)
In October 2016, the FASB issued new guidance on tax accounting for intra-entity transfers of assets (ASU 2016
-
16,
Income Taxes (Topic 740): Intra-Entity Transfers of Assets Other Than Inventory
). The new guidance is effective for fiscal years beginning after December 15, 2017 and interim periods within those fiscal years, and should be applied on a modified retrospective basis. Early adoption is permitted in the first interim or annual reporting period. Current guidance prohibits the recognition of current and deferred income taxes for an intra-entity asset transfer until the asset has been sold to an outside party. The new guidance requires an entity to recognize the income tax consequences of an intra-entity transfer of an asset other than inventory when the transfer occurs. Also, the guidance eliminates the exception for an intra-entity transfer of an asset other than inventory. The Company is currently evaluating the impact of this guidance on its consolidated financial statements.
In August 2016, the FASB issued new guidance on cash flow statement presentation (ASU 2016-15,
Statement of Cash Flows (Topic 230): Classification of Certain Cash Receipts and Cash Payments
). The new guidance is effective for fiscal years beginning after December 15, 2017 and interim periods within those fiscal years, and should be applied retrospectively to all periods presented. Early adoption is permitted in any interim or annual period. This ASU addresses diversity in how certain cash receipts and cash payments are presented and classified in the statement of cash flows. The Company is currently evaluating the impact of this guidance on its consolidated financial statements.
In June 2016, the FASB issued new guidance on measurement of credit losses on financial instruments (ASU 2016-13,
Financial Instruments - Credit Losses (Topic 326): Measurement of Credit Losses on Financial Instruments
). The new guidance is effective for fiscal years beginning after December 15, 2019, including interim periods within those fiscal years. Early adoption is permitted for fiscal years, and interim periods within those fiscal years, beginning after December 15, 2018. This ASU replaces the incurred loss impairment methodology with one that reflects expected credit losses. The measurement of expected credit losses should be based on historical loss information, current conditions, and reasonable and supportable forecasts. The new guidance requires that an
OTTI
on a debt security will be recognized as an allowance going forward, such that improvements in expected future cash flows after an impairment will no longer be reflected as a prospective yield adjustment through net investment income, but rather a reversal of the previous impairment and recognized through realized investment gains and losses. The guidance also requires enhanced disclosures. The Company has assessed the asset classes impacted by the new guidance and is currently assessing the accounting and reporting system changes that will be required to comply with the new guidance. The Company believes that the most significant impact upon adoption will be to its mortgage loan investments. The Company is continuing to evaluate the overall impact of the new guidance on its consolidated financial statements.
In March 2016, the FASB issued new guidance on stock compensation (ASU 2016-09,
Compensation - Stock Compensation (Topic 718): Improvements to Employee Share-based Payment Accounting
. The new guidance is effective for the fiscal years beginning after December 15, 2016, including interim periods within those fiscal years, and requires either a modified retrospective, a retrospective or a prospective transition approach depending upon the type of change. Early adoption is permitted in any interim or annual period. The new guidance changes several aspects of the accounting for share-based payment award transactions, including: (i) income tax consequences when awards vest or are settled; (ii) classification of awards as either equity or liabilities due to statutory tax withholding requirements; and (iii) classification on the statement of cash flows. The adoption of this new guidance will not have a material impact on the Company’s consolidated financial statements.
In February 2016, the FASB issued new guidance on leasing transactions (ASU 2016-02,
Leases - Topic 842
). The new guidance is effective for the fiscal years beginning after December 15, 2018, including interim periods within those fiscal years, and requires a modified retrospective transition approach. Early adoption is permitted. The new guidance requires a lessee to recognize assets and liabilities for leases with lease terms of more than 12 months. Leases would be classified as finance or operating leases and both types of leases will be recognized on the balance sheet. Lessor accounting will remain largely unchanged from current guidance except for certain targeted changes. The new guidance will also require new qualitative and quantitative disclosures. The Company’s implementation efforts are primarily focused on the review of its existing lease contracts as well as identification of other contracts that may fall under the scope of the new guidance. The Company is currently evaluating the impact of this guidance on its consolidated financial statements.
223
MetLife, Inc.
Notes to the Consolidated Financial Statements — (continued)
1. Business, Basis of Presentation and Summary of Significant Accounting Policies (continued)
In January 2016, the FASB issued new guidance (ASU 2016-01,
Financial Instruments-Overall: Recognition and Measurement of Financial Assets and Financial Liabilities
) on the recognition and measurement of financial instruments. The new guidance is effective for fiscal years beginning after December 15, 2017, including interim periods within those fiscal years. Early adoption is permitted for the instrument-specific credit risk provision. The new guidance changes the current accounting guidance related to (i) the classification and measurement of certain equity investments, (ii) the presentation of changes in the fair value of financial liabilities measured under the FVO that are due to instrument-specific credit risk, and (iii) certain disclosures associated with the fair value of financial instruments. Additionally, there will no longer be a requirement to assess equity securities for impairment since such securities will be measured at fair value through net income. The Company has assessed the population of financial instruments that are subject to the new guidance and has determined that the most significant impact will be the requirement to report changes in fair value in net income each reporting period for all equity securities currently classified as available-for-sale and to a lesser extent, other limited partnership interests and real estate joint ventures that are currently accounted for under the cost method. The population of these investments accounted for under the cost method is not material. The Company is continuing to evaluate the overall impact of this guidance on its consolidated financial statements.
In May 2014, the FASB issued a comprehensive new revenue recognition standard (ASU 2014‑09,
Revenue from Contracts with Customers (Topic 606)
), effective for fiscal years beginning after December 15, 2017 and interim periods within those years. The guidance may be applied retrospectively for all periods presented or retrospectively with a cumulative-effect adjustment at the date of adoption. The new guidance will supersede nearly all existing revenue recognition guidance under U.S. GAAP; however, it will not impact the accounting for insurance and investment contracts within the scope of Financial Services insurance (Topic 944), leases, financial instruments and guarantees. For those contracts that are impacted, the guidance will require an entity to recognize revenue upon the transfer of promised goods or services to customers in an amount that reflects the consideration to which the entity expects to be entitled, in exchange for those goods or services. Given the scope of the new revenue recognition guidance, the Company does not expect the adoption to have a material impact on its consolidated revenues or statements of operations, with the Company’s implementation efforts primarily focused on other revenues on the consolidated statements of operations, which represents less than
3%
of consolidated total revenues in 2016.
Other
Effective January 3, 2017, the Chicago Mercantile Exchange (“CME”) amended its rulebook, resulting in the characterization of variation margin transfers as settlement payments, as opposed to adjustments to collateral. These amendments will impact the accounting treatment of the Company’s centrally cleared derivatives, for which the CME serves as the central clearing party. The application of the amended rulebook is expected to reduce the gross derivative assets and liabilities, as well as the related collateral, recorded on the consolidated balance sheet for trades cleared through the CME. The Company is currently evaluating the impact of these amendments on its consolidated financial statements. This change is not expected to impact the tax treatment of such derivatives, although the Internal Revenue Service (“IRS”) is being asked to issue definitive guidance.
2. Segment Information
MetLife is organized into
six
segments: U.S.; Asia; Latin America; EMEA; MetLife Holdings; and Brighthouse Financial. In addition, the Company reports certain of its results of operations in Corporate & Other.
On January 12, 2016, MetLife, Inc. announced its plan to separate
a substantial portion of its former Retail segment, as well as certain portions of its former Corporate Benefit Funding segment and Corporate & Other (the “Separation”)
. Additionally, on July 21, 2016, MetLife, Inc. announced that following the Separation, the separated business will be rebranded as “Brighthouse Financial.” On October 5, 2016, Brighthouse Financial, Inc., a subsidiary of MetLife, Inc. (“Brighthouse”), filed a registration statement on Form 10 (the “Form 10”) with the U.S. Securities and Exchange Commission (“SEC”).
On December 6, 2016 Brighthouse filed an amendment to its registration statement on Form 10 with the SEC.
The information statement filed as an exhibit to the Form 10 disclosed that the Company intends to include MetLife Insurance Company USA (“MetLife USA”), New England Life Insurance Company (“NELICO”), First MetLife Investors Insurance Company (“FMLI”), MetLife Advisers, LLC and certain captive reinsurance companies in the proposed separated business and distribute at least 80.1% of the shares of Brighthouse’s common stock on a pro rata basis to the holders of MetLife, Inc. common stock.
The ultimate form and timing of the Separation will be influenced by a number of factors, including regulatory considerations and economic conditions. MetLife continues to evaluate and pursue structural alternatives for the proposed Separation. The Separation remains subject to certain conditions, including among others, obtaining final approval from the MetLife, Inc. Board of Directors, receipt of a favorable ruling from the IRS and an opinion from MetLife’s tax advisor regarding certain U.S. federal income tax matters, insurance and other regulatory approvals, and an SEC declaration of the effectiveness of the Form 10.
224
MetLife, Inc.
Notes to the Consolidated Financial Statements — (continued)
2. Segment Information (continued)
Based on the proposed Separation, in the third quarter of 2016, the Company reorganized its businesses. This re-segmentation resulted in a
$296 million
,
net of income tax, charge to earnings in the third quarter of 2016, all in the Brighthouse Financial segment, driven by the segment’s variable and universal life products. This charge is the direct result of the Company, beginning in the third quarter, no longer being able to aggregate, for loss recognition testing, the variable and universal life products of Brighthouse with the variable and universal life products remaining with MetLife Holdings. Of this amount, the Company recorded
$254 million
, net of income tax, as a one-time charge, which was mostly recognized as a write-off of DAC, with the remaining
$42 million
, net of income tax, recognized as an increase in insurance-related liabilities.
U.S.
The U.S. segment offers a broad range of protection products and services aimed at serving the financial needs of customers throughout their lives. These products are sold to corporations and their respective employees, other institutions and their respective members, as well as individuals. The U.S. segment is organized into three businesses: Group Benefits, Retirement and Income Solutions and Property & Casualty.
|
•
|
The Group Benefits business offers insurance products and services which include life, dental, group short- and long-term disability, individual disability, accidental death and dismemberment, critical illness, vision and accident & health coverages, as well as prepaid legal plans. This business also sells administrative services-only arrangements to some employers.
|
|
•
|
The Retirement and Income Solutions business offers a broad range of annuity and investment products, including guaranteed interest contracts and other stable value products, institutional income annuities and separate account contracts for the investment management of defined benefit and defined contribution plan assets. This business also includes structured settlements and certain products to fund postretirement benefits and company-, bank- or trust-owned life insurance used to finance nonqualified benefit programs for executives.
|
|
•
|
The Property & Casualty business offers personal and commercial lines of property and casualty insurance, including private passenger automobile, homeowners’ and personal excess liability insurance. In addition, Property & Casualty offers small business owners property, liability and business interruption insurance.
|
Asia
The Asia segment offers a broad range of products to both individuals and corporations, as well as other institutions and their respective employees, which include whole life, term life, variable life, universal life, accident & health insurance, fixed and variable annuities, credit insurance and endowment products.
Latin America
The Latin America segment offers a broad range of products to both individuals and corporations, as well as other institutions and their respective employees, which include life insurance, accident & health insurance, group medical, dental, credit insurance, endowment and retirement and savings products.
EMEA
The EMEA segment offers a broad range of products to both individuals and corporations, as well as other institutions and their respective employees, which include life insurance, accident & health insurance, credit insurance, annuities, endowment and retirement and savings products.
MetLife Holdings
The MetLife Holdings segment consists of operations relating to products and businesses no longer actively marketed by the Company in the United States. These products and businesses include variable, universal, term and whole life, as well as variable, fixed and index-linked annuities. The MetLife Holdings segment also includes the Company’s discontinued long-term care business and the assumed reinsurance of certain variable annuity products from the Company’s former operating joint venture in Japan.
225
MetLife, Inc.
Notes to the Consolidated Financial Statements — (continued)
2. Segment Information (continued)
Brighthouse Financial
The Brighthouse Financial segment offers a broad range of products and services which include variable, fixed, index-linked and income annuities, as well as variable, universal, term and whole life products. These products and services are actively marketed through various third party retail distribution channels in the United States. In addition, the Brighthouse Financial segment includes certain run-off businesses which are not actively marketed.
Corporate & Other
Corporate & Other contains the excess capital, as well as certain charges and activities, not allocated to the segments, including external integration and disposition costs, internal resource costs for associates committed to acquisitions and dispositions, enterprise-wide strategic initiative restructuring charges and various start-up businesses (including expatriate benefits insurance and the investment management business through which the Company offers fee-based investment management services to institutional clients, as well as the direct to consumer portion of the U.S. Direct business). Corporate & Other also includes interest expense related to the majority of the Company’s outstanding debt and expenses associated with certain legal proceedings and income tax audit issues. In addition, Corporate & Other includes the elimination of intersegment amounts, which generally relate to affiliated reinsurance and intersegment loans, which bear interest rates commensurate with related borrowings.
Financial Measures and Segment Accounting Policies
Operating earnings is used by management to evaluate performance and allocate resources. Consistent with GAAP guidance for segment reporting, operating earnings is also the Company’s GAAP measure of segment performance and is reported below. Operating earnings should not be viewed as a substitute for income (loss) from continuing operations, net of income tax. The Company believes the presentation of operating earnings as the Company measures it for management purposes enhances the understanding of its performance by highlighting the results of operations and the underlying profitability drivers of the business. Operating earnings allows analysis of the Company’s performance relative to the Company’s business plan and facilitates comparisons to industry results.
Operating earnings is defined as operating revenues less operating expenses, both net of income tax.
The financial measures of operating revenues and operating expenses focus on the Company’s primary businesses principally by excluding the impact of market volatility, which could distort trends, and revenues and costs related to non-core products and divested businesses and certain entities required to be consolidated under GAAP. Also, these measures exclude results of discontinued operations and other businesses that have been or will be sold or exited by MetLife and are referred to as divested businesses. In addition, for the year ended December 31, 2016, operating revenues and operating expenses exclude the financial impact of converting the Company’s Japan operations to calendar year-end reporting without retrospective application of this change to prior periods and is referred to as lag elimination. Operating revenues also excludes net investment gains (losses) and net derivative gains (losses). Operating expenses also excludes goodwill impairments.
The following additional adjustments are made to revenues, in the line items indicated, in calculating operating revenues:
|
•
|
Universal life and investment-type product policy fees excludes the amortization of unearned revenue related to net investment gains (losses) and net derivative gains (losses) and certain variable annuity GMIB fees (“GMIB Fees”);
|
|
•
|
Net investment income: (i) includes earned income on derivatives and amortization of premium on derivatives that are hedges of investments or that are used to replicate certain investments, but do not qualify for hedge accounting treatment, (ii) includes income from discontinued real estate operations, (iii) excludes post-tax operating earnings adjustments relating to insurance joint ventures accounted for under the equity method, (iv) excludes certain amounts related to contractholder-directed unit-linked investments and (v) excludes certain amounts related to securitization entities that are VIEs consolidated under GAAP; and
|
|
•
|
Other revenues are adjusted for settlements of foreign currency earnings hedges.
|
226
MetLife, Inc.
Notes to the Consolidated Financial Statements — (continued)
2. Segment Information (continued)
The following additional adjustments are made to expenses, in the line items indicated, in calculating operating expenses:
|
•
|
Policyholder benefits and claims and policyholder dividends excludes: (i) changes in the policyholder dividend obligation related to net investment gains (losses) and net derivative gains (losses), (ii) inflation-indexed benefit adjustments associated with contracts backed by inflation-indexed investments and amounts associated with periodic crediting rate adjustments based on the total return of a contractually referenced pool of assets and other pass through adjustments, (iii) benefits and hedging costs related to GMIBs (“GMIB Costs”) and (iv) market value adjustments associated with surrenders or terminations of contracts (“Market Value Adjustments”);
|
|
•
|
Interest credited to policyholder account balances includes adjustments for earned income on derivatives and amortization of premium on derivatives that are hedges of policyholder account balances but do not qualify for hedge accounting treatment and excludes amounts related to net investment income earned on contractholder-directed unit-linked investments;
|
|
•
|
Amortization of DAC and VOBA excludes amounts related to: (i) net investment gains (losses) and net derivative gains (losses), (ii) GMIB Fees and GMIB Costs and (iii) Market Value Adjustments;
|
|
•
|
Amortization of negative VOBA excludes amounts related to Market Value Adjustments;
|
|
•
|
Interest expense on debt excludes certain amounts related to securitization entities that are VIEs consolidated under GAAP; and
|
|
•
|
Other expenses excludes costs related to: (i) noncontrolling interests, (ii) implementation of new insurance regulatory requirements, and (iii) acquisition, integration and other costs.
|
Operating earnings also excludes the recognition of certain contingent assets and liabilities that could not be recognized at acquisition or adjusted for during the measurement period under GAAP business combination accounting guidance.
The tax impact of the adjustments mentioned above are calculated net of the U.S. or foreign statutory tax rate, which could differ from the Company’s effective tax rate. Additionally, the provision for income tax (expense) benefit also includes the impact related to the timing of certain tax credits, as well as certain tax reforms.
Set forth in the tables below is certain financial information with respect to the Company’s segments, as well as Corporate & Other, for the years ended
December 31, 2016
,
2015
and
2014
and at
December 31, 2016
and
2015
. The segment accounting policies are the same as those used to prepare the Company’s consolidated financial statements, except for operating earnings adjustments as defined above. In addition, segment accounting policies include the method of capital allocation described below, with the exception of the Brighthouse Financial segment,
for which equity is reflective of the historical equity of the legal entities which comprise Brighthouse and related companies, which will be eliminated upon Separation. The Brighthouse Financial segment equity is not indicative of Brighthouse and related companies’ equity on a combined standalone basis.
Economic capital is an internally developed risk capital model, the purpose of which is to measure the risk in the business and to provide a basis upon which capital is deployed. The economic capital model accounts for the unique and specific nature of the risks inherent in the Company’s business.
The Company’s economic capital model, coupled with considerations of local capital requirements, aligns segment allocated equity with emerging standards and consistent risk principles. The model applies statistics-based risk evaluation principles to the material risks to which the Company is exposed. These consistent risk principles include calibrating required economic capital shock factors to a specific confidence level and time horizon while applying an industry standard method for the inclusion of diversification benefits among risk types.
The Company’s management is responsible for the ongoing production and enhancement of the economic capital model and reviews its approach periodically to ensure that it remains consistent with emerging industry practice standards.
Segment net investment income, with the exception of the Brighthouse Financial segment, is credited or charged based on the level of allocated equity; however, changes in allocated equity do not impact the Company’s consolidated net investment income, income (loss) from continuing operations, net of income tax or operating earnings. As noted above, the Brighthouse Financial segment’s net investment income represents that of the legal entities which comprise Brighthouse and related companies on a historical basis, however, may not be indicative of that on a combined standalone basis.
227
MetLife, Inc.
Notes to the Consolidated Financial Statements — (continued)
2. Segment Information (continued)
Net investment income is based upon the actual results of each segment’s specifically identifiable investment portfolios adjusted for allocated equity. Other costs are allocated to each of the segments based upon: (i) a review of the nature of such costs; (ii) time studies analyzing the amount of employee compensation costs incurred by each segment; and (iii) cost estimates included in the Company’s product pricing.
228
MetLife, Inc.
Notes to the Consolidated Financial Statements — (continued)
2. Segment Information (continued)
|
Operating Results
|
||||||||||||||||||||||||||||||||||||||||
|
Year Ended December 31, 2016
|
U.S.
|
Asia
|
Latin
America
|
EMEA
|
MetLife
Holdings
|
Brighthouse
Financial
|
Corporate
& Other
|
Total
|
Adjustments
|
Total
Consolidated
|
||||||||||||||||||||||||||||||
|
(In millions)
|
||||||||||||||||||||||||||||||||||||||||
|
Revenues
|
||||||||||||||||||||||||||||||||||||||||
|
Premiums
|
$
|
21,501
|
|
$
|
6,902
|
|
$
|
2,529
|
|
$
|
2,027
|
|
$
|
4,506
|
|
$
|
1,222
|
|
$
|
40
|
|
$
|
38,727
|
|
$
|
426
|
|
$
|
39,153
|
|
||||||||||
|
Universal life and investment-type product policy fees
|
989
|
|
1,487
|
|
1,025
|
|
391
|
|
1,436
|
|
3,491
|
|
(119
|
)
|
8,700
|
|
506
|
|
9,206
|
|
||||||||||||||||||||
|
Net investment income
|
6,206
|
|
2,707
|
|
1,084
|
|
318
|
|
5,944
|
|
3,503
|
|
(62
|
)
|
19,700
|
|
247
|
|
19,947
|
|
||||||||||||||||||||
|
Other revenues
|
784
|
|
61
|
|
34
|
|
73
|
|
581
|
|
735
|
|
(517
|
)
|
1,751
|
|
8
|
|
1,759
|
|
||||||||||||||||||||
|
Net investment gains (losses)
|
—
|
|
—
|
|
—
|
|
—
|
|
—
|
|
—
|
|
—
|
|
—
|
|
171
|
|
171
|
|
||||||||||||||||||||
|
Net derivative gains (losses)
|
—
|
|
—
|
|
—
|
|
—
|
|
—
|
|
—
|
|
—
|
|
—
|
|
(6,760
|
)
|
(6,760
|
)
|
||||||||||||||||||||
|
Total revenues
|
29,480
|
|
11,157
|
|
4,672
|
|
2,809
|
|
12,467
|
|
8,951
|
|
(658
|
)
|
68,878
|
|
(5,402
|
)
|
63,476
|
|
||||||||||||||||||||
|
Expenses
|
||||||||||||||||||||||||||||||||||||||||
|
Policyholder benefits and claims and policyholder dividends
|
21,558
|
|
5,191
|
|
2,443
|
|
1,067
|
|
7,534
|
|
3,200
|
|
(23
|
)
|
40,970
|
|
1,090
|
|
42,060
|
|
||||||||||||||||||||
|
Interest credited to policyholder account balances
|
1,302
|
|
1,298
|
|
328
|
|
112
|
|
1,042
|
|
1,162
|
|
5
|
|
5,249
|
|
1,033
|
|
6,282
|
|
||||||||||||||||||||
|
Goodwill impairment
|
—
|
|
—
|
|
—
|
|
—
|
|
—
|
|
—
|
|
—
|
|
—
|
|
260
|
|
260
|
|
||||||||||||||||||||
|
Capitalization of DAC
|
(471
|
)
|
(1,668
|
)
|
(321
|
)
|
(403
|
)
|
(281
|
)
|
(333
|
)
|
(7
|
)
|
(3,484
|
)
|
(105
|
)
|
(3,589
|
)
|
||||||||||||||||||||
|
Amortization of DAC and VOBA
|
471
|
|
1,224
|
|
184
|
|
408
|
|
736
|
|
1,073
|
|
8
|
|
4,104
|
|
(1,463
|
)
|
2,641
|
|
||||||||||||||||||||
|
Amortization of negative VOBA
|
—
|
|
(208
|
)
|
(1
|
)
|
(13
|
)
|
—
|
|
—
|
|
—
|
|
(222
|
)
|
(47
|
)
|
(269
|
)
|
||||||||||||||||||||
|
Interest expense on debt
|
9
|
|
—
|
|
2
|
|
—
|
|
57
|
|
128
|
|
1,002
|
|
1,198
|
|
3
|
|
1,201
|
|
||||||||||||||||||||
|
Other expenses
|
3,706
|
|
3,586
|
|
1,336
|
|
1,323
|
|
2,392
|
|
2,338
|
|
(192
|
)
|
14,489
|
|
596
|
|
15,085
|
|
||||||||||||||||||||
|
Total expenses
|
26,575
|
|
9,423
|
|
3,971
|
|
2,494
|
|
11,480
|
|
7,568
|
|
793
|
|
62,304
|
|
1,367
|
|
63,671
|
|
||||||||||||||||||||
|
Provision for income tax expense (benefit)
|
988
|
|
492
|
|
158
|
|
42
|
|
288
|
|
361
|
|
(947
|
)
|
1,382
|
|
(2,381
|
)
|
(999
|
)
|
||||||||||||||||||||
|
Operating earnings
|
$
|
1,917
|
|
$
|
1,242
|
|
$
|
543
|
|
$
|
273
|
|
$
|
699
|
|
$
|
1,022
|
|
$
|
(504
|
)
|
5,192
|
|
|||||||||||||||||
|
Adjustments to:
|
||||||||||||||||||||||||||||||||||||||||
|
Total revenues
|
(5,402
|
)
|
||||||||||||||||||||||||||||||||||||||
|
Total expenses
|
(1,367
|
)
|
||||||||||||||||||||||||||||||||||||||
|
Provision for income tax (expense) benefit
|
2,381
|
|
||||||||||||||||||||||||||||||||||||||
|
Income (loss) from continuing operations, net of income tax
|
$
|
804
|
|
$
|
804
|
|
||||||||||||||||||||||||||||||||||
|
At December 31, 2016
|
U.S.
|
Asia (1)
|
Latin
America
|
EMEA
|
MetLife
Holdings
|
Brighthouse
Financial
|
Corporate
& Other
|
Total
|
||||||||||||||||||||||||
|
(In millions)
|
||||||||||||||||||||||||||||||||
|
Total assets
|
$
|
253,683
|
|
$
|
120,656
|
|
$
|
67,233
|
|
$
|
25,596
|
|
$
|
184,276
|
|
$
|
222,681
|
|
$
|
24,639
|
|
$
|
898,764
|
|
||||||||
|
Separate account assets
|
$
|
85,950
|
|
$
|
8,020
|
|
$
|
48,455
|
|
$
|
4,329
|
|
$
|
48,823
|
|
$
|
113,043
|
|
$
|
—
|
|
$
|
308,620
|
|
||||||||
|
Separate account liabilities
|
$
|
85,950
|
|
$
|
8,020
|
|
$
|
48,455
|
|
$
|
4,329
|
|
$
|
48,823
|
|
$
|
113,043
|
|
$
|
—
|
|
$
|
308,620
|
|
||||||||
__________________
|
(1)
|
Total assets includes
$98.0 billion
of assets from the Japan operations which represents
11%
of total consolidated assets.
|
229
MetLife, Inc.
Notes to the Consolidated Financial Statements — (continued)
2. Segment Information (continued)
|
Operating Results
|
||||||||||||||||||||||||||||||||||||||||
|
Year Ended December 31, 2015
|
U.S.
|
Asia
|
Latin
America
|
EMEA
|
MetLife
Holdings
|
Brighthouse
Financial
|
Corporate
& Other
|
Total
|
Adjustments
|
Total
Consolidated
|
||||||||||||||||||||||||||||||
|
(In millions)
|
||||||||||||||||||||||||||||||||||||||||
|
Revenues
|
||||||||||||||||||||||||||||||||||||||||
|
Premiums
|
$
|
20,861
|
|
$
|
6,937
|
|
$
|
2,581
|
|
$
|
2,036
|
|
$
|
4,545
|
|
$
|
1,675
|
|
$
|
(87
|
)
|
$
|
38,548
|
|
$
|
(3
|
)
|
$
|
38,545
|
|
||||||||||
|
Universal life and investment-type product policy fees
|
943
|
|
1,542
|
|
1,117
|
|
424
|
|
1,482
|
|
3,718
|
|
(113
|
)
|
9,113
|
|
394
|
|
9,507
|
|
||||||||||||||||||||
|
Net investment income
|
6,209
|
|
2,675
|
|
1,038
|
|
326
|
|
6,201
|
|
3,327
|
|
13
|
|
19,789
|
|
(508
|
)
|
19,281
|
|
||||||||||||||||||||
|
Other revenues
|
751
|
|
105
|
|
41
|
|
61
|
|
930
|
|
422
|
|
(290
|
)
|
2,020
|
|
(37
|
)
|
1,983
|
|
||||||||||||||||||||
|
Net investment gains (losses)
|
—
|
|
—
|
|
—
|
|
—
|
|
—
|
|
—
|
|
—
|
|
—
|
|
597
|
|
597
|
|
||||||||||||||||||||
|
Net derivative gains (losses)
|
—
|
|
—
|
|
—
|
|
—
|
|
—
|
|
—
|
|
—
|
|
—
|
|
38
|
|
38
|
|
||||||||||||||||||||
|
Total revenues
|
28,764
|
|
11,259
|
|
4,777
|
|
2,847
|
|
13,158
|
|
9,142
|
|
(477
|
)
|
69,470
|
|
481
|
|
69,951
|
|
||||||||||||||||||||
|
Expenses
|
||||||||||||||||||||||||||||||||||||||||
|
Policyholder benefits and claims and policyholder dividends
|
20,837
|
|
5,275
|
|
2,408
|
|
988
|
|
7,357
|
|
2,875
|
|
(175
|
)
|
39,565
|
|
537
|
|
40,102
|
|
||||||||||||||||||||
|
Interest credited to policyholder account balances
|
1,216
|
|
1,309
|
|
349
|
|
120
|
|
1,062
|
|
1,255
|
|
23
|
|
5,334
|
|
276
|
|
5,610
|
|
||||||||||||||||||||
|
Goodwill impairment
|
—
|
|
—
|
|
—
|
|
—
|
|
—
|
|
—
|
|
—
|
|
—
|
|
—
|
|
—
|
|
||||||||||||||||||||
|
Capitalization of DAC
|
(493
|
)
|
(1,720
|
)
|
(341
|
)
|
(472
|
)
|
(410
|
)
|
(399
|
)
|
(2
|
)
|
(3,837
|
)
|
—
|
|
(3,837
|
)
|
||||||||||||||||||||
|
Amortization of DAC and VOBA
|
471
|
|
1,256
|
|
271
|
|
497
|
|
577
|
|
731
|
|
(1
|
)
|
3,802
|
|
134
|
|
3,936
|
|
||||||||||||||||||||
|
Amortization of negative VOBA
|
—
|
|
(309
|
)
|
(1
|
)
|
(16
|
)
|
—
|
|
—
|
|
—
|
|
(326
|
)
|
(35
|
)
|
(361
|
)
|
||||||||||||||||||||
|
Interest expense on debt
|
4
|
|
—
|
|
—
|
|
—
|
|
55
|
|
128
|
|
1,013
|
|
1,200
|
|
8
|
|
1,208
|
|
||||||||||||||||||||
|
Other expenses
|
3,685
|
|
3,611
|
|
1,429
|
|
1,469
|
|
2,694
|
|
2,484
|
|
434
|
|
15,806
|
|
17
|
|
15,823
|
|
||||||||||||||||||||
|
Total expenses
|
25,720
|
|
9,422
|
|
4,115
|
|
2,586
|
|
11,335
|
|
7,074
|
|
1,292
|
|
61,544
|
|
937
|
|
62,481
|
|
||||||||||||||||||||
|
Provision for income tax expense (benefit)
|
1,040
|
|
457
|
|
37
|
|
21
|
|
581
|
|
555
|
|
(365
|
)
|
2,326
|
|
(178
|
)
|
2,148
|
|
||||||||||||||||||||
|
Operating earnings
|
$
|
2,004
|
|
$
|
1,380
|
|
$
|
625
|
|
$
|
240
|
|
$
|
1,242
|
|
$
|
1,513
|
|
$
|
(1,404
|
)
|
5,600
|
|
|
|
|||||||||||||||
|
Adjustments to:
|
||||||||||||||||||||||||||||||||||||||||
|
Total revenues
|
481
|
|
||||||||||||||||||||||||||||||||||||||
|
Total expenses
|
(937
|
)
|
||||||||||||||||||||||||||||||||||||||
|
Provision for income tax (expense) benefit
|
178
|
|
||||||||||||||||||||||||||||||||||||||
|
Income (loss) from continuing operations, net of income tax
|
$
|
5,322
|
|
$
|
5,322
|
|
||||||||||||||||||||||||||||||||||
|
At December 31, 2015
|
U.S.
|
Asia (1)
|
Latin
America |
EMEA
|
MetLife
Holdings |
Brighthouse
Financial |
Corporate
& Other |
Total
|
||||||||||||||||||||||||
|
(In millions)
|
||||||||||||||||||||||||||||||||
|
Total assets
|
$
|
237,858
|
|
$
|
113,895
|
|
$
|
64,808
|
|
$
|
26,767
|
|
$
|
187,677
|
|
$
|
226,792
|
|
$
|
20,136
|
|
$
|
877,933
|
|
||||||||
|
Separate account assets
|
$
|
79,540
|
|
$
|
8,964
|
|
$
|
46,061
|
|
$
|
3,996
|
|
$
|
48,590
|
|
$
|
114,447
|
|
$
|
—
|
|
$
|
301,598
|
|
||||||||
|
Separate account liabilities
|
$
|
79,540
|
|
$
|
8,964
|
|
$
|
46,061
|
|
$
|
3,996
|
|
$
|
48,590
|
|
$
|
114,447
|
|
$
|
—
|
|
$
|
301,598
|
|
||||||||
__________________
|
(1)
|
Total assets includes
$90.0 billion
of assets from the Japan operations which represents
10%
of total consolidated assets.
|
230
MetLife, Inc.
Notes to the Consolidated Financial Statements — (continued)
2. Segment Information (continued)
|
Operating Results
|
||||||||||||||||||||||||||||||||||||||||
|
Year Ended December 31, 2014
|
U.S.
|
Asia
|
Latin
America
|
EMEA
|
MetLife
Holdings
|
Brighthouse
Financial
|
Corporate
& Other
|
Total
|
Adjustments
|
Total
Consolidated
|
||||||||||||||||||||||||||||||
|
(In millions)
|
||||||||||||||||||||||||||||||||||||||||
|
Revenues
|
||||||||||||||||||||||||||||||||||||||||
|
Premiums
|
$
|
20,243
|
|
$
|
7,566
|
|
$
|
2,796
|
|
$
|
2,309
|
|
$
|
4,545
|
|
$
|
1,474
|
|
$
|
89
|
|
$
|
39,022
|
|
$
|
45
|
|
$
|
39,067
|
|
||||||||||
|
Universal life and investment-type product policy fees
|
909
|
|
1,693
|
|
1,239
|
|
466
|
|
1,374
|
|
3,963
|
|
(103
|
)
|
9,541
|
|
405
|
|
9,946
|
|
||||||||||||||||||||
|
Net investment income
|
6,111
|
|
2,886
|
|
1,219
|
|
428
|
|
6,409
|
|
3,156
|
|
275
|
|
20,484
|
|
669
|
|
21,153
|
|
||||||||||||||||||||
|
Other revenues
|
721
|
|
106
|
|
33
|
|
60
|
|
1,062
|
|
534
|
|
(483
|
)
|
2,033
|
|
(3
|
)
|
2,030
|
|
||||||||||||||||||||
|
Net investment gains (losses)
|
—
|
|
—
|
|
—
|
|
—
|
|
—
|
|
—
|
|
—
|
|
—
|
|
(197
|
)
|
(197
|
)
|
||||||||||||||||||||
|
Net derivative gains (losses)
|
—
|
|
—
|
|
—
|
|
—
|
|
—
|
|
—
|
|
—
|
|
—
|
|
1,317
|
|
1,317
|
|
||||||||||||||||||||
|
Total revenues
|
27,984
|
|
12,251
|
|
5,287
|
|
3,263
|
|
13,390
|
|
9,127
|
|
(222
|
)
|
71,080
|
|
2,236
|
|
73,316
|
|
||||||||||||||||||||
|
Expenses
|
||||||||||||||||||||||||||||||||||||||||
|
Policyholder benefits and claims and policyholder dividends
|
20,110
|
|
5,724
|
|
2,615
|
|
1,053
|
|
7,217
|
|
2,711
|
|
48
|
|
39,478
|
|
1,000
|
|
40,478
|
|
||||||||||||||||||||
|
Interest credited to policyholder account balances
|
1,168
|
|
1,544
|
|
394
|
|
148
|
|
1,098
|
|
1,275
|
|
34
|
|
5,661
|
|
1,282
|
|
6,943
|
|
||||||||||||||||||||
|
Goodwill impairment
|
—
|
|
—
|
|
—
|
|
—
|
|
—
|
|
—
|
|
—
|
|
—
|
|
—
|
|
—
|
|
||||||||||||||||||||
|
Capitalization of DAC
|
(488
|
)
|
(1,914
|
)
|
(377
|
)
|
(680
|
)
|
(326
|
)
|
(397
|
)
|
—
|
|
(4,182
|
)
|
(1
|
)
|
(4,183
|
)
|
||||||||||||||||||||
|
Amortization of DAC and VOBA
|
458
|
|
1,397
|
|
313
|
|
613
|
|
444
|
|
810
|
|
(8
|
)
|
4,027
|
|
105
|
|
4,132
|
|
||||||||||||||||||||
|
Amortization of negative VOBA
|
—
|
|
(364
|
)
|
(1
|
)
|
(31
|
)
|
—
|
|
—
|
|
—
|
|
(396
|
)
|
(46
|
)
|
(442
|
)
|
||||||||||||||||||||
|
Interest expense on debt
|
12
|
|
—
|
|
—
|
|
—
|
|
58
|
|
133
|
|
975
|
|
1,178
|
|
38
|
|
1,216
|
|
||||||||||||||||||||
|
Other expenses
|
3,550
|
|
3,975
|
|
1,588
|
|
1,846
|
|
2,670
|
|
2,472
|
|
153
|
|
16,254
|
|
114
|
|
16,368
|
|
||||||||||||||||||||
|
Total expenses
|
24,810
|
|
10,362
|
|
4,532
|
|
2,949
|
|
11,161
|
|
7,004
|
|
1,202
|
|
62,020
|
|
2,492
|
|
64,512
|
|
||||||||||||||||||||
|
Provision for income tax expense (benefit)
|
1,073
|
|
582
|
|
129
|
|
29
|
|
714
|
|
570
|
|
(719
|
)
|
2,378
|
|
87
|
|
2,465
|
|
||||||||||||||||||||
|
Operating earnings
|
$
|
2,101
|
|
$
|
1,307
|
|
$
|
626
|
|
$
|
285
|
|
$
|
1,515
|
|
$
|
1,553
|
|
$
|
(705
|
)
|
6,682
|
|
|||||||||||||||||
|
Adjustments to:
|
||||||||||||||||||||||||||||||||||||||||
|
Total revenues
|
2,236
|
|
||||||||||||||||||||||||||||||||||||||
|
Total expenses
|
(2,492
|
)
|
||||||||||||||||||||||||||||||||||||||
|
Provision for income tax (expense) benefit
|
(87
|
)
|
||||||||||||||||||||||||||||||||||||||
|
Income (loss) from continuing operations, net of income tax
|
$
|
6,339
|
|
$
|
6,339
|
|
||||||||||||||||||||||||||||||||||
231
MetLife, Inc.
Notes to the Consolidated Financial Statements — (continued)
2. Segment Information (continued)
The following table presents total premiums, universal life and investment-type product policy fees and other revenues by major product groups of the Company’s segments, as well as Corporate & Other:
|
Years Ended December 31,
|
|||||||||||
|
2016
|
2015
|
2014
|
|||||||||
|
(In millions)
|
|||||||||||
|
Life insurance
|
$
|
22,755
|
|
$
|
23,037
|
|
$
|
23,483
|
|
||
|
Accident & health insurance
|
14,150
|
|
13,090
|
|
13,336
|
|
|||||
|
Annuities
|
8,982
|
|
9,653
|
|
9,984
|
|
|||||
|
Property & casualty insurance
|
3,560
|
|
3,504
|
|
3,524
|
|
|||||
|
Non-insurance
|
671
|
|
751
|
|
716
|
|
|||||
|
Total
|
$
|
50,118
|
|
$
|
50,035
|
|
$
|
51,043
|
|
||
The following table presents total premiums, universal life and investment-type product policy fees and other revenues associated with the Company’s U.S. and foreign operations:
|
Years Ended December 31,
|
|||||||||||
|
2016
|
2015
|
2014
|
|||||||||
|
(In millions)
|
|||||||||||
|
U.S.
|
$
|
34,895
|
|
$
|
35,042
|
|
$
|
34,536
|
|
||
|
Foreign:
|
|||||||||||
|
Japan
|
7,088
|
|
6,264
|
|
6,917
|
|
|||||
|
Other
|
8,135
|
|
8,729
|
|
9,590
|
|
|||||
|
Total
|
$
|
50,118
|
|
$
|
50,035
|
|
$
|
51,043
|
|
||
Revenues derived from any customer did not exceed 10% of consolidated premiums, universal life and investment-type product policy fees and other revenues for the years ended December 31,
2016
,
2015
and
2014
.
3. Dispositions
2016 Disposition
In July 2016, MetLife, Inc. completed the sale to Massachusetts Mutual Life Insurance Company (“MassMutual”) of its U.S. retail advisor force and certain assets associated with the MetLife Premier Client Group, including all of the issued and outstanding shares of MetLife’s affiliated broker-dealer, MetLife Securities, Inc. (“MSI”), a wholly-owned subsidiary of MetLife, Inc. (collectively, the “U.S. Retail Advisor Force Divestiture”) for
$291 million
. MassMutual assumed all of the liabilities related to such assets that arise or occur after the closing of the sale. The Company recorded a gain of
$103 million
(
$58 million
, net of income tax), in net investment gains (losses) for the year ended
December 31, 2016
. See Notes
10
and
18
for discussion of certain charges related to the sale.
2014 Disposition
In May 2014, the Company completed the sale of its wholly-owned subsidiary, MetLife Assurance Limited (“MAL”), for
$702 million
(
£418 million
) in net cash consideration. As a result of the sale, a loss of
$633 million
(
$442 million
, net of income tax), was recorded for the year ended
December 31, 2014
, which includes a reduction to goodwill of
$60 million
(
$51 million
, net of income tax), as well as
$77 million
(
$50 million
, net of income tax) related to net investments in foreign operation hedges. The loss is reflected within net investment gains (losses) on the consolidated statements of operations and comprehensive income (loss). Compared to the expected loss at the time of the sales agreement, the actual loss on the sale was increased by net income from MAL of
$77 million
for the year ended December 31, 2014. MAL’s results of operations are included in continuing operations.
232
4. Insurance
Insurance Liabilities
Insurance liabilities are comprised of future policy benefits, policyholder account balances and other policy-related balances. Information regarding insurance liabilities by segment, as well as Corporate & Other, was as follows at:
|
December 31,
|
||||||||
|
2016
|
2015
|
|||||||
|
(In millions)
|
||||||||
|
U.S.
|
$
|
128,745
|
|
$
|
123,060
|
|
||
|
Asia
|
89,422
|
|
83,510
|
|
||||
|
Latin America
|
14,760
|
|
14,022
|
|
||||
|
EMEA
|
18,075
|
|
19,009
|
|
||||
|
MetLife Holdings
|
105,017
|
|
102,853
|
|
||||
|
Brighthouse Financial
|
73,999
|
|
71,853
|
|
||||
|
Corporate & Other
|
(5,426
|
)
|
(5,451
|
)
|
||||
|
Total
|
$
|
424,592
|
|
$
|
408,856
|
|
||
Future policy benefits are measured as follows:
|
Product Type:
|
Measurement Assumptions:
|
|
Participating life
|
Aggregate of (i) net level premium reserves for death and endowment policy benefits (calculated based upon the non-forfeiture interest rate, ranging from 3% to 7% for domestic business and less than 1% to 11% for international business and mortality rates guaranteed in calculating the cash surrender values described in such contracts); and (ii) the liability for terminal dividends for domestic business.
|
|
Nonparticipating life
|
Aggregate of the present value of expected future benefit payments and related expenses less the present value of expected future net premiums. Assumptions as to mortality and persistency are based upon the Company’s experience when the basis of the liability is established. Interest rate assumptions for the aggregate future policy benefit liabilities range from 2% to 11% for domestic business and less than 1% to 13% for international business.
|
|
I
ndividual and group
traditional fixed annuities
after annuitization
|
Present value of expected future payments. Interest rate assumptions used in establishing such liabilities range from 2% to 11% for domestic business and less than 1% to 12% for international business.
|
|
Non-medical health
insurance
|
The net level premium method and assumptions as to future morbidity, withdrawals and interest, which provide a margin for adverse deviation. Interest rate assumptions used in establishing such liabilities range from 4% to 7% (primarily related to domestic business).
|
|
Disabled lives
|
Present value of benefits method and experience assumptions as to claim terminations, expenses and interest. Interest rate assumptions used in establishing such liabilities range from 2% to 8% for domestic business and less than 1% to 9% for international business.
|
|
Property & casualty
insurance
|
The amount estimated for claims that have been reported but not settled and claims incurred but not reported are based upon the Company’s historical experience and other actuarial assumptions that consider the effects of current developments, anticipated trends and risk management programs, reduced for anticipated salvage and subrogation.
|
Participating business represented
4%
of the Company’s life insurance in-force at both December 31,
2016
and
2015
. Participating policies represented
18%
,
19%
and
18%
of gross traditional life insurance premiums for the years ended December 31,
2016
,
2015
and
2014
, respectively.
Policyholder account balances are equal to: (i) policy account values, which consist of an accumulation of gross premium payments and investment performance; (ii) credited interest, ranging from less than
1%
to
13%
for domestic business and less than
1%
to
15%
for international business, less expenses, mortality charges and withdrawals; and (iii) fair value adjustments relating to business combinations.
233
MetLife, Inc.
Notes to the Consolidated Financial Statements — (continued)
4. Insurance (continued)
Guarantees
The Company issues directly and assumes through reinsurance variable annuity products with guaranteed minimum benefits. GMABs and the portions of both non-life-contingent GMWBs and GMIBs that do not require annuitization are accounted for as embedded derivatives in policyholder account balances and are further discussed in
Note 9
. Guarantees accounted for as insurance liabilities include:
|
Guarantee:
|
Measurement Assumptions:
|
||||
|
GMDBs
|
•
|
A return of purchase payment upon death even if the account value is reduced to zero.
|
•
|
Present value of expected death benefits in excess of the projected account balance recognizing the excess ratably over the accumulation period based on the present value of total expected assessments.
|
|
|
•
|
An enhanced death benefit may be available for an additional fee.
|
•
|
Assumptions are consistent with those used for amortizing DAC, and are thus subject to the same variability and risk.
|
||
|
•
|
Investment performance and volatility assumptions are consistent with the historical experience of the appropriate underlying equity index, such as the S&P 500 Index.
|
||||
|
•
|
Benefit assumptions are based on the average benefits payable over a range of scenarios.
|
||||
|
GMIBs
|
•
|
After a specified period of time determined at the time of issuance of the variable annuity contract, a minimum accumulation of purchase payments, even if the account value is reduced to zero, that can be annuitized to receive a monthly income stream that is not less than a specified amount.
|
•
|
Present value of expected income benefits in excess of the projected account balance at any future date of annuitization and recognizing the excess ratably over the accumulation period based on present value of total expected assessments.
|
|
|
•
|
Certain contracts also provide for a guaranteed lump sum return of purchase premium in lieu of the annuitization benefit.
|
•
|
Assumptions are consistent with those used for estimating GMDB liabilities.
|
||
|
•
|
Calculation incorporates an assumption for the percentage of the potential annuitizations that may be elected by the contractholder.
|
||||
|
GMWBs
|
•
|
A return of purchase payment via partial withdrawals, even if the account value is reduced to zero, provided that cumulative withdrawals in a contract year do not exceed a certain limit.
|
•
|
Expected value of the life contingent payments and expected assessments using assumptions consistent with those used for estimating the GMDB liabilities.
|
|
|
•
|
Certain contracts include guaranteed withdrawals that are life contingent.
|
||||
The Company also issues other annuity contracts that apply a lower rate on funds deposited if the contractholder elects to surrender the contract for cash and a higher rate if the contractholder elects to annuitize. These guarantees include benefits that are payable in the event of death, maturity or at annuitization. Certain other annuity contracts contain guaranteed annuitization benefits that may be above what would be provided by the current account value of the contract. Additionally, the Company issues universal and variable life contracts where the Company contractually guarantees to the contractholder a secondary guarantee or a guaranteed paid-up benefit.
234
MetLife, Inc.
Notes to the Consolidated Financial Statements — (continued)
4. Insurance (continued)
Information regarding the liabilities for guarantees (excluding base policy liabilities and embedded derivatives) relating to annuity and universal and variable life contracts was as follows:
|
Annuity Contracts
|
Universal and Variable
Life Contracts |
||||||||||||||||||
|
GMDBs
|
GMIBs
|
Secondary
Guarantees |
Paid-Up
Guarantees |
Total
|
|||||||||||||||
|
(In millions)
|
|||||||||||||||||||
|
Direct and Assumed:
|
|||||||||||||||||||
|
Balance at January 1, 2014
|
$
|
685
|
|
$
|
1,851
|
|
$
|
4,698
|
|
$
|
266
|
|
$
|
7,500
|
|
||||
|
Incurred guaranteed benefits (1)
|
310
|
|
262
|
|
411
|
|
22
|
|
1,005
|
|
|||||||||
|
Paid guaranteed benefits
|
(59
|
)
|
—
|
|
(17
|
)
|
—
|
|
(76
|
)
|
|||||||||
|
Balance at December 31, 2014
|
936
|
|
2,113
|
|
5,092
|
|
288
|
|
8,429
|
|
|||||||||
|
Incurred guaranteed benefits (1)
|
319
|
|
417
|
|
452
|
|
18
|
|
1,206
|
|
|||||||||
|
Paid guaranteed benefits
|
(48
|
)
|
(1
|
)
|
(28
|
)
|
—
|
|
(77
|
)
|
|||||||||
|
Balance at December 31, 2015
|
1,207
|
|
2,529
|
|
5,516
|
|
306
|
|
9,558
|
|
|||||||||
|
Incurred guaranteed benefits (1)
|
440
|
|
409
|
|
1,044
|
|
25
|
|
1,918
|
|
|||||||||
|
Paid guaranteed benefits
|
(75
|
)
|
(1
|
)
|
(28
|
)
|
—
|
|
(104
|
)
|
|||||||||
|
Balance at December 31, 2016
|
$
|
1,572
|
|
$
|
2,937
|
|
$
|
6,532
|
|
$
|
331
|
|
$
|
11,372
|
|
||||
|
Ceded:
|
|
||||||||||||||||||
|
Balance at January 1, 2014
|
$
|
41
|
|
$
|
7
|
|
$
|
928
|
|
$
|
187
|
|
$
|
1,163
|
|
||||
|
Incurred guaranteed benefits
|
9
|
|
—
|
|
134
|
|
15
|
|
158
|
|
|||||||||
|
Paid guaranteed benefits
|
(12
|
)
|
—
|
|
—
|
|
—
|
|
(12
|
)
|
|||||||||
|
Balance at December 31, 2014
|
38
|
|
7
|
|
1,062
|
|
202
|
|
1,309
|
|
|||||||||
|
Incurred guaranteed benefits
|
32
|
|
—
|
|
195
|
|
13
|
|
240
|
|
|||||||||
|
Paid guaranteed benefits
|
(36
|
)
|
—
|
|
—
|
|
—
|
|
(36
|
)
|
|||||||||
|
Balance at December 31, 2015
|
34
|
|
7
|
|
1,257
|
|
215
|
|
1,513
|
|
|||||||||
|
Incurred guaranteed benefits
|
57
|
|
—
|
|
68
|
|
17
|
|
142
|
|
|||||||||
|
Paid guaranteed benefits
|
(51
|
)
|
—
|
|
—
|
|
—
|
|
(51
|
)
|
|||||||||
|
Balance at December 31, 2016
|
$
|
40
|
|
$
|
7
|
|
$
|
1,325
|
|
$
|
232
|
|
$
|
1,604
|
|
||||
|
Net:
|
|
||||||||||||||||||
|
Balance at January 1, 2014
|
$
|
644
|
|
$
|
1,844
|
|
$
|
3,770
|
|
$
|
79
|
|
$
|
6,337
|
|
||||
|
Incurred guaranteed benefits
|
301
|
|
262
|
|
277
|
|
7
|
|
847
|
|
|||||||||
|
Paid guaranteed benefits
|
(47
|
)
|
—
|
|
(17
|
)
|
—
|
|
(64
|
)
|
|||||||||
|
Balance at December 31, 2014
|
898
|
|
2,106
|
|
4,030
|
|
86
|
|
7,120
|
|
|||||||||
|
Incurred guaranteed benefits
|
287
|
|
417
|
|
257
|
|
5
|
|
966
|
|
|||||||||
|
Paid guaranteed benefits
|
(12
|
)
|
(1
|
)
|
(28
|
)
|
—
|
|
(41
|
)
|
|||||||||
|
Balance at December 31, 2015
|
1,173
|
|
2,522
|
|
4,259
|
|
91
|
|
8,045
|
|
|||||||||
|
Incurred guaranteed benefits
|
383
|
|
409
|
|
976
|
|
8
|
|
1,776
|
|
|||||||||
|
Paid guaranteed benefits
|
(24
|
)
|
(1
|
)
|
(28
|
)
|
—
|
|
(53
|
)
|
|||||||||
|
Balance at December 31, 2016
|
$
|
1,532
|
|
$
|
2,930
|
|
$
|
5,207
|
|
$
|
99
|
|
$
|
9,768
|
|
||||
__________________
|
(1)
|
Secondary guarantees include the effects of foreign currency translation of
$119 million
,
($80) million
and
($343) million
at
December 31, 2016
,
2015
and
2014
, respectively.
|
235
MetLife, Inc.
Notes to the Consolidated Financial Statements — (continued)
4. Insurance (continued)
Information regarding the Company’s guarantee exposure, which includes direct and assumed business, but excludes offsets from hedging or reinsurance, if any, was as follows at:
|
December 31,
|
|||||||||||||||||||||
|
2016
|
2015
|
||||||||||||||||||||
|
In the
Event of Death |
At
Annuitization |
In the
Event of Death |
At
Annuitization |
||||||||||||||||||
|
(Dollars in millions)
|
|||||||||||||||||||||
|
Annuity Contracts (1):
|
|||||||||||||||||||||
|
Variable Annuity Guarantees:
|
|||||||||||||||||||||
|
Total account value (2), (3)
|
$
|
177,895
|
|
$
|
89,839
|
|
$
|
181,413
|
|
$
|
91,240
|
|
|||||||||
|
Separate account value
|
$
|
150,118
|
|
$
|
86,355
|
|
$
|
151,901
|
|
$
|
87,841
|
|
|||||||||
|
Net amount at risk (2)
|
$
|
8,679
|
|
(4)
|
$
|
3,834
|
|
(5)
|
|
$
|
10,339
|
|
(4)
|
$
|
2,762
|
|
(5)
|
||||
|
Average attained age of contractholders
|
66 years
|
|
66 years
|
|
66 years
|
|
66 years
|
|
|||||||||||||
|
Other Annuity Guarantees:
|
|||||||||||||||||||||
|
Total account value (3)
|
N/A
|
|
$
|
1,393
|
|
N/A
|
|
$
|
1,560
|
|
|||||||||||
|
Net amount at risk
|
N/A
|
|
$
|
490
|
|
(6
|
)
|
N/A
|
|
$
|
422
|
|
(6)
|
||||||||
|
Average attained age of contractholders
|
N/A
|
|
50 years
|
|
N/A
|
|
51 years
|
|
|||||||||||||
|
December 31,
|
||||||||||||||||
|
2016
|
2015
|
|||||||||||||||
|
Secondary
Guarantees |
Paid-Up
Guarantees |
Secondary
Guarantees |
Paid-Up
Guarantees |
|||||||||||||
|
(Dollars in millions)
|
||||||||||||||||
|
Universal and Variable Life Contracts (1):
|
||||||||||||||||
|
Total account value (3)
|
$
|
17,689
|
|
$
|
3,337
|
|
$
|
17,211
|
|
$
|
3,461
|
|
||||
|
Net amount at risk (7)
|
$
|
172,860
|
|
$
|
17,785
|
|
$
|
175,958
|
|
$
|
19,047
|
|
||||
|
Average attained age of policyholders
|
58 years
|
|
62 years
|
|
57 years
|
|
62 years
|
|
||||||||
__________________
|
(1)
|
The Company’s annuity and life contracts with guarantees may offer more than one type of guarantee in each contract. Therefore, the amounts listed above may not be mutually exclusive.
|
|
(2)
|
Includes amounts, which are not reported on the consolidated balance sheets, from assumed reinsurance of certain variable annuity products from the Company’s former operating joint venture in Japan.
|
|
(3)
|
Includes the contractholder’s investments in the general account and separate account, if applicable.
|
|
(4)
|
Defined as the death benefit less the total account value, as of the balance sheet date. It represents the amount of the claim that the Company would incur if death claims were filed on all contracts on the balance sheet date and includes any additional contractual claims associated with riders purchased to assist with covering income taxes payable upon death.
|
|
(5)
|
Defined as the amount (if any) that would be required to be added to the total account value to purchase a lifetime income stream, based on current annuity rates, equal to the minimum amount provided under the guaranteed benefit. This amount represents the Company’s potential economic exposure to such guarantees in the event all contractholders were to annuitize on the balance sheet date, even though the contracts contain terms that allow annuitization of the guaranteed amount only after the 10th anniversary of the contract, which not all contractholders have achieved.
|
|
(6)
|
Defined as either the excess of the upper tier, adjusted for a profit margin, less the lower tier, as of the balance sheet date or the amount (if any) that would be required to be added to the total account value to purchase a lifetime income stream, based on current annuity rates, equal to the minimum amount provided under the guaranteed benefit. These amounts represent the Company’s potential economic exposure to such guarantees in the event all contractholders were to annuitize on the balance sheet date.
|
236
MetLife, Inc.
Notes to the Consolidated Financial Statements — (continued)
4. Insurance (continued)
|
(7)
|
Defined as the guarantee amount less the account value, as of the balance sheet date. It represents the amount of the claim that the Company would incur if death claims were filed on all contracts on the balance sheet date.
|
Account balances of contracts with guarantees were invested in separate account asset classes as follows at:
|
December 31,
|
||||||||
|
2016
|
2015
|
|||||||
|
(In millions)
|
||||||||
|
Fund Groupings:
|
||||||||
|
Balanced
|
$
|
77,991
|
|
$
|
79,473
|
|
||
|
Equity
|
68,400
|
|
69,973
|
|
||||
|
Bond
|
12,854
|
|
11,783
|
|
||||
|
Money Market
|
1,289
|
|
1,233
|
|
||||
|
Total
|
$
|
160,534
|
|
$
|
162,462
|
|
||
Obligations Under Funding Agreements
The Company issues fixed and floating rate funding agreements, which are denominated in either U.S. dollars or foreign currencies, to certain unconsolidated special purpose entities (“SPEs”) that have issued either debt securities or commercial paper for which payment of interest and principal is secured by such funding agreements. During the years ended December 31,
2016
,
2015
and
2014
, the Company issued
$41.1 billion
,
$48.1 billion
and
$48.9 billion
, respectively, and repaid
$42.0 billion
,
$49.9 billion
and
$45.6 billion
, respectively, of such funding agreements. At December 31,
2016
and
2015
, liabilities for funding agreements outstanding, which are included in policyholder account balances, were
$30.9 billion
and
$31.6 billion
, respectively.
Certain of the Company’s subsidiaries are members of regional banks in the Federal Home Loan Bank (“FHLB”) system (“FHLBanks”). Holdings of common stock of FHLBanks, included in equity securities, were as follows at:
|
December 31,
|
||||||||
|
2016
|
2015
|
|||||||
|
(In millions)
|
||||||||
|
FHLB of New York
|
$
|
748
|
|
$
|
666
|
|
||
|
FHLB of Des Moines
|
$
|
39
|
|
$
|
44
|
|
||
|
FHLB of Boston
|
$
|
27
|
|
$
|
36
|
|
||
|
FHLB of Pittsburgh
|
$
|
55
|
|
$
|
96
|
|
||
237
MetLife, Inc.
Notes to the Consolidated Financial Statements — (continued)
4. Insurance (continued)
Such subsidiaries have also entered into funding agreements with FHLBanks and the Federal Agricultural Mortgage Corporation, a federally chartered instrumentality of the U.S. (“Farmer Mac”). The liability for such funding agreements is included in policyholder account balances. Information related to such funding agreements was as follows at:
|
Liability
|
Collateral
|
|||||||||||||||||
|
December 31,
|
||||||||||||||||||
|
2016
|
2015
|
2016
|
2015
|
|||||||||||||||
|
(In millions)
|
||||||||||||||||||
|
FHLB of New York (1)
|
$
|
14,445
|
|
$
|
12,570
|
|
$
|
16,828
|
|
(2)
|
$
|
14,085
|
|
(2)
|
||||
|
Farmer Mac (3)
|
$
|
2,550
|
|
$
|
2,550
|
|
$
|
2,645
|
|
$
|
2,643
|
|
||||||
|
FHLB of Des Moines (1)
|
$
|
720
|
|
$
|
845
|
|
$
|
1,077
|
|
(2)
|
$
|
999
|
|
(2)
|
||||
|
FHLB of Boston (1)
|
$
|
50
|
|
$
|
250
|
|
$
|
144
|
|
(2)
|
$
|
311
|
|
(2)
|
||||
|
FHLB of Pittsburgh (1)
|
$
|
750
|
|
$
|
1,820
|
|
$
|
4,148
|
|
(2)
|
$
|
2,112
|
|
(2)
|
||||
|
(1)
|
Represents funding agreements issued to the applicable FHLBank in exchange for cash and for which such FHLBank has been granted a lien on certain assets, some of which are in the custody of such FHLBank, including residential mortgage-backed securities (“RMBS”), to collateralize obligations under advances evidenced by funding agreements. The Company is permitted to withdraw any portion of the collateral in the custody of such FHLBank as long as there is no event of default and the remaining qualified collateral is sufficient to satisfy the collateral maintenance level. Upon any event of default by the Company, such FHLBank’s recovery on the collateral is limited to the amount of the Company’s liability to such FHLBank.
|
|
(2)
|
Advances are collateralized by mortgage-backed securities. The amount of collateral presented is at estimated fair value.
|
|
(3)
|
Represents funding agreements issued to a subsidiary of Farmer Mac, as well as certain SPEs that have issued debt securities for which payment of interest and principal is secured by such funding agreements, and such debt securities are also guaranteed as to payment of interest and principal by Farmer Mac. The obligations under these funding agreements are secured by a pledge of certain eligible agricultural mortgage loans and may, under certain circumstances, be secured by other qualified collateral. The amount of collateral presented is at carrying value.
|
Liabilities for Unpaid Claims and Claim Expenses
The following is information about incurred and paid claims development by segment as of December 31, 2016. Such amounts are presented net of reinsurance, and are not discounted. The tables present claims development and cumulative claim payments by incurral year. The development tables are only presented for significant short-duration product liabilities within each segment. Where practical, up to 10 years of history has been provided. In order to eliminate potential fluctuations related to foreign exchange rates, liabilities and payments denominated in a foreign currency have been translated using the 2016 year end spot rates for all periods presented. The information about incurred and paid claims development prior to 2016 is presented as supplementary information, as described in
Note 1
.
238
MetLife, Inc.
Notes to the Consolidated Financial Statements — (continued)
4. Insurance (continued)
U.S.
Group Life - Term
|
Incurred Claims and Allocated Claim Adjustment Expense, Net of Reinsurance
|
At December 31, 2016
|
||||||||||||||||||||||||||||||
|
For the Years Ended December 31,
|
Total IBNR
Liabilities Plus
Expected
Development on
Reported Claims
|
Cumulative
Number of
Reported
Claims
|
|||||||||||||||||||||||||||||
|
(Unaudited)
|
|||||||||||||||||||||||||||||||
|
Incurral Year
|
2011
|
2012
|
2013
|
2014
|
2015
|
2016
|
|||||||||||||||||||||||||
|
(Dollars in millions)
|
|||||||||||||||||||||||||||||||
|
2011
|
$
|
6,318
|
|
$
|
6,290
|
|
$
|
6,293
|
|
$
|
6,269
|
|
$
|
6,287
|
|
$
|
6,295
|
|
$
|
3
|
|
207,139
|
|
||||||||
|
2012
|
6,503
|
|
6,579
|
|
6,569
|
|
6,546
|
|
6,568
|
|
3
|
|
208,441
|
|
|||||||||||||||||
|
2013
|
6,637
|
|
6,713
|
|
6,719
|
|
6,720
|
|
8
|
|
210,597
|
|
|||||||||||||||||||
|
2014
|
6,986
|
|
6,919
|
|
6,913
|
|
13
|
|
210,347
|
|
|||||||||||||||||||||
|
2015
|
7,040
|
|
7,015
|
|
27
|
|
210,838
|
|
|||||||||||||||||||||||
|
2016
|
7,125
|
|
825
|
|
184,085
|
|
|||||||||||||||||||||||||
|
Total
|
40,636
|
|
|||||||||||||||||||||||||||||
|
Cumulative paid claims and paid allocated claim adjustment expenses, net of reinsurance
|
(38,879
|
)
|
|||||||||||||||||||||||||||||
|
All outstanding liabilities for incurral years prior to 2011, net of reinsurance
|
12
|
|
|||||||||||||||||||||||||||||
|
Total unpaid claims and claim adjustment expenses, net of reinsurance
|
$
|
1,769
|
|
||||||||||||||||||||||||||||
|
Cumulative Paid Claims and Paid Allocated Claim Adjustment Expenses, Net of Reinsurance
|
||||||||||||||||||||||||
|
For the Years Ended December 31,
|
||||||||||||||||||||||||
|
(Unaudited)
|
||||||||||||||||||||||||
|
Incurral Year
|
2011
|
2012
|
2013
|
2014
|
2015
|
2016
|
||||||||||||||||||
|
(In millions)
|
||||||||||||||||||||||||
|
2011
|
$
|
4,982
|
|
$
|
6,194
|
|
$
|
6,239
|
|
$
|
6,256
|
|
$
|
6,281
|
|
$
|
6,290
|
|
||||||
|
2012
|
|
|
5,132
|
|
6,472
|
|
6,518
|
|
6,532
|
|
6,558
|
|
||||||||||||
|
2013
|
|
|
|
|
5,216
|
|
6,614
|
|
6,664
|
|
6,678
|
|
||||||||||||
|
2014
|
|
|
|
|
|
|
5,428
|
|
6,809
|
|
6,858
|
|
||||||||||||
|
2015
|
|
|
|
|
|
|
|
|
5,524
|
|
6,913
|
|
||||||||||||
|
2016
|
|
|
|
|
|
|
|
|
|
|
5,582
|
|
||||||||||||
|
Total cumulative paid claims and paid allocated claim adjustment expenses, net of reinsurance
|
$
|
38,879
|
|
|||||||||||||||||||||
Average Annual Percentage Payout
The following is supplementary information about average historical claims duration as of December 31, 2016:
|
Average Annual Percentage Payout of Incurred Claims by Age, Net of Reinsurance
|
||||||||||||||||||
|
Years
|
1
|
2
|
3
|
4
|
5
|
6
|
||||||||||||
|
Group Life - Term
|
78.4
|
%
|
20.0
|
%
|
0.7
|
%
|
0.2
|
%
|
0.4
|
%
|
0.2
|
%
|
||||||
239
MetLife, Inc.
Notes to the Consolidated Financial Statements — (continued)
4. Insurance (continued)
Group Long-Term Disability
|
Incurred Claims and Allocated Claim Adjustment Expense, Net of Reinsurance
|
At December 31, 2016
|
||||||||||||||||||||||||||||||
|
For the Years Ended December 31,
|
Total IBNR
Liabilities Plus
Expected
Development on
Reported Claims
|
Cumulative
Number of
Reported
Claims
|
|||||||||||||||||||||||||||||
|
(Unaudited)
|
|||||||||||||||||||||||||||||||
|
Incurral Year
|
2011
|
2012
|
2013
|
2014
|
2015
|
2016
|
|||||||||||||||||||||||||
|
(Dollars in millions)
|
|||||||||||||||||||||||||||||||
|
2011
|
$
|
955
|
|
$
|
916
|
|
$
|
894
|
|
$
|
914
|
|
$
|
924
|
|
$
|
923
|
|
$
|
—
|
|
21,187
|
|
||||||||
|
2012
|
966
|
|
979
|
|
980
|
|
1,014
|
|
1,034
|
|
—
|
|
19,502
|
|
|||||||||||||||||
|
2013
|
1,008
|
|
1,027
|
|
1,032
|
|
1,049
|
|
—
|
|
20,547
|
|
|||||||||||||||||||
|
2014
|
1,076
|
|
1,077
|
|
1,079
|
|
6
|
|
22,233
|
|
|||||||||||||||||||||
|
2015
|
1,082
|
|
1,105
|
|
29
|
|
18,172
|
|
|||||||||||||||||||||||
|
2016
|
1,131
|
|
534
|
|
8,960
|
|
|||||||||||||||||||||||||
|
Total
|
6,321
|
|
|||||||||||||||||||||||||||||
|
Cumulative paid claims and paid allocated claim adjustment expenses, net of reinsurance
|
(2,277
|
)
|
|||||||||||||||||||||||||||||
|
All outstanding liabilities for incurral years prior to 2011, net of reinsurance
|
2,933
|
|
|||||||||||||||||||||||||||||
|
Total unpaid claims and claim adjustment expenses, net of reinsurance
|
$
|
6,977
|
|
||||||||||||||||||||||||||||
|
Cumulative Paid Claims and Paid Allocated Claim Adjustment Expenses, Net of Reinsurance
|
||||||||||||||||||||||||
|
For the Years Ended December 31,
|
||||||||||||||||||||||||
|
(Unaudited)
|
||||||||||||||||||||||||
|
Incurral Year
|
2011
|
2012
|
2013
|
2014
|
2015
|
2016
|
||||||||||||||||||
|
(In millions)
|
||||||||||||||||||||||||
|
2011
|
$
|
44
|
|
$
|
217
|
|
$
|
337
|
|
$
|
411
|
|
$
|
478
|
|
$
|
537
|
|
||||||
|
2012
|
43
|
|
229
|
|
365
|
|
453
|
|
524
|
|
||||||||||||||
|
2013
|
43
|
|
234
|
|
382
|
|
475
|
|
||||||||||||||||
|
2014
|
51
|
|
266
|
|
428
|
|
||||||||||||||||||
|
2015
|
50
|
|
264
|
|
||||||||||||||||||||
|
2016
|
49
|
|
||||||||||||||||||||||
|
Total cumulative paid claims and paid allocated claim adjustment expenses, net of reinsurance
|
$
|
2,277
|
|
|||||||||||||||||||||
Average Annual Percentage Payout
The following is supplementary information about average historical claims duration as of December 31, 2016:
|
Average Annual Percentage Payout of Incurred Claims by Age, Net of Reinsurance
|
||||||||||||||||||
|
Years
|
1
|
|
2
|
|
3
|
|
4
|
|
5
|
|
6
|
|
||||||
|
Group Long-Term Disability
|
4.4
|
%
|
18.9
|
%
|
13.8
|
%
|
8.4
|
%
|
7.1
|
%
|
6.3
|
%
|
||||||
Significant Methodologies and Assumptions
Group Life - Term and Group Long-Term Disability incurred but not paid (“IBNP”) liabilities are developed using a combination of loss ratio and development methods. Claims in the course of settlement are then subtracted from the IBNP liabilities resulting in the IBNR liabilities. The loss ratio method is used in the period in which the claims are neither sufficient nor credible. In developing the loss ratios, any material rate increases that could change the underlying premium without affecting the estimated incurred losses are taken into account. For periods where sufficient and credible claim data exists, the development method is used based on the claim triangles which categorize claims according to both the period in which they were incurred and the period in which they were paid, adjudicated or reported. The end result is a triangle of known data that is used to develop known completion ratios and factors. Claims paid are then subtracted from the estimated ultimate incurred claims to calculate the IBNP liability.
An expense liability is held for the future expenses associated with the payment of incurred but not yet paid claims (IBNR and pending). This is expressed as a percentage of the underlying claims liability and is based on past experience and the anticipated future expense structure.
240
MetLife, Inc.
Notes to the Consolidated Financial Statements — (continued)
4. Insurance (continued)
For Group Life - Term and Group Long-Term Disability, first year incurred claims and allocated loss adjustment expenses increased in 2016 compared to the 2015 incurral year due to the growth in the size of the business.
There were no significant changes in methodologies during 2016. The assumptions used in calculating the unpaid claims and claim adjustment expenses for Group Life - Term and Group Long-Term Disability are updated annually to reflect emerging trends in claim experience.
No additional premiums or return premiums have been accrued as a result of the prior year development.
Liabilities for Group Life - Term unpaid claims and claim adjustment expenses are not discounted.
The liabilities for Group Long-Term Disability unpaid claims and claim adjustment expenses were
$5.8 billion
and
$5.5 billion
at December 31,
2016
and
2015
, respectively. These amounts were discounted using interest rates ranging from
3%
to
8%
, based on the incurral year. The total discount applied to these liabilities was
$1.3 billion
at both December 31, 2016 and 2015. The amount of interest accretion recognized was
$565 million
,
$517 million
and
$481 million
for the years ended December 31, 2016, 2015 and 2014, respectively. These amounts were reflected in policyholder benefits and claims.
For Group Life - Term, claims were based upon individual death claims. For Group Long-Term Disability, claim frequency was determined by the number of reported claims as identified by a unique claim number assigned to individual claimants. Claim counts initially include claims that do not ultimately result in a liability. These claims are omitted from the claim counts once it is determined that there is no liability.
The Group Long-Term Disability IBNR included in the development tables above, was developed using discounted cash flows, and is presented on a discounted basis.
Property & Casualty - Auto Liability
|
Incurred Claims and Allocated Claim Adjustment Expense, Net of Reinsurance
|
At December 31, 2016
|
||||||||||||||||||||||||||||||||||||||||||||||
|
For the Years Ended December 31,
|
Total IBNR
Liabilities Plus
Expected
Development on
Reported Claims
|
Cumulative
Number of
Reported
Claims
|
|||||||||||||||||||||||||||||||||||||||||||||
|
(Unaudited)
|
|||||||||||||||||||||||||||||||||||||||||||||||
|
Incurral Year
|
2007
|
2008
|
2009
|
2010
|
2011
|
2012
|
2013
|
2014
|
2015
|
2016
|
|||||||||||||||||||||||||||||||||||||
|
(Dollars in millions)
|
|||||||||||||||||||||||||||||||||||||||||||||||
|
2007
|
$
|
861
|
|
$
|
840
|
|
$
|
825
|
|
$
|
804
|
|
$
|
786
|
|
$
|
784
|
|
$
|
781
|
|
$
|
780
|
|
$
|
780
|
|
$
|
780
|
|
$
|
—
|
|
207,285
|
|
||||||||||||
|
2008
|
818
|
|
839
|
|
828
|
|
805
|
|
799
|
|
794
|
|
793
|
|
791
|
|
790
|
|
—
|
|
200,514
|
|
|||||||||||||||||||||||||
|
2009
|
862
|
|
877
|
|
853
|
|
826
|
|
823
|
|
817
|
|
815
|
|
815
|
|
1
|
|
201,577
|
|
|||||||||||||||||||||||||||
|
2010
|
863
|
|
873
|
|
853
|
|
847
|
|
833
|
|
826
|
|
825
|
|
3
|
|
202,094
|
|
|||||||||||||||||||||||||||||
|
2011
|
863
|
|
876
|
|
869
|
|
855
|
|
846
|
|
843
|
|
3
|
|
202,494
|
|
|||||||||||||||||||||||||||||||
|
2012
|
882
|
|
881
|
|
869
|
|
851
|
|
846
|
|
6
|
|
196,900
|
|
|||||||||||||||||||||||||||||||||
|
2013
|
911
|
|
900
|
|
882
|
|
878
|
|
10
|
|
201,192
|
|
|||||||||||||||||||||||||||||||||||
|
2014
|
897
|
|
910
|
|
913
|
|
25
|
|
203,233
|
|
|||||||||||||||||||||||||||||||||||||
|
2015
|
975
|
|
984
|
|
66
|
|
206,368
|
|
|||||||||||||||||||||||||||||||||||||||
|
2016
|
1,012
|
|
160
|
|
192,197
|
|
|||||||||||||||||||||||||||||||||||||||||
|
Total
|
8,686
|
|
|||||||||||||||||||||||||||||||||||||||||||||
|
Cumulative paid claims and paid allocated claim adjustment expenses, net of reinsurance
|
(7,509
|
)
|
|||||||||||||||||||||||||||||||||||||||||||||
|
All outstanding liabilities for incurral years prior to 2007, net of reinsurance
|
28
|
|
|||||||||||||||||||||||||||||||||||||||||||||
|
Total unpaid claims and claim adjustment expenses, net of reinsurance
|
$
|
1,205
|
|
||||||||||||||||||||||||||||||||||||||||||||
241
MetLife, Inc.
Notes to the Consolidated Financial Statements — (continued)
4. Insurance (continued)
|
Cumulative Paid Claims and Paid Allocated Claim Adjustment Expenses, Net of Reinsurance
|
||||||||||||||||||||||||||||||||||||||||
|
For the Years Ended December 31,
|
||||||||||||||||||||||||||||||||||||||||
|
(Unaudited)
|
||||||||||||||||||||||||||||||||||||||||
|
Incurral Year
|
2007
|
2008
|
2009
|
2010
|
2011
|
2012
|
2013
|
2014
|
2015
|
2016
|
||||||||||||||||||||||||||||||
|
(In millions)
|
||||||||||||||||||||||||||||||||||||||||
|
2007
|
$
|
299
|
|
$
|
535
|
|
$
|
649
|
|
$
|
715
|
|
$
|
751
|
|
$
|
765
|
|
$
|
773
|
|
$
|
777
|
|
$
|
778
|
|
$
|
779
|
|
||||||||||
|
2008
|
304
|
|
553
|
|
657
|
|
725
|
|
764
|
|
778
|
|
785
|
|
787
|
|
788
|
|
||||||||||||||||||||||
|
2009
|
321
|
|
563
|
|
681
|
|
755
|
|
789
|
|
803
|
|
810
|
|
813
|
|
||||||||||||||||||||||||
|
2010
|
319
|
|
572
|
|
695
|
|
762
|
|
796
|
|
810
|
|
816
|
|
||||||||||||||||||||||||||
|
2011
|
324
|
|
590
|
|
711
|
|
777
|
|
810
|
|
825
|
|
||||||||||||||||||||||||||||
|
2012
|
333
|
|
600
|
|
715
|
|
783
|
|
815
|
|
||||||||||||||||||||||||||||||
|
2013
|
346
|
|
618
|
|
743
|
|
809
|
|
||||||||||||||||||||||||||||||||
|
2014
|
352
|
|
648
|
|
777
|
|
||||||||||||||||||||||||||||||||||
|
2015
|
384
|
|
691
|
|
||||||||||||||||||||||||||||||||||||
|
2016
|
396
|
|
||||||||||||||||||||||||||||||||||||||
|
Total cumulative paid claims and paid allocated claim adjustment expenses, net of reinsurance
|
$
|
7,509
|
|
|||||||||||||||||||||||||||||||||||||
Average Annual Percentage Payout
The following is supplementary information about average historical claims duration as of December 31, 2016:
|
Average Annual Percentage Payout of Incurred Claims by Age, Net of Reinsurance
|
||||||||||||||||||||||||||||||
|
Years
|
1
|
2
|
3
|
4
|
5
|
6
|
7
|
8
|
9
|
10
|
||||||||||||||||||||
|
Auto Liability
|
38.9
|
%
|
31.1
|
%
|
14.2
|
%
|
8.2
|
%
|
4.2
|
%
|
1.7
|
%
|
0.9
|
%
|
0.4
|
%
|
0.2
|
%
|
0.1
|
%
|
||||||||||
Property & Casualty - Home
|
Incurred Claims and Allocated Claim Adjustment Expense, Net of Reinsurance
|
At December 31, 2016
|
||||||||||||||||||||||||||||||||||||||||||||||
|
For the Years Ended December 31,
|
Total IBNR
Liabilities Plus
Expected
Development on
Reported Claims
|
Cumulative
Number of
Reported
Claims
|
|||||||||||||||||||||||||||||||||||||||||||||
|
(Unaudited)
|
|||||||||||||||||||||||||||||||||||||||||||||||
|
Incurral Year
|
2007
|
2008
|
2009
|
2010
|
2011
|
2012
|
2013
|
2014
|
2015
|
2016
|
|||||||||||||||||||||||||||||||||||||
|
(Dollars in millions)
|
|||||||||||||||||||||||||||||||||||||||||||||||
|
2007
|
$
|
445
|
|
$
|
436
|
|
$
|
423
|
|
$
|
421
|
|
$
|
415
|
|
$
|
414
|
|
$
|
414
|
|
$
|
414
|
|
$
|
412
|
|
$
|
412
|
|
$
|
—
|
|
86,408
|
|
||||||||||||
|
2008
|
644
|
|
636
|
|
599
|
|
590
|
|
588
|
|
589
|
|
588
|
|
586
|
|
585
|
|
—
|
|
127,474
|
|
|||||||||||||||||||||||||
|
2009
|
506
|
|
523
|
|
510
|
|
507
|
|
503
|
|
501
|
|
498
|
|
497
|
|
—
|
|
106,614
|
|
|||||||||||||||||||||||||||
|
2010
|
573
|
|
589
|
|
587
|
|
584
|
|
582
|
|
581
|
|
580
|
|
2
|
|
115,495
|
|
|||||||||||||||||||||||||||||
|
2011
|
891
|
|
868
|
|
843
|
|
840
|
|
835
|
|
835
|
|
2
|
|
166,443
|
|
|||||||||||||||||||||||||||||||
|
2012
|
714
|
|
713
|
|
703
|
|
698
|
|
696
|
|
4
|
|
146,512
|
|
|||||||||||||||||||||||||||||||||
|
2013
|
654
|
|
652
|
|
635
|
|
635
|
|
5
|
|
107,469
|
|
|||||||||||||||||||||||||||||||||||
|
2014
|
707
|
|
702
|
|
704
|
|
8
|
|
113,448
|
|
|||||||||||||||||||||||||||||||||||||
|
2015
|
759
|
|
753
|
|
18
|
|
106,650
|
|
|||||||||||||||||||||||||||||||||||||||
|
2016
|
740
|
|
60
|
|
98,986
|
|
|||||||||||||||||||||||||||||||||||||||||
|
Total
|
6,437
|
|
|||||||||||||||||||||||||||||||||||||||||||||
|
Cumulative paid claims and paid allocated claim adjustment expenses, net of reinsurance
|
(6,210
|
)
|
|||||||||||||||||||||||||||||||||||||||||||||
|
All outstanding liabilities for incurral years prior to 2007, net of reinsurance
|
2
|
|
|||||||||||||||||||||||||||||||||||||||||||||
|
Total unpaid claims and claim adjustment expenses, net of reinsurance
|
$
|
229
|
|
||||||||||||||||||||||||||||||||||||||||||||
242
MetLife, Inc.
Notes to the Consolidated Financial Statements — (continued)
4. Insurance (continued)
|
Cumulative Paid Claims and Paid Allocated Claim Adjustment Expenses, Net of Reinsurance
|
||||||||||||||||||||||||||||||||||||||||
|
For the Years Ended December 31,
|
||||||||||||||||||||||||||||||||||||||||
|
(Unaudited)
|
||||||||||||||||||||||||||||||||||||||||
|
Incurral Year
|
2007
|
2008
|
2009
|
2010
|
2011
|
2012
|
2013
|
2014
|
2015
|
2016
|
||||||||||||||||||||||||||||||
|
(In millions)
|
||||||||||||||||||||||||||||||||||||||||
|
2007
|
$
|
303
|
|
$
|
385
|
|
|
$
|
399
|
|
$
|
405
|
|
$
|
408
|
|
$
|
409
|
|
$
|
411
|
|
$
|
412
|
|
$
|
412
|
|
$
|
412
|
|
|||||||||
|
2008
|
446
|
|
|
558
|
|
574
|
|
579
|
|
582
|
|
583
|
|
584
|
|
584
|
|
584
|
|
|||||||||||||||||||||
|
2009
|
385
|
|
476
|
|
486
|
|
492
|
|
495
|
|
495
|
|
496
|
|
496
|
|
||||||||||||||||||||||||
|
2010
|
436
|
|
546
|
|
562
|
|
571
|
|
574
|
|
577
|
|
578
|
|
||||||||||||||||||||||||||
|
2011
|
690
|
|
804
|
|
819
|
|
825
|
|
827
|
|
830
|
|
||||||||||||||||||||||||||||
|
2012
|
559
|
|
668
|
|
681
|
|
687
|
|
689
|
|
||||||||||||||||||||||||||||||
|
2013
|
505
|
|
604
|
|
618
|
|
626
|
|
||||||||||||||||||||||||||||||||
|
2014
|
574
|
|
670
|
|
685
|
|
||||||||||||||||||||||||||||||||||
|
2015
|
603
|
|
717
|
|
||||||||||||||||||||||||||||||||||||
|
2016
|
593
|
|
||||||||||||||||||||||||||||||||||||||
|
Total cumulative paid claims and paid allocated claim adjustment expenses, net of reinsurance
|
$
|
6,210
|
|
|||||||||||||||||||||||||||||||||||||
Average Annual Percentage Payout
The following is supplementary information about average historical claims duration as of December 31, 2016:
|
Average Annual Percentage Payout of Incurred Claims by Age, Net of Reinsurance
|
|||||||||||||||||||||||||||||||
|
Years
|
1
|
|
2
|
|
3
|
|
4
|
|
5
|
|
$
|
6
|
|
7
|
|
8
|
|
9
|
|
10
|
|
||||||||||
|
Home
|
78.7
|
%
|
16.6
|
%
|
2.4
|
%
|
1.1
|
%
|
0.5
|
%
|
0.3
|
%
|
0.2
|
%
|
0.2
|
%
|
—
|
%
|
—
|
%
|
|||||||||||
Significant Methodologies and Assumptions
The liability for unpaid claim and claim adjustment expenses for the Property & Casualty business is determined by examining the historical claims and allocated claim adjustment expenses data. This data, which is gross of salvage and subrogation, is classified by incurral year and coverage and includes paid claims data and reported liabilities. For homeowners and auto liability injury claims, the reported liabilities are set by the Company’s claims adjusters based on the individual case, and a supplemental liability is added based on the historical development of reported claims. These supplemental liabilities are estimated by coverage based on adjusted report year data triangles developed to ultimate claim liability. Adjustments are made for settlement rates and average case liabilities. For auto non-injury claims, the Company holds an average statistical liability for every reported claim. This statistical liability is based on an estimated average payment that varies by coverage, report year and state. These average estimated payments are updated monthly.
For all property and casualty coverages, many actuarial methods such as adjusted loss development (adjusted for settlement rates and average case liabilities) and loss ratio methods are employed to develop a best estimate of the IBNR for each coverage type. Similar actuarial methods are used to determine the best estimate of the expected salvage and subrogation; methods that look at recoveries by age and ratios of recoveries to paid loss are compared for each coverage. A liability for unpaid allocated claim adjustment expenses is held for the future claim adjustment costs associated with the payment of incurred but not yet paid claims. This liability is calculated as a percentage of the underlying unpaid claims liability. The percentage is based on historical ratios of essential claim department expenses compared with paid losses.
There were no significant changes in methodologies or assumptions during 2016.
No additional premiums or return premiums have been accrued as a result of the prior year development.
Liabilities for unpaid claims and claim adjustment expenses were not discounted.
The cumulative number of reported claims for auto liability coverages are counted by individual coverages (i.e. bodily injury and property damage) and, if multiple occupants are injured, then each injury is counted as a separate claim. For home coverages, each exposure is counted separately, so a house fire would, for example, have separate claim counts for the building, the contents, and additional living expenses. Claim counts include claims that do not ultimately result in a liability. Any liability established upon receipt of these claims would subsequently be reversed.
243
MetLife, Inc.
Notes to the Consolidated Financial Statements — (continued)
4. Insurance (continued)
Asia
Group Disability & Group Life
|
Incurred Claims and Allocated Claim Adjustment Expense, Net of Reinsurance
|
At December 31, 2016
|
||||||||||||||||||||||||||||||||||
|
For the Years Ended December 31,
|
Total IBNR
Liabilities Plus
Expected
Development on
Reported Claims
|
Cumulative
Number of
Reported
Claims
|
|||||||||||||||||||||||||||||||||
|
(Unaudited)
|
|||||||||||||||||||||||||||||||||||
|
Incurral Year
|
2010
|
2011
|
2012
|
2013
|
2014
|
2015
|
2016
|
||||||||||||||||||||||||||||
|
(Dollars in millions)
|
|||||||||||||||||||||||||||||||||||
|
2010
|
$
|
76
|
|
$
|
72
|
|
$
|
77
|
|
$
|
99
|
|
$
|
99
|
|
$
|
96
|
|
$
|
125
|
|
$
|
20
|
|
2,717
|
|
|||||||||
|
2011
|
72
|
|
62
|
|
82
|
|
82
|
|
87
|
|
115
|
|
21
|
|
1,863
|
|
|||||||||||||||||||
|
2012
|
91
|
|
96
|
|
95
|
|
109
|
|
110
|
|
11
|
|
2,014
|
|
|||||||||||||||||||||
|
2013
|
137
|
|
139
|
|
161
|
|
156
|
|
30
|
|
2,379
|
|
|||||||||||||||||||||||
|
2014
|
274
|
|
259
|
|
240
|
|
70
|
|
3,173
|
|
|||||||||||||||||||||||||
|
2015
|
258
|
|
248
|
|
102
|
|
2,667
|
|
|||||||||||||||||||||||||||
|
2016
|
213
|
|
151
|
|
1,441
|
|
|||||||||||||||||||||||||||||
|
Total
|
1,207
|
|
|||||||||||||||||||||||||||||||||
|
Cumulative paid claims and paid allocated claim adjustment expenses, net of reinsurance
|
(795
|
)
|
|||||||||||||||||||||||||||||||||
|
All outstanding liabilities for incurral years prior to 2010, net of reinsurance
|
41
|
|
|||||||||||||||||||||||||||||||||
|
Total unpaid claims and claim adjustment expenses, net of reinsurance
|
$
|
453
|
|
||||||||||||||||||||||||||||||||
|
Cumulative Paid Claims and Paid Allocated Claim Adjustment Expenses, Net of Reinsurance
|
||||||||||||||||||||||||||||
|
For the Years Ended December 31,
|
||||||||||||||||||||||||||||
|
(Unaudited)
|
||||||||||||||||||||||||||||
|
Incurral Year
|
2010
|
2011
|
2012
|
2013
|
2014
|
2015
|
2016
|
|||||||||||||||||||||
|
(In millions)
|
||||||||||||||||||||||||||||
|
2010
|
$
|
19
|
|
$
|
37
|
|
$
|
49
|
|
$
|
60
|
|
$
|
73
|
|
$
|
82
|
|
$
|
106
|
|
|||||||
|
2011
|
12
|
|
37
|
|
50
|
|
62
|
|
75
|
|
94
|
|
||||||||||||||||
|
2012
|
28
|
|
60
|
|
79
|
|
91
|
|
99
|
|
||||||||||||||||||
|
2013
|
41
|
|
92
|
|
112
|
|
126
|
|
||||||||||||||||||||
|
2014
|
64
|
|
133
|
|
167
|
|
||||||||||||||||||||||
|
2015
|
75
|
|
142
|
|
||||||||||||||||||||||||
|
2016
|
61
|
|
||||||||||||||||||||||||||
|
Total cumulative paid claims and paid allocated claim adjustment expenses, net of reinsurance
|
$
|
795
|
|
|||||||||||||||||||||||||
Average Annual Percentage Payout
The following is supplementary information about average historical claims duration as of December 31, 2016:
|
Average Annual Percentage Payout of Incurred Claims by Age, Net of Reinsurance
|
|||||||||||||||||||||
|
Years
|
1
|
|
2
|
|
3
|
|
4
|
|
5
|
|
6
|
|
7
|
|
|||||||
|
Group Disability & Group Life
|
23.2
|
%
|
25.7
|
%
|
13.2
|
%
|
9.7
|
%
|
9.5
|
%
|
11.8
|
%
|
18.8
|
%
|
|||||||
Significant Methodologies and Assumptions
This business line consists of employer sponsored and industry sponsored Group Life and Group Disability risks.
For Group Life, the IBNR liability is determined by using the Bornhuetter-Ferguson Method, with factors derived by examining the experience of historical claims. A pending liability is also calculated for claims that have been reported but have not been paid. A claim eligibility ratio based on past experience is applied to the face amount of individual claims.
244
MetLife, Inc.
Notes to the Consolidated Financial Statements — (continued)
4. Insurance (continued)
For Group Disability, the IBNR liability is calculated as a percentage of premiums in-force based on the expected delay as evidenced by the experience in the portfolio. This is then allocated back into different incurral years based on an assumed run-off. A claims in course of payment liability is also calculated for claims that have been admitted and are in the course of payment. The assumptions employed are based on the economic conditions, industry experience and adjusted for the Company’s own experience.
An expense liability is held for the future expenses associated with the payment of incurred but not yet paid claims. This is expressed as a percentage of the underlying claims liability and is based on past experience and the future expense structure.
The prior year estimates of ultimate losses were significantly higher in 2016 as a result of losing a litigation case relating to a reinsurance contract. In light of the court ruling, the Company reconsidered the carrying value of the reinsurance receivable in relation to the disputed amounts and any future reinsurance recovery and concluded that it is no longer appropriate to assume
50%
recovery from the reinsurer in relation to current or future disputed claims. For other contracts, estimates of ultimate losses for recent years were lower due to improving claims experience.
There were no significant changes in methodologies or assumptions during 2016.
No additional premiums or return premiums have been accrued as a result of the prior year development.
The liabilities for unpaid claims and claim adjustment expenses were
$627 million
and
$619 million
at December 31, 2016 and 2015, respectively. These amounts were discounted using interest rates ranging from
3%
to
7%
, based on the incurral year. The total discount applied to these liabilities was
$42 million
and
$41 million
at December 31, 2016 and 2015, respectively. The amount of interest accretion recognized was
$22 million
,
$20 million
and
$16 million
for the years ended December 31, 2016, 2015 and 2014, respectively. These amounts were reflected in policyholder benefits and claims.
The Company tracks claim frequency by the number of reported claims as identified by a unique claim number assigned to individual claimants. Claim counts include claims that do not ultimately result in a liability. A liability is only established for those claims that are expected to result in a liability, based on historical factors.
Latin America
Protection Life
|
Incurred Claims and Allocated Claim Adjustment Expense, Net of Reinsurance
|
At December 31, 2016
|
||||||||||||||||||||||||||||||||||||||||||
|
For the Years Ended December 31,
|
Total IBNR
Liabilities Plus
Expected
Development on
Reported
Claims
|
Cumulative
Number of
Reported
Claims
|
|||||||||||||||||||||||||||||||||||||||||
|
(Unaudited)
|
|||||||||||||||||||||||||||||||||||||||||||
|
Incurral Year
|
2008
|
2009
|
2010
|
2011
|
2012
|
2013
|
2014
|
2015
|
2016
|
||||||||||||||||||||||||||||||||||
|
(Dollars in millions)
|
|||||||||||||||||||||||||||||||||||||||||||
|
2008
|
$
|
201
|
|
$
|
267
|
|
$
|
271
|
|
$
|
273
|
|
$
|
273
|
|
$
|
273
|
|
$
|
273
|
|
$
|
274
|
|
$
|
274
|
|
$
|
—
|
|
32,175
|
|
|||||||||||
|
2009
|
228
|
|
308
|
|
312
|
|
314
|
|
314
|
|
314
|
|
314
|
|
314
|
|
—
|
|
32,470
|
|
|||||||||||||||||||||||
|
2010
|
250
|
|
322
|
|
329
|
|
330
|
|
330
|
|
330
|
|
330
|
|
—
|
|
33,001
|
|
|||||||||||||||||||||||||
|
2011
|
323
|
|
224
|
|
230
|
|
231
|
|
232
|
|
232
|
|
—
|
|
27,667
|
|
|||||||||||||||||||||||||||
|
2012
|
155
|
|
210
|
|
215
|
|
217
|
|
218
|
|
—
|
|
28,088
|
|
|||||||||||||||||||||||||||||
|
2013
|
172
|
|
240
|
|
247
|
|
248
|
|
1
|
|
32,048
|
|
|||||||||||||||||||||||||||||||
|
2014
|
245
|
|
369
|
|
380
|
|
3
|
|
40,661
|
|
|||||||||||||||||||||||||||||||||
|
2015
|
320
|
|
456
|
|
15
|
|
45,852
|
|
|||||||||||||||||||||||||||||||||||
|
2016
|
350
|
|
163
|
|
28,762
|
|
|||||||||||||||||||||||||||||||||||||
|
Total
|
2,802
|
|
|||||||||||||||||||||||||||||||||||||||||
|
Cumulative paid claims and paid allocated claim adjustment expenses, net of reinsurance
|
(2,500
|
)
|
|||||||||||||||||||||||||||||||||||||||||
|
All outstanding liabilities for incurral years prior to 2008, net of reinsurance
|
39
|
|
|||||||||||||||||||||||||||||||||||||||||
|
Total unpaid claims and claim adjustment expenses, net of reinsurance
|
$
|
341
|
|
||||||||||||||||||||||||||||||||||||||||
245
MetLife, Inc.
Notes to the Consolidated Financial Statements — (continued)
4. Insurance (continued)
|
Cumulative Paid Claims and Paid Allocated Claim Adjustment Expenses, Net of Reinsurance
|
||||||||||||||||||||||||||||||||||||
|
For the Years Ended December 31,
|
||||||||||||||||||||||||||||||||||||
|
(Unaudited)
|
||||||||||||||||||||||||||||||||||||
|
Incurral Year
|
2008
|
2009
|
2010
|
2011
|
2012
|
2013
|
2014
|
2015
|
2016
|
|||||||||||||||||||||||||||
|
(In millions)
|
||||||||||||||||||||||||||||||||||||
|
2008
|
$
|
198
|
|
$
|
262
|
|
$
|
266
|
|
$
|
267
|
|
$
|
268
|
|
$
|
268
|
|
$
|
268
|
|
$
|
268
|
|
$
|
268
|
|
|||||||||
|
2009
|
226
|
|
300
|
|
305
|
|
306
|
|
306
|
|
306
|
|
306
|
|
306
|
|
||||||||||||||||||||
|
2010
|
230
|
|
301
|
|
307
|
|
308
|
|
308
|
|
309
|
|
309
|
|
||||||||||||||||||||||
|
2011
|
144
|
|
219
|
|
225
|
|
226
|
|
226
|
|
227
|
|
||||||||||||||||||||||||
|
2012
|
153
|
|
207
|
|
212
|
|
213
|
|
214
|
|
||||||||||||||||||||||||||
|
2013
|
168
|
|
233
|
|
238
|
|
239
|
|
||||||||||||||||||||||||||||
|
2014
|
220
|
|
326
|
|
331
|
|
||||||||||||||||||||||||||||||
|
2015
|
263
|
|
368
|
|
||||||||||||||||||||||||||||||||
|
2016
|
238
|
|
||||||||||||||||||||||||||||||||||
|
Total cumulative paid claims and paid allocated claim adjustment expenses, net of reinsurance
|
$
|
2,500
|
|
|||||||||||||||||||||||||||||||||
Average Annual Percentage Payout
The following is supplementary information about average historical claims duration as of December 31, 2016:
|
Average Annual Percentage Payout of Incurred Claims by Age, Net of Reinsurance
|
|||||||||||||||||||||||||||
|
Years
|
1
|
|
2
|
|
3
|
|
4
|
|
5
|
|
6
|
|
7
|
|
8
|
|
9
|
|
|||||||||
|
Protection Life
|
66.4
|
%
|
25.4
|
%
|
1.9
|
%
|
0.4
|
%
|
0.2
|
%
|
0.1
|
%
|
—
|
%
|
—
|
%
|
—
|
%
|
|||||||||
Protection Health
|
Incurred Claims and Allocated Claim Adjustment Expense, Net of Reinsurance
|
At December 31, 2016
|
||||||||||||||||||||||||||||||||||||||||||
|
For the Years Ended December 31,
|
Total IBNR
Liabilities Plus
Expected
Development on
Reported
Claims
|
Cumulative
Number of
Reported
Claims
|
|||||||||||||||||||||||||||||||||||||||||
|
(Unaudited)
|
|||||||||||||||||||||||||||||||||||||||||||
|
Incurral Year
|
2008
|
2009
|
2010
|
2011
|
2012
|
2013
|
2014
|
2015
|
2016
|
||||||||||||||||||||||||||||||||||
|
(Dollars in millions)
|
|||||||||||||||||||||||||||||||||||||||||||
|
2008
|
$
|
127
|
|
$
|
142
|
|
$
|
144
|
|
$
|
144
|
|
$
|
144
|
|
$
|
145
|
|
$
|
145
|
|
$
|
145
|
|
$
|
145
|
|
$
|
—
|
|
91,276
|
|
|||||||||||
|
2009
|
146
|
|
163
|
|
165
|
|
165
|
|
166
|
|
166
|
|
166
|
|
166
|
|
4
|
|
92,466
|
|
|||||||||||||||||||||||
|
2010
|
172
|
|
192
|
|
193
|
|
194
|
|
194
|
|
194
|
|
194
|
|
—
|
|
96,316
|
|
|||||||||||||||||||||||||
|
2011
|
192
|
|
229
|
|
231
|
|
232
|
|
232
|
|
232
|
|
—
|
|
105,917
|
|
|||||||||||||||||||||||||||
|
2012
|
199
|
|
224
|
|
226
|
|
226
|
|
227
|
|
3
|
|
99,446
|
|
|||||||||||||||||||||||||||||
|
2013
|
216
|
|
244
|
|
245
|
|
246
|
|
30
|
|
103,077
|
|
|||||||||||||||||||||||||||||||
|
2014
|
224
|
|
249
|
|
251
|
|
24
|
|
96,075
|
|
|||||||||||||||||||||||||||||||||
|
2015
|
192
|
|
219
|
|
71
|
|
84,206
|
|
|||||||||||||||||||||||||||||||||||
|
2016
|
253
|
|
825
|
|
89,884
|
|
|||||||||||||||||||||||||||||||||||||
|
Total
|
1,933
|
|
|||||||||||||||||||||||||||||||||||||||||
|
Cumulative paid claims and paid allocated claim adjustment expenses, net of reinsurance
|
(1,915
|
)
|
|||||||||||||||||||||||||||||||||||||||||
|
All outstanding liabilities for incurral years prior to 2008, net of reinsurance
|
51
|
|
|||||||||||||||||||||||||||||||||||||||||
|
Total unpaid claims and claim adjustment expenses, net of reinsurance
|
$
|
69
|
|
||||||||||||||||||||||||||||||||||||||||
246
MetLife, Inc.
Notes to the Consolidated Financial Statements — (continued)
4. Insurance (continued)
|
Cumulative Paid Claims and Paid Allocated Claim Adjustment Expenses, Net of Reinsurance
|
||||||||||||||||||||||||||||||||||||
|
For the Years Ended December 31,
|
||||||||||||||||||||||||||||||||||||
|
(Unaudited)
|
||||||||||||||||||||||||||||||||||||
|
Incurral Year
|
2008
|
2009
|
2010
|
2011
|
2012
|
2013
|
2014
|
2015
|
2016
|
|||||||||||||||||||||||||||
|
(In millions)
|
||||||||||||||||||||||||||||||||||||
|
2008
|
$
|
127
|
|
$
|
142
|
|
$
|
144
|
|
$
|
144
|
|
$
|
144
|
|
$
|
145
|
|
$
|
145
|
|
$
|
145
|
|
$
|
145
|
|
|||||||||
|
2009
|
146
|
|
163
|
|
165
|
|
165
|
|
166
|
|
166
|
|
166
|
|
166
|
|
||||||||||||||||||||
|
2010
|
172
|
|
192
|
|
193
|
|
194
|
|
194
|
|
194
|
|
194
|
|
||||||||||||||||||||||
|
2011
|
206
|
|
229
|
|
231
|
|
232
|
|
232
|
|
232
|
|
||||||||||||||||||||||||
|
2012
|
199
|
|
224
|
|
226
|
|
226
|
|
227
|
|
||||||||||||||||||||||||||
|
2013
|
216
|
|
244
|
|
245
|
|
246
|
|
||||||||||||||||||||||||||||
|
2014
|
222
|
|
247
|
|
249
|
|
||||||||||||||||||||||||||||||
|
2015
|
192
|
|
219
|
|
||||||||||||||||||||||||||||||||
|
2016
|
237
|
|
||||||||||||||||||||||||||||||||||
|
Total cumulative paid claims and paid allocated claim adjustment expenses, net of reinsurance
|
$
|
1,915
|
|
|||||||||||||||||||||||||||||||||
Average Annual Percentage Payout
The following is supplementary information about average historical claims duration as of December 31, 2016:
|
Average Annual Percentage Payout of Incurred Claims by Age, Net of Reinsurance
|
|||||||||||||||||||||||||||
|
Years
|
1
|
|
2
|
|
3
|
|
4
|
|
5
|
|
6
|
|
7
|
|
8
|
|
9
|
|
|||||||||
|
Protection Health
|
88.8
|
%
|
10.7
|
%
|
0.7
|
%
|
0.3
|
%
|
0.2
|
%
|
0.1
|
%
|
0.1
|
%
|
—
|
%
|
0.1
|
%
|
|||||||||
Significant Methodologies and Assumptions
The Latin America segment establishes liabilities for unpaid losses, which are equal to the accumulation of unpaid reported claims, plus an estimate for claims incurred but not reported.
In general terms, for both the Protection Life and Protection Health products, the methodology for IBNR is a weighted loss ratio combined with the Bornhuetter-Ferguson Method. The factors are derived by examining the experience of historical claims. In the initial months, the credibility is higher on premiums and lower on claims. As the premiums are earned, the credibility grows for the factors. For one major medical Protection Health product, a different methodology is employed, which estimates the IBNR based on a percentage of policy cancellations and the accrued premium.
For Protection Health products, claim duration can be very long due to the multiple incidences over time that may occur for a single claim. The number of claims reported per year is based on the original claim occurrence date for each individual claim. Any subsequent claims that are considered part of the original claim occurrence are not counted as a new claim. For Protection Life products, claims were based upon individual death claims.
During 2016, there was an increase in first year incurred claims and allocated loss adjustment expenses as compared to 2015 due to an increase in claims duration experience for one product and due to an overall increase in sales of certain plan sponsored and individual protection health products.
There were no significant changes in methodologies or assumptions during 2016.
No additional premiums or return premiums have been accrued as a result of the prior year development.
Liabilities for unpaid claims and claim adjustment expenses were not discounted.
For Protection Life and Protection Health products, claim counts initially include claims that do not ultimately result in a liability. These claims are omitted from the claim counts once it is determined that there is no liability.
247
MetLife, Inc.
Notes to the Consolidated Financial Statements — (continued)
4. Insurance (continued)
Reconciliation of the Disclosure of Incurred and Paid Claims Development to the Liability for Unpaid Claims and Claim Adjustment Expenses
The reconciliation of the net incurred and paid claims development tables to the liability for unpaid claims and claims adjustment expenses on the consolidated balance sheet were as follows at:
|
December 31, 2016
|
|||||||
|
(In millions)
|
|||||||
|
Short-Duration:
|
|||||||
|
Unpaid claims and allocated claims adjustment expenses, net of reinsurance:
|
|||||||
|
U.S.:
|
|||||||
|
Group Life - Term
|
$
|
1,769
|
|
||||
|
Group Long-Term Disability
|
6,977
|
|
|||||
|
Property & Casualty - Auto
|
1,205
|
|
|||||
|
Property & Casualty - Home
|
229
|
|
|||||
|
Total
|
$
|
10,180
|
|
||||
|
Asia - Group Disability & Group Life
|
453
|
|
|||||
|
Latin America:
|
|||||||
|
Protection Life
|
341
|
|
|||||
|
Protection Health
|
69
|
|
|||||
|
Total
|
410
|
|
|||||
|
Other insurance lines - all segments combined
|
888
|
|
|||||
|
Total unpaid claims and allocated claims adjustment expenses, net of reinsurance
|
11,931
|
|
|||||
|
Reinsurance recoverables on unpaid claims:
|
|||||||
|
U.S.:
|
|||||||
|
Group Life - Term
|
21
|
|
|||||
|
Group Long-Term Disability
|
74
|
|
|||||
|
Property & Casualty - Auto
|
80
|
|
|||||
|
Property & Casualty - Home
|
4
|
|
|||||
|
Total
|
179
|
|
|||||
|
Asia - Group Disability & Group Life
|
216
|
|
|||||
|
Latin America:
|
|||||||
|
Protection Life
|
1
|
|
|||||
|
Protection Health
|
2
|
|
|||||
|
Total
|
3
|
|
|||||
|
Other insurance lines - all segments combined
|
193
|
|
|||||
|
Total reinsurance recoverable on unpaid claims
|
591
|
|
|||||
|
Total unpaid claims and allocated claims adjustment expense
|
12,522
|
|
|||||
|
Unallocated claims adjustment expenses
|
103
|
|
|||||
|
Discounting
|
(1,319
|
)
|
|||||
|
Liability for unpaid claims and claim adjustment liabilities - short-duration
|
11,306
|
|
|||||
|
Liability for unpaid claims and claim adjustment liabilities - all long-duration lines
|
6,853
|
|
|||||
|
Total liability for unpaid claims and claim adjustment expense (included in future policy benefits and other policy-related balances)
|
$
|
18,159
|
|
||||
248
MetLife, Inc.
Notes to the Consolidated Financial Statements — (continued)
4. Insurance (continued)
Rollforward of Claims and Claim Adjustment Expenses
Information regarding the liabilities for unpaid claims and claim adjustment expenses was as follows:
|
Years Ended December 31,
|
||||||||||||
|
2016
|
2015 (1)
|
2014 (1)
|
||||||||||
|
(In millions)
|
||||||||||||
|
Balance at December 31,
|
$
|
11,388
|
|
$
|
11,036
|
|
$
|
10,630
|
|
|||
|
Less: Reinsurance recoverables
|
2,042
|
|
1,876
|
|
1,661
|
|
||||||
|
Net balance at December 31,
|
9,346
|
|
9,160
|
|
8,969
|
|
||||||
|
Cumulative adjustment (2)
|
4,988
|
|
—
|
|
—
|
|
||||||
|
Net balance at January 1,
|
14,334
|
|
9,160
|
|
8,969
|
|
||||||
|
Incurred related to:
|
||||||||||||
|
Current year
|
25,085
|
|
9,639
|
|
9,358
|
|
||||||
|
Prior years (3)
|
369
|
|
(78
|
)
|
(70
|
)
|
||||||
|
Total incurred
|
25,454
|
|
9,561
|
|
9,288
|
|
||||||
|
Paid related to:
|
||||||||||||
|
Current year
|
(17,356
|
)
|
(6,788
|
)
|
(6,714
|
)
|
||||||
|
Prior years
|
(7,331
|
)
|
(2,587
|
)
|
(2,383
|
)
|
||||||
|
Total paid
|
(24,687
|
)
|
(9,375
|
)
|
(9,097
|
)
|
||||||
|
Net balance at December 31,
|
15,101
|
|
9,346
|
|
9,160
|
|
||||||
|
Add: Reinsurance recoverables
|
3,058
|
|
2,042
|
|
1,876
|
|
||||||
|
Balance at December 31,
|
$
|
18,159
|
|
$
|
11,388
|
|
$
|
11,036
|
|
|||
__________________
|
(1)
|
Limited to property & casualty, group accident and non-medical health policies and contracts.
|
|
(2)
|
Reflects the accumulated adjustment, net of reinsurance, upon implementation of the new short-duration contracts guidance which clarified the requirement to include claim information for long-duration contracts. The accumulated adjustment primarily reflects unpaid claim liabilities, net of reinsurance, for long-duration contracts as of the beginning of the period presented. Prior periods have not been restated.
See
Note 1
.
|
|
(3)
|
During 2016,
as a result of changes in estimates of insured events in the respective prior year, claims and claim adjustment expenses associated with prior years
increased due to the implementation of new guidance related to short-
duration contracts. During 2015 and 2014, as a result of changes in estimates of insured events in the respective prior year, claims and claim adjustment expenses associated with prior years decreased due to a reduction in prior year automobile bodily injury and homeowners’ severity.
|
Separate Accounts
Separate account assets and liabilities include two categories of account types: pass-through separate accounts totaling
$247.5 billion
and
$244.6 billion
at December 31,
2016
and
2015
, respectively, for which the policyholder assumes all investment risk, and separate accounts for which the Company contractually guarantees either a minimum return or account value to the policyholder which totaled
$61.1 billion
and
$57.0 billion
at December 31,
2016
and
2015
, respectively. The latter category consisted primarily of guaranteed interest contracts. The average interest rate credited on these contracts was
2.35%
and
2.37%
at December 31,
2016
and
2015
, respectively.
For the years ended December 31,
2016
,
2015
and
2014
, there were
no
investment gains (losses) on transfers of assets from the general account to the separate accounts.
249
5. Deferred Policy Acquisition Costs, Value of Business Acquired and Other Intangibles
See
Note 1
for a description of capitalized acquisition costs.
Nonparticipating and Non-Dividend-Paying Traditional Contracts
The Company amortizes DAC and VOBA related to these contracts (term insurance, nonparticipating whole life insurance, traditional group life insurance, non-medical health insurance, and accident & health insurance) over the appropriate premium paying period in proportion to the actual and expected future gross premiums that were set at contract issue. The expected premiums are based upon the premium requirement of each policy and assumptions for mortality, morbidity, persistency and investment returns at policy issuance, or policy acquisition (as it relates to VOBA), include provisions for adverse deviation, and are consistent with the assumptions used to calculate future policyholder benefit liabilities. These assumptions are not revised after policy issuance or acquisition unless the DAC or VOBA balance is deemed to be unrecoverable from future expected profits. Absent a premium deficiency, variability in amortization after policy issuance or acquisition is caused only by variability in premium volumes.
Participating, Dividend-Paying Traditional Contracts
The Company amortizes DAC and VOBA related to these contracts over the estimated lives of the contracts in proportion to actual and expected future gross margins. The amortization includes interest based on rates in effect at inception or acquisition of the contracts. The future gross margins are dependent principally on investment returns, policyholder dividend scales, mortality, persistency, expenses to administer the business, creditworthiness of reinsurance counterparties and certain economic variables, such as inflation. For participating contracts within the closed block (dividend-paying traditional contracts) future gross margins are also dependent upon changes in the policyholder dividend obligation. See
Note 7
. Of these factors, the Company anticipates that investment returns, expenses, persistency and other factor changes, as well as policyholder dividend scales, are reasonably likely to impact significantly the rate of DAC and VOBA amortization. Each reporting period, the Company updates the estimated gross margins with the actual gross margins for that period. When the actual gross margins change from previously estimated gross margins, the cumulative DAC and VOBA amortization is re-estimated and adjusted by a cumulative charge or credit to current operations. When actual gross margins exceed those previously estimated, the DAC and VOBA amortization will increase, resulting in a current period charge to earnings. The opposite result occurs when the actual gross margins are below the previously estimated gross margins. Each reporting period, the Company also updates the actual amount of business in-force, which impacts expected future gross margins. When expected future gross margins are below those previously estimated, the DAC and VOBA amortization will increase, resulting in a current period charge to earnings. The opposite result occurs when the expected future gross margins are above the previously estimated expected future gross margins. Each period, the Company also reviews the estimated gross margins for each block of business to determine the recoverability of DAC and VOBA balances.
Fixed and Variable Universal Life Contracts and Fixed and Variable Deferred Annuity Contracts
The Company amortizes DAC and VOBA related to these contracts over the estimated lives of the contracts in proportion to actual and expected future gross profits. The amortization includes interest based on rates in effect at inception or acquisition of the contracts. The amount of future gross profits is dependent principally upon returns in excess of the amounts credited to policyholders, mortality, persistency, interest crediting rates, expenses to administer the business, creditworthiness of reinsurance counterparties, the effect of any hedges used and certain economic variables, such as inflation. Of these factors, the Company anticipates that investment returns, expenses and persistency are reasonably likely to significantly impact the rate of DAC and VOBA amortization. Each reporting period, the Company updates the estimated gross profits with the actual gross profits for that period. When the actual gross profits change from previously estimated gross profits, the cumulative DAC and VOBA amortization is re-estimated and adjusted by a cumulative charge or credit to current operations. When actual gross profits exceed those previously estimated, the DAC and VOBA amortization will increase, resulting in a current period charge to earnings. The opposite result occurs when the actual gross profits are below the previously estimated gross profits. Each reporting period, the Company also updates the actual amount of business remaining in-force, which impacts expected future gross profits. When expected future gross profits are below those previously estimated, the DAC and VOBA amortization will increase, resulting in a current period charge to earnings. The opposite result occurs when the expected future gross profits are above the previously estimated expected future gross profits. Each period, the Company also reviews the estimated gross profits for each block of business to determine the recoverability of DAC and VOBA balances.
Credit Insurance, Property & Casualty Insurance and Other Short-Duration Contracts
The Company amortizes DAC for these contracts, which is primarily composed of commissions and certain underwriting expenses, in proportion to actual and future earned premium over the applicable contract term.
250
MetLife, Inc.
Notes to the Consolidated Financial Statements — (continued)
5. Deferred Policy Acquisition Costs, Value of Business Acquired and Other Intangibles (continued)
Factors Impacting Amortization
Separate account rates of return on variable universal life contracts and variable deferred annuity contracts affect in-force account balances on such contracts each reporting period, which can result in significant fluctuations in amortization of DAC and VOBA. Returns that are higher than the Company’s long-term expectation produce higher account balances, which increases the Company’s future fee expectations and decreases future benefit payment expectations on minimum death and living benefit guarantees, resulting in higher expected future gross profits. The opposite result occurs when returns are lower than the Company’s long-term expectation. The Company’s practice to determine the impact of gross profits resulting from returns on separate accounts assumes that long-term appreciation in equity markets is not changed by short-term market fluctuations, but is only changed when sustained interim deviations are expected. The Company monitors these events and only changes the assumption when its long-term expectation changes.
The Company also periodically reviews other long-term assumptions underlying the projections of estimated gross margins and profits. These assumptions primarily relate to investment returns, policyholder dividend scales, interest crediting rates, mortality, persistency, policyholder behavior and expenses to administer business. Management annually updates assumptions used in the calculation of estimated gross margins and profits which may have significantly changed. If the update of assumptions causes expected future gross margins and profits to increase, DAC and VOBA amortization will decrease, resulting in a current period increase to earnings. The opposite result occurs when the assumption update causes expected future gross margins and profits to decrease.
Periodically, the Company modifies product benefits, features, rights or coverages that occur by the exchange of a contract for a new contract, or by amendment, endorsement, or rider to a contract, or by election or coverage within a contract. If such modification, referred to as an internal replacement, substantially changes the contract, the associated DAC or VOBA is written off immediately through income and any new deferrable costs associated with the replacement contract are deferred. If the modification does not substantially change the contract, the DAC or VOBA amortization on the original contract will continue and any acquisition costs associated with the related modification are expensed.
Amortization of DAC and VOBA is attributed to net investment gains (losses) and net derivative gains (losses), and to other expenses for the amount of gross margins or profits originating from transactions other than investment gains and losses. Unrealized investment gains and losses represent the amount of DAC and VOBA that would have been amortized if such gains and losses had been recognized.
251
MetLife, Inc.
Notes to the Consolidated Financial Statements — (continued)
5. Deferred Policy Acquisition Costs, Value of Business Acquired and Other Intangibles (continued)
Information regarding DAC and VOBA was as follows:
|
Years Ended December 31,
|
|||||||||||
|
2016
|
2015
|
2014
|
|||||||||
|
(In millions)
|
|||||||||||
|
DAC:
|
|||||||||||
|
Balance at January 1,
|
$
|
19,465
|
|
$
|
18,984
|
|
$
|
19,774
|
|
||
|
Capitalizations
|
3,589
|
|
3,837
|
|
4,183
|
|
|||||
|
Amortization related to:
|
|||||||||||
|
Net investment gains (losses) and net derivative gains (losses)
|
1,628
|
|
11
|
|
(39
|
)
|
|||||
|
Other expenses
|
(3,819
|
)
|
(3,354
|
)
|
(3,372
|
)
|
|||||
|
Total amortization
|
(2,191
|
)
|
(3,343
|
)
|
(3,411
|
)
|
|||||
|
Unrealized investment gains (losses)
|
(196
|
)
|
539
|
|
(676
|
)
|
|||||
|
Effect of foreign currency translation and other
|
(300
|
)
|
(552
|
)
|
(886
|
)
|
|||||
|
Balance at December 31,
|
20,367
|
|
19,465
|
|
18,984
|
|
|||||
|
VOBA:
|
|||||||||||
|
Balance at January 1,
|
4,665
|
|
5,458
|
|
6,932
|
|
|||||
|
Amortization related to:
|
|||||||||||
|
Net investment gains (losses) and net derivative gains (losses)
|
(1
|
)
|
(20
|
)
|
(1
|
)
|
|||||
|
Other expenses
|
(449
|
)
|
(573
|
)
|
(720
|
)
|
|||||
|
Total amortization
|
(450
|
)
|
(593
|
)
|
(721
|
)
|
|||||
|
Unrealized investment gains (losses)
|
38
|
|
99
|
|
(26
|
)
|
|||||
|
Effect of foreign currency translation and other
|
178
|
|
(299
|
)
|
(727
|
)
|
|||||
|
Balance at December 31,
|
4,431
|
|
4,665
|
|
5,458
|
|
|||||
|
Total DAC and VOBA:
|
|||||||||||
|
Balance at December 31,
|
$
|
24,798
|
|
$
|
24,130
|
|
$
|
24,442
|
|
||
Information regarding total DAC and VOBA by segment, as well as Corporate & Other, was as follows at:
|
December 31,
|
|||||||
|
2016
|
2015
|
||||||
|
(In millions)
|
|||||||
|
U.S.
|
$
|
616
|
|
$
|
615
|
|
|
|
Asia
|
8,707
|
|
8,374
|
|
|||
|
Latin America
|
1,808
|
|
1,753
|
|
|||
|
EMEA
|
1,472
|
|
1,532
|
|
|||
|
MetLife Holdings
|
5,246
|
|
5,436
|
|
|||
|
Brighthouse Financial
|
6,921
|
|
6,390
|
|
|||
|
Corporate & Other
|
28
|
|
30
|
|
|||
|
Total
|
$
|
24,798
|
|
$
|
24,130
|
|
|
252
MetLife, Inc.
Notes to the Consolidated Financial Statements — (continued)
5. Deferred Policy Acquisition Costs, Value of Business Acquired and Other Intangibles (continued)
Information regarding other intangibles was as follows:
|
Years Ended December 31,
|
||||||||||||
|
2016
|
2015
|
2014
|
||||||||||
|
(In millions)
|
||||||||||||
|
DSI:
|
||||||||||||
|
Balance at January 1,
|
$
|
774
|
|
$
|
810
|
|
$
|
950
|
|
|||
|
Capitalization
|
25
|
|
31
|
|
56
|
|
||||||
|
Amortization
|
(111
|
)
|
(106
|
)
|
(130
|
)
|
||||||
|
Unrealized investment gains (losses)
|
(2
|
)
|
39
|
|
(64
|
)
|
||||||
|
Effect of foreign currency translation
|
—
|
|
—
|
|
(2
|
)
|
||||||
|
Balance at December 31,
|
$
|
686
|
|
$
|
774
|
|
$
|
810
|
|
|||
|
VODA and VOCRA:
|
||||||||||||
|
Balance at January 1,
|
$
|
719
|
|
$
|
847
|
|
$
|
975
|
|
|||
|
Amortization
|
(73
|
)
|
(75
|
)
|
(82
|
)
|
||||||
|
Effect of foreign currency translation
|
(17
|
)
|
(53
|
)
|
(46
|
)
|
||||||
|
Balance at December 31,
|
$
|
629
|
|
$
|
719
|
|
$
|
847
|
|
|||
|
Accumulated amortization
|
$
|
648
|
|
$
|
575
|
|
$
|
500
|
|
|||
|
Negative VOBA:
|
||||||||||||
|
Balance at January 1,
|
$
|
1,193
|
|
$
|
1,596
|
|
$
|
2,162
|
|
|||
|
Amortization
|
(269
|
)
|
(361
|
)
|
(442
|
)
|
||||||
|
Effect of foreign currency translation and other
|
11
|
|
(42
|
)
|
(124
|
)
|
||||||
|
Balance at December 31,
|
$
|
935
|
|
$
|
1,193
|
|
$
|
1,596
|
|
|||
|
Accumulated amortization
|
$
|
3,034
|
|
$
|
2,765
|
|
$
|
2,404
|
|
|||
The estimated future amortization expense (credit) to be reported in other expenses for the next five years is as follows:
|
VOBA
|
VODA and VOCRA
|
Negative VOBA
|
||||||||||
|
(In millions)
|
||||||||||||
|
2017
|
$
|
435
|
|
$
|
66
|
|
$
|
(131
|
)
|
|||
|
2018
|
$
|
388
|
|
$
|
60
|
|
$
|
(55
|
)
|
|||
|
2019
|
$
|
350
|
|
$
|
56
|
|
$
|
(38
|
)
|
|||
|
2020
|
$
|
303
|
|
$
|
51
|
|
$
|
(39
|
)
|
|||
|
2021
|
$
|
268
|
|
$
|
46
|
|
$
|
(38
|
)
|
|||
6. Reinsurance
The Company enters into reinsurance agreements primarily as a purchaser of reinsurance for its various insurance products and also as a provider of reinsurance for some insurance products issued by third parties. The Company participates in reinsurance activities in order to limit losses, minimize exposure to significant risks and provide additional capacity for future growth.
Accounting for reinsurance requires extensive use of assumptions and estimates, particularly related to the future performance of the underlying business and the potential impact of counterparty credit risks. The Company periodically reviews actual and anticipated experience compared to the aforementioned assumptions used to establish assets and liabilities relating to ceded and assumed reinsurance and evaluates the financial strength of counterparties to its reinsurance agreements using criteria similar to that evaluated in the security impairment process discussed in Note
8
.
253
MetLife, Inc.
Notes to the Consolidated Financial Statements — (continued)
6. Reinsurance (continued)
U.S.
For its Group Benefits business, the Company generally retains most of the risk and only cedes particular risk on certain client arrangements. The majority of the Company’s reinsurance activity within this business relates to client agreements for employer sponsored captive programs, risk-sharing agreements and multinational pooling.
The Company, through its Property & Casualty business, purchases reinsurance to manage its exposure to large losses (primarily catastrophe losses) and to protect statutory surplus. The Company cedes losses and premiums based upon the exposure of the policies subject to reinsurance. To manage exposure to large property & casualty losses, the Company purchases property catastrophe, casualty and property per risk excess of loss reinsurance protection.
The Company’s Retirement and Income Solutions business has periodically engaged in reinsurance activities, on an opportunistic basis. There were no such transactions during the periods presented.
Asia, Latin America and EMEA
For certain life insurance products, the Company currently reinsures risks in excess of
$5 million
to external reinsurers on a yearly renewable term basis. The Company may also reinsure certain risks with external reinsurers depending upon the nature of the risk and local regulatory requirements. For selected large corporate clients, the Company reinsures group employee benefits or credit insurance business with various client-affiliated reinsurance companies, covering policies issued to the employees or customers of the clients. Additionally, the Company cedes and assumes risk with other insurance companies when either company requires a business partner with the appropriate local licensing to issue certain types of policies in certain countries. In these cases, the assuming company typically underwrites the risks, develops the products and assumes most or all of the risk. The Company also has reinsurance agreements in-force that reinsure a portion of the living and death benefit guarantees issued in connection with variable annuity products. Under these agreements, the Company pays reinsurance fees associated with the guarantees collected from policyholders, and receives reimbursement for benefits paid or accrued in excess of account values, subject to certain limitations.
MetLife Holdings
For its life products, the Company has historically reinsured the mortality risk primarily on an excess of retention basis or on a quota share basis. The Company currently reinsures
90%
of the mortality risk in excess of
$2 million
for most products. In addition to reinsuring mortality risk as described above, the Company reinsures other risks, as well as specific coverages. Placement of reinsurance is done primarily on an automatic basis and also on a facultative basis for risks with specified characteristics. On a case by case basis, the Company may retain up to
$20 million
per life and reinsure
100%
of amounts in excess of the amount the Company retains. The Company also assumes portions of the risk associated with certain whole life policies issued by an affiliate and reinsures certain term life policies and universal life policies with secondary death benefit guarantees to an affiliate. The Company evaluates its reinsurance programs routinely and may increase or decrease its retention at any time.
For annuities, the Company reinsures
100%
of the living and death benefit guarantees issued in connection with certain variable annuities issued since 2004 to an affiliate and portions of the living and death benefit guarantees issued in connection with its variable annuities issued prior to 2004 to affiliated and unaffiliated reinsurers. Under these reinsurance agreements, the Company pays a reinsurance premium generally based on fees associated with the guarantees collected from policyholders, and receives reimbursement for benefits paid or accrued in excess of account values, subject to certain limitations. The value of embedded derivatives on the ceded risk is determined using a methodology consistent with the guarantees directly written by the Company with the exception of the input for nonperformance risk that reflects the credit of the reinsurer. The Company also assumes
100%
of certain variable annuity risks issued by certain affiliates.
In addition, the Company has
a reinsurance agreement in-force to reinsure the living and death benefit guarantees issued in connection with certain variable annuity products. Under this agreement, the Company receives reinsurance fees associated with the guarantees collected from policyholders, and provides reimbursement for benefits paid or accrued in excess of account values, subject to certain limitations.
254
MetLife, Inc.
Notes to the Consolidated Financial Statements — (continued)
6. Reinsurance (continued)
Brighthouse Financial
For its life products, the Company has historically reinsured the mortality risk primarily on an excess of retention basis or on a quota share basis. The Company currently reinsures
90%
of the mortality risk in excess of
$2 million
for most products. In addition to reinsuring mortality risk as described above, the Company reinsures other risks, as well as specific coverages. Placement of reinsurance is done primarily on an automatic basis and also on a facultative basis for risks with specified characteristics. On a case by case basis, the Company may retain up to
$20 million
per life and reinsure
100%
of amounts in excess of the amount the Company retains. The Company also reinsures portions of the risk associated with certain whole life policies to an affiliate and assumes certain term life policies and universal life policies with secondary death benefit guarantees issued by an affiliate. The Company evaluates its reinsurance programs routinely and may increase or decrease its retention at any time.
For annuities, the Company reinsures portions of the living and death benefit guarantees issued in connection with certain variable annuities to unaffiliated reinsurers. Under these reinsurance agreements, the Company pays a reinsurance
premium generally based on fees associated with the guarantees collected from policyholders, and receives reimbursement for benefits paid or accrued in excess of account values, subject to certain limitations.
The value of embedded derivatives on the ceded risk is determined using a methodology consistent with the guarantees directly written by the Company with the exception of the input for nonperformance risk that reflects the credit of the reinsurer.
The Company reinsures
100%
of certain variable annuity risks to an affiliate. The Company also assumes
100%
of the living and death benefit guarantees issued in connection with certain variable annuities issued by certain affiliates.
The Company also reinsures, through
100%
quota share reinsurance agreements, certain run-off long-term care and workers’ compensation business written by MetLife USA.
Catastrophe Coverage
The Company has exposure to catastrophes which could contribute to significant fluctuations in the Company’s results of operations. Currently, for Asia, Latin America and EMEA, the Company purchases catastrophe coverage to insure risks within certain countries deemed by management to be exposed to the greatest catastrophic risks. For all other segments, the Company uses excess of retention and quota share reinsurance agreements to provide greater diversification of risk and minimize exposure to larger risks.
Reinsurance Recoverables
The Company reinsures its business through a diversified group of well-capitalized reinsurers. The Company analyzes recent trends in arbitration and litigation outcomes in disputes, if any, with its reinsurers. The Company monitors ratings and evaluates the financial strength of its reinsurers by analyzing their financial statements. In addition, the reinsurance recoverable balance due from each reinsurer is evaluated as part of the overall monitoring process. Recoverability of reinsurance recoverable balances is evaluated based on these analyses. The Company generally secures large reinsurance recoverable balances with various forms of collateral, including secured trusts, funds withheld accounts and irrevocable letters of credit. These reinsurance recoverable balances are stated net of allowances for uncollectible reinsurance, which at December 31,
2016
and
2015
, were not significant.
The Company has secured certain reinsurance recoverable balances with various forms of collateral, including secured trusts, funds withheld accounts and irrevocable letters of credit. The Company had
$6.1 billion
of unsecured reinsurance recoverable balances at both December 31,
2016
and
2015
.
At December 31,
2016
, the Company had
$14.6 billion
of net ceded reinsurance recoverables. Of this total,
$9.8 billion
, or
67%
, were with the Company’s five largest ceded reinsurers, including
$2.3 billion
of net ceded reinsurance recoverables which were unsecured. At December 31,
2015
, the Company had
$15.3 billion
of net ceded reinsurance recoverables. Of this total,
$10.8 billion
, or
71%
, were with the Company’s five largest ceded reinsurers, including
$2.3 billion
of net ceded reinsurance recoverables which were unsecured.
The Company has reinsured with an unaffiliated third-party reinsurer,
59.25%
of the closed block through a modified coinsurance agreement. The Company accounts for this agreement under the deposit method of accounting. The Company, having the right of offset, has offset the modified coinsurance deposit with the deposit recoverable.
255
MetLife, Inc.
Notes to the Consolidated Financial Statements — (continued)
6. Reinsurance (continued)
The amounts on the consolidated statements of operations include the impact of reinsurance. Information regarding the significant effects of reinsurance was as follows:
|
Years Ended December 31,
|
||||||||||||
|
2016
|
2015
|
2014
|
||||||||||
|
(In millions)
|
||||||||||||
|
Premiums
|
||||||||||||
|
Direct premiums
|
$
|
40,271
|
|
$
|
39,516
|
|
$
|
40,049
|
|
|||
|
Reinsurance assumed
|
1,405
|
|
1,454
|
|
1,472
|
|
||||||
|
Reinsurance ceded
|
(2,523
|
)
|
(2,425
|
)
|
(2,454
|
)
|
||||||
|
Net premiums
|
$
|
39,153
|
|
$
|
38,545
|
|
$
|
39,067
|
|
|||
|
Universal life and investment-type product policy fees
|
||||||||||||
|
Direct universal life and investment-type product policy fees
|
$
|
10,183
|
|
$
|
10,424
|
|
$
|
10,768
|
|
|||
|
Reinsurance assumed
|
96
|
|
105
|
|
126
|
|
||||||
|
Reinsurance ceded
|
(1,073
|
)
|
(1,022
|
)
|
(948
|
)
|
||||||
|
Net universal life and investment-type product policy fees
|
$
|
9,206
|
|
$
|
9,507
|
|
$
|
9,946
|
|
|||
|
Policyholder benefits and claims
|
||||||||||||
|
Direct policyholder benefits and claims
|
$
|
43,422
|
|
$
|
41,233
|
|
$
|
41,573
|
|
|||
|
Reinsurance assumed
|
1,109
|
|
1,023
|
|
962
|
|
||||||
|
Reinsurance ceded
|
(3,727
|
)
|
(3,542
|
)
|
(3,433
|
)
|
||||||
|
Net policyholder benefits and claims
|
$
|
40,804
|
|
$
|
38,714
|
|
$
|
39,102
|
|
|||
|
Other expenses
|
||||||||||||
|
Direct other expenses
|
$
|
15,163
|
|
$
|
16,968
|
|
$
|
17,334
|
|
|||
|
Reinsurance assumed
|
317
|
|
130
|
|
165
|
|
||||||
|
Reinsurance ceded
|
(411
|
)
|
(329
|
)
|
(408
|
)
|
||||||
|
Net other expenses
|
$
|
15,069
|
|
$
|
16,769
|
|
$
|
17,091
|
|
|||
The amounts on the consolidated balance sheets include the impact of reinsurance. Information regarding the significant effects of reinsurance was as follows at:
|
December 31,
|
||||||||||||||||||||||||||||||||
|
2016
|
2015
|
|||||||||||||||||||||||||||||||
|
Direct
|
Assumed
|
Ceded
|
Total
Balance Sheet |
Direct
|
Assumed
|
Ceded
|
Total
Balance Sheet |
|||||||||||||||||||||||||
|
(In millions)
|
||||||||||||||||||||||||||||||||
|
Assets
|
||||||||||||||||||||||||||||||||
|
Premiums, reinsurance and other receivables
|
$
|
7,109
|
|
$
|
543
|
|
$
|
18,429
|
|
$
|
26,081
|
|
$
|
6,044
|
|
$
|
555
|
|
$
|
16,103
|
|
$
|
22,702
|
|
||||||||
|
Deferred policy acquisition costs and value of business acquired
|
25,099
|
|
16
|
|
(317
|
)
|
24,798
|
|
24,490
|
|
120
|
|
(480
|
)
|
24,130
|
|
||||||||||||||||
|
Total assets
|
$
|
32,208
|
|
$
|
559
|
|
$
|
18,112
|
|
$
|
50,879
|
|
$
|
30,534
|
|
$
|
675
|
|
$
|
15,623
|
|
$
|
46,832
|
|
||||||||
|
Liabilities
|
||||||||||||||||||||||||||||||||
|
Future policy benefits
|
$
|
198,436
|
|
$
|
1,535
|
|
$
|
—
|
|
$
|
199,971
|
|
$
|
189,817
|
|
$
|
2,062
|
|
$
|
—
|
|
$
|
191,879
|
|
||||||||
|
Policyholder account balances
|
209,028
|
|
1,209
|
|
(2
|
)
|
210,235
|
|
201,748
|
|
975
|
|
(1
|
)
|
202,722
|
|
||||||||||||||||
|
Other policy-related balances
|
14,055
|
|
324
|
|
7
|
|
14,386
|
|
13,939
|
|
310
|
|
6
|
|
14,255
|
|
||||||||||||||||
|
Other liabilities
|
23,513
|
|
407
|
|
4,898
|
|
28,818
|
|
19,800
|
|
472
|
|
3,289
|
|
23,561
|
|
||||||||||||||||
|
Total liabilities
|
$
|
445,032
|
|
$
|
3,475
|
|
$
|
4,903
|
|
$
|
453,410
|
|
$
|
425,304
|
|
$
|
3,819
|
|
$
|
3,294
|
|
$
|
432,417
|
|
||||||||
256
MetLife, Inc.
Notes to the Consolidated Financial Statements — (continued)
6. Reinsurance (continued)
Reinsurance agreements that do not expose the Company to a reasonable possibility of a significant loss from insurance risk are recorded using the deposit method of accounting. The deposit assets on reinsurance were
$3.1 billion
and
$2.3 billion
at December 31,
2016
and
2015
, respectively. The deposit liabilities on reinsurance were
$32 million
and
$33 million
at December 31,
2016
and
2015
, respectively.
7. Closed Block
On April 7, 2000 (the “Demutualization Date”), Metropolitan Life Insurance Company (“MLIC”) converted from a mutual life insurance company to a stock life insurance company and became a wholly-owned subsidiary of MetLife, Inc. The conversion was pursuant to an order by the New York Superintendent of Insurance approving MLIC’s plan of reorganization, as amended (the “Plan of Reorganization”). On the Demutualization Date, MLIC established a closed block for the benefit of holders of certain individual life insurance policies of MLIC. Assets have been allocated to the closed block in an amount that has been determined to produce cash flows which, together with anticipated revenues from the policies included in the closed block, are reasonably expected to be sufficient to support obligations and liabilities relating to these policies, including, but not limited to, provisions for the payment of claims and certain expenses and taxes, and to provide for the continuation of policyholder dividend scales in effect for 1999, if the experience underlying such dividend scales continues, and for appropriate adjustments in such scales if the experience changes. At least annually, the Company compares actual and projected experience against the experience assumed in the then-current dividend scales. Dividend scales are adjusted periodically to give effect to changes in experience.
The closed block assets, the cash flows generated by the closed block assets and the anticipated revenues from the policies in the closed block will benefit only the holders of the policies in the closed block. To the extent that, over time, cash flows from the assets allocated to the closed block and claims and other experience related to the closed block are, in the aggregate, more or less favorable than what was assumed when the closed block was established, total dividends paid to closed block policyholders in the future may be greater than or less than the total dividends that would have been paid to these policyholders if the policyholder dividend scales in effect for 1999 had been continued. Any cash flows in excess of amounts assumed will be available for distribution over time to closed block policyholders and will not be available to stockholders. If the closed block has insufficient funds to make guaranteed policy benefit payments, such payments will be made from assets outside of the closed block. The closed block will continue in effect as long as any policy in the closed block remains in-force. The expected life of the closed block is over 100 years.
The Company uses the same accounting principles to account for the participating policies included in the closed block as it used prior to the Demutualization Date. However, the Company establishes a policyholder dividend obligation for earnings that will be paid to policyholders as additional dividends as described below. The excess of closed block liabilities over closed block assets at the Demutualization Date (adjusted to eliminate the impact of related amounts in AOCI) represents the estimated maximum future earnings from the closed block expected to result from operations attributed to the closed block after income taxes. Earnings of the closed block are recognized in income over the period the policies and contracts in the closed block remain in-force. Management believes that over time the actual cumulative earnings of the closed block will approximately equal the expected cumulative earnings due to the effect of dividend changes. If, over the period the closed block remains in existence, the actual cumulative earnings of the closed block are greater than the expected cumulative earnings of the closed block, the Company will pay the excess of the actual cumulative earnings of the closed block over the expected cumulative earnings to closed block policyholders as additional policyholder dividends unless offset by future unfavorable experience of the closed block and, accordingly, will recognize only the expected cumulative earnings in income with the excess recorded as a policyholder dividend obligation. If over such period, the actual cumulative earnings of the closed block are less than the expected cumulative earnings of the closed block, the Company will recognize only the actual earnings in income. However, the Company may change policyholder dividend scales in the future, which would be intended to increase future actual earnings until the actual cumulative earnings equal the expected cumulative earnings.
Experience within the closed block, in particular mortality and investment yields, as well as realized and unrealized gains and losses, directly impact the policyholder dividend obligation. Amortization of the closed block DAC, which resides outside of the closed block, is based upon cumulative actual and expected earnings within the closed block. Accordingly, the Company’s net income continues to be sensitive to the actual performance of the closed block.
Closed block assets, liabilities, revenues and expenses are combined on a line-by-line basis with the assets, liabilities, revenues and expenses outside the closed block based on the nature of the particular item.
257
MetLife, Inc.
Notes to the Consolidated Financial Statements — (continued)
7. Closed Block (continued)
Information regarding the closed block liabilities and assets designated to the closed block was as follows at:
|
December 31,
|
||||||||
|
2016
|
2015
|
|||||||
|
(In millions)
|
||||||||
|
Closed Block Liabilities
|
||||||||
|
Future policy benefits
|
$
|
40,834
|
|
$
|
41,278
|
|
||
|
Other policy-related balances
|
257
|
|
249
|
|
||||
|
Policyholder dividends payable
|
443
|
|
468
|
|
||||
|
Policyholder dividend obligation
|
1,931
|
|
1,783
|
|
||||
|
Current income tax payable
|
4
|
|
—
|
|
||||
|
Other liabilities
|
196
|
|
380
|
|
||||
|
Total closed block liabilities
|
43,665
|
|
44,158
|
|
||||
|
Assets Designated to the Closed Block
|
||||||||
|
Investments:
|
||||||||
|
Fixed maturity securities available-for-sale, at estimated fair value
|
27,220
|
|
27,556
|
|
||||
|
Equity securities available-for-sale, at estimated fair value
|
100
|
|
111
|
|
||||
|
Mortgage loans
|
5,935
|
|
6,022
|
|
||||
|
Policy loans
|
4,553
|
|
4,642
|
|
||||
|
Real estate and real estate joint ventures
|
655
|
|
462
|
|
||||
|
Other invested assets
|
1,246
|
|
1,066
|
|
||||
|
Total investments
|
39,709
|
|
39,859
|
|
||||
|
Cash and cash equivalents
|
18
|
|
236
|
|
||||
|
Accrued investment income
|
467
|
|
474
|
|
||||
|
Premiums, reinsurance and other receivables
|
68
|
|
56
|
|
||||
|
Current income tax recoverable
|
—
|
|
11
|
|
||||
|
Deferred income tax assets
|
177
|
|
234
|
|
||||
|
Total assets designated to the closed block
|
40,439
|
|
40,870
|
|
||||
|
Excess of closed block liabilities over assets designated to the closed block
|
3,226
|
|
3,288
|
|
||||
|
Amounts included in AOCI:
|
||||||||
|
Unrealized investment gains (losses), net of income tax
|
1,517
|
|
1,382
|
|
||||
|
Unrealized gains (losses) on derivatives, net of income tax
|
95
|
|
76
|
|
||||
|
Allocated to policyholder dividend obligation, net of income tax
|
(1,255
|
)
|
(1,159
|
)
|
||||
|
Total amounts included in AOCI
|
357
|
|
299
|
|
||||
|
Maximum future earnings to be recognized from closed block assets and liabilities
|
$
|
3,583
|
|
$
|
3,587
|
|
||
Information regarding the closed block policyholder dividend obligation was as follows:
|
Years Ended December 31,
|
||||||||||||
|
2016
|
2015
|
2014
|
||||||||||
|
(In millions)
|
||||||||||||
|
Balance at January 1,
|
$
|
1,783
|
|
$
|
3,155
|
|
$
|
1,771
|
|
|||
|
Change in unrealized investment and derivative gains (losses)
|
148
|
|
(1,372
|
)
|
1,384
|
|
||||||
|
Balance at December 31,
|
$
|
1,931
|
|
$
|
1,783
|
|
$
|
3,155
|
|
|||
258
MetLife, Inc.
Notes to the Consolidated Financial Statements — (continued)
7. Closed Block (continued)
Information regarding the closed block revenues and expenses was as follows:
|
Years Ended December 31,
|
||||||||||||
|
2016
|
2015
|
2014
|
||||||||||
|
(In millions)
|
||||||||||||
|
Revenues
|
||||||||||||
|
Premiums
|
$
|
1,804
|
|
$
|
1,850
|
|
$
|
1,918
|
|
|||
|
Net investment income
|
1,902
|
|
1,982
|
|
2,093
|
|
||||||
|
Net investment gains (losses)
|
(10
|
)
|
(23
|
)
|
7
|
|
||||||
|
Net derivative gains (losses)
|
25
|
|
27
|
|
20
|
|
||||||
|
Total revenues
|
3,721
|
|
3,836
|
|
4,038
|
|
||||||
|
Expenses
|
||||||||||||
|
Policyholder benefits and claims
|
2,563
|
|
2,564
|
|
2,598
|
|
||||||
|
Policyholder dividends
|
953
|
|
1,015
|
|
988
|
|
||||||
|
Other expenses
|
133
|
|
143
|
|
155
|
|
||||||
|
Total expenses
|
3,649
|
|
3,722
|
|
3,741
|
|
||||||
|
Revenues, net of expenses before provision for income tax expense (benefit)
|
72
|
|
114
|
|
297
|
|
||||||
|
Provision for income tax expense (benefit)
|
24
|
|
41
|
|
104
|
|
||||||
|
Revenues, net of expenses and provision for income tax expense (benefit)
|
$
|
48
|
|
$
|
73
|
|
$
|
193
|
|
|||
MLIC charges the closed block with federal income taxes, state and local premium taxes and other state or local taxes, as well as investment management expenses relating to the closed block as provided in the Plan of Reorganization. MLIC also charges the closed block for expenses of maintaining the policies included in the closed block.
8. Investments
See Note
10
for information about the fair value hierarchy for investments and the related valuation methodologies.
Investment Risks and Uncertainties
Investments are exposed to the following primary sources of risk: credit, interest rate, liquidity, market valuation, currency and real estate risk. The financial statement risks, stemming from such investment risks, are those associated with the determination of estimated fair values, the diminished ability to sell certain investments in times of strained market conditions, the recognition of impairments, the recognition of income on certain investments and the potential consolidation of VIEs. The use of different methodologies, assumptions and inputs relating to these financial statement risks may have a material effect on the amounts presented within the consolidated financial statements.
The determination of valuation allowances and impairments is highly subjective and is based upon periodic evaluations and assessments of known and inherent risks associated with the respective asset class. Such evaluations and assessments are revised as conditions change and new information becomes available.
The recognition of income on certain investments (e.g. structured securities, including mortgage-backed securities, asset-backed securities (“ABS”), certain structured investment transactions and FVO and trading securities) is dependent upon certain factors such as prepayments and defaults, and changes in such factors could result in changes in amounts to be earned.
Fixed Maturity and Equity Securities AFS
Fixed Maturity and Equity Securities AFS by Sector
The following table presents the fixed maturity and equity securities AFS by sector. Redeemable preferred stock is reported within U.S. corporate and foreign corporate fixed maturity securities and non-redeemable preferred stock is reported within equity securities. Included within fixed maturity securities are structured securities including RMBS, ABS and commercial mortgage-backed securities (“CMBS”) (collectively, “Structured Securities”).
259
MetLife, Inc.
Notes to the Consolidated Financial Statements — (continued)
8. Investments (continued)
|
December 31, 2016
|
December 31, 2015
|
||||||||||||||||||||||||||||||||||||||
|
Cost or
Amortized
Cost
|
Gross Unrealized
|
Estimated
Fair
Value
|
Cost or
Amortized
Cost
|
Gross Unrealized
|
Estimated
Fair
Value
|
||||||||||||||||||||||||||||||||||
|
Gains
|
Temporary
Losses |
OTTI
Losses |
Gains
|
Temporary
Losses |
OTTI
Losses |
||||||||||||||||||||||||||||||||||
|
(In millions)
|
|||||||||||||||||||||||||||||||||||||||
|
Fixed maturity securities:
|
|||||||||||||||||||||||||||||||||||||||
|
U.S. corporate
|
$
|
94,558
|
|
$
|
7,351
|
|
$
|
1,056
|
|
$
|
—
|
|
$
|
100,853
|
|
$
|
96,466
|
|
$
|
6,583
|
|
$
|
2,255
|
|
$
|
—
|
|
$
|
100,794
|
|
|||||||||
|
U.S. government and agency
|
53,326
|
|
4,977
|
|
780
|
|
—
|
|
57,523
|
|
56,499
|
|
5,373
|
|
226
|
|
—
|
|
61,646
|
|
|||||||||||||||||||
|
Foreign government
|
50,923
|
|
6,600
|
|
385
|
|
—
|
|
57,138
|
|
45,451
|
|
5,269
|
|
221
|
|
—
|
|
50,499
|
|
|||||||||||||||||||
|
Foreign corporate (1)
|
55,676
|
|
3,132
|
|
1,752
|
|
(1
|
)
|
57,057
|
|
56,003
|
|
3,019
|
|
1,822
|
|
2
|
|
57,198
|
|
|||||||||||||||||||
|
RMBS (1)
|
36,293
|
|
1,244
|
|
554
|
|
(10
|
)
|
36,993
|
|
37,914
|
|
1,366
|
|
424
|
|
59
|
|
38,797
|
|
|||||||||||||||||||
|
State and political subdivision
|
14,566
|
|
1,733
|
|
122
|
|
1
|
|
16,176
|
|
13,723
|
|
1,795
|
|
67
|
|
10
|
|
15,441
|
|
|||||||||||||||||||
|
ABS
|
13,920
|
|
101
|
|
141
|
|
3
|
|
13,877
|
|
14,498
|
|
131
|
|
229
|
|
6
|
|
14,394
|
|
|||||||||||||||||||
|
CMBS (1)
|
11,092
|
|
282
|
|
103
|
|
(1
|
)
|
11,272
|
|
12,410
|
|
347
|
|
125
|
|
(1
|
)
|
12,633
|
|
|||||||||||||||||||
|
Total fixed maturity securities
|
$
|
330,354
|
|
$
|
25,420
|
|
$
|
4,893
|
|
$
|
(8
|
)
|
$
|
350,889
|
|
$
|
332,964
|
|
$
|
23,883
|
|
$
|
5,369
|
|
$
|
76
|
|
$
|
351,402
|
|
|||||||||
|
Equity securities:
|
|||||||||||||||||||||||||||||||||||||||
|
Common stock
|
$
|
1,927
|
|
$
|
488
|
|
$
|
14
|
|
$
|
—
|
|
$
|
2,401
|
|
$
|
1,962
|
|
$
|
397
|
|
$
|
107
|
|
$
|
—
|
|
$
|
2,252
|
|
|||||||||
|
Non-redeemable preferred stock
|
817
|
|
25
|
|
49
|
|
—
|
|
793
|
|
1,035
|
|
85
|
|
51
|
|
—
|
|
1,069
|
|
|||||||||||||||||||
|
Total equity securities
|
$
|
2,744
|
|
$
|
513
|
|
$
|
63
|
|
$
|
—
|
|
$
|
3,194
|
|
$
|
2,997
|
|
$
|
482
|
|
$
|
158
|
|
$
|
—
|
|
$
|
3,321
|
|
|||||||||
__________________
|
(1)
|
The noncredit loss component of OTTI losses for foreign corporate, RMBS and CMBS was in an unrealized gain position of
$1 million
,
$10 million
and
$1 million
, respectively, at December 31,
2016
, due to increases in estimated fair value subsequent to initial recognition of noncredit losses on such securities. The noncredit loss component of OTTI for CMBS was in an unrealized gain position of
$1 million
at December 31,
2015
, due to increases in estimated fair value subsequent to initial recognition of noncredit losses on such securities. See also “— Net Unrealized Investment Gains (Losses).”
|
The Company held non-income producing fixed maturity securities with an estimated fair value of
$6 million
and
$54 million
with unrealized gains (losses) of
($2) million
and
$12 million
at December 31,
2016
and
2015
, respectively.
Methodology for Amortization of Premium and Accretion of Discount on Structured Securities
Amortization of premium and accretion of discount on Structured Securities considers the estimated timing and amount of prepayments of the underlying loans. Actual prepayment experience is periodically reviewed and effective yields are recalculated when differences arise between the originally anticipated and the actual prepayments received and currently anticipated. Prepayment assumptions for Structured Securities are estimated using inputs obtained from third-party specialists and based on management’s knowledge of the current market. For credit-sensitive Structured Securities and certain prepayment-sensitive securities, the effective yield is recalculated on a prospective basis. For all other Structured Securities, the effective yield is recalculated on a retrospective basis.
Maturities of Fixed Maturity Securities
The amortized cost and estimated fair value of fixed maturity securities, by contractual maturity date, were as follows at
December 31, 2016
:
|
Due in One Year or Less
|
Due After One Year Through Five Years
|
Due After Five Years Through Ten Years
|
Due After Ten Years
|
Structured Securities
|
Total Fixed Maturity Securities
|
||||||||||||||||||
|
(In millions)
|
|||||||||||||||||||||||
|
Amortized cost
|
$
|
15,423
|
|
$
|
68,766
|
|
$
|
67,522
|
|
$
|
117,338
|
|
$
|
61,305
|
|
$
|
330,354
|
|
|||||
|
Estimated fair value
|
$
|
15,517
|
|
$
|
72,018
|
|
$
|
70,282
|
|
$
|
130,930
|
|
$
|
62,142
|
|
$
|
350,889
|
|
|||||
260
MetLife, Inc.
Notes to the Consolidated Financial Statements — (continued)
8. Investments (continued)
Actual maturities may differ from contractual maturities due to the exercise of call or prepayment options. Fixed maturity securities not due at a single maturity date have been presented in the year of final contractual maturity. Structured Securities are shown separately, as they are not due at a single maturity.
Continuous Gross Unrealized Losses for Fixed Maturity and Equity Securities AFS by Sector
The following table presents the estimated fair value and gross unrealized losses of fixed maturity and equity securities AFS in an unrealized loss position, aggregated by sector and by length of time that the securities have been in a continuous unrealized loss position at:
|
December 31, 2016
|
December 31, 2015
|
||||||||||||||||||||||||||||||
|
Less than 12 Months
|
Equal to or Greater
than 12 Months |
Less than 12 Months
|
Equal to or Greater
than 12 Months |
||||||||||||||||||||||||||||
|
Estimated
Fair Value |
Gross
Unrealized Losses |
Estimated
Fair Value |
Gross
Unrealized Losses |
Estimated
Fair Value |
Gross
Unrealized Losses |
Estimated
Fair Value |
Gross
Unrealized Losses |
||||||||||||||||||||||||
|
(Dollars in millions)
|
|||||||||||||||||||||||||||||||
|
Fixed maturity securities:
|
|||||||||||||||||||||||||||||||
|
U.S. corporate
|
$
|
16,147
|
|
$
|
656
|
|
$
|
3,684
|
|
$
|
400
|
|
$
|
27,526
|
|
$
|
1,629
|
|
$
|
3,762
|
|
$
|
626
|
|
|||||||
|
U.S. government and agency
|
13,500
|
|
760
|
|
141
|
|
20
|
|
19,628
|
|
222
|
|
298
|
|
4
|
|
|||||||||||||||
|
Foreign government
|
6,228
|
|
271
|
|
924
|
|
114
|
|
3,530
|
|
166
|
|
429
|
|
55
|
|
|||||||||||||||
|
Foreign corporate
|
11,613
|
|
639
|
|
6,127
|
|
1,112
|
|
14,447
|
|
911
|
|
5,251
|
|
913
|
|
|||||||||||||||
|
RMBS
|
12,943
|
|
403
|
|
2,618
|
|
141
|
|
13,467
|
|
287
|
|
2,431
|
|
196
|
|
|||||||||||||||
|
State and political subdivision
|
2,636
|
|
114
|
|
85
|
|
9
|
|
1,618
|
|
55
|
|
168
|
|
22
|
|
|||||||||||||||
|
ABS
|
2,702
|
|
33
|
|
2,789
|
|
111
|
|
7,329
|
|
124
|
|
2,823
|
|
111
|
|
|||||||||||||||
|
CMBS
|
2,570
|
|
48
|
|
735
|
|
54
|
|
4,876
|
|
81
|
|
637
|
|
43
|
|
|||||||||||||||
|
Total fixed maturity securities
|
$
|
68,339
|
|
$
|
2,924
|
|
$
|
17,103
|
|
$
|
1,961
|
|
$
|
92,421
|
|
$
|
3,475
|
|
$
|
15,799
|
|
$
|
1,970
|
|
|||||||
|
Equity securities:
|
|||||||||||||||||||||||||||||||
|
Common stock
|
$
|
105
|
|
$
|
14
|
|
$
|
11
|
|
$
|
—
|
|
$
|
203
|
|
$
|
105
|
|
$
|
20
|
|
$
|
2
|
|
|||||||
|
Non-redeemable preferred stock
|
196
|
|
9
|
|
165
|
|
40
|
|
79
|
|
2
|
|
200
|
|
49
|
|
|||||||||||||||
|
Total equity securities
|
$
|
301
|
|
$
|
23
|
|
$
|
176
|
|
$
|
40
|
|
$
|
282
|
|
$
|
107
|
|
$
|
220
|
|
$
|
51
|
|
|||||||
|
Total number of securities in an unrealized loss position
|
5,321
|
|
1,790
|
|
6,366
|
|
1,489
|
|
|||||||||||||||||||||||
Evaluation of AFS Securities for OTTI and Evaluating Temporarily Impaired AFS Securities
Evaluation and Measurement Methodologies
Management considers a wide range of factors about the security issuer and uses its best judgment in evaluating the cause of the decline in the estimated fair value of the security and in assessing the prospects for near-term recovery. Inherent in management’s evaluation of the security are assumptions and estimates about the operations of the issuer and its future earnings potential. Considerations used in the impairment evaluation process include, but are not limited to: (i) the length of time and the extent to which the estimated fair value has been below cost or amortized cost; (ii) the potential for impairments when the issuer is experiencing significant financial difficulties; (iii) the potential for impairments in an entire industry sector or sub-sector; (iv) the potential for impairments in certain economically depressed geographic locations; (v) the potential for impairments where the issuer, series of issuers or industry has suffered a catastrophic loss or has exhausted natural resources; (vi) with respect to fixed maturity securities, whether the Company has the intent to sell or will more likely than not be required to sell a particular security before the decline in estimated fair value below amortized cost recovers; (vii) with respect to Structured Securities, changes in forecasted cash flows after considering the quality of underlying collateral, expected prepayment speeds, current and forecasted loss severity, consideration of the payment terms of the underlying assets backing a particular security, and the payment priority within the tranche structure of the security; (viii) the potential for impairments due to weakening of foreign currencies on non-functional currency denominated fixed maturity securities that are near maturity; and (ix) other subjective factors, including concentrations and information obtained from regulators and rating agencies.
261
MetLife, Inc.
Notes to the Consolidated Financial Statements — (continued)
8. Investments (continued)
The methodology and significant inputs used to determine the amount of credit loss on fixed maturity securities are as follows:
|
•
|
The Company calculates the recovery value by performing a discounted cash flow analysis based on the present value of future cash flows. The discount rate is generally the effective interest rate of the security prior to impairment.
|
|
•
|
When determining collectability and the period over which value is expected to recover, the Company applies considerations utilized in its overall impairment evaluation process which incorporates information regarding the specific security, fundamentals of the industry and geographic area in which the security issuer operates, and overall macroeconomic conditions. Projected future cash flows are estimated using assumptions derived from management’s best estimates of likely scenario-based outcomes after giving consideration to a variety of variables that include, but are not limited to: payment terms of the security; the likelihood that the issuer can service the interest and principal payments; the quality and amount of any credit enhancements; the security’s position within the capital structure of the issuer; possible corporate restructurings or asset sales by the issuer; and changes to the rating of the security or the issuer by rating agencies.
|
|
•
|
Additional considerations are made when assessing the unique features that apply to certain Structured Securities including, but not limited to: the quality of underlying collateral, expected prepayment speeds, current and forecasted loss severity, consideration of the payment terms of the underlying loans or assets backing a particular security, and the payment priority within the tranche structure of the security.
|
|
•
|
When determining the amount of the credit loss for U.S. and foreign corporate securities, foreign government securities and state and political subdivision securities, the estimated fair value is considered the recovery value when available information does not indicate that another value is more appropriate. When information is identified that indicates a recovery value other than estimated fair value, management considers in the determination of recovery value the same considerations utilized in its overall impairment evaluation process as described above, as well as any private and public sector programs to restructure such securities.
|
With respect to securities that have attributes of debt and equity (“perpetual hybrid securities”), consideration is given in the OTTI analysis as to whether there has been any deterioration in the credit of the issuer and the likelihood of recovery in value of the securities that are in a severe and extended unrealized loss position. Consideration is also given as to whether any perpetual hybrid securities, with an unrealized loss, regardless of credit rating, have deferred any dividend payments. When an OTTI loss has occurred, the OTTI loss is the entire difference between the perpetual hybrid security’s cost and its estimated fair value with a corresponding charge to earnings.
The cost or amortized cost of fixed maturity and equity securities is adjusted for OTTI in the period in which the determination is made. The Company does not change the revised cost basis for subsequent recoveries in value.
In periods subsequent to the recognition of OTTI on a fixed maturity security, the Company accounts for the impaired security as if it had been purchased on the measurement date of the impairment. Accordingly, the discount (or reduced premium) based on the new cost basis is accreted over the remaining term of the fixed maturity security in a prospective manner based on the amount and timing of estimated future cash flows.
Current Period Evaluation
Based on the Company’s current evaluation of its AFS securities in an unrealized loss position in accordance with its impairment policy, and the Company’s current intentions and assessments (as applicable to the type of security) about holding, selling and any requirements to sell these securities, the Company concluded that these securities were not other-than-temporarily impaired at December 31,
2016
. Future OTTI will depend primarily on economic fundamentals, issuer performance (including changes in the present value of future cash flows expected to be collected), changes in credit ratings, collateral valuation, interest rates and credit spreads. If economic fundamentals deteriorate or if there are adverse changes in the above factors, OTTI may be incurred in upcoming periods.
Gross unrealized losses on fixed maturity securities decreased
$560 million
during the year ended December 31,
2016
to
$4.9 billion
. The decrease in gross unrealized losses for the year ended December 31,
2016
, was primarily attributable to narrowing credit spreads, partially offset by an increase in interest rates and, to a lesser extent, the impact of weakening foreign currencies on non-functional currency denominated fixed maturity securities.
262
MetLife, Inc.
Notes to the Consolidated Financial Statements — (continued)
8. Investments (continued)
At December 31,
2016
,
$282 million
of the total
$4.9 billion
of gross unrealized losses were from
125
fixed maturity securities with an unrealized loss position of
20%
or more of amortized cost for six months or greater.
The change in gross unrealized losses on equity securities was not significant during the year ended December 31, 2016.
Investment Grade Fixed Maturity Securities
Of the
$282 million
of gross unrealized losses on fixed maturity securities with an unrealized loss of
20%
or more of amortized cost for six months or greater,
$224 million
, or
79%
, were related to gross unrealized losses on
81
investment grade fixed maturity securities. Unrealized losses on investment grade fixed maturity securities are principally related to widening credit spreads since purchase and, with respect to fixed-rate fixed maturity securities, rising interest rates since purchase.
Below Investment Grade Fixed Maturity Securities
Of the
$282 million
of gross unrealized losses on fixed maturity securities with an unrealized loss of
20%
or more of amortized cost for six months or greater,
$58 million
, or
21%
, were related to gross unrealized losses on
44
below investment grade fixed maturity securities. Unrealized losses on below investment grade fixed maturity securities are principally related to U.S. and foreign corporate securities (primarily industrial and utility securities) and non-agency RMBS (primarily alternative residential mortgage loans) and are the result of significantly wider credit spreads resulting from higher risk premiums since purchase, largely due to economic and market uncertainty including concerns over lower oil prices in the energy sector and valuations of residential real estate supporting non-agency RMBS. Management evaluates U.S. and foreign corporate securities based on factors such as expected cash flows and the financial condition and near-term and long-term prospects of the issuers and evaluates non-agency RMBS based on actual and projected cash flows after considering the quality of underlying collateral, expected prepayment speeds, current and forecasted loss severity, consideration of the payment terms of the underlying assets backing a particular security and the payment priority within the tranche structure of the security.
Mortgage Loans
Mortgage Loans by Portfolio Segment
Mortgage loans are summarized as follows at:
|
December 31,
|
||||||||||||||
|
2016
|
2015
|
|||||||||||||
|
Carrying
Value |
% of
Total |
Carrying
Value |
% of
Total |
|||||||||||
|
(Dollars in millions)
|
||||||||||||||
|
Mortgage loans:
|
||||||||||||||
|
Commercial
|
$
|
48,035
|
|
64.4
|
%
|
$
|
44,012
|
|
65.6
|
%
|
||||
|
Agricultural
|
14,456
|
|
19.4
|
|
13,188
|
|
19.6
|
|
||||||
|
Residential
|
11,696
|
|
15.7
|
|
9,734
|
|
14.5
|
|
||||||
|
Subtotal (1)
|
74,187
|
|
99.5
|
|
66,934
|
|
99.7
|
|
||||||
|
Valuation allowances
|
(344
|
)
|
(0.5
|
)
|
(318
|
)
|
(0.5
|
)
|
||||||
|
Subtotal mortgage loans, net
|
73,843
|
|
99.0
|
|
66,616
|
|
99.2
|
|
||||||
|
Residential — FVO
|
566
|
|
0.8
|
|
314
|
|
0.5
|
|
||||||
|
Commercial mortgage loans held by CSEs — FVO
|
136
|
|
0.2
|
|
172
|
|
0.3
|
|
||||||
|
Total mortgage loans, net
|
$
|
74,545
|
|
100.0
|
%
|
$
|
67,102
|
|
100.0
|
%
|
||||
__________________
|
(1)
|
Purchases of mortgage loans were
$3.6 billion
and
$4.2 billion
for the years ended December 31,
2016
and
2015
, respectively, and were primarily comprised of residential mortgage loans.
|
See “— Variable Interest Entities” for discussion of CSEs.
263
MetLife, Inc.
Notes to the Consolidated Financial Statements — (continued)
8. Investments (continued)
I
nformation on commercial, agricultural and residential mortgage loans is presented in the tables below. Information on residential — FVO and commercial mortgage loans held by CSEs — FVO is presented in Note
10
. The Company elects the FVO for certain mortgage loans and related long-term debt that are managed on a total return basis.
Mortgage Loans, Valuation Allowance and Impaired Loans by Portfolio Segment
Mortgage loans by portfolio segment, by method of evaluation of credit loss, impaired mortgage loans including those modified in a troubled debt restructuring, and the related valuation allowances, were as follows at and for the years ended:
|
Evaluated Individually for Credit Losses
|
Evaluated Collectively for Credit Losses
|
Impaired Loans
|
|||||||||||||||||||||||||||||||||
|
Impaired Loans with a Valuation Allowance
|
Impaired Loans without a Valuation Allowance
|
||||||||||||||||||||||||||||||||||
|
Unpaid
Principal
Balance
|
Recorded
Investment
|
Valuation
Allowances |
Unpaid
Principal
Balance
|
Recorded
Investment |
Recorded
Investment |
Valuation
Allowances |
Carrying
Value |
Average
Recorded Investment |
|||||||||||||||||||||||||||
|
(In millions)
|
|||||||||||||||||||||||||||||||||||
|
December 31, 2016
|
|||||||||||||||||||||||||||||||||||
|
Commercial
|
$
|
—
|
|
$
|
—
|
|
$
|
—
|
|
$
|
12
|
|
$
|
12
|
|
$
|
48,023
|
|
$
|
234
|
|
$
|
12
|
|
$
|
90
|
|
||||||||
|
Agricultural
|
15
|
|
13
|
|
1
|
|
27
|
|
27
|
|
14,416
|
|
43
|
|
39
|
|
52
|
|
|||||||||||||||||
|
Residential
|
—
|
|
—
|
|
—
|
|
266
|
|
242
|
|
11,454
|
|
66
|
|
242
|
|
188
|
|
|||||||||||||||||
|
Total
|
$
|
15
|
|
$
|
13
|
|
$
|
1
|
|
$
|
305
|
|
$
|
281
|
|
$
|
73,893
|
|
$
|
343
|
|
$
|
293
|
|
$
|
330
|
|
||||||||
|
December 31, 2015
|
|||||||||||||||||||||||||||||||||||
|
Commercial
|
$
|
—
|
|
$
|
—
|
|
$
|
—
|
|
$
|
57
|
|
$
|
57
|
|
$
|
43,955
|
|
$
|
217
|
|
$
|
57
|
|
$
|
127
|
|
||||||||
|
Agricultural
|
49
|
|
47
|
|
3
|
|
22
|
|
21
|
|
13,120
|
|
39
|
|
65
|
|
63
|
|
|||||||||||||||||
|
Residential
|
—
|
|
—
|
|
—
|
|
141
|
|
131
|
|
9,603
|
|
59
|
|
131
|
|
84
|
|
|||||||||||||||||
|
Total
|
$
|
49
|
|
$
|
47
|
|
$
|
3
|
|
$
|
220
|
|
$
|
209
|
|
$
|
66,678
|
|
$
|
315
|
|
$
|
253
|
|
$
|
274
|
|
||||||||
The average recorded investment for impaired commercial, agricultural and residential mortgage loans was
$359 million
,
$80 million
and
$19 million
, respectively, for the year ended
December 31, 2014
.
Valuation Allowance Rollforward by Portfolio Segment
The changes in the valuation allowance, by portfolio segment, were as follows:
|
Commercial
|
Agricultural
|
Residential
|
Total
|
||||||||||||
|
(In millions)
|
|||||||||||||||
|
Balance at January 1, 2014
|
$
|
258
|
|
$
|
44
|
|
$
|
20
|
|
$
|
322
|
|
|||
|
Provision (release)
|
(11
|
)
|
(4
|
)
|
27
|
|
12
|
|
|||||||
|
Charge-offs, net of recoveries
|
(23
|
)
|
(1
|
)
|
(5
|
)
|
(29
|
)
|
|||||||
|
Balance at December 31, 2014
|
224
|
|
39
|
|
42
|
|
305
|
|
|||||||
|
Provision (release)
|
12
|
|
3
|
|
33
|
|
48
|
|
|||||||
|
Charge-offs, net of recoveries
|
(19
|
)
|
—
|
|
(16
|
)
|
(35
|
)
|
|||||||
|
Balance at December 31, 2015
|
217
|
|
42
|
|
59
|
|
318
|
|
|||||||
|
Provision (release) (1)
|
160
|
|
3
|
|
23
|
|
186
|
|
|||||||
|
Charge-offs, net of recoveries (1)
|
(143
|
)
|
(1
|
)
|
(16
|
)
|
(160
|
)
|
|||||||
|
Balance at December 31, 2016
|
$
|
234
|
|
$
|
44
|
|
$
|
66
|
|
$
|
344
|
|
|||
__________________
264
MetLife, Inc.
Notes to the Consolidated Financial Statements — (continued)
8. Investments (continued)
|
(1)
|
In connection with an acquisition in 2010, certain impaired commercial mortgage loans were acquired and accordingly, were not originated by the Company. Such commercial mortgage loans have been accounted for as purchased credit impaired (“PCI”) commercial mortgage loans. Decreases in cash flows expected to be collected on PCI commercial mortgage loans can result in provisions for losses on mortgage loans. For the year ended
December 31, 2016
, in connection with the maturity of an acquired PCI commercial mortgage loan, an increase to the commercial mortgage loan valuation allowance of
$143 million
was recorded and charged-off upon maturity. The Company will recover a substantial portion of the loss on the loan incurred through an indemnification agreement entered into in connection with the acquisition in 2010
.
|
Valuation Allowance Methodology
Mortgage loans are considered to be impaired when it is probable that, based upon current information and events, the Company will be unable to collect all amounts due under the loan agreement. Specific valuation allowances are established using the same methodology for all three portfolio segments as the excess carrying value of a loan over either (i) the present value of expected future cash flows discounted at the loan’s original effective interest rate, (ii) the estimated fair value of the loan’s underlying collateral if the loan is in the process of foreclosure or otherwise collateral dependent, or (iii) the loan’s observable market price. A common evaluation framework is used for establishing non-specific valuation allowances for all loan portfolio segments; however, a separate non-specific valuation allowance is calculated and maintained for each loan portfolio segment that is based on inputs unique to each loan portfolio segment. Non-specific valuation allowances are established for pools of loans with similar risk characteristics where a property-specific or market-specific risk has not been identified, but for which the Company expects to incur a credit loss. These evaluations are based upon several loan portfolio segment-specific factors, including the Company’s experience for loan losses, defaults and loss severity, and loss expectations for loans with similar risk characteristics. These evaluations are revised as conditions change and new information becomes available.
Commercial and Agricultural Mortgage Loan Portfolio Segments
The Company typically uses several years of historical experience in establishing non-specific valuation allowances which captures multiple economic cycles. For evaluations of commercial mortgage loans, in addition to historical experience, management considers factors that include the impact of a rapid change to the economy, which may not be reflected in the loan portfolio, and recent loss and recovery trend experience as compared to historical loss and recovery experience. For evaluations of agricultural mortgage loans, in addition to historical experience, management considers factors that include increased stress in certain sectors, which may be evidenced by higher delinquency rates, or a change in the number of higher risk loans. On a quarterly basis, management incorporates the impact of these current market events and conditions on historical experience in determining the non-specific valuation allowance established for commercial and agricultural mortgage loans.
All commercial mortgage loans are reviewed on an ongoing basis which may include an analysis of the property financial statements and rent roll, lease rollover analysis, property inspections, market analysis, estimated valuations of the underlying collateral, loan-to-value ratios, debt service coverage ratios, and tenant creditworthiness. The monitoring process focuses on higher risk loans, which include those that are classified as restructured, delinquent or in foreclosure, as well as loans with higher loan-to-value ratios and lower debt service coverage ratios. All agricultural mortgage loans are monitored on an ongoing basis. The monitoring process for agricultural mortgage loans is generally similar to the commercial mortgage loan monitoring process, with a focus on higher risk loans, including reviews on a geographic and property-type basis. Higher risk loans are reviewed individually on an ongoing basis for potential credit loss and specific valuation allowances are established using the methodology described above. Quarterly, the remaining loans are reviewed on a pool basis by aggregating groups of loans that have similar risk characteristics for potential credit loss, and non-specific valuation allowances are established as described above using inputs that are unique to each segment of the loan portfolio.
For commercial mortgage loans, the primary credit quality indicator is the debt service coverage ratio, which compares a property’s net operating income to amounts needed to service the principal and interest due under the loan. Generally, the lower the debt service coverage ratio, the higher the risk of experiencing a credit loss. The Company also reviews the loan-to-value ratio of its commercial mortgage loan portfolio. Loan-to-value ratios compare the unpaid principal balance of the loan to the estimated fair value of the underlying collateral. Generally, the higher the loan-to-value ratio, the higher the risk of experiencing a credit loss.
The debt service coverage ratio and the values utilized in calculating the ratio are updated annually on a rolling basis, with a portion of the portfolio updated each quarter. In addition, the loan-to-value ratio is routinely updated for all but the lowest risk loans as part of the Company’s ongoing review of its commercial mortgage loan portfolio.
265
MetLife, Inc.
Notes to the Consolidated Financial Statements — (continued)
8. Investments (continued)
For agricultural mortgage loans, the Company’s primary credit quality indicator is the loan-to-value ratio. The values utilized in calculating this ratio are developed in connection with the ongoing review of the agricultural mortgage loan portfolio and are routinely updated.
Residential Mortgage Loan Portfolio Segment
The Company’s residential mortgage loan portfolio is comprised primarily of closed end, amortizing residential mortgage loans. For evaluations of residential mortgage loans, the key inputs of expected frequency and expected loss reflect current market conditions, with expected frequency adjusted, when appropriate, for differences from market conditions and the Company’s historical experience. In contrast to the commercial and agricultural mortgage loan portfolios, residential mortgage loans are smaller-balance homogeneous loans that are collectively evaluated for impairment. Non-specific valuation allowances are established using the evaluation framework described above for pools of loans with similar risk characteristics from inputs that are unique to the residential segment of the loan portfolio. Loan specific valuation allowances are only established on residential mortgage loans when they have been restructured and are established using the methodology described above for all loan portfolio segments.
For residential mortgage loans, the Company’s primary credit quality indicator is whether the loan is performing or nonperforming. The Company generally defines nonperforming residential mortgage loans as those that are 60 or more days past due and/or in nonaccrual status which is assessed monthly. Generally, nonperforming residential mortgage loans have a higher risk of experiencing a credit loss.
Credit Quality of Commercial Mortgage Loans
The credit quality of commercial mortgage loans was as follows at:
|
Recorded Investment
|
Estimated
Fair Value |
% of
Total |
|||||||||||||||||||||||
|
Debt Service Coverage Ratios
|
Total
|
% of
Total
|
|||||||||||||||||||||||
|
> 1.20x
|
1.00x - 1.20x
|
< 1.00x
|
|||||||||||||||||||||||
|
(Dollars in millions)
|
|||||||||||||||||||||||||
|
December 31, 2016
|
|||||||||||||||||||||||||
|
Loan-to-value ratios:
|
|||||||||||||||||||||||||
|
Less than 65%
|
$
|
41,811
|
|
$
|
1,307
|
|
$
|
874
|
|
$
|
43,992
|
|
91.6
|
%
|
$
|
44,459
|
|
91.8
|
%
|
||||||
|
65% to 75%
|
3,335
|
|
—
|
|
221
|
|
3,556
|
|
7.4
|
|
3,488
|
|
7.2
|
|
|||||||||||
|
76% to 80%
|
229
|
|
—
|
|
—
|
|
229
|
|
0.5
|
|
215
|
|
0.5
|
|
|||||||||||
|
Greater than 80%
|
142
|
|
41
|
|
75
|
|
258
|
|
0.5
|
|
250
|
|
0.5
|
|
|||||||||||
|
Total
|
$
|
45,517
|
|
$
|
1,348
|
|
$
|
1,170
|
|
$
|
48,035
|
|
100.0
|
%
|
$
|
48,412
|
|
100.0
|
%
|
||||||
|
December 31, 2015
|
|||||||||||||||||||||||||
|
Loan-to-value ratios:
|
|||||||||||||||||||||||||
|
Less than 65%
|
$
|
38,163
|
|
$
|
1,063
|
|
$
|
544
|
|
$
|
39,770
|
|
90.4
|
%
|
$
|
40,921
|
|
90.7
|
%
|
||||||
|
65% to 75%
|
3,270
|
|
138
|
|
76
|
|
3,484
|
|
7.9
|
|
3,451
|
|
7.7
|
|
|||||||||||
|
76% to 80%
|
—
|
|
—
|
|
—
|
|
—
|
|
—
|
|
—
|
|
—
|
|
|||||||||||
|
Greater than 80%
|
381
|
|
140
|
|
237
|
|
758
|
|
1.7
|
|
732
|
|
1.6
|
|
|||||||||||
|
Total
|
$
|
41,814
|
|
$
|
1,341
|
|
$
|
857
|
|
$
|
44,012
|
|
100.0
|
%
|
$
|
45,104
|
|
100.0
|
%
|
||||||
266
MetLife, Inc.
Notes to the Consolidated Financial Statements — (continued)
8. Investments (continued)
Credit Quality of Agricultural Mortgage Loans
The credit quality of agricultural mortgage loans was as follows at:
|
December 31,
|
|||||||||||||
|
2016
|
2015
|
||||||||||||
|
Recorded
Investment
|
% of
Total
|
Recorded
Investment
|
% of
Total
|
||||||||||
|
(Dollars in millions)
|
|||||||||||||
|
Loan-to-value ratios:
|
|||||||||||||
|
Less than 65%
|
$
|
13,872
|
|
96.0
|
%
|
$
|
12,399
|
|
94.0
|
%
|
|||
|
65% to 75%
|
479
|
|
3.3
|
|
710
|
|
5.4
|
|
|||||
|
76% to 80%
|
17
|
|
0.1
|
|
21
|
|
0.2
|
|
|||||
|
Greater than 80%
|
88
|
|
0.6
|
|
58
|
|
0.4
|
|
|||||
|
Total
|
$
|
14,456
|
|
100.0
|
%
|
$
|
13,188
|
|
100.0
|
%
|
|||
The estimated fair value of agricultural mortgage loans was
$14.7 billion
and
$13.5 billion
at December 31,
2016
and
2015
, respectively.
Credit Quality of Residential Mortgage Loans
The credit quality of residential mortgage loans was as follows at:
|
December 31,
|
|||||||||||||
|
2016
|
2015
|
||||||||||||
|
Recorded
Investment |
% of
Total |
Recorded
Investment |
% of
Total |
||||||||||
|
(Dollars in millions)
|
|||||||||||||
|
Performance indicators:
|
|||||||||||||
|
Performing
|
$
|
11,304
|
|
96.6
|
%
|
$
|
9,408
|
|
96.7
|
%
|
|||
|
Nonperforming
|
392
|
|
3.4
|
|
326
|
|
3.3
|
|
|||||
|
Total
|
$
|
11,696
|
|
100.0
|
%
|
$
|
9,734
|
|
100.0
|
%
|
|||
The estimated fair value of residential mortgage loans was
$12.1 billion
and
$9.9 billion
at December 31,
2016
and
2015
, respectively.
Past Due and Nonaccrual Mortgage Loans
The Company has a high quality, well performing mortgage loan portfolio, with
99%
of all mortgage loans classified as performing at both December 31,
2016
and
2015
. The Company defines delinquency consistent with industry practice, when mortgage loans are past due as follows: commercial and residential mortgage loans — 60 days and agricultural mortgage loans — 90 days. The past due and nonaccrual mortgage loans at recorded investment, prior to valuation allowances, by portfolio segment, were as follows at:
|
Past Due
|
Greater than 90 Days Past Due and Still
Accruing Interest
|
Nonaccrual
|
|||||||||||||||||||||
|
December 31, 2016
|
December 31, 2015
|
December 31, 2016
|
December 31, 2015
|
December 31, 2016
|
December 31, 2015
|
||||||||||||||||||
|
(In millions)
|
|||||||||||||||||||||||
|
Commercial
|
$
|
3
|
|
$
|
2
|
|
$
|
3
|
|
$
|
—
|
|
$
|
—
|
|
$
|
—
|
|
|||||
|
Agricultural
|
127
|
|
103
|
|
104
|
|
73
|
|
23
|
|
46
|
|
|||||||||||
|
Residential
|
392
|
|
326
|
|
37
|
|
—
|
|
355
|
|
318
|
|
|||||||||||
|
Total
|
$
|
522
|
|
$
|
431
|
|
$
|
144
|
|
$
|
73
|
|
$
|
378
|
|
$
|
364
|
|
|||||
267
MetLife, Inc.
Notes to the Consolidated Financial Statements — (continued)
8. Investments (continued)
Mortgage Loans Modified in a Troubled Debt Restructuring
The Company may grant concessions related to borrowers experiencing financial difficulties, which are classified as troubled debt restructurings. Generally, the types of concessions include: reduction of the contractual interest rate, extension of the maturity date at an interest rate lower than current market interest rates, and/or a reduction of accrued interest. The amount, timing and extent of the concessions granted are considered in determining any impairment or changes in the specific valuation allowance recorded with the restructuring. Through the continuous monitoring process, a specific valuation allowance may have been recorded prior to the quarter when the mortgage loan is modified in a troubled debt restructuring.
During the year ended
December 31, 2016
, the Company had
562
residential mortgage loans modified in a troubled debt restructuring with carrying value after specific valuation allowance of
$137 million
and
$124 million
pre-modification and post-modification, respectively. During the year ended December 31, 2015, the Company had
460
residential mortgage loans modified in a troubled debt restructuring with carrying value after specific valuation allowance of
$108 million
and
$96 million
pre-modification and post-modification, respectively. There were
no
commercial or agricultural mortgage loans modified in a troubled debt restructuring for both the years ended
December 31, 2016
and 2015.
During the years ended
December 31, 2016
and
2015
, the Company did not have a significant amount of mortgage loans modified in a troubled debt restructuring with subsequent payment default.
Other Invested Assets
Other invested assets is comprised primarily of freestanding derivatives with positive estimated fair values (see Note
9
), tax credit and renewable energy partnerships and leveraged and direct financing leases.
Tax Credit Partnerships
The carrying value of tax credit partnerships was
$1.8 billion
and
$1.6 billion
at
December 31, 2016
and
2015
, respectively. Losses from tax credit partnerships included within net investment income were
$167 million
,
$164 million
, and
$149 million
for the years ended
December 31, 2016
,
2015
and
2014
, respectively.
Leveraged and Direct Financing Leases
Investment in leveraged and direct financing leases consisted of the following at:
|
December 31,
|
|||||||||||||||
|
2016
|
2015
|
||||||||||||||
|
Leveraged
Leases
|
Direct
Financing
Leases
|
Leveraged
Leases
|
Direct
Financing
Leases
|
||||||||||||
|
(In millions)
|
|||||||||||||||
|
Rental receivables, net
|
$
|
1,259
|
|
$
|
1,683
|
|
$
|
1,329
|
|
$
|
1,508
|
|
|||
|
Estimated residual values
|
966
|
|
71
|
|
1,076
|
|
80
|
|
|||||||
|
Subtotal
|
2,225
|
|
1,754
|
|
2,405
|
|
1,588
|
|
|||||||
|
Unearned income
|
(635
|
)
|
(639
|
)
|
(693
|
)
|
(512
|
)
|
|||||||
|
Investment in leases, net of non-recourse debt
|
$
|
1,590
|
|
$
|
1,115
|
|
$
|
1,712
|
|
$
|
1,076
|
|
|||
Rental receivables are generally due in periodic installments.
The payment periods for leveraged leases generally range from one to 15 years but in certain circumstances can be over 25 years, while the payment periods for direct financing leases range from one to 20 years.
For rental receivables, the primary credit quality indicator is whether the rental receivable is performing or nonperforming, which is assessed monthly. The Company generally defines nonperforming rental receivables as those that are 90 days or more past due. At December 31,
2016
and
2015
, all leveraged lease receivables were performing and over
99%
of direct financing rental receivables were performing.
The deferred income tax liability related to leveraged leases was
$1.5 billion
at both December 31,
2016
and
2015
.
268
MetLife, Inc.
Notes to the Consolidated Financial Statements — (continued)
8. Investments (continued)
Cash Equivalents
The carrying value of cash equivalents, which includes securities and other investments with an original or remaining maturity of three months or less at the time of purchase, was
$12.2 billion
and
$7.5 billion
at December 31,
2016
and
2015
, respectively.
Net Unrealized Investment Gains (Losses)
Unrealized investment gains (losses) on fixed maturity and equity securities AFS and the effect on DAC, VOBA, DSI, future policy benefits and the policyholder dividend obligation, that would result from the realization of the unrealized gains (losses), are included in net unrealized investment gains (losses) in AOCI.
The components of net unrealized investment gains (losses), included in AOCI, were as follows:
|
Years Ended December 31,
|
||||||||||||
|
2016
|
2015
|
2014
|
||||||||||
|
(In millions)
|
||||||||||||
|
Fixed maturity securities
|
$
|
20,300
|
|
$
|
18,164
|
|
$
|
30,367
|
|
|||
|
Fixed maturity securities with noncredit OTTI losses included in AOCI
|
8
|
|
(76
|
)
|
(112
|
)
|
||||||
|
Total fixed maturity securities
|
20,308
|
|
18,088
|
|
30,255
|
|
||||||
|
Equity securities
|
485
|
|
422
|
|
608
|
|
||||||
|
Derivatives
|
2,923
|
|
2,350
|
|
1,761
|
|
||||||
|
Other
|
23
|
|
287
|
|
149
|
|
||||||
|
Subtotal
|
23,739
|
|
21,147
|
|
32,773
|
|
||||||
|
Amounts allocated from:
|
||||||||||||
|
Future policy benefits
|
(1,114
|
)
|
(163
|
)
|
(2,886
|
)
|
||||||
|
DAC and VOBA related to noncredit OTTI losses recognized in AOCI
|
(3
|
)
|
—
|
|
(4
|
)
|
||||||
|
DAC, VOBA and DSI
|
(1,430
|
)
|
(1,273
|
)
|
(1,946
|
)
|
||||||
|
Policyholder dividend obligation
|
(1,931
|
)
|
(1,783
|
)
|
(3,155
|
)
|
||||||
|
Subtotal
|
(4,478
|
)
|
(3,219
|
)
|
(7,991
|
)
|
||||||
|
Deferred income tax benefit (expense) related to noncredit OTTI losses recognized in AOCI
|
(1
|
)
|
27
|
|
42
|
|
||||||
|
Deferred income tax benefit (expense)
|
(6,623
|
)
|
(6,151
|
)
|
(8,556
|
)
|
||||||
|
Net unrealized investment gains (losses)
|
12,637
|
|
11,804
|
|
16,268
|
|
||||||
|
Net unrealized investment gains (losses) attributable to noncontrolling interests
|
(6
|
)
|
(31
|
)
|
(33
|
)
|
||||||
|
Net unrealized investment gains (losses) attributable to MetLife, Inc.
|
$
|
12,631
|
|
$
|
11,773
|
|
$
|
16,235
|
|
|||
The changes in fixed maturity securities with noncredit OTTI losses included in AOCI were as follows:
|
Years Ended December 31,
|
|||||||
|
2016
|
2015
|
||||||
|
(In millions)
|
|||||||
|
Balance at January 1,
|
$
|
(76
|
)
|
$
|
(112
|
)
|
|
|
Noncredit OTTI losses and subsequent changes recognized
|
14
|
|
6
|
|
|||
|
Securities sold with previous noncredit OTTI loss
|
64
|
|
125
|
|
|||
|
Subsequent changes in estimated fair value
|
6
|
|
(95
|
)
|
|||
|
Balance at December 31,
|
$
|
8
|
|
$
|
(76
|
)
|
|
269
MetLife, Inc.
Notes to the Consolidated Financial Statements — (continued)
8. Investments (continued)
The changes in net unrealized investment gains (losses) were as follows:
|
Years Ended December 31,
|
||||||||||||
|
2016
|
2015
|
2014
|
||||||||||
|
(In millions)
|
||||||||||||
|
Balance at January 1,
|
$
|
11,773
|
|
$
|
16,235
|
|
$
|
8,414
|
|
|||
|
Fixed maturity securities on which noncredit OTTI losses have been recognized
|
84
|
|
36
|
|
106
|
|
||||||
|
Unrealized investment gains (losses) during the year
|
2,508
|
|
(11,662
|
)
|
15,521
|
|
||||||
|
Unrealized investment gains (losses) relating to:
|
||||||||||||
|
Future policy benefits
|
(951
|
)
|
2,723
|
|
(1,988
|
)
|
||||||
|
DAC and VOBA related to noncredit OTTI losses recognized in AOCI
|
(3
|
)
|
4
|
|
(10
|
)
|
||||||
|
DAC, VOBA and DSI
|
(157
|
)
|
673
|
|
(756
|
)
|
||||||
|
Policyholder dividend obligation
|
(148
|
)
|
1,372
|
|
(1,384
|
)
|
||||||
|
Deferred income tax benefit (expense) related to noncredit OTTI losses recognized in AOCI
|
(28
|
)
|
(15
|
)
|
(31
|
)
|
||||||
|
Deferred income tax benefit (expense)
|
(472
|
)
|
2,405
|
|
(3,600
|
)
|
||||||
|
Net unrealized investment gains (losses)
|
12,606
|
|
11,771
|
|
16,272
|
|
||||||
|
Net unrealized investment gains (losses) attributable to noncontrolling interests
|
25
|
|
2
|
|
(37
|
)
|
||||||
|
Balance at December 31,
|
$
|
12,631
|
|
$
|
11,773
|
|
$
|
16,235
|
|
|||
|
Change in net unrealized investment gains (losses)
|
$
|
833
|
|
$
|
(4,464
|
)
|
$
|
7,858
|
|
|||
|
Change in net unrealized investment gains (losses) attributable to noncontrolling interests
|
25
|
|
2
|
|
(37
|
)
|
||||||
|
Change in net unrealized investment gains (losses) attributable to MetLife, Inc.
|
$
|
858
|
|
$
|
(4,462
|
)
|
$
|
7,821
|
|
|||
Concentrations of Credit Risk
Investments in any counterparty that were greater than
10%
of the Company’s equity, other than the U.S. government and its agencies, were in fixed income securities of the Japanese government and its agencies with an estimated fair value of
$24.9 billion
and
$20.9 billion
at December 31,
2016
and
2015
, respectively.
Securities Lending
Elements of the securities lending program are presented below at:
|
December 31,
|
|||||||
|
2016
|
2015
|
||||||
|
(In millions)
|
|||||||
|
Securities on loan: (1)
|
|||||||
|
Amortized cost
|
$
|
24,692
|
|
$
|
27,223
|
|
|
|
Estimated fair value
|
$
|
26,308
|
|
$
|
29,646
|
|
|
|
Cash collateral on deposit from counterparties (2)
|
$
|
26,755
|
|
$
|
30,197
|
|
|
|
Security collateral on deposit from counterparties (3)
|
$
|
46
|
|
$
|
50
|
|
|
|
Reinvestment portfolio — estimated fair value
|
$
|
26,704
|
|
$
|
30,258
|
|
|
__________________
|
(1)
|
Included within fixed maturity securities and short-term investments.
|
|
(2)
|
Included within payables for collateral under securities loaned and other transactions.
|
|
(3)
|
Security collateral on deposit from counterparties may not be sold or re-pledged, unless the counterparty is in default, and is not reflected on the consolidated financial statements.
|
270
MetLife, Inc.
Notes to the Consolidated Financial Statements — (continued)
8. Investments (continued)
The cash collateral liability by loaned security type and remaining tenor of the agreements were as follows at:
|
December 31, 2016
|
December 31, 2015
|
||||||||||||||||||||||||||||||
|
Remaining Tenor of Securities Lending Agreements
|
Remaining Tenor of Securities Lending Agreements
|
||||||||||||||||||||||||||||||
|
Open (1)
|
1 Month
or Less
|
1 to 6
Months
|
Total
|
Open (1)
|
1 Month
or Less
|
1 to 6
Months
|
Total
|
||||||||||||||||||||||||
|
(In millions)
|
|||||||||||||||||||||||||||||||
|
Cash collateral liability by loaned security type:
|
|||||||||||||||||||||||||||||||
|
U.S. government and agency
|
$
|
6,608
|
|
$
|
8,403
|
|
$
|
10,125
|
|
$
|
25,136
|
|
$
|
10,116
|
|
$
|
11,157
|
|
$
|
5,986
|
|
$
|
27,259
|
|
|||||||
|
Foreign government
|
—
|
|
620
|
|
144
|
|
764
|
|
2
|
|
510
|
|
486
|
|
998
|
|
|||||||||||||||
|
U.S. corporate
|
—
|
|
523
|
|
—
|
|
523
|
|
9
|
|
380
|
|
—
|
|
389
|
|
|||||||||||||||
|
Agency RMBS
|
—
|
|
—
|
|
274
|
|
274
|
|
—
|
|
951
|
|
600
|
|
1,551
|
|
|||||||||||||||
|
Foreign corporate
|
—
|
|
58
|
|
—
|
|
58
|
|
—
|
|
—
|
|
—
|
|
—
|
|
|||||||||||||||
|
Total
|
$
|
6,608
|
|
$
|
9,604
|
|
$
|
10,543
|
|
$
|
26,755
|
|
$
|
10,127
|
|
$
|
12,998
|
|
$
|
7,072
|
|
$
|
30,197
|
|
|||||||
__________________
|
(1)
|
The related loaned security could be returned to the Company on the next business day which would require the Company to immediately return the cash collateral.
|
If the Company is required to return significant amounts of cash collateral on short notice and is forced to sell securities to meet the return obligation, it may have difficulty selling such collateral that is invested in securities in a timely manner, be forced to sell securities in a volatile or illiquid market for less than what otherwise would have been realized under normal market conditions, or both. The estimated fair value of the securities on loan related to the cash collateral on open at
December 31, 2016
was
$6.5 billion
, over
99%
of which were U.S. government and agency securities which, if put back to the Company, could be immediately sold to satisfy the cash requirement.
The reinvestment portfolio acquired with the cash collateral consisted principally of fixed maturity securities (including agency RMBS, ABS, short-term investments, cash equivalents and U.S. government and agency securities) with
59%
invested in agency RMBS, short-term investments, cash equivalents, U.S. government and agency securities or held in cash. If the securities on loan or the reinvestment portfolio become less liquid, the Company has the liquidity resources of most of its general account available to meet any potential cash demands when securities on loan are put back to the Company.
Repurchase Agreement Transactions
Elements of the short-term repurchase agreements are presented below at:
|
December 31, 2016
|
December 31, 2015
|
|||||||
|
(In millions)
|
||||||||
|
Securities on loan included within fixed maturity securities:
|
||||||||
|
Amortized cost
|
$
|
98
|
|
$
|
51
|
|
||
|
Estimated fair value
|
$
|
113
|
|
$
|
56
|
|
||
|
Cash collateral received included within other liabilities
|
$
|
102
|
|
$
|
50
|
|
||
|
Reinvestment portfolio — estimated fair value
|
$
|
100
|
|
$
|
50
|
|
||
271
MetLife, Inc.
Notes to the Consolidated Financial Statements — (continued)
8. Investments (continued)
The cash collateral liability by loaned security type and remaining tenor of the agreements were as follows at:
|
December 31, 2016
|
December 31, 2015
|
|||||||||||||||||||||||
|
Remaining Tenor of
Repurchase Agreements
|
Remaining Tenor of
Repurchase Agreements
|
|||||||||||||||||||||||
|
1 Month
or Less
|
1 to 6
Months
|
Total
|
1 Month
or Less
|
1 to 6
Months
|
Total
|
|||||||||||||||||||
|
(In millions)
|
||||||||||||||||||||||||
|
Cash collateral liability by loaned security type:
|
||||||||||||||||||||||||
|
Foreign corporate
|
$
|
12
|
|
$
|
10
|
|
$
|
22
|
|
$
|
—
|
|
$
|
25
|
|
$
|
25
|
|
||||||
|
All other corporate and government
|
39
|
|
41
|
|
80
|
|
—
|
|
25
|
|
25
|
|
||||||||||||
|
Total
|
$
|
51
|
|
$
|
51
|
|
$
|
102
|
|
$
|
—
|
|
$
|
50
|
|
$
|
50
|
|
||||||
Invested Assets on Deposit, Held in Trust and Pledged as Collateral
Invested assets on deposit, held in trust and pledged as collateral are presented below at estimated fair value for all asset classes, except mortgage loans, which are presented at carrying value at:
|
December 31,
|
||||||||
|
2016
|
2015
|
|||||||
|
(In millions)
|
||||||||
|
Invested assets on deposit (regulatory deposits)
|
$
|
9,573
|
|
$
|
9,089
|
|
||
|
Invested assets held in trust (collateral financing arrangements and reinsurance agreements)
|
11,111
|
|
10,443
|
|
||||
|
Invested assets pledged as collateral (1)
|
27,431
|
|
23,145
|
|
||||
|
Total invested assets on deposit, held in trust and pledged as collateral
|
$
|
48,115
|
|
$
|
42,677
|
|
||
__________________
|
(1)
|
The Company has pledged invested assets in connection with various agreements and transactions, including funding agreements (see Notes
4
), collateral financing arrangements (see Note
13
) and derivative transactions (see Note
9
).
|
See “— Securities Lending” and “Repurchase Agreement Transactions” for information regarding securities on loan and Note
7
for information regarding investments designated to the closed block.
Purchased Credit Impaired Investments
Investments acquired with evidence of credit quality deterioration since origination and for which it is probable at the acquisition date that the Company will be unable to collect all contractually required payments are classified as PCI investments. For each investment, the excess of the cash flows expected to be collected as of the acquisition date over its acquisition date fair value is referred to as the accretable yield and is recognized as net investment income on an effective yield basis. If, subsequently, based on current information and events, it is probable that there is a significant increase in cash flows previously expected to be collected or if actual cash flows are significantly greater than cash flows previously expected to be collected, the accretable yield is adjusted prospectively. The excess of the contractually required payments (including interest) as of the acquisition date over the cash flows expected to be collected as of the acquisition date is referred to as the nonaccretable difference, and this amount is not expected to be realized as net investment income. Decreases in cash flows expected to be collected can result in OTTI or the recognition of mortgage loan valuation allowances.
272
MetLife, Inc.
Notes to the Consolidated Financial Statements — (continued)
8. Investments (continued)
The Company’s PCI investments, by invested asset class, were as follows at:
|
December 31,
|
|||||||||||||||
|
2016
|
2015
|
2016
|
2015
|
||||||||||||
|
Fixed Maturity Securities
|
Mortgage Loans
|
||||||||||||||
|
(In millions)
|
|||||||||||||||
|
Outstanding principal and interest balance (1)
|
$
|
7,121
|
|
$
|
6,410
|
|
$
|
—
|
|
$
|
148
|
|
|||
|
Carrying value (2)
|
$
|
5,569
|
|
$
|
4,883
|
|
$
|
—
|
|
$
|
129
|
|
|||
__________________
|
(1)
|
Represents the contractually required payments, which is the sum of contractual principal, whether or not currently due, and accrued interest.
|
|
(2)
|
Estimated fair value plus accrued interest for fixed maturity securities and amortized cost, plus accrued interest, less any valuation allowances, for mortgage loans.
|
The following table presents information about PCI investments acquired during the periods indicated:
|
Years Ended December 31,
|
|||||||||||||||
|
2016
|
2015
|
2016
|
2015
|
||||||||||||
|
Fixed Maturity Securities
|
Mortgage Loans
|
||||||||||||||
|
(In millions)
|
|||||||||||||||
|
Contractually required payments (including interest)
|
$
|
2,031
|
|
$
|
2,220
|
|
$
|
—
|
|
$
|
—
|
|
|||
|
Cash flows expected to be collected (1)
|
$
|
1,828
|
|
$
|
1,951
|
|
$
|
—
|
|
$
|
—
|
|
|||
|
Fair value of investments acquired
|
$
|
1,331
|
|
$
|
1,439
|
|
$
|
—
|
|
$
|
—
|
|
|||
__________________
|
(1)
|
Represents undiscounted principal and interest cash flow expectations, at the date of acquisition.
|
The following table presents activity for the accretable yield on PCI investments:
|
Years Ended December 31,
|
|||||||||||||||
|
2016
|
2015
|
2016
|
2015
|
||||||||||||
|
Fixed Maturity Securities
|
Mortgage Loans
|
||||||||||||||
|
(In millions)
|
|||||||||||||||
|
Accretable yield, January 1,
|
$
|
2,200
|
|
$
|
2,143
|
|
$
|
21
|
|
$
|
48
|
|
|||
|
Investments purchased
|
497
|
|
512
|
|
—
|
|
—
|
|
|||||||
|
Accretion recognized in earnings
|
(337
|
)
|
(325
|
)
|
(9
|
)
|
(56
|
)
|
|||||||
|
Disposals
|
(15
|
)
|
(56
|
)
|
—
|
|
—
|
|
|||||||
|
Reclassification (to) from nonaccretable difference
|
(183
|
)
|
(74
|
)
|
(12
|
)
|
29
|
|
|||||||
|
Accretable yield, December 31,
|
$
|
2,162
|
|
$
|
2,200
|
|
$
|
—
|
|
$
|
21
|
|
|||
Collectively Significant Equity Method Investments
The Company holds investments in real estate joint ventures, real estate funds and other limited partnership interests consisting of leveraged buy-out funds, hedge funds, private equity funds, joint ventures and other funds. The portion of these investments accounted for under the equity method had a carrying value of
$14.3 billion
at December 31,
2016
. The Company’s maximum exposure to loss related to these equity method investments is limited to the carrying value of these investments plus unfunded commitments of
$6.0 billion
at December 31,
2016
. Except for certain real estate joint ventures, the Company’s investments in real estate funds and other limited partnership interests are generally of a passive nature in that the Company does not participate in the management of the entities.
273
MetLife, Inc.
Notes to the Consolidated Financial Statements — (continued)
8. Investments (continued)
As described in Note
1
, the Company generally records its share of earnings in its equity method investments using a three-month lag methodology and within net investment income. Aggregate net investment income from these equity method investments exceeded
10%
of the Company’s consolidated pre-tax income (loss) from continuing operations for one of the three most recent annual periods: 2016. The Company is providing the following aggregated summarized financial data for such equity method investments, for the most recent annual periods, in order to provide comparative information. This aggregated summarized financial data does not represent the Company’s proportionate share of the assets, liabilities, or earnings of such entities.
The aggregated summarized financial data presented below reflects the latest available financial information and is as of, and for, the years ended December 31,
2016
,
2015
and
2014
. Aggregate total assets of these entities totaled
$436.9 billion
and
$447.5 billion
at December 31,
2016
and
2015
, respectively. Aggregate total liabilities of these entities totaled
$56.4 billion
and
$72.0 billion
at December 31,
2016
and
2015
, respectively. Aggregate net income (loss) of these entities totaled
$26.8 billion
,
$25.8 billion
and
$34.9 billion
for the years ended December 31,
2016
,
2015
and
2014
, respectively. Aggregate net income (loss) from the underlying entities in which the Company invests is primarily comprised of investment income, including recurring investment income and realized and unrealized investment gains (losses).
Variable Interest Entities
The Company has invested in legal entities that are VIEs. In certain instances, the Company holds both the power to direct the most significant activities of the entity, as well as an economic interest in the entity and, as such, is deemed to be the primary beneficiary or consolidator of the entity. The determination of the VIE’s primary beneficiary requires an evaluation of the contractual and implied rights and obligations associated with each party’s relationship with or involvement in the entity, an estimate of the entity’s expected losses and expected residual returns and the allocation of such estimates to each party involved in the entity.
Consolidated VIEs
Creditors or beneficial interest holders of VIEs where the Company is the primary beneficiary have no recourse to the general credit of the Company, as the Company’s obligation to the VIEs is limited to the amount of its committed investment.
The following table presents the total assets and total liabilities relating to VIEs for which the Company has concluded that it is the primary beneficiary and which are consolidated at December 31,
2016
and
2015
.
|
December 31,
|
|||||||||||||||
|
2016
|
2015
|
||||||||||||||
|
Total
Assets |
Total
Liabilities |
Total
Assets |
Total
Liabilities |
||||||||||||
|
(In millions)
|
|||||||||||||||
|
MRSC (collateral financing arrangement (primarily securities)) (1)
|
$
|
3,422
|
|
$
|
—
|
|
$
|
3,374
|
|
$
|
—
|
|
|||
|
Operating joint venture (2)
|
—
|
|
—
|
|
2,465
|
|
2,079
|
|
|||||||
|
CSEs (assets (primarily loans) and liabilities (primarily debt)) (3)
|
146
|
|
35
|
|
186
|
|
62
|
|
|||||||
|
Other investments (4)
|
50
|
|
—
|
|
76
|
|
—
|
|
|||||||
|
Total
|
$
|
3,618
|
|
$
|
35
|
|
$
|
6,101
|
|
$
|
2,141
|
|
|||
__________________
|
(1)
|
See Note
13
for a description of the MetLife Reinsurance Company of South Carolina (“MRSC”) collateral financing arrangement.
|
|
(2)
|
Following a change in the foreign investment law in India, the Company no longer consolidated its India operating joint venture, effective January 1, 2016. Assets of the operating joint venture are primarily fixed maturity securities and separate account assets. Liabilities of the operating joint venture are primarily future policy benefits, other policy-related balances and separate account liabilities.
|
|
(3)
|
The Company consolidates entities that are structured as CMBS and as collateralized debt obligations. The assets of these entities can only be used to settle their respective liabilities, and under no circumstances is the Company liable for any principal or interest shortfalls should any arise. The Company’s exposure was limited to that of its remaining investment in these entities of
$95 million
and
$105 million
at estimated fair value at December 31,
2016
and
2015
, respectively.
|
|
(4)
|
Other investments is comprised of other invested assets and other limited partnership interests.
|
274
MetLife, Inc.
Notes to the Consolidated Financial Statements — (continued)
8. Investments (continued)
Unconsolidated VIEs
The carrying amount and maximum exposure to loss relating to VIEs in which the Company holds a significant variable interest but is not the primary beneficiary and which have not been consolidated were as follows at:
|
December 31,
|
|||||||||||||||
|
2016
|
2015
|
||||||||||||||
|
Carrying
Amount |
Maximum
Exposure to Loss (1) |
Carrying
Amount |
Maximum
Exposure to Loss (1) |
||||||||||||
|
(In millions)
|
|||||||||||||||
|
Fixed maturity securities AFS:
|
|||||||||||||||
|
Structured Securities (2)
|
$
|
59,773
|
|
$
|
59,773
|
|
$
|
65,824
|
|
$
|
65,824
|
|
|||
|
U.S. and foreign corporate
|
2,845
|
|
2,845
|
|
3,261
|
|
3,261
|
|
|||||||
|
Other limited partnership interests
|
6,208
|
|
11,282
|
|
5,186
|
|
7,074
|
|
|||||||
|
Other invested assets
|
2,261
|
|
2,837
|
|
1,604
|
|
2,161
|
|
|||||||
|
Other (3)
|
252
|
|
271
|
|
722
|
|
739
|
|
|||||||
|
Total
|
$
|
71,339
|
|
$
|
77,008
|
|
$
|
76,597
|
|
$
|
79,059
|
|
|||
__________________
|
(1)
|
The maximum exposure to loss relating to fixed maturity securities AFS, FVO and trading securities and equity securities AFS is equal to their carrying amounts or the carrying amounts of retained interests. The maximum exposure to loss relating to other limited partnership interests, mortgage loans and real estate joint ventures is equal to the carrying amounts plus any unfunded commitments. For certain of its investments in other invested assets, the Company’s return is in the form of income tax credits which are guaranteed by creditworthy third parties. For such investments, the maximum exposure to loss is equal to the carrying amounts plus any unfunded commitments, reduced by income tax credits guaranteed by third parties of
$150 million
and
$179 million
at December 31,
2016
and
2015
, respectively. Such a maximum loss would be expected to occur only upon bankruptcy of the issuer or investee.
|
|
(2)
|
For these variable interests, the Company’s involvement is limited to that of a passive investor in mortgage-backed or asset-backed securities issued by trusts that do not have substantial equity.
|
|
(3)
|
Other is comprised of mortgage loans, common stock, non-redeemable preferred stock, real estate joint ventures and FVO and trading securities.
|
As described in
Note 21
, the Company makes commitments to fund partnership investments in the normal course of business. Excluding these commitments, the Company did not provide financial or other support to investees designated as VIEs during the years ended December 31,
2016
,
2015
and
2014
.
275
MetLife, Inc.
Notes to the Consolidated Financial Statements — (continued)
8. Investments (continued)
Net Investment Income
The components of net investment income were as follows:
|
Years Ended December 31,
|
|||||||||||
|
2016
|
2015
|
2014
|
|||||||||
|
(In millions)
|
|||||||||||
|
Investment income:
|
|||||||||||
|
Fixed maturity securities
|
$
|
14,313
|
|
$
|
14,235
|
|
$
|
14,868
|
|
||
|
Equity securities
|
140
|
|
144
|
|
133
|
|
|||||
|
FVO and trading securities — FVO general account and Actively traded securities (1)
|
37
|
|
21
|
|
103
|
|
|||||
|
Mortgage loans
|
3,259
|
|
3,136
|
|
2,928
|
|
|||||
|
Policy loans
|
589
|
|
603
|
|
629
|
|
|||||
|
Real estate and real estate joint ventures
|
684
|
|
981
|
|
951
|
|
|||||
|
Other limited partnership interests
|
641
|
|
669
|
|
1,033
|
|
|||||
|
Cash, cash equivalents and short-term investments
|
173
|
|
148
|
|
168
|
|
|||||
|
Operating joint ventures
|
33
|
|
25
|
|
10
|
|
|||||
|
Other
|
263
|
|
248
|
|
192
|
|
|||||
|
Subtotal
|
20,132
|
|
20,210
|
|
21,015
|
|
|||||
|
Less: Investment expenses
|
1,147
|
|
1,209
|
|
1,178
|
|
|||||
|
Subtotal, net
|
18,985
|
|
19,001
|
|
19,837
|
|
|||||
|
FVO and trading securities — FVO contractholder-directed unit-linked investments (1)
|
950
|
|
264
|
|
1,266
|
|
|||||
|
FVO CSEs — interest income:
|
|||||||||||
|
Commercial mortgage loans
|
12
|
|
16
|
|
49
|
|
|||||
|
Securities
|
—
|
|
—
|
|
1
|
|
|||||
|
Subtotal
|
962
|
|
280
|
|
1,316
|
|
|||||
|
Net investment income
|
$
|
19,947
|
|
$
|
19,281
|
|
$
|
21,153
|
|
||
__________________
|
(1)
|
Changes in estimated fair value subsequent to purchase for securities still held as of the end of the respective periods included in net investment income were principally from FVO contractholder-directed unit-linked investments and, to a much lesser extent, actively traded and FVO general account securities, and were
$427 million
,
($456) million
and
$642 million
for the years ended
December 31, 2016
,
2015
, and
2014
, respectively.
|
See “— Variable Interest Entities” for discussion of CSEs.
276
MetLife, Inc.
Notes to the Consolidated Financial Statements — (continued)
8. Investments (continued)
Net Investment Gains (Losses)
Components of Net Investment Gains (Losses)
The components of net investment gains (losses) were as follows:
|
Years Ended December 31,
|
|||||||||||
|
2016
|
2015
|
2014
|
|||||||||
|
(In millions)
|
|||||||||||
|
Total gains (losses) on fixed maturity securities:
|
|||||||||||
|
Total OTTI losses recognized — by sector and industry:
|
|||||||||||
|
U.S. and foreign corporate securities — by industry:
|
|||||||||||
|
Industrial
|
$
|
(79
|
)
|
$
|
(5
|
)
|
$
|
—
|
|
||
|
Utility
|
(21
|
)
|
(21
|
)
|
—
|
|
|||||
|
Consumer
|
—
|
|
(28
|
)
|
(7
|
)
|
|||||
|
Transportation
|
—
|
|
—
|
|
(2
|
)
|
|||||
|
Communications
|
(3
|
)
|
—
|
|
—
|
|
|||||
|
Total U.S. and foreign corporate securities
|
(103
|
)
|
(54
|
)
|
(9
|
)
|
|||||
|
RMBS
|
(24
|
)
|
(30
|
)
|
(31
|
)
|
|||||
|
ABS
|
(2
|
)
|
—
|
|
(7
|
)
|
|||||
|
CMBS
|
—
|
|
—
|
|
(13
|
)
|
|||||
|
State and political subdivision
|
—
|
|
(6
|
)
|
—
|
|
|||||
|
OTTI losses on fixed maturity securities recognized in earnings
|
(129
|
)
|
(90
|
)
|
(60
|
)
|
|||||
|
Fixed maturity securities — net gains (losses) on sales and disposals
|
154
|
|
204
|
|
598
|
|
|||||
|
Total gains (losses) on fixed maturity securities
|
25
|
|
114
|
|
538
|
|
|||||
|
Total gains (losses) on equity securities:
|
|||||||||||
|
Total OTTI losses recognized — by sector:
|
|||||||||||
|
Common stock
|
(77
|
)
|
(39
|
)
|
(13
|
)
|
|||||
|
Non-redeemable preferred stock
|
—
|
|
(1
|
)
|
(23
|
)
|
|||||
|
OTTI losses on equity securities recognized in earnings
|
(77
|
)
|
(40
|
)
|
(36
|
)
|
|||||
|
Equity securities — net gains (losses) on sales and disposals
|
29
|
|
61
|
|
101
|
|
|||||
|
Total gains (losses) on equity securities
|
(48
|
)
|
21
|
|
65
|
|
|||||
|
FVO and trading securities — FVO general account securities
|
—
|
|
—
|
|
9
|
|
|||||
|
Mortgage loans
|
(224
|
)
|
(105
|
)
|
(36
|
)
|
|||||
|
Real estate and real estate joint ventures
|
147
|
|
531
|
|
222
|
|
|||||
|
Other limited partnership interests
|
(71
|
)
|
(67
|
)
|
(78
|
)
|
|||||
|
Other
|
(87
|
)
|
(6
|
)
|
(110
|
)
|
|||||
|
Subtotal
|
(258
|
)
|
488
|
|
610
|
|
|||||
|
FVO CSEs:
|
|||||||||||
|
Commercial mortgage loans
|
(2
|
)
|
(7
|
)
|
(13
|
)
|
|||||
|
Securities
|
1
|
|
—
|
|
—
|
|
|||||
|
Long-term debt — related to commercial mortgage loans
|
1
|
|
4
|
|
19
|
|
|||||
|
Long-term debt — related to securities
|
—
|
|
—
|
|
(1
|
)
|
|||||
|
Non-investment portfolio gains (losses) (1)
|
429
|
|
112
|
|
(812
|
)
|
|||||
|
Subtotal
|
429
|
|
109
|
|
(807
|
)
|
|||||
|
Total net investment gains (losses)
|
$
|
171
|
|
$
|
597
|
|
$
|
(197
|
)
|
||
__________________
277
MetLife, Inc.
Notes to the Consolidated Financial Statements — (continued)
8. Investments (continued)
|
(1)
|
Non-investment portfolio gains (losses) for the year ended
December 31, 2016
includes a gain from the U.S. Retail Advisor Force Divestiture of
$102 million
as more fully described in Note
3
. Non-investment portfolio gains (losses) for the year ended December 31,
2014
includes a loss of
$633 million
related to the disposition of MAL as more fully described in Note
3
.
|
See “— Variable Interest Entities” for discussion of CSEs.
Gains (losses) from foreign currency transactions included within net investment gains (losses) were
$263 million
,
$46 million
and
($183) million
for the years ended December 31,
2016
,
2015
and
2014
, respectively.
Sales or Disposals and Impairments of Fixed Maturity and Equity Securities
Investment gains and losses on sales of securities are determined on a specific identification basis. Proceeds from sales or disposals of fixed maturity and equity securities and the components of fixed maturity and equity securities net investment gains (losses) were as shown in the table below.
|
Years Ended December 31,
|
|||||||||||||||||||||||
|
2016
|
2015
|
2014
|
2016
|
2015
|
2014
|
||||||||||||||||||
|
Fixed Maturity Securities
|
Equity Securities
|
||||||||||||||||||||||
|
(In millions)
|
|||||||||||||||||||||||
|
Proceeds
|
$
|
125,979
|
|
$
|
115,395
|
|
$
|
82,075
|
|
$
|
326
|
|
$
|
358
|
|
$
|
544
|
|
|||||
|
Gross investment gains
|
$
|
1,231
|
|
$
|
1,262
|
|
$
|
1,165
|
|
$
|
46
|
|
$
|
99
|
|
$
|
112
|
|
|||||
|
Gross investment losses
|
(1,077
|
)
|
(1,058
|
)
|
(567
|
)
|
(17
|
)
|
(38
|
)
|
(11
|
)
|
|||||||||||
|
OTTI losses
|
(129
|
)
|
(90
|
)
|
(60
|
)
|
(77
|
)
|
(40
|
)
|
(36
|
)
|
|||||||||||
|
Net investment gains (losses)
|
$
|
25
|
|
$
|
114
|
|
$
|
538
|
|
$
|
(48
|
)
|
$
|
21
|
|
$
|
65
|
|
|||||
Credit Loss Rollforward
The table below presents a rollforward of the cumulative credit loss component of OTTI loss recognized in earnings on fixed maturity securities still held for which a portion of the OTTI loss was recognized in OCI:
|
Years Ended December 31,
|
|||||||
|
2016
|
2015
|
||||||
|
(In millions)
|
|||||||
|
Balance at January 1,
|
$
|
277
|
|
$
|
357
|
|
|
|
Additions:
|
|||||||
|
Initial impairments — credit loss OTTI on securities not previously impaired
|
1
|
|
20
|
|
|||
|
Additional impairments — credit loss OTTI on securities previously impaired
|
23
|
|
26
|
|
|||
|
Reductions:
|
|||||||
|
Sales (maturities, pay downs or prepayments) of securities previously impaired as credit loss OTTI
|
(85
|
)
|
(124
|
)
|
|||
|
Securities impaired to net present value of expected future cash flows
|
(1
|
)
|
—
|
|
|||
|
Increase in cash flows — accretion of previous credit loss OTTI
|
—
|
|
(2
|
)
|
|||
|
Balance at December 31,
|
$
|
215
|
|
$
|
277
|
|
|
9. Derivatives
Accounting for Derivatives
See Note
1
for a description of the Company’s accounting policies for derivatives and Note
10
for information about the fair value hierarchy for derivatives.
Derivative Strategies
The Company is exposed to various risks relating to its ongoing business operations, including interest rate, foreign currency exchange rate, credit and equity market. The Company uses a variety of strategies to manage these risks, including the use of derivatives.
278
MetLife, Inc.
Notes to the Consolidated Financial Statements — (continued)
9. Derivatives (continued)
Derivatives are financial instruments with values derived from interest rates, foreign currency exchange rates, credit spreads and/or other financial indices. Derivatives may be exchange-traded or contracted in the over-the-counter (“OTC”) market. Certain of the Company’s OTC derivatives are cleared and settled through central clearing counterparties (“OTC-cleared”), while others are bilateral contracts between two counterparties (“OTC-bilateral”). The types of derivatives the Company uses include swaps, forwards, futures and option contracts. To a lesser extent, the Company uses credit default swaps and structured interest rate swaps to synthetically replicate investment risks and returns which are not readily available in the cash markets.
Interest Rate Derivatives
The Company uses a variety of interest rate derivatives to reduce its exposure to changes in interest rates, including interest rate swaps, interest rate total return swaps, caps, floors, swaptions, futures and forwards.
Interest rate swaps are used by the Company primarily to reduce market risks from changes in interest rates and to alter interest rate exposure arising from mismatches between assets and liabilities (duration mismatches). In an interest rate swap, the Company agrees with another party to exchange, at specified intervals, the difference between fixed rate and floating rate interest amounts as calculated by reference to an agreed notional amount. The Company utilizes interest rate swaps in fair value, cash flow and nonqualifying hedging relationships.
The Company uses structured interest rate swaps to synthetically create investments that are either more expensive to acquire or otherwise unavailable in the cash markets. These transactions are a combination of a derivative and a cash instrument such as a U.S. government and agency, or other fixed maturity security. Structured interest rate swaps are included in interest rate swaps and are not designated as hedging instruments.
Interest rate total return swaps are swaps whereby the Company agrees with another party to exchange, at specified intervals, the difference between the economic risk and reward of an asset or a market index and the London Interbank Offered Rate (“LIBOR”), calculated by reference to an agreed notional amount. No cash is exchanged at the outset of the contract. Cash is paid and received over the life of the contract based on the terms of the swap. These transactions are entered into pursuant to master agreements that provide for a single net payment to be made by the counterparty at each due date. Interest rate total return swaps are used by the Company to reduce market risks from changes in interest rates and to alter interest rate exposure arising from mismatches between assets and liabilities (duration mismatches). The Company utilizes interest rate total return swaps in nonqualifying hedging relationships.
The Company purchases interest rate caps and floors primarily to protect its floating rate liabilities against rises in interest rates above a specified level, and against interest rate exposure arising from mismatches between assets and liabilities, as well as to protect its minimum rate guarantee liabilities against declines in interest rates below a specified level, respectively. In certain instances, the Company locks in the economic impact of existing purchased caps and floors by entering into offsetting written caps and floors. The Company utilizes interest rate caps and floors in nonqualifying hedging relationships.
In exchange-traded interest rate (Treasury and swap) futures transactions, the Company agrees to purchase or sell a specified number of contracts, the value of which is determined by the different classes of interest rate securities, and to post variation margin on a daily basis in an amount equal to the difference in the daily market values of those contracts. The Company enters into exchange-traded futures with regulated futures commission merchants that are members of the exchange. Exchange-traded interest rate (Treasury and swap) futures are used primarily to hedge mismatches between the duration of assets in a portfolio and the duration of liabilities supported by those assets, to hedge against changes in value of securities the Company owns or anticipates acquiring, to hedge against changes in interest rates on anticipated liability issuances by replicating Treasury or swap curve performance, and to hedge minimum guarantees embedded in certain variable annuity products offered by the Company. The Company utilizes exchange-traded interest rate futures in nonqualifying hedging relationships.
Swaptions are used by the Company to hedge interest rate risk associated with the Company’s long-term liabilities and invested assets. A swaption is an option to enter into a swap with a forward starting effective date. In certain instances, the Company locks in the economic impact of existing purchased swaptions by entering into offsetting written swaptions. The Company pays a premium for purchased swaptions and receives a premium for written swaptions. The Company utilizes swaptions in nonqualifying hedging relationships. Swaptions are included in interest rate options.
The Company enters into interest rate forwards to buy and sell securities. The price is agreed upon at the time of the contract and payment for such a contract is made at a specified future date. The Company utilizes interest rate forwards in cash flow and nonqualifying hedging relationships.
279
MetLife, Inc.
Notes to the Consolidated Financial Statements — (continued)
9. Derivatives (continued)
Foreign Currency Exchange Rate Derivatives
The Company uses foreign currency exchange rate derivatives, including foreign currency swaps, foreign currency forwards, currency options and exchange-traded currency futures, to reduce the risk from fluctuations in foreign currency exchange rates associated with its assets and liabilities denominated in foreign currencies. The Company also uses foreign currency derivatives to hedge the foreign currency exchange rate risk associated with certain of its net investments in foreign operations.
In a foreign currency swap transaction, the Company agrees with another party to exchange, at specified intervals, the difference between one currency and another at a fixed exchange rate, generally set at inception, calculated by reference to an agreed upon notional amount. The notional amount of each currency is exchanged at the inception and termination of the currency swap by each party. The Company utilizes foreign currency swaps in fair value, cash flow and nonqualifying hedging relationships.
In a foreign currency forward transaction, the Company agrees with another party to deliver a specified amount of an identified currency at a specified future date. The price is agreed upon at the time of the contract and payment for such a contract is made at the specified future date. The Company utilizes foreign currency forwards in fair value, net investment in foreign operations and nonqualifying hedging relationships.
The Company enters into currency options that give it the right, but not the obligation, to sell the foreign currency amount in exchange for a functional currency amount within a limited time at a contracted price. The contracts may also be net settled in cash, based on differentials in the foreign currency exchange rate and the strike price. The Company uses currency options to hedge against the foreign currency exposure inherent in certain of its variable annuity products. The Company also uses currency options as an economic hedge of foreign currency exposure related to the Company’s international subsidiaries. The Company utilizes currency options in net investment in foreign operations and nonqualifying hedging relationships.
To a lesser extent, the Company uses exchange-traded currency futures to hedge currency mismatches between assets and liabilities, and to hedge minimum guarantees embedded in certain variable annuity products offered by the Company. The Company utilizes exchange-traded currency futures in nonqualifying hedging relationships.
Credit Derivatives
The Company enters into purchased credit default swaps to hedge against credit-related changes in the value of its investments. In a credit default swap transaction, the Company agrees with another party to pay, at specified intervals, a premium to hedge credit risk. If a credit event occurs, as defined by the contract, the contract may be cash settled or it may be settled gross by the delivery of par quantities of the referenced investment equal to the specified swap notional amount in exchange for the payment of cash amounts by the counterparty equal to the par value of the investment surrendered. Credit events vary by type of issuer but typically include bankruptcy, failure to pay debt obligations, repudiation, moratorium, involuntary restructuring or governmental intervention. In each case, payout on a credit default swap is triggered only after the Credit Derivatives Determinations Committee of the International Swaps and Derivatives Association, Inc. (“ISDA”) deems that a credit event has occurred. The Company utilizes credit default swaps in nonqualifying hedging relationships.
The Company enters into written credit default swaps to synthetically create credit investments that are either more expensive to acquire or otherwise unavailable in the cash markets. These transactions are a combination of a derivative and one or more cash instruments, such as U.S. government and agency securities, or other fixed maturity securities. These credit default swaps are not designated as hedging instruments.
The Company also enters into certain purchased and written credit default swaps held in relation to trading portfolios for the purpose of generating profits on short-term differences in price. These credit default swaps are not designated as hedging instruments. At December 31, 2016, the Company no longer maintained a trading portfolio for derivatives.
The Company enters into forwards to lock in the price to be paid for forward purchases of certain securities. The price is agreed upon at the time of the contract and payment for the contract is made at a specified future date. When the primary purpose of entering into these transactions is to hedge against the risk of changes in purchase price due to changes in credit spreads, the Company designates these transactions as credit forwards. The Company utilizes credit forwards in cash flow hedging relationships.
280
MetLife, Inc.
Notes to the Consolidated Financial Statements — (continued)
9. Derivatives (continued)
Equity Derivatives
The Company uses a variety of equity derivatives to reduce its exposure to equity market risk, including equity index options, equity variance swaps, exchange-traded equity futures and equity total return swaps.
Equity index options are used by the Company primarily to hedge minimum guarantees embedded in certain variable annuity products offered by the Company. To hedge against adverse changes in equity indices, the Company enters into contracts to sell the equity index within a limited time at a contracted price. The contracts will be net settled in cash based on differentials in the indices at the time of exercise and the strike price. Certain of these contracts may also contain settlement provisions linked to interest rates. In certain instances, the Company may enter into a combination of transactions to hedge adverse changes in equity indices within a pre-determined range through the purchase and sale of options. The Company utilizes equity index options in nonqualifying hedging relationships.
Equity variance swaps are used by the Company primarily to hedge minimum guarantees embedded in certain variable annuity products offered by the Company. In an equity variance swap, the Company agrees with another party to exchange amounts in the future, based on changes in equity volatility over a defined period. The Company utilizes equity variance swaps in nonqualifying hedging relationships.
In exchange-traded equity futures transactions, the Company agrees to purchase or sell a specified number of contracts, the value of which is determined by the different classes of equity securities, and to post variation margin on a daily basis in an amount equal to the difference in the daily market values of those contracts. The Company enters into exchange-traded futures with regulated futures commission merchants that are members of the exchange. Exchange-traded equity futures are used primarily to hedge minimum guarantees embedded in certain variable annuity products offered by the Company. The Company utilizes exchange-traded equity futures in nonqualifying hedging relationships.
In an equity total return swap, the Company agrees with another party to exchange, at specified intervals, the difference between the economic risk and reward of an asset or a market index and LIBOR, calculated by reference to an agreed notional amount. No cash is exchanged at the outset of the contract. Cash is paid and received over the life of the contract based on the terms of the swap. The Company uses equity total return swaps to hedge its equity market guarantees in certain of its insurance products. Equity total return swaps can be used as hedges or to synthetically create investments. The Company utilizes equity total return swaps in nonqualifying hedging relationships.
281
MetLife, Inc.
Notes to the Consolidated Financial Statements — (continued)
9. Derivatives (continued)
Primary Risks Managed by Derivatives
The following table presents the gross notional amount, estimated fair value and primary underlying risk exposure of the Company’s derivatives, excluding embedded derivatives, held at:
|
Primary Underlying Risk Exposure
|
December 31,
|
||||||||||||||||||||||||
|
2016
|
2015
|
||||||||||||||||||||||||
|
Estimated Fair Value
|
Estimated Fair Value
|
||||||||||||||||||||||||
|
Gross
Notional
Amount
|
Assets
|
Liabilities
|
Gross
Notional
Amount
|
Assets
|
Liabilities
|
||||||||||||||||||||
|
(In millions)
|
|||||||||||||||||||||||||
|
Derivatives Designated as Hedging Instruments:
|
|||||||||||||||||||||||||
|
Fair value hedges:
|
|||||||||||||||||||||||||
|
Interest rate swaps
|
Interest rate
|
$
|
5,331
|
|
$
|
2,262
|
|
$
|
6
|
|
$
|
5,528
|
|
$
|
2,215
|
|
$
|
12
|
|
||||||
|
Foreign currency swaps
|
Foreign currency exchange rate
|
1,221
|
|
34
|
|
224
|
|
2,154
|
|
62
|
|
159
|
|
||||||||||||
|
Foreign currency forwards
|
Foreign currency exchange rate
|
1,085
|
|
—
|
|
54
|
|
1,685
|
|
—
|
|
52
|
|
||||||||||||
|
Subtotal
|
7,637
|
|
2,296
|
|
284
|
|
9,367
|
|
2,277
|
|
223
|
|
|||||||||||||
|
Cash flow hedges:
|
|||||||||||||||||||||||||
|
Interest rate swaps
|
Interest rate
|
2,085
|
|
332
|
|
34
|
|
2,190
|
|
487
|
|
—
|
|
||||||||||||
|
Interest rate forwards
|
Interest rate
|
4,032
|
|
—
|
|
370
|
|
105
|
|
23
|
|
—
|
|
||||||||||||
|
Foreign currency swaps
|
Foreign currency exchange rate
|
28,173
|
|
2,079
|
|
2,065
|
|
23,661
|
|
1,303
|
|
1,803
|
|
||||||||||||
|
Subtotal
|
34,290
|
|
2,411
|
|
2,469
|
|
25,956
|
|
1,813
|
|
1,803
|
|
|||||||||||||
|
Foreign operations hedges:
|
|||||||||||||||||||||||||
|
Foreign currency forwards
|
Foreign currency exchange rate
|
1,394
|
|
47
|
|
5
|
|
3,916
|
|
63
|
|
12
|
|
||||||||||||
|
Currency options
|
Foreign currency exchange rate
|
8,878
|
|
148
|
|
45
|
|
7,569
|
|
205
|
|
36
|
|
||||||||||||
|
Subtotal
|
10,272
|
|
195
|
|
50
|
|
11,485
|
|
268
|
|
48
|
|
|||||||||||||
|
Total qualifying hedges
|
52,199
|
|
4,902
|
|
2,803
|
|
46,808
|
|
4,358
|
|
2,074
|
|
|||||||||||||
|
Derivatives Not Designated or Not Qualifying as Hedging Instruments:
|
|||||||||||||||||||||||||
|
Interest rate swaps
|
Interest rate
|
81,524
|
|
6,017
|
|
3,328
|
|
89,288
|
|
5,109
|
|
2,247
|
|
||||||||||||
|
Interest rate floors
|
Interest rate
|
14,201
|
|
187
|
|
9
|
|
23,837
|
|
311
|
|
48
|
|
||||||||||||
|
Interest rate caps
|
Interest rate
|
90,400
|
|
137
|
|
2
|
|
68,928
|
|
105
|
|
3
|
|
||||||||||||
|
Interest rate futures
|
Interest rate
|
6,081
|
|
12
|
|
12
|
|
5,808
|
|
4
|
|
7
|
|
||||||||||||
|
Interest rate options
|
Interest rate
|
20,854
|
|
764
|
|
1
|
|
30,234
|
|
1,177
|
|
30
|
|
||||||||||||
|
Interest rate forwards
|
Interest rate
|
613
|
|
—
|
|
25
|
|
43
|
|
1
|
|
—
|
|
||||||||||||
|
Interest rate total return swaps
|
Interest rate
|
5,425
|
|
2
|
|
738
|
|
48
|
|
2
|
|
—
|
|
||||||||||||
|
Synthetic GICs
|
Interest rate
|
5,566
|
|
—
|
|
—
|
|
4,216
|
|
—
|
|
—
|
|
||||||||||||
|
Foreign currency swaps
|
Foreign currency exchange rate
|
12,912
|
|
1,600
|
|
466
|
|
11,081
|
|
766
|
|
431
|
|
||||||||||||
|
Foreign currency forwards
|
Foreign currency exchange rate
|
15,580
|
|
126
|
|
977
|
|
11,724
|
|
154
|
|
220
|
|
||||||||||||
|
Currency futures
|
Foreign currency exchange rate
|
915
|
|
—
|
|
—
|
|
930
|
|
—
|
|
—
|
|
||||||||||||
|
Currency options
|
Foreign currency exchange rate
|
3,615
|
|
195
|
|
17
|
|
9,590
|
|
466
|
|
189
|
|
||||||||||||
|
Credit default swaps — purchased
|
Credit
|
2,038
|
|
14
|
|
40
|
|
1,870
|
|
28
|
|
34
|
|
||||||||||||
|
Credit default swaps — written
|
Credit
|
12,645
|
|
189
|
|
9
|
|
10,311
|
|
78
|
|
13
|
|
||||||||||||
|
Equity futures
|
Equity market
|
12,494
|
|
68
|
|
3
|
|
7,206
|
|
63
|
|
18
|
|
||||||||||||
|
Equity index options
|
Equity market
|
54,028
|
|
1,323
|
|
1,458
|
|
55,682
|
|
1,542
|
|
1,041
|
|
||||||||||||
|
Equity variance swaps
|
Equity market
|
23,157
|
|
223
|
|
756
|
|
23,437
|
|
195
|
|
636
|
|
||||||||||||
|
Equity total return swaps
|
Equity market
|
3,901
|
|
2
|
|
160
|
|
3,803
|
|
47
|
|
58
|
|
||||||||||||
|
Total non-designated or nonqualifying derivatives
|
365,949
|
|
10,859
|
|
8,001
|
|
358,036
|
|
10,048
|
|
4,975
|
|
|||||||||||||
|
Total
|
$
|
418,148
|
|
$
|
15,761
|
|
$
|
10,804
|
|
$
|
404,844
|
|
$
|
14,406
|
|
$
|
7,049
|
|
|||||||
282
MetLife, Inc.
Notes to the Consolidated Financial Statements — (continued)
9. Derivatives (continued)
Based on gross notional amounts, a substantial portion of the Company’s derivatives was not designated or did not qualify as part of a hedging relationship at both
December 31, 2016
and
2015
. The Company’s use of derivatives includes (i) derivatives that serve as macro hedges of the Company’s exposure to various risks and that generally do not qualify for hedge accounting due to the criteria required under the portfolio hedging rules; (ii) derivatives that economically hedge insurance liabilities that contain mortality or morbidity risk and that generally do not qualify for hedge accounting because the lack of these risks in the derivatives cannot support an expectation of a highly effective hedging relationship; (iii) derivatives that economically hedge embedded derivatives that do not qualify for hedge accounting because the changes in estimated fair value of the embedded derivatives are already recorded in net income; and (iv) written credit default swaps that are used to synthetically create credit investments and that do not qualify for hedge accounting because they do not involve a hedging relationship. For these nonqualified derivatives, changes in market factors can lead to the recognition of fair value changes on the statement of operations without an offsetting gain or loss recognized in earnings for the item being hedged.
Net Derivative Gains (Losses)
The components of net derivative gains (losses) were as follows:
|
Years Ended December 31,
|
|||||||||||
|
2016
|
2015
|
2014
|
|||||||||
|
(In millions)
|
|||||||||||
|
Freestanding derivatives and hedging gains (losses) (1)
|
$
|
(4,536
|
)
|
$
|
277
|
|
$
|
1,638
|
|
||
|
Embedded derivatives gains (losses)
|
(2,224
|
)
|
(239
|
)
|
(321
|
)
|
|||||
|
Total net derivative gains (losses)
|
$
|
(6,760
|
)
|
$
|
38
|
|
$
|
1,317
|
|
||
__________________
|
(1)
|
Includes foreign currency transaction gains (losses) on hedged items in cash flow and nonqualifying hedging relationships, which are not presented elsewhere in this note.
|
The following table presents earned income on derivatives:
|
Years Ended December 31,
|
|||||||||||
|
2016
|
2015
|
2014
|
|||||||||
|
(In millions)
|
|||||||||||
|
Qualifying hedges:
|
|||||||||||
|
Net investment income
|
$
|
288
|
|
$
|
219
|
|
$
|
158
|
|
||
|
Interest credited to policyholder account balances
|
(1
|
)
|
25
|
|
101
|
|
|||||
|
Other expenses
|
(12
|
)
|
(6
|
)
|
(3
|
)
|
|||||
|
Nonqualifying hedges:
|
|||||||||||
|
Net investment income
|
(1
|
)
|
(5
|
)
|
(4
|
)
|
|||||
|
Net derivative gains (losses)
|
1,166
|
|
1,024
|
|
828
|
|
|||||
|
Policyholder benefits and claims
|
23
|
|
16
|
|
40
|
|
|||||
|
Total
|
$
|
1,463
|
|
$
|
1,273
|
|
$
|
1,120
|
|
||
283
MetLife, Inc.
Notes to the Consolidated Financial Statements — (continued)
9. Derivatives (continued)
Nonqualifying Derivatives and Derivatives for Purposes Other Than Hedging
The following table presents the amount and location of gains (losses) recognized in income for derivatives that were not designated or not qualifying as hedging instruments:
|
Net
Derivative Gains (Losses) |
Net
Investment Income (1) |
Policyholder
Benefits and Claims (2) |
|||||||||
|
(In millions)
|
|||||||||||
|
Year Ended December 31, 2016
|
|||||||||||
|
Interest rate derivatives
|
$
|
(3,862
|
)
|
$
|
—
|
|
$
|
42
|
|
||
|
Foreign currency exchange rate derivatives
|
958
|
|
—
|
|
(18
|
)
|
|||||
|
Credit derivatives — purchased
|
(40
|
)
|
—
|
|
—
|
|
|||||
|
Credit derivatives — written
|
81
|
|
—
|
|
—
|
|
|||||
|
Equity derivatives
|
(2,405
|
)
|
(22
|
)
|
(458
|
)
|
|||||
|
Total
|
$
|
(5,268
|
)
|
$
|
(22
|
)
|
$
|
(434
|
)
|
||
|
Year Ended December 31, 2015
|
|||||||||||
|
Interest rate derivatives
|
$
|
(421
|
)
|
$
|
—
|
|
$
|
5
|
|
||
|
Foreign currency exchange rate derivatives
|
547
|
|
—
|
|
—
|
|
|||||
|
Credit derivatives — purchased
|
7
|
|
(3
|
)
|
—
|
|
|||||
|
Credit derivatives — written
|
(83
|
)
|
—
|
|
—
|
|
|||||
|
Equity derivatives
|
(816
|
)
|
(14
|
)
|
(25
|
)
|
|||||
|
Total
|
$
|
(766
|
)
|
$
|
(17
|
)
|
$
|
(20
|
)
|
||
|
Year Ended December 31, 2014
|
|||||||||||
|
Interest rate derivatives
|
$
|
1,545
|
|
$
|
—
|
|
$
|
42
|
|
||
|
Foreign currency exchange rate derivatives
|
(344
|
)
|
—
|
|
—
|
|
|||||
|
Credit derivatives — purchased
|
(12
|
)
|
—
|
|
—
|
|
|||||
|
Credit derivatives — written
|
21
|
|
—
|
|
—
|
|
|||||
|
Equity derivatives
|
(634
|
)
|
(18
|
)
|
(288
|
)
|
|||||
|
Total
|
$
|
576
|
|
$
|
(18
|
)
|
$
|
(246
|
)
|
||
__________________
|
(1)
|
Changes in estimated fair value related to economic hedges of equity method investments in joint ventures, derivatives held in relation to trading portfolios and derivatives held within contractholder-directed unit-linked investments.
|
|
(2)
|
Changes in estimated fair value related to economic hedges of variable annuity guarantees included in future policy benefits.
|
Fair Value Hedges
The Company designates and accounts for the following as fair value hedges when they have met the requirements of fair value hedging: (i) interest rate swaps to convert fixed rate assets and liabilities to floating rate assets and liabilities; (ii) foreign currency swaps to hedge the foreign currency fair value exposure of foreign currency denominated assets and liabilities; and (iii) foreign currency forwards to hedge the foreign currency fair value exposure of foreign currency denominated investments.
284
MetLife, Inc.
Notes to the Consolidated Financial Statements — (continued)
9. Derivatives (continued)
The Company recognizes gains and losses on derivatives and the related hedged items in fair value hedges within net derivative gains (losses). The following table presents the amount of such net derivative gains (losses):
|
Derivatives in Fair Value
Hedging Relationships
|
Hedged Items in Fair Value
Hedging Relationships
|
Net Derivative
Gains (Losses)
Recognized
for Derivatives
|
Net Derivative
Gains (Losses)
Recognized for
Hedged Items
|
Ineffectiveness
Recognized in
Net Derivative
Gains (Losses)
|
||||||||||
|
(In millions)
|
||||||||||||||
|
Year Ended December 31, 2016
|
||||||||||||||
|
Interest rate swaps:
|
Fixed maturity securities
|
$
|
8
|
|
$
|
(10
|
)
|
$
|
(2
|
)
|
||||
|
Policyholder liabilities (1)
|
(108
|
)
|
90
|
|
(18
|
)
|
||||||||
|
Foreign currency swaps:
|
Foreign-denominated fixed maturity securities
|
13
|
|
(12
|
)
|
1
|
|
|||||||
|
Foreign-denominated policyholder account balances (2)
|
(95
|
)
|
92
|
|
(3
|
)
|
||||||||
|
Foreign currency forwards:
|
Foreign-denominated fixed maturity securities
|
127
|
|
(119
|
)
|
8
|
|
|||||||
|
Total
|
$
|
(55
|
)
|
$
|
41
|
|
$
|
(14
|
)
|
|||||
|
Year Ended December 31, 2015
|
||||||||||||||
|
Interest rate swaps:
|
Fixed maturity securities
|
$
|
5
|
|
$
|
—
|
|
$
|
5
|
|
||||
|
Policyholder liabilities (1)
|
(2
|
)
|
(8
|
)
|
(10
|
)
|
||||||||
|
Foreign currency swaps:
|
Foreign-denominated fixed maturity securities
|
15
|
|
(7
|
)
|
8
|
|
|||||||
|
Foreign-denominated policyholder account balances (2)
|
(240
|
)
|
232
|
|
(8
|
)
|
||||||||
|
Foreign currency forwards:
|
Foreign-denominated fixed maturity securities
|
(75
|
)
|
68
|
|
(7
|
)
|
|||||||
|
Total
|
$
|
(297
|
)
|
$
|
285
|
|
$
|
(12
|
)
|
|||||
|
Year Ended December 31, 2014
|
||||||||||||||
|
Interest rate swaps:
|
Fixed maturity securities
|
$
|
5
|
|
$
|
(1
|
)
|
$
|
4
|
|
||||
|
Policyholder liabilities (1)
|
681
|
|
(667
|
)
|
14
|
|
||||||||
|
Foreign currency swaps:
|
Foreign-denominated fixed maturity securities
|
13
|
|
(11
|
)
|
2
|
|
|||||||
|
Foreign-denominated policyholder account balances (2)
|
(283
|
)
|
270
|
|
(13
|
)
|
||||||||
|
Foreign currency forwards:
|
Foreign-denominated fixed maturity securities
|
(359
|
)
|
330
|
|
(29
|
)
|
|||||||
|
Total
|
$
|
57
|
|
$
|
(79
|
)
|
$
|
(22
|
)
|
|||||
__________________
|
(1)
|
Fixed rate liabilities reported in policyholder account balances or future policy benefits.
|
|
(2)
|
Fixed rate or floating rate liabilities.
|
For the Company’s foreign currency forwards, the change in the estimated fair value of the derivative related to the changes in the difference between the spot price and the forward price is excluded from the assessment of hedge effectiveness. For all other derivatives, all components of each derivative’s gain or loss were included in the assessment of hedge effectiveness. For the years ended December 31,
2016
,
2015
and
2014
, the component of the change in estimated fair value of derivatives that was excluded from the assessment of hedge effectiveness was
($23) million
,
($11) million
and
$3 million
, respectively.
Cash Flow Hedges
The Company designates and accounts for the following as cash flow hedges when they have met the requirements of cash flow hedging: (i) interest rate swaps to convert floating rate assets and liabilities to fixed rate assets and liabilities; (ii) foreign currency swaps to hedge the foreign currency cash flow exposure of foreign currency denominated assets and liabilities; (iii) interest rate forwards and credit forwards to lock in the price to be paid for forward purchases of investments; (iv) interest rate swaps and interest rate forwards to hedge the forecasted purchases of fixed-rate investments; and (v) interest rate swaps and interest rate forwards to hedge forecasted fixed-rate borrowings.
285
MetLife, Inc.
Notes to the Consolidated Financial Statements — (continued)
9. Derivatives (continued)
In certain instances, the Company discontinued cash flow hedge accounting because the forecasted transactions were no longer probable of occurring. Because certain of the forecasted transactions also were not probable of occurring within two months of the anticipated date, the Company reclassified amounts from AOCI into net derivative gains (losses). These amounts were
$13 million
,
$11 million
and
($15) million
for the years ended December 31,
2016
,
2015
and
2014
, respectively.
At both December 31,
2016
and
2015
, the maximum length of time over which the Company was hedging its exposure to variability in future cash flows for forecasted transactions did not exceed
five
years.
At December 31,
2016
and
2015
, the balance in AOCI associated with cash flow hedges was
$2.9 billion
and
$2.4 billion
, respectively.
The following table presents the effects of derivatives in cash flow hedging relationships on the consolidated statements of operations and the consolidated statements of equity:
|
Derivatives in Cash Flow
Hedging Relationships
|
Amount of Gains
(Losses)Deferred in
AOCI on Derivatives
|
Amount and Location
of Gains (Losses)
Reclassified from
AOCI into Income (Loss)
|
Amount and Location
of Gains (Losses) Recognized in Income (Loss) on Derivatives |
|||||||||||||||||
|
(Effective Portion)
|
(Effective Portion)
|
(Ineffective Portion)
|
||||||||||||||||||
|
Net Derivative
Gains (Losses)
|
Net Investment
Income
|
Other
Expenses
|
Net Derivative
Gains (Losses) |
|||||||||||||||||
|
(In millions)
|
||||||||||||||||||||
|
Year Ended December 31, 2016
|
||||||||||||||||||||
|
Interest rate swaps
|
$
|
74
|
|
$
|
89
|
|
$
|
15
|
|
$
|
—
|
|
$
|
(1
|
)
|
|||||
|
Interest rate forwards
|
(362
|
)
|
1
|
|
6
|
|
1
|
|
—
|
|
||||||||||
|
Foreign currency swaps
|
632
|
|
(345
|
)
|
(2
|
)
|
2
|
|
1
|
|
||||||||||
|
Credit forwards
|
—
|
|
3
|
|
1
|
|
—
|
|
—
|
|
||||||||||
|
Total
|
$
|
344
|
|
$
|
(252
|
)
|
$
|
20
|
|
$
|
3
|
|
$
|
—
|
|
|||||
|
Year Ended December 31, 2015
|
||||||||||||||||||||
|
Interest rate swaps
|
$
|
91
|
|
$
|
85
|
|
$
|
12
|
|
$
|
—
|
|
$
|
3
|
|
|||||
|
Interest rate forwards
|
(1
|
)
|
6
|
|
5
|
|
2
|
|
—
|
|
||||||||||
|
Foreign currency swaps
|
(109
|
)
|
(720
|
)
|
(1
|
)
|
1
|
|
9
|
|
||||||||||
|
Credit forwards
|
—
|
|
1
|
|
1
|
|
—
|
|
—
|
|
||||||||||
|
Total
|
$
|
(19
|
)
|
$
|
(628
|
)
|
$
|
17
|
|
$
|
3
|
|
$
|
12
|
|
|||||
|
Year Ended December 31, 2014
|
||||||||||||||||||||
|
Interest rate swaps
|
$
|
722
|
|
$
|
42
|
|
$
|
9
|
|
$
|
—
|
|
$
|
3
|
|
|||||
|
Interest rate forwards
|
86
|
|
(7
|
)
|
4
|
|
2
|
|
—
|
|
||||||||||
|
Foreign currency swaps
|
(139
|
)
|
(768
|
)
|
(2
|
)
|
2
|
|
1
|
|
||||||||||
|
Credit forwards
|
—
|
|
—
|
|
1
|
|
—
|
|
—
|
|
||||||||||
|
Total
|
$
|
669
|
|
$
|
(733
|
)
|
$
|
12
|
|
$
|
4
|
|
$
|
4
|
|
|||||
All components of each derivative’s gain or loss were included in the assessment of hedge effectiveness.
At December 31,
2016
, the Company expected to reclassify
($176) million
of deferred net gains (losses) on derivatives in AOCI to earnings within the next 12 months.
Hedges of Net Investments in Foreign Operations
The Company uses foreign currency exchange rate derivatives, which may include foreign currency forwards and currency options, to hedge portions of its net investments in foreign operations against adverse movements in exchange rates. The Company measures ineffectiveness on these derivatives based upon the change in forward rates.
When net investments in foreign operations are sold or substantially liquidated, the amounts in AOCI are reclassified to the statement of operations.
286
MetLife, Inc.
Notes to the Consolidated Financial Statements — (continued)
9. Derivatives (continued)
The following table presents the effects of derivatives in net investment hedging relationships on the consolidated statements of operations and the consolidated statements of equity:
|
Derivatives in Net Investment Hedging Relationships (1), (2)
|
Amount of Gains (Losses) Deferred in AOCI
(Effective Portion) |
|||||||||||
|
Years Ended December 31,
|
||||||||||||
|
2016
|
2015
|
2014
|
||||||||||
|
(In millions)
|
||||||||||||
|
Foreign currency forwards
|
$
|
(267
|
)
|
$
|
255
|
|
$
|
407
|
|
|||
|
Currency options
|
(35
|
)
|
(138
|
)
|
222
|
|
||||||
|
Total
|
$
|
(302
|
)
|
$
|
117
|
|
$
|
629
|
|
|||
__________________
|
(1)
|
During the
years ended December 31, 2016
and
2015
, there were
no
sales or substantial liquidations of net investments in foreign operations that would have required the reclassification of gains or losses from AOCI into earnings. In May 2014, the Company sold its interest in MAL, which was a hedged item in a net investment hedging relationship. See
Note 3
. As a result, during the year ended December 31, 2014, the Company released losses of
$77 million
from AOCI into earnings upon the sale.
|
|
(2)
|
There was
no
ineffectiveness recognized for the Company’s hedges of net investments in foreign operations. All components of each derivative’s gain or loss were included in the assessment of hedge effectiveness.
|
At December 31,
2016
and
2015
, the cumulative foreign currency translation gain (loss) recorded in AOCI related to hedges of net investments in foreign operations was
$754 million
and
$1.1 billion
, respectively.
Credit Derivatives
In connection with synthetically created credit investment transactions and credit default swaps held in relation to the trading portfolio, the Company writes credit default swaps for which it receives a premium to insure credit risk. Such credit derivatives are included within the nonqualifying derivatives and derivatives for purposes other than hedging table. If a credit event occurs, as defined by the contract, the contract may be cash settled or it may be settled gross by the Company paying the counterparty the specified swap notional amount in exchange for the delivery of par quantities of the referenced credit obligation. The Company’s maximum amount at risk, assuming the value of all referenced credit obligations is zero, was
$12.6 billion
and
$10.3 billion
at December 31,
2016
and
2015
, respectively. The Company can terminate these contracts at any time through cash settlement with the counterparty at an amount equal to the then current estimated fair value of the credit default swaps. At December 31,
2016
and
2015
, the Company would have received
$180 million
and
$65 million
, respectively, to terminate all of these contracts.
287
MetLife, Inc.
Notes to the Consolidated Financial Statements — (continued)
9. Derivatives (continued)
The following table presents the estimated fair value, maximum amount of future payments and weighted average years to maturity of written credit default swaps at:
|
December 31,
|
||||||||||||||||||||||
|
2016
|
2015
|
|||||||||||||||||||||
|
Rating Agency Designation of Referenced
Credit Obligations (1)
|
Estimated
Fair Value
of Credit
Default
Swaps
|
Maximum
Amount of Future Payments under Credit Default Swaps |
Weighted
Average Years to Maturity (2) |
Estimated
Fair Value
of Credit
Default
Swaps
|
Maximum
Amount of Future Payments under Credit Default Swaps |
Weighted
Average Years to Maturity (2) |
||||||||||||||||
|
(Dollars in millions)
|
||||||||||||||||||||||
|
Aaa/Aa/A
|
||||||||||||||||||||||
|
Single name credit default swaps (3)
|
$
|
6
|
|
$
|
494
|
|
3.0
|
|
$
|
6
|
|
$
|
661
|
|
2.5
|
|
||||||
|
Credit default swaps referencing indices
|
42
|
|
2,768
|
|
3.6
|
|
6
|
|
1,635
|
|
3.4
|
|
||||||||||
|
Subtotal
|
48
|
|
3,262
|
|
3.6
|
|
12
|
|
2,296
|
|
3.2
|
|
||||||||||
|
Baa
|
||||||||||||||||||||||
|
Single name credit default swaps (3)
|
7
|
|
931
|
|
2.3
|
|
8
|
|
1,349
|
|
2.5
|
|
||||||||||
|
Credit default swaps referencing indices
|
106
|
|
7,946
|
|
5.0
|
|
37
|
|
5,863
|
|
4.8
|
|
||||||||||
|
Subtotal
|
113
|
|
8,877
|
|
4.7
|
|
45
|
|
7,212
|
|
4.4
|
|
||||||||||
|
Ba
|
||||||||||||||||||||||
|
Single name credit default swaps (3)
|
(2
|
)
|
155
|
|
4.0
|
|
(2
|
)
|
64
|
|
2.3
|
|
||||||||||
|
Credit default swaps referencing indices
|
—
|
|
—
|
|
—
|
|
(1
|
)
|
100
|
|
1.0
|
|
||||||||||
|
Subtotal
|
(2
|
)
|
155
|
|
4.0
|
|
(3
|
)
|
164
|
|
1.5
|
|
||||||||||
|
B
|
||||||||||||||||||||||
|
Single name credit default swaps (3)
|
1
|
|
70
|
|
1.8
|
|
—
|
|
—
|
|
—
|
|
||||||||||
|
Credit default swaps referencing indices
|
20
|
|
281
|
|
5.0
|
|
11
|
|
639
|
|
4.9
|
|
||||||||||
|
Subtotal
|
21
|
|
351
|
|
4.3
|
|
11
|
|
639
|
|
4.9
|
|
||||||||||
|
Total
|
$
|
180
|
|
$
|
12,645
|
|
4.4
|
|
$
|
65
|
|
$
|
10,311
|
|
4.1
|
|
||||||
__________________
|
(1)
|
The rating agency designations are based on availability and the midpoint of the applicable ratings among Moody’s Investors Service (“Moody’s”), S&P and Fitch Ratings. If no rating is available from a rating agency, then an internally developed rating is used.
|
|
(2)
|
The weighted average years to maturity of the credit default swaps is calculated based on weighted average gross notional amounts.
|
|
(3)
|
Single name credit default swaps may be referenced to the credit of corporations, foreign governments, or state and political subdivisions.
|
The Company has also entered into credit default swaps to purchase credit protection on certain of the referenced credit obligations in the table above. As a result, the maximum amounts of potential future recoveries available to offset the
$12.6 billion
and
$10.3 billion
from the table above were
$30 million
and
$80 million
at December 31,
2016
and
2015
, respectively.
At
December 31, 2016
, the Company no longer maintained a trading portfolio for derivatives. At
December 31, 2015
, written credit default swaps held in relation to the trading portfolio amounted to
$20 million
in gross notional amount and
($2) million
in estimated fair value.
Credit Risk on Freestanding Derivatives
The Company may be exposed to credit-related losses in the event of nonperformance by its counterparties to derivatives. Generally, the current credit exposure of the Company’s derivatives is limited to the net positive estimated fair value of derivatives at the reporting date after taking into consideration the existence of master netting or similar agreements and any collateral received pursuant to such agreements.
288
MetLife, Inc.
Notes to the Consolidated Financial Statements — (continued)
9. Derivatives (continued)
The Company manages its credit risk related to derivatives by entering into transactions with creditworthy counterparties and establishing and monitoring exposure limits. The Company’s OTC-bilateral derivative transactions are generally governed by ISDA Master Agreements which provide for legally enforceable set-off and close-out netting of exposures to specific counterparties in the event of early termination of a transaction, which includes, but is not limited to, events of default and bankruptcy. In the event of an early termination, the Company is permitted to set off receivables from the counterparty against payables to the same counterparty arising out of all included transactions. Substantially all of the Company’s ISDA Master Agreements also include Credit Support Annex provisions which require both the pledging and accepting of collateral in connection with its OTC-bilateral derivatives.
The Company’s OTC-cleared derivatives are effected through central clearing counterparties and its exchange-traded derivatives are effected through regulated exchanges. Such positions are marked to market and margined on a daily basis (both initial margin and variation margin), and the Company has minimal exposure to credit-related losses in the event of nonperformance by counterparties to such derivatives.
See Note
10
for a description of the impact of credit risk on the valuation of derivatives.
The estimated fair values of the Company’s net derivative assets and net derivative liabilities after the application of master netting agreements and collateral were as follows at:
|
December 31,
|
||||||||||||||||
|
2016
|
2015
|
|||||||||||||||
|
Derivatives Subject to a Master Netting Arrangement or a Similar Arrangement
|
Assets
|
Liabilities
|
Assets
|
Liabilities
|
||||||||||||
|
(In millions)
|
||||||||||||||||
|
Gross estimated fair value of derivatives:
|
||||||||||||||||
|
OTC-bilateral (1)
|
$
|
13,387
|
|
$
|
8,650
|
|
$
|
13,017
|
|
$
|
5,848
|
|
||||
|
OTC-cleared (1)
|
2,543
|
|
2,047
|
|
1,600
|
|
1,217
|
|
||||||||
|
Exchange-traded
|
80
|
|
15
|
|
67
|
|
25
|
|
||||||||
|
Total gross estimated fair value of derivatives (1)
|
16,010
|
|
10,712
|
|
14,684
|
|
7,090
|
|
||||||||
|
Amounts offset on the consolidated balance sheets
|
—
|
|
—
|
|
—
|
|
—
|
|
||||||||
|
Estimated fair value of derivatives presented on the consolidated balance sheets (1)
|
16,010
|
|
10,712
|
|
14,684
|
|
7,090
|
|
||||||||
|
Gross amounts not offset on the consolidated balance sheets:
|
||||||||||||||||
|
Gross estimated fair value of derivatives: (2)
|
||||||||||||||||
|
OTC-bilateral
|
(6,018
|
)
|
(6,018
|
)
|
(4,368
|
)
|
(4,368
|
)
|
||||||||
|
OTC-cleared
|
(1,068
|
)
|
(1,068
|
)
|
(1,200
|
)
|
(1,200
|
)
|
||||||||
|
Exchange-traded
|
(5
|
)
|
(5
|
)
|
(1
|
)
|
(1
|
)
|
||||||||
|
Cash collateral: (3), (4)
|
||||||||||||||||
|
OTC-bilateral
|
(4,897
|
)
|
(84
|
)
|
(6,140
|
)
|
(7
|
)
|
||||||||
|
OTC-cleared
|
(1,427
|
)
|
(974
|
)
|
(378
|
)
|
(10
|
)
|
||||||||
|
Exchange-traded
|
—
|
|
(9
|
)
|
—
|
|
(20
|
)
|
||||||||
|
Securities collateral: (5)
|
||||||||||||||||
|
OTC-bilateral
|
(2,069
|
)
|
(2,516
|
)
|
(2,078
|
)
|
(1,395
|
)
|
||||||||
|
OTC-cleared
|
—
|
|
—
|
|
—
|
|
—
|
|
||||||||
|
Exchange-traded
|
—
|
|
—
|
|
—
|
|
(3
|
)
|
||||||||
|
Net amount after application of master netting agreements and collateral
|
$
|
526
|
|
$
|
38
|
|
$
|
519
|
|
$
|
86
|
|
||||
__________________
|
(1)
|
At
December 31, 2016
and
2015
, derivative assets included income or (expense) accruals reported in accrued investment income or in other liabilities of
$249 million
and
$278 million
, respectively, and derivative liabilities included (income) or expense accruals reported in accrued investment income or in other liabilities of
($92) million
and
$41 million
, respectively.
|
289
MetLife, Inc.
Notes to the Consolidated Financial Statements — (continued)
9. Derivatives (continued)
|
(2)
|
Estimated fair value of derivatives is limited to the amount that is subject to set-off and includes income or expense accruals.
|
|
(3)
|
Cash collateral received by the Company for OTC-bilateral and OTC-cleared derivatives is included in cash and cash equivalents, short-term investments or in fixed maturity securities, and the obligation to return it is included in payables for collateral under securities loaned and other transactions on the balance sheet.
|
|
(4)
|
The receivable for the return of cash collateral provided by the Company is inclusive of initial margin on exchange-traded and OTC-cleared derivatives and is included in premiums, reinsurance and other receivables on the balance sheet. The amount of cash collateral offset in the table above is limited to the net estimated fair value of derivatives after application of netting agreements. At
December 31, 2016
and
2015
, the Company received excess cash collateral of
$168 million
and
$89 million
, respectively, and provided excess cash collateral of
$486 million
and
$204 million
, respectively, which is not included in the table above due to the foregoing limitation.
|
|
(5)
|
Securities collateral received by the Company is held in separate custodial accounts and is not recorded on the balance sheet. Subject to certain constraints, the Company is permitted by contract to sell or re-pledge this collateral, but at
December 31, 2016
,
none
of the collateral had been sold or re-pledged. Securities collateral pledged by the Company is reported in fixed maturity securities on the balance sheet. Subject to certain constraints, the counterparties are permitted by contract to sell or re-pledge this collateral. The amount of securities collateral offset in the table above is limited to the net estimated fair value of derivatives after application of netting agreements and cash collateral. At
December 31, 2016
and
2015
, the Company received excess securities collateral with an estimated fair value of
$217 million
and
$100 million
, respectively, for its OTC-bilateral derivatives, which are not included in the table above due to the foregoing limitation. At
December 31, 2016
and
2015
, the Company provided excess securities collateral with an estimated fair value of
$297 million
and
$150 million
, respectively, for its OTC-bilateral derivatives,
$1.2 billion
and
$315 million
, respectively, for its OTC-cleared derivatives, and
$569 million
and
$224 million
, respectively, for its exchange-traded derivatives, which are not included in the table above due to the foregoing limitation.
|
The Company’s collateral arrangements for its OTC-bilateral derivatives generally require the counterparty in a net liability position, after considering the effect of netting agreements, to pledge collateral when the collateral amount owed by that counterparty reaches a minimum transfer amount. A small number of these arrangements also include credit-contingent provisions that include a threshold above which collateral must be posted. Such agreements provide for a reduction of these thresholds (on a sliding scale that converges toward zero) in the event of downgrades in the credit ratings of MetLife, Inc. and/or the counterparty. In addition, substantially all of the Company’s netting agreements for derivatives contain provisions that require both the Company and the counterparty to maintain a specific investment grade credit rating from each of Moody’s and S&P. If a party’s credit or financial strength rating, as applicable, were to fall below that specific investment grade credit rating, that party would be in violation of these provisions, and the other party to the derivatives could terminate the transactions and demand immediate settlement and payment based on such party’s reasonable valuation of the derivatives.
290
MetLife, Inc.
Notes to the Consolidated Financial Statements — (continued)
9. Derivatives (continued)
The following table presents the estimated fair value of the Company’s OTC-bilateral derivatives that are in a net liability position after considering the effect of netting agreements, together with the estimated fair value and balance sheet location of the collateral pledged. The table also presents the incremental collateral that MetLife, Inc. would be required to provide if there was a one-notch downgrade in MetLife, Inc.’s senior unsecured debt rating at the reporting date or if the Company’s credit or financial strength rating, as applicable, sustained a downgrade to a level that triggered full overnight collateralization or termination of the derivative position at the reporting date. OTC-bilateral derivatives that are not subject to collateral agreements are excluded from this table.
|
December 31,
|
||||||||||||||||||||||||
|
2016
|
2015
|
|||||||||||||||||||||||
|
Derivatives Subject to Credit-Contingent Provisions
|
Derivatives Not Subject to Credit-Contingent Provisions
|
Total
|
Derivatives Subject to Credit-Contingent Provisions
|
Derivatives Not Subject to Credit-Contingent Provisions
|
Total
|
|||||||||||||||||||
|
(In millions)
|
||||||||||||||||||||||||
|
Estimated Fair Value of Derivatives in a Net Liability Position (1)
|
$
|
2,607
|
|
$
|
25
|
|
$
|
2,632
|
|
$
|
1,270
|
|
$
|
207
|
|
$
|
1,477
|
|
||||||
|
Estimated Fair Value of Collateral Provided:
|
||||||||||||||||||||||||
|
Fixed maturity securities
|
$
|
2,742
|
|
$
|
31
|
|
$
|
2,773
|
|
$
|
1,365
|
|
$
|
174
|
|
$
|
1,539
|
|
||||||
|
Cash
|
$
|
91
|
|
$
|
—
|
|
$
|
91
|
|
$
|
4
|
|
$
|
4
|
|
$
|
8
|
|
||||||
|
Estimated Fair Value of Incremental Collateral Provided Upon:
|
||||||||||||||||||||||||
|
One-notch downgrade in the Company’s credit or financial strength rating, as applicable
|
$
|
6
|
|
$
|
—
|
|
$
|
6
|
|
$
|
1
|
|
$
|
—
|
|
$
|
1
|
|
||||||
|
Downgrade in the Company’s credit or financial strength rating, as applicable, to a level that triggers full overnight collateralization or termination of the derivative position
|
$
|
9
|
|
$
|
—
|
|
$
|
9
|
|
$
|
1
|
|
$
|
—
|
|
$
|
1
|
|
||||||
__________________
|
(1)
|
After taking into consideration the existence of netting agreements.
|
Embedded Derivatives
The Company issues certain products or purchases certain investments that contain embedded derivatives that are required to be separated from their host contracts and accounted for as freestanding derivatives. These host contracts principally include: variable annuities with guaranteed minimum benefits, including GMWBs, GMABs and certain GMIBs; ceded reinsurance of guaranteed minimum benefits related to certain GMIBs; assumed reinsurance of guaranteed minimum benefits related to GMWBs and GMABs; funding agreements with equity or bond indexed crediting rates; funds withheld on assumed and ceded reinsurance; fixed annuities with equity-indexed returns; and certain debt and equity securities.
291
MetLife, Inc.
Notes to the Consolidated Financial Statements — (continued)
9. Derivatives (continued)
The following table presents the estimated fair value and balance sheet location of the Company’s embedded derivatives that have been separated from their host contracts at:
|
December 31,
|
||||||||||
|
Balance Sheet Location
|
2016
|
2015
|
||||||||
|
(In millions)
|
||||||||||
|
Embedded derivatives within asset host contracts:
|
||||||||||
|
Ceded guaranteed minimum benefits
|
Premiums, reinsurance and other receivables
|
$
|
380
|
|
$
|
356
|
|
|||
|
Funds withheld on assumed reinsurance
|
Other invested assets
|
—
|
|
35
|
|
|||||
|
Options embedded in debt or equity securities
|
Investments
|
(137
|
)
|
(220
|
)
|
|||||
|
Embedded derivatives within asset host contracts
|
$
|
243
|
|
$
|
171
|
|
||||
|
Embedded derivatives within liability host contracts:
|
||||||||||
|
Direct guaranteed minimum benefits
|
Policyholder account balances and Future policy benefits
|
$
|
2,720
|
|
$
|
(20
|
)
|
|||
|
Assumed guaranteed minimum benefits
|
Policyholder account balances
|
1,205
|
|
965
|
|
|||||
|
Funds withheld on ceded reinsurance
|
Other liabilities
|
(30
|
)
|
(14
|
)
|
|||||
|
Fixed annuities with equity indexed returns
|
Policyholder account balances
|
210
|
|
4
|
|
|||||
|
Embedded derivatives within liability host contracts
|
$
|
4,105
|
|
$
|
935
|
|
||||
The following table presents changes in estimated fair value related to embedded derivatives:
|
Years Ended December 31,
|
||||||||||||
|
2016
|
2015
|
2014
|
||||||||||
|
(In millions)
|
||||||||||||
|
Net derivative gains (losses) (1)
|
$
|
(2,224
|
)
|
$
|
(239
|
)
|
$
|
(321
|
)
|
|||
|
Policyholder benefits and claims
|
$
|
(4
|
)
|
$
|
21
|
|
$
|
87
|
|
|||
__________________
|
(1)
|
The valuation of guaranteed minimum benefits includes a nonperformance risk adjustment. The amounts included in net derivative gains (losses) in connection with this adjustment were
$520 million
,
$163 million
and
$13 million
for the years ended December 31,
2016
,
2015
and
2014
, respectively.
|
292
10. Fair Value
When developing estimated fair values, the Company considers three broad valuation techniques: (i) the market approach, (ii) the income approach, and (iii) the cost approach. The Company determines the most appropriate valuation technique to use, given what is being measured and the availability of sufficient inputs, giving priority to observable inputs. The Company categorizes its assets and liabilities measured at estimated fair value into a three-level hierarchy, based on the significant input with the lowest level in its valuation. The input levels are as follows:
|
Level 1
|
Unadjusted quoted prices in active markets for identical assets or liabilities. The Company defines active markets based on average trading volume for equity securities. The size of the bid/ask spread is used as an indicator of market activity for fixed maturity securities.
|
|
Level 2
|
Quoted prices in markets that are not active or inputs that are observable either directly or indirectly. These inputs can include quoted prices for similar assets or liabilities other than quoted prices in Level 1, quoted prices in markets that are not active, or other significant inputs that are observable or can be derived principally from or corroborated by observable market data for substantially the full term of the assets or liabilities.
|
|
Level 3
|
Unobservable inputs that are supported by little or no market activity and are significant to the determination of estimated fair value of the assets or liabilities. Unobservable inputs reflect the reporting entity’s own assumptions about the assumptions that market participants would use in pricing the asset or liability.
|
Financial markets are susceptible to severe events evidenced by rapid depreciation in asset values accompanied by a reduction in asset liquidity. The Company’s ability to sell securities, or the price ultimately realized for these securities, depends upon the demand and liquidity in the market and increases the use of judgment in determining the estimated fair value of certain securities.
Considerable judgment is often required in interpreting market data to develop estimates of fair value, and the use of different assumptions or valuation methodologies may have a material effect on the estimated fair value amounts.
Recurring Fair Value Measurements
The assets and liabilities measured at estimated fair value on a recurring basis and their corresponding placement in the fair value hierarchy, including those items for which the Company has elected the FVO, are presented below at:
293
MetLife, Inc.
Notes to the Consolidated Financial Statements — (continued)
10. Fair Value (continued)
|
December 31, 2016
|
||||||||||||||||
|
Fair Value Hierarchy
|
||||||||||||||||
|
Level 1
|
Level 2
|
Level 3
|
Total
Estimated Fair Value |
|||||||||||||
|
(In millions)
|
||||||||||||||||
|
Assets
|
||||||||||||||||
|
Fixed maturity securities:
|
||||||||||||||||
|
U.S. corporate
|
$
|
—
|
|
$
|
93,639
|
|
$
|
7,214
|
|
$
|
100,853
|
|
||||
|
U.S. government and agency
|
31,153
|
|
26,370
|
|
—
|
|
57,523
|
|
||||||||
|
Foreign government
|
—
|
|
56,848
|
|
290
|
|
57,138
|
|
||||||||
|
Foreign corporate
|
—
|
|
50,344
|
|
6,713
|
|
57,057
|
|
||||||||
|
RMBS
|
—
|
|
31,896
|
|
5,097
|
|
36,993
|
|
||||||||
|
State and political subdivision
|
—
|
|
16,149
|
|
27
|
|
16,176
|
|
||||||||
|
ABS
|
—
|
|
12,624
|
|
1,253
|
|
13,877
|
|
||||||||
|
CMBS
|
—
|
|
10,757
|
|
515
|
|
11,272
|
|
||||||||
|
Total fixed maturity securities
|
31,153
|
|
298,627
|
|
21,109
|
|
350,889
|
|
||||||||
|
Equity securities
|
1,373
|
|
1,217
|
|
604
|
|
3,194
|
|
||||||||
|
FVO and trading securities (1)
|
11,123
|
|
2,513
|
|
287
|
|
13,923
|
|
||||||||
|
Short-term investments (2)
|
4,808
|
|
2,436
|
|
47
|
|
7,291
|
|
||||||||
|
Mortgage loans:
|
||||||||||||||||
|
Residential mortgage loans — FVO
|
—
|
|
—
|
|
566
|
|
566
|
|
||||||||
|
Commercial mortgage loans held by CSEs — FVO
|
—
|
|
136
|
|
—
|
|
136
|
|
||||||||
|
Total mortgage loans
|
—
|
|
136
|
|
566
|
|
702
|
|
||||||||
|
Other investments
|
86
|
|
71
|
|
—
|
|
157
|
|
||||||||
|
Derivative assets: (3)
|
||||||||||||||||
|
Interest rate
|
12
|
|
9,699
|
|
2
|
|
9,713
|
|
||||||||
|
Foreign currency exchange rate
|
—
|
|
4,149
|
|
80
|
|
4,229
|
|
||||||||
|
Credit
|
—
|
|
165
|
|
38
|
|
203
|
|
||||||||
|
Equity market
|
68
|
|
1,249
|
|
299
|
|
1,616
|
|
||||||||
|
Total derivative assets
|
80
|
|
15,262
|
|
419
|
|
15,761
|
|
||||||||
|
Embedded derivatives within asset host contracts (4)
|
—
|
|
—
|
|
380
|
|
380
|
|
||||||||
|
Separate account assets (5)
|
83,538
|
|
223,923
|
|
1,159
|
|
308,620
|
|
||||||||
|
Total assets
|
$
|
132,161
|
|
$
|
544,185
|
|
$
|
24,571
|
|
$
|
700,917
|
|
||||
|
Liabilities
|
||||||||||||||||
|
Derivative liabilities: (3)
|
||||||||||||||||
|
Interest rate
|
$
|
12
|
|
$
|
3,402
|
|
$
|
1,111
|
|
$
|
4,525
|
|
||||
|
Foreign currency exchange rate
|
—
|
|
3,799
|
|
54
|
|
3,853
|
|
||||||||
|
Credit
|
—
|
|
49
|
|
—
|
|
49
|
|
||||||||
|
Equity market
|
3
|
|
1,604
|
|
770
|
|
2,377
|
|
||||||||
|
Total derivative liabilities
|
15
|
|
8,854
|
|
1,935
|
|
10,804
|
|
||||||||
|
Embedded derivatives within liability host contracts (4)
|
—
|
|
—
|
|
4,105
|
|
4,105
|
|
||||||||
|
Trading liabilities (6)
|
—
|
|
—
|
|
—
|
|
—
|
|
||||||||
|
Separate account liabilities (5)
|
—
|
|
16
|
|
7
|
|
23
|
|
||||||||
|
Total liabilities
|
$
|
15
|
|
$
|
8,870
|
|
$
|
6,047
|
|
$
|
14,932
|
|
||||
294
MetLife, Inc.
Notes to the Consolidated Financial Statements — (continued)
10. Fair Value (continued)
|
December 31, 2015
|
||||||||||||||||
|
Fair Value Hierarchy
|
||||||||||||||||
|
Level 1
|
Level 2
|
Level 3
|
Total
Estimated
Fair Value
|
|||||||||||||
|
(In millions)
|
||||||||||||||||
|
Assets
|
||||||||||||||||
|
Fixed maturity securities:
|
||||||||||||||||
|
U.S. corporate
|
$
|
—
|
|
$
|
93,758
|
|
$
|
7,036
|
|
$
|
100,794
|
|
||||
|
U.S. government and agency
|
37,660
|
|
23,986
|
|
—
|
|
61,646
|
|
||||||||
|
Foreign government
|
—
|
|
49,643
|
|
856
|
|
50,499
|
|
||||||||
|
Foreign corporate
|
—
|
|
51,438
|
|
5,760
|
|
57,198
|
|
||||||||
|
RMBS
|
—
|
|
34,088
|
|
4,709
|
|
38,797
|
|
||||||||
|
State and political subdivision
|
—
|
|
15,395
|
|
46
|
|
15,441
|
|
||||||||
|
ABS
|
—
|
|
12,731
|
|
1,663
|
|
14,394
|
|
||||||||
|
CMBS
|
—
|
|
11,889
|
|
744
|
|
12,633
|
|
||||||||
|
Total fixed maturity securities
|
37,660
|
|
292,928
|
|
20,814
|
|
351,402
|
|
||||||||
|
Equity securities
|
1,274
|
|
1,615
|
|
432
|
|
3,321
|
|
||||||||
|
FVO and trading securities (1)
|
11,335
|
|
3,419
|
|
270
|
|
15,024
|
|
||||||||
|
Short-term investments (2)
|
2,543
|
|
5,985
|
|
291
|
|
8,819
|
|
||||||||
|
Mortgage loans:
|
||||||||||||||||
|
Residential mortgage loans — FVO
|
—
|
|
—
|
|
314
|
|
314
|
|
||||||||
|
Commercial mortgage loans held by CSEs — FVO
|
—
|
|
172
|
|
—
|
|
172
|
|
||||||||
|
Total mortgage loans
|
—
|
|
172
|
|
314
|
|
486
|
|
||||||||
|
Other investments
|
109
|
|
53
|
|
—
|
|
162
|
|
||||||||
|
Derivative assets: (3)
|
||||||||||||||||
|
Interest rate
|
4
|
|
9,405
|
|
25
|
|
9,434
|
|
||||||||
|
Foreign currency exchange rate
|
—
|
|
3,003
|
|
16
|
|
3,019
|
|
||||||||
|
Credit
|
—
|
|
99
|
|
7
|
|
106
|
|
||||||||
|
Equity market
|
63
|
|
1,435
|
|
349
|
|
1,847
|
|
||||||||
|
Total derivative assets
|
67
|
|
13,942
|
|
397
|
|
14,406
|
|
||||||||
|
Embedded derivatives within asset host contracts (4)
|
—
|
|
—
|
|
391
|
|
391
|
|
||||||||
|
Separate account assets (5)
|
77,080
|
|
222,814
|
|
1,704
|
|
301,598
|
|
||||||||
|
Total assets
|
$
|
130,068
|
|
$
|
540,928
|
|
$
|
24,613
|
|
$
|
695,609
|
|
||||
|
Liabilities
|
||||||||||||||||
|
Derivative liabilities: (3)
|
||||||||||||||||
|
Interest rate
|
$
|
7
|
|
$
|
2,340
|
|
$
|
—
|
|
$
|
2,347
|
|
||||
|
Foreign currency exchange rate
|
—
|
|
2,754
|
|
148
|
|
2,902
|
|
||||||||
|
Credit
|
—
|
|
45
|
|
2
|
|
47
|
|
||||||||
|
Equity market
|
18
|
|
1,077
|
|
658
|
|
1,753
|
|
||||||||
|
Total derivative liabilities
|
25
|
|
6,216
|
|
808
|
|
7,049
|
|
||||||||
|
Embedded derivatives within liability host contracts (4)
|
—
|
|
—
|
|
935
|
|
935
|
|
||||||||
|
Trading liabilities (6)
|
103
|
|
50
|
|
—
|
|
153
|
|
||||||||
|
Separate account liabilities (5)
|
—
|
|
—
|
|
—
|
|
—
|
|
||||||||
|
Total liabilities
|
$
|
128
|
|
$
|
6,266
|
|
$
|
1,743
|
|
$
|
8,137
|
|
||||
__________________
|
(1)
|
In 2016, the Company reinvested its trading securities portfolio into other asset classes and, at December 31, 2016, the Company no longer held any actively traded securities. FVO and trading securities at both December 31, 2016 and 2015 was comprised of over 90% FVO contractholder-directed unit-linked investments, with the remainder comprised of FVO general account securities and FVO securities held by CSEs at December 31, 2015 including actively traded securities.
|
|
(2)
|
Short-term investments as presented in the tables above differ from the amounts presented on the consolidated balance sheets because certain short-term investments are not measured at estimated fair value on a recurring basis.
|
295
MetLife, Inc.
Notes to the Consolidated Financial Statements — (continued)
10. Fair Value (continued)
|
(3)
|
Derivative assets are presented within other invested assets on the consolidated balance sheets and derivative liabilities are presented within other liabilities on the consolidated balance sheets. The amounts are presented gross in the tables above to reflect the presentation on the consolidated balance sheets, but are presented net for purposes of the rollforward in the Fair Value Measurements Using Significant Unobservable Inputs (Level 3) tables.
|
|
(4)
|
Embedded derivatives within asset host contracts are presented within premiums, reinsurance and other receivables and other invested assets on the consolidated balance sheets. Embedded derivatives within liability host contracts are presented within policyholder account balances, future policy benefits and other liabilities on the consolidated balance sheets. At
December 31, 2016
and
2015
, debt and equity securities also included embedded derivatives of
($137) million
and
($220) million
, respectively.
|
|
(5)
|
Investment performance related to separate account assets is fully offset by corresponding amounts credited to contractholders whose liability is reflected within separate account liabilities. Separate account liabilities are set equal to the estimated fair value of separate account assets. Separate account liabilities presented in the tables above represent derivative liabilities.
|
|
(6)
|
Trading liabilities are presented within other liabilities on the consolidated balance sheets.
|
The following describes the valuation methodologies used to measure assets and liabilities at fair value. The description includes the valuation techniques and key inputs for each category of assets or liabilities that are classified within Level 2 and Level 3 of the fair value hierarchy.
Investments
Valuation Controls and Procedures
On behalf of the Company’s Chief Investment Officer and Chief Financial Officer, a pricing and valuation committee that is independent of the trading and investing functions and comprised of senior management, provides oversight of control systems and valuation policies for securities, mortgage loans and derivatives. On a quarterly basis, this committee reviews and approves new transaction types and markets, ensures that observable market prices and market-based parameters are used for valuation, wherever possible, and determines that judgmental valuation adjustments, when applied, are based upon established policies and are applied consistently over time. This committee also provides oversight of the selection of independent third party pricing providers and the controls and procedures to evaluate third party pricing. Periodically, the Chief Accounting Officer reports to the Audit Committee of MetLife, Inc.’s Board of Directors regarding compliance with fair value accounting standards.
The Company reviews its valuation methodologies on an ongoing basis and revises those methodologies when necessary based on changing market conditions. Assurance is gained on the overall reasonableness and consistent application of input assumptions, valuation methodologies and compliance with fair value accounting standards through controls designed to ensure valuations represent an exit price. Several controls are utilized, including certain monthly controls, which include, but are not limited to, analysis of portfolio returns to corresponding benchmark returns, comparing a sample of executed prices of securities sold to the fair value estimates, comparing fair value estimates to management’s knowledge of the current market, reviewing the bid/ask spreads to assess activity, comparing prices from multiple independent pricing services and ongoing due diligence to confirm that independent pricing services use market-based parameters. The process includes a determination of the observability of inputs used in estimated fair values received from independent pricing services or brokers by assessing whether these inputs can be corroborated by observable market data. The Company ensures that prices received from independent brokers, also referred to herein as “consensus pricing,” represent a reasonable estimate of fair value by considering such pricing relative to the Company’s knowledge of the current market dynamics and current pricing for similar financial instruments. While independent non-binding broker quotations are utilized, they are not used for a significant portion of the portfolio. For example, fixed maturity securities priced using independent non-binding broker quotations represent less than
1%
of the total estimated fair value of fixed maturity securities and
6%
of the total estimated fair value of Level 3 fixed maturity securities at
December 31, 2016
.
296
MetLife, Inc.
Notes to the Consolidated Financial Statements — (continued)
10. Fair Value (continued)
The Company also applies a formal process to challenge any prices received from independent pricing services that are not considered representative of estimated fair value. If prices received from independent pricing services are not considered reflective of market activity or representative of estimated fair value, independent non-binding broker quotations are obtained, or an internally developed valuation is prepared. Internally developed valuations of current estimated fair value, which reflect internal estimates of liquidity and nonperformance risks, compared with pricing received from the independent pricing services, did not produce material differences in the estimated fair values for the majority of the portfolio; accordingly, overrides were not material. This is, in part, because internal estimates of liquidity and nonperformance risks are generally based on available market evidence and estimates used by other market participants. In the absence of such market-based evidence, management’s best estimate is used.
Securities, Short-term Investments, Other Investments and Trading Liabilities
When available, the estimated fair value of these financial instruments is based on quoted prices in active markets that are readily and regularly obtainable. Generally, these are the most liquid of the Company’s securities holdings and valuation of these securities does not involve management’s judgment.
When quoted prices in active markets are not available, the determination of estimated fair value is based on market standard valuation methodologies, giving priority to observable inputs. The significant inputs to the market standard valuation methodologies for certain types of securities with reasonable levels of price transparency are inputs that are observable in the market or can be derived principally from, or corroborated by, observable market data. When observable inputs are not available, the market standard valuation methodologies rely on inputs that are significant to the estimated fair value that are not observable in the market or cannot be derived principally from, or corroborated by, observable market data. These unobservable inputs can be based in large part on management’s judgment or estimation and cannot be supported by reference to market activity. Even though these inputs are unobservable, management believes they are consistent with what other market participants would use when pricing such securities and are considered appropriate given the circumstances.
The estimated fair value of investments in certain separate accounts included in FVO contractholder-directed unit-linked investments, FVO securities held by CSEs, other investments and trading liabilities is determined on a basis consistent with the methodologies described herein for securities.
The valuation of most instruments listed below is determined using independent pricing sources, matrix pricing, discounted cash flow methodologies or other similar techniques that use either observable market inputs or unobservable inputs.
297
MetLife, Inc.
Notes to the Consolidated Financial Statements — (continued)
10. Fair Value (continued)
|
Instrument
|
Level 2
Observable Inputs
|
Level 3
Unobservable Inputs
|
|||
|
Fixed Maturity Securities
|
|||||
|
U.S. corporate and Foreign corporate securities
|
|||||
|
Valuation Techniques: Principally the market and income approaches.
|
Valuation Techniques: Principally the market approach.
|
||||
|
Key Inputs:
|
Key Inputs:
|
||||
|
•
|
quoted prices in markets that are not active
|
•
|
illiquidity premium
|
||
|
•
|
benchmark yields; spreads off benchmark yields; new issuances; issuer rating
|
•
|
delta spread adjustments to reflect specific credit-related issues
|
||
|
•
|
trades of identical or comparable securities; duration
|
•
|
credit spreads
|
||
|
•
|
Privately-placed securities are valued using the additional key inputs:
|
•
|
quoted prices in markets that are not active for identical or similar securities that are less liquid and based on lower levels of trading activity than securities classified in Level 2
|
||
|
•
|
market yield curve; call provisions
|
||||
|
•
|
observable prices and spreads for similar public or private securities that incorporate the credit quality and industry sector of the issuer
|
•
|
independent non-binding broker quotations
|
||
|
•
|
delta spread adjustments to reflect specific credit-related issues
|
||||
|
U.S. government and agency, Foreign government and State and political subdivision securities
|
|||||
|
Valuation Techniques: Principally the market approach.
|
Valuation Techniques: Principally the market approach.
|
||||
|
Key Inputs:
|
Key Inputs:
|
||||
|
•
|
quoted prices in markets that are not active
|
•
|
independent non-binding broker quotations
|
||
|
•
|
benchmark U.S. Treasury yield or other yields
|
•
|
quoted prices in markets that are not active for identical or similar securities that are less liquid and based on lower levels of trading activity than securities classified in Level 2
|
||
|
•
|
the spread off the U.S. Treasury yield curve for the identical security
|
||||
|
•
|
issuer ratings and issuer spreads; broker-dealer quotes
|
•
|
credit spreads
|
||
|
•
|
comparable securities that are actively traded
|
||||
|
Structured Securities
|
|||||
|
Valuation Techniques: Principally the market and income approaches.
|
Valuation Techniques: Principally the market and income approaches.
|
||||
|
Key Inputs:
|
Key Inputs:
|
||||
|
•
|
quoted prices in markets that are not active
|
•
|
credit spreads
|
||
|
•
|
spreads for actively traded securities; spreads off benchmark yields
|
•
|
quoted prices in markets that are not active for identical or similar securities that are less liquid and based on lower levels of trading activity than securities classified in Level 2
|
||
|
•
|
expected prepayment speeds and volumes
|
||||
|
•
|
current and forecasted loss severity; ratings; geographic region
|
•
|
independent non-binding broker quotations
|
||
|
•
|
weighted average coupon and weighted average maturity
|
||||
|
•
|
average delinquency rates; debt-service coverage ratios
|
||||
|
•
|
issuance-specific information, including, but not limited to:
|
||||
|
•
|
collateral type; structure of the security; vintage of the loans
|
||||
|
•
|
payment terms of the underlying assets
|
||||
|
•
|
payment priority within the tranche; deal performance
|
||||
298
MetLife, Inc.
Notes to the Consolidated Financial Statements — (continued)
10. Fair Value (continued)
|
Instrument
|
Level 2
Observable Inputs
|
Level 3
Unobservable Inputs
|
|||
|
Equity Securities
|
|||||
|
Valuation Techniques: Principally the market approach.
|
Valuation Techniques: Principally the market and income approaches.
|
||||
|
Key Input:
|
Key Inputs:
|
||||
|
•
|
quoted prices in markets that are not considered active
|
•
|
credit ratings; issuance structures
|
||
|
•
|
quoted prices in markets that are not active for identical or similar securities that are less liquid and based on lower levels of trading activity than securities classified in Level 2
|
||||
|
•
|
independent non-binding broker quotations
|
||||
|
FVO and trading securities, Short-term investments, and Other investments
|
|||||
|
•
|
Contractholder-directed unit-linked investments include mutual fund interests without readily determinable fair values given prices are not published publicly. Valuation of these mutual funds is based upon quoted prices or reported net NAV provided by the fund managers, which were based on observable inputs.
|
•
|
FVO and trading securities and short-term investments are of a similar nature and class to the fixed maturity and equity securities described above; accordingly, the valuation techniques and unobservable inputs used in their valuation are also similar to those described above.
|
||
|
•
|
All other investments are of a similar nature and class to the fixed maturity and equity securities described above; accordingly, the valuation techniques and observable inputs used in their valuation are also similar to those described above.
|
||||
|
Mortgage Loans — FVO
|
|||||
|
Commercial mortgage loans held by CSEs — FVO
|
|||||
|
Valuation Techniques: Principally the market approach.
|
•
|
N/A
|
|||
|
Key Input:
|
|||||
|
•
|
quoted securitization market price determined principally by independent pricing services using observable inputs
|
||||
|
Residential mortgage loans — FVO
|
|||||
|
•
|
N/A
|
Valuation Techniques: Principally the market approach, including matrix pricing or other similar techniques.
|
|||
|
Key Inputs: Inputs that are unobservable or cannot be derived principally from, or corroborated by, observable market data
|
|||||
|
Separate Account Assets and Separate Account Liabilities (1)
|
|||||
|
Mutual funds and hedge funds without readily determinable fair values as prices are not published publicly
|
|||||
|
Key Input:
|
•
|
N/A
|
|||
|
•
|
quoted prices or reported NAV provided by the fund managers
|
||||
|
Other limited partnership interests
|
|||||
|
•
|
N/A
|
Valuation Techniques: Valued giving consideration to the underlying holdings of the partnerships and by applying a premium or discount, if appropriate.
|
|||
|
Key Inputs:
|
|||||
|
•
|
liquidity; bid/ask spreads; performance record of the fund manager
|
||||
|
•
|
other relevant variables that may impact the exit value of the particular partnership interest
|
||||
__________________
|
(1)
|
Estimated fair value equals carrying value, based on the value of the underlying assets, including: mutual fund interests, fixed maturity securities, equity securities, derivatives, hedge funds, other limited partnership interests, short-term investments and cash and cash equivalents. Fixed maturity securities, equity securities, derivatives, short-term investments and cash and cash equivalents are similar in nature to the instruments described under “— Securities, Short-term Investments, Other Investments and Trading Liabilities” and “— Derivatives — Freestanding Derivatives”
|
299
MetLife, Inc.
Notes to the Consolidated Financial Statements — (continued)
10. Fair Value (continued)
Derivatives
The estimated fair value of derivatives is determined through the use of quoted market prices for exchange-traded derivatives, or through the use of pricing models for OTC-bilateral and OTC-cleared derivatives. The determination of estimated fair value, when quoted market values are not available, is based on market standard valuation methodologies and inputs that management believes are consistent with what other market participants would use when pricing such instruments. Derivative valuations can be affected by changes in interest rates, foreign currency exchange rates, financial indices, credit spreads, default risk, nonperformance risk, volatility, liquidity and changes in estimates and assumptions used in the pricing models. The valuation controls and procedures for derivatives are described in “— Investments.”
The significant inputs to the pricing models for most OTC-bilateral and OTC-cleared derivatives are inputs that are observable in the market or can be derived principally from, or corroborated by, observable market data. Certain OTC-bilateral and OTC-cleared derivatives may rely on inputs that are significant to the estimated fair value that are not observable in the market or cannot be derived principally from, or corroborated by, observable market data. These unobservable inputs may involve significant management judgment or estimation. Even though unobservable, these inputs are based on assumptions deemed appropriate given the circumstances and management believes they are consistent with what other market participants would use when pricing such instruments.
Most inputs for OTC-bilateral and OTC-cleared derivatives are mid-market inputs but, in certain cases, liquidity adjustments are made when they are deemed more representative of exit value. Market liquidity, as well as the use of different methodologies, assumptions and inputs, may have a material effect on the estimated fair values of the Company’s derivatives and could materially affect net income.
The credit risk of both the counterparty and the Company are considered in determining the estimated fair value for all OTC-bilateral and OTC-cleared derivatives, and any potential credit adjustment is based on the net exposure by counterparty after taking into account the effects of netting agreements and collateral arrangements. The Company values its OTC-bilateral and OTC-cleared derivatives using standard swap curves which may include a spread to the risk-free rate, depending upon specific collateral arrangements. This credit spread is appropriate for those parties that execute trades at pricing levels consistent with similar collateral arrangements. As the Company and its significant derivative counterparties generally execute trades at such pricing levels and hold sufficient collateral, additional credit risk adjustments are not currently required in the valuation process. The Company’s ability to consistently execute at such pricing levels is in part due to the netting agreements and collateral arrangements that are in place with all of its significant derivative counterparties. An evaluation of the requirement to make additional credit risk adjustments is performed by the Company each reporting period.
Freestanding Derivatives
Level 2 Valuation Techniques and Key Inputs:
This level includes all types of derivatives utilized by the Company with the exception of exchange-traded derivatives included within Level 1 and those derivatives with unobservable inputs as described in Level 3.
Level 3 Valuation Techniques and Key Inputs:
These valuation methodologies generally use the same inputs as described in the corresponding sections for Level 2 measurements of derivatives. However, these derivatives result in Level 3 classification because one or more of the significant inputs are not observable in the market or cannot be derived principally from, or corroborated by, observable market data.
300
MetLife, Inc.
Notes to the Consolidated Financial Statements — (continued)
10. Fair Value (continued)
Freestanding derivatives are principally valued using the income approach. Valuations of non-option-based derivatives utilize present value techniques, whereas valuations of option-based derivatives utilize option pricing models. Key inputs are as follows:
|
Instrument
|
Interest Rate
|
Foreign Currency
Exchange Rate
|
Credit
|
Equity Market
|
||||
|
Inputs common to Level 2 and Level 3 by instrument type
|
•
|
swap yield curves
|
•
|
swap yield curves
|
•
|
swap yield curves
|
•
|
swap yield curves
|
|
•
|
basis curves
|
•
|
basis curves
|
•
|
credit curves
|
•
|
spot equity index levels
|
|
|
•
|
interest rate volatility (1)
|
•
|
currency spot rates
|
•
|
recovery rates
|
•
|
dividend yield curves
|
|
|
•
|
cross currency basis curves
|
•
|
equity volatility (1)
|
|||||
|
•
|
currency volatility (1)
|
|||||||
|
Level 3
|
•
|
swap yield curves (2)
|
•
|
swap yield curves (2)
|
•
|
swap yield curves (2)
|
•
|
dividend yield curves (2)
|
|
•
|
basis curves (2)
|
•
|
basis curves (2)
|
•
|
credit curves (2)
|
•
|
equity volatility (1), (2)
|
|
|
•
|
repurchase rates
|
•
|
cross currency basis curves (2)
|
•
|
credit spreads
|
•
|
correlation between model inputs (1)
|
|
|
•
|
currency correlation
|
•
|
repurchase rates
|
|||||
|
•
|
currency volatility (1)
|
•
|
independent non-binding broker quotations
|
|||||
__________________
|
(1)
|
Option-based only.
|
|
(2)
|
Extrapolation beyond the observable limits of the curve(s).
|
Embedded Derivatives
Embedded derivatives principally include certain direct, assumed and ceded variable annuity guarantees, equity or bond indexed crediting rates within certain funding agreements and annuity contracts, and those related to funds withheld on ceded reinsurance agreements. Embedded derivatives are recorded at estimated fair value with changes in estimated fair value reported in net income.
The Company issues certain variable annuity products with guaranteed minimum benefits. GMWBs, GMABs and certain GMIBs contain embedded derivatives, which are measured at estimated fair value separately from the host variable annuity contract, with changes in estimated fair value reported in net derivative gains (losses). These embedded derivatives are classified within policyholder account balances and future policy benefits on the consolidated balance sheets.
The Company’s actuarial department calculates the fair value of these embedded derivatives, which are estimated as the present value of projected future benefits minus the present value of projected future fees using actuarial and capital market assumptions including expectations concerning policyholder behavior. The calculation is based on in-force business, and is performed using standard actuarial valuation software which projects future cash flows from the embedded derivative over multiple risk neutral stochastic scenarios using observable risk-free rates.
Capital market assumptions, such as risk-free rates and implied volatilities, are based on market prices for publicly traded instruments to the extent that prices for such instruments are observable. Implied volatilities beyond the observable period are extrapolated based on observable implied volatilities and historical volatilities. Actuarial assumptions, including mortality, lapse, withdrawal and utilization, are unobservable and are reviewed at least annually based on actuarial studies of historical experience.
The valuation of these guarantee liabilities includes nonperformance risk adjustments and adjustments for a risk margin related to non-capital market inputs. The nonperformance adjustment is determined by taking into consideration publicly available information relating to spreads in the secondary market for MetLife, Inc.’s debt, including related credit default swaps. These observable spreads are then adjusted, as necessary, to reflect the priority of these liabilities and the claims paying ability of the issuing insurance subsidiaries as compared to MetLife, Inc.
301
MetLife, Inc.
Notes to the Consolidated Financial Statements — (continued)
10. Fair Value (continued)
Risk margins are established to capture the non-capital market risks of the instrument which represent the additional compensation a market participant would require to assume the risks related to the uncertainties of such actuarial assumptions as annuitization, premium persistency, partial withdrawal and surrenders. The establishment of risk margins requires the use of significant management judgment, including assumptions of the amount and cost of capital needed to cover the guarantees. These guarantees may be more costly than expected in volatile or declining equity markets. Market conditions including, but not limited to, changes in interest rates, equity indices, market volatility and foreign currency exchange rates; changes in nonperformance risk; and variations in actuarial assumptions regarding policyholder behavior, mortality and risk margins related to non-capital market inputs, may result in significant fluctuations in the estimated fair value of the guarantees that could materially affect net income.
The Company ceded the risk associated with certain of the GMIBs previously described. These reinsurance agreements contain embedded derivatives which are included within premiums, reinsurance and other receivables on the consolidated balance sheets with changes in estimated fair value reported in net derivative gains (losses) or policyholder benefits and claims depending on the statement of operations classification of the direct risk. The value of the embedded derivatives on the ceded risk is determined using a methodology consistent with that described previously for the guarantees directly written by the Company with the exception of the input for nonperformance risk that reflects the credit of the reinsurer.
The estimated fair value of the embedded derivatives within funds withheld related to certain ceded reinsurance is determined based on the change in estimated fair value of the underlying assets held by the Company in a reference portfolio backing the funds withheld liability. The estimated fair value of the underlying assets is determined as previously described in “— Investments — Securities, Short-term Investments, Other Investments and Trading Liabilities.” The estimated fair value of these embedded derivatives is included, along with their funds withheld hosts, in other liabilities on the consolidated balance sheets with changes in estimated fair value recorded in net derivative gains (losses). Changes in the credit spreads on the underlying assets, interest rates and market volatility may result in significant fluctuations in the estimated fair value of these embedded derivatives that could materially affect net income.
The estimated fair value of the embedded equity and bond indexed derivatives contained in certain funding agreements is determined using market standard swap valuation models and observable market inputs, including a nonperformance risk adjustment. The estimated fair value of these embedded derivatives are included, along with their funding agreements host, within policyholder account balances with changes in estimated fair value recorded in net derivative gains (losses). Changes in equity and bond indices, interest rates and the Company’s credit standing may result in significant fluctuations in the estimated fair value of these embedded derivatives that could materially affect net income.
The Company issues certain annuity contracts which allow the policyholder to participate in returns from equity indices. These equity indexed features are embedded derivatives which are measured at estimated fair value separately from the host fixed annuity contract, with changes in estimated fair value reported in net derivative gains (losses). These embedded derivatives are classified within policyholder account balances on the consolidated balance sheets.
The estimated fair value of the embedded equity indexed derivatives, based on the present value of future equity returns to the policyholder using actuarial and present value assumptions including expectations concerning policyholder behavior, is calculated by the Company’s actuarial department. The calculation is based on in-force business and uses standard capital market techniques, such as Black-Scholes, to calculate the value of the portion of the embedded derivative for which the terms are set. The portion of the embedded derivative covering the period beyond where terms are set is calculated as the present value of amounts expected to be spent to provide equity indexed returns in those periods. The valuation of these embedded derivatives also includes the establishment of a risk margin, as well as changes in nonperformance risk.
302
MetLife, Inc.
Notes to the Consolidated Financial Statements — (continued)
10. Fair Value (continued)
Embedded Derivatives Within Asset and Liability Host Contracts
Level 3 Valuation Techniques and Key Inputs:
Direct and assumed guaranteed minimum benefits
These embedded derivatives are principally valued using the income approach. Valuations are based on option pricing techniques, which utilize significant inputs that may include swap yield curves, currency exchange rates and implied volatilities. These embedded derivatives result in Level 3 classification because one or more of the significant inputs are not observable in the market or cannot be derived principally from, or corroborated by, observable market data. Significant unobservable inputs generally include: the extrapolation beyond observable limits of the swap yield curves and implied volatilities, actuarial assumptions for policyholder behavior and mortality and the potential variability in policyholder behavior and mortality, nonperformance risk and cost of capital for purposes of calculating the risk margin.
Reinsurance ceded on certain guaranteed minimum benefits
These embedded derivatives are principally valued using the income approach. The valuation techniques and significant market standard unobservable inputs used in their valuation are similar to those described above in “— Direct and assumed guaranteed minimum benefits” and also include counterparty credit spreads.
Transfers between Levels
Overall, transfers between levels occur when there are changes in the observability of inputs and market activity. Transfers into or out of any level are assumed to occur at the beginning of the period.
Transfers between Levels 1 and 2:
For assets and liabilities measured at estimated fair value and still held at
December 31, 2016
, transfers between Levels 1 and 2 were not significant. For assets and liabilities measured at estimated fair value and still held at
December 31, 2015
, transfers between Levels 1 and 2 were
$203 million
.
Transfers into or out of Level 3:
Assets and liabilities are transferred into Level 3 when a significant input cannot be corroborated with market observable data. This occurs when market activity decreases significantly and underlying inputs cannot be observed, current prices are not available, and/or when there are significant variances in quoted prices, thereby affecting transparency. Assets and liabilities are transferred out of Level 3 when circumstances change such that a significant input can be corroborated with market observable data. This may be due to a significant increase in market activity, a specific event, or one or more significant input(s) becoming observable.
303
MetLife, Inc.
Notes to the Consolidated Financial Statements — (continued)
10. Fair Value (continued)
Assets and Liabilities Measured at Fair Value Using Significant Unobservable Inputs (Level 3)
The following table presents certain quantitative information about the significant unobservable inputs used in the fair value measurement, and the sensitivity of the estimated fair value to changes in those inputs, for the more significant asset and liability classes measured at fair value on a recurring basis using significant unobservable inputs (Level 3) at:
|
December 31, 2016
|
December 31, 2015
|
Impact of
Increase in Input on Estimated Fair Value (2) |
|||||||||||||||||
|
Valuation Techniques
|
Significant
Unobservable Inputs
|
Range
|
Weighted
Average (1) |
Range
|
Weighted
Average (1) |
||||||||||||||
|
Fixed maturity securities (3)
|
|||||||||||||||||||
|
U.S. corporate and foreign corporate
|
•
|
Matrix pricing
|
•
|
Offered quotes (4)
|
18
|
-
|
138
|
105
|
39
|
-
|
111
|
96
|
Increase
|
||||||
|
•
|
Delta spread adjustments (5)
|
(65)
|
-
|
240
|
39
|
Decrease
|
|||||||||||||
|
•
|
Market pricing
|
•
|
Quoted prices (4)
|
6
|
-
|
700
|
114
|
—
|
-
|
780
|
156
|
Increase
|
|||||||
|
•
|
Consensus pricing
|
•
|
Offered quotes (4)
|
37
|
-
|
120
|
99
|
68
|
-
|
121
|
98
|
Increase
|
|||||||
|
Foreign government
|
•
|
Market pricing
|
•
|
Quoted prices (4)
|
98
|
-
|
124
|
104
|
96
|
-
|
135
|
113
|
Increase
|
||||||
|
RMBS
|
•
|
Market pricing
|
•
|
Quoted prices (4)
|
19
|
-
|
137
|
91
|
19
|
-
|
292
|
92
|
Increase (6)
|
||||||
|
ABS
|
•
|
Market pricing
|
•
|
Quoted prices (4)
|
5
|
-
|
106
|
99
|
16
|
-
|
109
|
100
|
Increase (6)
|
||||||
|
•
|
Consensus pricing
|
•
|
Offered quotes (4)
|
96
|
-
|
102
|
100
|
66
|
-
|
105
|
99
|
Increase (6)
|
|||||||
|
Derivatives
|
|||||||||||||||||||
|
Interest rate
|
•
|
Present value techniques
|
•
|
Swap yield (7)
|
200
|
-
|
300
|
307
|
-
|
317
|
Increase (8)
|
||||||||
|
•
|
Repurchase rates (9)
|
(44)
|
-
|
18
|
Decrease (8)
|
||||||||||||||
|
Foreign currency exchange rate
|
•
|
Present value techniques
|
•
|
Swap yield (7)
|
50
|
-
|
328
|
28
|
-
|
381
|
Increase (8)
|
||||||||
|
Credit
|
•
|
Present value techniques
|
•
|
Credit spreads (10)
|
97
|
-
|
98
|
98
|
-
|
100
|
Decrease (8)
|
||||||||
|
•
|
Consensus pricing
|
•
|
Offered quotes (11)
|
||||||||||||||||
|
Equity market
|
•
|
Present value techniques or option pricing models
|
•
|
Volatility (12)
|
12%
|
-
|
32%
|
15%
|
-
|
36%
|
Increase (8)
|
||||||||
|
•
|
Correlation (13)
|
40%
|
-
|
40%
|
70%
|
-
|
70%
|
||||||||||||
|
Embedded derivatives
|
|||||||||||||||||||
|
Direct, assumed and ceded guaranteed minimum benefits
|
•
|
Option pricing techniques
|
•
|
Mortality rates:
|
|||||||||||||||
|
Ages 0 - 40
|
0%
|
-
|
0.21%
|
0%
|
-
|
0.21%
|
Decrease (14)
|
||||||||||||
|
Ages 41 - 60
|
0.01%
|
-
|
0.78%
|
0.01%
|
-
|
0.78%
|
Decrease (14)
|
||||||||||||
|
Ages 61 - 115
|
0.04%
|
-
|
100%
|
0.04%
|
-
|
100%
|
Decrease (14)
|
||||||||||||
|
•
|
Lapse rates:
|
||||||||||||||||||
|
Durations 1 - 10
|
0.25%
|
-
|
100%
|
0.25%
|
-
|
100%
|
Decrease (15)
|
||||||||||||
|
Durations 11 - 20
|
2%
|
-
|
100%
|
2%
|
-
|
100%
|
Decrease (15)
|
||||||||||||
|
Durations 21 - 116
|
1.25%
|
-
|
100%
|
1%
|
-
|
100%
|
Decrease (15)
|
||||||||||||
|
•
|
Utilization rates
|
0%
|
-
|
25%
|
0%
|
-
|
25%
|
Increase (16)
|
|||||||||||
|
•
|
Withdrawal rates
|
0%
|
-
|
20%
|
0%
|
-
|
20%
|
(17)
|
|||||||||||
|
•
|
Long-term equity volatilities
|
9.95%
|
-
|
33%
|
8.79%
|
-
|
33%
|
Increase (18)
|
|||||||||||
|
•
|
Nonperformance risk spread
|
0.04%
|
-
|
1.70%
|
(0.47)%
|
-
|
1.31%
|
Decrease (19)
|
|||||||||||
__________________
|
(1)
|
The weighted average for fixed maturity securities is determined based on the estimated fair value of the securities.
|
|
(2)
|
The impact of a decrease in input would have the opposite impact on estimated fair value. For embedded derivatives, changes to direct and assumed guaranteed minimum benefits are based on liability positions; changes to ceded guaranteed minimum benefits are based on asset positions.
|
|
(3)
|
Significant increases (decreases) in expected default rates in isolation would result in substantially lower (higher) valuations.
|
|
(4)
|
Range and weighted average are presented in accordance with the market convention for fixed maturity securities of dollars per hundred dollars of par.
|
304
MetLife, Inc.
Notes to the Consolidated Financial Statements — (continued)
10. Fair Value (continued)
|
(5)
|
Range and weighted average are presented in basis points.
|
|
(6)
|
Changes in the assumptions used for the probability of default is accompanied by a directionally similar change in the assumption used for the loss severity and a directionally opposite change in the assumptions used for prepayment rates.
|
|
(7)
|
Ranges represent the rates across different yield curves and are presented in basis points. The swap yield curves are utilized among different types of derivatives to project cash flows, as well as to discount future cash flows to present value. Since this valuation methodology uses a range of inputs across a yield curve to value the derivative, presenting a range is more representative of the unobservable input used in the valuation.
|
|
(8)
|
Changes in estimated fair value are based on long U.S. dollar net asset positions and will be inversely impacted for short U.S. dollar net asset positions.
|
|
(9)
|
Ranges represent different repurchase rates utilized as components within the valuation methodology and are presented in basis points.
|
|
(10)
|
Represents the risk quoted in basis points of a credit default event on the underlying instrument. Credit derivatives with significant unobservable inputs are primarily comprised of written credit default swaps.
|
|
(11)
|
At both
December 31, 2016
and
2015
, independent non-binding broker quotations were used in the determination of less than
1%
of the total net derivative estimated fair value.
|
|
(12)
|
Ranges represent the underlying equity volatility quoted in percentage points. Since this valuation methodology uses a range of inputs across multiple volatility surfaces to value the derivative, presenting a range is more representative of the unobservable input used in the valuation.
|
|
(13)
|
Ranges represent the different correlation factors utilized as components within the valuation methodology. Presenting a range of correlation factors is more representative of the unobservable input used in the valuation. Increases (decreases) in correlation in isolation will increase (decrease) the significance of the change in valuations.
|
|
(14)
|
Mortality rates vary by age and by demographic characteristics such as gender. Mortality rate assumptions are based on company experience. A mortality improvement assumption is also applied. For any given contract, mortality rates vary throughout the period over which cash flows are projected for purposes of valuing the embedded derivative.
|
|
(15)
|
Base lapse rates are adjusted at the contract level based on a comparison of the actuarially calculated guaranteed values and the current policyholder account value, as well as other factors, such as the applicability of any surrender charges. A dynamic lapse function reduces the base lapse rate when the guaranteed amount is greater than the account value as in the money contracts are less likely to lapse. Lapse rates are also generally assumed to be lower in periods when a surrender charge applies. For any given contract, lapse rates vary throughout the period over which cash flows are projected for purposes of valuing the embedded derivative.
|
|
(16)
|
The utilization rate assumption estimates the percentage of contract holders with a GMIB or lifetime withdrawal benefit who will elect to utilize the benefit upon becoming eligible. The rates may vary by the type of guarantee, the amount by which the guaranteed amount is greater than the account value, the contract’s withdrawal history and by the age of the policyholder. For any given contract, utilization rates vary throughout the period over which cash flows are projected for purposes of valuing the embedded derivative.
|
|
(17)
|
The withdrawal rate represents the percentage of account balance that any given policyholder will elect to withdraw from the contract each year. The withdrawal rate assumption varies by age and duration of the contract, and also by other factors such as benefit type. For any given contract, withdrawal rates vary throughout the period over which cash flows are projected for purposes of valuing the embedded derivative. For GMWBs, any increase (decrease) in withdrawal rates results in an increase (decrease) in the estimated fair value of the guarantees. For GMABs and GMIBs, any increase (decrease) in withdrawal rates results in a decrease (increase) in the estimated fair value.
|
|
(18)
|
Long-term equity volatilities represent equity volatility beyond the period for which observable equity volatilities are available. For any given contract, long-term equity volatility rates vary throughout the period over which cash flows are projected for purposes of valuing the embedded derivative.
|
|
(19)
|
Nonperformance risk spread varies by duration and by currency. For any given contract, multiple nonperformance risk spreads will apply, depending on the duration of the cash flow being discounted for purposes of valuing the embedded derivative.
|
305
MetLife, Inc.
Notes to the Consolidated Financial Statements — (continued)
10. Fair Value (continued)
The following is a summary of the valuation techniques and significant unobservable inputs used in the fair value measurement of assets and liabilities classified within Level 3 that are not included in the preceding table. Generally, all other classes of securities classified within Level 3, including those within separate account assets, and embedded derivatives within funds withheld related to certain ceded and assumed reinsurance, use the same valuation techniques and significant unobservable inputs as previously described for Level 3 securities. This includes matrix pricing and discounted cash flow methodologies, inputs such as quoted prices for identical or similar securities that are less liquid and based on lower levels of trading activity than securities classified in Level 2, as well as independent non-binding broker quotations. The residential mortgage loans — FVO are valued using independent non-binding broker quotations and internal models including matrix pricing and discounted cash flow methodologies using current interest rates. The sensitivity of the estimated fair value to changes in the significant unobservable inputs for these other assets and liabilities is similar in nature to that described in the preceding table. The valuation techniques and significant unobservable inputs used in the fair value measurement for the more significant assets measured at estimated fair value on a nonrecurring basis and determined using significant unobservable inputs (Level 3) are summarized in “— Nonrecurring Fair Value Measurements.”
306
MetLife, Inc.
Notes to the Consolidated Financial Statements — (continued)
10. Fair Value (continued)
The following tables summarize the change of all assets and (liabilities) measured at estimated fair value on a recurring basis using significant unobservable inputs (Level 3):
|
Fair Value Measurements Using Significant Unobservable Inputs (Level 3)
|
||||||||||||||||||||||||
|
Fixed Maturity Securities
|
||||||||||||||||||||||||
|
Corporate (1)
|
Foreign
Government |
Structured
Securities
|
State and
Political Subdivision |
Equity
Securities |
FVO and
Trading Securities (2) |
|||||||||||||||||||
|
(In millions)
|
||||||||||||||||||||||||
|
Balance, January 1, 2015
|
$
|
13,432
|
|
$
|
1,311
|
|
$
|
7,392
|
|
$
|
—
|
|
$
|
345
|
|
$
|
567
|
|
||||||
|
Total realized/unrealized gains (losses) included in net income (loss) (3) (4)
|
69
|
|
13
|
|
124
|
|
—
|
|
22
|
|
(30
|
)
|
||||||||||||
|
Total realized/unrealized gains (losses) included in AOCI
|
(761
|
)
|
(25
|
)
|
(91
|
)
|
—
|
|
(64
|
)
|
—
|
|
||||||||||||
|
Purchases (5)
|
2,556
|
|
212
|
|
3,167
|
|
46
|
|
128
|
|
51
|
|
||||||||||||
|
Sales (5)
|
(1,425
|
)
|
(45
|
)
|
(1,585
|
)
|
—
|
|
(96
|
)
|
(127
|
)
|
||||||||||||
|
Issuances (5)
|
—
|
|
—
|
|
—
|
|
—
|
|
—
|
|
—
|
|
||||||||||||
|
Settlements (5)
|
—
|
|
—
|
|
—
|
|
—
|
|
—
|
|
—
|
|
||||||||||||
|
Transfers into Level 3 (6)
|
918
|
|
7
|
|
66
|
|
—
|
|
107
|
|
56
|
|
||||||||||||
|
Transfers out of Level 3 (6)
|
(1,993
|
)
|
(617
|
)
|
(1,957
|
)
|
—
|
|
(10
|
)
|
(247
|
)
|
||||||||||||
|
Balance, December 31, 2015
|
12,796
|
|
856
|
|
7,116
|
|
46
|
|
432
|
|
270
|
|
||||||||||||
|
Total realized/unrealized gains (losses) included in net income (loss) (3) (4)
|
3
|
|
12
|
|
138
|
|
1
|
|
(24
|
)
|
2
|
|
||||||||||||
|
Total realized/unrealized gains (losses) included in AOCI
|
33
|
|
(42
|
)
|
77
|
|
2
|
|
7
|
|
—
|
|
||||||||||||
|
Purchases (5)
|
3,198
|
|
45
|
|
2,519
|
|
—
|
|
23
|
|
99
|
|
||||||||||||
|
Sales (5)
|
(1,295
|
)
|
(45
|
)
|
(1,815
|
)
|
—
|
|
(41
|
)
|
(35
|
)
|
||||||||||||
|
Issuances (5)
|
—
|
|
—
|
|
—
|
|
—
|
|
—
|
|
—
|
|
||||||||||||
|
Settlements (5)
|
—
|
|
—
|
|
—
|
|
—
|
|
—
|
|
—
|
|
||||||||||||
|
Transfers into Level 3 (6)
|
1,089
|
|
3
|
|
38
|
|
16
|
|
457
|
|
18
|
|
||||||||||||
|
Transfers out of Level 3 (6)
|
(1,897
|
)
|
(539
|
)
|
(1,208
|
)
|
(38
|
)
|
(250
|
)
|
(67
|
)
|
||||||||||||
|
Balance, December 31, 2016
|
$
|
13,927
|
|
$
|
290
|
|
$
|
6,865
|
|
$
|
27
|
|
$
|
604
|
|
$
|
287
|
|
||||||
|
Changes in unrealized gains (losses) included in net income (loss) for the instruments still held at December 31, 2014: (7)
|
$
|
13
|
|
$
|
12
|
|
$
|
39
|
|
$
|
—
|
|
$
|
(5
|
)
|
$
|
(7
|
)
|
||||||
|
Changes in unrealized gains (losses) included in net income (loss) for the instruments still held at December 31, 2015: (7)
|
$
|
24
|
|
$
|
12
|
|
$
|
125
|
|
$
|
—
|
|
$
|
(1
|
)
|
$
|
(27
|
)
|
||||||
|
Changes in unrealized gains (losses) included in net income (loss) for the instruments still held at December 31, 2016: (7)
|
$
|
8
|
|
$
|
12
|
|
$
|
131
|
|
$
|
2
|
|
$
|
(29
|
)
|
$
|
3
|
|
||||||
|
Gains (Losses) Data for the year ended December 31, 2014:
|
||||||||||||||||||||||||
|
Total realized/unrealized gains (losses) included in net income (loss) (3) (4)
|
$
|
13
|
|
$
|
61
|
|
$
|
14
|
|
$
|
—
|
|
$
|
17
|
|
$
|
8
|
|
||||||
|
Total realized/unrealized gains (losses) included in AOCI
|
$
|
353
|
|
$
|
(110
|
)
|
$
|
69
|
|
$
|
—
|
|
$
|
(80
|
)
|
$
|
—
|
|
||||||
307
MetLife, Inc.
Notes to the Consolidated Financial Statements — (continued)
10. Fair Value (continued)
|
Fair Value Measurements Using Significant Unobservable Inputs (Level 3)
|
||||||||||||||||||||
|
Short-term
Investments
|
Residential Mortgage
Loans - FVO
|
Net
Derivatives (8)
|
Net Embedded
Derivatives (9)
|
Separate
Accounts (10)
|
||||||||||||||||
|
(In millions)
|
||||||||||||||||||||
|
Balance, January 1, 2015
|
$
|
336
|
|
$
|
308
|
|
$
|
(300
|
)
|
$
|
430
|
|
$
|
1,922
|
|
|||||
|
Total realized/unrealized gains (losses) included in net income (loss) (3) (4)
|
1
|
|
20
|
|
(223
|
)
|
(159
|
)
|
8
|
|
||||||||||
|
Total realized/unrealized gains (losses) included in AOCI
|
(1
|
)
|
—
|
|
—
|
|
2
|
|
—
|
|
||||||||||
|
Purchases (5)
|
292
|
|
136
|
|
24
|
|
—
|
|
572
|
|
||||||||||
|
Sales (5)
|
(27
|
)
|
(121
|
)
|
—
|
|
—
|
|
(527
|
)
|
||||||||||
|
Issuances (5)
|
—
|
|
—
|
|
—
|
|
—
|
|
98
|
|
||||||||||
|
Settlements (5)
|
—
|
|
(29
|
)
|
88
|
|
(817
|
)
|
(60
|
)
|
||||||||||
|
Transfers into Level 3 (6)
|
—
|
|
—
|
|
—
|
|
—
|
|
1
|
|
||||||||||
|
Transfers out of Level 3 (6)
|
(310
|
)
|
—
|
|
—
|
|
—
|
|
(310
|
)
|
||||||||||
|
Balance, December 31, 2015
|
291
|
|
314
|
|
(411
|
)
|
(544
|
)
|
1,704
|
|
||||||||||
|
Total realized/unrealized gains (losses) included in net income (loss) (3) (4)
|
1
|
|
8
|
|
(734
|
)
|
(2,271
|
)
|
(3
|
)
|
||||||||||
|
Total realized/unrealized gains (losses) included in AOCI
|
4
|
|
—
|
|
(363
|
)
|
(18
|
)
|
—
|
|
||||||||||
|
Purchases (5)
|
52
|
|
297
|
|
38
|
|
—
|
|
377
|
|
||||||||||
|
Sales (5)
|
(51
|
)
|
(11
|
)
|
—
|
|
—
|
|
(644
|
)
|
||||||||||
|
Issuances (5)
|
—
|
|
—
|
|
—
|
|
—
|
|
62
|
|
||||||||||
|
Settlements (5)
|
—
|
|
(42
|
)
|
(46
|
)
|
(892
|
)
|
(51
|
)
|
||||||||||
|
Transfers into Level 3 (6)
|
—
|
|
—
|
|
—
|
|
—
|
|
19
|
|
||||||||||
|
Transfers out of Level 3 (6)
|
(250
|
)
|
—
|
|
—
|
|
—
|
|
(312
|
)
|
||||||||||
|
Balance, December 31, 2016
|
$
|
47
|
|
$
|
566
|
|
$
|
(1,516
|
)
|
$
|
(3,725
|
)
|
$
|
1,152
|
|
|||||
|
Changes in unrealized gains (losses) included in net income (loss) for the instruments still held at December 31, 2014: (7)
|
$
|
1
|
|
$
|
20
|
|
$
|
(67
|
)
|
$
|
(173
|
)
|
$
|
—
|
|
|||||
|
Changes in unrealized gains (losses) included in net income (loss) for the instruments still held at December 31, 2015: (7)
|
$
|
—
|
|
$
|
20
|
|
$
|
(234
|
)
|
$
|
(176
|
)
|
$
|
—
|
|
|||||
|
Changes in unrealized gains (losses) included in net income (loss) for the instruments still held at December 31, 2016: (7)
|
$
|
1
|
|
$
|
8
|
|
$
|
(743
|
)
|
$
|
(2,311
|
)
|
$
|
—
|
|
|||||
|
Gains (Losses) Data for the year ended December 31, 2014:
|
||||||||||||||||||||
|
Total realized/unrealized gains (losses) included in net income (loss) (3) (4)
|
$
|
1
|
|
$
|
20
|
|
$
|
(83
|
)
|
$
|
(173
|
)
|
$
|
103
|
|
|||||
|
Total realized/unrealized gains (losses) included in AOCI
|
$
|
—
|
|
$
|
—
|
|
$
|
101
|
|
$
|
191
|
|
$
|
—
|
|
|||||
__________________
|
(1)
|
Comprised of U.S. and foreign corporate securities.
|
|
(2)
|
Comprised of FVO contractholder-directed unit-linked investments, FVO general account securities, FVO general account securities held by CSEs and actively traded securities.
|
|
(3)
|
Amortization of premium/accretion of discount is included within net investment income. Impairments charged to net income (loss) on securities are included in net investment gains (losses), while changes in estimated fair value of residential mortgage loans — FVO are included in net investment income. Lapses associated with net embedded derivatives are included in net derivative gains (losses). Substantially all realized/unrealized gains (losses) included in net income (loss) for net derivatives and net embedded derivatives are reported in net derivatives gains (losses).
|
|
(4)
|
Interest and dividend accruals, as well as cash interest coupons and dividends received, are excluded from the rollforward.
|
|
(5)
|
Items purchased/issued and then sold/settled in the same period are excluded from the rollforward. Fees attributed to embedded derivatives are included in settlements.
|
308
MetLife, Inc.
Notes to the Consolidated Financial Statements — (continued)
10. Fair Value (continued)
|
(6)
|
Gains and losses, in net income (loss) and OCI, are calculated assuming transfers into and/or out of Level 3 occurred at the beginning of the period. Items transferred into and then out of Level 3 in the same period are excluded from the rollforward.
|
|
(7)
|
Changes in unrealized gains (losses) included in net income (loss) relate to assets and liabilities still held at the end of the respective periods. Substantially all changes in unrealized gains (losses) included in net income (loss) for net derivatives and net embedded derivatives are reported in net derivative gains (losses).
|
|
(8)
|
Freestanding derivative assets and liabilities are presented net for purposes of the rollforward.
|
|
(9)
|
Embedded derivative assets and liabilities are presented net for purposes of the rollforward.
|
|
(10)
|
Investment performance related to separate account assets is fully offset by corresponding amounts credited to contractholders within separate account liabilities. Therefore, such changes in estimated fair value are not recorded in net income (loss). For the purpose of this disclosure, these changes are presented within net investment gains (losses).
Separate account assets and liabilities are presented net for the purposes of the rollforward.
|
Fair Value Option
The following table presents information for certain assets and liabilities accounted for under the FVO. These assets and liabilities were initially measured at fair value.
|
Residential Mortgage
Loans — FVO
|
Certain Assets
and Liabilities of CSEs — FVO (1) |
|||||||||||||||
|
December 31,
|
December 31,
|
|||||||||||||||
|
2016
|
2015
|
2016
|
2015
|
|||||||||||||
|
(In millions)
|
||||||||||||||||
|
Assets
|
||||||||||||||||
|
Unpaid principal balance
|
$
|
794
|
|
$
|
436
|
|
$
|
88
|
|
$
|
121
|
|
||||
|
Difference between estimated fair value and unpaid principal balance
|
(228
|
)
|
(122
|
)
|
48
|
|
51
|
|
||||||||
|
Carrying value at estimated fair value
|
$
|
566
|
|
$
|
314
|
|
$
|
136
|
|
$
|
172
|
|
||||
|
Loans in nonaccrual status
|
$
|
214
|
|
$
|
122
|
|
$
|
—
|
|
$
|
—
|
|
||||
|
Loans more than 90 days past due
|
$
|
137
|
|
$
|
72
|
|
$
|
—
|
|
$
|
—
|
|
||||
|
Loans in nonaccrual status or more than 90 days past due, or both — difference between aggregate estimated fair value and unpaid principal balance
|
$
|
(150
|
)
|
$
|
(52
|
)
|
$
|
—
|
|
$
|
—
|
|
||||
|
Liabilities
|
||||||||||||||||
|
Contractual principal balance
|
$
|
47
|
|
$
|
71
|
|
||||||||||
|
Difference between estimated fair value and contractual principal balance
|
(12
|
)
|
(11
|
)
|
||||||||||||
|
Carrying value at estimated fair value
|
$
|
35
|
|
$
|
60
|
|
||||||||||
__________________
|
(1)
|
These assets and liabilities are comprised of commercial mortgage loans and long-term debt. Changes in estimated fair value on these assets and liabilities and gains or losses on sales of these assets are recognized in net investment gains (losses). Interest income on commercial mortgage loans held by CSEs — FVO is recognized in net investment income. Interest expense from long-term debt of CSEs — FVO is recognized in other expenses.
|
309
MetLife, Inc.
Notes to the Consolidated Financial Statements — (continued)
10. Fair Value (continued)
Nonrecurring Fair Value Measurements
The following table presents information for assets measured at estimated fair value on a nonrecurring basis during the periods and still held at the reporting dates (for example, when there is evidence of impairment). The estimated fair values for these assets were determined using significant unobservable inputs (Level 3).
|
At December 31,
|
Years Ended December 31,
|
||||||||||||||||||||||
|
2016
|
2015
|
2014
|
2016
|
2015
|
2014
|
||||||||||||||||||
|
Carrying Value After Measurement
|
Gains (Losses)
|
||||||||||||||||||||||
|
(In millions)
|
|||||||||||||||||||||||
|
Mortgage loans (1)
|
$
|
12
|
|
$
|
44
|
|
$
|
97
|
|
$
|
—
|
|
$
|
(1
|
)
|
$
|
2
|
|
|||||
|
Other limited partnership interests (2)
|
$
|
99
|
|
$
|
59
|
|
$
|
147
|
|
$
|
(66
|
)
|
$
|
(32
|
)
|
$
|
(76
|
)
|
|||||
|
Other assets (3)
|
$
|
—
|
|
$
|
—
|
|
$
|
—
|
|
$
|
(44
|
)
|
$
|
—
|
|
$
|
—
|
|
|||||
|
Goodwill (4)
|
$
|
—
|
|
$
|
—
|
|
$
|
—
|
|
$
|
(260
|
)
|
$
|
—
|
|
$
|
—
|
|
|||||
__________________
|
(1)
|
Estimated fair values for impaired mortgage loans are based on independent broker quotations or valuation models using unobservable inputs or, if the loans are in foreclosure or are otherwise determined to be collateral dependent, are based on the estimated fair value of the underlying collateral or the present value of the expected future cash flows.
|
|
(2)
|
For these cost method investments, estimated fair value is determined from information provided on the financial statements of the underlying entities including NAV data. These investments include private equity and debt funds that typically invest primarily in various strategies including domestic and international leveraged buyout funds; power, energy, timber and infrastructure development funds; venture capital funds; and below investment grade debt and mezzanine debt funds. Distributions will be generated from investment gains, from operating income from the underlying investments of the funds and from liquidation of the underlying assets of the funds. It is estimated that the underlying assets of the funds will be liquidated over the next
two
to
10 years
. Unfunded commitments for these investments at both
December 31, 2016
and
2015
were not significant.
|
|
(3)
|
As discussed in
Note 3
, during the year ended December 31, 2016, the Company recognized an impairment of computer software in connection with the U.S. Retail Advisor Force Divestiture.
|
|
(4)
|
As discussed in
Note 11
, during the year ended December 31, 2016, the Company recorded an impairment of goodwill associated with the reporting units within the Brighthouse Financial segment.
|
Fair Value of Financial Instruments Carried at Other Than Fair Value
The following tables provide fair value information for financial instruments that are carried on the balance sheet at amounts other than fair value. These tables exclude the following financial instruments: cash and cash equivalents, accrued investment income, payables for collateral under securities loaned and other transactions, short-term debt and those short-term investments that are not securities, such as time deposits, and therefore are not included in the three level hierarchy table disclosed in the “— Recurring Fair Value Measurements” section. The estimated fair value of the excluded financial instruments, which are primarily classified in Level 2, approximates carrying value as they are short-term in nature such that the Company believes there is minimal risk of material changes in interest rates or credit quality. All remaining balance sheet amounts excluded from the tables below are not considered financial instruments subject to this disclosure.
310
MetLife, Inc.
Notes to the Consolidated Financial Statements — (continued)
10. Fair Value (continued)
The carrying values and estimated fair values for such financial instruments, and their corresponding placement in the fair value hierarchy, are summarized as follows at:
|
December 31, 2016
|
||||||||||||||||||||
|
Fair Value Hierarchy
|
||||||||||||||||||||
|
Carrying
Value
|
Level 1
|
Level 2
|
Level 3
|
Total
Estimated
Fair Value
|
||||||||||||||||
|
(In millions)
|
||||||||||||||||||||
|
Assets
|
||||||||||||||||||||
|
Mortgage loans
|
$
|
73,843
|
|
$
|
—
|
|
$
|
—
|
|
$
|
75,129
|
|
$
|
75,129
|
|
|||||
|
Policy loans
|
$
|
11,028
|
|
$
|
—
|
|
$
|
1,115
|
|
$
|
11,900
|
|
$
|
13,015
|
|
|||||
|
Real estate joint ventures
|
$
|
17
|
|
$
|
—
|
|
$
|
—
|
|
$
|
69
|
|
$
|
69
|
|
|||||
|
Other limited partnership interests
|
$
|
384
|
|
$
|
—
|
|
$
|
—
|
|
$
|
413
|
|
$
|
413
|
|
|||||
|
Other invested assets
|
$
|
506
|
|
$
|
145
|
|
$
|
—
|
|
$
|
360
|
|
$
|
505
|
|
|||||
|
Premiums, reinsurance and other receivables
|
$
|
5,140
|
|
$
|
—
|
|
$
|
1,982
|
|
$
|
3,179
|
|
$
|
5,161
|
|
|||||
|
Other assets
|
$
|
237
|
|
$
|
—
|
|
$
|
198
|
|
$
|
71
|
|
$
|
269
|
|
|||||
|
Liabilities
|
||||||||||||||||||||
|
Policyholder account balances
|
$
|
124,475
|
|
$
|
—
|
|
$
|
—
|
|
$
|
127,833
|
|
$
|
127,833
|
|
|||||
|
Long-term debt
|
$
|
16,459
|
|
$
|
—
|
|
$
|
18,016
|
|
$
|
—
|
|
$
|
18,016
|
|
|||||
|
Collateral financing arrangements
|
$
|
4,071
|
|
$
|
—
|
|
$
|
—
|
|
$
|
3,775
|
|
$
|
3,775
|
|
|||||
|
Junior subordinated debt securities
|
$
|
3,169
|
|
$
|
—
|
|
$
|
3,982
|
|
$
|
—
|
|
$
|
3,982
|
|
|||||
|
Other liabilities
|
$
|
2,028
|
|
$
|
—
|
|
$
|
1,540
|
|
$
|
488
|
|
$
|
2,028
|
|
|||||
|
Separate account liabilities
|
$
|
119,498
|
|
$
|
—
|
|
$
|
119,498
|
|
$
|
—
|
|
$
|
119,498
|
|
|||||
|
December 31, 2015
|
||||||||||||||||||||
|
Fair Value Hierarchy
|
||||||||||||||||||||
|
Carrying
Value
|
Level 1
|
Level 2
|
Level 3
|
Total
Estimated
Fair Value
|
||||||||||||||||
|
(In millions)
|
||||||||||||||||||||
|
Assets
|
||||||||||||||||||||
|
Mortgage loans
|
$
|
66,616
|
|
$
|
—
|
|
$
|
—
|
|
$
|
68,539
|
|
$
|
68,539
|
|
|||||
|
Policy loans
|
$
|
11,258
|
|
$
|
—
|
|
$
|
1,279
|
|
$
|
12,072
|
|
$
|
13,351
|
|
|||||
|
Real estate joint ventures
|
$
|
35
|
|
$
|
—
|
|
$
|
—
|
|
$
|
104
|
|
$
|
104
|
|
|||||
|
Other limited partnership interests
|
$
|
524
|
|
$
|
—
|
|
$
|
—
|
|
$
|
615
|
|
$
|
615
|
|
|||||
|
Other invested assets
|
$
|
537
|
|
$
|
155
|
|
$
|
2
|
|
$
|
380
|
|
$
|
537
|
|
|||||
|
Premiums, reinsurance and other receivables
|
$
|
2,822
|
|
$
|
—
|
|
$
|
484
|
|
$
|
2,421
|
|
$
|
2,905
|
|
|||||
|
Other assets
|
$
|
235
|
|
$
|
—
|
|
$
|
207
|
|
$
|
60
|
|
$
|
267
|
|
|||||
|
Liabilities
|
||||||||||||||||||||
|
Policyholder account balances
|
$
|
125,040
|
|
$
|
—
|
|
$
|
—
|
|
$
|
130,125
|
|
$
|
130,125
|
|
|||||
|
Long-term debt
|
$
|
17,954
|
|
$
|
—
|
|
$
|
19,360
|
|
$
|
—
|
|
$
|
19,360
|
|
|||||
|
Collateral financing arrangements
|
$
|
4,139
|
|
$
|
—
|
|
$
|
—
|
|
$
|
3,899
|
|
$
|
3,899
|
|
|||||
|
Junior subordinated debt securities
|
$
|
3,194
|
|
$
|
—
|
|
$
|
4,029
|
|
$
|
—
|
|
$
|
4,029
|
|
|||||
|
Other liabilities
|
$
|
2,249
|
|
$
|
—
|
|
$
|
865
|
|
$
|
1,385
|
|
$
|
2,250
|
|
|||||
|
Separate account liabilities
|
$
|
112,119
|
|
$
|
—
|
|
$
|
112,119
|
|
$
|
—
|
|
$
|
112,119
|
|
|||||
311
MetLife, Inc.
Notes to the Consolidated Financial Statements — (continued)
10. Fair Value (continued)
The methods, assumptions and significant valuation techniques and inputs used to estimate the fair value of financial instruments are summarized as follows:
Mortgage Loans
The estimated fair value of mortgage loans is primarily determined by estimating expected future cash flows and discounting them using current interest rates for similar mortgage loans with similar credit risk, or is determined from pricing for similar loans.
Policy Loans
Policy loans with fixed interest rates are classified within Level 3. The estimated fair values for these loans are determined using a discounted cash flow model applied to groups of similar policy loans determined by the nature of the underlying insurance liabilities. Cash flow estimates are developed by applying a weighted-average interest rate to the outstanding principal balance of the respective group of policy loans and an estimated average maturity determined through experience studies of the past performance of policyholder repayment behavior for similar loans. These cash flows are discounted using current risk-free interest rates with no adjustment for borrower credit risk, as these loans are fully collateralized by the cash surrender value of the underlying insurance policy. Policy loans with variable interest rates are classified within Level 2 and the estimated fair value approximates carrying value due to the absence of borrower credit risk and the short time period between interest rate resets, which presents minimal risk of a material change in estimated fair value due to changes in market interest rates.
Real Estate Joint Ventures and Other Limited Partnership Interests
The estimated fair values of these cost method investments are generally based on the Company’s share of the NAV as provided on the financial statements of the investees. In certain circumstances, management may adjust the NAV by a premium or discount when it has sufficient evidence to support applying such adjustments.
Other Invested Assets
These other invested assets are principally comprised of various interest-bearing assets held in foreign subsidiaries and certain amounts due under contractual indemnifications. For the various interest-bearing assets held in foreign subsidiaries, the Company evaluates the specific facts and circumstances of each instrument to determine the appropriate estimated fair values. These estimated fair values were not materially different from the recognized carrying values.
Premiums, Reinsurance and Other Receivables
Premiums, reinsurance and other receivables are principally comprised of certain amounts recoverable under reinsurance agreements, amounts on deposit with financial institutions to facilitate daily settlements related to certain derivatives and amounts receivable for securities sold but not yet settled.
Amounts recoverable under ceded reinsurance agreements, which the Company has determined do not transfer significant risk such that they are accounted for using the deposit method of accounting, have been classified as Level 3. The valuation is based on discounted cash flow methodologies using significant unobservable inputs. The estimated fair value is determined using interest rates determined to reflect the appropriate credit standing of the assuming counterparty.
The amounts on deposit for derivative settlements, classified within Level 2, essentially represent the equivalent of demand deposit balances and amounts due for securities sold are generally received over short periods such that the estimated fair value approximates carrying value.
Other Assets
These other assets are principally comprised of a receivable for cash paid to an unaffiliated financial institution under the MetLife Reinsurance Company of Charleston (“MRC”) collateral financing arrangement described in
Note 13
. The estimated fair value of the receivable for the cash paid to the unaffiliated financial institution under the MRC collateral financing arrangement is determined by discounting the expected future cash flows using a discount rate that reflects the credit rating of the unaffiliated financial institution.
312
MetLife, Inc.
Notes to the Consolidated Financial Statements — (continued)
10. Fair Value (continued)
Policyholder Account Balances
These policyholder account balances include investment contracts which primarily include certain funding agreements, fixed deferred annuities, modified guaranteed annuities, fixed term payout annuities and total control accounts (“TCA”). The valuation of these investment contracts is based on discounted cash flow methodologies using significant unobservable inputs. The estimated fair value is determined using current market risk-free interest rates adding a spread to reflect the nonperformance risk in the liability.
Long-term Debt, Collateral Financing Arrangements and Junior Subordinated Debt Securities
The estimated fair values of long-term debt, collateral financing arrangements and junior subordinated debt securities are principally determined using market standard valuation methodologies.
Valuations of instruments classified as Level 2 are based primarily on quoted prices in markets that are not active or using matrix pricing that use standard market observable inputs such as quoted prices in markets that are not active and observable yields and spreads in the market. Instruments valued using discounted cash flow methodologies use standard market observable inputs including market yield curve, duration, call provisions, observable prices and spreads for similar publicly traded or privately traded issues.
Valuations of instruments classified as Level 3 are based primarily on discounted cash flow methodologies that utilize unobservable discount rates that can vary significantly based upon the specific terms of each individual arrangement. The determination of estimated fair values of collateral financing arrangements incorporates valuations obtained from the counterparties to the arrangements, as part of the collateral management process.
Other Liabilities
Other liabilities consist primarily of interest payable, amounts due for securities purchased but not yet settled, and funds withheld amounts payable, which are contractually withheld by the Company in accordance with the terms of the reinsurance agreements. The Company evaluates the specific terms, facts and circumstances of each instrument to determine the appropriate estimated fair values, which are not materially different from the carrying values, with the exception of certain deposit type reinsurance payables. For such payables, the estimated fair value is determined as the present value of expected future cash flows, which are discounted using an interest rate determined to reflect the appropriate credit standing of the assuming counterparty.
Separate Account Liabilities
Separate account liabilities represent those balances due to policyholders under contracts that are classified as investment contracts.
Separate account liabilities classified as investment contracts primarily represent variable annuities with no significant mortality risk to the Company such that the death benefit is equal to the account balance, funding agreements related to group life contracts and certain contracts that provide for benefit funding.
Since separate account liabilities are fully funded by cash flows from the separate account assets which are recognized at estimated fair value as described in the section “— Recurring Fair Value Measurements,” the value of those assets approximates the estimated fair value of the related separate account liabilities. The valuation techniques and inputs for separate account liabilities are similar to those described for separate account assets.
313
11. Goodwill
Goodwill is the excess of cost over the estimated fair value of net assets acquired. Goodwill is not amortized but is tested for impairment at least annually or more frequently if events or circumstances, such as adverse changes in the business climate, indicate that there may be justification for conducting an interim test. The goodwill impairment process requires a comparison of the estimated fair value of a reporting unit to its carrying value. The Company tests goodwill for impairment by either performing a qualitative assessment or a two-step quantitative test. The qualitative assessment is an assessment of historical information and relevant events and circumstances to determine whether it is more likely than not that the fair value of a reporting unit is less than its carrying amount, including goodwill. The Company may elect not to perform the qualitative assessment for some or all of its reporting units and perform a two-step quantitative impairment test. In performing the two-step quantitative impairment test, the Company may determine the fair values of its reporting units by applying a market multiple, discounted cash flow, and/or an actuarial based valuation approach.
The market multiple valuation approach utilizes market multiples of companies with similar businesses and the projected operating earnings of the reporting unit. The discounted cash flow valuation approach requires judgments about revenues, operating earnings projections, capital market assumptions and discount rates. The actuarial based approaches such as embedded value or cash flow testing estimate the net worth of the reporting unit and the value of existing and new business. The actuarial based approaches require judgments and assumptions about level of economic capital required to support the mix of business, long-term growth rates, the account value of in-force business, projections of new and renewal business, as well as margins on such business, the level of interest rates, credit spreads, equity market levels, and the discount rate that the Company believes is appropriate for the respective reporting unit.
When testing goodwill for impairment, the Company also considers its market capitalization in relation to the aggregate estimated fair value of its reporting units. The Company applies significant judgment when determining the estimated fair value of the Company’s reporting units and when assessing the relationship of market capitalization to the aggregate estimated fair value of its reporting units.
The valuation methodologies utilized are subject to key judgments and assumptions that are sensitive to change. Estimates of fair value are inherently uncertain and represent only management’s reasonable expectation regarding future developments. These estimates and the judgments and assumptions upon which the estimates are based will, in all likelihood, differ in some respects from actual future results. Declines in the estimated fair value of the Company’s reporting units could result in goodwill impairments in future periods which could materially adversely affect the Company’s results of operations or financial position.
In anticipation of the Separation, in the third quarter of 2016, MetLife reorganized its businesses into six segments: U.S.; Asia; Latin America; EMEA; MetLife Holdings; and Brighthouse Financial, as well as Corporate & Other. In connection with the reorganization, MetLife realigned certain businesses among its existing and new segments. As a result, the Company reallocated goodwill according to the relative fair values of the realigned businesses and reporting units.
Based on a quantitative analysis performed in the third quarter of 2016 for the life and run-off reporting units within the Brighthouse Financial segment, the Company concluded that the carrying values of these reporting units exceeded their estimated fair values, indicating a potential for goodwill impairment. Accordingly, the Company performed Step 2 of the goodwill impairment process for each of the reporting units, which compares the implied estimated fair value of the reporting unit’s goodwill with its carrying value. This analysis indicated that the goodwill associated with these reporting units was not recoverable. As a result, the Company recorded a non-cash charge in the aggregate of
$260 million
(
$223 million
, net of income tax) for the impairment of the entire goodwill balance, which is reported in goodwill impairment on the consolidated statements of operations for the year ended
December 31, 2016
.
The Company performed its annual goodwill impairment tests of all other reporting units using a qualitative assessment and/or quantitative assessments under the market multiple, discounted cash flow and/or actuarial based valuation approaches and concluded that the estimated fair values of all such reporting units were in excess of their carrying values and, therefore, goodwill was not impaired.
314
MetLife, Inc.
Notes to the Consolidated Financial Statements — (continued)
11. Goodwill (continued)
Information regarding goodwill by segment, as well as Corporate & Other, was as follows:
|
U.S.
|
Asia (1)
|
Latin
America
|
EMEA
|
MetLife
Holdings
|
Brighthouse
Financial
|
Corporate
& Other
|
Total
|
||||||||||||||||||||||||
|
(In millions)
|
|||||||||||||||||||||||||||||||
|
Balance at January 1, 2014
|
|||||||||||||||||||||||||||||||
|
Goodwill
|
$
|
1,451
|
|
$
|
4,898
|
|
$
|
1,588
|
|
$
|
1,356
|
|
$
|
1,567
|
|
$
|
1,508
|
|
$
|
42
|
|
$
|
12,410
|
|
|||||||
|
Accumulated impairment (2)
|
—
|
|
—
|
|
—
|
|
—
|
|
(680
|
)
|
(1,188
|
)
|
—
|
|
(1,868
|
)
|
|||||||||||||||
|
Total goodwill, net
|
1,451
|
|
4,898
|
|
1,588
|
|
1,356
|
|
887
|
|
320
|
|
42
|
|
10,542
|
|
|||||||||||||||
|
Dispositions (3)
|
—
|
|
(3
|
)
|
—
|
|
(7
|
)
|
—
|
|
(60
|
)
|
—
|
|
(70
|
)
|
|||||||||||||||
|
Effect of foreign currency translation and other
|
—
|
|
(280
|
)
|
(203
|
)
|
(117
|
)
|
—
|
|
—
|
|
—
|
|
(600
|
)
|
|||||||||||||||
|
Balance at December 31, 2014
|
|
||||||||||||||||||||||||||||||
|
Goodwill
|
1,451
|
|
4,615
|
|
1,385
|
|
1,232
|
|
1,567
|
|
1,448
|
|
42
|
|
11,740
|
|
|||||||||||||||
|
Accumulated impairment
|
—
|
|
—
|
|
—
|
|
—
|
|
(680
|
)
|
(1,188
|
)
|
—
|
|
(1,868
|
)
|
|||||||||||||||
|
Total goodwill, net
|
1,451
|
|
4,615
|
|
1,385
|
|
1,232
|
|
887
|
|
260
|
|
42
|
|
9,872
|
|
|||||||||||||||
|
Effect of foreign currency translation and other
|
—
|
|
(107
|
)
|
(199
|
)
|
(89
|
)
|
—
|
|
—
|
|
—
|
|
(395
|
)
|
|||||||||||||||
|
Balance at December 31, 2015
|
|
||||||||||||||||||||||||||||||
|
Goodwill
|
1,451
|
|
4,508
|
|
1,186
|
|
1,143
|
|
1,567
|
|
1,448
|
|
42
|
|
11,345
|
|
|||||||||||||||
|
Accumulated impairment
|
—
|
|
—
|
|
—
|
|
—
|
|
(680
|
)
|
(1,188
|
)
|
—
|
|
(1,868
|
)
|
|||||||||||||||
|
Total goodwill, net
|
1,451
|
|
4,508
|
|
1,186
|
|
1,143
|
|
887
|
|
260
|
|
42
|
|
9,477
|
|
|||||||||||||||
|
Dispositions (4)
|
—
|
|
—
|
|
—
|
|
—
|
|
—
|
|
—
|
|
(42
|
)
|
(42
|
)
|
|||||||||||||||
|
Impairment (5)
|
—
|
|
—
|
|
—
|
|
—
|
|
—
|
|
(260
|
)
|
—
|
|
(260
|
)
|
|||||||||||||||
|
Effect of foreign currency translation and other
|
—
|
|
88
|
|
40
|
|
(83
|
)
|
—
|
|
—
|
|
—
|
|
45
|
|
|||||||||||||||
|
Balance at December 31, 2016
|
|
|
|||||||||||||||||||||||||||||
|
Goodwill
|
1,451
|
|
4,596
|
|
1,226
|
|
1,060
|
|
1,567
|
|
1,448
|
|
—
|
|
11,348
|
|
|||||||||||||||
|
Accumulated impairment
|
—
|
|
—
|
|
—
|
|
—
|
|
(680
|
)
|
(1,448
|
)
|
—
|
|
(2,128
|
)
|
|||||||||||||||
|
Total goodwill, net
|
$
|
1,451
|
|
$
|
4,596
|
|
$
|
1,226
|
|
$
|
1,060
|
|
$
|
887
|
|
$
|
—
|
|
$
|
—
|
|
$
|
9,220
|
|
|||||||
__________________
|
(1)
|
Includes goodwill of
$4.4 billion
,
$4.3 billion
and
$4.4 billion
from the Japan operations at December 31, 2016, 2015 and 2014, respectively.
|
|
(2)
|
The
$680 million
and
$1.2 billion
accumulated impairment in the MetLife Holdings and Brighthouse Financial segments, respectively, relates to the retail annuities business, which was impaired in 2012 and includes the allocated goodwill from Corporate & Other. This accumulated impairment balance was allocated between the two segments based on estimated fair value.
|
|
(3)
|
In connection with the sale of MAL, goodwill in the run-off reporting unit within the Brighthouse Financial segment was reduced by
$60 million
during the year ended
December 31, 2014
. See
Note 3
.
|
|
(4)
|
In connection with the U.S. Retail Advisor Force Divestiture, goodwill in Corporate & Other was reduced by
$42 million
for the year ended
December 31, 2016
. See
Note 3
.
|
|
(5)
|
For the year ended December 31, 2016, of the
$260 million
goodwill impairment for the Brighthouse Financial segment,
$147 million
(with no income tax impact) was reflected on MetLife, Inc.
|
315
Long-term and short-term debt outstanding was as follows:
|
|
December 31,
|
|||||||||||||||||||||||||||||||||||||||||
|
Interest Rates (1)
|
2016
|
2015
|
||||||||||||||||||||||||||||||||||||||||
|
Range
|
Weighted
Average |
Maturity
|
Face
Value
|
Unamortized
Discount
|
Unamortized
Issuance
Costs
|
Carrying
Value
|
Face
Value
|
Unamortized
Discount
|
Unamortized
Issuance
Costs
|
Carrying
Value (2)
|
||||||||||||||||||||||||||||||||
|
(In millions)
|
||||||||||||||||||||||||||||||||||||||||||
|
Senior notes
|
1.76
|
%
|
-
|
7.72%
|
4.94%
|
2017
|
-
|
2046
|
$
|
15,597
|
|
$
|
(30
|
)
|
$
|
(62
|
)
|
$
|
15,505
|
|
$
|
17,025
|
|
$
|
(31
|
)
|
$
|
(67
|
)
|
$
|
16,927
|
|
||||||||||
|
Surplus notes
|
7.63
|
%
|
-
|
7.88%
|
7.79%
|
2024
|
-
|
2025
|
507
|
|
(4
|
)
|
(2
|
)
|
501
|
|
507
|
|
(5
|
)
|
(2
|
)
|
500
|
|
||||||||||||||||||
|
Other notes
|
1.62
|
%
|
-
|
7.03%
|
4.47%
|
2017
|
-
|
2030
|
457
|
|
—
|
|
(4
|
)
|
453
|
|
458
|
|
—
|
|
(5
|
)
|
453
|
|
||||||||||||||||||
|
Capital lease obligations
|
8
|
|
—
|
|
—
|
|
8
|
|
9
|
|
—
|
|
—
|
|
9
|
|
||||||||||||||||||||||||||
|
Total long-term debt (3)
|
16,569
|
|
(34
|
)
|
(68
|
)
|
16,467
|
|
17,999
|
|
(36
|
)
|
(74
|
)
|
17,889
|
|
||||||||||||||||||||||||||
|
Total short-term debt
|
242
|
|
—
|
|
—
|
|
242
|
|
100
|
|
—
|
|
—
|
|
100
|
|
||||||||||||||||||||||||||
|
Total
|
$
|
16,811
|
|
$
|
(34
|
)
|
$
|
(68
|
)
|
$
|
16,709
|
|
$
|
18,099
|
|
$
|
(36
|
)
|
$
|
(74
|
)
|
$
|
17,989
|
|
||||||||||||||||||
__________________
|
(1)
|
Range of interest rates and weighted average interest rates are for the year ended December 31,
2016
.
|
|
(2)
|
Net of
$74 million
of unamortized issuance costs, which were reported in other assets at December 31, 2015.
|
|
(3)
|
Excludes
$35 million
and
$60 million
of long-term debt relating to CSEs — FVO at December 31,
2016
and
2015
, respectively. See Note
10
.
|
The aggregate maturities of long-term debt at December 31,
2016
for the next five years and thereafter are
$1.0 billion
in 2017,
$1.0 billion
in 2018,
$1.0 billion
in 2019,
$840 million
in 2020,
$1.0 billion
in 2021 and
$11.5 billion
thereafter.
Capital lease obligations are collateralized and rank highest in priority, followed by unsecured senior notes and other notes, followed by subordinated debt which consists of junior subordinated debt securities (see Note
14
). Payments of interest and principal on the Company’s surplus notes, which are subordinate to all other obligations at the operating company level and are senior to obligations at MetLife, Inc., may be made only with the prior approval of the insurance department of the state of domicile. Collateral financing arrangements (see Note
13
) are supported by either surplus notes of subsidiaries or financing arrangements with MetLife, Inc. and, accordingly, have priority consistent with other such obligations.
Certain of the Company’s debt instruments and committed facilities, as well as its credit facility, contain various administrative, reporting, legal and financial covenants. The Company believes it was in compliance with all applicable covenants at December 31,
2016
.
Senior Notes — Senior Debt Securities Underlying Common Equity Units
In November 2010, in connection with the financing of the acquisition of American Life Insurance Company (“American Life”) and Delaware American Life Insurance Company (“DelAm”), (collectively “ALICO”), MetLife, Inc. issued to ALICO Holdings LLC (now AM Holdings LLC (“AM Holdings”))
$3.0 billion
(estimated fair value of
$3.0 billion
) of three series of debt securities (the “Series C Debt Securities,” the “Series D Debt Securities,” and the “Series E Debt Securities,” collectively, the “Debt Securities”), which constituted a part of the common equity units more fully described in
Note 15
.
In October 2014, MetLife, Inc. closed the successful remarketing of senior debt securities underlying the common equity units. The Series E Debt Securities were remarketed in September and October 2014 as
1.903%
Series E senior debt securities Tranche 1 due
December 2017
and
4.721%
Series E senior debt securities Tranche 2 due
December 2044
. The Series D Debt Securities and the Series C Debt Securities were previously remarketed in 2013 and 2012, respectively. MetLife, Inc. did not receive any proceeds from the remarketings.
316
MetLife, Inc.
Notes to the Consolidated Financial Statements — (continued)
12. Long-term and Short-term Debt (continued)
Senior Notes — Other Issuances and Repayment
In November 2015, MetLife, Inc. issued
$500 million
of senior notes due in
November 2025
which bear interest at a fixed rate of
3.60%
, payable semi-annually. Also in November 2015, MetLife, Inc. issued
$750 million
of senior notes due in
May 2046
which bear interest at a fixed rate of
4.60%
, payable semi-annually. In connection with the issuances, MetLife, Inc. incurred
$10 million
of related costs which have been capitalized and are being amortized over the terms of the senior notes.
In March 2015, MetLife, Inc. issued
$500 million
of senior notes due in
March 2025
which bear interest at a fixed rate of
3.00%
, payable semi-annually. Also in March 2015, MetLife, Inc. issued
$1.0 billion
of senior notes due in
March 2045
which bear interest at a fixed rate of
4.05%
, payable semi-annually. In connection with the issuances, MetLife, Inc. incurred
$12 million
of related costs which have been capitalized and are being amortized over the terms of the senior notes.
In May 2014, MetLife, Inc. redeemed
$200 million
aggregate principal amount of its
5.875%
senior notes due
November 2033
at par.
In April 2014, MetLife, Inc. issued
$1.0 billion
of senior notes due
April 2024
which bear interest at a fixed rate of
3.60%
, payable semi-annually. In connection with the issuance, MetLife, Inc. incurred
$5 million
of related costs which have been capitalized and are being amortized over the term of the senior notes.
Other Notes
In December 2015, MetLife Private Equity Holdings, LLC (“MPEH”), a wholly-owned indirect investment subsidiary of MLIC, entered into a five-year credit agreement (the “MPEH Credit Agreement”) and borrowed
$350 million
under term loans that mature in
December 2020
. The loans bear interest at a variable rate of
three-month LIBOR plus 3.70%
, payable quarterly. In connection with the borrowing,
$6 million
of costs were incurred which have been capitalized and are being amortized over the term of the loans. Additionally, the MPEH Credit Agreement provides for MPEH to borrow up to
$100 million
on a revolving basis at a variable rate of
three-month LIBOR plus 3.70%
, payable quarterly. There were no revolving loans outstanding under the MPEH Credit Agreement at both December 31, 2015 and 2016. Term loans and revolving loans borrowed under the MPEH Credit Agreement are non-recourse to MLIC and MetLife, Inc.
Short-term Debt
Short-term debt with maturities of one year or less was as follows:
|
December 31,
|
||||||||
|
2016
|
2015
|
|||||||
|
(Dollars in millions)
|
||||||||
|
Commercial paper
|
$
|
100
|
|
$
|
100
|
|
||
|
Short-term borrowings
|
142
|
|
—
|
|
||||
|
Total short-term debt
|
$
|
242
|
|
$
|
100
|
|
||
|
Average daily balance
|
$
|
135
|
|
$
|
100
|
|
||
|
Average days outstanding
|
21 days
|
|
68 days
|
|
||||
During the years ended December 31,
2016
,
2015
and
2014
, the weighted average interest rate on short-term debt was
1.32%
,
0.15%
and
0.10%
, respectively.
Interest Expense
Interest expense included in other expenses was
$877 million
,
$894 million
and
$874 million
for the years ended December 31,
2016
,
2015
and
2014
, respectively. Such amounts do not include interest expense on long-term debt related to CSEs — FVO, collateral financing arrangements, or junior subordinated debt securities. See Notes
8
,
13
and
14
.
317
MetLife, Inc.
Notes to the Consolidated Financial Statements — (continued)
12. Long-term and Short-term Debt (continued)
Credit and Committed Facilities
At December 31,
2016
, the Company maintained a
$4.0 billion
unsecured revolving credit facility and certain committed facilities aggregating
$11.5 billion
.
As discussed further below, in December 2016, Brighthouse entered into a
$3.0 billion
three-year senior unsecured delayed draw term loan agreement and a
$2.0 billion
five-year senior unsecured revolving credit facility (collectively, the “Brighthouse Credit Facilities”).
When drawn upon, these facilities bear interest at varying rates in accordance with the respective agreements.
Credit Facilities
The Company’s unsecured revolving credit facility is used for general corporate purposes, to support the borrowers’ commercial paper programs and for the issuance of letters of credit. Total fees associated with this unsecured credit facility were
$15 million
,
$13 million
and
$12 million
for the years ended December 31,
2016
,
2015
and
2014
, respectively, and were included in other expenses. Information on the unsecured credit facility at December 31,
2016
was as follows:
|
Borrower(s)
|
Expiration
|
Maximum
Capacity |
Letters of
Credit Issued |
Drawdowns
|
Unused
Commitments |
||||||||||||||
|
(In millions)
|
|||||||||||||||||||
|
MetLife, Inc. and MetLife Funding, Inc.
|
May 2019 (1), (2)
|
$
|
4,000
|
|
(1) (2)
|
$
|
730
|
|
$
|
—
|
|
$
|
3,270
|
|
|||||
__________________
|
(1)
|
All borrowings under this unsecured revolving credit facility must be repaid by
May 30, 2019
, except that letters of credit outstanding upon termination may remain outstanding until May 30, 2020.
|
|
(2)
|
In December 2016, MetLife, Inc. and MetLife Funding, Inc. entered into an agreement to amend their existing
$4.0 billion
unsecured revolving credit facility, which provides, among other things, that the facility will be amended and restated upon the completion of the proposed Separation and the satisfaction of certain other conditions. As amended and restated, the unsecured revolving credit facility will provide for borrowings and the issuance of letters of credit in an aggregate amount of up to
$3.0 billion
. All borrowings under this amended unsecured revolving credit facility must be repaid by
December 20, 2021
, except that letters of credit outstanding upon termination may remain outstanding until
December 20, 2022
.
|
Brighthouse Credit Facilities
In December 2016, Brighthouse entered into a
$3.0 billion
three-year senior unsecured delayed draw term loan agreement and a
$2.0 billion
five-year senior unsecured revolving credit facility. Brighthouse incurred costs of
$16 million
related to the Brighthouse Credit Facilities, which have been capitalized and included in other assets. Borrowings under the term loan agreement may be used for general corporate purposes, including payment of a portion of the dividends to be paid by Brighthouse Financial, Inc. to MetLife, Inc. in connection with the Separation. The term loan agreement provides that borrowings may be made prior to the Separation. Amounts under the term loan agreement are available after the completion of the contribution by MetLife, Inc. of entities to Brighthouse Intermediate Company (“Initial Contribution”) and the completion of the contribution by MetLife, Inc. of Brighthouse Intermediate Company to Brighthouse. Alternatively, after the Initial Contribution, Brighthouse may draw down amounts from available commitments provided that Brighthouse Intermediate Company provides a guaranty of repayment of such obligations.
Borrowings and letters of credit under the revolving credit agreement may be used for general corporate purposes, including payment of a portion of the dividends to be paid by Brighthouse to MetLife, Inc. in connection with the Separation. Borrowings and issuances of letters of credit may commence after completion of the Separation, and shortly prior to the Separation if certain conditions are satisfied.
Both the term loan agreement and the revolving credit facility contain certain administrative, reporting, legal and financial covenants, including requirements to maintain a specified minimum consolidated net worth and to maintain a ratio of indebtedness to total capitalization not in excess of a specified percentage, and limitations on the dollar amount of indebtedness that may be incurred by subsidiaries of Brighthouse, which could restrict the operations and use of funds of Brighthouse.
318
MetLife, Inc.
Notes to the Consolidated Financial Statements — (continued)
12. Long-term and Short-term Debt (continued)
Total fees associated with the Brighthouse Credit Facilities were
$1 million
for the year ended December 31, 2016 and were included in other expenses.
There were no outstanding borrowings under the Brighthouse Credit Facilities as of December 31, 2016.
Committed Facilities
The committed facilities are used for collateral for certain of the Company’s affiliated reinsurance liabilities. Total fees associated with these committed facilities were
$96 million
,
$90 million
and
$95 million
for the years ended December 31,
2016
,
2015
and
2014
, respectively, and were included in other expenses. Information on these committed facilities at December 31,
2016
was as follows:
|
Account Party/Borrower(s)
|
Expiration
|
Maximum Capacity
|
Letters of
Credit Issued |
Drawdowns
|
Unused
Commitments |
|||||||||||||
|
(In millions)
|
||||||||||||||||||
|
MetLife, Inc.
|
June 2018 (1)
|
$
|
425
|
|
$
|
425
|
|
$
|
—
|
|
$
|
—
|
|
|||||
|
MetLife Reinsurance Company of Vermont and MetLife, Inc.
|
December 2024 (2), (3)
|
400
|
|
355
|
|
—
|
|
45
|
|
|||||||||
|
MetLife Reinsurance Company of South Carolina and MetLife, Inc.
|
June 2037 (4)
|
3,500
|
|
—
|
|
2,797
|
|
703
|
|
|||||||||
|
MetLife Reinsurance Company of Vermont and MetLife, Inc.
|
December 2037 (2), (5)
|
2,896
|
|
2,261
|
|
—
|
|
635
|
|
|||||||||
|
MetLife Reinsurance Company of Vermont and MetLife, Inc.
|
September 2038 (6)
|
4,250
|
|
3,000
|
|
—
|
|
1,250
|
|
|||||||||
|
Total
|
$
|
11,471
|
|
$
|
6,041
|
|
$
|
2,797
|
|
$
|
2,633
|
|
||||||
__________________
|
(1)
|
Capacity at December 31, 2016 of
$425 million
decreases in June 2017, March 2018 and June 2018 to
$395 million
,
$200 million
and
$0
, respectively.
|
|
(2)
|
MetLife, Inc. is a guarantor under the applicable facility.
|
|
(3)
|
Capacity at December 31, 2016 of
$400 million
decreases in June 2022, December 2022, June 2023, December 2023 and December 2024 to
$380 million
,
$360 million
,
$310 million
,
$260 million
and
$0
, respectively.
|
|
(4)
|
Capacity at December 31, 2016 of
$3.5 billion
decreases to
$0
upon maturity in June 2037. The drawdown on this facility is associated with a collateral financing arrangement described more fully in Note
13
.
|
|
(5)
|
Capacity at December 31, 2016 of
$2.4 billion
increases periodically to a maximum of
$2.9 billion
in 2024, decreases periodically commencing in 2025 to
$2.0 billion
in 2037, and decreases to
$0
after maturity in December 2037. Unused commitment of
$635 million
is based on maximum capacity.
|
|
(6)
|
Capacity at December 31, 2016 of
$4.3 billion
decreases periodically commencing in April 2028 to
$3.1 billion
in September 2038, and decreases to
$0
upon maturity in September 2038. Unused commitment of
$1.3 billion
is based on maximum capacity. MetLife Reinsurance Company of Vermont (“MRV”) is responsible only for reimbursement obligations relating to the
$3.0 billion
of letters of credit outstanding as of
December 31, 2016
. MetLife, Inc. is not responsible for those reimbursement obligations.
|
In addition to the above committed facilities, see also “— Other Notes” for information about the undrawn line of credit facility in the amount of
$100 million
.
319
13. Collateral Financing Arrangements
Associated with the Closed Block
Information related to the collateral financing arrangement associated with the closed block was as follows at:
|
December 31,
|
||||||||
|
2016
|
2015
|
|||||||
|
(In millions)
|
||||||||
|
Surplus notes outstanding (1)
|
$
|
1,274
|
|
$
|
1,342
|
|
||
|
Receivable from unaffiliated financial institution (1)
|
$
|
166
|
|
$
|
174
|
|
||
|
Pledged collateral (2)
|
$
|
160
|
|
$
|
67
|
|
||
|
Assets held in trust (2)
|
$
|
1,211
|
|
$
|
1,181
|
|
||
__________________
|
(1)
|
Carrying value.
|
|
(2)
|
Estimated fair value.
|
Interest expense on the collateral financing arrangement was
$24 million
,
$20 million
and
$19 million
for the years ended December 31,
2016
,
2015
and
2014
, respectively, which is included in other expenses.
In December 2007, MLIC reinsured a portion of its closed block liabilities to MRC, a wholly-owned subsidiary of MetLife, Inc. In connection with this transaction, MRC issued, to investors placed by an unaffiliated financial institution,
$2.5 billion
in aggregate principal amount of
35
-year surplus notes to provide statutory reserve support for the assumed closed block liabilities. Interest on the surplus notes accrues at an annual rate of three-month LIBOR plus
0.55%
, payable quarterly. The ability of MRC to make interest and principal payments on the surplus notes is contingent upon South Carolina regulatory approval.
Simultaneously with the issuance of the surplus notes, MetLife, Inc. entered into an agreement with the unaffiliated financial institution, under which MetLife, Inc. is entitled to the interest paid by MRC on the surplus notes of three-month LIBOR plus
0.55%
in exchange for the payment of three-month LIBOR plus
1.12%
, payable quarterly on such amount as adjusted, as described below. MetLife, Inc. may also be required to pledge collateral or make payments to the unaffiliated financial institution related to any decline in the estimated fair value of the surplus notes. Any such payments are accounted for as a receivable and included in other assets on the Company’s consolidated balance sheets and do not reduce the principal amount outstanding of the surplus notes. Such payments, however, reduce the amount of interest payments due from MetLife, Inc. under the agreement. Any payment received from the unaffiliated financial institution reduces the receivable by an amount equal to such payment and also increases the amount of interest payments due from MetLife, Inc. under the agreement. In addition, the unaffiliated financial institution may be required to pledge collateral to MetLife, Inc. related to any increase in the estimated fair value of the surplus notes. MetLife, Inc. may also be required to make a payment to the unaffiliated financial institution in connection with any early termination of this agreement.
During 2016 and 2015, following regulatory approval, MRC repurchased
$68 million
and
$57 million
, respectively, in aggregate principal amount of the surplus notes. Cumulatively, since December 2007, MRC repurchased
$1.2 billion
in aggregate principal amount of the surplus notes as of December 31, 2016. Payments made by the Company in 2016 and 2015 associated with the repurchases were exclusive of accrued interest on the surplus notes. In connection with the repurchases during 2016 and 2015, the Company received payments in the aggregate amount of
$8 million
each year from the unaffiliated financial institution, which reduced the amount receivable from the unaffiliated financial institution by
$8 million
each year. No other payments related to an increase or decrease in the estimated fair value of the surplus notes were made by MetLife, Inc. or received from the unaffiliated financial institution during
2016
,
2015
or
2014
.
A majority of the proceeds from the offering of the surplus notes was placed in a trust, which is consolidated by the Company, to support MRC’s statutory obligations associated with the assumed closed block liabilities. During the years ended
December 31,
2016
,
2015
and
2014
, MRC transferred
$1 million
,
$30 million
and
$467 million
, respectively, out of the trust to its general account. The assets are principally invested in fixed maturity securities and are presented as such within the Company’s consolidated balance sheets, with the related income included within net investment income on the Company’s consolidated statements of operations.
320
MetLife, Inc.
Notes to the Consolidated Financial Statements — (continued)
13. Collateral Financing Arrangements (continued)
Associated with Secondary Guarantees
Information related to the collateral financing arrangement associated with the secondary guarantees was as follows at:
|
December 31,
|
||||||||
|
2016
|
2015
|
|||||||
|
(In millions)
|
||||||||
|
Liability outstanding (1)
|
$
|
2,797
|
|
$
|
2,797
|
|
||
|
Assets held in trust (2)
|
$
|
3,422
|
|
$
|
3,374
|
|
||
__________________
|
(1)
|
Carrying value.
|
|
(2)
|
Estimated fair value.
|
Interest expense on the collateral financing arrangement was
$39 million
,
$28 million
and
$27 million
for the years ended December 31,
2016
,
2015
and
2014
, respectively, which is included in other expenses.
In May 2007, MetLife, Inc. and MRSC, a wholly-owned subsidiary of MetLife, Inc., entered into a
30
-year collateral financing arrangement with an unaffiliated financial institution that provides up to
$3.5 billion
of statutory reserve support for MRSC associated with reinsurance obligations under intercompany reinsurance agreements. Such statutory reserves are associated with ULSG and are required under U.S. Valuation of Life Policies Model Regulation (commonly referred to as Regulation A-XXX). Proceeds from the collateral financing arrangement were placed in trusts to support MRSC’s statutory obligations associated with the reinsurance of secondary guarantees. The trusts are VIEs which are consolidated by the Company. The unaffiliated financial institution is entitled to the return on the investment portfolio held by the trusts. The assets are principally invested in fixed maturity securities and are presented as such within the Company’s balance sheets, with the related income included within net investment income on the Company’s statements of operations. The collateral financing arrangement may be extended by agreement of MetLife, Inc. and the unaffiliated financial institution on each anniversary of the closing.
In connection with the collateral financing arrangement, MetLife, Inc. entered into an agreement with the same unaffiliated financial institution under which MetLife, Inc. is entitled to the return on the investment portfolio held by the trusts established in connection with this collateral financing arrangement in exchange for the payment of a stated rate of return to the unaffiliated financial institution of three-month LIBOR plus
0.70%
, payable quarterly. MetLife, Inc. may also be required to make payments to the unaffiliated financial institution, for deposit into the trusts, related to any decline in the estimated fair value of the assets held by the trusts, as well as amounts outstanding upon maturity or early termination of the collateral financing arrangement. During
2016
,
2015
and
2014
,
no
payments were made or received by MetLife, Inc. Cumulatively, since May 2007, MetLife, Inc. has contributed a total of
$680 million
as a result of declines in the estimated fair value of the assets in the trusts, all of which was deposited into the trusts as of December 31, 2016.
In addition, MetLife, Inc. may be required to pledge collateral to the unaffiliated financial institution under this agreement. At both December 31,
2016
and
2015
, MetLife, Inc. had pledged
no
collateral under this agreement.
321
14. Junior Subordinated Debt Securities
Outstanding Junior Subordinated Debt Securities
Outstanding junior subordinated debt securities and exchangeable surplus trust securities which are exchangeable for junior subordinated debt securities prior to redemption or repayment, were as follows:
|
December 31,
|
|||||||||||||||||||||||||||||||||||||||||||
|
2016
|
2015
|
||||||||||||||||||||||||||||||||||||||||||
|
Issuer
|
Issue
Date
|
Interest
Rate (1)
|
Scheduled
Redemption
Date
|
Interest Rate
Subsequent to
Scheduled
Redemption
Date (2)
|
Final
Maturity
|
Face
Value
|
Unamortized
Discount
|
Unamortized
Issuance
Costs
|
Carrying
Value
|
Face
Value |
Unamortized
Discount |
Unamortized
Issuance Costs |
Carrying
Value (3)
|
||||||||||||||||||||||||||||||
|
(In millions)
|
|||||||||||||||||||||||||||||||||||||||||||
|
MetLife, Inc.
|
July 2009
|
10.750
|
%
|
August 2039
|
LIBOR + 7.548%
|
August 2069
|
$
|
500
|
|
$
|
—
|
|
$
|
(4
|
)
|
$
|
496
|
|
$
|
500
|
|
$
|
—
|
|
$
|
(4
|
)
|
$
|
496
|
|
|||||||||||||
|
MetLife Capital Trust X (4), (5)
|
April 2008
|
9.250
|
%
|
April 2038
|
LIBOR + 5.540%
|
April 2068
|
750
|
|
—
|
|
(6
|
)
|
744
|
|
750
|
|
—
|
|
(6
|
)
|
744
|
|
|||||||||||||||||||||
|
MetLife Capital Trust IV (4)
|
December 2007
|
7.875
|
%
|
December 2037
|
LIBOR + 3.960%
|
December 2067
|
700
|
|
(4
|
)
|
(6
|
)
|
690
|
|
700
|
|
(4
|
)
|
(7
|
)
|
689
|
|
|||||||||||||||||||||
|
MetLife, Inc.
|
December 2006
|
6.400
|
%
|
December 2036
|
LIBOR + 2.205%
|
December 2066
|
1,250
|
|
(2
|
)
|
(9
|
)
|
1,239
|
|
1,250
|
|
(2
|
)
|
(9
|
)
|
1,239
|
|
|||||||||||||||||||||
|
$
|
3,200
|
|
$
|
(6
|
)
|
$
|
(25
|
)
|
$
|
3,169
|
|
$
|
3,200
|
|
$
|
(6
|
)
|
$
|
(26
|
)
|
$
|
3,168
|
|
||||||||||||||||||||
_________________
|
(1)
|
Prior to the scheduled redemption date, interest is payable semiannually in arrears.
|
|
(2)
|
In the event the securities are not redeemed on or before the scheduled redemption date, interest will accrue after such date at an annual rate of three-month LIBOR plus the indicated margin, payable quarterly in arrears.
|
|
(3)
|
Net of
$26 million
of unamortized issuance costs, which were reported in other assets at December 31, 2015.
|
|
(4)
|
MetLife Capital Trust X and MetLife Capital Trust IV are VIEs which are consolidated on the financial statements of the Company. The securities issued by these entities are exchangeable surplus trust securities, which are exchangeable for a like amount of MetLife, Inc.’s junior subordinated debt securities on the scheduled redemption date; mandatorily under certain circumstances, and at any time upon MetLife, Inc. exercising its option to redeem the securities.
|
|
(5)
|
See
Note 23
for the information regarding the Junior Subordinated Debt Securities exchange transaction in February 2017.
|
322
MetLife, Inc.
Notes to the Consolidated Financial Statements — (continued)
14. Junior Subordinated Debt Securities (continued)
In connection with each of the securities described above, MetLife, Inc. may redeem or may cause the redemption of the securities (i) in whole or in part, at any time on or after the date five years prior to the scheduled redemption date at their principal amount plus accrued and unpaid interest to, but excluding, the date of redemption, or (ii) in certain circumstances, in whole or in part, prior to the date five years prior to the scheduled redemption date at their principal amount plus accrued and unpaid interest to, but excluding, the date of redemption or, if greater, a make-whole price. MetLife, Inc. also has the right to, and in certain circumstances the requirement to, defer interest payments on the securities for a period up to
10 years
. Interest compounds during such periods of deferral. If interest is deferred for more than five consecutive years, MetLife, Inc. is required to use proceeds from the sale of its common stock or warrants on common stock to satisfy this interest payment obligation. In connection with each of the securities described above, MetLife, Inc. entered into a separate replacement capital covenant (“RCC”). As part of each RCC, MetLife, Inc. agreed that it will not repay, redeem, or purchase the securities on or before a date 10 years prior to the final maturity date of each issuance, unless, subject to certain limitations, it has received cash proceeds during a specified period from the sale of specified replacement securities. Each RCC will terminate upon the occurrence of certain events, including an acceleration of the applicable securities due to the occurrence of an event of default. The RCCs are not intended for the benefit of holders of the securities and may not be enforced by them. Rather, each RCC is for the benefit of the holders of a designated series of MetLife, Inc.’s other indebtedness (the “Covered Debt”). Initially, the Covered Debt for each of the securities described above was MetLife, Inc.’s
5.700%
senior notes due
2035
(the “5.700% Senior Notes”). As a result of the issuance of MetLife, Inc.’s
10.750%
Fixed-to-Floating Rate Junior Subordinated Debentures due
2069
(the “10.750% JSDs”), the 10.750% JSDs became the Covered Debt with respect to, and in accordance with, the terms of the RCC relating to MetLife, Inc.’s
6.40%
Fixed-to-Floating Rate Junior Subordinated Debentures due
2066
. The 5.700% Senior Notes continue to be the Covered Debt with respect to, and in accordance with, the terms of the RCCs relating to each of MetLife Capital Trust IV’s
7.875%
Fixed-to-Floating Rate Exchangeable Surplus Trust Securities, MetLife Capital Trust X’s
9.250%
Fixed-to-Floating Rate Exchangeable Surplus Trust Securities and the 10.750% JSDs. MetLife, Inc. also entered into a replacement capital obligation which will commence during the six month period prior to the scheduled redemption date of each of the securities described above and under which MetLife, Inc. must use reasonable commercial efforts to raise replacement capital to permit repayment of the securities through the issuance of certain qualifying capital securities.
Interest expense on outstanding junior subordinated debt securities was
$258 million
for each of the years ended December 31,
2016
,
2015
and
2014
, which is included in other expenses.
15. Common Equity Units
In connection with the financing of the acquisition of ALICO in
November 2010
, MetLife, Inc. issued to AM Holdings
40 million
common equity units with an aggregate stated amount at issuance of
$3.0 billion
and an estimated fair value of
$3.2 billion
. Each common equity unit had an initial stated amount of
$75
per unit and initially consisted of: (i) three purchase contracts (the Series C Purchase Contracts, the Series D Purchase Contracts and the Series E Purchase Contracts and, together, the “Purchase Contracts”), obligating the holder to purchase, on a subsequent settlement date, a variable number of shares of MetLife, Inc. common stock, par value
$0.01
per share, for a purchase price of
$25
(
$75
in the aggregate); and (ii) a 1/40 undivided beneficial ownership interest in each of three series of Debt Securities issued by MetLife, Inc., each series of Debt Securities having an aggregate principal amount of
$1.0 billion
. On March 8, 2011, AM Holdings sold, in a public offering, all the common equity units it received as consideration from MetLife in connection with the acquisition of ALICO.
As discussed in
Note 12
, in October 2014, September 2013 and October 2012, MetLife, Inc. closed the successful remarketings of senior debt securities underlying the common equity units. Most holders of the common equity units used the remarketing proceeds to settle their payment obligations under the applicable Purchase Contracts. The subsequent settlement of the Purchase Contracts provided proceeds to MetLife, Inc. of
$1.0 billion
in each of October 2014, September 2013 and October 2012 in exchange for shares of MetLife, Inc.’s common stock.
See
Note 16
.
323
16. Equity
Preferred Stock
Preferred stock authorized, issued and outstanding was as follows at both
December 31, 2016
and
2015
:
|
Series
|
|
Shares
Authorized |
|
Shares
Issued |
|
Shares
Outstanding |
|||
|
Floating Rate Non-Cumulative Preferred Stock, Series A
|
|
27,600,000
|
|
24,000,000
|
|
24,000,000
|
|
||
|
5.25% Fixed-to-Floating Rate Non-Cumulative Preferred Stock, Series C
|
|
1,500,000
|
|
1,500,000
|
|
1,500,000
|
|
||
|
Series A Junior Participating Preferred Stock
|
|
10,000,000
|
|
—
|
|
—
|
|
||
|
Not designated
|
|
160,900,000
|
|
—
|
|
—
|
|
||
|
Total
|
|
200,000,000
|
|
|
25,500,000
|
|
|
25,500,000
|
|
As discussed below, MetLife, Inc. repurchased or redeemed and canceled the
6.50%
Non-Cumulative Preferred Stock, Series B (the “Series B preferred stock”) in 2015. On November 3, 2015, MetLife, Inc. filed a Certificate of Elimination (the “Certificate of Elimination”) of
6.50%
Non-Cumulative Preferred Stock, Series B with the Secretary of State of the State of Delaware to eliminate all references to the Series B preferred stock in MetLife, Inc.’s Amended and Restated Certificate of Incorporation (the “Certificate of Incorporation”), including the related Certificate of Designations. As a result of the filing of the Certificate of Elimination, MetLife, Inc.’s Certificate of Incorporation was amended to eliminate all references therein to the Series B preferred stock, and the shares that were designated to such series were returned to the status of authorized but unissued shares of preferred stock, par value
$0.01
per share, of MetLife, Inc., without designation as to series.
In June 2015, MetLife, Inc. issued
1,500,000
shares of
5.25% Fixed-to-Floating Rate
Non-Cumulative Preferred Stock, Series C (the "Series C preferred stock"), with a
$0.01
par value per share and a liquidation preference of
$1,000
per share, for aggregate proceeds of
$1.5 billion
. In connection with the offering of the Series C preferred stock, MetLife, Inc. incurred
$17 million
of issuance costs which have been recorded as a reduction of additional paid-in capital.
In June 2015, MetLife, Inc. conducted a tender offer for up to
59,850,000
of its
60,000,000
shares of Series B preferred stock, liquidation preference
$25
per share, at a purchase price of
$25
per share, plus an amount equal to accrued, unpaid and undeclared dividends from, and including, June 15, 2015 to, but excluding, June 29, 2015, the settlement date of the tender offer. In June 2015, MetLife, Inc. also delivered a notice of redemption to the holders of the Series B preferred stock, pursuant to which it would redeem any shares of Series B preferred stock not purchased by it in the tender offer at a redemption price of
$25
per share, without any payment for accrued, unpaid and undeclared dividends on the Series B preferred stock from, and including, June 15, 2015 to, but excluding, July 1, 2015, the redemption date. On June 29, 2015, MetLife, Inc. repurchased and canceled
37,192,413
shares of Series B preferred stock in the tender offer for
$932 million
in cash. On July 1, 2015, MetLife, Inc. redeemed and canceled the remaining
22,807,587
shares of Series B preferred stock not tendered in the tender offer for an aggregate redemption price of
$570 million
in cash. In connection with the tender offer and redemption, MetLife, Inc. recognized a preferred stock repurchase premium of
$42 million
(calculated as the difference between the carrying value of the Series B preferred stock and the total amount paid by MetLife, Inc. to the holders of the Series B preferred stock in connection with the tender offer and redemption), which was reflected as a reduction to retained earnings on the consolidated balance sheet.
324
MetLife, Inc.
Notes to the Consolidated Financial Statements — (continued)
16. Equity (continued)
The outstanding preferred stock ranks senior to MetLife, Inc.’s common stock with respect to the payment of dividends and distributions upon liquidation, dissolution or winding-up. Holders of the outstanding preferred stock are entitled to receive dividend payments only when, as and if declared by MetLife, Inc.’s Board of Directors or a duly authorized committee of the Board. Dividends on the preferred stock are not cumulative or mandatory. Accordingly, if dividends are not declared on the preferred stock of the applicable series for any dividend period, then any accrued dividends for that dividend period will cease to accrue and be payable. If a dividend is not declared before the dividend payment date for any such dividend period, MetLife, Inc. will have no obligation to pay dividends accrued for such dividend period whether or not dividends are declared for any future period. No dividends may be paid or declared on MetLife, Inc.’s common stock (or any other securities ranking junior to the preferred stock) and MetLife, Inc. may not purchase, redeem, or otherwise acquire its common stock (or other such junior stock) unless the full dividends for the latest completed dividend period on all outstanding shares of preferred stock, and any parity stock, have been declared and paid or provided for. If dividends are declared on MetLife, Inc.’s Floating Rate Non-Cumulative Preferred Stock, Series A (the “Series A preferred stock”), they will be payable quarterly, in arrears, at an annual rate of the greater of:
(i) 1.00% above three-month LIBOR on the related LIBOR determination date; or (ii) 4.00%
. If dividends are declared on the Series C preferred stock for any dividend period, they are calculated on a non-cumulative basis at a fixed rate per annum of
5.25%
from the date of original issue to, but excluding, June 15, 2020, and will be calculated at a floating rate per annum equal to
three-month LIBOR plus 3.575%
on the related LIBOR determination date from and after June 15, 2020. Dividends on the Series C preferred stock for any dividend period are payable, if declared, semi-annually in arrears on the 15th day of June and December of each year commencing on December 15, 2015 and ending on June 15, 2020, and thereafter quarterly in arrears on the 15th day of September, December, March and June of each year. Information on payments of dividends on the Series B preferred stock is set forth in the table below.
MetLife, Inc. is prohibited from declaring dividends on the outstanding preferred stock if it fails to meet specified capital adequacy, net income and stockholders’ equity levels. Beginning on January 1, 2019, MetLife, Inc. will no longer be subject to such limitations with respect to the Series C preferred stock.
See “— Dividend Restrictions — MetLife, Inc.”
Holders of the preferred stock do not have voting rights except in certain circumstances, including where the dividends have not been paid for an equivalent of six or more dividend payment periods whether or not those periods are consecutive. Under such circumstances, the holders of the preferred stock have certain voting rights with respect to members of the Board of Directors of MetLife, Inc.
The preferred stock is not subject to any mandatory redemption, sinking fund, retirement fund, purchase fund or similar provisions. The Series A preferred stock is redeemable at MetLife, Inc.’s option in whole or in part, at a redemption price of
$25
per share of preferred stock, plus declared and unpaid dividends. MetLife, Inc. may, at its option, redeem the Series C preferred stock, (i) in whole but not in part, at any time prior to June 15, 2020, within 90 days after the occurrence of a “regulatory capital event,” and (ii) in whole or in part, from time to time, on or after June 15, 2020, in each case, at a redemption price equal to
$1,000
per Series C preferred share, plus an amount equal to any dividends per share that have accrued but not been declared and paid for the then-current dividend period to, but excluding, such redemption date. A “regulatory capital event” could occur as a result of a change or proposed change in capital adequacy rules (or the interpretation or application thereof) that would apply to MetLife, Inc. from rules (or the interpretation or application thereof) in effect with respect to bank holding companies as of June 1, 2015 that would create a more than insubstantial risk, as determined by MetLife, Inc., that the Series C preferred stock would not be treated as “Tier 1 Capital” or as capital with attributes similar to those of Tier 1 Capital.
In December 2008, MetLife, Inc. entered into an RCC related to the Series A and Series B preferred stock and, in June 2015, MetLife, Inc. entered into an RCC related to the Series C preferred stock. As part of each such RCC, MetLife, Inc. agreed that it will not repay, redeem or purchase the preferred stock on or before December 31, 2018, unless, subject to certain limitations, it has received proceeds during a specified period from the sale of specified replacement securities. The repurchase and redemption of Series B preferred stock as described above was in compliance with the terms of the applicable RCC. The RCC is, in each case, for the benefit of the holders of the related Covered Debt, which is currently MetLife, Inc.’s 10.750% JSDs. The RCC will terminate upon the occurrence of certain events, including the date on which MetLife, Inc. has no series of outstanding eligible debt securities.
325
MetLife, Inc.
Notes to the Consolidated Financial Statements — (continued)
16. Equity (continued)
Information on the declaration, record and payment dates, as well as per share and aggregate dividend amounts, for the Series A, Series B and Series C preferred stock was as follows:
|
Dividend
|
||||||||||||||||||||||||||||
|
Declaration Date
|
Record Date
|
Payment Date
|
Series A
Per Share
|
Series A
Aggregate
|
Series B
Per Share
|
Series B
Aggregate
|
Series C
Per Share
|
Series C
Aggregate
|
||||||||||||||||||||
|
(In millions, except per share data)
|
||||||||||||||||||||||||||||
|
November 15, 2016
|
November 30, 2016
|
December 15, 2016
|
$
|
0.253
|
|
$
|
6
|
|
$
|
—
|
|
$
|
—
|
|
$
|
26.250
|
|
$
|
39
|
|
||||||||
|
August 15, 2016
|
August 31, 2016
|
September 15, 2016
|
$
|
0.256
|
|
6
|
|
$
|
—
|
|
—
|
|
$
|
—
|
|
—
|
|
|||||||||||
|
May 16, 2016
|
May 31, 2016
|
June 15, 2016
|
$
|
0.256
|
|
7
|
|
$
|
—
|
|
—
|
|
$
|
26.250
|
|
39
|
|
|||||||||||
|
March 7, 2016
|
February 29, 2016
|
March 15, 2016
|
$
|
0.253
|
|
6
|
|
$
|
—
|
|
—
|
|
$
|
—
|
|
—
|
|
|||||||||||
|
$
|
25
|
|
$
|
—
|
|
$
|
78
|
|
||||||||||||||||||||
|
November 16, 2015
|
November 30, 2015
|
December 15, 2015
|
$
|
0.253
|
|
$
|
6
|
|
$
|
—
|
|
$
|
—
|
|
$
|
28.292
|
|
$
|
43
|
|
||||||||
|
August 17, 2015
|
August 31, 2015
|
September 15, 2015
|
$
|
0.256
|
|
6
|
|
$
|
—
|
|
—
|
|
$
|
—
|
|
—
|
|
|||||||||||
|
May 15, 2015
|
May 31, 2015
|
June 15, 2015
|
$
|
0.256
|
|
7
|
|
$
|
0.406
|
|
24
|
|
$
|
—
|
|
—
|
|
|||||||||||
|
March 5, 2015
|
February 28, 2015
|
March 16, 2015
|
$
|
0.250
|
|
6
|
|
$
|
0.406
|
|
24
|
|
$
|
—
|
|
—
|
|
|||||||||||
|
$
|
25
|
|
$
|
48
|
|
$
|
43
|
|
||||||||||||||||||||
|
November 17, 2014
|
November 30, 2014
|
December 15, 2014
|
$
|
0.253
|
|
$
|
7
|
|
$
|
0.406
|
|
$
|
24
|
|
$
|
—
|
|
$
|
—
|
|
||||||||
|
August 15, 2014
|
August 31, 2014
|
September 15, 2014
|
$
|
0.256
|
|
6
|
|
$
|
0.406
|
|
24
|
|
$
|
—
|
|
—
|
|
|||||||||||
|
May 15, 2014
|
May 31, 2014
|
June 16, 2014
|
$
|
0.256
|
|
7
|
|
$
|
0.406
|
|
24
|
|
$
|
—
|
|
—
|
|
|||||||||||
|
March 5, 2014
|
February 28, 2014
|
March 17, 2014
|
$
|
0.250
|
|
6
|
|
$
|
0.406
|
|
24
|
|
$
|
—
|
|
—
|
|
|||||||||||
|
$
|
26
|
|
$
|
96
|
|
$
|
—
|
|
||||||||||||||||||||
See Note
23
for information on subsequent preferred stock dividends declared.
Common Stock
Issuances
In October 2014, MetLife, Inc. issued
22,907,960
new shares of its common stock for
$1.0 billion
. The issuances were made in connection with the settlement of stock purchase contracts. See Note
15
.
During the years ended December 31,
2016
,
2015
and
2014
,
4,439,219
new shares,
5,592,622
new shares and
5,866,160
new shares of common stock were issued for
$166 million
,
$216 million
and
$220 million
, respectively, in connection with stock option exercises and other stock-based awards. There were
no
shares of common stock issued from treasury stock during any of the years ended December 31,
2016
,
2015
and
2014
.
Repurchase Authorizations
On December 12, 2014, MetLife, Inc. announced that its Board of Directors authorized
$1.0 billion
of common stock repurchases in addition to previously authorized repurchases and on September 22, 2015, MetLife, Inc. announced that its Board of Directors authorized additional repurchases of
$739 million
of its common stock, bringing MetLife, Inc.’s available repurchase authorization under the December 2014 and September 2015 authorizations as of such date to
$1.0 billion
. O
n November 10, 2016, MetLife, Inc. announced that its Board of Directors authorized
$3.0 billion
of common stock repurchases.
During the years ended December 31,
2016
,
2015
and
2014
, MetLife, Inc. repurchased
6,948,739
shares,
39,491,991
shares and
18,876,363
shares under these repurchase authorizations for
$372 million
,
$1.9 billion
, and
$1.0 billion
, respectively. At December 31,
2016
, MetLife, Inc. had
$2.7 billion
remaining under its common stock repurchase authorizations. See Note
23
for information on subsequent common stock repurchases.
Under these authorizations, MetLife, Inc. may purchase its common stock from the MetLife Policyholder Trust, in the open market (including pursuant to the terms of a pre-set trading plan meeting the requirements of Rule 10b5-1 under the Securities Exchange Act of 1934 (“Exchange Act”)), and in privately negotiated transactions. Common stock repurchases are dependent upon several factors, including the Company’s capital position, liquidity, financial strength and credit ratings, general market conditions, the market price of MetLife, Inc.’s common stock compared to management’s assessment of the stock’s underlying value and applicable regulatory approvals, as well as other legal and accounting factors.
326
MetLife, Inc.
Notes to the Consolidated Financial Statements — (continued)
16. Equity (continued)
Dividends
The table below presents declaration, record and payment dates, as well as per share and aggregate dividend amounts, for common stock:
|
Dividend
|
||||||||||||
|
Declaration Date
|
Record Date
|
Payment Date
|
Per Share
|
Aggregate
|
||||||||
|
(In millions, except per share data)
|
||||||||||||
|
October 25, 2016
|
November 7, 2016
|
December 13, 2016
|
$
|
0.400
|
|
$
|
441
|
|
||||
|
July 7, 2016
|
August 8, 2016
|
September 13, 2016
|
$
|
0.400
|
|
441
|
|
|||||
|
April 26, 2016
|
May 9, 2016
|
June 13, 2016
|
$
|
0.400
|
|
441
|
|
|||||
|
January 6, 2016
|
February 5, 2016
|
March 14, 2016
|
$
|
0.375
|
|
413
|
|
|||||
|
$
|
1,736
|
|
||||||||||
|
October 27, 2015
|
November 6, 2015
|
December 11, 2015
|
$
|
0.375
|
|
$
|
419
|
|
||||
|
July 7, 2015
|
August 7, 2015
|
September 11, 2015
|
$
|
0.375
|
|
420
|
|
|||||
|
April 28, 2015
|
May 11, 2015
|
June 12, 2015
|
$
|
0.375
|
|
420
|
|
|||||
|
January 6, 2015
|
February 6, 2015
|
March 13, 2015
|
$
|
0.350
|
|
394
|
|
|||||
|
$
|
1,653
|
|
||||||||||
|
October 28, 2014
|
November 7, 2014
|
December 12, 2014
|
$
|
0.350
|
|
$
|
398
|
|
||||
|
July 7, 2014
|
August 8, 2014
|
September 12, 2014
|
$
|
0.350
|
|
395
|
|
|||||
|
April 22, 2014
|
May 9, 2014
|
June 13, 2014
|
$
|
0.350
|
|
395
|
|
|||||
|
January 6, 2014
|
February 6, 2014
|
March 13, 2014
|
$
|
0.275
|
|
311
|
|
|||||
|
$
|
1,499
|
|
||||||||||
See Note
23
for information on subsequent common stock dividends declared.
The funding of the cash dividends and operating expenses of MetLife, Inc. is primarily provided by cash dividends from MetLife, Inc.’s insurance subsidiaries. The statutory capital and surplus, or net assets, of MetLife, Inc.’s insurance subsidiaries are subject to regulatory restrictions except to the extent that dividends are allowed to be paid in a given year without prior regulatory approval. Dividends exceeding these limitations can generally be made subject to regulatory approval. The nature and amount of these dividend restrictions, as well as the statutory capital and surplus of MetLife, Inc.’s U.S. insurance subsidiaries, are disclosed in “— Statutory Equity and Income” and “— Dividend Restrictions — Insurance Operations.” MetLife, Inc.’s principal non-U.S. insurance operations are branches or subsidiaries of American Life, a U.S. insurance subsidiary of the Company. In addition, the payment of dividends by MetLife, Inc. to its shareholders is also subject to restrictions. See “— Dividend Restrictions — MetLife, Inc.”
Stock-Based Compensation Plans
Plans for Employees and Agents
Under the MetLife, Inc. 2015 Stock and Incentive Compensation Plan (the “2015 Stock Plan”), MetLife, Inc. may grant awards to employees and agents in the form of Stock Options, Stock Appreciation Rights, Restricted Stock or Restricted Stock Units, Performance Shares or Performance Share Units, Cash-Based Awards and Stock-Based Awards (each, as applicable, as defined in the 2015 Stock Plan with reference to shares of MetLife, Inc. common stock (“Shares”)). Awards under the 2015 Stock Plan and its predecessor plan, the MetLife, Inc. 2005 Stock and Incentive Compensation Plan (the “2005 Stock Plan”) were outstanding at
December 31, 2016
. MetLife, Inc. granted all awards to employees and agents in
2016
under the 2015 Stock Plan.
327
MetLife, Inc.
Notes to the Consolidated Financial Statements — (continued)
16. Equity (continued)
The aggregate number of Shares authorized for issuance under the 2015 Stock Plan at
December 31, 2016
was
30,225,064
.
MetLife recognizes compensation expense related to awards under the 2005 Stock Plan or 2015 Stock Plan based on the number of awards it expects to vest, which represents the awards granted less expected forfeitures over the life of the award, as estimated at the date of grant. Unless a material deviation from the assumed forfeiture rate is observed during the term in which the awards are expensed, MetLife recognizes any adjustment necessary to reflect differences in actual experience in the period the award becomes payable or exercisable.
Compensation expense related to awards under the 2005 Stock Plan is principally related to the issuance of Stock Options. Under the 2015 Stock Plan, compensation expense principally relates to Stock Options, Unit Options, Performance Shares, Performance Units, Restricted Stock Units and Restricted Units. MetLife, Inc. granted the majority of each year’s awards under the 2005 Stock Plan and 2015 Stock Plan in the first quarter of the year.
Deferred Shares are Shares that are covered by awards that have become payable under a plan, but the issuance of which has been deferred. Deferred Shares payable to employees or agents related to awards under the 2005 Stock Plan, 2015 Stock Plan, or earlier applicable plans equaled
1,385,725
Shares at
December 31, 2016
.
Certain stock-based awards provide solely for cash settlement based in whole or in part on the price of Shares or changes in the price of Shares (“Phantom Stock-Based Awards”). MetLife granted such awards under the MetLife, Inc. International Unit Option Incentive Plan, the MetLife International Performance Unit Incentive Plan, and the MetLife International Restricted Unit Incentive Plan prior to 2015, and under the 2015 Stock Plan in 2015 and later.
Plans for Non-Management Directors
Under the MetLife, Inc. 2015 Non-Management Director Stock Compensation Plan (the “2015 Director Stock Plan”), MetLife, Inc. may grant non-management Directors of MetLife, Inc. awards in the form of nonqualified Stock Options, Stock Appreciation Rights, Restricted Stock or Restricted Stock Units, or Stock-Based Awards (each, as applicable, as defined in the 2015 Director Stock Plan with reference to Shares). The only awards MetLife, Inc. granted under the 2015 Director Stock Plan and its predecessor plan, the MetLife, Inc. 2005 Non-Management Director Stock Compensation Plan (the “2005 Director Stock Plan”), through
December 31, 2016
vested immediately and no awards under the 2005 Director Stock Plan or 2015 Director Stock Plan remained outstanding at
December 31, 2016
.
The aggregate number of Shares authorized for issuance under the 2015 Director Stock Plan at
December 31, 2016
was
1,561,333
.
MetLife recognizes compensation expense related to awards under the 2015 Director Stock Plan based on the number of Shares awarded. The only awards made under the 2005 Director Stock Plan and under the 2015 Director Stock Plan through
December 31, 2016
were Stock-Based Awards that vested immediately. MetLife, Inc. granted the majority of the awards in 2015 and 2016 under the 2015 Director Stock Plan in the second quarter of each year.
Deferred Shares payable to Directors related to awards under the 2005 Director Stock Plan, 2015 Director Stock Plan, or earlier applicable plans equaled
193,253
Shares at
December 31, 2016
.
328
MetLife, Inc.
Notes to the Consolidated Financial Statements — (continued)
16. Equity (continued)
Compensation Expense Related to Stock-Based Compensation
The components of compensation expense related to stock-based compensation includes compensation expense related to Phantom Stock-Based Awards, and excludes the insignificant compensation expense related to the 2015 Director Stock Plan. Those components were:
|
Years Ended December 31,
|
|||||||||||
|
2016
|
2015
|
2014
|
|||||||||
|
(In millions)
|
|||||||||||
|
Stock Options and Unit Options
|
$
|
10
|
|
$
|
14
|
|
$
|
29
|
|
||
|
Performance Shares and Performance Units (1)
|
80
|
|
65
|
|
111
|
|
|||||
|
Restricted Stock Units and Restricted Units
|
70
|
|
75
|
|
52
|
|
|||||
|
Total compensation expense
|
$
|
160
|
|
$
|
154
|
|
$
|
192
|
|
||
|
Income tax benefit
|
$
|
56
|
|
$
|
54
|
|
$
|
67
|
|
||
__________________
|
(1)
|
Performance Shares expected to vest and the related compensation expenses may be further adjusted by the performance factor most likely to be achieved, as estimated by management, at the end of the performance period.
|
The following table presents the total unrecognized compensation expense related to stock-based compensation and the expected weighted average period over which these expenses will be recognized at:
|
December 31, 2016
|
|||||
|
Expense
|
Weighted Average
Period
|
||||
|
(In millions)
|
(Years)
|
||||
|
Stock Options
|
$
|
5
|
|
1.65
|
|
|
Performance Shares
|
$
|
37
|
|
1.73
|
|
|
Restricted Stock Units
|
$
|
46
|
|
1.80
|
|
Equity Awards
Stock Options
Stock Options are the contingent right of award holders to purchase Shares at a stated price for a limited time. All Stock Options have an exercise price equal to the closing price of a Share reported on the New York Stock Exchange on the date of grant, and have a maximum term of
10
years. The vast majority of Stock Options granted has become or will become exercisable at a rate of one-third of each award on each of the first
three
anniversaries of the grant date. Other Stock Options have become or will become exercisable on the third anniversary of the grant date. Vesting is subject to continued service, except for employees who meet specified age and service criteria and in certain other limited circumstances.
329
MetLife, Inc.
Notes to the Consolidated Financial Statements — (continued)
16. Equity (continued)
A summary of the activity related to Stock Options was as follows:
|
Shares
Under
Option
|
Weighted
Average
Exercise
Price
|
Weighted
Average
Remaining
Contractual
Term
|
Aggregate
Intrinsic
Value (1)
|
|||||||||
|
(Years)
|
(In millions)
|
|||||||||||
|
Outstanding at January 1, 2016
|
23,506,764
|
|
$
|
44.50
|
|
4.09
|
$
|
166
|
|
|||
|
Granted
|
900,764
|
|
$
|
38.42
|
|
|||||||
|
Exercised
|
(2,432,001
|
)
|
$
|
34.36
|
|
|||||||
|
Expired
|
(2,429,009
|
)
|
$
|
50.50
|
|
|||||||
|
Forfeited
|
(64,130
|
)
|
$
|
45.90
|
|
|||||||
|
Outstanding at December 31, 2016
|
19,482,388
|
|
$
|
44.73
|
|
3.68
|
$
|
218
|
|
|||
|
Vested and expected to vest at December 31, 2016
|
19,314,192
|
|
$
|
44.72
|
|
3.69
|
$
|
217
|
|
|||
|
Exercisable at December 31, 2016
|
17,913,612
|
|
$
|
44.79
|
|
3.28
|
$
|
202
|
|
|||
__________________
|
(1)
|
The intrinsic value of each Stock Option is the closing price on a particular date less the exercise price of the Stock Option, so long as the difference is greater than zero. The aggregate intrinsic value of all outstanding Stock Options is computed using the closing Share price on December 31,
2016
of
$53.89
and December 31,
2015
of
$48.21
, as applicable.
|
MetLife estimates the fair value of Stock Options on the date of grant using a binomial lattice model. The significant assumptions the Company uses in its binomial lattice model are further described below. The assumptions include: expected volatility of the price of Shares; risk-free rate of return; dividend yield on Shares; exercise multiple; and the post-vesting termination rate.
Expected volatility is based upon an analysis of historical prices of Shares and call options on Shares traded on the open market. The Company uses a weighted-average of the implied volatility for publicly-traded call options with the longest remaining maturity nearest to the money as of each valuation date and the historical volatility, calculated using monthly closing prices of Shares. The Company chose a monthly measurement interval for historical volatility as this interval reflects the Company’s view that employee option exercise decisions are based on longer-term trends in the price of the underlying Shares rather than on daily price movements.
The binomial lattice model used by the Company incorporates different risk-free rates based on the imputed forward rates for U.S. Treasury Strips for each year over the contractual term of the option. The table below presents the full range of rates that were used for options granted during the respective periods.
Dividend yield is determined based on historical dividend distributions compared to the price of the underlying Shares as of the valuation date and held constant over the life of the Stock Option.
The binomial lattice model used by the Company incorporates the term of the Stock Options. The model also factors in expected exercise behavior and a post-vesting termination rate, or the rate at which vested options are exercised or expire prematurely due to termination of employment. From these factors, the model derives an expected life of the Stock Option. The exercise behavior in the model is a multiple that reflects the ratio of stock price at the time of exercise over the exercise price of the Stock Option at the time the model expects holders to exercise. The model derives the exercise multiple from actual exercise activity. The model determines the post-vesting termination rate from actual exercise experience and expiration activity under the Incentive Plans.
330
MetLife, Inc.
Notes to the Consolidated Financial Statements — (continued)
16. Equity (continued)
The following table presents the weighted average assumptions, with the exception of risk-free rate, which is expressed as a range, that the model uses to determine the fair value of unexercised Stock Options that MetLife, Inc. has granted:
|
Years Ended December 31,
|
||||||||||||
|
2016
|
2015
|
2014
|
||||||||||
|
Dividend yield
|
3.90%
|
2.72%
|
2.18%
|
|||||||||
|
Risk-free rate of return
|
0.62% - 2.85%
|
0.20% - 3.04%
|
0.12% - 5.07%
|
|||||||||
|
Expected volatility
|
33.58%
|
32.56%
|
33.26%
|
|||||||||
|
Exercise multiple
|
1.43
|
1.44
|
1.45
|
|||||||||
|
Post-vesting termination rate
|
2.58%
|
2.73%
|
2.93%
|
|||||||||
|
Contractual term (years)
|
10
|
|
10
|
|
10
|
|
||||||
|
Expected life (years)
|
7
|
|
7
|
|
6
|
|
||||||
|
Weighted average exercise price of stock options granted
|
$
|
38.42
|
|
$
|
51.39
|
|
$
|
50.53
|
|
|||
|
Weighted average fair value of stock options granted
|
$
|
9.26
|
|
$
|
13.29
|
|
$
|
13.84
|
|
|||
The following table presents a summary of Stock Option exercise activity:
|
Years Ended December 31,
|
||||||||||||
|
2016
|
2015
|
2014
|
||||||||||
|
(In millions)
|
||||||||||||
|
Total intrinsic value of stock options exercised
|
$
|
42
|
|
$
|
44
|
|
$
|
67
|
|
|||
|
Cash received from exercise of stock options
|
$
|
84
|
|
$
|
121
|
|
$
|
156
|
|
|||
|
Income tax benefit realized from stock options exercised
|
$
|
15
|
|
$
|
15
|
|
$
|
24
|
|
|||
Performance Shares
Performance Shares are units that, if they vest, are multiplied by a performance factor to produce a number of final Performance Shares which are payable in Shares. MetLife accounts for Performance Shares as equity awards. MetLife, Inc. does not credit Performance Shares with dividend-equivalents for dividends paid on Shares. Performance Share awards normally vest in their entirety at the end of the three-year performance period. Vesting is subject to continued service, except for employees who meet specified age and service criteria, and in certain other limited circumstances.
For awards granted for the 2014 – 2016 and later performance periods in progress through
December 31, 2016
, the vested Performance Shares will be multiplied by a performance factor of
0%
to
175%
. Assuming that MetLife, Inc. has met threshold performance goals related to its adjusted income or total shareholder return, the MetLife, Inc. Compensation Committee will determine the performance factor in its discretion. In doing so, the Compensation Committee may consider MetLife, Inc.’s total shareholder return relative to the performance of its competitors and operating return on MetLife, Inc.’s common stockholder’s equity relative to its financial plan. MetLife estimates the fair value of Performance Shares each quarter until they become payable. The performance factor for the 2013 - 2015 performance period was
86.2%
.
Restricted Stock Units
Restricted Stock Units are units that, if they vest, are payable in an equal number of Shares. MetLife accounts for Restricted Stock Units as equity awards. MetLife, Inc. does not credit Restricted Stock Units with dividend-equivalents for dividends paid on Shares. Accordingly, the estimated fair value of Restricted Stock Units is based upon the closing price of Shares on the date of grant, reduced by the present value of estimated dividends to be paid on that stock.
The vast majority of Restricted Stock Units normally vest in thirds on or shortly after the first three anniversaries of their grant date. Other Restricted Stock Units normally vest in their entirety on the third or later anniversary of their grant date. Vesting is subject to continued service, except for employees who meet specified age and service criteria and in certain other limited circumstances.
331
MetLife, Inc.
Notes to the Consolidated Financial Statements — (continued)
16. Equity (continued)
The following table presents a summary of Performance Share and Restricted Stock Unit activity:
|
Performance Shares
|
Restricted Stock Units
|
||||||||||||
|
Shares
|
Weighted
Average Fair Value (2) |
Units
|
Weighted
Average Fair Value (2) |
||||||||||
|
Outstanding at January 1, 2016
|
3,907,174
|
|
$
|
44.08
|
|
3,078,959
|
|
$
|
43.50
|
|
|||
|
Granted
|
1,661,925
|
|
$
|
49.65
|
|
2,075,089
|
|
$
|
33.67
|
|
|||
|
Forfeited
|
(159,358
|
)
|
$
|
49.91
|
|
(192,248
|
)
|
$
|
39.88
|
|
|||
|
Payable (1)
|
(1,592,641
|
)
|
$
|
44.57
|
|
(1,539,787
|
)
|
$
|
40.52
|
|
|||
|
Outstanding at December 31, 2016
|
3,817,100
|
|
$
|
49.88
|
|
3,422,013
|
|
$
|
39.08
|
|
|||
|
Vested and expected to vest at December 31, 2016
|
3,637,175
|
|
$
|
49.89
|
|
3,279,076
|
|
$
|
39.23
|
|
|||
__________________
|
(1)
|
Includes both Shares paid and Deferred Shares for later payment.
|
|
(2)
|
Values for shares outstanding at January 1, 2016, represent weighted average number of shares multiplied by the fair value per share at December 31, 2015. Otherwise, all values represent weighted average of number of shares multiplied by the fair value per share at
December 31, 2016
. Fair value per share of Restricted Stock Units on
December 31, 2016
was equal to Grant Date fair value per share.
|
Performance Share amounts above represent aggregate initial target awards and do not reflect potential increases or decreases resulting from the performance factor determined after the end of the respective performance periods. At
December 31, 2016
, the performance period for the 2014 — 2016 Performance Share grants was completed, but the performance factor had not yet been calculated. Included in the immediately preceding table are
1,066,076
outstanding Performance Shares to which the 2014 — 2016 performance factor will be applied.
Liability Awards (Phantom Stock-Based Awards)
Certain MetLife subsidiaries have a liability for Phantom Stock-Based Awards in the form of Unit Options, Restricted Units, and/or Performance Units. These Share-based cash settled awards are recorded as liabilities until payout is made. Unlike Share-settled awards, which have a fixed grant-date fair value, the fair value of unsettled or unvested liability awards is remeasured at the end of each reporting period based on the change in fair value of one Share. The liability and corresponding expense are adjusted accordingly until the award is settled.
Unit Options
Each Unit Option is the contingent right of the holder to receive a cash payment equal to the closing price of a Share on the surrender date, less the closing price on the grant date, if the difference is greater than zero. The vast majority of Unit Options has become or will become eligible for surrender at a rate of one-third of each award on each of the first three anniversaries of the grant date. Other Unit Options have become or will become eligible for surrender on the third anniversary of the grant date. Vesting is subject to continued service, except for employees who meet specified age and service criteria and in certain other limited circumstances.
Restricted Units
Restricted Units are units that, if they vest, are payable in cash equal to the closing price of a Share on the last day of the restriction period. The vast majority of Restricted Units normally vest in thirds on or shortly after the first three anniversaries of their grant date. Other Restricted Units normally vest in their entirety on the third or later anniversary of their grant date. Vesting is subject to continued service, except for employees meet specified age and service criteria and in certain other limited circumstances. Restricted Units are accounted for as liability awards. They are not credited with dividend-equivalents for actual dividends paid on Shares during the performance period.
332
MetLife, Inc.
Notes to the Consolidated Financial Statements — (continued)
16. Equity (continued)
Performance Units
Performance Units are units that, if they vest, are multiplied by a performance factor to produce a number of final Performance Units which are payable in cash equal to the closing price of a Share on a date following the last day of the three-year performance period. The performance factor for the Performance Units for any given period is determined on the identical basis as the performance factor for Performance Shares for the same performance period. Performance Units are accounted for as liability awards. They are not credited with dividend-equivalents for dividends paid on Shares. Accordingly, the estimated fair value of Performance Units is based upon the closing price of a Share on the date of grant, reduced by the present value of estimated dividends to be paid on that stock during the performance period.
See “— Equity Awards — Performance Shares” for a discussion of the Performance Shares vesting period and award calculation, which is also used for Performance Units.
The following table presents a summary of Liability Awards activity:
|
Unit
Options
|
Restricted
Units
|
Performance
Units
|
||||||
|
Outstanding at January 1, 2016
|
975,529
|
|
661,892
|
|
611,272
|
|
||
|
Granted
|
27,800
|
|
485,171
|
|
278,833
|
|
||
|
Exercised
|
(91,752
|
)
|
—
|
|
—
|
|
||
|
Forfeited
|
(55,680
|
)
|
(76,651
|
)
|
(39,086
|
)
|
||
|
Paid
|
—
|
|
(306,689
|
)
|
(235,663
|
)
|
||
|
Outstanding at December 31, 2016
|
855,897
|
|
763,723
|
|
615,356
|
|
||
|
Vested and expected to vest at December 31, 2016
|
770,307
|
|
687,351
|
|
553,820
|
|
||
Statutory Equity and Income
The states of domicile of
MetLife, Inc
.’s U.S. insurance subsidiaries each impose risk-based capital (“RBC”) requirements that were developed by the National Association of Insurance Commissioners (“NAIC”). American Life does not write business in Delaware or any other domestic state and, as such, is exempt from RBC requirements by Delaware law. Regulatory compliance is determined by a ratio of a company’s total adjusted capital, calculated in the manner prescribed by the NAIC (“TAC”) to its authorized control level RBC, calculated in the manner prescribed by the NAIC (“ACL RBC”), based on the statutory-based filed financial statements. Companies below specific trigger levels or ratios are classified by their respective levels, each of which requires specified corrective action. The minimum level of TAC before corrective action commences is twice ACL RBC (“Company Action Level RBC”). While not required by or filed with insurance regulators, the Company also calculates an internally defined combined RBC ratio (“Statement-Based Combined RBC Ratio”), which is determined by dividing the sum of TAC for
MetLife, Inc.
’s principal U.S. insurance subsidiaries, excluding American Life, by the sum of Company Action Level RBC for such subsidiaries. The Company’s Statement-Based Combined RBC Ratio was
in excess of 400%
at both December 31,
2016
and December 31,
2015
. In addition, all non-exempted U.S. insurance subsidiaries individually exceeded Company Action Level RBC for all periods presented.
MetLife, Inc.
’s foreign insurance operations are regulated by applicable authorities of the countries in which each entity operates and are subject to minimum capital and solvency requirements in those countries before corrective action commences. At December 31,
2016
and
2015
, the adjusted capital of American Life’s insurance subsidiary in Japan, the Company’s largest foreign insurance operation, was
in excess of four times the 200% solvency margin ratio
that would require corrective action. Excluding Japan, the aggregate required capital and surplus of the Company’s other foreign insurance operations was
$3.1 billion
and the aggregate actual regulatory capital and surplus of such operations was
$10.9 billion
as of the date of the most recent required capital adequacy calculation for each jurisdiction. Each of those other foreign insurance operations exceeded minimum capital and solvency requirements of their respective countries for all periods presented.
333
MetLife, Inc.
Notes to the Consolidated Financial Statements — (continued)
16. Equity (continued)
MetLife, Inc.’s insurance subsidiaries prepare statutory-basis financial statements in accordance with statutory accounting practices prescribed or permitted by the insurance department of the state of domicile or applicable foreign jurisdiction. The NAIC has adopted the Codification of Statutory Accounting Principles (“Statutory Codification”). Statutory Codification is intended to standardize regulatory accounting and reporting to state insurance departments. However, statutory accounting principles continue to be established by individual state laws and permitted practices. Modifications by the various state insurance departments may impact the effect of Statutory Codification on the statutory capital and surplus of
MetLife, Inc.
’s U.S. insurance subsidiaries.
Statutory accounting principles differ from GAAP primarily by charging policy acquisition costs to expense as incurred, establishing future policy benefit liabilities using different actuarial assumptions, reporting surplus notes as surplus instead of debt and valuing securities on a different basis.
In addition, certain assets are not admitted under statutory accounting principles and are charged directly to surplus. The most significant assets not admitted by the Company are net deferred income tax assets resulting from temporary differences between statutory accounting principles basis and tax basis not expected to reverse and become recoverable within three years. Further, statutory accounting principles do not give recognition to purchase accounting adjustments. MetLife, Inc.’s U.S. insurance subsidiaries have no material state prescribed accounting practices, except as described below.
New York has adopted certain prescribed accounting practices, primarily consisting of the continuous Commissioners’ Annuity Reserve Valuation Method, which impacts deferred annuities, and the New York Special Consideration Letter, which mandates certain assumptions in asset adequacy testing. The collective impact of these prescribed accounting practices decreased the statutory capital and surplus of MLIC for the years ended December 31,
2016
and
2015
by an amount of
$909 million
and
$1.2 billion
, respectively, in excess of the amount of the decrease had capital and surplus been measured under NAIC guidance.
American Life calculates its policyholder reserves on insurance written in each foreign jurisdiction in accordance with the reserve standards required by such jurisdiction. Additionally, American Life’s insurance subsidiaries are valued based on each respective subsidiary’s underlying local statutory equity, adjusted in a manner consistent with the reporting prescribed for its branch operations. The prescribed practice exempts American Life from calculating and disclosing the impact to its statutory capital and surplus. The tables below present amounts from MetLife, Inc.’s U.S. insurance subsidiaries, which are derived from the statutory-basis financial statements as filed with the insurance regulators.
Statutory net income (loss) was as follows:
|
Years Ended December 31,
|
||||||||||||||
|
Company
|
State of Domicile
|
2016
|
2015
|
2014
|
||||||||||
|
(In millions)
|
||||||||||||||
|
Metropolitan Life Insurance Company (1)
|
New York
|
$
|
3,444
|
|
$
|
3,703
|
|
$
|
1,487
|
|
||||
|
American Life Insurance Company
|
Delaware
|
$
|
341
|
|
$
|
335
|
|
$
|
(36
|
)
|
||||
|
MetLife Insurance Company USA
|
Delaware
|
$
|
1,186
|
|
$
|
(1,022
|
)
|
$
|
1,543
|
|
||||
|
Metropolitan Property and Casualty Insurance Company
|
Rhode Island
|
$
|
171
|
|
$
|
204
|
|
$
|
291
|
|
||||
|
Metropolitan Tower Life Insurance Company
|
Delaware
|
$
|
8
|
|
$
|
(42
|
)
|
$
|
51
|
|
||||
|
New England Life Insurance Company
|
Massachusetts
|
$
|
109
|
|
$
|
157
|
|
$
|
303
|
|
||||
|
General American Life Insurance Company
|
Missouri
|
$
|
(2
|
)
|
$
|
204
|
|
$
|
129
|
|
||||
|
Other
|
Various
|
$
|
(70
|
)
|
$
|
20
|
|
$
|
22
|
|
||||
__________________
|
(1)
|
In December 2016, MLIC transferred all of the issued and outstanding shares of the common stock of each of NELICO and General American Life Insurance Company (“GALIC”) to MetLife, Inc., in the form of a non-cash extraordinary
dividend.
|
334
MetLife, Inc.
Notes to the Consolidated Financial Statements — (continued)
16. Equity (continued)
Statutory capital and surplus was as follows at:
|
December 31,
|
||||||||||
|
Company
|
2016
|
2015
|
||||||||
|
(In millions)
|
||||||||||
|
Metropolitan Life Insurance Company (1)
|
$
|
11,195
|
|
$
|
14,485
|
|
(2
|
)
|
||
|
American Life Insurance Company
|
$
|
5,235
|
|
$
|
6,115
|
|
||||
|
MetLife Insurance Company USA
|
$
|
4,374
|
|
$
|
5,942
|
|
||||
|
Metropolitan Property and Casualty Insurance Company
|
$
|
2,271
|
|
$
|
2,335
|
|
||||
|
Metropolitan Tower Life Insurance Company
|
$
|
669
|
|
$
|
710
|
|
||||
|
New England Life Insurance Company
|
$
|
455
|
|
$
|
632
|
|
(2
|
)
|
||
|
General American Life Insurance Company
|
$
|
923
|
|
$
|
984
|
|
(2
|
)
|
||
|
Other
|
$
|
303
|
|
$
|
417
|
|
||||
__________________
|
(1)
|
In December 2016, MLIC transferred all of the issued and outstanding shares of the common stock of each of NELICO and GALIC to MetLife, Inc. in the form of a non-cash extraordinary dividend.
|
|
(2)
|
In 2015, NELICO and GALIC’s capital and surplus was included in MLIC’s total as they were subsidiaries of MLIC.
|
The Company’s domestic captive life reinsurance subsidiaries, which reinsure risks including the closed block, level premium term life and ULSG assumed from other MetLife subsidiaries, have no state prescribed accounting practices, except for MRV and MetLife Reinsurance Company of Delaware (“MRD”). MRV, with the explicit permission of the Commissioner of Insurance of the State of Vermont, has included, as admitted assets, the value of letters of credit serving as collateral for reinsurance credit taken by various affiliated cedants, in connection with reinsurance agreements entered into between MRV and the various affiliated cedants, which resulted in higher statutory capital and surplus of
$5.6 billion
and
$6.0 billion
for the years ended December 31,
2016
and
2015
, respectively. MRV’s RBC would have triggered a regulatory event without the use of the state prescribed practice. MRD, with the explicit permission of the Commissioner of Insurance of the State of Delaware, has included, as admitted assets, the value of letters of credit issued to MRD, which resulted in higher statutory capital and surplus of
$260 million
and
$200 million
for the years ended December 31,
2016
and
2015
, respectively. MRD’s RBC would not have triggered a regulatory event without the use of the state prescribed practice. The combined statutory net income (loss) of
MetLife, Inc.
’s domestic captive life reinsurance subsidiaries was
($344) million
,
($336) million
and
($320) million
for the years ended December
2016
,
2015
and
2014
, respectively, and the combined statutory capital and surplus, including the aforementioned prescribed practice, was
$4.4 billion
and
$5.0 billion
at December 31,
2016
and
2015
, respectively.
335
MetLife, Inc.
Notes to the Consolidated Financial Statements — (continued)
16. Equity (continued)
Dividend Restrictions
Insurance Operations
The table below sets forth the dividends permitted to be paid by MetLife, Inc.’s primary insurance subsidiaries without insurance regulatory approval and dividends paid:
|
2017
|
2016
|
2015
|
||||||||||||||
|
Company
|
Permitted Without
Approval (1) |
Paid (2)
|
Paid (2)
|
|||||||||||||
|
(In millions)
|
||||||||||||||||
|
Metropolitan Life Insurance Company
|
$
|
2,723
|
|
$
|
5,740
|
|
(3
|
)
|
$
|
1,489
|
|
|||||
|
American Life Insurance Company
|
$
|
—
|
|
$
|
—
|
|
$
|
—
|
|
|||||||
|
MetLife Insurance Company USA
|
$
|
473
|
|
$
|
261
|
|
$
|
500
|
|
|||||||
|
Metropolitan Property and Casualty Insurance Company
|
$
|
98
|
|
$
|
228
|
|
$
|
235
|
|
|||||||
|
Metropolitan Tower Life Insurance Company
|
$
|
66
|
|
$
|
60
|
|
$
|
102
|
|
|||||||
|
New England Life Insurance Company
|
$
|
106
|
|
$
|
295
|
|
(4
|
)
|
$
|
199
|
|
(4
|
)
|
|||
|
General American Life Insurance Company
|
$
|
91
|
|
$
|
—
|
|
$
|
—
|
|
|||||||
__________________
|
(1)
|
Reflects dividend amounts that may be paid during 2017 without prior regulatory approval. However, because dividend tests may be based on dividends previously paid over rolling 12-month periods, if paid before a specified date during 2017, some or all of such dividends may require regulatory approval.
|
|
(2)
|
Reflects all amounts paid, including those requiring regulatory approval.
|
|
(3)
|
In 2016, MLIC paid an ordinary cash dividend to MetLife, Inc. in the amount of
$3.6 billion
. In addition, in December 2016, MLIC distributed all of the issued and outstanding shares of common stock of each of NELICO and GALIC to MetLife, Inc. in the form of a non-cash extraordinary dividend in the amount of
$981 million
and
$1.2 billion
, respectively, as calculated on a statutory basis.
|
|
(4)
|
Dividends paid by NELICO in 2015 were paid to its former parent, MLIC. Dividends paid by NELICO in 2016, including a
$295 million
extraordinary cash dividend, were paid to its new parent, MetLife, Inc.
|
Effective for dividends paid during 2016 and going forward, the New York Insurance Law was amended permitting MLIC, without prior insurance regulatory clearance, to pay stockholder dividends to MetLife, Inc. in any calendar year based on either of two standards. Under one standard, MLIC is permitted, without prior insurance regulatory clearance, to pay dividends out of earned surplus (defined as positive “unassigned funds (surplus)” excluding 85% of the change in net unrealized capital gains or losses (less capital gains tax), for the immediately preceding calendar year), in an amount up to the greater of: (i) 10% of its surplus to policyholders as of the end of the immediately preceding calendar year, or (ii) its statutory net gain from operations for the immediately preceding calendar year (excluding realized capital gains), not to exceed 30% of surplus to policyholders as of the end of the immediately preceding calendar year. In addition, under this standard, MLIC may not, without prior insurance regulatory clearance, pay any dividends in any calendar year immediately following a calendar year for which its net gain from operations, excluding realized capital gains, was negative. Under the second standard, if dividends are paid out of other than earned surplus, MLIC may, without prior insurance regulatory clearance, pay an amount up to the lesser of: (i) 10% of its surplus to policyholders as of the end of the immediately preceding calendar year, or (ii) its statutory net gain from operations for the immediately preceding calendar year (excluding realized capital gains). In addition, MLIC will be permitted to pay a dividend to MetLife, Inc. in excess of the amounts allowed under both standards only if it files notice of its intention to declare such a dividend and the amount thereof with the New York Superintendent of Financial Services (the “Superintendent”) and the Superintendent either approves the distribution of the dividend or does not disapprove the dividend within 30 days of its filing. Under New York Insurance Law, the Superintendent has broad discretion in determining whether the financial condition of a stock life insurance company would support the payment of such dividends to its stockholders.
336
MetLife, Inc.
Notes to the Consolidated Financial Statements — (continued)
16. Equity (continued)
Under Delaware Insurance Code, each of American Life, MetLife USA and Metropolitan Tower Life Insurance Company (“MTL”) is permitted, without prior insurance regulatory clearance, to pay a stockholder dividend to MetLife, Inc. as long as the amount of the dividend, when aggregated with all other dividends in the preceding 12 months, does not exceed the greater of: (i) 10% of its surplus to policyholders as of the end of the immediately preceding calendar year, or (ii) its net statutory gain from operations for the immediately preceding calendar year (excluding realized capital gains), not including pro rata distributions of each insurer's own securities. Each of American Life, MetLife USA, and MTL will be permitted to pay a dividend to MetLife, Inc. in excess of the greater of such two amounts only if it files notice of the declaration of such a dividend and the amount thereof with the Delaware Commissioner of Insurance (the “Delaware Commissioner”) and the Delaware Commissioner either approves the distribution of the dividend or does not disapprove the distribution within 30 days of its filing. In addition, any dividend that exceeds earned surplus (defined as “unassigned funds (surplus)”) as of the immediately preceding calendar year requires insurance regulatory approval. Under Delaware Insurance Code, the Delaware Commissioner has broad discretion in determining whether the financial condition of a stock life insurance company would support the payment of such dividends to its stockholders.
Under the Rhode Island Insurance Code, Metropolitan Property and Casualty Insurance Company (“MPC”) is permitted, without prior insurance regulatory clearance, to pay a stockholder dividend to MetLife, Inc. as long as the aggregate amount of all such dividends in any 12 month period does not exceed the lesser of: (i) 10% of its surplus to policyholders as of the end of the immediately preceding calendar year, or (ii) net income, not including realized capital gains, for the immediately preceding calendar year, not including pro rata distributions of MPC’s own securities. In determining whether a dividend is extraordinary, MPC may include carry forward net income from the previous two calendar years, excluding realized capital gains less dividends paid in the second and immediately preceding calendar years. MPC will be permitted to pay a dividend to MetLife, Inc. in excess of the lesser of such two amounts only if it files notice of its intention to declare such a dividend and the amount thereof with the Rhode Island Commissioner of Insurance (the “Rhode Island Commissioner”) and the Rhode Island Commissioner either approves the distribution of the dividend or does not disapprove the distribution within 30 days of its filing. Under the Rhode Island Insurance Code, the Rhode Island Commissioner has broad discretion in determining whether the financial condition of a stock property and casualty insurance company would support the payment of such dividends to its stockholders.
Under Massachusetts State Insurance Law, NELICO is permitted, without prior insurance regulatory clearance, to pay a stockholder dividend to MetLife, Inc. as long as the amount of the dividend, when aggregated with all other dividends paid in the preceding 12 months, does not exceed the greater of: (i) 10% of its surplus to policyholders as of the end of the immediately preceding calendar year; or (ii) its statutory net gain from operations for the immediately preceding calendar year, not including pro rata distributions of NELICO’s own securities. NELICO will be permitted to pay a dividend to MetLife, Inc. in excess of the greater of such two amounts only if it files notice of the declaration of such a dividend and the amount thereof with the Massachusetts Commissioner of Insurance (the “Massachusetts Commissioner”) and the Massachusetts Commissioner either approves the distribution of the dividend or does not disapprove the distribution within 30 days of its filing. In addition, any dividend that exceeds earned surplus (defined as “unassigned funds (surplus)”) as of the last filed annual statutory statement requires insurance regulatory approval. Under Massachusetts State Insurance Law, the Massachusetts Commissioner has broad discretion in determining whether the financial condition of a stock life insurance company would support the payment of such dividends to its stockholders.
Under Missouri State Insurance Law, GALIC is permitted, without prior insurance regulatory clearance, to pay a stockholder dividend to MetLife, Inc. as long as the amount of such dividend when aggregated with all other dividends in the preceding 12 months, does not exceed the greater of: (i) 10% of its surplus to policyholders as of the end of the immediately preceding calendar year; or (ii) its statutory net gain from operations for the immediately preceding calendar year (excluding net realized capital gains), not including pro rata distributions of GALIC’s own securities. GALIC will be permitted to pay a dividend to MetLife, Inc. in excess of the greater of such two amounts only if it files notice of the declaration of such a dividend and the amount thereof with the Missouri Director of Insurance (the “Missouri Director”) and the Missouri Director either approves the distribution of the dividend or does not disapprove the distribution within 30 days of its filing. In addition, any dividend that exceeds earned surplus (defined by us to mean “unassigned funds (surplus)”) as of the last filed annual statutory statement requires insurance regulatory approval. Under Missouri State Insurance Law, the Missouri Director has broad discretion in determining whether the financial condition of a stock life insurance company would support the payment of such dividends to its stockholders.
337
MetLife, Inc.
Notes to the Consolidated Financial Statements — (continued)
16. Equity (continued)
MetLife, Inc.
In addition to regulatory restrictions on the payment of dividends by its insurance subsidiaries to MetLife, Inc., the payment of dividends by MetLife, Inc. to its stockholders is also subject to other restrictions. The declaration and payment of dividends is subject to the discretion of MetLife, Inc.’s Board of Directors, and will depend on its financial condition, results of operations, cash requirements, future prospects and other factors deemed relevant by the Board. In addition, the payment of dividends on MetLife, Inc.’s common stock, and MetLife, Inc.’s ability to repurchase its common stock, may be subject to restrictions described below arising out of (i) potential regulation by the Board of Governors of the Federal Reserve System (the “Federal Reserve Board”) and the Federal Reserve Bank of New York (collectively, with the Federal Reserve Board, the “Federal Reserve”) if MetLife, Inc. were re-designated by the Financial Stability Oversight Council (“FSOC”) as a non-bank systemically important financial institution (“non-bank SIFI”), and (ii) restrictions under the terms of MetLife, Inc.’s preferred stock and junior subordinated debentures in situations where MetLife, Inc. may be experiencing financial stress, as described below. For purposes of this discussion, “junior subordinated debentures” are deemed to include MetLife, Inc.’s Fixed-to-Floating Rate Exchangeable Surplus Trust Securities, as discussed in Note 14.
Regulatory Restriction
s. On December 18, 2014, the FSOC designated MetLife, Inc. as a non-bank SIFI subject to regulation by the Federal Reserve and the Federal Deposit Insurance Corporation, and to enhanced supervision and prudential standards. On January 13, 2015, MetLife, Inc. filed an action in the U.S. District Court for the District of Columbia (“D.C. District Court”) asking the court to review and rescind the FSOC’s designation of MetLife, Inc. as a non-bank SIFI. On March 30, 2016, the D.C. District Court ordered that the designation of MetLife, Inc. as a non-bank SIFI by the FSOC be rescinded. On April 8, 2016, the FSOC appealed the D.C. District Court’s order to the United States Court of Appeals for the District of Columbia, and oral argument was heard on October 24, 2016.
If the FSOC prevails on appeal or re-designates MetLife, Inc. as systemically important as part of its ongoing review of non-bank financial companies, MetLife, Inc. could once again be subject to supervision by the Federal Reserve Board and subject to enhanced prudential standards which the Dodd-Frank Wall Street Reform and Consumer Protection Act (“Dodd-Frank”) requires the Federal Reserve Board to adopt. These enhanced prudential standards include RBC requirements and leverage limits, liquidity requirements, overall risk management requirements, resolution plan and credit exposure report requirements, and concentration limits. Dodd-Frank also authorizes the Federal Reserve Board to adopt other standards applicable to non-bank SIFIs, including contingent capital requirements, enhanced public disclosures, short-term debt limits, and other appropriate standards. In addition, non-bank SIFIs are subject to stress testing and must pay a variety of assessments. The Federal Reserve Board has not yet fully implemented most of the standards that will apply to non-bank SIFIs. Accordingly, the manner in which the ultimate standards might apply to MetLife, Inc., were it to be re-designated as a non-bank SIFI, and the full impact of such standards, remains unclear. If MetLife, Inc. were to be re-designated as a non-bank SIFI, however, it is possible that such regulations could constrain MetLife, Inc.’s ability to pay dividends, repurchase common stock or other securities or engage in other transactions that could affect its capital, or cause the Company to raise the price of the products it offers, reduce the amount of risk it takes on, or stop offering certain products altogether. However, following the transition occurring in the United States government and the priorities of the Trump Administration, the Company cannot predict with certainty whether any such regulations will be adopted.
On January 12, 2016, MetLife, Inc. announced its plan to pursue the Separation. See Note 2. There can be no assurance that any actions taken in furtherance of this plan will affect any decision the FSOC may make to re-designate MetLife, Inc. as a non-bank SIFI.
MetLife, Inc. has also been designated as a global systemically important insurer by the Financial Stability Board. As such, it could be subject to enhanced capital standards and supervision and other additional requirements that would not apply to companies that are not so designated. These policy proposals would need to be implemented by legislation or regulation in each applicable jurisdiction, and the impact on MetLife, Inc. is uncertain.
338
MetLife, Inc.
Notes to the Consolidated Financial Statements — (continued)
16. Equity (continued)
“
Dividend Stopper
”
Provisions in the Preferred Stock and Junior Subordinated Debentures
. Certain terms of MetLife, Inc.’s preferred stock and junior subordinated debentures (sometimes referred to as “dividend stoppers”) may prevent it from repurchasing its common or preferred stock or paying dividends on its common or preferred stock in certain circumstances. If MetLife, Inc. has not paid the full dividends on its preferred stock for the latest completed divided period, MetLife, Inc. may not repurchase or pay dividends on its common stock during a dividend period. Under the junior subordinated debentures, if MetLife, Inc. has not paid in full the accrued interest on its junior subordinated debentures through the most recent interest payment date, it may not repurchase or pay dividends on its common stock or other capital stock (including the preferred stock), subject to certain exceptions. The junior subordinated debentures provide that MetLife may, at its option and provided that certain conditions are met, defer payment of interest without giving rise to an event of default for periods of up to 10 years. In that case, after five years MetLife, Inc. would be obligated to use commercially reasonable efforts to sell equity securities to raise proceeds to pay the interest. MetLife, Inc. would not be subject to limitations on the number of deferral periods that MetLife, Inc. could begin, so long as all accrued and unpaid interest is paid with respect to prior deferral periods. If MetLife, Inc. were to defer payments of interest, the “dividend stopper” provisions in the junior subordinated debentures would thus prevent MetLife, Inc. from repurchasing or paying dividends on its common stock or other capital stock (including the preferred stock) during the period of deferral, subject to exceptions.
In addition, the preferred stock and the junior subordinated debentures contain provisions that would automatically suspend the payment of preferred stock dividends and interest on junior subordinated debentures if MetLife, Inc. fails to meet certain risk based capital ratio, net income and stockholders’ equity tests at specified times. In such cases, however, MetLife would be permitted to make the payments to the extent of the net proceeds from the issuance of certain securities during specified periods.
MetLife, Inc. is a party to certain RCCs which limit its ability to eliminate these restrictions through the repayment, redemption or purchase of preferred stock or junior subordinated debentures by requiring MetLife, Inc., with some limitations, to receive cash proceeds during a specified period from the sale of specified replacement securities prior to any repayment, redemption or purchase. See “— Preferred Stock” for a description of such covenants in effect with respect to the preferred stock, and
Note 14
for a description of such covenants in effect with respect to junior subordinated debentures.
339
MetLife, Inc.
Notes to the Consolidated Financial Statements — (continued)
16. Equity (continued)
Accumulated Other Comprehensive Income (Loss)
Information regarding changes in the balances of each component of AOCI attributable to MetLife, Inc., was as follows:
|
Unrealized
Investment Gains
(Losses), Net of
Related Offsets (1)
|
Unrealized Gains
(Losses) on
Derivatives
|
Foreign
Currency
Translation
Adjustments
|
Defined
Benefit
Plans
Adjustment
|
Total
|
|||||||||||||||
|
(In millions)
|
|||||||||||||||||||
|
Balance at December 31, 2013
|
$
|
8,183
|
|
$
|
231
|
|
$
|
(1,659
|
)
|
$
|
(1,651
|
)
|
$
|
5,104
|
|
||||
|
OCI before reclassifications
|
11,197
|
|
669
|
|
(1,492
|
)
|
(1,150
|
)
|
9,224
|
|
|||||||||
|
Deferred income tax benefit (expense)
|
(3,419
|
)
|
(261
|
)
|
(208
|
)
|
401
|
|
(3,487
|
)
|
|||||||||
|
AOCI before reclassifications, net of income tax
|
15,961
|
|
639
|
|
(3,359
|
)
|
(2,400
|
)
|
10,841
|
|
|||||||||
|
Amounts reclassified from AOCI
|
(811
|
)
|
717
|
|
77
|
|
180
|
|
163
|
|
|||||||||
|
Deferred income tax benefit (expense)
|
249
|
|
(280
|
)
|
(27
|
)
|
(63
|
)
|
(121
|
)
|
|||||||||
|
Amounts reclassified from AOCI, net of income tax
|
(562
|
)
|
437
|
|
50
|
|
117
|
|
42
|
|
|||||||||
|
Sale of subsidiary (2)
|
(320
|
)
|
—
|
|
6
|
|
—
|
|
(314
|
)
|
|||||||||
|
Deferred income tax benefit (expense)
|
80
|
|
—
|
|
—
|
|
—
|
|
80
|
|
|||||||||
|
Sale of subsidiary, net of income tax
|
(240
|
)
|
—
|
|
6
|
|
—
|
|
(234
|
)
|
|||||||||
|
Balance at December 31, 2014
|
15,159
|
|
1,076
|
|
(3,303
|
)
|
(2,283
|
)
|
10,649
|
|
|||||||||
|
OCI before reclassifications
|
(7,218
|
)
|
(19
|
)
|
(1,646
|
)
|
125
|
|
(8,758
|
)
|
|||||||||
|
Deferred income tax benefit (expense)
|
2,519
|
|
6
|
|
(1
|
)
|
(43
|
)
|
2,481
|
|
|||||||||
|
AOCI before reclassifications, net of income tax
|
10,460
|
|
1,063
|
|
(4,950
|
)
|
(2,201
|
)
|
4,372
|
|
|||||||||
|
Amounts reclassified from AOCI
|
(223
|
)
|
608
|
|
—
|
|
229
|
|
614
|
|
|||||||||
|
Deferred income tax benefit (expense)
|
78
|
|
(213
|
)
|
—
|
|
(80
|
)
|
(215
|
)
|
|||||||||
|
Amounts reclassified from AOCI, net of income tax
|
(145
|
)
|
395
|
|
—
|
|
149
|
|
399
|
|
|||||||||
|
Balance at December 31, 2015
|
10,315
|
|
1,458
|
|
(4,950
|
)
|
(2,052
|
)
|
4,771
|
|
|||||||||
|
OCI before reclassifications
|
764
|
|
344
|
|
(476
|
)
|
(62
|
)
|
570
|
|
|||||||||
|
Deferred income tax benefit (expense)
|
(325
|
)
|
(100
|
)
|
114
|
|
24
|
|
(287
|
)
|
|||||||||
|
AOCI before reclassifications, net of income tax
|
10,754
|
|
1,702
|
|
(5,312
|
)
|
(2,090
|
)
|
5,054
|
|
|||||||||
|
Amounts reclassified from AOCI
|
21
|
|
229
|
|
—
|
|
193
|
|
443
|
|
|||||||||
|
Deferred income tax benefit (expense)
|
(9
|
)
|
(66
|
)
|
—
|
|
(75
|
)
|
(150
|
)
|
|||||||||
|
Amounts reclassified from AOCI, net of income tax
|
12
|
|
163
|
|
—
|
|
118
|
|
293
|
|
|||||||||
|
Balance at December 31, 2016
|
$
|
10,766
|
|
$
|
1,865
|
|
$
|
(5,312
|
)
|
$
|
(1,972
|
)
|
$
|
5,347
|
|
||||
__________________
|
(1)
|
See
Note 8
for information on offsets to investments related to future policy benefits, DAC, VOBA and DSI, and the policyholder dividend obligation.
|
|
(2)
|
See
Note 3
.
|
340
MetLife, Inc.
Notes to the Consolidated Financial Statements — (continued)
16. Equity (continued)
Information regarding amounts reclassified out of each component of AOCI was as follows:
|
AOCI Components
|
Amounts Reclassified from AOCI
|
Consolidated Statement of
Operations and
Comprehensive Income (Loss)
Locations
|
||||||||||||
|
Years Ended December 31,
|
||||||||||||||
|
2016
|
2015
|
2014
|
||||||||||||
|
(In millions)
|
||||||||||||||
|
Net unrealized investment gains (losses):
|
||||||||||||||
|
Net unrealized investment gains (losses)
|
$
|
(30
|
)
|
$
|
129
|
|
$
|
603
|
|
Net investment gains (losses)
|
||||
|
Net unrealized investment gains (losses)
|
42
|
|
49
|
|
67
|
|
Net investment income
|
|||||||
|
Net unrealized investment gains (losses)
|
(33
|
)
|
45
|
|
141
|
|
Net derivative gains (losses)
|
|||||||
|
Net unrealized investment gains (losses), before income tax
|
(21
|
)
|
223
|
|
811
|
|
||||||||
|
Income tax (expense) benefit
|
9
|
|
(78
|
)
|
(249
|
)
|
||||||||
|
Net unrealized investment gains (losses), net of income tax
|
(12
|
)
|
145
|
|
562
|
|
||||||||
|
Unrealized gains (losses) on derivatives - cash flow hedges:
|
||||||||||||||
|
Interest rate swaps
|
89
|
|
85
|
|
42
|
|
Net derivative gains (losses)
|
|||||||
|
Interest rate swaps
|
15
|
|
12
|
|
9
|
|
Net investment income
|
|||||||
|
Interest rate forwards
|
1
|
|
6
|
|
(7
|
)
|
Net derivative gains (losses)
|
|||||||
|
Interest rate forwards
|
6
|
|
5
|
|
4
|
|
Net investment income
|
|||||||
|
Interest rate forwards
|
1
|
|
2
|
|
2
|
|
Other expenses
|
|||||||
|
Foreign currency swaps
|
(345
|
)
|
(720
|
)
|
(768
|
)
|
Net derivative gains (losses)
|
|||||||
|
Foreign currency swaps
|
(2
|
)
|
(1
|
)
|
(2
|
)
|
Net investment income
|
|||||||
|
Foreign currency swaps
|
2
|
|
1
|
|
2
|
|
Other expenses
|
|||||||
|
Credit forwards
|
3
|
|
1
|
|
—
|
|
Net derivative gains (losses)
|
|||||||
|
Credit forwards
|
1
|
|
1
|
|
1
|
|
Net investment income
|
|||||||
|
Gains (losses) on cash flow hedges, before income tax
|
(229
|
)
|
(608
|
)
|
(717
|
)
|
||||||||
|
Income tax (expense) benefit
|
66
|
|
213
|
|
280
|
|
||||||||
|
Gains (losses) on cash flow hedges, net of income tax
|
(163
|
)
|
(395
|
)
|
(437
|
)
|
||||||||
|
Foreign currency translation adjustment
|
—
|
|
—
|
|
(77
|
)
|
Net investment gains (losses)
|
|||||||
|
Income tax (expense) benefit
|
—
|
|
—
|
|
27
|
|
||||||||
|
Foreign currency translation adjustment, net of income tax
|
—
|
|
—
|
|
(50
|
)
|
||||||||
|
Defined benefit plans adjustment: (1)
|
||||||||||||||
|
Amortization of net actuarial gains (losses)
|
(199
|
)
|
(233
|
)
|
(180
|
)
|
||||||||
|
Amortization of prior service (costs) credit
|
6
|
|
4
|
|
—
|
|
||||||||
|
Amortization of defined benefit plan items, before income tax
|
(193
|
)
|
(229
|
)
|
(180
|
)
|
||||||||
|
Income tax (expense) benefit
|
75
|
|
80
|
|
63
|
|
||||||||
|
Amortization of defined benefit plan items, net of income tax
|
(118
|
)
|
(149
|
)
|
(117
|
)
|
||||||||
|
Total reclassifications, net of income tax
|
$
|
(293
|
)
|
$
|
(399
|
)
|
$
|
(42
|
)
|
|||||
__________________
|
(1)
|
These AOCI components are included in the computation of net periodic benefit costs. See
Note 18
.
|
341
17. Other Expenses
Information on other expenses was as follows:
|
Years Ended December 31,
|
||||||||||||
|
2016
|
2015
|
2014
|
||||||||||
|
(In millions)
|
||||||||||||
|
Compensation
|
$
|
4,785
|
|
$
|
4,938
|
|
$
|
4,894
|
|
|||
|
Pension, postretirement and postemployment benefit costs
|
415
|
|
400
|
|
473
|
|
||||||
|
Commissions
|
4,311
|
|
4,517
|
|
5,153
|
|
||||||
|
Volume-related costs
|
934
|
|
1,002
|
|
859
|
|
||||||
|
Capitalization of DAC
|
(3,589
|
)
|
(3,837
|
)
|
(4,183
|
)
|
||||||
|
Amortization of DAC and VOBA
|
2,641
|
|
3,936
|
|
4,132
|
|
||||||
|
Amortization of negative VOBA
|
(269
|
)
|
(361
|
)
|
(442
|
)
|
||||||
|
Interest expense on debt
|
1,201
|
|
1,208
|
|
1,216
|
|
||||||
|
Premium taxes, licenses and fees
|
750
|
|
766
|
|
801
|
|
||||||
|
Professional services
|
1,550
|
|
1,511
|
|
1,457
|
|
||||||
|
Rent and related expenses, net of sublease income
|
364
|
|
328
|
|
361
|
|
||||||
|
Other (1)
|
1,976
|
|
2,361
|
|
2,370
|
|
||||||
|
Total other expenses (2)
|
$
|
15,069
|
|
$
|
16,769
|
|
$
|
17,091
|
|
|||
__________________
|
(1)
|
See
Note 19
for information on the charge related to income tax for the year ended December 31, 2015.
|
|
(2)
|
Includes
$212 million
of expenses, primarily in professional services, for the year ended December 31, 2016 in connection with the Separation. See
Note 2
for further information on the Separation.
|
Capitalization of DAC and Amortization of DAC and VOBA
See
Note 5
for additional information on DAC and VOBA including impacts of capitalization and amortization. See also
Note 7
for a description of the DAC amortization impact associated with the closed block.
Interest Expense on Debt
See Notes
12
,
13
, and
14
for attribution of interest expense by debt issuance. Interest expense on debt includes interest expense related to CSEs. See
Note 8
.
Restructuring Charges
The Company announced in 2016 a unit cost improvement program related to the Company’s refreshed enterprise strategy. This global strategy focuses on transforming the Company to become more digital, driving efficiencies and innovation to achieve competitive advantage, and simplified, decreasing the costs and risks associated with the Company’s highly complex industry to customers and shareholders. For the year ended December 31, 2016, the Company recorded
$35 million
, primarily related to severance, in other expenses. As the expenses relate to an enterprise-wide initiative, they are reported in Corporate & Other. Management anticipates further restructuring charges through the year ending December 31, 2019. However, such restructuring plans were not sufficiently developed to enable management to make an estimate of such restructuring charges at December 31, 2016.
342
MetLife, Inc.
Notes to the Consolidated Financial Statements — (continued)
17. Other Expenses (continued)
In 2016, the Company completed a previous enterprise-wide strategic initiative. These restructuring charges are included in other expenses. As the expenses relate to an enterprise-wide initiative, they are reported in Corporate & Other. Information regarding restructuring charges was as follows:
|
Years Ended December 31,
|
||||||||||||||||||||||||||||||||||||
|
2016
|
2015
|
2014
|
||||||||||||||||||||||||||||||||||
|
Severance
|
Lease and
Asset
Impairment
|
Total
|
Severance
|
Lease and
Asset
Impairment
|
Total
|
Severance
|
Lease and
Asset
Impairment
|
Total
|
||||||||||||||||||||||||||||
|
|
(In millions)
|
|||||||||||||||||||||||||||||||||||
|
Balance at January 1,
|
$
|
18
|
|
$
|
4
|
|
$
|
22
|
|
$
|
31
|
|
$
|
6
|
|
$
|
37
|
|
$
|
40
|
|
$
|
6
|
|
$
|
46
|
|
|||||||||
|
Restructuring charges
|
—
|
|
1
|
|
1
|
|
60
|
|
4
|
|
64
|
|
83
|
|
8
|
|
91
|
|
||||||||||||||||||
|
Cash payments
|
(17
|
)
|
(4
|
)
|
(21
|
)
|
(73
|
)
|
(6
|
)
|
(79
|
)
|
(92
|
)
|
(8
|
)
|
(100
|
)
|
||||||||||||||||||
|
Balance at December 31,
|
$
|
1
|
|
$
|
1
|
|
$
|
2
|
|
$
|
18
|
|
$
|
4
|
|
$
|
22
|
|
$
|
31
|
|
$
|
6
|
|
$
|
37
|
|
|||||||||
|
Total restructuring charges incurred since inception of initiative
|
$
|
383
|
|
$
|
47
|
|
$
|
430
|
|
$
|
383
|
|
$
|
46
|
|
$
|
429
|
|
$
|
323
|
|
$
|
42
|
|
$
|
365
|
|
|||||||||
18. Employee Benefit Plans
Pension and Other Postretirement Benefit Plans
Certain subsidiaries of MetLife, Inc. sponsor and/or administer various U.S. qualified and nonqualified defined benefit pension plans and other postretirement employee benefit plans covering employees and sales representatives who meet specified eligibility requirements. U.S. pension benefits are provided utilizing either a traditional formula or cash balance formula. The traditional formula provides benefits that are primarily based upon years of credited service and either final average or career average earnings. The cash balance formula utilizes hypothetical or notional accounts which credit participants with benefits equal to a percentage of eligible pay, as well as interest credits, determined annually based upon the annual rate of interest on 30-year U.S. Treasury securities, for each account balance. The U.S. nonqualified pension plans provide supplemental benefits in excess of limits applicable to a qualified plan. The non-U.S. pension plans generally provide benefits based upon either years of credited service and earnings preceding-retirement or points earned on job grades and other factors in years of service.
These subsidiaries also provide certain postemployment benefits and certain postretirement medical and life insurance benefits for U.S. retired employees. Employees of these subsidiaries who were hired prior to 2003 (or, in certain cases, rehired during or after 2003) and meet age and service criteria while working for one of the subsidiaries may become eligible for these other postretirement benefits, at various levels, in accordance with the applicable plans. Virtually all retirees, or their beneficiaries, contribute a portion of the total costs of postretirement medical benefits. Employees hired after 2003 are not eligible for any employer subsidy for postretirement medical benefits.
343
MetLife, Inc.
Notes to the Consolidated Financial Statements — (continued)
18. Employee Benefit Plans (continued)
The benefit obligations, funded status and net periodic benefit costs related to these pension and other postretirement benefits were comprised of the following:
|
December 31, 2016
|
December 31, 2015
|
||||||||||||||||||||||||||||||||||||||||||||||
|
Pension Benefits
|
Other Postretirement
Benefits
|
Pension Benefits
|
Other Postretirement
Benefits
|
||||||||||||||||||||||||||||||||||||||||||||
|
U.S.
Plans
|
Non-
U.S.
Plans
|
Total
|
U.S.
Plans
|
Non-
U.S.
Plans
|
Total
|
U.S.
Plans
|
Non-
U.S.
Plans
|
Total
|
U.S.
Plans
|
Non-
U.S.
Plans
|
Total
|
||||||||||||||||||||||||||||||||||||
|
(In millions)
|
|||||||||||||||||||||||||||||||||||||||||||||||
|
Benefit obligations
|
$
|
10,078
|
|
$
|
882
|
|
$
|
10,960
|
|
$
|
1,771
|
|
$
|
25
|
|
$
|
1,796
|
|
$
|
9,759
|
|
$
|
747
|
|
$
|
10,506
|
|
$
|
1,895
|
|
$
|
29
|
|
$
|
1,924
|
|
|||||||||||
|
Estimated fair value of plan assets
|
8,876
|
|
288
|
|
9,164
|
|
1,379
|
|
7
|
|
1,386
|
|
8,490
|
|
261
|
|
8,751
|
|
1,373
|
|
9
|
|
1,382
|
|
|||||||||||||||||||||||
|
Over (under) funded status
|
$
|
(1,202
|
)
|
$
|
(594
|
)
|
$
|
(1,796
|
)
|
$
|
(392
|
)
|
$
|
(18
|
)
|
$
|
(410
|
)
|
$
|
(1,269
|
)
|
$
|
(486
|
)
|
$
|
(1,755
|
)
|
$
|
(522
|
)
|
$
|
(20
|
)
|
$
|
(542
|
)
|
|||||||||||
|
Net periodic benefit costs
|
$
|
280
|
|
$
|
81
|
|
$
|
361
|
|
$
|
50
|
|
$
|
2
|
|
$
|
52
|
|
$
|
273
|
|
$
|
73
|
|
$
|
346
|
|
$
|
63
|
|
$
|
6
|
|
$
|
69
|
|
|||||||||||
344
MetLife, Inc.
Notes to the Consolidated Financial Statements — (continued)
18. Employee Benefit Plans (continued)
Obligations and Funded Status
|
December 31,
|
||||||||||||||||
|
2016
|
2015
|
|||||||||||||||
|
Pension
Benefits (1) |
Other
Postretirement
Benefits
|
Pension
Benefits (1) |
Other
Postretirement
Benefits
|
|||||||||||||
|
(In millions)
|
||||||||||||||||
|
Change in benefit obligations:
|
||||||||||||||||
|
Benefit obligations at January 1,
|
$
|
10,506
|
|
$
|
1,924
|
|
$
|
11,001
|
|
$
|
2,145
|
|
||||
|
Service costs
|
272
|
|
9
|
|
276
|
|
17
|
|
||||||||
|
Interest costs
|
432
|
|
84
|
|
423
|
|
90
|
|
||||||||
|
Plan participants’ contributions
|
—
|
|
33
|
|
—
|
|
30
|
|
||||||||
|
Net actuarial (gains) losses
|
367
|
|
(117
|
)
|
(627
|
)
|
(235
|
)
|
||||||||
|
Acquisition, divestitures, settlements and curtailments
|
(36
|
)
|
27
|
|
(4
|
)
|
(2
|
)
|
||||||||
|
Change in benefits
|
(11
|
)
|
(44
|
)
|
—
|
|
(7
|
)
|
||||||||
|
Benefits paid
|
(591
|
)
|
(117
|
)
|
(531
|
)
|
(109
|
)
|
||||||||
|
Effect of foreign currency translation
|
21
|
|
(3
|
)
|
(32
|
)
|
(5
|
)
|
||||||||
|
Benefit obligations at December 31,
|
10,960
|
|
1,796
|
|
10,506
|
|
1,924
|
|
||||||||
|
Change in plan assets:
|
||||||||||||||||
|
Estimated fair value of plan assets at January 1,
|
8,751
|
|
1,382
|
|
9,003
|
|
1,436
|
|
||||||||
|
Actual return on plan assets
|
630
|
|
75
|
|
(127
|
)
|
4
|
|
||||||||
|
Acquisition, divestitures and settlements
|
(7
|
)
|
(2
|
)
|
(3
|
)
|
(4
|
)
|
||||||||
|
Plan participants’ contributions
|
—
|
|
33
|
|
—
|
|
30
|
|
||||||||
|
Employer contributions
|
378
|
|
17
|
|
424
|
|
26
|
|
||||||||
|
Benefits paid
|
(591
|
)
|
(117
|
)
|
(531
|
)
|
(109
|
)
|
||||||||
|
Effect of foreign currency translation
|
3
|
|
(2
|
)
|
(15
|
)
|
(1
|
)
|
||||||||
|
Estimated fair value of plan assets at December 31,
|
9,164
|
|
1,386
|
|
8,751
|
|
1,382
|
|
||||||||
|
Over (under) funded status at December 31,
|
$
|
(1,796
|
)
|
$
|
(410
|
)
|
$
|
(1,755
|
)
|
$
|
(542
|
)
|
||||
|
Amounts recognized on the consolidated balance sheets:
|
||||||||||||||||
|
Other assets
|
$
|
5
|
|
$
|
1
|
|
$
|
5
|
|
$
|
1
|
|
||||
|
Other liabilities
|
(1,801
|
)
|
(411
|
)
|
(1,760
|
)
|
(543
|
)
|
||||||||
|
Net amount recognized
|
$
|
(1,796
|
)
|
$
|
(410
|
)
|
$
|
(1,755
|
)
|
$
|
(542
|
)
|
||||
|
AOCI:
|
||||||||||||||||
|
Net actuarial (gains) losses
|
$
|
2,993
|
|
$
|
89
|
|
$
|
2,945
|
|
$
|
222
|
|
||||
|
Prior service costs (credit)
|
(11
|
)
|
(49
|
)
|
—
|
|
(14
|
)
|
||||||||
|
AOCI, before income tax
|
$
|
2,982
|
|
$
|
40
|
|
$
|
2,945
|
|
$
|
208
|
|
||||
|
Accumulated benefit obligation
|
$
|
10,559
|
|
N/A
|
|
$
|
10,082
|
|
N/A
|
|
||||||
__________________
|
(1)
|
Includes nonqualified unfunded plans, for which the aggregate PBO was
$1.2 billion
and
$1.1 billion
at
December 31, 2016
and
2015
, respectively.
|
345
MetLife, Inc.
Notes to the Consolidated Financial Statements — (continued)
18. Employee Benefit Plans (continued)
Information for pension plans with PBOs in excess of plan assets and accumulated benefit obligations (“ABO”) in excess of plan assets was as follows at:
|
December 31,
|
|||||||||||||||
|
2016
|
2015
|
2016
|
2015
|
||||||||||||
|
PBO Exceeds Estimated Fair Value
of Plan Assets
|
ABO Exceeds Estimated Fair Value
of Plan Assets
|
||||||||||||||
|
(In millions)
|
|||||||||||||||
|
Projected benefit obligations
|
$
|
10,736
|
|
$
|
10,437
|
|
$
|
1,960
|
|
$
|
2,476
|
|
|||
|
Accumulated benefit obligations
|
$
|
10,384
|
|
$
|
10,052
|
|
$
|
1,851
|
|
$
|
2,340
|
|
|||
|
Estimated fair value of plan assets
|
$
|
8,979
|
|
$
|
8,715
|
|
$
|
228
|
|
$
|
839
|
|
|||
Net Periodic Benefit Costs
The components of net periodic benefit costs and other changes in plan assets and benefit obligations recognized in OCI were as follows:
|
Years Ended December 31,
|
|||||||||||||||||||||||
|
2016
|
2015
|
2014
|
|||||||||||||||||||||
|
Pension Benefits
|
Other Postretirement Benefits
|
Pension Benefits
|
Other Postretirement Benefits
|
Pension Benefits
|
Other Postretirement Benefits
|
||||||||||||||||||
|
(In millions)
|
|||||||||||||||||||||||
|
Net periodic benefit costs:
|
|||||||||||||||||||||||
|
Service costs
|
$
|
272
|
|
$
|
9
|
|
$
|
276
|
|
$
|
17
|
|
$
|
262
|
|
$
|
16
|
|
|||||
|
Interest costs
|
432
|
|
84
|
|
423
|
|
90
|
|
456
|
|
94
|
|
|||||||||||
|
Settlement and curtailment costs (1)
|
2
|
|
31
|
|
(1
|
)
|
3
|
|
19
|
|
4
|
|
|||||||||||
|
Expected return on plan assets
|
(535
|
)
|
(75
|
)
|
(542
|
)
|
(80
|
)
|
(482
|
)
|
(76
|
)
|
|||||||||||
|
Amortization of net actuarial (gains) losses
|
190
|
|
9
|
|
191
|
|
42
|
|
169
|
|
11
|
|
|||||||||||
|
Amortization of prior service costs (credit)
|
—
|
|
(6
|
)
|
(1
|
)
|
(3
|
)
|
1
|
|
(1
|
)
|
|||||||||||
|
Total net periodic benefit costs (credit)
|
361
|
|
52
|
|
346
|
|
69
|
|
425
|
|
48
|
|
|||||||||||
|
Other changes in plan assets and benefit obligations recognized in OCI:
|
|||||||||||||||||||||||
|
Net actuarial (gains) losses
|
238
|
|
(124
|
)
|
43
|
|
(161
|
)
|
960
|
|
223
|
|
|||||||||||
|
Prior service costs (credit)
|
(11
|
)
|
(41
|
)
|
—
|
|
(7
|
)
|
(20
|
)
|
(13
|
)
|
|||||||||||
|
Amortization of net actuarial (gains) losses
|
(190
|
)
|
(9
|
)
|
(191
|
)
|
(42
|
)
|
(169
|
)
|
(11
|
)
|
|||||||||||
|
Amortization of prior service (costs) credit
|
—
|
|
6
|
|
1
|
|
3
|
|
(1
|
)
|
1
|
|
|||||||||||
|
Total recognized in OCI
|
37
|
|
(168
|
)
|
(147
|
)
|
(207
|
)
|
770
|
|
200
|
|
|||||||||||
|
Total recognized in net periodic benefit costs and OCI
|
$
|
398
|
|
$
|
(116
|
)
|
$
|
199
|
|
$
|
(138
|
)
|
$
|
1,195
|
|
$
|
248
|
|
|||||
__________________
|
(1)
|
The Company recognized curtailment charges in 2016 on certain postretirement benefit plans in connection with the U.S Retail Advisor Force Divestiture. See Note
3
.
|
The estimated net actuarial (gains) losses and prior service costs (credit) for the defined benefit pension plans and other postretirement benefit plans that will be amortized from AOCI into net periodic benefit costs over the next year are
$177 million
and
($1) million
, and less than
($1) million
and
($22) million
, respectively.
346
MetLife, Inc.
Notes to the Consolidated Financial Statements — (continued)
18. Employee Benefit Plans (continued)
Assumptions
Assumptions used in determining benefit obligations for the U.S. plans were as follows:
|
Pension Benefits
|
Other Postretirement Benefits
|
|||||
|
December 31, 2016
|
||||||
|
Weighted average discount rate
|
4.30%
|
4.45%
|
||||
|
Rate of compensation increase
|
2.25
|
%
|
-
|
8.50%
|
N/A
|
|
|
December 31, 2015
|
||||||
|
Weighted average discount rate
|
4.50%
|
4.60%
|
||||
|
Rate of compensation increase
|
2.25
|
%
|
-
|
8.50%
|
N/A
|
|
Assumptions used in determining net periodic benefit costs for the U.S. Plans were as follows:
|
Pension Benefits
|
Other Postretirement Benefits
|
|||||
|
Year Ended December 31, 2016
|
||||||
|
Weighted average discount rate
|
4.13%
|
4.37%
|
||||
|
Weighted average expected rate of return on plan assets
|
6.00%
|
5.53%
|
||||
|
Rate of compensation increase
|
2.25
|
%
|
-
|
8.50%
|
N/A
|
|
|
Year Ended December 31, 2015
|
||||||
|
Weighted average discount rate
|
4.10%
|
4.10%
|
||||
|
Weighted average expected rate of return on plan assets
|
6.25%
|
5.70%
|
||||
|
Rate of compensation increase
|
2.25
|
%
|
-
|
8.50%
|
N/A
|
|
|
Year Ended December 31, 2014
|
||||||
|
Weighted average discount rate
|
5.15%
|
5.15%
|
||||
|
Weighted average expected rate of return on plan assets
|
6.25%
|
5.70%
|
||||
|
Rate of compensation increase
|
3.50
|
%
|
-
|
7.50%
|
N/A
|
|
The weighted average discount rate for the U.S. plans is determined annually based on the yield, measured on a yield to worst basis, of a hypothetical portfolio constructed of high quality debt instruments available on the valuation date, which would provide the necessary future cash flows to pay the aggregate PBO when due.
The weighted average expected rate of return on plan assets for the U.S. plans is based on anticipated performance of the various asset sectors in which the plans invest, weighted by target allocation percentages. Anticipated future performance is based on long-term historical returns of the plan assets by sector, adjusted for the long-term expectations on the performance of the markets. While the precise expected rate of return derived using this approach will fluctuate from year to year, the policy is to hold this long-term assumption constant as long as it remains within reasonable tolerance from the derived rate.
The weighted average expected rate of return on plan assets for use in that plan’s valuation in
2017
is currently anticipated to be
6.00%
for U.S. pension benefits and
5.35%
for U.S. other postretirement benefits.
The assumed healthcare costs trend rates used in measuring the APBO and net periodic benefit costs were as follows:
|
December 31,
|
|||||||||||
|
2016
|
2015
|
||||||||||
|
|
Before
Age 65
|
Age 65 and
older
|
Before
Age 65
|
Age 65 and
older
|
|||||||
|
Following year
|
6.8
|
%
|
13.0
|
%
|
6.3
|
%
|
10.3
|
%
|
|||
|
Ultimate rate to which cost increase is assumed to decline
|
4.0
|
%
|
4.3
|
%
|
4.2
|
%
|
4.6
|
%
|
|||
|
Year in which the ultimate trend rate is reached
|
2077
|
2092
|
2086
|
2091
|
|||||||
347
MetLife, Inc.
Notes to the Consolidated Financial Statements — (continued)
18. Employee Benefit Plans (continued)
Assumed healthcare costs trend rates may have a significant effect on the amounts reported for healthcare plans. A 1% change in assumed healthcare costs trend rates would have the following effects on the U.S. Plans as of
December 31, 2016
:
|
One Percent
Increase |
One Percent
Decrease |
|||||||
|
(In millions)
|
||||||||
|
Effect on total of service and interest costs components
|
$
|
12
|
|
$
|
(10
|
)
|
||
|
Effect of accumulated postretirement benefit obligations
|
$
|
215
|
|
$
|
(178
|
)
|
||
Plan Assets
Certain U.S. subsidiaries provide employees with benefits under various Employee Retirement Income Security Act of 1974 (“ERISA”) benefit plans. These include qualified pension plans, postretirement medical plans and certain retiree life insurance coverage. The assets of these U.S. subsidiaries’ qualified pension plans are held in an insurance group annuity contract, and the vast majority of the assets of the postretirement medical plan and backing the retiree life coverage are held in a trust which largely utilizes insurance contracts to hold the assets. All of these contracts are issued by the Company’s insurance affiliates, and the assets under the contracts are held in insurance separate accounts that have been established by the Company. The underlying assets of the separate accounts are principally comprised of cash and cash equivalents, short-term investments, fixed maturity and equity securities, derivatives, real estate, private equity investments and hedge fund investments.
The insurance contract provider engages investment management firms (“Managers”) to serve as sub-advisors for the separate accounts based on the specific investment needs and requests identified by the plan fiduciary. These Managers have portfolio management discretion over the purchasing and selling of securities and other investment assets pursuant to the respective investment management agreements and guidelines established for each insurance separate account. The assets of the qualified pension plans and postretirement medical plans (the “Invested Plans”) are well diversified across multiple asset categories and across a number of different Managers, with the intent of minimizing risk concentrations within any given asset category or with any of the given Managers.
The Invested Plans, other than those held in participant directed investment accounts, are managed in accordance with investment policies consistent with the longer-term nature of related benefit obligations and within prudent risk parameters. Specifically, investment policies are oriented toward (i) maximizing the Invested Plan’s funded status; (ii) minimizing the volatility of the Invested Plan’s funded status; (iii) generating asset returns that exceed liability increases; and (iv) targeting rates of return in excess of a custom benchmark and industry standards over appropriate reference time periods. These goals are expected to be met through identifying appropriate and diversified asset classes and allocations, ensuring adequate liquidity to pay benefits and expenses when due and controlling the costs of administering and managing the Invested Plan’s investments. Independent investment consultants are periodically used to evaluate the investment risk of the Invested Plan’s assets relative to liabilities, analyze the economic and portfolio impact of various asset allocations and management strategies and recommend asset allocations.
Derivative contracts may be used to reduce investment risk, to manage duration and to replicate the risk/return profile of an asset or asset class. Derivatives may not be used to leverage a portfolio in any manner, such as to magnify exposure to an asset, asset class, interest rates or any other financial variable. Derivatives are also prohibited for use in creating exposures to securities, currencies, indices or any other financial variable that is otherwise restricted.
348
MetLife, Inc.
Notes to the Consolidated Financial Statements — (continued)
18. Employee Benefit Plans (continued)
The table below summarizes the actual weighted average allocation of the estimated fair value of total plan assets by asset class at December 31 for the years indicated and the approved target allocation by major asset class at
December 31, 2016
for the Invested Plans:
|
December 31,
|
||||||||||||||||||
|
2016
|
2015
|
|||||||||||||||||
|
U.S. Pension
Benefits |
U.S. Other
Postretirement Benefits (2) |
U.S. Pension
Benefits
|
U.S. Other
Postretirement
Benefits (2)
|
|||||||||||||||
|
Target
|
Actual
Allocation |
Target
|
Actual
Allocation |
Actual
Allocation
|
Actual
Allocation
|
|||||||||||||
|
Asset Class (1)
|
||||||||||||||||||
|
Fixed maturity securities
|
82
|
%
|
81
|
%
|
76
|
%
|
76
|
%
|
75
|
%
|
75
|
%
|
||||||
|
Equity securities (3)
|
10
|
%
|
11
|
%
|
24
|
%
|
24
|
%
|
15
|
%
|
25
|
%
|
||||||
|
Alternative securities (4)
|
8
|
%
|
8
|
%
|
—
|
%
|
—
|
%
|
10
|
%
|
—
|
%
|
||||||
|
Total assets
|
100
|
%
|
100
|
%
|
100
|
%
|
100
|
%
|
||||||||||
__________________
|
(1)
|
Certain prior year amounts have been reclassified from alternative securities into fixed maturity securities to conform to the current year presentation.
|
|
(2)
|
U.S. other postretirement benefits do not reflect postretirement life’s plan assets invested in fixed maturity securities.
|
|
(3)
|
Equity securities percentage includes derivative assets.
|
|
(4)
|
Alternative securities primarily include hedges, private equity and real estate funds.
|
Estimated Fair Value
The pension and other postretirement benefit plan assets are categorized into a three-level fair value hierarchy, as described in
Note 10
, based upon the significant input with the lowest level in its valuation. The Level 2 asset category includes certain separate accounts that are primarily invested in liquid and readily marketable securities. The estimated fair value of such separate accounts is based upon reported NAV provided by fund managers and this value represents the amount at which transfers into and out of the respective separate account are effected. These separate accounts provide reasonable levels of price transparency and can be corroborated through observable market data. Directly held investments are primarily invested in U.S. and foreign government and corporate securities. The Level 3 asset category includes separate accounts that are invested in assets that provide little or no price transparency due to the infrequency with which the underlying assets trade and generally require additional time to liquidate in an orderly manner. Accordingly, the values for separate accounts invested in these alternative asset classes are based on inputs that cannot be readily derived from or corroborated by observable market data.
349
MetLife, Inc.
Notes to the Consolidated Financial Statements — (continued)
18. Employee Benefit Plans (continued)
The pension and other postretirement plan assets measured at estimated fair value on a recurring basis and their corresponding placement in the fair value hierarchy are summarized as follows:
|
December 31, 2016
|
||||||||||||||||||||||||||||||||
|
Pension Benefits
|
Other Postretirement Benefits
|
|||||||||||||||||||||||||||||||
|
Fair Value Hierarchy
|
Fair Value Hierarchy
|
|||||||||||||||||||||||||||||||
|
Level 1
|
Level 2
|
Level 3
|
Total
Estimated Fair Value |
Level 1
|
Level 2
|
Level 3
|
Total
Estimated Fair Value |
|||||||||||||||||||||||||
|
(In millions)
|
||||||||||||||||||||||||||||||||
|
Assets
|
||||||||||||||||||||||||||||||||
|
Fixed maturity securities:
|
||||||||||||||||||||||||||||||||
|
Corporate
|
$
|
—
|
|
$
|
3,552
|
|
$
|
—
|
|
$
|
3,552
|
|
$
|
20
|
|
$
|
306
|
|
$
|
—
|
|
$
|
326
|
|
||||||||
|
U.S. government bonds
|
1,694
|
|
4
|
|
—
|
|
1,698
|
|
210
|
|
1
|
|
—
|
|
211
|
|
||||||||||||||||
|
Foreign bonds
|
—
|
|
876
|
|
—
|
|
876
|
|
—
|
|
79
|
|
—
|
|
79
|
|
||||||||||||||||
|
Federal agencies
|
—
|
|
201
|
|
—
|
|
201
|
|
—
|
|
27
|
|
—
|
|
27
|
|
||||||||||||||||
|
Municipals
|
—
|
|
317
|
|
—
|
|
317
|
|
—
|
|
23
|
|
—
|
|
23
|
|
||||||||||||||||
|
Short-term investments
|
120
|
|
219
|
|
—
|
|
339
|
|
13
|
|
416
|
|
—
|
|
429
|
|
||||||||||||||||
|
Other (2)
|
—
|
|
367
|
|
9
|
|
376
|
|
—
|
|
55
|
|
—
|
|
55
|
|
||||||||||||||||
|
Total fixed maturity securities
|
1,814
|
|
|
5,536
|
|
|
9
|
|
|
7,359
|
|
|
243
|
|
|
907
|
|
|
—
|
|
|
1,150
|
|
|||||||||
|
Equity securities:
|
||||||||||||||||||||||||||||||||
|
Common stock - domestic
|
490
|
|
—
|
|
—
|
|
490
|
|
113
|
|
—
|
|
—
|
|
113
|
|
||||||||||||||||
|
Common stock - foreign
|
396
|
|
69
|
|
—
|
|
465
|
|
122
|
|
—
|
|
—
|
|
122
|
|
||||||||||||||||
|
Total equity securities
|
886
|
|
|
69
|
|
|
—
|
|
|
955
|
|
|
235
|
|
|
—
|
|
|
—
|
|
|
235
|
|
|||||||||
|
Other investments
|
30
|
|
105
|
|
637
|
|
772
|
|
—
|
|
—
|
|
—
|
|
—
|
|
||||||||||||||||
|
Derivative assets
|
16
|
|
(3
|
)
|
65
|
|
78
|
|
1
|
|
—
|
|
—
|
|
1
|
|
||||||||||||||||
|
Total assets
|
$
|
2,746
|
|
|
$
|
5,707
|
|
|
$
|
711
|
|
|
$
|
9,164
|
|
|
$
|
479
|
|
|
$
|
907
|
|
|
$
|
—
|
|
|
$
|
1,386
|
|
|
350
MetLife, Inc.
Notes to the Consolidated Financial Statements — (continued)
18. Employee Benefit Plans (continued)
|
December 31, 2015
|
||||||||||||||||||||||||||||||||
|
Pension Benefits
|
Other Postretirement Benefits
|
|||||||||||||||||||||||||||||||
|
Fair Value Hierarchy
|
Fair Value Hierarchy
|
|||||||||||||||||||||||||||||||
|
Level 1
|
Level 2
|
Level 3
|
Total
Estimated Fair Value |
Level 1
|
Level 2
|
Level 3
|
Total
Estimated Fair Value |
|||||||||||||||||||||||||
|
(In millions)
|
||||||||||||||||||||||||||||||||
|
Assets
|
||||||||||||||||||||||||||||||||
|
Fixed maturity securities:
|
||||||||||||||||||||||||||||||||
|
Corporate
|
$
|
—
|
|
$
|
2,979
|
|
$
|
78
|
|
$
|
3,057
|
|
$
|
18
|
|
$
|
281
|
|
$
|
1
|
|
$
|
300
|
|
||||||||
|
U.S. government bonds
|
994
|
|
493
|
|
—
|
|
1,487
|
|
193
|
|
12
|
|
—
|
|
205
|
|
||||||||||||||||
|
Foreign bonds
|
—
|
|
764
|
|
17
|
|
781
|
|
—
|
|
69
|
|
—
|
|
69
|
|
||||||||||||||||
|
Federal agencies
|
—
|
|
228
|
|
—
|
|
228
|
|
—
|
|
34
|
|
—
|
|
34
|
|
||||||||||||||||
|
Municipals
|
—
|
|
302
|
|
—
|
|
302
|
|
—
|
|
56
|
|
—
|
|
56
|
|
||||||||||||||||
|
Short-term investments (1)
|
10
|
|
309
|
|
—
|
|
319
|
|
1
|
|
431
|
|
—
|
|
432
|
|
||||||||||||||||
|
Other (1), (2)
|
9
|
|
403
|
|
7
|
|
419
|
|
—
|
|
47
|
|
—
|
|
47
|
|
||||||||||||||||
|
Total fixed maturity securities
|
1,013
|
|
|
5,478
|
|
|
102
|
|
|
6,593
|
|
|
212
|
|
|
930
|
|
|
1
|
|
|
1,143
|
|
|||||||||
|
Equity securities:
|
||||||||||||||||||||||||||||||||
|
Common stock - domestic
|
751
|
|
24
|
|
—
|
|
775
|
|
126
|
|
—
|
|
—
|
|
126
|
|
||||||||||||||||
|
Common stock - foreign
|
378
|
|
61
|
|
—
|
|
439
|
|
111
|
|
—
|
|
—
|
|
111
|
|
||||||||||||||||
|
Total equity securities
|
1,129
|
|
|
85
|
|
|
—
|
|
|
1,214
|
|
|
237
|
|
|
—
|
|
|
—
|
|
|
237
|
|
|||||||||
|
Other investments
|
32
|
|
84
|
|
723
|
|
839
|
|
—
|
|
—
|
|
—
|
|
—
|
|
||||||||||||||||
|
Derivative assets
|
26
|
|
3
|
|
76
|
|
105
|
|
2
|
|
—
|
|
—
|
|
2
|
|
||||||||||||||||
|
Total assets
|
$
|
2,200
|
|
|
$
|
5,650
|
|
|
$
|
901
|
|
|
$
|
8,751
|
|
|
$
|
451
|
|
|
$
|
930
|
|
|
$
|
1
|
|
|
$
|
1,382
|
|
|
__________________
|
(1)
|
The prior year amounts have been reclassified into fixed maturity securities to conform to the current year presentation.
|
|
(2)
|
Other primarily includes money market securities, mortgage-backed securities, collateralized mortgage obligations and ABS.
|
351
MetLife, Inc.
Notes to the Consolidated Financial Statements — (continued)
18. Employee Benefit Plans (continued)
A rollforward of all pension and other postretirement benefit plan assets measured at estimated fair value on a recurring basis using significant unobservable (Level 3) inputs was as follows:
|
Fair Value Measurements Using Significant Unobservable Inputs (Level 3)
|
||||||||||||||||||||
|
Pension Benefits
|
||||||||||||||||||||
|
Fixed Maturity Securities:
|
||||||||||||||||||||
|
Corporate
|
Foreign
Bonds
|
Other (1)
|
Other
Investments
|
Derivative
Assets
|
||||||||||||||||
|
(In millions)
|
||||||||||||||||||||
|
Balance, January 1, 2015
|
$
|
80
|
|
$
|
17
|
|
$
|
8
|
|
$
|
745
|
|
$
|
73
|
|
|||||
|
Realized gains (losses)
|
1
|
|
—
|
|
—
|
|
—
|
|
(11
|
)
|
||||||||||
|
Unrealized gains (losses)
|
(4
|
)
|
(1
|
)
|
2
|
|
55
|
|
(9
|
)
|
||||||||||
|
Purchases, sales, issuances and settlements, net
|
8
|
|
2
|
|
(1
|
)
|
(77
|
)
|
23
|
|
||||||||||
|
Transfers into and/or out of Level 3
|
(7
|
)
|
(1
|
)
|
(2
|
)
|
—
|
|
—
|
|
||||||||||
|
Balance, December 31, 2015
|
$
|
78
|
|
$
|
17
|
|
$
|
7
|
|
$
|
723
|
|
$
|
76
|
|
|||||
|
Realized gains (losses)
|
2
|
|
—
|
|
—
|
|
—
|
|
3
|
|
||||||||||
|
Unrealized gains (losses)
|
3
|
|
(3
|
)
|
—
|
|
33
|
|
(18
|
)
|
||||||||||
|
Purchases, sales, issuances and settlements, net
|
(21
|
)
|
(3
|
)
|
—
|
|
(119
|
)
|
6
|
|
||||||||||
|
Transfers into and/or out of Level 3
|
(62
|
)
|
(11
|
)
|
2
|
|
—
|
|
(2
|
)
|
||||||||||
|
Balance, December 31, 2016
|
$
|
—
|
|
$
|
—
|
|
$
|
9
|
|
$
|
637
|
|
$
|
65
|
|
|||||
__________________
|
(1)
|
Other includes ABS and collateralized mortgage obligations.
|
Other postretirement benefit plan assets measured at estimated fair value on a recurring basis using significant unobservable (Level 3) inputs were not significant for the years ended
December 31, 2016
and
2015
.
Expected Future Contributions and Benefit Payments
It is the subsidiaries’ practice to make contributions to the U.S. qualified pension plan to comply with minimum funding requirements of ERISA. In accordance with such practice, no contributions are required for
2017
. The subsidiaries expect to make discretionary contributions to the qualified pension plan of
$225 million
in
2017
. For information on employer contributions, see “— Obligations and Funded Status.”
Benefit payments due under the U.S. nonqualified pension plans are primarily funded from the subsidiaries’ general assets as they become due under the provision of the plans, therefore benefit payments equal employer contributions. The U.S. subsidiaries expect to make contributions of
$75 million
to fund the benefit payments in
2017
.
Postretirement benefits are either: (i) not vested under law; (ii) a non-funded obligation of the subsidiaries; or (iii) both. Current regulations do not require funding for these benefits. The subsidiaries use their general assets, net of participant’s contributions, to pay postretirement medical claims as they come due. As permitted under the terms of the governing trust document, the subsidiaries may be reimbursed from plan assets for postretirement medical claims paid from their general assets. The U.S. subsidiaries expect to make contributions of
$50 million
towards benefit obligations in
2017
to pay postretirement medical claims.
352
MetLife, Inc.
Notes to the Consolidated Financial Statements — (continued)
18. Employee Benefit Plans (continued)
Gross benefit payments for the next 10 years, which reflect expected future service where appropriate, are expected to be as follows:
|
Pension Benefits
|
Other Postretirement Benefits
|
|||||||
|
(In millions)
|
||||||||
|
2017
|
$
|
579
|
|
$
|
89
|
|
||
|
2018
|
$
|
600
|
|
$
|
91
|
|
||
|
2019
|
$
|
617
|
|
$
|
96
|
|
||
|
2020
|
$
|
639
|
|
$
|
99
|
|
||
|
2021
|
$
|
655
|
|
$
|
100
|
|
||
|
2022-2026
|
$
|
3,566
|
|
$
|
515
|
|
||
Additional Information
As previously discussed, most of the assets of the U.S. pension benefit plans are held in a group annuity contract issued by the subsidiaries while some of the assets of the U.S. postretirement benefit plans are held in a trust which largely utilizes life insurance contracts issued by the subsidiaries to hold such assets. Total revenues from these contracts recognized on the consolidated statements of operations were
$58 million
,
$55 million
and
$50 million
for the years ended
December 31, 2016
,
2015
and
2014
, respectively, and included policy charges and net investment income from investments backing the contracts and administrative fees. Total investment income (loss), including realized and unrealized gains (losses), credited to the account balances was
$672 million
,
($130) million
and
$1.2 billion
for the years ended
December 31, 2016
,
2015
and
2014
, respectively. The terms of these contracts are consistent in all material respects with those the subsidiaries offer to unaffiliated parties that are similarly situated.
Defined Contribution Plans
Certain subsidiaries sponsor defined contribution plans under which a portion of employee contributions are matched. These subsidiaries contributed
$81 million
,
$80 million
and
$77 million
for the years ended
December 31, 2016
,
2015
and
2014
, respectively.
353
19. Income Tax
The provision for income tax from continuing operations was as follows:
|
Years Ended December 31,
|
|||||||||||
|
2016
|
2015
|
2014
|
|||||||||
|
(In millions)
|
|||||||||||
|
Current:
|
|||||||||||
|
Federal
|
$
|
40
|
|
$
|
584
|
|
$
|
(56
|
)
|
||
|
State and local
|
3
|
|
10
|
|
9
|
|
|||||
|
Foreign
|
634
|
|
556
|
|
779
|
|
|||||
|
Subtotal
|
677
|
|
1,150
|
|
732
|
|
|||||
|
Deferred:
|
|||||||||||
|
Federal
|
(2,058
|
)
|
701
|
|
1,597
|
|
|||||
|
State and local
|
—
|
|
—
|
|
(1
|
)
|
|||||
|
Foreign
|
382
|
|
297
|
|
137
|
|
|||||
|
Subtotal
|
(1,676
|
)
|
998
|
|
1,733
|
|
|||||
|
Provision for income tax expense (benefit)
|
$
|
(999
|
)
|
$
|
2,148
|
|
$
|
2,465
|
|
||
The Company’s income (loss) from continuing operations before income tax expense (benefit) from domestic and foreign operations were as follows:
|
Years Ended December 31,
|
|||||||||||
|
2016
|
2015
|
2014
|
|||||||||
|
(In millions)
|
|||||||||||
|
Income (loss) from continuing operations:
|
|||||||||||
|
Domestic
|
$
|
(4,096
|
)
|
$
|
3,743
|
|
$
|
6,043
|
|
||
|
Foreign
|
3,901
|
|
3,727
|
|
2,761
|
|
|||||
|
Total
|
$
|
(195
|
)
|
$
|
7,470
|
|
$
|
8,804
|
|
||
354
MetLife, Inc.
Notes to the Consolidated Financial Statements — (continued)
19. Income Tax (continued)
The reconciliation of the income tax provision at the U.S. statutory rate to the provision for income tax as reported for continuing operations was as follows:
|
Years Ended December 31,
|
|||||||||||
|
2016
|
2015
|
2014
|
|||||||||
|
(In millions)
|
|||||||||||
|
Tax provision at U.S. statutory rate
|
$
|
(68
|
)
|
$
|
2,615
|
|
$
|
3,081
|
|
||
|
Tax effect of:
|
|||||||||||
|
Dividend received deduction
|
(192
|
)
|
(216
|
)
|
(204
|
)
|
|||||
|
Tax-exempt income
|
(88
|
)
|
(73
|
)
|
(92
|
)
|
|||||
|
Prior year tax (1)
|
11
|
|
555
|
|
21
|
|
|||||
|
Low income housing tax credits
|
(274
|
)
|
(225
|
)
|
(209
|
)
|
|||||
|
Other tax credits
|
(116
|
)
|
(80
|
)
|
(77
|
)
|
|||||
|
Foreign tax rate differential (2), (3), (4)
|
(315
|
)
|
(465
|
)
|
(118
|
)
|
|||||
|
Change in valuation allowance
|
(9
|
)
|
5
|
|
(3
|
)
|
|||||
|
Goodwill impairment
|
(12
|
)
|
—
|
|
—
|
|
|||||
|
Other, net
|
64
|
|
32
|
|
66
|
|
|||||
|
Provision for income tax expense (benefit)
|
$
|
(999
|
)
|
$
|
2,148
|
|
$
|
2,465
|
|
||
__________________
|
(1)
|
As discussed further below, for the year ended December 31, 2015, prior year tax includes a
$557 million
non-cash charge related to an uncertain tax position.
|
|
(2)
|
For the year ended December 31, 2016, foreign tax rate differential includes a tax benefit of
$110 million
in Japan related to a change in tax rate offset by a tax charge of
$19 million
in Chile related to a change in tax rate.
|
|
(3)
|
For the year ended December 31, 2015, foreign tax rate differential includes tax benefits of
$174 million
related to a Japan tax rate change,
$61 million
related to restructuring in Chile,
$57 million
related to the repatriation of earnings from Japan,
$41 million
related to certain non-portfolio net investment gains that were non-taxable and
$31 million
related to the devaluation of the peso in Argentina. These benefits were partially offset by charges of
$88 million
related to the impact of foreign exchange on investment gains in Argentina and
$36 million
as a result of a deferred tax liability true-up in Japan.
|
|
(4)
|
For the year ended December 31, 2014, foreign tax rate differential includes a tax charge of
$54 million
related to tax reform in Chile and
$45 million
related to the repatriation of earnings from Japan, partially offset by a tax benefit of
$13 million
related to the change in repatriation assumption for foreign earnings of the United Arab Emirates (“UAE”).
|
355
MetLife, Inc.
Notes to the Consolidated Financial Statements — (continued)
19. Income Tax (continued)
Deferred income tax represents the tax effect of the differences between the book and tax bases of assets and liabilities. Net deferred income tax assets and liabilities consisted of the following at:
|
December 31,
|
|||||||
|
2016
|
2015
|
||||||
|
(In millions)
|
|||||||
|
Deferred income tax assets:
|
|||||||
|
Policyholder liabilities and receivables
|
$
|
1,405
|
|
$
|
1,734
|
|
|
|
Net operating loss carryforwards
|
1,420
|
|
1,229
|
|
|||
|
Employee benefits
|
1,099
|
|
1,094
|
|
|||
|
Capital loss carryforwards
|
9
|
|
9
|
|
|||
|
Tax credit carryforwards
|
1,574
|
|
1,264
|
|
|||
|
Litigation-related and government mandated
|
256
|
|
260
|
|
|||
|
Other
|
798
|
|
858
|
|
|||
|
Total gross deferred income tax assets
|
6,561
|
|
6,448
|
|
|||
|
Less: Valuation allowance
|
161
|
|
203
|
|
|||
|
Total net deferred income tax assets
|
6,400
|
|
6,245
|
|
|||
|
Deferred income tax liabilities:
|
|||||||
|
Investments, including derivatives
|
2,615
|
|
4,469
|
|
|||
|
Intangibles
|
1,505
|
|
1,606
|
|
|||
|
Net unrealized investment gains
|
6,093
|
|
5,639
|
|
|||
|
DAC
|
5,367
|
|
5,000
|
|
|||
|
Other
|
187
|
|
123
|
|
|||
|
Total deferred income tax liabilities
|
15,767
|
|
16,837
|
|
|||
|
Net deferred income tax asset (liability)
|
$
|
(9,367
|
)
|
$
|
(10,592
|
)
|
|
The Company also has recorded a valuation allowance benefit of
$9 million
related to certain state and foreign net operating loss carryforwards for the year ended
December 31, 2016
. In addition, a
$10 million
reduction was related to foreign currency movement and a
$23 million
reduction was recorded as a balance sheet reclassification with other deferred tax assets for the year ended
December 31, 2016
. The valuation allowance reflects management’s assessment, based on available information, that it is more likely than not that the deferred income tax asset for certain foreign and state net operating loss carryforwards will not be realized. The tax benefit will be recognized when management believes that it is more likely than not that these deferred income tax assets are realizable.
356
MetLife, Inc.
Notes to the Consolidated Financial Statements — (continued)
19. Income Tax (continued)
The following table sets forth the domestic, state, and foreign net operating loss carryforwards and the domestic capital loss carryforwards for tax purposes at December 31,
2016
.
|
Net Operating Loss Carryforwards
|
Capital Loss Carryforwards
|
||||||||||||||
|
Domestic
|
State
|
Foreign
|
Domestic
|
||||||||||||
|
(In millions)
|
|||||||||||||||
|
Expiration:
|
|||||||||||||||
|
2017-2021
|
$
|
1
|
|
$
|
38
|
|
$
|
86
|
|
$
|
27
|
|
|||
|
2022-2026
|
—
|
|
59
|
|
36
|
|
—
|
|
|||||||
|
2027-2031
|
76
|
|
29
|
|
41
|
|
—
|
|
|||||||
|
2032-2036
|
3,805
|
|
2
|
|
(6
|
)
|
—
|
|
|||||||
|
Indefinite
|
—
|
|
—
|
|
354
|
|
—
|
|
|||||||
|
$
|
3,882
|
|
$
|
128
|
|
$
|
511
|
|
$
|
27
|
|
||||
The following table sets forth the general business credits, foreign tax credits, and other credit carryforwards for tax purposes at December 31,
2016
.
|
Tax Credit Carryforwards
|
|||||||||||
|
General Business
Credits
|
Foreign Tax
Credits
|
Other
|
|||||||||
|
(In millions)
|
|||||||||||
|
Expiration:
|
|||||||||||
|
2017-2021
|
$
|
—
|
|
$
|
—
|
|
$
|
—
|
|
||
|
2022-2026
|
—
|
|
611
|
|
—
|
|
|||||
|
2027-2031
|
181
|
|
—
|
|
—
|
|
|||||
|
2032-2036
|
669
|
|
—
|
|
—
|
|
|||||
|
Indefinite
|
—
|
|
9
|
|
384
|
|
|||||
|
$
|
850
|
|
$
|
620
|
|
$
|
384
|
|
|||
The Company has not provided U.S. deferred taxes on cumulative earnings of certain non-U.S. affiliates that have been reinvested indefinitely. These earnings relate to ongoing operations and have been reinvested in active non-U.S. business operations. The Company does not intend to repatriate these earnings to fund U.S. operations. Deferred taxes are provided for earnings of non-U.S. affiliates when the Company plans to remit those earnings. At December 31, 2016, the Company had not made a provision for U.S. taxes on approximately
$5.4 billion
of the excess of the amount for financial reporting over the tax bases of investments in foreign subsidiaries that are essentially permanent in duration. It is not practicable to estimate the amount of deferred tax liability related to investments in these foreign subsidiaries.
The Company considers the earnings of Japan and the Middle East (excluding the UAE and Turkey) to be available for repatriation. Earnings from the remaining foreign countries, including the UAE, are considered to be permanently reinvested.
357
MetLife, Inc.
Notes to the Consolidated Financial Statements — (continued)
19. Income Tax (continued)
The Company files income tax returns with the U.S. federal government and various state and local jurisdictions, as well as foreign jurisdictions. The Company is under continuous examination by the IRS and other tax authorities in jurisdictions in which the Company has significant business operations. The income tax years under examination vary by jurisdiction and subsidiary. The Company is no longer subject to U.S. federal, state, or local income tax examinations for years prior to 2007, except for i) 2000 through 2002 where the IRS disallowance relates to certain tax credits claimed - in April 2015, the Company received a Statutory Notice of Deficiency (the “Notice”) and paid the tax thereon in September 2015 (see note (1) below); and ii) 2003 through 2006, where the IRS disallowance relates predominantly to certain tax credits claimed and the Company is engaged with IRS Appeals. Management believes it has established adequate tax liabilities and final resolution for the years 2000 through 2006 is not expected to have a material impact on the Company’s consolidated financial statements. The IRS audit cycle for the years 2007-2009, which began in December of 2015, is scheduled to conclude in 2017. In material foreign jurisdictions, the Company is no longer subject to income tax examinations for years prior to 2009.
The Company’s liability for unrecognized tax benefits may increase or decrease in the next 12 months. A reasonable estimate of the increase or decrease cannot be made at this time. However, the Company continues to believe that the ultimate resolution of the pending issues will not result in a material change to its consolidated financial statements, although the resolution of income tax matters could impact the Company’s effective tax rate for a particular future period.
A reconciliation of the beginning and ending amount of unrecognized tax benefits was as follows:
|
Years Ended December 31,
|
|||||||||||
|
2016
|
2015
|
2014
|
|||||||||
|
(In millions)
|
|||||||||||
|
Balance at January 1,
|
$
|
1,323
|
|
$
|
779
|
|
$
|
774
|
|
||
|
Additions for tax positions of prior years (1)
|
26
|
|
579
|
|
74
|
|
|||||
|
Reductions for tax positions of prior years
|
(124
|
)
|
(24
|
)
|
(88
|
)
|
|||||
|
Additions for tax positions of current year
|
28
|
|
28
|
|
23
|
|
|||||
|
Reductions for tax positions of current year
|
—
|
|
(1
|
)
|
—
|
|
|||||
|
Settlements with tax authorities
|
(49
|
)
|
(38
|
)
|
(4
|
)
|
|||||
|
Balance at December 31,
|
$
|
1,204
|
|
$
|
1,323
|
|
$
|
779
|
|
||
|
Unrecognized tax benefits that, if recognized would impact the effective rate
|
$
|
1,170
|
|
$
|
1,268
|
|
$
|
690
|
|
||
__________________
|
(1)
|
The significant increase in 2015 is related to a non-cash charge the Company recorded to net income of
$792 million
, net of tax. The charge was related to an uncertain tax position and was comprised of a
$557 million
charge included in provision for income tax expense (benefit) and a
$362 million
(
$235 million
, net of tax) charge included in other expenses. This charge is the result of the Company’s consideration of recent decisions of the U.S. Court of Appeals for the Second Circuit upholding the disallowance of foreign tax credits claimed by other corporate entities not affiliated with the Company. The Company’s action relates to tax years from 2000 to 2009, during which MLIC held non-U.S. investments in support of its life insurance business through a United Kingdom investment subsidiary that was structured as a joint venture at the time.
|
The Company classifies interest accrued related to unrecognized tax benefits in interest expense, included within other expenses, while penalties are included in income tax expense.
358
MetLife, Inc.
Notes to the Consolidated Financial Statements — (continued)
19. Income Tax (continued)
Interest was as follows:
|
Years Ended December 31,
|
|||||||||||
|
2016
|
2015
|
2014
|
|||||||||
|
(In millions)
|
|||||||||||
|
Interest recognized on the consolidated statements of operations (1)
|
$
|
(42
|
)
|
$
|
388
|
|
$
|
26
|
|
||
|
December 31,
|
|||||||||||
|
2016
|
2015
|
||||||||||
|
(In millions)
|
|||||||||||
|
Interest included in other liabilities on the consolidated balance sheets (1)
|
$
|
629
|
|
$
|
671
|
|
|||||
__________________
|
(1)
|
The significant increase in 2015 is related to the non-cash charge discussed above.
|
The Company had insignificant penalties for the years ended December 31,
2016
,
2015
and
2014
.
There has been no change in the Company’s position on the disallowance of its foreign tax credits by the IRS. The Company continues to contest the disallowance of these foreign tax credits by the IRS as management believes the facts strongly support the Company’s position. The Company will defend its position vigorously and does not expect any additional charges related to this matter.
Also related to the aforementioned foreign tax credit matter, on April 9, 2015, the IRS issued the Notice to the Company. The Notice asserted that the Company owes additional taxes and interest for 2000 through 2002 primarily due to the disallowance of foreign tax credits. The transactions that are the subject of the Notice continue through 2009, and it is likely that the IRS will seek to challenge these later periods. On September 18, 2015, the Company paid the assessed tax and interest of
$444 million
for 2000 through 2002 and will subsequently file a claim for a refund. On November 19, 2015,
$9 million
of this amount was refunded from the IRS as an overpayment of interest.
The U.S. Treasury Department and the IRS have indicated that they intend to address through regulations the methodology to be followed in determining the dividends received deduction (“DRD”) related to variable life insurance and annuity contracts. The DRD reduces the amount of dividend income subject to tax and is a significant component of the difference between the actual tax expense and expected amount determined using the federal statutory tax rate of
35%
. Any regulations that the IRS ultimately proposes for issuance in this area will be subject to public notice and comment, at which time insurance companies and other interested parties will have the opportunity to raise legal and practical questions about the content, scope and application of such regulations. As a result, the ultimate timing and substance of any such regulations are unknown at this time. For the years ended December 31,
2016
,
2015
, and
2014
, the Company recognized an income tax benefit of
$164 million
,
$220 million
and
$234 million
, respectively, related to the separate account DRD. The
2016
benefit included an expense of
$22 million
related to a true-up of the
2015
tax return. The
2015
and
2014
benefit included a benefit of
$12 million
and
$38 million
related to a true-up of the
2014
and
2013
tax returns, respectively
.
359
20. Earnings Per Common Share
The following table presents the weighted average shares used in calculating basic earnings per common share and those used in calculating diluted earnings per common share for each income category presented below:
|
Years Ended December 31,
|
|||||||||||
|
2016
|
2015
|
2014
|
|||||||||
|
(In millions, except per share data)
|
|||||||||||
|
Weighted Average Shares:
|
|||||||||||
|
Weighted average common stock outstanding for basic earnings per common share
|
1,100.5
|
|
1,117.8
|
|
1,128.7
|
|
|||||
|
Incremental common shares from assumed:
|
|||||||||||
|
Stock purchase contracts underlying common equity units (1)
|
—
|
|
—
|
|
2.9
|
|
|||||
|
Exercise or issuance of stock-based awards
|
8.0
|
|
10.5
|
|
10.9
|
|
|||||
|
Weighted average common stock outstanding for diluted earnings per common share
|
1,108.5
|
|
1,128.3
|
|
1,142.5
|
|
|||||
|
Income (Loss) from Continuing Operations:
|
|||||||||||
|
Income (loss) from continuing operations, net of income tax
|
$
|
804
|
|
$
|
5,322
|
|
$
|
6,339
|
|
||
|
Less: Income (loss) from continuing operations, net of income tax, attributable to noncontrolling interests
|
4
|
|
12
|
|
27
|
|
|||||
|
Less: Preferred stock dividends
|
103
|
|
116
|
|
122
|
|
|||||
|
Preferred stock repurchase premium
|
—
|
|
42
|
|
—
|
|
|||||
|
Income (loss) from continuing operations, net of income tax, available to MetLife, Inc.’s common shareholders
|
$
|
697
|
|
$
|
5,152
|
|
$
|
6,190
|
|
||
|
Basic
|
$
|
0.63
|
|
$
|
4.61
|
|
$
|
5.48
|
|
||
|
Diluted
|
$
|
0.63
|
|
$
|
4.57
|
|
$
|
5.42
|
|
||
|
Income (Loss) from Discontinued Operations:
|
|||||||||||
|
Income (loss) from discontinued operations, net of income tax
|
$
|
—
|
|
$
|
—
|
|
$
|
(3
|
)
|
||
|
Less: Income (loss) from discontinued operations, net of income tax, attributable to noncontrolling interests
|
—
|
|
—
|
|
—
|
|
|||||
|
Income (loss) from discontinued operations, net of income tax, available to MetLife, Inc.’s common shareholders
|
$
|
—
|
|
$
|
—
|
|
$
|
(3
|
)
|
||
|
Basic
|
$
|
—
|
|
$
|
—
|
|
$
|
—
|
|
||
|
Diluted
|
$
|
—
|
|
$
|
—
|
|
$
|
—
|
|
||
|
Net Income (Loss):
|
|||||||||||
|
Net income (loss)
|
$
|
804
|
|
$
|
5,322
|
|
$
|
6,336
|
|
||
|
Less: Net income (loss) attributable to noncontrolling interests
|
4
|
|
12
|
|
27
|
|
|||||
|
Less: Preferred stock dividends
|
103
|
|
116
|
|
122
|
|
|||||
|
Preferred stock repurchase premium
|
—
|
|
42
|
|
—
|
|
|||||
|
Net income (loss) available to MetLife, Inc.’s common shareholders
|
$
|
697
|
|
$
|
5,152
|
|
$
|
6,187
|
|
||
|
Basic
|
$
|
0.63
|
|
$
|
4.61
|
|
$
|
5.48
|
|
||
|
Diluted
|
$
|
0.63
|
|
$
|
4.57
|
|
$
|
5.42
|
|
||
__________________
|
(1)
|
See
Note 15
for a description of the Company’s common equity units.
|
360
21. Contingencies, Commitments and Guarantees
Contingencies
Litigation
The Company is a defendant in a large number of litigation matters. In some of the matters, very large and/or indeterminate amounts, including punitive and treble damages, are sought. Modern pleading practice in the U.S. permits considerable variation in the assertion of monetary damages or other relief. Jurisdictions may permit claimants not to specify the monetary damages sought or may permit claimants to state only that the amount sought is sufficient to invoke the jurisdiction of the trial court. In addition, jurisdictions may permit plaintiffs to allege monetary damages in amounts well exceeding reasonably possible verdicts in the jurisdiction for similar matters. This variability in pleadings, together with the actual experience of the Company in litigating or resolving through settlement numerous claims over an extended period of time, demonstrates to management that the monetary relief which may be specified in a lawsuit or claim bears little relevance to its merits or disposition value.
Due to the vagaries of litigation, the outcome of a litigation matter and the amount or range of potential loss at particular points in time may normally be difficult to ascertain. Uncertainties can include how fact finders will evaluate documentary evidence and the credibility and effectiveness of witness testimony, and how trial and appellate courts will apply the law in the context of the pleadings or evidence presented, whether by motion practice, or at trial or on appeal. Disposition valuations are also subject to the uncertainty of how opposing parties and their counsel will themselves view the relevant evidence and applicable law.
The Company establishes liabilities for litigation and regulatory loss contingencies when it is probable that a loss has been incurred and the amount of the loss can be reasonably estimated. Liabilities have been established for a number of the matters noted below. It is possible that some of the matters could require the Company to pay damages or make other expenditures or establish accruals in amounts that could not be reasonably estimated at December 31,
2016
. While the potential future charges could be material in the particular quarterly or annual periods in which they are recorded, based on information currently known to management, management does not believe any such charges are likely to have a material effect on the Company’s financial position.
Matters as to Which an Estimate Can Be Made
For some of the matters disclosed below, the Company is able to estimate a reasonably possible range of loss. For such matters where a loss is believed to be reasonably possible, but not probable, no accrual has been made. As of December 31,
2016
, the Company estimates the aggregate range of reasonably possible losses in excess of amounts accrued for these matters to be
$0
to
$425 million
.
Matters as to Which an Estimate Cannot Be Made
For other matters disclosed below, the Company is not currently able to estimate the reasonably possible loss or range of loss. The Company is often unable to estimate the possible loss or range of loss until developments in such matters have provided sufficient information to support an assessment of the range of possible loss, such as quantification of a damage demand from plaintiffs, discovery from other parties and investigation of factual allegations, rulings by the court on motions or appeals, analysis by experts, and the progress of settlement negotiations. On a quarterly and annual basis, the Company reviews relevant information with respect to litigation contingencies and updates its accruals, disclosures and estimates of reasonably possible losses or ranges of loss based on such reviews.
361
MetLife, Inc.
Notes to the Consolidated Financial Statements — (continued)
21. Contingencies, Commitments and Guarantees (continued)
Asbestos-Related Claims
MLIC is and has been a defendant in a large number of asbestos-related suits filed primarily in state courts. These suits principally allege that the plaintiff or plaintiffs suffered personal injury resulting from exposure to asbestos and seek both actual and punitive damages. MLIC has never engaged in the business of manufacturing, producing, distributing or selling asbestos or asbestos-containing products nor has MLIC issued liability or workers’ compensation insurance to companies in the business of manufacturing, producing, distributing or selling asbestos or asbestos-containing products. The lawsuits principally have focused on allegations with respect to certain research, publication and other activities of one or more of MLIC’s employees during the period from the 1920’s through approximately the 1950’s and allege that MLIC learned or should have learned of certain health risks posed by asbestos and, among other things, improperly publicized or failed to disclose those health risks. MLIC believes that it should not have legal liability in these cases. The outcome of most asbestos litigation matters, however, is uncertain and can be impacted by numerous variables, including differences in legal rulings in various jurisdictions, the nature of the alleged injury and factors unrelated to the ultimate legal merit of the claims asserted against MLIC. MLIC employs a number of resolution strategies to manage its asbestos loss exposure, including seeking resolution of pending litigation by judicial rulings and settling individual or groups of claims or lawsuits under appropriate circumstances.
Claims asserted against MLIC have included negligence, intentional tort and conspiracy concerning the health risks associated with asbestos. MLIC’s defenses (beyond denial of certain factual allegations) include that: (i) MLIC owed no duty to the plaintiffs — it had no special relationship with the plaintiffs and did not manufacture, produce, distribute or sell the asbestos products that allegedly injured plaintiffs; (ii) plaintiffs did not rely on any actions of MLIC; (iii) MLIC’s conduct was not the cause of the plaintiffs’ injuries; (iv) plaintiffs’ exposure occurred after the dangers of asbestos were known; and (v) the applicable time with respect to filing suit has expired. During the course of the litigation, certain trial courts have granted motions dismissing claims against MLIC, while other trial courts have denied MLIC’s motions. There can be no assurance that MLIC will receive favorable decisions on motions in the future. While most cases brought to date have settled, MLIC intends to continue to defend aggressively against claims based on asbestos exposure, including defending claims at trials.
The approximate total number of asbestos personal injury claims pending against MLIC as of the dates indicated, the approximate number of new claims during the years ended on those dates and the approximate total settlement payments made to resolve asbestos personal injury claims at or during those years are set forth in the following table:
|
December 31,
|
|||||||||||
|
2016
|
2015
|
2014
|
|||||||||
|
(In millions, except number of claims)
|
|||||||||||
|
Asbestos personal injury claims at year end
|
67,223
|
|
67,787
|
|
68,460
|
|
|||||
|
Number of new claims during the year
|
4,146
|
|
3,856
|
|
4,636
|
|
|||||
|
Settlement payments during the year (1)
|
$
|
50.2
|
|
$
|
56.1
|
|
$
|
46.0
|
|
||
__________________
|
(1)
|
Settlement payments represent payments made by MLIC during the year in connection with settlements made in that year and in prior years. Amounts do not include MLIC’s attorneys’ fees and expenses.
|
The number of asbestos cases that may be brought, the aggregate amount of any liability that MLIC may incur, and the total amount paid in settlements in any given year are uncertain and may vary significantly from year to year.
The ability of MLIC to estimate its ultimate asbestos exposure is subject to considerable uncertainty, and the conditions impacting its liability can be dynamic and subject to change. The availability of reliable data is limited and it is difficult to predict the numerous variables that can affect liability estimates, including the number of future claims, the cost to resolve claims, the disease mix and severity of disease in pending and future claims, the impact of the number of new claims filed in a particular jurisdiction and variations in the law in the jurisdictions in which claims are filed, the possible impact of tort reform efforts, the willingness of courts to allow plaintiffs to pursue claims against MLIC when exposure to asbestos took place after the dangers of asbestos exposure were well known, and the impact of any possible future adverse verdicts and their amounts.
362
MetLife, Inc.
Notes to the Consolidated Financial Statements — (continued)
21. Contingencies, Commitments and Guarantees (continued)
The ability to make estimates regarding ultimate asbestos exposure declines significantly as the estimates relate to years further in the future. In the Company’s judgment, there is a future point after which losses cease to be probable and reasonably estimable. It is reasonably possible that the Company’s total exposure to asbestos claims may be materially greater than the asbestos liability currently accrued and that future charges to income may be necessary. While the potential future charges could be material in the particular quarterly or annual periods in which they are recorded, based on information currently known by management, management does not believe any such charges are likely to have a material effect on the Company’s financial position.
The Company believes adequate provision has been made in its consolidated financial statements for all probable and reasonably estimable losses for asbestos-related claims. MLIC’s recorded asbestos liability is based on its estimation of the following elements, as informed by the facts presently known to it, its understanding of current law and its past experiences: (i) the probable and reasonably estimable liability for asbestos claims already asserted against MLIC, including claims settled but not yet paid; (ii) the probable and reasonably estimable liability for asbestos claims not yet asserted against MLIC, but which MLIC believes are reasonably probable of assertion; and (iii) the legal defense costs associated with the foregoing claims. Significant assumptions underlying MLIC’s analysis of the adequacy of its recorded liability with respect to asbestos litigation include: (i) the number of future claims; (ii) the cost to resolve claims; and (iii) the cost to defend claims.
MLIC reevaluates on a quarterly and annual basis its exposure from asbestos litigation, including studying its claims experience, reviewing external literature regarding asbestos claims experience in the U.S., assessing relevant trends impacting asbestos liability and considering numerous variables that can affect its asbestos liability exposure on an overall or per claim basis. These variables include bankruptcies of other companies involved in asbestos litigation, legislative and judicial developments, the number of pending claims involving serious disease, the number of new claims filed against it and other defendants and the jurisdictions in which claims are pending. As previously disclosed, in 2014, MLIC increased its recorded liability for asbestos-related claims to
$690 million
. Based upon its regular reevaluation of its exposure from asbestos litigation, MLIC has updated its liability analysis for asbestos-related claims through December 31, 2016.
Regulatory Matters
The Company receives and responds to subpoenas or other inquiries seeking a broad range of information from state regulators, including state insurance commissioners; state attorneys general or other state governmental authorities; federal regulators, including the SEC; federal governmental authorities, including congressional committees; and the Financial Industry Regulatory Authority (“FINRA”), as well as from local and national regulators and government authorities in countries outside the United States where MetLife conducts business. The issues involved in information requests and regulatory matters vary widely. The Company cooperates in these inquiries.
In the Matter of Chemform, Inc. Site, Pompano Beach, Broward County, Florida
In July 2010, the Environmental Protection Agency (“EPA”) advised MLIC that it believed payments were due under
two
settlement agreements, known as “Administrative Orders on Consent,” that New England Mutual Life Insurance Company (“New England Mutual”) signed in 1989 and 1992 with respect to the cleanup of a Superfund site in Florida (the “Chemform Site”). The EPA originally contacted MLIC (as successor to New England Mutual) and a third party in 2001, and advised that they owed additional clean-up costs for the Chemform Site. The matter was not resolved at that time. The EPA is requesting payment of an amount under
$1 million
from MLIC and such third party for past costs and an additional amount for future environmental testing costs at the Chemform Site. In September 2012, the EPA, MLIC and the third party executed an Administrative Order on Consent under which MLIC and the third party have agreed to be responsible for certain environmental testing at the Chemform Site. The Company estimates that its costs for the environmental testing will not exceed
$100,000
. The September 2012 Administrative Order on Consent does not resolve the EPA’s claim for past clean-up costs. The EPA may seek additional costs if the environmental testing identifies issues. The Company estimates that the aggregate cost to resolve this matter will not exceed
$1 million
.
363
MetLife, Inc.
Notes to the Consolidated Financial Statements — (continued)
21. Contingencies, Commitments and Guarantees (continued)
Sales Practices Regulatory Matters
Regulatory authorities in a number of states and FINRA, and occasionally the SEC, have had investigations or inquiries relating to sales of individual life insurance policies or annuities or other products by MLIC, MetLife USA, NELICO, GALIC, FMLI and broker-dealer, MSI. These investigations often focus on the conduct of particular financial services representatives and the sale of unregistered or unsuitable products or the misuse of client assets. Over the past several years, these and a number of investigations by other regulatory authorities were resolved for monetary payments and certain other relief, including restitution payments. The Company may continue to resolve investigations in a similar manner. The Company believes adequate provision has been made in its consolidated financial statements for all probable and reasonably estimable losses for these sales practices-related investigations or inquiries.
Unclaimed Property Litigation
West Virginia Lawsuits
On September 20, 2012, the West Virginia Treasurer filed an action against MLIC in West Virginia state court
(West Virginia ex rel. John D. Perdue v. Metropolitan Life Insurance Company, Circuit Court of Putnam County, Civil Action No. 12-C-295)
alleging that MLIC violated the West Virginia Uniform Unclaimed Property Act (the “Act”), seeking to compel compliance with the Act, and seeking payment of unclaimed property, interest, and penalties. On November 14, 2012, November 21, 2012, December 28, 2012, and January 9, 2013, the Treasurer filed substantially identical suits against MetLife Investors USA, NELICO, MetLife Insurance Company of Connecticut and GALIC, respectively. On January 31, 2017, the parties entered into a settlement agreement resolving these actions.
City of Westland Police and Fire Retirement System v. MetLife, Inc., et. al. (S.D.N.Y., filed January 12, 2012)
Seeking to represent a class of persons who purchased MetLife, Inc. common shares between February 2, 2010, and October 6, 2011, the plaintiff filed a third amended complaint alleging that MetLife, Inc. and several current and former directors and executive officers of MetLife, Inc. violated the Securities Act of 1933 (“Securities Act”), as well as the Exchange Act and Rule 10b-5 promulgated thereunder by issuing, or causing MetLife, Inc. to issue, materially false and misleading statements concerning MetLife, Inc.’s potential liability for millions of dollars in insurance benefits that should have been paid to beneficiaries or escheated to the states. Plaintiff seeks unspecified compensatory damages and other relief. The defendants intend to defend this action vigorously.
City of Birmingham Retirement and Relief System v. MetLife, Inc., et al. (Circuit Court of Jefferson County Alabama, filed July 5, 2012)
Seeking to represent a class of persons who purchased MetLife, Inc. common equity units in or traceable to a public offering in March 2011, the plaintiff filed an action alleging that MetLife, Inc., certain current and former directors and executive officers of MetLife, Inc., and various underwriters violated several provisions of the Securities Act related to the filing of the registration statement by issuing, or causing MetLife, Inc. to issue, materially false and misleading statements and/or omissions concerning MetLife, Inc.’s potential liability for millions of dollars in insurance benefits that should have been paid to beneficiaries or escheated to the states. Plaintiff seeks unspecified compensatory damages and other relief. On December 7, 2016, the court entered an order granting preliminary approval of the proposed settlement, under which MetLife, Inc. agreed to pay
$9.75 million
, and conditionally certifying a settlement class.
Total Control Accounts Litigation
MLIC is a defendant in a lawsuit related to its use of retained asset accounts, known as TCA, as a settlement option for death benefits.
Owens v. Metropolitan Life Insurance Company (N.D. Ga., filed April 17, 2014)
Plaintiff filed this putative class action lawsuit on behalf of all persons for whom MLIC established a retained asset account, known as a TCA, to pay death benefits under an ERISA plan. The action alleges that MLIC’s use of the TCA as the settlement option for life insurance benefits under some group life insurance policies violates MLIC’s fiduciary duties under ERISA. As damages, plaintiff seeks disgorgement of profits that MLIC realized on accounts owned by members of the putative class. On September 27, 2016, the court denied MLIC’s summary judgment motion in full and granted plaintiff’s partial summary judgment motion. The Company intends to defend this action vigorously.
364
MetLife, Inc.
Notes to the Consolidated Financial Statements — (continued)
21. Contingencies, Commitments and Guarantees (continued)
Reinsurance Litigation
Robainas, et al. v. Metropolitan Life Insurance Company (S.D.N.Y., December 16, 2014)
Plaintiffs filed this putative class action lawsuit on behalf of themselves and all persons and entities who, directly or indirectly, purchased, renewed or paid premiums on life insurance policies issued by MLIC from 2009 through 2014 (the “Policies”). Two similar actions were subsequently filed,
Yale v. Metropolitan Life Ins. Co. (S.D.N.Y., January 12, 2015) and International Association of Machinists and Aerospace Workers District Lodge 15 v. Metropolitan Life Ins. Co. (E.D.N.Y., February 2, 2015)
. Both of these actions were consolidated with the Robainas action. The consolidated complaint alleges that MLIC inadequately disclosed in its statutory annual statements that certain reinsurance transactions with affiliated reinsurance companies were collateralized using “contractual parental guarantees,” and thereby allegedly misrepresented its financial condition and the adequacy of its reserves. The lawsuit sought recovery under Section 4226 of the New York Insurance Law of a statutory penalty in the amount of the premiums paid for the Policies. On October 9, 2015, the court granted MLIC’s motion to dismiss the consolidated complaint, finding that plaintiffs lacked Article III standing because they did not allege any concrete injury as a result of the alleged conduct. On February 23, 2017, the Second Circuit Court of Appeals affirmed this decision.
Intoccia v. Metropolitan Life Insurance Company (S.D.N.Y., April 20, 2015)
Plaintiffs filed this putative class action on behalf of themselves and all persons and entities who, directly or indirectly, purchased, renewed or paid premiums for Guaranteed Benefits Insurance Riders attached to variable annuity contracts with MLIC from 2009 through 2015 (the “Annuities”). The court consolidated
Weilert v. Metropolitan Life Ins. Co.
(S.D.N.Y., April 30, 2015) with the
Intoccia
case, and the consolidated, amended complaint alleges that MLIC inadequately disclosed in its statutory annual statements that certain reinsurance transactions with affiliated reinsurance companies were collateralized using “contractual parental guarantees,” and thereby allegedly misrepresented its financial condition and the adequacy of its reserves. The lawsuits seek recovery under Section 4226 of the New York Insurance Law of a statutory penalty in the amount of the premiums paid for Guaranteed Benefits Insurance Riders attached to the Annuities. The Court granted MLIC’s motion to dismiss, adopting the reasoning of the
Robainas
decision. On February 23, 2017, the Second Circuit Court of Appeals affirmed this decision.
Diversified Lending Group Litigations
Hartshorne v. MetLife, Inc., et al. (Los Angeles County Superior Court, filed March 25, 2015)
Plaintiffs have named MetLife, Inc., MSI and NELICO in 12 related lawsuits in California state court alleging various causes of action including multiple negligence and statutory claims relating to a Ponzi scheme involving the Diversified Lending Group (“DLG”). In August 2016, a trial of claims by one of the plaintiffs, Christine Ramirez, resulted in a verdict against MetLife, Inc., MSI, and NELICO for approximately
$200 thousand
in compensatory damages and
$15 million
in punitive damages. On November 30, 2016, Ramirez consented to the court’s reduction of punitive damages to approximately
$7 million
. These companies have filed a notice appealing this judgment to the Second Appellate District of the State of California.
Other Litigation
Sun Life Assurance Company of Canada Indemnity Claim
In 2006, Sun Life Assurance Company of Canada (“Sun Life”), as successor to the purchaser of MLIC’s Canadian operations, filed a lawsuit in Toronto, seeking a declaration that MLIC remains liable for “market conduct claims” related to certain individual life insurance policies sold by MLIC that were subsequently transferred to Sun Life. In January 2010, the court found that Sun Life had given timely notice of its claim for indemnification but, because it found that Sun Life had not yet incurred an indemnifiable loss, granted MLIC’s motion for summary judgment. Both parties agreed to consider the indemnity claim through arbitration. In September 2010, Sun Life notified MLIC that a purported class action lawsuit was filed against Sun Life in Toronto alleging sales practices claims regarding the policies sold by MLIC and transferred to Sun Life. On August 30, 2011, Sun Life notified MLIC that another purported class action lawsuit was filed against Sun Life in Vancouver, BC alleging sales practices claims regarding certain of the same policies sold by MLIC and transferred to Sun Life. Sun Life contends that MLIC is obligated to indemnify Sun Life for some or all of the claims in these lawsuits. These sales practices cases against Sun Life are ongoing, and the Company is unable to estimate the reasonably possible loss or range of loss arising from this litigation.
365
MetLife, Inc.
Notes to the Consolidated Financial Statements — (continued)
21. Contingencies, Commitments and Guarantees (continued)
Fauley v. Metropolitan Life Insurance Company, et al. (Circuit Court of the 19th Judicial Circuit, Lake County, Ill., July 3, 2014).
On September 28, 2016, the Illinois Supreme Court denied an objector’s petition for leave to appeal from an order approving MLIC’s
$23 million
settlement of a class action alleging violation of the Telephone Consumer Protection Act. MLIC paid out the settlement funds in January 2017.
MetLife, Inc. v. Financial Stability Oversight Council (D. D.C., January 13, 2015).
MetLife, Inc. filed this action in D.C. District Court seeking to overturn the FSOC’s designation of MetLife, Inc. as a non-bank SIFI. The suit is brought under the section of Dodd-Frank providing that a company designated as a non-bank SIFI may petition the federal courts for review, and seeks an order requiring that the final determination be rescinded. The D.C. District Court issued a decision on March 30, 2016 granting, in part, MetLife, Inc.’s cross motion for summary judgment and rescinding the FSOC’s designation of MetLife, Inc. as a non-bank SIFI. On April 8, 2016, the FSOC appealed the D.C. District Court’s order to the United States Court of Appeals for the District of Columbia.
Voshall v. Metropolitan Life Insurance Company (Superior Court of the State of California, County of Los Angeles, April 8, 2015)
Plaintiff filed this putative class action lawsuit on behalf of himself and all persons covered under a long-term group disability income insurance policy issued by MLIC to public entities in California between April 8, 2011 and April 8, 2015. Plaintiff alleges that MLIC improperly reduced benefits by including cost of living adjustments and employee paid contributions in the employer retirement benefits and other income that reduces the benefit payable under such policies. Plaintiff asserts causes of action for declaratory relief, violation of the California Business & Professions Code, breach of contract and breach of the implied covenant of good faith and fair dealing. The Company intends to defend this action vigorously.
Martin v. Metropolitan Life Insurance Company, (Superior Court of the State of California, County of Contra Costa, filed December 17, 2015)
Plaintiffs filed this putative class action lawsuit on behalf of themselves and all California persons who have been charged compound interest by MLIC in life insurance policy and/or premium loan balances within the last four years. Plaintiffs allege that MLIC has engaged in a pattern and practice of charging compound interest on life insurance policy and premium loans without the borrower authorizing such compounding, and that this constitutes an unlawful business practice under California law. Plaintiff asserts causes of action for declaratory relief, violation of California’s Unfair Competition Law and Usury Law, and unjust enrichment. Plaintiff seeks declaratory and injunctive relief, restitution of interest, and damages in an unspecified amount. On April 12, 2016, the court granted MLIC’s motion to dismiss. Plaintiffs have filed an appeal of this ruling.
Lau v. Metropolitan Life Insurance Company (S.D.N.Y. filed, December 3, 2015)
This putative class action lawsuit was filed by a single defined contribution plan participant on behalf of all ERISA plans whose assets were invested in MetLife’s “Group Annuity Contract Stable Value Funds” within the past six years. The suit alleges breaches of fiduciary duty under ERISA and challenges the “spread” with respect to the stable value fund group annuity products sold to retirement plans. The allegations focus on the methodology MetLife uses to establish and reset the crediting rate, the terms under which plan participants are permitted to transfer funds from a stable value option to another investment option, the procedures followed if an employer terminates a contract, and the level of disclosure provided. Plaintiff seeks declaratory and injunctive relief, as well as damages in an unspecified amount. The Company intends to defend this action vigorously.
Newman v. Metropolitan Life Insurance Company (N.D. Ill., filed March 23, 2016)
Plaintiff filed this putative class action alleging causes of action for breach of contract, fraud, and violations of the Illinois Consumer Fraud and Deceptive Business Practices Act, based on MLIC’s class-wide increase in premiums charged for long-term care insurance policies. Plaintiff alleges a class consisting of herself and all persons over age 65 who selected a Reduced Pay at Age 65 payment feature and whose premium rates were increased after age 65. Plaintiff asserts that premiums could not be increased for these class members and/or that marketing material was misleading as to MLIC’s right to increase premiums. Plaintiff seeks unspecified compensatory, statutory and punitive damages as well as recessionary and injunctive relief. The Company intends to defend this action vigorously.
366
MetLife, Inc.
Notes to the Consolidated Financial Statements — (continued)
21. Contingencies, Commitments and Guarantees (continued)
Thrivent Financial for Lutherans v. MetLife Insurance Company USA, (E.D. Wis., filed September 12, 2016)
Plaintiff filed a complaint against MetLife USA contending that its use of the Brighthouse Financial trademark and logo will infringe on its trademarks. Alleging violations of federal and state law, plaintiff seeks preliminary and permanent injunctions, compensatory damages, and other relief. On December 23, 2016, plaintiff filed an amended complaint adding Brighthouse as an additional defendant. The parties have resolved this matter, and the action was voluntarily dismissed on February 15, 2017.
Sales Practices Claims
Over the past several years, the Company has faced numerous claims, including class action lawsuits, alleging improper marketing or sales of individual life insurance policies, annuities, mutual funds, other products or the misuse of client assets. Some of the current cases seek substantial damages, including punitive and treble damages and attorneys’ fees. The Company continues to defend vigorously against the claims in these matters. The Company believes adequate provision has been made in its consolidated financial statements for all probable and reasonably estimable losses for sales practices matters.
Summary
Putative or certified class action litigation and other litigation and claims and assessments against the Company, in addition to those discussed previously and those otherwise provided for in the Company’s consolidated financial statements, have arisen in the course of the Company’s business, including, but not limited to, in connection with its activities as an insurer, mortgage lending bank, employer, investor, investment advisor and taxpayer. Further, state insurance regulatory authorities and other federal and state authorities regularly make inquiries and conduct investigations concerning the Company’s compliance with applicable insurance and other laws and regulations.
It is not possible to predict the ultimate outcome of all pending investigations and legal proceedings. In some of the matters referred to previously, very large and/or indeterminate amounts, including punitive and treble damages, are sought. Although in light of these considerations it is possible that an adverse outcome in certain cases could have a material effect upon the Company’s financial position, based on information currently known by the Company’s management, in its opinion, the outcomes of such pending investigations and legal proceedings are not likely to have such an effect. However, given the large and/or indeterminate amounts sought in certain of these matters and the inherent unpredictability of litigation, it is possible that an adverse outcome in certain matters could, from time to time, have a material effect on the Company’s consolidated net income or cash flows in particular quarterly or annual periods.
Insolvency Assessments
Most of the jurisdictions in which the Company is admitted to transact business require insurers doing business within the jurisdiction to participate in guaranty associations, which are organized to pay contractual benefits owed pursuant to insurance policies issued by impaired, insolvent or failed insurers. These associations levy assessments, up to prescribed limits, on all member insurers in a particular state on the basis of the proportionate share of the premiums written by member insurers in the lines of business in which the impaired, insolvent or failed insurer engaged. Some states permit member insurers to recover assessments paid through full or partial premium tax offsets. In addition, Japan has established the Life Insurance Policyholders Protection Corporation of Japan as a contingency to protect policyholders against the insolvency of life insurance companies in Japan through assessments to companies licensed to provide life insurance.
367
MetLife, Inc.
Notes to the Consolidated Financial Statements — (continued)
21. Contingencies, Commitments and Guarantees (continued)
Assets and liabilities held for insolvency assessments were as follows:
|
December 31,
|
|||||||
|
2016
|
2015
|
||||||
|
(In millions)
|
|||||||
|
Other Assets:
|
|||||||
|
Premium tax offset for future discounted and undiscounted assessments
|
$
|
44
|
|
$
|
45
|
|
|
|
Premium tax offsets currently available for paid assessments
|
42
|
|
64
|
|
|||
|
Total
|
$
|
86
|
|
$
|
109
|
|
|
|
Other Liabilities:
|
|||||||
|
Insolvency assessments
|
$
|
64
|
|
$
|
65
|
|
|
368
MetLife, Inc.
Notes to the Consolidated Financial Statements — (continued)
21. Contingencies, Commitments and Guarantees (continued)
Commitments
Leases
The Company, as lessee, has entered into various lease and sublease agreements for office space, information technology, aircrafts, automobiles, and other equipment. Future minimum gross rental payments relating to these lease arrangements are as follows:
|
Amount
|
||||
|
(In millions)
|
||||
|
2017
|
$
|
289
|
|
|
|
2018
|
256
|
|
||
|
2019
|
219
|
|
||
|
2020
|
211
|
|
||
|
2021
|
189
|
|
||
|
Thereafter
|
996
|
|
||
|
Total
|
$
|
2,160
|
|
|
Total minimum rentals to be received in the future under non-cancelable subleases were
$376 million
as of
December 31, 2016
. Operating lease expense was
$383 million
,
$364 million
and
$347 million
for the years ended
December 31, 2016
,
2015
and
2014
, respectively.
Mortgage Loan Commitments
The Company commits to lend funds under mortgage loan commitments. The amounts of these mortgage loan commitments were
$4.3 billion
and
$4.4 billion
at December 31,
2016
and
2015
, respectively.
Commitments to Fund Partnership Investments, Bank Credit Facilities, Bridge Loans and Private Corporate Bond Investments
The Company commits to fund partnership investments and to lend funds under bank credit facilities, bridge loans and private corporate bond investments. The amounts of these unfunded commitments were
$8.2 billion
and
$7.1 billion
at December 31,
2016
and
2015
, respectively.
Guarantees
In the normal course of its business, the Company has provided certain indemnities, guarantees and commitments to third parties such that it may be required to make payments now or in the future. In the context of acquisition, disposition, investment and other transactions, the Company has provided indemnities and guarantees, including those related to tax, environmental and other specific liabilities and other indemnities and guarantees that are triggered by, among other things, breaches of representations, warranties or covenants provided by the Company. In addition, in the normal course of business, the Company provides indemnifications to counterparties in contracts with triggers similar to the foregoing, as well as for certain other liabilities, such as third-party lawsuits. These obligations are often subject to time limitations that vary in duration, including contractual limitations and those that arise by operation of law, such as applicable statutes of limitation. In some cases, the maximum potential obligation under the indemnities and guarantees is subject to a contractual limitation ranging from less than
$1 million
to
$329 million
, with a cumulative maximum of
$1.1 billion
, while in other cases such limitations are not specified or applicable. Since certain of these obligations are not subject to limitations, the Company does not believe that it is possible to determine the maximum potential amount that could become due under these guarantees in the future. Management believes that it is unlikely the Company will have to make any material payments under these indemnities, guarantees, or commitments.
In addition, the Company indemnifies its directors and officers as provided in its charters and by-laws. Also, the Company indemnifies its agents for liabilities incurred as a result of their representation of the Company’s interests. Since these indemnities are generally not subject to limitation with respect to duration or amount, the Company does not believe that it is possible to determine the maximum potential amount that could become due under these indemnities in the future.
369
MetLife, Inc.
Notes to the Consolidated Financial Statements — (continued)
21. Contingencies, Commitments and Guarantees (continued)
The Company has also minimum fund yield requirements on certain international pension funds in accordance with local laws. Since these guarantees are not subject to limitation with respect to duration or amount, the Company does not believe that it is possible to determine the maximum potential amount that could become due under these guarantees in the future.
The Company’s recorded liabilities were
$10 million
and
$8 million
at December 31,
2016
and
2015
, respectively, for indemnities, guarantees and commitments.
370
22. Quarterly Results of Operations (Unaudited)
The unaudited quarterly results of operations for
2016
and
2015
are summarized in the table below:
|
Three Months Ended
|
|||||||||||||||
|
March 31,
|
June 30,
|
September 30,
|
December 31,
|
||||||||||||
|
(In millions, except per share data)
|
|||||||||||||||
|
2016
|
|||||||||||||||
|
Total revenues
|
$
|
18,433
|
|
$
|
15,244
|
|
$
|
17,723
|
|
$
|
12,076
|
|
|||
|
Total expenses
|
$
|
15,511
|
|
$
|
15,344
|
|
$
|
17,175
|
|
$
|
15,641
|
|
|||
|
Income (loss) from continuing operations, net of income tax
|
$
|
2,203
|
|
$
|
114
|
|
$
|
573
|
|
$
|
(2,086
|
)
|
|||
|
Income (loss) from discontinued operations, net of income tax
|
$
|
—
|
|
$
|
—
|
|
$
|
—
|
|
$
|
—
|
|
|||
|
Net income (loss)
|
$
|
2,203
|
|
$
|
114
|
|
$
|
573
|
|
$
|
(2,086
|
)
|
|||
|
Less: Net income (loss) attributable to noncontrolling interests
|
$
|
2
|
|
$
|
4
|
|
$
|
(4
|
)
|
$
|
2
|
|
|||
|
Net income (loss) attributable to MetLife, Inc.
|
$
|
2,201
|
|
$
|
110
|
|
$
|
577
|
|
$
|
(2,088
|
)
|
|||
|
Less: Preferred stock dividends
|
$
|
6
|
|
$
|
46
|
|
$
|
6
|
|
$
|
45
|
|
|||
|
Preferred stock repurchase premium
|
$
|
—
|
|
$
|
—
|
|
$
|
—
|
|
$
|
—
|
|
|||
|
Net income (loss) available to MetLife, Inc.’s common shareholders
|
$
|
2,195
|
|
$
|
64
|
|
$
|
571
|
|
$
|
(2,133
|
)
|
|||
|
Basic earnings per common share
|
|||||||||||||||
|
Income (loss) from continuing operations, net of income tax, available to MetLife, Inc.’s common shareholders
|
$
|
1.99
|
|
$
|
0.06
|
|
$
|
0.52
|
|
$
|
(1.94
|
)
|
|||
|
Income (loss) from discontinued operations, net of income tax, attributable to MetLife, Inc.
|
$
|
—
|
|
$
|
—
|
|
$
|
—
|
|
$
|
—
|
|
|||
|
Net income (loss) attributable to MetLife, Inc.
|
$
|
2.00
|
|
$
|
0.10
|
|
$
|
0.52
|
|
$
|
(1.90
|
)
|
|||
|
Net income (loss) available to MetLife, Inc.’s common shareholders
|
$
|
1.99
|
|
$
|
0.06
|
|
$
|
0.52
|
|
$
|
(1.94
|
)
|
|||
|
Diluted earnings per common share (1)
|
|||||||||||||||
|
Income (loss) from continuing operations, net of income tax, available to MetLife, Inc.’s common shareholders
|
$
|
1.98
|
|
$
|
0.06
|
|
$
|
0.51
|
|
$
|
(1.94
|
)
|
|||
|
Income (loss) from discontinued operations, net of income tax, attributable to MetLife, Inc.
|
$
|
—
|
|
$
|
—
|
|
$
|
—
|
|
$
|
—
|
|
|||
|
Net income (loss) attributable to MetLife, Inc.
|
$
|
1.99
|
|
$
|
0.10
|
|
$
|
0.52
|
|
$
|
(1.90
|
)
|
|||
|
Net income (loss) available to MetLife, Inc.’s common shareholders
|
$
|
1.98
|
|
$
|
0.06
|
|
$
|
0.51
|
|
$
|
(1.94
|
)
|
|||
|
2015
|
|||||||||||||||
|
Total revenues
|
$
|
18,710
|
|
$
|
16,166
|
|
$
|
18,031
|
|
$
|
17,044
|
|
|||
|
Total expenses
|
$
|
15,651
|
|
$
|
15,053
|
|
$
|
15,868
|
|
$
|
15,909
|
|
|||
|
Income (loss) from continuing operations, net of income tax
|
$
|
2,163
|
|
$
|
1,119
|
|
$
|
1,198
|
|
$
|
842
|
|
|||
|
Income (loss) from discontinued operations, net of income tax
|
$
|
—
|
|
$
|
—
|
|
$
|
—
|
|
$
|
—
|
|
|||
|
Net income (loss)
|
$
|
2,163
|
|
$
|
1,119
|
|
$
|
1,198
|
|
$
|
842
|
|
|||
|
Less: Net income (loss) attributable to noncontrolling interests
|
$
|
5
|
|
$
|
4
|
|
$
|
(5
|
)
|
$
|
8
|
|
|||
|
Net income (loss) attributable to MetLife, Inc.
|
$
|
2,158
|
|
$
|
1,115
|
|
$
|
1,203
|
|
$
|
834
|
|
|||
|
Less: Preferred stock dividends
|
$
|
30
|
|
$
|
31
|
|
$
|
6
|
|
$
|
49
|
|
|||
|
Preferred stock repurchase premium
|
$
|
—
|
|
$
|
42
|
|
$
|
—
|
|
$
|
—
|
|
|||
|
Net income (loss) available to MetLife, Inc.’s common shareholders
|
$
|
2,128
|
|
$
|
1,042
|
|
$
|
1,197
|
|
$
|
785
|
|
|||
|
Basic earnings per common share
|
|||||||||||||||
|
Income (loss) from continuing operations, net of income tax, available to MetLife, Inc.’s common shareholders
|
$
|
1.89
|
|
$
|
0.93
|
|
$
|
1.07
|
|
$
|
0.71
|
|
|||
|
Income (loss) from discontinued operations, net of income tax, attributable to MetLife, Inc.
|
$
|
—
|
|
$
|
—
|
|
$
|
—
|
|
$
|
—
|
|
|||
|
Net income (loss) attributable to MetLife, Inc.
|
$
|
1.92
|
|
$
|
1.00
|
|
$
|
1.08
|
|
$
|
0.75
|
|
|||
|
Net income (loss) available to MetLife, Inc.’s common shareholders
|
$
|
1.89
|
|
$
|
0.93
|
|
$
|
1.07
|
|
$
|
0.71
|
|
|||
|
Diluted earnings per common share
|
|||||||||||||||
|
Income (loss) from continuing operations, net of income tax, available to MetLife, Inc.’s common shareholders
|
$
|
1.87
|
|
$
|
0.92
|
|
$
|
1.06
|
|
$
|
0.70
|
|
|||
|
Income (loss) from discontinued operations, net of income tax, attributable to MetLife, Inc.
|
$
|
—
|
|
$
|
—
|
|
$
|
—
|
|
$
|
—
|
|
|||
|
Net income (loss) attributable to MetLife, Inc.
|
$
|
1.90
|
|
$
|
0.99
|
|
$
|
1.06
|
|
$
|
0.74
|
|
|||
|
Net income (loss) available to MetLife, Inc.’s common shareholders
|
$
|
1.87
|
|
$
|
0.92
|
|
$
|
1.06
|
|
$
|
0.70
|
|
|||
__________________
|
(1)
|
For the three months ended
December 31, 2016
,
9.2 million
shares related to the assumed exercise or issuance of stock-based awards have been excluded from the weighted average common shares outstanding - diluted, as to include these assumed shares would be anti-dilutive to net income (loss) available to common shareholders per common share - diluted.
|
23. Subsequent Events
Common Stock Repurchases
In 2017, through
February 23, 2017
, MetLife, Inc. repurchased
8,718,054
shares of its common stock in the open market for
$468 million
.
Dividends
Preferred Stock
On
February 17, 2017
, MetLife, Inc. announced a first quarter 2017 dividend of
$0.25
per share, for a total of
$6 million
, on its Series A preferred stock, subject to the final confirmation that it has met the financial tests specified in the certificate of designation for the Series A preferred stock, which the Company anticipates will be made and announced on or about
March 6, 2017
. The dividend will be payable
March 15, 2017
to shareholders of record as of
February 28, 2017
.
Common Stock
On
January 6, 2017
, the MetLife, Inc. Board of Directors declared a
first quarter 2017
common stock dividend of
$0.40
per share payable on
March 13, 2017
to shareholders of record as of
February 6, 2017
. The Company estimates that the aggregate dividend payment will be
$438 million
.
Junior Subordinated Debt Securities
On February 10, 2017, MetLife, Inc. exchanged
$750 million
aggregate principal amount of its
9.250%
Fixed-to-Floating Rate Junior Subordinated Debentures due 2068 for
$750 million
aggregate liquidation preference of the
9.250%
Fixed-to-Floating Rate Exchangeable Surplus Trust Securities of MetLife Capital Trust X.
371
MetLife, Inc.
Schedule I
Consolidated Summary of Investments —
Other Than Investments in Related Parties
December 31,
2016
(In millions)
|
Types of Investments
|
Cost or
Amortized Cost (1) |
Estimated Fair Value
|
Amount at
Which Shown on Balance Sheet |
||||||||
|
Fixed maturity securities:
|
|||||||||||
|
Bonds:
|
|||||||||||
|
U.S. government and agency securities
|
$
|
53,326
|
|
$
|
57,523
|
|
$
|
57,523
|
|
||
|
Foreign government securities
|
50,923
|
|
57,138
|
|
57,138
|
|
|||||
|
State and political subdivision securities
|
14,566
|
|
16,176
|
|
16,176
|
|
|||||
|
Public utilities
|
13,783
|
|
15,057
|
|
15,057
|
|
|||||
|
All other corporate bonds
|
135,199
|
|
141,465
|
|
141,465
|
|
|||||
|
Total bonds
|
267,797
|
|
287,359
|
|
287,359
|
|
|||||
|
Mortgage-backed and asset-backed securities
|
61,305
|
|
62,142
|
|
62,142
|
|
|||||
|
Redeemable preferred stock
|
1,252
|
|
1,388
|
|
1,388
|
|
|||||
|
Total fixed maturity securities
|
330,354
|
|
350,889
|
|
350,889
|
|
|||||
|
FVO and trading securities
|
12,288
|
|
13,923
|
|
13,923
|
|
|||||
|
Equity securities:
|
|||||||||||
|
Common stock:
|
|||||||||||
|
Industrial, miscellaneous and all other
|
1,730
|
|
2,123
|
|
2,123
|
|
|||||
|
Banks, trust and insurance companies
|
96
|
|
144
|
|
144
|
|
|||||
|
Public utilities
|
101
|
|
134
|
|
134
|
|
|||||
|
Non-redeemable preferred stock
|
817
|
|
793
|
|
793
|
|
|||||
|
Total equity securities
|
2,744
|
|
3,194
|
|
3,194
|
|
|||||
|
Mortgage loans
|
74,545
|
|
74,545
|
|
|||||||
|
Policy loans
|
11,028
|
|
11,028
|
|
|||||||
|
Real estate and real estate joint ventures
|
8,982
|
|
8,982
|
|
|||||||
|
Real estate acquired in satisfaction of debt
|
59
|
|
59
|
|
|||||||
|
Other limited partnership interests
|
6,778
|
|
6,778
|
|
|||||||
|
Short-term investments
|
7,810
|
|
7,810
|
|
|||||||
|
Other invested assets
|
23,185
|
|
23,185
|
|
|||||||
|
Total investments
|
$
|
477,773
|
|
$
|
500,393
|
|
|||||
__________________
|
(1)
|
The FVO and trading securities portfolio is mainly comprised of fixed maturity and equity securities, including mutual funds and, to a lesser extent, short-term investments and cash and cash equivalents. Cost or amortized cost for fixed maturity securities and mortgage loans represents original cost reduced by repayments, valuation allowances and impairments from other-than-temporary declines in estimated fair value that are charged to earnings and adjusted for amortization of premiums or accretion of discounts; for equity securities, cost represents original cost reduced by impairments from other-than-temporary declines in estimated fair value; for real estate, cost represents original cost reduced by impairments and depreciation; for investees, cost represents original cost reduced for impairments or original cost adjusted for equity in earnings and distributions.
|
372
MetLife, Inc.
Schedule II
Condensed Financial Information
(Parent Company Only)
December 31,
2016
and
2015
(In millions, except share and per share data)
|
2016
|
2015
|
||||||
|
Condensed Balance Sheets
|
|||||||
|
Assets
|
|||||||
|
Investments:
|
|||||||
|
Fixed maturity securities available-for-sale, at estimated fair value (amortized cost: $3,900 and $5,023, respectively)
|
$
|
3,894
|
|
$
|
5,028
|
|
|
|
Short-term investments, principally at estimated fair value
|
148
|
|
268
|
|
|||
|
Other invested assets, at estimated fair value
|
499
|
|
830
|
|
|||
|
Total investments
|
4,541
|
|
6,126
|
|
|||
|
Cash and cash equivalents
|
334
|
|
421
|
|
|||
|
Accrued investment income
|
74
|
|
76
|
|
|||
|
Investment in subsidiaries
|
85,207
|
|
85,977
|
|
|||
|
Loans to subsidiaries
|
1,200
|
|
1,200
|
|
|||
|
Other assets
|
1,529
|
|
1,177
|
|
|||
|
Total assets
|
$
|
92,885
|
|
$
|
94,977
|
|
|
|
Liabilities and Stockholders’ Equity
|
|||||||
|
Liabilities
|
|||||||
|
Payables for collateral under derivatives transactions
|
$
|
147
|
|
$
|
227
|
|
|
|
Long-term debt — unaffiliated
|
15,505
|
|
16,994
|
|
|||
|
Long-term debt — affiliated
|
3,100
|
|
3,314
|
|
|||
|
Collateral financing arrangements
|
2,797
|
|
2,797
|
|
|||
|
Junior subordinated debt securities
|
1,734
|
|
1,748
|
|
|||
|
Payables to subsidiaries
|
—
|
|
147
|
|
|||
|
Other liabilities
|
2,294
|
|
1,801
|
|
|||
|
Total liabilities
|
25,577
|
|
27,028
|
|
|||
|
Stockholders’ Equity
|
|||||||
|
Preferred stock, par value $0.01 per share; $2,100 aggregate liquidation preference
|
—
|
|
—
|
|
|||
|
Common stock, par value $0.01 per share; 3,000,000,000 shares authorized; 1,164,029,985 and 1,159,590,766 shares issued, respectively; 1,095,519,005 and 1,098,028,525 shares outstanding, respectively
|
12
|
|
12
|
|
|||
|
Additional paid-in capital
|
30,944
|
|
30,749
|
|
|||
|
Retained earnings
|
34,480
|
|
35,519
|
|
|||
|
Treasury stock, at cost; 68,510,980 and 61,562,241 shares, respectively
|
(3,474
|
)
|
(3,102
|
)
|
|||
|
Accumulated other comprehensive income (loss)
|
5,347
|
|
4,771
|
|
|||
|
Total stockholders’ equity
|
67,309
|
|
67,949
|
|
|||
|
Total liabilities and stockholders’ equity
|
$
|
92,886
|
|
$
|
94,977
|
|
|
See accompanying notes to the condensed financial information.
373
MetLife, Inc.
Schedule II
Condensed Financial Information — (continued)
(Parent Company Only)
For the Years Ended December 31,
2016
,
2015
and
2014
(In millions)
|
2016
|
2015
|
2014
|
|||||||||
|
Condensed Statements of Operations
|
|||||||||||
|
Revenues
|
|||||||||||
|
Equity in earnings of subsidiaries
|
$
|
1,783
|
|
$
|
5,985
|
|
$
|
6,907
|
|
||
|
Net investment income
|
129
|
|
170
|
|
371
|
|
|||||
|
Other revenues
|
151
|
|
124
|
|
128
|
|
|||||
|
Net investment gains (losses)
|
86
|
|
12
|
|
(287
|
)
|
|||||
|
Net derivative gains (losses)
|
(68
|
)
|
(7
|
)
|
165
|
|
|||||
|
Total revenues
|
2,081
|
|
6,284
|
|
7,284
|
|
|||||
|
Expenses
|
|||||||||||
|
Interest expense
|
1,152
|
|
1,171
|
|
1,151
|
|
|||||
|
Goodwill impairment
|
147
|
|
—
|
|
—
|
|
|||||
|
Other expenses
|
390
|
|
180
|
|
197
|
|
|||||
|
Total expenses
|
1,689
|
|
1,351
|
|
1,348
|
|
|||||
|
Income (loss) before provision for income tax
|
392
|
|
4,933
|
|
5,936
|
|
|||||
|
Provision for income tax expense (benefit)
|
(408
|
)
|
(377
|
)
|
(373
|
)
|
|||||
|
Net income (loss)
|
800
|
|
5,310
|
|
6,309
|
|
|||||
|
Less: Preferred stock dividends
|
103
|
|
116
|
|
122
|
|
|||||
|
Preferred stock repurchase premium
|
—
|
|
42
|
|
—
|
|
|||||
|
Net income (loss) available to common shareholders
|
$
|
697
|
|
$
|
5,152
|
|
$
|
6,187
|
|
||
|
Comprehensive income (loss)
|
$
|
1,376
|
|
$
|
(568
|
)
|
$
|
11,854
|
|
||
See accompanying notes to the condensed financial information.
374
MetLife, Inc.
Schedule II
Condensed Financial Information — (continued)
(Parent Company Only)
For the Years Ended
December 31, 2016
,
2015
and
2014
(In millions)
|
2016
|
2015
|
2014
|
|||||||||
|
Condensed Statements of Cash Flows
|
|||||||||||
|
Cash flows from operating activities
|
|||||||||||
|
Net income (loss)
|
$
|
800
|
|
$
|
5,310
|
|
$
|
6,309
|
|
||
|
Earnings of subsidiaries
|
(1,783
|
)
|
(5,985
|
)
|
(6,907
|
)
|
|||||
|
Dividends from subsidiaries
|
4,470
|
|
2,335
|
|
2,388
|
|
|||||
|
Goodwill impairment
|
147
|
|
—
|
|
—
|
|
|||||
|
Other, net
|
113
|
|
(54
|
)
|
825
|
|
|||||
|
Net cash provided by (used in) operating activities
|
3,747
|
|
|
1,606
|
|
|
2,615
|
|
|||
|
Cash flows from investing activities
|
|||||||||||
|
Sales of fixed maturity securities
|
8,603
|
|
7,952
|
|
6,611
|
|
|||||
|
Purchases of fixed maturity securities
|
(7,409
|
)
|
(7,957
|
)
|
(7,181
|
)
|
|||||
|
Cash received in connection with freestanding derivatives
|
311
|
|
930
|
|
438
|
|
|||||
|
Cash paid in connection with freestanding derivatives
|
(561
|
)
|
(510
|
)
|
(281
|
)
|
|||||
|
Sales of businesses
|
291
|
|
—
|
|
7
|
|
|||||
|
Expense paid on behalf of subsidiaries
|
(68
|
)
|
(40
|
)
|
(54
|
)
|
|||||
|
Receipts on loans to subsidiaries
|
140
|
|
761
|
|
832
|
|
|||||
|
Issuances of loans to subsidiaries
|
(140
|
)
|
(300
|
)
|
(370
|
)
|
|||||
|
Returns of capital from subsidiaries
|
80
|
|
5
|
|
—
|
|
|||||
|
Capital contributions to subsidiaries
|
(1,733
|
)
|
(667
|
)
|
(1,262
|
)
|
|||||
|
Net change in short-term investments
|
120
|
|
110
|
|
182
|
|
|||||
|
Other, net
|
(18
|
)
|
2
|
|
101
|
|
|||||
|
Net cash provided by (used in) investing activities
|
(384
|
)
|
|
286
|
|
|
(977
|
)
|
|||
|
Cash flows from financing activities
|
|||||||||||
|
Net change in payables for collateral under derivative transactions
|
(80
|
)
|
(122
|
)
|
264
|
|
|||||
|
Long-term debt issued
|
—
|
|
2,739
|
|
1,000
|
|
|||||
|
Long-term debt repaid
|
(1,250
|
)
|
(1,000
|
)
|
(1,550
|
)
|
|||||
|
Common stock issued, net of issuance costs
|
—
|
|
—
|
|
1,000
|
|
|||||
|
Treasury stock acquired in connection with share repurchases
|
(372
|
)
|
(1,930
|
)
|
(1,000
|
)
|
|||||
|
Preferred stock issued, net of issuance costs
|
—
|
|
1,483
|
|
—
|
|
|||||
|
Repurchase of preferred stock
|
—
|
|
(1,460
|
)
|
—
|
|
|||||
|
Preferred stock repurchase premium
|
—
|
|
(42
|
)
|
—
|
|
|||||
|
Dividends on preferred stock
|
(103
|
)
|
(116
|
)
|
(122
|
)
|
|||||
|
Dividends on common stock
|
(1,736
|
)
|
(1,653
|
)
|
(1,499
|
)
|
|||||
|
Other, net
|
91
|
|
187
|
|
64
|
|
|||||
|
Net cash provided by (used in) financing activities
|
(3,450
|
)
|
|
(1,914
|
)
|
|
(1,843
|
)
|
|||
|
Change in cash and cash equivalents
|
(87
|
)
|
|
(22
|
)
|
|
(205
|
)
|
|||
|
Cash and cash equivalents, beginning of year
|
421
|
|
443
|
|
648
|
|
|||||
|
Cash and cash equivalents, end of year
|
$
|
334
|
|
|
$
|
421
|
|
|
$
|
443
|
|
375
MetLife, Inc.
Schedule II
Condensed Financial Information — (continued)
(Parent Company Only)
For the Years Ended
December 31, 2016
,
2015
and
2014
(In millions)
|
2016
|
2015
|
2014
|
|||||||||
|
Supplemental disclosures of cash flow information
|
|||||||||||
|
Net cash paid (received) for:
|
|||||||||||
|
Interest
|
$
|
1,146
|
|
$
|
1,133
|
|
$
|
1,138
|
|
||
|
Income tax:
|
|||||||||||
|
Amounts paid to (received from) subsidiaries, net
|
$
|
(569
|
)
|
$
|
(226
|
)
|
$
|
(1,247
|
)
|
||
|
Income tax paid (received) by MetLife, Inc., net
|
136
|
|
55
|
|
385
|
|
|||||
|
Total income tax, net
|
$
|
(433
|
)
|
$
|
(171
|
)
|
$
|
(862
|
)
|
||
|
Non-cash transactions:
|
|||||||||||
|
Dividends from subsidiary
|
$
|
2,652
|
|
$
|
—
|
|
$
|
81
|
|
||
|
Returns of capital from subsidiaries
|
$
|
372
|
|
$
|
4,284
|
|
$
|
6,308
|
|
||
|
Capital contributions to subsidiaries
|
$
|
157
|
|
$
|
4,120
|
|
$
|
6,388
|
|
||
|
Payables to subsidiaries for future capital contributions
|
$
|
—
|
|
$
|
120
|
|
$
|
445
|
|
||
|
Allocation of interest expense to subsidiary
|
$
|
39
|
|
$
|
28
|
|
$
|
27
|
|
||
|
Allocation of interest income to subsidiary
|
$
|
54
|
|
$
|
57
|
|
$
|
65
|
|
||
376
MetLife, Inc.
Schedule II
Notes to the Condensed Financial Information
(Parent Company Only)
1. Basis of Presentation
The condensed financial information of MetLife, Inc. (the “Parent Company”) should be read in conjunction with the consolidated financial statements of MetLife, Inc. and its subsidiaries and the notes thereto (the “Consolidated Financial Statements”). These condensed unconsolidated financial statements reflect the results of operations, financial position and cash flows for MetLife, Inc. Investments in subsidiaries are accounted for using the equity method of accounting.
The preparation of these condensed unconsolidated financial statements in conformity with GAAP requires management to adopt accounting policies and make certain estimates and assumptions. The most important of these estimates and assumptions relate to the fair value measurements, the accounting for goodwill and identifiable intangible assets and the provision for potential losses that may arise from litigation and regulatory proceedings and tax audits, which may affect the amounts reported in the condensed unconsolidated financial statements and accompanying notes. Actual results could differ from these estimates.
2. Investment in Subsidiaries
In December 2016, MLIC transferred the issued and outstanding shares of the common stock of each of NELICO and GALIC to MetLife, Inc. in the form of a non-cash extraordinary dividend of
$2.7 billion
.
In February 2016, MetLife, Inc., paid in cash, a capital contribution of
$1.5 billion
to MetLife USA in connection with the Separation.
In December 2015, MetLife, Inc. accrued
$50 million
,
$45 million
and
$25 million
in capital contributions payable to the following captive reinsurers: MRV, MRD and MRSC, respectively, which were included in payables to subsidiaries at December 31, 2015. The payables were settled for cash in February 2016.
In December 2014, MetLife, Inc. accrued
$350 million
and
$95 million
in capital contributions payable to MRV and MRD, respectively, which were included in payables to subsidiaries at December 31, 2014. The payables were settled for cash in February 2015.
In 2014, in connection with the mergers into MetLife USA of certain of its affiliates and a subsidiary, MetLife, Inc. recorded
$5.7 billion
in non-cash returns of capital from subsidiaries, including
$2.0 billion
of Exeter Reassurance Company, Ltd.’s
(“
Exeter”) preferred stock, and correspondingly recorded
$5.7 billion
of non-cash capital contributions to subsidiaries. In November 2014, upon the consummation of the mergers, the
$2.0 billion
of outstanding preferred stock of Exeter was canceled. Consequently, MetLife, Inc.’s preferred capital stock investment was added to its common capital stock investment in MetLife USA.
3. Loans to Subsidiaries
MetLife, Inc. lends funds, as necessary, to its subsidiaries, some of which are regulated, to meet their capital requirements. Payments of interest and principal on surplus notes of regulated subsidiaries, which are subordinate to all other obligations of the issuing company, may be made only with the prior approval of the insurance department of the state of domicile.
In April 2016, American Life issued a
$140 million
short-term note to MetLife, Inc. which was repaid in July 2016. The short-term note bore interest at
six-month LIBOR plus 1.00%
.
In May 2015, American Life issued a
$150 million
short-term note to MetLife, Inc. which was repaid in June 2015. The short-term note bore interest at
six-month LIBOR plus 1.00%
.
In April 2015, American Life issued a
$150 million
short-term note to MetLife, Inc. which was repaid in May 2015. The short-term note bore interest at
six-month LIBOR plus 0.875%
.
In December 2014, American Life issued a
$100 million
surplus note to MetLife, Inc. The surplus note bears interest at a fixed rate of
3.17%
, payable semi-annually and matures in
June 2020
.
377
MetLife, Inc.
Schedule II
Notes to the Condensed Financial Information — (continued)
(Parent Company Only)
3. Loans to Subsidiaries (continued)
In August 2014, American Life issued a
$120 million
short-term note to MetLife, Inc. which was repaid in December 2014. In February 2014, American Life issued a
$150 million
short-term note to MetLife, Inc. which was repaid in June 2014. Both short-term notes bore interest at
six-month LIBOR plus 0.875%
.
In July 2013, MetLife Ireland Treasury d.a.c. (formerly known as MetLife Ireland Treasury Limited) (“MIT”) borrowed the Chilean peso equivalent of
$1.5 billion
from MetLife, Inc., which was due
July 2023
. The loan bore interest at a fixed rate of
8.5%
, payable annually. In December, September and June 2015, MIT made loan payments of the Chilean peso equivalent of
$77 million
,
$153 million
and
$231 million
, respectively. In December 2014 and June 2014, MIT made loan payments of the Chilean peso equivalent of
$493 million
and
$69 million
, respectively. At December 31, 2015, the loan was fully paid.
Interest income earned on loans to subsidiaries of
$64 million
,
$91 million
and
$155 million
for the years ended December 31,
2016
,
2015
and
2014
, respectively, is included in net investment income.
4. Long-term Debt
Long-term debt outstanding was as follows:
|
Interest Rates (1)
|
December 31,
|
||||||||||||
|
Range
|
Weighted
Average |
Maturity
|
2016
|
2015
|
|||||||||
|
(Dollars in millions)
|
|||||||||||||
|
Senior notes — unaffiliated (2)
|
1.76% - 7.72%
|
4.94%
|
2017 - 2046
|
$
|
15,505
|
|
$
|
16,927
|
|
||||
|
Senior notes — affiliated
|
3.03% - 5.86%
|
4.86%
|
2019 - 2033
|
3,100
|
|
3,100
|
|
||||||
|
Other affiliated debt
|
—
|
1.31%
|
—
|
—
|
|
214
|
|
||||||
|
Total
|
$
|
18,605
|
|
$
|
20,241
|
|
|||||||
__________________
|
(1)
|
Range of interest rates and weighted average interest rates are for the year ended December 31,
2016
.
|
|
(2)
|
Net of
$62 million
of unamortized issuance costs and
$30 million
of unamortized net premiums and discounts at December 31, 2016. Net of
$67 million
of unamortized issuance costs, which were reported in other assets, and
$31 million
of unamortized net premiums and discounts at December 31, 2015.
|
See Note
12
of the Notes to the Consolidated Financial Statements.
The aggregate maturities of long-term debt at December 31,
2016
for the next five years and thereafter are
$1.0 billion
in 2017,
$1.0 billion
in 2018,
$1.8 billion
in 2019,
$742 million
in 2020,
$2.0 billion
in 2021 and
$12.0 billion
thereafter.
Affiliated Credit Facility
In June 2016, MetLife, Inc. entered into a five-year agreement with an indirect wholly-owned subsidiary, MIT, to borrow up to
$1.3 billion
on a revolving basis, at interest rates based on the IRS safe harbor interest rate in effect at the time of the borrowing. MetLife, Inc. may borrow funds under the agreement at MIT’s discretion and subject to the availability of funds. There were no outstanding borrowings at December 31, 2016.
Other Affiliated Debt
In June 2016, March 2016 and December 2015, MetLife, Inc. repaid
$204 million
,
$10 million
and
$286 million
of affiliated long-term debt to MetLife Exchange Trust I, at maturity, in exchange for a return of capital. The long-term notes bore interest at
three-month LIBOR plus 0.7%
.
378
MetLife, Inc.
Schedule II
Notes to the Condensed Financial Information — (continued)
(Parent Company Only)
4. Long-term Debt (continued)
Senior Notes – Affiliated
In September 2016, a
$250 million
senior note issued to MLIC matured and, subsequently, in September 2016 MetLife, Inc. issued a new
$250 million
senior note to MLIC. The senior note matures in
September 2020
and bears interest at a rate per annum of
3.03%
, payable semi-annually.
In June 2014, a
$500 million
senior note payable to MLIC matured and, subsequently, MetLife, Inc. issued a new
$500 million
senior note to MLIC. This note matures in
June 2019
and bears interest at a fixed rate of
3.54%
, payable semi-annually.
Interest Expense
Interest expense was comprised of the following:
|
Years Ended December 31,
|
|||||||||||
|
2016
|
2015
|
2014
|
|||||||||
|
(In millions)
|
|||||||||||
|
Long-term debt — unaffiliated
|
$
|
811
|
|
$
|
833
|
|
$
|
809
|
|
||
|
Long-term debt — affiliated
|
160
|
|
168
|
|
173
|
|
|||||
|
Collateral financing arrangements
|
47
|
|
36
|
|
35
|
|
|||||
|
Junior subordinated debt securities
|
134
|
|
134
|
|
134
|
|
|||||
|
Total
|
$
|
1,152
|
|
$
|
1,171
|
|
$
|
1,151
|
|
||
See Notes
13
and
14
of the Notes to the Consolidated Financial Statements for information about the collateral financing arrangements and junior subordinated debt securities.
5. Support Agreements
MetLife, Inc. is party to various capital support commitments and guarantees with certain of its subsidiaries. Under these arrangements, MetLife, Inc. has agreed to cause each such entity to meet specified capital and surplus levels or has guaranteed certain contractual obligations.
MetLife, Inc., in connection with MRD’s reinsurance of certain universal life and term life risks, entered into capital maintenance agreements pursuant to which MetLife, Inc. agreed, without limitation as to amount, to cause the first and second protected cells of MRD to maintain total adjusted capital equal to or greater than 200% of each such protected cell’s Company Action Level RBC, as defined in state insurance statutes. In addition, MetLife, Inc. entered into an agreement with the Delaware Department of Insurance to increase such capital maintenance threshold to 300% of each such protected cell’s Company Action Level RBC, in the event of specified downgrades in the senior unsecured debt ratings of MetLife, Inc.
MetLife, Inc. guarantees the obligations of its subsidiary, DelAm, under a stop loss reinsurance agreement with RGA Reinsurance (Barbados) Inc. (“RGARe”), pursuant to which RGARe retrocedes to DelAm a portion of the whole life medical insurance business that RGARe assumed from American Life on behalf of its Japan operations. Also, MetLife, Inc. guarantees the obligations of its subsidiary, Missouri Reinsurance, Inc. (“MoRe”), under a retrocession agreement with RGARe, pursuant to which MoRe retrocedes certain group term life insurance liabilities (which retrocession was terminated effective as of January, 2016) and a portion of the closed block liabilities associated with industrial life and ordinary life insurance policies that it assumed from MLIC.
MetLife, Inc. guarantees the obligations of MetLife Reinsurance Company of Bermuda, Ltd. (“MrB”), a Bermuda insurance affiliate and an indirect, wholly-owned subsidiary of MetLife, Inc. under a reinsurance agreement with Mitsui Sumitomo Primary Life Insurance Co., Ltd. (“Mitsui”), a former affiliate that is now an unaffiliated third party, under which MrB reinsures certain variable annuity business written by Mitsui.
379
MetLife, Inc.
Schedule II
Notes to the Condensed Financial Information — (continued)
(Parent Company Only)
5. Support Agreements (continued)
MetLife, Inc. guarantees the obligations of MrB in an aggregate amount up to
$1.0 billion
, under a reinsurance agreement with MetLife Europe d.a.c. (“MEL”) (formerly known as MetLife Europe Limited), under which MrB reinsured the guaranteed living benefits and guaranteed death benefits associated with certain unit-linked annuity contracts issued by MEL.
MetLife, Inc., in connection with MRV’s reinsurance of certain universal life and term life insurance risks, committed to the Vermont Department of Banking, Insurance, Securities and Health Care Administration to take necessary action to cause the three protected cells of MRV to maintain total adjusted capital in an amount that is equal to or greater than 200% of each such protected cell’s authorized control level RBC, as defined in Vermont state insurance statutes. See Note
12
of the Notes to the Consolidated Financial Statements.
MetLife, Inc., in connection with the collateral financing arrangement associated with MRC’s reinsurance of a portion of the liabilities associated with the closed block, committed to the South Carolina Department of Insurance to make capital contributions, if necessary, to MRC so that MRC may at all times maintain its total adjusted capital in an amount that is equal to or greater than 200% of the Company Action Level RBC, as defined in South Carolina state insurance statutes as in effect on the date of determination or December 31, 2007, whichever calculation produces the greater capital requirement, or as otherwise required by the South Carolina Department of Insurance. See Note
13
of the Notes to the Consolidated Financial Statements.
MetLife, Inc., in connection with the collateral financing arrangement associated with MRSC’s reinsurance of ULSG, committed to the South Carolina Department of Insurance to take necessary action to cause MRSC to maintain the greater of capital and surplus of
$250,000
or total adjusted capital in an amount that is equal to or greater than 100% of authorized control level RBC, as defined in South Carolina state insurance statutes. See Note
13
of the Notes to the Consolidated Financial Statements.
MetLife, Inc. has a net worth maintenance agreement with its insurance subsidiary, FMLI. Under this agreement, as amended, MetLife, Inc. agreed, without limitation as to the amount, to cause FMLI to have capital and surplus of
$10 million
, total adjusted capital in an amount that is equal to or greater than 150% of the Company Action Level RBC, as defined by applicable state insurance statutes, and liquidity necessary to enable it to meet its current obligations on a timely basis. In connection with the Separation, this support agreement will be terminated.
MetLife, Inc. guarantees obligations arising from derivatives of the following subsidiaries: MrB, MetLife International Holdings, LLC and MetLife Worldwide Holdings, LLC. These subsidiaries are exposed to various risks relating to their ongoing business operations, including interest rate, foreign currency exchange rate, credit and equity market. These subsidiaries use a variety of strategies to manage these risks, including the use of derivatives. Further, all of the subsidiaries’ derivatives are subject to industry standard netting agreements and collateral agreements that limit the unsecured portion of any open derivative position. On a net counterparty basis at December 31,
2016
and
2015
, derivative transactions with positive mark-to-market values (in-the-money) were
$495 million
and
$583 million
, respectively, and derivative transactions with negative mark-to-market values (out-of-the-money) were
$237 million
and
$32 million
, respectively. To secure the obligations represented by the out of-the-money transactions, the subsidiaries had provided collateral to their counterparties with an estimated fair value of
$233 million
and
$32 million
at December 31,
2016
and
2015
, respectively. Accordingly, unsecured derivative liabilities guaranteed by MetLife, Inc. were
$4 million
and
$0
at December 31,
2016
and
2015
, respectively.
MetLife, Inc. also guarantees the obligations of certain of its subsidiaries under committed facilities with third-party banks. See Note
12
of the Notes to the Consolidated Financial Statements.
380
MetLife, Inc.
Schedule II
Notes to the Condensed Financial Information — (continued)
(Parent Company Only)
6. Subsequent Event
Junior Subordinated Debt Securities
On February 10, 2017, MetLife, Inc. exchanged
$750 million
aggregate principal amount of its
9.250%
Fixed-to-Floating Rate Junior Subordinated Debentures due 2068 for
$750 million
aggregate liquidation preference of the
9.250%
Fixed-to-Floating Rate Exchangeable Surplus Trust Securities of MetLife Capital Trust X. As a result of the exchange, MetLife, Inc. is the sole beneficial owner of the Trust, a special purpose entity which issued the exchangeable surplus trust securities to investors, and is the beneficiary of
$750 million
of
8.595%
surplus notes held by the Trust that were issued by MetLife USA. MetLife, Inc. has stated that it will take steps to terminate the Trust prior to the Separation, after which it will become the direct holder of the surplus notes. MetLife, Inc. has also stated that, prior to the Separation, it intends to forgive MetLife USA’s obligations to pay the principal amount of such surplus notes.
381
MetLife, Inc.
Schedule III
Consolidated Supplementary Insurance Information
December 31,
2016
,
2015
and
2014
(In millions)
|
Segment
|
DAC
and
VOBA
|
Future Policy Benefits,
Other Policy-Related
Balances and
Policyholder Dividend
Obligation
|
Policyholder
Account
Balances
|
Policyholder
Dividends
Payable
|
Unearned
Premiums (1), (2)
|
Unearned
Revenue (1) |
||||||||||||||||||
|
2016
|
||||||||||||||||||||||||
|
U.S.
|
$
|
616
|
|
$
|
61,206
|
|
$
|
67,539
|
|
$
|
—
|
|
$
|
1,843
|
|
$
|
30
|
|
||||||
|
Asia
|
8,707
|
|
36,308
|
|
53,114
|
|
95
|
|
2,167
|
|
912
|
|
||||||||||||
|
Latin America
|
1,808
|
|
9,163
|
|
5,597
|
|
—
|
|
448
|
|
563
|
|
||||||||||||
|
EMEA
|
1,472
|
|
5,439
|
|
12,636
|
|
6
|
|
64
|
|
372
|
|
||||||||||||
|
MetLife Holdings
|
5,246
|
|
72,284
|
|
34,664
|
|
604
|
|
204
|
|
209
|
|
||||||||||||
|
Brighthouse Financial
|
6,921
|
|
36,473
|
|
37,526
|
|
12
|
|
19
|
|
530
|
|
||||||||||||
|
Corporate & Other
|
28
|
|
(4,585
|
)
|
(841
|
)
|
(9
|
)
|
(2
|
)
|
—
|
|
||||||||||||
|
Total
|
$
|
24,798
|
|
$
|
216,288
|
|
$
|
210,235
|
|
$
|
708
|
|
$
|
4,743
|
|
$
|
2,616
|
|
||||||
|
2015
|
||||||||||||||||||||||||
|
U.S.
|
$
|
615
|
|
$
|
59,074
|
|
$
|
63,986
|
|
$
|
—
|
|
$
|
1,820
|
|
$
|
33
|
|
||||||
|
Asia
|
8,374
|
|
34,416
|
|
49,094
|
|
88
|
|
1,859
|
|
974
|
|
||||||||||||
|
Latin America
|
1,753
|
|
8,142
|
|
5,880
|
|
—
|
|
491
|
|
597
|
|
||||||||||||
|
EMEA
|
1,532
|
|
5,837
|
|
13,172
|
|
7
|
|
60
|
|
336
|
|
||||||||||||
|
MetLife Holdings
|
5,436
|
|
70,818
|
|
33,818
|
|
621
|
|
171
|
|
218
|
|
||||||||||||
|
Brighthouse Financial
|
6,390
|
|
34,332
|
|
37,521
|
|
15
|
|
17
|
|
529
|
|
||||||||||||
|
Corporate & Other
|
30
|
|
(4,702
|
)
|
(749
|
)
|
(11
|
)
|
3
|
|
—
|
|
||||||||||||
|
Total
|
$
|
24,130
|
|
$
|
207,917
|
|
$
|
202,722
|
|
$
|
720
|
|
$
|
4,421
|
|
$
|
2,687
|
|
||||||
|
2014
|
||||||||||||||||||||||||
|
U.S.
|
$
|
593
|
|
$
|
57,521
|
|
$
|
65,615
|
|
$
|
—
|
|
$
|
1,801
|
|
$
|
41
|
|
||||||
|
Asia
|
8,217
|
|
33,711
|
|
52,772
|
|
61
|
|
1,711
|
|
924
|
|
||||||||||||
|
Latin America
|
1,987
|
|
8,914
|
|
6,425
|
|
—
|
|
508
|
|
651
|
|
||||||||||||
|
EMEA
|
1,709
|
|
6,514
|
|
14,006
|
|
8
|
|
54
|
|
313
|
|
||||||||||||
|
MetLife Holdings
|
5,387
|
|
71,169
|
|
33,738
|
|
612
|
|
179
|
|
229
|
|
||||||||||||
|
Brighthouse Financial
|
6,537
|
|
32,546
|
|
37,367
|
|
12
|
|
16
|
|
546
|
|
||||||||||||
|
Corporate & Other
|
12
|
|
(3,212
|
)
|
(629
|
)
|
(9
|
)
|
3
|
|
—
|
|
||||||||||||
|
Total
|
$
|
24,442
|
|
$
|
207,163
|
|
$
|
209,294
|
|
$
|
684
|
|
$
|
4,272
|
|
$
|
2,704
|
|
||||||
__________________
|
(1)
|
Amounts are included within the future policy benefits, other policy-related balances and policyholder dividend obligation column.
|
|
(2)
|
Includes premiums received in advance.
|
382
MetLife, Inc.
Schedule III
Consolidated Supplementary Insurance Information — (continued)
December 31,
2016
,
2015
and
2014
(In millions)
|
Segment
|
Premiums and
Universal Life and Investment-Type Product Policy Fees |
Net
Investment Income |
Policyholder
Benefits and Claims and Interest Credited to Policyholder Account Balances |
Amortization of
DAC and VOBA Charged to Other Expenses |
Other
Operating Expenses (1) |
|||||||||||||||
|
2016
|
||||||||||||||||||||
|
U.S.
|
$
|
22,490
|
|
$
|
5,942
|
|
$
|
22,859
|
|
$
|
471
|
|
$
|
3,244
|
|
|||||
|
Asia
|
8,913
|
|
2,807
|
|
6,896
|
|
1,338
|
|
1,795
|
|
||||||||||
|
Latin America
|
3,554
|
|
1,133
|
|
2,770
|
|
184
|
|
1,007
|
|
||||||||||
|
EMEA
|
2,442
|
|
1,229
|
|
2,064
|
|
408
|
|
924
|
|
||||||||||
|
MetLife Holdings
|
6,034
|
|
5,670
|
|
7,532
|
|
424
|
|
3,392
|
|
||||||||||
|
Brighthouse Financial
|
5,005
|
|
3,207
|
|
4,984
|
|
(192
|
)
|
2,269
|
|
||||||||||
|
Corporate & Other
|
(79
|
)
|
(41
|
)
|
(19
|
)
|
8
|
|
1,053
|
|
||||||||||
|
Total
|
$
|
48,359
|
|
$
|
19,947
|
|
$
|
47,086
|
|
$
|
2,641
|
|
$
|
13,684
|
|
|||||
|
2015
|
||||||||||||||||||||
|
U.S.
|
$
|
21,804
|
|
$
|
6,046
|
|
$
|
22,038
|
|
$
|
471
|
|
$
|
3,197
|
|
|||||
|
Asia
|
8,491
|
|
2,859
|
|
6,817
|
|
1,265
|
|
1,619
|
|
||||||||||
|
Latin America
|
3,702
|
|
1,046
|
|
2,853
|
|
271
|
|
1,075
|
|
||||||||||
|
EMEA
|
2,455
|
|
347
|
|
1,109
|
|
492
|
|
998
|
|
||||||||||
|
MetLife Holdings
|
6,116
|
|
5,867
|
|
7,226
|
|
701
|
|
3,597
|
|
||||||||||
|
Brighthouse Financial
|
5,684
|
|
3,098
|
|
4,432
|
|
737
|
|
2,258
|
|
||||||||||
|
Corporate & Other
|
(200
|
)
|
18
|
|
(151
|
)
|
(1
|
)
|
1,477
|
|
||||||||||
|
Total
|
$
|
48,052
|
|
$
|
19,281
|
|
$
|
44,324
|
|
$
|
3,936
|
|
$
|
14,221
|
|
|||||
|
2014
|
||||||||||||||||||||
|
U.S.
|
$
|
21,152
|
|
$
|
6,001
|
|
$
|
21,292
|
|
$
|
458
|
|
$
|
3,080
|
|
|||||
|
Asia
|
9,270
|
|
3,279
|
|
7,748
|
|
1,394
|
|
1,724
|
|
||||||||||
|
Latin America
|
4,038
|
|
1,257
|
|
3,310
|
|
313
|
|
1,192
|
|
||||||||||
|
EMEA
|
2,832
|
|
1,238
|
|
1,978
|
|
626
|
|
1,176
|
|
||||||||||
|
MetLife Holdings
|
5,964
|
|
6,012
|
|
7,087
|
|
199
|
|
3,636
|
|
||||||||||
|
Brighthouse Financial
|
5,771
|
|
3,078
|
|
4,545
|
|
1,150
|
|
2,285
|
|
||||||||||
|
Corporate & Other
|
(14
|
)
|
288
|
|
85
|
|
(8
|
)
|
1,242
|
|
||||||||||
|
Total
|
$
|
49,013
|
|
$
|
21,153
|
|
$
|
46,045
|
|
$
|
4,132
|
|
$
|
14,335
|
|
|||||
______________
|
(1)
|
Includes other expenses and policyholder dividends, excluding amortization of DAC and VOBA charged to other expenses.
|
383
MetLife, Inc.
Schedule IV
Consolidated Reinsurance
December 31, 2016
,
2015
and
2014
(Dollars in millions)
|
Gross Amount
|
Ceded
|
Assumed
|
Net Amount
|
% Amount Assumed to Net
|
|||||||||||||||
|
2016
|
|||||||||||||||||||
|
Life insurance in-force
|
$
|
4,752,050
|
|
$
|
680,460
|
|
$
|
613,693
|
|
$
|
4,685,283
|
|
13.1
|
%
|
|||||
|
Insurance premium
|
|
||||||||||||||||||
|
Life insurance (1)
|
$
|
23,006
|
|
$
|
2,001
|
|
$
|
1,133
|
|
$
|
22,138
|
|
5.1
|
%
|
|||||
|
Accident & health insurance
|
13,698
|
|
447
|
|
255
|
|
13,506
|
|
1.9
|
%
|
|||||||||
|
Property & casualty insurance
|
3,567
|
|
75
|
|
17
|
|
3,509
|
|
0.5
|
%
|
|||||||||
|
Total insurance premium
|
$
|
40,271
|
|
$
|
2,523
|
|
$
|
1,405
|
|
$
|
39,153
|
|
3.6
|
%
|
|||||
|
2015
|
|
||||||||||||||||||
|
Life insurance in-force
|
$
|
4,718,278
|
|
$
|
751,199
|
|
$
|
602,213
|
|
$
|
4,569,292
|
|
13.2
|
%
|
|||||
|
Insurance premium
|
|
||||||||||||||||||
|
Life insurance (1)
|
$
|
23,308
|
|
$
|
1,964
|
|
$
|
1,221
|
|
$
|
22,565
|
|
5.4
|
%
|
|||||
|
Accident & health insurance
|
12,695
|
|
385
|
|
220
|
|
12,530
|
|
1.8
|
%
|
|||||||||
|
Property & casualty insurance
|
3,513
|
|
76
|
|
13
|
|
3,450
|
|
0.4
|
%
|
|||||||||
|
Total insurance premium
|
$
|
39,516
|
|
$
|
2,425
|
|
$
|
1,454
|
|
$
|
38,545
|
|
3.8
|
%
|
|||||
|
2014
|
|
||||||||||||||||||
|
Life insurance in-force
|
$
|
4,572,115
|
|
$
|
719,154
|
|
$
|
649,032
|
|
$
|
4,501,993
|
|
14.4
|
%
|
|||||
|
Insurance premium
|
|
||||||||||||||||||
|
Life insurance (1)
|
$
|
23,575
|
|
$
|
2,034
|
|
$
|
1,224
|
|
$
|
22,765
|
|
5.4
|
%
|
|||||
|
Accident & health insurance
|
13,015
|
|
340
|
|
239
|
|
12,914
|
|
1.9
|
%
|
|||||||||
|
Property & casualty insurance
|
3,459
|
|
80
|
|
9
|
|
3,388
|
|
0.3
|
%
|
|||||||||
|
Total insurance premium
|
$
|
40,049
|
|
$
|
2,454
|
|
$
|
1,472
|
|
$
|
39,067
|
|
3.8
|
%
|
|||||
__________________
|
(1)
|
Includes annuities with life contingencies.
|
384
None.
Management, with the participation of the Chief Executive Officer and Chief Financial Officer, has evaluated the effectiveness of the design and operation of the Company’s disclosure controls and procedures as defined in Exchange Act Rule 13a-15(e) as of the end of the period covered by this report. Based on that evaluation, the Chief Executive Officer and Chief Financial Officer have concluded that these disclosure controls and procedures are effective.
There were no changes to the Company’s internal control over financial reporting as defined in Exchange Act Rule 13a-15(f) during the quarter ended December 31,
2016
that have materially affected, or are reasonably likely to materially affect, the Company’s internal control over financial reporting.
Management’s Annual Report on Internal Control Over Financial Reporting
Management of MetLife, Inc. and subsidiaries is responsible for establishing and maintaining adequate internal control over financial reporting. In fulfilling this responsibility, estimates and judgments by management are required to assess the expected benefits and related costs of control procedures. The objectives of internal control include providing management with reasonable, but not absolute, assurance that assets are safeguarded against loss from unauthorized use or disposition, and that transactions are executed in accordance with management’s authorization and recorded properly to permit the preparation of consolidated financial statements in conformity with GAAP.
Management has documented and evaluated the effectiveness of the internal control of the Company at December 31,
2016
pertaining to financial reporting in accordance with the criteria established in
Internal Control — Integrated Framework (2013)
issued by the Committee of Sponsoring Organizations of the Treadway Commission.
In the opinion of management, MetLife, Inc. maintained effective internal control over financial reporting at December 31,
2016
.
Deloitte & Touche LLP, an independent registered public accounting firm, has audited the consolidated financial statements and consolidated financial statement schedules included in the Annual Report on Form 10-K for the year ended December 31,
2016
. The Report of the Independent Registered Public Accounting Firm on their audit of the consolidated financial statements and consolidated financial statement schedules is included on page 386.
Report of the Company’s Registered Public Accounting Firm
The Company’s independent registered public accounting firm, Deloitte & Touche LLP, has issued their report on their audit of the effectiveness of internal control over financial reporting which is set forth below.
385
REPORT OF INDEPENDENT REGISTERED PUBLIC ACCOUNTING FIRM
To the Board of Directors and Stockholders of
MetLife, Inc.
New York, New York
We have audited the internal control over financial reporting of MetLife, Inc. and subsidiaries (the “Company”) as of December 31,
2016
, based on criteria established in
Internal Control — Integrated Framework
(
2013)
issued by the Committee of Sponsoring Organizations of the Treadway Commission. The Company’s management is responsible for maintaining effective internal control over financial reporting and for its assessment of the effectiveness of internal control over financial reporting, included in the accompanying Management’s Annual Report on Internal Control Over Financial Reporting. Our responsibility is to express an opinion on the Company’s internal control over financial reporting based on our audit.
We conducted our audit in accordance with the standards of the Public Company Accounting Oversight Board (United States). Those standards require that we plan and perform the audit to obtain reasonable assurance about whether effective internal control over financial reporting was maintained in all material respects. Our audit included obtaining an understanding of internal control over financial reporting, assessing the risk that a material weakness exists, testing and evaluating the design and operating effectiveness of internal control based on the assessed risk, and performing such other procedures as we considered necessary in the circumstances. We believe that our audit provides a reasonable basis for our opinion.
A company’s internal control over financial reporting is a process designed by, or under the supervision of, the company’s principal executive and principal financial officers, or persons performing similar functions, and effected by the company’s board of directors, management, and other personnel to provide reasonable assurance regarding the reliability of financial reporting and the preparation of financial statements for external purposes in accordance with generally accepted accounting principles. A company’s internal control over financial reporting includes those policies and procedures that (1) pertain to the maintenance of records that, in reasonable detail, accurately and fairly reflect the transactions and dispositions of the assets of the company; (2) provide reasonable assurance that transactions are recorded as necessary to permit preparation of financial statements in accordance with generally accepted accounting principles, and that receipts and expenditures of the company are being made only in accordance with authorizations of management and directors of the company; and (3) provide reasonable assurance regarding prevention or timely detection of unauthorized acquisition, use, or disposition of the company’s assets that could have a material effect on the financial statements.
Because of the inherent limitations of internal control over financial reporting, including the possibility of collusion or improper management override of controls, material misstatements due to error or fraud may not be prevented or detected on a timely basis. Also, projections of any evaluation of the effectiveness of the internal control over financial reporting to future periods are subject to the risk that the controls may become inadequate because of changes in conditions, or that the degree of compliance with the policies or procedures may deteriorate.
In our opinion, the Company maintained, in all material respects, effective internal control over financial reporting as of December 31,
2016
, based on the criteria established in
Internal Control — Integrated Framework (2013)
issued by the Committee of Sponsoring Organizations of the Treadway Commission.
We have also audited, in accordance with the standards of the Public Company Accounting Oversight Board (United States), the consolidated financial statements and financial statement schedules as of and for the year ended December 31,
2016
, of the Company and our report dated February 28,
2017
, expressed an unqualified opinion on those consolidated financial statements and financial statement schedules.
/s/ DELOITTE & TOUCHE LLP
New York, New York
February 28,
2017
386
None.
The information called for by this Item pertaining to Directors is incorporated herein by reference to the sections entitled “Proxy Summary — Director Nominees,” “Proposal 1 — Election of Directors For a One-Year Term Ending at the 2018 Annual Meeting of Shareholders — Director Nominees” and “Proposal 1 — Election of Directors For a One-Year Term Ending at the 2018 Annual Meeting of Shareholders —
Corporate Governance — Board and Committee Information” and “Other Information — Section 16(a) Beneficial Ownership Reporting Compliance” in MetLife, Inc.’s definitive proxy statement for the Annual Meeting of Shareholders to be held on June 13,
2017
, to be filed by MetLife, Inc. with the SEC pursuant to Regulation 14A within 120 days after the year ended December 31,
2016
(the “2017 Proxy Statement”).
The information called for by this Item pertaining to Executive Officers appears in “Business — Executive Officers” in this Annual Report on Form 10-K and “Other Information — Section 16(a) Beneficial Ownership Reporting Compliance” in the
2017
Proxy Statement.
The Company has adopted the MetLife Financial Management Code of Professional Conduct (the “Financial Management Code”), a “code of ethics” as defined under the rules of the SEC, that applies to MetLife, Inc.’s Chief Executive Officer, Chief Financial Officer, Chief Accounting Officer and all professionals in finance and finance-related departments. In addition, the Company has adopted the Directors’ Code of Business Conduct and Ethics (the “Directors’ Code”) which applies to all members of MetLife, Inc.’s Board of Directors, including the Chief Executive Officer, and the Code of Conduct (together with the Financial Management Code and the Directors’ Code, collectively, the “Ethics Codes”), which applies to all employees of the Company, including MetLife, Inc.’s Chief Executive Officer, Chief Financial Officer and Chief Accounting Officer. The Ethics Codes are available on the Company’s website at http://www.metlife.com/about/corporate-profile/corporate-governance/corporate-conduct/index.html. The Company intends to satisfy its disclosure obligations under Item 5.05 of Form 8-K by posting information about amendments to, or waivers from a provision of, the Ethics Codes that apply to MetLife, Inc.’s Chief Executive Officer, Chief Financial Officer and Chief Accounting Officer on the Company’s website at the address given above.
The information called for by this Item is incorporated herein by reference to the sections entitled “Proposal 1 — Election of Directors for a One-Year Term Ending at the 2018 Annual Meeting of Shareholders — Corporate Governance — Board and Committee Information,” “
Proposal 1
—
Election of Directors for a One-Year Term Ending at the 2018 Annual Meeting of Shareholders
— Director Compensation in
2016
,” and
“Proposal 3
—
Advisory Vote to Approve the Compensation Paid to the Company’s Named Executive Officers”
in the
2017
Proxy Statement.
The information called for by this Item pertaining to ownership of shares of MetLife, Inc.’s common stock (“Shares”) is incorporated herein by reference to the sections entitled “Other Information — Security Ownership of Directors and Executive Officers” and “Other Information — Security Ownership of Certain Beneficial Owners” in the
2017
Proxy Statement.
387
The following table provides information, at
December 31, 2016
, regarding MetLife, Inc.’s equity compensation plans:
Equity Compensation Plan Information at
December 31, 2016
|
Number of Securities to be Issued upon Exercise of Outstanding Options, Warrants and Rights (1)
|
Weighted-average Exercise Price of Outstanding Options, Warrants and Rights (2)
|
Number of Securities Remaining Available for Future Issuance Under Equity Compensation Plans (Excluding Securities Reflected in Column (a))(3)
|
||||||||
|
Plan Category
|
(a)
|
(b)
|
(c)
|
|||||||
|
Equity compensation plans approved by security holders
|
31,163,304
|
|
$
|
44.73
|
|
31,786,397
|
|
|||
|
Equity compensation plans not approved by security holders
|
—
|
|
—
|
|
—
|
|
||||
|
Total
|
31,163,304
|
|
$
|
44.73
|
|
31,786,397
|
|
|||
______________
|
(1)
|
Column (a) reflects the following items outstanding as of
December 31, 2016
:
|
|
Stock Options
|
19,482,388
|
|
|
Restricted Stock Units
|
3,422,013
|
|
|
Performance Shares (assuming future payout at maximum performance factor)
|
6,679,925
|
|
|
Deferred Shares
|
1,578,978
|
|
|
Shares that will or may be issued
|
31,163,304
|
|
As of December 31, 2016:
|
•
|
Stock Options under the MetLife, Inc. 2015 Stock and Incentive Compensation Plan (the “2015 Stock Plan”) and its predecessor plan, the MetLife, Inc. 2005 Stock and Incentive Compensation Plan (the “2005 Stock Plan) were outstanding;
|
|
•
|
Restricted Stock Units and Performance Shares under the 2015 Stock Plan were outstanding; and
|
|
•
|
Deferred Shares related to awards under the 2015 Stock Plan, MetLife, Inc. 2015 Non-Management Directors Stock Compensation Plan (the “2015 Director Stock Plan”), 2005 Stock Plan, MetLife, Inc. 2005 Non-Management Directors Stock Compensation Plan (the “2005 Director Stock Plan”), and earlier plans, were outstanding. Deferred Shares are Shares that are covered by awards that have become payable under any plan, but the issuance of which has been deferred.
|
The maximum performance factor for Performance Shares granted in 2014, 2015, and 2016 was 175%. The number of Performance Shares outstanding as of
December 31, 2016
at target (100%) performance factor was 3,817,100.
MetLife, Inc. may issue Shares pursuant to awards (including Stock Option exercises, if any) under any plan using Shares held in treasury by MetLife, Inc. or by issuing new Shares.
For a general description of how the number of Shares paid out on account of Performance Shares and Restricted Stock Units is determined, and the vesting periods applicable to Performance Shares and Restricted Stock Units, see Note
16
of the Notes to the Consolidated Financial Statements.
|
(2)
|
Column (b) reflects the weighted average exercise price of all Stock Options under any plan that, as of
December 31, 2016
, had been granted but not forfeited, expired, or exercised. Performance Shares, Restricted Stock Units, and Deferred Shares are not included in determining the weighted average in column (b) because they have no exercise price.
|
388
|
(3)
|
Column (c) reflects the following items outstanding as of
December 31, 2016
:
|
|
Number of Shares
|
||
|
At January 15, 2015, the effective date of the 2015 Stock Plan and 2015 Director Stock Plan:
|
||
|
Shares newly authorized for issuance under the 2015 Stock Plan
|
11,750,000
|
|
|
Shares remaining authorized for issuance under the 2005 Stock Plan or other plans that were not covered by awards (*)
|
18,023,959
|
|
|
Shares authorized for issuance under the 2015 Director Stock Plan (**)
|
1,642,208
|
|
|
Total Shares authorized for issuance at January 1, 2015
|
31,416,167
|
|
|
Additional Shares recovered for issuance (***) in:
|
||
|
2015
|
4,475,737
|
|
|
2016
|
6,344,455
|
|
|
Total Shares recovered for issuance since January 1, 2015
|
10,820,192
|
|
|
Less: Shares covered by new awards and new imputed reinvested dividends on Deferred Shares (****) in:
|
||
|
2015
|
4,413,785
|
|
|
2016
|
6,036,177
|
|
|
Total Shares covered by new awards and new imputed reinvested dividends on Deferred Shares since January 1, 2015
|
10,449,962
|
|
|
Shares remaining available for future issuance under the 2015 Stock Plan and 2015 Director Stock Plan
|
31,786,397
|
|
______________
|
(*)
|
Consisting of those that were not covered by awards, including shares previously covered by awards but recovered due to forfeiture of awards or other reasons and once again available for issuance.
|
|
(**)
|
Consists of shares remaining authorized for issuance under the predecessor plan, the 2005 Director Stock Plan, that were not covered by awards, including shares previously covered by awards but recovered due to forfeiture of awards or other reasons and once again available.
|
|
(***)
|
Consists of Shares utilized under the 2005 Stock Plan or 2015 Stock Plan that were recovered during each of the indicated calendar years, and therefore once again available for issuance, due to: (i) termination of the award by expiration, forfeiture, cancellation, lapse, or otherwise without issuing Shares; (ii) settlement of the award in cash either in lieu of Shares or otherwise; (iii) exchange of the award for awards not involving Shares; (iv) payment of the exercise price of a Stock Option, or the tax withholding requirements with respect to an award, satisfied by tendering Shares to MetLife, Inc. (by either actual delivery or by attestation); (v) satisfaction of tax withholding requirements with respect to an award satisfied by MetLife, Inc. withholding Shares otherwise issuable; and (vi) the payout of Performance Shares at any performance factor less than the maximum performance factor.
|
|
(****)
|
Consists of Shares covered by awards granted under the 2015 Stock Plan (including Performance Shares assuming future payout at maximum performance factor). Shares covered by awards granted under the 2015 Directors Stock Plan and Shares covered by imputed reinvested dividends credited on Deferred Shares owed to directors, employees or agents, in each case during each of the indicated calendar years.
|
389
Each Share MetLife, Inc. issues in connection with awards granted under the MetLife, Inc. 2005 Stock Plan other than Stock Options or Stock Appreciation Rights (such as Shares payable on account of Performance Shares or Restricted Stock Units under that plan, including any Deferred Shares resulting from such awards) reduces the number of Shares remaining for issuance by 1.179 (“2005 Stock Plan Share Award Ratio”). Each Share MetLife, Inc. issues in connection with a Stock Option or Stock Appreciation Right granted under the 2005 Stock Plan, or in connection with any award under any other plan for employees and agents (including any Deferred Shares resulting from such awards), reduces the number of Shares remaining for issuance by 1.0. (“Standard Award Ratio”). Shares related to awards that are recovered, and therefore authorized for issuance under the 2015 Stock Plan, are recovered with consideration of the 2005 Stock Plan Share Award Ratio and Standard Award Ratio, as applicable. Each Share MetLife, Inc. issues under the 2005 Director Stock Plan or 2015 Director Stock Plan (including any Deferred Shares resulting from such awards) reduces the number of Shares remaining for issuance under that plan by one. Shares related to awards that are recovered, and therefore authorized for issuance under the 2015 Director Stock Plan are recovered with consideration of this ratio. If MetLife, Inc. was to grant a Share-settled Stock Appreciation Right under the 2015 Stock Plan and the award holder exercised it, only the number of Shares MetLife, Inc. issued, net of the Shares tendered, if any, would be deemed delivered for purposes of determining the maximum number of Shares MetLife, Inc. may issue under the 2015 Stock Plan.
Any Shares covered by awards under the 2015 Director Stock Plan that were to be recovered due to (i) termination of the award by expiration, forfeiture, cancellation, lapse, or otherwise without issuing Shares; (ii) settlement of the award in cash either in lieu of Shares or otherwise; (iii) exchange of the award for awards not involving Shares; and (iv) payment of the exercise price of a Stock Option, or the tax withholding requirements with respect to an award, satisfied by tendering Shares to MetLife, Inc. (by either actual delivery or by attestation) would be available to be issued under the 2015 Director Stock Plan. In addition, if MetLife, Inc. was to grant a Share-settled Stock Appreciation Right under the 2015 Director Stock Plan, only the number of Shares issued, net of the Shares tendered, if any, would be deemed delivered for purposes of determining the maximum number of Shares available for issuance under the 2015 Director Stock Plan.
Under both the 2015 Stock Plan and the 2015 Director Stock Plan, in the event of a corporate event or transaction (including, but not limited to, a change in the Shares or the capitalization of MetLife) such as a merger, consolidation, reorganization, recapitalization, separation, stock dividend, extraordinary dividend, stock split, reverse stock split, split up, spin-off, or other distribution of stock or property of MetLife, combination of securities, exchange of securities, dividend in kind, or other like change in capital structure or distribution (other than normal cash dividends) to shareholders of MetLife, or any similar corporate event or transaction, the appropriate committee of the Board of Directors of MetLife, in order to prevent dilution or enlargement of participants’ rights under the applicable plan, shall substitute or adjust, as applicable, the number and kind of Shares that may be issued under that plan and shall adjust the number and kind of Shares subject to outstanding awards. Any Shares related to awards under either plan which: (i) terminate by expiration, forfeiture, cancellation, or otherwise without the issuance of Shares; (ii) are settled in cash either in lieu of Shares or otherwise; or (iii) are exchanged with the appropriate committee’s permission for awards not involving Shares, are available again for grant under the applicable plan. If the option price of any Stock Option granted under either plan or the tax withholding requirements with respect to any award granted under either plan is satisfied by tendering Shares to MetLife (by either actual delivery or by attestation), or if a Stock Appreciation Right is exercised, only the number of Shares issued, net of the Shares tendered, if any, will be deemed delivered for purposes of determining the maximum number of Shares available for issuance under that plan. The maximum number of Shares available for issuance under either plan shall not be reduced to reflect any dividends or dividend equivalents that are reinvested into additional Shares or credited as additional Restricted Stock or Restricted Stock Units.
For a description of the kinds of awards that have been or may be made under the 2015 Stock Plan and 2015 Director Stock Plan and awards that remained outstanding under the 2005 Stock Plan, see Note
16
of the Notes to the Consolidated Financial Statements.
The information called for by this Item is incorporated herein by reference to the sections entitled “Proposal 1 — Election of Directors for a One-Year Term Ending at the 2018 Annual Meeting of Shareholders — Corporate Governance — Procedures for Reviewing Related Person Transactions,” “Proposal 1 — Election of Directors for a One-Year Term Ending at the 2018 Annual Meeting of Shareholders — Corporate Governance — Related Person Transactions” and “Proposal 1 — Election of Directors for a One-Year Term Ending at the 2018 Annual Meeting of Shareholders — Corporate Governance — Board and Committee Information — Composition and Independence of the Board of Directors” in the
2017
Proxy Statement.
390
The information called for by this item is incorporated herein by reference to the section entitled “Proposal 2 — Ratification of Appointment of the Independent Auditor” in the
2017
Proxy Statement.
The following documents are filed as part of this report:
1. Financial Statements
The financial statements are listed in the Index to Consolidated Financial Statements, Notes and Schedules on page 199.
2. Financial Statement Schedules
The financial statement schedules are listed in the Index to Consolidated Financial Statements, Notes and Schedules on page 199.
3. Exhibits
The exhibits are listed in the Exhibit Index which begins on page E-1.
391
Signatures
Pursuant to the requirements of Section 13 or 15(d) of the Securities Exchange Act of 1934, the registrant has duly caused this report to be signed on its behalf by the undersigned, thereunto duly authorized.
February 28, 2017
|
METLIFE, INC.
|
||
|
By
|
|
/s/ Steven A. Kandarian
|
|
|
Name: Steven A. Kandarian
|
|
|
|
Title: Chairman of the Board, President
and Chief Executive Officer |
|
Pursuant to the requirements of the Securities Exchange Act of 1934, this report has been signed below by the following persons on behalf of the registrant and in the capacities and on the dates indicated.
|
Signature
|
|
Title
|
|
Date
|
|
/s/ Cheryl W. Grisé
|
|
Director
|
|
February 28, 2017
|
|
Cheryl W. Grisé
|
||||
|
/s/ Carlos M. Gutierrez
|
|
Director
|
|
February 28, 2017
|
|
Carlos M. Gutierrez
|
||||
|
/s/ David L. Herzog
|
Director
|
February 28, 2017
|
||
|
David L. Herzog
|
||||
|
/s/ R. Glenn Hubbard
|
Director
|
February 28, 2017
|
||
|
R. Glenn Hubbard
|
||||
|
/s/ Alfred F. Kelly, Jr.
|
|
Director
|
|
February 28, 2017
|
|
Alfred F. Kelly, Jr.
|
||||
|
/s/ Edward J. Kelly, III
|
|
Director
|
|
February 28, 2017
|
|
Edward J. Kelly, III
|
||||
|
/s/ William E. Kennard
|
|
Director
|
|
February 28, 2017
|
|
William E. Kennard
|
||||
|
/s/ James M. Kilts
|
|
Director
|
|
February 28, 2017
|
|
James M. Kilts
|
||||
|
/s/ Catherine R. Kinney
|
|
Director
|
|
February 28, 2017
|
|
Catherine R. Kinney
|
||||
|
/s/ Denise M. Morrison
|
|
Director
|
|
February 28, 2017
|
|
Denise M. Morrison
|
||||
|
/s/ Kenton J. Sicchitano
|
|
Director
|
|
February 28, 2017
|
|
Kenton J. Sicchitano
|
||||
|
/s/ Lulu C. Wang
|
Director
|
February 28, 2017
|
||
|
Lulu C. Wang
|
||||
392
|
Signature
|
Title
|
Date
|
||
|
/s/ Steven A. Kandarian
|
|
Chairman of the Board, President and
|
|
February 28, 2017
|
|
Steven A. Kandarian
|
Chief Executive Officer
(Principal Executive Officer) |
|||
|
/s/ John C. R. Hele
|
|
Executive Vice President and
|
|
February 28, 2017
|
|
John C. R. Hele
|
Chief Financial Officer
(Principal Financial Officer)
|
|||
|
/s/ Peter M. Carlson
|
|
Executive Vice President and
|
|
February 28, 2017
|
|
Peter M. Carlson
|
Chief Accounting Officer
(Principal Accounting Officer)
|
|||
393
Exhibit Index
(Note Regarding Reliance on Statements in Our Contracts:
In reviewing the agreements included as exhibits to this Annual Report on Form 10-K, please remember that they are included to provide you with information regarding their terms and are not intended to provide any other factual or disclosure information about MetLife, Inc., its subsidiaries or affiliates, or the other parties to the agreements. The agreements contain representations and warranties by each of the parties to the applicable agreement. These representations and warranties have been made solely for the benefit of the other parties to the applicable agreement and (i) should not in all instances be treated as categorical statements of fact, but rather as a way of allocating the risk to one of the parties if those statements prove to be inaccurate; (ii) have been qualified by disclosures that were made to the other party in connection with the negotiation of the applicable agreement, which disclosures are not necessarily reflected in the agreement; (iii) may apply standards of materiality in a way that is different from what may be viewed as material to investors; and (iv) were made only as of the date of the applicable agreement or such other date or dates as may be specified in the agreement and are subject to more recent developments. Accordingly, these representations and warranties may not describe the actual state of affairs as of the date they were made or at any other time. Additional information about MetLife, Inc., its subsidiaries and affiliates may be found elsewhere in this Annual Report on Form 10-K and MetLife, Inc.’s other public filings, which are available without charge through the SEC’s website at www.sec.gov.)
|
Exhibit No.
|
|
Description
|
|
2.1
|
|
Plan of Reorganization. (Incorporated by reference to Exhibit 2.1 to MetLife, Inc.'s Registration Statement on Form S-1 (No. 333-91517) (the "S-1 Registration Statement")).
|
|
2.2
|
|
Amendment to Plan of Reorganization, dated as of March 9, 2000. (Incorporated by reference to Exhibit 2.2 to the S-1 Registration Statement).
|
|
3.1
|
|
Amended and Restated Certificate of Incorporation of MetLife, Inc.
|
|
3.2
|
|
Certificate of Designation, Preferences and Rights of Series A Junior Participating Preferred Stock of MetLife, Inc., filed with the Secretary of State of Delaware on April 7, 2000.
|
|
3.3
|
|
Certificate of Designations of Floating Rate Non-Cumulative Preferred Stock, Series A, of MetLife, Inc., filed with the Secretary of State of Delaware on June 10, 2005.
|
|
3.4
|
|
Certificate of Amendment of Amended and Restated Certificate of Incorporation of MetLife, Inc., dated April 29, 2011.
|
|
3.5
|
Certificate of Retirement of Series B Contingent Convertible Junior Participating Non-Cumulative Perpetual Preferred Stock of MetLife, Inc., filed with the Secretary of State of Delaware on November 5, 2013. (Incorporated by reference to Exhibit 3.6 to MetLife, Inc.'s Quarterly Report on Form 10-Q for the quarter ended September 30, 2013).
|
|
|
3.6
|
Certificate of Amendment of Amended and Restated Certificate of Incorporation of MetLife, Inc., dated April 29, 2015. (Incorporated by reference to Exhibit 3.1 to MetLife, Inc.'s Current Report on Form 8-K dated April 30, 2015).
|
|
|
3.7
|
Certificate of Designations of 5.250% Fixed-to-Floating Rate Non-Cumulative Preferred Stock, Series C, of MetLife, Inc., filed with the Secretary of State of Delaware on May 28, 2015. (Incorporated by reference to Exhibit 3.1 to MetLife, Inc.’s Current Report on Form 8‑K dated May 28, 2015).
|
|
|
3.8
|
Certificate of Elimination of 6.500% Non-Cumulative Preferred Stock, Series B, of MetLife, Inc., filed with the Secretary of State of Delaware on November 3, 2015. (Incorporated by reference to Exhibit 3.7 to MetLife, Inc.’s Quarterly Report on Form 10-Q for the quarter ended September 30, 2015).*
|
|
|
3.9
|
|
Amended and Restated By-Laws of MetLife, Inc., effective September 27, 2016. (Incorporated by reference to Exhibit 3.2 to MetLife, Inc.'s Current Report on Form 8-K dated September 29, 2016).
|
|
4.1
|
Form of Certificate for Common Stock, par value $0.01 per share. (Incorporated by reference to Exhibit 4.1 to the S-1 Registration Statement).
|
|
|
4.2
|
Certificate of Designation, Preferences and Rights of Series A Junior Participating Preferred Stock of MetLife, Inc., filed with the Secretary of State of Delaware on April 7, 2000. (See Exhibit 3.2 above).
|
|
E-1
|
Exhibit No.
|
|
Description
|
|
4.3
|
Certificate of Designations of Floating Rate Non-Cumulative Preferred Stock, Series A, of MetLife, Inc., filed with the Secretary of State of Delaware on June 10, 2005. (See Exhibit 3.3 above).
|
|
|
4.4
|
Form of Stock Certificate, Floating Rate Non-Cumulative Preferred Stock, Series A, of MetLife, Inc. (Incorporated by reference to Exhibit 99.6 to MetLife, Inc.'s Registration Statement on Form 8-A filed on June 10, 2005).
|
|
|
4.5
|
Certificate of Designations of 5.250% Fixed-to-Floating Rate Non-Cumulative Preferred Stock, Series C, of MetLife, Inc., filed with the Secretary of State of Delaware on May 28, 2015. (See Exhibit 3.7 above).
|
|
|
4.6
|
Form of Stock Certificate, 5.250% Fixed-to-Floating Rate Non-Cumulative Preferred Stock, Series C, of MetLife, Inc. (Incorporated by reference to Exhibit 4.2 to MetLife, Inc.'s Current Report on Form 8-K dated May 28, 2015).
|
|
|
Certain instruments defining the rights of holders of long-term debt of MetLife, Inc. and its consolidated subsidiaries are omitted pursuant to Item 601(b)(4)(iii) of Regulation S-K. MetLife, Inc. hereby agrees to furnish to the Securities and Exchange Commission, upon request, copies of such instruments.
|
||
|
10.1
|
MetLife Executive Severance Plan (as amended and restated, effective June 14, 2010). (Incorporated by reference to Exhibit 10.1 to MetLife, Inc.'s Annual Report on Form 10-K for the fiscal year ended December 31, 2014 (the "2014 Annual Report")). *
|
|
|
10.2
|
|
Offer Letter, dated March 25, 2009, between American Life Insurance Company and Michel Khalaf.*
|
|
10.3
|
|
Adjustment of certain compensation items for Michel Khalaf, effective July 1, 2012. (Incorporated by reference to Exhibit 10.2 to MetLife, Inc.'s Quarterly Report on Form 10-Q for the quarter ended September 30, 2012).*
|
|
10.4
|
|
Employment Agreement between Christopher G. Townsend and MetLife Asia Pacific Limited, dated May 11, 2012. (Incorporated by reference to Exhibit 10.1 to MetLife, Inc.'s Current Report on Form 8-K dated May 16, 2012 (the "May 16, 2012 Form 8-K")).*
|
|
10.5
|
Letter Agreement dated June 11, 2015 between MetLife, Inc. and Christopher Townsend. (Incorporated by reference to Exhibit 10.1 to MetLife, Inc.’s Current Report on Form 8-K dated June 15, 2015). *
|
|
|
10.6
|
Tax Equalization Agreement dated June 10, 2015 between MetLife, Inc. and Michel Khalaf. (Incorporated by reference to Exhibit 10.1 to MetLife, Inc.’s Quarterly Report on Form 10-Q for the quarter ended June 30, 2015).*
|
|
|
10.7
|
Separation Agreement, Waiver and General Release, dated July 30, 2015, between MetLife Group, Inc. and William J. Wheeler. (Incorporated by reference to Exhibit 10.1 to MetLife, Inc.’s Quarterly Report on Form 10-Q for the quarter ended September 30, 2015).*
|
|
|
10.8
|
Agreement to Protect Corporate Property executed by William J. Wheeler on June 21, 2001. (Incorporated by reference to Exhibit 10.2 to MetLife, Inc.’s Quarterly Report on Form 10-Q for the quarter ended September 30, 2015).*
|
|
|
10.9
|
Agreement to Protect Corporate Property, dated January 1, 2015, executed by Esther S. Lee. (Incorporated by reference to Exhibit 10.13 to MetLife, Inc.'s Annual Report on Form 10-K for the fiscal year ended December 31, 2015 (the "2015 Annual Report")).*
|
|
|
10.10
|
Form of Agreement to Protect Corporate Property executed by Steven A. Kandarian, Steven J. Goulart, and Maria M. Morris. (Incorporated by reference to Exhibit 10.14 to the 2015 Annual Report).*
|
|
|
10.11
|
Form of Agreement to Protect Corporate Property executed by Ricardo A. Anzaldua, John C. R. Hele, Frans Hijkoop, and Esther Lee on May 25, 2016; Steven A. Kandarian on May 31, 2016; Steven J. Goulart on June 2, 2016; and Maria M. Morris on June 8, 2016. (Incorporated by reference to Exhibit 10.1 to MetLife, Inc.'s Quarterly Report on Form 10-Q for the quarter ended June 30, 2016).*
|
|
|
10.12
|
MetLife, Inc. 2005 Stock and Incentive Compensation Plan, effective April 15, 2005 (the "2005 SIC Plan"). (Incorporated by reference to Exhibit 10.24 to the 2014 Annual Report).*
|
|
|
10.13
|
Form of Management Stock Option Agreement under the 2005 SIC Plan (effective as of April 25, 2007). (Incorporated by reference to Exhibit 10.24 to the 2012 Annual Report). *
|
|
|
10.14
|
Amendment to Stock Option Agreements under the 2005 SIC Plan (effective as of April 25, 2007). (Incorporated by reference to Exhibit 10.25 to the 2012 Annual Report).*
|
|
|
10.15
|
Form of Management Stock Option Agreement under the 2005 SIC Plan (effective December 15, 2009). (Incorporated by reference to Exhibit 10.28 to the 2014 Annual Report).*
|
|
|
10.16
|
Form of Management Stock Option Agreement under the 2005 SIC Plan. (Incorporated by reference to Exhibit 10.29 to the 2014 Annual Report).*
|
|
|
10.17
|
Form of Stock Option Agreement under the 2005 SIC Plan (effective February 11, 2013). (Incorporated by reference to Exhibit 10.9 to MetLife, Inc.'s Current Report on Form 8-K dated February 15, 2013 (the "February 15, 2013 Form 8-K")).*
|
|
|
10.18
|
Form of Stock Option Agreement (Three-Year "Cliff" Exercisability) under the 2005 SIC Plan (effective February 11, 2013). (Incorporated by reference to Exhibit 10.10 to the February 15, 2013 Form 8-K).*
|
|
|
10.19
|
Form of Restricted Stock Unit Agreement (effective February 11, 2013). (Incorporated by reference to Exhibit 10.4 to the February 15, 2013 Form 8-K).*
|
|
|
10.20
|
Form of Restricted Stock Unit Agreement (Three-Year "Cliff" Period of Restriction; No Code 162(m) Goals) (effective February 11, 2013). (Incorporated by reference to Exhibit 10.5 to the February 15, 2013 Form 8-K).*
|
|
|
10.21
|
Form of Performance Share Agreement (effective February 11, 2013). (Incorporated by reference to Exhibit 10.1 to the February 15, 2013 Form 8-K).*
|
|
E-2
|
10.22
|
MetLife International Performance Unit Incentive Plan (as amended and restated effective February 11, 2013). (Incorporated by reference to Exhibit 10.2 to the February 15, 2013 Form 8-K).*
|
|
|
Exhibit No.
|
|
Description
|
|
10.23
|
Form of Performance Unit Agreement (effective February 11, 2013). (Incorporated by reference to Exhibit 10.3 to the February 15, 2013 Form 8-K).*
|
|
|
10.24
|
MetLife International Unit Option Incentive Plan, dated July 21, 2011 (as amended and restated effective February 23, 2011).*
|
|
|
10.25
|
Form of Unit Option Agreement under the MetLife International Unit Option Incentive Plan (effective February 23, 2011).*
|
|
|
10.26
|
MetLife International Unit Option Incentive Plan (as amended and restated December 3, 2012). (Incorporated by reference to Exhibit 10.11 to the February 15, 2013 Form 8-K).*
|
|
|
10.27
|
Form of Unit Option Agreement (effective February 11, 2013). (Incorporated by reference to Exhibit 10.12 to the February 15, 2013 Form 8-K).*
|
|
|
10.28
|
Form of Unit Option Agreement (Three-Year "Cliff" Exercisability) (effective February 11, 2013). (Incorporated by reference to Exhibit 10.13 to the February 15, 2013 Form 8-K).*
|
|
|
10.29
|
MetLife International Restricted Unit Incentive Plan (as amended and restated effective February 11, 2013). (Incorporated by reference to Exhibit 10.6 to the February 15, 2013 Form 8-K).*
|
|
|
10.30
|
Form of Restricted Unit Agreement (effective February 11, 2013). (Incorporated by reference to Exhibit 10.7 to the February 15, 2013 Form 8-K).*
|
|
|
10.31
|
Form of Restricted Unit Agreement (Three-Year "Cliff" Period of Restriction; No Code 162(m) Goals) (effective February 11, 2013). (Incorporated by reference to Exhibit 10.8 to the February 15, 2013 Form 8-K).*
|
|
|
10.32
|
MetLife Policyholder Trust Agreement. (Incorporated by reference to Exhibit 10.12 to the S-1 Registration Statement).
|
|
|
10.33
|
Amendment to MetLife Policyholder Trust Agreement. (Incorporated by reference to Exhibit 10.62 to the 2012 Annual Report).
|
|
|
10.34
|
Five-Year Credit Agreement, dated as of May 30, 2014, among MetLife, Inc. and MetLife Funding, Inc., as borrowers, and the other parties signatory thereto, amending and restating (i) the Five-Year Credit Agreement, dated as of August 12, 2011, among MetLife, Inc. and MetLife Funding, Inc., as borrowers, and the other parties signatory thereto and (ii) the Five-Year Credit Agreement dated as of September 13, 2012 among MetLife, Inc. and MetLife Funding, Inc., as borrowers, and the other parties signatory thereto. (Incorporated by reference to Exhibit 10.1 to MetLife, Inc.’s Current Report on Form 8-K dated June 4, 2014).
|
|
|
10.35
|
First Amendment dated as of November 20, 2015 to the Five-Year Credit Agreement dated as of May 30, 2014, among MetLife, Inc. and MetLife Funding, Inc., as Borrowers, Bank of America, N.A., as Administrative Agent, Fronting L/C Issuer, Several L/C Agent and a Limited Fronting Lender, JPMorgan Chase Bank, N.A. and Wells Fargo Bank, National Association, as Fronting L/C Issuers and Limited Fronting Lenders, and the other Lenders party thereto. (Incorporated by reference to Exhibit 10.1 to MetLife, Inc.’s Current Report on Form 8-K dated November 24, 2015).
|
|
|
10.36
|
Second Amendment dated December 20, 2016 to the Five-Year Credit Agreement, dated as of May 30, 2014, among MetLife, Inc. and MetLife Funding, Inc., as borrowers, and the other parties signatory thereto, providing for the amendment and restatement of such Credit Agreement. (Incorporated by reference to Exhibit 10.1 to MetLife, Inc.’s Current Report on Form 8-K dated December 21, 2016).
|
|
|
10.37
|
Metropolitan Life Auxiliary Savings and Investment Plan (as amended and restated, effective January 1, 2008). (Incorporated by reference to Exhibit 10.72 to the 2012 Annual Report).*
|
|
|
10.38
|
Amendment 1 to the Metropolitan Life Auxiliary Savings and Investment Plan (as amended and restated, effective January 1, 2008). (Incorporated by reference to Exhibit 10.74 to the 2014 Annual Report).*
|
|
|
10.39
|
Amendment Number 2 to the Metropolitan Life Auxiliary Savings and Investment Plan (Amended and Restated Effective January 1, 2008). (Incorporated by reference to Exhibit 10.48 to the 2015 Annual Report).*
|
|
|
10.40
|
Amendment Number 3 to the Metropolitan Life Auxiliary Savings and Investment Plan (Amended and Restated Effective January 1, 2008). (Incorporated by reference to Exhibit 10.75 to the 2012 Annual Report).*
|
|
|
10.41
|
Amendment Number 4 to the Metropolitan Life Auxiliary Savings and Investment Plan (Amended and Restated Effective January 1, 2008). (Incorporated by reference to Exhibit 10.77 to the 2013 Annual Report).*
|
|
|
10.42
|
MetLife Deferred Compensation Plan for Officers, as amended and restated, effective November 1, 2003. (Incorporated by reference to Exhibit 10.78 to the 2013 Annual Report).*
|
|
|
10.43
|
Amendment Number One to the MetLife Deferred Compensation Plan for Officers (as amended and restated as of November 1, 2003), dated May 4, 2005. (Incorporated by reference to Exhibit 10.52 to the 2015 Annual Report).*
|
|
|
10.44
|
Amendment Number Two to the MetLife Deferred Compensation Plan for Officers (as amended and restated as of November 1, 2003, effective December 14, 2005). (Incorporated by reference to Exhibit 10.53 to the 2015 Annual Report).*
|
|
|
10.45
|
Amendment Number Three to the MetLife Deferred Compensation Plan for Officers (as amended and restated as of November 1, 2003, effective February 26, 2007).*
|
|
E-3
|
Exhibit No.
|
|
Description
|
|
10.46
|
MetLife Leadership Deferred Compensation Plan, dated November 2, 2006 (as amended and restated, effective with respect to salary and cash incentive compensation, January 1, 2005, and with respect to stock compensation, April 15, 2005).*
|
|
|
10.47
|
Amendment Number One to the MetLife Leadership Deferred Compensation Plan, dated December 13, 2007 (effective as of December 31, 2007). (Incorporated by reference to Exhibit 10.81 to the 2012 Annual Report).*
|
|
|
10.48
|
Amendment Number Two to the MetLife Leadership Deferred Compensation Plan, dated December 11, 2008 (effective December 31, 2008). (Incorporated by reference to Exhibit 10.84 to the 2013 Annual Report).*
|
|
|
10.49
|
Amendment Number Three to the MetLife Leadership Deferred Compensation Plan, dated December 11, 2009 (effective January 1, 2010). (Incorporated by reference to Exhibit 10.85 to the 2014 Annual Report).*
|
|
|
10.50
|
Amendment Number Four to the MetLife Leadership Deferred Compensation Plan, dated December 11, 2009 (effective December 31, 2009). (Incorporated by reference to Exhibit 10.86 to the 2014 Annual Report).*
|
|
|
10.51
|
Amendment Number Five to the MetLife Leadership Deferred Compensation Plan, dated December 11, 2009 (effective January 1, 2011). (Incorporated by reference to Exhibit 10.60 to the 2015 Annual Report).*
|
|
|
10.52
|
Amendment Number Six to the MetLife Leadership Deferred Compensation Plan, dated December 27, 2011 (effective January 1, 2011).*
|
|
|
10.53
|
Amendment Number Seven to the MetLife Leadership Deferred Compensation Plan, dated December 26, 2012 (effective January 1, 2013).*
|
|
|
10.54
|
Amendment Number Eight to the MetLife Leadership Deferred Compensation Plan, dated December 17, 2013 (effective January 1, 2014).*
|
|
|
10.55
|
Amendment Number Nine to the MetLife Leadership Deferred Compensation Plan, dated December 30, 2014 (effective January 1, 2015). (Incorporated by reference to Exhibit 10.88 to the 2014 Annual Report).*
|
|
|
10.56
|
Amendment Number Ten to the MetLife Leadership Deferred Compensation Plan, dated September 30, 2016 (effective October 1, 2016).*
|
|
|
10.57
|
Amendment Number Eleven to the MetLife Leadership Deferred Compensation Plan, dated September 30, 2016 (effective October 1, 2016).*
|
|
|
10.58
|
MetLife Non-Management Director Deferred Compensation Plan (as amended and restated, effective January 1, 2005). (Incorporated by reference to Exhibit 4.1 to MetLife, Inc.’s Registration Statement on Form S-8 (No. 333-214710).*
|
|
|
10.59
|
MetLife, Inc. Director Indemnity Plan (dated and effective July 22, 2008). (Incorporated by reference to Exhibit 10.94 to the 2013 Annual Report).*
|
|
|
10.60
|
MetLife Auxiliary Pension Plan, dated August 7, 2006 (as amended and restated, effective June 30, 2006).*
|
|
|
10.61
|
MetLife Auxiliary Pension Plan, dated December 21, 2006 (amending and restating Part I thereof, effective January 1, 2007).*
|
|
|
10.62
|
MetLife Auxiliary Pension Plan, dated December 21, 2007 (amending and restating Part I thereof, effective January 1, 2008). (Incorporated by reference to Exhibit 10.95 to the 2012 Annual Report).*
|
|
|
10.63
|
Amendment #1 to the MetLife Auxiliary Pension Plan (as amended and restated, effective January 1, 2008), dated October 24, 2008 (effective October 1, 2008). (Incorporated by reference to Exhibit 10.98 to the 2013 Annual Report).*
|
|
|
10.64
|
Amendment Number Two to the MetLife Auxiliary Pension Plan (as amended and restated, effective January 1, 2008), dated December 12, 2008 (effective December 31, 2008). (Incorporated by reference to Exhibit 10.99 to the 2013 Annual Report).*
|
|
|
10.65
|
Amendment Number Three to the MetLife Auxiliary Pension Plan (as amended and restated, effective January 1, 2008) dated March 25, 2009 (effective January 1, 2009). (Incorporated by reference to Exhibit 10.71 to the 2015 Annual Report).*
|
|
|
10.66
|
Amendment Number Four to the MetLife Auxiliary Pension Plan (as amended and restated, effective January 1, 2008), dated December 16, 2009 (effective January 1, 2010). (Incorporated by reference to Exhibit 10.102 to the 2014 Annual Report). *
|
|
|
10.67
|
Amendment Number Five to the MetLife Auxiliary Pension Plan (as amended and restated, effective January 1, 2008) dated December 21, 2010 (effective January 1, 2010). (Incorporated by reference to Exhibit 10.73 to the 2015 Annual Report).*
|
|
|
10.68
|
Amendment Number Six to the MetLife Auxiliary Pension Plan (as amended and restated, effective January 1, 2008) dated December 20, 2012 (effective January 1, 2012). (Incorporated by reference to Exhibit 10.101 to the 2012 Annual Report).*
|
|
|
10.69
|
Amendment Number Seven to the MetLife Auxiliary Pension Plan (as amended and restated, effective January 1, 2008) dated December 27, 2013 (effective December 10, 2013).*
|
|
|
10.70
|
Alico Overseas Pension Plan, dated January 2009.*
|
|
|
10.71
|
Amendment Number One to the Alico Overseas Pension Plan (effective November 1, 2010), dated December 20, 2010.*
|
|
|
10.72
|
Amendment Number Two to the Alico Overseas Pension Plan (effective as of November 1, 2011), dated December 13, 2011.*
|
|
|
10.73
|
Amendment Number Three to the Alico Overseas Pension Plan, dated May 1, 2012 (effective January 1, 2012). (Incorporated by reference to Exhibit 10.1 to MetLife, Inc.'s Current Report on Form 8-K dated May 4, 2012).*
|
|
E-4
|
Exhibit No.
|
|
Description
|
|
10.74
|
Member's Explanatory Handbook for the Metropolitan Life Insurance Company of Hong Kong Limited Healthcare Plan (2014). (Incorporated by reference to Exhibit 10.79 to the 2015 Annual Report).*
|
|
|
10.75
|
MetLife Plan for Transition Assistance for Officers, dated April 21, 2014 (as amended and restated, effective April 1, 2014 (the "MPTA")). (Incorporated by reference to Exhibit 10.2 to MetLife, Inc.’s Quarterly Report on Form 10-Q for the quarter ended June 30, 2014).*
|
|
|
10.76
|
Amendment Number One to the MPTA, dated December 30, 2014 (effective January 1, 2015). (Incorporated by reference to Exhibit 10.111 to the 2014 Annual Report).*
|
|
|
10.77
|
Amendment Number Two to the MPTA, dated March 30, 2016 (effective April 1, 2016).*
|
|
|
10.78
|
Amendment Number Three to the MPTA, dated June 30, 2016 (effective June 30, 2016).*
|
|
|
10.79
|
Amendment Number Four to the MPTA, dated October 24, 2016 (effective October 31, 2016).*
|
|
|
10.80
|
Amendment Number Five to the MPTA, dated November 3, 2016 (effective October 1, 2016).*
|
|
|
10.81
|
MetLife, Inc. 2015 Non-Management Director Stock Compensation Plan, effective January 1, 2015. (Incorporated by reference to Exhibit 4.1 to MetLife, Inc.’s Registration Statement on Form S-8 (No. 333-198141).*
|
|
|
10.82
|
MetLife, Inc. 2015 Stock and Incentive Plan, effective January 1, 2015 (the “2015 SIC Plan”). (Incorporated by reference to Exhibit 4.1 to MetLife, Inc.’s Registration Statement on Form S-8 (No. 333-198145)).*
|
|
|
10.83
|
Form of Performance Share Agreement under the 2015 SIC Plan. (Incorporated by reference to Exhibit 10.1 to MetLife, Inc.’s Current Report on Form 8-K dated December 11, 2014 (the “December 11, 2014 Form 8-K”).*
|
|
|
10.84
|
Form of Performance Unit Agreement under the 2015 SIC Plan. (Incorporated by reference to Exhibit 10.2 to the December 11, 2014 Form 8-K).*
|
|
|
10.85
|
Form of Restricted Stock Unit Agreement (Ratable Period of Restriction Ends in Thirds; Code Section 162(m) Goals) under the 2015 SIC Plan (Incorporated by reference to Exhibit 10.3 to the December 11, 2014 Form 8-K).*
|
|
|
10.86
|
Form of Restricted Stock Unit Agreement (Three-Year “Cliff” Period of Restriction; No Code Section 162(m) Goals) (Incorporated by reference to Exhibit 10.4 to the December 11, 2014 Form 8-K).*
|
|
|
10.87
|
Form of Restricted Unit Agreement (Ratable Period of Restriction Ends in Thirds; Code Section 162(m) Goals) (Incorporated by reference to Exhibit 10.5 to the December 11, 2014 Form 8-K).*
|
|
|
10.88
|
Form of Restricted Unit Agreement (Three-Year “Cliff” Period of Restriction; No Code Section 162(m) Goals) (Incorporated by reference to Exhibit 10.6 to the December 11, 2014 Form 8-K).*
|
|
|
10.89
|
Form of Stock Option Agreement (Ratable Exercisability in Thirds) (Incorporated by reference to Exhibit 10.7 to the December 11, 2014 Form 8-K).*
|
|
|
10.90
|
Form of Stock Option Agreement (Three-Year “Cliff” Exercisability) (Incorporated by reference to Exhibit 10.8 to the December 11, 2014 Form 8-K).*
|
|
|
10.91
|
Form of Unit Option Agreement (Ratable Exercisability in Thirds) (Incorporated by reference to Exhibit 10.9 to the December 11, 2014 Form 8-K).*
|
|
|
10.92
|
Form of Unit Option Agreement (Three-Year “Cliff” Exercisability) (Incorporated by reference to Exhibit 10.10 to the December 11, 2014 Form 8-K).*
|
|
|
10.93
|
MetLife Annual Variable Incentive Plan (effective as amended and restated January 1, 2015) (Incorporated by reference to Exhibit 10.11 to the December 11, 2014 Form 8-K).*
|
|
|
10.94
|
Form of Performance Share Agreement under the 2015 SIC Plan, effective January 1, 2016. (Incorporated by reference to Exhibit 10.95 to the 2015 Annual Report).*
|
|
|
10.95
|
Form of Performance Unit Agreement under the 2015 SIC Plan, effective January 1, 2016. (Incorporated by reference to Exhibit 10.96 to the 2015 Annual Report).*
|
|
|
10.96
|
Form of Restricted Stock Unit Agreement (Ratable Period of Restriction Ends in Thirds; Code Section 162(m) Goals) under the 2015 SIC Plan, effective January 1, 2016. (Incorporated by reference to Exhibit 10.97 to the 2015 Annual Report).*
|
|
|
10.97
|
Form of Restricted Stock Unit Agreement (Three-Year “Cliff” Period of Restriction; No Code Section 162(m) Goals), effective January 1, 2016. (Incorporated by reference to Exhibit 10.98 to the 2015 Annual Report).*
|
|
|
10.98
|
Form of Restricted Unit Agreement (Ratable Period of Restriction Ends in Thirds; Code Section 162(m) Goals), effective January 1, 2016. (Incorporated by reference to Exhibit 10.99 to the 2015 Annual Report).*
|
|
|
10.99
|
Form of Restricted Unit Agreement (Three-Year “Cliff” Period of Restriction; No Code Section 162(m) Goals), effective January 1, 2016. (Incorporated by reference to Exhibit 10.100 to the 2015 Annual Report).*
|
|
|
10.100
|
Form of Stock Option Agreement (Ratable Exercisability in Thirds), effective January 1, 2016. (Incorporated by reference to Exhibit 10.101 to the 2015 Annual Report).*
|
|
E-5
|
Exhibit No.
|
|
Description
|
|
10.101
|
Form of Stock Option Agreement (Three-Year “Cliff” Exercisability), effective January 1, 2016. (Incorporated by reference to Exhibit 10.102 to the 2015 Annual Report).*
|
|
|
10.102
|
Form of Unit Option Agreement (Ratable Exercisability in Thirds), effective January 1, 2016. (Incorporated by reference to Exhibit 10.103 to the 2015 Annual Report).*
|
|
|
10.103
|
Form of Unit Option Agreement (Three-Year “Cliff” Exercisability), effective January 1, 2016. (Incorporated by reference to Exhibit 10.104 to the 2015 Annual Report).*
|
|
|
10.104
|
Award Agreement Supplement, effective January 1, 2016. (Incorporated by reference to Exhibit 10.105 to the 2015 Annual Report).*
|
|
|
10.105
|
MetLife Individual Distribution Sales Deferred Compensation Plan, effective January 1, 2010. (Incorporated by reference to Exhibit 4.1 to MetLife, Inc. ’s Registration Statement on Form S-8 (No. 333-198143)).*
|
|
|
10.106
|
Amendment Number One to the MetLife Individual Distribution Sales Deferred Compensation Plan, effective January 1, 2010. (Incorporated by reference to Exhibit 4.2 to MetLife, Inc.’s Registration Statement on Form S-8 (No. 333-198143)).*
|
|
|
10.107
|
Amendment Number Two to the MetLife Individual Distribution Sales Deferred Compensation Plan, effective January 1, 2010. (Incorporated by reference to Exhibit 4.3 to MetLife, Inc.’s Registration Statement on Form S-8 (No. 333-198143)).*
|
|
|
10.108
|
Amendment Number Three to the MetLife Individual Distribution Sales Deferred Compensation Plan, effective January 1, 2013. (Incorporated by reference to Exhibit 4.4 to MetLife, Inc.’s Registration Statement on Form S-8 (No. 333-198143)).*
|
|
|
10.109
|
Amendment Number Four to the MetLife Individual Distribution Sales Deferred Compensation Plan, effective January 1, 2014. (Incorporated by reference to Exhibit 4.5 to MetLife, Inc.’s Registration Statement on Form S-8 (No. 333-198143)).*
|
|
|
10.110
|
Amendment Number Five to the MetLife Individual Distribution Sales Deferred Compensation Plan, effective June 1, 2014. (Incorporated by reference to Exhibit 4.6 to MetLife, Inc.’s Registration Statement on Form S-8 (No. 333-198143)).*
|
|
|
10.111
|
Purchase Agreement by and among MetLife, Inc. and Massachusetts Mutual Life Insurance Company, dated as of February 28, 2016. (Incorporated by reference to Exhibit 10.1 to MetLife, Inc.'s Quarterly Report on Form 10-Q for the quarter ended March 31, 2016).
|
|
|
12.1
|
Statement re: Computation of Ratios of Earnings to Fixed Charges.
|
|
|
21.1
|
Subsidiaries of the Registrant.
|
|
|
23.1
|
Consent of Deloitte & Touche LLP.
|
|
|
31.1
|
Certification of Chief Executive Officer pursuant to Section 302 of the Sarbanes-Oxley Act of 2002.
|
|
|
31.2
|
Certification of Chief Financial Officer pursuant to Section 302 of the Sarbanes-Oxley Act of 2002.
|
|
|
32.1
|
Certification of Chief Executive Officer pursuant to Section 906 of the Sarbanes-Oxley Act of 2002.
|
|
|
32.2
|
Certification of Chief Financial Officer pursuant to Section 906 of the Sarbanes-Oxley Act of 2002.
|
|
|
101.INS
|
XBRL Instance Document.
|
|
|
101.SCH
|
XBRL Taxonomy Extension Schema Document.
|
|
|
101.CAL
|
XBRL Taxonomy Extension Calculation Linkbase Document.
|
|
|
101.LAB
|
XBRL Taxonomy Extension Label Linkbase Document.
|
|
|
101.PRE
|
XBRL Taxonomy Extension Presentation Linkbase Document.
|
|
|
101.DEF
|
XBRL Taxonomy Extension Definition Linkbase Document.
|
|
______________
* Indicates management contracts or compensatory plans or arrangements.
E-6
TABLE OF CONTENTS
Part IItem 1. BusinessItem 1A. Risk FactorsItem 1B. Unresolved Staff CommentsItem 2. PropertiesItem 3. Legal ProceedingsItem 4. Mine Safety DisclosuresPart IIItem 5. Market For Registrant S Common Equity, Related Stockholder Matters and Issuer Purchases Of Equity SecuritiesItem 6. Selected Financial DataItem 7. Management S Discussion and Analysis Of Financial Condition and Results Of OperationsItem 7A. Quantitative and Qualitative Disclosures About Market RiskItem 8. Financial Statements and Supplementary DataItem 9. Changes in and Disagreements with Accountants on Accounting and Financial DisclosureItem 9A. Controls and ProceduresItem 9B. Other InformationPart IIIItem 10. Directors, Executive Officers and Corporate GovernanceItem 11. Executive CompensationItem 12. Security Ownership Of Certain Beneficial Owners and Management and Related Stockholder MattersItem 13. Certain Relationships and Related Transactions, and Director IndependenceItem 14. Principal Accountant Fees and ServicesPart IVItem 15. Exhibits and Financial Statement Schedules