METLIFE INC
10-Ks and 10-Qs
|
|
|
|
|
|
|
|
|
|
|
|
|
|
|
|
|
|
|
|
|
|
|
|
|
|
|
|
|
|
|
|
|
|
|
|
|
|
|
|
|
|
|
|
|
|
|
|
|
|
|
|
|
|
|
|
|
|
|
UNITED STATES SECURITIES AND EXCHANGE COMMISSION
Washington, D.C. 20549
______________________________________
Form
10-Q
(Mark One)
|
|
QUARTERLY REPORT PURSUANT TO SECTION 13 OR 15(d) OF THE SECURITIES EXCHANGE ACT OF 1934
|
||||
FOR THE QUARTERLY PERIOD ENDED
SEPTEMBER 30, 2022
or
|
|
TRANSITION REPORT PURSUANT TO SECTION 13 OR 15(d) OF THE SECURITIES EXCHANGE ACT OF 1934
|
||||
FOR THE TRANSITION PERIOD FROM TO
Commission file number:
001-15787
_____________________________________
(Exact name of registrant as specified in its charter)
|
|
|
|||||||||||||
|
(State or other jurisdiction of
incorporation or organization) |
(I.R.S. Employer
Identification No.) |
|||||||||||||
|
|
|
|
|
|||||||||||
| (Address of principal executive offices) | (Zip Code) | |||||||||||||
(
212
)
578-9500
(
Registrant’s telephone number, including area code)
Securities registered pursuant to Section 12(b) of the Act:
| Title of each class | Trading Symbol(s) | Name of each exchange on which registered | ||||||
|
|
|
|
||||||
|
|
|
|
||||||
|
|
|
|
||||||
|
|
|
|
||||||
Indicate by check mark whether the registrant: (1) has filed all reports required to be filed by Section 13 or 15(d) of the Securities Exchange Act of 1934 during the preceding 12 months (or for such shorter period that the registrant was required to file such reports), and (2) has been subject to such filing requirements for the past 90 days.
Yes
☑
No
¨
Indicate by check mark whether the registrant has submitted electronically every Interactive Data File required to be submitted pursuant to Rule 405 of Regulation S-T (§ 232.405 of this chapter) during the preceding 12 months (or for such shorter period that the registrant was required to submit such files).
Yes
☑
No
¨
Indicate by check mark whether the registrant is a large accelerated filer, an accelerated filer, a non-accelerated filer, a smaller reporting company, or an emerging growth company. See the definitions of “large accelerated filer,” “accelerated filer,” “smaller reporting company,” and “emerging growth company” in Rule 12b-2 of the Exchange Act.
|
|
☑
|
Accelerated filer |
☐
|
||||||||
| Non-accelerated filer | ☐ | Smaller reporting company |
|
||||||||
| Emerging growth company |
|
||||||||||
If an emerging growth company, indicate by check mark if the registrant has elected not to use the extended transition period for complying with any new or revised financial accounting standards provided pursuant to Section 13(a) of the Exchange Act.
☐
Indicate by check mark whether the registrant is a shell company (as defined in Rule 12b-2 of the Exchange Act). Yes
☐
No
☑
At October 31, 2022,
784,606,205
shares of the registrant’s common stock were outstanding.
Table of Contents
| Page | ||||||||
| Item 1. |
Financial Statements (Unaudited) (at September 30, 2022 and December 31, 2021 and for the Three Months and Nine Months Ended September 30, 2022 and 2021)
|
|||||||
| Item 2. | ||||||||
| Item 3. | ||||||||
| Item 4. | ||||||||
| Item 1. | ||||||||
| Item 1A. | ||||||||
| Item 2. | ||||||||
| Item 6. | ||||||||
As used in this Form 10
‑
Q, “MetLife,” the “Company,” “we,” “our” and “us” refer to MetLife, Inc., a Delaware corporation incorporated in 1999, its subsidiaries and affiliates.
Note Regarding Forward-Looking Statements
This Quarterly Report on Form 10‑Q, including Management’s Discussion and Analysis of Financial Condition and Results of Operations, may contain or incorporate by reference information that includes or is based upon forward-looking statements within the meaning of the Private Securities Litigation Reform Act of 1995. Forward-looking statements give expectations or forecasts of future events and do not relate strictly to historical or current facts. They use words and terms such as “anticipate,” “assume,” “believe,” “continue,” “could,” “estimate,” “expect,” “if,” “intend,” “likely,” “may,” “plan,” “potential,” “project,” “should,” “will,” “would” and other words and terms of similar meaning or that are otherwise tied to future periods or future performance, in each case in all derivative forms. They include statements relating to future actions, prospective services or products, future performance or results of current and anticipated services or products, future sales efforts, future expenses, the outcome of contingencies such as legal proceedings, and future trends in operations and financial results.
Many factors determine Company results, and they involve unpredictable risks and uncertainties. Our forward-looking statements depend on our assumptions, our expectations, and our understanding of the economic environment, but they may be inaccurate and may change. We do not guarantee any future performance. Our results could differ materially from those we express or imply in forward-looking statements. The risks, uncertainties and other factors, including those relating to the COVID-19 pandemic, identified in MetLife, Inc.’s filings with the U.S. Securities and Exchange Commission, and others, may cause such differences. These factors include:
(1) economic condition difficulties, including risks relating to public health, interest rates, credit spreads, equity, real estate, obligors and counterparties, currency exchange rates, derivatives, and terrorism and security;
(2) global capital and credit market adversity;
(3) credit facility inaccessibility;
(4) financial strength or credit ratings downgrades;
(5) unavailability, unaffordability, or inadequate reinsurance;
(6) statutory life insurance reserve financing costs or limited market capacity;
(7) legal, regulatory, and supervisory and enforcement policy changes;
(8) changes in tax rates, tax laws or interpretations;
(9) litigation and regulatory investigations;
(10) London Interbank Offered Rate discontinuation and transition to alternative reference rates;
(11) unsuccessful efforts to meet all environmental, social, and governance standards or to enhance our sustainability;
(12) MetLife, Inc.’s inability to pay dividends and repurchase common stock;
(13) MetLife, Inc.’s subsidiaries’ inability to pay it dividends;
(14) investment defaults, downgrades, or volatility;
(15) investment sales or lending difficulties;
(16) collateral or derivative-related payments;
(17) investment valuations, allowances, or impairments changes;
(18) claims or other results that differ from our estimates, assumptions, or models;
(19) global political, legal, or operational risks;
(20) business competition;
(21) technological changes;
(22) catastrophes;
(23) climate changes or responses to it;
(24) deficiencies in our closed block;
(25) goodwill or other asset impairment, or deferred income tax asset allowance;
(26) acceleration of amortization of deferred policy acquisition costs, deferred sales inducements, value of business acquired, value of distribution agreements acquired or value of customer relationships acquired;
(27) product guarantee volatility, costs, and counterparty risks;
(28) risk management failures;
(29) insufficient protection from operational risks;
(30) failure to protect confidentiality and integrity of data or other cybersecurity or disaster recovery failures;
(31) accounting standards changes;
(32) excessive risk-taking;
(33) marketing and distribution difficulties;
(34) pension and other postretirement benefit assumption changes;
(35) inability to protect our intellectual property or avoid infringement claims;
(36) acquisition, integration, growth, disposition, or reorganization difficulties;
(37) Brighthouse Financial, Inc. separation risks;
(38) MetLife, Inc.’s Board of Directors influence over the outcome of stockholder votes through the voting provisions of the MetLife Policyholder Trust; and
(39) legal- and corporate governance-related effects on business combinations.
MetLife, Inc. does not undertake any obligation to publicly correct or update any forward-looking statement if MetLife, Inc. later becomes aware that such statement is not likely to be achieved. Please consult any further disclosures MetLife, Inc. makes on related subjects in subsequent reports to the U.S. Securities and Exchange Commission.
2
Corporate Information
We encourage investors and others to frequently visit our website (www.metlife.com), including our Investor Relations web pages (https://investor.metlife.com). We announce significant financial and other information to our investors and the public on the Investor Relations web pages, as well as in U.S. Securities and Exchange Commission filings, in news releases, public conference calls and webcasts, fact sheets and other documents and media. The information found on our website, including MetLife’s Sustainability Report, is not incorporated by reference into this Quarterly Report on Form 10-Q or in any other report or document we submit to the U.S. Securities and Exchange Commission, and any references to our website are intended to be inactive textual references only.
Note Regarding Reliance on Statements in Our Contracts
See “Exhibits — Note Regarding Reliance on Statements in Our Contracts” for information regarding agreements included as exhibits to this Quarterly Report on Form 10-Q.
3
Part I — Financial Information
Item 1. Financial Statements
MetLife, Inc.
Interim Condensed Consolidated Balance Sheets
September 30, 2022 and December 31, 2021 (Unaudited)
(In millions, except share and per share data)
| September 30, 2022 | December 31, 2021 | |||||||||||||
| Assets | ||||||||||||||
| Investments: | ||||||||||||||
|
Fixed maturity securities available-for-sale, at estimated fair value (amortized cost: $
|
$ |
|
$ |
|
||||||||||
| Equity securities, at estimated fair value |
|
|
||||||||||||
| Contractholder-directed equity securities and fair value option securities, at estimated fair value |
|
|
||||||||||||
|
Mortgage loans (net of allowance for credit loss of $
|
|
|
||||||||||||
| Policy loans |
|
|
||||||||||||
|
Real estate and real estate joint ventures (includes $
|
|
|
||||||||||||
| Other limited partnership interests |
|
|
||||||||||||
| Short-term investments, principally at estimated fair value |
|
|
||||||||||||
|
Other invested assets (includes $
|
|
|
||||||||||||
|
Total investments
|
|
|
||||||||||||
| Cash and cash equivalents, principally at estimated fair value |
|
|
||||||||||||
| Accrued investment income |
|
|
||||||||||||
| Premiums, reinsurance and other receivables |
|
|
||||||||||||
| Deferred policy acquisition costs and value of business acquired |
|
|
||||||||||||
| Current income tax recoverable |
|
|
||||||||||||
| Deferred income tax asset |
|
|
||||||||||||
| Goodwill |
|
|
||||||||||||
| Assets held-for-sale |
|
|
||||||||||||
| Other assets |
|
|
||||||||||||
| Separate account assets |
|
|
||||||||||||
|
Total assets
|
$ |
|
$ |
|
||||||||||
| Liabilities and Equity | ||||||||||||||
| Liabilities | ||||||||||||||
| Future policy benefits | $ |
|
$ |
|
||||||||||
| Policyholder account balances |
|
|
||||||||||||
| Other policy-related balances |
|
|
||||||||||||
| Policyholder dividends payable |
|
|
||||||||||||
| Policyholder dividend obligation |
|
|
||||||||||||
| Payables for collateral under securities loaned and other transactions |
|
|
||||||||||||
| Short-term debt |
|
|
||||||||||||
| Long-term debt |
|
|
||||||||||||
| Collateral financing arrangement |
|
|
||||||||||||
| Junior subordinated debt securities |
|
|
||||||||||||
| Deferred income tax liability |
|
|
||||||||||||
| Liabilities held-for-sale |
|
|
||||||||||||
| Other liabilities |
|
|
||||||||||||
| Separate account liabilities |
|
|
||||||||||||
|
Total liabilities
|
|
|
||||||||||||
| Contingencies, Commitments and Guarantees (Note 15) |
|
|
||||||||||||
| Equity | ||||||||||||||
| MetLife, Inc.’s stockholders’ equity: | ||||||||||||||
|
Preferred stock, par value $
|
|
|
||||||||||||
|
Common stock, par value $
|
|
|
||||||||||||
| Additional paid-in capital |
|
|
||||||||||||
| Retained earnings |
|
|
||||||||||||
|
Treasury stock, at cost;
|
(
|
(
|
||||||||||||
| Accumulated other comprehensive income (loss) |
(
|
|
||||||||||||
|
Total MetLife, Inc.’s stockholders’ equity
|
|
|
||||||||||||
| Noncontrolling interests |
|
|
||||||||||||
|
Total equity
|
|
|
||||||||||||
|
Total liabilities and equity
|
$ |
|
$ |
|
||||||||||
See accompanying notes to the interim condensed consolidated financial statements.
4
MetLife, Inc.
Interim Condensed Consolidated Statements of Operations and Comprehensive Income (Loss)
For the Three Months and Nine Months Ended September 30, 2022 and 2021 (Unaudited)
(In millions, except per share data)
|
Three Months
Ended September 30, |
Nine Months
Ended September 30, |
|||||||||||||||||||||||||
| 2022 | 2021 | 2022 | 2021 | |||||||||||||||||||||||
|
Revenues
|
||||||||||||||||||||||||||
|
Premiums
|
$ |
|
$ |
|
$ |
|
$ |
|
||||||||||||||||||
|
Universal life and investment-type product policy fees
|
|
|
|
|
||||||||||||||||||||||
|
Net investment income
|
|
|
|
|
||||||||||||||||||||||
|
Other revenues
|
|
|
|
|
||||||||||||||||||||||
|
Net investment gains (losses)
|
(
|
(
|
(
|
|
||||||||||||||||||||||
|
Net derivative gains (losses)
|
(
|
(
|
(
|
(
|
||||||||||||||||||||||
|
Total revenues
|
|
|
|
|
||||||||||||||||||||||
|
Expenses
|
||||||||||||||||||||||||||
|
Policyholder benefits and claims
|
|
|
|
|
||||||||||||||||||||||
|
Interest credited to policyholder account balances
|
|
|
|
|
||||||||||||||||||||||
|
Policyholder dividends
|
|
|
|
|
||||||||||||||||||||||
|
Other expenses
|
|
|
|
|
||||||||||||||||||||||
|
Total expenses
|
|
|
|
|
||||||||||||||||||||||
|
Income (loss) before provision for income tax
|
|
|
|
|
||||||||||||||||||||||
|
Provision for income tax expense (benefit)
|
|
|
(
|
|
||||||||||||||||||||||
|
Net income (loss)
|
|
|
|
|
||||||||||||||||||||||
|
Less: Net income (loss) attributable to noncontrolling interests
|
|
|
|
|
||||||||||||||||||||||
|
Net income (loss) attributable to MetLife, Inc.
|
|
|
|
|
||||||||||||||||||||||
|
Less: Preferred stock dividends
|
|
|
|
|
||||||||||||||||||||||
| Preferred stock redemption premium |
|
|
|
|
||||||||||||||||||||||
|
Net income (loss) available to MetLife, Inc.’s common shareholders
|
$ |
|
$ |
|
$ |
|
$ |
|
||||||||||||||||||
|
Comprehensive income (loss)
|
$ |
(
|
$ |
|
$ |
(
|
$ |
(
|
||||||||||||||||||
|
Less: Comprehensive income (loss) attributable to noncontrolling interests, net of income tax
|
|
|
|
|
||||||||||||||||||||||
|
Comprehensive income (loss) attributable to MetLife, Inc.
|
$ |
(
|
$ |
|
$ |
(
|
$ |
(
|
||||||||||||||||||
|
Net income (loss) available to MetLife, Inc.’s common shareholders per common share:
|
||||||||||||||||||||||||||
|
Basic
|
$ |
|
$ |
|
$ |
|
$ |
|
||||||||||||||||||
|
Diluted
|
$ |
|
$ |
|
$ |
|
$ |
|
||||||||||||||||||
See accompanying notes to the interim condensed consolidated financial statements.
5
MetLife, Inc.
Interim Condensed Consolidated Statements of Equity
For the Nine Months Ended September 30, 2022 and 2021 (Unaudited)
(In millions)
|
Preferred
Stock |
Common
Stock |
Additional
Paid-in Capital |
Retained
Earnings |
Treasury
Stock at Cost |
Accumulated
Other Comprehensive Income (Loss) |
Total
MetLife, Inc.’s Stockholders’ Equity |
Noncontrolling
Interests |
Total
Equity |
||||||||||||||||||||||||||||||||||||||||||||||||
| Balance at December 31, 2021 | $ |
|
$ |
|
$ |
|
$ |
|
$ |
(
|
$ |
|
$ |
|
$ |
|
$ |
|
||||||||||||||||||||||||||||||||||||||
|
Treasury stock acquired in connection with share repurchases
|
(
|
(
|
(
|
|||||||||||||||||||||||||||||||||||||||||||||||||||||
|
Stock-based compensation
|
|
|
|
|||||||||||||||||||||||||||||||||||||||||||||||||||||
|
Dividends on preferred stock
|
(
|
(
|
(
|
|||||||||||||||||||||||||||||||||||||||||||||||||||||
|
Dividends on common stock (declared per share of $
|
(
|
(
|
(
|
|||||||||||||||||||||||||||||||||||||||||||||||||||||
| Change in equity of noncontrolling interests |
|
(
|
(
|
|||||||||||||||||||||||||||||||||||||||||||||||||||||
|
Net income (loss)
|
|
|
|
|
||||||||||||||||||||||||||||||||||||||||||||||||||||
|
Other comprehensive income (loss), net of income tax
|
(
|
(
|
(
|
(
|
||||||||||||||||||||||||||||||||||||||||||||||||||||
| Balance at June 30, 2022 |
|
|
|
|
(
|
(
|
|
|
|
|||||||||||||||||||||||||||||||||||||||||||||||
|
Treasury stock acquired in connection with share repurchases
|
(
|
(
|
(
|
|||||||||||||||||||||||||||||||||||||||||||||||||||||
|
Stock-based compensation
|
|
|
|
|||||||||||||||||||||||||||||||||||||||||||||||||||||
|
Dividends on preferred stock
|
(
|
(
|
(
|
|||||||||||||||||||||||||||||||||||||||||||||||||||||
|
Dividends on common stock (declared per share of $
|
(
|
(
|
(
|
|||||||||||||||||||||||||||||||||||||||||||||||||||||
| Change in equity of noncontrolling interests |
|
(
|
(
|
|||||||||||||||||||||||||||||||||||||||||||||||||||||
|
Net income (loss)
|
|
|
|
|
||||||||||||||||||||||||||||||||||||||||||||||||||||
|
Other comprehensive income (loss), net of income tax
|
(
|
(
|
|
(
|
||||||||||||||||||||||||||||||||||||||||||||||||||||
| Balance at September 30, 2022 | $ |
|
$ |
|
$ |
|
$ |
|
$ |
(
|
$ |
(
|
$ |
|
$ |
|
$ |
|
||||||||||||||||||||||||||||||||||||||
|
Preferred
Stock |
Common
Stock |
Additional
Paid-in Capital |
Retained
Earnings |
Treasury
Stock at Cost |
Accumulated
Other Comprehensive Income (Loss) |
Total
MetLife, Inc.’s Stockholders’ Equity |
Noncontrolling
Interests |
Total
Equity |
||||||||||||||||||||||||||||||||||||||||||||||||
| Balance at December 31, 2020 | $ |
|
$ |
|
$ |
|
$ |
|
$ |
(
|
$ |
|
$ |
|
$ |
|
$ |
|
||||||||||||||||||||||||||||||||||||||
| Redemption of preferred stock |
(
|
(
|
(
|
|||||||||||||||||||||||||||||||||||||||||||||||||||||
| Preferred stock redemption premium |
(
|
(
|
(
|
|||||||||||||||||||||||||||||||||||||||||||||||||||||
|
Treasury stock acquired in connection with share repurchases
|
(
|
(
|
(
|
|||||||||||||||||||||||||||||||||||||||||||||||||||||
|
Stock-based compensation
|
|
|
|
|||||||||||||||||||||||||||||||||||||||||||||||||||||
|
Dividends on preferred stock
|
(
|
(
|
(
|
|||||||||||||||||||||||||||||||||||||||||||||||||||||
|
Dividends on common stock (declared per share of $
|
(
|
(
|
(
|
|||||||||||||||||||||||||||||||||||||||||||||||||||||
| Change in equity of noncontrolling interests |
|
|
|
|||||||||||||||||||||||||||||||||||||||||||||||||||||
|
Net income (loss)
|
|
|
|
|
||||||||||||||||||||||||||||||||||||||||||||||||||||
|
Other comprehensive income (loss), net of income tax
|
(
|
(
|
|
(
|
||||||||||||||||||||||||||||||||||||||||||||||||||||
| Balance at June 30, 2021 |
|
|
|
|
(
|
|
|
|
|
|||||||||||||||||||||||||||||||||||||||||||||||
| Treasury stock acquired in connection with share repurchases |
(
|
(
|
(
|
|||||||||||||||||||||||||||||||||||||||||||||||||||||
| Stock-based compensation |
|
|
|
|||||||||||||||||||||||||||||||||||||||||||||||||||||
| Dividends on preferred stock |
(
|
(
|
(
|
|||||||||||||||||||||||||||||||||||||||||||||||||||||
|
Dividends on common stock (declared per share of $
|
(
|
(
|
(
|
|||||||||||||||||||||||||||||||||||||||||||||||||||||
| Change in equity of noncontrolling interests |
|
(
|
(
|
|||||||||||||||||||||||||||||||||||||||||||||||||||||
| Net income (loss) |
|
|
|
|
||||||||||||||||||||||||||||||||||||||||||||||||||||
| Other comprehensive income (loss), net of income tax |
(
|
(
|
|
(
|
||||||||||||||||||||||||||||||||||||||||||||||||||||
| Balance at September 30, 2021 | $ |
|
$ |
|
$ |
|
$ |
|
$ |
(
|
$ |
|
$ |
|
$ |
|
$ |
|
||||||||||||||||||||||||||||||||||||||
See accompanying notes to the interim condensed consolidated financial statements.
6
MetLife, Inc.
Interim Condensed Consolidated Statements of Cash Flows
For the Nine Months Ended September 30, 2022 and 2021 (Unaudited)
(In millions)
|
Nine Months
Ended September 30, |
|||||||||||
| 2022 | 2021 | ||||||||||
|
Net cash provided by (used in) operating activities
|
$ |
|
$ |
|
|||||||
|
Cash flows from investing activities
|
|||||||||||
|
Sales, maturities and repayments of:
|
|||||||||||
|
Fixed maturity securities available-for-sale
|
|
|
|||||||||
|
Equity securities
|
|
|
|||||||||
|
Mortgage loans
|
|
|
|||||||||
|
Real estate and real estate joint ventures
|
|
|
|||||||||
|
Other limited partnership interests
|
|
|
|||||||||
|
Purchases and originations of:
|
|||||||||||
|
Fixed maturity securities available-for-sale
|
(
|
(
|
|||||||||
|
Equity securities
|
(
|
(
|
|||||||||
|
Mortgage loans
|
(
|
(
|
|||||||||
|
Real estate and real estate joint ventures
|
(
|
(
|
|||||||||
|
Other limited partnership interests
|
(
|
(
|
|||||||||
|
Cash received in connection with freestanding derivatives
|
|
|
|||||||||
|
Cash paid in connection with freestanding derivatives
|
(
|
(
|
|||||||||
|
Sales of businesses, net of cash and cash equivalents disposed of $
|
|
|
|||||||||
| Purchases of investments in operating joint ventures |
(
|
|
|||||||||
|
Net change in policy loans
|
|
|
|||||||||
|
Net change in short-term investments
|
|
(
|
|||||||||
|
Net change in other invested assets
|
(
|
(
|
|||||||||
|
Other, net
|
(
|
(
|
|||||||||
|
Net cash provided by (used in) investing activities
|
(
|
(
|
|||||||||
|
Cash flows from financing activities
|
|||||||||||
|
Policyholder account balances:
|
|||||||||||
|
Deposits
|
|
|
|||||||||
|
Withdrawals
|
(
|
(
|
|||||||||
| Payables for collateral under securities loaned and other transactions: | |||||||||||
| Net change in payables for collateral under securities loaned and other transactions |
(
|
|
|||||||||
|
Cash paid for other transactions with tenors greater than three months
|
|
(
|
|||||||||
|
Long-term debt issued
|
|
|
|||||||||
|
Long-term debt repaid
|
(
|
(
|
|||||||||
|
Collateral financing arrangement repaid
|
(
|
(
|
|||||||||
|
Financing element on certain derivative instruments and other derivative related transactions, net
|
|
|
|||||||||
|
Treasury stock acquired in connection with share repurchases
|
(
|
(
|
|||||||||
| Redemption of preferred stock |
|
(
|
|||||||||
| Preferred stock redemption premium |
|
(
|
|||||||||
|
Dividends on preferred stock
|
(
|
(
|
|||||||||
|
Dividends on common stock
|
(
|
(
|
|||||||||
|
Other, net
|
(
|
|
|||||||||
|
Net cash provided by (used in) financing activities
|
(
|
(
|
|||||||||
|
Effect of change in foreign currency exchange rates on cash and cash equivalents balances
|
(
|
(
|
|||||||||
|
Change in cash and cash equivalents
|
|
(
|
|||||||||
| Cash and cash equivalents, including subsidiaries held-for-sale, beginning of period |
|
|
|||||||||
| Cash and cash equivalents, including subsidiaries held-for-sale, end of period | $ |
|
$ |
|
|||||||
| Cash and cash equivalents, subsidiaries held-for-sale, beginning of period | $ |
|
$ |
|
|||||||
| Cash and cash equivalents, subsidiaries held-for-sale, end of period | $ |
|
$ |
|
|||||||
| Cash and cash equivalents, beginning of period | $ |
|
$ |
|
|||||||
| Cash and cash equivalents, end of period | $ |
|
$ |
|
|||||||
| Supplemental disclosures of cash flow information | |||||||||||
| Net cash paid (received) for: | |||||||||||
| Interest | $ |
|
$ |
|
|||||||
| Income tax | $ |
|
$ |
|
|||||||
| Non-cash transactions: | |||||||||||
| Fixed maturity securities available-for-sale received in connection with pension risk transfer transactions | $ |
|
$ |
|
|||||||
| Real estate and real estate joint ventures acquired in satisfaction of debt | $ |
|
$ |
|
|||||||
| Increase in equity securities due to in-kind distributions received from other limited partnership interests | $ |
|
$ |
|
|||||||
| Reclassification of certain other invested assets to contractholder-directed equity securities and fair value option securities | $ |
|
$ |
|
|||||||
See accompanying notes to the interim condensed consolidated financial statements
.
7
MetLife, Inc.
Notes to the Interim Condensed Consolidated Financial Statements (Unaudited)
Business
“MetLife” and the “Company” refer to MetLife, Inc., a Delaware corporation incorporated in 1999, its subsidiaries and affiliates. MetLife is one of the world’s leading financial services companies, providing insurance, annuities, employee benefits and asset management. MetLife is organized into
five
segments: U.S.; Asia; Latin America; Europe, the Middle East and Africa (“EMEA”); and MetLife Holdings.
Basis of Presentation
The accompanying interim condensed consolidated financial statements are unaudited and reflect all adjustments (including normal recurring adjustments) necessary to present fairly the financial position, results of operations and cash flows for the interim periods presented in conformity with GAAP. Interim results are not necessarily indicative of full year performance. The December 31, 2021 consolidated balance sheet data was derived from audited consolidated financial statements included in MetLife, Inc.’s Annual Report on Form 10-K for the year ended December 31, 2021 (the “2021 Annual Report”), which include all disclosures required by GAAP. Therefore, these interim condensed consolidated financial statements should be read in conjunction with the consolidated financial statements of the Company included in the 2021 Annual Report.
Consolidation
The accompanying interim condensed consolidated financial statements include the accounts of MetLife, Inc. and its subsidiaries, as well as partnerships and joint ventures in which the Company has a controlling financial interest, and variable interest entities (“VIEs”) for which the Company is the primary beneficiary. Intercompany accounts and transactions have been eliminated.
The Company uses the equity method of accounting or the fair value option (“FVO”) for real estate joint ventures and other limited partnership interests (“investee”) when it has more than a minor ownership interest or more than a minor influence over the investee’s operations. The Company generally recognizes its share of the investee’s earnings in net investment income on a three-month lag in instances where the investee’s financial information is not sufficiently timely or when the investee’s reporting period differs from the Company’s reporting period.
Held-for-Sale
The Company classifies a business as held-for-sale when management has approved or received approval to sell the business, the sale is probable to occur during the next 12 months at a price that is reasonable in relation to its current estimated fair value and certain other specified criteria are met. The business classified as held-for-sale is recorded at the lower of the carrying value and estimated fair value, less cost to sell. If the carrying value of the business exceeds its estimated fair value, less cost to sell, a loss is recognized and reported in net investment gains (losses). Assets and liabilities related to the business classified as held-for-sale are separately reported in the Company's consolidated balance sheets in the period in which the business is classified as held-for-sale. See Note 3. If a component of the Company has either been disposed of or is classified as held-for-sale and represents a strategic shift that has or will have a major effect on the Company’s operations and financial results, the results of the component are reported in discontinued operations.
Reclassifications
Certain amounts in the prior year periods’ interim condensed consolidated financial statements and related footnotes thereto have been reclassified to conform to the 2022 presentation as discussed throughout the Notes to the Interim Condensed Consolidated Financial Statements.
8
MetLife, Inc.
Notes to the Interim Condensed Consolidated Financial Statements (Unaudited) — (continued
)
1. Business, Basis of Presentation and Summary of Significant Accounting Policies (continued)
Recent Accounting Pronouncements
Changes to GAAP are established by the Financial Accounting Standards Board (“FASB”) in the form of accounting standards updates (“ASUs”) to the FASB Accounting Standards Codification. The Company considers the applicability and impact of all ASUs. The following tables provide a description of ASUs recently issued by the FASB and the impact of their adoption on the Company’s interim condensed consolidated financial statements.
Adopted Accounting Pronouncements
The table below describes the impacts of the ASUs recently adopted by the Company.
| Standard | Description |
Effective Date and
Method of Adoption |
Impact on Financial Statements | ||||||||
|
ASU 2020-04,
Reference Rate Reform (Topic 848): Facilitation of the Effects of Reference Rate Reform on Financial Reporting
; as clarified and amended by ASU 2021-01,
Reference Rate Reform (Topic 848): Scope
|
The guidance provides optional expedients and exceptions for applying GAAP to contracts, hedging relationships and other transactions affected by reference rate reform if certain criteria are met. The expedients and exceptions provided by the amendments do not apply to contract modifications made and hedging relationships entered into or evaluated after December 31, 2022, with certain exceptions. ASU 2021-01 amends the scope of the recent reference rate reform guidance. New optional expedients allow derivative instruments impacted by changes in the interest rate used for margining, discounting, or contract price alignment to qualify for certain optional relief.
|
Effective for contract modifications made between March 12, 2020 and December 31, 2022.
|
The guidance has reduced the operational and financial impacts of contract modifications that replace a reference rate, such as London Interbank Offered Rate (“LIBOR”), affected by reference rate reform.
Contract modifications for invested assets and derivative instruments occurred during 2021 and have continued into 2022. Based on actions taken to date, the adoption of the guidance has not had a material impact on the Company’s interim condensed consolidated financial statements. The Company does not expect the adoption of this guidance to have a material ongoing impact and will continue to evaluate the impacts of reference rate reform on contract modifications and hedging relationships through December 31, 2022.
|
||||||||
|
ASU 2021-10,
Government Assistance (Topic 832): Disclosures by Business Entities about Government Assistance
|
The guidance requires entities to provide annual disclosures about transactions with a government that are accounted for by applying a grant or contribution accounting model by analogy and can include tax credits and other forms of government assistance. Entities are required to disclose information about (i) the nature of the transactions and the related accounting policy used to account for the transactions; (ii) the line items on the balance sheet and income statement that are affected by the transactions, including the associated amounts; and (iii) the significant terms and conditions of the transactions, including commitments and contingencies. | Effective for annual periods beginning January 1, 2022, to be applied prospectively. |
The adoption of the guidance will not have a material impact on the Company’s annual consolidated financial statements.
|
||||||||
9
MetLife, Inc.
Notes to the Interim Condensed Consolidated Financial Statements (Unaudited) — (continued
)
1. Business, Basis of Presentation and Summary of Significant Accounting Policies (continued)
Future Adoption of Accounting Pronouncements
ASUs not listed below were assessed and either determined to be not applicable or are not expected to have a material impact on the Company’s interim condensed consolidated financial statements or disclosures. ASUs issued but not yet adopted as of September 30, 2022 that are currently being assessed and may or may not have a material impact on the Company’s interim condensed consolidated financial statements or disclosures are summarized in the table below.
| Standard | Description |
Effective Date and
Method of Adoption |
Impact on Financial Statements | ||||||||
|
ASU 2018-12,
Financial Services—Insurance (Topic 944): Targeted Improvements to the Accounting for Long-Duration Contracts,
as amended by ASU 2019-09,
Financial Services—Insurance (Topic 944): Effective Date,
as amended by ASU 2020-11
, Financial Services—Insurance (Topic 944): Effective Date and Early Application
|
The guidance (i) prescribes the discount rate to be used in measuring the liability for future policy benefits for traditional and limited payment long-duration contracts, and requires assumptions for those liability valuations to be updated after contract inception, (ii) requires more market-based product guarantees (“market risk benefits”) on certain separate account and other account balance long-duration contracts to be accounted for at fair value, (iii) simplifies the amortization of deferred policy acquisition costs (“DAC”) for virtually all long-duration contracts, and (iv) introduces certain financial statement presentation requirements, as well as significant additional quantitative and qualitative disclosures. The amendments in ASU 2019-09 defer the effective date of ASU 2018-12 to January 1, 2022 for all entities, and the amendments in ASU 2020-11 further defer the effective date of ASU 2018-12 for an additional year to January 1, 2023 for all entities.
|
January 1, 2023, to be applied retrospectively to January 1, 2021 (with early adoption permitted). Estimated impacts from adoption as of the transition date of January 1, 2021 are measured using market assumptions appropriate as of that date. Such estimates do not reflect changes in market assumptions subsequent to January 1, 2021.
|
The Company’s implementation efforts and the evaluation of the impacts of the guidance on its consolidated financial statements, as well as its systems, processes, and controls, continue to progress. Given the nature and extent of the required changes to a significant portion of the Company’s operations, the adoption of this guidance is expected to have a material impact on its financial position, results of operations, and disclosures.
The Company will adopt the guidance effective January 1, 2023. The modified retrospective approach will be used, except in regard to market risk benefits where the Company will use the full retrospective approach. Based upon these transition methods, the Company currently estimates that the January 1, 2021 transition date impact from adoption is expected to result in a decrease to total equity in a range of approximately $
The expected decrease in total equity includes the estimated impact to Accumulated other comprehensive income (loss) (“AOCI”) which, as of the transition date, is expected to result in a decrease in a range of approximately $
The expected decrease in total equity also includes the estimated impact to retained earnings which, from adoption, is expected to result in a decrease in a range of approximately $
The changes in market conditions from January 1, 2021 to September 30, 2022 are estimated to cause the initial transition date reduction in total equity (as discussed in the preceding paragraphs) to largely reverse as of September 30, 2022.
|
||||||||
10
MetLife, Inc.
Notes to the Interim Condensed Consolidated Financial Statements (Unaudited) — (continued
)
1. Business, Basis of Presentation and Summary of Significant Accounting Policies (continued)
| Standard | Description |
Effective Date and
Method of Adoption |
Impact on Financial Statements | ||||||||
|
ASU 2022-03,
Fair Value Measurement (Topic 820): Fair Value Measurement of Equity Securities Subject to
Contractual Sale Restrictions
|
The amendments in this update clarify that a contractual restriction on the sale of an equity security is not considered part of the unit of account of the equity security and, therefore, is not considered in measuring fair value. In addition, the amendments clarify that an entity cannot, as a separate unit of account, recognize and measure a contractual sale restriction. The amendments also require entities that hold equity securities subject to contractual sale restrictions to make disclosures about the fair value of such equity securities, the nature and remaining duration of the restriction(s) and the circumstances that could cause a lapse in the restriction(s).
|
January 1, 2024, to be applied prospectively with any adjustments from the adoption of the amendments
recognized in earnings and disclosed on the date of adoption (with early adoption permitted). |
The Company is continuing to evaluate the impact of the guidance, and it does not expect the adoption of the guidance to have a material impact on its interim condensed consolidated financial statements.
|
||||||||
|
ASU 2022-02,
Financial Instruments—Credit Losses
(Topic 326): Troubled Debt Restructurings and Vintage Disclosures
|
The amendments in the new ASU eliminate the accounting guidance for troubled debt restructurings (“TDRs”) by creditors that have adopted the current expected credit loss guidance while enhancing disclosure requirements for certain loan refinancings and restructurings by creditors when a borrower is experiencing financial difficulty. In addition, the amendments require that a public business entity disclose current-period gross write-offs by year of origination for financing receivables and net investment in leases.
|
January 1, 2023, to be applied prospectively; however, for the transition method related to the recognition and measurement of TDRs, an entity can apply a modified retrospective transition method, resulting in a cumulative-effect adjustment to retained earnings in the period of adoption. Entities are permitted to early adopt these amendments, including adoption in any interim period, provided that the amendments are adopted as of the beginning of the annual reporting period that includes the interim period of adoption. In addition, entities are permitted to elect to early adopt the amendments related to TDRs accounting and related disclosure enhancements separately from the amendments related to certain vintage disclosures.
|
The Company is continuing to evaluate the impact of the guidance and the alternative methods of adoption. Also, the Company is in the process of finalizing the updates to its loan administration systems, as well as updating its accounting policies and controls to comply with the new disclosure requirements. The Company does not expect the adoption of the guidance to have a material impact on its interim condensed consolidated financial statements.
|
||||||||
|
ASU 2021-08,
Business Combinations (Topic 805): Accounting for Contract Assets and Contract Liabilities from Contracts with Customers
|
The guidance indicates how to determine whether a contract liability is recognized by the acquirer in a business combination and provides specific guidance on how to recognize and measure acquired contract assets and contract liabilities from revenue contracts in a business combination.
|
January 1, 2023, to be applied prospectively (with early adoption permitted).
|
The Company is currently evaluating the impact of the guidance on its interim condensed consolidated financial statements.
|
||||||||
11
MetLife, Inc.
Notes to the Interim Condensed Consolidated Financial Statements (Unaudited) — (continued)
MetLife is organized into
five
segments: U.S.; Asia; Latin America; EMEA; and MetLife Holdings. In addition, the Company reports certain of its results of operations in Corporate & Other.
U.S.
The U.S. segment offers a broad range of protection products and services aimed at serving the financial needs of customers throughout their lives. These products are sold to corporations and their respective employees, other institutions and their respective members, as well as individuals. The U.S. segment is organized into two businesses: Group Benefits and Retirement and Income Solutions (“RIS”).
•
The Group Benefits business offers products such as term, variable and universal life insurance, dental, group and individual disability, vision and accident & health insurance.
•
The RIS business offers a broad range of life and annuity-based insurance and investment products, including stable value and pension risk transfer products, institutional income annuities, structured settlements, longevity reinsurance solutions, benefit funding solutions and capital markets investment products.
Asia
The Asia segment offers a broad range of products and services to both individuals and corporations, as well as to other institutions, and their respective employees, which include life insurance, accident & health insurance and retirement and savings.
Latin America
The Latin America segment offers a broad range of products to both individuals and corporations, as well as to other institutions, and their respective employees, which include life insurance, retirement and savings, accident & health insurance and credit insurance.
EMEA
The EMEA segment offers products to individuals, corporations, other institutions, and their respective employees, which include life insurance, accident & health insurance, retirement and savings and credit insurance.
MetLife Holdings
The MetLife Holdings segment consists of operations relating to products and businesses that the Company no longer actively markets in the United States. These include variable, universal, term and whole life insurance, variable, fixed and index-linked annuities and long-term care insurance.
Corporate & Other
Corporate & Other contains various start-up, developing and run-off businesses. Also included in Corporate & Other are: the excess capital, as well as certain charges and activities, not allocated to the segments (including external integration and disposition costs, internal resource costs for associates committed to acquisitions and dispositions and enterprise-wide strategic initiative restructuring charges), interest expense related to the majority of the Company’s outstanding debt, expenses associated with certain legal proceedings and income tax audit issues, the elimination of intersegment amounts (which generally relate to affiliated reinsurance, investment expenses and intersegment loans bearing interest rates commensurate with related borrowings), and the Company’s investment management business (through which the Company provides public fixed income, private capital and real estate investment solutions to institutional investors worldwide).
Financial Measures and Segment Accounting Policies
Adjusted earnings is used by management to evaluate performance and allocate resources. Consistent with GAAP guidance for segment reporting, adjusted earnings is also the Company’s GAAP measure of segment performance and is reported below. Adjusted earnings should not be viewed as a substitute for net income (loss). The Company believes the presentation of adjusted earnings, as the Company measures it for management purposes, enhances the understanding of its performance by highlighting the results of operations and the underlying profitability drivers of the business.
12
MetLife, Inc.
Notes to the Interim Condensed Consolidated Financial Statements (Unaudited) — (continued)
2. Segment Information (continued)
Adjusted earnings is defined as adjusted revenues less adjusted expenses, net of income tax.
The financial measures of adjusted revenues and adjusted expenses focus on the Company’s primary businesses principally by excluding the impact of market volatility, which could distort trends, and revenues and costs related to non-core products and certain entities required to be consolidated under GAAP. Also, these measures exclude results of discontinued operations under GAAP and other businesses that have been or will be sold or exited by MetLife but do not meet the discontinued operations criteria under GAAP and are referred to as divested businesses. Divested businesses also include the net impact of transactions with exited businesses that have been eliminated in consolidation under GAAP and costs relating to businesses that have been or will be sold or exited by MetLife that do not meet the criteria to be included in results of discontinued operations under GAAP. Adjusted revenues also excludes net investment gains (losses) and net derivative gains (losses). Adjusted expenses also excludes goodwill impairments.
The following additional adjustments are made to revenues, in the line items indicated, in calculating adjusted revenues:
•
Universal life and investment-type product policy fees excludes the amortization of unearned revenue related to net investment gains (losses) and net derivative gains (losses) and certain variable annuity guaranteed minimum income benefits (“GMIBs”) fees (“GMIB fees”);
•
Net investment income: (i) includes adjustments for earned income on derivatives and amortization of premium on derivatives that are hedges of investments or that are used to replicate certain investments, but do not qualify for hedge accounting treatment, (ii) excludes post-tax adjusted earnings adjustments relating to insurance joint ventures accounted for under the equity method, (iii) excludes certain amounts related to contractholder-directed equity securities, (iv) excludes certain amounts related to securitization entities that are VIEs consolidated under GAAP and (v) includes distributions of profits from certain other limited partnership interests that were previously accounted for under the cost method, but are now accounted for at estimated fair value, where the change in estimated fair value is recognized in net investment gains (losses) under GAAP; and
•
Other revenues is adjusted for settlements of foreign currency earnings hedges and excludes fees received in association with services provided under transition service agreements (“TSA fees”).
The following additional adjustments are made to expenses, in the line items indicated, in calculating adjusted expenses:
•
Policyholder benefits and claims and policyholder dividends excludes: (i) amortization of basis adjustments associated with de-designated fair value hedges of future policy benefits, (ii) changes in the policyholder dividend obligation related to net investment gains (losses) and net derivative gains (losses), (iii) inflation-indexed benefit adjustments associated with contracts backed by inflation-indexed investments and amounts associated with periodic crediting rate adjustments based on the total return of a contractually referenced pool of assets and other pass through adjustments, (iv) benefits and hedging costs related to GMIBs (“GMIB costs”) and (v) market value adjustments associated with surrenders or terminations of contracts (“Market value adjustments”);
•
Interest credited to policyholder account balances includes adjustments for earned income on derivatives and amortization of premium on derivatives that are hedges of policyholder account balances but do not qualify for hedge accounting treatment and excludes certain amounts related to net investment income earned on contractholder-directed equity securities;
•
Amortization of DAC and value of business acquired (“VOBA”) excludes amounts related to: (i) net investment gains (losses) and net derivative gains (losses), (ii) GMIB fees and GMIB costs and (iii) Market value adjustments;
•
Amortization of negative VOBA excludes amounts related to Market value adjustments;
•
Interest expense on debt excludes certain amounts related to securitization entities that are VIEs consolidated under GAAP; and
•
Other expenses excludes: (i) noncontrolling interests, (ii) implementation of new insurance regulatory requirements costs, and (iii) acquisition, integration and other costs. Other expenses includes TSA fees.
Adjusted earnings also excludes the recognition of certain contingent assets and liabilities that could not be recognized at acquisition or adjusted for during the measurement period under GAAP business combination accounting guidance.
13
MetLife, Inc.
Notes to the Interim Condensed Consolidated Financial Statements (Unaudited) — (continued)
2. Segment Information (continued)
The tax impact of the adjustments mentioned above are calculated net of the U.S. or foreign statutory tax rate, which could differ from the Company’s effective tax rate. Additionally, the provision for income tax (expense) benefit also includes the impact related to the timing of certain tax credits, as well as certain tax reforms.
Set forth in the tables below is certain financial information with respect to the Company’s segments, as well as Corporate & Other, for the three months and
nine months ended September 30, 2022 and 2021. The segment accounting policies are the same as those used to prepare the Company’s interim condensed consolidated financial statements, except for adjusted earnings adjustments as defined above. In addition, segment accounting policies include the method of capital allocation described below.
Economic capital is an internally developed risk capital model, the purpose of which is to measure the risk in the business and to provide a basis upon which capital is deployed. The economic capital model accounts for the unique and specific nature of the risks inherent in the Company’s business.
The Company’s economic capital model, coupled with considerations of local capital requirements, aligns segment allocated equity with emerging standards and consistent risk principles. The model applies statistics-based risk evaluation principles to the material risks to which the Company is exposed. These consistent risk principles include calibrating required economic capital shock factors to a specific confidence level and time horizon while applying an industry standard method for the inclusion of diversification benefits among risk types. The Company’s management is responsible for the ongoing production and enhancement of the economic capital model and reviews its approach periodically to ensure that it remains consistent with emerging industry practice standards.
Segment net investment income is credited or charged based on the level of allocated equity; however, changes in allocated equity do not impact the Company’s consolidated net investment income, net income (loss) or adjusted earnings.
Net investment income is based upon the actual results of each segment’s specifically identifiable investment portfolios adjusted for allocated equity. Other costs are allocated to each of the segments based upon: (i) a review of the nature of such costs; (ii) time studies analyzing the amount of employee compensation costs incurred by each segment; and (iii) cost estimates included in the Company’s product pricing.
14
MetLife, Inc.
Notes to the Interim Condensed Consolidated Financial Statements (Unaudited) — (continued)
2. Segment Information (continued)
| Three Months Ended September 30, 2022 | U.S. | Asia |
Latin
America |
EMEA |
MetLife
Holdings |
Corporate
& Other |
Total | Adjustments |
Total
Consolidated |
|||||||||||||||||||||||||||||||||||||||||||||||
| (In millions) | ||||||||||||||||||||||||||||||||||||||||||||||||||||||||
| Revenues | ||||||||||||||||||||||||||||||||||||||||||||||||||||||||
| Premiums | $ |
|
$ |
|
$ |
|
$ |
|
$ |
|
$ |
(
|
$ |
|
$ |
|
$ |
|
||||||||||||||||||||||||||||||||||||||
| Universal life and investment-type product policy fees |
|
|
|
|
|
(
|
|
|
|
|||||||||||||||||||||||||||||||||||||||||||||||
| Net investment income |
|
|
|
|
|
|
|
(
|
|
|||||||||||||||||||||||||||||||||||||||||||||||
| Other revenues |
|
|
|
|
|
|
|
|
|
|||||||||||||||||||||||||||||||||||||||||||||||
| Net investment gains (losses) |
|
|
|
|
|
|
|
(
|
(
|
|||||||||||||||||||||||||||||||||||||||||||||||
| Net derivative gains (losses) |
|
|
|
|
|
|
|
(
|
(
|
|||||||||||||||||||||||||||||||||||||||||||||||
| Total revenues |
|
|
|
|
|
|
|
(
|
|
|||||||||||||||||||||||||||||||||||||||||||||||
| Expenses | ||||||||||||||||||||||||||||||||||||||||||||||||||||||||
| Policyholder benefits and claims and policyholder dividends |
|
|
|
|
|
(
|
|
(
|
|
|||||||||||||||||||||||||||||||||||||||||||||||
| Interest credited to policyholder account balances |
|
|
|
|
|
|
|
(
|
|
|||||||||||||||||||||||||||||||||||||||||||||||
| Capitalization of DAC |
(
|
(
|
(
|
(
|
(
|
(
|
(
|
|
(
|
|||||||||||||||||||||||||||||||||||||||||||||||
| Amortization of DAC and VOBA |
|
|
|
|
(
|
|
|
(
|
|
|||||||||||||||||||||||||||||||||||||||||||||||
| Amortization of negative VOBA |
|
(
|
|
(
|
|
|
(
|
|
(
|
|||||||||||||||||||||||||||||||||||||||||||||||
| Interest expense on debt |
|
|
|
|
|
|
|
|
|
|||||||||||||||||||||||||||||||||||||||||||||||
| Other expenses |
|
|
|
|
|
|
|
|
|
|||||||||||||||||||||||||||||||||||||||||||||||
| Total expenses |
|
|
|
|
|
|
|
(
|
|
|||||||||||||||||||||||||||||||||||||||||||||||
| Provision for income tax expense (benefit) |
|
|
|
|
|
(
|
|
(
|
|
|||||||||||||||||||||||||||||||||||||||||||||||
| Adjusted earnings | $ |
|
$ |
|
$ |
|
$ |
|
$ |
|
$ |
(
|
|
|||||||||||||||||||||||||||||||||||||||||||
| Adjustments to: | ||||||||||||||||||||||||||||||||||||||||||||||||||||||||
| Total revenues |
(
|
|||||||||||||||||||||||||||||||||||||||||||||||||||||||
| Total expenses |
|
|||||||||||||||||||||||||||||||||||||||||||||||||||||||
| Provision for income tax (expense) benefit |
|
|||||||||||||||||||||||||||||||||||||||||||||||||||||||
| Net income (loss) | $ |
|
$ |
|
||||||||||||||||||||||||||||||||||||||||||||||||||||
15
MetLife, Inc.
Notes to the Interim Condensed Consolidated Financial Statements (Unaudited) — (continued)
2. Segment Information (continued)
| Three Months Ended September 30, 2021 | U.S. | Asia |
Latin
America |
EMEA |
MetLife
Holdings |
Corporate
& Other |
Total | Adjustments |
Total
Consolidated |
|||||||||||||||||||||||||||||||||||||||||||||||
| (In millions) | ||||||||||||||||||||||||||||||||||||||||||||||||||||||||
| Revenues | ||||||||||||||||||||||||||||||||||||||||||||||||||||||||
| Premiums | $ |
|
$ |
|
$ |
|
$ |
|
$ |
|
$ |
|
$ |
|
$ |
|
$ |
|
||||||||||||||||||||||||||||||||||||||
| Universal life and investment-type product policy fees |
|
|
|
|
|
|
|
|
|
|||||||||||||||||||||||||||||||||||||||||||||||
| Net investment income |
|
|
|
|
|
|
|
(
|
|
|||||||||||||||||||||||||||||||||||||||||||||||
| Other revenues |
|
|
|
|
|
|
|
|
|
|||||||||||||||||||||||||||||||||||||||||||||||
| Net investment gains (losses) |
|
|
|
|
|
|
|
(
|
(
|
|||||||||||||||||||||||||||||||||||||||||||||||
| Net derivative gains (losses) |
|
|
|
|
|
|
|
(
|
(
|
|||||||||||||||||||||||||||||||||||||||||||||||
| Total revenues |
|
|
|
|
|
|
|
(
|
|
|||||||||||||||||||||||||||||||||||||||||||||||
| Expenses | ||||||||||||||||||||||||||||||||||||||||||||||||||||||||
| Policyholder benefits and claims and policyholder dividends |
|
|
|
|
|
|
|
|
|
|||||||||||||||||||||||||||||||||||||||||||||||
| Interest credited to policyholder account balances |
|
|
|
|
|
|
|
|
|
|||||||||||||||||||||||||||||||||||||||||||||||
| Capitalization of DAC |
(
|
(
|
(
|
(
|
(
|
(
|
(
|
(
|
(
|
|||||||||||||||||||||||||||||||||||||||||||||||
| Amortization of DAC and VOBA |
|
|
|
|
|
|
|
|
|
|||||||||||||||||||||||||||||||||||||||||||||||
| Amortization of negative VOBA |
|
(
|
|
(
|
|
|
(
|
|
(
|
|||||||||||||||||||||||||||||||||||||||||||||||
| Interest expense on debt |
|
|
|
|
|
|
|
|
|
|||||||||||||||||||||||||||||||||||||||||||||||
| Other expenses |
|
|
|
|
|
|
|
|
|
|||||||||||||||||||||||||||||||||||||||||||||||
| Total expenses |
|
|
|
|
|
|
|
|
|
|||||||||||||||||||||||||||||||||||||||||||||||
| Provision for income tax expense (benefit) |
|
|
(
|
|
|
(
|
|
(
|
|
|||||||||||||||||||||||||||||||||||||||||||||||
| Adjusted earnings | $ |
|
$ |
|
$ |
|
$ |
|
$ |
|
$ |
(
|
|
|||||||||||||||||||||||||||||||||||||||||||
| Adjustments to: | ||||||||||||||||||||||||||||||||||||||||||||||||||||||||
| Total revenues |
(
|
|||||||||||||||||||||||||||||||||||||||||||||||||||||||
| Total expenses |
(
|
|||||||||||||||||||||||||||||||||||||||||||||||||||||||
| Provision for income tax (expense) benefit |
|
|||||||||||||||||||||||||||||||||||||||||||||||||||||||
| Net income (loss) | $ |
|
$ |
|
||||||||||||||||||||||||||||||||||||||||||||||||||||
16
MetLife, Inc.
Notes to the Interim Condensed Consolidated Financial Statements (Unaudited) — (continued)
2. Segment Information (continued)
| Nine Months Ended September 30, 2022 | U.S. | Asia |
Latin
America |
EMEA |
MetLife
Holdings |
Corporate
& Other |
Total | Adjustments |
Total
Consolidated |
|||||||||||||||||||||||||||||||||||||||||||||||
| (In millions) | ||||||||||||||||||||||||||||||||||||||||||||||||||||||||
| Revenues | ||||||||||||||||||||||||||||||||||||||||||||||||||||||||
| Premiums | $ |
|
$ |
|
$ |
|
$ |
|
$ |
|
$ |
(
|
$ |
|
$ |
|
$ |
|
||||||||||||||||||||||||||||||||||||||
| Universal life and investment-type product policy fees |
|
|
|
|
|
|
|
|
|
|||||||||||||||||||||||||||||||||||||||||||||||
| Net investment income |
|
|
|
|
|
|
|
(
|
|
|||||||||||||||||||||||||||||||||||||||||||||||
| Other revenues |
|
|
|
|
|
|
|
|
|
|||||||||||||||||||||||||||||||||||||||||||||||
| Net investment gains (losses) |
|
|
|
|
|
|
|
(
|
(
|
|||||||||||||||||||||||||||||||||||||||||||||||
| Net derivative gains (losses) |
|
|
|
|
|
|
|
(
|
(
|
|||||||||||||||||||||||||||||||||||||||||||||||
| Total revenues |
|
|
|
|
|
|
|
(
|
|
|||||||||||||||||||||||||||||||||||||||||||||||
| Expenses | ||||||||||||||||||||||||||||||||||||||||||||||||||||||||
| Policyholder benefits and claims and policyholder dividends |
|
|
|
|
|
(
|
|
(
|
|
|||||||||||||||||||||||||||||||||||||||||||||||
| Interest credited to policyholder account balances |
|
|
|
|
|
|
|
(
|
|
|||||||||||||||||||||||||||||||||||||||||||||||
| Capitalization of DAC |
(
|
(
|
(
|
(
|
(
|
(
|
(
|
(
|
(
|
|||||||||||||||||||||||||||||||||||||||||||||||
| Amortization of DAC and VOBA |
|
|
|
|
|
|
|
(
|
|
|||||||||||||||||||||||||||||||||||||||||||||||
| Amortization of negative VOBA |
|
(
|
|
(
|
|
|
(
|
|
(
|
|||||||||||||||||||||||||||||||||||||||||||||||
| Interest expense on debt |
|
|
|
|
|
|
|
|
|
|||||||||||||||||||||||||||||||||||||||||||||||
| Other expenses |
|
|
|
|
|
|
|
|
|
|||||||||||||||||||||||||||||||||||||||||||||||
| Total expenses |
|
|
|
|
|
|
|
(
|
|
|||||||||||||||||||||||||||||||||||||||||||||||
| Provision for income tax expense (benefit) |
|
|
|
|
|
(
|
|
(
|
(
|
|||||||||||||||||||||||||||||||||||||||||||||||
| Adjusted earnings | $ |
|
$ |
|
$ |
|
$ |
|
$ |
|
$ |
(
|
|
|||||||||||||||||||||||||||||||||||||||||||
| Adjustments to: | ||||||||||||||||||||||||||||||||||||||||||||||||||||||||
| Total revenues |
(
|
|||||||||||||||||||||||||||||||||||||||||||||||||||||||
| Total expenses |
|
|||||||||||||||||||||||||||||||||||||||||||||||||||||||
| Provision for income tax (expense) benefit |
|
|||||||||||||||||||||||||||||||||||||||||||||||||||||||
| Net income (loss) | $ |
|
$ |
|
||||||||||||||||||||||||||||||||||||||||||||||||||||
17
MetLife, Inc.
Notes to the Interim Condensed Consolidated Financial Statements (Unaudited) — (continued)
2. Segment Information (continued)
| Nine Months Ended September 30, 2021 | U.S. | Asia |
Latin
America |
EMEA |
MetLife
Holdings |
Corporate
& Other |
Total | Adjustments |
Total
Consolidated
|
|||||||||||||||||||||||||||||||||||||||||||||||
| (In millions) | ||||||||||||||||||||||||||||||||||||||||||||||||||||||||
| Revenues | ||||||||||||||||||||||||||||||||||||||||||||||||||||||||
| Premiums | $ |
|
$ |
|
$ |
|
$ |
|
$ |
|
$ |
|
$ |
|
$ |
|
$ |
|
||||||||||||||||||||||||||||||||||||||
| Universal life and investment-type product policy fees |
|
|
|
|
|
|
|
|
|
|||||||||||||||||||||||||||||||||||||||||||||||
| Net investment income |
|
|
|
|
|
|
|
|
|
|||||||||||||||||||||||||||||||||||||||||||||||
| Other revenues |
|
|
|
|
|
|
|
|
|
|||||||||||||||||||||||||||||||||||||||||||||||
| Net investment gains (losses) |
|
|
|
|
|
|
|
|
|
|||||||||||||||||||||||||||||||||||||||||||||||
| Net derivative gains (losses) |
|
|
|
|
|
|
|
(
|
(
|
|||||||||||||||||||||||||||||||||||||||||||||||
| Total revenues |
|
|
|
|
|
|
|
|
|
|||||||||||||||||||||||||||||||||||||||||||||||
| Expenses | ||||||||||||||||||||||||||||||||||||||||||||||||||||||||
| Policyholder benefits and claims and policyholder dividends |
|
|
|
|
|
|
|
|
|
|||||||||||||||||||||||||||||||||||||||||||||||
| Interest credited to policyholder account balances |
|
|
|
|
|
|
|
|
|
|||||||||||||||||||||||||||||||||||||||||||||||
| Capitalization of DAC |
(
|
(
|
(
|
(
|
(
|
(
|
(
|
(
|
(
|
|||||||||||||||||||||||||||||||||||||||||||||||
| Amortization of DAC and VOBA |
|
|
|
|
|
|
|
|
|
|||||||||||||||||||||||||||||||||||||||||||||||
| Amortization of negative VOBA |
|
(
|
|
(
|
|
|
(
|
|
(
|
|||||||||||||||||||||||||||||||||||||||||||||||
| Interest expense on debt |
|
|
|
|
|
|
|
|
|
|||||||||||||||||||||||||||||||||||||||||||||||
| Other expenses |
|
|
|
|
|
|
|
|
|
|||||||||||||||||||||||||||||||||||||||||||||||
| Total expenses |
|
|
|
|
|
|
|
|
|
|||||||||||||||||||||||||||||||||||||||||||||||
| Provision for income tax expense (benefit) |
|
|
|
|
|
(
|
|
(
|
|
|||||||||||||||||||||||||||||||||||||||||||||||
| Adjusted earnings | $ |
|
$ |
|
$ |
|
$ |
|
$ |
|
$ |
(
|
|
|||||||||||||||||||||||||||||||||||||||||||
| Adjustments to: | ||||||||||||||||||||||||||||||||||||||||||||||||||||||||
| Total revenues |
|
|||||||||||||||||||||||||||||||||||||||||||||||||||||||
| Total expenses |
(
|
|||||||||||||||||||||||||||||||||||||||||||||||||||||||
| Provision for income tax (expense) benefit |
|
|||||||||||||||||||||||||||||||||||||||||||||||||||||||
| Net income (loss) | $ |
|
$ |
|
||||||||||||||||||||||||||||||||||||||||||||||||||||
18
MetLife, Inc.
Notes to the Interim Condensed Consolidated Financial Statements (Unaudited) — (continued)
2. Segment Information (continued)
The following table presents total assets with respect to the Company’s segments, as well as Corporate & Other, at:
| September 30, 2022 | December 31, 2021 | |||||||||||||
| (In millions) | ||||||||||||||
|
U.S.
|
$ |
|
$ |
|
||||||||||
|
Asia
|
|
|
||||||||||||
|
Latin America
|
|
|
||||||||||||
|
EMEA
|
|
|
||||||||||||
|
MetLife Holdings
|
|
|
||||||||||||
|
Corporate & Other
|
|
|
||||||||||||
|
Total
|
$ |
|
$ |
|
||||||||||
Disposition of MetLife Poland and Greece
In July 2021, the Company entered into definitive agreements to sell its wholly-owned subsidiaries in Poland and Greece (collectively, “MetLife Poland and Greece”) to NN Group N.V. for $
738
million in total consideration, including a pre-closing dividend of $
43
million. In January 2022 and April 2022, the Company completed the sales of its wholly-owned subsidiaries in Greece and Poland, respectively. In connection with the sales, a loss of $
25
million, net of income tax, was recorded for the nine months ended September 30, 2022, which was reflected in net investment gains (losses) and resulted in a total loss on the sales of $
239
million, net of income tax. MetLife Poland and Greece results of operations are reported in the EMEA segment adjusted earnings through June 30, 2021. See Note 2 for information on accounting for divested business.
MetLife Poland and Greece met the criteria in the second quarter of 2021 to be classified as held-for-sale but did not meet the criteria to be classified as discontinued operations. As a result, the related assets and liabilities are included in the separate held-for-sale line items of the asset and liability sections of the interim condensed consolidated balance sheet until the quarter in which the disposition is completed.
19
MetLife, Inc.
Notes to the Interim Condensed Consolidated Financial Statements (Unaudited) — (continued)
3. Dispositions (continued)
The following table summarizes the assets and liabilities held-for-sale:
| December 31, 2021 | ||||||||
| (In millions) | ||||||||
| Assets: | ||||||||
| Fixed maturity securities available-for-sale | $ |
|
||||||
|
Contractholder-directed equity securities
|
|
|||||||
|
Other investments
|
|
|||||||
| Total investments |
|
|||||||
| Cash and cash equivalents |
|
|||||||
|
Deferred policy acquisition costs and value of business acquired
|
|
|||||||
| Other |
|
|||||||
|
Separate account assets
|
|
|||||||
| Total assets held-for-sale | $ |
|
||||||
| Liabilities: | ||||||||
| Future policy benefits | $ |
|
||||||
|
Policyholder account balances
|
|
|||||||
| Other policy-related balances |
|
|||||||
| Other |
|
|||||||
|
Separate account liabilities
|
|
|||||||
| Total liabilities held-for-sale | $ |
|
||||||
MetLife Poland and Greece income (loss) before provision for income tax as reflected in the interim condensed consolidated statements of operations was $
19
million for the nine months ended September 30, 2022, and $
12
million and $
40
million for the three months and nine months ended September 30, 2021, respectively.
Guarantees
As discussed in Notes 1 and 4 of the Notes to the Consolidated Financial Statements included in the 2021 Annual Report, the Company issues directly and assumes through reinsurance variable annuity products with guaranteed minimum benefits. Guaranteed minimum accumulation benefits (“GMABs”), the non-life contingent portion of guaranteed minimum withdrawal benefits (“GMWBs”) and certain non-life contingent portions of GMIBs are accounted for as embedded derivatives in policyholder account balances and are further discussed in Note 7.
The Company also issues other annuity contracts that apply a lower rate on funds deposited if the contractholder elects to surrender the contract for cash and a higher rate if the contractholder elects to annuitize. These guarantees include benefits that are payable in the event of death, maturity or at annuitization. Certain other annuity contracts contain guaranteed annuitization benefits that may be above what would be provided by the current account value of the contract. Additionally, the Company issues universal and variable life contracts where the Company contractually guarantees to the contractholder a secondary guarantee or a guaranteed paid-up benefit.
20
MetLife, Inc.
Notes to the Interim Condensed Consolidated Financial Statements (Unaudited) — (continued)
4. Insurance (continued)
Information regarding the Company’s guarantee exposure, which includes direct and assumed business, but excludes offsets from hedging or ceded reinsurance, if any, was as follows at:
| September 30, 2022 | December 31, 2021 | |||||||||||||||||||||||||||||||||||||
|
In the
Event of Death |
At
Annuitization |
In the
Event of Death
|
At
Annuitization
|
|||||||||||||||||||||||||||||||||||
| (Dollars in millions) | ||||||||||||||||||||||||||||||||||||||
|
Annuity Contracts:
|
||||||||||||||||||||||||||||||||||||||
|
Variable Annuity Guarantees:
|
||||||||||||||||||||||||||||||||||||||
|
Total account value (1), (2), (3)
|
$ |
|
$ |
|
$ |
|
$ |
|
||||||||||||||||||||||||||||||
|
Separate account value (1)
|
$ |
|
$ |
|
$ |
|
$ |
|
||||||||||||||||||||||||||||||
|
Net amount at risk (2)
|
$ |
|
(4) | $ |
|
(5) | $ |
|
(4) | $ |
|
(5) | ||||||||||||||||||||||||||
|
Average attained age of contractholders
|
|
|
|
|
||||||||||||||||||||||||||||||||||
|
Other Annuity Guarantees:
|
||||||||||||||||||||||||||||||||||||||
|
Total account value (1), (3)
|
N/A | $ |
|
N/A | $ |
|
||||||||||||||||||||||||||||||||
|
Net amount at risk
|
N/A | $ |
|
(6) | N/A | $ |
|
(6) | ||||||||||||||||||||||||||||||
|
Average attained age of contractholders
|
N/A |
|
N/A |
|
||||||||||||||||||||||||||||||||||
| September 30, 2022 | December 31, 2021 | |||||||||||||||||||||||||
|
Secondary
Guarantees |
Paid-Up
Guarantees |
Secondary
Guarantees
|
Paid-Up
Guarantees |
|||||||||||||||||||||||
| (Dollars in millions) | ||||||||||||||||||||||||||
|
Universal and Variable Life Contracts:
|
||||||||||||||||||||||||||
|
Total account value (1), (3)
|
$ |
|
$ |
|
$ |
|
$ |
|
||||||||||||||||||
|
Net amount at risk (7)
|
$ |
|
$ |
|
$ |
|
$ |
|
||||||||||||||||||
|
Average attained age of policyholders
|
|
|
|
|
||||||||||||||||||||||
__________________
(1)
The Company’s annuity and life contracts with guarantees may offer more than one type of guarantee in each contract. Therefore, the amounts listed above may not be mutually exclusive.
(2)
Includes amounts, which are not reported on the interim condensed consolidated balance sheets, from assumed variable annuity guarantees from the Company’s former operating joint venture in Japan.
(3)
Includes the contractholders’ investments in the general account and separate account, if applicable.
(4)
Defined as the death benefit less the total account value, as of the balance sheet date. It represents the amount of the claim that the Company would incur if death claims were filed on all contracts on the balance sheet date and includes any additional contractual claims associated with riders purchased to assist with covering income taxes payable upon death.
(5)
Defined as the amount (if any) that would be required to be added to the total account value to purchase a lifetime income stream, based on current annuity rates, equal to the minimum amount provided under the guaranteed benefit. This amount represents the Company’s potential economic exposure to such guarantees in the event all contractholders were to annuitize on the balance sheet date, even though the contracts contain terms that allow annuitization of the guaranteed amount only after the 10th anniversary of the contract, which not all contractholders have achieved.
(6)
Defined as either the excess of the upper tier, adjusted for a profit margin, less the lower tier, as of the balance sheet date or the amount (if any) that would be required to be added to the total account value to purchase a lifetime income stream, based on current annuity rates, equal to the minimum amount provided under the guaranteed benefit. These amounts represent the Company’s potential economic exposure to such guarantees in the event all contractholders were to annuitize on the balance sheet date.
(7)
Defined as the guarantee amount less the account value, as of the balance sheet date. It represents the amount of the claim that the Company would incur if death claims were filed on all contracts on the balance sheet date.
21
MetLife, Inc.
Notes to the Interim Condensed Consolidated Financial Statements (Unaudited) — (continued)
4. Insurance (continued)
Liabilities for Unpaid Claims and Claim Expenses
Rollforward of Claims and Claim Adjustment Expenses
Information regarding the liabilities for unpaid claims and claim adjustment expenses was as follows:
|
Nine Months
Ended September 30, |
||||||||||||||
| 2022 | 2021 | |||||||||||||
| (In millions) | ||||||||||||||
| Balance, beginning of period | $ |
|
$ |
|
||||||||||
| Less: Reinsurance recoverables |
|
|
||||||||||||
| Net balance, beginning of period |
|
|
||||||||||||
| Incurred related to: | ||||||||||||||
| Current period |
|
|
||||||||||||
| Prior periods (1) |
|
|
||||||||||||
| Total incurred |
|
|
||||||||||||
| Paid related to: | ||||||||||||||
| Current period |
(
|
(
|
||||||||||||
| Prior periods |
(
|
(
|
||||||||||||
| Total paid |
(
|
(
|
||||||||||||
| Reclassified to liabilities held-for-sale (2) |
|
(
|
||||||||||||
| Dispositions |
|
(
|
||||||||||||
| Net balance, end of period |
|
|
||||||||||||
| Add: Reinsurance recoverables |
|
|
||||||||||||
| Balance, end of period (included in future policy benefits and other policy-related balances) | $ |
|
$ |
|
||||||||||
__________________
(1)
The nine months ended September 30, 2022 and 2021 include incurred claim activity and claim adjustment expenses associated with prior periods but reported in the respective current period, which contain impacts related to the COVID-19 pandemic, partially offset by additional premiums recorded for experience-rated contracts that are not reflected in the table above.
(2)
See Note 3 for information on the Company’s business dispositions.
On April 7, 2000 (the “Demutualization Date”), Metropolitan Life Insurance Company (“MLIC”) converted from a mutual life insurance company to a stock life insurance company and became a wholly-owned subsidiary of MetLife, Inc. The conversion was pursuant to an order by the New York Superintendent of Insurance approving MLIC’s plan of reorganization, as amended (the “Plan of Reorganization”). On the Demutualization Date, MLIC established a closed block for the benefit of holders of certain individual life insurance policies of MLIC.
Experience within the closed block, in particular mortality and investment yields, as well as realized and unrealized gains and losses, directly impact the policyholder dividend obligation. Amortization of the closed block DAC, which resides outside of the closed block, is based upon cumulative actual and expected earnings within the closed block. Accordingly, the Company’s net income continues to be sensitive to the actual performance of the closed block.
22
MetLife, Inc.
Notes to the Interim Condensed Consolidated Financial Statements (Unaudited) — (continued)
5. Closed Block (continued)
Information regarding the closed block liabilities and assets designated to the closed block was as follows at:
| September 30, 2022 | December 31, 2021 | |||||||||||||
| (In millions) | ||||||||||||||
|
Closed Block Liabilities
|
||||||||||||||
|
Future policy benefits
|
$ |
|
$ |
|
||||||||||
|
Other policy-related balances
|
|
|
||||||||||||
|
Policyholder dividends payable
|
|
|
||||||||||||
|
Policyholder dividend obligation
|
|
|
||||||||||||
| Deferred income tax liability |
|
|
||||||||||||
|
Other liabilities
|
|
|
||||||||||||
|
Total closed block liabilities
|
|
|
||||||||||||
|
Assets Designated to the Closed Block
|
||||||||||||||
|
Investments:
|
||||||||||||||
|
Fixed maturity securities available-for-sale, at estimated fair value
|
|
|
||||||||||||
|
Equity securities, at estimated fair value
|
|
|
||||||||||||
|
Mortgage loans
|
|
|
||||||||||||
|
Policy loans
|
|
|
||||||||||||
|
Real estate and real estate joint ventures
|
|
|
||||||||||||
|
Other invested assets
|
|
|
||||||||||||
|
Total investments
|
|
|
||||||||||||
|
Cash and cash equivalents
|
|
|
||||||||||||
|
Accrued investment income
|
|
|
||||||||||||
|
Premiums, reinsurance and other receivables
|
|
|
||||||||||||
|
Current income tax recoverable
|
|
|
||||||||||||
| Deferred income tax asset |
|
|
||||||||||||
|
Total assets designated to the closed block
|
|
|
||||||||||||
|
Excess of closed block liabilities over assets designated to the closed block
|
|
|
||||||||||||
|
AOCI:
|
||||||||||||||
|
Unrealized investment gains (losses), net of income tax
|
(
|
|
||||||||||||
|
Unrealized gains (losses) on derivatives, net of income tax
|
|
|
||||||||||||
|
Allocated to policyholder dividend obligation, net of income tax
|
|
(
|
||||||||||||
|
Total amounts included in AOCI
|
(
|
|
||||||||||||
|
Maximum future earnings to be recognized from closed block assets and liabilities
|
$ |
|
$ |
|
||||||||||
Information regarding the closed block policyholder dividend obligation was as follows:
|
Nine Months
Ended September 30, 2022 |
Year
Ended December 31, 2021 |
|||||||||||||
| (In millions) | ||||||||||||||
|
Balance, beginning of period
|
$ |
|
$ |
|
||||||||||
|
Change in unrealized investment and derivative gains (losses)
|
(
|
(
|
||||||||||||
|
Balance, end of period
|
$ |
|
$ |
|
||||||||||
23
MetLife, Inc.
Notes to the Interim Condensed Consolidated Financial Statements (Unaudited) — (continued)
5. Closed Block (continued)
Information regarding the closed block revenues and expenses was as follows:
|
Three Months
Ended September 30, |
Nine Months
Ended September 30, |
|||||||||||||||||||||||||
| 2022 | 2021 | 2022 | 2021 | |||||||||||||||||||||||
| (In millions) | ||||||||||||||||||||||||||
|
Revenues
|
||||||||||||||||||||||||||
|
Premiums
|
$ |
|
$ |
|
$ |
|
$ |
|
||||||||||||||||||
|
Net investment income
|
|
|
|
|
||||||||||||||||||||||
|
Net investment gains (losses)
|
(
|
(
|
(
|
(
|
||||||||||||||||||||||
|
Net derivative gains (losses)
|
|
|
|
|
||||||||||||||||||||||
|
Total revenues
|
|
|
|
|
||||||||||||||||||||||
|
Expenses
|
||||||||||||||||||||||||||
|
Policyholder benefits and claims
|
|
|
|
|
||||||||||||||||||||||
|
Policyholder dividends
|
|
|
|
|
||||||||||||||||||||||
|
Other expenses
|
|
|
|
|
||||||||||||||||||||||
|
Total expenses
|
|
|
|
|
||||||||||||||||||||||
|
Revenues, net of expenses before provision for income tax expense (benefit)
|
|
|
|
(
|
||||||||||||||||||||||
|
Provision for income tax expense (benefit)
|
|
|
|
(
|
||||||||||||||||||||||
|
Revenues, net of expenses and provision for income tax expense (benefit)
|
$ |
|
$ |
|
$ |
|
$ |
(
|
||||||||||||||||||
MLIC charges the closed block with federal income taxes, state and local premium taxes and other state or local taxes, as well as investment management expenses relating to the closed block as provided in the Plan of Reorganization. MLIC also charges the closed block for expenses of maintaining the policies included in the closed block.
24
MetLife, Inc.
Notes to the Interim Condensed Consolidated Financial Statements (Unaudited) — (continued)
Fixed Maturity Securities Available-for-Sale
Fixed Maturity Securities Available-for-Sale by Sector
The following table presents fixed maturity securities available-for-sale (“AFS”) by sector. U.S. corporate and foreign corporate sectors include redeemable preferred stock. Residential mortgage-backed securities (“RMBS”) includes agency, prime, alternative and sub-prime mortgage-backed securities. Asset-backed securities and collateralized loan obligations (“ABS & CLO”), previously disclosed as ABS in the 2021 Annual Report, includes securities collateralized by consumer loans, corporate loans and broadly syndicated bank loans. Municipals includes taxable and tax-exempt revenue bonds and, to a much lesser extent, general obligations of states, municipalities and political subdivisions. Commercial mortgage-backed securities (“CMBS”) primarily includes securities collateralized by multiple commercial mortgage loans. RMBS, ABS & CLO and CMBS are, collectively, “Structured Products.”
| September 30, 2022 | December 31, 2021 | |||||||||||||||||||||||||||||||||||||||||||||||||||||||||||||
|
Amortized
Cost |
Gross Unrealized |
Estimated
Fair Value |
Amortized
Cost |
Gross Unrealized (1) |
Estimated
Fair Value |
|||||||||||||||||||||||||||||||||||||||||||||||||||||||||
|
Sector
|
Allowance for
Credit Loss |
Gains | Losses |
Allowance for
Credit Loss |
Gains |
Losses |
||||||||||||||||||||||||||||||||||||||||||||||||||||||||
| (In millions) | ||||||||||||||||||||||||||||||||||||||||||||||||||||||||||||||
| U.S. corporate | $ |
|
$ |
(
|
$ |
|
$ |
|
$ |
|
$ |
|
$ |
(
|
$ |
|
$ |
|
$ |
|
||||||||||||||||||||||||||||||||||||||||||
|
Foreign corporate
|
|
(
|
|
|
|
|
(
|
|
|
|
||||||||||||||||||||||||||||||||||||||||||||||||||||
|
Foreign government
|
|
(
|
|
|
|
|
(
|
|
|
|
||||||||||||||||||||||||||||||||||||||||||||||||||||
| U.S. government and agency |
|
|
|
|
|
|
|
|
|
|
||||||||||||||||||||||||||||||||||||||||||||||||||||
| RMBS |
|
|
|
|
|
|
|
|
|
|
||||||||||||||||||||||||||||||||||||||||||||||||||||
|
ABS & CLO
|
|
|
|
|
|
|
|
|
|
|
||||||||||||||||||||||||||||||||||||||||||||||||||||
| Municipals |
|
|
|
|
|
|
|
|
|
|
||||||||||||||||||||||||||||||||||||||||||||||||||||
| CMBS |
|
(
|
|
|
|
|
(
|
|
|
|
||||||||||||||||||||||||||||||||||||||||||||||||||||
|
Total fixed maturity securities AFS
|
$ |
|
$ |
(
|
$ |
|
$ |
|
$ |
|
$ |
|
$ |
(
|
$ |
|
$ |
|
$ |
|
||||||||||||||||||||||||||||||||||||||||||
_________________
(1)
Excludes gross unrealized gains (losses) related to assets held-for-sale; these unrealized gains (losses) are included in AOCI as no component of equity is held-for-sale. See Note 3 for information on the Company’s business dispositions.
The Company held non-income producing fixed maturity securities AFS with an estimated fair value of $
133
million and $
22
million at September 30, 2022 and December 31, 2021, respectively, with unrealized gains (losses) of ($
29
) million and $
8
million at September 30, 2022 and December 31, 2021, respectively.
The amortized cost, net of allowance for credit loss (“ACL”) and estimated fair value of fixed maturity securities AFS, by contractual maturity date, were as follows at September 30, 2022:
|
Due in One
Year or Less |
Due After
One Year Through Five Years |
Due After
Five Years Through Ten Years |
Due After
Ten Years |
Structured
Products |
Total Fixed
Maturity Securities AFS |
|||||||||||||||||||||||||||||||||
| (In millions) | ||||||||||||||||||||||||||||||||||||||
| Amortized cost, net of ACL | $ |
|
$ |
|
$ |
|
$ |
|
$ |
|
$ |
|
||||||||||||||||||||||||||
| Estimated fair value | $ |
|
$ |
|
$ |
|
$ |
|
$ |
|
$ |
|
||||||||||||||||||||||||||
25
MetLife, Inc.
Notes to the Interim Condensed Consolidated Financial Statements (Unaudited) — (continued)
6. Investments (continued)
Continuous Gross Unrealized Losses for Fixed Maturity Securities AFS by Sector
The following table presents the estimated fair value and gross unrealized losses of fixed maturity securities AFS in an unrealized loss position without an ACL by sector and aggregated by length of time that the securities have been in a continuous unrealized loss position.
| September 30, 2022 | December 31, 2021 | |||||||||||||||||||||||||||||||||||||||||||||||||
| Less than 12 Months |
Equal to or Greater
than 12 Months |
Less than 12 Months |
Equal to or Greater
than 12 Months |
|||||||||||||||||||||||||||||||||||||||||||||||
| Sector & Credit Quality |
Estimated
Fair Value |
Gross
Unrealized Losses |
Estimated
Fair Value |
Gross
Unrealized Losses |
Estimated
Fair Value |
Gross
Unrealized Losses (1) |
Estimated
Fair Value |
Gross
Unrealized Losses (1) |
||||||||||||||||||||||||||||||||||||||||||
| (Dollars in millions) | ||||||||||||||||||||||||||||||||||||||||||||||||||
| U.S. corporate | $ |
|
$ |
|
$ |
|
$ |
|
$ |
|
$ |
|
$ |
|
$ |
|
||||||||||||||||||||||||||||||||||
| Foreign corporate |
|
|
|
|
|
|
|
|
||||||||||||||||||||||||||||||||||||||||||
| Foreign government |
|
|
|
|
|
|
|
|
||||||||||||||||||||||||||||||||||||||||||
| U.S. government and agency |
|
|
|
|
|
|
|
|
||||||||||||||||||||||||||||||||||||||||||
| RMBS |
|
|
|
|
|
|
|
|
||||||||||||||||||||||||||||||||||||||||||
| ABS & CLO |
|
|
|
|
|
|
|
|
||||||||||||||||||||||||||||||||||||||||||
| Municipals |
|
|
|
|
|
|
|
|
||||||||||||||||||||||||||||||||||||||||||
| CMBS |
|
|
|
|
|
|
|
|
||||||||||||||||||||||||||||||||||||||||||
|
Total fixed maturity securities AFS
|
$ |
|
$ |
|
$ |
|
$ |
|
$ |
|
$ |
|
$ |
|
$ |
|
||||||||||||||||||||||||||||||||||
| Investment grade | $ |
|
$ |
|
$ |
|
$ |
|
$ |
|
$ |
|
$ |
|
$ |
|
||||||||||||||||||||||||||||||||||
| Below investment grade |
|
|
|
|
|
|
|
|
||||||||||||||||||||||||||||||||||||||||||
|
Total fixed maturity securities AFS
|
$ |
|
$ |
|
$ |
|
$ |
|
$ |
|
$ |
|
$ |
|
$ |
|
||||||||||||||||||||||||||||||||||
| Total number of securities in an unrealized loss position |
|
|
|
|
||||||||||||||||||||||||||||||||||||||||||||||
________________
(1)
Excludes gross unrealized losses related to assets held-for-sale; these unrealized losses are included in AOCI as no component of equity is held-for-sale. See Note 3 for information on the Company’s business dispositions.
Evaluation of Fixed Maturity Securities AFS for Credit Loss
Evaluation and Measurement Methodologies
Management considers a wide range of factors about the security issuer and uses its best judgment in evaluating the cause of the decline in the estimated fair value of the security and in assessing the prospects for near-term recovery. Inherent in management’s evaluation of the security are assumptions and estimates about the operations of the issuer and its future earnings potential. Considerations used in the credit loss evaluation process include, but are not limited to: (i) the extent to which the estimated fair value has been below amortized cost, (ii) adverse conditions specifically related to a security, an industry sector or sub-sector, or an economically depressed geographic area, adverse change in the financial condition of the issuer of the security, changes in technology, discontinuance of a segment of the business that may affect future earnings, and changes in the quality of credit enhancement, (iii) payment structure of the security and likelihood of the issuer being able to make payments, (iv) failure of the issuer to make scheduled interest and principal payments, (v) whether the issuer, or series of issuers or an industry has suffered a catastrophic loss or has exhausted natural resources, (vi) whether the Company has the intent to sell or will more likely than not be required to sell a particular security before the decline in estimated fair value below amortized cost recovers, (vii) with respect to Structured Products, changes in forecasted cash flows after considering the changes in the financial condition of the underlying loan obligors and quality of underlying collateral, expected prepayment speeds, current and forecasted loss severity, consideration of the payment terms of the underlying assets backing a particular security, and the payment priority within the tranche structure of the security, (viii) changes in the rating of the security by a rating agency, and (ix) other subjective factors, including concentrations and information obtained from regulators.
26
MetLife, Inc.
Notes to the Interim Condensed Consolidated Financial Statements (Unaudited) — (continued)
6. Investments (continued)
The methodology and significant inputs used to determine the amount of credit loss are as follows:
•
The Company calculates the recovery value by performing a discounted cash flow analysis based on the present value of future cash flows. The discount rate is generally the effective interest rate of the security at the time of purchase for fixed-rate securities and the spot rate at the date of evaluation of credit loss for floating-rate securities.
•
When determining collectability and the period over which value is expected to recover, the Company applies considerations utilized in its overall credit loss evaluation process which incorporates information regarding the specific security, fundamentals of the industry and geographic area in which the security issuer operates, and overall macroeconomic conditions. Projected future cash flows are estimated using assumptions derived from management’s single best estimate, the most likely outcome in a range of possible outcomes, after giving consideration to a variety of variables that include, but are not limited to: payment terms of the security; the likelihood that the issuer can service the interest and principal payments; the quality and amount of any credit enhancements; the security’s position within the capital structure of the issuer; possible corporate restructurings or asset sales by the issuer; any private and public sector programs to restructure foreign government securities and municipals; and changes to the rating of the security or the issuer by rating agencies.
•
Additional considerations are made when assessing the unique features that apply to certain Structured Products including, but not limited to: the quality of underlying collateral, historical performance of the underlying loan obligors, historical rent and vacancy levels, changes in the financial condition of the underlying loan obligors, expected prepayment speeds, current and forecasted loss severity, consideration of the payment terms of the underlying loans or assets backing a particular security, changes in the quality of credit enhancement and the payment priority within the tranche structure of the security.
With respect to securities that have attributes of debt and equity (“perpetual hybrid securities”), consideration is given in the credit loss analysis as to whether there has been any deterioration in the credit of the issuer and the likelihood of recovery in value of the securities that are in a severe unrealized loss position. Consideration is also given as to whether any perpetual hybrid securities with an unrealized loss, regardless of credit rating, have deferred any dividend payments.
In periods subsequent to the recognition of an initial ACL on a security, the Company reassesses credit loss quarterly. Subsequent increases or decreases in the expected cash flow from the security result in corresponding decreases or increases in the ACL which are recognized in earnings and reported within net investment gains (losses); however, the previously recorded ACL is not reduced to an amount below zero. Full or partial write-offs are deducted from the ACL in the period the security, or a portion thereof, is considered uncollectible. Recoveries of amounts previously written off are recorded to the ACL in the period received. When the Company has the intent-to-sell the security or it is more likely than not that the Company will be required to sell the security before recovery of its amortized cost, any ACL is written off and the amortized cost is written down to estimated fair value through a charge within net investment gains (losses), which becomes the new amortized cost of the security.
Evaluation of Fixed Maturity Securities AFS in an Unrealized Loss Position
Gross unrealized losses on securities without an ACL increased $
34.6
billion for the nine months ended September 30, 2022 to $
37.0
billion primarily due to increases in interest rates, widening credit spreads, and the impact of weakening foreign currencies on certain non-functional currency denominated fixed maturity securities.
Gross unrealized losses on securities without an ACL that have been in a continuous gross unrealized loss position for 12 months or greater were $
8.0
billion at September 30, 2022, or
22
% of the total gross unrealized losses on securities without an ACL.
Investment Grade Fixed Maturity Securities AFS
Of the $
8.0
billion of gross unrealized losses on securities without an ACL that have been in a continuous gross unrealized loss position for 12 months or greater, $
7.4
billion, or
93
%, were related to
2,477
investment grade securities. Unrealized losses on investment grade securities are principally related to widening credit spreads since purchase and, with respect to fixed-rate securities, rising interest rates since purchase.
27
MetLife, Inc.
Notes to the Interim Condensed Consolidated Financial Statements (Unaudited) — (continued)
6. Investments (continued)
Below Investment Grade Fixed Maturity Securities AFS
Of the $
8.0
billion of gross unrealized losses on securities without an ACL that have been in a continuous gross unrealized loss position for 12 months or greater, $
582
million, or
7
%, were related to
319
below investment grade securities. Unrealized losses on below investment grade securities are principally related to U.S. corporate and foreign corporate securities (primarily industrial and consumer) and foreign government securities. These unrealized losses are the result of significantly wider credit spreads resulting from higher risk premiums since purchase, largely due to economic and market uncertainty, as well as, with respect to fixed-rate securities, rising interest rates since purchase. Management evaluates U.S. corporate and foreign corporate securities based on several factors such as expected cash flows, financial condition and near-term and long-term prospects of the issuers. Management evaluates foreign government securities based on factors impacting the issuers such as expected cash flows, financial condition of the issuers and any country specific economic conditions or public sector programs to restructure foreign government securities.
Current Period Evaluation
At September 30, 2022, with respect to securities in an unrealized loss position without an ACL, the Company did not intend to sell these securities, and it was not more likely than not that the Company would be required to sell these securities before the anticipated recovery of the remaining amortized cost. Based on the Company’s current evaluation of its securities in an unrealized loss position without an ACL, the Company concluded that these securities had not incurred a credit loss and should not have an ACL at September 30, 2022.
Future provisions for credit loss will depend primarily on economic fundamentals, issuer performance (including changes in the present value of future cash flows expected to be collected), changes in credit ratings and collateral valuation.
Rollforward of Allowance for Credit Loss for Fixed Maturity Securities AFS by Sector
The rollforward of ACL for fixed maturity securities AFS by sector is as follows:
|
U.S.
Corporate |
Foreign
Corporate |
Foreign
Government |
CMBS | Total | |||||||||||||||||||||||||
| Three Months Ended September 30, 2022 | (In millions) | ||||||||||||||||||||||||||||
| Balance, at beginning of period | $ |
|
$ |
|
$ |
|
$ |
|
$ |
|
|||||||||||||||||||
| Additions: | |||||||||||||||||||||||||||||
|
ACL not previously recorded
|
|
|
|
|
|
||||||||||||||||||||||||
| Reductions: | |||||||||||||||||||||||||||||
|
Changes for securities with previously recorded ACL
|
|
(
|
(
|
|
(
|
||||||||||||||||||||||||
| Securities sold or exchanged |
|
(
|
|
|
(
|
||||||||||||||||||||||||
| Disposition |
|
|
|
|
|
||||||||||||||||||||||||
| Effect of foreign currency translation |
|
|
(
|
|
(
|
||||||||||||||||||||||||
|
Write-offs
|
|
|
|
|
|
||||||||||||||||||||||||
| Balance, at end of period | $ |
|
$ |
|
$ |
|
$ |
|
$ |
|
|||||||||||||||||||
| Three Months Ended September 30, 2021 | |||||||||||||||||||||||||||||
| Balance, at beginning of period | $ |
|
$ |
|
$ |
|
$ |
|
$ |
|
|||||||||||||||||||
| Additions: | |||||||||||||||||||||||||||||
|
ACL not previously recorded
|
|
|
|
|
|
||||||||||||||||||||||||
| Reductions: | |||||||||||||||||||||||||||||
|
Changes for securities with previously recorded ACL
|
|
(
|
|
|
(
|
||||||||||||||||||||||||
| Securities sold or exchanged |
(
|
(
|
|
|
(
|
||||||||||||||||||||||||
| Disposition |
|
|
(
|
|
(
|
||||||||||||||||||||||||
| Effect of foreign currency translation |
|
|
|
|
|
||||||||||||||||||||||||
|
Write-offs
|
(
|
|
|
|
(
|
||||||||||||||||||||||||
| Balance, at end of period | $ |
|
$ |
|
$ |
|
$ |
|
$ |
|
|||||||||||||||||||
28
MetLife, Inc.
Notes to the Interim Condensed Consolidated Financial Statements (Unaudited) — (continued)
6. Investments (continued)
|
U.S.
Corporate |
Foreign
Corporate |
Foreign
Government |
CMBS | Total | |||||||||||||||||||||||||
| Nine Months Ended September 30, 2022 | (In millions) | ||||||||||||||||||||||||||||
| Balance, at beginning of period | $ |
|
$ |
|
$ |
|
$ |
|
$ |
|
|||||||||||||||||||
| Additions: | |||||||||||||||||||||||||||||
|
ACL not previously recorded
|
|
|
|
|
|
||||||||||||||||||||||||
| Reductions: | |||||||||||||||||||||||||||||
|
Changes for securities with previously recorded ACL
|
|
|
(
|
|
(
|
||||||||||||||||||||||||
| Securities sold or exchanged |
(
|
(
|
(
|
|
(
|
||||||||||||||||||||||||
| Disposition |
|
|
|
|
|
||||||||||||||||||||||||
| Effect of foreign currency translation |
|
|
(
|
|
(
|
||||||||||||||||||||||||
|
Write-offs
|
(
|
|
|
|
(
|
||||||||||||||||||||||||
| Balance, at end of period | $ |
|
$ |
|
$ |
|
$ |
|
$ |
|
|||||||||||||||||||
| Nine Months Ended September 30, 2021 | |||||||||||||||||||||||||||||
| Balance, at beginning of period | $ |
|
$ |
|
$ |
|
$ |
|
$ |
|
|||||||||||||||||||
| Additions: | |||||||||||||||||||||||||||||
|
ACL not previously recorded
|
|
|
|
|
|
||||||||||||||||||||||||
| Reductions: | |||||||||||||||||||||||||||||
|
Changes for securities with previously recorded ACL
|
|
(
|
|
(
|
(
|
||||||||||||||||||||||||
| Securities sold or exchanged |
(
|
(
|
|
|
(
|
||||||||||||||||||||||||
| Disposition |
|
|
(
|
|
(
|
||||||||||||||||||||||||
| Effect of foreign currency translation |
|
|
|
|
|
||||||||||||||||||||||||
|
Write-offs
|
(
|
|
|
|
(
|
||||||||||||||||||||||||
| Balance, at end of period | $ |
|
$ |
|
$ |
|
$ |
|
$ |
|
|||||||||||||||||||
Equity Securities
The following table presents equity securities by security type. Common stock includes common stock, exchange traded funds, mutual funds and real estate investment trusts.
| September 30, 2022 | December 31, 2021 | |||||||||||||||||||||||||||||||||||||
| Cost |
Net Unrealized
Gains (Losses) (1) |
Estimated
Fair Value |
Cost |
Net Unrealized
Gains (Losses) (1) |
Estimated
Fair Value |
|||||||||||||||||||||||||||||||||
| Security Type | ||||||||||||||||||||||||||||||||||||||
| (In millions) | ||||||||||||||||||||||||||||||||||||||
| Common stock | $ |
|
$ |
|
$ |
|
$ |
|
$ |
|
$ |
|
||||||||||||||||||||||||||
| Non-redeemable preferred stock |
|
(
|
|
|
|
|
||||||||||||||||||||||||||||||||
|
Total
|
$ |
|
$ |
|
$ |
|
$ |
|
$ |
|
$ |
|
||||||||||||||||||||||||||
(1)
Represents cumulative changes in estimated fair value, recognized in earnings, and not in Other Comprehensive Income (Loss) (“OCI”).
29
MetLife, Inc.
Notes to the Interim Condensed Consolidated Financial Statements (Unaudited) — (continued)
6. Investments (continued)
Contractholder-Directed Equity Securities and FVO Securities
The following table presents these investments by asset type. Contractholder-directed investments supporting unit-linked variable annuity type liabilities (“Unit-linked investments”) are primarily equity securities (including mutual funds) and, to a lesser extent, fixed income investments and cash and cash equivalents.
| September 30, 2022 | December 31, 2021 | |||||||||||||||||||||||||||||||||||||
|
Cost or
Amortized Cost |
Net Unrealized
Gains (Losses) (1) |
Estimated
Fair Value |
Cost or
Amortized Cost |
Net Unrealized
Gains (Losses) (1) |
Estimated
Fair Value |
|||||||||||||||||||||||||||||||||
| Asset Type | ||||||||||||||||||||||||||||||||||||||
| (In millions) | ||||||||||||||||||||||||||||||||||||||
|
Unit-linked investments
|
$ |
|
$ |
|
$ |
|
$ |
|
$ |
|
$ |
|
||||||||||||||||||||||||||
|
FVO Securities
|
|
|
|
|
|
|
||||||||||||||||||||||||||||||||
|
Total
|
$ |
|
$ |
|
$ |
|
$ |
|
$ |
|
$ |
|
||||||||||||||||||||||||||
(1)
Represents cumulative changes in estimated fair value, recognized in earnings, and not in OCI.
Mortgage Loans
Mortgage Loans by Portfolio Segment
Mortgage loans are summarized as follows at:
| September 30, 2022 | December 31, 2021 | |||||||||||||||||||||||||
| Portfolio Segment |
Carrying
Value |
% of
Total |
Carrying
Value |
% of
Total |
||||||||||||||||||||||
| (Dollars in millions) | ||||||||||||||||||||||||||
| Commercial | $ |
|
|
% | $ |
|
|
% | ||||||||||||||||||
| Agricultural |
|
|
|
|
||||||||||||||||||||||
| Residential |
|
|
|
|
||||||||||||||||||||||
|
Total amortized cost
|
|
|
|
|
||||||||||||||||||||||
| Allowance for credit loss |
(
|
(
|
(
|
(
|
||||||||||||||||||||||
| Subtotal mortgage loans, net |
|
|
|
|
||||||||||||||||||||||
| Residential — FVO |
|
|
|
|
||||||||||||||||||||||
|
Total mortgage loans held-for-investment, net
|
|
|
|
|
||||||||||||||||||||||
|
Total mortgage loans, net
|
$ |
|
|
% | $ |
|
|
% | ||||||||||||||||||
The Company elects the FVO for certain residential mortgage loans that are managed on a total return basis, with changes in estimated fair value included in net investment income. See Note 8 for further information.
The amount of net (discounts) premiums and deferred (fees) expenses, included within total amortized cost, primarily attributable to residential mortgage loans was ($
687
) million and ($
759
) million at September 30, 2022 and December 31, 2021, respectively. The accrued interest income excluded from total amortized cost for commercial, agricultural and residential mortgage loans at September 30, 2022 was $
205
million, $
152
million and $
80
million, respectively. The accrued interest income excluded from total amortized cost for commercial, agricultural and residential mortgage loans at December 31, 2021 was $
180
million, $
161
million and $
86
million, respectively.
Purchases of mortgage loans, consisting primarily of residential mortgage loans, were $
462
million and $
2.2
billion for the three months and nine months ended September 30, 2022, respectively, and $
499
million and $
1.5
billion for the three months and nine months ended September 30, 2021, respectively.
30
MetLife, Inc.
Notes to the Interim Condensed Consolidated Financial Statements (Unaudited) — (continued)
6. Investments (continued)
Rollforward of Allowance for Credit Loss for Mortgage Loans by Portfolio Segment
The rollforward of ACL for mortgage loans, by portfolio segment, is as follows:
|
Nine Months
Ended September 30, |
|||||||||||||||||||||||||||||||||||||||||||||||
| 2022 | 2021 | ||||||||||||||||||||||||||||||||||||||||||||||
| Commercial | Agricultural | Residential | Total | Commercial | Agricultural | Residential | Total | ||||||||||||||||||||||||||||||||||||||||
| (In millions) | |||||||||||||||||||||||||||||||||||||||||||||||
|
Balance, beginning of period
|
$ |
|
$ |
|
$ |
|
$ |
|
$ |
|
$ |
|
$ |
|
$ |
|
|||||||||||||||||||||||||||||||
| Provision (release) |
(
|
|
(
|
(
|
|
|
(
|
(
|
|||||||||||||||||||||||||||||||||||||||
|
Initial credit losses on PCD loans (1)
|
|
|
|
|
|
|
|
|
|||||||||||||||||||||||||||||||||||||||
|
Charge-offs, net of recoveries
|
(
|
(
|
(
|
(
|
|
(
|
(
|
(
|
|||||||||||||||||||||||||||||||||||||||
|
Balance, end of period
|
$ |
|
$ |
|
$ |
|
$ |
|
$ |
|
$ |
|
$ |
|
$ |
|
|||||||||||||||||||||||||||||||
(1)
Represents the initial credit losses on purchased mortgage loans accounted for as purchased financial assets with credit deterioration (“PCD”).
Allowance for Credit Loss Methodology
The Company records an allowance for expected lifetime credit loss in earnings within net investment gains (losses) in an amount that represents the portion of the amortized cost basis of mortgage loans that the Company does not expect to collect, resulting in mortgage loans being presented at the net amount expected to be collected. In determining the Company’s ACL, management applies significant judgment to estimate expected lifetime credit loss, including: (i) pooling mortgage loans that share similar risk characteristics, (ii) considering expected lifetime credit loss over the contractual term of its mortgage loans adjusted for expected prepayments and any extensions, and (iii) considering past events and current and forecasted economic conditions. Each of the Company’s commercial, agricultural and residential mortgage loan portfolio segments are evaluated separately. The ACL is calculated for each mortgage loan portfolio segment based on inputs unique to each loan portfolio segment. On a quarterly basis, mortgage loans within a portfolio segment that share similar risk characteristics, such as internal risk ratings or consumer credit scores, are pooled for calculation of ACL. On an ongoing basis, mortgage loans with dissimilar risk characteristics (i.e., loans with significant declines in credit quality), collateral dependent mortgage loans (i.e., when the borrower is experiencing financial difficulty, including when foreclosure is reasonably possible or probable) and reasonably expected TDRs (i.e., the Company grants concessions to borrower that is experiencing financial difficulties) are evaluated individually for credit loss. The ACL for loans evaluated individually are established using the same methodologies for all three portfolio segments. For example, the ACL for a collateral dependent loan is established as the excess of amortized cost over the estimated fair value of the loan’s underlying collateral, less selling cost when foreclosure is probable. Accordingly, the change in the estimated fair value of collateral dependent loans, which are evaluated individually for credit loss, is recorded as a change in the ACL which is recorded on a quarterly basis as a charge or credit to earnings in net investment gains (losses).
31
MetLife, Inc.
Notes to the Interim Condensed Consolidated Financial Statements (Unaudited) — (continued)
6. Investments (continued)
Commercial and Agricultural Mortgage Loan Portfolio Segments
Commercial and agricultural mortgage loan ACL are calculated in a similar manner. Within each loan portfolio segment, commercial and agricultural, loans are pooled by internal risk rating. Estimated lifetime loss rates, which vary by internal risk rating, are applied to the amortized cost of each loan, excluding accrued investment income, on a quarterly basis to develop the ACL. Internal risk ratings are based on an assessment of the loan’s credit quality, which can change over time. The estimated lifetime loss rates are based on several loan portfolio segment-specific factors, including (i) the Company’s experience with defaults and loss severity, (ii) expected default and loss severity over the forecast period, (iii) current and forecasted economic conditions including growth, inflation, interest rates and unemployment levels, (iv) loan specific characteristics including loan-to-value (“LTV”) ratios, and (v) internal risk ratings. These evaluations are revised as conditions change and new information becomes available. The Company uses its several decades of historical default and loss severity experience which capture multiple economic cycles. The Company uses a forecast of economic assumptions for a two-year period for most of its commercial and agricultural mortgage loans, while a one-year period is used for loans originated in certain markets. After the applicable forecast period, the Company reverts to its historical loss experience using a straight-line basis over two years. For evaluations of commercial mortgage loans, in addition to historical experience, management considers factors that include the impact of a rapid change to the economy, which may not be reflected in the loan portfolio, recent loss and recovery trend experience as compared to historical loss and recovery experience, and loan specific characteristics including debt service coverage ratios (“DSCR”). In estimating expected lifetime credit loss over the term of its commercial mortgage loans, the Company adjusts for expected prepayment and extension experience during the forecast period using historical prepayment and extension experience considering the expected position in the economic cycle and the loan profile (i.e., floating rate, shorter-term fixed rate and longer-term fixed rate) and after the forecast period using long-term historical prepayment experience. For evaluations of agricultural mortgage loans, in addition to historical experience, management considers factors that include increased stress in certain sectors, which may be evidenced by higher delinquency rates, or a change in the number of higher risk loans. In estimating expected lifetime credit loss over the term of its agricultural mortgage loans, the Company’s experience is much less sensitive to the position in the economic cycle and by loan profile; accordingly, historical prepayment experience is used, while extension terms are not prevalent with the Company’s agricultural mortgage loans.
Commercial mortgage loans are reviewed on an ongoing basis, which review includes, but is not limited to, an analysis of the property financial statements and rent roll, lease rollover analysis, property inspections, market analysis, estimated valuations of the underlying collateral, LTV ratios, DSCR and tenant creditworthiness. The monitoring process focuses on higher risk loans, which include those that are classified as restructured, delinquent or in foreclosure, as well as loans with higher LTV ratios and lower DSCR. Agricultural mortgage loans are reviewed on an ongoing basis, which review includes, but is not limited to, property inspections, market analysis, estimated valuations of the underlying collateral, LTV ratios and borrower creditworthiness, as well as reviews on a geographic and property-type basis. The monitoring process for agricultural mortgage loans also focuses on higher risk loans.
For commercial mortgage loans, the primary credit quality indicator is the DSCR, which compares a property’s net operating income to amounts needed to service the principal and interest due under the loan. Generally, the lower the DSCR, the higher the risk of experiencing a credit loss. The Company also reviews the LTV ratio of its commercial mortgage loan portfolio. LTV ratios compare the unpaid principal balance of the loan to the estimated fair value of the underlying collateral. Generally, the higher the LTV ratio, the higher the risk of experiencing a credit loss. The DSCR and the values utilized in calculating the ratio are updated routinely. In addition, the LTV ratio is routinely updated for all but the lowest risk loans as part of the Company’s ongoing review of its commercial mortgage loan portfolio.
For agricultural mortgage loans, the Company’s primary credit quality indicator is the LTV ratio. The values utilized in calculating this ratio are developed in connection with the ongoing review of the agricultural mortgage loan portfolio and are routinely updated.
32
MetLife, Inc.
Notes to the Interim Condensed Consolidated Financial Statements (Unaudited) — (continued)
6. Investments (continued)
Commitments to lend: After loans are approved, the Company makes commitments to lend and, typically, borrowers draw down on some or all of the commitments. The timing of mortgage loan funding is based on the commitment expiration dates. A liability for credit loss for unfunded commercial and agricultural mortgage loan commitments that are not unconditionally cancellable is recognized in earnings and is reported within net investment gains (losses). The liability is based on estimated lifetime loss rates as described above and the amount of the outstanding commitments, which for lines of credit, considers estimated utilization rates. When the commitment is funded or expires, the liability is adjusted accordingly.
Residential Mortgage Loan Portfolio Segment
The Company’s residential mortgage loan portfolio is comprised primarily of purchased closed end, amortizing residential mortgage loans, including both performing loans purchased within 12 months of origination and reperforming loans purchased after they have been performing for at least 12 months post-modification. Residential mortgage loans are pooled by loan type (i.e., new origination and reperforming) and pooled by similar risk profiles (including consumer credit score and LTV ratios). Estimated lifetime loss rates, which vary by loan type and risk profile, are applied to the amortized cost of each loan excluding accrued investment income on a quarterly basis to develop the ACL. The estimated lifetime loss rates are based on several factors, including (i) industry historical experience and expected results over the forecast period for defaults, (ii) loss severity, (iii) prepayment rates, (iv) current and forecasted economic conditions including growth, inflation, interest rates and unemployment levels, and (v) loan pool specific characteristics including consumer credit scores, LTV ratios, payment history and home prices. These evaluations are revised as conditions change and new information becomes available. The Company uses industry historical experience which captures multiple economic cycles as the Company has purchased most of its residential mortgage loans in the last five years. The Company uses a forecast of economic assumptions for a two-year period for most of its residential mortgage loans. After the applicable forecast period, the Company immediately reverts to industry historical loss experience.
For residential mortgage loans, the Company’s primary credit quality indicator is whether the loan is performing or nonperforming. The Company generally defines nonperforming residential mortgage loans as those that are 60 or more days past due and/or in nonaccrual status which is assessed monthly. Generally, nonperforming residential mortgage loans have a higher risk of experiencing a credit loss.
Troubled Debt Restructuring
The Company may grant concessions to borrowers experiencing financial difficulties and if significant, these concessions are classified as TDRs. Generally, the types of concessions include: reduction of contractual interest rates, extension of the maturity date at an interest rate lower than current market interest rates, and/or a reduction of accrued interest. The amount, timing and extent of the concessions granted are considered in determining any ACL recorded.
For the three months and nine months ended September 30, 2022, the Company had
one
and
two
commercial mortgage loans modified in a TDR, respectively with both pre-modification and post-modification carrying value, after ACL, of $
64
million and $
162
million, respectively.
33
MetLife, Inc.
Notes to the Interim Condensed Consolidated Financial Statements (Unaudited) — (continued)
6. Investments (continued)
Credit Quality of Mortgage Loans by Portfolio Segment
The amortized cost of commercial mortgage loans by credit quality indicator and vintage year was as follows at September 30, 2022:
| Credit Quality Indicator | 2022 | 2021 | 2020 | 2019 | 2018 | Prior |
Revolving
Loans |
Total |
% of
Total |
|||||||||||||||||||||||||||||||||||||||||||||||
| (Dollars in millions) | ||||||||||||||||||||||||||||||||||||||||||||||||||||||||
| LTV ratios: | ||||||||||||||||||||||||||||||||||||||||||||||||||||||||
|
Less than 65%
|
$ |
|
$ |
|
$ |
|
$ |
|
$ |
|
$ |
|
$ |
|
$ |
|
|
% | ||||||||||||||||||||||||||||||||||||||
|
65% to 75%
|
|
|
|
|
|
|
|
|
|
|||||||||||||||||||||||||||||||||||||||||||||||
|
76% to 80%
|
|
|
|
|
|
|
|
|
|
|||||||||||||||||||||||||||||||||||||||||||||||
|
Greater than 80%
|
|
|
|
|
|
|
|
|
|
|||||||||||||||||||||||||||||||||||||||||||||||
|
Total
|
$ |
|
$ |
|
$ |
|
$ |
|
$ |
|
$ |
|
$ |
|
$ |
|
|
% | ||||||||||||||||||||||||||||||||||||||
| DSCR: | ||||||||||||||||||||||||||||||||||||||||||||||||||||||||
|
> 1.20x
|
$ |
|
$ |
|
$ |
|
$ |
|
$ |
|
$ |
|
$ |
|
$ |
|
|
% | ||||||||||||||||||||||||||||||||||||||
|
1.00x - 1.20x
|
|
|
|
|
|
|
|
|
|
|||||||||||||||||||||||||||||||||||||||||||||||
|
<1.00x
|
|
|
|
|
|
|
|
|
|
|||||||||||||||||||||||||||||||||||||||||||||||
|
Total
|
$ |
|
$ |
|
$ |
|
$ |
|
$ |
|
$ |
|
$ |
|
$ |
|
|
% | ||||||||||||||||||||||||||||||||||||||
The amortized cost of agricultural mortgage loans by credit quality indicator and vintage year was as follows at September 30, 2022:
| Credit Quality Indicator | 2022 | 2021 | 2020 | 2019 | 2018 | Prior |
Revolving
Loans |
Total |
% of
Total |
|||||||||||||||||||||||||||||||||||||||||||||||
| (Dollars in millions) | ||||||||||||||||||||||||||||||||||||||||||||||||||||||||
| LTV ratios: | ||||||||||||||||||||||||||||||||||||||||||||||||||||||||
|
Less than 65%
|
$ |
|
$ |
|
$ |
|
$ |
|
$ |
|
$ |
|
$ |
|
$ |
|
|
% | ||||||||||||||||||||||||||||||||||||||
|
65% to 75%
|
|
|
|
|
|
|
|
|
|
|||||||||||||||||||||||||||||||||||||||||||||||
|
76% to 80%
|
|
|
|
|
|
|
|
|
|
|||||||||||||||||||||||||||||||||||||||||||||||
|
Greater than 80%
|
|
|
|
|
|
|
|
|
|
|||||||||||||||||||||||||||||||||||||||||||||||
|
Total
|
$ |
|
$ |
|
$ |
|
$ |
|
$ |
|
$ |
|
$ |
|
$ |
|
|
% | ||||||||||||||||||||||||||||||||||||||
The amortized cost of residential mortgage loans by credit quality indicator and vintage year was as follows at September 30, 2022:
| Credit Quality Indicator | 2022 | 2021 | 2020 | 2019 | 2018 | Prior |
Revolving
Loans |
Total |
% of
Total |
|||||||||||||||||||||||||||||||||||||||||||||||
| (Dollars in millions) | ||||||||||||||||||||||||||||||||||||||||||||||||||||||||
| Performance indicators: | ||||||||||||||||||||||||||||||||||||||||||||||||||||||||
|
Performing
|
$ |
|
$ |
|
$ |
|
$ |
|
$ |
|
$ |
|
$ |
|
$ |
|
|
% | ||||||||||||||||||||||||||||||||||||||
|
Nonperforming (1)
|
|
|
|
|
|
|
|
|
|
|||||||||||||||||||||||||||||||||||||||||||||||
|
Total
|
$ |
|
$ |
|
$ |
|
$ |
|
$ |
|
$ |
|
$ |
|
$ |
|
|
% | ||||||||||||||||||||||||||||||||||||||
__________________
(1)
Includes residential mortgage loans in process of foreclosure of $
145
million and $
70
million at September 30, 2022 and December 31, 2021, respectively.
LTV ratios compare the unpaid principal balance of the loan to the estimated fair value of the underlying collateral. The amortized cost of commercial and agricultural mortgage loans with an LTV ratio in excess of 100% was $
599
million, or
1
% of total commercial and agricultural mortgage loans, at September 30, 2022.
The Company has a high quality, well performing mortgage loan portfolio, with
99
% of all mortgage loans classified as performing at both September 30, 2022 and December 31, 2021.
The Company defines delinquency consistent with
34
MetLife, Inc.
Notes to the Interim Condensed Consolidated Financial Statements (Unaudited) — (continued)
6. Investments (continued)
| Past Due |
Greater than 90 Days Past Due
and Still Accruing Interest |
Nonaccrual | ||||||||||||||||||||||||||||||||||||
| Portfolio Segment | September 30, 2022 | December 31, 2021 | September 30, 2022 | December 31, 2021 | September 30, 2022 | December 31, 2021 | ||||||||||||||||||||||||||||||||
| (In millions) | ||||||||||||||||||||||||||||||||||||||
| Commercial | $ |
|
$ |
|
$ |
|
$ |
|
$ |
|
$ |
|
||||||||||||||||||||||||||
| Agricultural |
|
|
|
|
|
|
||||||||||||||||||||||||||||||||
| Residential |
|
|
|
|
|
|
||||||||||||||||||||||||||||||||
| Total | $ |
|
$ |
|
$ |
|
$ |
|
$ |
|
$ |
|
||||||||||||||||||||||||||
The amortized cost for nonaccrual commercial, agricultural and residential mortgage loans at beginning of year 2021 was $
317
million, $
266
million and $
534
million, respectively. The amortized cost for nonaccrual agricultural mortgage loans with no ACL was $
88
million and $
134
million at September 30, 2022 and December 31, 2021, respectively. There were
no
nonaccrual commercial or residential mortgage loans without an ACL at either September 30, 2022 or December 31, 2021.
Real Estate and Real Estate Joint Ventures
The Company’s real estate investment portfolio is diversified by property type, geography and income stream, including income from operating leases, operating income and equity in earnings from equity method real estate joint ventures.
Real estate investments, by income type, as well as income earned, were as follows at and for the periods indicated:
| September 30, 2022 | December 31, 2021 |
Three Months
Ended September 30, |
Nine Months
Ended September 30, |
|||||||||||||||||||||||||||||||||||
| 2022 | 2021 | 2022 | 2021 | |||||||||||||||||||||||||||||||||||
| Income Type | Carrying Value | Income | ||||||||||||||||||||||||||||||||||||
| (In millions) | ||||||||||||||||||||||||||||||||||||||
| Wholly-owned real estate: | ||||||||||||||||||||||||||||||||||||||
| Leased real estate | $ |
|
$ |
|
$ |
|
$ |
|
$ |
|
$ |
|
||||||||||||||||||||||||||
| Other real estate |
|
|
|
|
|
|
||||||||||||||||||||||||||||||||
| Real estate joint ventures |
|
|
|
|
|
|
||||||||||||||||||||||||||||||||
| Total real estate and real estate joint ventures | $ |
|
$ |
|
$ |
|
$ |
|
$ |
|
$ |
|
||||||||||||||||||||||||||
The carrying value of wholly-owned real estate acquired through foreclosure was $
175
million and $
181
million at September 30, 2022 and December 31, 2021, respectively. Depreciation expense on real estate investments was $
29
million and $
88
million for the three months and nine months ended September 30, 2022, respectively, and $
31
million and $
92
million for the three months and nine months ended September 30, 2021, respectively. Real estate investments were net of accumulated depreciation of $
903
million and $
883
million at September 30, 2022 and December 31, 2021, respectively.
Leases
The Company, as lessor, leases investment real estate, principally commercial real estate for office and retail use, through a variety of operating lease arrangements, which typically include tenant reimbursement for property operating costs and options to renew or extend the lease. In some circumstances, leases may include an option for the lessee to purchase the property. In addition, certain leases of retail space may stipulate that a portion of the income earned is contingent upon the level of the tenants’ revenues.
The Company has elected a practical expedient of not separating non-lease components related to reimbursement of property operating costs from associated lease components. These property operating costs have the same timing and pattern of transfer as the related lease component, because they are incurred over the same period of time as the operating lease. Therefore, the combined component is accounted for as a single operating lease.
Risk is managed through lessee credit analysis, property type diversification, and geographic diversification.
35
MetLife, Inc.
Notes to the Interim Condensed Consolidated Financial Statements (Unaudited) — (continued)
6. Investments (continued)
See Note 8 of the Notes to the Consolidated Financial Statements included in the 2021 Annual Report for a summary of leased real estate investments and income earned, by property type.
The Company has diversified leveraged and direct financing lease portfolios. Its leveraged leases principally include renewable energy generation facilities, rail cars, commercial real estate and commercial aircraft, and its direct financing leases principally include commercial real estate. These assets are leased through a variety of lease arrangements, which may include options to renew or extend the lease and options for the lessee to purchase the property. Residual values are estimated using available third-party data at inception of the lease. Risk is managed through lessee credit analysis, asset allocation, geographic diversification, and ongoing reviews of estimated residual values, using available third-party data and, in certain leases, linking the amount of future rental receipts to changes in inflation rates. Generally, estimated residual values are not guaranteed by the lessee or a third party.
Lease receivables are generally due in periodic installments.
The payment periods for leveraged leases generally range from one to 10 years, but in certain circumstances can be over 10 years, while the payment periods for direct financing leases generally range from one to 25 years but in certain circumstances can be over 25 years.
The Company records an allowance for expected lifetime credit loss in earnings within net investment gains (losses) in an amount that represents the portion of the investment in leases that the Company does not expect to collect, resulting in the investment in leases being presented at the net amount expected to be collected. In determining the ACL, management applies significant judgment to estimate expected lifetime credit loss, including: (i) pooling leases that share similar risk characteristics, (ii) considering expected lifetime credit loss over the contractual term of the lease, and (iii) considering past events and current and forecasted economic conditions. Leases with dissimilar risk characteristics are evaluated individually for credit loss. Expected lifetime credit loss on leveraged lease receivables is estimated using a probability of default and loss given default model, where the probability of default incorporates third party credit ratings of the lessee and the related historical default data. Direct financing leases principally relate to leases of commercial real estate; accordingly, expected lifetime credit loss is estimated on such lease receivables consistent with the methodology for commercial mortgage loans (see “— Mortgage Loans — Allowance for Credit Loss Methodology”). The Company also assesses the non-guaranteed residual values for recoverability by comparison to the current estimated fair value of the leased asset and considers other relevant market information such as independent third-party forecasts, consulting, asset brokerage and investment banking reports and data, comparable market transactions, and factors such as the competitive dynamics impacting specific industries, technological change and obsolescence, government and regulatory rules, tax policy, potential environmental liabilities and litigation.
The investment in leveraged and direct financing leases, net of ACL, was $
795
million and $
1.0
billion, respectively, at September 30, 2022 and $
787
million and $
1.1
billion, respectively, at December 31, 2021. The ACL for leveraged and direct financing leases was $
33
million and $
40
million at September 30, 2022 and December 31, 2021, respectively.
Cash Equivalents
Cash equivalents, which includes securities and other investments with an original or remaining maturity of three months or less at the time of purchase, wa
s $
9.4
billion
and
$
9.0
billion, principally
at estimated fair value, at September 30, 2022 and December 31, 2021, respectively.
Net Unrealized Investment Gains (Losses)
Unrealized investment gains (losses) on fixed maturity securities AFS and derivatives and the effect on policyholder liabilities, DAC, VOBA and deferred sales inducements (“DSI”) that would result from the realization of the unrealized gains (losses), are included in net unrealized investment gains (losses) in AOCI.
The components of net unrealized investment gains (losses), included in AOCI, were as follows:
| September 30, 2022 | December 31, 2021 | |||||||||||||
| (In millions) | ||||||||||||||
|
Fixed maturity securities AFS
|
$ |
(
|
$ |
|
||||||||||
|
Derivatives
|
|
|
||||||||||||
|
Other
|
|
|
||||||||||||
|
Subtotal
|
(
|
|
||||||||||||
|
Amounts allocated from:
|
||||||||||||||
| Policyholder liabilities (1) |
(
|
(
|
||||||||||||
|
DAC, VOBA and DSI
|
|
(
|
||||||||||||
|
Subtotal
|
|
(
|
||||||||||||
|
Deferred income tax benefit (expense)
|
|
(
|
||||||||||||
|
Net unrealized investment gains (losses)
|
(
|
|
||||||||||||
|
Net unrealized investment gains (losses) attributable to noncontrolling interests
|
(
|
(
|
||||||||||||
|
Net unrealized investment gains (losses) attributable to MetLife, Inc.
|
$ |
(
|
$ |
|
||||||||||
(1)
Includes unearned revenue liabilities.
The changes in net unrealized investment gains (losses) were as follows:
|
Nine Months
Ended September 30, 2022 |
|||||
| (In millions) | |||||
|
Balance, beginning of period
|
$ |
|
|||
|
Unrealized investment gains (losses) during the period
|
(
|
||||
|
Unrealized investment gains (losses) relating to:
|
|||||
| Policyholder liabilities |
|
||||
|
DAC, VOBA and DSI
|
|
||||
|
Deferred income tax benefit (expense)
|
|
||||
|
Net unrealized investment gains (losses)
|
(
|
||||
|
Net unrealized investment gains (losses) attributable to noncontrolling interests
|
|
||||
|
Balance, end of period
|
$ |
(
|
|||
|
Change in net unrealized investment gains (losses)
|
$ |
(
|
|||
|
Change in net unrealized investment gains (losses) attributable to noncontrolling interests
|
|
||||
|
Change in net unrealized investment gains (losses) attributable to MetLife, Inc.
|
$ |
(
|
|||
Concentrations of Credit Risk
Investments in any counterparty that were greater than 10% of the Company’s equity, other than the U.S. government and its agencies, at estimated fair value at September 30, 2022 and December 31, 2021, were in fixed income securities of the Japanese government and its agencies of $
22.9
billion and $
32.7
billion, respectively, in fixed income securities of the South Korean government and its agencies of $
5.0
billion and $
7.1
billion, respectively, and in fixed income securities of the Mexican government and its agencies of $
3.1
billion at September 30, 2022.
36
MetLife, Inc.
Notes to the Interim Condensed Consolidated Financial Statements (Unaudited) — (continued)
6. Investments (continued)
Securities Lending Transactions and Repurchase Agreements
Securities, Collateral and Reinvestment Portfolio
A summary of these transactions and agreements accounted for as secured borrowings was as follows:
| September 30, 2022 | December 31, 2021 | |||||||||||||||||||||||||||||||||||||
| Securities (1) | Securities (1) | |||||||||||||||||||||||||||||||||||||
| Agreement Type |
Estimated
Fair Value |
Cash Collateral
Received from Counterparties (2) |
Reinvestment
Portfolio at Estimated Fair Value |
Estimated
Fair Value |
Cash Collateral
Received from Counterparties (2) |
Reinvestment
Portfolio at Estimated Fair Value |
||||||||||||||||||||||||||||||||
| (In millions) | ||||||||||||||||||||||||||||||||||||||
|
Securities lending
|
$ |
|
$ |
|
$ |
|
$ |
|
$ |
|
$ |
|
||||||||||||||||||||||||||
|
Repurchase agreements
|
$ |
|
$ |
|
$ |
|
$ |
|
$ |
|
$ |
|
||||||||||||||||||||||||||
__________________
(1)
These securities were included within fixed maturity securities AFS and short-term investments at September 30, 2022 and within fixed maturity securities AFS at December 31, 2021.
(2)
The liability for cash collateral is included within payables for collateral under securities loaned and other transactions.
Contractual Maturities
Contractual maturities of these transactions and agreements accounted for as secured borrowings were as follows:
| September 30, 2022 | December 31, 2021 | |||||||||||||||||||||||||||||||||||||||||||||||||||||||||||||
| Remaining Maturities | Remaining Maturities | |||||||||||||||||||||||||||||||||||||||||||||||||||||||||||||
| Security Type | Open (1) |
1 Month
or Less |
Over 1 Month
to 6 Months |
Over 6
Months to 1 Year |
Total | Open (1) |
1 Month
or Less |
Over 1 Month
to 6 Months |
Over 6
Months to 1 Year |
Total | ||||||||||||||||||||||||||||||||||||||||||||||||||||
| (In millions) | ||||||||||||||||||||||||||||||||||||||||||||||||||||||||||||||
| Cash collateral liability by security type: | ||||||||||||||||||||||||||||||||||||||||||||||||||||||||||||||
| Securities lending: | ||||||||||||||||||||||||||||||||||||||||||||||||||||||||||||||
|
U.S. government and agency
|
$ |
|
$ |
|
$ |
|
$ |
|
$ |
|
$ |
|
$ |
|
$ |
|
$ |
|
$ |
|
||||||||||||||||||||||||||||||||||||||||||
|
Foreign government
|
|
|
|
|
|
|
|
|
|
|
||||||||||||||||||||||||||||||||||||||||||||||||||||
| Agency RMBS |
|
|
|
|
|
|
|
|
|
|
||||||||||||||||||||||||||||||||||||||||||||||||||||
|
U.S. corporate
|
|
|
|
|
|
|
|
|
|
|
||||||||||||||||||||||||||||||||||||||||||||||||||||
|
Total
|
$ |
|
$ |
|
$ |
|
$ |
|
$ |
|
$ |
|
$ |
|
$ |
|
$ |
|
$ |
|
||||||||||||||||||||||||||||||||||||||||||
| Repurchase agreements: | ||||||||||||||||||||||||||||||||||||||||||||||||||||||||||||||
|
U.S. government and agency
|
$ |
|
$ |
|
$ |
|
$ |
|
$ |
|
$ |
|
$ |
|
$ |
|
$ |
|
$ |
|
||||||||||||||||||||||||||||||||||||||||||
__________________
(1)
The related security could be returned to the Company on the next business day, which would require the Company to immediately return the cash collateral.
If the Company is required to return significant amounts of cash collateral on short notice and is forced to sell investments to meet the return obligation, it may have difficulty selling such collateral that is invested in a timely manner, be forced to sell investments in a volatile or illiquid market for less than what otherwise would have been realized under normal market conditions, or both.
The securities lending and repurchase agreements reinvestment portfolios consist principally of high quality, liquid, publicly-traded fixed maturity securities AFS, short-term investments, cash equivalents or cash. If the securities, or the reinvestment portfolio become less liquid, liquidity resources within the general account are available to meet any potential cash demands when securities are put back by the counterparty.
37
MetLife, Inc.
Notes to the Interim Condensed Consolidated Financial Statements (Unaudited) — (continued)
6. Investments (continued)
Invested Assets on Deposit, Held in Trust and Pledged as Collateral
Invested assets on deposit, held in trust and pledged as collateral are presented below at estimated fair value for all asset classes, except mortgage loans, which are presented at carrying value and were as follows at:
| September 30, 2022 | December 31, 2021 | |||||||||||||
| (In millions) | ||||||||||||||
|
Invested assets on deposit (regulatory deposits)
|
$ |
|
$ |
|
||||||||||
| Invested assets held in trust (external reinsurance agreements) (1) |
|
|
||||||||||||
| Invested assets pledged as collateral (2) |
|
|
||||||||||||
|
Total invested assets on deposit, held in trust and pledged as collateral
|
$ |
|
$ |
|
||||||||||
__________________
(1) Represents assets held in trust related to third-party reinsur
ance agreements. Excludes assets held in trust related to reinsurance agreements between wholly-owned subsidiaries of $
1.9
billion
and $
2.1
billion at September 30, 2022 and December 31, 2021, respectively.
(2) The Company has pledged invested assets in connection with various agreements and transactions, including funding agreements, secured debt and short-term debt related to repurchase agreements and a collateral financing arrangement (see Notes 4, 13 and 14 of the Notes to the Consolidated Financial Statements included in the 2021 Annual Report) and derivative transactions (see
Note 7).
See “— Securities Lending Transactions and Repurchase Agreements” for information regarding securities supporting securities lending transactions and repurchase agreements an
d Note 5 f
or information regarding investments designated to the closed block. In addition, the Company’s investment in Federal Home Loan Bank common stock, included within other invested assets, which is considered restricted until redeemed by the issuer, was
$
768
million
and $
769
million, at redemption value, at September 30, 2022 and December 31, 2021, respectively.
Variable Interest Entities
The Company has invested in legal entities that are VIEs. In certain instances, the Company holds both the power to direct the most significant activities of the entity, as well as an economic interest in the entity and, as such, is deemed to be the primary beneficiary or consolidator of the entity. The determination of the VIE’s primary beneficiary requires an evaluation of the contractual and implied rights and obligations associated with each party’s relationship with or involvement in the entity.
Consolidated VIEs
Creditors or beneficial interest holders of VIEs where the Company is the primary beneficiary have no recourse to the general credit of the Company, as the Company’s obligation to the VIEs is limited to the amount of its committed investment.
The following table presents the total assets and total liabilities relating to investment related VIEs for which the Company has concluded that it is the primary beneficiary and which are consolidated at:
| September 30, 2022 | December 31, 2021 | |||||||||||||||||||||||||
| Asset Type |
Total
Assets |
Total
Liabilities |
Total
Assets |
Total
Liabilities |
||||||||||||||||||||||
| (In millions) | ||||||||||||||||||||||||||
| Investment funds (primarily other invested assets) | $ |
|
$ |
|
$ |
|
$ |
|
||||||||||||||||||
| Renewable energy partnership (primarily other invested assets) |
|
|
|
|
||||||||||||||||||||||
| Other investments (primarily other assets) |
|
|
|
|
||||||||||||||||||||||
|
Total
|
$ |
|
$ |
|
$ |
|
$ |
|
||||||||||||||||||
38
MetLife, Inc.
Notes to the Interim Condensed Consolidated Financial Statements (Unaudited) — (continued)
6. Investments (continued)
Unconsolidated VIEs
The carrying amount and maximum exposure to loss relating to VIEs in which the Company holds a significant variable interest but is not the primary beneficiary and which have not been consolidated were as follows at:
| September 30, 2022 | December 31, 2021 | |||||||||||||||||||||||||
| Asset Type |
Carrying
Amount |
Maximum
Exposure to Loss (1) |
Carrying
Amount |
Maximum
Exposure to Loss (1) |
||||||||||||||||||||||
| (In millions) | ||||||||||||||||||||||||||
| Fixed maturity securities AFS (2) | $ |
|
$ |
|
$ |
|
$ |
|
||||||||||||||||||
|
Other limited partnership interests
|
|
|
|
|
||||||||||||||||||||||
|
Other invested assets
|
|
|
|
|
||||||||||||||||||||||
|
Other investments
|
|
|
|
|
||||||||||||||||||||||
|
Total
|
$ |
|
$ |
|
$ |
|
$ |
|
||||||||||||||||||
__________________
(1)
The maximum exposure to loss relating to fixed maturity securities AFS is equal to their carrying amounts or the carrying amounts of retained interests. The maximum exposure to loss relating to other limited partnership interests is equal to the carrying amounts plus any unfunded commitments. For certain of its investments in other invested assets, the Company’s return is in the form of income tax credits which are guaranteed by creditworthy third parties. For such investments, the maximum exposure to loss is equal to the carrying amounts plus any unfunded commitments, reduced by income tax credits guaranteed by third parties of $
6
million and $
5
million at September 30, 2022 and December 31, 2021, respectively. Such a maximum loss would be expected to occur only upon bankruptcy of the issuer or investee.
(2)
For variable interests in Structured Products included within fixed maturity securities AFS, the Company’s involvement is limited to that of a passive investor in mortgage-backed or asset-backed securities issued by trusts that do not have substantial equity.
As described in Note 15, the Company makes commitments to fund partnership investments in the normal course of business. Excluding these commitments, the Company did not provide financial or other support to investees designated as VIEs for either the nine months ended September 30, 2022 or 2021.
39
MetLife, Inc.
Notes to the Interim Condensed Consolidated Financial Statements (Unaudited) — (continued)
6. Investments (continued)
Net Investment Income
The composition of net investment income by asset type was as follows:
|
Three Months
Ended September 30, |
Nine Months
Ended September 30, |
|||||||||||||||||||||||||
| Asset Type | 2022 | 2021 | 2022 | 2021 | ||||||||||||||||||||||
| (In millions) | ||||||||||||||||||||||||||
|
Fixed maturity securities AFS
|
$ |
|
$ |
|
$ |
|
$ |
|
||||||||||||||||||
|
Equity securities
|
|
|
|
|
||||||||||||||||||||||
| FVO Securities |
(
|
|
(
|
|
||||||||||||||||||||||
|
Mortgage loans
|
|
|
|
|
||||||||||||||||||||||
|
Policy loans
|
|
|
|
|
||||||||||||||||||||||
|
Real estate and real estate joint ventures
|
|
|
|
|
||||||||||||||||||||||
|
Other limited partnership interests
|
(
|
|
|
|
||||||||||||||||||||||
|
Cash, cash equivalents and short-term investments
|
|
|
|
|
||||||||||||||||||||||
|
Operating joint ventures
|
|
|
|
|
||||||||||||||||||||||
|
Other
|
|
|
|
|
||||||||||||||||||||||
| Subtotal investment income |
|
|
|
|
||||||||||||||||||||||
|
Less: Investment expenses
|
|
|
|
|
||||||||||||||||||||||
|
Subtotal, net
|
|
|
|
|
||||||||||||||||||||||
| Unit-linked investments |
(
|
|
(
|
|
||||||||||||||||||||||
|
Net investment income
|
$ |
|
$ |
|
$ |
|
$ |
|
||||||||||||||||||
Net investment income included realized and unrealized gains (losses) recognized in earnings of ($
373
) million and ($
1.7
) billion for the three months and nine months ended September 30, 2022, respectively, and $
137
million and $
811
million for the three months and nine months ended September 30, 2021, respectively. The amount includes realized gains (losses) on sales and disposals, primarily related to FVO securities (“FVO Securities”) and Unit-linked investments, of $
30
million and $
139
million for the three months and nine months ended September 30, 2022, respectively, and $
146
million and $
407
million for the three months and nine months ended September 30, 2021, respectively. The amount also includes unrealized gains (losses), representing changes in estimated fair value, recognized in earnings, primarily related to FVO Securities and Unit-linked investments, of ($
403
) million and ($
1.8
) billion for the three months and nine months ended September 30, 2022, respectively, and ($
9
) million and $
404
million for the three months and nine months ended September 30, 2021, respectively.
Changes in estimated fair value subsequent to purchase of FVO Securities and Unit-linked investments still held at the end of the respective periods and included in net investment income were ($
304
) million and ($
1.5
) billion for the three months and nine months ended September 30, 2022, respectively, and $
55
million and $
577
million for the three months and nine months ended September 30, 2021, respectively.
Net investment income from equity method investments, comprised primarily of real estate joint ventures, other limited partnership interests, tax credit and renewable energy partnerships and operating joint ventures, was ($
135
) million and $
1.3
billion for the three months and nine months ended September 30, 2022, respectively, and $
1.7
billion and $
4.0
billion for the three months and nine months ended September 30, 2021, respectively.
40
MetLife, Inc.
Notes to the Interim Condensed Consolidated Financial Statements (Unaudited) — (continued)
6. Investments (continued)
Net Investment Gains (Losses)
Net Investment Gains (Losses) by Asset Type and Transaction Type
The composition of net investment gains (losses) by asset type and transaction type was as follows:
|
Three Months
Ended September 30, |
Nine Months
Ended September 30, |
|||||||||||||||||||||||||
| Asset Type | 2022 | 2021 | 2022 | 2021 | ||||||||||||||||||||||
| (In millions) | ||||||||||||||||||||||||||
| Fixed maturity securities AFS | $ |
(
|
$ |
|
$ |
(
|
$ |
|
||||||||||||||||||
|
Equity securities
|
(
|
(
|
(
|
|
||||||||||||||||||||||
| Mortgage loans |
|
|
|
|
||||||||||||||||||||||
|
Real estate and real estate joint ventures (excluding changes in estimated fair value)
|
|
|
|
|
||||||||||||||||||||||
|
Other limited partnership interests (excluding changes in estimated fair value)
|
(
|
(
|
|
(
|
||||||||||||||||||||||
|
Other gains (losses)
|
|
|
|
|
||||||||||||||||||||||
|
Subtotal
|
(
|
|
(
|
|
||||||||||||||||||||||
| Change in estimated fair value of other limited partnership interests and real estate joint ventures |
(
|
|
(
|
|
||||||||||||||||||||||
|
Non-investment portfolio gains (losses)
|
(
|
(
|
(
|
|
||||||||||||||||||||||
|
Subtotal
|
(
|
(
|
(
|
|
||||||||||||||||||||||
| Net investment gains (losses) | $ |
(
|
$ |
(
|
$ |
(
|
$ |
|
||||||||||||||||||
| Transaction Type | ||||||||||||||||||||||||||
| Realized gains (losses) on investments sold or disposed | $ |
(
|
$ |
|
$ |
(
|
$ |
|
||||||||||||||||||
| Impairments |
(
|
(
|
(
|
(
|
||||||||||||||||||||||
| Recognized gains (losses): | ||||||||||||||||||||||||||
| Change in allowance for credit loss recognized in earnings |
|
|
(
|
|
||||||||||||||||||||||
| Unrealized net gains (losses) recognized in earnings |
(
|
|
(
|
|
||||||||||||||||||||||
| Total recognized gains (losses) |
|
|
(
|
|
||||||||||||||||||||||
| Non-investment portfolio gains (losses) |
(
|
(
|
(
|
|
||||||||||||||||||||||
| Net investment gains (losses) | $ |
(
|
$ |
(
|
$ |
(
|
$ |
|
||||||||||||||||||
Net realized investment gains (losses) of ($
222
) million and ($
769
) million for the three months and nine months ended September 30, 2022, respectively, and $
348
million and $
1.0
billion for the three months and nine months ended September 30, 2021, respectively, represent realized gains (losses) on sales and disposals from all invested asset classes, including realized gains (losses) on sales and disposals recognized in net investment income, primarily related to FVO Securities and Unit-linked investments.
Changes in estimated fair value subsequent to purchase of equity securities still held as of the end of the period included in net investment gains (losses) were ($
25
) million and ($
87
) million for the three months and nine months ended September 30, 2022, respectively, and ($
16
) million and $
86
million for the three months and nine months ended September 30, 2021, respectively.
Other gains (losses) included ($
15
) million and $
45
million reclassified from AOCI to earnings due to the sale of certain investments that were hedged in qualifying cash flow hedges for the three months and nine months ended September 30, 2022, respectively, and $
6
million and $
54
million for the three months and nine months ended September 30, 2021, respectively.
41
MetLife, Inc.
Notes to the Interim Condensed Consolidated Financial Statements (Unaudited) — (continued)
6. Investments (continued)
Net investment gains (losses) includes gains (losses) from foreign currency transactions of ($
67
) million and ($
81
) million for the three months and nine months ended September 30, 2022, respectively, and ($
23
) million and ($
4
) million for the three months and nine months ended September 30, 2021, respectively.
Non-investment portfolio gains (losses) for the nine months ended September 30, 2021, include a gain of $
1.4
billion on the disposition of Metropolitan Property and Casualty Insurance Company and certain of its wholly-owned subsidiaries (collectively, “MetLife P&C”). See Note 3 for information on non-investment portfolio losses relating to the disposition of MetLife Poland and Greece.
Fixed Maturity Securities AFS and Equity Securities – Composition of Net Investment Gains (Losses)
The composition of net investment gains (losses) for these securities is as follows:
|
Three Months
Ended September 30, |
Nine Months
Ended September 30, |
|||||||||||||||||||||||||
| Fixed Maturity Securities AFS | 2022 | 2021 | 2022 | 2021 | ||||||||||||||||||||||
| (In millions) | ||||||||||||||||||||||||||
|
Proceeds
|
$ |
|
$ |
|
$ |
|
$ |
|
||||||||||||||||||
|
Gross investment gains
|
$ |
|
$ |
|
$ |
|
$ |
|
||||||||||||||||||
| Gross investment (losses) |
(
|
(
|
(
|
(
|
||||||||||||||||||||||
| Realized gains (losses) on sales and disposals |
(
|
|
(
|
|
||||||||||||||||||||||
| Net credit loss (provision) release (change in ACL recognized in earnings) |
|
|
(
|
|
||||||||||||||||||||||
|
Impairment (loss)
|
(
|
(
|
(
|
(
|
||||||||||||||||||||||
| Net credit loss (provision) release and impairment (loss) |
|
|
(
|
(
|
||||||||||||||||||||||
| Net investment gains (losses) | $ |
(
|
$ |
|
$ |
(
|
$ |
|
||||||||||||||||||
|
Equity Securities
|
||||||||||||||||||||||||||
| Realized gains (losses) on sales and disposals | $ |
|
$ |
(
|
$ |
(
|
$ |
(
|
||||||||||||||||||
| Unrealized net gains (losses) recognized in earnings |
(
|
(
|
(
|
|
||||||||||||||||||||||
| Net investment gains (losses) | $ |
(
|
$ |
(
|
$ |
(
|
$ |
|
||||||||||||||||||
Accounting for Derivatives
See Note 1 of the Notes to the Consolidated Financial Statements included in the 2021 Annual Report for a description of the Company’s accounting policies for derivatives and Note 8 for information about the fair value hierarchy for derivatives.
Derivative Strategies
Types of Derivative Instruments and Derivative Strategies
•
Interest rate derivatives: swaps, total return swaps, caps, floors, futures, swaptions, forwards and synthetic guaranteed interest contracts (“GICs”);
•
Foreign currency exchange rate derivatives: swaps, forwards, options and exchange-traded futures;
•
Credit derivatives: purchased or written single name or index credit default swaps, and forwards; and
•
Equity derivatives: index options, variance swaps, exchange-traded futures and total return swaps.
42
MetLife, Inc.
Notes to the Interim Condensed Consolidated Financial Statements (Unaudited) — (continued)
7.
Derivat
ives (continued)
Primary Risks Managed by Derivatives
The following table presents the primary underlying risk exposure, gross notional amount and estimated fair value of the Company’s derivatives, excluding embedded derivatives, held at:
| September 30, 2022 | December 31, 2021 | |||||||||||||||||||||||||||||||||||||||||||
| Primary Underlying Risk Exposure |
Gross
Notional Amount |
Estimated Fair Value |
Gross
Notional Amount |
Estimated Fair Value | ||||||||||||||||||||||||||||||||||||||||
| Assets | Liabilities | Assets | Liabilities | |||||||||||||||||||||||||||||||||||||||||
| (In millions) | ||||||||||||||||||||||||||||||||||||||||||||
| Derivatives Designated as Hedging Instruments: | ||||||||||||||||||||||||||||||||||||||||||||
| Fair value hedges: | ||||||||||||||||||||||||||||||||||||||||||||
| Interest rate swaps | Interest rate | $ |
|
$ |
|
$ |
|
$ |
|
$ |
|
$ |
|
|||||||||||||||||||||||||||||||
| Foreign currency swaps | Foreign currency exchange rate |
|
|
|
|
|
|
|||||||||||||||||||||||||||||||||||||
| Foreign currency forwards | Foreign currency exchange rate |
|
|
|
|
|
|
|||||||||||||||||||||||||||||||||||||
| Subtotal |
|
|
|
|
|
|
||||||||||||||||||||||||||||||||||||||
| Cash flow hedges: | ||||||||||||||||||||||||||||||||||||||||||||
| Interest rate swaps | Interest rate |
|
|
|
|
|
|
|||||||||||||||||||||||||||||||||||||
| Interest rate forwards | Interest rate |
|
|
|
|
|
|
|||||||||||||||||||||||||||||||||||||
| Foreign currency swaps | Foreign currency exchange rate |
|
|
|
|
|
|
|||||||||||||||||||||||||||||||||||||
| Subtotal |
|
|
|
|
|
|
||||||||||||||||||||||||||||||||||||||
|
Net investment in a foreign operation (“NIFO”) hedges:
|
||||||||||||||||||||||||||||||||||||||||||||
| Foreign currency forwards | Foreign currency exchange rate |
|
|
|
|
|
|
|||||||||||||||||||||||||||||||||||||
| Currency options | Foreign currency exchange rate |
|
|
|
|
|
|
|||||||||||||||||||||||||||||||||||||
| Subtotal |
|
|
|
|
|
|
||||||||||||||||||||||||||||||||||||||
| Total qualifying hedges |
|
|
|
|
|
|
||||||||||||||||||||||||||||||||||||||
| Derivatives Not Designated or Not Qualifying as Hedging Instruments: | ||||||||||||||||||||||||||||||||||||||||||||
| Interest rate swaps | Interest rate |
|
|
|
|
|
|
|||||||||||||||||||||||||||||||||||||
| Interest rate floors | Interest rate |
|
|
|
|
|
|
|||||||||||||||||||||||||||||||||||||
| Interest rate caps | Interest rate |
|
|
|
|
|
|
|||||||||||||||||||||||||||||||||||||
| Interest rate futures | Interest rate |
|
|
|
|
|
|
|||||||||||||||||||||||||||||||||||||
| Interest rate options | Interest rate |
|
|
|
|
|
|
|||||||||||||||||||||||||||||||||||||
| Interest rate forwards | Interest rate |
|
|
|
|
|
|
|||||||||||||||||||||||||||||||||||||
| Interest rate total return swaps | Interest rate |
|
|
|
|
|
|
|||||||||||||||||||||||||||||||||||||
| Synthetic GICs | Interest rate |
|
|
|
|
|
|
|||||||||||||||||||||||||||||||||||||
| Foreign currency swaps | Foreign currency exchange rate |
|
|
|
|
|
|
|||||||||||||||||||||||||||||||||||||
| Foreign currency forwards | Foreign currency exchange rate |
|
|
|
|
|
|
|||||||||||||||||||||||||||||||||||||
| Currency futures | Foreign currency exchange rate |
|
|
|
|
|
|
|||||||||||||||||||||||||||||||||||||
| Currency options | Foreign currency exchange rate |
|
|
|
|
|
|
|||||||||||||||||||||||||||||||||||||
| Credit default swaps — purchased | Credit |
|
|
|
|
|
|
|||||||||||||||||||||||||||||||||||||
| Credit default swaps — written | Credit |
|
|
|
|
|
|
|||||||||||||||||||||||||||||||||||||
| Equity futures | Equity market |
|
|
|
|
|
|
|||||||||||||||||||||||||||||||||||||
| Equity index options | Equity market |
|
|
|
|
|
|
|||||||||||||||||||||||||||||||||||||
| Equity variance swaps | Equity market |
|
|
|
|
|
|
|||||||||||||||||||||||||||||||||||||
| Equity total return swaps | Equity market |
|
|
|
|
|
|
|||||||||||||||||||||||||||||||||||||
| Total non-designated or nonqualifying derivatives |
|
|
|
|
|
|
||||||||||||||||||||||||||||||||||||||
| Total | $ |
|
$ |
|
$ |
|
$ |
|
$ |
|
$ |
|
||||||||||||||||||||||||||||||||
43
MetLife, Inc.
Notes to the Interim Condensed Consolidated Financial Statements (Unaudited) — (continued)
7.
Derivat
ives (continued)
44
MetLife, Inc.
Notes to the Interim Condensed Consolidated Financial Statements (Unaudited) — (continued)
7.
Derivat
ives (continued)
| Three Months Ended September 30, 2022 | ||||||||||||||||||||||||||||||||||||||||||||
|
Net
Investment
Income
|
Net
Investment
Gains
(Losses)
|
Net
Derivative
Gains
(Losses)
|
Policyholder
Benefits and
Claims
|
Interest
Credited to
Policyholder
Account
Balances
|
Other
Expenses
|
OCI | ||||||||||||||||||||||||||||||||||||||
| (In millions) | ||||||||||||||||||||||||||||||||||||||||||||
| Gain (Loss) on Fair Value Hedges: | ||||||||||||||||||||||||||||||||||||||||||||
| Interest rate derivatives: | ||||||||||||||||||||||||||||||||||||||||||||
| Derivatives designated as hedging instruments (1) | $ |
|
$ |
|
$ |
|
$ |
(
|
$ |
(
|
$ |
|
N/A | |||||||||||||||||||||||||||||||
| Hedged items |
(
|
|
|
|
|
|
N/A | |||||||||||||||||||||||||||||||||||||
| Foreign currency exchange rate derivatives: | ||||||||||||||||||||||||||||||||||||||||||||
| Derivatives designated as hedging instruments (1) |
|
(
|
|
|
|
|
N/A | |||||||||||||||||||||||||||||||||||||
| Hedged items |
(
|
|
|
|
|
|
N/A | |||||||||||||||||||||||||||||||||||||
| Amount excluded from the assessment of hedge effectiveness |
|
|
|
|
|
|
N/A | |||||||||||||||||||||||||||||||||||||
|
Subtotal
|
|
|
|
(
|
(
|
|
N/A | |||||||||||||||||||||||||||||||||||||
| Gain (Loss) on Cash Flow Hedges: | ||||||||||||||||||||||||||||||||||||||||||||
|
Interest rate derivatives: (1)
|
||||||||||||||||||||||||||||||||||||||||||||
| Amount of gains (losses) deferred in AOCI | N/A | N/A | N/A | N/A | N/A | N/A | $ |
(
|
||||||||||||||||||||||||||||||||||||
| Amount of gains (losses) reclassified from AOCI into income |
|
(
|
|
|
|
|
|
|||||||||||||||||||||||||||||||||||||
| Foreign currency exchange rate derivatives: (1) | ||||||||||||||||||||||||||||||||||||||||||||
| Amount of gains (losses) deferred in AOCI | N/A | N/A | N/A | N/A | N/A | N/A |
|
|||||||||||||||||||||||||||||||||||||
| Amount of gains (losses) reclassified from AOCI into income |
|
(
|
|
|
|
|
|
|||||||||||||||||||||||||||||||||||||
| Foreign currency transaction gains (losses) on hedged items |
|
|
|
|
|
|
|
|||||||||||||||||||||||||||||||||||||
|
Credit derivatives: (1)
|
||||||||||||||||||||||||||||||||||||||||||||
| Amount of gains (losses) deferred in AOCI | N/A | N/A | N/A | N/A | N/A | N/A |
|
|||||||||||||||||||||||||||||||||||||
| Amount of gains (losses) reclassified from AOCI into income |
|
|
|
|
|
|
|
|||||||||||||||||||||||||||||||||||||
|
Subtotal
|
|
(
|
|
|
|
|
|
|||||||||||||||||||||||||||||||||||||
| Gain (Loss) on NIFO Hedges: | ||||||||||||||||||||||||||||||||||||||||||||
| Foreign currency exchange rate derivatives (1) | N/A | N/A | N/A | N/A | N/A | N/A |
|
|||||||||||||||||||||||||||||||||||||
| Non-derivative hedging instruments | N/A | N/A | N/A | N/A | N/A | N/A |
|
|||||||||||||||||||||||||||||||||||||
|
Subtotal
|
N/A | N/A | N/A | N/A | N/A | N/A |
|
|||||||||||||||||||||||||||||||||||||
|
Gain (Loss) on Derivatives Not Designated or Not Qualifying as Hedging Instruments:
|
||||||||||||||||||||||||||||||||||||||||||||
| Interest rate derivatives (1) |
|
|
(
|
(
|
|
|
N/A | |||||||||||||||||||||||||||||||||||||
| Foreign currency exchange rate derivatives (1) |
|
|
(
|
(
|
|
|
N/A | |||||||||||||||||||||||||||||||||||||
| Credit derivatives — purchased (1) |
|
|
|
|
|
|
N/A | |||||||||||||||||||||||||||||||||||||
| Credit derivatives — written (1) |
|
|
|
|
|
|
N/A | |||||||||||||||||||||||||||||||||||||
| Equity derivatives (1) |
|
|
|
|
|
|
N/A | |||||||||||||||||||||||||||||||||||||
| Foreign currency transaction gains (losses) on hedged items |
|
|
(
|
|
|
|
N/A | |||||||||||||||||||||||||||||||||||||
|
Subtotal
|
|
|
(
|
|
|
|
N/A | |||||||||||||||||||||||||||||||||||||
| Earned income on derivatives |
|
|
|
|
(
|
|
|
|||||||||||||||||||||||||||||||||||||
| Embedded derivatives (2) | N/A | N/A |
(
|
|
N/A | N/A | N/A | |||||||||||||||||||||||||||||||||||||
|
Total
|
$ |
|
$ |
(
|
$ |
(
|
$ |
|
$ |
(
|
$ |
|
$ |
|
||||||||||||||||||||||||||||||
45
MetLife, Inc.
Notes to the Interim Condensed Consolidated Financial Statements (Unaudited) — (continued)
7.
Derivat
ives (continued)
|
Three Months Ended September 30, 2021
|
||||||||||||||||||||||||||||||||||||||||||||
|
Net
Investment
Income
|
Net
Investment
Gains
(Losses)
|
Net
Derivative
Gains
(Losses)
|
Policyholder
Benefits and
Claims
|
Interest
Credited to
Policyholder
Account
Balances
|
Other
Expenses
|
OCI | ||||||||||||||||||||||||||||||||||||||
| (In millions) | ||||||||||||||||||||||||||||||||||||||||||||
| Gain (Loss) on Fair Value Hedges: | ||||||||||||||||||||||||||||||||||||||||||||
| Interest rate derivatives: | ||||||||||||||||||||||||||||||||||||||||||||
| Derivatives designated as hedging instruments (1) | $ |
|
$ |
|
$ |
|
$ |
(
|
$ |
|
$ |
|
N/A | |||||||||||||||||||||||||||||||
| Hedged items |
(
|
|
|
|
|
|
N/A | |||||||||||||||||||||||||||||||||||||
| Foreign currency exchange rate derivatives: | ||||||||||||||||||||||||||||||||||||||||||||
| Derivatives designated as hedging instruments (1) |
|
(
|
|
|
|
|
N/A | |||||||||||||||||||||||||||||||||||||
| Hedged items |
(
|
|
|
|
|
|
N/A | |||||||||||||||||||||||||||||||||||||
| Amount excluded from the assessment of hedge effectiveness |
|
(
|
|
|
|
|
N/A | |||||||||||||||||||||||||||||||||||||
|
Subtotal
|
|
(
|
|
(
|
|
|
N/A | |||||||||||||||||||||||||||||||||||||
| Gain (Loss) on Cash Flow Hedges: | ||||||||||||||||||||||||||||||||||||||||||||
|
Interest rate derivatives: (1)
|
||||||||||||||||||||||||||||||||||||||||||||
| Amount of gains (losses) deferred in AOCI | N/A | N/A | N/A | N/A | N/A | N/A | $ |
|
||||||||||||||||||||||||||||||||||||
| Amount of gains (losses) reclassified from AOCI into income |
|
|
|
|
|
|
(
|
|||||||||||||||||||||||||||||||||||||
| Foreign currency exchange rate derivatives: (1) | ||||||||||||||||||||||||||||||||||||||||||||
| Amount of gains (losses) deferred in AOCI | N/A | N/A | N/A | N/A | N/A | N/A |
|
|||||||||||||||||||||||||||||||||||||
| Amount of gains (losses) reclassified from AOCI into income |
|
(
|
|
|
|
|
|
|||||||||||||||||||||||||||||||||||||
| Foreign currency transaction gains (losses) on hedged items |
|
|
|
|
|
|
|
|||||||||||||||||||||||||||||||||||||
|
Credit derivatives: (1)
|
||||||||||||||||||||||||||||||||||||||||||||
| Amount of gains (losses) deferred in AOCI | N/A | N/A | N/A | N/A | N/A | N/A |
|
|||||||||||||||||||||||||||||||||||||
| Amount of gains (losses) reclassified from AOCI into income |
|
|
|
|
|
|
|
|||||||||||||||||||||||||||||||||||||
|
Subtotal
|
|
|
|
|
|
|
|
|||||||||||||||||||||||||||||||||||||
| Gain (Loss) on NIFO Hedges: | ||||||||||||||||||||||||||||||||||||||||||||
| Foreign currency exchange rate derivatives (1) | N/A | N/A | N/A | N/A | N/A | N/A |
|
|||||||||||||||||||||||||||||||||||||
| Non-derivative hedging instruments | N/A | N/A | N/A | N/A | N/A | N/A |
|
|||||||||||||||||||||||||||||||||||||
|
Subtotal
|
N/A | N/A | N/A | N/A | N/A | N/A |
|
|||||||||||||||||||||||||||||||||||||
|
Gain (Loss) on Derivatives Not Designated or Not Qualifying as Hedging Instruments:
|
||||||||||||||||||||||||||||||||||||||||||||
| Interest rate derivatives (1) |
(
|
|
(
|
(
|
|
|
N/A | |||||||||||||||||||||||||||||||||||||
| Foreign currency exchange rate derivatives (1) |
|
|
(
|
(
|
|
|
N/A | |||||||||||||||||||||||||||||||||||||
| Credit derivatives — purchased (1) |
|
|
|
|
|
|
N/A | |||||||||||||||||||||||||||||||||||||
| Credit derivatives — written (1) |
|
|
(
|
|
|
|
N/A | |||||||||||||||||||||||||||||||||||||
| Equity derivatives (1) |
(
|
|
|
|
|
|
N/A | |||||||||||||||||||||||||||||||||||||
| Foreign currency transaction gains (losses) on hedged items |
|
|
(
|
|
|
|
N/A | |||||||||||||||||||||||||||||||||||||
|
Subtotal
|
(
|
|
(
|
(
|
|
|
N/A | |||||||||||||||||||||||||||||||||||||
| Earned income on derivatives |
|
|
|
|
(
|
|
|
|||||||||||||||||||||||||||||||||||||
| Embedded derivatives (2) | N/A | N/A |
|
|
N/A | N/A | N/A | |||||||||||||||||||||||||||||||||||||
|
Total
|
$ |
|
$ |
|
$ |
(
|
$ |
|
$ |
(
|
$ |
|
$ |
|
||||||||||||||||||||||||||||||
46
MetLife, Inc.
Notes to the Interim Condensed Consolidated Financial Statements (Unaudited) — (continued)
7.
Derivat
ives (continued)
| Nine Months Ended September 30, 2022 | ||||||||||||||||||||||||||||||||||||||||||||
|
Net
Investment Income |
Net
Investment Gains (Losses) |
Net
Derivative Gains (Losses) |
Policyholder
Benefits and Claims |
Interest
Credited to Policyholder Account Balances |
Other
Expenses |
OCI | ||||||||||||||||||||||||||||||||||||||
| (In millions) | ||||||||||||||||||||||||||||||||||||||||||||
|
Gain (Loss) on Fair Value Hedges:
|
||||||||||||||||||||||||||||||||||||||||||||
| Interest rate derivatives: | ||||||||||||||||||||||||||||||||||||||||||||
|
Derivatives designated as hedging instruments (1)
|
$ |
|
$ |
|
$ |
|
$ |
(
|
$ |
(
|
$ |
|
N/A | |||||||||||||||||||||||||||||||
|
Hedged items
|
(
|
|
|
|
|
|
N/A | |||||||||||||||||||||||||||||||||||||
|
Foreign currency exchange rate derivatives:
|
||||||||||||||||||||||||||||||||||||||||||||
|
Derivatives designated as hedging instruments (1)
|
|
(
|
|
|
|
|
N/A | |||||||||||||||||||||||||||||||||||||
|
Hedged items
|
(
|
|
|
|
|
|
N/A | |||||||||||||||||||||||||||||||||||||
|
Amount excluded from the assessment of hedge effectiveness
|
|
|
|
|
|
|
N/A | |||||||||||||||||||||||||||||||||||||
|
Subtotal
|
|
|
|
(
|
(
|
|
N/A | |||||||||||||||||||||||||||||||||||||
| Gain (Loss) on Cash Flow Hedges: | ||||||||||||||||||||||||||||||||||||||||||||
|
Interest rate derivatives: (1)
|
||||||||||||||||||||||||||||||||||||||||||||
|
Amount of gains (losses) deferred in AOCI
|
N/A | N/A | N/A | N/A | N/A | N/A | $ |
(
|
||||||||||||||||||||||||||||||||||||
|
Amount of gains (losses) reclassified from AOCI into income
|
|
|
|
|
|
|
(
|
|||||||||||||||||||||||||||||||||||||
| Foreign currency exchange rate derivatives: (1) | ||||||||||||||||||||||||||||||||||||||||||||
|
Amount of gains (losses) deferred in AOCI
|
N/A | N/A | N/A | N/A | N/A | N/A |
|
|||||||||||||||||||||||||||||||||||||
|
Amount of gains (losses) reclassified from AOCI into income
|
|
(
|
|
|
|
|
|
|||||||||||||||||||||||||||||||||||||
|
Foreign currency transaction gains (losses) on hedged items
|
|
|
|
|
|
|
|
|||||||||||||||||||||||||||||||||||||
|
Credit derivatives: (1)
|
||||||||||||||||||||||||||||||||||||||||||||
|
Amount of gains (losses) deferred in AOCI
|
N/A | N/A | N/A | N/A | N/A | N/A |
|
|||||||||||||||||||||||||||||||||||||
|
Amount of gains (losses) reclassified from AOCI into income
|
|
|
|
|
|
|
|
|||||||||||||||||||||||||||||||||||||
|
Subtotal
|
|
|
|
|
|
|
|
|||||||||||||||||||||||||||||||||||||
|
Gain (Loss) on NIFO Hedges:
|
||||||||||||||||||||||||||||||||||||||||||||
| Foreign currency exchange rate derivatives (1) | N/A | N/A | N/A | N/A | N/A | N/A |
|
|||||||||||||||||||||||||||||||||||||
| Non-derivative hedging instruments | N/A | N/A | N/A | N/A | N/A | N/A |
|
|||||||||||||||||||||||||||||||||||||
|
Subtotal
|
N/A | N/A | N/A | N/A | N/A | N/A |
|
|||||||||||||||||||||||||||||||||||||
|
Gain (Loss) on Derivatives Not Designated or Not Qualifying as Hedging Instruments:
|
||||||||||||||||||||||||||||||||||||||||||||
|
Interest rate derivatives (1)
|
|
|
(
|
(
|
|
|
N/A | |||||||||||||||||||||||||||||||||||||
|
Foreign currency exchange rate derivatives (1)
|
|
|
(
|
(
|
|
|
N/A | |||||||||||||||||||||||||||||||||||||
|
Credit derivatives — purchased (1)
|
|
|
|
|
|
|
N/A | |||||||||||||||||||||||||||||||||||||
|
Credit derivatives — written (1)
|
|
|
(
|
|
|
|
N/A | |||||||||||||||||||||||||||||||||||||
|
Equity derivatives (1)
|
|
|
|
|
|
|
N/A | |||||||||||||||||||||||||||||||||||||
|
Foreign currency transaction gains (losses) on hedged items
|
|
|
|
|
|
|
N/A | |||||||||||||||||||||||||||||||||||||
|
Subtotal
|
|
|
(
|
|
|
|
N/A | |||||||||||||||||||||||||||||||||||||
|
Earned income on derivatives
|
|
|
|
|
(
|
|
|
|||||||||||||||||||||||||||||||||||||
|
Embedded derivatives (2)
|
N/A | N/A |
(
|
|
N/A | N/A | N/A | |||||||||||||||||||||||||||||||||||||
|
Total
|
$ |
|
$ |
|
$ |
(
|
$ |
|
$ |
(
|
$ |
|
$ |
|
||||||||||||||||||||||||||||||
47
MetLife, Inc.
Notes to the Interim Condensed Consolidated Financial Statements (Unaudited) — (continued)
7.
Derivat
ives (continued)
| Nine Months Ended September 30, 2021 | ||||||||||||||||||||||||||||||||||||||||||||
|
Net
Investment
Income
|
Net
Investment
Gains
(Losses)
|
Net
Derivative
Gains
(Losses)
|
Policyholder
Benefits and
Claims
|
Interest
Credited to
Policyholder
Account
Balances
|
Other
Expenses
|
OCI | ||||||||||||||||||||||||||||||||||||||
| (In millions) | ||||||||||||||||||||||||||||||||||||||||||||
|
Gain (Loss) on Fair Value Hedges:
|
||||||||||||||||||||||||||||||||||||||||||||
| Interest rate derivatives: | ||||||||||||||||||||||||||||||||||||||||||||
|
Derivatives designated as hedging instruments (1)
|
$ |
|
$ |
|
$ |
|
$ |
(
|
$ |
|
$ |
|
N/A | |||||||||||||||||||||||||||||||
|
Hedged items
|
(
|
|
|
|
|
|
N/A | |||||||||||||||||||||||||||||||||||||
|
Foreign currency exchange rate derivatives:
|
||||||||||||||||||||||||||||||||||||||||||||
|
Derivatives designated as hedging instruments (1)
|
|
(
|
|
|
|
|
N/A | |||||||||||||||||||||||||||||||||||||
|
Hedged items
|
(
|
|
|
|
|
|
N/A | |||||||||||||||||||||||||||||||||||||
|
Amount excluded from the assessment of hedge effectiveness
|
|
(
|
|
|
|
|
N/A | |||||||||||||||||||||||||||||||||||||
|
Subtotal
|
|
(
|
|
(
|
|
|
N/A | |||||||||||||||||||||||||||||||||||||
| Gain (Loss) on Cash Flow Hedges: | ||||||||||||||||||||||||||||||||||||||||||||
|
Interest rate derivatives: (1)
|
||||||||||||||||||||||||||||||||||||||||||||
|
Amount of gains (losses) deferred in AOCI
|
N/A | N/A | N/A | N/A | N/A | N/A | $ |
(
|
||||||||||||||||||||||||||||||||||||
|
Amount of gains (losses) reclassified from AOCI into income
|
|
|
|
|
|
|
(
|
|||||||||||||||||||||||||||||||||||||
| Foreign currency exchange rate derivatives: (1) | ||||||||||||||||||||||||||||||||||||||||||||
|
Amount of gains (losses) deferred in AOCI
|
N/A | N/A | N/A | N/A | N/A | N/A |
|
|||||||||||||||||||||||||||||||||||||
|
Amount of gains (losses) reclassified from AOCI into income
|
|
(
|
|
|
|
|
|
|||||||||||||||||||||||||||||||||||||
|
Foreign currency transaction gains (losses) on hedged items
|
|
|
|
|
|
|
|
|||||||||||||||||||||||||||||||||||||
|
Credit derivatives: (1)
|
||||||||||||||||||||||||||||||||||||||||||||
|
Amount of gains (losses) deferred in AOCI
|
N/A | N/A | N/A | N/A | N/A | N/A |
(
|
|||||||||||||||||||||||||||||||||||||
|
Amount of gains (losses) reclassified from AOCI into income
|
|
|
|
|
|
|
|
|||||||||||||||||||||||||||||||||||||
|
Subtotal
|
|
|
|
|
|
|
|
|||||||||||||||||||||||||||||||||||||
|
Gain (Loss) on NIFO Hedges:
|
||||||||||||||||||||||||||||||||||||||||||||
| Foreign currency exchange rate derivatives (1) | N/A | N/A | N/A | N/A | N/A | N/A |
|
|||||||||||||||||||||||||||||||||||||
| Non-derivative hedging instruments | N/A | N/A | N/A | N/A | N/A | N/A |
|
|||||||||||||||||||||||||||||||||||||
|
Subtotal
|
N/A | N/A | N/A | N/A | N/A | N/A |
|
|||||||||||||||||||||||||||||||||||||
|
Gain (Loss) on Derivatives Not Designated or Not Qualifying as Hedging Instruments:
|
||||||||||||||||||||||||||||||||||||||||||||
|
Interest rate derivatives (1)
|
|
|
(
|
(
|
|
|
N/A | |||||||||||||||||||||||||||||||||||||
|
Foreign currency exchange rate derivatives (1)
|
|
|
(
|
|
|
|
N/A | |||||||||||||||||||||||||||||||||||||
|
Credit derivatives — purchased (1)
|
|
|
|
|
|
|
N/A | |||||||||||||||||||||||||||||||||||||
|
Credit derivatives — written (1)
|
|
|
|
|
|
|
N/A | |||||||||||||||||||||||||||||||||||||
|
Equity derivatives (1)
|
(
|
|
(
|
(
|
|
|
N/A | |||||||||||||||||||||||||||||||||||||
|
Foreign currency transaction gains (losses) on hedged items
|
|
|
|
|
|
|
N/A | |||||||||||||||||||||||||||||||||||||
|
Subtotal
|
(
|
|
(
|
(
|
|
|
N/A | |||||||||||||||||||||||||||||||||||||
|
Earned income on derivatives
|
|
|
|
|
(
|
|
|
|||||||||||||||||||||||||||||||||||||
|
Embedded derivatives (2)
|
N/A | N/A |
|
|
N/A | N/A | N/A | |||||||||||||||||||||||||||||||||||||
|
Total
|
$ |
|
$ |
|
$ |
(
|
$ |
(
|
$ |
(
|
$ |
|
$ |
|
||||||||||||||||||||||||||||||
__________________
(1)
Excludes earned income on derivatives.
(2)
The valuation of guaranteed minimum benefits includes a nonperformanc
e risk adjustment. The amounts included in net derivative gains (losses) in connection with this adjustment were $
39
million and $
43
million for
the three months and nine months ended September 30, 2022, respectively, and $
3
million and ($
48
) million for the three months and nine months ended September 30, 2021, respectively.
48
MetLife, Inc.
Notes to the Interim Condensed Consolidated Financial Statements (Unaudited) — (continued)
7.
Derivat
ives (continued)
Fair Value Hedges
The following table presents the balance sheet classification, carrying amount and cumulative fair value hedging adjustments for items designated and qualifying as hedged items in fair value hedges:
| Balance Sheet Line Item |
Carrying Amount
of the Hedged Assets/(Liabilities) |
Cumulative Amount
of Fair Value Hedging Adjustments Included in the Carrying Amount of Hedged Assets/(Liabilities) (1) |
||||||||||||||||||||||||
| September 30, 2022 | December 31, 2021 | September 30, 2022 | December 31, 2021 | |||||||||||||||||||||||
| (In millions) | ||||||||||||||||||||||||||
| Fixed maturity securities AFS | $ |
|
$ |
|
$ |
|
$ |
(
|
||||||||||||||||||
| Mortgage loans | $ |
|
$ |
|
$ |
(
|
$ |
|
||||||||||||||||||
| Future policy benefits | $ |
(
|
$ |
(
|
$ |
|
$ |
(
|
||||||||||||||||||
| Policyholder account balances | $ |
(
|
$ |
|
$ |
|
$ |
|
||||||||||||||||||
__________________
(1)
Includ
es ($
142
) million
and ($
161
) million of hedging adjustments on discontinued hedging relationships at September 30, 2022 and December 31, 2021, respectively.
For the Company’s foreign currency forwards, the change in the estimated fair value of the derivative related to the changes in the difference between the spot price and the forward price is excluded from the assessment of hedge effectiveness. The Company has elected to record changes in estimated fair value of excluded components in earnings. For all other derivatives, all components of each derivative’s gain or loss were included in the assessment of hedge effectiveness.
Cash Flow Hedges
In certain instances, the Company discontinued cash flow hedge accounting because the forecasted transactions were no longer probable of occurring. Because certain of the forecasted transactions also were not probable of occurring within two months of the anticipated date, the Company reclassified amounts from AOCI into income. These amounts were $
19
million and $
21
million for the three months and nine months ended September 30, 2022, respectively, and $
6
million and $
5
million for the three months and nine months ended September 30, 2021, respectively.
At both September 30, 2022 and December 31, 2021, the maximum length of time over which the Company was hedging its exposure to variability in future cash flows for forecasted transactions did not exceed
seven years
.
At September 30, 2022 and December 31, 2021, the balance in AOCI associated with cash flow hedges was $
3.9
billion and $
2.1
billion, respectively.
All components of each derivative’s gain or loss were included in the assessment of hedge effectiveness.
At September 30, 2022, the Company expected to reclassify $
372
million of deferred net gains (losses) on derivatives in AOCI to earnings within the next 12 months.
49
MetLife, Inc.
Notes to the Interim Condensed Consolidated Financial Statements (Unaudited) — (continued)
7.
Derivat
ives (continued)
NIFO Hedges
The Company uses foreign currency exchange rate derivatives, which may include foreign currency forwards and currency options, to hedge portions of its net investments in foreign operations against adverse movements in exchange rates. The Company also designates a portion of its foreign-denominated debt as a non-derivative hedging instrument of its net investments in foreign operations. The Company assesses hedge effectiveness of its derivatives based upon the change in forward rates and assesses its non-derivative hedging instruments based upon the change in spot rates. All components of ea
ch derivative’s gain or loss were included in the assessment of hedge effectiveness.
When net investments in foreign operations are sold or substantially liquidated, the amounts in AOCI are reclassified to the statement of operations.
Credit Derivatives
In connection with synthetically created credit investment transactions, the Company writes credit default swaps for which it receives a premium to insure credit risk. Such credit derivatives are included within the effects of derivatives on the interim condensed consolidated statements of operations and comprehensive income (loss) table. If a credit event occurs, as defined by the contract, the contract may be cash settled or it may be settled gross by the Company paying the counterparty the specified swap notional amount in exchange for the delivery of par quantities of the referenced credit obligation. The Company can terminate these contracts at any time through cash settlement with the counterparty at an amount equal to the then current estimated fair value of the credit default swaps.
50
MetLife, Inc.
Notes to the Interim Condensed Consolidated Financial Statements (Unaudited) — (continued)
7.
Derivat
ives (continued)
The following table presents the estimated fair value, maximum amount of future payments and weighted average years to maturity of written credit default swaps at:
| September 30, 2022 | December 31, 2021 | |||||||||||||||||||||||||||||||||||||
|
Rating Agency Designation of Referenced
Credit Obligations (1) |
Estimated
Fair Value of Credit Default Swaps |
Maximum
Amount of Future Payments under Credit Default Swaps |
Weighted
Average Years to Maturity (2) |
Estimated
Fair Value of Credit Default Swaps |
Maximum
Amount of Future Payments under Credit Default Swaps |
Weighted
Average Years to Maturity (2) |
||||||||||||||||||||||||||||||||
| (Dollars in millions) | ||||||||||||||||||||||||||||||||||||||
|
Aaa/Aa/A
|
||||||||||||||||||||||||||||||||||||||
|
Single name credit default swaps (3)
|
$ |
|
$ |
|
|
$ |
|
$ |
|
|
||||||||||||||||||||||||||||
|
Credit default swaps referencing indices
|
|
|
|
|
|
|
||||||||||||||||||||||||||||||||
|
Subtotal
|
|
|
|
|
|
|
||||||||||||||||||||||||||||||||
|
Baa
|
||||||||||||||||||||||||||||||||||||||
|
Single name credit default swaps (3)
|
|
|
|
|
|
|
||||||||||||||||||||||||||||||||
|
Credit default swaps referencing indices
|
(
|
|
|
|
|
|
||||||||||||||||||||||||||||||||
|
Subtotal
|
(
|
|
|
|
|
|
||||||||||||||||||||||||||||||||
|
Ba
|
||||||||||||||||||||||||||||||||||||||
|
Single name credit default swaps (3)
|
|
|
|
|
|
|
||||||||||||||||||||||||||||||||
|
Credit default swaps referencing indices
|
|
|
|
(
|
|
|
||||||||||||||||||||||||||||||||
|
Subtotal
|
|
|
|
|
|
|
||||||||||||||||||||||||||||||||
|
B
|
||||||||||||||||||||||||||||||||||||||
|
Credit default swaps referencing indices
|
|
|
|
|
|
|
||||||||||||||||||||||||||||||||
|
Subtotal
|
|
|
|
|
|
|
||||||||||||||||||||||||||||||||
| Caa3 | ||||||||||||||||||||||||||||||||||||||
|
Credit default swaps referencing indices
|
(
|
|
|
(
|
|
|
||||||||||||||||||||||||||||||||
|
Subtotal
|
(
|
|
|
(
|
|
|
||||||||||||||||||||||||||||||||
|
Total
|
$ |
(
|
$ |
|
|
$ |
|
$ |
|
|
||||||||||||||||||||||||||||
_________________
(1)
The rating agency designations are based on availability and the midpoint of the applicable ratings among Moody’s Investors Service (“Moody’s”), S&P Global Ratings (“S&P”) and Fitch Ratings. If no rating is available from a rating agency, then an internally developed rating is used.
(2)
The weighted average years to maturity of the credit default swaps is calculated based on weighted average gross notional amounts.
(3)
Single name credit default swaps may be referenced to the credit of corporations, foreign governments, or municipals.
Credit Risk on Freestanding Derivatives
The Company may be exposed to credit-related losses in the event of nonperformance by its counterparties to derivatives. Generally, the current credit exposure of the Company’s derivatives is limited to the net positive estimated fair value of derivatives at the reporting date after taking into consideration the existence of master netting or similar agreements and any collateral received pursuant to such agreements.
Derivatives may be exchange-traded or contracted in the over-the-counter (“OTC”) market. Certain of the Company’s OTC derivatives are cleared and settled through central clearinghouses (“OTC-cleared”), while others are bilateral contracts between two counterparties (“OTC-bilateral”).
The Company manages its credit risk related to derivatives by entering into transactions with creditworthy counterparties in jurisdictions in which it understands that close-out netting should be enforceable and establishing and monitoring exposure limits. The Company’s OTC-bilateral derivative transactions are governed by International Swaps and Derivatives
51
MetLife, Inc.
Notes to the Interim Condensed Consolidated Financial Statements (Unaudited) — (continued)
7.
Derivat
ives (continued)
Association, Inc. (“ISDA”) Master Agreements which provide for legally enforceable set-off and close-out netting of exposures to specific counterparties in the event of early termination of a transaction, which includes, but is not limited to, events of default and bankruptcy. In the event of an early termination, close-out netting permits the Company (subject to financial regulations such as the Orderly Liquidation Authority under Title II of Dodd-Frank) to set off receivables from the counterparty against payables to the same counterparty arising out of all included transactions and to apply collateral to the obligations, without application of the automatic stay, upon the counterparty’s bankruptcy. All of the Company’s ISDA Master Agreements also include Credit Support Annex provisions which require both the pledging and accepting of collateral in connection with its OTC-bilateral derivatives as required by applicable law. Additionally, effective September 1, 2021, the Company is required to pledge initial margin for certain new OTC-bilateral derivative transactions to third party custodians.
The Company’s OTC-cleared derivatives are effected through central clearing counterparties and its exchange-traded derivatives are effected through regulated exchanges. Such positions are marked to market and margined on a daily basis (both initial margin and variation margin), and the Company has minimal exposure to credit-related losses in the event of nonperformance by brokers and central clearinghouses to such derivatives.
See Note 8 for
a
description of the impact of credit risk on the valuation of derivatives.
The estimated fair values of the Company’s net derivative assets and net derivative liabilities after the application of master netting agreements and collateral were as follows at:
| September 30, 2022 | December 31, 2021 | |||||||||||||||||||||||||
| Derivatives Subject to a Master Netting Arrangement or a Similar Arrangement | Assets | Liabilities | Assets | Liabilities | ||||||||||||||||||||||
| (In millions) | ||||||||||||||||||||||||||
|
Gross estimated fair value of derivatives:
|
||||||||||||||||||||||||||
|
OTC-bilateral (1)
|
$ |
|
$ |
|
$ |
|
$ |
|
||||||||||||||||||
|
OTC-cleared (1)
|
|
|
|
|
||||||||||||||||||||||
|
Exchange-traded
|
|
|
|
|
||||||||||||||||||||||
|
Total gross estimated fair value of derivatives presented on the interim condensed consolidated balance sheets (1)
|
|
|
|
|
||||||||||||||||||||||
|
Gross amounts not offset on the interim condensed consolidated balance sheets:
|
||||||||||||||||||||||||||
|
Gross estimated fair value of derivatives: (2)
|
||||||||||||||||||||||||||
|
OTC-bilateral
|
(
|
(
|
(
|
(
|
||||||||||||||||||||||
|
OTC-cleared
|
(
|
(
|
(
|
(
|
||||||||||||||||||||||
|
Exchange-traded
|
(
|
(
|
(
|
(
|
||||||||||||||||||||||
|
Cash collateral: (3), (4)
|
||||||||||||||||||||||||||
|
OTC-bilateral
|
(
|
|
(
|
|
||||||||||||||||||||||
|
OTC-cleared
|
|
(
|
(
|
(
|
||||||||||||||||||||||
|
Exchange-traded
|
|
(
|
|
(
|
||||||||||||||||||||||
|
Securities collateral: (5)
|
||||||||||||||||||||||||||
|
OTC-bilateral
|
(
|
(
|
(
|
(
|
||||||||||||||||||||||
|
OTC-cleared
|
|
(
|
|
(
|
||||||||||||||||||||||
|
Exchange-traded
|
|
(
|
|
(
|
||||||||||||||||||||||
|
Net amount after application of master netting agreements and collateral
|
$ |
|
$ |
|
$ |
|
$ |
|
||||||||||||||||||
__________________
(1)
At September 30, 2022 and December 31, 2021, derivative assets included income (expense) accruals reported in accrued investment income or in other liabilities
of $
187
million an
d
$
130
million
, respectively, and derivative liabilities included (income) expense accruals reported in accrued investment income or in other liabilities
of $
34
million
and ($
23
) million, respectively.
(2)
Estimated fair value of derivatives is limited to the amount that is subject to set-off and includes income or expense accruals.
52
MetLife, Inc.
Notes to the Interim Condensed Consolidated Financial Statements (Unaudited) — (continued)
7.
Derivat
ives (continued)
(3)
Cash collateral received by the Company for OTC-bilateral and OTC-cleared derivatives, where the centralized clearinghouse treats variation margin as collateral, is included in cash and cash equivalents, short-term investments or in fixed maturity securities AFS, and the obligation to return it is included in payables for collateral under securities loaned and other transactions on the balance sheet. For certain collateral agreements, cash collateral is pledged to the Company as initial margin on its OTC-bilateral derivatives.
(4)
The receivable for the return of cash collateral provided by the Company is inclusive of initial margin on exchange-traded and OTC-cleared derivatives and is included in premiums, reinsurance and other receivables on the balance sheet. The amount of cash collateral offset in the table above is limited to the net estimated fair value of derivatives after application of netting agreements. At September 30, 2022 and December 31, 2021, the Company received excess cash collateral of $
950
million and $
172
million, respectively, and provided excess cash collateral of $
127
million and $
126
million, respectively, which is not included in the table above due to the foregoing limitation.
(5)
Securities collateral received by the Company is held in separate custodial accounts and is not recorded on the balance sheet. Subject to certain constraints, the Company is permitted by contract to sell or re-pledge this collateral, but at September 30, 2022,
none
of the collateral had been sold or re-pledged. Securities collateral pledged by the Company is reported in fixed maturity securities AFS on the balance sheet. Subject to certain constraints, the counterparties are permitted by contract to sell or re-pledge this collateral. The amount of securities collateral offset in the table above is limited to the net estimated fair value of derivatives after application of netting agreements and cash collateral. At September 30, 2022 and December 31,
2021, the Company received excess securities collateral with an estimated fair value o
f $
283
million an
d $
160
million, respectively, for its OTC-bilateral derivatives, which are not included in the table above due to the foregoing limitation. At September 30, 2022 and December 31, 2021, the Company provided excess securities collateral with an estimated fair value of $
1.4
billion and $
243
million, respectively, for its OTC-bilateral derivatives, $
942
million and $
1.2
billion, respectively, for its OTC-cleared derivatives, and $
136
million and $
185
million, respectively, for its exchange-traded derivatives, which are not included in the table above due to the foregoing limitation.
The Company’s collateral arrangements for its OTC-bilateral derivatives generally require the counterparty in a net liability position, after considering the effect of netting agreements, to pledge collateral when the collateral amount owed by that counterparty reaches a minimum transfer amount. Substantially all of the Company’s netting agreements for derivatives contain provisions that require both the Company and the counterparty to maintain a specific investment grade credit rating from each of Moody’s and S&P. If a party’s credit or financial strength rating, as applicable, were to fall below that specific investment grade credit rating, that party would be in violation of these provisions, and the other party to the derivatives could terminate the transactions and demand immediate settlement and payment based on such party’s reasonable valuation of the derivatives. A small number of these arrangements also include credit-contingent provisions that include a threshold above which collateral must be posted. Such agreements provide for a reduction of these thresholds (on a sliding scale that converges toward zero) in the event of downgrades in the credit ratings of MetLife, Inc. and/or the counterparty. At September 30, 2022, the amount of collateral not provided by the Company due to the existence of these thresholds was $
15
million.
53
MetLife, Inc.
Notes to the Interim Condensed Consolidated Financial Statements (Unaudited) — (continued)
7.
Derivat
ives (continued)
The following table presents the estimated fair value of the Company’s OTC-bilateral derivatives that were in a net liability position after considering the effect of netting agreements, together with the estimated fair value and balance sheet location of the collateral pledged.
| September 30, 2022 | December 31, 2021 | |||||||||||||||||||||||||||||||||||||
|
Derivatives
Subject to Credit- Contingent Provisions |
Derivatives
Not Subject to Credit- Contingent Provisions |
Total |
Derivatives
Subject to Credit- Contingent Provisions |
Derivatives
Not Subject to Credit- Contingent Provisions |
Total | |||||||||||||||||||||||||||||||||
| (In millions) | ||||||||||||||||||||||||||||||||||||||
| Estimated fair value of derivatives in a net liability position (1) | $ |
|
$ |
|
$ |
|
$ |
|
$ |
|
$ |
|
||||||||||||||||||||||||||
| Estimated fair value of collateral provided: | ||||||||||||||||||||||||||||||||||||||
|
Fixed maturity securities AFS
|
$ |
|
$ |
|
$ |
|
$ |
|
$ |
|
$ |
|
||||||||||||||||||||||||||
__________________
(1)
After taking into consideration the existence of netting agreements.
Embedded Derivatives
The Company issues certain products or purchases certain investments that contain embedded derivatives that are required to be separated from their host contracts and accounted for as freestanding derivatives.
The following table presents the estimated fair value and balance sheet location of the Company’s embedded derivatives that have been separated from their host contracts at:
| Balance Sheet Location | September 30, 2022 | December 31, 2021 | ||||||||||||||||||
| (In millions) | ||||||||||||||||||||
| Embedded derivatives within asset host contracts: | ||||||||||||||||||||
| Ceded guaranteed minimum benefits | Premiums, reinsurance and other receivables | $ |
|
$ |
|
|||||||||||||||
| Embedded derivatives within liability host contracts: | ||||||||||||||||||||
| Direct guaranteed minimum benefits | Policyholder account balances | $ |
|
$ |
|
|||||||||||||||
| Assumed guaranteed minimum benefits | Policyholder account balances |
|
|
|||||||||||||||||
|
Funds withheld and guarantees on reinsurance
|
Other liabilities |
(
|
|
|||||||||||||||||
| Fixed annuities with equity indexed returns | Policyholder account balances |
|
|
|||||||||||||||||
| Other guarantees | Policyholder account balances |
|
|
|||||||||||||||||
|
Embedded derivatives within liability host contracts
|
$ |
|
$ |
|
||||||||||||||||
54
MetLife, Inc.
Notes to the Interim Condensed Consolidated Financial Statements (Unaudited) — (continued)
8. Fair Value (continued)
Recurring Fair Value Measurements
The assets and liabilities measured at estimated fair value on a recurring basis and their corresponding placement in the fair value hierarchy, including those items for which the Company has elected the FVO, are presented below at:
| September 30, 2022 | ||||||||||||||||||||||||||
| Fair Value Hierarchy | ||||||||||||||||||||||||||
| Level 1 | Level 2 | Level 3 |
Total
Estimated
Fair Value
|
|||||||||||||||||||||||
| (In millions) | ||||||||||||||||||||||||||
|
Assets
|
||||||||||||||||||||||||||
|
Fixed maturity securities AFS:
|
||||||||||||||||||||||||||
|
U.S. corporate
|
$ |
|
$ |
|
$ |
|
$ |
|
||||||||||||||||||
| Foreign corporate |
|
|
|
|
||||||||||||||||||||||
| Foreign government |
|
|
|
|
||||||||||||||||||||||
|
U.S. government and agency
|
|
|
|
|
||||||||||||||||||||||
|
RMBS
|
|
|
|
|
||||||||||||||||||||||
| ABS & CLO |
|
|
|
|
||||||||||||||||||||||
|
Municipals
|
|
|
|
|
||||||||||||||||||||||
|
CMBS
|
|
|
|
|
||||||||||||||||||||||
|
Total fixed maturity securities AFS
|
|
|
|
|
||||||||||||||||||||||
|
Equity securities
|
|
|
|
|
||||||||||||||||||||||
| Unit-linked and FVO Securities (2) |
|
|
|
|
||||||||||||||||||||||
| Short-term investments (3) |
|
|
|
|
||||||||||||||||||||||
|
Residential mortgage loans — FVO
|
|
|
|
|
||||||||||||||||||||||
|
Other investments
|
|
|
|
|
||||||||||||||||||||||
| Derivative assets: (4) | ||||||||||||||||||||||||||
|
Interest rate
|
|
|
|
|
||||||||||||||||||||||
|
Foreign currency exchange rate
|
|
|
|
|
||||||||||||||||||||||
|
Credit
|
|
|
|
|
||||||||||||||||||||||
|
Equity market
|
|
|
|
|
||||||||||||||||||||||
|
Total derivative assets
|
|
|
|
|
||||||||||||||||||||||
| Embedded derivatives within asset host contracts (5) |
|
|
|
|
||||||||||||||||||||||
| Separate account assets (6) |
|
|
|
|
||||||||||||||||||||||
| Total assets (7) | $ |
|
$ |
|
$ |
|
$ |
|
||||||||||||||||||
|
Liabilities
|
||||||||||||||||||||||||||
| Derivative liabilities: (4) | ||||||||||||||||||||||||||
|
Interest rate
|
$ |
|
$ |
|
$ |
|
$ |
|
||||||||||||||||||
|
Foreign currency exchange rate
|
|
|
|
|
||||||||||||||||||||||
|
Credit
|
|
|
|
|
||||||||||||||||||||||
|
Equity market
|
|
|
|
|
||||||||||||||||||||||
|
Total derivative liabilities
|
|
|
|
|
||||||||||||||||||||||
| Embedded derivatives within liability host contracts (5) |
|
|
|
|
||||||||||||||||||||||
| Separate account liabilities (6) |
|
|
|
|
||||||||||||||||||||||
|
Total liabilities
|
$ |
|
$ |
|
$ |
|
$ |
|
||||||||||||||||||
55
MetLife, Inc.
Notes to the Interim Condensed Consolidated Financial Statements (Unaudited) — (continued)
8. Fair Value (continued)
| December 31, 2021 (1) | ||||||||||||||||||||||||||
| Fair Value Hierarchy | ||||||||||||||||||||||||||
| Level 1 | Level 2 | Level 3 |
Total
Estimated
Fair Value
|
|||||||||||||||||||||||
| (In millions) | ||||||||||||||||||||||||||
|
Assets
|
||||||||||||||||||||||||||
|
Fixed maturity securities AFS:
|
||||||||||||||||||||||||||
|
U.S. corporate
|
$ |
|
$ |
|
$ |
|
$ |
|
||||||||||||||||||
| Foreign corporate |
|
|
|
|
||||||||||||||||||||||
| Foreign government |
|
|
|
|
||||||||||||||||||||||
|
U.S. government and agency
|
|
|
|
|
||||||||||||||||||||||
|
RMBS
|
|
|
|
|
||||||||||||||||||||||
| ABS & CLO |
|
|
|
|
||||||||||||||||||||||
|
Municipals
|
|
|
|
|
||||||||||||||||||||||
|
CMBS
|
|
|
|
|
||||||||||||||||||||||
|
Total fixed maturity securities AFS
|
|
|
|
|
||||||||||||||||||||||
|
Equity securities
|
|
|
|
|
||||||||||||||||||||||
| Unit-linked and FVO Securities (2) |
|
|
|
|
||||||||||||||||||||||
| Short-term investments (3) |
|
|
|
|
||||||||||||||||||||||
|
Residential mortgage loans — FVO
|
|
|
|
|
||||||||||||||||||||||
|
Other investments
|
|
|
|
|
||||||||||||||||||||||
| Derivative assets: (4) | ||||||||||||||||||||||||||
|
Interest rate
|
|
|
|
|
||||||||||||||||||||||
|
Foreign currency exchange rate
|
|
|
|
|
||||||||||||||||||||||
|
Credit
|
|
|
|
|
||||||||||||||||||||||
|
Equity market
|
|
|
|
|
||||||||||||||||||||||
|
Total derivative assets
|
|
|
|
|
||||||||||||||||||||||
| Embedded derivatives within asset host contracts (5) |
|
|
|
|
||||||||||||||||||||||
| Separate account assets (6) |
|
|
|
|
||||||||||||||||||||||
| Total assets (7) | $ |
|
$ |
|
$ |
|
$ |
|
||||||||||||||||||
|
Liabilities
|
||||||||||||||||||||||||||
| Derivative liabilities: (4) | ||||||||||||||||||||||||||
|
Interest rate
|
$ |
|
$ |
|
$ |
|
$ |
|
||||||||||||||||||
|
Foreign currency exchange rate
|
|
|
|
|
||||||||||||||||||||||
|
Credit
|
|
|
|
|
||||||||||||||||||||||
|
Equity market
|
|
|
|
|
||||||||||||||||||||||
|
Total derivative liabilities
|
|
|
|
|
||||||||||||||||||||||
| Embedded derivatives within liability host contracts (5) |
|
|
|
|
||||||||||||||||||||||
| Separate account liabilities (6) |
|
|
|
|
||||||||||||||||||||||
|
Total liabilities
|
$ |
|
$ |
|
$ |
|
$ |
|
||||||||||||||||||
__________________
(1)
Excludes amounts reclassified to assets held-for-sale or liabilities held-for-sale. Assets held-for-sale and liabilities held-for-sale are valued on a basis consistent with similar assets and liabilities described herein. See Note 3 for information on the Company’s business dispositions.
56
MetLife, Inc.
Notes to the Interim Condensed Consolidated Financial Statements (Unaudited) — (continued)
8. Fair Value (continued)
(2)
Contractholder-directed equity securities and FVO Securities (collectively, “Unit-linked and FVO Securities”) were primarily comprised of Unit-linked investments at both September 30, 2022 and December 31, 2021.
(3)
Short-term investments as presented in the tables above differ from the amounts presented on the interim condensed consolidated balance sheets because certain short-term investments are not measured at estimated fair value on a recurring basis.
(4)
Derivative assets are presented within other invested assets on the interim condensed consolidated balance sheets and derivative liabilities are presented within other liabilities on the interim condensed consolidated balance sheets. The amounts are presented gross in the tables above to reflect the presentation on the interim condensed consolidated balance sheets, but are presented net for purposes of the rollforward in the Fair Value Measurements Using Significant Unobservable Inputs (Level 3) tables.
(5)
Embedded derivatives within asset host contracts are presented within premiums, reinsurance and other receivables on the interim condensed consolidated balance sheets. Embedded derivatives within liability host contracts are presented within policyholder account balances and other liabilities on the interim condensed consolidated balance sheets.
(6)
Investment performance related to separate account assets is fully offset by corresponding amounts credited to contractholders whose liability is reflected within separate account liabilities. Separate account liabilities are set equal to the estimated fair value of separate account assets. Separate account liabilities presented in the tables above represent derivative liabilities.
(7)
Total assets included in the fair value hierarchy exclude other limited partnership interests that are measured at estimated fair value using the net asset value (“NAV”) per share (or its equivalent) practical expedient. At September 30, 2022 and December 31, 2021, the estimated fair value of such investments was $
72
million and $
99
million, respectively.
The following describes the valuation methodologies used to measure assets and liabilities at fair value.
Investments
Securities, Short-term Investments and Other Investments
When available, the estimated fair value of these financial instruments is based on quoted prices in active markets that are readily and regularly obtainable. Generally, these are the most liquid of the Company’s securities holdings and valuation of these securities does not involve management’s judgment.
When quoted prices in active markets are not available, the determination of estimated fair value of securities is based on market standard valuation methodologies, giving priority to observable inputs. The significant inputs to the market standard valuation methodologies for certain types of securities with reasonable levels of price transparency are inputs that are observable in the market or can be derived principally from, or corroborated by, observable market data. When observable inputs are not available, the market standard valuation methodologies rely on inputs that are significant to the estimated fair value that are not observable in the market or cannot be derived principally from, or corroborated by, observable market data. These unobservable inputs can be based in large part on management’s judgment or estimation and cannot be supported by reference to market activity. Unobservable inputs are based on management’s assumptions about the inputs market participants would use in pricing such investments.
The estimated fair value of short-term investments and other investments is determined on a basis consistent with the methodologies described herein.
The valuation approaches and key inputs for each category of assets or liabilities that are classified within Level 2 and Level 3 of the fair value hierarchy are presented below. The primary valuation approaches are the market approach, which considers recent prices from market transactions involving identical or similar assets or liabilities, and the income approach, which converts expected future amounts (e.g. cash flows) to a single current, discounted amount. The valuation of most instruments listed below is determined using independent pricing sources, matrix pricing, discounted cash flow methodologies or other similar techniques that use either observable market inputs or unobservable inputs.
57
MetLife, Inc.
Notes to the Interim Condensed Consolidated Financial Statements (Unaudited) — (continued)
8. Fair Value (continued)
|
Instrument
|
Level 2
Observable Inputs
|
Level 3
Unobservable Inputs
|
|||||||||||||||
|
Fixed maturity securities AFS
|
|||||||||||||||||
|
U.S. corporate and Foreign corporate securities
|
|||||||||||||||||
|
Valuation Approaches: Principally the market and income approaches.
|
Valuation Approaches: Principally the market approach.
|
||||||||||||||||
|
Key Inputs:
|
Key Inputs:
|
||||||||||||||||
| • |
quoted prices in markets that are not active
|
• |
illiquidity premium
|
||||||||||||||
| • | benchmark yields; spreads off benchmark yields; new issuances; issuer ratings | • | delta spread adjustments to reflect specific credit-related issues | ||||||||||||||
| • |
trades of identical or comparable securities; duration
|
• | credit spreads | ||||||||||||||
| • |
privately-placed securities are valued using the additional key inputs:
|
• |
quoted prices in markets that are not active for identical or similar securities that are less liquid and based on lower levels of trading activity than securities classified in Level 2
|
||||||||||||||
| • |
market yield curve; call provisions
|
||||||||||||||||
| • |
observable prices and spreads for similar public or private securities that incorporate the credit quality and industry sector of the issuer
|
• | independent non-binding broker quotations | ||||||||||||||
| • |
delta spread adjustments to reflect specific credit-related issues
|
||||||||||||||||
| Foreign government securities, U.S. government and agency securities and Municipals | |||||||||||||||||
|
Valuation Approaches: Principally the market approach.
|
Valuation Approaches: Principally the market approach.
|
||||||||||||||||
|
Key Inputs:
|
Key Inputs:
|
||||||||||||||||
| • |
quoted prices in markets that are not active
|
• |
independent non-binding broker quotations
|
||||||||||||||
| • |
benchmark U.S. Treasury yield or other yields
|
• |
quoted prices in markets that are not active for identical or similar securities that are less liquid and based on lower levels of trading activity than securities classified in Level 2
|
||||||||||||||
| • |
the spread off the U.S. Treasury yield curve for the identical security
|
||||||||||||||||
| • | issuer ratings and issuer spreads; broker-dealer quotations | • | credit spreads | ||||||||||||||
| • |
comparable securities that are actively traded
|
||||||||||||||||
|
Structured Products
|
|||||||||||||||||
|
Valuation Approaches: Principally the market and income approaches.
|
Valuation Approaches: Principally the market and income approaches.
|
||||||||||||||||
|
Key Inputs:
|
Key Inputs:
|
||||||||||||||||
| • | quoted prices in markets that are not active | • |
credit spreads
|
||||||||||||||
| • |
spreads for actively traded securities; spreads off benchmark yields
|
• |
quoted prices in markets that are not active for identical or similar securities that are less liquid and based on lower levels of trading activity than securities classified in Level 2
|
||||||||||||||
| • |
expected prepayment speeds and volumes
|
||||||||||||||||
| • |
current and forecasted loss severity; ratings; geographic region
|
• |
independent non-binding broker quotations
|
||||||||||||||
| • |
weighted average coupon and weighted average maturity
|
• | credit ratings | ||||||||||||||
| • | average delinquency rates; DSCR | ||||||||||||||||
| • |
credit ratings
|
||||||||||||||||
| • |
issuance-specific information, including, but not limited to:
|
||||||||||||||||
| • | collateral type; structure of the security; vintage of the loans | ||||||||||||||||
| • | payment terms of the underlying assets | ||||||||||||||||
| • |
payment priority within the tranche; deal performance
|
||||||||||||||||
58
MetLife, Inc.
Notes to the Interim Condensed Consolidated Financial Statements (Unaudited) — (continued)
8. Fair Value (continued)
|
Instrument
|
Level 2
Observable Inputs
|
Level 3
Unobservable Inputs
|
||||||||||||||||||
|
Equity securities
|
||||||||||||||||||||
|
Valuation Approaches: Principally the market approach.
|
Valuation Approaches: Principally the market and income approaches.
|
|||||||||||||||||||
|
Key Input:
|
Key Inputs:
|
|||||||||||||||||||
| • |
quoted prices in markets that are not considered active
|
• |
credit ratings; issuance structures
|
|||||||||||||||||
| • |
quoted prices in markets that are not active for identical or similar securities that are less liquid and based on lower levels of trading activity than securities classified in Level 2
|
|||||||||||||||||||
| • |
independent non-binding broker quotations
|
|||||||||||||||||||
|
Unit-linked and FVO Securities, Short-term investments and Other investments
|
||||||||||||||||||||
| Valuation Approaches: Principally the market and income approaches. | Valuation Approaches: Principally the market and income approaches. | |||||||||||||||||||
| Key Inputs: | Key Inputs: | |||||||||||||||||||
| • |
Unit-linked and FVO Securities include mutual fund interests without readily determinable fair values given prices are not published publicly. Valuation of these mutual funds is based upon quoted prices or reported NAV provided by the fund managers, which were based on observable inputs.
|
• | Unit-linked and FVO Securities, short-term investments and other investments are of a similar nature and class to the fixed maturity securities AFS and equity securities described above; accordingly, the valuation approaches and unobservable inputs used in their valuation are also similar to those described above. Other investments also include certain real estate joint ventures and use the valuation approach and key inputs as described for other limited partnership interests below. | |||||||||||||||||
| • |
Short-term investments and other investments are of a similar nature and class to the fixed maturity securities AFS and equity securities described above; accordingly, the valuation approaches and observable inputs used in their valuation are also similar to those described above.
|
|||||||||||||||||||
|
Residential mortgage loans — FVO
|
||||||||||||||||||||
| • | N/A |
Valuation Approaches: Principally the market approach.
|
||||||||||||||||||
|
Valuation Techniques and Key Inputs: These investments are based primarily on matrix pricing or other similar techniques that utilize inputs from mortgage servicers that are unobservable or cannot be derived principally from, or corroborated by, observable market data.
|
||||||||||||||||||||
| Separate account assets and Separate account liabilities (1) | ||||||||||||||||||||
|
Mutual funds and hedge funds without readily determinable fair values as prices are not published publicly
|
||||||||||||||||||||
| Key Input: | • | N/A | ||||||||||||||||||
| • | quoted prices or reported NAV provided by the fund managers | |||||||||||||||||||
|
Other limited partnership interests
|
||||||||||||||||||||
| • | N/A |
Valued giving consideration to the underlying holdings of the partnerships and adjusting, if appropriate.
|
||||||||||||||||||
| Key Inputs: | ||||||||||||||||||||
| • |
liquidity; bid/ask spreads; performance record of the fund manager
|
|||||||||||||||||||
| • |
other relevant variables that may impact the exit value of the particular partnership interest
|
|||||||||||||||||||
__________________
(1)
Estimated fair value equals carrying value, based on the value of the underlying assets, including: mutual fund interests, fixed maturity securities, equity securities, derivatives, hedge funds, other limited partnership interests, short-term investments and cash and cash equivalents. The estimated fair value of fixed maturity securities, equity securities, derivatives, short-term investments and cash and cash equivalents is determined on a basis consistent with the assets described under “— Securities, Short-term Investments and Other Investments” and “— Derivatives — Freestanding Derivatives.”
Derivatives
The estimated fair value of derivatives is determined through the use of quoted market prices for exchange-traded derivatives, or through the use of pricing models for OTC-bilateral and OTC-cleared derivatives. The determination of estimated fair value, when quoted market values are not available, is based on market standard valuation methodologies and inputs that management believes are consistent with what other market participants would use when pricing such instruments. Derivative valuations can be affected by changes in interest rates, foreign currency exchange rates, financial indices, credit spreads, default risk, nonperformance risk, volatility, liquidity and changes in estimates and assumptions used in the pricing models.
59
MetLife, Inc.
Notes to the Interim Condensed Consolidated Financial Statements (Unaudited) — (continued)
8. Fair Value (continued)
The significant inputs to the pricing models for most OTC-bilateral and OTC-cleared derivatives are inputs that are observable in the market or can be derived principally from, or corroborated by, observable market data. Certain OTC-bilateral and OTC-cleared derivatives may rely on inputs that are significant to the estimated fair value that are not observable in the market or cannot be derived principally from, or corroborated by, observable market data. These unobservable inputs may involve significant management judgment or estimation. Unobservable inputs are based on management’s assumptions about the inputs market participants would use in pricing such derivatives.
Most inputs for OTC-bilateral and OTC-cleared derivatives are mid-market inputs but, in certain cases, liquidity adjustments are made when they are deemed more representative of exit value. Market liquidity, as well as the use of different methodologies, assumptions and inputs, may have a material effect on the estimated fair values of the Company’s derivatives and could materially affect net income.
The credit risk of both the counterparty and the Company are considered in determining the estimated fair value for all OTC-bilateral and OTC-cleared derivatives, and any potential credit adjustment is based on the net exposure by counterparty after taking into account the effects of netting agreements and collateral arrangements. The Company values its OTC-bilateral and OTC-cleared derivatives using standard swap curves which may include a spread to the risk-free rate, depending upon specific collateral arrangements. This credit spread is appropriate for those parties that execute trades at pricing levels consistent with similar collateral arrangements. As the Company and its significant derivative counterparties generally execute trades at such pricing levels and hold sufficient collateral, additional credit risk adjustments are not currently required in the valuation process. The Company’s ability to consistently execute at such pricing levels is, in part, due to the netting agreements and collateral arrangements that are in place with all of its significant derivative counterparties. An evaluation of the requirement to make additional credit risk adjustments is performed by the Company each reporting period.
Freestanding Derivatives
Level 2 Valuation Approaches and Key Inputs:
This level includes all types of derivatives utilized by the Company with the exception of exchange-traded derivatives included within Level 1 and those derivatives with unobservable inputs as described in Level 3.
Level 3 Valuation Approaches and Key Inputs:
These valuation methodologies generally use the same inputs as described in the corresponding sections for Level 2 measurements of derivatives. However, these derivatives result in Level 3 classification because one or more of the significant inputs are not observable in the market or cannot be derived principally from, or corroborated by, observable market data.
Freestanding derivatives are principally valued using the income approach. Valuations of non-option-based derivatives utilize present value techniques, whereas valuations of option-based derivatives utilize option pricing models. Key inputs are as follows:
| Instrument | Interest Rate |
Foreign Currency
Exchange Rate |
Credit | Equity Market | ||||||||||||||||||||||
|
Inputs common to Level 2 and Level 3 by instrument type
|
• |
swap yield curves
|
• |
swap yield curves
|
• |
swap yield curves
|
• |
swap yield curves
|
||||||||||||||||||
| • |
basis curves
|
• |
basis curves
|
• |
credit curves
|
• |
spot equity index levels
|
|||||||||||||||||||
| • | interest rate volatility (1) | • |
currency spot rates
|
• |
recovery rates
|
• |
dividend yield curves
|
|||||||||||||||||||
| • | cross currency basis curves | • |
equity volatility (1)
|
|||||||||||||||||||||||
| • |
currency volatility (1)
|
|||||||||||||||||||||||||
| Level 3 | • |
swap yield curves (2)
|
• |
swap yield curves (2)
|
• |
swap yield curves (2)
|
• |
dividend yield curves (2)
|
||||||||||||||||||
| • |
basis curves (2)
|
• |
basis curves (2)
|
• |
credit curves (2)
|
• |
equity volatility (1), (2)
|
|||||||||||||||||||
| • |
repurchase rates
|
• |
cross currency basis curves (2)
|
•
|
credit spreads | • |
correlation between model inputs (1)
|
|||||||||||||||||||
| • | interest rate volatility (1), (2) | • |
currency correlation
|
• | repurchase rates | |||||||||||||||||||||
| • |
currency volatility (1)
|
•
|
independent non-binding broker quotations
|
|||||||||||||||||||||||
__________________
(1)
Option-based only.
60
MetLife, Inc.
Notes to the Interim Condensed Consolidated Financial Statements (Unaudited) — (continued)
8. Fair Value (continued)
(2)
Extrapolation beyond the observable limits of the curve(s).
Embedded Derivatives
Embedded derivatives principally include certain direct, assumed and ceded variable annuity guarantees, annuity contracts, guarantees on reinsurance, and investment risk within funds withheld related to certain reinsurance agreements. Embedded derivatives are recorded at estimated fair value with changes in estimated fair value reported in net income.
The Company issues certain variable annuity products with guaranteed minimum benefits. GMWBs, GMABs and certain GMIBs contain embedded derivatives, which are measured at estimated fair value separately from the host variable annuity contract, with changes in estimated fair value reported in net derivative gains (losses). These embedded derivatives are classified within policyholder account balances on the interim condensed consolidated balance sheets.
The Company calculates the fair value of these embedded derivatives, which is estimated as the present value of projected future benefits minus the present value of projected future fees using actuarial and capital market assumptions including expectations concerning policyholder behavior. The calculation is based on in-force business, projecting future cash flows from the embedded derivative over multiple risk neutral stochastic scenarios using observable risk-free rates.
Capital market assumptions, such as risk-free rates and implied volatilities, are based on market prices for publicly traded instruments to the extent that prices for such instruments are observable. Implied volatilities beyond the observable period are extrapolated based on observable implied volatilities and historical volatilities. Actuarial assumptions, including mortality, lapse, withdrawal and utilization, are unobservable and are reviewed at least annually based on actuarial studies of historical experience.
The valuation of these guarantee liabilities includes nonperformance risk adjustments and adjustments for a risk margin related to non-capital market inputs. The nonperformance adjustment is determined by taking into consideration publicly available information relating to spreads in the secondary market for MetLife, Inc.’s debt, including related credit default swaps. These observable spreads are then adjusted, as necessary, to reflect the priority of these liabilities and the claims paying ability of the issuing insurance subsidiaries as compared to MetLife, Inc.
Risk margins are established to capture the non-capital market risks of the instrument which represent the additional compensation a market participant would require to assume the risks related to the uncertainties of such actuarial assumptions as annuitization, premium persistency, partial withdrawal and surrenders. The establishment of risk margins requires the use of significant management judgment, including assumptions of the amount and cost of capital needed to cover the guarantees. These guarantees may be more costly than expected in volatile or declining equity markets. Market conditions including, but not limited to, changes in interest rates, equity indices, market volatility and foreign currency exchange rates; changes in nonperformance risk; and variations in actuarial assumptions regarding policyholder behavior, mortality and risk margins related to non-capital market inputs, may result in significant fluctuations in the estimated fair value of the guarantees that could materially affect net income.
The Company ceded the risk associated with certain of the GMIBs previously described. These reinsurance agreements contain embedded derivatives which are included within premiums, reinsurance and other receivables on the interim condensed consolidated balance sheets with changes in estimated fair value reported in net derivative gains (losses) or policyholder benefits and claims depending on the statement of operations classification of the direct risk. The value of the embedded derivatives on the ceded risk is determined using a methodology consistent with that described previously for the guarantees directly written by the Company with the exception of the input for nonperformance risk that reflects the credit of the reinsurer.
The estimated fair value of the embedded derivatives within funds withheld related to certain ceded reinsurance is determined based on the change in estimated fair value of the underlying assets held by the Company in a reference portfolio backing the funds withheld liability. The estimated fair value of the underlying assets is determined as described in “— Investments — Securities, Short-term Investments and Other Investments.” The estimated fair value of guarantees related to reinsurance is determined based on multiple stochastic scenarios and includes a nonperformance risk adjustment. The estimated fair value of these embedded derivatives is included, along with their underlying host contracts, in other liabilities on the interim condensed consolidated balance sheets with changes in estimated fair value recorded in net derivative gains (losses). Changes in the credit spreads on the underlying assets, interest rates and market volatility may result in significant fluctuations in the estimated fair value of these embedded derivatives that could materially affect net income.
61
MetLife, Inc.
Notes to the Interim Condensed Consolidated Financial Statements (Unaudited) — (continued)
8. Fair Value (continued)
The Company issues certain annuity contracts which allow the policyholder to participate in returns from equity indices. These equity indexed features are embedded derivatives which are measured at estimated fair value separately from the host fixed annuity contract, with changes in estimated fair value reported in net derivative gains (losses). These embedded derivatives are classified within policyholder account balances on the interim condensed consolidated balance sheets.
The estimated fair value of the embedded equity indexed derivatives, based on the present value of future equity returns to the policyholder using actuarial and present value assumptions including expectations concerning policyholder behavior, is calculated by the Company’s actuarial department. The calculation is based on in-force business and uses standard capital market techniques, such as Black-Scholes, to calculate the value of the portion of the embedded derivative for which the terms are set. The portion of the embedded derivative covering the period beyond where terms are set is calculated as the present value of amounts expected to be spent to provide equity indexed returns in those periods. The valuation of these embedded derivatives also includes the establishment of a risk margin, as well as changes in nonperformance risk.
Embedded Derivatives Within Asset and Liability Host Contracts
Level 3 Valuation Approaches and Key Inputs:
Direct and assumed guaranteed minimum benefits
These embedded derivatives are principally valued using the income approach. Valuations are based on option pricing techniques, which utilize significant inputs that may include swap yield curves, currency exchange rates and implied volatilities. These embedded derivatives result in Level 3 classification because one or more of the significant inputs are not observable in the market or cannot be derived principally from, or corroborated by, observable market data. Significant unobservable inputs generally include: the extrapolation beyond observable limits of the swap yield curves and implied volatilities, actuarial assumptions for policyholder behavior and mortality and the potential variability in policyholder behavior and mortality, nonperformance risk and cost of capital for purposes of calculating the risk margin.
Reinsurance ceded on certain guaranteed minimum benefits
These embedded derivatives are principally valued using the income approach. The valuation techniques and significant market standard unobservable inputs used in their valuation are similar to those described above in “— Direct and assumed guaranteed minimum benefits” and also include counterparty credit spreads.
Transfers between Levels
Overall, transfers between levels occur when there are changes in the observability of inputs and market activity.
Transfers into or out of Level 3:
Assets and liabilities are transferred into Level 3 when a significant input cannot be corroborated with market observable data. This occurs when market activity decreases significantly and underlying inputs cannot be observed, current prices are not available, and/or when there are significant variances in quoted prices, thereby affecting transparency. Assets and liabilities are transferred out of Level 3 when circumstances change such that a significant input can be corroborated with market observable data. This may be due to a significant increase in market activity, a specific event, or one or more significant input(s) becoming observable.
62
MetLife, Inc.
Notes to the Interim Condensed Consolidated Financial Statements (Unaudited) — (continued)
8. Fair Value (continued)
Assets and Liabilities Measured at Fair Value Using Significant Unobservable Inputs (Level 3)
The following table presents certain quantitative information about the significant unobservable inputs used in the fair value measurement, and the sensitivity of the estimated fair value to changes in those inputs, for the more significant asset and liability classes measured at fair value on a recurring basis using significant unobservable inputs (Level 3) at:
| September 30, 2022 | December 31, 2021 |
Impact of
Increase in Input on Estimated Fair Value (2) |
|||||||||||||||||||||||||||||||||||||||||||||||||||||||||
|
Valuation
Techniques |
Significant
Unobservable Inputs |
Range |
Weighted
Average (1) |
Range |
Weighted
Average (1) |
||||||||||||||||||||||||||||||||||||||||||||||||||||||
| Fixed maturity securities AFS (3) | |||||||||||||||||||||||||||||||||||||||||||||||||||||||||||
| U.S. corporate and foreign corporate | • | Matrix pricing | • | Offered quotes (4) |
|
- |
|
|
|
- |
|
|
Increase | ||||||||||||||||||||||||||||||||||||||||||||||
| • | Market pricing | • | Quoted prices (4) |
|
- |
|
|
|
- |
|
|
Increase | |||||||||||||||||||||||||||||||||||||||||||||||
| • | Consensus pricing | • | Offered quotes (4) |
|
- |
|
|
|
- |
|
|
Increase | |||||||||||||||||||||||||||||||||||||||||||||||
| RMBS | • | Market pricing | • | Quoted prices (4) |
|
- |
|
|
|
- |
|
|
Increase (5) | ||||||||||||||||||||||||||||||||||||||||||||||
| ABS & CLO | • | Market pricing | • | Quoted prices (4) |
|
- |
|
|
|
- |
|
|
Increase (5) | ||||||||||||||||||||||||||||||||||||||||||||||
| Derivatives | |||||||||||||||||||||||||||||||||||||||||||||||||||||||||||
| Interest rate | • | Present value techniques | • | Swap yield (6) |
|
- |
|
|
|
- |
|
|
Increase (7) | ||||||||||||||||||||||||||||||||||||||||||||||
| • | Volatility (8) |
|
- |
|
|
|
- |
|
|
Increase (7) | |||||||||||||||||||||||||||||||||||||||||||||||||
| Foreign currency exchange rate | • | Present value techniques | • | Swap yield (6) |
|
- |
|
|
|
- |
|
|
Increase (7) | ||||||||||||||||||||||||||||||||||||||||||||||
| Credit | • | Present value techniques | • | Credit spreads (9) |
|
- |
|
|
|
- |
|
|
Decrease (7) | ||||||||||||||||||||||||||||||||||||||||||||||
| • | Consensus pricing | • | Offered quotes (10) | ||||||||||||||||||||||||||||||||||||||||||||||||||||||||
| Embedded derivatives | |||||||||||||||||||||||||||||||||||||||||||||||||||||||||||
| Direct, assumed and ceded guaranteed minimum benefits | • | Option pricing techniques | • | Mortality rates: | |||||||||||||||||||||||||||||||||||||||||||||||||||||||
| Ages 0 - 40 |
|
- |
|
|
|
- |
|
|
Decrease (11) | ||||||||||||||||||||||||||||||||||||||||||||||||||
| Ages 41 - 60 |
|
- |
|
|
|
- |
|
|
Decrease (11) | ||||||||||||||||||||||||||||||||||||||||||||||||||
| Ages 61 - 115 |
|
- |
|
|
|
- |
|
|
Decrease (11) | ||||||||||||||||||||||||||||||||||||||||||||||||||
| • | Lapse rates: | ||||||||||||||||||||||||||||||||||||||||||||||||||||||||||
| Durations 1 - 10 |
|
- |
|
|
|
- |
|
|
Decrease (12) | ||||||||||||||||||||||||||||||||||||||||||||||||||
| Durations 11 - 20 |
|
- |
|
|
|
- |
|
|
Decrease (12) | ||||||||||||||||||||||||||||||||||||||||||||||||||
| Durations 21 - 116 |
|
- |
|
|
|
- |
|
|
Decrease (12) | ||||||||||||||||||||||||||||||||||||||||||||||||||
| • | Utilization rates |
|
- |
|
|
|
- |
|
|
Increase (13) | |||||||||||||||||||||||||||||||||||||||||||||||||
| • | Withdrawal rates |
|
- |
|
|
|
- |
|
|
(14) | |||||||||||||||||||||||||||||||||||||||||||||||||
| • | Long-term equity volatilities |
|
- |
|
|
|
- |
|
|
Increase (15) | |||||||||||||||||||||||||||||||||||||||||||||||||
| • | Nonperformance risk spread |
|
- |
|
|
|
- |
|
|
Decrease (16) | |||||||||||||||||||||||||||||||||||||||||||||||||
__________________
(1)
The weighted average for fixed maturity securities AFS and derivatives is determined based on the estimated fair value of the securities and derivatives. The weighted average for embedded derivatives is determined based on a combination of account values and experience data.
(2)
The impact of a decrease in input would have resulted in the opposite impact on estimated fair value. For embedded derivatives, changes to direct and assumed guaranteed minimum benefits are based on liability positions; changes to ceded guaranteed minimum benefits are based on asset positions.
(3)
Significant increases (decreases) in expected default rates in isolation would have resulted in substantially lower (higher) valuations.
(4)
Range and weighted average are presented in accordance with the market convention for fixed maturity securities AFS of dollars per hundred dollars of par.
(5)
Changes in the assumptions used for the probability of default would have been accompanied by a directionally similar change in the assumption used for the loss severity and a directionally opposite change in the assumptions used for prepayment rates.
63
MetLife, Inc.
Notes to the Interim Condensed Consolidated Financial Statements (Unaudited) — (continued)
8. Fair Value (continued)
(6)
Ranges represent the rates across different yield curves and are presented in basis points. The swap yield curves are utilized among different types of derivatives to project cash flows, as well as to discount future cash flows to present value. Since this valuation methodology uses a range of inputs across a yield curve to value the derivative, presenting a range is more representative of the unobservable input used in the valuation.
(7)
Changes in estimated fair value are based on long U.S. dollar net asset positions and will be inversely impacted for short U.S. dollar net asset positions.
(8)
Ranges represent the underlying interest rate volatility quoted in percentage points. Since this valuation methodology uses an equivalent of LIBOR for secured overnight financing rate volatility, presenting a range is more representative of the unobservable input used in the valuation.
(9)
Represents the risk quoted in basis points of a credit default event on the underlying instrument. Credit derivatives with significant unobservable inputs are primarily comprised of written credit default swaps.
(10)
At both September 30, 2022 and December 31, 2021, independent non-binding broker quotations were used in the determination of less than 1% of the total net derivative estimated fair value.
(11)
Mortality rates vary by age and by demographic characteristics such as gender. Mortality rate assumptions are based on company experience. A mortality improvement assumption is also applied. For any given contract, mortality rates vary throughout the period over which cash flows are projected for purposes of valuing the embedded derivative.
(12)
Base lapse rates are adjusted at the contract level based on a comparison of the actuarially calculated guaranteed values and the current policyholder account value, as well as other factors, such as the applicability of any surrender charges. A dynamic lapse function reduces the base lapse rate when the guaranteed amount is greater than the account value as in the money contracts are less likely to lapse. Lapse rates are also generally assumed to be lower in periods when a surrender charge applies. For any given contract, lapse rates vary throughout the period over which cash flows are projected for purposes of valuing the embedded derivative.
(13)
The utilization rate assumption estimates the percentage of contractholders with GMIBs or a lifetime withdrawal benefit who will elect to utilize the benefit upon becoming eligible. The rates may vary by the type of guarantee, the amount by which the guaranteed amount is greater than the account value, the contract’s withdrawal history and by the age of the policyholder. For any given contract, utilization rates vary throughout the period over which cash flows are projected for purposes of valuing the embedded derivative.
(14)
The withdrawal rate represents the percentage of account balance that any given policyholder will elect to withdraw from the contract each year. The withdrawal rate assumption varies by age and duration of the contract, and also by other factors such as benefit type. For any given contract, withdrawal rates vary throughout the period over which cash flows are projected for purposes of valuing the embedded derivative. For GMWBs, any increase (decrease) in withdrawal rates results in an increase (decrease) in the estimated fair value of the guarantees. For GMABs and GMIBs, any increase (decrease) in withdrawal rates results in a decrease (increase) in the estimated fair value.
(15)
Long-term equity volatilities represent equity volatility beyond the period for which observable equity volatilities are available. For any given contract, long-term equity volatility rates vary throughout the period over which cash flows are projected for purposes of valuing the embedded derivative.
(16)
Nonperformance risk spread varies by duration and by currency. For any given contract, multiple nonperformance risk spreads will apply, depending on the duration of the cash flow being discounted for purposes of valuing the embedded derivative.
Generally, all other classes of assets and liabilities classified within Level 3 that are not included in the preceding table use the same valuation techniques and significant unobservable inputs as previously described for Level 3. The sensitivity of the estimated fair value to changes in the significant unobservable inputs for these other assets and liabilities is similar in nature to that described in the preceding table.
64
MetLife, Inc.
Notes to the Interim Condensed Consolidated Financial Statements (Unaudited) — (continued)
8. Fair Value (continued)
| Fair Value Measurements Using Significant Unobservable Inputs (Level 3) | ||||||||||||||||||||||||||||||||||||||
| Fixed Maturity Securities AFS | ||||||||||||||||||||||||||||||||||||||
| Corporate (6) |
Foreign
Government |
Structured
Products
|
Municipals |
Equity
Securities
|
Unit-linked
and FVO Securities |
|||||||||||||||||||||||||||||||||
| (In millions) | ||||||||||||||||||||||||||||||||||||||
| Three Months Ended September 30, 2022 | ||||||||||||||||||||||||||||||||||||||
|
Balance, beginning of period
|
$ |
|
$ |
|
$ |
|
$ |
|
$ |
|
$ |
|
||||||||||||||||||||||||||
|
Total realized/unrealized gains (losses) included in net income (loss) (1), (2)
|
|
|
|
|
(
|
(
|
||||||||||||||||||||||||||||||||
|
Total realized/unrealized gains (losses) included in AOCI
|
(
|
(
|
(
|
|
|
|
||||||||||||||||||||||||||||||||
|
Purchases (3)
|
|
|
|
|
|
|
||||||||||||||||||||||||||||||||
|
Sales (3)
|
(
|
(
|
(
|
|
(
|
(
|
||||||||||||||||||||||||||||||||
|
Issuances (3)
|
|
|
|
|
|
|
||||||||||||||||||||||||||||||||
|
Settlements (3)
|
|
|
|
|
|
|
||||||||||||||||||||||||||||||||
|
Transfers into Level 3 (4)
|
|
|
|
|
|
|
||||||||||||||||||||||||||||||||
| Transfers out of Level 3 (4) |
(
|
(
|
(
|
|
|
|
||||||||||||||||||||||||||||||||
|
Balance, end of period
|
$ |
|
$ |
|
$ |
|
$ |
|
$ |
|
$ |
|
||||||||||||||||||||||||||
| Three Months Ended September 30, 2021 | ||||||||||||||||||||||||||||||||||||||
|
Balance, beginning of period
|
$ |
|
$ |
|
$ |
|
$ |
|
$ |
|
$ |
|
||||||||||||||||||||||||||
|
Total realized/unrealized gains (losses) included in net income (loss) (1), (2)
|
(
|
|
|
|
|
(
|
||||||||||||||||||||||||||||||||
|
Total realized/unrealized gains (losses) included in AOCI
|
(
|
|
|
|
|
|
||||||||||||||||||||||||||||||||
|
Purchases (3)
|
|
|
|
|
|
|
||||||||||||||||||||||||||||||||
|
Sales (3)
|
(
|
(
|
(
|
|
(
|
(
|
||||||||||||||||||||||||||||||||
|
Issuances (3)
|
|
|
|
|
|
|
||||||||||||||||||||||||||||||||
|
Settlements (3)
|
|
|
|
|
|
|
||||||||||||||||||||||||||||||||
|
Transfers into Level 3 (4)
|
|
|
|
|
|
|
||||||||||||||||||||||||||||||||
| Transfers out of Level 3 (4) |
(
|
(
|
(
|
|
(
|
(
|
||||||||||||||||||||||||||||||||
|
Balance, end of period
|
$ |
|
$ |
|
$ |
|
$ |
|
$ |
|
$ |
|
||||||||||||||||||||||||||
|
Changes in unrealized gains (losses) included in
net income (loss) for the instruments still held
at September 30, 2022 (5)
|
$ |
|
$ |
|
$ |
|
$ |
|
$ |
(
|
$ |
(
|
||||||||||||||||||||||||||
|
Changes in unrealized gains (losses) included in
net income (loss) for the instruments still held
at September 30, 2021 (5)
|
$ |
(
|
$ |
|
$ |
|
$ |
|
$ |
|
$ |
(
|
||||||||||||||||||||||||||
|
Changes in unrealized gains (losses) included in
AOCI for the instruments still held
at September 30, 2022 (5)
|
$ |
(
|
$ |
(
|
$ |
(
|
$ |
|
$ |
|
$ |
|
||||||||||||||||||||||||||
|
Changes in unrealized gains (losses) included in
AOCI for the instruments still held
at September 30, 2021 (5)
|
$ |
(
|
$ |
|
$ |
|
$ |
|
$ |
|
$ |
|
||||||||||||||||||||||||||
65
MetLife, Inc.
Notes to the Interim Condensed Consolidated Financial Statements (Unaudited) — (continued)
8. Fair Value (continued)
| Fair Value Measurements Using Significant Unobservable Inputs (Level 3) | ||||||||||||||||||||||||||||||||||||||
|
Short-term
Investments |
Residential
Mortgage
Loans — FVO |
Other
Investments |
Net
Derivatives (7) |
Net Embedded
Derivatives (8) |
Separate
Accounts (9) |
|||||||||||||||||||||||||||||||||
| (In millions) | ||||||||||||||||||||||||||||||||||||||
| Three Months Ended September 30, 2022 | ||||||||||||||||||||||||||||||||||||||
|
Balance, beginning of period
|
$ |
|
$ |
|
$ |
|
$ |
(
|
$ |
(
|
$ |
|
||||||||||||||||||||||||||
|
Total realized/unrealized gains (losses) included in net income (loss) (1), (2)
|
|
|
|
(
|
(
|
|
||||||||||||||||||||||||||||||||
|
Total realized/unrealized gains (losses) included in AOCI
|
|
|
|
(
|
|
|
||||||||||||||||||||||||||||||||
|
Purchases (3)
|
|
|
|
|
|
|
||||||||||||||||||||||||||||||||
|
Sales (3)
|
(
|
(
|
(
|
|
|
(
|
||||||||||||||||||||||||||||||||
|
Issuances (3)
|
|
|
|
(
|
|
(
|
||||||||||||||||||||||||||||||||
|
Settlements (3)
|
|
(
|
|
|
(
|
|
||||||||||||||||||||||||||||||||
|
Transfers into Level 3 (4)
|
|
|
|
|
|
|
||||||||||||||||||||||||||||||||
| Transfers out of Level 3 (4) |
(
|
|
|
(
|
|
(
|
||||||||||||||||||||||||||||||||
|
Balance, end of period
|
$ |
|
$ |
|
$ |
|
$ |
(
|
$ |
(
|
$ |
|
||||||||||||||||||||||||||
| Three Months Ended September 30, 2021 | ||||||||||||||||||||||||||||||||||||||
|
Balance, beginning of period
|
$ |
|
$ |
|
$ |
|
$ |
|
$ |
(
|
$ |
|
||||||||||||||||||||||||||
|
Total realized/unrealized gains (losses) included in net income (loss) (1), (2)
|
|
|
|
(
|
|
|
||||||||||||||||||||||||||||||||
|
Total realized/unrealized gains (losses) included in AOCI
|
(
|
|
|
|
|
|
||||||||||||||||||||||||||||||||
|
Purchases (3)
|
|
|
|
|
|
|
||||||||||||||||||||||||||||||||
|
Sales (3)
|
(
|
|
(
|
|
|
(
|
||||||||||||||||||||||||||||||||
|
Issuances (3)
|
|
|
|
(
|
|
|
||||||||||||||||||||||||||||||||
|
Settlements (3)
|
|
(
|
|
(
|
(
|
|
||||||||||||||||||||||||||||||||
|
Transfers into Level 3 (4)
|
|
|
|
|
|
|
||||||||||||||||||||||||||||||||
| Transfers out of Level 3 (4) |
(
|
|
(
|
|
|
(
|
||||||||||||||||||||||||||||||||
|
Balance, end of period
|
$ |
|
$ |
|
$ |
|
$ |
(
|
$ |
(
|
$ |
|
||||||||||||||||||||||||||
|
Changes in unrealized gains (losses) included in
net income (loss) for the instruments still held
at September 30, 2022 (5)
|
$ |
|
$ |
|
$ |
|
$ |
(
|
$ |
(
|
$ |
|
||||||||||||||||||||||||||
|
Changes in unrealized gains (losses) included in
net income (loss) for the instruments still held
at September 30, 2021 (5)
|
$ |
|
$ |
(
|
$ |
|
$ |
(
|
$ |
|
$ |
|
||||||||||||||||||||||||||
|
Changes in unrealized gains (losses) included in
AOCI for the instruments still held
at September 30, 2022 (5)
|
$ |
|
$ |
|
$ |
|
$ |
(
|
$ |
|
$ |
|
||||||||||||||||||||||||||
|
Changes in unrealized gains (losses) included in
AOCI for the instruments still held
at September 30, 2021 (5)
|
$ |
|
$ |
|
$ |
|
$ |
|
$ |
|
$ |
|
||||||||||||||||||||||||||
66
MetLife, Inc.
Notes to the Interim Condensed Consolidated Financial Statements (Unaudited) — (continued)
8. Fair Value (continued)
| Fair Value Measurements Using Significant Unobservable Inputs (Level 3) | ||||||||||||||||||||||||||||||||||||||
| Fixed Maturity Securities AFS | ||||||||||||||||||||||||||||||||||||||
| Corporate (6) |
Foreign
Government |
Structured
Products |
Municipals |
Equity
Securities |
Unit-linked
and FVO Securities |
|||||||||||||||||||||||||||||||||
| (In millions) | ||||||||||||||||||||||||||||||||||||||
| Nine Months Ended September 30, 2022 | ||||||||||||||||||||||||||||||||||||||
|
Balance, beginning of period
|
$ |
|
$ |
|
$ |
|
$ |
|
$ |
|
$ |
|
||||||||||||||||||||||||||
|
Total realized/unrealized gains (losses) included in net income (loss) (1), (2)
|
(
|
(
|
|
|
|
(
|
||||||||||||||||||||||||||||||||
|
Total realized/unrealized gains (losses) included in AOCI
|
(
|
|
(
|
|
|
|
||||||||||||||||||||||||||||||||
|
Purchases (3)
|
|
|
|
|
|
|
||||||||||||||||||||||||||||||||
|
Sales (3)
|
(
|
(
|
(
|
|
(
|
(
|
||||||||||||||||||||||||||||||||
|
Issuances (3)
|
|
|
|
|
|
|
||||||||||||||||||||||||||||||||
|
Settlements (3)
|
|
|
|
|
|
|
||||||||||||||||||||||||||||||||
|
Transfers into Level 3 (4)
|
|
|
|
|
|
|
||||||||||||||||||||||||||||||||
| Transfers out of Level 3 (4) |
(
|
(
|
(
|
|
(
|
(
|
||||||||||||||||||||||||||||||||
|
Balance, end of period
|
$ |
|
$ |
|
$ |
|
$ |
|
$ |
|
$ |
|
||||||||||||||||||||||||||
| Nine Months Ended September 30, 2021 | ||||||||||||||||||||||||||||||||||||||
|
Balance, beginning of period
|
$ |
|
$ |
|
$ |
|
$ |
|
$ |
|
$ |
|
||||||||||||||||||||||||||
|
Total realized/unrealized gains (losses) included in net income (loss) (1), (2)
|
(
|
|
|
|
|
|
||||||||||||||||||||||||||||||||
|
Total realized/unrealized gains (losses) included in AOCI
|
(
|
(
|
|
|
|
|
||||||||||||||||||||||||||||||||
|
Purchases (3)
|
|
|
|
|
|
|
||||||||||||||||||||||||||||||||
|
Sales (3)
|
(
|
(
|
(
|
|
(
|
(
|
||||||||||||||||||||||||||||||||
|
Issuances (3)
|
|
|
|
|
|
|
||||||||||||||||||||||||||||||||
|
Settlements (3)
|
|
|
|
|
|
|
||||||||||||||||||||||||||||||||
|
Transfers into Level 3 (4)
|
|
|
|
|
|
|
||||||||||||||||||||||||||||||||
| Transfers out of Level 3 (4) |
(
|
(
|
(
|
|
(
|
(
|
||||||||||||||||||||||||||||||||
|
Balance, end of period
|
$ |
|
$ |
|
$ |
|
$ |
|
$ |
|
$ |
|
||||||||||||||||||||||||||
|
Changes in unrealized gains (losses) included in
net income (loss) for the instruments still held
at September 30, 2022 (5)
|
$ |
(
|
$ |
(
|
$ |
|
$ |
|
$ |
|
$ |
(
|
||||||||||||||||||||||||||
|
Changes in unrealized gains (losses) included in
net income (loss) for the instruments still held
at September 30, 2021 (5)
|
$ |
(
|
$ |
|
$ |
|
$ |
|
$ |
|
$ |
|
||||||||||||||||||||||||||
|
Changes in unrealized gains (losses) included in
AOCI for the instruments still held
at September 30, 2022 (5)
|
$ |
(
|
$ |
|
$ |
(
|
$ |
|
$ |
|
$ |
|
||||||||||||||||||||||||||
|
Changes in unrealized gains (losses) included in
AOCI for the instruments still held
at September 30, 2021 (5)
|
$ |
(
|
$ |
(
|
$ |
|
$ |
|
$ |
|
$ |
|
||||||||||||||||||||||||||
67
MetLife, Inc.
Notes to the Interim Condensed Consolidated Financial Statements (Unaudited) — (continued)
8. Fair Value (continued)
| Fair Value Measurements Using Significant Unobservable Inputs (Level 3) | ||||||||||||||||||||||||||||||||||||||
|
Short-term
Investments |
Residential
Mortgage Loans — FVO |
Other
Investments |
Net
Derivatives (7) |
Net Embedded
Derivatives (8) |
Separate
Accounts (9) |
|||||||||||||||||||||||||||||||||
| (In millions) | ||||||||||||||||||||||||||||||||||||||
| Nine Months Ended September 30, 2022 | ||||||||||||||||||||||||||||||||||||||
|
Balance, beginning of period
|
$ |
|
$ |
|
$ |
|
$ |
(
|
$ |
(
|
$ |
|
||||||||||||||||||||||||||
|
Total realized/unrealized gains (losses) included in net income (loss) (1), (2)
|
(
|
(
|
|
(
|
(
|
|
||||||||||||||||||||||||||||||||
|
Total realized/unrealized gains (losses) included in AOCI
|
|
|
|
(
|
|
|
||||||||||||||||||||||||||||||||
|
Purchases (3)
|
|
|
|
|
|
|
||||||||||||||||||||||||||||||||
|
Sales (3)
|
(
|
(
|
(
|
|
|
(
|
||||||||||||||||||||||||||||||||
|
Issuances (3)
|
|
|
|
(
|
|
|
||||||||||||||||||||||||||||||||
|
Settlements (3)
|
|
(
|
|
|
(
|
|
||||||||||||||||||||||||||||||||
|
Transfers into Level 3 (4)
|
|
|
|
|
|
|
||||||||||||||||||||||||||||||||
| Transfers out of Level 3 (4) |
|
|
(
|
|
|
(
|
||||||||||||||||||||||||||||||||
|
Balance, end of period
|
$ |
|
$ |
|
$ |
|
$ |
(
|
$ |
(
|
$ |
|
||||||||||||||||||||||||||
| Nine Months Ended September 30, 2021 | ||||||||||||||||||||||||||||||||||||||
|
Balance, beginning of period
|
$ |
|
$ |
|
$ |
|
$ |
|
$ |
(
|
$ |
|
||||||||||||||||||||||||||
|
Total realized/unrealized gains (losses) included in net income (loss) (1), (2)
|
|
(
|
|
(
|
|
|
||||||||||||||||||||||||||||||||
|
Total realized/unrealized gains (losses) included in AOCI
|
(
|
|
|
(
|
|
|
||||||||||||||||||||||||||||||||
|
Purchases (3)
|
|
|
|
|
|
|
||||||||||||||||||||||||||||||||
|
Sales (3)
|
(
|
(
|
(
|
|
|
(
|
||||||||||||||||||||||||||||||||
|
Issuances (3)
|
|
|
|
(
|
|
(
|
||||||||||||||||||||||||||||||||
|
Settlements (3)
|
|
(
|
|
|
(
|
|
||||||||||||||||||||||||||||||||
| Transfers into Level 3 (4) |
|
|
|
|
|
|
||||||||||||||||||||||||||||||||
| Transfers out of Level 3 (4) |
(
|
|
(
|
(
|
|
(
|
||||||||||||||||||||||||||||||||
|
Balance, end of period
|
$ |
|
$ |
|
$ |
|
$ |
(
|
$ |
(
|
$ |
|
||||||||||||||||||||||||||
|
Changes in unrealized gains (losses) included in
net income (loss) for the instruments still held
at September 30, 2022 (5)
|
$ |
(
|
$ |
|
$ |
|
$ |
(
|
$ |
(
|
$ |
|
||||||||||||||||||||||||||
|
Changes in unrealized gains (losses) included in
net income (loss) for the instruments still held
at September 30, 2021 (5)
|
$ |
|
$ |
(
|
$ |
|
$ |
(
|
$ |
|
$ |
|
||||||||||||||||||||||||||
|
Changes in unrealized gains (losses) included in
AOCI for the instruments still held
at September 30, 2022 (5)
|
$ |
|
$ |
|
$ |
|
$ |
(
|
$ |
|
$ |
|
||||||||||||||||||||||||||
|
Changes in unrealized gains (losses) included in
AOCI for the instruments still held
at September 30, 2021 (5)
|
$ |
|
$ |
|
$ |
|
$ |
(
|
$ |
|
$ |
|
||||||||||||||||||||||||||
__________________
(1)
Amortization of premium/accretion of discount is included within net investment income. Impairments and changes in ACL charged to net income (loss) on certain securities are included in net investment gains (losses), while changes in estimated fair value of Unit-linked and FVO Securities and residential mortgage loans — FVO are included in net investment income. Lapses associated with net embedded derivatives are included in net derivative gains (losses). Substantially all realized/unrealized gains (losses) included in net income (loss) for net derivatives and net embedded derivatives are reported in net derivative gains (losses).
(2)
Interest and dividend accruals, as well as cash interest coupons and dividends received, are excluded from the rollforward.
(3)
Items purchased/issued and then sold/settled in the same period are excluded from the rollforward. Fees attributed to embedded derivatives are included in settlements.
(4)
Items transferred into and then out of Level 3 in the same period are excluded from the rollforward.
68
MetLife, Inc.
Notes to the Interim Condensed Consolidated Financial Statements (Unaudited) — (continued)
8. Fair Value (continued)
(5)
Changes in unrealized gains (losses) included in net income (loss) and included in AOCI relate to assets and liabilities still held at the end of the respective periods. Substantially all changes in unrealized gains (losses) included in net income (loss) for net derivatives and net embedded derivatives are reported in net derivative gains (losses).
(6)
Comprised of U.S. and foreign corporate securities.
(7)
Freestanding derivative assets and liabilities are presented net for purposes of the rollforward.
(8)
Embedded derivative assets and liabilities are presented net for purposes of the rollforward.
(9)
Investment performance related to separate account assets is fully offset by corresponding amounts credited to contractholders within separate account liabilities. Therefore, such changes in estimated fair value are not recorded in net income (loss). For the purpose of this disclosure, these changes are presented within net income (loss). Separate account assets and liabilities are presented net for the purposes of the rollforward.
Fair Value Option
The Company elects the FVO for certain residential mortgage loans that are managed on a total return basis.
The following table presents information for residential mortgage loans which are accounted for under the FVO and were initially measured at fair value.
| September 30, 2022 | December 31, 2021 | |||||||||||||
| (In millions) | ||||||||||||||
| Unpaid principal balance | $ |
|
$ |
|
||||||||||
| Difference between estimated fair value and unpaid principal balance |
|
(
|
||||||||||||
| Carrying value at estimated fair value | $ |
|
$ |
|
||||||||||
| Loans in nonaccrual status | $ |
|
$ |
|
||||||||||
|
Loans more than 90 days past due
|
$ |
|
$ |
|
||||||||||
|
Loans in nonaccrual status or more than 90 days past due, or both — difference between aggregate estimated fair value and unpaid principal balance
|
$ |
|
$ |
(
|
||||||||||
Fair Value of Financial Instruments Carried at Other Than Fair Value
The following tables provide fair value information for financial instruments that are carried on the balance sheet at amounts other than fair value. These tables exclude the following financial instruments: cash and cash equivalents, accrued investment income, payables for collateral under securities loaned and other transactions, short-term debt and those short-term investments that are not securities, such as time deposits, and therefore are not included in the three-level hierarchy table disclosed in the “— Recurring Fair Value Measurements” section. The Company believes that due to the short-term nature of these excluded assets, which are primarily classified in Level 2, the estimated fair value approximates carrying value. All remaining balance sheet amounts excluded from the tables below are not considered financial instruments subject to this disclosure.
69
MetLife, Inc.
Notes to the Interim Condensed Consolidated Financial Statements (Unaudited) — (continued)
8. Fair Value (continued)
The carrying values and estimated fair values for such financial instruments, and their corresponding placement in the fair value hierarchy, are summarized as follows at:
| September 30, 2022 | ||||||||||||||||||||||||||||||||
| Fair Value Hierarchy | ||||||||||||||||||||||||||||||||
|
Carrying
Value
|
Level 1 | Level 2 | Level 3 |
Total
Estimated
Fair Value
|
||||||||||||||||||||||||||||
| (In millions) | ||||||||||||||||||||||||||||||||
|
Assets
|
||||||||||||||||||||||||||||||||
| Mortgage loans (1) | $ |
|
$ |
|
$ |
|
$ |
|
$ |
|
||||||||||||||||||||||
|
Policy loans
|
$ |
|
$ |
|
$ |
|
$ |
|
$ |
|
||||||||||||||||||||||
|
Other invested assets
|
$ |
|
$ |
|
$ |
|
$ |
|
$ |
|
||||||||||||||||||||||
|
Premiums, reinsurance and other receivables
|
$ |
|
$ |
|
$ |
|
$ |
|
$ |
|
||||||||||||||||||||||
|
Other assets
|
$ |
|
$ |
|
$ |
|
$ |
|
$ |
|
||||||||||||||||||||||
|
Liabilities
|
||||||||||||||||||||||||||||||||
|
Policyholder account balances
|
$ |
|
$ |
|
$ |
|
$ |
|
$ |
|
||||||||||||||||||||||
|
Long-term debt
|
$ |
|
$ |
|
$ |
|
$ |
|
$ |
|
||||||||||||||||||||||
|
Collateral financing arrangement
|
$ |
|
$ |
|
$ |
|
$ |
|
$ |
|
||||||||||||||||||||||
|
Junior subordinated debt securities
|
$ |
|
$ |
|
$ |
|
$ |
|
$ |
|
||||||||||||||||||||||
|
Other liabilities
|
$ |
|
$ |
|
$ |
|
$ |
|
$ |
|
||||||||||||||||||||||
|
Separate account liabilities
|
$ |
|
$ |
|
$ |
|
$ |
|
$ |
|
||||||||||||||||||||||
| December 31, 2021 (2) | ||||||||||||||||||||||||||||||||
| Fair Value Hierarchy | ||||||||||||||||||||||||||||||||
|
Carrying
Value |
Level 1 | Level 2 | Level 3 |
Total
Estimated Fair Value |
||||||||||||||||||||||||||||
| (In millions) | ||||||||||||||||||||||||||||||||
| Assets | ||||||||||||||||||||||||||||||||
|
Mortgage loans (1)
|
$ |
|
$ |
|
$ |
|
$ |
|
$ |
|
||||||||||||||||||||||
| Policy loans | $ |
|
$ |
|
$ |
|
$ |
|
$ |
|
||||||||||||||||||||||
| Other invested assets | $ |
|
$ |
|
$ |
|
$ |
|
$ |
|
||||||||||||||||||||||
|
Premiums, reinsurance and other receivables
|
$ |
|
$ |
|
$ |
|
$ |
|
$ |
|
||||||||||||||||||||||
| Other assets | $ |
|
$ |
|
$ |
|
$ |
|
$ |
|
||||||||||||||||||||||
| Liabilities | ||||||||||||||||||||||||||||||||
| Policyholder account balances | $ |
|
$ |
|
$ |
|
$ |
|
$ |
|
||||||||||||||||||||||
| Long-term debt | $ |
|
$ |
|
$ |
|
$ |
|
$ |
|
||||||||||||||||||||||
| Collateral financing arrangement | $ |
|
$ |
|
$ |
|
$ |
|
$ |
|
||||||||||||||||||||||
| Junior subordinated debt securities | $ |
|
$ |
|
$ |
|
$ |
|
$ |
|
||||||||||||||||||||||
| Other liabilities | $ |
|
$ |
|
$ |
|
$ |
|
$ |
|
||||||||||||||||||||||
| Separate account liabilities | $ |
|
$ |
|
$ |
|
$ |
|
$ |
|
||||||||||||||||||||||
_________________
(1)
Includes mortgage loans measured at estimated fair value on a nonrecurring basis and excludes mortgage loans measured at estimated fair value on a recurring basis.
(2)
Excludes amounts reclassified to assets held-for-sale or liabilities held-for-sale. See Note 3 for information on the Company’s business dispositions.
70
MetLife, Inc.
Notes to the Interim Condensed Consolidated Financial Statements (Unaudited) — (continued)
Preferred Stock
Preferred stock authorized, issued and outstanding was as follows at both September 30, 2022 and December 31, 2021:
| Series |
Shares
Authorized |
Shares Issued and
Outstanding |
||||||||||||
| Floating Rate Non-Cumulative Preferred Stock, Series A |
|
|
||||||||||||
| 5.875% Fixed-to-Floating Rate Non-Cumulative Preferred Stock, Series D |
|
|
||||||||||||
| 5.625% Non-Cumulative Preferred Stock, Series E |
|
|
||||||||||||
| 4.75% Non-Cumulative Preferred Stock, Series F |
|
|
||||||||||||
| 3.85% Fixed Rate Reset Non-Cumulative Preferred Stock, Series G |
|
|
||||||||||||
| Series A Junior Participating Preferred Stock |
|
|
||||||||||||
| Not designated |
|
|
||||||||||||
| Total |
|
|
||||||||||||
The per share and aggregate dividends declared for MetLife, Inc.’s preferred stock were as follows:
| Three Months Ended September 30, | Nine Months Ended September 30, | |||||||||||||||||||||||||||||||||||||||||||||||||
| 2022 | 2021 | 2022 | 2021 | |||||||||||||||||||||||||||||||||||||||||||||||
| Series | Per Share | Aggregate | Per Share | Aggregate | Per Share | Aggregate | Per Share | Aggregate | ||||||||||||||||||||||||||||||||||||||||||
| (In millions, except per share data) | ||||||||||||||||||||||||||||||||||||||||||||||||||
| A | $ |
|
$ |
|
$ |
|
$ |
|
$ |
|
$ |
|
$ |
|
$ |
|
||||||||||||||||||||||||||||||||||
| C (1) | $ |
|
|
$ |
|
|
$ |
|
|
$ |
|
|
||||||||||||||||||||||||||||||||||||||
| D | $ |
|
|
$ |
|
|
$ |
|
|
$ |
|
|
||||||||||||||||||||||||||||||||||||||
| E | $ |
|
|
$ |
|
|
$ |
|
|
$ |
|
|
||||||||||||||||||||||||||||||||||||||
| F | $ |
|
|
$ |
|
|
$ |
|
|
$ |
|
|
||||||||||||||||||||||||||||||||||||||
| G | $ |
|
|
$ |
|
|
$ |
|
|
$ |
|
|
||||||||||||||||||||||||||||||||||||||
| Total | $ |
|
$ |
|
$ |
|
$ |
|
||||||||||||||||||||||||||||||||||||||||||
__________________
(1)
Dividends were paid through the dividend payment date of June 15, 2021, when all outstanding shares of MetLife, Inc.’s 5.25% Fixed-to-Floating Rate Non-Cumulative Preferred Stock, Series C were redeemed and eliminated. See Note 16 of the Notes to the Consolidated Financial Statements included in the 2021 Annual Report.
Common Stock
MetLife, Inc. announced that its Board of Directors authorized common stock repurchases as follows:
| Authorization Remaining at | ||||||||||||||
| Announcement Date | Authorization Amount | September 30, 2022 | ||||||||||||
| (In millions) | ||||||||||||||
| May 4, 2022 | $ |
|
$ |
|
||||||||||
| August 4, 2021 | $ |
|
$ |
|
||||||||||
| December 11, 2020 | $ |
|
$ |
|
||||||||||
Under these authorizations, MetLife, Inc. may purchase its common stock from the MetLife Policyholder Trust, in the open market (including pursuant to the terms of a pre-set trading plan meeting the requirements of Rule 10b5-1 under the Securities Exchange Act of 1934), and in privately negotiated transactions. Common stock repurchases are subject to the
71
MetLife, Inc.
Notes to the Interim Condensed Consolidated Financial Statements (Unaudited) — (continued)
10. Equity (continued)
discretion of MetLife, Inc.’s Board of Directors and will depend upon the Company’s capital position, liquidity, financial strength and credit ratings, general market conditions, the market price of MetLife, Inc.’s common stock compared to management’s assessment of the stock’s underlying value, applicable regulatory approvals, and other legal and accounting factors.
For the nine months ended September 30, 2022 and 2021, MetLife, Inc. repurchased
41,267,149
shares and
52,857,261
shares of its common stock, respectively, through open market purchases for $
2.7
billion and $
3.1
billion, respectively.
Stock-Based Compensation Plans
Performance Shares and Performance Units
Final Performance Shares are paid in shares of MetLife, Inc. common stock. Final Performance Units are payable in cash equal to the closing price of MetLife, Inc. common stock on a date following the last day of the three-year performance period. The performance factor for the January 1, 2019 – December 31, 2021 performance period was
141.3
%, which was determined within a possible range from
0
% to
175
%. This factor has been applied to the
1,485,512
Performance Shares and
156,090
Performance Units associated with that performance period that vested on December 31, 2021. As a result, in the first quarter of 2022, MetLife, Inc. issued
2,099,028
shares of its common stock (less withholding for taxes and other items, as applicable), excluding shares that payees choose to defer, and MetLife, Inc. or its affiliates paid the cash value of
220,555
Performance Units (less withholding for taxes and other items, as applicable).
Dividend Restrictions
Insurance Operations
For the nine months ended September 30, 2022, American Life Insurance Company paid a dividend of $
620
million to MetLife, Inc., for which regulatory approval was obtained as required.
See Note 16 of the Notes to Consolidated Financial Statements included in the 2021 Annual Report for additional information on dividend restrictions.
72
MetLife, Inc.
Notes to the Interim Condensed Consolidated Financial Statements (Unaudited) — (continued)
10. Equity (continued)
Accumulated Other Comprehensive Income (Loss)
|
Three Months
Ended September 30, 2022 |
||||||||||||||||||||||||||||||||
|
Unrealized
Investment Gains (Losses), Net of Related Offsets (1) |
Unrealized
Gains (Losses) on Derivatives |
Foreign
Currency Translation Adjustments |
Defined
Benefit Plans Adjustment |
Total | ||||||||||||||||||||||||||||
| (In millions) | ||||||||||||||||||||||||||||||||
|
Balance, beginning of period
|
$ |
(
|
$ |
|
$ |
(
|
$ |
(
|
$ |
(
|
||||||||||||||||||||||
| OCI before reclassifications |
(
|
|
(
|
|
(
|
|||||||||||||||||||||||||||
|
Deferred income tax benefit (expense)
|
|
(
|
(
|
|
|
|||||||||||||||||||||||||||
|
AOCI before reclassifications, net of income tax
|
(
|
|
(
|
(
|
(
|
|||||||||||||||||||||||||||
|
Amounts reclassified from AOCI
|
|
|
|
|
|
|||||||||||||||||||||||||||
|
Deferred income tax benefit (expense)
|
(
|
(
|
|
(
|
(
|
|||||||||||||||||||||||||||
|
Amounts reclassified from AOCI, net of income tax
|
|
|
|
|
|
|||||||||||||||||||||||||||
|
Balance, end of period
|
$ |
(
|
$ |
|
$ |
(
|
$ |
(
|
$ |
(
|
||||||||||||||||||||||
|
Three Months
Ended September 30, 2021 |
||||||||||||||||||||||||||||||||
|
Unrealized
Investment Gains (Losses), Net of Related Offsets (1) |
Unrealized
Gains (Losses) on Derivatives |
Foreign
Currency Translation Adjustments |
Defined
Benefit Plans Adjustment |
Total | ||||||||||||||||||||||||||||
| (In millions) | ||||||||||||||||||||||||||||||||
|
Balance, beginning of period
|
$ |
|
$ |
|
$ |
(
|
$ |
(
|
$ |
|
||||||||||||||||||||||
| OCI before reclassifications |
(
|
|
(
|
|
(
|
|||||||||||||||||||||||||||
|
Deferred income tax benefit (expense)
|
|
(
|
(
|
(
|
|
|||||||||||||||||||||||||||
|
AOCI before reclassifications, net of income tax
|
|
|
(
|
(
|
|
|||||||||||||||||||||||||||
|
Amounts reclassified from AOCI
|
(
|
|
|
|
|
|||||||||||||||||||||||||||
|
Deferred income tax benefit (expense)
|
|
(
|
|
(
|
(
|
|||||||||||||||||||||||||||
|
Amounts reclassified from AOCI, net of income tax
|
(
|
|
|
|
|
|||||||||||||||||||||||||||
| Sale of subsidiary, net of income tax |
|
|
|
|
|
|||||||||||||||||||||||||||
|
Balance, end of period
|
$ |
|
$ |
|
$ |
(
|
$ |
(
|
$ |
|
||||||||||||||||||||||
73
MetLife, Inc.
Notes to the Interim Condensed Consolidated Financial Statements (Unaudited) — (continued)
10. Equity (continued)
|
Nine Months
Ended September 30, 2022 |
||||||||||||||||||||||||||||||||
|
Unrealized
Investment Gains (Losses), Net of Related Offsets (1) |
Unrealized
Gains (Losses) on Derivatives |
Foreign
Currency Translation Adjustments |
Defined
Benefit Plans Adjustment |
Total | ||||||||||||||||||||||||||||
| (In millions) | ||||||||||||||||||||||||||||||||
|
Balance, beginning of period
|
$ |
|
$ |
|
$ |
(
|
$ |
(
|
$ |
|
||||||||||||||||||||||
| OCI before reclassifications |
(
|
|
(
|
|
(
|
|||||||||||||||||||||||||||
|
Deferred income tax benefit (expense)
|
|
(
|
(
|
(
|
|
|||||||||||||||||||||||||||
|
AOCI before reclassifications, net of income tax
|
(
|
|
(
|
(
|
(
|
|||||||||||||||||||||||||||
|
Amounts reclassified from AOCI
|
|
|
|
|
|
|||||||||||||||||||||||||||
|
Deferred income tax benefit (expense)
|
(
|
(
|
|
(
|
(
|
|||||||||||||||||||||||||||
| Amounts reclassified from AOCI, net of income tax |
|
|
|
|
|
|||||||||||||||||||||||||||
| Sale of subsidiaries, net of income tax (2) |
(
|
|
|
(
|
|
|||||||||||||||||||||||||||
|
Balance, end of period
|
$ |
(
|
$ |
|
$ |
(
|
$ |
(
|
$ |
(
|
||||||||||||||||||||||
|
Nine Months
Ended September 30, 2021 |
||||||||||||||||||||||||||||||||
|
Unrealized
Investment Gains (Losses), Net of Related Offsets (1) |
Unrealized
Gains (Losses) on Derivatives |
Foreign
Currency Translation Adjustments |
Defined
Benefit Plans Adjustment |
Total | ||||||||||||||||||||||||||||
| (In millions) | ||||||||||||||||||||||||||||||||
|
Balance, beginning of period
|
$ |
|
$ |
|
$ |
(
|
$ |
(
|
$ |
|
||||||||||||||||||||||
| OCI before reclassifications |
(
|
(
|
(
|
|
(
|
|||||||||||||||||||||||||||
|
Deferred income tax benefit (expense)
|
|
|
(
|
(
|
|
|||||||||||||||||||||||||||
|
AOCI before reclassifications, net of income tax
|
|
|
(
|
(
|
|
|||||||||||||||||||||||||||
|
Amounts reclassified from AOCI
|
(
|
|
|
|
|
|||||||||||||||||||||||||||
|
Deferred income tax benefit (expense)
|
|
(
|
|
(
|
(
|
|||||||||||||||||||||||||||
|
Amounts reclassified from AOCI, net of income tax
|
(
|
|
|
|
|
|||||||||||||||||||||||||||
| Sale of subsidiaries, net of income tax |
(
|
|
|
|
|
|||||||||||||||||||||||||||
|
Balance, end of period
|
$ |
|
$ |
|
$ |
(
|
$ |
(
|
$ |
|
||||||||||||||||||||||
__________________
(1)
See Note 6 for information on offsets to investments related to policyholder liabilities, DAC, VOBA and DSI
.
(2)
S
ee Note 3 for information on the Company’s business dispositions
.
74
MetLife, Inc.
Notes to the Interim Condensed Consolidated Financial Statements (Unaudited) — (continued)
10. Equity (continued)
Information regarding amounts reclassified out of each component of AOCI was as follows:
|
Three Months
Ended September 30, |
Nine Months
Ended September 30, |
|||||||||||||||||||||||||||||||
| 2022 | 2021 | 2022 | 2021 | |||||||||||||||||||||||||||||
| AOCI Components | Amounts Reclassified from AOCI |
Consolidated Statements of
Operations and Comprehensive Income (Loss) Locations |
||||||||||||||||||||||||||||||
| (In millions) | ||||||||||||||||||||||||||||||||
|
Net unrealized investment gains (losses):
|
||||||||||||||||||||||||||||||||
|
Net unrealized investment gains (losses)
|
$ |
(
|
$ |
|
$ |
(
|
$ |
|
Net investment gains (losses) | |||||||||||||||||||||||
|
Net unrealized investment gains (losses)
|
|
(
|
|
(
|
Net investment income | |||||||||||||||||||||||||||
|
Net unrealized investment gains (losses)
|
(
|
(
|
|
|
Net derivative gains (losses) | |||||||||||||||||||||||||||
|
Net unrealized investment gains (losses), before income tax
|
(
|
|
(
|
|
||||||||||||||||||||||||||||
|
Income tax (expense) benefit
|
|
(
|
|
(
|
||||||||||||||||||||||||||||
|
Net unrealized investment gains (losses), net of income tax
|
(
|
|
(
|
|
||||||||||||||||||||||||||||
|
Unrealized gains (losses) on derivatives - cash flow hedges:
|
||||||||||||||||||||||||||||||||
|
Interest rate derivatives
|
|
|
|
|
Net investment income | |||||||||||||||||||||||||||
|
Interest rate derivatives
|
(
|
|
|
|
Net investment gains (losses) | |||||||||||||||||||||||||||
|
Interest rate derivatives
|
|
|
|
|
Other expenses | |||||||||||||||||||||||||||
|
Foreign currency exchange rate derivatives
|
|
|
|
|
Net investment income | |||||||||||||||||||||||||||
|
Foreign currency exchange rate derivatives
|
(
|
(
|
(
|
(
|
Net investment gains (losses) | |||||||||||||||||||||||||||
| Foreign currency exchange rate derivatives |
|
|
|
|
Other expenses | |||||||||||||||||||||||||||
|
Gains (losses) on cash flow hedges, before income tax
|
(
|
(
|
(
|
(
|
||||||||||||||||||||||||||||
|
Income tax (expense) benefit
|
|
|
|
|
||||||||||||||||||||||||||||
|
Gains (losses) on cash flow hedges, net of income tax
|
(
|
(
|
(
|
(
|
||||||||||||||||||||||||||||
|
Defined benefit plans adjustment: (1)
|
||||||||||||||||||||||||||||||||
|
Amortization of net actuarial gains (losses)
|
(
|
(
|
(
|
(
|
||||||||||||||||||||||||||||
|
Amortization of prior service (costs) credit
|
|
|
|
|
||||||||||||||||||||||||||||
|
Amortization of defined benefit plan items, before income tax
|
(
|
(
|
(
|
(
|
||||||||||||||||||||||||||||
|
Income tax (expense) benefit
|
|
|
|
|
||||||||||||||||||||||||||||
|
Amortization of defined benefit plan items, net of income tax
|
(
|
(
|
(
|
(
|
||||||||||||||||||||||||||||
|
Total reclassifications, net of income tax
|
$ |
(
|
$ |
(
|
$ |
(
|
$ |
(
|
||||||||||||||||||||||||
__________________
(1)
These AOCI components are included in the computation of net periodic benefit costs. See Note 12.
75
MetLife, Inc.
Notes to the Interim Condensed Consolidated Financial Statements (Unaudited) — (continued)
Other Revenues
Information on other revenues, which primarily includes fees related to service contracts from customers, was as follows:
|
Three Months
Ended September 30, |
Nine Months
Ended September 30, |
|||||||||||||||||||||||||
| 2022 | 2021 | 2022 | 2021 | |||||||||||||||||||||||
| (In millions) | ||||||||||||||||||||||||||
| Vision fee for service arrangements | $ |
|
$ |
|
$ |
|
$ |
|
||||||||||||||||||
| Prepaid legal plans |
|
|
|
|
||||||||||||||||||||||
| Fee-based investment management |
|
|
|
|
||||||||||||||||||||||
| Recordkeeping and administrative services (1) |
|
|
|
|
||||||||||||||||||||||
| Administrative services-only contracts |
|
|
|
|
||||||||||||||||||||||
| Other revenue from service contracts from customers |
|
|
|
|
||||||||||||||||||||||
|
Total revenues from service contracts from customers
|
|
|
|
|
||||||||||||||||||||||
| Other |
|
|
|
|
||||||||||||||||||||||
|
Total other revenues
|
$ |
|
$ |
|
$ |
|
$ |
|
||||||||||||||||||
__________________
(1)
Related to products and businesses no longer actively marketed by the Company.
Receivables related to revenues from service contracts from customers were $
222
million and $
235
million at September 30, 2022 and December 31, 2021, respectively.
Other Expenses
Information on other expenses was as follows:
|
Three Months
Ended September 30, |
Nine Months
Ended September 30, |
|||||||||||||||||||||||||
| 2022 | 2021 | 2022 | 2021 | |||||||||||||||||||||||
| (In millions) | ||||||||||||||||||||||||||
| Employee-related costs (1) | $ |
|
$ |
|
$ |
|
$ |
|
||||||||||||||||||
|
Third party staffing costs
|
|
|
|
|
||||||||||||||||||||||
|
General and administrative expenses
|
|
|
|
|
||||||||||||||||||||||
|
Pension, postretirement and postemployment benefit costs
|
|
|
|
|
||||||||||||||||||||||
|
Premium taxes, other taxes, and licenses & fees
|
|
|
|
|
||||||||||||||||||||||
|
Commissions and other variable expenses
|
|
|
|
|
||||||||||||||||||||||
|
Capitalization of DAC
|
(
|
(
|
(
|
(
|
||||||||||||||||||||||
|
Amortization of DAC and VOBA
|
|
|
|
|
||||||||||||||||||||||
|
Amortization of negative VOBA
|
(
|
(
|
(
|
(
|
||||||||||||||||||||||
|
Interest expense on debt
|
|
|
|
|
||||||||||||||||||||||
|
Total other expenses
|
$ |
|
$ |
|
$ |
|
$ |
|
||||||||||||||||||
__________________
(1)
Includes
$
30
million and $
145
million for the three months and nine months ended September 30, 2022, respectively, and ($
15
) million and ($
89
) million for the three months and nine months ended September 30, 2021, respectively, for the net change in cash surrender value of investments in certain life insurance policies, net of premiums paid.
76
MetLife, Inc.
Notes to the Interim Condensed Consolidated Financial Statements (Unaudited) — (continued)
Pension and Other Postretirement Benefit Plans
The components of net periodic benefit costs, reported in other expenses, were as follows:
|
Three Months
Ended September 30, |
||||||||||||||||||||||||||
| 2022 | 2021 | |||||||||||||||||||||||||
|
Pension
Benefits |
Other
Postretirement Benefits |
Pension
Benefits |
Other
Postretirement Benefits |
|||||||||||||||||||||||
| (In millions) | ||||||||||||||||||||||||||
| Service costs | $ |
|
$ |
|
$ |
|
$ |
|
||||||||||||||||||
| Interest costs |
|
|
|
|
||||||||||||||||||||||
| Expected return on plan assets |
(
|
(
|
(
|
(
|
||||||||||||||||||||||
| Amortization of net actuarial (gains) losses |
|
(
|
|
(
|
||||||||||||||||||||||
| Amortization of prior service costs (credit) |
(
|
|
(
|
|
||||||||||||||||||||||
| Net periodic benefit costs (credit) | $ |
|
$ |
(
|
$ |
|
$ |
(
|
||||||||||||||||||
|
Nine Months
Ended September 30, |
||||||||||||||||||||||||||
| 2022 | 2021 | |||||||||||||||||||||||||
|
Pension
Benefits |
Other
Postretirement Benefits |
Pension
Benefits |
Other
Postretirement Benefits |
|||||||||||||||||||||||
| (In millions) | ||||||||||||||||||||||||||
|
Service costs
|
$ |
|
$ |
|
$ |
|
$ |
|
||||||||||||||||||
|
Interest costs
|
|
|
|
|
||||||||||||||||||||||
| Curtailment (gains) losses |
|
|
(
|
|
||||||||||||||||||||||
|
Expected return on plan assets
|
(
|
(
|
(
|
(
|
||||||||||||||||||||||
|
Amortization of net actuarial (gains) losses
|
|
(
|
|
(
|
||||||||||||||||||||||
|
Amortization of prior service costs (credit)
|
(
|
|
(
|
|
||||||||||||||||||||||
|
Net periodic benefit costs (credit)
|
$ |
|
$ |
(
|
$ |
|
$ |
(
|
||||||||||||||||||
77
MetLife, Inc.
Notes to the Interim Condensed Consolidated Financial Statements (Unaudited) — (continued)
13. Income Tax (continued)
The following table presents the weighted average shares, basic earnings per common share and diluted earnings per common share:
|
Three Months
Ended September 30, |
Nine Months
Ended September 30, |
|||||||||||||||||||||||||
| 2022 | 2021 | 2022 | 2021 | |||||||||||||||||||||||
| (In millions, except per share data) | ||||||||||||||||||||||||||
|
Weighted Average Shares:
|
||||||||||||||||||||||||||
|
Weighted average common stock outstanding - basic
|
|
|
|
|
||||||||||||||||||||||
|
Incremental common shares from assumed exercise or issuance of stock-based awards
|
|
|
|
|
||||||||||||||||||||||
|
Weighted average common stock outstanding - diluted
|
|
|
|
|
||||||||||||||||||||||
|
Net Income (Loss):
|
||||||||||||||||||||||||||
|
Net income (loss)
|
$ |
|
$ |
|
$ |
|
$ |
|
||||||||||||||||||
|
Less: Net income (loss) attributable to noncontrolling interests
|
|
|
|
|
||||||||||||||||||||||
|
Less: Preferred stock dividends
|
|
|
|
|
||||||||||||||||||||||
| Preferred stock redemption premium |
|
|
|
|
||||||||||||||||||||||
|
Net income (loss) available to MetLife, Inc.’s common shareholders
|
$ |
|
$ |
|
$ |
|
$ |
|
||||||||||||||||||
|
Basic
|
$ |
|
$ |
|
$ |
|
$ |
|
||||||||||||||||||
|
Diluted
|
$ |
|
$ |
|
$ |
|
$ |
|
||||||||||||||||||
Contingencies
Litigation
The Company is a defendant in a large number of litigation matters. Putative or certified class action litigation and other litigation and claims and assessments against the Company, in addition to those discussed below and those otherwise provided for in the Company’s interim condensed consolidated financial statements, have arisen in the course of the Company’s business, including, but not limited to, in connection with its activities as an insurer, mortgage lending bank, employer, investor, investment advisor, broker-dealer, and taxpayer.
The Company also receives and responds to subpoenas or other inquiries seeking a broad range of information from state regulators, including state insurance commissioners; state attorneys general or other state governmental authorities; federal regulators, including the U.S. Securities and Exchange Commission; federal governmental authorities, including congressional committees; and the Financial Industry Regulatory Authority, as well as from local and national regulators and government authorities in jurisdictions outside the United States where the Company conducts business. The issues involved in information requests and regulatory matters vary widely, but can include inquiries or investigations concerning the Company’s compliance with applicable insurance and other laws and regulations. The Company cooperates in these inquiries.
78
MetLife, Inc.
Notes to the Interim Condensed Consolidated Financial Statements (Unaudited) — (continued)
15. Contingencies, Commitments and Guarantees (continued)
It is not possible to predict the ultimate outcome of all pending investigations and legal proceedings. The Company establishes liabilities for litigation and regulatory loss contingencies when it is probable that a loss has been incurred and the amount of the loss can be reasonably estimated. Liabilities have been established for a number of the matters noted below. In certain circumstances where liabilities have been established there may be coverage under one or more corporate insurance policies, pursuant to which there may be an insurance recovery. Insurance recoveries are recognized as gains when any contingencies relating to the insurance claim have been resolved, which is the earlier of when the gains are realized or realizable. It is possible that some of the matters could require the Company to pay damages or make other expenditures or establish accruals in amounts that could not be reasonably estimated at September 30, 2022. While the potential future charges could be material in the particular quarterly or annual periods in which they are recorded, based on information currently known to management, management does not believe any such charges are likely to have a material effect on the Company’s financial position. Given the large and/or indeterminate amounts sought in certain of these matters and the inherent unpredictability of litigation, it is possible that an adverse outcome in certain matters could, from time to time, have a material effect on the Company’s consolidated net income or cash flows in particular quarterly or annual periods.
Matters as to Which an Estimate Can Be Made
For some matters, the Company is able to estimate a reasonably possible range of loss. For matters where a loss is believed to be reasonably possible, but not probable, the Company has not made an accrual. As of September 30,
2022, the Company estimates the aggregate range of reasonably possible losses in excess of amounts accrued for these matters to be $
0
to $
125
million.
Matters as to Which an Estimate Cannot Be Made
For other matters, the Company is not currently able to estimate the reasonably possible loss or range of loss. The Company is often unable to estimate the possible loss or range of loss until developments in such matters have provided sufficient information to support an assessment of the range of possible loss, such as quantification of a damage demand from plaintiffs, discovery from other parties and investigation of factual allegations, rulings by the court on motions or appeals, analysis by experts, and the progress of settlement negotiations. On a quarterly and annual basis, the Company reviews relevant information with respect to litigation contingencies and updates its accruals, disclosures and estimates of reasonably possible losses or ranges of loss based on such reviews.
Asbestos-Related Claims
MLIC is and has been a defendant in a large number of asbestos-related suits filed primarily in state courts. These suits principally allege that the plaintiff or plaintiffs suffered personal injury resulting from exposure to asbestos and seek both actual and punitive damages. MLIC has never engaged in the business of manufacturing or selling asbestos-containing products, nor has MLIC issued liability or workers’ compensation insurance to companies in the business of manufacturing or selling asbestos-containing products. The lawsuits principally have focused on allegations with respect to certain research, publication and other activities of one or more of MLIC’s employees during the period from the 1920s through approximately the 1950s and allege that MLIC learned or should have learned of certain health risks posed by asbestos and, among other things, improperly publicized or failed to disclose those health risks. MLIC believes that it should not have legal liability in these cases. The outcome of most asbestos litigation matters, however, is uncertain and can be impacted by numerous variables, including differences in legal rulings in various jurisdictions, the nature of the alleged injury and factors unrelated to the ultimate legal merit of the claims asserted against MLIC.
MLIC’s defenses include that: (i) MLIC owed no duty to the plaintiffs; (ii) plaintiffs did not rely on any actions of MLIC; (iii) MLIC’s conduct was not the cause of the plaintiffs’ injuries; and (iv) plaintiffs’ exposure occurred after the dangers of asbestos were known. During the course of the litigation, certain trial courts have granted motions dismissing claims against MLIC, while other trial courts have denied MLIC’s motions. There can be no assurance that MLIC will receive favorable decisions on motions in the future. While most cases brought to date have settled, MLIC intends to continue to defend aggressively against claims based on asbestos exposure, including defending claims at trials.
79
MetLife, Inc.
Notes to the Interim Condensed Consolidated Financial Statements (Unaudited) — (continued)
15. Contingencies, Commitments and Guarantees (continued)
As reported in the 2021 Annual Report, MLIC received approximately
2,824
asbestos-related claims in 2021. For the nine months ended September 30, 2022 and 2021, MLIC received approximately
1,962
and
2,156
new asbestos-related claims, respectively. See Note 21 of the Notes to the Consolidated Financial Statements included in the 2021 Annual Report for historical information concerning asbestos claims and MLIC’s update in its recorded liability at December 31, 2021. The number of asbestos cases that may be brought, the aggregate amount of any liability that MLIC may incur, and the total amount paid in settlements in any given year are uncertain and may vary significantly from year to year.
The ability of MLIC to estimate its ultimate asbestos exposure is subject to considerable uncertainty, and the conditions impacting its liability can be dynamic and subject to change. The availability of reliable data is limited and it is difficult to predict the numerous variables that can affect liability estimates, including the number of future claims, the cost to resolve claims, the disease mix and severity of disease in pending and future claims, the willingness of courts to allow plaintiffs to pursue claims against MLIC when exposure to asbestos took place after the dangers of asbestos exposure were well known, and the impact of any possible future adverse verdicts and their amounts.
The ability to make estimates regarding ultimate asbestos exposure declines significantly as the estimates relate to years further in the future. In the Company’s judgment, there is a future point after which losses cease to be probable and reasonably estimable. It is reasonably possible that the Company’s total exposure to asbestos claims may be materially greater than the asbestos liability currently accrued and that future charges to income may be necessary, but management does not believe any such charges are likely to have a material effect on the Company’s financial position.
The Company believes adequate provision has been made in its interim condensed consolidated financial statements for all probable and reasonably estimable losses for asbestos-related claims. MLIC’s recorded asbestos liability covers pending claims, claims not yet asserted, and legal defense costs and is based on estimates and includes significant assumptions underlying its analysis.
MLIC reevaluates on a quarterly and annual basis its exposure from asbestos litigation, including studying its claims experience, reviewing external literature regarding asbestos claims experience in the United States, assessing relevant trends impacting asbestos liability and considering numerous variables that can affect its asbestos liability exposure on an overall or per claim basis. Based upon its regular reevaluation of its exposure from asbestos litigation, MLIC has updated its liability analysis for asbestos-related claims through September 30, 2022.
Total Asset Recovery Services, LLC. v. MetLife, Inc., et al. (Supreme Court of the State of New York, County of New York, filed December 27, 2017)
Total Asset Recovery Services
(the “Relator”) brought an action under the qui tam provision of the New York False Claims Act (the “Act”) on behalf of itself and the Sta
te of New York. The Relator originally filed this action under seal in 2010, and the complaint was unsealed on December 19, 2017. The Relator alleges that MetLife, Inc., MLIC, and several other insurance companies violated the Act by filing false unclaimed property reports with the State of New York from 1986 to 2017, to avoid having to escheat the proceeds of more than 25,000 life insurance policies, including policies for which the defendants escheated funds as part of their demutualizations in the late 1990s. The Relator seeks treble damages and other relief. The Appellate Division of the New York State Supreme Court, First Department, reversed the court’s order granting MetLife, Inc. and MLIC’s motion to dismiss and remanded the case to the trial court where the Relator has filed an amended complaint. The Company intends to defend the action vigorously.
Matters Related to Group Annuity Benefits and Assumed Variable Annuity Guarantee Reserves
In 2018, the Company announced that it identified two material weaknesses in its internal control over financial reporting related to the practices and procedures for estimating reserves for certain group annuity benefits and the calculation of reserves associated with certain variable annuity guarantees assumed from the former operating joint venture in Japan. Several regulators have made inquiries into these issues and it is possible that other jurisdictions may pursue similar investigations or inquiries. The Company could be exposed to lawsuits and additional legal actions relating to these issues. These may result in payments, including damages, fines, penalties, interest and other amounts assessed or awarded by courts or regulatory authorities under applicable escheat, tax, securities, Employee Retirement Income Security Act of 1974, or other laws or regulations. The Company could incur significant costs in connection with these actions.
80
MetLife, Inc.
Notes to the Interim Condensed Consolidated Financial Statements (Unaudited) — (continued)
15. Contingencies, Commitments and Guarantees (continued)
Commitments
Mortgage Loan Commitments
The Company commits to lend funds under mortgage loan commitments. The amounts of these mortgage loan commitments were $
3.4
billion and $
4.6
billion at September 30, 2022 and December 31, 2021, respectively.
Commitments to Fund Partnership Investments, Bank Credit Facilities, Bridge Loans and Private Corporate Bond Investments
The Company commits to fund partnership investments and to lend funds under bank credit facilities, bridge loans and private corporate bond investments. The amounts of these unfunded commitments were $
9.4
billion
and $
9.1
billion at September 30, 2022 and December 31, 2021, respectively.
Guarantees
In the normal course of its business, the Company has provided certain indemnities, guarantees and commitments to third parties such that it may be required to make payments now or in the future. In the context of acquisition, disposition, investment and other transactions, the Company has provided indemnities and guarantees, including those related to tax, environmental and other specific liabilities and other indemnities and guarantees that are triggered by, among other things, breaches of representations, warranties or covenants provided by the Company. In addition, in the normal course of business, the Company provides indemnifications to counterparties in contracts with triggers similar to the foregoing, as well as for certain other liabilities, such as third-party lawsuits. These obligations are often subject to time limitations that vary in duration, including contractual limitations and those that arise by operation of law, such as applicable statutes of limitation. In some cases, the maximum potential obligation under the indemnities and guarantees is subject to a contractual limitation ranging from less than $
1
million to $
329
million, with a cumulative maximum of $
626
million, while in other cases such limitations are not specified or applicable. Since certain of these obligations are not subject to limitations, the Company does not believe that it is possible to determine the maximum potential amount that could become due under these guarantees in the future. Management believes that it is unlikely the Company will have to make any material payments under these indemnities, guarantees, or commitments.
In addition, the Company indemnifies its directors and officers as provided in its charters and by-laws. Also, the Company indemnifies its agents for liabilities incurred as a result of their representation of the Company’s interests. Since these indemnities are generally not subject to limitation with respect to duration or amount, the Company does not believe that it is possible to determine the maximum potential amount that could become due under these indemnities in the future.
The Company also has minimum fund yield requirements on certain pension funds. Since these guarantees are not subject to limitation with respect to duration or amount, the Company does not believe that it is possible to determine the maximum potential amount that could become due under these guarantees in the future.
The Company’s recorded liabilities were $
20
million at both September 30, 2022 and December 31, 2021, for indemnities, guarantees and commitments.
81
Item 2. Management’s Discussion and Analysis of Financial Condition and Results of Operations
Index to Management’s Discussion and Analysis of Financial Condition and Results of Operations
| Page | |||||
82
Forward-Looking Statements and Other Financial Information
For purposes of this discussion, “MetLife,” the “Company,” “we,” “our” and “us” refer to MetLife, Inc., a Delaware corporation incorporated in 1999, its subsidiaries and affiliates. This discussion should be read in conjunction with MetLife, Inc.’s Annual Report on Form 10-K for the year ended December 31, 2021 (the “2021 Annual Report”), the cautionary language regarding forward-looking statements included below, the “Risk Factors” set forth in Part II, Item 1A, and the additional risk factors referred to therein, “Quantitative and Qualitative Disclosures About Market Risk” and the Company’s interim condensed consolidated financial statements included elsewhere herein.
This Management’s Discussion and Analysis of Financial Condition and Results of Operations may contain or incorporate by reference information that includes or is based upon forward-looking statements within the meaning of the Private Securities Litigation Reform Act of 1995. See “Note Regarding Forward-Looking Statements” for cautionary language regarding forward-looking statements.
This Management’s Discussion and Analysis of Financial Condition and Results of Operations includes references to our performance measures, adjusted earnings and adjusted earnings available to common shareholders, that are not based on accounting principles generally accepted in the United States of America (“GAAP”). See “— Non-GAAP and Other Financial Disclosures” for definitions and a discussion of these and other financial measures, and “— Results of Operations” and “— Investments” for reconciliations of historical non-GAAP financial measures to the most directly comparable GAAP measures.
Executive Summary
Overview
MetLife is one of the world’s leading financial services companies, providing insurance, annuities, employee benefits and asset management. MetLife is organized into five segments: U.S.; Asia; Latin America; Europe, the Middle East and Africa (“EMEA”); and MetLife Holdings. In addition, the Company reports certain of its results of operations in Corporate & Other. See Note 2 of the Notes to the Interim Condensed Consolidated Financial Statements for further information on the Company’s segments and Corporate & Other.
COVID-19 Pandemic
We continue to closely monitor developments relating to the COVID-19 pandemic and assess its impact on our business. The COVID-19 pandemic continues to impact the global economy and financial markets and has caused volatility in the global equity, credit and real estate markets. See “— Industry Trends — Financial and Economic Environment.” We have implemented risk management and business continuity plans and taken preventive measures and other precautions, such as employee business travel restrictions and remote work arrangements which, to date, have enabled us to maintain our critical business processes, customer service levels, relationships with key vendors, financial reporting systems, internal control over financial reporting and disclosure controls and procedures.
See “— Results of Operations — Segment Results and Corporate & Other” for further information regarding the effect of the COVID-19 pandemic on our businesses.
Current Period Highlights
During the three months ended September 30, 2022, adjusted premiums, fees and other revenues, net of foreign currency fluctuations, increased compared to the prior period driven by growth in our U.S. segment, primarily in our Retirement and Income Solutions (“RIS”) business. Equity market returns had a less favorable impact on our private equity funds and hedge funds compared to the prior period and resulted in lower investment yields, however, positive net flows drove an increase in our investment portfolio. An unfavorable change in net investment gains (losses) primarily reflects current period losses versus prior period gains on sales, partially offset by the prior period loss on the sale of our wholly-owned Argentinian subsidiary, MetLife Seguros S.A. (“MetLife Seguros”). Changes in long-term interest rates drove an unfavorable change in net derivative gains (losses). Underwriting experience was favorable and reflected an overall decline in COVID-19 related claims. Our annual actuarial assumption review resulted in a gain in the current period versus a charge in the prior period. In addition, the current period includes the favorable impact from a reinsurance recapture and the unfavorable impact from model refinements.
83
The following represents segment level results and percentage contributions to total segment level adjusted earnings available to common shareholders for the three months ended September 30, 2022:
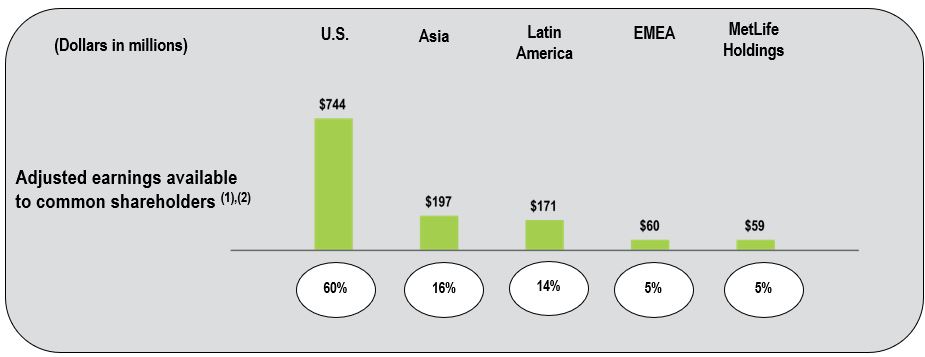
(1)
Excludes Corporate & Other adjusted loss available to common shareholders of $265 million.
(2)
Consistent with GAAP guidance for segment reporting, adjusted earnings is our GAAP measure of segment performance. For additional information, see Note 2 of the Notes to the Interim Condensed Consolidated Financial Statements.
84
Three Months Ended September 30, 2022 Compared with the Three Months Ended September 30, 2021
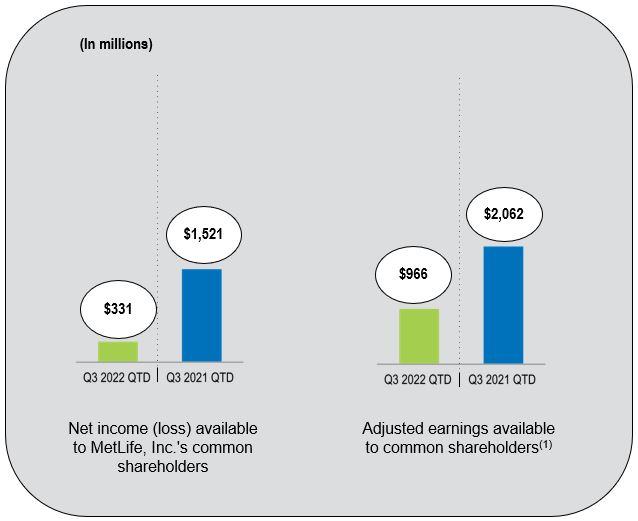
|
Consolidated Results - Highlights | ||||||||||||||||||||||
|
Net income (loss) available to MetLife, Inc.’s common shareholders down $1.2 billion:
|
|||||||||||||||||||||||
| • | Unfavorable change in net investment gains (losses) of $330 million ($261 million, net of income tax) | ||||||||||||||||||||||
| • |
Unfavorable change in net derivative gains (losses) of $262 million ($207 million, net of income tax)
(2)
|
||||||||||||||||||||||
| • |
Favorable change from annual actuarial assumption reviews of $356 million ($269 million, net of income tax)
(3)
|
||||||||||||||||||||||
| • | Adjusted earnings available to common shareholders down $1.1 billion | ||||||||||||||||||||||
| (1) See “— Results of Operations — Consolidated Results” and “— Non-GAAP and Other Financial Disclosures” for reconciliations and definitions of non-GAAP financial measures. | |||||||||||||||||||||||
| (2) Includes amounts relating to investment hedge adjustments, which are also included in adjusted earnings available to common shareholders. See “— Investments — Investment Portfolio Results” for additional information. | |||||||||||||||||||||||
| (3) Includes amounts recognized in net derivative gains (losses) and adjusted earnings available to common shareholders. See “— Results of Operations — Consolidated Results — Three Months Ended September 30, 2022 Compared with the Three Months Ended September 30, 2021 — Actuarial Assumption Review and Certain Other Insurance Adjustments” for additional information. | |||||||||||||||||||||||
| Consolidated Results - Adjusted Earnings Highlights | |||||||||||||||||||||||
|
Adjusted earnings available to common shareholders was down $1.1 billion primarily due to lower investment yields as a result of the unfavorable impact of lower equity market returns on our private equity funds and hedge funds, as well as higher interest credited expense, partially offset by favorable underwriting, primarily driven by an overall decline in COVID-19 related claims, higher net investment income due to a larger average invested asset base and the favorable change from our annual actuarial assumption reviews. In addition, the current period includes the favorable impact from a reinsurance recapture in our U.S. segment and the unfavorable impact from model refinements in our MetLife Holdings segment.
|
|||||||||||||||||||||||
| For a more in-depth discussion of our consolidated results, see “— Results of Operations — Consolidated Results,” “— Results of Operations — Consolidated Results - Adjusted Earnings” and “— Results of Operations — Segment Results and Corporate & Other.” | |||||||||||||||||||||||
85
Nine Months Ended September 30, 2022 Compared with the Nine Months Ended September 30, 2021

|
Consolidated Results - Highlights | |||||||||||||||||||||||||
|
Net income (loss) available to MetLife, Inc.’s common shareholders down $4.1 billion:
|
||||||||||||||||||||||||||
| • | Unfavorable change in net investment gains (losses) of $3.3 billion ($2.6 billion, net of income tax) | |||||||||||||||||||||||||
| • |
Unfavorable change in net derivative gains (losses) of $502 million ($397 million, net of income tax)
(2)
|
|||||||||||||||||||||||||
| • |
Favorable change from annual actuarial assumption reviews of $356 million ($269 million, net of income tax)
(3)
|
|||||||||||||||||||||||||
| • | Adjusted earnings available to common shareholders down $1.8 billion | |||||||||||||||||||||||||
| (1) See “— Results of Operations — Consolidated Results” and “— Non-GAAP and Other Financial Disclosures” for reconciliations and definitions of non-GAAP financial measures. | ||||||||||||||||||||||||||
| (2) Includes amounts relating to investment hedge adjustments, which are also included in adjusted earnings available to common shareholders. See “— Investments — Investment Portfolio Results” for additional information. | ||||||||||||||||||||||||||
| (3) Includes amounts recognized in net derivative gains (losses) and adjusted earnings available to common shareholders. See “— Results of Operations — Consolidated Results — Three Months Ended September 30, 2022 Compared with the Three Months Ended September 30, 2021 — Actuarial Assumption Review and Certain Other Insurance Adjustments” for additional information. | ||||||||||||||||||||||||||
| Consolidated Results - Adjusted Earnings Highlights | ||||||||||||||||||||||||||
|
Adjusted earnings available to common shareholders was down $1.8 billion primarily due to lower investment yields as a result of the unfavorable impact of lower equity market returns on our private equity funds and hedge funds, higher interest credited expense and higher expenses, partially offset by higher net investment income due to a larger average invested asset base, favorable underwriting, primarily driven by an overall decline in COVID-19 related claims, and the favorable change from our annual actuarial assumption reviews. In addition, the current period includes the favorable impacts from a reinsurance recapture in our U.S. segment and a reinsurance settlement in our MetLife Holdings segment, as well as the unfavorable impact of model refinements in our MetLife Holdings segment and the prior period included the release of a legal reserve.
|
||||||||||||||||||||||||||
| For a more in-depth discussion of our consolidated results, see “— Results of Operations — Consolidated Results,” “— Results of Operations — Consolidated Results - Adjusted Earnings” and “— Results of Operations — Segment Results and Corporate & Other.” | ||||||||||||||||||||||||||
Industry Trends
We continue to be impacted by the changing global financial and economic environment that has been affecting the industry.
Financial and Economic Environment
Our business and results of operations are materially affected by conditions in the global capital markets and the economy generally due to our market presence in numerous countries, large investment portfolio and the sensitivity of our insurance liabilities and derivatives to changing market factors.
86
We are closely monitoring political and economic conditions that might contribute to global market volatility and impact our business operations, investment portfolio and derivatives, such as global inflation, supply chain disruptions, the Russia-Ukraine conflict and the COVID-19 pandemic. See “— Impact of Market Interest Rates — Effects of Inflation,” and “— Investments — Current Environment.” We are also monitoring the imposition of tariffs, sanctions or other barriers to international trade, changes to international trade agreements, and their potential impacts on our business, results of operations and financial condition.
Governments and central banks around the world responded to the COVID-19 pandemic with unprecedented fiscal and monetary policies, but many of these stimulus programs have concluded due to global economic recovery and rising inflation. In the United States, the Board of Governors of the Federal Reserve System (“Federal Reserve Board”) ended its asset purchase program in March 2022 and began to reduce its holdings on June 1, 2022. The Federal Open Market Committee has repeatedly raised interest rates in 2022; further increases in the target range for the federal funds rate are expected throughout 2022 to combat inflation. This has caused the gap between the two-year U.S. Treasury and the 10-year U.S. Treasury yield to invert and has contributed to a heightened level of concern about an economic downturn in the United States before the end of 2023. The European Central Bank (“ECB”) ended its pandemic asset purchase program in March 2022 and its quantitative easing program in July 2022. The ECB has repeatedly raised its policy interest rates in 2022 and is expected to continue to do so throughout 2022 to combat inflation. It also established the Transmission Protection Instrument, which aims to prevent financial fragmentation by helping more indebted periphery euro area member states, which could otherwise face a disorderly widening of government bond yield spreads over core members like Germany, as the ECB tightens policy. The Bank of England ended its quantitative easing program in 2021 and has been raising interest rates since December 2021 to combat inflation, with further increases expected throughout 2022. In September and October 2022, the Bank of England also bought government bonds as a targeted and temporary intervention to stabilize the United Kingdom (“U.K.”) bond market. Russia’s invasion of Ukraine and sanctions imposed in response represent an inflationary shock for Europe and globally, driving commodity prices up and contributing to broader inflationary pressure. Europe is particularly vulnerable given its proximity to the conflict and reliance on Russia as a primary source of its energy imports, which is aggravated by Russia largely suspending its gas supplies to Europe. Higher global food and energy prices in the wake of the conflict present additional challenges to the economic performance of net importers of these items, particularly for certain emerging market economies in Eastern Europe and the Middle East.
In Japan, the Bank of Japan (“BoJ”) has kept its monetary policy settings on hold. The BoJ has downgraded its economic assessment of the Japanese economy for fiscal years 2022 and 2023, noting downside risks from slowing global growth and rising recession risks in key exports such as Europe and the U.S. The BoJ has also strengthened its phrasing around the outlook for inflation given the expected pass-through of higher energy and commodity prices. The BoJ’s more cautious view on external growth, coupled with still below target core CPI inflation, suggests that monetary policy will remain on hold for the time being. The Japanese yen weakened to its lowest level against the U.S. dollar since the 1990s as monetary policy divergence has widened between the BoJ and the Federal Reserve and as the trade deficit has widened due to costlier commodity imports year to date. To support its currency, Japan’s government intervened in the foreign exchange market to sell U.S. dollars for the Japanese yen.
Impact of Market Interest Rates
Market interest rates are a key driver of our results. Increases and decreases in such rates, as well as extended periods of stagnation, may impact our business and investments in various ways. See “Management’s Discussion and Analysis of Financial Condition and Results of Operations — Industry Trends — Impact of Market Interest Rates” and “Risk Factors — Economic Environment and Capital Markets Risks” included in the 2021 Annual Report.
Effects of Inflation
Management believes that while inflation has not had a material effect on the Company’s consolidated results of operations, except insofar as inflation may affect interest rates, both rising interest rates and inflation will have a neutral to modest impact on our business. See “Management’s Discussion and Analysis of Financial Condition and Results of Operations — Industry Trends — Impact of Market Interest Rates — Impact of a Rising Interest Rate Environment,” and “Management’s Discussion and Analysis of Financial Condition and Results of Operations — Industry Trends — Impact of Market Interest Rates — Interest Rate Scenarios” included in the 2021 Annual Report.
87
An increase in inflation could affect our business in several ways. In our group life and disability businesses, premiums increase as compensation levels of our customers’ employees increase. However, during inflationary periods with rising interest rates, the value of fixed income investments falls which could increase realized and unrealized losses, resulting in additional deferred tax assets that may not be realizable. Inflation also increases expenses for labor and other costs, potentially putting pressure on profitability if such costs cannot be passed through in our product prices. Prolonged and elevated inflation could adversely affect the financial markets and the economy generally, and dispelling it may require governments to pursue a restrictive fiscal and monetary policy, which could constrain overall economic activity, inhibit revenue growth and reduce the number of attractive investment opportunities.
Competitive Pressures
See “Business — Competition” and “Management’s Discussion and Analysis of Financial Condition and Results of Operations — Industry Trends — Competitive Pressures” in the 2021 Annual Report for information on our competitive position.
Regulatory Developments
The following discussion on regulatory developments should be read in conjunction with “Business — Regulation” and “Management’s Discussion and Analysis of Financial Condition and Results of Operations — Industry Trends — Regulatory Developments” included in the 2021 Annual Report, as amended or supplemented here.
Insurance Regulation
U.S. Federal Initiatives
U.S. federal initiatives can affect our business in a variety of ways, including regulation of financial services, securities, derivatives, pensions, health care, money laundering, foreign sanctions and corrupt practices, and taxation. The Inflation Reduction Act, signed into law by President Biden on August 16, 2022, included a number of tax-related provisions including (i) a fifteen percent alternative minimum tax rate on adjusted financial statement income and (ii) a one percent excise tax on certain corporate stock buybacks. Both provisions will be effective on January 1, 2023 and are not expected to have a material impact on our results of operations.
Surplus and Capital
Risk-Based Capital
The National Association of Insurance Commissioners (“NAIC”) adopted revisions to certain factors used to calculate Life risk-based capital (“RBC”), which is the denominator of the RBC ratios, in light of changes to U.S. tax laws in recent years. These revisions have resulted in increased RBC charges and reduced the RBC ratios of our insurance subsidiaries. The NAIC approved RBC revisions for corporate bonds, real estate equity and longevity risk that took effect at year-end 2021.These revisions had a modest net positive RBC impact on us. The NAIC has also approved an RBC update for mortality risk that will take effect at year-end 2022, and we expect this revision to have a modest net positive RBC impact on us.
Securities, Broker-Dealer and Investment Adviser Regulation
The New York State Department of Financial Services (“NYDFS”) Regulation 187 - Suitability and Best Interests in Life Insurance and Annuity Transactions incorporates the “best interest” standard for annuity transactions and sales of life insurance policies to consumers. In April 2021, the Appellate Division of the New York Supreme Court overturned the regulation for being unconstitutionally vague; however, the New York State Court of Appeals reversed this ruling on October 20, 2022.
Environmental Laws and Regulations
In furtherance of President Biden’s Executive Order on Climate-Related Financial Risk, dated May 20, 2021, the Federal Insurance Office (“FIO”) sought public comment on climate-related financial risks in the insurance industry through November 2021. The FIO’s request for information noted that it will work on assessing how the insurance sector may mitigate climate change impacts and help achieve national climate-related goals. The FIO intends to publish a report by year-end that addresses climate-related issues in the regulation of insurers and climate related disclosures by insurers.
88
On March 21, 2022, the U.S. Securities and Exchange Commission (the “SEC”) proposed rules requiring registrants to provide additional climate-related information in their registration statements and annual reports, including in their financial statements. The proposal sets forth proposed rules for disclosure of climate-related risks, material impacts, governance, risk management, financial statement metrics, greenhouse gas emissions, attestation of emissions disclosures, and targets and goals.
On May 25, 2022, the SEC proposed rules requiring registered investment companies, business development companies, and registered and certain unregistered investment advisers to disclose in their fund prospectuses, annual reports and Form ADV information about how funds and advisers incorporate environmental, social and governance factors into their investment strategies.
Cross-Border Trade and Investments
In April 2022, we received authorization from the Central Bank of Ireland for a new entity, MetLife Investment Management Europe, under the Undertakings for the Collective Investment in Transferable Securities Directive and the Alternative Investment Fund Managers Directive with the Markets in Financial Instruments Directive top-up permissions, which allows us to continue our investment management business in the European Union (“EU”).
The U.S., the EU and the U.K., maintain and enforce a variety of economic sanctions against designated countries and their nationals around the world, which can result in disruptions in cross-border activity. In particular, U.S., EU and U.K. sanctions on Russia have expanded as a result of the war in Ukraine. These new sanctions, including a series of presidential executive orders and regulations administered by the U.S. Department of Treasury’s Office of Foreign Assets Control, have, inter alia, expanded restrictions on transactions with the Russian Central Bank and other specified Russian government entities, dealing in Russian sovereign debt, engaging in certain debt and equity transactions, and engaging in transactions related to all new investment in the Russian Federation. Trade and investment in China may also be impacted by U.S. sanctions. The Biden administration has previously issued restrictions targeting certain activity involving specified Chinese securities and technology.
London Interbank Offered Rate
In March 2022, federal legislation was enacted to address the transition from U.S. Dollar London Interbank Offered Rate (“LIBOR”) to alternative reference rates for all U.S. law governed contracts with non-existent or inadequate U.S. Dollar LIBOR fallback provisions. Except with respect to the one-week and two-month U.S. Dollar LIBOR tenors, the federal legislation supersedes all state law addressing the U.S. Dollar LIBOR transition, including legislation enacted in New York in 2021. The implementation of the federal legislation is subject to regulations to be promulgated by the Federal Reserve Board. We continue to assess current and alternative reference rates’ merits, limitations, risks and suitability for our investment and insurance processes.
Summary of Critical Accounting Estimates
The preparation of financial statements in conformity with GAAP requires management to adopt accounting policies and make estimates and assumptions that affect amounts reported on the Interim Condensed Consolidated Financial Statements. The most critical estimates include those used in determining:
(i)
liabilities for future policy benefits and the accounting for reinsurance;
(ii)
capitalization and amortization of deferred policy acquisition costs (“DAC”) and the establishment and amortization of value of business acquired (“VOBA”);
(iii)
estimated fair values of investments in the absence of quoted market values;
(iv)
investment allowance for credit loss (“ACL”) and impairments;
(v)
estimated fair values of freestanding derivatives and the recognition and estimated fair value of embedded derivatives requiring bifurcation;
(vi)
measurement of goodwill and related impairment;
(vii)
measurement of employee benefit plan liabilities;
(viii)
measurement of income taxes and the valuation of deferred tax assets; and
(ix)
liabilities for litigation and regulatory matters.
89
In addition, the application of acquisition accounting requires the use of estimation techniques in determining the estimated fair values of assets acquired and liabilities assumed — the most significant of which relate to the aforementioned critical accounting estimates. In applying these policies and estimates, management makes subjective and complex judgments that frequently require assumptions about matters that are inherently uncertain. Many of these policies, estimates and related judgments are common in the insurance and financial services industries; others are specific to our business and operations. Actual results could differ from these estimates.
The Company’s critical accounting estimates are described in “Management’s Discussion and Analysis of Financial Condition and Results of Operations — Summary of Critical Accounting Estimates” and Note 1 of the Notes to the Consolidated Financial Statements included in the 2021 Annual Report.
Goodwill
Goodwill is tested for impairment at least annually or more frequently if events or circumstances, such as adverse changes in the business climate, indicate that there may be justification for conducting an interim test.
For purposes of goodwill impairment testing, if the carrying value of a reporting unit exceeds its estimated fair value, an impairment charge would be recognized for the amount by which the carrying value exceeds the reporting unit’s fair value; however, the loss recognized would not exceed the total amount of goodwill allocated to that reporting unit. Additionally, the Company will consider income tax effects from any tax deductible goodwill on the carrying value of the reporting unit when measuring the goodwill impairment loss, if applicable. The key inputs, judgments and assumptions necessary in determining estimated fair value of the reporting units include projected adjusted earnings, current book value, the level of economic capital required to support the mix of business, long-term growth rates, comparative market multiples, the account value of in-force business, projections of new and renewed business, as well as margins on such business, interest rate levels, credit spreads, equity market levels, and the discount rate that we believe is appropriate for the respective reporting unit.
We apply significant judgment when determining the estimated fair value of our reporting units and when assessing the relationship of market capitalization to the aggregate estimated fair value of our reporting units. The valuation methodologies utilized are subject to key judgments and assumptions that are sensitive to change. Estimates of fair value are inherently uncertain and represent only management’s reasonable expectation regarding future developments. These estimates and the judgments and assumptions upon which the estimates are based will, in all likelihood, differ in some respects from actual future results. Declines in the estimated fair value of our reporting units could result in goodwill impairments in future periods which could materially adversely affect our results of operations or financial position.
In the third quarter of 2022, the Company performed its annual goodwill impairment tests on all of its reporting units, using both qualitative and quantitative assessments. The quantitative assessment utilized the market multiple, embedded value and discounted cash flow valuation approaches based on best available data as of June 30, 2022. The Company concluded that the estimated fair values of all its reporting units were substantially in excess of their carrying values and, therefore, goodwill was not impaired.
Acquisitions and Dispositions
Acquisitions
Pending Acquisition of Affirmative Investment Management
In August 2022, the Company entered into a definitive agreement to acquire Affirmative Investment Management, a specialist global environmental, social and corporate governance impact fixed income investment manager. This transaction is subject to customary closing conditions, including regulatory approval.
Ownership Increase of PNB MetLife
In February 2022, the Company acquired approximately 15.0% ownership in PNB MetLife India Insurance Company Limited (“PNB MetLife”). As a result, the Company’s ownership in PNB MetLife, an operating joint venture accounted for under the equity method, increased to approximately 47.0%. This transaction supports the Company’s continued growth in India and will enable us to deliver more value for our customers, partners and shareholders.
90
Dispositions
Disposition of MetLife Poland and Greece
For information regarding the Company's dispositions of its wholly-owned subsidiaries in Poland and Greece (collectively, “MetLife Poland and Greece”), which were reported as held-for-sale, see Notes 1 and 3 of the Notes to the Interim Condensed Consolidated Financial Statements.
Disposition of MetLife Seguros
For information regarding the Company's September 2021 disposition of MetLife Seguros, see Note 3 of the Notes to the Consolidated Financial Statements included in the 2021 Annual Report.
Disposition of MetLife P&C
For information regarding the Company's April 2021 disposition of Metropolitan Property and Casualty Insurance Company and certain of its wholly-owned subsidiaries (“MetLife P&C”), which was reported as held-for-sale, see Notes 1 and 3 of the Notes to the Consolidated Financial Statements included in the 2021 Annual Report.
Disposition of MetLife Russia
For information regarding the Company's January 2021 disposition of its wholly-owned Russian subsidiary, the Joint-stock Company MetLife Insurance Company (“MetLife Russia”), see Note 3 of the Notes to the Consolidated Financial Statements included in the 2021 Annual Report.
91
Results of Operations
Consolidated Results
|
Three Months
Ended September 30, |
Nine Months
Ended September 30, |
|||||||||||||||||||||||||
| 2022 | 2021 | 2022 | 2021 | |||||||||||||||||||||||
|
(In millions)
|
||||||||||||||||||||||||||
|
Revenues
|
||||||||||||||||||||||||||
|
Premiums
|
$ | 17,547 | $ | 9,455 | $ | 40,039 | $ | 28,914 | ||||||||||||||||||
|
Universal life and investment-type product policy fees
|
1,302 | 1,521 | 4,236 | 4,334 | ||||||||||||||||||||||
|
Net investment income
|
3,585 | 5,568 | 11,452 | 16,162 | ||||||||||||||||||||||
|
Other revenues
|
730 | 663 | 2,006 | 1,958 | ||||||||||||||||||||||
|
Net investment gains (losses)
|
(414) | (84) | (1,617) | 1,655 | ||||||||||||||||||||||
|
Net derivative gains (losses)
|
(480) | (218) | (2,534) | (2,032) | ||||||||||||||||||||||
|
Total revenues
|
22,270 | 16,905 | 53,582 | 50,991 | ||||||||||||||||||||||
|
Expenses
|
||||||||||||||||||||||||||
|
Policyholder benefits and claims and policyholder dividends
|
18,148 | 10,292 | 41,522 | 30,703 | ||||||||||||||||||||||
|
Interest credited to policyholder account balances
|
980 | 1,287 | 2,102 | 4,153 | ||||||||||||||||||||||
|
Capitalization of DAC
|
(615) | (635) | (1,887) | (2,052) | ||||||||||||||||||||||
|
Amortization of DAC and VOBA
|
218 | 816 | 1,371 | 1,943 | ||||||||||||||||||||||
|
Amortization of negative VOBA
|
(12) | (6) | (31) | (25) | ||||||||||||||||||||||
|
Interest expense on debt
|
239 | 240 | 690 | 696 | ||||||||||||||||||||||
|
Other expenses
|
2,893 | 2,869 | 8,683 | 8,753 | ||||||||||||||||||||||
|
Total expenses
|
21,851 | 14,863 | 52,450 | 44,171 | ||||||||||||||||||||||
| Income (loss) before provision for income tax | 419 | 2,042 | 1,132 | 6,820 | ||||||||||||||||||||||
| Provision for income tax expense (benefit) | 19 | 453 | (80) | 1,456 | ||||||||||||||||||||||
| Net income (loss) | 400 | 1,589 | 1,212 | 5,364 | ||||||||||||||||||||||
|
Less: Net income (loss) attributable to noncontrolling interests
|
5 | 5 | 16 | 15 | ||||||||||||||||||||||
| Net income (loss) attributable to MetLife, Inc. | 395 | 1,584 | 1,196 | 5,349 | ||||||||||||||||||||||
|
Less: Preferred stock dividends
|
64 | 63 | 156 | 166 | ||||||||||||||||||||||
| Preferred stock redemption premium | — | — | — | 6 | ||||||||||||||||||||||
| Net income (loss) available to MetLife, Inc.’s common shareholders | $ | 331 | $ | 1,521 | $ | 1,040 | $ | 5,177 | ||||||||||||||||||
Three Months Ended September 30, 2022 Compared with the Three Months Ended September 30, 2021
During the three months ended September 30, 2022, net income (loss) decreased $1.2 billion from the prior period, primarily driven by unfavorable changes in adjusted earnings, net investment gains (losses), and net derivative gains (losses), net of investment hedge adjustments, partially offset by a favorable change from our annual actuarial assumption reviews.
Management of Investment Portfolio and Hedging Market Risks with Derivatives.
See “— Investments — Overview” for a discussion of the management of our investment portfolio.
We purchase investments to support our insurance liabilities and not to generate net investment gains and losses. However, net investment gains and losses are incurred and can change significantly from period to period due to changes in external influences, including changes in market factors such as interest rates, foreign currency exchange rates, credit spreads and equity markets; counterparty specific factors such as financial performance, credit rating and collateral valuation; and internal factors such as portfolio rebalancing. Changes in these factors from period to period can significantly impact the levels of provision for credit loss and impairments on our investment portfolio, as well as realized gains and losses on investments sold.
92
We also use derivatives as an integral part of our management of the investment portfolio and insurance liabilities to hedge certain risks, including changes in interest rates, foreign currency exchange rates, credit spreads and equity market levels. We use freestanding interest rate, equity, credit and currency derivatives to hedge certain invested assets and insurance liabilities. A portion of these hedges are designated and qualify as accounting hedges, which reduce volatility in earnings. For those hedges not designated as accounting hedges, changes in market factors lead to the recognition of fair value changes in net derivative gains (losses) generally without an offsetting gain or loss recognized in earnings for the item being hedged, which creates volatility in earnings. We actively evaluate market risk hedging needs and strategies to ensure our free cash flow and capital objectives are met under a range of market conditions.
Certain variable annuity products with guaranteed minimum benefits contain embedded derivatives that are measured at estimated fair value separately from the host variable annuity contract, with changes in estimated fair value recorded in net derivative gains (losses). We use freestanding derivatives to hedge the market risks inherent in these variable annuity guarantees. The valuation of these embedded derivatives includes a nonperformance risk adjustment, which is unhedged, and can be a significant driver of net derivative gains (losses) and volatility in earnings, but does not have an economic impact on us.
We continuously review and refine our hedging strategy in light of changing economic and market conditions, evolving NAIC and NYDFS statutory requirements, and accounting rule changes. As a part of our current hedging strategy, we maintain portfolio level derivatives in our macro hedge program. These macro hedge program derivatives, which are included in the non-VA program derivatives section of the table below, mitigate the potential deterioration in our capital positions from significant adverse economic conditions.
Net Derivative Gains (Losses).
The variable annuity embedded derivatives and associated freestanding derivative hedges are collectively referred to as “VA program derivatives.” All other derivatives that are economic hedges of certain invested assets and insurance liabilities are referred to as “non-VA program derivatives.” The table below presents the impact on net derivative gains (losses) from non-VA program derivatives and VA program derivatives:
|
Three Months
Ended September 30, |
|||||||||||
| 2022 | 2021 | ||||||||||
| (In millions) | |||||||||||
| Non-VA program derivatives: | |||||||||||
| Interest rate | $ | (333) | $ | (181) | |||||||
| Foreign currency exchange rate | 68 | (147) | |||||||||
| Credit | 27 | 13 | |||||||||
| Equity | 93 | 70 | |||||||||
| Non-VA embedded derivatives | (14) | 45 | |||||||||
| Total non-VA program derivatives | (159) | (200) | |||||||||
| VA program derivatives: | |||||||||||
|
Market risks in embedded derivatives
|
91 | 65 | |||||||||
|
Nonperformance risk adjustment on embedded derivatives
|
39 | 3 | |||||||||
|
Other risks in embedded derivatives
|
(352) | (66) | |||||||||
| Total embedded derivatives | (222) | 2 | |||||||||
|
Freestanding derivatives hedging embedded derivatives
|
(99) | (20) | |||||||||
| Total VA program derivatives | (321) | (18) | |||||||||
|
Net derivative gains (losses)
|
$ | (480) | $ | (218) | |||||||
93
The favorable change in net derivative gains (losses) on non-VA program derivatives was $41 million ($32 million, net of income tax). This was primarily due to the U.S. dollar strengthening more significantly against major currencies in the current period compared to the prior period. This favorably impacted the estimated fair value of receive U.S. dollar foreign currency swaps. The favorable change was partially offset by long-term interest rates increasing more significantly in the current period compared to the prior period. This unfavorably impacted the estimated fair value of receive fixed interest rate swaps. Because certain of these hedging strategies are not designated or do not qualify as accounting hedges, the changes in the estimated fair value of these freestanding derivatives are recognized in net derivative gains (losses) without an offsetting gain or loss recognized in earnings for the items being hedged.
The unfavorable change in net derivative gains (losses) on VA program derivatives was $303 million ($239 million, net of income tax). This was due to (i) an unfavorable change of $286 million, ($226 million, net of income tax) in other risks in embedded derivatives, and (ii) an unfavorable change of $53 million ($41 million, net of income tax) in market risks in embedded derivatives, net of freestanding derivatives hedging market risks in embedded derivatives, partially offset by a favorable change of $36 million ($28 million, net of income tax) in the nonperformance risk adjustment on embedded derivatives.
The aforementioned $286 million ($226 million, net of income tax) unfavorable change in other risks in embedded derivatives reflects actuarial assumption updates and a combination of factors, such as fees deducted from accounts, changes in the benefit base, premiums, lapses, withdrawals and deaths, in addition to changes to cross-effect, basis mismatch, risk margin and fund allocation.
The aforementioned $53 million ($41 million, net of income tax) unfavorable change reflects a $79 million ($62 million, net of income tax) unfavorable change in freestanding derivatives hedging market risks in embedded derivatives, partially offset by a $26 million ($21 million, net of income tax) favorable change in market risks in embedded derivatives,
The primary changes in market factors affecting the valuation of VA program derivatives are summarized as follows:
•
Long-term interest rates increased more significantly in the current period compared to the prior period, contributing to an unfavorable change in our freestanding derivatives and a favorable change in our embedded derivatives. For example, the 30-year U.S. swap rate increased 41 basis points in the current period and increased 2 basis points in the prior period.
•
Key equity index levels decreased in the current period versus increased in the prior period, contributing to an unfavorable change in our embedded derivatives and a favorable change in our freestanding derivatives. For example, the S&P Global Ratings (“S&P”) 500 Index decreased 5% in the current period and increased 0.2% in the prior period.
The aforementioned $36 million ($28 million, net of income tax) favorable change in the nonperformance risk adjustment on embedded derivatives resulted from a favorable change of $35 million ($28 million, net of income tax), related to model changes and changes in capital market inputs, such as long-term interest rates and key equity index levels, on variable annuity guarantees, in addition to a slight favorable change related to changes in our own credit spread.
When equity index levels decrease in isolation, the variable annuity guarantees become more valuable to policyholders, which results in an increase in the undiscounted embedded derivative liability. Discounting this unfavorable change by the risk adjusted rate results in a smaller loss than by discounting at the risk-free rate, thus creating a gain from including an adjustment for nonperformance risk.
When the risk-free interest rate decreases in isolation, discounting the embedded derivative liability produces a higher valuation of the liability than if the risk-free interest rate had remained constant. Discounting this unfavorable change by the risk adjusted rate results in a smaller loss than by discounting at the risk-free interest rate, thus creating a gain from including an adjustment for nonperformance risk.
When our own credit spread increases in isolation, discounting the embedded derivative liability produces a lower valuation of the liability than if our own credit spread had remained constant. As a result, a gain is created from including an adjustment for nonperformance risk. For each of these primary market drivers, the opposite effect occurs when the driver moves in the opposite direction.
Net Investment Gains (Losses)
. The unfavorable change in net investment gains (losses) of $330 million ($261 million, net of income tax) primarily reflects current period losses on sales of fixed maturity securities and prior period gains on sales of real estate investments. These unfavorable changes were partially offset by the prior period loss on the sale of MetLife Seguros.
94
Taxes
. For the three months ended September 30, 2022, our effective tax rate on income (loss) before provision for income tax was 5%, which differed from the U.S. statutory rate of 21% primarily due to tax benefits from foreign earnings taxed at different rates than the U.S. statutory rate and tax credits. For the three months ended September 30, 2021, our effective tax rate on income (loss) before provision for income tax was 22%, which differed from the U.S. statutory rate of 21% primarily due to tax charges from foreign earnings taxed at different rates than the U.S. statutory rate and the completed sale of MetLife Seguros, partially offset by tax benefits related to tax credits and non-taxable investment income.
Actuarial Assumption Review and Certain Other Insurance Adjustments
. Results for the current period include a $75 million ($53 million, net of income tax) gain associated with our annual review of actuarial assumptions related to reserves and DAC, of which a $344 million ($273 million, net of income tax) loss was recognized in net derivative gains (losses).
Of the $75 million gain, a $315 million ($242 million, net of income tax) gain was related to DAC, and a loss of $240 million ($189 million, net of income tax) was associated with reserves. The portion of the $75 million gain that is included in adjusted earnings is $48 million ($33 million, net of income tax).
The $345 million ($273 million, net of income tax) loss recognized in net derivative gains (losses) associated with our annual review of actuarial assumptions is included within the other risks in embedded derivatives line in the table above.
As a result of our annual review of actuarial assumptions, changes were made to economic, biometric, policyholder behavior, and operational assumptions. The most significant impacts were in the MetLife Holdings and Asia segments. In the MetLife Holdings segment, significant impacts included economic assumption updates related to the projection of closed block results and updates to behavioral assumptions for variable annuities. In the Asia segment, the most significant impact was driven by economic assumption updates for interest sensitive whole life and fixed annuities. The breakdown of total current period results is summarized as follows:
•
Economic assumption updates resulted in favorable impacts to reserves and DAC, for a net gain of $308 million ($234 million, net of income tax).
•
Changes in biometric assumptions resulted in unfavorable impacts to reserves and favorable impacts to DAC, for a net charge of $5 million ($4 million, net of income tax).
•
Changes in policyholder behavior assumptions resulted in unfavorable impacts to reserves and favorable impacts to DAC, for a net charge of $245 million ($192 million, net of income tax).
•
Changes in operational assumptions resulted in favorable impacts to reserves and unfavorable impacts to DAC, for a net gain of $17 million ($15 million, net of income tax).
Results for the prior period include a $281 million ($216 million, net of income tax) charge associated with our annual review of actuarial assumptions related to reserves and DAC, of which a $2 million ($1 million, net of income tax) loss was recognized in net derivative gains (losses). Of the $281 million charge, $129 million ($96 million, net of income tax) was related to DAC and $152 million ($120 million, net of income tax) was associated with reserves. The portion of the $281 million charge that is included in adjusted earnings is $187 million ($140 million, net of income tax).
Certain other insurance adjustments recorded in the current period include a $115 million ($91 million, net of income tax) favorable reinsurance recapture in our U.S. segment and a $114 million ($90 million, net of income tax) charge related to model refinements in our MetLife Holdings segment. These adjustments are included in adjusted earnings.
Adjusted Earnings.
As more fully described in “— Non-GAAP and Other Financial Disclosures,” we use adjusted earnings, which does not equate to net income (loss), as determined in accordance with GAAP, to analyze our performance, evaluate segment performance, and allocate resources. We believe that the presentation of adjusted earnings and other financial measures based on adjusted earnings, as we measure it for management purposes, enhances the understanding of our performance by highlighting the results of operations and the underlying profitability drivers of the business. Adjusted earnings and other financial measures based on adjusted earnings allow analysis of our performance relative to our business plan and facilitate comparisons to industry results. Adjusted earnings should not be viewed as a substitute for net income (loss). Adjusted earnings available to common shareholders and adjusted earnings available to common shareholders on a constant currency basis should not be viewed as substitutes for net income (loss) available to MetLife, Inc.’s common shareholders. Adjusted earnings available to common shareholders decreased $1.1 billion, net of income tax, to $966 million, net of income tax, for the three months ended September 30, 2022 from $2.1 billion, net of income tax, for the three months ended September 30, 2021.
95
Nine Months Ended September 30, 2022 Compared with the Nine Months Ended September 30, 2021
During the nine months ended September 30, 2022, net income (loss) decreased $4.2 billion from the prior period, primarily driven by unfavorable changes in net investment gains (losses), adjusted earnings and net derivative gains (losses), net of investment hedge adjustments, partially offset by a favorable change from our annual actuarial assumption reviews.
The table below presents the impact on net derivative gains (losses) from non-VA program derivatives and VA program derivatives:
|
Nine Months
Ended September 30, |
|||||||||||
| 2022 | 2021 | ||||||||||
| (In millions) | |||||||||||
| Non-VA program derivatives: | |||||||||||
| Interest rate | $ | (2,424) | $ | (1,206) | |||||||
| Foreign currency exchange rate | (102) | (356) | |||||||||
| Credit | (95) | 75 | |||||||||
| Equity | 452 | (612) | |||||||||
| Non-VA embedded derivatives | 33 | 64 | |||||||||
| Total non-VA program derivatives | (2,136) | (2,035) | |||||||||
| VA program derivatives: | |||||||||||
|
Market risks in embedded derivatives
|
290 | 803 | |||||||||
|
Nonperformance risk adjustment on embedded derivatives
|
43 | (48) | |||||||||
|
Other risks in embedded derivatives
|
(463) | (103) | |||||||||
| Total embedded derivatives | (130) | 652 | |||||||||
|
Freestanding derivatives hedging embedded derivatives
|
(268) | (649) | |||||||||
| Total VA program derivatives | (398) | 3 | |||||||||
|
Net derivative gains (losses)
|
$ | (2,534) | $ | (2,032) | |||||||
The unfavorable change in net derivative gains (losses) on non-VA program derivatives was $101 million ($80 million, net of income tax). This was primarily due to long-term interest rates increasing more significantly in the current period compared to the prior period. This unfavorably impacted the estimated fair value of receive fixed interest rate swaps. The unfavorable change was partially offset by key equity indexes decreasing in the current period versus increasing in the prior period, favorably impacting equity options and total rate of return swaps acquired primarily as part of our macro hedge program. Because certain of these hedging strategies are not designated or do not qualify as accounting hedges, the changes in the estimated fair value of these freestanding derivatives are recognized in net derivative gains (losses) without an offsetting gain or loss recognized in earnings for the items being hedged.
The unfavorable change in net derivative gains (losses) on VA program derivatives was $401 million ($317 million, net of income tax). This was due to (i) an unfavorable change of $360 million, ($284 million, net of income tax) in other risks in embedded derivatives, and (ii) an unfavorable change of $132 million ($104 million, net of income tax) in market risks in embedded derivatives, net of freestanding derivatives hedging market risks in embedded derivatives, partially offset by a favorable change of $91 million ($71 million, net of income tax) in the nonperformance risk adjustment on embedded derivatives.
The aforementioned $360 million ($284 million, net of income tax) unfavorable change in other risks in embedded derivatives reflects actuarial assumption updates and a combination of factors, such as fees deducted from accounts, changes in the benefit base, premiums, lapses, withdrawals and deaths, in addition to changes to cross-effect, basis mismatch, risk margin and fund allocation.
The aforementioned $132 million ($104 million, net of income tax) unfavorable change reflects a $513 million ($405 million, net of income tax) unfavorable change in market risks in embedded derivatives, partially offset by a $381 million ($301 million, net of income tax) favorable change in freestanding derivatives hedging market risks in embedded derivatives.
96
The primary changes in market factors affecting the valuation of VA program derivatives are summarized as follows:
•
Key equity index levels decreased in the current period versus increased in the prior period, contributing to an unfavorable change in our embedded derivatives and a favorable change in our freestanding derivatives. For example, the S&P 500 Index decreased 25% in the current period and increased 15% in the prior period.
•
Long-term interest rates increased more significantly in the current period compared to the prior period, contributing to an unfavorable change in our freestanding derivatives and a favorable change in our embedded derivatives. For example, the 30-year U.S. swap rate increased 162 basis points in the current period and increased 39 basis points in the prior period.
The aforementioned $91 million ($71 million, net of income tax) favorable change in the nonperformance risk adjustment on embedded derivatives resulted from a favorable change of $57 million ($45 million, net of income tax) related to model changes and changes in capital market inputs, such as long-term interest rates and key equity index levels, on variable annuity guarantees, in addition to a favorable change of $34 million ($26 million, net of income tax) related to changes in our own credit spread.
Net Investment Gains (Losses)
. The unfavorable change in net investment gains (losses) of $3.3 billion ($2.6 billion, net of income tax) primarily reflects (i) current period losses on sales of fixed maturity securities, (ii) the prior period gain on the disposition of MetLife P&C, (iii) net foreign currency transaction losses in the current period, (iv) lower gains on sales of real estate investments, and (v) mark-to-market losses in the current period compared to market-to-market gains in the prior period on equity securities, which are measured at fair value through net income (loss). These unfavorable changes were partially offset by prior period losses on the sale of MetLife Seguros and pending disposition of MetLife Poland and Greece.
Divested Businesses.
Income (loss) before provision for income tax related to divested businesses, excluding net investment gains (losses) and net derivative gains (losses), decreased $105 million ($84 million, net of income tax) to a loss of $10 million ($3 million, net of income tax) in the current period from income of $95 million ($81 million, net of income tax) in the prior period. Included in this decrease was a decline in total revenues of $938 million, before income tax, and a decrease in total expenses of $833 million, before income tax. Divested businesses primarily included activity related to the disposition of MetLife P&C in the prior period.
Taxes
. For the nine months ended September 30, 2022, our effective tax rate on income (loss) before provision for income tax was (7%), which reflects an income tax benefit despite having income before provisions for income tax. Our effective tax rate differed from the U.S. statutory rate of 21% primarily due to tax benefits from foreign earnings taxed at different rates than the U.S. statutory rate, tax credits, the corporate tax deduction for stock compensation and non-taxable investment income. For the nine months ended September 30, 2021, our effective tax rate on income (loss) before provision for income tax was equal to the U.S. statutory rate of 21% as tax charges from foreign earnings taxed at different rates than the U.S. statutory rate, the completed sales of MetLife P&C and MetLife Seguros, and the pending disposition of MetLife Poland and Greece, were offset by tax benefits related to tax credits, non-taxable investment income and the corporate tax deduction for stock compensation.
Actuarial Assumption Review and Certain Other Insurance Adjustments
. For the results of our 2022 and 2021 annual actuarial assumption reviews, see “— Three Months Ended September 30, 2022 Compared with the Three Months Ended September 30, 2021 — Actuarial Assumption Review and Certain Other Insurance Adjustments.”
Certain other insurance adjustments recorded in the current period include a $115 million ($91 million, net of income tax) favorable reinsurance recapture in our U.S. segment, a $97 million ($77 million, net of income tax) favorable reinsurance settlement in our MetLife Holdings segment and a $114 million ($90 million, net of income tax) charge related to model refinements in our MetLife Holdings segment. These adjustments are included in adjusted earnings.
Adjusted Earnings.
Adjusted earnings available to common shareholders decreased $1.8 billion, net of income tax, to $4.3 billion, net of income tax, for the nine months ended September 30, 2022 from $6.1 billion, net of income tax, for the nine months ended September 30, 2021.
97
Reconciliation of net income (loss) to adjusted earnings available to common shareholders and premiums, fees and other revenues to adjusted premiums, fees and other revenues
Three Months Ended September 30, 2022
| U.S. | Asia | Latin America | EMEA | MetLife Holdings | Corporate & Other | Total | ||||||||||||||||||||||||||||||||||||||
| (In millions) | ||||||||||||||||||||||||||||||||||||||||||||
| Net income (loss) available to MetLife, Inc.'s common shareholders | $ | 837 | $ | (421) | $ | 77 | $ | 4 | $ | 29 | $ | (195) | $ | 331 | ||||||||||||||||||||||||||||||
| Add: Preferred stock dividends | — | — | — | — | — | 64 | 64 | |||||||||||||||||||||||||||||||||||||
| Add: Preferred stock redemption premium | — | — | — | — | — | — | — | |||||||||||||||||||||||||||||||||||||
| Add: Net income (loss) attributable to noncontrolling interests | — | (1) | 2 | 1 | — | 3 | 5 | |||||||||||||||||||||||||||||||||||||
| Net income (loss) | 837 | (422) | 79 | 5 | 29 | (128) | 400 | |||||||||||||||||||||||||||||||||||||
|
Less: adjustments from net income (loss) to adjusted earnings available to common shareholders:
|
||||||||||||||||||||||||||||||||||||||||||||
| Revenues: | ||||||||||||||||||||||||||||||||||||||||||||
| Net investment gains (losses) | (71) | (386) | 20 | (19) | (53) | 95 | (414) | |||||||||||||||||||||||||||||||||||||
| Net derivative gains (losses) | 284 | (559) | 10 | 7 | (249) | 27 | (480) | |||||||||||||||||||||||||||||||||||||
|
Premiums
|
— | — | — | — | — | — | — | |||||||||||||||||||||||||||||||||||||
| Universal life and investment-type product policy fees | — | (8) | — | 1 | 19 | — | 12 | |||||||||||||||||||||||||||||||||||||
|
Net investment income
|
(93) | (82) | (63) | (269) | (70) | (1) | (578) | |||||||||||||||||||||||||||||||||||||
| Other revenues | — | — | — | 1 | — | 39 | 40 | |||||||||||||||||||||||||||||||||||||
|
Expenses:
|
||||||||||||||||||||||||||||||||||||||||||||
|
Policyholder benefits and claims and policyholder dividends
|
(2) | 66 | (92) | (40) | 211 | — | 143 | |||||||||||||||||||||||||||||||||||||
| Interest credited to policyholder account balances | — | 53 | (1) | 250 | — | — | 302 | |||||||||||||||||||||||||||||||||||||
|
Capitalization of DAC
|
— | — | — | — | — | — | — | |||||||||||||||||||||||||||||||||||||
| Amortization of DAC and VOBA | — | 8 | — | 1 | 108 | — | 117 | |||||||||||||||||||||||||||||||||||||
|
Amortization of negative VOBA
|
— | — | — | — | — | — | — | |||||||||||||||||||||||||||||||||||||
| Interest expense on debt | — | — | — | — | — | — | — | |||||||||||||||||||||||||||||||||||||
|
Other expenses
|
— | — | 3 | (1) | — | (62) | (60) | |||||||||||||||||||||||||||||||||||||
| Goodwill impairment | — | — | — | — | — | — | — | |||||||||||||||||||||||||||||||||||||
|
Provision for income tax (expense) benefit
|
(25) | 289 | 31 | 14 | 4 | (25) | 288 | |||||||||||||||||||||||||||||||||||||
| Adjusted earnings | $ | 744 | $ | 197 | $ | 171 | $ | 60 | $ | 59 | (201) | 1,030 | ||||||||||||||||||||||||||||||||
| Less: Preferred stock dividends | 64 | 64 | ||||||||||||||||||||||||||||||||||||||||||
| Adjusted earnings available to common shareholders | $ | (265) | $ | 966 | ||||||||||||||||||||||||||||||||||||||||
| Premiums, fees and other revenues | $ | 14,966 | $ | 1,781 | $ | 1,123 | $ | 547 | $ | 1,035 | $ | 127 | $ | 19,579 | ||||||||||||||||||||||||||||||
| Less: adjustments to premiums, fees and other revenues | — | (8) | — | 2 | 19 | 39 | 52 | |||||||||||||||||||||||||||||||||||||
| Adjusted premiums, fees and other revenues | $ | 14,966 | $ | 1,789 | $ | 1,123 | $ | 545 | $ | 1,016 | $ | 88 | $ | 19,527 | ||||||||||||||||||||||||||||||
98
Three Months Ended September 30, 2021
| U.S. | Asia | Latin America | EMEA | MetLife Holdings | Corporate & Other | Total | ||||||||||||||||||||||||||||||||||||||
| (In millions) | ||||||||||||||||||||||||||||||||||||||||||||
| Net income (loss) available to MetLife, Inc.'s common shareholders | $ | 978 | $ | 610 | $ | (402) | $ | 74 | $ | 501 | $ | (240) | $ | 1,521 | ||||||||||||||||||||||||||||||
| Add: Preferred stock dividends | — | — | — | — | — | 63 | 63 | |||||||||||||||||||||||||||||||||||||
| Add: Preferred stock redemption premium | — | — | — | — | — | — | — | |||||||||||||||||||||||||||||||||||||
| Add: Net income (loss) attributable to noncontrolling interests | — | — | 1 | 1 | — | 3 | 5 | |||||||||||||||||||||||||||||||||||||
| Net income (loss) | 978 | 610 | (401) | 75 | 501 | (174) | 1,589 | |||||||||||||||||||||||||||||||||||||
|
Less: adjustments from net income (loss) to adjusted earnings available to common shareholders:
|
||||||||||||||||||||||||||||||||||||||||||||
| Revenues: | ||||||||||||||||||||||||||||||||||||||||||||
| Net investment gains (losses) | 115 | 122 | (199) | (13) | 48 | (157) | (84) | |||||||||||||||||||||||||||||||||||||
| Net derivative gains (losses) | 86 | (34) | (299) | (9) | (3) | 41 | (218) | |||||||||||||||||||||||||||||||||||||
|
Premiums
|
— | — | — | 57 | — | — | 57 | |||||||||||||||||||||||||||||||||||||
| Universal life and investment-type product policy fees | — | 46 | — | 18 | 20 | — | 84 | |||||||||||||||||||||||||||||||||||||
|
Net investment income
|
(89) | 16 | (9) | 61 | (74) | (5) | (100) | |||||||||||||||||||||||||||||||||||||
| Other revenues | — | — | — | 6 | — | 73 | 79 | |||||||||||||||||||||||||||||||||||||
|
Expenses:
|
||||||||||||||||||||||||||||||||||||||||||||
|
Policyholder benefits and claims and policyholder dividends
|
(8) | (21) | — | (43) | (108) | (1) | (181) | |||||||||||||||||||||||||||||||||||||
| Interest credited to policyholder account balances | 1 | (55) | (8) | (58) | — | — | (120) | |||||||||||||||||||||||||||||||||||||
|
Capitalization of DAC
|
— | — | — | 15 | — | — | 15 | |||||||||||||||||||||||||||||||||||||
| Amortization of DAC and VOBA | — | (30) | — | (13) | (15) | — | (58) | |||||||||||||||||||||||||||||||||||||
|
Amortization of negative VOBA
|
— | — | — | — | — | — | — | |||||||||||||||||||||||||||||||||||||
| Interest expense on debt | — | — | — | — | — | — | — | |||||||||||||||||||||||||||||||||||||
|
Other expenses
|
— | — | 1 | (36) | — | (74) | (109) | |||||||||||||||||||||||||||||||||||||
| Goodwill impairment | — | — | — | — | — | — | — | |||||||||||||||||||||||||||||||||||||
|
Provision for income tax (expense) benefit
|
(22) | (3) | 84 | (4) | 27 | 17 | 99 | |||||||||||||||||||||||||||||||||||||
| Adjusted earnings | $ | 895 | $ | 569 | $ | 29 | $ | 94 | $ | 606 | (68) | 2,125 | ||||||||||||||||||||||||||||||||
| Less: Preferred stock dividends | 63 | 63 | ||||||||||||||||||||||||||||||||||||||||||
| Adjusted earnings available to common shareholders | $ | (131) | $ | 2,062 | ||||||||||||||||||||||||||||||||||||||||
|
Adjusted earnings available to common shareholders on a constant currency basis (1)
|
$ | 895 | $ | 555 | $ | 19 | $ | 75 | $ | 606 | $ | (131) | $ | 2,019 | ||||||||||||||||||||||||||||||
| Premiums, fees and other revenues | $ | 6,408 | $ | 2,134 | $ | 988 | $ | 751 | $ | 1,161 | $ | 197 | $ | 11,639 | ||||||||||||||||||||||||||||||
| Less: adjustments to premiums, fees and other revenues | — | 46 | — | 81 | 20 | 73 | 220 | |||||||||||||||||||||||||||||||||||||
| Adjusted premiums, fees and other revenues | $ | 6,408 | $ | 2,088 | $ | 988 | $ | 670 | $ | 1,141 | $ | 124 | $ | 11,419 | ||||||||||||||||||||||||||||||
| Adjusted premiums, fees and other revenues on a constant currency basis (1) | $ | 6,408 | $ | 1,762 | $ | 930 | $ | 583 | $ | 1,141 | $ | 124 | $ | 10,948 | ||||||||||||||||||||||||||||||
__________________
(1)
Amounts for U.S., MetLife Holdings and Corporate & Other are shown on a reported basis, as constant currency impact is not significant.
99
Nine Months Ended September 30, 2022
| U.S. | Asia | Latin America | EMEA | MetLife Holdings | Corporate & Other | Total | ||||||||||||||||||||||||||||||||||||||
| (In millions) | ||||||||||||||||||||||||||||||||||||||||||||
| Net income (loss) available to MetLife, Inc.'s common shareholders | $ | 1,941 | $ | (1,250) | $ | 318 | $ | 11 | $ | 319 | $ | (299) | $ | 1,040 | ||||||||||||||||||||||||||||||
| Add: Preferred stock dividends | — | — | — | — | — | 156 | 156 | |||||||||||||||||||||||||||||||||||||
| Add: Preferred stock redemption premium | — | — | — | — | — | — | — | |||||||||||||||||||||||||||||||||||||
| Add: Net income (loss) attributable to noncontrolling interests | — | — | 6 | 4 | — | 6 | 16 | |||||||||||||||||||||||||||||||||||||
| Net income (loss) | 1,941 | (1,250) | 324 | 15 | 319 | (137) | 1,212 | |||||||||||||||||||||||||||||||||||||
| Less: adjustments from net income (loss) to adjusted earnings available to common shareholders: | ||||||||||||||||||||||||||||||||||||||||||||
| Revenues: | ||||||||||||||||||||||||||||||||||||||||||||
| Net investment gains (losses) | (677) | (1,043) | 58 | (122) | (200) | 367 | (1,617) | |||||||||||||||||||||||||||||||||||||
| Net derivative gains (losses) | 532 | (2,468) | 72 | (16) | (771) | 117 | (2,534) | |||||||||||||||||||||||||||||||||||||
|
Premiums
|
— | — | — | 41 | — | — | 41 | |||||||||||||||||||||||||||||||||||||
| Universal life and investment-type product policy fees | — | (27) | — | 19 | 57 | — | 49 | |||||||||||||||||||||||||||||||||||||
|
Net investment income
|
(226) | (344) | (219) | (1,213) | (208) | 3 | (2,207) | |||||||||||||||||||||||||||||||||||||
| Other revenues | — | — | — | 6 | — | 132 | 138 | |||||||||||||||||||||||||||||||||||||
|
Expenses:
|
||||||||||||||||||||||||||||||||||||||||||||
|
Policyholder benefits and claims and policyholder dividends
|
12 | 88 | (309) | (120) | 438 | — | 109 | |||||||||||||||||||||||||||||||||||||
| Interest credited to policyholder account balances | — | 252 | 43 | 1,204 | — | — | 1,499 | |||||||||||||||||||||||||||||||||||||
|
Capitalization of DAC
|
— | — | — | 11 | — | — | 11 | |||||||||||||||||||||||||||||||||||||
| Amortization of DAC and VOBA | — | 35 | — | (8) | 79 | — | 106 | |||||||||||||||||||||||||||||||||||||
|
Amortization of negative VOBA
|
— | — | — | — | — | — | — | |||||||||||||||||||||||||||||||||||||
| Interest expense on debt | — | — | — | — | — | — | — | |||||||||||||||||||||||||||||||||||||
|
Other expenses
|
— | — | 7 | (26) | — | (187) | (206) | |||||||||||||||||||||||||||||||||||||
| Goodwill impairment | — | — | — | — | — | — | — | |||||||||||||||||||||||||||||||||||||
| Provision for income tax (expense) benefit | 75 | 1,094 | 92 | 63 | 124 | (100) | 1,348 | |||||||||||||||||||||||||||||||||||||
| Adjusted earnings | $ | 2,225 | $ | 1,163 | $ | 580 | $ | 176 | $ | 800 | (469) | 4,475 | ||||||||||||||||||||||||||||||||
| Less: Preferred stock dividends | 156 | 156 | ||||||||||||||||||||||||||||||||||||||||||
| Adjusted earnings available to common shareholders | $ | (625) | $ | 4,319 | ||||||||||||||||||||||||||||||||||||||||
| Premiums, fees and other revenues | $ | 31,796 | $ | 5,701 | $ | 3,286 | $ | 1,803 | $ | 3,284 | $ | 411 | $ | 46,281 | ||||||||||||||||||||||||||||||
| Less: adjustments to premiums, fees and other revenues | — | (27) | — | 66 | 57 | 132 | 228 | |||||||||||||||||||||||||||||||||||||
| Adjusted premiums, fees and other revenues | $ | 31,796 | $ | 5,728 | $ | 3,286 | $ | 1,737 | $ | 3,227 | $ | 279 | $ | 46,053 | ||||||||||||||||||||||||||||||
100
Nine Months Ended September 30, 2021
| U.S. | Asia | Latin America | EMEA | MetLife Holdings | Corporate & Other | Total | ||||||||||||||||||||||||||||||||||||||
| (In millions) | ||||||||||||||||||||||||||||||||||||||||||||
| Net income (loss) available to MetLife, Inc.'s common shareholders | $ | 2,905 | $ | 1,171 | $ | (319) | $ | 34 | $ | 746 | $ | 640 | $ | 5,177 | ||||||||||||||||||||||||||||||
| Add: Preferred stock dividends | — | — | — | — | — | 166 | 166 | |||||||||||||||||||||||||||||||||||||
| Add: Preferred stock redemption premium | — | — | — | — | — | 6 | 6 | |||||||||||||||||||||||||||||||||||||
| Add: Net income (loss) attributable to noncontrolling interests | — | 1 | 4 | 2 | — | 8 | 15 | |||||||||||||||||||||||||||||||||||||
| Net income (loss) | 2,905 | 1,172 | (315) | 36 | 746 | 820 | 5,364 | |||||||||||||||||||||||||||||||||||||
| Less: adjustments from net income (loss) to adjusted earnings available to common shareholders: | ||||||||||||||||||||||||||||||||||||||||||||
| Revenues: | ||||||||||||||||||||||||||||||||||||||||||||
| Net investment gains (losses) | 473 | 62 | (195) | (200) | 94 | 1,421 | 1,655 | |||||||||||||||||||||||||||||||||||||
| Net derivative gains (losses) | 127 | (737) | (412) | 6 | (964) | (52) | (2,032) | |||||||||||||||||||||||||||||||||||||
| Premiums | 865 | — | — | 57 | — | — | 922 | |||||||||||||||||||||||||||||||||||||
| Universal life and investment-type product policy fees | — | 59 | — | 26 | 60 | — | 145 | |||||||||||||||||||||||||||||||||||||
| Net investment income | (236) | 77 | (27) | 479 | (216) | 6 | 83 | |||||||||||||||||||||||||||||||||||||
| Other revenues | 11 | — | — | 6 | — | 168 | 185 | |||||||||||||||||||||||||||||||||||||
| Expenses: | ||||||||||||||||||||||||||||||||||||||||||||
| Policyholder benefits and claims and policyholder dividends | (603) | (59) | 91 | (92) | (257) | (1) | (921) | |||||||||||||||||||||||||||||||||||||
| Interest credited to policyholder account balances | 2 | (194) | (33) | (470) | — | — | (695) | |||||||||||||||||||||||||||||||||||||
| Capitalization of DAC | 89 | — | — | 15 | — | — | 104 | |||||||||||||||||||||||||||||||||||||
| Amortization of DAC and VOBA | (98) | (27) | — | (12) | — | — | (137) | |||||||||||||||||||||||||||||||||||||
| Amortization of negative VOBA | — | — | — | — | — | — | — | |||||||||||||||||||||||||||||||||||||
| Interest expense on debt | — | — | — | — | — | (1) | (1) | |||||||||||||||||||||||||||||||||||||
| Other expenses | (222) | 1 | 3 | (40) | — | (181) | (439) | |||||||||||||||||||||||||||||||||||||
| Goodwill impairment | — | — | — | — | — | — | — | |||||||||||||||||||||||||||||||||||||
| Provision for income tax (expense) benefit | (84) | 278 | 92 | 2 | 269 | (344) | 213 | |||||||||||||||||||||||||||||||||||||
| Adjusted earnings | $ | 2,581 | $ | 1,712 | $ | 166 | $ | 259 | $ | 1,760 | (196) | 6,282 | ||||||||||||||||||||||||||||||||
| Less: Preferred stock dividends | 166 | 166 | ||||||||||||||||||||||||||||||||||||||||||
| Adjusted earnings available to common shareholders | $ | (362) | $ | 6,116 | ||||||||||||||||||||||||||||||||||||||||
| Adjusted earnings available to common shareholders on a constant currency basis (1) | $ | 2,581 | $ | 1,658 | $ | 134 | $ | 212 | $ | 1,760 | $ | (362) | $ | 5,983 | ||||||||||||||||||||||||||||||
| Premiums, fees and other revenues | $ | 19,812 | $ | 6,345 | $ | 2,797 | $ | 2,181 | $ | 3,545 | $ | 526 | $ | 35,206 | ||||||||||||||||||||||||||||||
| Less: adjustments to premiums, fees and other revenues | 876 | 59 | — | 89 | 60 | 168 | 1,252 | |||||||||||||||||||||||||||||||||||||
| Adjusted premiums, fees and other revenues | $ | 18,936 | $ | 6,286 | $ | 2,797 | $ | 2,092 | $ | 3,485 | $ | 358 | $ | 33,954 | ||||||||||||||||||||||||||||||
| Adjusted premiums, fees and other revenues on a constant currency basis (1) | $ | 18,936 | $ | 5,551 | $ | 2,678 | $ | 1,880 | $ | 3,485 | $ | 358 | $ | 32,888 | ||||||||||||||||||||||||||||||
__________________
(1)
Amounts for U.S., MetLife Holdings and Corporate & Other are shown on a reported basis, as constant currency impact is not significant.
101
Consolidated Results - Adjusted Earnings
Business Overview.
Adjusted premiums, fees and other revenues for the three months ended September 30, 2022 increased $8.1 billion, or 71%, compared to the prior period. Adjusted premiums, fees and other revenues, net of foreign currency fluctuations, increased $8.6 billion, or 78%, compared to the prior period primarily due to higher premiums in our RIS business and growth in our Group Benefits business, both in our U.S. segment. Strong sales and solid persistency in our Latin America segment also contributed to the improvement in adjusted premiums, fees and other revenues. In our Asia segment, increases in Japan and Australia were partially offset by the impact of our actuarial assumption review in both periods. A decrease in adjusted premiums, fees and other revenues in our EMEA segment was primarily due to refinements to unearned revenue reserves in both periods. In our MetLife Holdings segment, we anticipate an annual decline in adjusted premiums, fees and other revenues of approximately 6% to 8% per year from expected business run-off.
Three Months Ended September 30, 2022 Compared with the Three Months Ended September 30, 2021
Unless otherwise stated, all amounts discussed below are net of income tax.
Overview.
The primary drivers of the decrease in adjusted earnings were lower investment yields due to the unfavorable impact of lower equity market returns on our private equity funds and hedge funds, as well as higher interest credited expense, partially offset by favorable underwriting, primarily driven by an overall decline in COVID-19 related claims, higher net investment income due to a larger average invested asset base and the favorable change from our annual actuarial assumption reviews. In addition, the current period includes the favorable impact from a reinsurance recapture in our U.S. segment and the unfavorable impact from model refinements in our MetLife Holdings segment.
Foreign Currency.
Changes in foreign currency exchange rates had a $43 million negative impact on adjusted earnings for the third quarter of 2022 compared to the prior period. Unless otherwise stated, all amounts discussed below are net of foreign currency fluctuations. Foreign currency fluctuations can result in significant variances in the financial statement line items.
Business Growth
. We benefited from positive net flows from most of our businesses, which increased our average invested asset base and resulted in higher net investment income. However, consistent with the growth in average invested assets, interest credited expenses on certain insurance-related liabilities increased. Higher premiums, fees and other revenues, net of corresponding changes in policyholder benefits, improved adjusted earnings, primarily from growth in our Asia and Latin America segments, partially offset by a decline in our MetLife Holdings segment. Higher commissions were offset by higher DAC capitalization. In our U.S. segment, higher variable expenses, coupled with higher direct expenses, including certain employee-related costs, exceeded the corresponding increase in premiums, fees and other revenues. The combined impact of the items affecting our business growth, as well as higher DAC amortization, resulted in a $62 million decrease in adjusted earnings.
Market Factors
. Market factors, including interest rate levels, variability in equity market returns, and foreign currency fluctuations, continued to impact our results; however, certain impacts were mitigated by derivatives used to hedge these risks. Excluding the impact of changes in foreign currency exchange rates on net investment income in our non-U.S. segments and changes in inflation rates on our inflation-indexed investments, investment yields decreased. The decrease in investment yields was primarily driven by the unfavorable impact of lower equity market returns on our private equity and hedge funds, lower prepayment fees and lower real estate market returns on our real estate investments, primarily real estate funds. These decreases were partially offset by the favorable impact of higher yields on our fixed income securities. The changes in market factors discussed above resulted in a $1.4 billion decrease in adjusted earnings.
Underwriting, Actuarial Assumption Review and Other Insurance Adjustments.
Favorable underwriting resulted in a $286 million increase in adjusted earnings and reflected overall lower impacts from the COVID-19 pandemic. This was primarily driven by favorable mortality in our U.S. and Latin America segments, partially offset by unfavorable claims experience in our Asia segment. The favorable change from our annual actuarial assumption reviews resulted in a net increase of $173 million in adjusted earnings. Refinements to certain insurance and other liabilities in both periods resulted in a $42 million increase in adjusted earnings, which includes the favorable impact from a reinsurance recapture in our U.S. segment mostly offset by model refinements in our MetLife Holdings segment, all in the current period.
Expenses.
Adjusted earnings decreased $67 million primarily due to increases in corporate-related expenses and employee-related costs.
102
Taxes
. For the three months ended September 30, 2022, our effective tax rate on adjusted earnings was 23%, which differed from the U.S. statutory rate of 21% primarily due to tax charges from foreign earnings taxed at different rates than the U.S. statutory rate, partially offset by tax benefits from tax credits. For the three months ended September 30, 2021, our effective tax rate on adjusted earnings was equal to the U.S. statutory rate of 21% as benefits from tax credits and non-taxable investment income were offset by tax charges from foreign earnings taxed at different rates than the U.S. statutory rate.
Nine Months Ended September 30, 2022 Compared with the Nine Months Ended September 30, 2021
Unless otherwise stated, all amounts discussed below are net of income tax.
Overview.
The primary drivers of the decrease in adjusted earnings were lower investment yields due to the unfavorable impact of lower equity market returns on our private equity funds and hedge funds, higher interest credited expense and higher expenses, partially offset by higher net investment income due to a larger average invested asset base, favorable underwriting, primarily driven by an overall decline in COVID-19 related claims, and the favorable change from our annual actuarial assumption reviews. In addition, the current period includes the favorable impacts from a reinsurance recapture in our U.S. segment and a reinsurance settlement in our MetLife Holdings segment, as well as the unfavorable impact from model refinements in our MetLife Holdings segment and the prior period included the release of a legal reserve.
Foreign Currency.
Changes in foreign currency exchange rates had a $134 million negative impact on adjusted earnings for the first nine months of 2022 compared to the prior period. Unless otherwise stated, all amounts discussed below are net of foreign currency fluctuations. Foreign currency fluctuations can result in significant variances in the financial statement line items.
Business Growth
. We benefited from positive net flows from most of our businesses, which increased our average invested asset base and resulted in higher net investment income. However, consistent with the growth in average invested assets, interest credited expenses on certain insurance-related liabilities increased. Higher premiums, fees and other revenues, net of corresponding changes in policyholder benefits, improved adjusted earnings, primarily from growth in our Asia, Latin America and EMEA segments, partially offset by a decline in our MetLife Holdings segment. Higher commissions were offset by higher DAC capitalization. The combined impact of the items affecting our business growth, partially offset by higher DAC amortization, resulted in a $430 million increase in adjusted earnings.
Market Factors
. Market factors, including interest rate levels, variability in equity market returns, and foreign currency fluctuations, continued to impact our results; however, certain impacts were mitigated by derivatives used to hedge these risks. Excluding the impact of changes in foreign currency exchange rates on net investment income in our non-U.S. segments and changes in inflation rates on our inflation-indexed investments, investment yields decreased. The decrease in investment yields was primarily driven by the unfavorable impact of lower equity market returns on our private equity funds, hedge funds, and fair value option securities (“FVO Securities”), as well as lower prepayment fees. These decreases were partially offset by higher yields on our fixed income securities, as well as the favorable impact of higher real estate market returns on our real estate investments. The changes in market factors discussed above resulted in a $2.7 billion decrease in adjusted earnings.
Underwriting, Actuarial Assumption Review and Other Insurance Adjustments.
Favorable underwriting resulted in a $563 million increase in adjusted earnings and reflected overall lower impacts from the COVID-19 pandemic. This was primarily driven by favorable mortality in our U.S. and Latin America segments, partially offset by unfavorable claims experience in our Asia segment. The favorable change from our annual actuarial assumption reviews resulted in a net increase of $173 million in adjusted earnings. Refinements to certain insurance and other liabilities in both periods resulted in a $127 million increase in adjusted earnings, which includes the favorable impacts from a reinsurance recapture in our U.S. segment and a reinsurance settlement in our MetLife Holdings segment, mostly offset by model refinements in our MetLife Holdings segment, all in the current period.
Expenses.
Adjusted earnings decreased $273 million primarily due to increases in corporate-related expenses and employee-related costs, as well as the release of a legal reserve in the prior period.
103
Taxes
. For the nine months ended September 30, 2022, our effective tax rate on adjusted earnings was 22%, which differed from the U.S. statutory rate of 21% primarily due to tax charges from foreign earnings taxed at different rates than the U.S. statutory rate offset by tax benefits from tax credits, the corporate tax deduction for stock compensation and non-taxable investment income. For the nine months ended September 30, 2021, our effective tax rate on adjusted earnings was equal to the U.S. statutory rate of 21% as tax benefits from tax credits, non-taxable investment income and the corporate tax deduction for stock compensation were offset by tax charges from foreign earnings taxed at different rates than the U.S. statutory rate.
104
Segment Results and Corporate & Other
U.S.
Business Overview.
Adjusted premiums, fees and other revenues for the three months ended September 30, 2022 increased $8.6 billion, or 134%, compared to the prior period. This was primarily due to higher premiums in our RIS business, as well as growth in our Group Benefits business. The increase in premiums in RIS was mainly driven by a large pension risk transfer transaction in the current period. Changes in RIS premiums are mostly offset by a corresponding change in policyholder benefits. The increase in our Group Benefits business was primarily due to growth from our voluntary products, group disability, dental and group life businesses.
|
Three Months
Ended September 30, |
Nine Months
Ended September 30, |
||||||||||||||||||||||
| 2022 | 2021 | 2022 | 2021 | ||||||||||||||||||||
| (In millions) | |||||||||||||||||||||||
| Adjusted revenues | |||||||||||||||||||||||
| Premiums | $ | 14,164 | $ | 5,746 | $ | 29,582 | $ | 16,919 | |||||||||||||||
| Universal life and investment-type product policy fees | 286 | 279 | 867 | 858 | |||||||||||||||||||
| Net investment income | 1,716 | 2,098 | 5,300 | 6,106 | |||||||||||||||||||
| Other revenues | 516 | 383 | 1,347 | 1,159 | |||||||||||||||||||
| Total adjusted revenues | 16,682 | 8,506 | 37,096 | 25,042 | |||||||||||||||||||
| Adjusted expenses | |||||||||||||||||||||||
| Policyholder benefits and claims and policyholder dividends | 14,265 | 6,118 | 30,151 | 17,999 | |||||||||||||||||||
| Interest credited to policyholder account balances | 478 | 362 | 1,212 | 1,080 | |||||||||||||||||||
| Capitalization of DAC | (23) | (17) | (60) | (48) | |||||||||||||||||||
| Amortization of DAC and VOBA | 15 | 26 | 43 | 50 | |||||||||||||||||||
| Interest expense on debt | 3 | 1 | 6 | 4 | |||||||||||||||||||
| Other expenses | 1,003 | 886 | 2,931 | 2,695 | |||||||||||||||||||
| Total adjusted expenses | 15,741 | 7,376 | 34,283 | 21,780 | |||||||||||||||||||
| Provision for income tax expense (benefit) | 197 | 235 | 588 | 681 | |||||||||||||||||||
| Adjusted earnings | $ | 744 | $ | 895 | $ | 2,225 | $ | 2,581 | |||||||||||||||
| Adjusted premiums, fees and other revenues | $ | 14,966 | $ | 6,408 | $ | 31,796 | $ | 18,936 | |||||||||||||||
Three Months Ended September 30, 2022 Compared with the Three Months Ended September 30, 2021
Unless otherwise stated, all amounts discussed below are net of income tax.
Business Growth
. The impact of positive flows from pension risk transfer transactions and funding agreement issuances resulted in higher average invested assets, improving net investment income. However, this was partially offset by a corresponding increase in interest credited expenses on long duration insurance and investment-type products. Higher variable expenses, coupled with higher direct expenses, including certain employee-related costs, exceeded the corresponding increase in premiums, fees and other revenues. The combined impact of the items affecting our business growth decreased adjusted earnings by $8 million.
Market Factors.
Market factors, including interest rate levels, variability in equity market returns and foreign currency fluctuations, continued to impact our results; however, certain impacts were mitigated by derivatives used to hedge these risks. Investment yields decreased primarily driven by the unfavorable impact of lower equity market returns on our private equity funds and lower real estate market returns on our real estate investments, primarily real estate funds. This was partially offset by higher yields on fixed income securities and mortgage loans. The impact of interest rate fluctuations resulted in an increase in our average interest credited rates on long duration insurance and investment-type products, which drove an increase in interest credited expenses. The changes in market factors discussed above resulted in a $537 million decrease in adjusted earnings.
105
Underwriting and Other Insurance Adjustments
. Favorable mortality in our Group Benefits business resulted in an increase in adjusted earnings of $343 million. This was driven by decreases in both incidence and severity of COVID-19 and non-COVID-19 claims. Less favorable mortality in our RIS business resulted in a decrease in adjusted earnings of $51 million, driven by our structured settlement, pension risk transfer and institutional income annuity businesses. Unfavorable claims experience in our group disability, individual disability and dental businesses, partially offset by favorable claims experience in our vision business and growth in our accident & health business resulted in a $38 million decrease in adjusted earnings. Refinements to certain insurance and other liabilities in both periods resulted in a $138 million increase in adjusted earnings, which includes the favorable impact from a reinsurance recapture in the current period.
Nine Months Ended September 30, 2022 Compared with the Nine Months Ended September 30, 2021
Unless otherwise stated, all amounts discussed below are net of income tax.
Business Growth
. The impact of positive flows from pension risk transfer transactions and funding agreement issuances resulted in higher average invested assets, improving net investment income. However, this was partially offset by a corresponding increase in interest credited expenses on long duration insurance and investment-type products. Higher direct expenses, including certain employee-related costs, coupled with an increase in variable expenses, exceeded the corresponding increase in premiums, fees and other revenues. The combined impact of the items affecting our business growth increased adjusted earnings by $204 million.
Market Factors
. Market factors, including interest rate levels, variability in equity market returns and foreign currency fluctuations, continued to impact our results; however, certain impacts were mitigated by derivatives used to hedge these risks. Investment yields decreased primarily driven by the unfavorable impact of lower equity market returns on our private equity funds and hedge funds, partially offset by higher yields on fixed income securities and mortgage loans, as well as the favorable impact of higher real estate market returns on our real estate investments. The impact of interest rate fluctuations resulted in an increase in our average interest credited rates on long duration insurance and investment-type products, which drove an increase in interest credited expenses. The changes in market factors discussed above resulted in a $1.1 billion decrease in adjusted earnings.
Underwriting and Other Insurance Adjustments
. Favorable mortality in our Group Benefits business resulted in an increase in adjusted earnings of $510 million. This was driven by decreases in both incidence and severity of COVID-19 and non-COVID-19 claims. Less favorable mortality in our RIS business resulted in a decrease in adjusted earnings of $62 million, primarily driven by our structured settlement and pension risk transfer businesses. Unfavorable claims experience in our group disability and individual disability businesses, partially offset by growth in our accident & health business and favorable claims experience in our vision and dental businesses, resulted in a $25 million decrease in adjusted earnings. Refinements to certain insurance and other liabilities in both periods resulted in a $158 million increase in adjusted earnings, which includes the favorable impact from a reinsurance recapture in the current period.
106
Asia
Business Overview
. Adjusted premiums, fees and other revenues for the three months ended September 30, 2022 decreased $299 million, or 14%, compared to the prior period. Adjusted premiums, fees and other revenues, net of foreign currency fluctuations, increased $27 million, or 2%, compared to the prior period, mainly due to increases in Japan and Australia, partially offset by the impact of our annual actuarial assumption review in both periods. In Japan, higher fees from foreign currency-denominated life and fixed annuity products were partially offset by a decrease in premiums from yen-denominated life products. The increase in Australia was primarily due to higher group sales.
|
Three Months
Ended September 30, |
Nine Months
Ended September 30, |
||||||||||||||||||||||
| 2022 | 2021 | 2022 | 2021 | ||||||||||||||||||||
| (In millions) | |||||||||||||||||||||||
| Adjusted revenues | |||||||||||||||||||||||
| Premiums | $ | 1,347 | $ | 1,594 | $ | 4,295 | $ | 4,861 | |||||||||||||||
| Universal life and investment-type product policy fees | 421 | 477 | 1,367 | 1,371 | |||||||||||||||||||
| Net investment income | 827 | 1,354 | 3,081 | 3,776 | |||||||||||||||||||
| Other revenues | 21 | 17 | 66 | 54 | |||||||||||||||||||
| Total adjusted revenues | 2,616 | 3,442 | 8,809 | 10,062 | |||||||||||||||||||
| Adjusted expenses | |||||||||||||||||||||||
| Policyholder benefits and claims and policyholder dividends | 1,257 | 1,220 | 3,670 | 3,750 | |||||||||||||||||||
| Interest credited to policyholder account balances | 497 | 513 | 1,488 | 1,498 | |||||||||||||||||||
| Capitalization of DAC | (358) | (373) | (1,120) | (1,203) | |||||||||||||||||||
| Amortization of DAC and VOBA | 190 | 470 | 799 | 1,080 | |||||||||||||||||||
| Amortization of negative VOBA | (11) | (5) | (27) | (20) | |||||||||||||||||||
| Other expenses | 749 | 811 | 2,349 | 2,542 | |||||||||||||||||||
| Total adjusted expenses | 2,324 | 2,636 | 7,159 | 7,647 | |||||||||||||||||||
| Provision for income tax expense (benefit) | 95 | 237 | 487 | 703 | |||||||||||||||||||
| Adjusted earnings | $ | 197 | $ | 569 | $ | 1,163 | $ | 1,712 | |||||||||||||||
| Adjusted earnings on a constant currency basis | $ | 197 | $ | 555 | $ | 1,163 | $ | 1,658 | |||||||||||||||
| Adjusted premiums, fees and other revenues | $ | 1,789 | $ | 2,088 | $ | 5,728 | $ | 6,286 | |||||||||||||||
|
Adjusted premiums, fees and other revenues on a constant currency basis
|
$ | 1,789 | $ | 1,762 | $ | 5,728 | $ | 5,551 | |||||||||||||||
Three Months Ended September 30, 2022 Compared with the Three Months Ended September 30, 2021
Unless otherwise stated, all amounts discussed below are net of income tax.
Foreign Currency
. Changes in foreign currency exchange rates decreased adjusted earnings by $14 million for the third quarter of 2022 compared to the prior period, primarily due to the weakening of the Korean won and Japanese yen against the U.S. dollar. Unless otherwise stated, all amounts discussed below are net of foreign currency fluctuations. Foreign currency fluctuations can result in significant variances in the financial statement line items.
Business Growth
. Increased premiums, fees and other revenues, partially offset by higher policyholder benefits, contributed to Asia’s business growth. Consistent with this business growth, commissions increased, but were offset by DAC capitalization. Positive net flows in Japan and Korea resulted in higher average invested assets, which improved net investment income. The increase in net investment income was offset by a corresponding increase in interest credited expenses on certain insurance liabilities. The combined impact of the items affecting our business growth, partially offset by higher DAC amortization, improved adjusted earnings by $19 million.
107
Market Factors
. Market factors, including interest rate levels and variability in equity market returns, continued to impact our results; however, certain impacts were mitigated by derivatives used to hedge these risks. Investment yields decreased, driven by the unfavorable impact of lower equity market returns on our private equity funds, as well as lower real estate market returns on our real estate investments, primarily real estate funds. These unfavorable impacts were partially offset by higher yields on fixed income securities supporting products sold in Japan denominated in U.S. dollars and Japanese yen. A decrease in interest credited expenses on certain insurance liabilities also improved adjusted earnings. The changes in market factors discussed above decreased adjusted earnings by $353 million.
Underwriting, Actuarial Assumption Review and Other Insurance Adjustments
. Unfavorable underwriting, mainly driven by COVID-19-related claims in Japan, decreased adjusted earnings by $116 million. The favorable change from our annual actuarial assumption reviews resulted in a net increase of $102 million in adjusted earnings. Refinements to certain insurance liabilities and other liabilities in both periods resulted in an $8 million increase in adjusted earnings.
Expenses
. Higher expenses, primarily driven by other operating expenses, as well as an increase in corporate overhead costs, decreased adjusted earnings by $19 million.
Nine Months Ended September 30, 2022 Compared with the Nine Months Ended September 30, 2021
Unless otherwise stated, all amounts discussed below are net of income tax.
Foreign Currency
. Changes in foreign currency exchange rates decreased adjusted earnings by $54 million for the first nine months of 2022 compared to the prior period, primarily due to the weakening of the Japanese yen, Korean won and Australian dollar against the U.S. dollar. Unless otherwise stated, all amounts discussed below are net of foreign currency fluctuations. Foreign currency fluctuations can result in significant variances in the financial statement line items.
Business Growth
. Increased premiums, fees and other revenues, as well as lower variable expenses, were partially offset by higher policyholder benefits and commissions, net of DAC capitalization, which contributed to Asia’s business growth. Positive net flows in Japan and Korea resulted in higher average invested assets, which improved net investment income. The increase in net investment income was largely offset by a corresponding increase in interest credited expenses on certain insurance liabilities. The combined impact of the items affecting our business growth, partially offset by higher DAC amortization, improved adjusted earnings by $98 million.
Market Factors
. Market factors, including interest rate levels and variability in equity market returns, continued to impact our results; however, certain impacts were mitigated by derivatives used to hedge these risks. Investment yields decreased, driven by the unfavorable impact of lower equity market returns on our private equity and hedge funds, and lower net investment income on derivatives. These unfavorable impacts were partially offset by the favorable impact of higher real estate market returns on our real estate investments, primarily real estate funds, as well as higher yields on fixed income securities supporting products sold in Japan denominated in U.S. dollars and Japanese yen. In addition, there were higher earnings from our operating joint ventures in China and India. In addition, a decrease in interest credited expenses on certain insurance liabilities improved adjusted earnings. The changes in market factors discussed above decreased adjusted earnings by $488 million.
Underwriting, Actuarial Assumption Review and Other Insurance Adjustments
. Unfavorable underwriting, mainly driven by COVID-19-related claims in Japan, decreased adjusted earnings by $176 million. The favorable change from our annual actuarial assumption reviews resulted in a net increase of $102 million in adjusted earnings. Refinements to certain insurance liabilities and other liabilities in both periods resulted in an $11 million increase in adjusted earnings.
Expenses
. Higher expenses, primarily driven by higher employee-related and other operating expenses, as well as an increase in corporate overhead costs, decreased adjusted earnings by $44 million.
108
Latin America
Business Overview.
Adjusted premiums, fees and other revenues for the three months ended September 30, 2022 increased $135 million, or 14%, compared to the prior period. Adjusted premiums, fees and other revenues, net of foreign currency fluctuations, increased $193 million, or 21%, compared to the prior period, mainly driven by strong sales and solid persistency across the region.
|
Three Months
Ended September 30, |
Nine Months
Ended September 30, |
||||||||||||||||||||||
| 2022 | 2021 | 2022 | 2021 | ||||||||||||||||||||
| (In millions) | |||||||||||||||||||||||
| Adjusted revenues | |||||||||||||||||||||||
| Premiums | $ | 823 | $ | 705 | $ | 2,381 | $ | 1,936 | |||||||||||||||
| Universal life and investment-type product policy fees | 290 | 274 | 876 | 831 | |||||||||||||||||||
| Net investment income | 399 | 306 | 1,180 | 913 | |||||||||||||||||||
| Other revenues | 10 | 9 | 29 | 30 | |||||||||||||||||||
| Total adjusted revenues | 1,522 | 1,294 | 4,466 | 3,710 | |||||||||||||||||||
| Adjusted expenses | |||||||||||||||||||||||
| Policyholder benefits and claims and policyholder dividends | 874 | 885 | 2,454 | 2,370 | |||||||||||||||||||
| Interest credited to policyholder account balances | 89 | 63 | 241 | 182 | |||||||||||||||||||
| Capitalization of DAC | (130) | (109) | (363) | (304) | |||||||||||||||||||
| Amortization of DAC and VOBA | 68 | 62 | 238 | 205 | |||||||||||||||||||
| Interest expense on debt | 3 | 2 | 10 | 4 | |||||||||||||||||||
| Other expenses | 398 | 363 | 1,122 | 1,041 | |||||||||||||||||||
| Total adjusted expenses | 1,302 | 1,266 | 3,702 | 3,498 | |||||||||||||||||||
| Provision for income tax expense (benefit) | 49 | (1) | 184 | 46 | |||||||||||||||||||
| Adjusted earnings | $ | 171 | $ | 29 | $ | 580 | $ | 166 | |||||||||||||||
| Adjusted earnings on a constant currency basis | $ | 171 | $ | 19 | $ | 580 | $ | 134 | |||||||||||||||
| Adjusted premiums, fees and other revenues | $ | 1,123 | $ | 988 | $ | 3,286 | $ | 2,797 | |||||||||||||||
| Adjusted premiums, fees and other revenues on a constant currency basis | $ | 1,123 | $ | 930 | $ | 3,286 | $ | 2,678 | |||||||||||||||
Three Months Ended September 30, 2022 Compared with the Three Months Ended September 30, 2021
Unless otherwise stated, all amounts discussed below are net of income tax.
Foreign Currency.
Changes in foreign currency exchange rates decreased adjusted earnings by $10 million for the third quarter of 2022 compared to the prior period, mainly due to the weakening of foreign currencies against the U.S. dollar, primarily the Chilean peso. Unless otherwise stated, all amounts discussed below are net of foreign currency fluctuations. Foreign currency fluctuations can result in significant variances in the financial statement line items.
Business Growth
. Latin America experienced premium and fee growth across the region, primarily in Chile and Mexico. The increase in premiums and fees was partially offset by related changes in policyholder benefits. An increase in average invested assets, primarily in Chile and Mexico, generated higher net investment income. The increase in net investment income was partially offset by a corresponding increase in interest credited expenses on certain insurance liabilities. Business growth in the region drove an increase in commissions and other variable expenses, which was offset by higher DAC capitalization. The combined impact of the items affecting business growth, partially offset by higher DAC amortization, increased adjusted earnings by $25 million.
109
Market Factors.
Market factors, including interest rate levels and variability in equity market returns, continued to impact our results; however, certain impacts were mitigated by derivatives used to hedge these risks. Investment yields increased, driven by higher yields on fixed maturity securities and mortgage loans in Chile and Mexico, and higher earnings from a joint venture investment in Chile, partially offset by lower equity market returns on private equity funds. An increase in interest credited expenses on certain insurance liabilities also decreased adjusted earnings. The changes in market factors discussed above, as well as the net impact of inflation, resulted in a slight decrease in adjusted earnings.
Underwriting, Actuarial Assumption Review and Other Insurance Adjustments.
Favorable underwriting drove a $118 million increase in adjusted earnings. This increase includes a decline in COVID-19-related claims, primarily in Mexico and Brazil. The favorable change from our annual actuarial assumption reviews resulted in a net increase of $9 million in adjusted earnings. Refinements to certain insurance liabilities and other liabilities in both periods resulted in a $6 million increase in adjusted earnings.
Expenses and Taxes
. Adjusted earnings decreased $14 million due to higher employee-related costs and the region’s continued investment in technology. Tax-related adjustments in both periods resulted in a $10 million increase in adjusted earnings, primarily driven by a recurring tax item related to inflation in Chile.
Nine Months Ended September 30, 2022 Compared with the Nine Months Ended September 30, 2021
Unless otherwise stated, all amounts discussed below are net of income tax.
Foreign Currency.
Changes in foreign currency exchange rates decreased adjusted earnings by $32 million for the first nine months of 2022 compared to the prior period, mainly due to the weakening of foreign currencies against the U.S. dollar, primarily the Chilean peso. Unless otherwise stated, all amounts discussed below are net of foreign currency fluctuations. Foreign currency fluctuations can result in significant variances in the financial statement line items.
Business Growth
. Latin America experienced premium and fee growth across the region, primarily in Chile and Mexico. The increase in premiums and fees was partially offset by related changes in policyholder benefits. An increase in average invested assets, primarily in Chile and Mexico, generated higher net investment income. The increase in net investment income was partially offset by a corresponding increase in interest credited expenses on certain insurance liabilities. Business growth in the region drove an increase in commissions and other variable expenses, which was offset by higher DAC capitalization. The combined impact of the items affecting business growth, partially offset by higher DAC amortization, increased adjusted earnings by $46 million.
Market Factors
. Market factors, including interest rate levels and variability in equity market returns, continued to impact our results; however, certain impacts were mitigated by derivatives used to hedge these risks. Investment yields increased, driven by higher yields on fixed maturity securities and mortgage loans in Chile and Mexico, and higher earnings from a joint venture investment in Chile, partially offset by lower equity market returns on private equity funds. An increase in interest credited expenses on certain insurance liabilities also decreased adjusted earnings. The changes in market factors discussed above, as well as the net impact of inflation, resulted in a $38 million increase in adjusted earnings.
Underwriting, Actuarial Assumption Review and Other Insurance Adjustments.
Favorable underwriting drove a $340 million increase in adjusted earnings. This increase includes a decline in COVID-19-related claims, primarily in Mexico and Brazil, as well as a reduction to the IBNR reserve that was established in the prior year. The favorable change from our annual actuarial assumption reviews resulted in a net increase of $9 million in adjusted earnings. Refinements to certain insurance liabilities and other liabilities in both periods resulted in a $12 million increase in adjusted earnings.
Expenses and Taxes
. Adjusted earnings decreased $32 million due to higher employee-related costs and the region’s continued investment in technology, partially offset by the impact of continued expense discipline. Tax-related adjustments in both periods resulted in a $34 million increase in adjusted earnings, primarily driven by a recurring tax item related to inflation in Chile.
110
EMEA
Business Overview.
Adjusted premiums, fees and other revenues for the three months ended September 30, 2022 decreased $125 million, or 19%, compared to the prior period. Adjusted premiums, fees and other revenues, net of foreign currency fluctuations, decreased $38 million, or 7%, compared to the prior period primarily due to (i) a prior period favorable refinement to an unearned revenue reserve in Czech Republic and Slovakia, (ii) a current period unfavorable refinement to an unearned revenue reserve in the Gulf, and (iii) decreases in our corporate solutions and variable life businesses in the Gulf, as well as our pension business in Romania, partially offset by growth in our (i) accident & health business across the region, (ii) corporate solutions business in Egypt and (iii) credit life business in Turkey and Romania.
|
Three Months
Ended September 30, |
Nine Months
Ended September 30, |
||||||||||||||||||||||
| 2022 | 2021 | 2022 | 2021 | ||||||||||||||||||||
| (In millions) | |||||||||||||||||||||||
| Adjusted revenues | |||||||||||||||||||||||
| Premiums | $ | 475 | $ | 532 | $ | 1,476 | $ | 1,751 | |||||||||||||||
| Universal life and investment-type product policy fees | 62 | 128 | 236 | 302 | |||||||||||||||||||
| Net investment income | 40 | 46 | 119 | 171 | |||||||||||||||||||
| Other revenues | 8 | 10 | 25 | 39 | |||||||||||||||||||
| Total adjusted revenues | 585 | 716 | 1,856 | 2,263 | |||||||||||||||||||
| Adjusted expenses | |||||||||||||||||||||||
| Policyholder benefits and claims and policyholder dividends | 239 | 268 | 758 | 944 | |||||||||||||||||||
| Interest credited to policyholder account balances | 16 | 17 | 53 | 66 | |||||||||||||||||||
| Capitalization of DAC | (96) | (110) | (305) | (359) | |||||||||||||||||||
| Amortization of DAC and VOBA | 79 | 118 | 260 | 274 | |||||||||||||||||||
| Amortization of negative VOBA | (1) | (1) | (4) | (5) | |||||||||||||||||||
| Other expenses | 269 | 308 | 863 | 1,006 | |||||||||||||||||||
| Total adjusted expenses | 506 | 600 | 1,625 | 1,926 | |||||||||||||||||||
| Provision for income tax expense (benefit) | 19 | 22 | 55 | 78 | |||||||||||||||||||
| Adjusted earnings | $ | 60 | $ | 94 | $ | 176 | $ | 259 | |||||||||||||||
| Adjusted earnings on a constant currency basis | $ | 60 | $ | 75 | $ | 176 | $ | 212 | |||||||||||||||
| Adjusted premiums, fees and other revenues | $ | 545 | $ | 670 | $ | 1,737 | $ | 2,092 | |||||||||||||||
| Adjusted premiums, fees and other revenues on a constant currency basis | $ | 545 | $ | 583 | $ | 1,737 | $ | 1,880 | |||||||||||||||
Three Months Ended September 30, 2022 Compared with the Three Months Ended September 30, 2021
Unless otherwise stated, all amounts discussed below are net of income tax.
Foreign Currency.
Changes in foreign currency exchange rates decreased adjusted earnings by $19 million for the third quarter of 2022 as compared to the prior period, primarily driven by the strengthening of the U.S. dollar against the Turkish lira, euro and British pound. Unless otherwise stated, all amounts discussed below are net of foreign currency fluctuations. Foreign currency fluctuations can result in significant variances in the financial statement line items.
Business Growth.
Decreases in our (i) corporate solutions and variable life businesses in the Gulf, and (ii) pension business in Romania, partially offset by growth in our (i) accident & health business across the region, (ii) credit life business in Turkey, and (iii) corporate solutions business in Egypt, resulted in a $2 million decrease in adjusted earnings.
Market Factors.
Market factors, including interest rate levels and variability in equity market returns increased adjusted earnings by $4 million. This was primarily due to a decrease in DAC amortization in our variable life business as a result of equity market movements.
111
Underwriting, Actuarial Assumption Review and Other Insurance Adjustments.
Adjusted earnings decreased $8 million as a result of unfavorable underwriting experience in our (i) corporate solutions business in the U.K., (ii) ordinary life business in Portugal and France, and (iii) accident & health business across the region, partially offset by favorable underwriting experience in our (i) corporate solutions business in Egypt, (ii) ordinary life business in the Gulf, and (iii) credit life business in Turkey and Romania. The favorable change from our annual actuarial assumption reviews resulted in a net increase of $10 million in adjusted earnings. Refinements to certain insurance-related assets and liabilities in both periods resulted in a $20 million decrease in adjusted earnings.
Nine Months Ended September 30, 2022 Compared with the Nine Months Ended September 30, 2021
Unless otherwise stated, all amounts discussed below are net of income tax.
Foreign Currency.
Changes in foreign currency exchange rates decreased adjusted earnings by $47 million for the first nine months of 2022 as compared to the prior period, primarily driven by the strengthening of the U.S. dollar against the Turkish lira, euro, British pound and Egyptian pound. Unless otherwise stated, all amounts discussed below are net of foreign currency fluctuations. Foreign currency fluctuations can result in significant variances in the financial statement line items.
Business Growth.
Growth in our (i) accident & health business across the region, (ii) credit life business in Turkey, (iii) corporate solutions business in Egypt and (iv) ordinary life business in Europe, partially offset by decreases in our corporate solutions and variable life businesses in the Gulf, as well as our pension business in Romania, resulted in a $5 million increase in adjusted earnings.
Market Factors.
Market factors, including interest rate levels and variability in equity market returns decreased adjusted earnings by $7 million. This was primarily due to an increase in DAC amortization in our variable life business as a result of equity market movements.
Underwriting, Actuarial Assumption Review and Other Insurance Adjustments.
Adjusted earnings increased $21 million as a result of favorable underwriting experience, primarily due to the impact of the COVID-19 pandemic, which resulted in lower utilization in the first nine months of 2022 and higher claims in the prior period. Favorable underwriting experience in our (i) corporate solutions business in Egypt and the Gulf, (ii) variable life business in Lebanon and Czech Republic, and (iii) credit life business in Turkey and Romania were partially offset by unfavorable underwriting experience in our (i) ordinary life business in France, (ii) corporate solutions business in the U.K., and (iii) accident & health business across the region. The favorable change from our annual actuarial assumption reviews resulted in a net increase of $10 million in adjusted earnings. Refinements to certain insurance-related assets and liabilities in both periods resulted in a $41 million decrease in adjusted earnings.
Expenses
. Higher expenses resulted in a $13 million decrease in adjusted earnings mainly due to various operating expenses across the region.
Other.
In addition to the items discussed above, adjusted earnings decreased by $11 million due to the disposition of MetLife Poland and Greece.
112
MetLife Holdings
Business Overview.
Our MetLife Holdings segment consists of operations relating to products and businesses, previously included in our former retail business, that we no longer actively market in the United States. We anticipate an average decline in adjusted premiums, fees and other revenues of approximately 6% to 8% per year from expected business run-off. A significant portion of our adjusted earnings is driven by separate account balances. Most directly, these balances determine asset-based fee income but they also impact DAC amortization and asset-based commissions. Separate account balances are driven by movements in the market, surrenders, deposits, withdrawals, benefit payments, transfers and policy charges. Although we have discontinued selling our long-term care product, we continue to collect premiums and administer the existing block of business, which contributed to asset growth in the segment, and we expect the related reserves to grow as this block matures.
|
Three Months
Ended September 30, |
Nine Months
Ended September 30, |
||||||||||||||||||||||
| 2022 | 2021 | 2022 | 2021 | ||||||||||||||||||||
| (In millions) | |||||||||||||||||||||||
| Adjusted revenues | |||||||||||||||||||||||
| Premiums | $ | 745 | $ | 805 | $ | 2,281 | $ | 2,471 | |||||||||||||||
| Universal life and investment-type product policy fees | 232 | 279 | 840 | 826 | |||||||||||||||||||
| Net investment income | 1,118 | 1,771 | 3,807 | 4,960 | |||||||||||||||||||
| Other revenues | 39 | 57 | 106 | 188 | |||||||||||||||||||
| Total adjusted revenues | 2,134 | 2,912 | 7,034 | 8,445 | |||||||||||||||||||
| Adjusted expenses | |||||||||||||||||||||||
| Policyholder benefits and claims and policyholder dividends | 1,659 | 1,611 | 4,610 | 4,683 | |||||||||||||||||||
| Interest credited to policyholder account balances | 202 | 212 | 607 | 632 | |||||||||||||||||||
| Capitalization of DAC | (6) | (8) | (21) | (25) | |||||||||||||||||||
| Amortization of DAC and VOBA | (20) | 80 | 130 | 190 | |||||||||||||||||||
| Interest expense on debt | 2 | 1 | 5 | 4 | |||||||||||||||||||
| Other expenses | 228 | 255 | 706 | 752 | |||||||||||||||||||
| Total adjusted expenses | 2,065 | 2,151 | 6,037 | 6,236 | |||||||||||||||||||
| Provision for income tax expense (benefit) | 10 | 155 | 197 | 449 | |||||||||||||||||||
| Adjusted earnings | $ | 59 | $ | 606 | $ | 800 | $ | 1,760 | |||||||||||||||
| Adjusted premiums, fees and other revenues | $ | 1,016 | $ | 1,141 | $ | 3,227 | $ | 3,485 | |||||||||||||||
Three Months Ended September 30, 2022 Compared with the Three Months Ended September 30, 2021
Unless otherwise stated, all amounts discussed below are net of income tax.
Business Growth
. A decrease in average invested assets resulted in lower net investment income, decreasing adjusted earnings. In our deferred annuity business, negative net flows resulted in lower asset-based fee income. In addition, premiums declined due to business run-off and the impact of dividend scale reductions in both periods. The combined impact of the items affecting our business growth resulted in a $78 million decrease in adjusted earnings.
Market Factors
. Market factors, including interest rate levels, variability in equity market returns, and foreign currency fluctuations, continued to impact our results; however, certain impacts were mitigated by derivatives used to hedge these risks. Investment yields decreased, driven by the unfavorable impact of lower equity market returns on our private equity and hedge funds, and lower prepayment fees. In addition, there were lower returns on our real estate investments, primarily real estate funds, and lower yields on mortgage loans. The changes in market factors discussed above resulted in a $495 million decrease in adjusted earnings.
113
Underwriting, Actuarial Assumption Review and Other Insurance Adjustments
. Favorable underwriting, mainly in our life business resulted in a $32 million increase in adjusted earnings. The favorable change from our annual actuarial assumption reviews resulted in a net increase of $52 million in adjusted earnings. Refinements to certain insurance-related liabilities in the current period resulted in a $90 million decrease in adjusted earnings, which include the unfavorable impact from model refinements. Dividend scale reductions, as well as run-off in the Metropolitan Life Insurance Company’s (“MLIC”) closed block, contributed to lower dividend expense, net of DAC amortization, and resulted in a $16 million increase in adjusted earnings.
Expenses
. Adjusted earnings increased by $16 million mainly due to lower corporate-related expenses.
Nine Months Ended September 30, 2022 Compared with the Nine Months Ended September 30, 2021
Unless otherwise stated, all amounts discussed below are net of income tax.
Business Growth
. In our deferred annuity business, negative net flows resulted in lower asset-based fee income. In addition, premiums declined due to business run-off and the impact of dividend scale reductions in both periods. The combined impact of the items affecting our business growth, partially offset by lower DAC amortization, resulted in a $47 million decrease in adjusted earnings.
Market Factors
. Market factors, including interest rate levels, variability in equity market returns, and foreign currency fluctuations, continued to impact our results; however, certain impacts were mitigated by derivatives used to hedge these risks. Investment yields decreased driven by the unfavorable impact of lower equity market returns on our private equity and hedge funds, lower prepayment fees and lower yields on our fixed income securities and mortgage loans. These declines were partially offset by the impact of higher real estate market returns on our real estate investments. The changes in market factors discussed above resulted in a $988 million decrease in adjusted earnings.
Underwriting, Actuarial Assumption Review and Other Insurance Adjustments.
Less favorable underwriting, mainly in our long-term care business, reflecting a smaller impact from the COVID-19 pandemic in the current period, partially offset by favorable underwriting in our life business, resulted in a $46 million decrease in adjusted earnings. The favorable change from our annual actuarial assumption reviews resulted in a net increase of $52 million in adjusted earnings. Refinements to certain insurance-related liabilities, which include the unfavorable impact from model refinements, partially offset by a reinsurance settlement, all in the current period, resulted in a $13 million decrease in adjusted earnings. Dividend scale reductions, as well as run-off in the MLIC closed block, contributed to lower dividend expense, net of DAC amortization, and resulted in a $58 million increase in adjusted earnings.
Expenses
. Adjusted earnings increased by $27 million mainly due to lower corporate-related expenses.
114
Corporate & Other
|
Three Months
Ended September 30, |
Nine Months
Ended September 30, |
||||||||||||||||||||||
| 2022 | 2021 | 2022 | 2021 | ||||||||||||||||||||
| (In millions) | |||||||||||||||||||||||
| Adjusted revenues | |||||||||||||||||||||||
| Premiums | $ | (7) | $ | 16 | $ | (17) | $ | 54 | |||||||||||||||
| Universal life and investment-type product policy fees | (1) | — | 1 | 1 | |||||||||||||||||||
| Net investment income | 63 | 93 | 172 | 153 | |||||||||||||||||||
| Other revenues | 96 | 108 | 295 | 303 | |||||||||||||||||||
| Total adjusted revenues | 151 | 217 | 451 | 511 | |||||||||||||||||||
| Adjusted expenses | |||||||||||||||||||||||
| Policyholder benefits and claims and policyholder dividends | (3) | 9 | (12) | 36 | |||||||||||||||||||
| Capitalization of DAC | (2) | (3) | (7) | (9) | |||||||||||||||||||
| Amortization of DAC and VOBA | 3 | 2 | 7 | 7 | |||||||||||||||||||
| Interest expense on debt | 231 | 236 | 669 | 683 | |||||||||||||||||||
| Other expenses | 186 | 137 | 506 | 278 | |||||||||||||||||||
| Total adjusted expenses | 415 | 381 | 1,163 | 995 | |||||||||||||||||||
| Provision for income tax expense (benefit) | (63) | (96) | (243) | (288) | |||||||||||||||||||
| Adjusted earnings | (201) | (68) | (469) | (196) | |||||||||||||||||||
| Less: Preferred stock dividends | 64 | 63 | 156 | 166 | |||||||||||||||||||
| Adjusted earnings available to common shareholders | $ | (265) | $ | (131) | $ | (625) | $ | (362) | |||||||||||||||
| Adjusted premiums, fees and other revenues | $ | 88 | $ | 124 | $ | 279 | $ | 358 | |||||||||||||||
The table below presents adjusted earnings available to common shareholders by source:
|
Three Months
Ended September 30, |
Nine Months
Ended September 30, |
||||||||||||||||||||||
| 2022 | 2021 | 2022 | 2021 | ||||||||||||||||||||
| (In millions) | |||||||||||||||||||||||
| Business activities | $ | 36 | $ | 41 | $ | 106 | $ | 98 | |||||||||||||||
| Net investment income | 60 | 95 | 170 | 159 | |||||||||||||||||||
| Interest expense on debt | (240) | (247) | (693) | (716) | |||||||||||||||||||
| Corporate initiatives and projects | (15) | (25) | (48) | (74) | |||||||||||||||||||
| Other | (105) | (28) | (247) | 49 | |||||||||||||||||||
|
Provision for income tax (expense) benefit and other tax-related items
|
63 | 96 | 243 | 288 | |||||||||||||||||||
| Preferred stock dividends | (64) | (63) | (156) | (166) | |||||||||||||||||||
|
Adjusted earnings available to common shareholders
|
$ | (265) | $ | (131) | $ | (625) | $ | (362) | |||||||||||||||
Three Months Ended September 30, 2022 Compared with the Three Months Ended September 30, 2021
Unless otherwise stated, all amounts discussed below are net of income tax.
Business Activities
. Adjusted earnings from business activities decreased $4 million. This was primarily related to lower results from certain of our businesses.
Net Investment Income.
Net investment income decreased $28 million, primarily due to lower returns on our equity market sensitive investments, including private equity funds, and lower yields on our mortgage loans. These decreases were partially offset by higher income on our real estate investments.
115
Interest Expense on Debt.
Interest expense on debt decreased by $6 million, primarily due to a senior note redemption in July 2021, partially offset by a senior note issuance in July 2022.
Corporate Initiatives and Projects & Other.
Adjusted earnings decreased $53 million, primarily as a result of increases in certain corporate-related expenses and employee-related costs.
Provision for Income Tax (Expense) Benefit and Other Tax-Related Items.
An unfavorable change in Corporate & Other’s taxes was primarily due to lower utilization of tax preferenced items, which include non-taxable investment income, tax credits and foreign earnings taxed at different rates than the U.S. statutory rate.
Nine Months Ended September 30, 2022 Compared with the Nine Months Ended September 30, 2021
Unless otherwise stated, all amounts discussed below are net of income tax.
Business Activities
. Adjusted earnings from business activities increased $6 million. This was primarily related to improved results from certain of our businesses.
Net Investment Income.
Net investment income increased $9 million, primarily due to a higher average invested asset base, as well as increased income on real estate investments. These increases were partially offset by lower returns on our equity market sensitive investments, including private equity funds and FVO Securities, as well as lower yields on our mortgage loans.
Interest Expense on Debt.
Interest expense on debt decreased by $18 million, primarily due to a senior note redemption in July 2021, partially offset by a senior note issuance in July 2022.
Corporate Initiatives and Projects & Other
. Adjusted earnings decreased $214 million, primarily as a result of an increase in corporate-related expenses, the release of a legal reserve in the prior period and higher interest expense on tax positions due to audit settlements in both periods.
Provision for Income Tax (Expense) Benefit and Other Tax-Related Items.
An unfavorable change in Corporate & Other’s taxes was primarily due to lower utilization of tax preferenced items, which include non-taxable investment income, tax credits and foreign earnings taxed at different rates than the U.S. statutory rate, partially offset by lower taxes on stock compensation.
Preferred Stock Dividends.
Adjusted earnings available to common shareholders increased $10 million primarily as a result of the redemption and cancellation of the Series C preferred stock, in June 2021.
116
Investments
Overview
We manage our investment portfolio using disciplined asset/liability management (“ALM”) principles, focusing on cash flow and duration to support our current and future liabilities. Our intent is to match the timing and amount of liability cash outflows with invested assets that have cash inflows of comparable timing and amount, while optimizing risk-adjusted investment income and risk-adjusted total return. Our investment portfolio is heavily weighted toward fixed income investments, with the vast majority of our portfolio invested in fixed maturity securities available-for-sale (“AFS”) and mortgage loans. These securities and loans have varying maturities and other characteristics which cause them to be generally well suited for matching the cash flow and duration of insurance liabilities.
Current Environment
As a global insurance company, we continue to be impacted by the changing global financial and economic environment, the fiscal and monetary policy of governments and central banks around the world and other governmental measures. The COVID-19 pandemic continues to impact the global economy and financial markets and has caused volatility in the global equity, credit and real estate markets. See “— Industry Trends — Financial and Economic Environment.” Uncertainty created by the COVID-19 pandemic may persist for some time and may continue to impact pricing levels of risk-bearing investments, as well as our business operations, investment portfolio and derivatives. Rising market interest rates have impacted our investment portfolio and derivatives. See “— Industry Trends,” as well as “— Results of Operations — Consolidated Results,” and “— Results of Operations — Consolidated Results - Adjusted Earnings” for impacts on our derivatives and analysis of the period over period changes in investment portfolio results. See also “Investments — Fixed Maturity Securities Available-for-Sale — Evaluation of Fixed Maturity Securities AFS in an Unrealized Loss Position” in Note 6 of the Notes to the Interim Condensed Consolidated Financial Statements for impacts on the net unrealized gain (loss) on our fixed maturity securities AFS.
Selected Country and Sector Investments
Selected Country: We have a market presence in numerous countries and, therefore, our investment portfolio, which supports our insurance operations and related policyholder liabilities, as well as our global portfolio diversification objectives, is exposed to risks posed by local political and economic conditions. The countries included in the following table have been the most affected by these risks. The table below presents a summary of selected country fixed maturity securities AFS, at estimated fair value, on a “country of risk basis” (e.g. where the issuer primarily conducts business).
| Selected Country Fixed Maturity Securities AFS at September 30, 2022 | |||||||||||||||||||||||
| Country | Sovereign (1) |
Financial
Services |
Non-Financial
Services |
Total (2) | |||||||||||||||||||
| (Dollars in millions) | |||||||||||||||||||||||
| Italy | 15 | 52 | 511 | 578 | |||||||||||||||||||
| Colombia | 312 | 54 | 133 | 499 | |||||||||||||||||||
| Peru | 110 | 20 | 197 | 327 | |||||||||||||||||||
| Ukraine (3) | 54 | — | 2 | 56 | |||||||||||||||||||
| Russian Federation (3) | 43 | — | 3 | 46 | |||||||||||||||||||
| Turkey | 34 | — | 9 | 43 | |||||||||||||||||||
| Total | $ | 568 | $ | 126 | $ | 855 | $ | 1,549 | |||||||||||||||
| Investment grade % | 31.4 | % | 55.9 | % | 64.8 | % | 51.8 | % | |||||||||||||||
__________________
(1)
Sovereign includes government and agency.
(2)
The par value, amortized cost net of ACL and estimated fair value, net of purchased and written credit default swaps, of these securities wer
e $1.9 billion, $1.8 billion
and
$1.5 billion, respectively, at September 30, 2022. The notional value and estimated fair value of the net purchased and written credit default swaps were $76 million and $11 million, respectively, at September 30, 2022.
117
(3)
As of September 30, 2022, the amortized cost, ACL and amortized cost, net of ACL of our Russian Federation sovereign securities were $120 million
, $79 million and $41 million
, respectively; and the amortized cost, ACL and amortized cost, net of ACL of our Russian Federation corporate securities were
$7 million, $4 million and $3 million
, respectively. As of September 30, 2022, the amortized cost, ACL and amortized cost, net of ACL of our Ukraine sovereign securities were
$91 million, $37 million and $54 million, r
espectively; and the amortized cost, ACL and amortized cost, net of ACL of our Ukraine corporate securities were
$3 million, $1 million and $1 million,
respectively.
Selected Sector: See “Management’s Discussion and Analysis of Financial Condition and Results of Operations — Investments — Current Environment —Selected Country and Sector Investments” included in the 2021 Annual Report for information on our Selected Sector investments as of December 31, 2021.
We manage direct and indirect investment exposure in the selected countries and sectors through fundamental analysis and we continually monitor and adjust our level of investment exposure.
Investment Portfolio Results
The reconciliation of net investment income under GAAP to adjusted net investment income is presented below.
| For the Three Months Ended September 30, | For the Nine Months Ended September 30, | ||||||||||||||||||||||
| 2022 | 2021 | 2022 | 2021 | ||||||||||||||||||||
| (In millions) | |||||||||||||||||||||||
| Net investment income — GAAP | $ | 3,585 | $ | 5,568 | $ | 11,452 | $ | 16,162 | |||||||||||||||
|
Investment hedge adjustments
|
252 | 228 | 699 | 660 | |||||||||||||||||||
| Unit-linked investment income | 321 | (114) | 1,507 | (699) | |||||||||||||||||||
|
Other
|
5 | (14) | 1 | (44) | |||||||||||||||||||
| Adjusted net investment income (1) | $ | 4,163 | $ | 5,668 | $ | 13,659 | $ | 16,079 | |||||||||||||||
__________________
(1)
See “Financial Measures and Segment Accounting Policies” in Note 2 of the Notes to the Interim Condensed Consolidated Financial Statements for a discussion of the adjustments made to net investment income under GAAP in calculating adjusted net investment income.
The following yield table presentation is consistent with how we measure our investment performance for management purposes, and we believe it enhances understanding of our investment portfolio results.
| For the Three Months Ended September 30, | For the Nine Months Ended September 30, | ||||||||||||||||||||||||||||||||||||||||||||||
| 2022 | 2021 | 2022 | 2021 | ||||||||||||||||||||||||||||||||||||||||||||
| Asset Class | Yield % (1) | Amount | Yield % (1) | Amount | Yield % (1) | Amount | Yield % (1) | Amount | |||||||||||||||||||||||||||||||||||||||
| (Dollars in millions) | |||||||||||||||||||||||||||||||||||||||||||||||
| Fixed maturity securities AFS (2), (3) | 3.81 | % | $ | 2,773 | 3.71 | % | $ | 2,761 | 3.66 | % | $ | 8,120 | 3.73 | % | $ | 8,330 | |||||||||||||||||||||||||||||||
| Mortgage loans (3) | 4.37 | 898 | 4.12 | 837 | 4.20 | 2,553 | 4.18 | $ | 2,583 | ||||||||||||||||||||||||||||||||||||||
| Real estate and real estate joint ventures | 5.75 | 179 | 6.00 | 181 | 7.51 | 697 | 4.28 | $ | 385 | ||||||||||||||||||||||||||||||||||||||
| Policy loans | 5.18 | 114 | 5.09 | 118 | 5.13 | 344 | 5.14 | $ | 359 | ||||||||||||||||||||||||||||||||||||||
| Equity securities | 6.40 | 14 | 4.85 | 8 | 4.14 | 26 | 4.69 | $ | 28 | ||||||||||||||||||||||||||||||||||||||
| Other limited partnership interests | (5.35) | (194) | 48.43 | 1,542 | 8.26 | 903 | 45.04 | $ | 3,877 | ||||||||||||||||||||||||||||||||||||||
|
Cash and short-term investments
|
2.54 | 78 | 0.70 | 20 | 1.74 | 151 | 0.76 | $ | 62 | ||||||||||||||||||||||||||||||||||||||
| Other invested assets | — | 426 | — | 342 | — | 1,274 | — | $ | 906 | ||||||||||||||||||||||||||||||||||||||
|
Investment income
|
3.98 | % | 4,288 | 5.36 | % | 5,809 | 4.33 | % | 14,068 | 5.09 | % | $ | 16,530 | ||||||||||||||||||||||||||||||||||
| Investment fees and expenses | (0.12) | (125) | (0.12) | (125) | (0.12) | (398) | (0.12) | $ | (399) | ||||||||||||||||||||||||||||||||||||||
| Net investment income including divested businesses (4) | 3.86 | % | 4,163 | 5.24 | % | 5,684 | 4.21 | % | 13,670 | 4.97 | % | $ | 16,131 | ||||||||||||||||||||||||||||||||||
| Less: net investment income from divested businesses (4) | — | 16 | 11 | $ | 52 | ||||||||||||||||||||||||||||||||||||||||||
| Adjusted net investment income | $ | 4,163 | $ | 5,668 | $ | 13,659 | $ | 16,079 | |||||||||||||||||||||||||||||||||||||||
__________________
118
(1)
We calculate yields using adjusted net investment income as a percent of average quarterly asset carrying values. Adjusted net investment income excludes realized gains (losses) from sales and disposals, and includes the impact of changes in foreign currency exchange rates. Average quarterly asset carrying values exclude unrealized gains (losses), collateral received in connection with our securities lending program, annuities funding structured settlement claims, freestanding derivative assets, collateral received from derivative counterparties and contractholder-directed equity securities. In addition, average quarterly asset carrying values include invested assets reclassified to held-for-sale, while ending carrying values exclude invested assets reclassified to held-for-sale. A yield is not presented for other invested assets, as it is not considered a meaningful measure of performance for this asset class.
(2)
Investment income (loss) from fixed maturity securities includes amounts from FVO Securities of ($43) million and ($197) million for the three months and nine months ended September 30, 2022, respectively, and $6 million and $92 million for the three months and nine months ended September 30, 2021, respectively.
(3)
Investment income from fixed maturity securities AFS and mortgage loans includes prepayment fees.
(4)
See “Financial Measures and Segment Accounting Policies” in Note 2 of the Notes to the Interim Condensed Consolidated Financial Statements for discussion of divested businesses.
See “— Results of Operations — Consolidated Results - Adjusted Earnings” for an analysis of the period over period changes in investment portfolio results.
Fixed Maturity Securities AFS and Equity Securities
The following table presents fixed maturity securities AFS and equity securities by type (public or private) and information about perpetual and redeemable securities held at:
| September 30, 2022 | December 31, 2021 | |||||||||||||||||||||||||
| Securities by Type | Estimated Fair Value | % of Total | Estimated Fair Value | % of Total | ||||||||||||||||||||||
| (Dollars in millions) | ||||||||||||||||||||||||||
|
Fixed maturity securities AFS
|
||||||||||||||||||||||||||
| Publicly-traded | $ | 208,818 | 77.1 | % | $ | 267,040 | 78.5 | % | ||||||||||||||||||
| Privately-placed | 61,947 | 22.9 | 73,234 | 21.5 | ||||||||||||||||||||||
| Total fixed maturity securities AFS | $ | 270,765 | 100.0 | % | $ | 340,274 | 100.0 | % | ||||||||||||||||||
| Percentage of cash and invested assets | 60.4 | % | 66.1 | % | ||||||||||||||||||||||
|
Equity securities
|
||||||||||||||||||||||||||
| Publicly-traded | $ | 761 | 78.2 | % | $ | 1,118 | 88.1 | % | ||||||||||||||||||
| Privately-held | 212 | 21.8 | 151 | 11.9 | ||||||||||||||||||||||
| Total equity securities | $ | 973 | 100.0 | % | $ | 1,269 | 100.0 | % | ||||||||||||||||||
| Percentage of cash and invested assets | 0.2 | % | 0.2 | % | ||||||||||||||||||||||
| Perpetual and redeemable securities | ||||||||||||||||||||||||||
|
Perpetual securities included within fixed maturity securities AFS and equity securities
|
$ | 282 | $ | 321 | ||||||||||||||||||||||
|
Redeemable preferred stock with a stated maturity included within fixed maturity securities AFS
|
$ | 834 | $ | 864 | ||||||||||||||||||||||
See Note 6 of the Notes to the Interim Condensed Consolidated Financial Statements for information about fixed maturity securities AFS by sector, contractual maturities, continuous gross unrealized losses and equity securities by security type and the related cost, net unrealized gains (losses) and estimated fair value of these securities; as well as realized gains (losses) on sales and disposals and unrealized net gains (losses) recognized in earnings.
Included within fixed maturity securities AFS are structured securities, including residential mortgage-backed securities (“RMBS”), asset-backed securities and collateralized loan obligations (“ABS & CLO”), previously disclosed as ABS in the 2021 Annual Report, and commercial mortgage-backed securities (“CMBS”) (collectively, “Structured Products”). See “— Structured Products” for further information.
119
Perpetual securities are included within fixed maturity securities AFS and equity securities. Upon acquisition, we classify perpetual securities that have attributes of both debt and equity as fixed maturity securities AFS if the securities have an interest rate step-up feature which, when combined with other qualitative factors, indicates that the securities have more debt-like characteristics; while those with more equity-like characteristics are classified as equity securities. Many of such securities, commonly referred to as “perpetual hybrid securities,” have been issued by non-U.S. financial institutions that are accorded the highest two capital treatment categories by their respective regulatory bodies (i.e. core capital, or “Tier 1 capital” and perpetual deferrable securities, or “Upper Tier 2 capital”).
Redeemable preferred stock with a stated maturity is included within fixed maturity securities AFS. These securities, which are commonly referred to as “capital securities,” primarily have cumulative interest deferral features and are primarily issued by U.S. financial institutions.
See “Management’s Discussion and Analysis of Financial Condition and Results of Operations — Investments — Fixed Maturity Securities AFS and Equity Securities — Valuation of Securities” included in the 2021 Annual Report for further information on the processes used to value securities and the related controls.
Fair Value of Fixed Maturity Securities AFS and Equity Securities
Fixed maturity securities AFS and equity securities measured at estimated fair value on a recurring basis and their corresponding fair value pricing sources were as follows:
| September 30, 2022 | ||||||||||||||||||||||||||||||||
| Level |
Fixed Maturity
Securities AFS |
Equity
Securities |
||||||||||||||||||||||||||||||
| (Dollars in millions) | ||||||||||||||||||||||||||||||||
| Level 1 | ||||||||||||||||||||||||||||||||
| Quoted prices in active markets for identical assets | $ | 15,587 | 5.8 | % | $ | 592 | 60.8 | % | ||||||||||||||||||||||||
| Level 2 | ||||||||||||||||||||||||||||||||
| Independent pricing sources | 229,008 | 84.6 | 167 | 17.2 | ||||||||||||||||||||||||||||
| Internal matrix pricing or discounted cash flow techniques | 563 | 0.2 | 45 | 4.6 | ||||||||||||||||||||||||||||
| Significant other observable inputs | 229,571 | 84.8 | 212 | 21.8 | ||||||||||||||||||||||||||||
| Level 3 | ||||||||||||||||||||||||||||||||
| Independent pricing sources | 19,803 | 7.3 | 19 | 2.0 | ||||||||||||||||||||||||||||
| Internal matrix pricing or discounted cash flow techniques | 5,483 | 2.0 | 147 | 15.1 | ||||||||||||||||||||||||||||
| Independent broker quotations | 321 | 0.1 | 3 | 0.3 | ||||||||||||||||||||||||||||
| Significant unobservable inputs | 25,607 | 9.4 | 169 | 17.4 | ||||||||||||||||||||||||||||
| Total estimated fair value | $ | 270,765 | 100.0 | % | $ | 973 | 100.0 | % | ||||||||||||||||||||||||
See Note 8 of the Notes to the Interim Condensed Consolidated Financial Statements for the fixed maturity securities AFS and equity securities fair value hierarchy; a rollforward of the fair value measurements for securities measured at estimated fair value on a recurring basis using significant unobservable (Level 3) inputs; transfers into and/or out of Level 3; and further information about the valuation approaches and inputs by level by major classes of invested assets that affect the amounts reported above.
The majority of the Level 3 fixed maturity securities AFS and equity securities were concentrated in three sectors at September 30, 2022: U.S. corporate securities, foreign corporate securities and RMBS. During the three months ended September 30, 2022, Level 3 fixed maturity securities AFS decreased by $2.4 billion, or 9%. The decrease was driven by a decrease in estimated fair value recognized in other comprehensive income (loss) and by transfers out of Level 3 in excess of transfers into Level 3, partially offset by purchases in excess of sales. During the nine months ended September 30, 2022, Level 3 fixed maturity securities AFS decreased by $5.8 billion, or 18%. The decrease was driven by a decrease in estimated fair value recognized in other comprehensive income (loss) and by transfers out of Level 3 in excess of transfers into Level 3, partially offset by purchases in excess of sales.
See “Management’s Discussion and Analysis of Financial Condition and Results of Operations — Investments — Fixed Maturity Securities AFS and Equity Securities — Valuation of Securities” included in the 2021 Annual Report for further information on the estimates and assumptions that affect the amounts reported above.
120
Fixed Maturity Securities AFS
See Notes 1 and 6 of the Notes to the Interim Condensed Consolidated Financial Statements for information about fixed maturity securities AFS by sector, contractual maturities and continuous gross unrealized losses.
Fixed Maturity Securities AFS Credit Quality — Ratings
See “Management’s Discussion and Analysis of Financial Condition and Results of Operations — Investments — Fixed Maturity Securities AFS and Equity Securities — Fixed Maturity Securities AFS Credit Quality — Ratings” included in the 2021 Annual Report for a discussion of the credit quality ratings assigned by Nationally Recognized Statistical Rating Organizations (“NRSRO”), credit quality designations and designation categories assigned by the Securities Valuation Office of the NAIC for fixed maturity securities AFS and modeling methodologies adopted by the NAIC for non-agency RMBS and CMBS that estimate security level expected losses under a variety of economic scenarios.
NRSRO ratings and NAIC designations are as of the dates shown below. Over time, credit ratings and designations can migrate, up or down, through the NRSRO’s and NAIC’s continuous monitoring process. NRSRO ratings are based on availability of applicable ratings. If no NRSRO rating is available, then an internally developed rating is used. If no NAIC designation is available, then, as permitted by the NAIC, an internally developed designation is used. NAIC designations are generally similar to the credit quality ratings of the NRSRO, except for (i) non-agency RMBS and CMBS and (ii) securities rated Ca or C by NRSROs, included within Caa and lower, that are designated NAIC 6; accordingly, NAIC designations may not correspond to NRSRO ratings.
The following table presents total fixed maturity securities AFS by NRSRO rating, except for non-agency RMBS and CMBS, which are presented using NAIC designations for modeled securities. In addition, in the following table, the applicable NAIC designation from the NAIC published comparison of NRSRO ratings to NAIC designations is provided.
| September 30, 2022 | December 31, 2021 | |||||||||||||||||||||||||||||||||||||||||||||||||||||||||||||
| NRSRO Rating |
NAIC
Designation |
Amortized
Cost net of ACL |
Unrealized
Gains (Losses) |
Estimated
Fair
Value
|
% of
Total
|
Amortized
Cost net of ACL |
Unrealized
Gains (Losses) (1) |
Estimated
Fair
Value
|
% of
Total
|
|||||||||||||||||||||||||||||||||||||||||||||||||||||
| (Dollars in millions) | ||||||||||||||||||||||||||||||||||||||||||||||||||||||||||||||
| Aaa/Aa/A | 1 | $ | 205,583 | $ | (19,803) | $ | 185,780 | 68.6 | % | $ | 217,886 | $ | 21,508 | $ | 239,394 | 70.4 | % | |||||||||||||||||||||||||||||||||||||||||||||
| Baa | 2 | 81,544 | (10,268) | 71,276 | 26.3 | 77,739 | 7,470 | 85,209 | 25.0 | |||||||||||||||||||||||||||||||||||||||||||||||||||||
| Subtotal investment grade | 287,127 | (30,071) | 257,056 | 94.9 | 295,625 | 28,978 | 324,603 | 95.4 | ||||||||||||||||||||||||||||||||||||||||||||||||||||||
| Ba | 3 | 11,725 | (1,073) | 10,652 | 4.0 | 11,439 | 534 | 11,973 | 3.5 | |||||||||||||||||||||||||||||||||||||||||||||||||||||
| B | 4 | 2,909 | (291) | 2,618 | 1.0 | 3,152 | (2) | 3,150 | 0.9 | |||||||||||||||||||||||||||||||||||||||||||||||||||||
| Caa and lower | 5 | 336 | (30) | 306 | 0.1 | 563 | (37) | 526 | 0.2 | |||||||||||||||||||||||||||||||||||||||||||||||||||||
| In or near default | 6 | 162 | (29) | 133 | — | 14 | 8 | 22 | — | |||||||||||||||||||||||||||||||||||||||||||||||||||||
|
Subtotal below investment grade
|
15,132 | (1,423) | 13,709 | 5.1 | 15,168 | 503 | 15,671 | 4.6 | ||||||||||||||||||||||||||||||||||||||||||||||||||||||
|
Total fixed maturity securities AFS
|
$ | 302,259 | $ | (31,494) | $ | 270,765 | 100.0 | % | $ | 310,793 | $ | 29,481 | $ | 340,274 | 100.0 | % | ||||||||||||||||||||||||||||||||||||||||||||||
__________________
(1) Excludes gross unrealized gains (losses) related to assets held-for-sale. See Note 3 of the Notes to the Interim Condensed Consolidated Financial Statements for information on the Company’s business dispositions.
121
The following tables present total fixed maturity securities AFS, at estimated fair value, by sector and by NRSRO rating, except for non-agency RMBS and CMBS, which are presented using NAIC designations for modeled securities. In addition, in the following table, the applicable NAIC designation from the NAIC published comparison of the NRSRO ratings to NAIC designations is provided.
| Fixed Maturity Securities AFS — by Sector & Credit Quality Rating | |||||||||||||||||||||||||||||||||||||||||
| NRSRO Rating | Aaa/Aa/A | Baa | Ba | B | Caa and Lower |
In or Near
Default |
Total
Estimated Fair Value |
||||||||||||||||||||||||||||||||||
| NAIC Designation | 1 | 2 | 3 | 4 | 5 | 6 | |||||||||||||||||||||||||||||||||||
| (Dollars in millions) | |||||||||||||||||||||||||||||||||||||||||
| September 30, 2022 | |||||||||||||||||||||||||||||||||||||||||
| U.S. corporate | $ | 39,166 | $ | 33,404 | $ | 4,399 | $ | 1,649 | $ | 146 | $ | 60 | $ | 78,824 | |||||||||||||||||||||||||||
| Foreign corporate | 17,598 | 28,767 | 3,068 | 453 | 40 | 1 | 49,927 | ||||||||||||||||||||||||||||||||||
| Foreign government | 36,234 | 4,872 | 2,545 | 291 | 63 | 45 | 44,050 | ||||||||||||||||||||||||||||||||||
| U.S. government and agency | 31,108 | 454 | — | — | — | 31,562 | |||||||||||||||||||||||||||||||||||
| RMBS | 26,341 | 663 | 71 | 51 | 5 | 14 | 27,145 | ||||||||||||||||||||||||||||||||||
| ABS & CLO | 13,880 | 2,408 | 366 | 73 | 26 | 13 | 16,766 | ||||||||||||||||||||||||||||||||||
| Municipals | 11,798 | 192 | 24 | — | — | — | 12,014 | ||||||||||||||||||||||||||||||||||
| CMBS | 9,655 | 516 | 179 | 101 | 26 | — | 10,477 | ||||||||||||||||||||||||||||||||||
| Total fixed maturity securities AFS | $ | 185,780 | $ | 71,276 | $ | 10,652 | $ | 2,618 | $ | 306 | $ | 133 | $ | 270,765 | |||||||||||||||||||||||||||
| Percentage of total | 68.6 | % | 26.3 | % | 4.0 | % | 1.0 | % | 0.1 | % | — | % | 100.0 | % | |||||||||||||||||||||||||||
| December 31, 2021 | |||||||||||||||||||||||||||||||||||||||||
| U.S. corporate | $ | 47,377 | $ | 39,094 | $ | 4,523 | $ | 1,796 | $ | 244 | $ | — | $ | 93,034 | |||||||||||||||||||||||||||
| Foreign corporate | 23,228 | 35,893 | 3,731 | 577 | 210 | 1 | 63,640 | ||||||||||||||||||||||||||||||||||
| Foreign government | 52,316 | 5,739 | 3,032 | 506 | 14 | 2 | 61,609 | ||||||||||||||||||||||||||||||||||
| U.S. government and agency | 46,065 | 534 | — | — | — | — | 46,599 | ||||||||||||||||||||||||||||||||||
| RMBS | 29,529 | 634 | 150 | 67 | 5 | 19 | 30,404 | ||||||||||||||||||||||||||||||||||
| ABS & CLO | 15,920 | 2,221 | 316 | 85 | 27 | — | 18,569 | ||||||||||||||||||||||||||||||||||
| Municipals | 13,737 | 457 | 18 | — | — | — | 14,212 | ||||||||||||||||||||||||||||||||||
| CMBS | 11,222 | 637 | 203 | 119 | 26 | — | 12,207 | ||||||||||||||||||||||||||||||||||
| Total fixed maturity securities AFS | $ | 239,394 | $ | 85,209 | $ | 11,973 | $ | 3,150 | $ | 526 | $ | 22 | $ | 340,274 | |||||||||||||||||||||||||||
| Percentage of total | 70.4 | % | 25.0 | % | 3.5 | % | 0.9 | % | 0.2 | % | — | % | 100.0 | % | |||||||||||||||||||||||||||
U.S. and Foreign Corporate Fixed Maturity Securities AFS
We maintain a diversified portfolio of corporate fixed maturity securities AFS across industries and issuers. This portfolio did not have any exposure to any single issuer in excess of 1% of total investments at September 30, 2022. The top 10 holdings comprised 1% and 2% of total investments at September 30, 2022 and December 31, 2021, respectively. The table below presents our U.S. and foreign corporate securities holdings by industry at:
| September 30, 2022 | December 31, 2021 | ||||||||||||||||||||||
| Industry |
Estimated
Fair Value |
% of
Total |
Estimated
Fair Value |
% of
Total |
|||||||||||||||||||
| (Dollars in millions) | |||||||||||||||||||||||
| Industrial | $ | 38,048 | 29.6 | % | $ | 45,732 | 29.2 | % | |||||||||||||||
| Finance | 29,766 | 23.1 | 35,676 | 22.7 | |||||||||||||||||||
| Consumer | 26,002 | 20.2 | 31,142 | 19.9 | |||||||||||||||||||
| Utility | 22,145 | 17.2 | 28,961 | 18.5 | |||||||||||||||||||
| Communications | 9,930 | 7.7 | 12,346 | 7.9 | |||||||||||||||||||
| Other | 2,860 | 2.2 | 2,817 | 1.8 | |||||||||||||||||||
| Total | $ | 128,751 | 100.0 | % | $ | 156,674 | 100.0 | % | |||||||||||||||
122
Structured Products
Structured Products are comprised of investments in securities that are collateralized by residential mortgages, commercial mortgages, bank loans and other assets. Our investment selection criteria and monitoring includes the reviews of credit ratings, characteristics of the assets underlying the securities, borrower characteristics and the level of credit enhancement. We held $54.4 billion and $61.2 billion of Structured Products, at estimated fair value, at September 30, 2022 and December 31, 2021, respectively, as presented in the RMBS, ABS & CLO and CMBS sections below.
RMBS
Our RMBS portfolio is diversified by security type and risk profile. The following table presents our RMBS portfolio by security type, risk profile and ratings profile at:
| September 30, 2022 | December 31, 2021 | ||||||||||||||||||||||||||||||||||
|
Estimated
Fair Value |
% of
Total |
Net
Unrealized Gains (Losses) |
Estimated
Fair Value |
% of
Total |
Net
Unrealized Gains (Losses) (1) |
||||||||||||||||||||||||||||||
| (Dollars in millions) | |||||||||||||||||||||||||||||||||||
| Security type | |||||||||||||||||||||||||||||||||||
| Collateralized mortgage obligations | $ | 15,978 | 58.9 | % | $ | (1,655) | $ | 17,646 | 58.0 | % | $ | 1,092 | |||||||||||||||||||||||
| Pass-through mortgage-backed securities | 11,167 | 41.1 | (1,617) | 12,758 | 42.0 | 160 | |||||||||||||||||||||||||||||
| Total RMBS | $ | 27,145 | 100.0 | % | $ | (3,272) | $ | 30,404 | 100.0 | % | $ | 1,252 | |||||||||||||||||||||||
| Risk profile | |||||||||||||||||||||||||||||||||||
| Agency | $ | 16,884 | 62.2 | % | $ | (2,324) | $ | 19,487 | 64.1 | % | $ | 671 | |||||||||||||||||||||||
| Non Agency | |||||||||||||||||||||||||||||||||||
| Prime | 2,554 | 9.4 | (454) | 3,018 | 9.9 | 13 | |||||||||||||||||||||||||||||
| Alt-A | 4,827 | 17.8 | (328) | 3,887 | 12.8 | 267 | |||||||||||||||||||||||||||||
| Sub-prime | 2,880 | 10.6 | (166) | 4,012 | 13.2 | 301 | |||||||||||||||||||||||||||||
| Subtotal Non Agency | 10,261 | 37.8 | % | (948) | 10,917 | 35.9 | % | 581 | |||||||||||||||||||||||||||
| Total RMBS | $ | 27,145 | 100.0 | % | $ | (3,272) | $ | 30,404 | 100.0 | % | $ | 1,252 | |||||||||||||||||||||||
| Ratings profile | |||||||||||||||||||||||||||||||||||
| Rated Aaa and Aa | $ | 22,415 | 82.6 | % | $ | 24,190 | 79.6 | % | |||||||||||||||||||||||||||
| Designated NAIC 1 | $ | 26,345 | 97.1 | % | $ | 29,529 | 97.1 | % | |||||||||||||||||||||||||||
__________________
(1) Excludes gross unrealized gains (losses) related to assets held-for-sale. See Note 3 of the Notes to the Interim Condensed Consolidated Financial Statements for information on the Company’s business dispositions.
See “Management’s Discussion and Analysis of Financial Condition and Results of Operations — Investments — Fixed Maturity Securities AFS and Equity Securities — Structured Products — RMBS” included in the 2021 Annual Report for further information about collateralized mortgage obligations and pass-through mortgage-backed securities, as well as agency, prime, alternative residential mortgage loans (“Alt-A”) and sub-prime RMBS.
Historically, we have managed our exposure to sub-prime RMBS holdings by focusing primarily on senior tranche securities, stress testing the portfolio with severe loss assumptions and closely monitoring the performance of the portfolio. Our sub-prime RMBS portfolio consists predominantly of securities that were purchased at significant discounts to par value and discounts to the expected principal recovery value of these securities. The vast majority of these securities are investment grade under the NAIC designations (e.g., NAIC 1 and NAIC 2).
123
ABS & CLO
Our non-mortgage loan-backed structured securities are comprised of two broad categories of securitizations: ABS & CLO. These portfolios are diversified by collateral type and issuer. The following table presents these portfolios by collateral type and ratings profile at:
| September 30, 2022 | December 31, 2021 | ||||||||||||||||||||||||||||||||||
|
Estimated
Fair Value |
% of
Total |
Net
Unrealized Gains (Losses) |
Estimated
Fair Value |
% of
Total |
Net
Unrealized Gains (Losses) (1) |
||||||||||||||||||||||||||||||
| (Dollars in millions) | |||||||||||||||||||||||||||||||||||
| ABS | |||||||||||||||||||||||||||||||||||
| Collateral type | |||||||||||||||||||||||||||||||||||
| Vehicle and equipment loans | $ | 1,438 | 8.6 | % | $ | (61) | $ | 1,864 | 10.0 | % | $ | 10 | |||||||||||||||||||||||
| Consumer Loans | 1,326 | 7.9 | (96) | 1,653 | 8.9 | 48 | |||||||||||||||||||||||||||||
| Student loans | 861 | 5.1 | (79) | 1,143 | 6.2 | 15 | |||||||||||||||||||||||||||||
| Foreign residential loans | 652 | 3.9 | (43) | 922 | 5.0 | 2 | |||||||||||||||||||||||||||||
| Credit card | 1,031 | 6.1 | (15) | 900 | 4.8 | 9 | |||||||||||||||||||||||||||||
| Other (2) | 3,955 | 23.6 | (481) | 3,646 | 19.6 | 45 | |||||||||||||||||||||||||||||
| Total ABS | 9,263 | 55.2 | % | (775) | 10,128 | 54.5 | % | 129 | |||||||||||||||||||||||||||
| CLO (3) | 7,503 | 44.8 | (466) | 8,441 | 45.5 | (3) | |||||||||||||||||||||||||||||
| Total ABS & CLO | $ | 16,766 | 100.0 | % | $ | (1,241) | $ | 18,569 | 100.0 | % | $ | 126 | |||||||||||||||||||||||
| ABS ratings profile | |||||||||||||||||||||||||||||||||||
| Rated Aaa and Aa | $ | 4,407 | 47.6 | % | $ | 5,289 | 52.2 | % | |||||||||||||||||||||||||||
| Designated NAIC 1 | $ | 7,058 | 76.2 | % | $ | 8,105 | 80.0 | % | |||||||||||||||||||||||||||
| CLO ratings profile | |||||||||||||||||||||||||||||||||||
| Rated Aaa and Aa | $ | 5,660 | 75.4 | % | $ | 6,749 | 80.0 | % | |||||||||||||||||||||||||||
| Designated NAIC 1 | $ | 6,814 | 90.8 | % | $ | 7,815 | 92.6 | % | |||||||||||||||||||||||||||
| ABS & CLO ratings profile | |||||||||||||||||||||||||||||||||||
| Rated Aaa and Aa | $ | 10,067 | 60.0 | % | $ | 12,038 | 64.8 | % | |||||||||||||||||||||||||||
| Designated NAIC 1 | $ | 13,872 | 82.7 | % | $ | 15,920 | 85.7 | % | |||||||||||||||||||||||||||
__________________
(1) Excludes gross unrealized gains (losses) related to assets held-for-sale. See Note 3 of the Notes to the Interim Condensed Consolidated Financial Statements for information on the Company’s business dispositions.
(2) Other ABS are broadly diversified across several subsectors and issuers, including securities with the following collateral types: digital infrastructure, franchise, transportation equipment, and renewable energy.
(3) Includes primarily securities collateralized by broadly syndicated bank loans.
124
CMBS
Our CMBS portfolio is comprised primarily of securities collateralized by multiple commercial mortgage loans and is diversified by property type, borrower and geography. The following tables present our CMBS portfolio by collateral type and ratings profile at.
| September 30, 2022 | December 31, 2021 | ||||||||||||||||||||||||||||||||||
| Estimated Fair Value | % of Total | Net Unrealized Gains (Losses) | Estimated Fair Value | % of Total | Net Unrealized Gains (Losses) (1) | ||||||||||||||||||||||||||||||
| (Dollars in millions) | |||||||||||||||||||||||||||||||||||
| Collateral type | |||||||||||||||||||||||||||||||||||
| Conduit | $ | 7,054 | 67.3 | % | $ | (604) | $ | 8,282 | 67.8 | % | $ | 341 | |||||||||||||||||||||||
| Single asset and single borrower | 1,981 | 18.9 | (162) | 2,269 | 18.6 | 32 | |||||||||||||||||||||||||||||
| Commercial real estate collateralized loan obligations | 513 | 4.9 | (6) | 653 | 5.4 | 2 | |||||||||||||||||||||||||||||
| Agency | 606 | 5.8 | (87) | 610 | 5.0 | 50 | |||||||||||||||||||||||||||||
| Other | 323 | 3.1 | (25) | 393 | 3.2 | 2 | |||||||||||||||||||||||||||||
| Total CMBS | $ | 10,477 | 100.0 | % | $ | (884) | $ | 12,207 | 100 | % | $ | 427 | |||||||||||||||||||||||
| Ratings profile | |||||||||||||||||||||||||||||||||||
| Rated Aaa and Aa | $ | 8,255 | 78.8 | % | $ | 9,614 | 78.8 | % | |||||||||||||||||||||||||||
| Designated NAIC 1 | $ | 9,654 | 92.1 | % | $ | 11,222 | 91.9 | % | |||||||||||||||||||||||||||
__________________
(1) Excludes gross unrealized gains (losses) related to assets held-for-sale. See Note 3 of the Notes to the Interim Condensed Consolidated Financial Statements for information on the Company’s business dispositions.
Evaluation of Fixed Maturity Securities AFS for Credit Loss, Rollforward of Allowance for Credit Loss and Credit Loss on Fixed Maturity Securities AFS Recognized in Earnings
See Note 6 of the Notes to the Interim Condensed Consolidated Financial Statements for information about the evaluation of fixed maturity securities AFS for credit loss, rollforward of the ACL, net credit loss provision (release), and impairment loss, as well as realized gross gains and gross losses on sales and disposals of fixed maturity securities AFS at and for the nine months ended September 30, 2022.
Contractholder-Directed Equity Securities and Fair Value Option Securities
The estimated fair value of these investments, which are primarily comprised of contractholder-directed investments supporting unit-linked variable annuity type liabilities (“Unit-linked investments”), was
$9.0 billion
and $12.1 billion, or
2%
and 2.4% of cash and invested assets, at September 30, 2022 and December 31, 2021, respectively. See Notes 6 and 8 of the Notes to the Interim Condensed Consolidated Financial Statements for a description of this portfolio, investments by asset type and the related cost or amortized cost, net unrealized gains (losses) and estimated fair value of these securities, the fair value hierarchy and a rollforward of the fair value measurements for these investments measured at estimated fair value on a recurring basis using significant unobservable (Level 3) inputs.
Securities Lending Transactions, Repurchase Agreements and Third-Party Custodian Administered Programs
We participate in securities lending transactions, repurchase agreements and third-party custodian administered programs with unaffiliated financial institutions in the normal course of business for the purpose of enhancing the total return on our investment portfolio.
Securities lending transactions and repurchase agreements: We account for these arrangements as secured borrowings and record a liability in the amount of the cash received. We obtain collateral, usually cash, from the borrower, which must be returned to the borrower when the securities are returned to us. Through these arrangements, we were liable for cash collateral under our control of
$16.6 billion
and $24.4 billion at September 30, 2022 and December 31, 2021, respectively, including a portion that may require the immediate return of cash collateral we hold. See Note 6 of the Notes to the Interim Condensed Consolidated Financial Statements, as well as “Summary of Significant Accounting Policies — Investments — Securities Lending Transactions and Repurchase Agreements” in Note
1 of the Notes of the Consolidated Financial Statements included in the 2021 Annual Report for further information about the secured borrowings accounting and the classification of revenues and expenses.
125
Third-party custodian administered programs: The estimated fair value of securities we own which are loaned in connection with these programs was
$475 million
and $273 million at September 30, 2022 and December 31, 2021, respectively. The estimated fair value of the related non-cash collateral on deposit with third-party custodians on our behalf, which is not reflected in our interim condensed consolidated financial statements and cannot be sold or re-pledged, was
$493 million
and $282 million at September 30, 2022 and December 31, 2021, respectively.
Mortgage Loans
Our mortgage loans held-for-investment are principally collateralized by commercial, agricultural and residential properties. Mortgage loans carried at amortized cost and the related ACL are summarized as follows at:
| September 30, 2022 | December 31, 2021 | |||||||||||||||||||||||||||||||||||||||||||||||||
| Portfolio Segment |
Amortized Cost
|
% of
Total
|
ACL
|
% of
Amortized Cost
|
Amortized Cost
|
% of
Total
|
ACL
|
% of
Amortized Cost
|
||||||||||||||||||||||||||||||||||||||||||
| (Dollars in millions) | ||||||||||||||||||||||||||||||||||||||||||||||||||
| Commercial | $ | 52,273 | 63.1 | % | $ | 209 | 0.4 | % | $ | 50,553 | 63.3 | % | $ | 340 | 0.7 | % | ||||||||||||||||||||||||||||||||||
| Agricultural | 18,923 | 22.8 | 118 | 0.6 | % | 18,111 | 22.7 | 88 | 0.5 | % | ||||||||||||||||||||||||||||||||||||||||
| Residential | 11,708 | 14.1 | 140 | 1.2 | % | 11,196 | 14.0 | 206 | 1.8 | % | ||||||||||||||||||||||||||||||||||||||||
| Total | $ | 82,904 | 100.0 | % | $ | 467 | 0.6 | % | $ | 79,860 | 100.0 | % | $ | 634 | 0.8 | % | ||||||||||||||||||||||||||||||||||
The carrying value of all mortgage loans, net of ACL, was 18.4% and 15.4%
o
f cash and invested assets at September 30, 2022 and December 31, 2021, respectively.
We diversify our mortgage loan portfolio by both geographic region and property type to reduce the risk of concentration. Of our commercial and agricultural mortgage loan held-for-investment portfolios, 86% are collateralized by properties located in the United States, with the remaining 14% collateralized by properties located primarily in Mexico, U.K. and Australia at September 30, 2022. The carrying values of our commercial and agricultural mortgage loans held-for-investment located in California, New York and Texas were 17%, 9% and 7%, respectively, of total commercial and agricultural mortgage loans held-for-investment at September 30, 2022. Additionally, we manage risk when originating commercial and agricultural mortgage loans by generally lending up to 75% of the estimated fair value of the underlying real estate collateral.
We manage our residential mortgage loan held-for-investment portfolio in a similar manner to reduce risk of concentration, with 92% collateralized by properties located in the United States, and the remaining 8% collateralized by properties located primarily in Chile at September 30, 2022. The carrying values of our residential mortgage loans located in California, Florida, and New York were 32%, 10%, and 8%, respectively, of total residential mortgage loans at September 30, 2022.
126
Commercial Mortgage Loans by Geographic Region and Property Type.
Commercial mortgage loans are the largest mortgage loan portfolio segment. The tables below present the diversification across geographic regions and property types of commercial mortgage loans held-for-investment at:
| September 30, 2022 | December 31, 2021 | ||||||||||||||||||||||||||||
| Amount |
% of
Total |
Amount |
% of
Total |
||||||||||||||||||||||||||
| (Dollars in millions) | |||||||||||||||||||||||||||||
| Region | |||||||||||||||||||||||||||||
| Non-U.S. | $ | 8,977 | 17.2 | % | $ | 9,969 | 19.7 | % | |||||||||||||||||||||
| Pacific | 9,805 | 18.7 | 9,676 | 19.1 | |||||||||||||||||||||||||
| Middle Atlantic | 7,748 | 14.8 | 7,537 | 14.9 | |||||||||||||||||||||||||
| South Atlantic | 6,691 | 12.8 | 6,800 | 13.5 | |||||||||||||||||||||||||
| West South Central | 4,005 | 7.7 | 3,492 | 6.9 | |||||||||||||||||||||||||
| New England | 2,754 | 5.3 | 2,748 | 5.4 | |||||||||||||||||||||||||
| East North Central | 1,596 | 3.1 | 2,129 | 4.2 | |||||||||||||||||||||||||
| Mountain | 2,269 | 4.3 | 1,993 | 4.0 | |||||||||||||||||||||||||
| East South Central | 635 | 1.2 | 759 | 1.5 | |||||||||||||||||||||||||
| West North Central | 471 | 0.9 | 663 | 1.3 | |||||||||||||||||||||||||
| Multi-Region and Other | 7,322 | 14.0 | 4,787 | 9.5 | |||||||||||||||||||||||||
| Total amortized cost | 52,273 | 100.0 | % | 50,553 | 100.0 | % | |||||||||||||||||||||||
| Less: ACL | 209 | 340 | |||||||||||||||||||||||||||
| Carrying value, net of ACL | $ | 52,064 | $ | 50,213 | |||||||||||||||||||||||||
| Property Type | |||||||||||||||||||||||||||||
| Office | $ | 21,144 | 40.5 | % | $ | 22,388 | 44.3 | % | |||||||||||||||||||||
| Apartment | 10,793 | 20.6 | 9,121 | 18.0 | |||||||||||||||||||||||||
| Retail | 8,305 | 15.9 | 8,548 | 16.9 | |||||||||||||||||||||||||
| Industrial | 5,068 | 9.7 | 5,096 | 10.1 | |||||||||||||||||||||||||
| Hotel | 3,261 | 6.2 | 3,201 | 6.3 | |||||||||||||||||||||||||
| Other | 3,702 | 7.1 | 2,199 | 4.4 | |||||||||||||||||||||||||
| Total amortized cost | 52,273 | 100.0 | % | 50,553 | 100.0 | % | |||||||||||||||||||||||
| Less: ACL | 209 | 340 | |||||||||||||||||||||||||||
| Carrying value, net of ACL | $ | 52,064 | $ | 50,213 | |||||||||||||||||||||||||
Our commercial mortgage loan portfolio is well positioned with exposures concentrated in high quality underlying properties located in primary markets typically with institutional investors who are better positioned to manage their assets during periods of market volatility. Our portfolio is comprised primarily of lower risk loans with higher debt service coverage ratios (“DSCR”) and lower loan-to-value (“LTV”) ratios. See
“— Mortgage Loan Credit Quality — Monitoring Process” for further information and Note 6 of the Notes to the Interim Condensed Consolidated Financial Statements for a distribution of our commercial mortgage loans by DSCR and LTV ratios.
Mortgage Loan Credit Quality - Monitoring Process.
We monitor our mortgage loan investments on an ongoing basis, including a review of loans by credit quality indicator and loans that are current, past due, restructured and under foreclosure. See Note 6 of the Notes to the Interim Condensed Consolidated Financial Statements for further information regarding mortgage loans by credit quality indicator, past due and nonaccrual mortgage loans.
We review our commercial mortgage loans on an ongoing basis. These reviews may include an analysis of the property financial statements and rent roll, lease rollover analysis, property inspections, market analysis, estimated valuations of the underlying collateral, LTV ratios, DSCR and tenant creditworthiness. The monitoring process focuses on higher risk loans, which include those that are classified as restructured, delinquent or in foreclosure, as well as loans with higher LTV ratios and lower DSCR. The monitoring process for agricultural mortgage loans is generally similar, with a focus on higher risk loans, such as loans with higher LTV ratios. Agricultural mortgage loans are reviewed on an ongoing basis which include, but are not limited to, property inspections, market analysis, estimated valuations of the underlying collateral, LTV ratios and borrower creditworthiness, including reviews on a geographic and property-type basis. We review our residential mortgage loans on an ongoing basis, with a focus on higher risk loans, such as nonperforming loans. See Notes 1 and 6 of the Notes to the Interim Condensed Consolidated Financial Statements for information on our evaluation of residential mortgage loans and related ACL methodology.
127
LTV ratios and DSCR are common measures in the assessment of the quality of commercial mortgage loans. LTV ratios are a common measure in the assessment of the quality of agricultural mortgage loans. LTV ratios compare the amount of the loan to the estimated fair value of the underlying collateral. An LTV ratio greater than 100% indicates that the loan amount is greater than the collateral value. An LTV ratio of less than 100% indicates an excess of collateral value over the loan amount. Generally, the higher the LTV ratio, the higher the risk of experiencing a credit loss. The DSCR compares a property’s net operating income to amounts needed to service the principal and interest due under the loan. Generally, the lower the DSCR, the higher the risk of experiencing a credit loss. For our commercial mortgage loans, our average LTV ratio was 57% and 56% at September 30, 2022 and December 31, 2021, respectively, and our average DSCR was 2.5x at both September 30, 2022 and December 31, 2021. The DSCR and the values utilized in calculating the ratio are updated routinely. In addition, the LTV ratio is routinely updated for all but the lowest risk loans as part of our ongoing review of our commercial mortgage loan portfolio. For our agricultural mortgage loans, our average LTV ratio was 48% and 49% at September 30, 2022 and December 31, 2021, respectively. The values utilized in calculating our agricultural mortgage loan LTV ratio are developed in connection with the ongoing review of our agricultural loan portfolio and are routinely updated.
Mortgage Loan Allowance for Credit Loss.
Our ACL is established for both pools of loans with similar risk characteristics and for mortgage loans with dissimilar risk characteristics, collateral dependent loans and reasonably expected troubled debt restructurings, individually on a loan specific basis. We record an allowance for expected lifetime credit loss in earnings within net investment gains (losses) in an amount that represents the portion of the amortized cost basis of mortgage loans that the Company does not expect to collect, resulting in mortgage loans being presented at the net amount expected to be collected.
In determining our ACL, management (i) pools mortgage loans that share similar risk characteristics, (ii) considers expected lifetime credit loss over the contractual term of our mortgage loans, as adjusted for expected prepayments and any extensions, and (iii) considers past events and current and forecasted economic conditions. Actual credit loss realized could be different from the amount of the ACL recorded. These evaluations and assessments are revised as conditions change and new information becomes available, which can cause the ACL to increase or decrease over time as such evaluations are revised. Negative credit migration, including an actual or expected increase in the level of problem loans, will result in an increase in the ACL. Positive credit migration, including an actual or expected decrease in the level of problem loans, will result in a decrease in the ACL. See Note 6 of the Notes to the Interim Condensed Consolidated Financial Statements for information on how the ACL is established and monitored, and activity in and balances of the ACL.
Real Estate and Real Estate Joint Ventures
Real estate and real estate joint ventures is comprised of wholly-owned real estate and joint ventures with interests in single property income-producing real estate and, to a lesser extent, joint ventures with interests in multi-property projects with varying strategies ranging from the development of properties to the operation of income-producing properties, as well as real estate funds. The carrying value of real estate and real estate joint ventures was $12.5 billion and $12.2 billion, or 2.8% and 2.4% of cash and invested assets, at September 30, 2022 and December 31, 2021, respectively.
Our real estate investments are typically stabilized properties that we intend to hold for the longer-term for portfolio diversification and long-term appreciation. Our real estate investment portfolio has significantly appreciated to a $7.5 billion and $6.3 billion unrealized gain position at September 30, 2022 and September 30, 2021, respectively. We continuously monitor expected future cash flows of each of our real estate investments and incorporate them into our periodic impairment analyses. There were no impairments recognized in earnings within net investment gains (losses) on real estate and real estate joint ventures for either the nine months ended September 30, 2022 or 2021.
We diversify our real estate investments by both geographic region and property type to reduce risk of concentration. See Note 6 of the Notes to the Interim Condensed Consolidated Financial Statements for a summary of real estate investments, by income type, as well as income earned.
Other Limited Partnership Interests
Other limited partnership interests are comprised of investments in private funds, including private equity funds and hedge funds. At September 30, 2022 and December 31, 2021, the carrying value of other limited partnership interests was
$14.4 billion
and $14.6 billion, which included
$532 million
and $663 million of hedge funds, respectively. Other limited partnership interests were
3.2%
and 2.8% of cash and invested assets at September 30, 2022 and December 31, 2021, respectively. Cash distributions on these investments are generated from investment gains, operating income from the underlying investments of the funds and liquidation of the underlying investments of the funds.
128
We use the equity method of accounting for most of our private equity funds. We generally recognize our share of a private equity fund’s earnings in net investment income on a three-month lag when the information is reported to us. Accordingly, changes in equity market levels, which can impact the underlying results of these private equity funds, are recognized in earnings within our net investment income on a three-month lag.
Other Invested Assets
The following table presents the carrying value of our other invested assets by type at:
| September 30, 2022 | December 31, 2021 | ||||||||||||||||||||||
| Asset Type |
Carrying
Value |
% of
Total |
Carrying
Value |
% of
Total |
|||||||||||||||||||
| (Dollars in millions) | |||||||||||||||||||||||
| Freestanding derivatives with positive estimated fair values | $ | 14,193 | 63.6 | % | $ | 10,466 | 56.1 | % | |||||||||||||||
| Tax credit and renewable energy partnerships | 1,391 | 6.2 | 1,564 | 8.4 | |||||||||||||||||||
| Annuities funding structured settlement claims | 1,237 | 5.5 | 1,251 | 6.7 | |||||||||||||||||||
| Direct financing leases | 1,006 | 4.5 | 1,143 | 6.1 | |||||||||||||||||||
| Operating joint ventures | 1,139 | 5.1 | 901 | 4.8 | |||||||||||||||||||
| Leveraged leases | 795 | 3.6 | 787 | 4.2 | |||||||||||||||||||
| FHLB common stock | 768 | 3.4 | 769 | 4.1 | |||||||||||||||||||
| Funds withheld | 426 | 1.9 | 525 | 2.8 | |||||||||||||||||||
| Other | 1,344 | 6.2 | 1,249 | 6.8 | |||||||||||||||||||
| Total | $ | 22,299 | 100.0 | % | $ | 18,655 | 100.0 | % | |||||||||||||||
| Percentage of cash and invested assets | 5.0 | % | 3.6 | % | |||||||||||||||||||
Investment
Commitments
We enter into the following commitments in the normal course of business for the purpose of enhancing the total return on our investment portfolio: mortgage loan commitments and commitments to fund partnerships, bank credit facilities, bridge loans and private corporate bond investments. See Note 15 of the Notes to the Interim Condensed Consolidated Financial Statements for the amount of our unfunded investment commitments at September 30, 2022 and December 31, 2021. See “Net Investment Income” and “Net Investment Gains (Losses)” in Note 6 of the Notes to the Interim Condensed Consolidated Financial Statements for information on the investment income, investment expense, gains and losses from such investments and the liability for credit loss for unfunded mortgage loan commitments. See also “— Fixed Maturity Securities AFS and Equity Securities,” “— Mortgage Loans,” “— Real Estate and Real Estate Joint Ventures” and “— Other Limited Partnership Interests.”
Derivatives
Overview
We are exposed to various risks relating to our ongoing business operations, including interest rate, foreign currency exchange rate, credit and equity market. We use a variety of strategies to manage these risks, including the use of derivatives such as market standard purchased and written credit default swap contracts. See Note 7 of the Notes to the Interim Condensed Consolidated Financial Statements for:
•
A comprehensive description of the nature of our derivatives, including the strategies for which derivatives are used in managing various risks.
•
Information about the primary underlying risk exposure, gross notional amount, and estimated fair value of our derivatives by type of hedge designation, excluding embedded derivatives held at September 30, 2022 and December 31, 2021.
•
The statement of operations effects of derivatives in net investments in foreign operations, cash flow, fair value, or nonqualifying hedge relationships for the three months and nine months ended September 30, 2022 and 2021.
129
We enter into market standard purchased and written credit default swap contracts. Payout under such contracts is triggered by certain credit events experienced by the referenced entities. For credit default swaps covering North American corporate issuers, credit events typically include bankruptcy and failure to pay on borrowed money. For European corporate issuers, credit events typically also include involuntary restructuring. With respect to credit default contracts on sovereign debt, credit events typically include failure to pay debt obligations, repudiation, moratorium, or involuntary restructuring. In each case, payout on a credit default swap is triggered only after the relevant third party, Credit Derivatives Determinations Committee, determines that a credit event has occurred.
We use purchased credit default swaps to mitigate credit risk in our investment portfolio. Generally, we purchase credit protection by entering into credit default swaps referencing the issuers of specific assets we own. In certain cases, basis risk exists between these credit default swaps and the specific assets we own. For example, we may purchase credit protection on a macro basis to reduce exposure to specific industries or other portfolio concentrations. In such instances, the referenced entities and obligations under the credit default swaps may not be identical to the individual obligors or securities in our investment portfolio. In addition, our purchased credit default swaps may have shorter tenors than the underlying investments they are hedging, which gives us more flexibility in managing our credit exposures. We believe that our purchased credit default swaps serve as effective economic hedges of our credit exposure.
See “Quantitative and Qualitative Disclosures About Market Risk — Management of Market Risk Exposures — Hedging Activities” included in the 2021 Annual Report for more information about our use of derivatives by major hedge program.
Fair Value Hierarchy
See Note 8 of the Notes to the Interim Condensed Consolidated Financial Statements for derivatives measured at estimated fair value on a recurring basis and their corresponding fair value hierarchy.
The valuation of Level 3 derivatives involves the use of significant unobservable inputs and generally requires a higher degree of management judgment or estimation than the valuations of Level 1 and Level 2 derivatives. Although Level 3 inputs are unobservable, management believes they are consistent with what other market participants would use when pricing such instruments and are considered appropriate given the circumstances. The use of different inputs or methodologies could have a material effect on the estimated fair value of Level 3 derivatives and could materially affect net income.
Derivatives categorized as Level 3 at September 30, 2022 include: interest rate forwards with maturities which extend beyond the observable portion of the yield curve; interest rate caps with unobservable volatility inputs; foreign currency swaps and forwards with certain unobservable inputs, including the unobservable portion of the yield curve; and credit default swaps priced using unobservable credit spreads, or that are priced through independent broker quotations. At September 30, 2022, less than 1% of the estimated fair value of our derivatives was priced through independent broker quotations.
See Note 8 of the Notes to the Interim Condensed Consolidated Financial Statements for a rollforward of the fair value measurements for derivatives measured at estimated fair value on a recurring basis using significant unobservable (Level 3) inputs.
See “Management’s Discussion and Analysis of Financial Condition and Results of Operations — Summary of Critical Accounting Estimates — Derivatives” included in the 2021 Annual Report for further information on the estimates and assumptions that affect derivatives.
Credit Risk
See Note 7 of the Notes to the Interim Condensed Consolidated Financial Statements for information about how we manage credit risk related to derivatives and for the estimated fair value of our net derivative assets and net derivative liabilities after the application of master netting agreements and collateral.
Our policy is not to offset the fair value amounts recognized for derivatives executed with the same counterparty under the same master netting agreement. This policy applies to the recognition of derivatives on the consolidated balance sheets, and does not affect our legal right of offset.
130
Credit Derivatives
The following table presents the gross notional amount and estimated fair value of credit default swaps at:
| September 30, 2022 | December 31, 2021 | |||||||||||||||||||||||||
| Credit Default Swaps |
Gross
Notional Amount |
Estimated
Fair Value |
Gross
Notional Amount |
Estimated
Fair Value |
||||||||||||||||||||||
| (In millions) | ||||||||||||||||||||||||||
|
Purchased
|
$ | 2,993 | $ | (47) | $ | 3,042 | $ | (100) | ||||||||||||||||||
|
Written
|
13,059 | (11) | 8,626 | 165 | ||||||||||||||||||||||
|
Total
|
$ | 16,052 | $ | (58) | $ | 11,668 | $ | 65 | ||||||||||||||||||
The following table presents the gross gains, gross losses and net gains (losses) recognized in net derivative gains (losses) for credit default swaps as follows:
|
Three Months
Ended September 30, |
Nine Months
Ended September 30, |
|||||||||||||||||||||||||||||||||||||||||||||||||||||||||||||||||||||||||
| 2022 | 2021 | 2022 | 2021 | |||||||||||||||||||||||||||||||||||||||||||||||||||||||||||||||||||||||
| Credit Default Swaps |
Gross
Gains |
Gross
Losses |
Net
Gains (Losses) |
Gross
Gains |
Gross
Losses |
Net
Gains (Losses) |
Gross
Gains |
Gross
Losses |
Net
Gains (Losses) |
Gross
Gains |
Gross
Losses |
Net
Gains (Losses) |
||||||||||||||||||||||||||||||||||||||||||||||||||||||||||||||
| (In millions) | ||||||||||||||||||||||||||||||||||||||||||||||||||||||||||||||||||||||||||
|
Purchased (1)
|
$ | 7 | $ | — | $ | 7 | $ | 5 | $ | (1) | $ | 4 | $ | 101 | $ | (2) | $ | 99 | $ | 21 | $ | (5) | $ | 16 | ||||||||||||||||||||||||||||||||||||||||||||||||||
|
Written (1)
|
1 | — | 1 | 2 | (4) | (2) | 3 | (247) | (244) | 44 | (11) | 33 | ||||||||||||||||||||||||||||||||||||||||||||||||||||||||||||||
| Total | $ | 8 | $ | — | $ | 8 | $ | 7 | $ | (5) | $ | 2 | $ | 104 | $ | (249) | $ | (145) | $ | 65 | $ | (16) | $ | 49 | ||||||||||||||||||||||||||||||||||||||||||||||||||
__________________
(1)
Gains (losses) do not include earned income (expense) on credit default swaps.
The unfavorable change in net gains (losses) on written credit default swaps of $277 million for the nine months ended September 30, 2022 compared to the nine months ended September 30, 2021 was due to certain credit spreads on certain credit default swaps used as replications widening in the current period as compared to narrowing in the prior period. The favorable change in net gains (losses) on purchased credit defaults swaps of $83 million for the nine months ended September 30, 2022 compared to the nine months ended September 30, 2021 was due to certain credit spreads on certain credit default swaps widening in the current period as compared to narrowing in the prior period.
The maximum amount at risk related to our written credit default swaps is equal to the corresponding gross notional amount. In a replication transaction, we pair an asset on our balance sheet with a written credit default swap to synthetically replicate a corporate bond, a core asset holding of life insurance companies. Replications are entered into in accordance with the guidelines approved by state insurance regulators and the NAIC and are an important tool in managing the overall corporate credit risk within the Company. In order to match our long-dated insurance liabilities, we seek to buy long-dated corporate bonds. In some instances, these may not be readily available in the market, or they may be issued by corporations to which we already have significant corporate credit exposure. For example, by purchasing Treasury bonds (or other high-quality assets) and associating them with written credit default swaps on the desired corporate credit name, we can replicate the desired bond exposures and meet our ALM needs. In addition, given the shorter tenor of the credit default swaps (generally five-year tenors) versus a long dated corporate bond, we have more flexibility in managing our credit exposures.
Collateral for Derivatives
We enter into derivatives to manage various risks relating to our ongoing business operations. We receive non-cash collateral from counterparties for derivatives, which can be sold or re-pledged subject to certain constraints, and which is not reflected on our interim condensed consolidated balance sheets. The amounts of this non-cash collateral
were $1.7 billion and $1.1 billion, at estimated fair value, at September 30, 2022 and December 31, 2021, respectively. See “— Liquidity and Capital Resources — The Company — Liquidity and Capital Uses — Pledged Collateral” and Note 7 of the Notes to the Interim Condensed
Consolidated Financial Statements for information regarding the earned income on and the gross notional amount, estimated fair value of assets and liabilities and primary underlying risk exposure of our derivatives.
131
Embedded Derivatives
See Note 8 of the Notes to the Interim Condensed Consolidated Financial Statements for information about embedded derivatives measured at estimated fair value on a recurring basis and their corresponding fair value hierarchy and a rollforward of the fair value measurements for embedded derivatives measured at estimated fair value on a recurring basis using significant unobservable (Level 3) inputs.
See Note 7 of the Notes to the Interim Condensed Consolidated Financial Statements for information about the nonperformance risk adjustment included in the valuation of guaranteed minimum benefits accounted for as embedded derivatives.
See “Management’s Discussion and Analysis of Financial Condition and Results of Operations — Summary of Critical Accounting Estimates — Derivatives” included in the 2021 Annual Report for further information on the estimates and assumptions that affect embedded derivatives.
Policyholder Liabilities
We establish, and carry as liabilities, actuarially determined amounts that are calculated to meet policy obligations or to provide for future annuity payments. Amounts for actuarial liabilities are computed and reported on the interim condensed consolidated financial statements in conformity with GAAP. For more details on Policyholder Liabilities, see “Management’s Discussion and Analysis of Financial Condition and Results of Operations — Summary of Critical Accounting Estimates” included in the 2021 Annual Report.
We periodically review our estimates of actuarial liabilities for future benefits and compare them with our actual experience. We revise estimates, to the extent permitted or required under GAAP, if we determine that future expected experience differs from assumptions used in the development of actuarial liabilities. We charge or credit changes in our liabilities to expenses in the period the liabilities are established or re-estimated. If the liabilities originally established for future benefit payments prove inadequate, we must increase them. Such an increase could adversely affect our earnings and have a material adverse effect on our business, results of operations and financial condition.
See “Business — Regulation — Insurance Regulation — Policy and Contract Reserve Adequacy Analysis” and “Risk Factors — Business Risks” included in the 2021 Annual Report for further information regarding required analyses of the adequacy of statutory reserves of our insurance operations.
The following discussions on future policy benefits and policyholder account balances should be read in conjunction with “Management’s Discussion and Analysis of Financial Condition and Results of Operations — Industry Trends — Impact of Market Interest Rates” included in the 2021 Annual Report, as amended or supplemented in our subsequently filed Quarterly Reports on Form 10-Q and “— Variable Annuity Guarantees.” See also Notes 1 and 4 of the Notes to the Consolidated Financial Statements included in the 2021 Annual Report for additional information.
Future Policy Benefits
We establish liabilities for amounts payable under insurance policies. A discussion of future policy benefits by segment (as well as Corporate & Other) follows.
U.S.
Amounts payable under insurance policies for this segment are comprised of group insurance and annuities. For group insurance, future policyholder benefits are comprised mainly of liabilities for disabled lives under disability waiver of premium policy provisions, liabilities for survivor income benefit insurance, active life policies and premium stabilization and other contingency liabilities held under life insurance contracts. For group annuity contracts, future policyholder benefits are primarily related to payout annuities, including pension risk transfers, structured settlement annuities and institutional income annuities. There is no interest rate crediting flexibility on these liabilities.
Asia
Future policy benefits for this segment are held primarily for traditional life, endowment, annuity and accident & health contracts. They are also held for total return pass-through provisions included in certain universal life and savings products. They include certain liabilities for variable annuity and variable life guarantees of minimum death benefits, and longevity guarantees. Factors impacting these liabilities include sustained periods of lower than expected yields, lower than expected asset reinvestment rates, market volatility, actual lapses resulting in lower than expected income, and actual mortality or morbidity resulting in higher than expected benefit payments.
132
Latin America
Future policy benefit liabilities for this segment are held primarily for immediate annuities, traditional life contracts and total return pass-through provisions included in certain universal life and savings products. There is no interest rate crediting flexibility on the immediate annuity and traditional life liabilities. Other factors impacting these liabilities are actual mortality resulting in higher than expected benefit payments and actual lapses resulting in lower than expected income.
EMEA
Future policy benefits for this segment include unearned premium reserves for group life and medical and credit insurance contracts. Future policy benefits are also held for traditional life, endowment and annuity contracts with significant mortality risk and accident & health contracts. Factors impacting these liabilities include lower than expected asset reinvestment rates, market volatility, actual lapses resulting in lower than expected income, and actual mortality or morbidity resulting in higher than expected benefit payments.
MetLife Holdings
Future policy benefits for the life insurance business are comprised mainly of liabilities for traditional life insurance contracts. For the annuities business, future policy benefits are comprised mainly of liabilities for life-contingent income annuities and liabilities for the variable annuity guaranteed minimum benefits that are accounted for as insurance. For the long-term care business, future policyholder benefits are comprised mainly of liabilities for disabled lives under disability waiver of premium policy provisions, and active life policies. In addition, for our other products, future policyholder benefits related to the reinsurance of our former Japan joint venture are comprised of liabilities for the variable annuity guaranteed minimum benefits that are accounted for as insurance.
Corporate & Other
Future policy benefits primarily include liabilities for other reinsurance business.
Policyholder Account Balances
Policyholder account balances are generally equal to the account value, which includes accrued interest credited, but excludes the impact of any applicable charge that may be incurred upon surrender. A discussion of policyholder account balances by segment follows.
U.S.
Policyholder account balances in this segment are comprised of funding agreements, retained asset accounts, universal life policies, the fixed account of variable life insurance policies and specialized life insurance products for benefit programs.
Group Benefits
Policyholder account balances in this business are held for retained asset accounts, universal life policies, the fixed account of variable life insurance policies and specialized life insurance products for benefit programs. Policyholder account balances are credited interest at a rate we determine, which is influenced by current market rates. Most of these policyholder account balances have minimum credited rate guarantees.
The table below presents the breakdown of account value subject to minimum guaranteed crediting rates for Group Benefits:
| September 30, 2022 | |||||||||||
| Guaranteed Minimum Crediting Rate |
Account
Value |
Account
Value at Guarantee |
|||||||||
| (In millions) | |||||||||||
| Greater than 0% but less than 2% | $ | 5,589 | $ | 5,406 | |||||||
| Equal to or greater than 2% but less than 4% | $ | 1,513 | $ | 1,470 | |||||||
| Equal to or greater than 4% | $ | 818 | $ | 786 | |||||||
133
Retirement and Income Solutions
Policyholder account balances in this business are held largely for investment-type products, mainly funding agreements, as well as postretirement benefits and corporate-owned life insurance to fund non-qualified benefit programs for executives. Interest crediting rates vary by type of contract and can be fixed or variable. Variable interest crediting rates are generally tied to an external index, most commonly (1-month or 3-month) LIBOR or Secured Overnight Financing Rate. We guarantee payment of interest and return of principal at the contractual maturity date.
The table below presents the breakdown of account value subject to minimum guaranteed crediting rates for RIS:
| September 30, 2022 | |||||||||||
| Guaranteed Minimum Crediting Rate |
Account
Value |
Account
Value at Guarantee |
|||||||||
| (In millions) | |||||||||||
| Greater than 0% but less than 2% | $ | 1,280 | $ | — | |||||||
| Equal to or greater than 2% but less than 4% | $ | 812 | $ | 232 | |||||||
| Equal to or greater than 4% | $ | 4,584 | $ | 4,402 | |||||||
Asia
Policyholder account balances in this segment are held largely for fixed income retirement and savings plans, fixed deferred annuities, interest sensitive whole life products, universal life and, to a lesser degree, liability amounts for Unit-linked investments that do not meet the GAAP definition of separate accounts. Also included are certain liabilities for retirement and savings products sold in certain countries in Asia that generally are sold with minimum credited rate guarantees. Liabilities for guarantees on certain variable annuities in Asia are accounted for as embedded derivatives and recorded at estimated fair value and are also included within policyholder account balances. Most of these policyholder account balances have minimum credited rate guarantees. Liabilities for Unit-linked investments are impacted by changes in the fair value of the associated underlying investments, as the return on assets is generally passed directly to the policyholder.
The table below presents the breakdown of account value subject to minimum guaranteed crediting rates for Asia:
| September 30, 2022 | |||||||||||
| Guaranteed Minimum Crediting Rate |
Account
Value |
Account
Value at Guarantee |
|||||||||
| (In millions) | |||||||||||
|
Annuities:
|
|||||||||||
| Greater than 0% but less than 2% | $ | 30,240 | $ | 1,643 | |||||||
| Equal to or greater than 2% but less than 4% | $ | 831 | $ | 377 | |||||||
| Equal to or greater than 4% | $ | 1 | $ | 1 | |||||||
| Life & Other: | |||||||||||
| Greater than 0% but less than 2% | $ | 10,938 | $ | 10,212 | |||||||
| Equal to or greater than 2% but less than 4% | $ | 34,189 | $ | 20,967 | |||||||
| Equal to or greater than 4% | $ | 273 | $ | 273 | |||||||
Latin America
Policyholder account balances in this segment are held largely for investment-type products, universal life products, deferred annuities and Unit-linked investments that do not meet the GAAP definition of separate accounts. Liabilities for Unit-linked investments are impacted by changes in the fair value of the associated investments, as the return on assets is generally passed directly to the policyholder. Many of the other liabilities have minimum credited rate guarantees.
EMEA
Policyholder account balances in this segment are held mostly for universal life, deferred annuities, pension products, and Unit-linked investments that do not meet the GAAP definition of separate accounts. They are also held for endowment products without significant mortality risk. Most of these policyholder account balances have minimum credited rate guarantees. Liabilities for Unit-linked investments are impacted by changes in the fair value of the associated investments, as the return on assets is generally passed directly to the policyholder.
134
MetLife Holdings
Life policyholder account balances in this segment are held for retained asset accounts, universal life policies, the fixed account of variable life insurance policies, and funding agreements. For annuities, policyholder account balances are held for fixed deferred annuities, the fixed account portion of variable annuities, non-life contingent income annuities, and embedded derivatives related to variable annuity guarantees. Interest is credited to the policyholder’s account at interest rates we determine which are influenced by current market rates, subject to specified minimums. Most of these policyholder account balances have minimum credited rate guarantees. Additionally, for our other products, policyholder account balances are held for variable annuity guarantees assumed from a former operating joint venture in Japan that are accounted for as embedded derivatives.
The table below presents the breakdown of account value subject to minimum guaranteed crediting rates for the MetLife Holdings segment:
| September 30, 2022 | |||||||||||
| Guaranteed Minimum Crediting Rate |
Account
Value |
Account
Value at Guarantee |
|||||||||
| (In millions) | |||||||||||
| Greater than 0% but less than 2% | $ | 1,075 | $ | 1,048 | |||||||
| Equal to or greater than 2% but less than 4% | $ | 16,889 | $ | 15,499 | |||||||
| Equal to or greater than 4% | $ | 7,199 | $ | 6,589 | |||||||
Variable Annuity Guarantees
We issue, directly and through assumed business, certain variable annuity products with guaranteed minimum benefits that provide the policyholder a minimum return based on their initial deposit (i.e., the benefit base) less withdrawals. In some cases, the benefit base may be increased by additional deposits, bonus amounts, accruals or optional market value resets. See Note 4 of the Notes to the Interim Condensed Consolidated Financial Statements, as well as Notes 1 and 4 of the Notes to the Consolidated Financial Statements included in the 2021 Annual Report for additional information.
Certain guarantees, including portions thereof, have insurance liabilities established that are included in future policy benefits. Guarantees accounted for in this manner include GMDBs, the life-contingent portion of guaranteed minimum withdrawal benefits (“GMWBs”), elective guaranteed minimum income benefit (“GMIB”) annuitizations, and the life contingent portion of GMIBs that require annuitization when the account balance goes to zero. These liabilities are accrued over the life of the contract in proportion to actual and future expected policy assessments based on the level of guaranteed minimum benefits generated using multiple scenarios of separate account returns. The scenarios are based on best estimate assumptions consistent with those used to amortize DAC. When current estimates of future benefits exceed those previously projected or when current estimates of future assessments are lower than those previously projected, liabilities will increase, resulting in a current period charge to net income. The opposite result occurs when the current estimates of future benefits are lower than those previously projected or when current estimates of future assessments exceed those previously projected. At the end of each reporting period, we update the actual amount of business remaining in-force, which impacts expected future assessments and the projection of estimated future benefits resulting in a current period charge or increase to earnings.
Certain guarantees, including portions thereof, accounted for as embedded derivatives, are recorded at estimated fair value and included in policyholder account balances. Guarantees accounted for as embedded derivatives include guaranteed minimum accumulation benefits (“GMABs”), the non-life contingent portion of GMWBs and certain non-life contingent portions of GMIBs. The estimated fair values of guarantees accounted for as embedded derivatives are determined based on the present value of projected future benefits minus the present value of projected future fees. The projections of future benefits and future fees require capital market and actuarial assumptions including expectations concerning policyholder behavior. A risk-neutral valuation methodology is used to project the cash flows from the guarantees under multiple capital market scenarios to determine an economic liability. The reported estimated fair value is then determined by taking the present value of these risk-free generated cash flows using a discount rate that incorporates a spread over the risk-free rate to reflect our nonperformance risk and adding a risk margin. For more information on the determination of estimated fair value, see Note 8 of the Notes to the Interim Condensed Consolidated Financial Statements.
135
The table below presents the carrying value for guarantees at:
|
Future Policy
Benefits |
Policyholder
Account Balances |
||||||||||||||||||||||
| September 30, 2022 | December 31, 2021 | September 30, 2022 | December 31, 2021 | ||||||||||||||||||||
| (In millions) | |||||||||||||||||||||||
| Asia | |||||||||||||||||||||||
| GMDB | $ | 4 | $ | 4 | $ | — | $ | — | |||||||||||||||
| GMAB | — | — | 10 | 14 | |||||||||||||||||||
| GMWB | 25 | 32 | 58 | 107 | |||||||||||||||||||
| EMEA | |||||||||||||||||||||||
| GMDB | 4 | 3 | — | — | |||||||||||||||||||
| GMAB | — | — | 10 | 6 | |||||||||||||||||||
| GMWB | 25 | 19 | (36) | (58) | |||||||||||||||||||
| MetLife Holdings | |||||||||||||||||||||||
| GMDB | 763 | 561 | — | — | |||||||||||||||||||
| GMIB | 906 | 1,029 | 476 | 180 | |||||||||||||||||||
| GMAB | — | — | (1) | — | |||||||||||||||||||
| GMWB | 180 | 174 | 160 | 173 | |||||||||||||||||||
| Total | $ | 1,907 | $ | 1,822 | $ | 677 | $ | 422 | |||||||||||||||
The carrying amounts for guarantees included in policyholder account balances above include nonperformance risk adjustments of $164 million and $120 million at September 30, 2022 and December 31, 2021, respectively. These nonperformance risk adjustments represent the impact of including a credit spread when discounting the underlying risk-neutral cash flows to determine the estimated fair values. The nonperformance risk adjustment does not have an economic impact on us as it cannot be monetized given the nature of these policyholder liabilities. The change in valuation arising from the nonperformance risk adjustment is not hedged.
The carrying values of these guarantees can change significantly during periods of sizable and sustained shifts in equity market performance, equity volatility, interest rates or foreign currency exchange rates. Carrying values are also impacted by our assumptions around mortality, separate account returns and policyholder behavior, including lapse rates.
As discussed below, we use a combination of product design, hedging strategies, reinsurance, and other risk management actions to mitigate the risks related to these benefits. Within each type of guarantee, there is a range of product offerings reflecting the changing nature of these products over time. Changes in product features and terms are in part driven by customer demand but, more importantly, reflect our risk management practices of continuously evaluating the guaranteed benefits and their associated asset-liability matching. We continue to diversify the concentration of income benefits in our portfolio by focusing on withdrawal benefits, variable annuities without living benefits and index-linked annuities.
The sections below provide further detail by total account value for certain of our most popular guarantees. Total account values include amounts not reported on the interim condensed consolidated balance sheets from assumed business, Unit-linked investments that do not qualify for presentation as separate account assets, and amounts included in our general account. The total account values and the net amounts at risk include direct and assumed business, but exclude offsets from hedging or ceded reinsurance, if any.
GMDBs
We offer a range of GMDBs to our contractholders. The table below presents GMDBs, by benefit type, at September 30, 2022:
| Total Account Value (1) | |||||||||||
| Asia & EMEA | MetLife Holdings | ||||||||||
| (In millions) | |||||||||||
| Return of premium or five to seven year step-up | $ | 5,093 | $ | 34,007 | |||||||
| Annual step-up | — | 2,244 | |||||||||
| Roll-up and step-up combination | — | 3,811 | |||||||||
| Total | $ | 5,093 | $ | 40,062 | |||||||
__________________
136
(1)
Total account value excludes $496 million for contracts with no GMDBs. The Company’s annuity contracts with guarantees may offer more than one type of guarantee in each contract. Therefore, the amounts listed for GMDBs and for living benefit guarantees are not mutually exclusive.
Based on total account value, less than 17% of our GMDBs included enhanced death benefits such as the annual step-up or roll-up and step-up combination products at September 30, 2022.
Living Benefit Guarantees
The table below presents our living benefit guarantees based on total account values at September 30, 2022:
| Total Account Value (1) | |||||||||||
| Asia & EMEA | MetLife Holdings | ||||||||||
| (In millions) | |||||||||||
| GMIB | $ | — | $ | 14,185 | |||||||
| GMWB - non-life contingent (2) | 649 | 1,390 | |||||||||
| GMWB - life-contingent | 1,991 | 5,877 | |||||||||
| GMAB | 984 | 96 | |||||||||
| Total | $ | 3,624 | $ | 21,548 | |||||||
__________________
(1)
Total account value excludes $20.5 billion for contracts with no living benefit guarantees. The Company’s annuity contracts with guarantees may offer more than one type of guarantee in each contract. Therefore, the amounts listed for GMDBs and for living benefit guarantee amounts are not mutually exclusive.
(2)
The Asia and EMEA segments include the non-life contingent portion of the GMWB total account value of $649 million with a guarantee at annuitization.
In terms of total account value, GMIBs are our most significant living benefit guarantee. Our primary risk management strategy for our GMIB products is our derivatives hedging program as discussed below. Additionally, we have engaged in certain reinsurance agreements covering some of our GMIB business. As part of our overall risk management approach for living benefit guarantees, we continually monitor the reinsurance markets for the right opportunity to purchase additional coverage for our GMIB business. We stopped selling GMIBs in February 2016.
The table below presents our GMIB associated total account values, by their guaranteed payout basis, at September 30, 2022:
| Total Account Value | |||||
| (In millions) | |||||
| 7-year setback, 2.5% interest rate | $ | 4,299 | |||
| 7-year setback, 1.5% interest rate | 870 | ||||
| 10-year setback, 1.5% interest rate | 2,854 | ||||
| 10-year mortality projection, 10-year setback, 1.0% interest rate | 5,229 | ||||
| 10-year mortality projection, 10-year setback, 0.5% interest rate | 933 | ||||
| $ | 14,185 | ||||
The annuitization interest rates on GMIBs have been decreased from 2.5% to 0.5% over time, partially in response to the low interest rate environment in effect at the time the GMIBs were sold, accompanied by an increase in the setback period from seven years to 10 years and the introduction of a 10-year mortality projection.
Additionally, 34% of the $14.2 billion of GMIB total account value has been invested in managed volatility funds as of September 30, 2022. These funds seek to manage volatility by adjusting the fund holdings within certain guidelines based on capital market movements. Such activity reduces the overall risk of the underlying funds while maintaining their growth opportunities. These risk mitigation techniques reduce or eliminate the need for us to manage the funds’ volatility through hedging or reinsurance.
Our GMIB products typically have a waiting period of 10 years to be eligible for annuitization. As of September 30, 2022, only 44% of our contracts with GMIBs were eligible for annuitization. The remaining contracts are not eligible for annuitization for an average of three years.
137
Once eligible for annuitization, contractholders would be expected to annuitize only if their contracts were in-the-money. We calculate in-the-moneyness with respect to GMIBs consistent with net amount at risk as discussed in Note 4 of the Notes to the Interim Condensed Consolidated Financial Statements, by comparing the contractholders’ income benefits based on total account values and current annuity rates versus the guaranteed income benefits. The net amount at risk was $685 million at September 30, 2022, of which $638 million was related to GMIBs. For those contracts with GMIB, the table below presents details of contracts that are in-the-money and out-of-the-money at September 30, 2022:
|
In-the-
Moneyness |
Total
Account Value |
% of Total | |||||||||||||||
| (In millions) | |||||||||||||||||
| In-the-money | 30% or greater | $ | 586 | 4 | % | ||||||||||||
| 20% to less than 30% | 365 | 3 | % | ||||||||||||||
| 10% to less than 20% | 729 | 5 | % | ||||||||||||||
| 0% to less than 10% | 1,642 | 12 | % | ||||||||||||||
| 3,322 | |||||||||||||||||
| Out-of-the-money | -10% to 0% | 2,960 | 21 | % | |||||||||||||
| -20% to less than -10% | 3,037 | 21 | % | ||||||||||||||
| Greater than -20% | 4,866 | 34 | % | ||||||||||||||
| 10,863 | |||||||||||||||||
| Total GMIBs | $ | 14,185 | |||||||||||||||
Derivatives Hedging Variable Annuity Guarantees
Our risk mitigating hedging strategy uses various over-the-counter and exchange traded derivatives. The table below presents the gross notional amount, estimated fair value and primary underlying risk exposure of the derivatives hedging our variable annuity guarantees:
| Instrument Type | September 30, 2022 | December 31, 2021 | ||||||||||||||||||||||||||||||||||||||||||
|
Primary Underlying
Risk Exposure |
Gross Notional
Amount |
Estimated Fair Value |
Gross Notional
Amount |
Estimated Fair Value | ||||||||||||||||||||||||||||||||||||||||
| Assets | Liabilities | Assets | Liabilities | |||||||||||||||||||||||||||||||||||||||||
| (In millions) | ||||||||||||||||||||||||||||||||||||||||||||
| Interest rate | Interest rate swaps | $ | 7,371 | $ | 36 | $ | 728 | $ | 8,663 | $ | 52 | $ | 75 | |||||||||||||||||||||||||||||||
| Interest rate futures | 1,367 | 2 | 6 | 1,087 | 3 | — | ||||||||||||||||||||||||||||||||||||||
| Interest rate options | 50 | 6 | — | 100 | 1 | — | ||||||||||||||||||||||||||||||||||||||
| Foreign currency exchange rate | Foreign currency forwards | 858 | 8 | 33 | 1,149 | 4 | 13 | |||||||||||||||||||||||||||||||||||||
| Equity market | Equity futures | 2,498 | 25 | 4 | 3,641 | 11 | 5 | |||||||||||||||||||||||||||||||||||||
| Equity index options | 3,709 | 198 | 252 | 4,161 | 513 | 362 | ||||||||||||||||||||||||||||||||||||||
| Equity variance swaps | 692 | 18 | 13 | 699 | 17 | 13 | ||||||||||||||||||||||||||||||||||||||
| Equity total return swaps | 2,723 | 169 | — | 2,763 | 11 | 44 | ||||||||||||||||||||||||||||||||||||||
| Total | $ | 19,268 | $ | 462 | $ | 1,036 | $ | 22,263 | $ | 612 | $ | 512 | ||||||||||||||||||||||||||||||||
The change in estimated fair values of our derivatives is recorded in policyholder benefits and claims if such derivatives are hedging guarantees included in future policy benefits, and in net derivative gains (losses) if such derivatives are hedging guarantees included in policyholder account balances.
Our hedging strategy involves the significant use of static longer-term derivative instruments to avoid the need to execute transactions during periods of market disruption or higher volatility. We continually monitor the capital markets for opportunities to adjust our liability coverage, as appropriate. Futures are also used to dynamically adjust the daily coverage levels as markets and liability exposures fluctuate.
138
We remain liable for the guaranteed benefits in the event that reinsurers or derivative counterparties are unable or unwilling to pay. Certain of our reinsurance agreements and all derivative positions are collateralized and derivatives positions are subject to master netting agreements, both of which significantly reduce the exposure to counterparty risk. In addition, we are subject to the risk that hedging and other risk management actions prove ineffective or that unanticipated policyholder behavior or mortality, combined with adverse market events, produces economic losses beyond the scope of the risk management techniques employed.
Liquidity and Capital Resources
Overview
Our business and results of operations are materially affected by conditions in the global capital markets and the economy generally due to our market presence in numerous countries, large investment portfolio and the sensitivity of our insurance liabilities and derivatives to changing market factors. Changing conditions in the global capital markets and the economy may affect our financing costs and market interest for our debt or equity securities. For further information regarding market factors that could affect our ability to meet liquidity and capital needs, see “— Industry Trends” and “— Investments — Current Environment.”
Liquidity Management
Based upon the strength of our franchise, diversification of our businesses, strong financial fundamentals and the substantial funding sources available to us as described herein, we continue to believe we have access to ample liquidity to meet business requirements under current market conditions and reasonably possible stress scenarios. We continuously monitor and adjust our liquidity and capital plans for MetLife, Inc. and its subsidiaries in light of market conditions, as well as changing needs and opportunities.
Short-term Liquidity
We maintain a substantial short-term liquidity position, which was $15.4 billion and $12.4 billion at September 30, 2022 and December 31, 2021, respectively. Short-term liquidity includes cash and cash equivalents and short-term investments, excluding assets that are pledged or otherwise committed, including amounts received in connection with securities lending, repurchase agreements, derivatives, and secured borrowings, as well as amounts held in the closed block.
Liquid Assets
An integral part of our liquidity management includes managing our level of liquid assets, which was $174.1 billion and $223.0 billion at September 30, 2022 and December 31, 2021, respectively. Liquid assets include cash and cash equivalents, short-term investments and publicly-traded securities, excluding assets that are pledged or otherwise committed. Assets pledged or otherwise committed include amounts received in connection with securities lending, repurchase agreements, derivatives, regulatory deposits, the collateral financing arrangement, funding agreements and secured borrowings, as well as amounts held in the closed block.
Capital Management
We have established several senior management committees as part of our capital management process. These committees, including the Capital Management Committee and the Enterprise Risk Committee (“ERC”), regularly review actual and projected capital levels (under a variety of scenarios including stress scenarios) and our annual capital plan in accordance with our capital policy. The Capital Management Committee is comprised of members of senior management, including MetLife, Inc.’s Chief Financial Officer (“CFO”), Treasurer, and Chief Risk Officer (“CRO”). The ERC is also comprised of members of senior management, including MetLife, Inc.’s CFO, CRO and Chief Investment Officer.
MetLife, Inc.’s Board of Directors (“Board of Directors”) and senior management are directly involved in the development and maintenance of our capital policy. The capital policy sets forth, among other things, minimum and target capital levels and the governance of the capital management process. All capital actions, including proposed changes to the annual capital plan, capital targets or capital policy, are reviewed by the Finance and Risk Committee of the Board of Directors prior to obtaining full Board of Directors approval. The Board of Directors approves the capital policy and the annual capital plan and authorizes capital actions, as required.
139
See “Risk Factors — Capital Risks — We May Not be Able to Pay Dividends or Repurchase Our Stock Due to Legal and Regulatory Restrictions or Cash Buffer Needs” and Note 16 of the Notes to the Consolidated Financial Statements included in the 2021 Annual Report for information regarding restrictions on payment of dividends and stock repurchases. See also “— The Company — Liquidity and Capital Uses — Common Stock Repurchases” for information regarding MetLife, Inc.’s common stock repurchase authorizations.
The Company
Liquidity
Liquidity refers to the ability to generate adequate amounts of cash to meet our needs. In the event of significant cash requirements beyond anticipated liquidity needs, we have various alternatives available depending on market conditions and the amount and timing of the liquidity need. These available alternatives include cash flows from operations, sales of liquid assets, global funding sources including commercial paper and various credit and committed facilities. See “Management’s Discussion and Analysis of Financial Condition — Liquidity and Capital Resources — The Company — Liquidity” included in the 2021 Annual Report.
Capital
We manage our capital position to maintain our financial strength and credit ratings. Our capital position is supported by our ability to generate strong cash flows within our operating companies and borrow funds at competitive rates, as well as by our demonstrated ability to raise additional capital to meet operating and growth needs despite adverse market and economic conditions.
Summary of the Company’s Primary Sources and Uses of Liquidity and Capital
Our primary sources and uses of liquidity and capital are summarized as follows:
|
Nine Months
Ended September 30, |
|||||||||||
| 2022 | 2021 | ||||||||||
| (In millions) | |||||||||||
|
Sources:
|
|||||||||||
| Operating activities, net | $ | 10,670 | $ | 7,256 | |||||||
| Net change in policyholder account balances | 4,593 | 4,041 | |||||||||
| Net change in payables for collateral under securities loaned and other transactions | — | 1,279 | |||||||||
| Long-term debt issued | 1,013 | 29 | |||||||||
| Financing element on certain derivative instruments and other derivative related transactions, net | — | 305 | |||||||||
| Other, net | — | 20 | |||||||||
| Total sources | 16,276 | 12,930 | |||||||||
|
Uses:
|
|||||||||||
| Investing activities, net | 2,423 | 8,325 | |||||||||
| Net change in payables for collateral under securities loaned and other transactions | 6,602 | — | |||||||||
| Cash paid for other transactions with tenors greater than three months | — | 100 | |||||||||
| Long-term debt repaid | 77 | 540 | |||||||||
| Collateral financing arrangement repaid | 37 | 39 | |||||||||
|
Treasury stock acquired in connection with share repurchases
|
2,730 | 3,127 | |||||||||
| Redemption of preferred stock | — | 494 | |||||||||
| Preferred stock redemption premium | — | 6 | |||||||||
|
Dividends on preferred stock
|
156 | 166 | |||||||||
|
Dividends on common stock
|
1,205 | 1,242 | |||||||||
| Other, net | 206 | — | |||||||||
|
Effect of change in foreign currency exchange rates on cash and cash equivalents
|
756 | 392 | |||||||||
|
Total uses
|
14,192 | 14,431 | |||||||||
| Net increase (decrease) in cash and cash equivalents | $ | 2,084 | $ | (1,501) | |||||||
140
Cash Flows from Operations
The principal cash inflows from our insurance activities come from insurance premiums, net investment income, annuity considerations and deposit funds. The principal cash outflows are the result of various life insurance, annuity and pension products, operating expenses and income tax, as well as interest expense.
Cash Flows from Investments
The principal cash inflows from our investment activities come from repayments of principal, proceeds from maturities and sales of investments and settlements of freestanding derivatives. The principal cash outflows relate to purchases of investments, issuances of policy loans and settlements of freestanding derivatives. In addition, cash inflows and outflows relate to sales and purchases of businesses. We typically have a net cash outflow from investing activities because cash inflows from insurance operations are reinvested in accordance with our ALM discipline to fund insurance liabilities. We closely monitor and manage these risks through our comprehensive investment risk management process.
Cash Flows from Financing
The principal cash inflows from our financing activities come from issuances of debt and other securities, deposits of funds associated with policyholder account balances and lending of securities. The principal cash outflows come from repayments of debt and the collateral financing arrangement, payments of dividends on and repurchases or redemptions of MetLife, Inc.’s securities, withdrawals associated with policyholder account balances and the return of securities on loan.
Liquidity and Capital Sources
In addition to the general description of liquidity and capital sources in “— Summary of the Company’s Primary Sources and Uses of Liquidity and Capital,” the Company’s primary sources of liquidity and capital are set forth below.
Global Funding Sources
Liquidity is provided by a variety of global funding sources, including funding agreements, credit and committed facilities and commercial paper. Capital is provided by a variety of global funding sources, including short-term and long-term debt, the collateral financing arrangement, junior subordinated debt securities, preferred securities, equity securities and equity-linked securities. MetLife, Inc. maintains a shelf registration statement with the SEC that permits the issuance of public debt, equity and hybrid securities. As a “Well-Known Seasoned Issuer” under SEC rules, MetLife, Inc.’s shelf registration statement provides for automatic effectiveness upon filing and has no stated issuance capacity. The diversity of our global funding sources enhances our funding flexibility, limits dependence on any one market or source of funds and generally lowers the cost of funds. Our primary global funding sources include:
Preferred Stock
See Note 16 of the Notes to the Consolidated Financial Statements included in the 2021 Annual Report.
Common Stock
For the nine months ended September 30, 2022 and 2021, MetLife, Inc. issued 3,067,435 and 4,478,479 new shares of its common stock, respectively, for $148 million and $180 million, respectively, to satisfy various stock option exercises and other stock-based awards.
Commercial Paper, Reported in Short-term Debt
MetLife, Inc. and MetLife Funding, Inc. (“MetLife Funding”), a subsidiary of MLIC, each have a commercial paper program that is supported by our unsecured revolving credit facility (see “— Credit and Committed Facilities”). MetLife Funding raises cash from its commercial paper program and uses the proceeds to extend loans through MetLife Credit Corp., another subsidiary of MLIC, to affiliates in order to enhance the financial flexibility and liquidity of these companies.
Policyholder Account Balances
See “Management’s Discussion and Analysis of Financial Condition and Results of Operations — Liquidity and Capital Resources — The Company — Liquidity and Capital Sources — Global Funding Sources — Policyholder Account Balances” included in the 2021 Annual Report for information regarding the Company’s contractual obligations related to future policy benefits and policyholder account balances.
141
Federal Home Loan Bank Funding Agreements, Reported in Policyholder Account Balances
Certain of our U.S. insurance subsidiaries are members of a regional Federal Home Loan Bank (“FHLB”). For the nine months ended September 30, 2022 and 2021, we issued $25.9 billion and $27.4 billion, respectively, and repaid $25.9 billion and $27.4 billion, respectively, of funding agreements with certain regional FHLBs. At both September 30, 2022 and December 31, 2021, total obligations outstanding under these funding agreements were $15.8 billion. See Note 4 of the Notes to the Consolidated Financial Statements included in the 2021 Annual Report.
Special Purpose Entity Funding Agreements, Reported in Policyholder Account Balances
We issue fixed and floating rate funding agreements, which are denominated in either U.S. dollars or foreign currencies, to certain unconsolidated special purpose entities that have issued either debt securities or commercial paper for which payment of interest and principal is secured by such funding agreements. For the nine months ended September 30, 2022 and 2021, we issued $39.7 billion and $32.1 billion, respectively, and repaid $38.3 billion and $31.1 billion, respectively, under such funding agreements. At September 30, 2022 and December 31, 2021, total obligations outstanding under these funding agreements were $39.7 billion and $39.5 billion, respectively. See Note 4 of the Notes to the Consolidated Financial Statements included in the 2021 Annual Report.
Federal Agricultural Mortgage Corporation Funding Agreements, Reported in Policyholder Account Balances
We have issued funding agreements to a subsidiary of the Federal Agricultural Mortgage Corporation which are secured by a pledge of certain eligible agricultural mortgage loans. For the nine months ended September 30, 2022 and 2021, we issued $625 million and $425 million, respectively, and repaid $625 million and $750 million, respectively, under such funding agreements. At both September 30, 2022 and December 31, 2021, total obligations outstanding under these funding agreements were $2.1 billion. See Note 4 of the Notes to the Consolidated Financial Statements included in the 2021 Annual Report.
Debt Issuances
See Note 9 of the Notes to the Interim Condensed Consolidated Financial Statements for information about senior notes issued by MetLife, Inc.
Credit and Committed Facilities
At September 30, 2022, we maintained a $3.0 billion unsecured revolving credit facility and certain committed facilities aggregating $3.2 billion, to which MetLife, Inc. is a party and/or guarantor. When drawn upon, these facilities bear interest at varying rates in accordance with the respective agreements.
The unsecured revolving credit facility is used for general corporate purposes, to support the borrowers’ commercial paper programs and for the issuance of letters of credit. At September 30, 2022, we had outstanding $263 million in letters of credit and no drawdowns against this facility. Remaining availability was $2.7 billion at September 30, 2022.
The committed facilities are used as collateral for certain of our affiliated reinsurance liabilities. At September 30, 2022, we had outstanding $2.8 billion in letters of credit and no drawdowns against these facilities. Remaining availability was $408 million at September 30, 2022.
See Note 13 of the Notes to the Consolidated Financial Statements included in the 2021 Annual Report for further information on credit and committed facilities.
We have no reason to believe that our lending counterparties will be unable to fulfill their respective contractual obligations under these facilities. As commitments under our credit and committed facilities may expire unused, these amounts do not necessarily reflect our actual future cash funding requirements.
142
Outstanding Debt Under Global Funding Sources
The following table summarizes our outstanding debt at:
| September 30, 2022 | December 31, 2021 | ||||||||||
| (In millions) | |||||||||||
| Short-term debt (1) | $ | 183 | $ | 341 | |||||||
| Long-term debt (2) | $ | 14,520 | $ | 13,933 | |||||||
| Collateral financing arrangement | $ | 729 | $ | 766 | |||||||
| Junior subordinated debt securities | $ | 3,158 | $ | 3,156 | |||||||
__________________
(1)
Includes $84 million and $241 million of debt that is non-recourse to MetLife, Inc. and MLIC, subject to customary exceptions, at September 30, 2022 and December 31, 2021, respectively. Certain subsidiaries have pledged assets to secure this debt.
(2)
Includes $447 million and $482 million of debt that is non-recourse to MetLife, Inc. and MLIC, subject to customary exceptions, at September 30, 2022 and December 31, 2021, respectively. Certain investment subsidiaries have pledged assets to secure this debt.
Debt and Facility Covenants
Certain of our debt instruments and committed facilities, as well as our unsecured revolving credit facility, contain various administrative, reporting, legal and financial covenants. We believe we were in compliance with all applicable financial covenants at September 30, 2022.
Dispositions
For information regarding the Company’s dispositions, see Note 3 of the Notes to the Interim Condensed Consolidated Financial Statements.
Liquidity and Capital Uses
In addition to the general description of liquidity and capital uses in “— Summary of the Company’s Primary Sources and Uses of Liquidity and Capital,” the Company’s primary uses of liquidity and capital are set forth below.
Preferred Stock Redemption
See Note 16 of the Notes to the Consolidated Financial Statements included in the 2021 Annual Report.
Common Stock Repurchases
See Note 10 of the Notes to the Interim Condensed Consolidated Financial Statements for information relating to authorizations by the Board of Directors to repurchase MetLife, Inc. common stock, amounts of common stock repurchased pursuant to such authorizations for the nine months ended September 30, 2022 and 2021, and the amount remaining under such authorizations at September 30, 2022.
Common stock repurchases are subject to the discretion of our Board of Directors and will depend upon our capital position, liquidity, financial strength and credit ratings, general market conditions, the market price of MetLife, Inc.’s common stock compared to management’s assessment of the stock’s underlying value, applicable regulatory approvals, and other legal and accounting factors. Restrictions on the payment of dividends that may arise under so-called “Dividend Stopper” provisions would also restrict MetLife, Inc.’s ability to repurchase common stock. See “— Dividends,” as well as “Business — Regulation,” “Risk Factors — Capital Risks — We May Not be Able to Pay Dividends or Repurchase Our Stock Due to Legal and Regulatory Restrictions or Cash Buffer Needs” and Note 16 of the Notes to the Consolidated Financial Statements included in the 2021 Annual Report.
Dividends
For the nine months ended September 30, 2022 and 2021, MetLife, Inc. paid dividends on its preferred stock of $156 million and $166 million, respectively. For each of the nine months ended September 30, 2022 and 2021, MetLife, Inc. paid dividends on its common stock of $1.2 billion. See Note 10 of the Notes to the Interim Condensed Consolidated Financial Statements, as well as Note 16 of the Notes to the Consolidated Financial Statements included in the 2021 Annual Report for information regarding the calculation and timing of these dividend payments.
143
The declaration and payment of common stock dividends are subject to the discretion of our Board of Directors, and will depend on MetLife, Inc.’s financial condition, results of operations, cash requirements, future prospects, regulatory restrictions on the payment of dividends by MetLife, Inc.’s insurance subsidiaries and other factors deemed relevant by the Board of Directors. See Note 16 of the Notes to the Consolidated Financial Statements included in the 2021 Annual Report for additional information.
Dividend Restrictions
The payment of dividends is also subject to restrictions under the terms of our preferred stock and junior subordinated debentures in situations where we may be experiencing financial stress. See “Management’s Discussion and Analysis of Financial Condition and Results of Operations — Liquidity and Capital Resources — The Company — Liquidity and Capital Uses — Dividends — ‘Dividend Stopper’ Provisions in MetLife’s Preferred Stock and Junior Subordinated Debentures,” “Risk Factors — Capital Risks — We May Not be Able to Pay Dividends or Repurchase Our Stock Due to Legal and Regulatory Restrictions or Cash Buffer Needs” and Note 16 of the Notes to the Consolidated Financial Statements included in the 2021 Annual Report.
Debt Repayments
For the nine months ended September 30, 2022 and 2021, following regulatory approval, MetLife Reinsurance Company of Charleston, a wholly-owned subsidiary of MetLife, Inc., repurchased and canceled $37 million and $39 million, respectively, in aggregate principal amount of its surplus notes, which were reported in collateral financing arrangement on the interim condensed consolidated balance sheets.
Debt Repurchases, Redemptions and Exchanges
We may from time to time seek to retire or purchase our outstanding debt through cash purchases, redemptions and/or exchanges for other securities, in open market purchases, privately negotiated transactions or otherwise. Any such repurchases, redemptions, or exchanges will be dependent upon several factors, including our liquidity requirements, contractual restrictions, general market conditions, and applicable regulatory, legal and accounting factors. Whether or not to repurchase or redeem any debt and the size and timing of any such repurchases or redemptions will be determined at our discretion.
Support Agreements
MetLife, Inc. and several of its subsidiaries (each, an “Obligor”) are parties to various capital support commitments and guarantees with subsidiaries. Under these arrangements, each Obligor has agreed to cause the applicable entity to meet specified capital and surplus levels or has guaranteed certain contractual obligations. We anticipate that in the event these arrangements place demands upon us, there will be sufficient liquidity and capital to enable us to meet such demands. See Note 5 of the Notes to the MetLife, Inc. (Parent Company Only) Condensed Financial Information included in the 2021 Annual Report.
Insurance Liabilities
Liabilities arising from our insurance activities primarily relate to benefit payments under various life insurance, annuity and group pension products, as well as payments for policy surrenders, withdrawals and loans. For annuity or deposit type products, surrender or lapse behavior differs somewhat by segment. In the MetLife Holdings segment, which includes individual annuities, lapses and surrenders tend to occur in the normal course of business. For the nine months ended September 30, 2022 and 2021, general account surrenders and withdrawals from annuity products were $998 million and $971 million, respectively. In the RIS business within the U.S. segment, which includes pension risk transfers, bank-owned life insurance and other fixed annuity contracts, as well as funding agreements and other capital market products, most of the products offered have fixed maturities or fairly predictable surrenders or withdrawals. With regard to the RIS business products that provide customers with limited rights to accelerate payments, at September 30, 2022 there were funding agreements totaling $126 million that could be put back to the Company. See “Management’s Discussion and Analysis of Financial Condition and Results of Operations — Liquidity and Capital Resources — The Company — Liquidity and Capital Uses — Insurance Liabilities” included in the 2021 Annual Report for additional information.
144
Pledged Collateral
We pledge collateral to, and have collateral pledged to us by, counterparties in connection with our derivatives. At September 30, 2022 and December 31, 2021, we had received pledged cash collateral from counterparties of $8.3 billion and $7.5 billion, respectively. At September 30, 2022 and December 31, 2021, we had pledged cash collateral to counterparties of $302 million and $142 million, respectively. See Note 7 of the Notes to the Interim Condensed Consolidated Financial Statements for additional information about collateral pledged to us, collateral we pledge and derivatives subject to credit contingent provisions.
We pledge collateral and have had collateral pledged to us, and may be required from time to time to pledge additional collateral or be entitled to have additional collateral pledged to us, in connection with the collateral financing arrangement related to the reinsurance of closed block liabilities.
We pledge collateral from time to time in connection with funding agreements and advance agreements. See Note 6 of the Notes to the Interim Condensed Consolidated Financial Statements, as well as Note 4 of the Notes to the Consolidated Financial Statements included in the 2021 Annual Report.
Securities Lending Transactions, Repurchase Agreements and Third-Party Custodian Administered Programs
See “— Investments — Securities Lending Transactions, Repurchase Agreements and Third-Party Custodian Administered Programs.”
Litigation
We establish liabilities for litigation and regulatory loss contingencies when it is probable that a loss has been incurred and the amount of the loss can be reasonably estimated. For material matters where a loss is believed to be reasonably possible but not probable, no accrual is made but we disclose the nature of the contingency and an aggregate estimate of the reasonably possible range of loss in excess of amounts accrued, when such an estimate can be made. It is not possible to predict the ultimate outcome of all pending investigations and legal proceedings. In some of the matters referred to herein, very large and/or indeterminate amounts, including punitive and treble damages, are sought. Given the large and/or indeterminate amounts sought in certain of these matters and the inherent unpredictability of litigation, it is possible that an adverse outcome in certain matters could, from time to time, have a material adverse effect on our consolidated net income or cash flows in particular quarterly or annual periods. See Note 15 of the Notes to the Interim Condensed Consolidated Financial Statements.
MetLife, Inc.
Liquidity and Capital Management
Liquidity and capital are managed to preserve stable, reliable and cost-effective sources of cash to meet all current and future financial obligations and are provided by a variety of sources, including a portfolio of liquid assets, a diversified mix of short- and long-term funding sources from the wholesale financial markets and the ability to borrow through credit and committed facilities. Liquidity is monitored through the use of internal liquidity risk metrics, including the composition and level of the liquid asset portfolio, timing differences in short-term cash flow obligations, access to the financial markets for capital and debt transactions and exposure to contingent draws on MetLife, Inc.’s liquidity. MetLife, Inc. is an active participant in the global financial markets through which it obtains a significant amount of funding. These markets, which serve as cost-effective sources of funds, are critical components of MetLife, Inc.’s liquidity and capital management. Decisions to access these markets are based upon relative costs, prospective views of balance sheet growth and a targeted liquidity profile and capital structure. A disruption in the financial markets could limit MetLife, Inc.’s access to liquidity.
MetLife, Inc.’s ability to maintain regular access to competitively priced wholesale funds is fostered by its current credit ratings from the major credit rating agencies. We view our capital ratios, credit quality, stable and diverse earnings streams, diversity of liquidity sources and our liquidity monitoring procedures as critical to retaining such credit ratings. See “Management’s Discussion and Analysis of Financial Condition and Results of Operations — Liquidity and Capital Resources — The Company — Rating Agencies” included in the 2021 Annual Report.
Liquidity
For a summary of MetLife, Inc.’s liquidity, see “— The Company — Liquidity.”
Capital
For a summary of MetLife, Inc.’s capital, see “— The Company — Capital.” See also “— The Company — Liquidity and Capital Uses — Common Stock Repurchases” for information regarding MetLife, Inc.’s common stock repurchases.
145
Liquid Assets
At September 30, 2022 and December 31, 2021, MetLife, Inc., collectively with other MetLife holding companies, had $5.2 billion and $5.4 billion, respectively, in liquid assets. Of these amounts, $4.0 billion and $4.2 billion were held by MetLife, Inc. and $1.2 billion and $1.2 billion were held by other MetLife holding companies at September 30, 2022 and December 31, 2021, respectively. Liquid assets include cash and cash equivalents, short-term investments and publicly-traded securities, excluding assets that are pledged or otherwise committed. Assets pledged or otherwise committed include amounts received in connection with derivatives and a collateral financing arrangement.
See “Management’s Discussion and Analysis of Financial Condition and Results of Operations — Liquidity and Capital Resources — MetLife, Inc. — Liquid Assets” included in the 2021 Annual Report for additional information on the sources and uses of liquid assets, as well as sources and uses of liquid assets included in free cash flow for MetLife, Inc. and other MetLife holding companies.
Liquidity and Capital Sources
In addition to the description of liquidity and capital sources in “— The Company — Summary of the Company’s Primary Sources and Uses of Liquidity and Capital” and “— The Company — Liquidity and Capital Sources,” MetLife, Inc.’s primary sources of liquidity and capital are set forth below.
Dividends from Subsidiaries
MetLife, Inc. relies, in part, on dividends from its subsidiaries to meet its cash requirements. MetLife, Inc.’s insurance subsidiaries are subject to regulatory restrictions on the payment of dividends imposed by the regulators of their respective domiciles. The dividend limitation for U.S. insurance subsidiaries is generally based on the surplus to policyholders at the end of the immediately preceding calendar year and statutory net gain from operations for the immediately preceding calendar year. Statutory accounting practices, as prescribed by insurance regulators of various states in which we conduct business, differ in certain respects from accounting principles used in financial statements prepared in conformity with GAAP. The significant differences relate to the treatment of DAC, certain deferred income tax, required investment liabilities, statutory reserve calculation assumptions, goodwill and surplus notes.
The table below sets forth the dividends permitted to be paid in 2022 by MetLife, Inc.’s primary U.S. insurance subsidiaries without insurance regulatory approval and the actual dividends paid for the nine months ended September 30, 2022:
| Company | Paid (1) |
Permitted Without
Approval (2) |
||||||||||||
| (In millions) | ||||||||||||||
| Metropolitan Life Insurance Company | $ | 2,539 | $ | 3,539 | ||||||||||
| American Life Insurance Company | $ | 620 | $ | 554 | ||||||||||
| Metropolitan Tower Life Insurance Company | $ | — | $ | 163 | ||||||||||
__________________
(1)
Reflects all amounts paid, including those where regulatory approval was obtained as required.
(2)
Reflects dividend amounts that may be paid during 2022 without prior regulatory approval. However, because dividend tests may be based on dividends previously paid over rolling 12-month periods, if paid before a specified date during 2022, some or all of such dividends may require regulatory approval.
In addition to the amounts presented in the table above, for the nine months ended September 30, 2022, MetLife, Inc. also received from certain other subsidiaries cash dividends of $64 million, as well as cash returns of capital of $8 million.
The dividend capacity of our non-U.S. operations is subject to similar restrictions established by the local regulators. The non-U.S. regulatory regimes also commonly limit dividend payments to the parent company to a portion of the subsidiary’s prior year statutory income, as determined by the local accounting principles. The regulators of our non-U.S. operations, including Japan’s Financial Services Agency, may also limit or not permit profit repatriations or other transfers of funds to the U.S. if such transfers are deemed to be detrimental to the solvency or financial strength of the non-U.S. operations, or for other reasons. Most of our non-U.S. subsidiaries are second tier subsidiaries which are owned by various non-U.S. holding companies. The capital and rating considerations applicable to our first tier subsidiaries may also impact the dividend flow into MetLife, Inc.
146
We proactively manage target and excess capital levels and dividend flows and forecast local capital positions as part of the financial planning cycle. The dividend capacity of certain U.S. and non-U.S. subsidiaries is also subject to business targets in excess of the minimum capital necessary to maintain the desired rating or level of financial strength in the relevant market. See “Risk Factors — Capital Risks — Our Subsidiaries May be Unable to Pay Dividends, a Major Component of Holding Company Free Cash Flow” and Note 16 of the Notes to the Consolidated Financial Statements included in the 2021 Annual Report.
Credit and Committed Facilities
See “— The Company — Liquidity and Capital Sources — Global Funding Sources — Credit and Committed Facilities” for further information regarding the Company’s unsecured revolving credit facility and certain committed facilities.
Long-term Debt Outstanding
The following table summarizes the outstanding long-term debt of MetLife, Inc. at:
| September 30, 2022 | December 31, 2021 | ||||||||||
| (In millions) | |||||||||||
| Long-term debt — unaffiliated | $ | 13,454 | $ | 12,814 | |||||||
|
Long-term debt — affiliated
|
$ | 1,550 | $ | 1,884 | |||||||
| Junior subordinated debt securities | $ | 2,465 | $ | 2,463 | |||||||
Debt and Facility Covenants
Certain of MetLife, Inc.’s debt instruments and committed facilities, as well as its unsecured revolving credit facility, contain various administrative, reporting, legal and financial covenants. MetLife, Inc. believes it was in compliance with all applicable financial covenants at September 30, 2022.
Liquidity and Capital Uses
The primary uses of liquidity of MetLife, Inc. include debt service, cash dividends on common and preferred stock, capital contributions to subsidiaries, common stock, preferred stock and debt repurchases and/or redemptions, payment of general operating expenses and acquisitions. Based on our analysis and comparison of our current and future cash inflows from the dividends we receive from subsidiaries that are permitted to be paid without prior insurance regulatory approval, our investment portfolio and other cash flows and anticipated access to the capital markets, we believe there will be sufficient liquidity and capital to enable MetLife, Inc. to make payments on debt, pay cash dividends on its common and preferred stock, contribute capital to its subsidiaries, repurchase its common stock and certain of its other securities, pay all general operating expenses and meet its cash needs under current market conditions and reasonably possible stress scenarios.
In addition to the description of liquidity and capital uses in “— The Company — Liquidity and Capital Uses,” MetLife, Inc.’s primary uses of liquidity and capital are set forth below.
Affiliated Capital and Debt Transactions
For the nine months ended September 30, 2022 and 2021, MetLife, Inc. invested a net amount of $12 million and $118 million, respectively, in various subsidiaries.
MetLife, Inc. lends funds, as necessary, through credit agreements or otherwise to its subsidiaries and affiliates, some of which are regulated, to meet their capital requirements or to provide liquidity. MetLife, Inc. had loans to subsidiaries outstanding of $35 million at both September 30, 2022 and December 31, 2021.
Support Agreements
MetLife, Inc. is party to various capital support commitments and guarantees with certain of its subsidiaries. Under these arrangements, MetLife, Inc. has agreed to cause each such entity to meet specified capital and surplus levels or has guaranteed certain contractual obligations. See “— The Company — Liquidity and Capital Uses — Support Agreements.”
Adopted Accounting Pronouncements
See Note 1 of the Notes to the Interim Condensed Consolidated Financial Statements.
147
Future Adoption of Accounting Pronouncements
See Note 1 of the Notes to the Interim Condensed Consolidated Financial Statements.
Non-GAAP and Other Financial Disclosures
In this report, the Company presents certain measures of its performance on a consolidated and segment basis that are not calculated in accordance with GAAP. We believe that these non-GAAP financial measures enhance the understanding for the Company and our investors of our performance by highlighting the results of operations and the underlying profitability drivers of our business. Segment-specific financial measures are calculated using only the portion of consolidated results attributable to that specific segment.
The following non-GAAP financial measures should not be viewed as substitutes for the most directly comparable financial measures calculated in accordance with GAAP:
| Non-GAAP financial measures: | Comparable GAAP financial measures: | ||||||||||
| (i) |
adjusted premiums, fees and other revenues
|
(i) |
premiums, fees and other revenues
|
||||||||
| (ii) | adjusted earnings | (ii) | net income (loss) | ||||||||
| (iii) |
adjusted earnings available to common
shareholders |
(iii) | net income (loss) available to MetLife, Inc.’s common shareholders | ||||||||
| (iv) | adjusted net investment income | (iv) | net investment income | ||||||||
Any of these financial measures shown on a constant currency basis reflect the impact of changes in foreign currency exchange rates and are calculated using the average foreign currency exchange rates for the most recent period and applied to the comparable prior period (“constant currency basis”).
Reconciliations of these non-GAAP financial measures to the most directly comparable historical GAAP financial measures are included in “— Results of Operations” and “— Investments.” Reconciliations of these non-GAAP measures to the most directly comparable GAAP measures are not accessible on a forward-looking basis because we believe it is not possible without unreasonable effort to provide other than a range of net investment gains and losses and net derivative gains and losses, which can fluctuate significantly within or outside the range and from period to period and may have a material impact on net income.
Our definitions of non-GAAP and other financial measures discussed in this report may differ from those used by other companies.
Adjusted earnings and related measures:
•
adjusted earnings;
•
adjusted earnings available to common shareholders; and
•
adjusted earnings available to common shareholders on a constant currency basis.
These measures are used by management to evaluate performance and allocate resources. Consistent with GAAP guidance for segment reporting, adjusted earnings and components of, or other financial measures based on, adjusted earnings are also our GAAP measures of segment performance. Adjusted earnings and other financial measures based on adjusted earnings are also the measures by which senior management’s and many other employees’ performance is evaluated for the purposes of determining their compensation under applicable compensation plans. Adjusted earnings and other financial measures based on adjusted earnings allow analysis of our performance relative to our business plan and facilitate comparisons to industry results.
Adjusted earnings is defined as adjusted revenues less adjusted expenses, net of income tax. Adjusted loss is defined as negative adjusted earnings. Adjusted earnings available to common shareholders is defined as adjusted earnings less preferred stock dividends. For information relating to adjusted revenues and adjusted expenses, see “Financial Measures and Segment Accounting Policies” in Note 2 of the Notes to the Interim Condensed Consolidated Financial Statements.
In addition, adjusted earnings available to common shareholders excludes the impact of preferred stock redemption premium, which is reported as a reduction to net income (loss) available to MetLife, Inc.’s common shareholders.
148
Return on equity, allocated equity and related measures:
•
Total MetLife, Inc.’s common stockholders’ equity, excluding accumulated other comprehensive income (“AOCI”) other than foreign currency translation adjustments (“FCTA”), is defined as total MetLife, Inc.’s common stockholders’ equity, excluding the net unrealized investment gains (losses) and defined benefit plans adjustment components of AOCI, net of income tax.
•
Adjusted return on MetLife, Inc.’s common stockholders’ equity is defined as adjusted earnings available to common shareholders divided by MetLife, Inc.’s average common stockholders’ equity.
•
Adjusted return on MetLife, Inc.’s common stockholders’ equity, excluding AOCI other than FCTA, is defined as adjusted earnings available to common shareholders divided by MetLife, Inc.’s average common stockholders’ equity, excluding AOCI other than FCTA.
•
Allocated equity is the portion of MetLife, Inc.’s common stockholders’ equity that management allocates to each of its segments and sub-segments based on local capital requirements and economic capital. See “Management’s Discussion and Analysis of Financial Condition and Results of Operations — Risk Management — Economic Capital” in the 2021 Annual Report. Allocated equity excludes the impact of AOCI other than FCTA.
The above measures represent a level of equity consistent with the view that, in the ordinary course of business, we do not plan to sell most investments for the sole purpose of realizing gains or losses.
Expense ratio and direct expense ratio:
•
Expense ratio: other expenses, net of capitalization of DAC, divided by premiums, fees and other revenues.
•
Direct expense ratio: adjusted direct expenses divided by adjusted premiums, fees and other revenues. Direct expenses are comprised of employee-related costs, third party staffing costs, and general and administrative expenses.
•
Direct expense ratio, excluding total notable items related to direct expenses and pension risk transfers: adjusted direct expenses excluding total notable items related to direct expenses, divided by adjusted premiums, fees and other revenues, excluding pension risk transfers.
The following additional information is relevant to an understanding of our performance results and outlook:
•
We sometimes refer to sales activity for various products. These sales statistics do not correspond to revenues under GAAP, but are used as relevant measures of business activity. Further, sales statistics for our Latin America, Asia and EMEA segments are on a constant currency basis.
•
Near-term represents one to three years.
•
Notable items reflect the unexpected impact of events that affect the Company’s results, but that were unknown and that the Company could not anticipate when it devised its business plan. Notable items also include certain items regardless of the extent anticipated in the business plan, to help investors have a better understanding of MetLife’s results and to evaluate and forecast those results. Notable items represent a positive (negative) impact to adjusted earnings available to common shareholders.
•
The Company uses a measure of free cash flow to facilitate an understanding of its ability to generate cash for reinvestment into its businesses or use in non-mandatory capital actions. The Company defines free cash flow as the sum of cash available at MetLife’s holding companies from dividends from operating subsidiaries, expenses and other net flows of the holding companies (including capital contributions to subsidiaries), and net contributions from debt to be at or below target leverage ratios. This measure of free cash flow is prior to capital actions, such as common stock dividends and repurchases, debt reduction and mergers and acquisitions. Free cash flow should not be viewed as a substitute for net cash provided by (used in) operating activities calculated in accordance with GAAP. The free cash flow ratio is typically expressed as a percentage of annual adjusted earnings available to common shareholders.
Risk Management
See “Management’s Discussion and Analysis of Financial Condition and Results of Operations — Risk Management” in the 2021 Annual Report for information on our risk management.
149
Item 3. Quantitative and Qualitative Disclosures About Market Risk
We regularly analyze our exposure to interest rate, equity market price and foreign currency exchange rate risks. As a result of that analysis, we have determined that the estimated fair values of certain assets and liabilities are materially exposed to changes in interest rates, foreign currency exchange rates and changes in the equity markets. We have exposure to such market risks through our insurance operations and investment activities. We use a variety of strategies to manage these risks, including the use of derivatives. A description of our market risk exposures may be found under “Quantitative and Qualitative Disclosures About Market Risk” included in the 2021 Annual Report. Further, our exposure to these market risks is expected to remain elevated due to the COVID-19 pandemic. See “Management’s Discussion and Analysis of Financial Condition and Results of Operations — Executive Summary — COVID-19 Pandemic.”
150
Item 4. Controls and Procedures
Management, with the participation of the Chief Executive Officer (“CEO”) and CFO, has evaluated the effectiveness of the design and operation of the Company’s disclosure controls and procedures as defined in Rule 13a-15(e) under the Securities Exchange Act of 1934 (“Exchange Act”), as of the end of the period covered by this report. Based on that evaluation, the CEO and CFO have concluded that these disclosure controls and procedures are effective.
There were no changes to the Company’s internal control over financial reporting as defined in Exchange Act Rule 13a-15(f) during the quarter ended September 30, 2022 that have materially affected, or are reasonably likely to materially affect, the Company’s internal control over financial reporting.
151
Part II — Other Information
Item 1. Legal Proceedings
See Note 15 of the Notes to the Interim Condensed Consolidated Financial Statements.
Item 1A. Risk Factors
Certain factors that may affect the Company’s business or operations are described under “Risk Factors” in Part I, Item 1A, of the 2021 Annual Report. There have been no material changes to our risk factors from the risk factors previously disclosed in the 2021 Annual Report.
Item 2. Unregistered Sales of Equity Securities and Use of Proceeds
Issuer Purchases of Equity Securities
Purchases of MetLife, Inc. common stock made by or on behalf of MetLife, Inc. or its affiliates during the quarter ended September 30, 2022 are set forth below:
| Period |
Total Number
of Shares Purchased (1) |
Average Price Paid per Share |
Total Number
of Shares Purchased as Part of Publicly Announced Plans or Programs |
Maximum Number
(or Approximate Dollar Value) of Shares that May Yet Be Purchased Under the Plans or Programs (2) |
||||||||||||||||||||||
| July 1 — July 31, 2022 | — | $ | — | — | $ | 2,475,053,649 | ||||||||||||||||||||
| August 1 — August 31, 2022 | 4,207,063 | $ | 66.12 | 4,207,063 | $ | 2,196,884,590 | ||||||||||||||||||||
| September 1 — September 30, 2022 | 6,120,545 | $ | 64.60 | 6,120,545 | $ | 1,801,514,554 | ||||||||||||||||||||
| Total | 10,327,608 | 10,327,608 | ||||||||||||||||||||||||
__________________
(1)
During the periods July 1 — July 31, 2022, August 1 — August 31, 2022 and September 1 — September 30, 2022, there were no purchases by separate account index funds of MetLife, Inc. common stock on the open market in non-discretionary transactions.
(2)
In May 2022, MetLife, Inc. announced that its Board of Directors authorized $3.0 billion of common stock repurchases. At September 30, 2022, MetLife, Inc. had $1.8 billion of common stock repurchases remaining under the authorization. For more information on common stock repurchases, see “Management’s Discussion and Analysis of Financial Condition and Results of Operations — Liquidity and Capital Resources — The Company — Liquidity and Capital Uses — Common Stock Repurchases” and Note 10 of the Notes to the Interim Condensed Consolidated Financial Statements. See also “Risk Factors — Capital Risks — We May Not be Able to Pay Dividends or Repurchase Our Stock Due to Legal and Regulatory Restrictions or Cash Buffer Needs” included in the 2021 Annual Report.
152
Item 6. Exhibits
(Note Regarding Reliance on Statements in Our Contracts:
In reviewing the agreements included as exhibits to this Quarterly Report on Form 10-Q, please remember that they are included to provide you with information regarding their terms and are not intended to provide any other factual or disclosure information about MetLife, Inc., its subsidiaries or affiliates, or the other parties to the agreements. The agreements contain representations and warranties by each of the parties to the applicable agreement. These representations and warranties have been made solely for the benefit of the other parties to the applicable agreement and (i) should not in all instances be treated as categorical statements of fact, but rather as a way of allocating the risk to one of the parties if those statements prove to be inaccurate; (ii) have been qualified by disclosures that were made to the other party in connection with the negotiation of the applicable agreement, which disclosures are not necessarily reflected in the agreement; (iii) may apply standards of materiality in a way that is different from what may be viewed as material to investors; and (iv) were made only as of the date of the applicable agreement or such other date or dates as may be specified in the agreement and are subject to more recent developments. Accordingly, these representations and warranties may not describe the actual state of affairs as of the date they were made or at any other time. Additional information about MetLife, Inc., its subsidiaries and affiliates may be found elsewhere in this Quarterly Report on Form 10-Q and MetLife, Inc.’s other public filings, which are available without charge through the U.S. Securities and Exchange Commission website at www.sec.gov.)
| Incorporated by Reference | ||||||||||||||||||||||||||||||||||||||
| Exhibit No. | Description | Form | File Number | Exhibit | Filing Date | Filed or Furnished Herewith | ||||||||||||||||||||||||||||||||
| 4.1 | Certain instruments defining the rights of holders of long-term debt of MetLife, Inc. and its consolidated subsidiaries are omitted pursuant to Item 601(b)(4)(iii) of Regulation S-K. MetLife, Inc. hereby agrees to furnish to the Securities and Exchange Commission, upon request, copies of such instruments. | |||||||||||||||||||||||||||||||||||||
| 31.1 | X | |||||||||||||||||||||||||||||||||||||
| 31.2 | X | |||||||||||||||||||||||||||||||||||||
| 32.1 | X | |||||||||||||||||||||||||||||||||||||
| 32.2 | X | |||||||||||||||||||||||||||||||||||||
| 101.SCH | Inline XBRL Taxonomy Extension Schema Document. | X | ||||||||||||||||||||||||||||||||||||
| 101.CAL | Inline XBRL Taxonomy Extension Calculation Linkbase Document | X | ||||||||||||||||||||||||||||||||||||
| 101.DEF | Inline XBRL Taxonomy Extension Definition Linkbase Document | X | ||||||||||||||||||||||||||||||||||||
| 101.LAB | Inline XBRL Taxonomy Extension Label Linkbase Document | X | ||||||||||||||||||||||||||||||||||||
| 101.PRE | Inline XBRL Taxonomy Extension Presentation Linkbase Document. | X | ||||||||||||||||||||||||||||||||||||
| 101.INS | XBRL Instance Document - the instance document does not appear in the Interactive Data file because its XBRL tags are embedded within the Inline XBRL document. | X | ||||||||||||||||||||||||||||||||||||
| 104 |
Cover Page Interactive Data File (embedded within the Inline XBRL document and included in Exhibit 101).
|
X | ||||||||||||||||||||||||||||||||||||
153
Signatures
Pursuant to the requirements of the Securities Exchange Act of 1934, the registrant has duly caused this report to be signed on its behalf by the undersigned thereunto duly authorized.
| METLIFE, INC. | ||||||||
| By: | /s/ Tamara L. Schock | |||||||
|
Name: Tamara L. Schock
Title: Executive Vice President
and Chief Accounting Officer
(Authorized Signatory and Principal
Accounting Officer)
|
||||||||
Date: November 3, 2022
154
TABLE OF CONTENTS
Part I Financial InformationItem 1. Financial StatementsItem 2. Management S Discussion and Analysis Of Financial Condition and Results Of OperationsItem 3. Quantitative and Qualitative Disclosures About Market RiskItem 4. Controls and ProceduresPart II Other InformationItem 1. Legal ProceedingsItem 1A. Risk FactorsItem 2. Unregistered Sales Of Equity Securities and Use Of ProceedsItem 6. Exhibits