META PLATFORMS, INC.
10-Ks and 10-Qs
|
|
|
|
|
|
|
|
|
|
|
|
|
|
|
|
|
|
|
|
|
|
|
|
|
|
|
|
|
|
|
|
|
|
|
|
|
|
|
|
|
|
|
|
|
|
|
UNITED STATES
SECURITIES AND EXCHANGE COMMISSION
Washington, D.C. 20549
__________________________
FORM 10-K
__________________________
(Mark One)
|
x
|
ANNUAL REPORT PURSUANT TO SECTION 13 OR 15(d) OF THE SECURITIES EXCHANGE ACT OF 1934
|
For the fiscal year ended
December 31, 2013
or
|
¨
|
TRANSITION REPORT PURSUANT TO SECTION 13 OR 15(d) OF THE SECURITIES EXCHANGE ACT OF 1934
|
For the transition period from to
Commission File Number: 001-35551
__________________________
FACEBOOK, INC.
(Exact name of registrant as specified in its charter)
__________________________
|
Delaware
|
20-1665019
|
|
(State or other jurisdiction of incorporation or organization)
|
(I.R.S. Employer Identification Number)
|
1601 Willow Road, Menlo Park, California 94025
(Address of principal executive offices and Zip Code)
(650) 543-4800
(Registrant's telephone number, including area code)
__________________________
Securities registered pursuant to Section 12(b) of the Act:
|
Class A Common Stock, $0.000006 par value
|
The NASDAQ Stock Market LLC
|
|
(Title of each class)
|
(Name of each exchange on which registered)
|
Securities registered pursuant to Section 12(g) of the Act:
None
(Title of class)
Indicate by check mark if the registrant is a well-known seasoned issuer, as defined in Rule 405 of the Securities Act. Yes
x
No
¨
Indicate by check mark if the registrant is not required to file reports pursuant to Section 13 or Section 15(d) of the Act. Yes
¨
No
x
Indicate by check mark whether the registrant (1) has filed all reports required to be filed by Section 13 or 15(d) of the Securities Exchange Act of 1934 (Exchange Act) during the preceding 12 months (or for such shorter period that the registrant was required to file such reports), and (2) has been subject to such filing requirements for the past 90 days. Yes
x
No
¨
Indicate by check mark whether the registrant has submitted electronically and posted on its corporate Website, if any, every Interactive Data File required to be submitted and posted pursuant to Rule 405 of Regulation S-T (§ 232.405 of this chapter) during the preceding 12 months (or for such shorter period that the registrant was required to submit and post such files). Yes
x
No
¨
Indicate by check mark if disclosure of delinquent filers pursuant to Item 405 of Regulation S-K (§ 229.405 of this chapter) is not contained herein, and will not be contained, to the best of registrant's knowledge, in definitive proxy or information statements incorporated by reference in Part III of this Form 10-K or any amendment to this Form 10-K.
¨
Indicate by check mark whether the registrant is a large accelerated filer, an accelerated filer, a non-accelerated filer, or a smaller reporting company. See definition of "large accelerated filer," "accelerated filer" and "smaller reporting company" in Rule 12b-2 of the Exchange Act. (Check one):
|
Large accelerated filer
|
x
|
Accelerated filer
|
¨
|
|
Non-accelerated filer
|
¨
(Do not check if a smaller reporting company)
|
Smaller reporting company
|
¨
|
Indicate by check mark whether the registrant is a shell company (as defined in Rule 12b-2 of the Exchange Act). Yes
¨
No
x
The aggregate market value of the voting and non-voting stock held by non-affiliates of the registrant as of
June 28, 2013
, the last business day of the registrant's most recently completed second fiscal quarter, was
$49,067,097,971
based upon the closing price reported for such date on the NASDAQ Global Select Market.
On
January 28, 2014
, the registrant had
1,975,722,473
shares of Class A common stock and
574,020,314
shares of Class B common stock outstanding.
DOCUMENTS INCORPORATED BY REFERENCE
Portions of the registrant's Proxy Statement for the
2014
Annual Meeting of Stockholders are incorporated herein by reference in Part III of this Annual Report on Form 10-K to the extent stated herein. Such proxy statement will be filed with the Securities and Exchange Commission within 120 days of the registrant's fiscal year ended
December 31, 2013
.
FACEBOOK, INC.
FORM 10-K
TABLE OF CONTENTS
2
NOTE ABOUT FORWARD-LOOKING STATEMENTS
This Annual Report on Form 10-K contains forward-looking statements within the meaning of the Private Securities Litigation Reform Act of 1995. All statements contained in this Annual Report on Form 10-K other than statements of historical fact, including statements regarding our future results of operations and financial position, our business strategy and plans, and our objectives for future operations, are forward-looking statements. The words "believe," "may," "will," "estimate," "continue," "anticipate," "intend," "expect," and similar expressions are intended to identify forward-looking statements. We have based these forward-looking statements largely on our current expectations and projections about future events and trends that we believe may affect our financial condition, results of operations, business strategy, short-term and long-term business operations and objectives, and financial needs. These forward-looking statements are subject to a number of risks, uncertainties and assumptions, including those described in Part I, Item 1A, "Risk Factors" in this Annual Report on Form 10-K. Moreover, we operate in a very competitive and rapidly changing environment. New risks emerge from time to time. It is not possible for our management to predict all risks, nor can we assess the impact of all factors on our business or the extent to which any factor, or combination of factors, may cause actual results to differ materially from those contained in any forward-looking statements we may make. In light of these risks, uncertainties and assumptions, the future events and trends discussed in this Annual Report on Form 10-K may not occur and actual results could differ materially and adversely from those anticipated or implied in the forward-looking statements.
We undertake no obligation to revise or publicly release the results of any revision to these forward-looking statements, except as required by law. Given these risks and uncertainties, readers are cautioned not to place undue reliance on such forward-looking statements.
Unless expressly indicated or the context requires otherwise, the terms "Facebook," "company," "we," "us," and "our" in this document refer to Facebook, Inc., a Delaware corporation, and, where appropriate, its wholly owned subsidiaries. The term "Facebook" may also refer to our products, regardless of the manner in which they are accessed. For references to accessing Facebook on the "web" or via a "website," such terms refer to accessing Facebook on desktop or personal computers. For references to accessing Facebook on "mobile," such term refers to accessing Facebook via a mobile application or via a mobile-optimized version of our website such as m.facebook.com, whether on a mobile phone or tablet.
3
LIMITATIONS OF KEY METRICS AND OTHER DATA
The numbers for our key metrics, which include our daily active users (DAUs), mobile DAUs, monthly active users (MAUs), mobile MAUs, and average revenue per user (ARPU), as well as certain other metrics such as mobile-only DAUs and mobile-only MAUs, are calculated using internal company data based on the activity of user accounts. While these numbers are based on what we believe to be reasonable estimates of our user base for the applicable period of measurement, there are inherent challenges in measuring usage of our products across large online and mobile populations around the world. For example, there may be individuals who maintain one or more Facebook accounts in violation of our terms of service. We estimate, for example, that "duplicate" accounts (an account that a user maintains in addition to his or her principal account) may have represented between approximately 4.3% and 7.9% of our worldwide MAUs in 2013. We also seek to identify "false" accounts, which we divide into two categories: (1) user-misclassified accounts, where users have created personal profiles for a business, organization, or non-human entity such as a pet (such entities are permitted on Facebook using a Page rather than a personal profile under our terms of service); and (2) undesirable accounts, which represent user profiles that we determine are intended to be used for purposes that violate our terms of service, such as spamming. In 2013, for example, we estimate user-misclassified accounts may have represented between approximately 0.8% and 2.1% of our worldwide MAUs and undesirable accounts may have represented between approximately 0.4% and 1.2% of our worldwide MAUs. We believe the percentage of accounts that are duplicate or false is meaningfully lower in developed markets such as the United States or United Kingdom and higher in developing markets such as India and Turkey. However, these estimates are based on an internal review of a limited sample of accounts and we apply significant judgment in making this determination, such as identifying names that appear to be fake or other behavior that appears inauthentic to the reviewers. As such, our estimation of duplicate or false accounts may not accurately represent the actual number of such accounts. We are continually seeking to improve our ability to identify duplicate or false accounts and estimate the total number of such accounts, and such estimates may change due to improvements or changes in our methodology. Due to inherent variability in such estimates at particular dates of measurement, we disclose these estimates as a range over a recent period.
Our data limitations may affect our understanding of certain details of our business. For example, while user-provided data indicates a decline in usage among younger users, this age data is unreliable because a disproportionate number of our younger users register with an inaccurate age. In the third quarter of 2013, we worked with third parties to develop models to more accurately analyze user data by age in the United States. These models suggested that usage by U.S. teens overall was stable, but that DAUs among younger U.S. teens had declined. The data and models we are using are not precise and our understanding of usage by age group may not be complete.
Some of our historical metrics through the second quarter of 2012 were also affected by applications on certain mobile devices that automatically contact our servers for regular updates with no user action involved, and this activity can cause our system to count the user associated with such a device as an active user on the day such contact occurs. For example, we estimate that less than 5% of our estimated worldwide DAUs as of December 31, 2011 and 2010 resulted from this type of automatic mobile activity, and that this type of activity had a substantially smaller effect on our estimate of worldwide MAUs and mobile MAUs. The impact of this automatic activity on our metrics varies by geography because mobile usage varies in different regions of the world. In addition, our data regarding the geographic location of our users is estimated based on a number of factors, such as the user's IP address and self-disclosed location. These factors may not always accurately reflect the user's actual location. For example, a mobile-only user may appear to be accessing Facebook from the location of the proxy server that the user connects to rather than from the user's actual location. The methodologies used to measure user metrics may also be susceptible to algorithm or other technical errors. For example, in early June 2012, we discovered an error in the algorithm we used to estimate the geographic location of our users that affected our attribution of certain user locations for the period ended March 31, 2012. While this issue did not affect our overall worldwide DAU and MAU numbers, it did affect our attribution of users across different geographic regions. We estimate that the number of MAUs as of March 31, 2012 for the United States & Canada region was overstated as a result of the error by approximately 3% and this overstatement was offset by understatements in other regions. The number of such users for the period ended March 31, 2012 disclosed in "Management's Discussion and Analysis of Financial Condition and Results of Operations -- Trends in Our User Metrics" reflect the reclassification to more correctly attribute users by geographic region. Our estimates for revenue by user location and revenue by user device are also affected by these factors. We regularly review and may adjust our processes for calculating these metrics to improve their accuracy. In addition, our DAU and MAU estimates will differ from estimates published by third parties due to differences in methodology. For example, some third parties are not able to accurately measure mobile users or do not count mobile users for certain user groups or at all in their analyses.
The numbers of DAUs, mobile DAUs, MAUs, mobile MAUs, mobile-only DAUs and mobile-only MAUs discussed in this Annual Report on Form 10-K, as well as ARPU, do not include users of Instagram unless they would otherwise qualify as such users, respectively, based on their other activities on Facebook. In addition, other user engagement metrics included herein do not include Instagram unless otherwise specifically stated.
4
|
Item 1.
|
Business
|
Overview
Our mission is to give people the power to share and make the world more open and connected.
We build technology to enable faster, easier and richer communication. Hundreds of millions of people use Facebook's websites and mobile applications every day to stay connected with their friends and family, to discover and learn what is going on in the world around them, and to share and express what matters to them to the people they care about.
Our business focuses on creating value for users, marketers, and developers.
How We Create Value for People Who Use Facebook
Our top priority is to build useful and engaging products that enable people to:
|
•
|
Connect and Share with Friends.
With more than
1.2 billion
monthly active users (MAUs) worldwide, Facebook users are able to find and stay connected with their friends, family, and colleagues on Facebook.
|
|
•
|
Discover and Learn.
We believe that people come to Facebook to discover and learn more about what is going on in the world around them, particularly in the lives of their friends and family and with public figures and organizations that interest them. Each person's experience on Facebook is unique based on the content shared by his or her friends and connections.
|
|
•
|
Express Yourself.
We enable people to share their opinions, ideas, photos and videos, and activities with audiences ranging from their closest friends to the public at large, giving everyone a voice within the Facebook community. Through Facebook's privacy and sharing settings, people can control what they share and with whom they share it.
|
|
•
|
Stay Connected Everywhere.
People can access Facebook through our website, mobile sites, smartphone applications, and feature phone products. Through mobile and web applications built by developers that integrate with Facebook, people can interact with their Facebook friends while playing games, listening to music, watching movies, reading news, and engaging in other activities across the web and on mobile devices.
|
We had
757 million
daily active users (DAUs) on average in
December 2013
, an increase of
22%
compared to
December 2012
. We had
556 million
DAUs who accessed Facebook from a mobile device on average in
December 2013
, an increase of
49%
compared to
December 2012
.
\
How We Create Value for Marketers
Facebook focuses on providing value for all kinds of marketers, including brand marketers, direct marketers, small and medium-sized businesses, and developers. We help marketers achieve their business objectives, such as increasing online sales, in-store sales, or awareness of their brands, products, or services. We generate the substantial majority of our revenue from selling advertising placements to marketers.
We offer marketers the following benefits:
|
•
|
Targeted Reach.
With over
1.2 billion
MAUs using our service every month, Facebook offers marketers the ability to reach their existing and prospective customers. Marketers can target their ads to people on Facebook based on demographic factors such as age, location, gender, education, and specific interests that users have chosen to share with us. In addition, marketers may choose to match their own data or third-party data with ours, so they can find existing customers or potential new ones directly on Facebook. We also offer marketers the ability to include social context with their marketing messages. Social context is information that highlights a friend's connections with a particular brand or business, and we believe that social context improves ad effectiveness.
|
|
•
|
Engagement.
We offer marketers access to one of the most highly engaged consumer networks in the world. According to eMarketer, in 2013, people spent more time with digital media than watching TV for the first time. We believe marketing dollars will follow this shift in consumer time, and we offer marketers a place to shift their spend given our large and highly engaged audience.
|
|
•
|
Facebook Ads
. Our ads offer marketers the opportunity to communicate their messages to consumers and to direct them to specific destinations such as a web page or a Facebook Page. Marketers purchase ads that can appear in multiple locations including in the right-hand side of most page types on personal computers and in the News Feed on personal
|
5
computers or mobile devices. Our ads are effectively integrated into the Facebook experience in a manner designed to deliver impressive returns for marketers while optimizing the user experience.
|
•
|
Facebook Ad System.
Our
ad creation tools are designed to align with marketers’ advertising goals. When marketers create an ad campaign on Facebook, they can specify their marketing objectives and the types of people they want to reach. In addition, marketers can use our products such as Custom Audiences to more precisely target people such as those who have previously expressed interest in that particular marketer. Using our ad system, marketers indicate the maximum price they are willing to pay for their ad, either per click (CPC), per action (CPA), or per thousand impressions (CPM), and their maximum budget. Our system also supports guaranteed delivery of a fixed number of ad impressions for a fixed price. Facebook's ad serving technology dynamically determines the best available ad to show each user based on the combination of the user's unique attributes and the real-time comparison of bids from eligible ads. We enable marketers to deploy and adjust campaigns rapidly.
|
|
•
|
Ad Measurement.
Marketers can use our platform to track and optimize both the in-store and online performance of their ad campaigns. Offline and online conversion measurement and partnerships with third parties help marketers understand how their ad investments impact specific business outcomes (e.g. in-store sales, offsite conversions, application installs). These insights also help marketers make modifications to their ad campaigns to maximize results.
|
How We Create Value for Developers
Facebook provides a set of development tools and application programming interfaces (APIs) that enable developers to easily integrate with Facebook to create mobile and web applications. We are focused on providing developers with unique tools to support their mobile and web applications. We generate revenue from developers who use our Payments infrastructure to sell virtual and digital goods to our users on personal computers. We also generate revenue from developers who choose to purchase ads from us.
We support developers’ efforts to build, grow, and monetize their mobile and web applications:
|
•
|
Build.
We provide tools and services that accelerate and enhance cross-platform mobile and web application development. With Facebook Login, developers can offer their users a single identity across platforms, which provides a fast and secure way for people to sign in. Facebook Login also enables developers to design applications that feel familiar to each user by bringing their Facebook identity to the application experience. Through our Parse service, we enable developers to focus on creating engaging front-end user experiences while using our service to handle complex back-end infrastructure, services and server maintenance.
|
|
•
|
Grow.
We provide developers with tools to increase the exposure, distribution and engagement of their mobile and web applications. By using our tools for sharing, invites, requests, and mobile application ads, developers have unique ways to drive application discovery and user engagement. Mobile application ads enable developers to grow awareness and usage of their
applications and can feature a call to action such as "install" or "shop now." Mobile application ads for "install" actions appear in the Facebook News Feed and take people directly to the application store to download. If a mobile developer would like to target users who already have their application installed, they can link users from the News Feed ad to a customized, specific location inside the application, such as a sale, promotion or specific content such as a new album or hotel listing. In addition, social plugins, such as the Like button, are social features that developers can easily integrate with their websites by incorporating a few lines of HTML code. Social plugins enable developers to provide engaging and personalized social experiences to their users.
|
|
•
|
Monetize.
On the web,
we provide an online Payments infrastructure that enables developers to receive payments from our users in an easy-to-use, secure, and trusted environment. Our Payments infrastructure enables users on personal computers to purchase virtual or digital goods from developers and third-party websites by using debit and credit cards, PayPal, mobile phone payments, gift cards or other methods. Currently, substantially all of our Payments revenue is from users' purchases of virtual goods used in social games on personal computers. We receive a fee of up to 30% when users make such purchases from developers using our Payments infrastructure
.
In 2013, developers received more than $2.1 billion from transactions enabled by our Payments infrastructure. While mobile applications can also integrate with Facebook, mobile applications do not process transactions using our Payments infrastructure.
|
Our Products
|
•
|
Facebook.
The Facebook mobile app and website enable people to connect, share, discover, and communicate with each other on mobile devices and personal computers. Facebook is free and available throughout the world. The Facebook website and mobile app includes the following features:
|
|
-
|
News Feed.
News Feed is the core feature of a person's homepage on the Facebook website and mobile app and
|
6
is a regularly updating list of stories from friends, Pages, and other entities to which the person is connected. It includes posts, photos, event updates, group memberships, application updates, and other activities. Each person's News Feed is personalized based on his or her interests and the sharing activity of his or her friends and connections. Stories in each person's News Feed are prioritized based on several factors, including how many friends have Liked or Commented on a certain piece of content, who posted the content, and what type of content it is.
|
-
|
Timeline.
Timeline allows people to organize and display the events and activities that matter most to them, enabling them to curate their memories in a searchable personal narrative that is organized chronologically. People choose what information to share on their Timeline, such as their interests, photos, education, work history, relationship status, and contact information, and people can control with whom content is shared on their Timeline.
|
|
-
|
Graph Search
. Graph Search is a structured search tool that enables people to find people, places, photos and other information shared with them on Facebook. People can search using simple phrases such as "Photos of my friends in New York" or "Restaurants in London that my friends have been to," and browse the results. Once turned on, Graph Search replaces the search bar at the top of every page on Facebook. Graph Search beta is available on the web for people using the site in English, and we are planning to expand Graph Search to mobile and international audiences in the future.
|
|
•
|
Messenger.
Messenger is a mobile-to-mobile messaging application available on iOS and Android phones. Messenger works similarly to texting (SMS) to let people reach others instantly.
|
|
•
|
Instagram.
Instagram is a mobile app and website that enable people to take photos or videos, customize them with filter effects, and share them with friends and followers in a photo feed or send them directly to friends.
|
Our Strategy
We are in the early stages of pursuing our mission to make the world more open and connected. We believe we have a significant opportunity to further enhance the value we deliver to users, developers, and marketers. Key elements of our strategy are:
|
•
|
Expand Our Global Community.
There are more than 1.5 billion internet users on personal computers, and more than three billion mobile users worldwide according to GSMA Wireless Intelligence, and we aspire to someday connect all of these people. As of
December 31, 2013
, we had
1.23 billion
MAUs globally. We intend to increase the size of our network by continuing our marketing and user acquisition efforts, enhancing our products including mobile applications, and making Facebook more easily accessible to people throughout the world. We are focused on increasing the number of people using Facebook across all geographies, including relatively less-developed markets. Our investments include efforts to make Facebook accessible on feature phones, reducing the amount of data required to utilize our service, and investing in increasing the number of people who have access to the internet including through industry partnerships such as Internet.org.
|
|
•
|
Develop Great Social Products to Increase Engagement.
We prioritize product development investments that we believe will drive user engagement. We continue to invest significantly in improving our existing products such as News Feed, Timeline, and Graph Search and our stand-alone mobile applications such as Messenger and Instagram. For example, we are continually improving our ability to analyze and organize vast amounts of information in real time to enable us to select the unique content that we believe will be most interesting to show to each user. We are also focused on developing new products, including new stand-alone applications, to increase engagement. Increasing user engagement is a core part of our strategy to maximize our long-term business performance and therefore we are willing to sacrifice short-term monetization in order to increase engagement.
|
|
•
|
Increase the Utility of our Service and Provide the Most Compelling User Experience.
We aim to maximize the utility we create for people using our service. We are investing significantly in improving our products and developing new products, including new stand-alone applications, in order to create more value and make the Facebook experience more useful. We also enable developers to integrate their mobile and web applications with Facebook in order to increase utility for our users.
|
|
•
|
Improve Our Ad Products.
We are investing to improve our ad products in order to attract more marketers to work with Facebook, to create more value for marketers, and to enhance marketers' ability to make their advertising more relevant for users. Our advertising strategy centers on the belief that ad products that are relevant, well-targeted, social, and well-integrated with other content on Facebook can enhance the user experience while providing an attractive return for marketers. We intend to invest in additional products for marketers while continuing to balance our monetization objectives with our commitment to optimizing the user experience. We will continue to work to develop new tools that help marketers to target their ads most effectively and thereby increase their return on ad spend. We also continue to focus on analytics
|
7
and measurement tools to enable marketers to evaluate and improve the effectiveness of ad campaigns on Facebook.
|
•
|
Excel at Mobile Product Development and Make our Mobile Products Fast, Reliable, and Easily Available.
We devote substantial resources to our development of mobile products and experiences for a wide range of platforms, including smartphones, feature phones and tablets. In addition, we are working across the mobile industry with operators, hardware manufacturers, operating system providers, and developers to improve the Facebook experience on mobile devices and make Facebook available to more people around the world. We had
945 million
MAUs who used Facebook mobile products as of
December 31, 2013
. We believe that mobile usage of Facebook is critical to user growth and engagement over the long term.
|
|
•
|
Enable Developers to Build, Grow, and Monetize Their Mobile and Web Applications
. The success of Facebook’s developer ecosystem is an important part of our strategy. We continue to invest in tools and APIs that enhance the ability of developers who integrate with Facebook to build valuable and engaging products. Developers can create value for Facebook in multiple ways, including: purchasing advertising on Facebook; using our Payment infrastructure to facilitate transactions with users on personal computers; sharing content with Facebook that makes our products more engaging; and contributing to our understanding of users’ interests and preferences.
|
|
•
|
Build a Scalable Infrastructure to Provide the Most Compelling, Robust, and Reliable Product Experience.
We are investing in software and hardware infrastructure that enables us to provide a unique, personalized experience to each of our users around the world. We believe the speed and reliability of our products are important competitive advantages.
|
Building and Maintaining User Trust
Trust is a cornerstone of our business. We dedicate significant resources to the goal of building user trust through developing and implementing programs designed to protect user privacy, promote a safe environment, and assure the security of user data. The resources we dedicate to this goal include engineers, analysts, lawyers, policy experts, and operations specialists, as well as hardware and software from leading vendors and solutions we have designed and built.
|
•
|
Privacy and Sharing.
People come to Facebook to connect and share with different audiences. Protecting user privacy is an important part of our product development process. Our objective is to give users choice over what they share and with whom they share it. This effort is fundamental to our business and focuses on control, transparency, and accountability.
|
|
-
|
Control.
We believe that by providing our users with clear and easy-to-use controls, we will continue to promote trust in our products. For example, when a user posts a status update or uploads a photo to Facebook, our in-line controls allow the user to select his or her audience at the same time that he or she is publishing the post. In addition, we provide other data management tools. "Activity Log" is a unified tool that people can use to review and manage the content they have posted and the actions they have taken on Facebook. When using the Activity Log, a user can view his or her activity with a particular application, delete a specific post, change who can see a photo, or remove an application completely. Additionally, our "Download Your Information" tool enables users to access and store their personal information off Facebook.
|
|
-
|
Transparency.
Our Data Use Policy describes in plain language our data use practices and how privacy works on Facebook. We also offer a number of tools and features that provide users with transparency about their information on Facebook. Our application settings feature enables users to view each of the applications they have chosen to use, the information needed by each application, and the audience with whom the user has chosen to share his or her interactions with each application. We believe that this transparency enables people to make more informed decisions about their activities on Facebook.
|
|
-
|
Accountability.
We continue to build new procedural safeguards as part of our comprehensive privacy program. These include a dedicated team of privacy professionals who are involved in new product and feature development from design through launch; ongoing review and monitoring of the way data is handled by existing features and applications; and rigorous data security practices. We regularly work with online privacy and safety experts and regulators around the world. In August 2012, the Federal Trade Commission formally approved a 20-year settlement agreement requiring us to enhance our privacy program and to complete biennial third-party assessments. We also have undergone two audits by the Office of the Irish Data Protection Commissioner. The audits comprehensively reviewed our compliance with Irish data protection law, which is grounded in European data protection principles. As part of the audit process, we agreed to enhance various data protection and privacy practices to ensure compliance with the law and adherence to industry best practices.
|
|
•
|
Safety.
We design our products to include safety tools. These tools are coupled with educational resources and partnerships with online safety experts to offer protections for all users, particularly teenagers. We take into account the unique needs
|
8
of teenagers who use our service and employ age-appropriate settings that restrict their visibility, limit the audience with whom they can share, and help prevent unwanted contact from strangers.
Our abuse reporting infrastructure allows anyone on Facebook to report inappropriate, offensive, or dangerous content through "report" links found throughout our site. We have enhanced this reporting system to include "Social Reporting," which gives users the option to report content to us, to report content to a trusted friend, or to block the person who posted the content with one easy-to-use tool. Our Safety Advisory Board, comprised of five leading online safety organizations from around the world, advises us on product design and helps us to create comprehensive safety resources for everyone who uses our service. These resources are located in our multimedia Family Safety Center on our website, which also offers special information for parents, educators, teenagers, and members of the law enforcement community.
|
•
|
Security.
We invest in technology, processes, and people as part of our commitment to safeguarding our users' information. We use a variety of techniques to protect the data that we are entrusted with, and we rely on multiple layers of network segregation using firewalls to protect against attacks or unauthorized access. We also employ proprietary technologies to protect our users. For example, if we suspect that a user's account may have been compromised, we may use a process that we refer to as "social authentication" to validate that the person accessing the account is the actual account holder. The process of social authentication may include asking the person accessing the account to identify photos of the account holder's friends. Our security team actively scans for security vulnerabilities using commercial tools, penetration tests, code security reviews, and internal and external audits. We also have a network of geographically distributed single-tenant data centers, and we take measures to protect the information stored in these data centers.
|
Competition
Our business is characterized by innovation, rapid change, and disruptive technologies. We face significant competition in every aspect of our business, including from companies that provide tools to facilitate the sharing of information, companies that enable marketers to display advertising, and companies that provide development platforms for application developers. We compete to attract, engage, and retain users, to attract and retain marketers, to attract and retain developers to build compelling mobile and web applications that integrate with Facebook, and to attract and retain highly talented individuals, especially software engineers, designers, and product managers.
We compete with the following:
|
•
|
Companies that offer full-featured products that replicate the range of communications and related capabilities we provide. These offerings include, for example, Google+, which Google has integrated with certain of its products, including search and Android, as well as other, largely regional, social networks that have strong positions in particular countries.
|
|
•
|
Companies that develop applications, particularly mobile applications, that provide social functionality, such as messaging, photo- and video-sharing, and micro-blogging.
|
|
•
|
Companies that provide web- and mobile-based information and entertainment products and services that are designed to engage users and capture time spent online and on mobile devices.
|
|
•
|
Traditional and online businesses that provide media for marketers to reach their audiences and/or develop tools and systems for managing and optimizing advertising campaigns.
|
As we introduce new products, as our existing products evolve, or as other companies introduce new products and services, we may become subject to additional competition.
Technology
We have assembled a team of highly skilled engineers and computer scientists whose expertise spans a broad range of technical areas. We make significant investments in product and feature development, data management and personalization technologies, large-scale systems and scalable infrastructure, mobile technologies, and advertising technologies, including:
|
•
|
Product and Feature Development.
We aim to improve our existing products continuously and to develop new products for our users, developers, and marketers. Our product development philosophy is centered on continuous innovation in creating products that are social by design, which means that our products are designed to place people and their social interactions at the core of the product experience.
|
|
•
|
Data Management and Personalization Technologies.
To provide each user with a personalized Facebook experience, we must process and analyze a significant amount of content shared by our users, developers, and marketers and surface the most relevant content in real time. As such, we invest extensively in developing technologies and analytics in areas
|
9
including content optimization and delivery, graph query, media storage and serving, large-scale data management, and software performance.
|
•
|
Large-Scale Systems and Scalable Infrastructure.
Our products are built on a shared computing infrastructure. We use a combination of off-the-shelf and custom software running on clusters of commodity computers to amass substantial computing capability. Our infrastructure has enabled the storage and processing of large datasets and facilitated the deployment of our products on a global scale. As our user base grows, and the level of engagement and sharing from our users continues to increase, our computing needs continue to expand. We aim to provide our products rapidly and reliably to all users around the world, including in countries where we do not expect significant short-term monetization.
|
|
•
|
Mobile Technologies.
In order to provide a high-quality experience on a wide variety of mobile devices and operating systems, we invest in developing novel techniques and technologies including: custom graphics rendering, operating system customizations, development tools, systems for customizing the user experience based on a variety of factors, and systems for monitoring the behavior of the applications in the field.
|
|
•
|
Advertising Technologies.
We invest extensively in advertising technology capable of serving billions of ad impressions every day while maximizing the relevance of each impression to selected users based upon the information that users have chosen to share. Our system manages our entire set of ads, the selected audiences, and the marketers' bids to determine which ads to show each person and how to display them for every page on Facebook. We use an advanced user action prediction system that weighs many real-time updated features using automated learning techniques. Our technology incorporates the estimated user action rate with both the marketer's bid and a user relevancy signal to select what we believe to be the optimal ads to show.
|
Our research and development expenses were
$1.4 billion
in both
2013
and
2012
and
$388 million
in
2011
. For information about our research and development expenses, see Part II, Item 7, "Management's Discussion and Analysis of Financial Condition and Results of Operations - Results of Operations - Research and development" of this Annual Report on Form 10-K.
Sales and Operations
The majority of our marketers use our self-service ad platform to establish accounts and to launch and manage their advertising campaigns. We also have a global sales force that is focused on attracting and retaining marketers and providing support to them throughout the stages of the advertising campaign cycle from pre-purchase decision making to real-time optimizations to post-campaign analytics. We work directly with marketers, through traditional advertising agencies, and with an ecosystem of agencies that have a specialized focus on Facebook advertising. We currently operate more than 30 sales offices around the globe.
We have operations teams to provide support for our users, developers, and marketers in five regional centers located in Menlo Park, California; Austin, Texas; Dublin, Ireland; Hyderabad, India; and Singapore. We also invest in and rely on self-service tools to provide direct customer support to our users, developers, and marketers.
Marketing
To date, the Facebook user community has grown virally with users inviting their friends to connect with them, supported by internal efforts to stimulate user awareness and interest. In addition we have invested and will continue to invest in marketing our services to build our brand and user base around the world. We leverage the utility of our products and our social distribution channels as our most effective marketing tools. In addition, we undertake various user acquisition efforts and regularly host events and conferences to engage with developers and marketers.
Intellectual Property
To establish and protect our proprietary rights, we rely on a combination of patents, patent applications, trademarks, copyrights, trade secrets, including know-how, license agreements, confidentiality procedures, non-disclosure agreements with third parties, employee disclosure and invention assignment agreements, and other contractual rights. In addition, to further protect our proprietary rights, from time to time we have purchased patents and patent applications from third parties. We do not believe that our proprietary technology is dependent on any single patent or copyright or groups of related patents or copyrights. We believe the duration of our patents is adequate relative to the expected lives of our products.
Government Regulation
We are subject to a number of U.S. federal and state, and foreign laws and regulations that affect companies conducting business on the Internet. Many of these laws and regulations are still evolving and being tested in courts, and could be interpreted in ways that could harm our business. These may involve user privacy, rights of publicity, data protection, content, intellectual property, distribution, electronic contracts and other communications, competition, protection of minors, consumer protection, taxation and online payment
10
services. In particular, we are subject to federal, state, and foreign laws regarding privacy and protection of user data. Foreign data protection, privacy, and other laws and regulations can be more restrictive than those in the United States. U.S. federal and state and foreign laws and regulations are constantly evolving and can be subject to significant change. In addition, the application and interpretation of these laws and regulations are often uncertain, particularly in the new and rapidly-evolving industry in which we operate, and may be interpreted and applied inconsistently from country to country and inconsistently with our current policies and practices. There are also a number of legislative proposals pending before the U.S. Congress, various state legislative bodies, and foreign governments concerning data protection which could affect us. For example, the European Commission is currently considering a data protection regulation that may include operational requirements for companies that receive personal data that are different than those currently in place in the European Union, and that may also include significant penalties for non-compliance.
In August 2012, the FTC approved a settlement agreement with us to resolve an investigation into various practices, that, among other things, requires us to complete bi-annual independent privacy assessments and to establish and refine certain practices with respect to treatment of user information and the privacy settings we offer. Violation of existing or future regulatory orders or consent decrees could subject us to substantial monetary fines and other penalties that could negatively affect our financial condition and results of operations.
Various laws and regulations in the United States and abroad, such as the Bank Secrecy Act, the Dodd-Frank Act, the USA PATRIOT Act, and the Credit CARD Act, impose certain anti-money laundering requirements on companies that are financial institutions or that provide financial products and services. Under these laws and regulations, financial institutions are broadly defined to include money services businesses such as money transmitters, check cashers, and sellers or issuers of stored value. Requirements imposed on financial institutions under these laws include customer identification and verification programs, record retention policies and procedures, and transaction reporting. To increase flexibility in how our use of Payments may evolve and to mitigate regulatory uncertainty, we have received certain money transmitter licenses in the United States and expect to apply for certain regulatory licenses in Europe, which will generally require us to demonstrate compliance with many domestic and foreign laws relating to money transmission, gift cards and other prepaid access instruments, electronic funds transfers, anti-money laundering, counter-terrorist financing, gambling, banking and lending, and import and export restrictions.
Employees
As of
December 31, 2013
, we had
6,337
employees.
Corporate Information
We were incorporated in Delaware in July 2004. We completed our initial public offering in May 2012 and our Class A common stock is listed on The Nasdaq Global Select Market under the symbol "FB." Our principal executive offices are located at 1601 Willow Road, Menlo Park, California 94025, and our telephone number is (650) 543-4800.
Facebook, the Facebook logo, FB, the Like button, Instagram and our other registered or common law trademarks, service marks, or trade names appearing in this Annual Report on Form 10-K are the property of Facebook, Inc. or its affiliates. Other trademarks, service marks, or trade names appearing in this Annual Report on Form 10-K are the property of their respective owners.
Information about Segment and Geographic Revenue
Information about segment and geographic revenue is set forth in Notes 1 and 14 of our Notes to Consolidated Financial Statements included in Part II, Item 8, "Financial Statements and Supplementary Data" of this Annual Report on Form 10-K.
Available Information
Our website address is www.facebook.com. Our Annual Report on Form 10-K, Quarterly Reports on Form 10-Q, Current Reports on Form 8-K, and amendments to reports filed pursuant to Sections 13(a) and 15(d) of the Securities Exchange Act of 1934, as amended (Exchange Act), are filed with the U.S. Securities and Exchange Commission (SEC). We are subject to the informational requirements of the Exchange Act and file or furnish reports, proxy statements, and other information with the SEC. Such reports and other information filed by the Company with the SEC are available free of charge on our website at investor.fb.com when such reports are available on the SEC's website. We use our
investor.fb.com
website as a means of disclosing material non-public information and for complying with our disclosure obligations under Regulation FD. Accordingly, investors should monitor such portions of
investor.fb.com
, in addition to following SEC filings and public conference calls and webcasts.
The public may read and copy any materials filed by Facebook with the SEC at the SEC's Public Reference Room at 100 F Street, NE, Room 1580, Washington, DC 20549. The public may obtain information on the operation of the Public Reference Room by calling the SEC at 1-800-SEC-0330. The SEC maintains an Internet site that contains reports, proxy and information statements and other information regarding issuers that file electronically with the SEC at www.sec.gov.
11
The contents of the websites referred to above are not incorporated into this filing. Further, our references to the URLs for these websites are intended to be inactive textual references only.
12
|
Item 1A.
|
Risk Factors
|
Certain factors may have a material adverse effect on our business, financial condition, and results of operations. You should consider carefully the risks and uncertainties described below, in addition to other information contained in this Annual Report on Form 10-K, including our consolidated financial statements and related notes. The risks and uncertainties described below are not the only ones we face. Additional risks and uncertainties that we are unaware of, or that we currently believe are not material, may also become important factors that adversely affect our business. If any of the following risks actually occurs, our business, financial condition, results of operations, and future prospects could be materially and adversely affected. In that event, the trading price of our Class A common stock could decline, and you could lose part or all of your investment.
Risks Related to Our Business and Industry
If we fail to retain existing users or add new users, or if our users decrease their level of engagement with Facebook, our revenue, financial results, and business may be significantly harmed.
The size of our user base and our users' level of engagement are critical to our success. Our financial performance has been and will continue to be significantly determined by our success in adding, retaining, and engaging active users. We anticipate that our active user growth rate will continue to decline over time as the size of our active user base increases, and as we achieve higher market penetration rates. If people do not perceive our products to be useful, reliable, and trustworthy, we may not be able to attract or retain users or otherwise maintain or increase the frequency and duration of their engagement. A number of other social networking companies that achieved early popularity have since seen their active user bases or levels of engagement decline, in some cases precipitously. There is no guarantee that we will not experience a similar erosion of our active user base or engagement levels. Our user engagement patterns have changed over time and can be difficult to measure, particularly as users engage increasingly via mobile devices and as we introduce new and different services. Any number of factors could potentially negatively affect user retention, growth, and engagement, including if:
|
•
|
users increasingly engage with other products or activities;
|
|
•
|
we fail to introduce new products that users find engaging or if we introduce new products or services that are not favorably received;
|
|
•
|
users feel that their Facebook experience is diminished as a result of the decisions we make with respect to the frequency, prominence, and size of ads that we display, or the quality of the ads displayed;
|
|
•
|
user behavior on Facebook changes as a result of increasing use of mobile devices;
|
|
•
|
we are unable to continue to develop products for mobile devices that users find engaging, that work with a variety of mobile operating systems and networks, and that achieve a high level of market acceptance;
|
|
•
|
there are changes in user sentiment about the quality or usefulness of our products or concerns related to privacy and sharing, safety, security, or other factors;
|
|
•
|
we are unable to manage and prioritize information to ensure users are presented with content that is interesting, useful, and relevant to them;
|
|
•
|
users adopt new technologies where Facebook may not be featured or otherwise available;
|
|
•
|
there are adverse changes in our products that are mandated by legislation, regulatory authorities, or litigation, including settlements or consent decrees;
|
|
•
|
technical or other problems prevent us from delivering our products in a rapid and reliable manner or otherwise affect the user experience, such as any failure to prevent spam or similar content;
|
|
•
|
we adopt policies or procedures related to areas such as sharing or user data that are perceived negatively by our users or the general public;
|
|
•
|
if we elect to focus our user growth and engagement efforts more on longer-term initiatives, or if initiatives designed to attract and retain users and engagement are unsuccessful or discontinued, whether as a result of actions by us, third parties or otherwise;
|
|
•
|
we fail to provide adequate customer service to users, developers, or marketers;
|
|
•
|
we, developers whose products are integrated with Facebook, or other companies in our industry are the subject of
|
13
adverse media reports or other negative publicity; or
|
•
|
our current or future products, such as our development tools and application programming interfaces that enable developers to build mobile and web applications, reduce user activity on Facebook by making it easier for our users to interact and share on third-party mobile and web applications.
|
If we are unable to maintain or increase our user base and user engagement, our revenue and financial results may be adversely affected. Any decrease in user retention, growth, or engagement could render Facebook less attractive to users, developers, and marketers, which may have a material and adverse impact on our revenue, business, financial condition, and results of operations. To the extent our active user growth rate slows, we will become increasingly dependent on our ability to maintain or increase levels of user engagement and monetization in order to drive revenue growth.
We generate a substantial majority of our revenue from advertising. The loss of marketers, or reduction in spending by marketers with Facebook, could seriously harm our business.
The substantial majority of our revenue is currently generated from third parties advertising on Facebook. For 2013, 2012, and 2011, advertising accounted for
89%
,
84%
and
85%
, respectively, of our revenue. As is common in the industry, our marketers do not have long-term advertising commitments with us. Many of our marketers spend only a relatively small portion of their overall advertising budget with us. We expect our ability to grow advertising revenue will become increasingly dependent on our ability to generate revenue from ads displayed on mobile devices. In addition, marketers may view some of our products as experimental and unproven. Marketers will not continue to do business with us, or they will reduce the prices they are willing to pay to advertise with us or the budgets they are willing to commit to us, if we do not deliver ads in an effective manner, or if they do not believe that their investment in advertising with us will generate a competitive return relative to other alternatives. Our advertising revenue could be adversely affected by a number of other factors, including:
|
•
|
decreases in user engagement, including time spent on Facebook;
|
|
•
|
our ability to continue to increase user access to and engagement with Facebook through our mobile products;
|
|
•
|
product changes or inventory management decisions we may make that reduce the size, frequency, or relative prominence of ads displayed on Facebook;
|
|
•
|
our inability to maintain or increase marketer demand, the pricing of our ads, or both;
|
|
•
|
differences between the pricing of our ads displayed on personal computers and mobile devices;
|
|
•
|
our inability to maintain or increase the quality of ads shown to users, particularly on mobile devices;
|
|
•
|
the accuracy of our analytics and measurement solutions that demonstrate the value of our ads, or our ability to further improve such tools;
|
|
•
|
decisions by marketers to use our free products, such as Facebook Pages, instead of advertising on Facebook;
|
|
•
|
loss of advertising market share to our competitors, including if such competitors offer lower priced or more integrated products;
|
|
•
|
adverse legal developments relating to advertising, including legislative and regulatory developments and developments in litigation;
|
|
•
|
decisions by marketers to reduce their advertising as a result of adverse media reports or other negative publicity involving us, content on Facebook, developers with Facebook-integrated mobile and web applications, or other companies in our industry;
|
|
•
|
our inability to create new products that sustain or increase the value of our ads;
|
|
•
|
the degree to which users opt out of social ads;
|
|
•
|
the degree to which users cease or reduce the number of times they click on our ads;
|
|
•
|
changes in the way online advertising is priced;
|
|
•
|
the impact of new technologies that could block or obscure the display of our ads; and
|
|
•
|
the impact of macroeconomic conditions or conditions in the advertising industry, in general.
|
14
The occurrence of any of these or other factors could result in a reduction in demand for our ads, which may reduce the prices we receive for our ads, or cause marketers to stop advertising with us altogether, either of which would negatively affect our revenue and financial results.
Mobile advertising is new and evolving and growth in the use of Facebook through our mobile products as a substitute for use on personal computers may negatively affect our revenue and financial results.
We had
945 million
mobile monthly active users (MAUs) in December 2013. While most of our mobile users also access Facebook through personal computers, we anticipate that the rate of growth in mobile usage will continue to be the primary driver of our growth for the foreseeable future and that usage through personal computers will decline worldwide, including in key markets such as the United States and other developed markets in Europe and Asia. For example, during the fourth quarter of 2013, the number of mobile MAUs exceeded the number of MAUs using personal computers for the first time, and the number of MAUs on personal computers declined relative to the third quarter of 2013. While our mobile advertising revenue continues to grow and comprised over half of our overall advertising revenue in the fourth quarter of 2013, the mobile advertising market remains a new and evolving market. In addition, we do not currently offer our Payments infrastructure to applications on mobile devices. If users increasingly access Facebook mobile products as a substitute for access through personal computers, and if we are unable to continue to grow mobile revenues or successfully monetize mobile users, or if we incur excessive expenses in these efforts, our financial performance and ability to grow revenue would be negatively affected.
Facebook user growth, engagement, and monetization on mobile devices depend upon effective operation with mobile operating systems, networks, and standards that we do not control.
There is no guarantee that popular mobile devices will continue to feature Facebook, or that mobile device users will continue to use Facebook rather than competing products. We are dependent on the interoperability of Facebook with popular mobile operating systems that we do not control, such as Android and iOS, and any changes in such systems and terms of service that degrade our products' functionality, give preferential treatment to competitive products, or prevent our ability to show ads could adversely affect Facebook usage and monetization on mobile devices. Additionally, in order to deliver high quality mobile products, it is important that our products work well with a range of mobile technologies, systems, networks, and standards that we do not control. We may not be successful in developing relationships with key participants in the mobile industry or in developing products that operate effectively with these technologies, systems, networks, or standards. In the event that it is more difficult for our users to access and use Facebook on their mobile devices, or if our users choose not to access or use Facebook on their mobile devices or use mobile products that do not offer access to Facebook, our user growth and user engagement could be harmed.
Our business is highly competitive. Competition presents an ongoing threat to the success of our business.
We face significant competition in every aspect of our business, including from companies that provide tools to facilitate the sharing of information, companies that enable marketers to display advertising and companies that provide development platforms for applications developers. We compete with companies that offer full-featured products that replicate the range of communications and related capabilities we provide. These offerings include, for example, Google+, which Google has integrated with certain of its products, including search and Android, as well as other, largely regional, social networks that have strong positions in particular countries. We also compete with companies that develop applications, particularly mobile applications, that provide social functionality, such as messaging, photo- and video-sharing, and micro-blogging, and companies that provide web- and mobile-based information and entertainment products and services that are designed to engage users and capture time spent online and on mobile devices. In addition, we face competition from traditional and online businesses that provide media for marketers to reach their audiences and/or
develop tools and systems for managing and optimizing advertising campaigns.
Some of our current and potential competitors may have significantly greater resources or better competitive positions in certain product segments, geographic regions or user demographics than we do. These factors may allow our competitors to respond more effectively than us to new or emerging technologies and changes in market conditions. We believe that some of our users, particularly our younger users, are aware of and actively engaging with other products and services similar to, or as a substitute for, Facebook, and we believe that some of our users have reduced their engagement with Facebook in favor of increased engagement with these other products and services. For example, in the third quarter of 2013, the best data available to us suggested that while usage by U.S. teens overall was stable, DAUs among younger teens in the United States had declined. In the event that our users increasingly engage with other products and services, we may experience a decline in user engagement in key user demographics or more broadly and our business could be harmed.
Our competitors may develop products, features, or services that are similar to ours or that achieve greater acceptance, may undertake more far-reaching and successful product development efforts or marketing campaigns, or may adopt more aggressive pricing policies. In addition, developers whose mobile and web applications are integrated with Facebook may use information shared by our users through Facebook in order to develop products or features that compete with us. Certain competitors, including Google, could use strong or dominant positions in one or more markets to gain competitive advantage against us in areas where we operate,
15
including: by integrating competing social networking platforms or features into products they control such as search engines, web browsers, or mobile device operating systems; by making acquisitions; by limiting or denying our access to advertising measurement or delivery systems; or by making access to Facebook more difficult. As a result, our competitors may acquire and engage users at the expense of the growth or engagement of our user base, which may negatively affect our business and financial results.
We believe that our ability to compete effectively depends upon many factors both within and beyond our control, including:
|
•
|
the popularity, usefulness, ease of use, performance, and reliability of our products compared to our competitors' products, particularly with respect to mobile products;
|
|
•
|
the size and composition of our user base;
|
|
•
|
the engagement of our users with our products;
|
|
•
|
the timing and market acceptance of products, including developments and enhancements to our or our competitors' products;
|
|
•
|
our ability to monetize our products;
|
|
•
|
the frequency, size, quality, and relative prominence of the ads displayed by us or our competitors;
|
|
•
|
customer service and support efforts;
|
|
•
|
marketing and selling efforts, including our ability to provide marketers with a compelling return on their investments;
|
|
•
|
our ability to establish and maintain developers' interest in building mobile and web applications that integrate with Facebook;
|
|
•
|
changes mandated by legislation, regulatory authorities, or litigation, including settlements and consent decrees, some of which may have a disproportionate effect on us;
|
|
•
|
acquisitions or consolidation within our industry, which may result in more formidable competitors;
|
|
•
|
our ability to attract, retain, and motivate talented employees, particularly software engineers, designers, and product managers;
|
|
•
|
our ability to cost-effectively manage and grow our operations; and
|
|
•
|
our reputation and brand strength relative to those of our competitors.
|
If we are not able to compete effectively, our user base and level of user engagement may decrease, we may become less attractive to developers and marketers, and our revenue and results of operations may be materially and adversely affected.
We may not be successful in our efforts to grow usage of and engagement with mobile and web applications that integrate with Facebook.
We have made and are continuing to make investments to enable developers to build mobile and web applications that integrate with Facebook. Such existing and prospective developers may not be successful in building mobile and/or web applications that create and maintain user engagement. Additionally, developers may choose to build on other platforms, including mobile platforms controlled by third parties, rather than building products that integrate with Facebook. We are continuously seeking to balance the distribution objectives of our developers with our desire to provide an optimal user experience, and we may not be successful in achieving a balance that continues to attract and retain such developers. For example, from time to time, we have taken actions to reduce the volume of communications from these developers to users on Facebook with the objective of enhancing the user experience, and such actions have reduced distribution from, user engagement with, and our monetization opportunities from, Facebook-integrated mobile and web applications. In some instances, these actions, as well as other actions to enforce our policies applicable to developers, have adversely affected our relationships with such developers. If we are not successful in our efforts to grow the number of developers that choose to build products that integrate with Facebook or if we are unable to build and maintain good relations with such developers, our user growth and user engagement and our financial results may be adversely affected.
16
We may not be successful in our efforts to further monetize how developers use Facebook.
We currently generate revenue from developers that use Facebook in several ways, including ads on pages generated by developers' applications on the Facebook website, direct advertising on Facebook purchased by developers to drive traffic to their mobile and web applications, and fees from developers' use of our Payments infrastructure to sell virtual and digital goods to users accessing Facebook via personal computers. Applications built by developers of social games are currently responsible for substantially all of our revenue derived from Payments, and the majority of the revenue from these applications has historically been generated by a limited number of the most popular games. In addition, a relatively small percentage of our users have transacted with Facebook Payments. If the Facebook-integrated applications that currently generate revenue fail to grow or maintain their users and engagement, if developers do not continue to introduce new applications that attract users and create engagement on Facebook, if developers reduce their advertising on Facebook, if we fail to maintain good relationships with existing developers or to attract new developers who build products that integrate with Facebook, or if Facebook-integrated applications outside of social games do not gain popularity and generate significant revenue for us, our financial performance and ability to grow revenue could be adversely affected.
Additionally, we are actively supporting developers' efforts to develop their own mobile and web applications that integrate with Facebook. Unlike applications that run within the Facebook website which enable us to show ads and offer Payments, we generally do not directly monetize from developers' integrating their own mobile and web applications with Facebook. Therefore, our developers' efforts to prioritize their own mobile or web applications may reduce or slow the growth of our user activity that generates advertising and Payments opportunities, which could negatively affect our revenue. Although we believe that there are significant long-term benefits to Facebook resulting from increased engagement on Facebook-integrated mobile and web applications, these benefits may not offset the possible loss of revenue, in which case our business could be harmed.
Action by governments to restrict access to Facebook in their countries could substantially harm our business and financial results.
It is possible that governments of one or more countries may seek to censor content available on Facebook in their country, restrict access to Facebook from their country entirely, or impose other restrictions that may affect the accessibility of Facebook in their country for an extended period of time or indefinitely. For example, access to Facebook has been or is currently restricted in whole or in part in China, Iran, and North Korea. In addition, governments in other countries may seek to restrict access to Facebook if they consider us to be in violation of their laws. In the event that access to Facebook is restricted, in whole or in part, in one or more countries or our competitors are able to successfully penetrate geographic markets that we cannot access, our ability to retain or increase our user base and user engagement may be adversely affected, we may not be able to maintain or grow our revenue as anticipated, and our financial results could be adversely affected.
Our new products and changes to existing products could fail to attract or retain users or generate revenue.
Our ability to retain, increase, and engage our user base and to increase our revenue depends heavily on our ability to create successful new products, both independently and in conjunction with developers or other third parties. We may introduce significant changes to our existing products or develop and introduce new and unproven products, including using technologies with which we have little or no prior development or operating experience. If new or enhanced products fail to engage users, developers, or marketers, we may fail to attract or retain users or to generate sufficient revenue, operating margin, or other value to justify our investments, and our business may be adversely affected. In the future, we may invest in new products and initiatives to generate revenue, but there is no guarantee these approaches will be successful. For example, we recently began showing ads on Instagram in the United States and we cannot assure you that these ads will generate meaningful revenue for our business. If we are not successful with new products or new approaches to monetization, we may not be able to maintain or grow our revenue as anticipated or recover any associated development costs, and our financial results could be adversely affected.
We prioritize user growth and engagement and the user experience over short-term financial results.
We frequently make product decisions that may reduce our short-term revenue or profitability if we believe that the decisions are consistent with our mission and benefit the aggregate user experience and will thereby improve our financial performance over the long term. For example, from time to time we may change the size, frequency, or relative prominence of ads in order to improve ad quality and overall user experience. Similarly, from time to time we update our News Feed ranking algorithm to deliver the most relevant content to our users, which may adversely affect the distribution of content of developers and marketers and could reduce their incentive to invest in their development and marketing efforts on Facebook. We also may introduce changes to existing products, or introduce new stand-alone products, that direct users away from properties where we have a proven means of monetization. For example, we have taken action to redirect users who send messages from within the Facebook application to our stand-alone Messenger application, although we currently do not monetize the stand-alone Messenger application. In addition, we plan to focus on growing the user base for Instagram and potentially other stand-alone applications that may have limited or no monetization, and it is possible that these efforts may reduce engagement with the core Facebook application. These decisions may not produce the long-term benefits that we expect, in which case our user growth and engagement, our relationships with developers and marketers, and our business and results of operations could be harmed.
17
If we are not able to maintain and enhance our brand, or if events occur that damage our reputation and brand, our ability to expand our base of users, developers, and marketers may be impaired, and our business and financial results may be harmed.
We believe that the Facebook brand has significantly contributed to the success of our business. We also believe that maintaining and enhancing our brand is critical to expanding our base of users, developers, and marketers. Many of our new users are referred by existing users. Maintaining and enhancing our brand will depend largely on our ability to continue to provide useful, reliable, trustworthy, and innovative products, which we may not do successfully. We may introduce new products or terms of service that users do not like, which may negatively affect our brand. Additionally, the actions of our developers may affect our brand if users do not have a positive experience using third-party mobile and web applications integrated with Facebook. We have in the past experienced, and we expect that in the future we will continue to experience, media, legislative, or regulatory scrutiny of our decisions regarding user privacy or other issues, which may adversely affect our reputation and brand. We also may fail to provide adequate customer service, which could erode confidence in our brand. Our brand may also be negatively affected by the actions of users that are deemed to be hostile or inappropriate to other users, or by users acting under false or inauthentic identities, or by perceived or actual efforts by governments to obtain access to user information for security-related purposes. Maintaining and enhancing our brand may require us to make substantial investments and these investments may not be successful. If we fail to successfully promote and maintain the Facebook brand or if we incur excessive expenses in this effort, our business and financial results may be adversely affected.
Improper access to or disclosure of user information, or violation of our terms of service or policies, could harm our reputation and adversely affect our business.
Our Data Use Policy governs the collection and use of information we receive in connection with our services. Our efforts to protect the information we receive may be unsuccessful due to the actions of third parties, software bugs or other technical malfunctions, employee error or malfeasance, government surveillance, or other factors. In addition, third parties may attempt to fraudulently induce employees or users to disclose information in order to gain access to our data or our users' data. If any of these events occur, our users' information could be accessed or disclosed improperly. Some of our developers or other partners, such as those that help us measure the effectiveness of ads, may receive or store information provided by us or by our users through mobile or web applications integrated with Facebook. If these third parties or developers fail to adopt or adhere to adequate data security practices or fail to comply with our terms and policies, or in the event of a breach of their networks, our users' data may be improperly accessed, used, or disclosed.
Any incidents involving unauthorized access to or improper use of user information or incidents involving violation of our terms of service or policies, including our Data Use Policy, could damage our reputation and our brand and diminish our competitive position. In addition, the affected users or government authorities could initiate legal or regulatory actions against us in connection with such incidents, which could cause us to incur significant expense and liability or result in orders or consent decrees forcing us to modify our business practices. Any of these events could have a material and adverse effect on our business, reputation, or financial results.
Unfavorable media coverage could negatively affect our business.
We receive a high degree of media coverage around the world. Unfavorable publicity regarding, for example, our privacy practices, product changes, product quality, litigation or regulatory activity, government surveillance, the actions of our developers whose products are integrated with Facebook, the actions of our users, or the actions of other companies that provide similar services to us, could adversely affect our reputation. Such negative publicity also could have an adverse effect on the size, engagement, and loyalty of our user base and result in decreased revenue, which could adversely affect our business and financial results.
Our financial results will fluctuate from quarter to quarter and are difficult to predict.
Our quarterly financial results have fluctuated in the past and will fluctuate in the future. Additionally, we have a limited operating history with the current scale of our business, which makes it difficult to forecast our future results. As a result, you should not rely upon our past quarterly financial results as indicators of future performance. You should take into account the risks and uncertainties frequently encountered by companies in rapidly evolving markets. Our financial results in any given quarter can be influenced by numerous factors, many of which we are unable to predict or are outside of our control, including:
|
•
|
our ability to maintain and grow our user base and user engagement;
|
|
•
|
our ability to attract and retain marketers in a particular period;
|
|
•
|
fluctuations in spending by our marketers due to seasonality, such as historically strong spending in the fourth quarter of each year, or other factors;
|
|
•
|
the number and quality of ads shown to users;
|
|
•
|
the pricing of our ads and other products;
|
18
|
•
|
our ability to continue to scale monetization through our mobile products;
|
|
•
|
our ability to maintain or increase Payments and other fees revenue;
|
|
•
|
the diversification and growth of revenue sources beyond advertising and Payments;
|
|
•
|
the development and introduction of new products or services by us or our competitors;
|
|
•
|
increases in marketing, sales, and other operating expenses that we may incur to grow and expand our operations and to remain competitive;
|
|
•
|
our ability to maintain gross margins and operating margins;
|
|
•
|
costs related to the acquisitions of businesses, talent, technologies or intellectual property, including potentially significant amortization costs;
|
|
•
|
our ability to obtain equipment and components for our data centers and other technical infrastructure in a timely and cost-effective manner;
|
|
•
|
system failures, which could prevent us from serving ads for any period of time, or breaches of security or privacy, and the costs associated with remediating any such failures or breaches;
|
|
•
|
inaccessibility of Facebook due to third-party actions;
|
|
•
|
share-based compensation expense;
|
|
•
|
adverse litigation judgments, settlements, or other litigation-related costs;
|
|
•
|
changes in the legislative or regulatory environment, including with respect to privacy, or enforcement by government regulators, including fines, orders, or consent decrees;
|
|
•
|
the overall tax rate for our business, which may be affected by the financial results of our international subsidiaries;
|
|
•
|
fluctuations in currency exchange rates and changes in the proportion of our revenue and expenses denominated in foreign currencies;
|
|
•
|
fluctuations in the market values of our portfolio investments and in interest rates;
|
|
•
|
changes in U.S. generally accepted accounting principles; and
|
|
•
|
changes in global business or macroeconomic conditions.
|
We expect our rates of growth may decline in the future.
We believe that our rates of user and revenue growth may decline over time. While we have recently experienced increased revenue growth compared to prior periods, we expect that our user growth and revenue growth rates will decline over time as the size of our active user base increases and as we achieve greater market penetration. For example, our MAUs grew
16%
from December 31, 2012 to 2013, 25% from December 31, 2011 to 2012 and 39% from 2010 to 2011. Historically, our user growth has been a primary driver of growth in our revenue. As our growth rates decline, investors' perceptions of our business may be adversely affected and the trading price of our Class A common stock could decline.
Our costs are continuing to grow, which could harm our business and profitability.
Operating our business is costly and we expect our expenses to continue to increase in the future as we broaden our user base, as users increase the number of connections and amount of data they share with us, and as we develop and implement new products. Historically, our costs have increased each year due to these factors and we expect to continue to incur increasing costs, in particular for servers, storage, power, and data centers, to support our anticipated future growth. We expect to continue to invest in these and other efforts to operate and expand our business around the world, including in countries and/or projects where we may not have a clear path to monetization, such as our commitment to the Internet.org initiative to increase global Internet access. In addition, our costs may increase as we hire additional employees, particularly as a result of the significant competition that we face to attract and retain technical talent. Our expenses may grow faster than our revenue and may be greater than we anticipate in a particular period or over time, and our investments may not be successful. In addition, we may increase marketing, sales, and other operating expenses in order to grow and expand our operations and to remain competitive. Increases in our costs may adversely affect our business and profitability.
19
Our business is subject to complex and evolving U.S. and foreign laws and regulations regarding privacy, data protection, and other matters. Many of these laws and regulations are subject to change and uncertain interpretation, and could result in claims, changes to our business practices, monetary penalties, increased cost of operations, or declines in user growth or engagement, or otherwise harm our business.
We are subject to a variety of laws and regulations in the United States and abroad that involve matters central to our business, including user privacy, rights of publicity, data protection, content, intellectual property, advertising, marketing, distribution, electronic contracts and other communications, competition, protection of minors, consumer protection, taxation, securities law compliance, and online payment services. The introduction of new products or expansion of our activities in certain jurisdictions may subject us to additional laws and regulations. In addition, foreign data protection, privacy, and other laws and regulations can be more restrictive than those in the United States. These U.S. federal and state and foreign laws and regulations, which can be enforced by private parties or government entities, are constantly evolving and can be subject to significant change. In addition, the application and interpretation of these laws and regulations are often uncertain, particularly in the new and rapidly evolving industry in which we operate, and may be interpreted and applied inconsistently from country to country and inconsistently with our current policies and practices. For example, the interpretation of some laws and regulations that govern the use of names and likenesses in connection with advertising and marketing activities is unsettled and developments in this area could affect the manner in which we design our products, as well as our terms of use. A number of proposals are pending before federal, state, and foreign legislative and regulatory bodies that could significantly affect our business. For example, the European Commission is currently considering a data protection regulation that may include operational requirements for companies that receive personal data that are different than those currently in place in the European Union, and that may also include significant penalties for non-compliance. Similarly, there have been a number of recent legislative proposals in the United States, at both the federal and state level, that would impose new obligations in areas such as privacy and liability for copyright infringement by third parties. In addition, some countries are considering legislation requiring local storage and processing of data that, if enacted, could increase the cost and complexity of delivering our services. These existing and proposed laws and regulations can be costly to comply with and can delay or impede the development of new products, result in negative publicity, increase our operating costs, require significant management time and attention, and subject us to inquiries or investigations, claims or other remedies, including fines or demands that we modify or cease existing business practices.
We have been subject to regulatory investigations and settlements and we expect to continue to be subject to such proceedings in the future, which could cause us to incur substantial costs or require us to change our business practices in a manner materially adverse to our business.
From time to time, we receive formal and informal inquiries from regulators regarding our compliance with laws and other matters. In 2012 the Federal Trade Commission approved a settlement agreement with us that, among other things, requires us to complete bi-annual independent privacy assessments and to establish and refine certain practices with respect to treatment of user information and the privacy settings we offer. In 2011 and 2012, the Irish Data Protection Commissioner audited the data, security, and privacy practices and policies of Facebook Ireland. We expect to continue to be the subject of regulatory investigations and audits in the future by these and other regulators throughout the world.
Violation of existing or future regulatory orders or consent decrees could subject us to substantial monetary fines and other penalties that could negatively affect our financial condition and results of operations. In addition, it is possible that future orders issued by, or inquiries or enforcement actions initiated by, regulatory authorities could cause us to incur substantial costs or require us to change our business practices in a manner materially adverse to our business.
20
If we are unable to protect our intellectual property, the value of our brand and other intangible assets may be diminished, and our business may be adversely affected.
We rely and expect to continue to rely on a combination of confidentiality and license agreements with our employees, consultants, and third parties with whom we have relationships, as well as trademark, copyright, patent, trade secret, and domain name protection laws, to protect our proprietary rights. In the United States and internationally, we have filed various applications for protection of certain aspects of our intellectual property, and we currently hold a number of issued patents in multiple jurisdictions and have acquired patents and patent applications from third parties. In addition, in the future we may acquire additional patents or patent portfolios, which could require significant cash expenditures. Third parties may knowingly or unknowingly infringe our proprietary rights, third parties may challenge proprietary rights held by us, and pending and future trademark and patent applications may not be approved. In addition, effective intellectual property protection may not be available in every country in which we operate or intend to operate our business. In any or all of these cases, we may be required to expend significant time and expense in order to prevent infringement or to enforce our rights. Although we have taken measures to protect our proprietary rights, there can be no assurance that others will not offer products or concepts that are substantially similar to ours and compete with our business. In addition, we regularly contribute software source code under open source licenses and have made other technology we developed available under other open licenses, and we include open source software in our products. For example, we have contributed certain specifications and designs related to our data center equipment to the Open Compute Project Foundation, a non-profit entity that shares and develops such information with the technology community, under the Open Web Foundation License. As a result of our open source contributions and the use of open source in our products, we may license or be required to license or disclose code and/or innovations that turn out to be material to our business and may also be exposed to increased litigation risk. If the protection of our proprietary rights is inadequate to prevent unauthorized use or appropriation by third parties, the value of our brand and other intangible assets may be diminished and competitors may be able to more effectively mimic our service and methods of operations. Any of these events could have an adverse effect on our business and financial results.
We are currently, and expect to be in the future, party to patent lawsuits and other intellectual property rights claims that are expensive and time consuming, and, if resolved adversely, could have a significant impact on our business, financial condition, or results of operations.
Companies in the Internet, technology, and media industries own large numbers of patents, copyrights, trademarks, and trade secrets, and frequently enter into litigation based on allegations of infringement, misappropriation, or other violations of intellectual property or other rights. In addition, various "non-practicing entities" that own patents and other intellectual property rights often attempt to aggressively assert their rights in order to extract value from technology companies. Furthermore, from time to time we may introduce new products, including in areas where we currently do not compete, which could increase our exposure to patent and other intellectual property claims from competitors and non-practicing entities.
From time to time, we receive notice letters from patent holders alleging that certain of our products and services infringe their patent rights. We presently are involved in a number of intellectual property lawsuits, and as we face increasing competition and gain an increasingly high profile, we expect the number of patent and other intellectual property claims against us to grow. Defending patent and other intellectual property litigation is costly and can impose a significant burden on management and employees, and there can be no assurances that favorable final outcomes will be obtained in all cases. In addition, plaintiffs may seek, and we may become subject to, preliminary or provisional rulings in the course of any such litigation, including potential preliminary injunctions requiring us to cease some or all of our operations. We may decide to settle such lawsuits and disputes on terms that are unfavorable to us. Similarly, if any litigation to which we are a party is resolved adversely, we may be subject to an unfavorable judgment that may not be reversed upon appeal. The terms of such a settlement or judgment may require us to cease some or all of our operations or pay substantial amounts to the other party. In addition, we may have to seek a license to continue practices found to be in violation of a third party's rights, which may not be available on reasonable terms, or at all, and may significantly increase our operating costs and expenses. As a result, we may also be required to develop alternative non-infringing technology or practices or discontinue the practices. The development of alternative non-infringing technology or practices could require significant effort and expense or may not be feasible. Our business, financial condition, and results of operations could be adversely affected as a result of an unfavorable resolution of the disputes and litigation referred to above.
We are involved in numerous class action lawsuits and other litigation matters that are expensive and time consuming, and, if resolved adversely, could harm our business, financial condition, or results of operations.
In addition to intellectual property claims, we are also involved in numerous other lawsuits, including putative class action lawsuits brought by users and marketers, many of which claim statutory damages or seek significant changes to our business operations, and we anticipate that we will continue to be a target for numerous lawsuits in the future. Because we have over a billion users, the plaintiffs in class action cases filed against us typically claim enormous monetary damages even if the alleged per-user harm is small or non-existent. Any negative outcome from such lawsuits could result in payments of substantial monetary damages or fines, or undesirable changes to our products or business practices, and accordingly our business, financial condition, or results of operations
21
could be materially and adversely affected. Although the results of such lawsuits and claims cannot be predicted with certainty, we do not believe that the final outcome of those matters relating to our products that we currently face will have a material adverse effect on our business, financial condition, or results of operations. In addition, we are currently the subject of stockholder class action suits in connection with our IPO. We believe these lawsuits are without merit and are vigorously defending these lawsuits.
There can be no assurances that a favorable final outcome will be obtained in all our cases, and defending any lawsuit is costly and can impose a significant burden on management and employees. Any litigation to which we are a party may result in an onerous or unfavorable judgment that may not be reversed upon appeal or in payments of substantial monetary damages or fines, or we may decide to settle lawsuits on similarly unfavorable terms, which could adversely affect our business, financial conditions, or results of operations.
Our CEO has control over key decision making as a result of his control of a majority of our voting stock.
Mark Zuckerberg, our founder, Chairman, and CEO, is able to exercise voting rights with respect to a majority of the voting power of our outstanding capital stock and therefore has the ability to control the outcome of matters submitted to our stockholders for approval, including the election of directors and any merger, consolidation, or sale of all or substantially all of our assets. This concentrated control could delay, defer, or prevent a change of control, merger, consolidation, or sale of all or substantially all of our assets that our other stockholders support, or conversely this concentrated control could result in the consummation of such a transaction that our other stockholders do not support. This concentrated control could also discourage a potential investor from acquiring our Class A common stock due to the limited voting power of such stock relative to the Class B common stock and might harm the trading price of our Class A common stock. In addition, Mr. Zuckerberg has the ability to control the management and major strategic investments of our company as a result of his position as our CEO and his ability to control the election or replacement of our directors. In the event of his death, the shares of our capital stock that Mr. Zuckerberg owns will be transferred to the persons or entities that he designates. As a board member and officer, Mr. Zuckerberg owes a fiduciary duty to our stockholders and must act in good faith in a manner he reasonably believes to be in the best interests of our stockholders. As a stockholder, even a controlling stockholder, Mr. Zuckerberg is entitled to vote his shares, and shares over which he has voting control as a result of voting agreements, in his own interests, which may not always be in the interests of our stockholders generally.
We plan to continue to make acquisitions, which could require significant management attention, disrupt our business, result in dilution to our stockholders, and adversely affect our financial results.
As part of our business strategy, we have made and intend to make acquisitions to add specialized employees, complementary companies, products, or technologies. Our ability to acquire and integrate larger or more complex companies, products, or technologies in a successful manner is unproven
.
In the future, we may not be able to find other suitable acquisition candidates, and we may not be able to complete acquisitions on favorable terms, if at all. Any future acquisitions we complete could be viewed negatively by users, developers, marketers, or investors, and our acquisitions may not achieve our goals. For example, in August 2012, we acquired Instagram and since the acquisition, we have been focused on user growth and the users' experience. We just recently began showing ads on Instagram in the United States and we cannot assure you that these ads will generate meaningful revenue for our business. In addition, if we fail to successfully close or integrate any acquisitions, integrate the products or technologies associated with such acquisitions into our company, or identify and address liabilities associated with the acquired business or assets, our business, revenue, and operating results could be adversely affected. Any integration process may require significant time and resources, and we may not be able to manage the process successfully. We may not successfully evaluate or utilize the acquired products, technology, or personnel, or accurately forecast the financial impact of an acquisition transaction, including accounting charges. In addition, our ability to conduct due diligence with respect to acquisitions, and our ability to evaluate the results of such due diligence, is dependent upon the accuracy and completeness of statements and disclosures made or actions taken by the companies we acquire or their representatives. Despite our efforts, there could be significant liabilities or deficiencies associated with the business, assets, products, financial condition or accounting practices related to the assets or companies we acquire. In addition, we may have to pay cash or incur debt to pay for acquisitions, which could adversely affect our financial results and liquidity. Additionally, we may issue equity securities to pay for acquisitions or to retain the employees of the acquired company, which could increase our expenses, adversely affect our financial results and result in dilution to our stockholders. The incurrence of indebtedness would result in increased fixed obligations and could also include covenants or other restrictions that would impede our ability to manage our operations.
22
Our business is dependent on our ability to maintain and scale our technical infrastructure, and any significant disruption in our service could damage our reputation, result in a potential loss of users and engagement, and adversely affect our financial results.
Our reputation and ability to attract, retain, and serve our users is dependent upon the reliable performance of our products and our underlying technical infrastructure. Our systems may not be adequately designed with the necessary reliability and redundancy to avoid performance delays or outages that could be harmful to our business. If Facebook is unavailable when users attempt to access it, or if it does not load as quickly as they expect, users may not use our products as often in the future, or at all. As our user base and the amount and types of information shared on Facebook continue to grow, we will need an increasing amount of technical infrastructure, including network capacity, and computing power, to continue to satisfy the needs of our users. It is possible that we may fail to effectively scale and grow our technical infrastructure to accommodate these increased demands. In addition, our business may be subject to interruptions, delays, or failures resulting from earthquakes, adverse weather conditions, other natural disasters, power loss, terrorism, or other catastrophic events.
A substantial portion of our network infrastructure is provided by third parties. Any disruption or failure in the services we receive from these providers could harm our ability to handle existing or increased traffic and could significantly harm our business. Any financial or other difficulties these providers face may adversely affect our business, and we exercise little control over these providers, which increases our vulnerability to problems with the services they provide.
We could experience unforeseen difficulties in building and operating key portions of our technical infrastructure.
We have designed and built our own data centers and key portions of our technical infrastructure through which we serve our products, and we plan to continue to significantly expand the size of our infrastructure primarily through data centers and other projects. The infrastructure expansion we are undertaking is complex, and unanticipated delays in the completion of these projects or availability of components may lead to increased project costs, operational inefficiencies, or interruptions in the delivery or degradation of the quality of our products. In addition, there may be issues related to this infrastructure that are not identified during the testing phases of design and implementation, which may only become evident after we have started to fully utilize the underlying equipment, that could further degrade the user experience or increase our costs.
Our products and internal systems rely on software that is highly technical, and if it contains undetected errors, our business could be adversely affected.
Our products and internal systems rely on software that is highly technical and complex. In addition, our products and internal systems depend on the ability of our software to store, retrieve, process, and manage immense amounts of data. Our software has contained, and may now or in the future contain, undetected errors, bugs, or vulnerabilities. Some errors in our software may only be discovered after the code has been released for external or internal use. Errors or other design defects within our software may result in a negative experience for users and marketers who use our products, delay product introductions or enhancements, or result in measurement or billing errors. Any errors, bugs, or defects discovered in our software could result in damage to our reputation, loss of users, loss of revenue, or liability for damages, any of which could adversely affect our business and financial results.
Certain of our user metrics are subject to inherent challenges in measurement, and real or perceived inaccuracies in such metrics may harm our reputation and negatively affect our business.
The numbers for our key metrics, which include our DAUs, mobile DAUs, MAUs, mobile MAUs, and average revenue per user (ARPU), as well as certain other metrics such as mobile-only DAUs and mobile-only MAUs, are calculated using internal company data based on the activity of user accounts. While these numbers are based on what we believe to be reasonable estimates of our user base for the applicable period of measurement, there are inherent challenges in measuring usage of our products across large online and mobile populations around the world. For example, there may be individuals who maintain one or more Facebook accounts in violation of our terms of service. We estimate, for example, that "duplicate" accounts (an account that a user maintains in addition to his or her principal account) may have represented between approximately 4.3% and 7.9% of our worldwide MAUs in 2013. We also seek to identify "false" accounts, which we divide into two categories: (1) user-misclassified accounts, where users have created personal profiles for a business, organization, or non-human entity such as a pet (such entities are permitted on Facebook using a Page rather than a personal profile under our terms of service); and (2) undesirable accounts, which represent user profiles that we determine are intended to be used for purposes that violate our terms of service, such as spamming. In 2013, for example, we estimate user-misclassified accounts may have represented between approximately 0.8% and 2.1% of our worldwide MAUs and undesirable accounts may have represented between approximately 0.4% and 1.2% of our worldwide MAUs. We believe the percentage of accounts that are duplicate or false is meaningfully lower in developed markets such as the United States or United Kingdom and higher in developing markets such as India and Turkey. However, these estimates are based on an internal review of a limited sample of accounts and we apply significant judgment in making this determination, such as identifying names that appear to be fake or other behavior that appears inauthentic to the reviewers. As such, our estimation of duplicate or false accounts may not accurately represent the actual number of such accounts. We are continually seeking to improve our ability to identify duplicate or false accounts and estimate the total number of such accounts, and such estimates may change due to improvements or changes in our methodology. Due
23
to inherent variability in such estimates at particular dates of measurement, we disclose these estimates as a range over a recent period.
Our data limitations may affect our understanding of certain details of our business. For example, while user-provided data indicates a decline in usage among younger users, this age data is unreliable because a disproportionate number of our younger users register with an inaccurate age. In the third quarter of 2013, we worked with third parties to develop models to analyze user data by age in the United States. These models suggested that usage by U.S. teens overall was stable, but that DAUs among younger U.S. teens had declined. The data and models we are using are not precise and our understanding of usage by age group may not be complete.
Some of our historical metrics through the second quarter of 2012 have also been affected by applications on certain mobile devices that automatically contact our servers for regular updates with no user action involved, and this activity can cause our system to count the user associated with such a device as an active user on the day such contact occurs. For example, we estimate that less than 5% of our estimated worldwide DAUs as of December 31, 2011 and 2010 resulted from this type of automatic mobile activity, and that this type of activity had a substantially smaller effect on our estimate of worldwide MAUs and mobile MAUs. The impact of this automatic activity on our metrics varied by geography because mobile usage varies in different regions of the world. In addition, our data regarding the geographic location of our users is estimated based on a number of factors, such as the user's IP address and self-disclosed location. These factors may not always accurately reflect the user's actual location. For example, a mobile-only user may appear to be accessing Facebook from the location of the proxy server that the user connects to rather than from the user's actual location. The methodologies used to measure user metrics may also be susceptible to algorithm or other technical errors. For example, in early June 2012, we discovered an error in the algorithm we use to estimate the geographic location of our users that affected our attribution of certain user locations for the period ended March 31, 2012. While this issue did not affect our overall worldwide DAU and MAU numbers, it did affect our attribution of users across different geographic regions. We estimate that the number of MAUs as of March 31, 2012 for the United States & Canada region was overstated as a result of the error by approximately 3% and this overstatement was offset by understatements in other regions. The number of such users for the period ended March 31, 2012 disclosed in "Management's Discussion and Analysis of Financial Condition and Results of Operations -- Trends in Our User Metrics" reflect the reclassification to more correctly attribute users by geographic region. Our estimates for revenue by user location and revenue by user device are also affected by these factors. We regularly review and may adjust our processes for calculating these metrics to improve their accuracy. In addition, our DAU and MAU estimates will differ from estimates published by third parties due to differences in methodology. For example, some third parties are not able to accurately measure mobile users or do not count mobile users for certain user groups or at all in their analyses. If marketers, developers, or investors do not perceive our user metrics to be accurate representations of our user base, or if we discover material inaccuracies in our user metrics, our reputation may be harmed and marketers and developers may be less willing to allocate their budgets or resources to Facebook, which could negatively affect our business and financial results.
We cannot assure you that we will effectively manage our growth.
Our employee headcount and the scope and complexity of our business have increased significantly, with the number of employees increasing to
6,337
as of December 31, 2013 from
4,619
as of December 31, 2012, and we expect headcount growth to continue for the foreseeable future. The growth and expansion of our business and products create significant challenges for our management, operational, and financial resources, including managing multiple relations with users, marketers, developers, and other third parties. In the event of continued growth of our operations or in the number of our third-party relationships, our information technology systems or our internal controls and procedures may not be adequate to support our operations. In addition, some members of our management do not have significant experience managing a large global business operation, so our management may not be able to manage such growth effectively. To effectively manage our growth, we must continue to improve our operational, financial, and management processes and systems and to effectively expand, train, and manage our employee base. As our organization continues to grow, and we are required to implement more complex organizational management structures, we may find it increasingly difficult to maintain the benefits of our corporate culture, including our ability to quickly develop and launch new and innovative products. This could negatively affect our business performance.
The loss of one or more of our key personnel, or our failure to attract and retain other highly qualified personnel in the future, could harm our business.
We currently depend on the continued services and performance of our key personnel, including Mark Zuckerberg and Sheryl K. Sandberg. Although we have entered into employment agreements with Mr. Zuckerberg and Ms. Sandberg, the agreements have no specific duration and constitute at-will employment. In addition, many of our key technologies and systems are custom-made for our business by our personnel. The loss of key personnel, including members of management as well as key engineering, product development, marketing, and sales personnel, could disrupt our operations and have an adverse effect on our business.
As we continue to grow, we cannot guarantee we will continue to attract the personnel we need to maintain our competitive position. In particular, we intend to continue to hire a significant number of technical personnel in 2014 and the foreseeable future, and we expect to face significant competition from other companies in hiring such personnel, particularly in the San Francisco Bay
24
Area. As we mature, the incentives to attract, retain, and motivate employees provided by our equity awards or by future arrangements may not be as effective as in the past, and if we issue significant equity to attract additional employees, the ownership of our existing stockholders may be further diluted. Additionally, we have a number of current employees whose equity ownership in our company has provided them a substantial amount of personal wealth, which could affect their decisions about whether or not to continue to work for us. As a result of these factors, it may be difficult for us to continue to retain and motivate our employees. If we do not succeed in attracting, hiring, and integrating excellent personnel, or retaining and motivating existing personnel, we may be unable to grow effectively.
We may incur liability as a result of information retrieved from or transmitted over the Internet or posted to Facebook and claims related to our products.
We have faced, currently face, and will continue to face claims relating to information that is published or made available on Facebook. In particular, the nature of our business exposes us to claims related to defamation, intellectual property rights, rights of publicity and privacy, and personal injury torts. This risk is enhanced in certain jurisdictions outside the United States where our protection from liability for third-party actions may be unclear and where we may be less protected under local laws than we are in the United States. We could incur significant costs investigating and defending such claims and, if we are found liable, significant damages. If any of these events occur, our business and financial results could be adversely affected.
Computer malware, viruses, hacking and phishing attacks, and spamming could harm our business and results of operations.
Computer malware, viruses, and computer hacking and phishing attacks have become more prevalent in our industry, have occurred on our systems in the past, and may occur on our systems in the future. Because of our prominence, we believe that we are a particularly attractive target for such attacks. Though it is difficult to determine what, if any, harm may directly result from any specific interruption or attack, any failure to maintain performance, reliability, security, and availability of our products and technical infrastructure. Any such failure may harm our reputation, our ability to retain existing users and attract new users, and our results of operations.
In addition, spammers attempt to use our products to send targeted and untargeted spam messages to users, which may embarrass or annoy users and make Facebook less user-friendly. We cannot be certain that the technologies and employees that we have to attempt to defeat spamming attacks will be able to curb spam messages from being sent on our platform. As a result of spamming activities, our users may use Facebook less or stop using our products altogether.
Payment transactions on Facebook may subject us to additional regulatory requirements and other risks that could be costly and difficult to comply with or that could harm our business.
Our users can use Facebook to purchase virtual and digital goods from developers that offer applications on the Facebook website using our Payments infrastructure. We are subject to a variety of laws and regulations in the United States, Europe, and elsewhere, including those governing anti-money laundering and counter-terrorist financing, money transmission, gift cards and other prepaid access instruments, and import and export restrictions. Depending on how our Payments product evolves, we may also be subject to other laws and regulations including those governing electronic funds transfers, gambling, banking, and lending. In some jurisdictions, the application or interpretation of these laws and regulations is not clear. To increase flexibility in how our use of Payments may evolve and to mitigate regulatory uncertainty, we have received certain money transmitter licenses in the United States and expect to apply for certain regulatory licenses in Europe, which will generally require us to demonstrate compliance with many domestic and foreign laws in these areas. Our efforts to comply with these laws and regulations could be costly and result in diversion of management time and effort and may still not guarantee compliance. In the event that we are found to be in violation of any such legal or regulatory requirements, we may be subject to monetary fines or other penalties such as a cease and desist order, or we may be required to make product changes, any of which could have an adverse effect on our business and financial results.
In addition, we may be subject to a variety of additional risks as a result of Payments on Facebook, including:
|
•
|
increased costs and diversion of management time and effort and other resources to deal with bad transactions or customer disputes;
|
|
•
|
potential fraudulent or otherwise illegal activity by users, developers, employees, or third parties;
|
|
•
|
restrictions on the investment of consumer funds used to transact Payments; and
|
|
•
|
additional disclosure and reporting requirements.
|
25
We plan to continue expanding our operations abroad where we have limited operating experience and may be subject to increased business and economic risks that could affect our financial results.
We plan to continue the international expansion of our business operations and the translation of our products. We currently make Facebook available in more than 70 different languages, and we have offices or data centers in more than 25 different countries. We may enter new international markets where we have limited or no experience in marketing, selling, and deploying our products. For example, we continue to evaluate making Facebook generally available in China. However, this market has substantial legal and regulatory complexities that have prevented this to date. If we fail to deploy or manage our operations in international markets successfully, our business may suffer. In addition, we are subject to a variety of risks inherent in doing business internationally, including:
|
•
|
political, social, or economic instability;
|
|
•
|
risks related to the legal and regulatory environment in foreign jurisdictions, including with respect to privacy and tax and terrestrial infrastructure matters, and unexpected changes in laws, regulatory requirements, and enforcement;
|
|
•
|
potential damage to our brand and reputation due to compliance with local laws, including potential censorship or requirements to provide user information to local authorities;
|
|
•
|
fluctuations in currency exchange rates;
|
|
•
|
higher levels of credit risk and payment fraud;
|
|
•
|
enhanced difficulties of integrating any foreign acquisitions;
|
|
•
|
burdens of complying with a variety of foreign laws;
|
|
•
|
reduced protection for intellectual property rights in some countries;
|
|
•
|
difficulties in staffing and managing global operations and the increased travel, infrastructure, and legal compliance costs associated with multiple international locations;
|
|
•
|
compliance with the U.S. Foreign Corrupt Practices Act, the U.K. Bribery Act, and similar laws in other jurisdictions; and
|
|
•
|
compliance with statutory equity requirements and management of tax consequences.
|
If we are unable to expand internationally and manage the complexity of our global operations successfully, our financial results could be adversely affected.
We may incur a substantial amount of indebtedness, which could adversely affect our financial condition.
In August 2013, we entered into a five-year senior unsecured revolving credit facility under which we may borrow up to $6.5 billion to fund working capital and general corporate purposes. As of December 31, 2013, no amounts were outstanding under this facility. If we draw down on this facility in the future, our interest expense and principal repayment requirements will increase significantly, which could have an adverse effect on our financial results.
We may require additional capital to support our business growth, and this capital may not be available on acceptable terms, if at all.
We may require additional capital to support our business growth or to respond to business opportunities, challenges or unforeseen circumstances. Our ability to obtain additional capital, if and when required, will depend on our business plans, investor demand, our operating performance, the condition of the capital markets, and other factors. If we raise additional funds through the issuance of equity, equity-linked or debt securities, those securities may have rights, preferences, or privileges senior to the rights of our Class A common stock, and our existing stockholders may experience dilution. If we are unable to obtain additional capital, or are unable to obtain additional capital on satisfactory terms, our ability to continue to support our business growth or to respond to business opportunities, challenges, or unforeseen circumstances could be adversely affected, and our business may be harmed.
If we default on our leasing and credit obligations, our operations may be interrupted and our business and financial results could be adversely affected.
We finance a significant portion of our expenditures through leasing arrangements, some of which are not required to be reflected on our balance sheet, and we may enter into additional similar arrangements in the future. In particular, we have used these types of
26
arrangements to finance some of our equipment and data centers. In addition, we have a $6.5 billion revolving credit facility that we may draw upon to finance our operations or other corporate purposes. If we default on these leasing and credit obligations, our leasing partners and lenders may, among other things:
|
•
|
require repayment of any outstanding lease obligations or amounts drawn on our credit facility;
|
|
•
|
terminate our leasing arrangements and credit facilities;
|
|
•
|
terminate our access to the leased data centers we utilize;
|
|
•
|
stop delivery of ordered equipment;
|
|
•
|
sell or require us to return our leased equipment; or
|
|
•
|
require us to pay significant damages.
|
If some or all of these events were to occur, our operations may be interrupted and our ability to fund our operations or obligations, as well as our business, financial results, and financial condition, could be adversely affected.
We may have exposure to greater than anticipated tax liabilities.
Our income tax obligations are based in part on our corporate operating structure and intercompany arrangements, including the manner in which we develop, value, and use our intellectual property and the valuations of our intercompany transactions. The tax laws applicable to our business, including the laws of the United States and other jurisdictions, are subject to interpretation and certain jurisdictions are aggressively interpreting their laws in new ways in an effort to raise additional tax proceeds from companies such as Facebook. The taxing authorities of the jurisdictions in which we operate may challenge our methodologies for valuing developed technology or intercompany arrangements, which could increase our worldwide effective tax rate and harm our financial position and results of operations. We are subject to regular review and audit by U.S. federal and state and foreign tax authorities. Tax authorities may disagree with certain positions we have taken and any adverse outcome of such a review or audit could have a negative effect on our financial position and results of operations. In addition, the determination of our worldwide provision for income taxes and other tax liabilities requires significant judgment by management, and there are many transactions where the ultimate tax determination is uncertain. Although we believe that our estimates are reasonable, the ultimate tax outcome may differ from the amounts recorded in our financial statements and may materially affect our financial results in the period or periods for which such determination is made.
In addition, our future income taxes could be adversely affected by earnings being lower than anticipated in jurisdictions that have lower statutory tax rates and higher than anticipated in jurisdictions that have higher statutory tax rates, by changes in the valuation of our deferred tax assets and liabilities, or by changes in tax laws, regulations, or accounting principles. For example, we have previously incurred losses in certain international subsidiaries that resulted in an effective tax rate that is significantly higher than the statutory tax rate in the United States and this could continue to happen in the future.
Changes in tax laws or tax rulings could materially affect our financial position and results of operations.
Changes in tax laws or tax rulings could materially affect our financial position and results of operations. For example, the current U.S. administration and key members of Congress have made public statements indicating that tax reform is a priority. Certain changes to U.S. tax laws, including limitations on the ability to defer U.S. taxation on earnings outside of the United States until those earnings are repatriated to the United States, could affect the tax treatment of our foreign earnings. In addition, many countries in the European Union, as well as a number of other countries and organizations such as the Organization for Economic Cooperation and Development, are actively considering changes to existing tax laws. Certain proposals could include recommendations that would significantly increase our tax obligations in many countries where we do business. Due to the large and expanding scale of our international business activities, any changes in the taxation of such activities may increase our worldwide effective tax rate and harm our financial position and results of operations.
Risks Related to Ownership of Our Class A Common Stock
The trading price of our Class A common stock has been and will likely continue to be volatile.
The trading price of our Class A common stock has been, and is likely to continue to be, volatile. Since shares of our Class A common stock were sold in our IPO in May 2012 at a price of $38.00 per share, our stock price has ranged from
$17.55
to
$58.58
through December 31, 2013. In addition to the factors discussed in this Annual Report on Form 10-K, the trading price of our Class A common stock may fluctuate significantly in response to numerous factors, many of which are beyond our control, including:
|
•
|
actual or anticipated fluctuations in our revenue and other operating results;
|
|
•
|
the financial projections we may provide to the public, any changes in these projections or our failure to meet these
|
27
projections;
|
•
|
actions of securities analysts who initiate or maintain coverage of us, changes in financial estimates by any securities analysts who follow our company, or our failure to meet these estimates or the expectations of investors;
|
|
•
|
additional shares of our Class A common stock being sold into the market by us or our existing stockholders, including shares sold by our employees to cover tax liabilities in connection with RSU vesting events, or the anticipation of such sales;
|
|
•
|
investor sentiment with respect to our competitors, our business partners, and our industry in general;
|
|
•
|
announcements by us or our competitors of significant products or features, technical innovations, acquisitions, strategic partnerships, joint ventures, or capital commitments;
|
|
•
|
announcements by us or estimates by third parties of actual or anticipated changes in the size of our user base, the level of user engagement, or the effectiveness of our ad products;
|
|
•
|
changes in operating performance and stock market valuations of technology companies in our industry, including our developers and competitors;
|
|
•
|
price and volume fluctuations in the overall stock market, including as a result of trends in the economy as a whole;
|
|
•
|
the inclusion or deletion of our Class A common stock from any trading indices, such as the S&P 500 Index;
|
|
•
|
media coverage of our business and financial performance;
|
|
•
|
lawsuits threatened or filed against us;
|
|
•
|
developments in new legislation and pending lawsuits or regulatory actions, including interim or final rulings by judicial or regulatory bodies; and
|
|
•
|
other events or factors, including those resulting from war or incidents of terrorism, or responses to these events.
|
In addition, the stock markets have experienced extreme price and volume fluctuations that have affected and continue to affect the market prices of equity securities of many technology companies. Stock prices of many technology companies have fluctuated in a manner unrelated or disproportionate to the operating performance of those companies. We are currently subject to securities litigation in connection with our IPO. We may experience more such litigation following future periods of volatility. Any securities litigation could subject us to substantial costs, divert resources and the attention of management from our business, and adversely affect our business.
If securities or industry analysts publish inaccurate or unfavorable research about our business, our stock price could decline.
The trading market for our Class A common stock depends in part on the research and reports that securities or industry analysts publish about us or our business. If one or more of the analysts who cover us downgrade the rating of our Class A common stock or publish inaccurate or unfavorable research about our business, our Class A common stock price could decline.
We do not intend to pay dividends for the foreseeable future.
We have never declared or paid cash dividends on our capital stock. We currently intend to retain any future earnings to finance the operation and expansion of our business, and we do not expect to declare or pay any dividends in the foreseeable future. As a result, you may only receive a return on your investment in our Class A common stock if the trading price of our Class A common stock increases. In addition, our credit facility contains restrictions on our ability to pay dividends.
28
If we are unable to maintain effective internal control over financial reporting in the future, investors may lose confidence in the accuracy and completeness of our financial reports and the trading price of our Class A common stock may be negatively affected.
We are subject to Section 404 of the Sarbanes-Oxley Act (SOX), which requires us to maintain internal controls over financial reporting and to report any material weaknesses in such internal controls. We have consumed and will continue to consume management resources and incur expenses for SOX compliance on an ongoing basis. If we identify material weaknesses in our internal control over financial reporting, or if we are unable to comply with the requirements of Section 404 in a timely manner or assert that our internal control over financial reporting is effective, investors may lose confidence in the accuracy and completeness of our financial reports and the trading price of our Class A common stock could be negatively affected, and we could become subject to investigations by the stock exchange on which our securities are listed, the Securities and Exchange Commission (SEC), or other regulatory authorities, which could require additional financial and management resources.
The requirements of being a public company may strain our resources and divert management's attention.
We also are subject to the reporting requirements of the Securities Exchange Act of 1934, as amended, the Dodd-Frank Act, the listing requirements of the NASDAQ Global Select Market, and other applicable securities rules and regulations. Compliance with these rules and regulations has increased and likely will continue to increase our legal and financial compliance costs, make some activities more difficult, time-consuming, or costly, and increase demand on our systems and resources. As a result, management's attention may be diverted from other business concerns, which could harm our business and operating results.
In addition, complying with public disclosure rules makes our business more visible, which we believe may result in threatened or actual litigation, including by competitors and other third parties. If such claims are successful, our business and operating results could be harmed, and even if the claims do not result in litigation or are resolved in our favor, these claims, and the time and resources necessary to resolve them, could divert the resources of our management and harm our business and operating results.
The dual class structure of our common stock and the voting agreements among certain stockholders have the effect of concentrating voting control with our CEO, and also with certain employees and directors and their affiliates; this will limit or preclude your ability to influence corporate matters.
Our Class B common stock has ten votes per share, and our Class A common stock has one vote per share. Stockholders who hold shares of Class B common stock, including certain of our executive officers, employees, and directors and their affiliates, together hold a substantial majority of the voting power of our outstanding capital stock. Because of the ten-to-one voting ratio between our Class B and Class A common stock, the holders of our Class B common stock collectively control a majority of the combined voting power of our common stock and therefore are able to control all matters submitted to our stockholders for approval so long as the shares of Class B common stock represent at least 9.1% of all outstanding shares of our Class A and Class B common stock. This concentrated control will limit or preclude your ability to influence corporate matters for the foreseeable future.
Transfers by holders of Class B common stock will generally result in those shares converting to Class A common stock, subject to limited exceptions, such as certain transfers effected for estate planning or charitable purposes. The conversion of Class B common stock to Class A common stock will have the effect, over time, of increasing the relative voting power of those holders of Class B common stock who retain their shares in the long term. If, for example, Mr. Zuckerberg retains a significant portion of his holdings of Class B common stock for an extended period of time, he could, in the future, continue to control a majority of the combined voting power of our Class A common stock and Class B common stock.
We have elected to take advantage of the "controlled company" exemption to the corporate governance rules for NASDAQ-listed companies, which could make our Class A common stock less attractive to some investors or otherwise harm our stock price.
Because we qualify as a "controlled company" under the corporate governance rules for NASDAQ-listed companies, we are not required to have a majority of our board of directors be independent, nor are we required to have a compensation committee or an independent nominating function. In light of our status as a controlled company, our board of directors determined not to have an independent nominating function and chose to have the full board of directors be directly responsible for nominating members of our board, and in the future we could elect not to have a majority of our board of directors be independent or not to have a compensation committee. Accordingly, should the interests of our controlling stockholder differ from those of other stockholders, the other stockholders may not have the same protections afforded to stockholders of companies that are subject to all of the corporate governance rules for NASDAQ-listed companies. Our status as a controlled company could make our Class A common stock less attractive to some investors or otherwise harm our stock price.
Delaware law and provisions in our restated certificate of incorporation and bylaws could make a merger, tender offer, or proxy contest difficult, thereby depressing the trading price of our Class A common stock.
Our status as a Delaware corporation and the anti-takeover provisions of the Delaware General Corporation Law may discourage,
29
delay, or prevent a change in control by prohibiting us from engaging in a business combination with an interested stockholder for a period of three years after the person becomes an interested stockholder, even if a change of control would be beneficial to our existing stockholders. In addition, our restated certificate of incorporation and bylaws contain provisions that may make the acquisition of our company more difficult, including the following:
|
•
|
until the first date on which the outstanding shares of our Class B common stock represent less than 35% of the combined voting power of our common stock, any transaction that would result in a change in control of our company requires the approval of a majority of our outstanding Class B common stock voting as a separate class;
|
|
•
|
we have a dual class common stock structure, which provides Mr. Zuckerberg with the ability to control the outcome of matters requiring stockholder approval, even if he owns significantly less than a majority of the shares of our outstanding Class A and Class B common stock;
|
|
•
|
when the outstanding shares of our Class B common stock represent less than a majority of the combined voting power of common stock, certain amendments to our restated certificate of incorporation or bylaws will require the approval of two-thirds of the combined vote of our then-outstanding shares of Class A and Class B common stock;
|
|
•
|
when the outstanding shares of our Class B common stock represent less than a majority of the combined voting power of our common stock, vacancies on our board of directors will be able to be filled only by our board of directors and not by stockholders;
|
|
•
|
when the outstanding shares of our Class B common stock represent less than a majority of the combined voting power of our common stock, our board of directors will be classified into three classes of directors with staggered three-year terms and directors will only be able to be removed from office for cause;
|
|
•
|
when the outstanding shares of our Class B common stock represent less than a majority of the combined voting power of our common stock, our stockholders will only be able to take action at a meeting of stockholders and not by written consent;
|
|
•
|
only our chairman, our chief executive officer, our president, or a majority of our board of directors are authorized to call a special meeting of stockholders;
|
|
•
|
advance notice procedures apply for stockholders to nominate candidates for election as directors or to bring matters before an annual meeting of stockholders;
|
|
•
|
our restated certificate of incorporation authorizes undesignated preferred stock, the terms of which may be established, and shares of which may be issued, without stockholder approval; and
|
|
•
|
certain litigation against us can only be brought in Delaware.
|
30
|
Item 1B.
|
Unresolved Staff Comments
|
None.
|
Item 2.
|
Properties
|
As of
December 31, 2013
, we leased office and data center facilities around the world totaling approximately
2 million
square feet, including one million square feet for our corporate headquarters in Menlo Park, California. We have data centers in the United States, including data center facilities that we own in North Carolina and Oregon and leased data center facilities in California and Virginia. We also own a data center facility in Lulea, Sweden. We believe that our facilities are adequate for our current needs. To support planned future growth, we are currently making significant investments to expand our corporate headquarters in Menlo Park, California and constructing a new data center in Altoona, Iowa.
|
Item 3.
|
Legal Proceedings
|
Paul D. Ceglia filed suit against us and Mark Zuckerberg on or about June 30, 2010, in the Supreme Court of the State of New York for the County of Allegheny, claiming substantial ownership of our company based on a purported contract between Mr. Ceglia and Mr. Zuckerberg allegedly entered into in April 2003. We removed the case to the U.S. District Court for the Western District of New York, where the case is now pending. In his first amended complaint, filed on April 11, 2011, Mr. Ceglia revised his claims to include an alleged partnership with Mr. Zuckerberg, he revised his claims for relief to seek a substantial share of Mr. Zuckerberg's ownership in us, and he included quotations from supposed emails that he claims to have exchanged with Mr. Zuckerberg in 2003 and 2004. On March 26, 2012, we filed a motion to dismiss Mr. Ceglia's complaint and a motion for judgment on the pleadings.
On November 27, 2012, Mr. Ceglia was indicted on mail and wire fraud charges based on his prosecution of this lawsuit. On March 26, 2013, the magistrate judge overseeing the matter issued a report recommending that the court grant our motion to dismiss and that it deny as moot our motion for judgment on the pleadings.
We continue to believe that Mr. Ceglia is attempting to perpetrate a fraud on the court and we intend to continue to defend the case vigorously.
Beginning on May 22, 2012, multiple putative class actions, derivative actions, and individual actions were filed in state and federal courts in the United States and in other jurisdictions against us, our directors, and/or certain of our officers alleging violation of securities laws or breach of fiduciary duties in connection with our initial public offering (IPO) and seeking unspecified damages. We believe these lawsuits are without merit, and we intend to continue to vigorously defend them. On October 4, 2012, on our motion, the vast majority of the cases in the United States, along with multiple cases filed against The NASDAQ OMX Group, Inc. and The Nasdaq Stock Market LLC (collectively referred to herein as NASDAQ) alleging technical and other trading-related errors by NASDAQ in connection with our IPO, were ordered centralized for coordinated or consolidated pre-trial proceedings in the United States District Court for the Southern District of New York. On February 13, 2013, the court granted our motion to dismiss four derivative actions against our directors and certain of our officers with leave to amend. On October 8, 2013, the court heard argument on our motion to dismiss the consolidated securities class action, as well as our motion to dismiss, and the plaintiffs' motion to remand to state court, certain other derivative actions. On December 18, 2013, the court denied our motion to dismiss the consolidated securities class action. On December 23, 2013, the court granted our motion to dismiss, and denied the plaintiffs’ motion to remand to state court, certain other derivative actions. In addition, the events surrounding our IPO have become the subject of various government inquiries, and we are cooperating with those inquiries. Any such inquiries could subject us to substantial costs, divert resources and the attention of management from our business, and adversely affect our business.
We are also party to various legal proceedings and claims that arise in the ordinary course of business. Among these pending legal matters, one case,
Rembrandt Social Media, LP v. Facebook, Inc., et al.
, was scheduled to begin trial in December 2013 in the U.S. District Court for the Eastern District of Virginia. In this case, the plaintiff alleges that we infringe certain patents held by the plaintiff. The plaintiff is seeking significant monetary damages and equitable relief. The trial date was vacated in December 2013 and the case is currently on appeal. We believe the claims made by the plaintiff in the
Rembrandt
case are without merit, and we intend to continue to defend ourselves vigorously.
In addition, we are also currently parties to multiple other lawsuits related to our products, including other patent infringement lawsuits as well as class action lawsuits brought by users and marketers, and we may in the future be subject to additional lawsuits and disputes. We are also involved in other claims, government investigations, and proceedings arising from the ordinary course of our business.
|
Item 4.
|
Mine Safety Disclosures
|
Not applicable.
31
|
Item 5.
|
Market for Registrant's Common Equity, Related Stockholder Matters and Issuer Purchases of Equity Securities.
|
Market Information for Common Stock
Our Class A common stock has been listed on the NASDAQ Global Select Market under the symbol "FB" since May 18, 2012. Prior to that time, there was no public market for our stock. The following table sets forth for the indicated periods the high and low intra-day sales prices per share for our Class A common stock on the NASDAQ Global Select Market.
|
2013
|
2012
|
||||||
|
High
|
Low
|
High
|
Low
|
||||
|
First Quarter
|
$32.51
|
$24.72
|
n/a
|
n/a
|
|||
|
Second Quarter
(1)
|
$29.07
|
$22.67
|
$45.00
|
$25.52
|
|||
|
Third Quarter
|
$51.60
|
$24.15
|
$32.88
|
$17.55
|
|||
|
Fourth Quarter
|
$58.58
|
$43.55
|
$28.88
|
$18.80
|
|||
(1)
The period reported for the second quarter of 2012 is from May 18, 2012 through June 30, 2012.
Our Class B common stock is not listed nor traded on any stock exchange.
Holders of Record
As of
December 31, 2013
, there were
4,819
stockholders of record of our Class A common stock, and the closing price of our Class A common stock was
$54.65
per share as reported on the NASDAQ Global Select Market. Because many of our shares of Class A common stock are held by brokers and other institutions on behalf of stockholders, we are unable to estimate the total number of stockholders represented by these record holders. As of
December 31, 2013
, there were
102
stockholders of record of our Class B common stock.
Dividend Policy
We have never declared or paid any cash dividend on our common stock. We intend to retain any future earnings and do not expect to pay dividends in the foreseeable future. In addition, our credit facility contains restrictions on our ability to pay dividends.
Purchases of Equity Securities by the Issuer and Affiliated Purchasers
None.
Recent Sale of Unregistered Securities and Use of Proceeds
Recent Sale of Unregistered Securities
None.
Use of Proceeds
On May 17, 2012, our registration statement on Form S-1 (File No. 333-179287) was declared effective by the Securities and Exchange Commission (SEC) for our initial public offering pursuant to which we sold an aggregate of 180,000,000 shares of our Class A common stock at a price to the public of $38.00 per share. There has been no material change in the planned use of proceeds from our initial public offering as described in our final prospectus filed with the SEC on May 18, 2012 pursuant to Rule 424(b).
32
Stock Performance Graph
This performance graph shall not be deemed "soliciting material" or to be "filed" with the SEC for purposes of Section 18 of the Securities Exchange Act of 1934, as amended (Exchange Act), or otherwise subject to the liabilities under that Section, and shall not be deemed to be incorporated by reference into any filing of Facebook, Inc. under the Securities Act of 1933, as amended, or the Exchange Act.
The following graph shows a comparison from May 18, 2012 (the date our Class A common stock commenced trading on the NASDAQ Global Select Market) through
December 31, 2013
of the cumulative total return for our Class A common stock, the Standard & Poor's 500 Stock Index (S&P 500 Index) and the Nasdaq Composite Index (NASDAQ Composite). The graph assumes that $100 was invested at the market close on May 18, 2012 in the Class A common stock of Facebook, Inc., the S&P 500 Index and the NASDAQ Composite and data for the S&P 500 Index and the NASDAQ Composite assumes reinvestments of dividends. The stock price performance of the following graph is not necessarily indicative of future stock price performance.
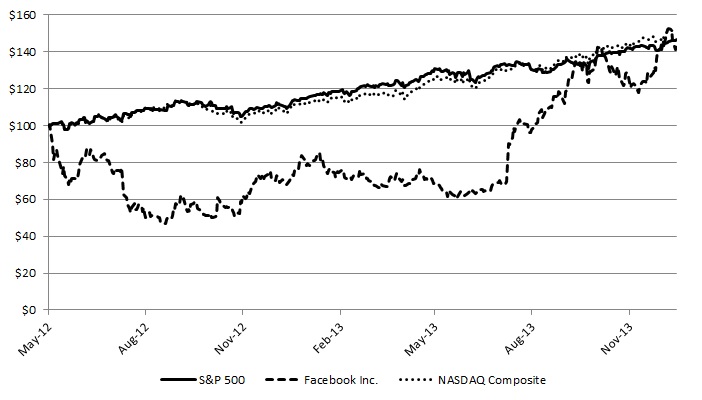
Securities Authorized for Issuance under Equity Compensation Plans
The information required by this item with respect to our equity compensation plans is incorporated by reference to our Proxy Statement for the 2014 Annual Meeting of Stockholders to be filed with the Securities and Exchange Commission within 120 days of the fiscal year ended
December 31, 2013
.
33
|
Item 6.
|
Selected Financial Data.
|
You should read the following selected consolidated financial data in conjunction with Part II, Item 7, "Management's Discussion and Analysis of Financial Condition and Results of Operations," and our consolidated financial statements and the related notes included in Part II, Item 8, "Financial Statements and Supplementary Data" of this Annual Report on Form 10-K.
The consolidated statements of income data for each of the years ended
December 31, 2013
,
2012
, and
2011
and the consolidated balance sheets data as of
December 31, 2013
and
2012
are derived from our audited consolidated financial statements included in Part II, Item 8, "Financial Statements and Supplementary Data" of this Annual Report on Form 10-K. The consolidated statements of income data for the years ended
December 31, 2010
and
2009
and the consolidated balance sheets data as of
December 31, 2011
,
2010
, and
2009
are derived from our audited consolidated financial statements that are not included in this Annual Report on Form 10-K. Our historical results are not necessarily indicative of our results in any future period.
|
Year Ended December 31,
|
|||||||||||||||||||
|
2013
|
2012
|
2011
|
2010
|
2009
|
|||||||||||||||
|
(in millions, except per share data)
|
|||||||||||||||||||
|
Consolidated Statements of Income Data:
|
|||||||||||||||||||
|
Revenue
|
$
|
7,872
|
|
$
|
5,089
|
|
$
|
3,711
|
|
$
|
1,974
|
|
$
|
777
|
|
||||
|
Total costs and expenses
(1)
|
5,068
|
|
4,551
|
|
1,955
|
|
942
|
|
515
|
|
|||||||||
|
Income from operations
|
2,804
|
|
538
|
|
1,756
|
|
1,032
|
|
262
|
|
|||||||||
|
Income before provision for income taxes
|
2,754
|
|
494
|
|
1,695
|
|
1,008
|
|
254
|
|
|||||||||
|
Net income
|
1,500
|
|
53
|
|
1,000
|
|
606
|
|
229
|
|
|||||||||
|
Net income attributable to Class A and Class B common stockholders
|
1,491
|
|
32
|
|
668
|
|
372
|
|
122
|
|
|||||||||
|
Earnings per share attributable to Class A and Class B common stockholders
(2)
:
|
|||||||||||||||||||
|
Basic
|
$
|
0.62
|
|
$
|
0.02
|
|
$
|
0.52
|
|
$
|
0.34
|
|
$
|
0.12
|
|
||||
|
Diluted
|
$
|
0.60
|
|
$
|
0.01
|
|
$
|
0.46
|
|
$
|
0.28
|
|
$
|
0.10
|
|
||||
|
(1)
|
Total costs and expenses include
$906 million
,
$1.57 billion
,
$217 million
, $20 million and $27 million of share-based compensation for the years ended
December 31, 2013
,
2012
,
2011
,
2010
and
2009
, respectively.
|
|
(2)
|
See Note 3 of the notes to our consolidated financial statements for a description of our computation of basic and diluted earnings per share attributable to Class A and Class B common stockholders.
|
|
As of December 31,
|
|||||||||||||||||||
|
2013
|
2012
|
2011
|
2010
|
2009
|
|||||||||||||||
|
(in millions)
|
|||||||||||||||||||
|
Consolidated Balance Sheets Data:
|
|||||||||||||||||||
|
Cash, cash equivalents, and marketable securities
|
$
|
11,449
|
|
$
|
9,626
|
|
$
|
3,908
|
|
$
|
1,785
|
|
$
|
633
|
|
||||
|
Working capital
|
11,970
|
|
10,215
|
|
3,705
|
|
1,857
|
|
703
|
|
|||||||||
|
Property and equipment, net
|
2,882
|
|
2,391
|
|
1,475
|
|
574
|
|
148
|
|
|||||||||
|
Total assets
|
17,895
|
|
15,103
|
|
6,331
|
|
2,990
|
|
1,109
|
|
|||||||||
|
Capital lease obligations
|
476
|
|
856
|
|
677
|
|
223
|
|
95
|
|
|||||||||
|
Long-term debt
|
—
|
|
1,500
|
|
—
|
|
250
|
|
—
|
|
|||||||||
|
Total liabilities
|
2,425
|
|
3,348
|
|
1,432
|
|
828
|
|
241
|
|
|||||||||
|
Additional paid-in capital
|
12,297
|
|
10,094
|
|
2,684
|
|
947
|
|
253
|
|
|||||||||
|
Total stockholders' equity
|
15,470
|
|
11,755
|
|
4,899
|
|
2,162
|
|
868
|
|
|||||||||
Free Cash Flow
In addition to other financial measures presented in accordance with U.S. generally accepted accounting principles (GAAP), we monitor free cash flow (FCF) as a non-GAAP measure to manage our business, make planning decisions, evaluate our performance, and allocate resources. We define FCF as net cash provided by operating activities reduced by purchases of property and equipment and property and equipment acquired under capital leases.
34
We believe that FCF is one of the key financial indicators of our business performance over the long term and provides useful information regarding how cash provided by operating activities compares to the property and equipment investments required to maintain and grow our business. We have chosen to subtract both purchases of property and equipment and property and equipment acquired under capital leases in our calculation of FCF because we believe that these two items collectively represent the amount of property and equipment we need to procure to support our business, regardless of whether we finance such property or equipment with a capital lease. The market for financing servers and other technical equipment is dynamic and we expect our use of capital leases could vary significantly from year to year.
We have chosen our definition for FCF because we believe that this methodology can provide useful supplemental information to help investors better understand underlying trends in our business. We use FCF in discussions with our senior management and board of directors.
FCF has limitations as an analytical tool, and you should not consider it in isolation or as a substitute for analysis of other GAAP financial measures, such as net cash provided by operating activities. Some of the limitations of FCF are:
|
•
|
FCF does not reflect our future contractual commitments; and
|
|
•
|
other companies in our industry present similarly titled measures differently than we do, limiting their usefulness as comparative measures.
|
Management compensates for the inherent limitations associated with using the FCF measure through disclosure of such limitations, presentation of our financial statements in accordance with GAAP, and reconciliation of FCF to the most directly comparable GAAP measure, net cash provided by operating activities, as presented below.
The following is a reconciliation of FCF to the most comparable GAAP measure, net cash provided by operating activities:
|
Year Ended December 31,
|
|||||||||||||||||||
|
2013
|
2012
|
2011
|
2010
|
2009
|
|||||||||||||||
|
(in millions)
|
|||||||||||||||||||
|
Net cash provided by operating activities
(1)
|
$
|
4,222
|
|
$
|
1,612
|
|
$
|
1,549
|
|
$
|
698
|
|
$
|
155
|
|
||||
|
Purchases of property and equipment
|
(1,362
|
)
|
(1,235
|
)
|
(606
|
)
|
(293
|
)
|
(33
|
)
|
|||||||||
|
Property and equipment acquired under capital leases
|
(11
|
)
|
(340
|
)
|
(473
|
)
|
(217
|
)
|
(56
|
)
|
|||||||||
|
Free cash flow
|
$
|
2,849
|
|
$
|
37
|
|
$
|
470
|
|
$
|
188
|
|
$
|
66
|
|
||||
|
(1)
|
For the year ended December 31, 2012, net cash provided by operating activities was reduced by $451 million of income tax refundable from income tax loss carrybacks due to the recognition of tax benefits related to share-based compensation from RSUs granted prior to January 1, 2011. We received substantially all of this refund in 2013 which increased our net cash provided by operating activities and FCF for the year ended December 31, 2013.
|
35
|
Item 7.
|
Management's Discussion and Analysis of Financial Condition and Results of Operations
|
You should read the following discussion of our financial condition and results of operations in conjunction with our consolidated financial statements and the related notes included in Part II, Item 8, "Financial Statements and Supplementary Data" of this Annual Report on Form 10-K. In addition to our historical consolidated financial information, the following discussion contains forward-looking statements that reflect our plans, estimates, and beliefs. Our actual results could differ materially from those discussed in the forward-looking statements. Factors that could cause or contribute to these differences include those discussed below and elsewhere in this Annual Report on Form 10-K, particularly in Part I, Item 1A, "Risk Factors." For a discussion of limitations in the measurement of certain of our user metrics, see the section entitled "Limitations of Key Metrics and Other Data."
Overview
Our mission is to give people the power to share and make the world more open and connected.
We build products that support our mission by creating value for users, marketers, and developers:
Users.
We enable people who use Facebook to stay connected with their friends and family, to discover and learn what is going on in the world around them, and to share and express what matters to them to the people they care about.
Marketers.
We enable marketers to engage with more than
1.2 billion
monthly active users (MAUs) on Facebook or subsets of our users based on information they have chosen to share with us such as their age, location, gender, or interests. We offer marketers benefits such as targeted reach, engagement, Facebook ads, Facebook ad system and ad measurement.
Developers.
We enable developers to use Facebook's developer services to build, grow and monetize their mobile and web applications that integrate with Facebook more rapidly and successfully.
We generate substantially all of our revenue from advertising and from fees associated with our Payments infrastructure that enables users to purchase virtual and digital goods from developers with applications on the Facebook website. F
or the year ended
December 31, 2013
, we recorded revenue of
$7.87 billion
, income from operations of
$2.8 billion
and net income of
$1.5 billion
.
36
Trends in Our User Metrics
The numbers for our key metrics, our daily active users (DAUs), mobile DAUs, MAUs, mobile MAUs and average revenue per user (ARPU), and certain other metric such as mobile-only DAUs and mobile-only MAUs, do not include Instagram users unless they would otherwise qualify as such users, respectively, based on their other activities on Facebook. In addition, other user engagement metrics do not include Instagram unless otherwise specifically stated.
Trends in the number of our users affect our revenue and financial results by influencing the number of ads we are able to show, the volume of Payments transactions, as well as our expenses and capital expenditures.
|
•
|
Daily Active Users (DAUs).
We define a daily active user as a registered Facebook user who logged in and visited Facebook through our website or a mobile device, used our Messenger app, or took an action to share content or activity with his or her Facebook friends or connections via a third-party website or application that is integrated with Facebook, on a given day. We view DAUs, and DAUs as a percentage of MAUs, as measures of user engagement.
|
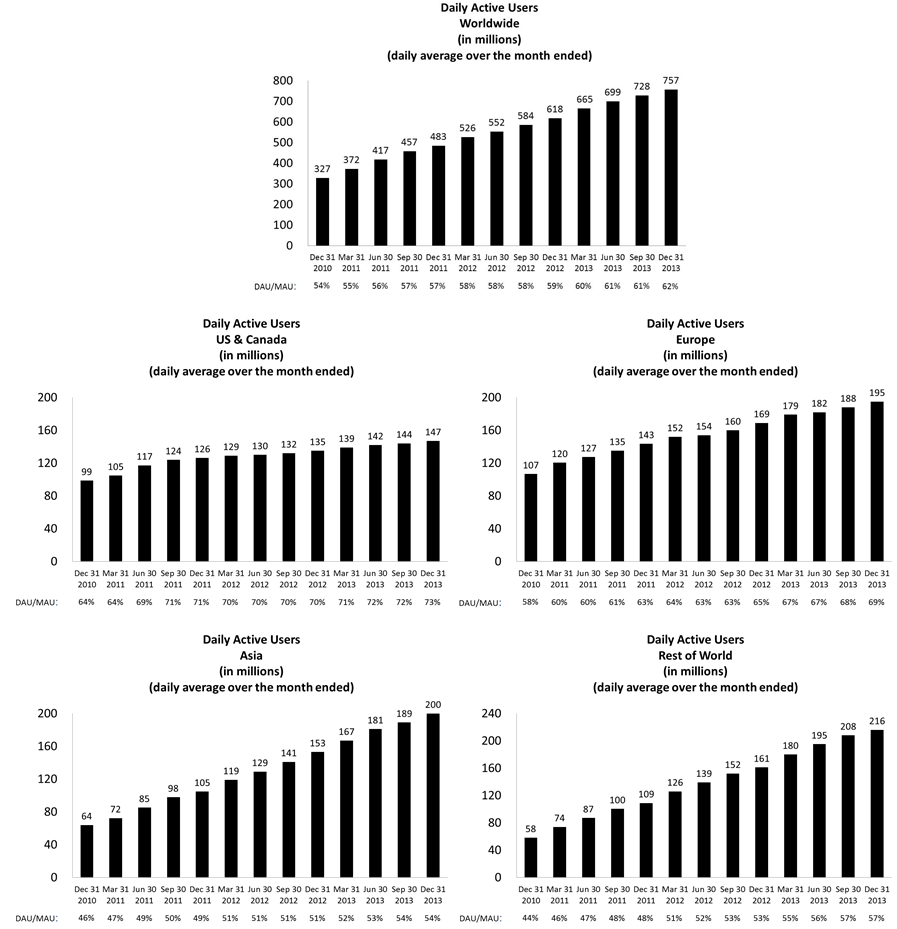
Note: For purposes of reporting DAUs, MAUs, and ARPU by geographic region, Europe includes all users in Russia and Turkey, Asia includes all users in Australia and New Zealand, and Rest of World includes all users in Africa, Latin America, and the Middle East.
37
Worldwide DAUs increased
22%
to
757 million
on average during
December 2013
from
618 million
during
December 2012
. We experienced growth in DAUs across major markets including Brazil, India and the United States. Overall growth in DAUs was driven largely by increased mobile usage of Facebook. The number of DAUs using personal computers decreased modestly in December 2013 compared to the same period in
2012
.
|
•
|
Mobile DAUs
. We define a mobile DAU as a user who accessed Facebook via a mobile application or via versions of our website such as m.facebook.com, whether on a mobile phone or tablet, on a given day.
|
Worldwide mobile DAUs increased
49%
to
556 million
on average during
December 2013
from
374 million
during
December 2012
. In all regions, an increasing number of our DAUs are accessing Facebook through mobile devices, with users in Brazil, United States and India representing key sources of mobile growth on average during December
2013
as compared to the same period during
2012
. There were
395 million
mobile DAUs who accessed Facebook solely through mobile applications or our mobile website on average during the month ended
December 31, 2013
, increasing
65%
from
240 million
during the same period in
2012
. The remaining
161 million
mobile DAUs accessed Facebook from both personal computers and mobile devices during
December 2013
. We anticipate that the rate of growth in mobile usage will continue to be the primary driver of our user growth for the foreseeable future and that usage through personal computers may be flat or decline worldwide, including in key markets such as the United States and other developed markets in Europe and Asia.
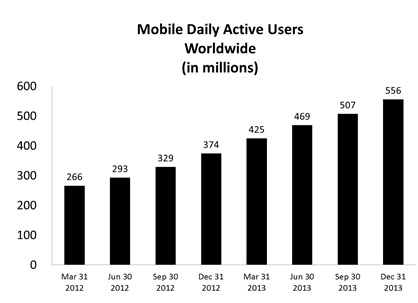
38
|
•
|
Monthly Active Users (MAUs).
We define a monthly active user as a registered Facebook user who logged in and visited Facebook through our website or a mobile device, used our Messenger app, or took an action to share content or activity with his or her Facebook friends or connections via a third-party website or application that is integrated with Facebook, in the last 30 days as of the date of measurement. MAUs are a measure of the size of our global active user community.
|
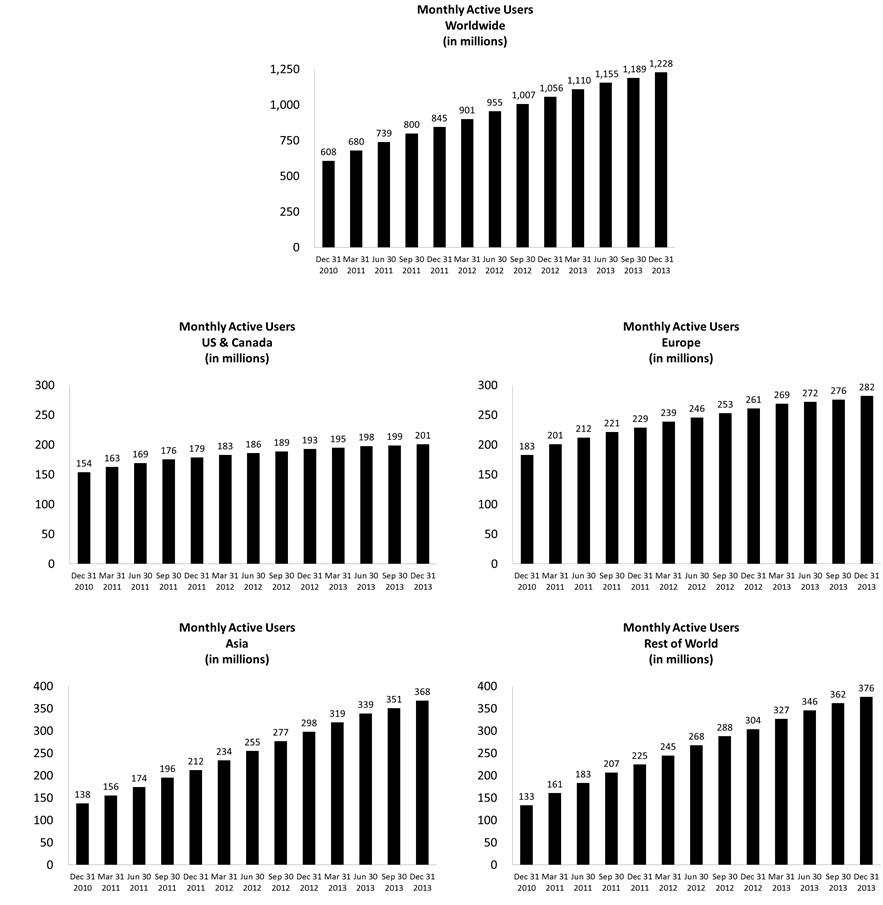
As of
December 31, 2013
, we had
1.23 billion
MAUs, an increase of
16%
from
December 31, 2012
. Users in India, Brazil and Mexico represented key sources of growth in
2013
relative to the prior year.
|
•
|
Mobile MAUs
. We define a mobile MAU as a user who accessed Facebook via a mobile application or via versions of our website such as m.facebook.com, whether on a mobile phone or tablet, during the period of measurement.
|
39
Worldwide mobile MAUs increased
39%
to
945 million
as of
December 31, 2013
from
680 million
as of
December 31, 2012
. In all regions, an increasing number of our MAUs are accessing Facebook through mobile devices, with users in India, Brazil, and the United States representing key sources of mobile growth over the fourth quarter of
2013
as compared to the same period in
2012
. There were
296 million
mobile MAUs who accessed Facebook solely through mobile applications or our mobile website during the month ended
December 31, 2013
, increasing
89%
from
157 million
during the same period in
2012
. The remaining
649 million
mobile MAUs accessed Facebook from both personal computers and mobile devices during
December 2013
. We anticipate that the rate of growth in mobile usage will continue to be the primary driver of our user growth for the foreseeable future and that usage through personal computers will decline worldwide, including in key markets such as the United States and other developed markets in Europe and Asia.
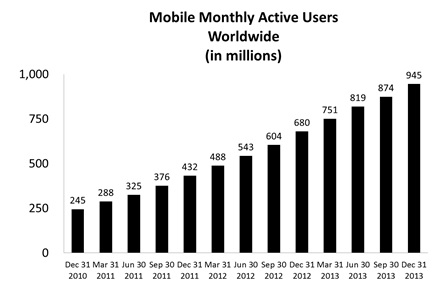
40
Trends in Our Monetization by User Geography
We calculate our revenue by user geography based on our estimate of the geography in which ad impressions are delivered or virtual and digital goods are purchased. We define ARPU as our total revenue in a given geography during a given quarter, divided by the average of the number of MAUs in the geography at the beginning and end of the quarter. Annual ARPU is the sum of respective quarterly ARPU amounts in that year. The geography of our users affects our revenue and financial results because we currently monetize users in different geographies at different average rates. Our revenue and ARPU in regions such as United States & Canada and Europe are relatively higher due to the size and maturity of those advertising markets as well as our greater sales presence and the number of payment methods that we make available to marketers and users. For example, ARPU for an average user in 2013 in United States & Canada is more than five times higher than for an average user in Asia.
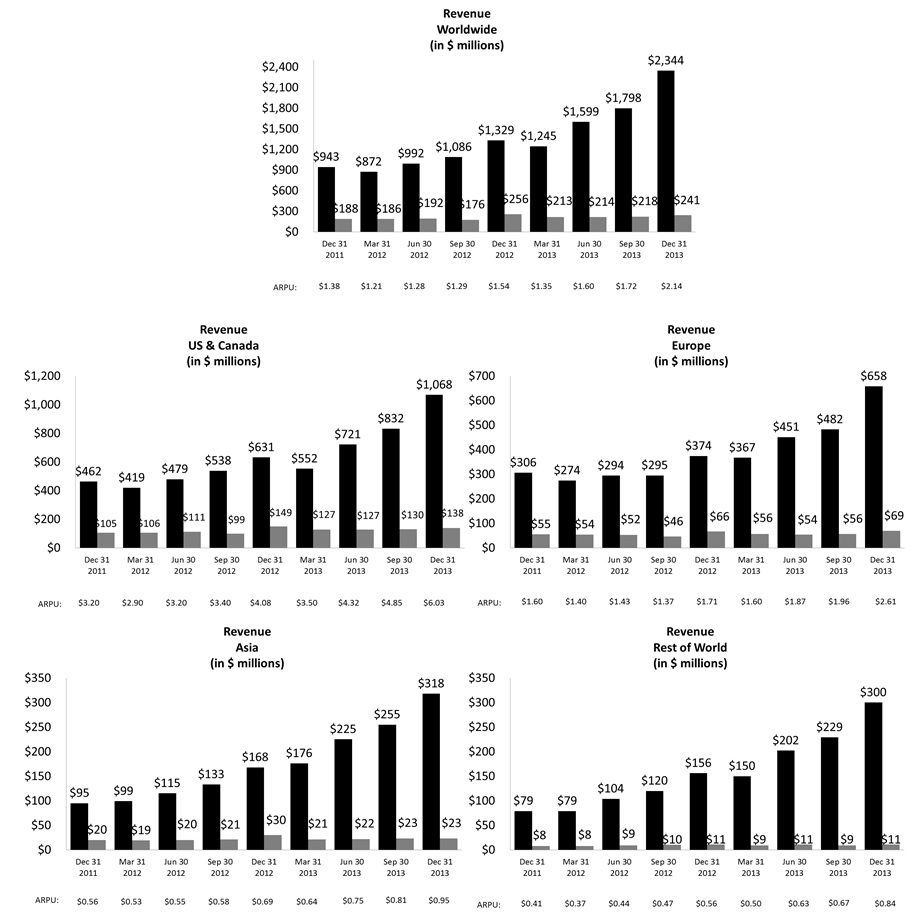

Note: Our revenue by user geography in the charts above is geographically apportioned based on our estimation of the geographic location of our users when they perform a revenue-generating activity. This allocation differs from our revenue by geography disclosure in our consolidated financial statements where revenue is geographically apportioned based on the location of the marketer or developer.
41
For
2013
, worldwide ARPU was
$6.81
, an increase of
28%
from
2012
. Over this period, ARPU increased by approximately 43% in Rest of World, 38% in the United States & Canada, 36% in Europe and 34% in Asia. User growth was more rapid in geographies with relatively lower ARPU, such as Asia and Rest of World. We expect that user growth in the future will continue to be higher in those regions where ARPU is relatively lower, such as Asia and Rest of World, such that worldwide ARPU may continue to increase at a slower rate relative to ARPU in any geographic region, or potentially decrease even if ARPU increases in each geographic region.
Critical Accounting Policies and Estimates
Our consolidated financial statements are prepared in accordance with U.S. generally accepted accounting principles (GAAP). The preparation of these consolidated financial statements requires us to make estimates and assumptions that affect the reported amounts of assets, liabilities, revenue, costs and expenses, and related disclosures. We evaluate our estimates and assumptions on an ongoing basis. Our estimates are based on historical experience and various other assumptions that we believe to be reasonable under the circumstances. Our actual results could differ from these estimates.
An accounting policy is deemed to be critical if it requires an accounting estimate to be made based on assumptions about matters that are highly uncertain at the time the estimate is made, if different estimates reasonably could have been used, or if changes in the estimate that are reasonably possible could materially impact the financial statements. We believe that the assumptions and estimates associated with revenue recognition for payments and other fees, income taxes, share-based compensation, loss contingencies, and business combinations and valuation of goodwill and other acquired intangible assets have the greatest potential impact on our consolidated financial statements. Therefore, we consider these to be our critical accounting policies and estimates. For further information on all of our significant accounting policies, see Note 1 of our accompanying Notes to Consolidated Financial Statements included in Part II, Item 8, "Financial Statements and Supplementary Data" of this Annual Report on Form 10-K.
Revenue Recognition for Payments and Other Fees
We enable Payments from our users to developers with applications on the Facebook website. Our users can make payments on Facebook by using debit and credit cards, PayPal, mobile phone payments, gift cards or other methods. We receive a fee from developers when a user engages in a payment transaction for the purchase of a virtual or digital good on the Facebook website.
The price of the virtual or digital good is a price that is solely determined by the developer. We remit to the developer an amount that is based on the total amount of transaction less the processing fee that we charge the developer for the service performed. Our revenue is the net amount of the transaction representing our processing fee for the transaction. We record revenue on a net basis as we do not consider ourselves to be the principal in the sale of the virtual or digital good to the user. Under GAAP guidance related to reporting revenue gross as a principal versus net as an agent, the indicators used to determine whether an entity is a principal or an agent to a transaction are subject to judgment. We consider ourselves the agent to these transactions when we apply the indicators to our facts. Should material subsequent changes in the substance or nature of the transactions with developers result in us being considered the principal in such sales, we would reflect the virtual and digital goods sale as revenue and the amounts paid to the developers as an associated cost.
Income Taxes
We are subject to income taxes in the United States and numerous foreign jurisdictions. Significant judgment is required in determining our provision for income taxes and income tax assets and liabilities, including evaluating uncertainties in the application of accounting principles and complex tax laws.
We record a provision for income taxes for the anticipated tax consequences of the reported results of operations using the asset and liability method. Under this method, we recognize deferred tax assets and liabilities for the expected future tax consequences of temporary differences between the financial reporting and tax bases of assets and liabilities, as well as for operating loss and tax credit carryforwards. Deferred tax assets and liabilities are measured using the tax rates that are expected to apply to taxable income for the years in which those tax assets and liabilities are expected to be realized or settled. We record a valuation allowance to reduce our deferred tax assets to the net amount that we believe is more likely than not to be realized.
We recognize tax benefits from uncertain tax positions only if we believe that it is more likely than not that the tax position will be sustained on examination by the taxing authorities based on the technical merits of the position. Although we believe that we have adequately reserved for our uncertain tax positions, we can provide no assurance that the final tax outcome of these matters will not be materially different. We make adjustments to these reserves when facts and circumstances change, such as the closing of a tax audit or the refinement of an estimate. To the extent that the final tax outcome of these matters is different than the amounts recorded, such differences will affect the provision for income taxes in the period in which such determination is made and could have a material impact on our financial condition and operating results. The provision for income taxes includes the effects of any reserves that we believe are appropriate, as well as the related net interest and penalties.
Share-based Compensation
Prior to January 1, 2011 we granted RSUs (Pre-2011 RSUs) to our employees and members of our board of directors that vested upon the satisfaction of both a service-based condition, generally over four years, and a liquidity condition. The liquidity condition was
42
satisfied in connection with our IPO in May 2012. Therefore, we did not recognize any expense relating to the granting of the Pre-2011 RSUs until the completion of our IPO. For the Pre-2011 RSUs, we recognize share-based compensation expense using the accelerated attribution method, net of estimated forfeitures, in which compensation cost for each vesting tranche in an award is recognized ratably from the service inception date to the vesting date for that tranche.
RSUs granted on or after January 1, 2011 (Post-2011 RSUs) are not subject to a liquidity condition in order to vest, and compensation expense related to these grants is based on the grant date fair value of the RSUs and is recognized on a straight-line basis over the applicable service period. The majority of Post-2011 RSUs are earned over a service period of
four
to
five years
. For Post-2011 RSUs, which are only subject to a service condition, we recognize share-based compensation expense on a ratable basis over the requisite service period for the entire award.
We account for share-based employee compensation plans under the fair value recognition and measurement provisions in accordance with applicable accounting standards, which require all share-based payments to employees, including grants of stock options and RSUs, to be measured based on the grant-date fair value of the awards.
Share-based compensation expense is recorded net of estimated forfeitures in our consolidated statements of income and as such is recorded for only those share-based awards that we expect to vest. We estimate the forfeiture rate based on historical forfeitures of equity awards and adjust the rate to reflect changes in facts and circumstances, if any. We will revise our estimated forfeiture rate if actual forfeitures differ from our initial estimates.
We have historically issued unvested restricted shares to employee stockholders of certain acquired companies. As these awards are generally subject to continued post-acquisition employment, we have accounted for them as post-acquisition share-based compensation expense. We recognize compensation expense equal to the grant date fair value of the common stock on a straight-line basis over the employee's required service period.
Loss Contingencies
We are involved in various lawsuits, claims, investigations and proceedings that arise in the ordinary course of business. Certain of these matters include speculative claims for substantial or indeterminate amounts of damages. We record a liability when we believe that it is both probable that a loss has been incurred and the amount can be reasonably estimated. Significant judgment is required to determine both probability and the estimated amount. We review these provisions at least quarterly and adjust these provisions accordingly to reflect the impact of negotiations, settlements, rulings, advice of legal counsel, and updated information.
We believe that the amount or estimable range of reasonably possible loss, will not, either individually or in the aggregate, have a material adverse effect on our business, consolidated financial position, results of operations, or cash flows with respect to loss contingencies for legal and other contingencies as of
December 31, 2013
. However, the outcome of litigation is inherently uncertain. Therefore, if one or more of these legal matters were resolved against us for amounts in excess of management's expectations, our results of operations and financial condition, including in a particular reporting period, could be materially adversely affected.
Business Combinations and Valuation of Goodwill and Other Acquired Intangible Assets
We allocate the fair value of purchase consideration to the tangible assets acquired, liabilities assumed and intangible assets acquired based on their estimated fair values. The excess of the fair value of purchase consideration over the fair values of these identifiable assets and liabilities is recorded as goodwill. Such valuations require management to make significant estimates and assumptions, especially with respect to intangible assets. During the measurement period, which is one year from the acquisition date, we may record adjustments to the assets acquired and liabilities assumed, with the corresponding offset to goodwill. Upon the conclusion of the measurement period, any subsequent adjustments are recorded to earnings.
We review goodwill for impairment at least annually or more frequently if events or changes in circumstances indicate that the carrying value of goodwill may not be recoverable. We have elected to first assess the qualitative factors to determine whether it is more likely than not that the fair value of our single reporting operating unit is less than its carrying amount as a basis for determining whether it is necessary to perform the two-step goodwill impairment under Accounting Standards Update (ASU) No. 2011-08,
Goodwill and Other (Topic 350): Testing Goodwill for Impairment,
issued by the Financial Accounting Standards Board (FASB). If we determine that it is more likely than not that its fair value is less than its carrying amount, then the two-step goodwill impairment test will be performed. The first step, identifying a potential impairment, compares the fair value of the reporting unit with its carrying amount. If the carrying amount exceeds its fair value, the second step will be performed; otherwise, no further step is required. The second step, measuring the impairment loss, compares the implied fair value of the goodwill with the carrying amount of the goodwill. Any excess of the goodwill carrying amount over the applied fair value is recognized as an impairment loss, and the carrying value of goodwill is written down to fair value. As of
December 31, 2013
, no impairment of goodwill has been identified.
Acquired intangible assets are amortized over their estimated useful lives. We evaluate the recoverability of amortizable intangible assets for possible impairment whenever events or circumstances indicate that the carrying amount of such assets may not be recoverable. Recoverability of these assets is measured by a comparison of the carrying amounts to the future undiscounted cash flows the assets are
43
expected to generate. If such review indicates that the carrying amount of property and equipment and intangible assets is not recoverable, the carrying amount of such assets is reduced to fair value. We have not recorded any such impairment charge during the years presented.
In addition to the recoverability assessment, we routinely review the remaining estimated useful lives of our amortizable intangible assets. If we reduce the estimated useful life assumption for any asset, the remaining unamortized balance would be amortized over the revised estimated useful life.
Components of Results of Operations
Revenue
We generate substantially all of our revenue from advertising and from fees associated with our Payments infrastructure that enables users to purchase virtual and digital goods from our developers with applications on the Facebook website.
Advertising.
Our advertising revenue is generated by displaying ad products on the Facebook website or mobile application and third-party affiliated websites or mobile applications. Marketers pay for ad products either directly or through their relationships with advertising agencies, based on the number of clicks made by our users, the number of actions taken by our users or the number of impressions delivered. We recognize revenue from the delivery of click-based ads in the period in which a user clicks on the content, and action-based ads in the period in which a user takes the action the marketer contracted for. We recognize revenue from the display of impression-based ads in the contracted period in which the impressions are delivered. Impressions are considered delivered when an ad is displayed to users. The number of ads we show is subject to methodological changes as we continue to evolve our ads business and the structure of our ads products. Whether we count the initial display only or every display of an ad as an impression is dependent on where the ad is displayed. For example, an individual ad in News Feed that is purchased on an impression basis may be displayed to users more than once during a day; however, only the initial display of the ad is considered an impression, regardless of how many times the ad is actually displayed within the News Feed to a particular user. We calculate price per ad as total ad revenue divided by the number of ads delivered, representing the effective price paid per impression by a marketer regardless of their desired objective such as impression, click, or action.
Payments and other fees.
We enable Payments from our users to purchase virtual and digital goods from our developers with applications on the Facebook website. Our users can transact and make payments on the Facebook website by using debit and credit cards, PayPal, mobile phone payments, gift cards or other methods. We receive a fee from developers when users make purchases in these applications using our Payments infrastructure. We recognize revenue net of amounts remitted to our developers. We have mandated the use of our Payments infrastructure for game applications on Facebook, and fees related to Payments are generated almost exclusively from games. Our other fees revenue, which has not been significant in recent periods, consists primarily of user Promoted Posts and our ad serving and measurement products.
Cost of Revenue and Operating Expenses
Cost of revenue.
Our cost of revenue consists primarily of expenses associated with the delivery and distribution of our products. These include expenses related to the operation of our data centers such as facility and server equipment depreciation, facility and server equipment rent expense, energy and bandwidth costs, support and maintenance costs, and salaries, benefits, and share-based compensation for employees on our operations teams. Cost of revenue also includes credit card and other transaction fees related to processing customer transactions.
Research and development.
Research and development expenses consist primarily of salaries, benefits, and share-based compensation for employees on our engineering and technical teams who are responsible for building new products as well as improving existing products. We expense all of our research and development costs as they are incurred.
Marketing and sales.
Our marketing and sales expenses consist primarily of salaries, benefits, and share-based compensation for our employees engaged in sales, sales support, marketing, business development, and customer service functions. Our marketing and sales expenses also include user-, developer-, and marketer-facing marketing and promotional expenditures.
General and administrative.
Our general and administrative expenses consist primarily of salaries, benefits, and share-based compensation for our executives as well as our legal, finance, human resources, corporate communications and policy, and other administrative employees. In addition, general and administrative expenses include outside consulting fees, and legal and accounting services. General and administrative expenses also include legal settlements and amortization of patents we acquired.
44
Results of Operations
The following table set forth our consolidated statements of income data:
|
Year Ended December 31,
|
|||||||||||
|
2013
|
2012
|
2011
|
|||||||||
|
(in millions)
|
|||||||||||
|
Consolidated Statements of Income Data:
|
|||||||||||
|
Revenue
|
$
|
7,872
|
|
$
|
5,089
|
|
$
|
3,711
|
|
||
|
Costs and expenses:
|
|
|
|||||||||
|
Cost of revenue
|
1,875
|
|
1,364
|
|
860
|
|
|||||
|
Research and development
|
1,415
|
|
1,399
|
|
388
|
|
|||||
|
Marketing and sales
|
997
|
|
896
|
|
393
|
|
|||||
|
General and administrative
|
781
|
|
892
|
|
314
|
|
|||||
|
Total costs and expenses
|
5,068
|
|
4,551
|
|
1,955
|
|
|||||
|
Income from operations
|
2,804
|
|
538
|
|
1,756
|
|
|||||
|
Interest and other expense, net
|
(50
|
)
|
(44
|
)
|
(61
|
)
|
|||||
|
Income before provision for income taxes
|
2,754
|
|
494
|
|
1,695
|
|
|||||
|
Provision for income taxes
|
1,254
|
|
441
|
|
695
|
|
|||||
|
Net income
|
$
|
1,500
|
|
$
|
53
|
|
$
|
1,000
|
|
||
Share-based compensation expense included in costs and expenses:
|
Year Ended December 31,
|
|||||||||||
|
2013
|
2012
|
2011
|
|||||||||
|
(in millions)
|
|||||||||||
|
Cost of revenue
|
$
|
42
|
|
$
|
88
|
|
$
|
9
|
|
||
|
Research and development
|
604
|
|
843
|
|
114
|
|
|||||
|
Marketing and sales
|
133
|
|
306
|
|
37
|
|
|||||
|
General and administrative
|
127
|
|
335
|
|
57
|
|
|||||
|
Total share-based compensation expense
|
$
|
906
|
|
$
|
1,572
|
|
$
|
217
|
|
||
The following table set forth our consolidated statements of income data (as a percentage of revenue):
|
Year Ended December 31,
|
||||||||
|
2013
|
2012
|
2011
|
||||||
|
Consolidated Statements of Income Data:
|
||||||||
|
Revenue
|
100
|
%
|
100
|
%
|
100
|
%
|
||
|
Costs and expenses:
|
||||||||
|
Cost of revenue
|
24
|
|
27
|
|
23
|
|
||
|
Research and development
|
18
|
|
27
|
|
10
|
|
||
|
Marketing and sales
|
13
|
|
18
|
|
11
|
|
||
|
General and administrative
|
10
|
|
18
|
|
8
|
|
||
|
Total costs and expenses
|
64
|
|
89
|
|
53
|
|
||
|
Income from operations
|
36
|
|
11
|
|
47
|
|
||
|
Interest and other expense, net
|
(1
|
)
|
(1
|
)
|
(2
|
)
|
||
|
Income before provision for income taxes
|
35
|
|
10
|
|
46
|
|
||
|
Provision for income taxes
|
16
|
|
9
|
|
19
|
|
||
|
Net income
|
19
|
%
|
1
|
%
|
27
|
%
|
||
45
Share-based compensation expense included in costs and expenses (as a percentage of revenue):
|
|
Year Ended December 31,
|
|||||||
|
|
2013
|
2012
|
2011
|
|||||
|
Cost of revenue
|
1
|
%
|
2
|
%
|
—
|
%
|
||
|
Research and development
|
8
|
|
17
|
|
3
|
|
||
|
Marketing and sales
|
2
|
|
6
|
|
1
|
|
||
|
General and administrative
|
2
|
|
7
|
|
2
|
|
||
|
Total share-based compensation expense
|
12
|
%
|
31
|
%
|
6
|
%
|
||
Revenue
|
|
Year Ended December 31,
|
2013 vs 2012
% Change |
2012 vs 2011
% Change |
||||||||||||||
|
|
2013
|
2012
|
2011
|
||||||||||||||
|
|
(in millions)
|
|
|
||||||||||||||
|
Advertising
|
$
|
6,986
|
|
$
|
4,279
|
|
$
|
3,154
|
|
63
|
%
|
36
|
%
|
||||
|
Payments and other fees
|
886
|
|
810
|
|
557
|
|
9
|
%
|
45
|
%
|
|||||||
|
Total revenue
|
$
|
7,872
|
|
$
|
5,089
|
|
$
|
3,711
|
|
55
|
%
|
37
|
%
|
||||
2013
Compared to
2012
.
Revenue in
2013
increased
$2.78 billion
, or
55%
compared to
2012
. The increase was due primarily to a
63%
increase in advertising revenue during
2013
as compared to
2012
.
The most important factor driving advertising revenue growth was an increase in revenue from ads in News Feed on both mobile devices and personal computers. News Feed ads are displayed more prominently, have significantly higher levels of engagement and a higher price per ad relative to our other ad placements. In
2013
, we estimate that mobile advertising revenue represented approximately
45%
of total advertising revenue, as compared with
11%
in
2012
. Other factors that influenced our advertising revenue growth in
2013
included an increase in the number of marketers actively advertising on Facebook, which we believe increased demand for our ad inventory, and a
22%
growth in average DAUs from December 2012 to December 2013.
In 2013 compared to 2012, we increased the number of ads shown by 20% and the average price per ad by 36%. The increase in average price per ad was driven primarily by the increased number of News Feed ads on both mobile devices and personal computers, offset partially by product changes including our decision to lower the market reserve price, i.e. the minimum price threshold accepted in our auction. The increase in the number of ads shown was driven by user growth and the reserve price change, partially offset by a shift towards more usage on mobile devices, where we show fewer ads than on personal computers.
Advertising revenue in the fourth quarter of
2013
increased
76%
compared to the same period in
2012
. The increase in ad revenue in the fourth quarter of 2013 was driven by the same factors that drove 2013 annual ad revenue growth, primarily an increase in revenue from ads in News Feed on both mobile devices and personal computers. For the fourth quarter of 2013, we estimate that mobile advertising revenue represented approximately
53%
of total advertising revenue, as compared with
23%
in the same period in 2012.
Advertising spending is traditionally seasonally strong in the fourth quarter of each year. We believe that this seasonality in advertising spending affects our quarterly results, which generally reflect significant growth in advertising revenue between the third and fourth quarters and a decline in advertising spending between the fourth and subsequent first quarters. For instance, our advertising revenue increased 30%, 22%, and 18% between the third and fourth quarters of 2013, 2012 and 2011, respectively, while advertising revenue for the first quarter of 2013 and 2012 declined 6% and 8% compared to the fourth quarters of 2012 and 2011, respectively.
Payments and other fees revenue in 2013 increased
$76 million
, or
9%
, compared to 2012. The increase in Payments and other fees revenue is a result of increased Payments revenue from games played on Facebook on personal computers, and to a lesser extent, the inclusion of other fees revenue in 2013 from user Promoted Posts and our ad serving and measurement products.
Payments and other fees revenue in the fourth quarter of 2013 was $
241 million
, as compared to
$256 million
in the same period of 2012, which was affected by a one-time increase in Payments revenue in the fourth quarter of 2012. Our Payments terms and conditions provide for a 30-day claim period subsequent to a Payments transaction during which the customer may dispute the virtual or digital goods transaction. Due to lack of historical transactional information, through the third quarter of 2012, we deferred recognition of Payments revenue until the expiration of the claim period as we were unable to make reasonable and reliable estimates
46
of future refunds or chargebacks arising during this period. Beginning in the fourth quarter of 2012, we had 24 months of historical transactional information which enabled us to estimate future refunds and chargebacks. Accordingly, commencing in the fourth quarter of 2012, we recorded all Payments revenues at the time of the purchase of the related virtual or digital goods, net of estimated refunds or chargebacks. This change resulted in a one-time increase in Payments revenue in the fourth quarter of 2012 of approximately
$66 million
as we recognized revenue from four months of transactions.
In 2013, we generated approximately 46% of our revenue from marketers and developers based in the United States, compared to
51%
in 2012. The change is due to a faster growth rate of international users and to the expansion of international sales offices and payment methods. The majority of our revenue outside of the United States came from customers located in Western Europe, Canada, Australia and Brazil.
2012
Compared to
2011
.
Revenue in 2012 increased $1.38 billion, or 37% compared to 2011. The increase was due primarily to a 36% increase in advertising revenue during 2012 as compared to 2011.
Advertising revenue grew due to a 32% increase in the number of ads delivered during 2012 and to a 3% increase in the average price per ad. The increase in ads delivered was driven primarily by user growth. Average DAUs grew 28% from December 2011 to December 2012 and MAUs grew 25% from December 31, 2011 to December 31, 2012. Various product changes and changes in user engagement generally offset in their impact on the average number of ads per user. For example, the shift to greater mobile use generally reduced ads per user, while the introduction of ads in News Feed increased the number of ads per user. The rate of change in number of ads delivered also differs by geography, driven by factors such as mobile penetration. For example, Europe and Rest of World increased at a faster rate than the United States and Asia.
Growth in the average price per ad during 2012 compared to 2011 was driven primarily by an increase in price per ad in the United States, which benefited from growth in ads in News Feed across desktop and mobile devices. Ads in News Feed have a significantly higher average price per ad due to factors which include the prominent position of the ads. The increase in price per ad in the United States was partially offset by an increased percentage of our worldwide ads being delivered in the Asia and Rest of World geographies where the average price per ad, while growing on a year-over-year basis, is relatively lower. The average price per ad was also affected by a decline in the average price per ad in Europe in 2012 compared to 2011 due to the impact of foreign exchange rate changes, an increase in the percentage of ads being delivered in European regions where the average price per ads is relatively lower, and in part, we believe, to continuing weak economic conditions in that region affecting advertiser demand.
In 2012, we estimate that mobile advertising revenue as a percentage of advertising revenue was approximately
11%
. As mobile advertising was not offered prior to the first quarter of 2012, comparisons to prior year are not meaningful.
Payments and other fees revenue in 2012 increased $253 million, or 45%, compared to 2011. Excluding the one-time increase in Payments revenue described above, Payments and other fees revenue in 2012 increased 34% compared to 2011. Facebook Payments became mandatory for all game developers accepting payments on the Facebook website with limited exceptions on July 1, 2011. Accordingly, comparisons of Payments and other fees revenue to periods before this date may not be meaningful.
In 2012, we generated approximately
51%
of our revenue from marketers and developers based in the United States, compared to 56% in 2011. The change is due primarily to a faster growth rate of international users and, to a lesser extent, to the expansion of international sales offices and payment methods. The majority of our revenue outside of the United States came from customers located in western Europe, Canada, Australia and Brazil.
No customer represented 10% or more of total revenue during the years ended
December 31, 2013
and 2012 and one customer represented
12%
of total revenue for the year ended December 31, 2011.
Cost of revenue
|
Year Ended December 31,
|
|||||||||||||||||
|
2013
|
2012
|
2011
|
2013 vs 2012
% Change |
2012 vs 2011
% Change |
|||||||||||||
|
(dollars in millions)
|
|||||||||||||||||
|
Cost of revenue
|
$
|
1,875
|
|
$
|
1,364
|
|
$
|
860
|
|
37
|
%
|
59
|
%
|
||||
|
Percentage of revenue
|
24
|
%
|
27
|
%
|
23
|
%
|
|||||||||||
2013
Compared to
2012
.
Cost of revenue in
2013
increased
$511 million
, or
37%
, compared to
2012
. The increase was primarily due to operational expenses related to expanding our data center and technical infrastructure, including a $275 million increase in depreciation in 2013. In addition, we recognized
$117 million
of lease abandonment expense in 2013 primarily due to exiting certain
47
leased data centers resulting from the migration of operations to our own data centers. In the event that circumstances change such that we decide to re-occupy and utilize any of the data centers we have exited, we would reverse the remaining lease abandonment liability associated with those facilities. The increase in cost of revenue in 2013 was partially offset by a
$46 million
decrease in share-based compensation expense compared to 2012 mainly due to the recognition of expense in the prior period related to Pre-2011 RSUs as a result of our IPO in May 2012.
2012
Compared to
2011
.
Cost of revenue in 2012 increased $504 million, or 59%, compared to 2011. The increase was primarily due to expenses related to expanding our data center operations, including a $257 million increase in depreciation in 2012. Share-based compensation expense increased by $79 million in 2012 compared to 2011 mainly due to the recognition of expenses related to Pre-2011 RSUs triggered by the completion of our IPO in May 2012 and, to a lesser extent, Post-2011 RSUs. Increases in payroll and benefits expenses resulting from a 65% increase in employee headcount also contributed to the increase in cost of revenue in 2012. These expenses supported our user growth, the increased usage of products by users, developers, and marketers, and the launch of new products.
We anticipate that the cost of revenue will increase in dollar amount in 2014 and for the foreseeable future as we expand our data center capacity and technical infrastructure to support user growth, increased user engagement, and the delivery of new products and offerings. The expected increase in cost of revenue may be partially mitigated to the extent we are able to realize improvements in server and network performance and the efficiency of our technical operations.
Research and development
|
Year Ended December 31,
|
|||||||||||||||||
|
2013
|
2012
|
2011
|
2013 vs 2012
% Change |
2012 vs 2011
% Change |
|||||||||||||
|
(dollars in millions)
|
|||||||||||||||||
|
Research and development
|
$
|
1,415
|
|
$
|
1,399
|
|
$
|
388
|
|
1
|
%
|
261
|
%
|
||||
|
Percentage of revenue
|
18
|
%
|
27
|
%
|
10
|
%
|
|||||||||||
2013
Compared to
2012
.
Research and development expenses in
2013
increased
$16 million
, or
1%
, compared to
2012
. The increase was primarily due to an increase in payroll and benefits expense resulting from a
50%
growth in employee headcount from December 31, 2012 to December 31, 2013 in engineering and other technical functions. This increase in 2013 was offset by a
$239 million
decrease in share-based compensation expense compared to 2012 mainly due to the recognition of expense in the prior period related to Pre-2011 RSUs as a result of our IPO in May 2012.
2012
Compared to
2011
.
Research and development expenses in 2012 increased $1.01 billion, or 261%, compared to 2011. The increase was primarily due to an increase in share-based compensation expense of $729 million in 2012 resulting primarily from the recognition of expenses related to Pre-2011 RSUs triggered by the completion of our IPO in May 2012 and, to a lesser extent, Post-2011 RSUs. Payroll and benefits expense also increased due to a 73% growth in employee headcount in engineering, design, product management, and other technical functions. This investment supported our efforts to improve existing products and build new products for users, developers, and marketers.
In 2014, we plan to continue hiring software engineers and other technical employees. We expect research and development expenses will rise in 2014 at a higher rate than it rose in 2013 due to the large share-based compensation expense in 2012 associated with Pre-2011 RSUs as a result of our IPO which lowered the growth rate between 2012 and 2013.
Marketing and sales
|
Year Ended December 31,
|
|||||||||||||||||
|
2013
|
2012
|
2011
|
2013 vs 2012
% Change |
2012 vs 2011
% Change |
|||||||||||||
|
(dollars in millions)
|
|||||||||||||||||
|
Marketing and sales
|
$
|
997
|
|
$
|
896
|
|
$
|
393
|
|
11
|
%
|
128
|
%
|
||||
|
Percentage of revenue
|
13
|
%
|
18
|
%
|
11
|
%
|
|||||||||||
2013
Compared to
2012
.
Marketing and sales expenses in
2013
increased
$101 million
, or
11%
, compared to
2012
. The increase was primarily due to an increase in payroll and benefits expenses resulting from a
36%
increase in employee headcount from December 31, 2012 to December 31, 2013 to support global sales, business development and customer service. Our user-, developer-, and marketer-facing marketing expense also contributed to the increase in 2013. These increases in 2013 were partially offset by a decrease
48
in share-based compensation expense of
$173 million
compared to 2012 primarily due to the recognition of expense in the prior period related to Pre-2011 RSUs as a result of our IPO in May 2012.
2012
Compared to
2011
.
Marketing and sales expenses in 2012 increased $503 million, or 128%, compared to 2011. The increase was primarily due to an increase in share-based compensation expense of $269 million in 2012 resulting primarily from the recognition of expenses related to Pre-2011 RSUs triggered by the completion of our IPO in May 2012 and, to a lesser extent, Post-2011 RSUs. Payroll and benefits expenses also increased due to a 19% increase in employee headcount to support global sales, business development and customer service. An increase in our user-, developer-, and marketer-facing marketing expense also contributed to the increase in 2012.
In 2014, we plan to add sales and business development employees, and increase our investment in user-, developer-, and marketer-facing marketing. We expect marketing and sales expenses will rise in 2014 at a higher rate than it rose in 2013 due to the large share-based compensation expense in 2012 associated with Pre-2011 RSUs as a result of our IPO which lowered the growth rate between 2012 and 2013.
General and administrative
|
Year Ended December 31,
|
|||||||||||||||||
|
2013
|
2012
|
2011
|
2013 vs 2012
% Change |
2012 vs 2011
% Change |
|||||||||||||
|
(dollars in millions)
|
|||||||||||||||||
|
General and administrative
|
$
|
781
|
|
$
|
892
|
|
$
|
314
|
|
(12
|
)%
|
184
|
%
|
||||
|
Percentage of revenue
|
10
|
%
|
18
|
%
|
8
|
%
|
|||||||||||
2013
Compared to
2012
.
General and administrative expenses in
2013
decreased
$111 million
, or
12%
, compared to
2012
. The decrease was primarily due to a
$208 million
decrease in share-based compensation expense in 2013 compared to 2012 resulting from recognition of expense related to Pre-2011 RSUs as a result of our IPO in May 2012. The decrease in 2013 was partially offset by increased payroll and benefits expense resulting from a
19%
increase in employee headcount and increased amortization of acquired patents.
2012
Compared to
2011
.
General and administrative expenses in 2012 increased $578 million, or 184%, compared to 2011. The increase was primarily due to an increase in share-based compensation expense of $278 million resulting from recognition of expense related to Pre-2011 RSUs and, to a lesser extent, Post-2011 RSUs. The increase was also due to growth in legal fees and settlement costs, amortization of acquired patents and other professional service fees. Payroll and benefits expenses also increased for 2012 due to a 38% increase in employee headcount in corporate communications and policy, human resources, legal, finance, and other functions.
In 2014, we expect general and administrative expenses will grow relative to 2013 as we continue to increase general and administrative employee headcount to support our growth.
Interest and other expense, net
|
Year Ended December 31,
|
|||||||||||||||||
|
2013
|
2012
|
2011
|
2013 vs 2012
% Change |
2012 vs 2011
% Change |
|||||||||||||
|
(in millions)
|
|||||||||||||||||
|
Interest expense
|
$
|
(56
|
)
|
$
|
(51
|
)
|
$
|
(42
|
)
|
10
|
%
|
21
|
%
|
||||
|
Other income (expense), net
|
6
|
|
7
|
|
(19
|
)
|
(14
|
)%
|
137
|
%
|
|||||||
|
Interest and other expense, net
|
$
|
(50
|
)
|
$
|
(44
|
)
|
$
|
(61
|
)
|
14
|
%
|
(28
|
)%
|
||||
2013
Compared to
2012
.
Interest and other expense, net in
2013
increased
$6 million
, or
14%
, compared to
2012
. Interest expense increased by
$5 million
primarily due to interest on the $1.5 billion term loan that was drawn down in the fourth quarter of 2012 and fully repaid in August 2013. Other income, net in 2013 decreased $1 million compared to 2012 primarily due to an increase in foreign exchange loss resulting from the periodic re-measurement of our foreign currency balances, offset by an increase in interest income resulting from higher invested cash balances.
2012
Compared to
2011
.
Interest and other expense, net in 2012 decreased $17 million, or 28%, compared to 2011. Interest expense increased by $9 million primarily due to an increased volume of property and equipment financed by capital leases for 2012
49
and interest on the $1.5 billion term loan that was drawn down in the fourth quarter of 2012. Changes in other income (expense), net were primarily due to lower foreign exchange losses in 2012 resulting from the periodic re-measurement of our foreign currency balances and an increase in interest income driven by higher invested cash balances.
Provision for income taxes
|
Year Ended December 31,
|
|||||||||||||||||
|
2013
|
2012
|
2011
|
2013 vs 2012
% Change |
2012 vs 2011
% Change |
|||||||||||||
|
(dollars in millions)
|
|||||||||||||||||
|
Provision for income taxes
|
$
|
1,254
|
|
$
|
441
|
|
$
|
695
|
|
184
|
%
|
(37
|
)%
|
||||
|
Effective tax rate
|
46
|
%
|
89
|
%
|
41
|
%
|
|||||||||||
2013
Compared to
2012
.
Our provision for income taxes in
2013
increased
$813 million
, or
184%
, compared to
2012
, primarily due to an increase in pretax income. Our effective tax rate decreased primarily due to a lower amount of non-deductible share-based compensation resulting from recognition of expense related to Pre-2011 RSUs as a result of our IPO in May 2012. Our effective tax rate in 2013 was also lower due to the reinstatement in 2013 of the federal tax credit for research and development activities. We recognized the benefit from the reinstatement of the tax credit for 2012 and 2013 during the year ended December 31, 2013.
2012
Compared to
2011
.
Our provision for income taxes in 2012 decreased $254 million, or 37%, compared to 2011, primarily due to a decrease in pretax income. Our effective tax rate increased primarily due to the impact of non-deductible share-based compensation and the losses arising outside the United States in jurisdictions where we do not receive a tax benefit. Our effective tax rate in 2012 was also higher due to the expiration of the federal tax credit for research and development activities.
50
Quarterly Results of Operations Data
The following tables set forth our unaudited quarterly consolidated statements of operations data in dollars and as a percentage of total revenue for each of the eight quarters in the period ended
December 31, 2013
. We have prepared the quarterly consolidated statements of operations data on a basis consistent with the audited consolidated financial statements included in Part II, Item 8, "Financial Statements and Supplementary Data" in this Annual Report on Form 10-K. In the opinion of management, the financial information reflects all adjustments, consisting only of normal recurring adjustments, which we consider necessary for a fair presentation of this data. This information should be read in conjunction with the audited consolidated financial statements and related notes included in Part II, Item 8, "Financial Statements and Supplementary Data" in this Annual Report on Form 10-K. The results of historical periods are not necessarily indicative of the results of operations for any future period.
|
Three Months Ended
|
|||||||||||||||||||||||||||||||
|
Dec 31,
2013 |
Sep 30,
2013 |
Jun 30,
2013 |
Mar 31,
2013 |
Dec 31,
2012 |
Sep 30,
2012 |
Jun 30,
2012 |
Mar 31,
2012 |
||||||||||||||||||||||||
|
(in millions)
|
|||||||||||||||||||||||||||||||
|
Consolidated Statements of Operations Data:
|
|||||||||||||||||||||||||||||||
|
Revenue:
|
|||||||||||||||||||||||||||||||
|
Advertising
|
$
|
2,344
|
|
$
|
1,798
|
|
$
|
1,599
|
|
$
|
1,245
|
|
$
|
1,329
|
|
$
|
1,086
|
|
$
|
992
|
|
$
|
872
|
|
|||||||
|
Payments and other fees
(1)
|
241
|
|
218
|
|
214
|
|
213
|
|
256
|
|
176
|
|
192
|
|
186
|
|
|||||||||||||||
|
Total revenue
|
2,585
|
|
2,016
|
|
1,813
|
|
1,458
|
|
1,585
|
|
1,262
|
|
1,184
|
|
1,058
|
|
|||||||||||||||
|
Costs and expenses:
|
|||||||||||||||||||||||||||||||
|
Cost of revenue
|
491
|
|
507
|
|
465
|
|
413
|
|
398
|
|
322
|
|
367
|
|
277
|
|
|||||||||||||||
|
Research and development
|
408
|
|
369
|
|
344
|
|
293
|
|
297
|
|
244
|
|
705
|
|
153
|
|
|||||||||||||||
|
Marketing and sales
|
292
|
|
233
|
|
269
|
|
203
|
|
193
|
|
168
|
|
392
|
|
143
|
|
|||||||||||||||
|
General and administrative
|
261
|
|
171
|
|
173
|
|
176
|
|
174
|
|
151
|
|
463
|
|
104
|
|
|||||||||||||||
|
Total costs and expenses
|
1,452
|
|
1,280
|
|
1,251
|
|
1,085
|
|
1,062
|
|
885
|
|
1,927
|
|
677
|
|
|||||||||||||||
|
Income (loss) from operations
|
1,133
|
|
736
|
|
562
|
|
373
|
|
523
|
|
377
|
|
(743
|
)
|
381
|
|
|||||||||||||||
|
Interest and other income (expense), net
|
(3
|
)
|
(10
|
)
|
(17
|
)
|
(20
|
)
|
(18
|
)
|
(5
|
)
|
(22
|
)
|
1
|
|
|||||||||||||||
|
Income (loss) before provision for (benefit from) income taxes
|
1,130
|
|
726
|
|
545
|
|
353
|
|
505
|
|
372
|
|
(765
|
)
|
382
|
|
|||||||||||||||
|
Provision for (benefit from) income taxes
|
607
|
|
301
|
|
212
|
|
134
|
|
441
|
|
431
|
|
(608
|
)
|
177
|
|
|||||||||||||||
|
Net income (loss)
|
$
|
523
|
|
$
|
425
|
|
$
|
333
|
|
$
|
219
|
|
$
|
64
|
|
$
|
(59
|
)
|
$
|
(157
|
)
|
$
|
205
|
|
|||||||
|
Less: Net income attributable to participating securities
|
3
|
|
3
|
|
2
|
|
2
|
|
—
|
|
—
|
|
—
|
|
68
|
|
|||||||||||||||
|
Net income (loss) attributable to Class A and Class B common stockholders
|
$
|
520
|
|
$
|
422
|
|
$
|
331
|
|
$
|
217
|
|
$
|
64
|
|
$
|
(59
|
)
|
$
|
(157
|
)
|
$
|
137
|
|
|||||||
|
Earnings (loss) per share attributable to Class A and Class B common stockholders:
|
|||||||||||||||||||||||||||||||
|
Basic
|
$
|
0.21
|
|
$
|
0.17
|
|
$
|
0.14
|
|
$
|
0.09
|
|
$
|
0.03
|
|
$
|
(0.02
|
)
|
$
|
(0.08
|
)
|
$
|
0.10
|
|
|||||||
|
Diluted
|
$
|
0.20
|
|
$
|
0.17
|
|
$
|
0.13
|
|
$
|
0.09
|
|
$
|
0.03
|
|
$
|
(0.02
|
)
|
$
|
(0.08
|
)
|
$
|
0.09
|
|
|||||||
51
Share-based compensation expense included in costs and expenses:
|
Three Months Ended
|
|||||||||||||||||||||||||||||||
|
Dec 31,
2013 |
Sep 30,
2013 |
Jun 30,
2013 |
Mar 31,
2013 |
Dec 31,
2012 |
Sep 30,
2012 |
Jun 30,
2012 |
Mar 31,
2012 |
||||||||||||||||||||||||
|
(in millions)
|
|||||||||||||||||||||||||||||||
|
Cost of revenue
|
$
|
11
|
|
$
|
12
|
|
$
|
11
|
|
$
|
8
|
|
$
|
9
|
|
$
|
8
|
|
$
|
66
|
|
$
|
5
|
|
|||||||
|
Research and development
|
172
|
|
164
|
|
151
|
|
117
|
|
124
|
|
114
|
|
545
|
|
60
|
|
|||||||||||||||
|
Marketing and sales
|
42
|
|
34
|
|
33
|
|
24
|
|
27
|
|
28
|
|
232
|
|
19
|
|
|||||||||||||||
|
General and administrative
|
48
|
|
29
|
|
29
|
|
21
|
|
24
|
|
29
|
|
263
|
|
19
|
|
|||||||||||||||
|
Total share-based compensation expense
(2)
|
$
|
273
|
|
$
|
239
|
|
$
|
224
|
|
$
|
170
|
|
$
|
184
|
|
$
|
179
|
|
$
|
1,106
|
|
$
|
103
|
|
|||||||
|
(1)
|
Commencing in the fourth quarter of 2012, we recorded all Payments revenue at the time of purchase of the related virtual or digital goods, net of estimated refunds or chargebacks, instead of deferring Payment revenue until the expiration of the 30-day claim period, as we are able to estimate future refunds and chargebacks based on historical trends. This charge resulted in a one-time increase in Payment revenue of
$66 million
in the fourth quarter of 2012.
|
|
(2)
|
In the second quarter of 2012, we recognized $986 million of share-based compensation expense related to Pre-2011 RSUs that vested in connection with our IPO.
|
|
Three Months Ended
|
|||||||||||||||||||||||
|
Dec 31,
2013 |
Sep 30,
2013 |
Jun 30,
2013 |
Mar 31,
2013 |
Dec 31,
2012 |
Sep 30,
2012 |
Jun 30,
2012 |
Mar 31,
2012 |
||||||||||||||||
|
(as a percentage of total revenue)
|
|||||||||||||||||||||||
|
Consolidated Statements of Operations Data:
|
|||||||||||||||||||||||
|
Revenue:
|
|||||||||||||||||||||||
|
Advertising
|
91
|
%
|
89
|
%
|
88
|
%
|
85
|
%
|
84
|
%
|
86
|
%
|
84
|
%
|
82
|
%
|
|||||||
|
Payments and other fees
|
9
|
|
11
|
|
12
|
|
15
|
|
16
|
|
14
|
|
16
|
|
18
|
|
|||||||
|
Total revenue
|
100
|
%
|
100
|
%
|
100
|
%
|
100
|
%
|
100
|
%
|
100
|
%
|
100
|
%
|
100
|
%
|
|||||||
|
Costs and expenses:
|
|||||||||||||||||||||||
|
Cost of revenue
|
19
|
|
25
|
|
26
|
|
28
|
|
25
|
|
26
|
|
31
|
|
26
|
|
|||||||
|
Research and development
|
16
|
|
18
|
|
19
|
|
20
|
|
19
|
|
19
|
|
60
|
|
14
|
|
|||||||
|
Marketing and sales
|
11
|
|
12
|
|
15
|
|
14
|
|
12
|
|
13
|
|
33
|
|
14
|
|
|||||||
|
General and administrative
|
10
|
|
8
|
|
10
|
|
12
|
|
11
|
|
12
|
|
39
|
|
10
|
|
|||||||
|
Total costs and expenses
|
56
|
|
63
|
|
69
|
|
74
|
|
67
|
|
70
|
|
163
|
|
64
|
|
|||||||
|
Income (loss) from operations
|
44
|
|
37
|
|
31
|
|
26
|
|
33
|
|
30
|
|
(63
|
)
|
36
|
|
|||||||
|
Interest and other income (expense), net
|
—
|
|
—
|
|
(1
|
)
|
(1
|
)
|
(1
|
)
|
—
|
|
(2
|
)
|
—
|
|
|||||||
|
Income (loss) before provision for (benefit from) income taxes
|
44
|
|
36
|
|
30
|
|
24
|
|
32
|
|
29
|
|
(65
|
)
|
36
|
|
|||||||
|
Provision for (benefit from) income taxes
|
23
|
|
15
|
|
12
|
|
9
|
|
28
|
|
34
|
|
(51
|
)
|
17
|
|
|||||||
|
Net income (loss)
|
20
|
%
|
21
|
%
|
18
|
%
|
15
|
%
|
4
|
%
|
(5
|
)%
|
(13
|
)%
|
19
|
%
|
|||||||
|
Less: Net income attributable to participating securities
|
—
|
|
—
|
|
—
|
|
—
|
|
—
|
|
—
|
|
—
|
|
6
|
|
|||||||
|
Net income (loss) attributable to Class A and Class B common stockholders
|
20
|
%
|
21
|
%
|
18
|
%
|
15
|
%
|
4
|
%
|
(5
|
)%
|
(13
|
)%
|
13
|
%
|
|||||||
52
Share-based compensation expense included in costs and expenses:
|
Three Months Ended
|
|||||||||||||||||||||||
|
Dec 31,
2013 |
Sep 30,
2013 |
Jun 30,
2013 |
Mar 31,
2013 |
Dec 31,
2012 |
Sep 30,
2012 |
Jun 30,
2012 |
Mar 31,
2012 |
||||||||||||||||
|
(as a percentage of total revenue)
|
|||||||||||||||||||||||
|
Cost of revenue
|
—
|
%
|
1
|
%
|
1
|
%
|
1
|
%
|
1
|
%
|
1
|
%
|
6
|
%
|
—%
|
|
|||||||
|
Research and development
|
7
|
|
8
|
|
8
|
|
8
|
|
8
|
|
9
|
|
46
|
|
6
|
|
|||||||
|
Marketing and sales
|
2
|
|
2
|
|
2
|
|
2
|
|
2
|
|
2
|
|
20
|
|
2
|
|
|||||||
|
General and administrative
|
2
|
|
1
|
|
2
|
|
1
|
|
2
|
|
2
|
|
22
|
|
2
|
|
|||||||
|
Total share-based compensation expense
|
11
|
%
|
12
|
%
|
12
|
%
|
12
|
%
|
12
|
%
|
14
|
%
|
93
|
%
|
10
|
%
|
|||||||
Liquidity and Capital Resources
|
Year Ended December 31,
|
|||||||||||
|
2013
|
2012
|
2011
|
|||||||||
|
(in millions)
|
|||||||||||
|
Consolidated Statements of Cash Flows Data:
|
|||||||||||
|
Net cash provided by operating activities
|
$
|
4,222
|
|
$
|
1,612
|
|
$
|
1,549
|
|
||
|
Net cash used in investing activities
|
(2,624
|
)
|
(7,024
|
)
|
(3,023
|
)
|
|||||
|
Net cash (used in) provided by financing activities
|
(667
|
)
|
6,283
|
|
1,198
|
|
|||||
|
Purchases of property and equipment
|
(1,362
|
)
|
(1,235
|
)
|
(606
|
)
|
|||||
|
Depreciation and amortization
|
1,011
|
|
649
|
|
323
|
|
|||||
|
Share-based compensation
|
906
|
|
1,572
|
|
217
|
|
|||||
Our principal sources of liquidity are our cash and cash equivalents, marketable securities, and cash generated from operations. Cash and cash equivalents and marketable securities consist primarily of cash on deposit with banks and investments in money market funds and U.S. government and U.S. government agency securities. Cash and cash equivalents and marketable securities were
$11.45 billion
as of
December 31, 2013
, an increase of
$1.82 billion
from
December 31, 2012
, primarily due to
$4.22 billion
of cash generated from operations,
$1.48 billion
of net proceeds from our follow-on equity offering which was completed in December 2013, and
$609 million
in excess tax benefit from share-based award activity, offset by the repayment of our $1.5 billion term loan,
$1.36 billion
for purchases of property and equipment and
$889 million
for tax payments related to net share settlement of equity awards.
In January 2014, we began requiring that employees sell a portion of the shares that they receive upon the vesting of RSUs in order to cover any required withholding taxes ("sell-to-cover"), rather than our previous approach of net share settlement. We expect this sell-to-cover approach will reduce our cash outflows.
We currently anticipate that our available funds, credit facilities, and cash flow from operations will be sufficient to meet our operational cash needs for the foreseeable future.
In August 2013, in connection with the termination of our existing credit facilities, we entered into a five-year senior unsecured revolving credit facility (2013 Revolving Credit Facility) that allows us to borrow up to $6.5 billion to fund working capital and general corporate purposes with interest payable on the borrowed amounts set at LIBOR plus 1.0%, as well as an annual commitment fee of 0.10% on the daily undrawn balance of the facility. We paid origination fees at closing of the 2013 Revolving Credit Facility, which fees are being amortized over the term of the facility. Any amounts outstanding under this facility will be due and payable on August 15, 2018. As of
December 31, 2013
, no amounts had been drawn down and we were in compliance with the covenants under this credit facility. See Note 9 in the notes to the consolidated financial statements included in Part II, Item 8 for additional detail.
As of
December 31, 2013
,
$634 million
of the
$11.45 billion
in cash and cash equivalents and marketable securities was held by our foreign subsidiaries. We have provided for the additional taxes that would be due if we repatriated these funds for use in our operations in the United States.
53
Cash Provided by Operating Activities
Cash flow from operating activities during
2013
primarily consisted of net income, adjusted for certain non-cash items, including depreciation and amortization of
$1.01 billion
and share-based compensation expense of
$906 million
, and an increase in other liabilities related to uncertain tax positions. The cash flow from operating activities during
2013
compared to
2012
increased mainly due to an increase in net income of
$1.45 billion
and uncertain tax position of $786 million. In addition, we received income tax refunds of
$421 million
in 2013.
Cash flow from operating activities during 2012 primarily consisted of adjustments to net income for certain non-cash items such as share-based compensation expense of $1.57 billion and depreciation and amortization of $649 million, partially offset by income tax refundable of $451 million. The cash flow from operating activities during 2012 compared to 2011 increased modestly as the increases in adjustments for non-cash items as described above were offset by a reduction in net income of $947 million and an increase in income tax refundable.
Cash flow from operating activities during 2011 primarily consisted of net income, adjusted for certain non-cash items, including depreciation and amortization of $323 million and share-based compensation expense of $217 million.
Cash Used in Investing Activities
Cash used in investing activities during
2013
primarily resulted from
$1.36 billion
for capital expenditures related to the purchase of servers, network infrastructure, and the construction of data centers, as well as
$882 million
for the net purchase of marketable securities and
$368 million
for the acquisition of businesses and other assets, such as patents. The decrease in cash used in investing activities during
2013
compared to
2012
was mainly due to decreases in the purchase of marketable securities and the acquisition of businesses and other assets.
Cash used in investing activities during 2012 primarily resulted from $4.87 billion for the net purchase of marketable securities, $1.24 billion for capital expenditures related to the purchase of servers, network infrastructure, and the construction of data centers, as well as $911 million for the acquisition of businesses and other assets, such as patents. The increase in cash used in investing activities during 2012 compared to 2011 was mainly due to increases in the purchase of marketable securities, the acquisition of businesses and other assets, and capital expenditures.
Cash used in investing activities during 2011 primarily resulted from the use of approximately $2.4 billion for the net purchase of marketable securities. Our cash used in investing activities in 2011 also consisted of capital expenditures of $606 million related to the purchase of servers, network infrastructure, and the construction of data centers.
We anticipate making capital expenditures in 2014 of approximately $2.0 billion to $2.5 billion.
Cash (Used in) Provided by Financing Activities
Cash used in financing activities during 2013 was
$667 million
, which primarily resulted from $1.5 billion for repayment of debt and
$889 million
of tax payments related to the net share settlement of equity awards, partially offset by
$1.48 billion
in net proceeds from the completion of our follow-on equity offering in December 2013.
Cash provided by financing activities during 2012 was $6.28 billion, which primarily resulted from $6.8 billion in net proceeds from the completion of our IPO, $1.5 billion draw down from our unsecured term loan facility and $1.03 billion of excess tax benefits from stock award activities, partially offset by $2.86 billion of taxes paid related to the net share settlement of equity awards.
Cash provided by financing activities during 2011 was $1.2 billion, primarily resulted from $998 million in net proceeds related to the completion of an offering of our Class A common stock to certain non-U.S. investors.
Off-Balance Sheet Arrangements
We did not have any off-balance sheet arrangements as of
December 31, 2013
.
54
Contractual Obligations
Our principal commitments consist of obligations under capital and operating leases for equipment and office and data center facilities. The following table summarizes our commitments to settle contractual obligations in cash as of
December 31, 2013
.
|
Payment Due by Period
|
|||||||||||||||||||
|
Total
|
Less than
1 Year |
1-3
Years |
3-5
Years |
More than
5 Years |
|||||||||||||||
|
Operating lease obligations
|
$
|
978
|
|
$
|
142
|
|
$
|
281
|
|
$
|
243
|
|
$
|
312
|
|
||||
|
Capital lease obligations
|
561
|
|
255
|
|
148
|
|
31
|
|
127
|
|
|||||||||
|
Other contractual commitments
(1)
|
258
|
|
116
|
|
40
|
|
16
|
|
86
|
|
|||||||||
|
Total contractual obligations
|
$
|
1,797
|
|
$
|
513
|
|
$
|
469
|
|
$
|
290
|
|
$
|
525
|
|
||||
_____________________
|
(1)
|
Other contractual commitments primarily relate to network infrastructure for our data center operations and, to a lesser extent, construction commitments related to our data center sites.
|
In addition, our other liabilities include
$886 million
related to uncertain tax positions as of
December 31, 2013
. Due to uncertainties in the timing of the completion of tax audits, the timing of the resolution of these positions is uncertain and we are unable to make a reasonably reliable estimate of the timing of payments in individual years beyond 12 months. As a result, this amount is not included in the above contractual obligations table.
Contingencies
We are involved in claims, lawsuits, government investigations, and proceedings. We record a provision for a liability when we believe that it is both probable that a liability has been incurred, and the amount can be reasonably estimated. Significant judgment is required to determine both probability and the estimated amount. Such legal proceedings are inherently unpredictable and subject to significant uncertainties, some of which are beyond our control. Should any of these estimates and assumptions change or prove to be incorrect, it could have a material impact on our results of operations, financial position, and cash flows.
See Note 10 in the accompanying notes to our consolidated financial statements included in Part II, Item 8, "Financial Statements and Supplementary Data" and Part I, Item 3, "Legal Proceedings" of this Annual Report on Form 10-K for additional information regarding contingencies.
Recently Issued and Adopted Accounting Pronouncement
Comprehensive Income
In February 2013, the FASB issued ASU No. 2013-02,
Comprehensive Income (Topic 220): Reporting of Amounts Reclassified Out of Accumulated Other Comprehensive Income
(ASU 2013-02) which is effective prospectively for public companies for reporting periods beginning after December 15, 2012. This new accounting standard improves the reporting of reclassifications out of accumulated other comprehensive income (AOCI) by requiring an entity to report the effect of significant reclassifications out of AOCI on the respective line items in net income if the amount being reclassified is required under GAAP to be reclassified in its entirety to net income. For other amounts that are not required under GAAP to be reclassified in their entirety to net income in the same reporting period, an entity is required to cross-reference other disclosures required under GAAP that provide additional detail about those amounts. We adopted this new guidance on January 1, 2013 and the adoption did not have a material effect on our consolidated financial statements.
55
|
Item 7A.
|
Quantitative and Qualitative Disclosures About Market Risk
|
We are exposed to market risks, including changes to foreign currency exchange rates, interest rates, and inflation.
Foreign Currency Exchange Risk
We have foreign currency risks related to our revenue and operating expenses denominated in currencies other than the U.S. dollar, primarily the Euro. In general, we are a net receiver of currencies other than the U.S. dollar. Accordingly, changes in exchange rates, and in particular a strengthening of the U.S. dollar, will negatively affect our revenue and other operating results as expressed in U.S. dollars.
We have experienced and will continue to experience fluctuations in our net income as a result of transaction gains or losses related to revaluing certain current asset and current liability balances that are denominated in currencies other than the functional currency of the entities in which they are recorded. At this time we have not entered into, but in the future we may enter into, derivatives or other financial instruments in an attempt to hedge our foreign currency exchange risk. It is difficult to predict the effect hedging activities would have on our results of operations. We recognized foreign currency losses of
$14 million
,
$9 million
, and
$29 million
in
2013
,
2012
, and
2011
, respectively.
Interest Rate Sensitivity
Our exposure to changes in interest rates relates primarily to interest earned and market value on our cash and cash equivalents and marketable securities.
Our cash and cash equivalents and marketable securities consist of cash, certificates of deposit, time deposits, money market funds, and
U.S. government and U.S. government agency securities
. Our investment policy and strategy are focused on preservation of capital and supporting our liquidity requirements. Changes in U.S. interest rates affect the interest earned on our cash and cash equivalents and marketable securities and the market value of those securities. A hypothetical 100 basis point increase in interest rates would result in a decrease of approximately
$73 million
and
$55 million
in the market value of our available-for-sale debt securities as of
December 31, 2013
and
December 31, 2012
, respectively. Any realized gains or losses resulting from such interest rate changes would only occur if we sold the investments prior to maturity.
Inflation Risk
We do not believe that inflation has had a material effect on our business, financial condition, or results of operations.
56
|
Item 8.
|
Financial Statements and Supplementary Data
|
FACEBOOK, INC.
INDEX TO CONSOLIDATED FINANCIAL STATEMENTS
|
Consolidated Financial Statements:
|
|
The supplementary financial information required by this Item 8, is included in Part II, Item 7 under the caption "Quarterly Results of Operations Data," which is incorporated herein by reference.
Report of Ernst & Young LLP, Independent Registered Public Accounting Firm
The Board of Directors and Stockholders of Facebook, Inc.
We have audited the accompanying consolidated balance sheets of Facebook, Inc. as of
December 31, 2013
and 2012, and the related consolidated statements of income, comprehensive income, stockholders' equity and cash flows for each of the three years in the period ended
December 31, 2013
. These financial statements are the responsibility of the Company's management. Our responsibility is to express an opinion on these financial statements based on our audits.
We conducted our audits in accordance with the standards of the Public Company Accounting Oversight Board (United States). Those standards require that we plan and perform the audit to obtain reasonable assurance about whether the financial statements are free of material misstatement. An audit includes examining, on a test basis, evidence supporting the amounts and disclosures in the financial statements. An audit also includes assessing the accounting principles used and significant estimates made by management, as well as evaluating the overall financial statement presentation. We believe that our audits provide a reasonable basis for our opinion.
In our opinion, the financial statements referred to above present fairly, in all material respects, the consolidated financial position of Facebook, Inc. at
December 31, 2013
and 2012, and the consolidated results of its operations and its cash flows for each of the three years in the period ended
December 31, 2013
, in conformity with U.S. generally accepted accounting principles.
We also have audited, in accordance with the standards of the Public Company Accounting Oversight Board (United States), Facebook, Inc.'s internal control over financial reporting as of
December 31, 2013
, based on criteria established in
Internal Control – Integrated Framework
issued by the Committee of Sponsoring Organizations of the Treadway Commission (1992 framework) and our report dated January 31, 2014 expressed an unqualified opinion thereon.
/s/ Ernst & Young LLP
San Francisco, California
January 31, 2014
58
Report of Ernst & Young LLP, Independent Registered Public Accounting Firm
The Board of Directors and Stockholders of Facebook, Inc.
We have audited Facebook, Inc.’s internal control over financial reporting as of
December 31, 2013
, based on criteria established in
Internal Control – Integrated Framework
issued by the Committee of Sponsoring Organizations of the Treadway Commission (1992 framework) (“the COSO criteria”). Facebook, Inc.’s management is responsible for maintaining effective internal control over financial reporting, and for its assessment of the effectiveness of internal control over financial reporting included in the accompanying Management’s Annual Report on Internal Control Over Financial Reporting. Our responsibility is to express an opinion on the Company’s internal control over financial reporting based on our audit.
We conducted our audit in accordance with the standards of the Public Company Accounting Oversight Board (United States). Those standards require that we plan and perform the audit to obtain reasonable assurance about whether effective internal control over financial reporting was maintained in all material respects. Our audit included obtaining an understanding of internal control over financial reporting, assessing the risk that a material weakness exists, testing and evaluating the design and operating effectiveness of internal control based on the assessed risk, and performing such other procedures as we considered necessary in the circumstances. We believe that our audit provides a reasonable basis for our opinion.
A company’s internal control over financial reporting is a process designed to provide reasonable assurance regarding the reliability of financial reporting and the preparation of financial statements for external purposes in accordance with generally accepted accounting principles. A company’s internal control over financial reporting includes those policies and procedures that (1) pertain to the maintenance of records that, in reasonable detail, accurately and fairly reflect the transactions and dispositions of the assets of the company; (2) provide reasonable assurance that transactions are recorded as necessary to permit preparation of financial statements in accordance with generally accepted accounting principles, and that receipts and expenditures of the company are being made only in accordance with authorizations of management and directors of the company; and (3) provide reasonable assurance regarding prevention or timely detection of unauthorized acquisition, use, or disposition of the company’s assets that could have a material effect on the financial statements.
Because of its inherent limitations, internal control over financial reporting may not prevent or detect misstatements. Also, projections of any evaluation of effectiveness to future periods are subject to the risk that controls may become inadequate because of changes in conditions, or that the degree of compliance with the policies or procedures may deteriorate.
In our opinion, Facebook, Inc. maintained, in all material respects, effective internal control over financial reporting as of
December 31, 2013
, based on the COSO criteria.
We also have audited, in accordance with the standards of the Public Company Accounting Oversight Board (United States), the 2013 consolidated financial statements of Facebook, Inc. and our report dated January 31, 2014 expressed an unqualified opinion thereon.
/s/ Ernst & Young LLP
San Francisco, California
January 31, 2014
59
FACEBOOK, INC.
(In millions, except for number of shares and par value)
|
December 31,
|
|||||||
|
|
2013
|
2012
|
|||||
|
Assets
|
|
|
|||||
|
Current assets:
|
|
|
|||||
|
Cash and cash equivalents
|
$
|
3,323
|
|
$
|
2,384
|
|
|
|
Marketable securities
|
8,126
|
|
7,242
|
|
|||
|
Accounts receivable, net of allowances for doubtful accounts of $38 and $22 as of December 31, 2013 and December 31, 2012, respectively
|
1,109
|
|
719
|
|
|||
|
Income tax refundable
|
51
|
|
451
|
|
|||
|
Prepaid expenses and other current assets
|
461
|
|
471
|
|
|||
|
Total current assets
|
13,070
|
|
11,267
|
|
|||
|
Property and equipment, net
|
2,882
|
|
2,391
|
|
|||
|
Goodwill and intangible assets, net
|
1,722
|
|
1,388
|
|
|||
|
Other assets
|
221
|
|
57
|
|
|||
|
Total assets
|
$
|
17,895
|
|
$
|
15,103
|
|
|
|
Liabilities and stockholders' equity
|
|
|
|
|
|||
|
Current liabilities:
|
|
|
|
|
|||
|
Accounts payable
|
$
|
87
|
|
$
|
65
|
|
|
|
Developer partners payable
|
181
|
|
169
|
|
|||
|
Accrued expenses and other current liabilities
|
555
|
|
423
|
|
|||
|
Deferred revenue and deposits
|
38
|
|
30
|
|
|||
|
Current portion of capital lease obligations
|
239
|
|
365
|
|
|||
|
Total current liabilities
|
1,100
|
|
1,052
|
|
|||
|
Capital lease obligations, less current portion
|
237
|
|
491
|
|
|||
|
Long-term debt
|
—
|
|
1,500
|
|
|||
|
Other liabilities
|
1,088
|
|
305
|
|
|||
|
Total liabilities
|
2,425
|
|
3,348
|
|
|||
|
Commitments and contingencies
|
|
|
|
|
|||
|
Stockholders' equity:
|
|
|
|
|
|||
|
Common stock, $0.000006 par value; 5,000 million Class A shares authorized, 1,970 million and 1,671 million shares issued and outstanding, including 6 million and 2 million outstanding shares subject to repurchase as of December 31, 2013 and December 31, 2012, respectively; 4,141 million Class B shares authorized, 577 million and 701 million shares issued and outstanding, including 6 million and 11 million outstanding shares subject to repurchase as of December 31, 2013 and December 31, 2012, respectively
|
—
|
|
—
|
|
|||
|
Additional paid-in capital
|
12,297
|
|
10,094
|
|
|||
|
Accumulated other comprehensive income
|
14
|
|
2
|
|
|||
|
Retained earnings
|
3,159
|
|
1,659
|
|
|||
|
Total stockholders' equity
|
15,470
|
|
11,755
|
|
|||
|
Total liabilities and stockholders' equity
|
$
|
17,895
|
|
$
|
15,103
|
|
|
See Accompanying Notes to Consolidated Financial Statements.
60
FACEBOOK, INC.
(In millions, except per share amounts)
|
|
Year Ended December 31,
|
||||||||||
|
2013
|
2012
|
2011
|
|||||||||
|
Revenue
|
$
|
7,872
|
|
$
|
5,089
|
|
$
|
3,711
|
|
||
|
Costs and expenses:
|
|
|
|
|
|||||||
|
Cost of revenue
|
1,875
|
|
1,364
|
|
860
|
|
|||||
|
Research and development
|
1,415
|
|
1,399
|
|
388
|
|
|||||
|
Marketing and sales
|
997
|
|
896
|
|
393
|
|
|||||
|
General and administrative
|
781
|
|
892
|
|
314
|
|
|||||
|
Total costs and expenses
|
5,068
|
|
4,551
|
|
1,955
|
|
|||||
|
Income from operations
|
2,804
|
|
538
|
|
1,756
|
|
|||||
|
Interest and other income (expense), net:
|
|
|
|
|
|
|
|||||
|
Interest expense
|
(56
|
)
|
(51
|
)
|
(42
|
)
|
|||||
|
Other income (expense), net
|
6
|
|
7
|
|
(19
|
)
|
|||||
|
Income before provision for income taxes
|
2,754
|
|
494
|
|
1,695
|
|
|||||
|
Provision for income taxes
|
1,254
|
|
441
|
|
695
|
|
|||||
|
Net income
|
$
|
1,500
|
|
$
|
53
|
|
$
|
1,000
|
|
||
|
Less: Net income attributable to participating securities
|
9
|
|
21
|
|
332
|
|
|||||
|
Net income attributable to Class A and Class B common stockholders
|
$
|
1,491
|
|
$
|
32
|
|
$
|
668
|
|
||
|
Earnings per share attributable to Class A and Class B common stockholders:
|
|
|
|
|
|
|
|||||
|
Basic
|
$
|
0.62
|
|
$
|
0.02
|
|
$
|
0.52
|
|
||
|
Diluted
|
$
|
0.60
|
|
$
|
0.01
|
|
$
|
0.46
|
|
||
|
Weighted average shares used to compute earnings per share attributable to Class A and Class B common stockholders:
|
|||||||||||
|
Basic
|
2,420
|
|
2,006
|
|
1,294
|
|
|||||
|
Diluted
|
2,517
|
|
2,166
|
|
1,508
|
|
|||||
|
Share-based compensation expense included in costs and expenses:
|
|
|
|
|
|
|
|||||
|
Cost of revenue
|
$
|
42
|
|
$
|
88
|
|
$
|
9
|
|
||
|
Research and development
|
604
|
|
843
|
|
114
|
|
|||||
|
Marketing and sales
|
133
|
|
306
|
|
37
|
|
|||||
|
General and administrative
|
127
|
|
335
|
|
57
|
|
|||||
|
Total share-based compensation expense
|
$
|
906
|
|
$
|
1,572
|
|
$
|
217
|
|
||
See Accompanying Notes to Consolidated Financial Statements.
61
FACEBOOK, INC.
CONSOLIDATED STATEMENTS OF COMPREHENSIVE INCOME
(In millions)
|
Year Ended December 31,
|
|||||||||||
|
2013
|
2012
|
2011
|
|||||||||
|
Net income
|
$
|
1,500
|
|
$
|
53
|
|
$
|
1,000
|
|
||
|
Other comprehensive income (loss):
|
|||||||||||
|
Change in foreign currency translation adjustment
|
11
|
|
9
|
|
—
|
|
|||||
|
Change in unrealized gain/loss on available-for-sale investments, net of tax
|
(1
|
)
|
1
|
|
—
|
|
|||||
|
Change in unrealized gain/loss on derivative, net of tax
|
2
|
|
(2
|
)
|
—
|
|
|||||
|
Comprehensive income
|
$
|
1,512
|
|
$
|
61
|
|
$
|
1,000
|
|
||
See Accompanying Notes to Consolidated Financial Statements.
62
FACEBOOK, INC.
CONSOLIDATED STATEMENTS OF STOCKHOLDERS' EQUITY
(In millions)
|
Convertible
Preferred Stock |
Class A and
Class B Common Stock |
Additional
Paid-In Capital |
Accumulated
Other Comprehensive (Loss) Income |
Retained
Earnings |
Total
Stockholders' Equity |
||||||||||||||||||||||||
|
Shares
|
Amount
|
Shares
|
Par Value
|
||||||||||||||||||||||||||
|
Balances at December 31, 2010
|
541
|
|
$
|
615
|
|
1,172
|
|
$
|
—
|
|
$
|
947
|
|
$
|
(6
|
)
|
$
|
606
|
|
$
|
2,162
|
|
|||||||
|
Issuance of common stock, net of issuance costs
|
—
|
|
—
|
|
48
|
|
—
|
|
998
|
|
—
|
|
—
|
|
998
|
|
|||||||||||||
|
Issuance of common stock for cash upon exercise of stock options
|
—
|
|
—
|
|
102
|
|
—
|
|
28
|
|
—
|
|
—
|
|
28
|
|
|||||||||||||
|
Issuance of common stock to nonemployees for past services
|
—
|
|
—
|
|
—
|
|
—
|
|
3
|
|
—
|
|
—
|
|
3
|
|
|||||||||||||
|
Issuance of common stock related to acquisitions
|
—
|
|
—
|
|
2
|
|
—
|
|
58
|
|
—
|
|
—
|
|
58
|
|
|||||||||||||
|
Exercise of preferred stock warrants
|
8
|
|
—
|
|
—
|
|
—
|
|
—
|
|
—
|
|
—
|
|
—
|
|
|||||||||||||
|
Conversion of Series B & C preferred stock to common stock
|
(6
|
)
|
—
|
|
6
|
|
—
|
|
—
|
|
—
|
|
—
|
|
—
|
|
|||||||||||||
|
Share-based compensation, related to employee share-based awards
|
—
|
|
—
|
|
—
|
|
—
|
|
217
|
|
—
|
|
—
|
|
217
|
|
|||||||||||||
|
Tax benefit from share-based award activity
|
—
|
|
—
|
|
—
|
|
—
|
|
433
|
|
—
|
|
—
|
|
433
|
|
|||||||||||||
|
Net income
|
—
|
|
—
|
|
—
|
|
—
|
|
—
|
|
—
|
|
1,000
|
|
1,000
|
|
|||||||||||||
|
Balances at December 31, 2011
|
543
|
|
615
|
|
1,330
|
|
—
|
|
2,684
|
|
(6
|
)
|
1,606
|
|
4,899
|
|
|||||||||||||
|
Issuance of common stock, net of issuance costs
|
—
|
|
—
|
|
180
|
|
—
|
|
6,760
|
|
—
|
|
—
|
|
6,760
|
|
|||||||||||||
|
Issuance of common stock for cash upon exercise of stock options
|
—
|
|
—
|
|
135
|
|
—
|
|
17
|
|
—
|
|
—
|
|
17
|
|
|||||||||||||
|
Issuance of common stock to nonemployees for past services
|
—
|
|
—
|
|
—
|
|
—
|
|
1
|
|
—
|
|
—
|
|
1
|
|
|||||||||||||
|
Issuance of common stock related to acquisitions
|
—
|
|
—
|
|
26
|
|
—
|
|
274
|
|
—
|
|
—
|
|
274
|
|
|||||||||||||
|
Issuance of common stock for settlement of restricted stock units (RSUs)
|
—
|
|
—
|
|
279
|
|
—
|
|
—
|
|
—
|
|
—
|
|
—
|
|
|||||||||||||
|
Shares withheld related to net share settlement of RSUs
|
—
|
|
—
|
|
(123
|
)
|
—
|
|
(2,862
|
)
|
—
|
|
—
|
|
(2,862
|
)
|
|||||||||||||
|
Conversion of Series A, B, C, D & E preferred stock to common stock
|
(543
|
)
|
(615
|
)
|
545
|
|
—
|
|
615
|
|
—
|
|
—
|
|
—
|
|
|||||||||||||
|
Share-based compensation, related to employee share-based awards
|
—
|
|
—
|
|
—
|
|
—
|
|
1,572
|
|
—
|
|
—
|
|
1,572
|
|
|||||||||||||
|
Tax benefit from share-based award activity
|
—
|
|
—
|
|
—
|
|
—
|
|
1,033
|
|
—
|
|
—
|
|
1,033
|
|
|||||||||||||
|
Other comprehensive income
|
—
|
|
—
|
|
—
|
|
—
|
|
—
|
|
8
|
|
—
|
|
8
|
|
|||||||||||||
|
Net income
|
—
|
|
—
|
|
—
|
|
—
|
|
—
|
|
—
|
|
53
|
|
53
|
|
|||||||||||||
|
Balances at December 31, 2012
|
—
|
|
—
|
|
2,372
|
|
—
|
|
10,094
|
|
2
|
|
1,659
|
|
11,755
|
|
|||||||||||||
|
Issuance of common stock, net of issuance costs
|
—
|
|
—
|
|
27
|
|
—
|
|
1,478
|
|
—
|
|
—
|
|
1,478
|
|
|||||||||||||
|
Issuance of common stock for cash upon exercise of stock options
|
—
|
|
—
|
|
101
|
|
—
|
|
26
|
|
—
|
|
—
|
|
26
|
|
|||||||||||||
|
Issuance of common stock to nonemployees for past services
|
—
|
|
—
|
|
—
|
|
—
|
|
3
|
|
—
|
|
—
|
|
3
|
|
|||||||||||||
|
Issuance of common stock related to acquisitions
|
—
|
|
—
|
|
9
|
|
—
|
|
77
|
|
—
|
|
—
|
|
77
|
|
|||||||||||||
|
Issuance of common stock for settlement of RSUs
|
—
|
|
—
|
|
65
|
|
—
|
|
—
|
|
—
|
|
—
|
|
—
|
|
|||||||||||||
|
Shares withheld related to net share settlement of RSUs
|
—
|
|
—
|
|
(27
|
)
|
—
|
|
(889
|
)
|
—
|
|
—
|
|
(889
|
)
|
|||||||||||||
|
Share-based compensation, related to employee share-based awards
|
—
|
|
—
|
|
—
|
|
—
|
|
906
|
|
—
|
|
—
|
|
906
|
|
|||||||||||||
|
Tax benefit from share-based award activity
|
—
|
|
—
|
|
—
|
|
—
|
|
602
|
|
—
|
|
—
|
|
602
|
|
|||||||||||||
|
Other comprehensive income
|
—
|
|
—
|
|
—
|
|
—
|
|
—
|
|
12
|
|
—
|
|
12
|
|
|||||||||||||
|
Net income
|
—
|
|
—
|
|
—
|
|
—
|
|
—
|
|
—
|
|
1,500
|
|
1,500
|
|
|||||||||||||
|
Balances at December 31, 2013
|
—
|
|
$
|
—
|
|
2,547
|
|
$
|
—
|
|
$
|
12,297
|
|
$
|
14
|
|
$
|
3,159
|
|
$
|
15,470
|
|
|||||||
See Accompanying Notes to Consolidated Financial Statements.
63
FACEBOOK, INC.
(In millions)
|
Year Ended December 31,
|
|||||||||||
|
2013
|
2012
|
2011
|
|||||||||
|
Cash flows from operating activities
|
|||||||||||
|
Net income
|
$
|
1,500
|
|
$
|
53
|
|
$
|
1,000
|
|
||
|
Adjustments to reconcile net income to net cash provided by operating activities:
|
|||||||||||
|
Depreciation and amortization
|
1,011
|
|
649
|
|
323
|
|
|||||
|
Lease abandonment expense
|
117
|
|
8
|
|
—
|
|
|||||
|
Loss on disposal or write-off of equipment
|
56
|
|
15
|
|
4
|
|
|||||
|
Share-based compensation
|
906
|
|
1,572
|
|
217
|
|
|||||
|
Deferred income taxes
|
(37
|
)
|
(186
|
)
|
(30
|
)
|
|||||
|
Tax benefit from share-based award activity
|
602
|
|
1,033
|
|
433
|
|
|||||
|
Excess tax benefit from share-based award activity
|
(609
|
)
|
(1,033
|
)
|
(433
|
)
|
|||||
|
Changes in assets and liabilities:
|
|||||||||||
|
Accounts receivable
|
(378
|
)
|
(170
|
)
|
(174
|
)
|
|||||
|
Income tax refundable
|
400
|
|
(451
|
)
|
—
|
|
|||||
|
Prepaid expenses and other current assets
|
(45
|
)
|
(14
|
)
|
(24
|
)
|
|||||
|
Other assets
|
(142
|
)
|
2
|
|
(5
|
)
|
|||||
|
Accounts payable
|
26
|
|
1
|
|
6
|
|
|||||
|
Developer partners payable
|
12
|
|
(2
|
)
|
96
|
|
|||||
|
Accrued expenses and other current liabilities
|
(38
|
)
|
152
|
|
37
|
|
|||||
|
Deferred revenue and deposits
|
8
|
|
(60
|
)
|
49
|
|
|||||
|
Other liabilities
|
833
|
|
43
|
|
50
|
|
|||||
|
Net cash provided by operating activities
|
4,222
|
|
1,612
|
|
|
1,549
|
|
||||
|
Cash flows from investing activities
|
|||||||||||
|
Purchases of property and equipment
|
(1,362
|
)
|
(1,235
|
)
|
(606
|
)
|
|||||
|
Purchases of marketable securities
|
(7,433
|
)
|
(10,307
|
)
|
(3,025
|
)
|
|||||
|
Sales of marketable securities
|
2,988
|
|
2,100
|
|
113
|
|
|||||
|
Maturities of marketable securities
|
3,563
|
|
3,333
|
|
516
|
|
|||||
|
Investments in non-marketable equity securities
|
(1
|
)
|
(2
|
)
|
(3
|
)
|
|||||
|
Acquisitions of businesses, net of cash acquired, and purchases of intangible assets
|
(368
|
)
|
(911
|
)
|
(24
|
)
|
|||||
|
Change in restricted cash and deposits
|
(11
|
)
|
(2
|
)
|
6
|
|
|||||
|
Net cash used in investing activities
|
(2,624
|
)
|
(7,024
|
)
|
(3,023
|
)
|
|||||
|
Cash flows from financing activities
|
|||||||||||
|
Net proceeds from issuance of common stock
|
1,478
|
|
6,760
|
|
998
|
|
|||||
|
Taxes paid related to net share settlement of equity awards
|
(889
|
)
|
(2,862
|
)
|
—
|
|
|||||
|
Proceeds from exercise of stock options
|
26
|
|
17
|
|
28
|
|
|||||
|
Proceeds from long-term debt, net of issuance cost
|
—
|
|
1,496
|
|
—
|
|
|||||
|
Repayment of long-term debt
|
(1,500
|
)
|
—
|
|
(250
|
)
|
|||||
|
Proceeds from sale and lease-back transactions
|
—
|
|
205
|
|
170
|
|
|||||
|
Principal payments on capital lease obligations
|
(391
|
)
|
(366
|
)
|
(181
|
)
|
|||||
|
Excess tax benefit from share-based award activity
|
609
|
|
1,033
|
|
433
|
|
|||||
|
Net cash (used in) provided by financing activities
|
(667
|
)
|
6,283
|
|
1,198
|
|
|||||
|
Effect of exchange rate changes on cash and cash equivalents
|
8
|
|
1
|
|
3
|
|
|||||
|
Net increase (decrease) in cash and cash equivalents
|
939
|
|
872
|
|
(273
|
)
|
|||||
|
Cash and cash equivalents at beginning of period
|
2,384
|
|
1,512
|
|
1,785
|
|
|||||
|
Cash and cash equivalents at end of period
|
$
|
3,323
|
|
$
|
2,384
|
|
$
|
1,512
|
|
||
See Accompanying Notes to Consolidated Financial Statements.
64
FACEBOOK, INC.
CONSOLIDATED STATEMENTS OF CASH FLOWS
(In millions)
|
Year Ended December 31,
|
|||||||||||
|
2013
|
2012
|
2011
|
|||||||||
|
Supplemental cash flow data
|
|||||||||||
|
Cash paid during the period for:
|
|||||||||||
|
Interest
|
$
|
38
|
|
$
|
38
|
|
$
|
28
|
|
||
|
Income taxes
|
$
|
82
|
|
$
|
184
|
|
$
|
197
|
|
||
|
Cash received during the period for:
|
|||||||||||
|
Refund of income taxes
|
$
|
421
|
|
$
|
131
|
|
$
|
—
|
|
||
|
Non-cash investing and financing activities:
|
|||||||||||
|
Net change in accounts payable and accrued expenses and other current liabilities related to property and equipment additions
|
$
|
53
|
|
$
|
(40
|
)
|
$
|
135
|
|
||
|
Property and equipment acquired under capital leases
|
$
|
11
|
|
$
|
340
|
|
$
|
473
|
|
||
|
Fair value of shares issued related to acquisitions of businesses and other assets
|
$
|
77
|
|
$
|
274
|
|
$
|
58
|
|
||
See Accompanying Notes to Consolidated Financial Statements.
65
FACEBOOK, INC.
NOTES TO CONSOLIDATED FINANCIAL STATEMENTS
|
Note 1.
|
Summary of Significant Accounting Policies
|
Organization and Description of Business
Facebook was incorporated in Delaware in July 2004. Our mission is to give people the power to share and make the world more open and connected. We build products that support our mission by providing value to Facebook users, marketers, and developers. We generate substantially all of our revenue from advertising and from fees associated with our Payments infrastructure that enables users to purchase virtual and digital goods from developers with applications on the Facebook website.
Basis of Presentation
We prepared the consolidated financial statements in accordance with U.S. generally accepted accounting principles (GAAP). The consolidated financial statements include the accounts of Facebook, Inc. and its wholly owned subsidiaries. All intercompany balances and transactions have been eliminated.
Use of Estimates
Conformity with GAAP requires the use of estimates and judgments that affect the reported amounts in the consolidated financial statements and accompanying notes. These estimates form the basis for judgments we make about the carrying values of our assets and liabilities, which are not readily apparent from other sources. We base our estimates and judgments on historical information and on various other assumptions that we believe are reasonable under the circumstances. GAAP requires us to make estimates and judgments in several areas, including, but not limited to, those related to revenue recognition, collectability of accounts receivable, contingent liabilities, fair value of acquired intangible assets and goodwill, useful lives of intangible assets and property and equipment, and income taxes. These estimates are based on management's knowledge about current events and expectations about actions we may undertake in the future. Actual results could differ materially from those estimates.
Reclassifications
We have reclassified certain prior period amounts within our consolidated statements of cash flows to conform to our current year presentation.
Revenue Recognition
We generate substantially all of our revenue from advertising and payment processing fees. We recognize revenue once all of the following criteria have been met:
|
•
|
persuasive evidence of an arrangement exists;
|
|
•
|
delivery of our obligations to our customer has occurred;
|
|
•
|
the price is fixed or determinable; and
|
|
•
|
collectability of the related receivable is reasonably assured.
|
Revenue for the years ended
December 31, 2013
,
2012
, and
2011
consists of the following (in millions):
|
|
Year Ended December 31,
|
||||||||||
|
|
2013
|
2012
|
2011
|
||||||||
|
Advertising
|
$
|
6,986
|
|
$
|
4,279
|
|
$
|
3,154
|
|
||
|
Payments and other fees
|
886
|
|
810
|
|
557
|
|
|||||
|
Total revenue
|
$
|
7,872
|
|
$
|
5,089
|
|
$
|
3,711
|
|
||
Advertising
Advertising revenue is generated by displaying ad products on the Facebook website or mobile application and third-party affiliated websites or mobile applications. The arrangements are evidenced by either online acceptance of terms and conditions or contracts that stipulate the types of advertising to be delivered, the timing and the pricing. Marketers pay for ad products either directly or through their relationships with advertising agencies, based on the number of clicks made by our users, the number of actions taken by our users or
66
the number of impressions delivered. The typical term of an advertising arrangement is approximately 30 days with billing generally occurring after the delivery of the advertisement.
We recognize revenue from the delivery of click-based ads in the period in which a user clicks on the content, and action-based ads in the period in which a user takes the action the marketer contracted for. We recognize revenue from the display of impression-based ads in the contracted period in which the impressions are delivered. Impressions are considered delivered when an ad is displayed to users.
Payments and Other Fees
We enable Payments from our users to purchase virtual and digital goods from our developers with applications on the Facebook website. Our users can transact and make payments on the Facebook website by using debit cards and credit cards, PayPal, mobile phone payments, gift cards or other methods.
When a user engages in a payment transaction for the purchase of a virtual or digital good from a developer, we remit to the developer an amount that is based on the total amount of the transaction less the processing fee that we charge the developer. The price of the purchase is an amount that is solely determined by the developer. Our revenue is the net amount of the transaction, representing our processing fee for the service performed. We record revenue on a net basis as we do not consider ourselves to be the principal in the sale of the virtual or digital good to the user.
Our Payments terms and conditions provide for a
30
-day claim period subsequent to a Payments transaction during which the customer may dispute the virtual or digital goods transaction. Due to lack of historical transactional information, through the third quarter of 2012, we deferred recognition of Payments revenue until the expiration of the claim period as we were unable to make reasonable and reliable estimates of future refunds or chargebacks arising during this period. Beginning in the fourth quarter of 2012, we had
24 months
of historical transactional information which enabled us to estimate future refunds and chargebacks. Accordingly, commencing in the fourth quarter of 2012, we record all Payments revenues at the time of the purchase of the related virtual or digital goods, net of estimated refunds or chargebacks. This change resulted in a one-time increase in Payments revenue in the fourth quarter of 2012 of approximately
$66 million
as we recognized revenue from
four months
of transactions.
Other fees, which includes user Promoted Posts and our ad serving and measurement products, were not material in all periods presented in our financial statements.
Revenue is recognized net of applicable sales and other taxes.
Cost of Revenue
Our cost of revenue consists primarily of expenses associated with the delivery and distribution of our products. These include expenses related to the operation of our data centers such as facility and server equipment depreciation, facility and server equipment rent expense, energy and bandwidth costs, support and maintenance costs, and salaries, benefits and share-based compensation for certain personnel on our operations teams. Cost of revenue also includes credit card and other transaction fees related to processing customer transactions.
Share-based Compensation
We account for share-based employee compensation plans under the fair value recognition and measurement provisions of GAAP. Those provisions require all share-based payments to employees, including grants of stock options and RSUs, to be measured based on the grant-date fair value of the awards, with the resulting expense generally recognized in our consolidated statements of income over the period during which the employee is required to perform service in exchange for the award.
Prior to January 1, 2011, we granted RSUs (Pre-2011 RSUs) under our 2005 Stock Plan to our employees and members of our board of directors that vested upon the satisfaction of both a service condition and a liquidity condition. The service condition for the majority of these awards is satisfied over
four years
. The liquidity condition was satisfied six months after our initial public offering (IPO) in May 2012. The vesting condition that was satisfied six months following our IPO did not affect the expense attribution period for the RSUs for which the service condition had been met as of the date of our IPO. This six-month period was not a substantive service condition and, accordingly, beginning on the effectiveness of our IPO in May 2012, we began recognizing share-based compensation expense for the portion of the RSUs that had met the service condition, following the accelerated attribution method (net of estimated forfeitures).
RSUs granted on or after January 1, 2011 (Post-2011 RSUs) under our 2005 Stock Plan or 2012 Equity Incentive Plan (2012 Plan) are not subject to a liquidity condition in order to vest, and compensation expense related to these grants is based on the grant date fair value of the RSUs and is recognized on a straight-line basis over the applicable service period. The majority of Post-2011 RSUs are earned over a service period of
four
to
five years
.
67
Share-based compensation expense is recorded net of estimated forfeitures in our consolidated statements of income and as such, only those share-based awards that we expect to vest are recorded. We estimate the forfeiture rate based on historical forfeitures of equity awards and adjust the rate to reflect changes in facts and circumstances, if any. We will revise our estimated forfeiture rate if actual forfeitures differ from our initial estimates.
We have historically issued unvested restricted shares to employee stockholders of certain acquired companies. As these awards are generally subject to continued post-acquisition employment, we have accounted for them as post-acquisition share-based compensation expense. We recognize compensation expense equal to the grant date fair value of the common stock on a straight-line basis over the employee's required service period.
During the years ended
December 31, 2013
,
2012
, and
2011
, we realized tax benefits from share-based award activity of
$602 million
,
$1.03 billion
, and
$433 million
, respectively. These amounts reflect the extent that the total reduction to our income tax liability from share-based award activity was greater than the amount of the deferred tax assets that we had previously recorded in anticipation of these benefits. These amounts are the aggregate of the individual transactions in which the reduction to our income tax liability was greater than the deferred tax assets that we recorded, reduced by any individual transactions in which the reduction to our income tax liability was less than the deferred tax assets that were recorded. These net amounts were recorded as an adjustment to stockholders' equity in each period, as an increase to cash flows from operating activities, and were not recognized in our consolidated statements of income.
In addition, we reported excess tax benefits that decreased our cash flows from operating activities and increased our cash flows from financing activities for the years ended
December 31, 2013
,
2012
, and
2011
, by
$609 million
,
$1.03 billion
, and
$433 million
, respectively. The amounts of these excess tax benefits reflect the total of the individual transactions in which the reduction to our income tax liability was greater than the deferred tax assets that were recorded, but were not reduced by any of the individual transactions in which the reduction to our income tax liability was less than the deferred tax assets that were recorded.
Income Taxes
We recognize income taxes under the asset and liability method. We recognize deferred income tax assets and liabilities for the expected future consequences of temporary differences between the financial reporting and tax bases of assets and liabilities. These differences are measured using the enacted statutory tax rates that are expected to apply to taxable income for the years in which differences are expected to reverse. We recognize the effect on deferred income taxes of a change in tax rates in income in the period that includes the enactment date.
We record a valuation allowance to reduce our deferred tax assets to the net amount that we believe is more likely than not to be realized. We consider all available evidence, both positive and negative, including historical levels of income, expectations and risks associated with estimates of future taxable income and ongoing tax planning strategies in assessing the need for a valuation allowance.
We recognize tax benefits from uncertain tax positions only if we believe that it is more likely than not that the tax position will be sustained on examination by the taxing authorities based on the technical merits of the position. We make adjustments to these reserves when facts and circumstances change, such as the closing of a tax audit or the refinement of an estimate. The provision for income taxes includes the effects of any reserves that are considered appropriate, as well as the related net interest and penalties.
Advertising Expense
Advertising costs are expensed when incurred and are included in marketing and sales expenses in the accompanying consolidated statements of income. We incurred advertising expenses of
$117 million
,
$67 million
, and
$28 million
for the years ended
December 31, 2013
,
2012
, and
2011
, respectively.
Cash and Cash Equivalents, and Marketable Securities
Cash and cash equivalents primarily consist of cash on deposit with banks and investments in money market funds, and U.S. government and U.S. government agency securities with maturities of 90 days or less from the date of purchase.
We hold investments in marketable securities, consisting of
U.S. government and U.S. government agency securities
. We classify our marketable securities as available-for-sale investments in our current assets because they represent investments of cash available for current operations. Our available-for-sale investments are carried at estimated fair value with any unrealized gains and losses, net of taxes, included in accumulated other comprehensive income/(loss) in stockholders' equity. Unrealized losses are charged against other income (expense), net when a decline in fair value is determined to be other-than-temporary. We have not recorded any such impairment charge in the periods presented. We determine realized gains or losses on sale of marketable securities on a specific identification method, and record such gains or losses as other income (expense), net.
We classify certain restricted cash balances within prepaid expenses and other current assets and other assets on the accompanying consolidated balance sheets based upon the term of the remaining restrictions.
68
Fair Value of Financial Instruments
We apply fair value accounting for all financial assets and liabilities and non-financial assets and liabilities that are recognized or disclosed at fair value in the financial statements on a recurring basis. We define fair value as the price that would be received from selling an asset or paid to transfer a liability in an orderly transaction between market participants at the measurement date. When determining the fair value measurements for assets and liabilities, which are required to be recorded at fair value, we consider the principal or most advantageous market in which we would transact and the market-based risk measurements or assumptions that market participants would use in pricing the asset or liability, such as risks inherent in valuation techniques, transfer restrictions and credit risk. Fair value is estimated by applying the following hierarchy, which prioritizes the inputs used to measure fair value into three levels and bases the categorization within the hierarchy upon the lowest level of input that is available and significant to the fair value measurement:
Level 1
-Quoted prices in active markets for identical assets or liabilities.
Level 2
-Observable inputs other than quoted prices in active markets for identical assets and liabilities, quoted prices for identical or similar assets or liabilities in inactive markets, or other inputs that are observable or can be corroborated by observable market data for substantially the full term of the assets or liabilities.
Level 3
-Inputs that are generally unobservable and typically reflect management's estimate of assumptions that market participants would use in pricing the asset or liability.
Our valuation techniques used to measure the fair value of money market funds and marketable debt securities were derived from quoted prices in active markets for identical assets or liabilities and our valuation technique used to measure the fair value of our derivative instrument was based on a model-driven valuation using significant inputs derived from or corroborated by observable market data.
Accounts Receivable and Allowance for Doubtful Accounts
Accounts receivable are recorded and carried at the original invoiced amount less an allowance for any potential uncollectible amounts. We make estimates for the allowance for doubtful accounts based upon our assessment of various factors, including historical experience, the age of the accounts receivable balances, credit quality of our customers, current economic conditions, and other factors that may affect customers' ability to pay.
Property and Equipment
Property and equipment, which includes amounts recorded under capital leases, are stated at cost less accumulated depreciation. Depreciation is computed using the straight-line method over the estimated useful lives of the assets or the remaining lease term, in the case of a capital lease, whichever is shorter.
The estimated useful lives of property and equipment are described below:
|
Property and Equipment
|
Useful Life
|
|
|
Network equipment
|
Three to five years
|
|
|
Buildings
|
15 to 20 years
|
|
|
Computer software, office equipment and other
|
Three to five years
|
|
|
Leased equipment and leasehold improvements
|
Lesser of estimated useful life or remaining lease term
|
|
Land and assets held within construction in progress are not depreciated. Construction in progress is related to the construction or development of property and equipment that have not yet been placed in service for their intended use.
The cost of maintenance and repairs is expensed as incurred. When assets are retired or otherwise disposed of, the cost and related accumulated depreciation are removed from their respective accounts, and any gain or loss on such sale or disposal is reflected in income from operations.
Lease Obligations
We lease office space, data centers, and equipment under non-cancelable capital and operating leases with various expiration dates through
2029
. Certain of the operating lease agreements contain rent holidays, rent escalation provisions, and purchase options. Rent holidays and rent escalation provisions are considered in determining the straight-line rent expense to be recorded over the lease term. The lease term begins on the date of initial possession of the leased property for purposes of recognizing lease expense on a straight-line basis over the term of the lease. We do not assume renewals in our determination of the lease term unless the renewals are deemed to be reasonably assured at lease inception.
69
Loss Contingencies
We are involved in various lawsuits, claims, investigations and proceedings that arise in the ordinary course of business. We record a liability when we believe that it is both probable that a loss has been incurred and the amount can be reasonably estimated. Significant judgment is required to determine both probability and the estimated amount. We review these provisions at least quarterly and adjust these provisions accordingly to reflect the impact of negotiations, settlements, rulings, advice of legal counsel, and updated information.
Business Combinations
We allocate the fair value of purchase consideration to the tangible assets acquired, liabilities assumed and intangible assets acquired based on their estimated fair values. The excess of the fair value of purchase consideration over the fair values of these identifiable assets and liabilities is recorded as goodwill. Such valuations require management to make significant estimates and assumptions, especially with respect to intangible assets. During the measurement period, which is one year from the acquisition date, we may record adjustments to the assets acquired and liabilities assumed, with the corresponding offset to goodwill. Upon the conclusion of the measurement period, any subsequent adjustments are recorded to earnings.
Long-Lived Assets, Including Goodwill and Other Acquired Intangible Assets
We evaluate the recoverability of property and equipment and amortizable intangible assets for possible impairment whenever events or circumstances indicate that the carrying amount of such assets may not be recoverable. Recoverability of these assets is measured by a comparison of the carrying amounts to the future undiscounted cash flows the assets are expected to generate. If such review indicates that the carrying amount of property and equipment and intangible assets is not recoverable, the carrying amount of such assets is reduced to fair value. We have not recorded any significant impairment charge during the years presented.
We review goodwill for impairment at least annually or more frequently if events or changes in circumstances indicate that the carrying value of goodwill may not be recoverable. We have elected to first assess the qualitative factors to determine whether it is more likely than not that the fair value of our single reporting operating unit is less than its carrying amount as a basis for determining whether it is necessary to perform the two-step goodwill impairment under Accounting Standards Update (ASU) No. 2011-08,
Goodwill and Other (Topic 350): Testing Goodwill for Impairment,
issued by the Financial Accounting Standards Board (FASB). If we determine that it is more likely than not that its fair value is less than its carrying amount, then the two-step goodwill impairment test is performed. The first step, identifying a potential impairment, compares the fair value of the reporting unit with its carrying amount. If the carrying amount exceeds its fair value, the second step would need to be performed; otherwise, no further step is required. The second step, measuring the impairment loss, compares the implied fair value of the goodwill with the carrying amount of the goodwill. Any excess of the goodwill carrying amount over the applied fair value is recognized as an impairment loss, and the carrying value of goodwill is written down to fair value. As of
December 31, 2013
,
no
impairment of goodwill has been identified.
Acquired amortizable intangible assets, which are included in goodwill and intangible assets, net, are amortized on a straight-line basis over the estimated useful lives of the assets. The estimated remaining useful lives for intangible assets range from less than
one year
to
16 years
.
In addition to the recoverability assessment, we routinely review the remaining estimated useful lives of property and equipment and amortizable intangible assets. If we reduce the estimated useful life assumption for any asset, the remaining unamortized balance would be amortized or depreciated over the revised estimated useful life.
Deferred Revenue and Deposits
Deferred revenue consists of billings in advance of revenue recognition. Deposits relate to unused virtual currency held by our users. Once this virtual currency is utilized by a user, approximately
70%
of this amount would then be payable to the developer and the balance would be recognized as revenue.
Deferred revenue and deposits consists of the following (in millions):
|
|
December 31,
|
||||||
|
|
2013
|
2012
|
|||||
|
Deferred revenue
|
$
|
13
|
|
$
|
8
|
|
|
|
Deposits
|
25
|
|
22
|
|
|||
|
Total deferred revenue and deposits
|
$
|
38
|
|
$
|
30
|
|
|
70
Foreign Currency
Generally the functional currency of our international subsidiaries is the local currency. We translate the financial statements of these subsidiaries to U.S. dollars using month-end rates of exchange for assets and liabilities, and average rates of exchange for revenue, costs, and expenses. Translation gains and losses are recorded in accumulated other comprehensive income as a component of stockholders' equity. Net losses resulting from foreign exchange transactions were
$14 million
,
$9 million
, and
$29 million
for the years ended
December 31, 2013
,
2012
, and
2011
, respectively. These losses were recorded as other income (expense), net on our consolidated statements of income.
Credit Risk and Concentration
Financial instruments owned by the company that are potentially subject to concentrations of credit risk consist primarily of cash, cash equivalents, restricted cash, marketable securities, accounts receivable, and derivative instruments. Cash equivalents consist of short-term money market funds and
U.S. government and U.S. government agency securities
, which are managed by reputable financial institutions. Marketable securities consist of investments in
U.S. government and U.S. government agency securities
. Our investment policy limits investment instruments to
U.S. government and U.S. government agency securities
with the main objective of preserving capital and maintaining liquidity.
Accounts receivable are typically unsecured and are derived from revenue earned from customers across different industries and countries. We generated
46%
,
51%
, and
56%
of our revenue for the years ended
December 31, 2013
,
2012
, and
2011
, respectively, from marketers and developers based in the United States, with the majority of revenue outside of the United States coming from customers located in western Europe, Canada, Australia, and Brazil.
We perform ongoing credit evaluations of our customers, and generally do not require collateral. We maintain an allowance for estimated credit losses. During the years ended
December 31, 2013
,
2012
, and
2011
, our bad debt expenses were
$21 million
,
$9 million
, and
$8 million
, respectively. In the event that accounts receivable collection cycles deteriorate, our operating results and financial position could be adversely affected.
No customer represented 10% or more of total revenue during the years ended
December 31, 2013
and 2012 and
one
customer represented
12%
of total revenue for the year ended December 31, 2011.
Segments
Our chief operating decision-maker is our Chief Executive Officer who reviews financial information presented on a consolidated basis. There are no segment managers who are held accountable by the chief operating decision-maker, or anyone else, for operations, operating results, and planning for levels or components below the consolidated unit level. Accordingly, we have determined that we have a single reporting segment and operating unit structure.
Recently Issued and Adopted Accounting Pronouncement
Comprehensive Income
In February 2013, the FASB issued ASU No. 2013-02,
Comprehensive Income (Topic 220): Reporting of Amounts Reclassified Out of Accumulated Other Comprehensive Income
(ASU 2013-02), which is effective prospectively for public companies for reporting periods beginning after December 15, 2012. This new accounting standard improves the reporting of reclassifications out of accumulated other comprehensive income (AOCI) by requiring an entity to report the effect of significant reclassifications out of AOCI on the respective line items in net income if the amount being reclassified is required under GAAP to be reclassified in its entirety to net income. For other amounts that are not required under GAAP to be reclassified in their entirety to net income in the same reporting period, an entity is required to cross-reference other disclosures required under GAAP that provide additional detail about those amounts. We adopted this new guidance on January 1, 2013 and the adoption did not have a material effect on our consolidated financial statements.
|
Note 2.
|
Acquisitions
|
During the year ended
December 31, 2013
, we completed several business acquisitions for total consideration of
$363 million
, consisting of approximately
$285 million
in cash and
3 million
vested shares of our Class A common stock which are not conditioned upon continuous employment. In addition, we issued approximately
6 million
shares of Class A common stock in connection with such acquisitions, which are conditioned upon continuous employment. These shares have been excluded from purchase consideration and will be recognized over the required service period as share-based compensation expense.
Pro forma results of operations related to our acquisitions during the year ended
December 31, 2013
have not been presented because they are not material to our consolidated statements of income, either individually or in the aggregate.
71
The following table summarizes the allocation of estimated fair values of the net assets acquired during the year ended
December 31, 2013
, including the related estimated useful lives, where applicable:
|
(in millions)
|
Useful lives (in years)
|
||||
|
Amortizable intangible assets:
|
|||||
|
Acquired technology
|
$
|
94
|
|
3 - 7
|
|
|
Tradename and other
|
41
|
|
2 - 10
|
||
|
Net liabilities assumed
|
(3
|
)
|
|||
|
Deferred tax liabilities
|
(21
|
)
|
|||
|
Net assets acquired
|
$
|
111
|
|
||
|
Goodwill
|
252
|
|
|||
|
Total fair value considerations
|
$
|
363
|
|
||
Goodwill generated from all business acquisitions completed during the year ended
December 31, 2013
is primarily attributable to expected synergies from future growth and potential monetization opportunities and
$130 million
of this goodwill is deductible for tax purposes.
During the year ended
December 31, 2013
, we also acquired
$92 million
of patents and other intangible assets. Patents acquired during the year ended
December 31, 2013
have estimated useful lives ranging from
six
to
15 years
from the dates of acquisition.
|
Note 3.
|
Earnings per Share
|
We compute earnings per share (EPS) of Class A and Class B common stock using the two-class method required for participating securities. Prior to the date of our IPO in May 2012, we considered all series of our convertible preferred stock to be participating securities due to their non-cumulative dividend rights. Immediately after the completion of our IPO, all outstanding shares of convertible preferred stock converted to Class B common stock. Additionally, we consider restricted stock awards to be participating securities because holders of such shares have non-forfeitable dividend rights in the event of our declaration of a dividend for common shares.
Undistributed earnings allocated to these participating securities are subtracted from net income in determining net income attributable to common stockholders. Basic EPS is computed by dividing net income attributable to common stockholders by the weighted-average number of shares of our Class A and Class B common stock outstanding, adjusted for outstanding shares that are subject to repurchase.
For the calculation of diluted EPS, net income attributable to common stockholders for basic EPS is adjusted by the effect of dilutive securities, including awards under our equity compensation plans. In addition, the computation of the diluted EPS of Class A common stock assumes the conversion from Class B common stock, while the diluted EPS of Class B common stock does not assume the conversion of those shares to Class A common stock. Diluted EPS attributable to common stockholders is computed by dividing the resulting net income attributable to common stockholders by the weighted-average number of fully diluted common shares outstanding.
Dilutive securities in our diluted EPS calculation for the year ended
December 31, 2011
do not include Pre-2011 RSUs. Vesting of these RSUs is dependent upon the satisfaction of both a service condition and a liquidity condition. The liquidity condition is satisfied upon the occurrence of a qualifying event, defined as a change of control transaction or six months following the completion of our IPO. Our IPO did not occur until May 2012. Therefore, prior to this date the holders of these RSUs had no rights in our undistributed earnings and accordingly, they are excluded from the effect of basic and dilutive securities. However, subsequent to the completion of our IPO in May 2012, these RSUs are included in our basic and diluted EPS calculation. Post-2011 RSUs are not subject to a liquidity condition in order to vest, and are thus included in the calculation of diluted EPS.
We also excluded
1 million
,
15 million
, and
3 million
Post-2011 RSUs for the years ended
December 31, 2013
,
2012
, and
2011
, respectively, because the impact would be anti-dilutive.
Basic and diluted EPS are the same for each class of common stock because they are entitled to the same liquidation and dividend rights.
72
The numerators and denominators of the basic and diluted EPS computations for our common stock are calculated as follows (in millions, except per share amounts):
|
|
Year Ended December 31,
|
||||||||||||||||||||||
|
|
2013
|
2012
|
2011
|
||||||||||||||||||||
|
|
Class
A
|
Class
B
|
Class
A
|
Class
B
|
Class
A
|
Class
B
|
|||||||||||||||||
|
Basic EPS:
|
|
|
|
|
|
|
|||||||||||||||||
|
Numerator
|
|
|
|
|
|
|
|||||||||||||||||
|
Net income
|
$
|
1,114
|
|
$
|
386
|
|
$
|
18
|
|
$
|
35
|
|
$
|
85
|
|
$
|
915
|
|
|||||
|
Less: Net income attributable to participating securities
|
7
|
|
2
|
|
7
|
|
14
|
|
28
|
|
304
|
|
|||||||||||
|
Net income attributable to common stockholders
|
$
|
1,107
|
|
$
|
384
|
|
$
|
11
|
|
$
|
21
|
|
$
|
57
|
|
$
|
611
|
|
|||||
|
Denominator
|
|
|
|
|
|
|
|||||||||||||||||
|
Weighted average shares outstanding
|
1,803
|
|
631
|
|
668
|
|
1,344
|
|
110
|
|
1,189
|
|
|||||||||||
|
Less: Shares subject to repurchase
|
5
|
|
9
|
|
1
|
|
5
|
|
—
|
|
5
|
|
|||||||||||
|
Number of shares used for basic EPS computation
|
1,798
|
|
622
|
|
667
|
|
1,339
|
|
110
|
|
1,184
|
|
|||||||||||
|
Basic EPS
|
$
|
0.62
|
|
$
|
0.62
|
|
$
|
0.02
|
|
$
|
0.02
|
|
$
|
0.52
|
|
$
|
0.52
|
|
|||||
|
Diluted EPS:
|
|
|
|
|
|||||||||||||||||||
|
Numerator
|
|
|
|
|
|
|
|||||||||||||||||
|
Net income attributable to common stockholders
|
$
|
1,107
|
|
$
|
384
|
|
$
|
11
|
|
$
|
21
|
|
$
|
57
|
|
$
|
611
|
|
|||||
|
Reallocation of net income attributable to participating securities
|
9
|
|
—
|
|
—
|
|
—
|
|
31
|
|
—
|
|
|||||||||||
|
Reallocation of net income as a result of conversion of Class B to Class A common stock
|
384
|
|
—
|
|
21
|
|
—
|
|
611
|
|
—
|
|
|||||||||||
|
Reallocation of net income to Class B common stock
|
—
|
|
39
|
|
—
|
|
1
|
|
—
|
|
37
|
|
|||||||||||
|
Net income attributable to common stockholders for diluted EPS
|
$
|
1,500
|
|
$
|
423
|
|
$
|
32
|
|
$
|
22
|
|
$
|
699
|
|
$
|
648
|
|
|||||
|
Denominator
|
|
|
|
|
|
|
|||||||||||||||||
|
Number of shares used for basic EPS computation
|
1,798
|
|
622
|
|
667
|
|
1,339
|
|
110
|
|
1,184
|
|
|||||||||||
|
Conversion of Class B to Class A common stock
|
622
|
|
—
|
|
1,339
|
|
—
|
|
1,184
|
|
—
|
|
|||||||||||
|
Weighted average effect of dilutive securities:
|
|
|
|
|
|
|
|||||||||||||||||
|
Employee stock options
|
65
|
|
65
|
|
134
|
|
134
|
|
204
|
|
204
|
|
|||||||||||
|
RSUs
|
25
|
|
15
|
|
23
|
|
23
|
|
5
|
|
5
|
|
|||||||||||
|
Shares subject to repurchase
|
7
|
|
7
|
|
3
|
|
3
|
|
3
|
|
3
|
|
|||||||||||
|
Warrants
|
—
|
|
—
|
|
—
|
|
—
|
|
2
|
|
2
|
|
|||||||||||
|
Number of shares used for diluted EPS computation
|
2,517
|
|
709
|
|
2,166
|
|
1,499
|
|
1,508
|
|
1,398
|
|
|||||||||||
|
Diluted EPS
|
$
|
0.60
|
|
$
|
0.60
|
|
$
|
0.01
|
|
$
|
0.01
|
|
$
|
0.46
|
|
$
|
0.46
|
|
|||||
73
|
Note 4.
|
Cash and Cash Equivalents, and Marketable Securities
|
The following table sets forth the cash, cash equivalents and marketable securities for the periods presented (in millions):
|
December 31,
|
|||||||
|
2013
|
2012
|
||||||
|
Cash and cash equivalents:
|
|||||||
|
Cash
|
$
|
1,044
|
|
$
|
1,513
|
|
|
|
Money market funds
|
2,279
|
|
871
|
|
|||
|
Total cash and cash equivalents
|
3,323
|
|
2,384
|
|
|||
|
Marketable securities:
|
|||||||
|
U.S. government securities
|
5,687
|
|
5,165
|
|
|||
|
U.S. government agency securities
|
2,439
|
|
2,077
|
|
|||
|
Total marketable securities
|
8,126
|
|
7,242
|
|
|||
|
Total cash, cash equivalents and marketable securities
|
$
|
11,449
|
|
$
|
9,626
|
|
|
The gross unrealized gains or losses on our marketable securities as of
December 31, 2013
and
2012
were not significant. In addition, there were
no
securities in a continuous loss position for 12 months or longer as of
December 31, 2013
and
2012
.
The following table classifies our marketable securities by contractual maturities (in millions):
|
December 31,
|
|||||||
|
|
2013
|
2012
|
|||||
|
Due in one year
|
$
|
4,704
|
|
$
|
4,815
|
|
|
|
Due in one to two years
|
3,422
|
|
2,427
|
|
|||
|
Total
|
$
|
8,126
|
|
$
|
7,242
|
|
|
|
Note 5.
|
Fair Value Measurement
|
The following table summarizes, for assets or liabilities measured at fair value, the respective fair value and the classification by level of input within the fair value hierarchy (in millions):
|
|
|
Fair Value Measurement at
Reporting Date Using
|
||||||||||||||
|
Description
|
December 31,
2013 |
Quoted
Prices in
Active
Markets for
Identical
Assets
(Level 1)
|
Significant
Other
Observable
Inputs
(Level 2)
|
Significant
Unobservable
Inputs
(Level 3)
|
||||||||||||
|
Cash equivalents:
|
|
|
|
|
||||||||||||
|
Money market funds
|
$
|
2,279
|
|
$
|
2,279
|
|
$
|
—
|
|
$
|
—
|
|
||||
|
Marketable securities:
|
|
|
|
|
||||||||||||
|
U.S. government securities
|
5,687
|
|
5,687
|
|
—
|
|
—
|
|
||||||||
|
U.S. government agency securities
|
2,439
|
|
2,439
|
|
—
|
|
—
|
|
||||||||
|
Total cash equivalents and marketable securities
|
$
|
10,405
|
|
$
|
10,405
|
|
$
|
—
|
|
$
|
—
|
|
||||
74
|
|
|
Fair Value Measurement at
Reporting Date Using
|
||||||||||||||
|
Description
|
December 31,
2012 |
Quoted
Prices in
Active
Markets for
Identical
Assets
(Level 1)
|
Significant
Other
Observable
Inputs
(Level 2)
|
Significant
Unobservable
Inputs
(Level 3
|
||||||||||||
|
Cash equivalents:
|
|
|
|
|
||||||||||||
|
Money market funds
|
$
|
871
|
|
$
|
871
|
|
$
|
—
|
|
$
|
—
|
|
||||
|
Marketable securities:
|
|
|||||||||||||||
|
U.S. government securities
|
5,165
|
|
5,165
|
|
—
|
|
—
|
|
||||||||
|
U.S. government agency securities
|
2,077
|
|
2,077
|
|
—
|
|
—
|
|
||||||||
|
Total cash equivalents and marketable securities
|
$
|
8,113
|
|
$
|
8,113
|
|
$
|
—
|
|
$
|
—
|
|
||||
|
|
||||||||||||||||
|
Other current liabilities:
|
|
|||||||||||||||
|
Contingent consideration liability
|
$
|
4
|
|
$
|
—
|
|
$
|
—
|
|
$
|
4
|
|
||||
|
|
||||||||||||||||
|
Other liabilities:
|
|
|||||||||||||||
|
Derivative financial instrument
|
$
|
4
|
|
$
|
—
|
|
$
|
4
|
|
$
|
—
|
|
||||
Our Level 2 derivative financial instrument as of December 31, 2012 represented our interest rate swap agreement which was valued based on a valuation model using significant inputs derived from or corroborated by observable market data. In August 2013, we terminated our Level 2 derivative financial instrument related to our interest rate swap agreement. See Note 9 in these notes to the consolidated financial statements for additional information with respect to the termination of our interest swap agreement.
We estimated the fair value of our Level 3 contingent consideration liability as of December 31, 2012 based on the probability assessment of an earn-out criteria. In developing these estimates, we considered factors not observed in the market and thus this represented a Level 3 measurement. Level 3 instruments are valued based on unobservable inputs that are supported by little or no market activity and reflect our own assumptions in measuring fair value. In August 2013, we settled our Level 3 contingent consideration liability.
|
Note 6.
|
Property and Equipment
|
Property and equipment consists of the following (in millions):
|
|
December 31,
|
||||||
|
|
2013
|
2012
|
|||||
|
Network equipment
|
$
|
2,351
|
|
$
|
1,912
|
|
|
|
Land
|
45
|
|
36
|
|
|||
|
Buildings
|
1,071
|
|
594
|
|
|||
|
Leasehold improvements
|
203
|
|
194
|
|
|||
|
Computer software, office equipment and other
|
95
|
|
93
|
|
|||
|
Construction in progress
|
377
|
|
444
|
|
|||
|
Total
|
4,142
|
|
3,273
|
|
|||
|
Less: Accumulated depreciation
|
(1,260
|
)
|
(882
|
)
|
|||
|
Property and equipment, net
|
$
|
2,882
|
|
$
|
2,391
|
|
|
Depreciation expense on property and equipment was
$857 million
,
$566 million
, and
$303 million
during
2013
,
2012
, and
2011
, respectively.
Property and equipment at
December 31, 2013
and
2012
includes
$976 million
and
$1.28 billion
, respectively, acquired under capital lease agreements of which the majority is included in network equipment. Accumulated depreciation of property and equipment acquired under these capital leases was
$527 million
and
$437 million
at
December 31, 2013
and
2012
, respectively.
Construction in progress includes costs primarily related to the construction of data centers in Iowa and Sweden and network equipment infrastructure to support our data centers around the world. Construction in progress also includes the ongoing construction to expand our corporate headquarters in Menlo Park, California. Interest capitalized during the periods presented was not material.
75
|
Note 7.
|
Goodwill and Intangible Assets
|
The changes in carrying amount of goodwill for the years ended
December 31, 2013
and
2012
are as follows (in millions):
|
Balance as of December 31, 2011
|
$
|
82
|
|
|
Goodwill acquired
|
505
|
|
|
|
Balance as of December 31, 2012
|
587
|
|
|
|
Goodwill acquired
|
252
|
|
|
|
Balance as of December 31, 2013
|
$
|
839
|
|
Intangible assets consist of the following (in millions):
|
December 31, 2013
|
December 31, 2012
|
||||||||||||||||||||||||
|
Useful lives from date of acquisitions (in years)
|
Gross Carrying Amount
|
Accumulated Amortization
|
Net Carrying Amount
|
Gross Carrying Amount
|
Accumulated Amortization
|
Net Carrying Amount
|
|||||||||||||||||||
|
Amortizable intangible assets:
|
|||||||||||||||||||||||||
|
Acquired patents
|
2 - 18
|
$
|
773
|
|
$
|
(142
|
)
|
$
|
631
|
|
$
|
684
|
|
$
|
(53
|
)
|
$
|
631
|
|
||||||
|
Acquired technology
|
2 - 10
|
227
|
|
(65
|
)
|
162
|
|
133
|
|
(32
|
)
|
101
|
|
||||||||||||
|
Tradename and other
|
2 - 10
|
138
|
|
(48
|
)
|
90
|
|
94
|
|
(25
|
)
|
69
|
|
||||||||||||
|
Total
|
$
|
1,138
|
|
$
|
(255
|
)
|
$
|
883
|
|
$
|
911
|
|
$
|
(110
|
)
|
$
|
801
|
|
|||||||
Amortization expense of intangible assets for the years ended
December 31, 2013
,
2012
, and
2011
was
$145 million
,
$78 million
, and
$20 million
, respectively.
As of
December 31, 2013
, expected amortization expense for the unamortized acquired intangible assets for the next five years and thereafter is as follows (in millions):
|
2014
|
$
|
160
|
|
|
2015
|
150
|
|
|
|
2016
|
138
|
|
|
|
2017
|
116
|
|
|
|
2018
|
82
|
|
|
|
Thereafter
|
237
|
|
|
|
Total
|
$
|
883
|
|
|
Note 8.
|
Liabilities
|
The components of accrued expenses and other current liabilities are as follows (in millions):
|
December 31,
|
|||||||
|
2013
|
2012
|
||||||
|
Accrued property and equipment
|
$
|
87
|
|
$
|
46
|
|
|
|
Accrued compensation and benefits
|
196
|
|
146
|
|
|||
|
Other current liabilities
|
272
|
|
231
|
|
|||
|
Accrued expenses and other current liabilities
|
$
|
555
|
|
$
|
423
|
|
|
76
The components of other liabilities are as follows (in millions):
|
December 31,
|
|||||||
|
2013
|
2012
|
||||||
|
Income tax payable
|
$
|
886
|
|
$
|
100
|
|
|
|
Other liabilities
|
202
|
|
205
|
|
|||
|
Other liabilities
|
$
|
1,088
|
|
$
|
305
|
|
|
|
Note 9.
|
|
In October 2012, we amended and restated our bridge credit facility, and converted it into a
three
-year unsecured term loan facility. The unsecured term loan allowed us to borrow up to
$1.5 billion
with interest payable on borrowed amount set at
LIBOR
plus
1.0%
, as well as an annual commitment fee of
0.10%
on the daily undrawn balance of the facility. We fully drew down on this facility in October 2012 and fully repaid the
$1.5 billion
outstanding principal balance in August 2013.
In connection with our termination of the unsecured term loan facility, we also terminated our
$1.5 billion
interest rate swap agreement which converted the
one-month LIBOR
rate on the corresponding notional amount of debt to a fixed interest rate to hedge our exposure to interest rate fluctuation. We have reclassified all amounts related to the interest rate swap in AOCI to interest expense. For the year ended
December 31, 2013
, the amount in AOCI reclassified to interest expense was not material. The realized gain as a result of the termination of our interest rate swap was also not material.
Concurrently, we also terminated our unsecured
five
-year revolving credit facility that allowed us to borrow up to
$5 billion
. We had not drawn down on this facility.
In August 2013, in connection with the termination of these facilities, we entered into a
five
-year senior unsecured revolving credit facility (2013 Revolving Credit Facility) that allows us to borrow up to
$6.5 billion
to fund working capital and general corporate purposes with interest payable on the borrowed amounts set at
LIBOR
plus
1.0%
, as well as an annual commitment fee of
0.10%
on the daily undrawn balance of the facility. We paid origination fees at closing of the 2013 Revolving Credit Facility, which fees are being amortized over the term of the facility. Any amounts outstanding under this facility will be due and payable on August 15, 2018. As of
December 31, 2013
,
no
amounts had been drawn down, and we were in compliance with the covenants under this facility.
|
Note 10.
|
Commitments and Contingencies
|
Commitments
Leases
We entered into various capital lease arrangements to obtain property and equipment for our operations. Additionally, on occasion we have purchased property and equipment for which we have subsequently obtained capital financing under sale-leaseback transactions. These agreements are typically for
three years
, except for building leases which are for
15 years
, with interest rates ranging from
1%
to
13%
. The leases are secured by the underlying leased buildings, leasehold improvements, and equipment. We have also entered into various non-cancelable operating lease agreements for certain of our offices, equipment, land and data centers with original lease periods expiring between
2014
and
2029
. We are committed to pay a portion of the related actual operating expenses under certain of these lease agreements. Certain of these arrangements have free rent periods or escalating rent payment provisions, and we recognize rent expense under such arrangements on a straight-line basis.
77
The following is a schedule, by years, of the future minimum lease payments required under non-cancelable capital and operating leases as of
December 31, 2013
(in millions):
|
|
Capital
Leases
|
Operating
Leases
|
|||||
|
2014
|
$
|
255
|
|
$
|
142
|
|
|
|
2015
|
127
|
|
142
|
|
|||
|
2016
|
21
|
|
139
|
|
|||
|
2017
|
15
|
|
131
|
|
|||
|
2018
|
16
|
|
112
|
|
|||
|
Thereafter
|
127
|
|
312
|
|
|||
|
Total minimum lease payments
|
$
|
561
|
|
$
|
978
|
|
|
|
Less: amount representing interest and taxes
|
(85
|
)
|
|
||||
|
Less: current portion of the present value of minimum lease payments
|
(239
|
)
|
|
||||
|
Capital lease obligations, net of current portion
|
$
|
237
|
|
|
|||
Operating lease expenses totaled
$130 million
,
$196 million
, and
$219 million
for the years ended
December 31, 2013
,
2012
and
2011
, respectively.
Other contractual commitments
We also have
$258 million
of non-cancelable contractual commitments as of
December 31, 2013
, primarily related to network infrastructure for our data center operations and, to a lesser extent, construction of our data center sites. The majority of these commitments are due within
five years
.
Contingencies
Legal Matters
Beginning on May 22, 2012, multiple putative class actions, derivative actions, and individual actions were filed in state and federal courts in the United States and in other jurisdictions against us, our directors, and/or certain of our officers alleging violation of securities laws or breach of fiduciary duties in connection with our IPO and seeking unspecified damages. We believe these lawsuits are without merit, and we intend to continue to vigorously defend them. On October 4, 2012, on our motion, the vast majority of the cases in the United States, along with multiple cases filed against The NASDAQ OMX Group, Inc. and The Nasdaq Stock Market LLC (collectively referred to herein as NASDAQ) alleging technical and other trading-related errors by NASDAQ in connection with our IPO, were ordered centralized for coordinated or consolidated pre-trial proceedings in the United States District Court for the Southern District of New York. On February 13, 2013, the court granted our motion to dismiss four derivative actions against our directors and certain of our officers with leave to amend. On October 8, 2013, the court heard argument on our motion to dismiss the consolidated securities class action, as well as our motion to dismiss, and the plaintiffs' motion to remand to state court, certain other derivative actions. On December 18, 2013, the court denied our motion to dismiss the consolidated securities class action. On December 23, 2013, the court granted our motion to dismiss, and denied the plaintiffs’ motion to remand to state court, certain other derivative actions. In addition, the events surrounding our IPO have become the subject of various government inquiries, and we are cooperating with those inquiries.
We are also party to various legal proceedings and claims that arise in the ordinary course of business. Among these pending legal matters, one case,
Rembrandt Social Media, LP v. Facebook, Inc., et al
., was scheduled to begin trial in December 2013 in the U.S. District Court for the Eastern District of Virginia. In this case, the plaintiff alleges that we infringe certain patents held by the plaintiff. The plaintiff is seeking significant monetary damages and equitable relief. This trial date was vacated in December 2013 and the case is currently on appeal. We believe the claims made by the plaintiff in the
Rembrandt
case are without merit, and we intend to continue to defend ourselves vigorously.
With respect to our outstanding legal matters, we believe that the amount or estimable range of reasonably possible loss will not, either individually or in the aggregate, have a material adverse effect on our business, consolidated financial position, results of operations, or cash flows. However, the outcome of litigation is inherently uncertain. Therefore, if one or more of these legal matters were resolved against us for amounts in excess of management's expectations, our results of operations and financial condition, including in a particular reporting period, could be materially adversely affected.
78
Indemnifications
In the normal course of business, to facilitate transactions of services and products, we have agreed to indemnify certain parties with respect to certain matters. We have agreed to hold certain parties harmless against losses arising from a breach of representations or covenants, or out of intellectual property infringement or other claims made by third parties. These agreements may limit the time within which an indemnification claim can be made and the amount of the claim. In addition, we have entered into indemnification agreements with our officers, directors, and certain employees, and our certificate of incorporation and bylaws contain similar indemnification obligations.
It is not possible to determine the maximum potential amount under these indemnification agreements due to the limited history of prior indemnification claims and the unique facts and circumstances involved in each particular agreement. Historically, payments made by us under these agreements have not had a material impact on our consolidated financial position, results of operations or cash flows. In our opinion, as of
December 31, 2013
, there was not at least a reasonable possibility we had incurred a material loss with respect to indemnification of such parties. We have not recorded any liability for costs related to indemnification through
December 31, 2013
.
|
Note 11.
|
Stockholders' Equity
|
Initial Public Offering
In May 2012, we completed our IPO in which we issued and sold
180,000,000
shares of Class A common stock at a public offering price of
$38.00
per share and the selling stockholders sold
241,233,615
shares of Class A common stock. We did not receive any proceeds from the sale of shares by the selling stockholders. The total net proceeds received from the IPO were
$6.76 billion
after deducting underwriting discounts and commissions of
$75 million
and other offering expenses of approximately
$7 million
.
Follow-on Offering
In December 2013, we completed a follow-on offering in which we issued and sold
27,004,761
shares of Class A common stock at a public offering price of
$55.05
per share and the selling stockholders sold
42,995,239
shares of Class A common stock. We did not receive any proceeds from the sale of shares by the selling stockholders. The total net proceeds received from the follow-on offering were
$1.48 billion
after deducting underwriting discounts and commissions of
$7 million
and other offering expenses of approximately
$1 million
.
Common Stock
Our certificate of incorporation authorizes the issuance of Class A common stock and Class B common stock. As of
December 31, 2013
, we are authorized to issue
5,000,000,000
shares of Class A common stock and
4,141,000,000
shares of Class B common stock, each with a par value of
$0.000006
per share. Holders of our Class A common stock and Class B common stock are entitled to dividends when, as and if, declared by our board of directors, subject to the rights of the holders of all classes of stock outstanding having priority rights to dividends. As of
December 31, 2013
, we did not declare any dividends and our credit facility contains restrictions on our ability to pay dividends. The holder of each share of Class A common stock is entitled to
one
vote, while the holder of each share of Class B common stock is entitled to
ten
votes. Shares of our Class B common stock are convertible into an equivalent number of shares of our Class A common stock and generally convert into shares of our Class A common stock upon transfer. Class A common stock and Class B common stock are referred to as common stock throughout the notes to these financial statements, unless otherwise noted.
As of
December 31, 2013
, there were
1,969,996,533
shares and
576,587,559
shares of Class A common stock and Class B common stock, respectively, issued and outstanding.
Share-based Compensation Plans
We maintain
three
share-based employee compensation plans: the 2012 Plan, the 2005 Stock Plan and the 2005 Officers' Stock Plan (collectively, Stock Plans). Our 2012 Plan serves as the successor to our 2005 Stock Plan and provides for the issuance of incentive and nonstatutory stock options, restricted stock awards, stock appreciation rights, RSUs, performance shares and stock bonuses to qualified employees, directors and consultants. Outstanding awards under the 2005 Stock Plan continue to be subject to the terms and conditions of the 2005 Stock Plan.
We have initially reserved
25,000,000
shares of our Class A common stock for issuance under our 2012 Plan. The number of shares reserved for issuance under our 2012 Plan will increase automatically on the first day of January of each of
2013
through
2022
by a number of shares of Class A common stock equal to the lesser of (i)
2.5%
of the total outstanding shares of our common stock as of the immediately preceding December 31st or (ii) a number of shares determined by the board of directors. Our board of directors elected not to increase the number of shares reserved for issuance in 2013. In addition, shares available for grant under the 2005 Stock Plan, which were reserved but not issued or subject to outstanding awards under the 2005 Stock Plan as of the effective date of our IPO, were added to the reserves of the 2012 Plan and shares that are withheld in connection with the net settlement of RSUs are also
79
added to the reserves of the 2012 Plan. The maximum term for stock options granted under the 2012 Plan may not exceed
ten years
from the date of grant. Our 2012 Plan will terminate
ten years
from the date of approval unless it is terminated earlier by our compensation committee.
The 2005 Officers' Stock Plan provides for up to
120,000,000
shares of incentive and nonstatutory stock options to certain of our employees or officers. The 2005 Officers' Stock Plan will terminate
ten years
after its adoption unless terminated earlier by our compensation committee. Stock options become vested and exercisable at such times and under such conditions as determined by our compensation committee on the date of grant. In November 2005, we issued a nonstatutory stock option to our CEO to purchase
120,000,000
shares of our Class B common stock under the 2005 Officers' Stock Plan. As of
December 31, 2013
, this option was fully exercised and
no
options were available for future issuance under the 2005 Officers' Stock Plan. We will not grant any additional awards under the 2005 Officers' Stock Plan in the future.
The following table summarizes the stock option and RSU award activities under the Stock Plans for the year ended
December 31, 2013
:
|
|
Shares Subject to Options Outstanding
|
|||||||||||
|
|
Number of
Shares
|
Weighted
Average
Exercise
Price
|
Weighted
Average
Remaining
Contractual
Term
|
Aggregate
Intrinsic
Value
(
1)
|
||||||||
|
|
(in thousands)
|
|
(in years)
|
(in millions)
|
||||||||
|
Balance as of December 31, 2012
|
122,821
|
|
$
|
0.85
|
|
3.79
|
$
|
3,166
|
|
|||
|
Stock options exercised
|
(100,504
|
)
|
0.26
|
|
||||||||
|
Stock options forfeited/cancelled
|
(215
|
)
|
1.85
|
|
||||||||
|
Balance as of December 31, 2013
|
22,102
|
|
$
|
3.56
|
|
4.66
|
$
|
1,129
|
|
|||
|
Stock options vested and expected to vest as of December 31, 2013
|
22,080
|
|
$
|
3.55
|
|
4.66
|
$
|
1,128
|
|
|||
|
Stock options exercisable as of December 31, 2013
|
17,007
|
|
$
|
1.64
|
|
4.12
|
$
|
902
|
|
|||
|
(1)
|
The aggregate intrinsic value is calculated as the difference between the exercise price of the underlying stock option awards and the closing price of our Class A common stock of
$54.65
on
December 31, 2013
.
|
80
There were
no
options granted for the years ended
December 31, 2013
,
2012
, and
2011
. The aggregate intrinsic value of the options exercised in the years ended
December 31, 2013
,
2012
, and
2011
was
$4.58 billion
,
$4.23 billion
and
$2.38 billion
, respectively. The total grant date fair value of stock options vested during the years ended
December 31, 2013
,
2012
, and
2011
was
$7 million
,
$5 million
and
$6 million
, respectively.
The following table summarizes additional information regarding outstanding and exercisable options under the Stock Plans at
December 31, 2013
:
|
|
Options Outstanding
|
Options Exercisable
|
|||||||||||||
|
Exercise
Price (Range)
|
Number of
Shares
|
Weighted
Average
Remaining
Contractual
Term
|
Weighted
Average
Exercise
Price
|
Number of
Shares
|
Weighted
Average
Exercise
Price
|
||||||||||
|
|
(in thousands)
|
(in years)
|
|
(in thousands)
|
|
||||||||||
|
$0.00 - 0.04
|
5
|
1.72
|
$
|
0.04
|
|
5
|
|
$
|
0.04
|
|
|||||
|
0.06
|
762
|
1.99
|
0.06
|
|
762
|
|
0.06
|
|
|||||||
|
0.10 - 0.18
|
2,527
|
2.48
|
0.11
|
|
2,527
|
|
0.11
|
|
|||||||
|
0.29 - 0.33
|
6,232
|
3.24
|
0.31
|
|
6,232
|
|
0.31
|
|
|||||||
|
1.85
|
2,140
|
5.03
|
1.85
|
|
2,140
|
|
1.85
|
|
|||||||
|
2.95
|
1,360
|
5.63
|
2.95
|
|
1,014
|
|
2.95
|
|
|||||||
|
3.23
|
4,376
|
5.82
|
3.23
|
|
3,701
|
|
3.23
|
|
|||||||
|
10.39
|
3,500
|
6.56
|
10.39
|
|
583
|
|
10.39
|
|
|||||||
|
15.00
|
1,200
|
6.80
|
15.00
|
|
43
|
|
15.00
|
|
|||||||
|
|
22,102
|
4.66
|
$
|
3.56
|
|
17,007
|
|
$
|
1.64
|
|
|||||
The following table summarizes the activities for our unvested RSUs for the year ended
December 31, 2013
:
|
Unvested RSUs
|
||||||
|
Number of Shares
|
Weighted Average Grant Date Fair Value
|
|||||
|
(in thousands)
|
||||||
|
Unvested at December 31, 2012
|
113,044
|
|
$
|
21.38
|
|
|
|
Granted
|
53,344
|
|
29.98
|
|
||
|
Vested
|
(47,550
|
)
|
16.96
|
|
||
|
Forfeited
|
(14,867
|
)
|
25.31
|
|
||
|
Unvested at December 31, 2013
|
103,971
|
|
$
|
27.30
|
|
|
The fair value as of the respective vesting dates of RSUs during the years ended
December 31, 2013
,
2012
, and
2011
was
$1.55 billion
,
$1.99 billion
, and
$2.17 billion
, respectively, including the Pre-2011 RSUs earned but subject to a liquidity condition which was satisfied six months after our IPO.
The majority of our RSUs that were settled during the years ended
December 31, 2013
and
2012
were net share settled. No RSUs were settled in the year ended
December 31, 2011
. Under net settlement procedures applicable to our outstanding RSUs prior to December 31, 2013, upon each settlement date, RSUs were withheld to cover the required withholding tax, which is based on the value of the RSU on the settlement date as determined by the closing price of our common stock on the trading day immediately preceding the applicable settlement date. The remaining amounts are delivered to the recipient as shares of our common stock. In 2013 and 2012, we settled
65 million
and
279 million
of RSUs, respectively, of which
64 million
and
273 million
RSUs were net settled, respectively, by withholding
27 million
and
123 million
shares, respectively, which represented the employees' minimum statutory obligation for each such employee's applicable income and other employment taxes and remitted cash of
$889 million
and
$2.86 billion
, respectively, to the appropriate tax authorities. The amount remitted to the tax authorities for the employees' tax obligation to the tax authorities was reflected as a financing activity within our consolidated statements of cash flows. These shares withheld by us as a result of the net settlement of RSUs are no longer considered issued and outstanding, thereby reducing our shares outstanding used to calculate earnings per share. These shares were returned to the reserves and are available for future issuance under the 2012 Plan.
81
As of
December 31, 2013
, there was
$2.69 billion
of unrecognized share-based compensation expense, of which
$2.4 billion
is related to RSUs, and
$286 million
is related to restricted shares and stock options. This unrecognized compensation expense is expected to be recognized over a weighted-average period of approximately
three years
.
|
Note 12.
|
Other income (expense), net
|
The following table presents the detail of other income (expense), net, for the periods presented (in millions):
|
Year Ended December 31,
|
|||||||||||
|
2013
|
2012
|
2011
|
|||||||||
|
Interest income
|
$
|
19
|
|
$
|
14
|
|
$
|
4
|
|
||
|
Foreign currency exchange losses, net
|
(14
|
)
|
(9
|
)
|
(29
|
)
|
|||||
|
Other
|
1
|
|
2
|
|
6
|
|
|||||
|
Other income (expense), net
|
$
|
6
|
|
$
|
7
|
|
$
|
(19
|
)
|
||
|
Note 13.
|
Income Taxes
|
The components of income before provision for income taxes for the years ended
December 31, 2013
,
2012
, and
2011
are as follows (in millions):
|
|
Year Ended December 31,
|
||||||||||
|
|
2013
|
2012
|
2011
|
||||||||
|
Domestic
|
$
|
3,197
|
|
$
|
1,062
|
|
$
|
1,819
|
|
||
|
Foreign
|
(443
|
)
|
(568
|
)
|
(124
|
)
|
|||||
|
Income before provision for income taxes
|
$
|
2,754
|
|
$
|
494
|
|
$
|
1,695
|
|
||
The provision for income taxes consisted of the following (in millions):
|
|
Year Ended December 31,
|
||||||||||
|
|
2013
|
2012
|
2011
|
||||||||
|
Current:
|
|
|
|
||||||||
|
Federal
|
$
|
1,154
|
|
$
|
559
|
|
$
|
664
|
|
||
|
State
|
69
|
|
45
|
|
60
|
|
|||||
|
Foreign
|
68
|
|
22
|
|
8
|
|
|||||
|
Total current tax expense
|
1,291
|
|
626
|
|
732
|
|
|||||
|
Deferred:
|
|
|
|
||||||||
|
Federal
|
(28
|
)
|
(172
|
)
|
(34
|
)
|
|||||
|
State
|
(7
|
)
|
(6
|
)
|
(3
|
)
|
|||||
|
Foreign
|
(2
|
)
|
(7
|
)
|
—
|
|
|||||
|
Total deferred tax benefit
|
(37
|
)
|
(185
|
)
|
(37
|
)
|
|||||
|
Provision for income taxes
|
$
|
1,254
|
|
$
|
441
|
|
$
|
695
|
|
||
82
A reconciliation of the U.S. federal statutory income tax rate of
35.0%
to our effective tax rate is as follows (in percentages):
|
|
Year Ended December 31,
|
|||||||
|
|
2013
|
2012
|
2011
|
|||||
|
U.S. federal statutory income tax rate
|
35.0
|
%
|
35.0
|
%
|
35.0
|
%
|
||
|
State income taxes, net of federal benefit
|
1.6
|
|
6.2
|
|
2.2
|
|
||
|
Research tax credits
|
(4.7
|
)
|
—
|
|
(1.0
|
)
|
||
|
Share-based compensation
|
5.2
|
|
19.2
|
|
1.5
|
|
||
|
Effect of non-U.S. operations
|
6.8
|
|
26.9
|
|
3.3
|
|
||
|
Other
|
1.6
|
|
2.0
|
|
—
|
|
||
|
Effective tax rate
|
45.5
|
%
|
89.3
|
%
|
41.0
|
%
|
||
Excess tax benefits associated with stock option exercises and other equity awards are credited to stockholders' equity. The income tax benefits resulting from stock awards that were credited to stockholders' equity were
$602 million
,
$1.03 billion
and
$433 million
for the years ended
December 31, 2013
,
2012
, and
2011
.
Our deferred tax assets (liabilities) are as follows (in millions):
|
|
December 31,
|
||||||
|
|
2013
|
2012
|
|||||
|
Deferred tax assets:
|
|
|
|||||
|
Net operating loss carryforward
|
$
|
6
|
|
$
|
10
|
|
|
|
Tax credit carryforward
|
164
|
|
37
|
|
|||
|
Share-based compensation
|
120
|
|
233
|
|
|||
|
Accrued expenses and other liabilities
|
141
|
|
83
|
|
|||
|
Other
|
5
|
|
16
|
|
|||
|
Total deferred tax assets
|
436
|
|
379
|
|
|||
|
Less: valuation allowance
|
(82
|
)
|
(37
|
)
|
|||
|
Deferred tax assets, net of valuation allowance
|
354
|
|
342
|
|
|||
|
Deferred tax liabilities:
|
|
|
|||||
|
Depreciation and amortization
|
(68
|
)
|
(97
|
)
|
|||
|
Purchased intangible assets
|
(90
|
)
|
(92
|
)
|
|||
|
Deferred foreign taxes
|
(43
|
)
|
(15
|
)
|
|||
|
Total deferred tax liabilities
|
(201
|
)
|
(204
|
)
|
|||
|
Net deferred tax assets
|
$
|
153
|
|
$
|
138
|
|
|
The valuation allowance was approximately
$82 million
and
$37 million
as of
December 31, 2013
and
2012
, respectively, related to state tax credits that we do not believe will ultimately be realized.
As of
December 31, 2013
, the U.S. federal and state net operating loss carryforwards were approximately
$7.88 billion
and
$9.24 billion
, which will begin to expire in
2027
and
2021
, respectively, if not utilized. If realized, the impact of the net operating loss carryforwards will be recognized as a benefit of approximately
$2.89 billion
through additional paid in capital. We have federal and state tax credit carryforwards of
$637 million
and
$651 million
, respectively, which will expire beginning in
2032
.
Utilization of our net operating loss and tax credit carryforwards may be subject to substantial annual limitations due to the ownership change limitations provided by the Internal Revenue Code and similar state provisions. Such annual limitations could result in the expiration of the net operating loss and tax credit carryforwards before their utilization. The events that may cause ownership changes include, but are not limited to, a cumulative stock ownership change of greater than
50%
over a
three
-year period.
Our net foreign pretax losses include jurisdictions with both pretax earnings and pretax losses. Our consolidated financial statements provide taxes for all related tax liabilities that would arise upon repatriation of earnings in the foreign jurisdictions where we do not intend to indefinitely reinvest those earnings outside the United States, and the amount of taxes provided for has been insignificant.
83
The following table reflects changes in the gross unrecognized tax benefits (in millions):
|
|
Year Ended December 31,
|
||||||||||
|
|
2013
|
2012
|
2011
|
||||||||
|
Gross unrecognized tax benefits-beginning of period
|
$
|
164
|
|
$
|
63
|
|
$
|
18
|
|
||
|
Increases related to prior year tax positions
|
425
|
|
13
|
|
5
|
|
|||||
|
Decreases related to prior year tax positions
|
(13
|
)
|
(16
|
)
|
(2
|
)
|
|||||
|
Increases related to current year tax positions
|
740
|
|
104
|
|
42
|
|
|||||
|
Gross unrecognized tax benefits-end of period
|
$
|
1,316
|
|
$
|
164
|
|
$
|
63
|
|
||
During all years presented, we recognized interest and penalties related to unrecognized tax benefits within the provision for income taxes on the consolidated statements of income. For the year ended
December 31, 2013
, we recognized interest of
$2 million
and a reversal for penalties of
$2 million
. The amount of interest and penalties accrued as of
December 31, 2013
,
2012
, and
2011
was
$10 million
,
$10 million
, and
$6 million
, respectively.
If the remaining balance of gross unrecognized tax benefits of
$1.32 billion
as of
December 31, 2013
was realized in a future period, this would result in a tax benefit of
$842 million
within our provision of income taxes at such time.
We are subject to taxation in the United States and various other state and foreign jurisdictions. The material jurisdictions in which we are subject to potential examination include the United States and Ireland. We are under examination by the Internal Revenue Service (IRS) for our 2008 through 2010 tax years. We believe that adequate amounts have been reserved for any adjustments that may ultimately result from these examinations and we do not anticipate a significant impact to our gross unrecognized tax benefits within the next 12 months related to these years. Our 2011 through 2013 tax years remain subject to examination by the IRS and all tax years starting in 2008 remain subject to examination in Ireland.
Although the timing of the resolution, settlement, and closure of any audits is highly uncertain, it is reasonably possible that the balance of gross unrecognized tax benefits could significantly change in the next 12 months. However, given the number of years remaining that are subject to examination, we are unable to estimate the full range of possible adjustments to the balance of gross unrecognized tax benefits.
|
Note 14.
|
Geographical Information
|
Revenue by geography is based on the billing address of the advertiser or developer. The following table sets forth revenue and property and equipment, net by geographic area (in millions):
|
|
Year Ended December 31,
|
||||||||||
|
|
2013
|
2012
|
2011
|
||||||||
|
Revenue:
|
|
|
|
||||||||
|
United States
|
$
|
3,613
|
|
$
|
2,578
|
|
$
|
2,067
|
|
||
|
Rest of the world
(1)
|
4,259
|
|
2,511
|
|
1,644
|
|
|||||
|
Total revenue
|
$
|
7,872
|
|
$
|
5,089
|
|
$
|
3,711
|
|
||
|
(1)
|
No individual country, other than disclosed above, exceeded 10% of our total revenue for any period presented
|
|
|
December 31,
|
||||||
|
|
2013
|
2012
|
|||||
|
Property and equipment, net:
|
|
|
|||||
|
United States
|
$
|
2,368
|
|
$
|
2,110
|
|
|
|
Sweden
|
415
|
|
220
|
|
|||
|
Rest of the world
|
99
|
|
61
|
|
|||
|
Total property and equipment, net
|
$
|
2,882
|
|
$
|
2,391
|
|
|
84
|
Item 9.
|
Changes in and Disagreements with Accountants on Accounting and Financial Disclosure
|
None.
|
Item 9A.
|
Controls and Procedures
|
Evaluation of Disclosure Controls and Procedures
Our management, with the participation of our chief executive officer (CEO) and chief financial officer (CFO), has evaluated the effectiveness of our disclosure controls and procedures (as defined in Rules 13a- 15(e) and 15d- 15(e) under the Securities Exchange Act of 1934, as amended (Exchange Act)), as of the end of the period covered by this Annual Report on Form 10-K. Based on such evaluation, our CEO and CFO have concluded that as of December 31, 2013, our disclosure controls and procedures are designed at a reasonable assurance level and are effective to provide reasonable assurance that information we are required to disclose in reports that we file or submit under the Exchange Act is recorded, processed, summarized, and reported within the time periods specified in the rules and forms of the Securities and Exchange Commission (SEC), and that such information is accumulated and communicated to our management, including our CEO and CFO, as appropriate, to allow timely decisions regarding required disclosure.
Management's Report on Internal Control over Financial Reporting
Our management is responsible for establishing and maintaining adequate internal control over financial reporting (as defined in Rule 13a-15(f) under the Exchange Act). Management conducted an assessment of the effectiveness of our internal control over financial reporting based on the criteria set forth in Internal Control - Integrated Framework issued by the Committee of Sponsoring Organizations of the Treadway Commission (1992 framework). Based on the assessment, management has concluded that its internal control over financial reporting was effective as of December 31, 2013 to provide reasonable assurance regarding the reliability of financial reporting and the preparation of financial statements in accordance with GAAP. Our independent registered public accounting firm, Ernst & Young LLP, has issued an audit report with respect to our internal control over financial reporting, which appears in Part II, Item 8 of this Annual Report on Form 10-K.
Changes in Internal Control
There were no changes in our internal control over financial reporting identified in management's evaluation pursuant to Rules 13a-15(d) or 15d-15(d) of the Exchange Act during the fourth quarter of 2013 that materially affected, or are reasonably likely to materially affect, our internal control over financial reporting.
Limitations on Effectiveness of Controls and Procedures and Internal Control over Financial Reporting
In designing and evaluating the disclosure controls and procedures and internal control over financial reporting, management recognizes that any controls and procedures, no matter how well designed and operated, can provide only reasonable assurance of achieving the desired control objectives. In addition, the design of disclosure controls and procedures and internal control over financial reporting must reflect the fact that there are resource constraints and that management is required to apply judgment in evaluating the benefits of possible controls and procedures relative to their costs.
|
Item 9B.
|
Other Information
|
None.
85
|
Item 10.
|
Directors, Executive Officers and Corporate Governance
|
The information required by this item is incorporated by reference to our Proxy Statement for the
2014
Annual Meeting of Stockholders to be filed with the Securities and Exchange Commission (SEC) within 120 days of the fiscal year ended
December 31, 2013
.
Our board of directors has adopted a Code of Conduct applicable to all officers, directors and employees, which is available on our website (investor.fb.com) under "Corporate Governance." We intend to satisfy the disclosure requirement under Item 5.05 of Form 8-K regarding amendment to, or waiver from, a provision of our Code of Conduct and by posting such information on our website at the address and location specified above.
|
Item 11.
|
Executive Compensation
|
The information required by this item is incorporated by reference to our Proxy Statement for the
2014
Annual Meeting of Stockholders to be filed with the SEC within 120 days of the fiscal year ended
December 31, 2013
.
|
Item 12.
|
Security Ownership of Certain Beneficial Owners and Management and Related Stockholder Matters
|
The information required by this item is incorporated by reference to our Proxy Statement for the
2014
Annual Meeting of Stockholders to be filed with the SEC within 120 days of the fiscal year ended
December 31, 2013
.
|
Item 13.
|
Certain Relationships and Related Transactions, and Director Independence
|
The information required by this item is incorporated by reference to our Proxy Statement for the
2014
Annual Meeting of Stockholders to be filed with the SEC within 120 days of the fiscal year ended
December 31, 2013
.
|
Item 14.
|
Principal Accounting Fees and Services
|
The information required by this item is incorporated by reference to our Proxy Statement for the
2014
Annual Meeting of Stockholders to be filed with the SEC within 120 days of the fiscal year ended
December 31, 2013
.
86
|
Item 15.
|
Exhibits, Financial Statement Schedules
|
We have filed the following documents as part of this Form 10-K:
1. Consolidated Financial Statements:
|
Page No.
|
|
2. Financial Statement Schedules
All schedules have been omitted because they are not required, not applicable, not present in amounts sufficient to require submission of the schedule, or the required information is otherwise included.
3. Exhibits
See the Exhibit Index immediately following the signature page of this Annual Report on Form 10-K.
87
SIGNATURES
Pursuant to the requirements of Section 13 or 15(d) of the Securities Exchange Act of 1934, the Registrant has duly caused this Annual Report on Form 10-K to be signed on its behalf by the undersigned, thereunto duly authorized, in the City of Menlo Park, State of California, on this
31st
day of
January 2014
.
|
FACEBOOK, INC.
|
||
|
Date:
|
January 31, 2014
|
/
S
/ M
ARK
Z
UCKERBERG
|
|
Mark Zuckerberg
|
||
|
Chairman and Chief Executive Officer
|
||
POWER OF ATTORNEY
KNOW ALL PERSONS BY THESE PRESENTS, that each person whose signature appears below constitutes and appoints David A. Ebersman and Colin S. Stretch, and each of them, as his or her true and lawful attorneys-in-fact and agents, with full power of substitution and resubstitution, for him or her and in his or her name, place and stead, in any and all capacities, to sign any and all amendments to this Annual Report on Form 10-K, and to file the same, with all exhibits thereto, and other documents in connection therewith, with the Securities and Exchange Commission, granting unto said attorneys-in-fact and agents, and each of them, full power and authority to do and perform each and every act and thing requisite and necessary to be done in connection therewith, as fully to all intents and purposes as he or she might or could do in person, hereby ratifying and confirming that all said attorneys-in-fact and agents, or any of them or their or his or her substitute or substitutes, may lawfully do or cause to be done by virtue hereof.
Pursuant to the requirements of the Securities Exchange Act of 1934, this Annual Report on Form 10-K has been signed by the following persons on behalf of the Registrant and in the capacities and on the dates indicated:
88
|
Signature
|
Title
|
Date
|
|||
|
/
S
/ M
ARK
Z
UCKERBERG
|
Chairman and Chief Executive Officer
(Principal Executive Officer)
|
January 31, 2014
|
|||
|
Mark Zuckerberg
|
|||||
|
/
S
/ D
AVID
A. E
BERSMAN
|
Chief Financial Officer
(Principal Financial Officer)
|
January 31, 2014
|
|||
|
David A. Ebersman
|
|||||
|
/
S
/ Jas Athwal
|
Chief Accounting Officer
(Principal Accounting Officer)
|
January 31, 2014
|
|||
|
Jas Athwal
|
|||||
|
/s/ Marc L. Andreessen
|
Director
|
January 31, 2014
|
|||
|
Marc L. Andreessen
|
|||||
|
/s/ Erskine B. Bowles
|
Director
|
January 31, 2014
|
|||
|
Erskine B. Bowles
|
|||||
|
/s/ Susan D. Desmond-Hellmann
|
Director
|
January 31, 2014
|
|||
|
Susan D. Desmond-Hellmann
|
|||||
|
/s/ Donald E. Graham
|
Director
|
January 31, 2014
|
|||
|
Donald E. Graham
|
|||||
|
/s/ Reed Hastings
|
Director
|
January 31, 2014
|
|||
|
Reed Hastings
|
|||||
|
/s/ Sheryl K. Sandberg
|
Director
|
January 31, 2014
|
|||
|
Sheryl K. Sandberg
|
|||||
|
/s/ Peter A. Thiel
|
Director
|
January 31, 2014
|
|||
|
Peter A. Thiel
|
|||||
89
EXHIBIT INDEX
|
Exhibit
|
|
Incorporated by Reference
|
Filed
Herewith
|
|||||||||
|
Number
|
Exhibit Description
|
Form
|
File No.
|
Exhibit
|
Filing Date
|
|||||||
|
3.1
|
Restated Certificate of Incorporation.
|
10-Q
|
001-35551
|
3.1
|
July 31, 2012
|
|||||||
|
3.2
|
Amended and Restated Bylaws.
|
10-Q
|
001-35551
|
3.2
|
July 31, 2012
|
|||||||
|
4.1
|
Form of Class A Common Stock Certificate.
|
S-1
|
333-179287
|
4.1
|
February 8, 2012
|
|||||||
|
4.2
|
Form of Class B Common Stock Certificate.
|
S-8
|
333-181566
|
4.4
|
May 21, 2012
|
|||||||
|
4.3
|
Sixth Amended and Restated Investors' Rights Agreement, dated December 27, 2010, by and among Registrant and certain security holders of Registrant.
|
S-1
|
333-179287
|
4.2
|
February 8, 2012
|
|||||||
|
4.4
|
Amendment No. 1 to Sixth Amended and Restated Investors' Rights Agreement, dated May 1, 2012, by and among Registrant and certain security holders of Registrant.
|
S-1
|
333-179287
|
4.2A
|
May 3, 2012
|
|||||||
|
4.5
|
Form of "Type 1" Holder Voting Agreement, between Registrant, Mark Zuckerberg, and certain parties thereto.
|
S-1
|
333-179287
|
4.3
|
February 8, 2012
|
|||||||
|
4.6
|
Form of "Type 3" Holder Voting Agreement, between Registrant, Mark Zuckerberg, and certain parties thereto.
|
S-1
|
333-179287
|
4.5
|
February 8, 2012
|
|||||||
|
10.1+
|
Form of Indemnification Agreement.
|
S-1
|
333-179287
|
10.1
|
February 8, 2012
|
|||||||
|
10.2(A)+
|
2005 Stock Plan, as amended.
|
10-K
|
001-35551
|
10.2(A)
|
February 1, 2013
|
|||||||
|
10.2(B)+
|
2005 Stock Plan forms of award agreements.
|
S-1
|
333-179287
|
10.2
|
February 8, 2012
|
|||||||
|
10.3(A)+
|
2012 Equity Incentive Plan, as amended.
|
10-K
|
001-35551
|
10.4(A)
|
February 1, 2013
|
|||||||
|
10.3(B)+
|
2012 Equity Incentive Plan forms of award agreements.
|
10-Q
|
001-35551
|
10.2
|
July 31, 2012
|
|||||||
|
10.4+
|
2013 Bonus/Retention Plan.
|
X
|
||||||||||
|
10.5+
|
Amended and Restated Offer Letter, dated January 27, 2012, between Registrant and Mark Zuckerberg.
|
S-1
|
333-179287
|
10.6
|
February 8, 2012
|
|||||||
|
10.6+
|
Amended and Restated Employment Agreement, dated January 27, 2012, between Registrant and Sheryl K. Sandberg.
|
S-1
|
333-179287
|
10.7
|
February 8, 2012
|
|||||||
|
10.7+
|
Amended and Restated Offer Letter, dated January 27, 2012, between Registrant and David A. Ebersman.
|
S-1
|
333-179287
|
10.8
|
February 8, 2012
|
|||||||
|
10.8+
|
Amended and Restated Offer Letter, dated January 27, 2012, between Registrant and Mike Schroepfer.
|
S-1
|
333-179287
|
10.9
|
February 8, 2012
|
|||||||
|
10.9+
|
Amended and Restated Employment Agreement, dated January 27, 2012, between Registrant and David Fischer.
|
10-Q
|
001-35551
|
10.10
|
May 2, 2013
|
|||||||
|
10.10†
|
Lease, dated February 7, 2011, between Registrant and Wilson Menlo Park Campus, LLC.
|
S-1
|
333-179287
|
10.11
|
February 8, 2012
|
|||||||
90
|
10.11
|
Credit Agreement, dated August 15, 2013, between Registrant, the Lenders party thereto, and JPMorgan Chase Bank, N.A., as Administrative Agent.
|
8-K
|
001-35551
|
10.1
|
August 15, 2013
|
|||||||
|
21.1
|
List of subsidiaries.
|
X
|
||||||||||
|
23.1
|
Consent of Ernst & Young LLP, Independent Registered Public Accounting Firm.
|
X
|
||||||||||
|
31.1
|
Certification of Mark Zuckerberg, Chief Executive Officer, pursuant to Rule 13a-14(a)/15d-14(a), as adopted pursuant to Section 302 of the Sarbanes-Oxley Act of 2002.
|
X
|
||||||||||
|
31.2
|
Certification of David A. Ebersman, Chief Financial Officer, pursuant to Rule 13a-14(a)/15d-14(a), as adopted pursuant to Section 302 of the Sarbanes-Oxley Act of 2002.
|
X
|
||||||||||
|
32.1#
|
Certification of Mark Zuckerberg, Chief Executive Officer, pursuant to 18 U.S.C. Section 1350, as adopted pursuant to Section 906 of the Sarbanes-Oxley Act of 2002.
|
X
|
||||||||||
|
32.2#
|
Certification of David A. Ebersman, Chief Financial Officer, pursuant to 18 U.S.C. Section 1350, as adopted pursuant to Section 906 of the Sarbanes-Oxley Act of 2002.
|
X
|
||||||||||
|
101.INS
|
XBRL Instance Document.
|
X
|
||||||||||
|
101.SCH
|
XBRL Taxonomy Extension Schema Document.
|
X
|
||||||||||
|
101.CAL
|
XBRL Taxonomy Extension Calculation Linkbase Document.
|
X
|
||||||||||
|
101.DEF
|
XBRL Taxonomy Extension Definition Linkbase Document.
|
X
|
||||||||||
|
101.LAB
|
XBRL Taxonomy Extension Labels Linkbase Document.
|
X
|
||||||||||
|
101.PRE
|
XBRL Taxonomy Extension Presentation Linkbase Document.
|
X
|
||||||||||
+ Indicates a management contract or compensatory plan.
† Portions of exhibit have been granted confidential treatment by the SEC.
# This certification is deemed not filed for purposes of section 18 of the Securities Exchange Act of 1934, as amended (Exchange Act), or otherwise subject to the liability of that section, nor shall it be deemed incorporated by reference into any filing under the Securities Act of 1933, as amended or the Exchange Act.
91
TABLE OF CONTENTS
Part IItem 1. BusinessItem 1A. Risk FactorsItem 1B. Unresolved Staff CommentsItem 2. PropertiesItem 3. Legal ProceedingsItem 4. Mine Safety DisclosuresPart IIItem 5. Market For Registrant's Common Equity, Related Stockholder Matters and Issuer Purchases Of Equity SecuritiesItem 6. Selected Financial DataItem 7. Management's Discussion and Analysis Of Financial Condition and Results Of OperationsItem 7A. Quantitative and Qualitative Disclosures About Market RiskItem 8. Financial Statements and Supplementary DataNote 1. Summary Of Significant Accounting PoliciesNote 2. AcquisitionsNote 3. Earnings Per ShareNote 4. Cash and Cash Equivalents, and Marketable SecuritiesNote 5. Fair Value MeasurementNote 6. Property and EquipmentNote 7. Goodwill and Intangible AssetsNote 8. LiabilitiesNote 9. Long-term DebtNote 10. Commitments and ContingenciesNote 11. Stockholders' EquityNote 12. Other Income (expense), NetNote 13. Income TaxesNote 14. Geographical InformationItem 9. Changes in and Disagreements with Accountants on Accounting and Financial DisclosureItem 9A. Controls and ProceduresItem 9B. Other InformationPart IIIItem 10. Directors, Executive Officers and Corporate GovernanceItem 11. Executive CompensationItem 12. Security Ownership Of Certain Beneficial Owners and Management and Related Stockholder MattersItem 13. Certain Relationships and Related Transactions, and Director IndependenceItem 14. Principal Accounting Fees and ServicesPart IVItem 15. Exhibits, Financial Statement Schedules