UNITED STATES SECURITIES AND EXCHANGE COMMISSION
Washington, D.C. 20549
FORM
20-F
(Mark One)
|
|
REGISTRATION STATEMENT PURSUANT TO SECTION 12(b) OR (g) OF THE SECURITIES EXCHANGE ACT OF 1934
|
OR
|
|
ANNUAL REPORT PURSUANT TO SECTION 13 OR 15(d) OF THE SECURITIES EXCHANGE ACT OF 1934
|
For the fiscal year ended
March 31
,
2021
OR
|
|
TRANSITION REPORT PURSUANT TO SECTION 13 OR 15(d) OF THE SECURITIES EXCHANGE ACT OF 1934
|
OR
|
|
SHELL COMPANY REPORT PURSUANT TO SECTION 13 OR 15(d) OF THE SECURITIES EXCHANGE ACT OF 1934
|
Date of event requiring this shell company report
For the transition period from to
Commission file number
001-33098
Kabushiki Kaisha Mizuho Financial Group
(Exact name of Registrant as specified in its charter)
(Translation of Registrant’s name into English)
(Jurisdiction of incorporation or organization)
(Address of principal executive offices)
+
81-3
-
5224-1111
,
+81-3-5224-1059,
(Name, Telephone, Facsimile number and Address of Company Contact Person)
Securities registered or to be registered pursuant to Section12(b) of the Act.
|
Title of each class
|
|
Trading Symbols
|
|
Name of each exchange on which registered
|
|
|
|
|
|
|
Securities registered or to be registered pursuant to Section12(g) of the Act.
None
(Title of Class)
Securities for which there is a reporting obligation pursuant to Section15(d) of the Act:
None
(Title of Class)
Indicate the number of outstanding shares of each of the issuer’s classes of capital or common stock as of the close of the period covered by the annual report.
At March 31, 2021, the following shares of capital stock were issued:
2,539,249,894
shares of common stock (including 552,914 shares of common stock held by the registrant as treasury stock).
Indicate by check mark if the registrant is a well-known seasoned issuer, as defined in Rule 405 of the Securities Act.
If this report is an annual or transition report, indicate by check mark if the registrant is not required to file reports pursuant to Section 13 or 15(d) of the Securities Exchange Act of 1934.
Yes ☐
No
☒
Note—Checking the box above will not relieve any registrant required to file reports pursuant to Section 13 or 15(d) of the Securities Exchange Act of 1934 from their obligations under those Sections.
Indicate by check mark whether the registrant (1) has filed all reports required to be filed by Section 13 or 15(d) of the Securities Exchange Act of 1934 during the preceding 12 months (or for such shorter period that the registrant was required to file such reports), and (2) has been subject to such filing requirements for the past 90 days.
Indicate by check mark whether the registrant has submitted electronically every Interactive Data File required to be submitted pursuant to Rule 405 of Regulation
S-T
(§232.405 of this chapter) during the preceding 12 months (or for such shorter period that the registrant was required to submit such files).
Indicate by check mark whether the registrant is a large accelerated filer, an accelerated filer, a
non-accelerated
filer, or an emerging growth company. See definition of “large accelerated filer, “accelerated filer,” and “emerging growth company” in Rule
12b-2
of the Exchange Act.
|
|
|
Accelerated filer ☐
|
|
Non-accelerated
filer ☐
|
|
Emerging growth company
|
If an emerging growth company that prepares its financial statements in accordance with U.S. GAAP, indicate by check mark if the registrant has elected not to use the extended transition period for complying with any new or revised financial accounting standards† provided pursuant to Section13(a) of the Exchange Act. ☐
|
†
|
The term “new or revised financial accounting standard” refers to any update issued by the Financial Accounting Standards Board to its Accounting Standards Codification after April 5, 2012.
|
Indicate by check mark whether the registrant has filed a report on and attestation to its management’s assessment of the effectiveness of its internal control over financial reporting under Section 404(b) of the Sarbanes-Oxley Act (15 U.S.C. 7262(b)) by the registered public accounting firm that prepared or issued its audit report.
☒
Indicate by check mark which basis of accounting the registrant has used to prepare the financial statements included in this filing:
|
☒
|
|
International Financial Reporting Standards as issued by the International Accounting Standards Board ☐
|
|
Other ☐
|
If “Other” has been checked in response to the previous question, indicate by check mark which financial statement item the registrant has elected to follow.
Item 17 ☐ Item 18 ☐
If this is an annual report, indicate by check mark whether the registrant is a shell company (as defined in Rule
12b-2
of the Exchange Act).
Yes ☐ No
☒
(APPLICABLE ONLY TO ISSUERS INVOLVED IN BANKRUPTCY PROCEEDINGS DURING THE PAST FIVE YEARS)
Indicate by check mark whether the registrant has filed all documents and reports required to be filed by Section 12, 13 or 15(d) of the Securities Exchange Act of 1934 subsequent to the distribution of securities under a plan confirmed by a court.
Yes ☐ No ☐
|
*
|
|
MIZUHO FINANCIAL GROUP, INC.
ANNUAL REPORT ON FORM
20-F
Table of Contents
1
|
Page
|
||||||||
|
ITEM 11.
|
Quantitative and Qualitative Disclosures about Credit, Market and Other Risk | 153 | ||||||
|
ITEM 12.
|
Description of Securities Other than Equity Securities | 171 | ||||||
| 12.A. | Debt Securities | 171 | ||||||
| 12.B. | Warrants and Rights | 171 | ||||||
| 12.C. | Other Securities | 171 | ||||||
| 12.D. | American Depositary Shares | 172 | ||||||
|
ITEM 13.
|
Defaults, Dividend Arrearages and Delinquencies | 173 | ||||||
|
ITEM 14.
|
Material Modifications to the Rights of Security Holders and Use of Proceeds | 173 | ||||||
|
ITEM 15.
|
Controls and Procedures | 173 | ||||||
|
ITEM 16A.
|
Audit Committee Financial Expert | 174 | ||||||
|
ITEM 16B.
|
Code of Ethics | 174 | ||||||
|
ITEM 16C.
|
Principal Accountant Fees and Services | 174 | ||||||
|
ITEM 16D.
|
Exemptions from the Listing Standards for Audit Committees | 175 | ||||||
|
ITEM 16E.
|
Purchase of Equity Securities by the Issuer and Affiliated Purchasers | 175 | ||||||
|
ITEM 16F.
|
Change in Registrant’s Certifying Accountant | 176 | ||||||
|
ITEM 16G.
|
Corporate Governance | 176 | ||||||
|
ITEM 16H.
|
Mine Safety Disclosure | 177 | ||||||
|
ITEM 17.
|
Financial Statements | 178 | ||||||
|
ITEM 18.
|
Financial Statements | 178 | ||||||
|
ITEM 19.
|
Exhibits | 178 | ||||||
| A-1 | ||||||||
| F-1 | ||||||||
2
PRESENTATION OF FINANCIAL AND OTHER INFORMATION
In this annual report, the terms “Mizuho Financial Group,” the “Mizuho group,” “we,” “us” and “our” generally refer to Mizuho Financial Group, Inc. and its consolidated subsidiaries, but from time to time as appropriate to the context, those terms refer to Mizuho Financial Group, Inc. as an individual legal entity. Furthermore, unless the context indicates otherwise, these references are intended to refer to us as if we had been in existence in our current form for all periods referred to herein.
On July 1, 2013, a merger between the former Mizuho Bank, Ltd. and the former Mizuho Corporate Bank, Ltd. came into effect with the former Mizuho Corporate Bank as the surviving entity, which was renamed Mizuho Bank upon the merger. In this annual report, “Mizuho Bank” refers to the post-merger entity, while the “former Mizuho Bank” and the “former Mizuho Corporate Bank” refer to
pre-merger
Mizuho Bank and
pre-merger
Mizuho Corporate Bank, respectively.
In this annual report, “our principal banking subsidiaries” refer to Mizuho Bank and Mizuho Trust & Banking Co., Ltd.
In this annual report, references to “U.S. dollars,” “dollars” and “$” refer to the lawful currency of the United States and those to “yen” and “¥” refer to the lawful currency of Japan.
In this annual report, yen figures and percentages have been rounded to the figures shown. However, in some cases, figures presented in tables have been adjusted to match the sum of the figures with the total amount, and such figures may also be referred to in the related text. In addition, yen figures and percentages in “Item 3.A. Key Information—Selected Financial Data—Japanese GAAP Selected Consolidated Financial Information” and others that are specified have been truncated to the figures shown.
Our fiscal year end is March 31. References to years not specified as being fiscal years are to calendar years.
Unless otherwise specified, for purposes of this annual report, we have presented our financial information in accordance with accounting principles generally accepted in the United States, or U.S. GAAP. Unless otherwise stated or the context otherwise requires, all amounts in our financial statements are expressed in yen.
We usually hold the ordinary general meeting of shareholders of Mizuho Financial Group in June of each year in
Chiyoda-ku,
Tokyo.
FORWARD-LOOKING STATEMENTS
We may from time to time make written or oral forward-looking statements. Written forward-looking statements may appear in documents filed with the Securities and Exchange Commission, including this annual report, and other reports to shareholders and other communications.
The U.S. Private Securities Litigation Reform Act of 1995 provides a “safe harbor” for forward-looking information to encourage companies to provide prospective information about themselves. We rely on this safe harbor in making these forward-looking statements.
This annual report contains forward-looking statements regarding the intent, belief, current expectations and targets of our management with respect to our financial condition and future results of operations. In many cases, but not all, we use such words as “aim,” “anticipate,” “believe,” “endeavor,” “estimate,” “expect,” “intend,” “may,” “plan,” “probability,” “project,” “risk,” “seek,” “should,” “strive,” “target” and similar expressions in relation to us or our management to identify forward-looking statements. You can also identify forward-looking statements by discussions of strategy, plans or intentions. These statements reflect our current views with respect
3
to future events and are subject to risks, uncertainties and assumptions. Should one or more of these risks or uncertainties materialize, or should underlying assumptions prove incorrect, our actual results may vary materially from those we currently anticipate. Potential risks and uncertainties include, without limitation, the following:
| • |
the development and impact of the novel coronavirus;
|
| • |
increase in allowance for credit losses on loans and incurrence of significant credit-related costs;
|
| • |
declines in the value of our securities portfolio, including as a result of the declines in stock markets and the impact of the dislocation in the global financial markets;
|
| • |
changes in interest rates;
|
| • |
foreign exchange rate fluctuations;
|
| • |
decrease in the market liquidity of our assets;
|
| • |
revised assumptions or other changes related to our pension plans;
|
| • |
a decline in our deferred tax assets;
|
| • |
the effect of financial transactions entered into for hedging and other similar purposes;
|
| • |
failure to maintain required capital adequacy ratio levels;
|
| • |
downgrades in our credit ratings;
|
| • |
our ability to avoid reputational harm;
|
| • |
our ability to implement our Five-Year Business Plan and other strategic initiatives and measures effectively;
|
| • |
the effectiveness of our operation, legal and other risk management policies;
|
| • |
the effect of changes in general economic conditions in Japan and elsewhere;
|
| • |
problems related to our information technology systems and cyber attacks;
|
| • |
amendments and other changes to the laws and regulations that are applicable to us; and
|
| • |
the effect of climate change.
|
Our forward-looking statements are not guarantees of future performance and involve risks and uncertainties. Actual results may differ from those in the forward-looking statements as a result of various factors. We identify in this annual report in “Item 3.D. Key Information—Risk Factors,” “Item 4.B. Information on the Company—Business Overview,” “Item 5. Operating and Financial Review and Prospects” and elsewhere, some, but not necessarily all, of the important factors that could cause these differences.
We do not intend to update our forward-looking statements. We are under no obligation, and disclaim any obligation, to update or alter our forward-looking statements, whether as a result of new information, future events or otherwise.
4
PART I
|
ITEM 1.
|
IDENTITY OF DIRECTORS, SENIOR MANAGEMENT AND ADVISERS
|
Not applicable.
|
ITEM 2.
|
OFFER STATISTICS AND EXPECTED TIMETABLE
|
Not applicable.
5
|
ITEM 3.
|
KEY INFORMATION
|
3.A. Selected Financial Data
The following tables set forth our selected consolidated financial data.
The first table below sets forth selected consolidated financial data of Mizuho Financial Group as of and for the fiscal years ended March 31, 2017, 2018, 2019, 2020 and 2021 derived from the audited consolidated financial statements of Mizuho Financial Group prepared in accordance with U.S. GAAP.
The second table below sets forth selected consolidated financial data of Mizuho Financial Group as of and for the fiscal years ended March 31, 2017, 2018, 2019, 2020 and 2021 derived from Mizuho Financial Group’s consolidated financial statements prepared in accordance with accounting principles generally accepted in Japan, or Japanese GAAP.
The consolidated financial statements of Mizuho Financial Group as of and for the fiscal years ended March 31, 2017, 2018, 2019, 2020 and 2021 prepared in accordance with U.S. GAAP have been audited in accordance with the standards of the Public Company Accounting Oversight Board (United States) by Ernst & Young ShinNihon LLC, an independent registered public accounting firm.
You should read the U.S. GAAP selected consolidated financial information presented below together with the information included in “Item 5. Operating and Financial Review and Prospects” and the audited consolidated financial statements, including the notes thereto, included in this annual report. The information presented below is qualified in its entirety by reference to that information.
6
U.S. GAAP Selected Consolidated Financial Information
|
As of and for the fiscal years ended March 31,
|
||||||||||||||||||||
|
2017
|
2018
|
2019
|
2020
|
2021
|
||||||||||||||||
|
(in millions of yen, except per share data, share number information and percentages)
|
||||||||||||||||||||
|
Statement of income data:
|
||||||||||||||||||||
|
Interest and dividend income
|
¥ | 1,509,030 | ¥ | 1,761,886 | ¥ | 2,207,443 | ¥ | 2,151,172 | ¥ | 1,456,556 | ||||||||||
|
Interest expense
|
601,712 | 889,936 | 1,313,476 | 1,271,381 | 467,939 | |||||||||||||||
|
|
|
|
|
|
|
|
|
|
|
|||||||||||
|
Net interest income
|
907,318 | 871,950 | 893,967 | 879,791 | 988,617 | |||||||||||||||
|
Provision (credit) for credit losses
|
37,668 | (126,362 | ) | 32,459 | 156,200 | 112,776 | ||||||||||||||
|
|
|
|
|
|
|
|
|
|
|
|||||||||||
|
Net interest income after provision (credit) for credit losses
|
869,650 | 998,312 | 861,508 | 723,591 | 875,841 | |||||||||||||||
|
Noninterest income
|
1,368,032 | 1,604,663 | 1,222,371 | 1,307,740 | 2,041,320 | |||||||||||||||
|
Noninterest expenses
|
1,757,307 | 1,763,677 | 1,998,819 | 1,877,841 | 1,888,397 | |||||||||||||||
|
|
|
|
|
|
|
|
|
|
|
|||||||||||
|
Income before income tax expense
|
480,375 | 839,298 | 85,060 | 153,490 | 1,028,764 | |||||||||||||||
|
Income tax expense
|
91,244 | 237,604 | 9,335 | 47,175 | 210,716 | |||||||||||||||
|
|
|
|
|
|
|
|
|
|
|
|||||||||||
|
Net income
|
389,131 | 601,694 | 75,725 | 106,315 | 818,048 | |||||||||||||||
|
Less: Net income (loss) attributable to noncontrolling interests
|
26,691 | 24,086 | (8,746 | ) | (43,880 | ) | 236,283 | |||||||||||||
|
|
|
|
|
|
|
|
|
|
|
|||||||||||
|
Net income attributable to MHFG shareholders
|
¥ | 362,440 | ¥ | 577,608 | ¥ | 84,471 | ¥ | 150,195 | ¥ | 581,765 | ||||||||||
|
|
|
|
|
|
|
|
|
|
|
|||||||||||
|
Net income attributable to common shareholders
|
¥ | 362,440 | ¥ | 577,608 | ¥ | 84,471 | ¥ | 150,195 | ¥ | 581,765 | ||||||||||
|
Amounts per share
(1)
:
|
||||||||||||||||||||
|
Basic earnings per common share—net income attributable to common shareholders
|
¥ | 143.34 | ¥ | 227.71 | ¥ | 33.31 | ¥ | 59.19 | ¥ | 229.27 | ||||||||||
|
Diluted earnings per common share—net income attributable to common shareholders
|
¥ | 142.80 | ¥ | 227.64 | ¥ | 33.30 | ¥ | 59.19 | ¥ | 229.26 | ||||||||||
|
Number of shares used to calculate basic earnings per common share (in thousands)
|
2,528,590 | 2,536,635 | 2,536,238 | 2,537,368 | 2,537,513 | |||||||||||||||
|
Number of shares used to calculate diluted earnings per common share (in thousands)
|
2,538,030 | 2,537,393 | 2,536,690 | 2,537,526 | 2,537,602 | |||||||||||||||
|
Cash dividends per share
(2)(3)
:
|
||||||||||||||||||||
|
Common stock
|
¥ | 75.00 | ¥ | 75.00 | ¥ | 75.00 | ¥ | 75.00 | ¥ | 75.00 | ||||||||||
| $ | 0.67 | $ | 0.71 | $ | 0.68 | $ | 0.70 | $ | 0.68 | |||||||||||
7
|
As of and for the fiscal years ended March 31,
|
||||||||||||||||||||
|
2017
|
2018
|
2019
|
2020
|
2021
|
||||||||||||||||
|
(in millions of yen, except per share data, share number information and percentages)
|
||||||||||||||||||||
|
Balance sheet data:
|
||||||||||||||||||||
|
Total assets
|
¥ | 200,456,304 | ¥ | 204,255,642 | ¥ | 197,611,195 | ¥ | 211,218,760 | ¥ | 221,651,474 | ||||||||||
|
Loans, net of allowance
|
81,804,233 | 83,204,742 | 82,492,742 | 87,087,233 | 87,930,018 | |||||||||||||||
|
Total liabilities
|
191,684,247 | 194,751,942 | 188,109,702 | 202,043,136 | 211,963,317 | |||||||||||||||
|
Deposits
|
131,184,953 | 136,884,006 | 138,296,916 | 144,948,667 | 151,010,604 | |||||||||||||||
|
Long-term debt
|
14,529,414 | 12,955,230 | 11,529,400 | 10,346,152 | 11,706,471 | |||||||||||||||
|
Common stock
|
5,826,149 | 5,826,383 | 5,829,657 | 5,827,500 | 5,826,863 | |||||||||||||||
|
Total MHFG shareholders’ equity
|
8,261,357 | 8,868,421 | 8,726,519 | 8,512,365 | 9,105,238 | |||||||||||||||
|
Other financial data:
|
||||||||||||||||||||
|
Return on equity and assets:
|
||||||||||||||||||||
|
Net income attributable to common shareholders as a percentage of total average assets
|
0.18 | % | 0.28 | % | 0.04 | % | 0.07 | % | 0.26 | % | ||||||||||
|
Net income attributable to common shareholders as a percentage of average MHFG shareholders’ equity
|
5.25 | % | 8.26 | % | 1.11 | % | 1.95 | % | 7.50 | % | ||||||||||
|
Dividends per common share as a percentage of basic earnings per common share
|
52.32 | % | 32.94 | % | 225.16 | % | 126.71 | % | 32.71 | % | ||||||||||
|
Average MHFG shareholders’ equity as a percentage of total average assets
|
3.38 | % | 3.35 | % | 3.71 | % | 3.81 | % | 3.43 | % | ||||||||||
|
Net interest income as a percentage of total average interest-earning assets
|
0.51 | % | 0.47 | % | 0.48 | % | 0.48 | % | 0.48 | % | ||||||||||
Notes:
| (1) |
Mizuho Financial Group adopted the share consolidation of the shares of common stock on the basis of one post-consolidation share per ten
pre-consolidation
shares effective as of October 1, 2020. For purposes of the amounts per share, we have assumed the effective date of the share consolidation to be April 1, 2016. For more information on the share consolidation, see “Item 10.B. Memorandum and Articles of Association—Common Stock—Share Consolidation.” In addition, certain other comparative amounts for the prior period have been reclassified in order to conform to the current period’s presentation.
|
| (2) |
Yen amounts are expressed in U.S. dollars at the rate of ¥111.41= $1.00, ¥106.20= $1.00, ¥110.68= $1.00, ¥107.53= $1.00 and ¥110.61= $1.00 for the fiscal years ended March 31, 2017, 2018, 2019, 2020 and 2021, respectively. These rates are the noon buying rates on the respective fiscal
year-end
dates in New York City for cable transfers in yen as certified for customs purposes by the Federal Reserve Bank of New York.
|
| (3) |
Figures represent cash dividends per share with respect to the applicable fiscal year. Dividends with respect to a fiscal year include
year-end
dividends and interim dividends. Declaration and payment of dividends are conducted during the immediately following fiscal year, in the case of
year-end
dividends, or immediately following interim period, in the case of interim dividends.
|
8
Japanese GAAP Selected Consolidated Financial Information
|
As of and for the fiscal years ended March 31,
|
||||||||||||||||||||
|
2017
|
2018
|
2019
|
2020
|
2021
|
||||||||||||||||
|
(in millions of yen, except per share data and percentages)
|
||||||||||||||||||||
|
Statement of income data:
|
||||||||||||||||||||
|
Interest income
|
¥ | 1,445,555 | ¥ | 1,622,354 | ¥ | 2,056,327 | ¥ | 2,014,440 | ¥ | 1,333,509 | ||||||||||
|
Interest expense
|
577,737 | 814,988 | 1,293,846 | 1,280,897 | 427,826 | |||||||||||||||
|
|
|
|
|
|
|
|
|
|
|
|||||||||||
|
Net interest income
|
867,818 | 807,366 | 762,480 | 733,542 | 905,683 | |||||||||||||||
|
Fiduciary income
|
50,627 | 55,400 | 55,153 | 58,565 | 55,160 | |||||||||||||||
|
Net fee and commission income
|
603,542 | 614,349 | 610,427 | 619,243 | 687,147 | |||||||||||||||
|
Net trading income
|
325,332 | 275,786 | 297,367 | 391,299 | 388,130 | |||||||||||||||
|
Net other operating income
|
245,419 | 162,454 | 87,306 | 259,567 | 162,571 | |||||||||||||||
|
General and administrative expenses
|
1,467,221 | 1,488,973 | 1,430,850 | 1,378,398 | 1,414,608 | |||||||||||||||
|
Other income
|
438,042 | 565,683 | 447,300 | 318,438 | 380,978 | |||||||||||||||
|
Other expenses
|
279,368 | 192,113 | 712,927 | 383,542 | 512,900 | |||||||||||||||
|
|
|
|
|
|
|
|
|
|
|
|||||||||||
|
Income before income taxes
|
784,193 | 799,953 | 116,259 | 618,717 | 652,163 | |||||||||||||||
|
Income taxes:
|
||||||||||||||||||||
|
Current
(1)
|
196,535 | 190,158 | 161,376 | 150,088 | 165,688 | |||||||||||||||
|
Deferred
|
(58,800 | ) | 1,469 | (163,879 | ) | 11,408 | 9,099 | |||||||||||||
|
Profit
|
646,457 | 608,326 | 118,762 | 457,221 | 477,375 | |||||||||||||||
|
Profit attributable to non- controlling interests
|
42,913 | 31,778 | 22,196 | 8,652 | 6,355 | |||||||||||||||
|
|
|
|
|
|
|
|
|
|
|
|||||||||||
|
Profit attributable to owners of parent
|
¥ | 603,544 | ¥ | 576,547 | ¥ | 96,566 | ¥ | 448,568 | ¥ | 471,020 | ||||||||||
|
|
|
|
|
|
|
|
|
|
|
|||||||||||
|
Net income per share
(2)
:
|
||||||||||||||||||||
|
Basic
|
¥ | 238.68 | ¥ | 227.28 | ¥ | 38.07 | ¥ | 176.87 | ¥ | 185.75 | ||||||||||
|
Diluted
|
237.80 | 227.22 | 38.06 | 176.86 | 185.75 | |||||||||||||||
|
Balance sheet data:
|
||||||||||||||||||||
|
Total assets
|
¥ | 200,508,610 | ¥ | 205,028,300 | ¥ | 200,792,226 | ¥ | 214,659,077 | ¥ | 225,586,211 | ||||||||||
|
Loans and bills discounted
(3)
|
78,337,793 | 79,421,473 | 78,456,935 | 83,468,185 | 83,704,675 | |||||||||||||||
|
Securities
|
32,353,158 | 34,183,033 | 29,774,489 | 34,907,234 | 43,697,262 | |||||||||||||||
|
Deposits
(4)
|
130,676,494 | 136,463,824 | 137,649,596 | 144,472,235 | 150,504,978 | |||||||||||||||
|
Net assets
|
9,273,361 | 9,821,246 | 9,194,038 | 8,663,847 | 9,362,207 | |||||||||||||||
|
Risk-adjusted capital data (Basel III)
(5)
:
|
||||||||||||||||||||
|
Common Equity Tier 1 capital
|
¥ | 7,001,664 | ¥ | 7,437,048 | ¥ | 7,390,058 | ¥ | 7,244,776 | ¥ | 7,849,969 | ||||||||||
|
Tier 1 capital
|
8,211,522 | 9,192,244 | 9,232,160 | 9,024,404 | 9,701,931 | |||||||||||||||
|
Total capital
|
10,050,953 | 10,860,440 | 10,917,507 | 10,722,278 | 11,385,395 | |||||||||||||||
|
Risk-weighted assets
|
61,717,158 | 59,528,983 | 57,899,567 | 62,141,217 | 67,481,983 | |||||||||||||||
|
Common Equity Tier 1 capital ratio
|
11.34 | % | 12.49 | % | 12.76 | % | 11.65 | % | 11.63 | % | ||||||||||
|
Tier 1 capital ratio
|
13.30 | 15.44 | 15.94 | 14.52 | 14.37 | |||||||||||||||
|
Total capital ratio
|
16.28 | 18.24 | 18.85 | 17.25 | 16.87 | |||||||||||||||
Notes:
| (1) |
Includes refund of income taxes.
|
9
| (2) |
Mizuho Financial Group adopted the share consolidation of the shares of common stock on the basis of one post-consolidation share per ten
pre-consolidation
shares effective as of October 1, 2020. For purposes of the net income per share, we have assumed the effective date of the share consolidation to be April 1, 2016. For more information on the share consolidation, see “Item 10.B. Memorandum and Articles of Association—Common Stock—Share Consolidation.”
|
| (3) |
Bills discounted refer to a form of financing in Japan under which promissory notes obtained by corporations through their regular business activities are purchased by banks prior to their payment dates at a discount based on prevailing interest rates.
|
| (4) |
Includes negotiable certificates of deposit.
|
| (5) |
Risk-adjusted capital data are calculated on a Basel III basis. We utilize the advanced internal ratings-based approach (the “AIRB approach”) for the calculation of risk-weighted assets associated with credit risk and the advanced measurement approach (the “AMA”) for the calculation of operational risk. For more details on capital adequacy requirements set by the Bank for International Settlements (“BIS”), and the guideline implemented by the Financial Services Agency in compliance thereto, see “Item 5. Operating and Financial Review and Prospects—Capital Adequacy.”
|
There are certain differences between U.S. GAAP and Japanese GAAP. The differences between U.S. GAAP and Japanese GAAP applicable to us primarily relate to the accounting for derivative financial instruments and hedging activities, investments, loans, allowances for loan losses and
off-balance-sheet
instruments, premises and equipment, land revaluation, business combinations, pension liabilities, consolidation of variable interest entities, deferred taxes and foreign currency translation. See “Item 5. Operating and Financial Review and Prospects—Reconciliation with Japanese GAAP.”
3.B. Capitalization and Indebtedness
Not applicable.
3.C. Reasons for the Offer and Use of Proceeds
Not applicable.
3.D. Risk Factors
Investing in our securities involves a high degree of risk. You should carefully consider the risks described below as well as the other information in this annual report, including our consolidated financial statements and related notes, “Item 5. Operating and Financial Review and Prospects,” “Item 11. Quantitative and Qualitative Disclosures about Credit, Market and Other Risk” and “Selected Statistical Data.”
Our business, financial condition and operating results could be materially adversely affected by any of the factors discussed below. The trading price of our securities could decline due to any of these factors. This annual report also contains forward-looking statements that involve risks and uncertainties. Our actual results could differ materially from those anticipated in these forward-looking statements as a result of various factors, including the risks faced by us described below and elsewhere in this annual report. See “Forward-Looking Statements.”
Risks Relating to Our Business
The recent outbreak of the novel coronavirus could have a significant negative impact on our business, results of operations and financial condition.
Due to a strain of a virus called
(severe acute respiratory syndrome coronavirus 2), or coronavirus, which causes coronavirus disease, or
SARS-CoV-2
COVID-19,
the global economy, including that of Japan, is
10
under severe pressure and many business fields have been widely and adversely affected. Financial and monetary easing measures taken by governments and central banks have been preventing severe liquidity crises in the global financial system to date, and financial markets have been gradually returning to stability. However, currently an increasing number of new variants of the coronavirus has led to surges of infections in some regions, with infections from some of these variants being observed in Japan, causing new rounds of restrictions on economic activities. While the some countries have been successful in administering vaccinations to the general public, other countries including Japan are experiencing delays in doing so. With the continued impact from the novel coronavirus, it is expected that it would take time for the global economy to recover. Moreover, high volatility in financial markets is expected to continue. As a result, we may incur significantly increased credit-related costs, increased valuation losses and impairment of our assets, and our liquidity could also decline. As a result of any of the foregoing, our business, financial condition and results of operations may be materially and adversely affected.
We may be required to increase allowance for credit losses on loans and/or incur significant credit-related and other costs in the future due to problem loans.
We are the primary bank lender for a large number of our corporate customers, and the amount of our loans and other claims to each of our major customers is significant. In addition, while we have made efforts to diversify our credit exposure along industry lines, the proportion of credit exposure to customers in the manufacturing and real estate industries as well as banks and other financial institutions is relatively high. We manage our credit portfolio by regularly monitoring the credit profile of each of our customers, the progress made on restructuring plans and credit exposure concentrations in particular industries or corporate groups that are expected to be affected when risk events occur, and we also utilize credit derivatives for hedging and credit risk mitigation purposes. We also periodically assess the value of the relevant collateral or guarantee. However, depending on the status of domestic and global credit cycles, the business environment in particular industries, prices of real estate assets and other factors, the amount of our problem loans and other claims could increase significantly, including as a result of the deterioration in the credit profile of customers for which we are the primary bank lender, other major customers or customers belonging to industries to which we have significant credit exposure, and the value of collateral and guarantees could decline. There can be no assurance that credit-related and other costs will not increase in the future as a result of the foregoing or otherwise.
Our equity investment portfolio exposes us to market risks that could adversely affect our financial condition and results of operations.
We hold substantial investments in marketable equity securities, mainly common stock of Japanese listed companies. We have established the “Policy Regarding Cross-holding of Shares of Other Listed Companies” and, in light of the potential material adverse impact on our financial position associated with stock market volatility risk, we have decided to hold the shares of other companies as cross-shareholdings only when these holdings are meaningful, and we have accordingly sold a portion of such investments. In addition, in order to lower the risk of stock market volatility, we have been applying partial hedges as we deem necessary. However, significant declines in Japanese stock prices in the future would lead to unrealized losses, losses on impairment and losses from sales of equity securities. In addition, net unrealized gains and losses on such investments, based on Japanese GAAP, are taken into account when calculating the amount of capital for purposes of the calculation of our capital adequacy ratios, and as a result, a decline in the value of such investments would negatively affect such ratios. Accordingly, our financial condition and results of operations could be materially and adversely affected.
Changes in interest rates could adversely affect our financial condition and results of operations.
We hold a significant amount of bonds, consisting mostly of Japanese government bonds, and other instruments primarily for the purpose of investment. As a result of such holdings, an increase in interest rates, primarily yen interest rates, could lead to unrealized losses of bonds or losses from sales of bonds. In addition,
11
due mainly to differences in maturities between financial assets and liabilities, changes in interest rates could have an adverse effect on our average interest rate spread. We manage interest rate risk under our risk management policies, which provide for adjustments in the composition of our bond portfolio and the utilization of derivatives and other hedging methods to reduce our exposure to interest rate risk. However, in the event of significant changes in interest rates, including as a result of a change in Japanese monetary policy, increased sovereign risk due to deterioration of public finances and market trends, our financial condition and results of operations could be materially and adversely affected.
Our financial condition and results of operations could be adversely affected by foreign exchange rate fluctuations.
A portion of our assets and liabilities is denominated in foreign currencies, mainly the U.S. dollar. The difference between the amount of assets and liabilities denominated in foreign currencies leads to foreign currency translation gains and losses in the event of fluctuations in foreign exchange rates. Although we hedge a portion of our exposure to foreign exchange rate fluctuation risk, our financial condition and results of operations could be materially and adversely affected if future foreign exchange rate fluctuations significantly exceed our expectations.
We may incur further losses relating to decreases in the market liquidity of assets that we hold.
The market liquidity of the various marketable assets that we hold may decrease significantly due to turmoil in financial markets and other factors, and the value of such assets could decline as a result. If factors such as turmoil in global financial markets or the deterioration of economic or financial conditions cause the market liquidity of our assets to decrease significantly, our financial condition and results of operations could be materially and adversely affected.
Our pension-related costs could increase as a result of revised assumptions or changes in our pension plans.
Our pension-related costs and projected benefit obligations are calculated based on assumptions regarding projected returns on pension plan assets and various actuarial assumptions relating to the plans. If actual results differ from our assumptions or we revise our assumptions in the future, due to changes in the stock markets, interest rate environment or otherwise, our pension-related costs and projected benefit obligations could increase. In addition, any future changes to our pension plans could also lead to increases in our pension-related costs and projected benefit obligations. As a result, our financial condition and results of operations could be materially and adversely affected.
A decrease in deferred tax assets, net of valuation allowance, due to a change in our estimation of future taxable income or change in Japanese tax policy could adversely affect our financial condition and results of operations.
We recorded deferred tax assets, net of valuation allowance, based on a reasonable estimation of future taxable income in accordance with applicable accounting standards. Our financial condition and results of operations could be materially and adversely affected if our deferred tax assets decrease due to a change in our estimation of future taxable income, a change in tax rate as a result of tax system revisions or other factors. Because we consider the sale of
securities and equity securities to be a qualifying
available-for-sale
tax-planning
strategy, turmoil in financial markets such as significant declines in stock prices could lead to a decrease in our estimated future taxable income.
Financial transactions entered into for hedging and other similar purposes could adversely affect our financial condition and results of operations.
The accounting and valuation methods applied to credit and equity derivatives and other financial transactions that we enter into for hedging and credit risk mitigation purposes are not always consistent with the
12
accounting and valuation methods applied to the assets that are being hedged. Consequently, in some cases, due to changes in the market or otherwise, losses related to such financial transactions during a given period may adversely affect net income, while the corresponding increases in the value of the hedged assets do not have an effect on net income for such period. As a result, our financial condition and results of operations could be materially and adversely affected during the period.
Impairment of the carrying value of our long-lived assets could materially and adversely affect our financial condition and results of operations.
We periodically review our long-lived assets that are held for use for events or changes in circumstances that indicate possible impairment. Our impairment review is based on an undiscounted cash flow analysis of a group of assets, combined with associated liabilities, at the lowest level for which identifiable cash flows exist. Impairment occurs when the carrying value of the asset group exceeds the future undiscounted cash flows that the asset group is expected to generate. When impairment is identified, the future cash flows are then discounted to determine the estimated fair value of the asset group and an impairment charge is recorded for the difference between the carrying value and the estimated fair value of the asset group. We cannot accurately predict the amount and timing of any impairment of long-lived assets. Should these assets not generate sufficient cash flows to justify their carrying value and we recognize impairment losses thereon, there could be a material adverse effect on our financial condition and results of operations.
Our business will be adversely affected if we encounter difficulties in raising funds.
We rely principally on deposits and bonds as our funding sources. In addition, we also raise funds in the financial markets. In particular, our foreign currency funding structure relies more on capital markets compared to our
yen-based
funding. Our efforts to maintain stable funding, such as setting maximum limits on financial market funding and monitoring our liquidity position to apply appropriate funding policies, may not be sufficient to prevent significant increases in our funding costs or, in the case mainly of foreign currencies, cash flow problems if we encounter difficulties in attracting deposits or otherwise raising funds. Such difficulties could result, among other things, from any of the following:
| • |
a reduction in the size and liquidity of the debt markets due for example to the decline in the domestic and global economy, concerns regarding the financial system or turmoil in financial markets and other factors;
|
| • |
adverse developments with respect to our financial condition and results of operations; or
|
| • |
downgrading of our credit ratings or damage to our reputation.
|
As a result, our business, financial condition and results of operations could be materially and adversely affected.
Downgrades in our credit ratings could have negative effects on our funding costs and business operations.
Credit ratings are assigned to Mizuho Financial Group, our banking subsidiaries and a number of our other subsidiaries by major domestic and international credit rating agencies. The credit ratings are based on information furnished by us or obtained by the credit rating agencies from independent sources and are also influenced by credit ratings of Japanese government bonds and general views regarding the Japanese financial system as a whole. The credit ratings are subject to revision, suspension or withdrawal by the credit rating agencies at any time. A downgrade in our credit ratings could result in, among other things, the following:
| • |
increased funding costs and other difficulties in raising funds;
|
| • |
the need to provide additional collateral in connection with financial market transactions; and
|
| • |
the termination or cancellation of existing agreements.
|
13
As a result, our business, financial condition and results of operations could be materially and adversely affected.
For example, assuming a downgrade occurred on March 31, 2021, the additional collateral requirement in connection with our derivative contracts if other conditions remain unchanged, would have been approximately ¥5.9 billion for a
one-notch
downgrade and approximately ¥13.8 billion for a
two-notch
downgrade.
Failure to maintain capital adequacy ratios and other regulatory standards above minimum required levels could have material adverse effects.
Capital adequacy regulations
We are subject to capital adequacy regulations as prescribed by the Financial Services Agency based on the Basel III rules text issued by the Basel Committee on Banking Supervision, both on a consolidated basis and with respect to each of our principal banking subsidiaries. The capital adequacy ratio rules was initially scheduled to be applied in stages over several years from January 1, 2022, with full application scheduled to commence in January 1, 2027 under the finalized Basel III reforms published by the Basel Committee on Banking Supervision in December 2017. However, in March 2020, the Basel Committee’s oversight body, the Group of Central Bank Governors and Heads of Supervision (“GHOS”), announced a deferral of the implementation date of the finalized Basel III reform by one year to increase operational capacity of banks and supervisors to respond to
COVID-19.
Following this announcement, the Financial Services Agency announced that the finalized Basel III reform is scheduled to be implemented in Japan from March 2023. In addition, the Financial Services Agency published its draft regulatory policy directions for the implementation of the Basel III finalization framework in Japan on December 24, 2020 and the draft amendments to the regulatory notices regarding operational risk under the Basel III finalization framework on March 31, 2021. Furthermore, we have been named by the Financial Stability Board as a “global systemically important bank”
(G-SIB),
and a higher level of capital adequacy ratio is applicable to us as a result. In addition, the list of
G-SIBs,
including their categorization regarding the level of additional required capital, is updated annually, and there is a possibility that we will be required to have a higher level of capital in the future. See “Item 5. Operating and Financial Review and Prospects—Capital Adequacy” and “Item 4.B. Business Overview—Supervision and Regulation—Capital Adequacy.”
We endeavor to maintain our capital adequacy ratios at an appropriate and sufficient level in light of our risk-asset management plan that is integrated with our business strategy, capital efficiency needs and the status of the risks enumerated in these “Risk Factors.” However, our and our principal banking subsidiaries’ capital adequacy ratios could decline in the future, including as a result of the materialization of any of the risks enumerated in these “Risk Factors” and changes to the methods of calculating capital adequacy ratios and other factors. Also, there are regulatory adjustments, such as those related to goodwill and other intangibles, deferred tax assets and investments in the capital of banking, financial and insurance entities, that are deducted from regulatory capital under certain conditions. Our or our principal banking subsidiaries’ regulatory capital and capital adequacy ratios could decline due to such regulations.
If the capital adequacy ratios of us or our principal banking subsidiaries fall below specified levels, the Financial Services Agency could require us to take corrective actions, including, depending on the level of deficiency, the submission of a plan to limit the outflow of capital or an improvement plan that would strengthen the capital base, a reduction (or slowing of increase) of total assets, a reduction in the size of business operations, a disposition of subsidiary shares and a suspension of all or a portion of business operations. In addition, some of our banking subsidiaries are subject to capital adequacy regulations in foreign jurisdictions such as the United States, and in the event of a breach of these regulations, they could be subject to various restrictions and orders from local authorities. Such events could adversely affect our business, financial condition and results of operations.
14
Leverage ratio regulations
In December 2017, the Basel Committee on Banking Supervision published the finalized Basel III reforms in which the framework for the leverage ratio requirements was finalized, and the phased application of the requirements, as prescribed by the Financial Services Agency, commenced on March 31, 2019. In March 2020, according to the deferral of the implementation of the finalized Basel III reform announced by GHOS, the Financial Services Agency announced that the implementation of the leverage ratio requirements under the finalized definition of the leverage ratio exposure measure and the leverage ratio buffer requirement for
G-SIBs
in Japan were deferred for one year, and will take effect from March 31, 2023. In June 2020, under concerns regarding the increasing impact of the coronavirus pandemic, to maintain harmonization with the monetary policy implemented by the Bank of Japan and the prudent regulations for banks and other financial institutions, the Financial Services Agency introduced temporary measures to exclude amounts of deposits to the Bank of Japan from the total exposure, which is the denominator, in calculating leverage ratio when a ratio, which is separately determined by the Commissioner of the Financial Services Agency taking into account an exceptional macroeconomic condition, applies as minimum regulatory requirements for leverage ratio. The temporary measures were at first implemented as effective until March 31, 2021, but were later extended to be effective until March 31, 2022. The regulation requires bank holding companies and banks to maintain their leverage ratio, which is a supplementary indicator of the capital adequacy ratio, at a certain level or above. See “Item 5. Operating and Financial Review and Prospects—Capital Adequacy” and “Item 4.B. Business Overview—Supervision and Regulation—Capital Adequacy.” If the leverage ratio falls below a certain ratio, the Financial Services Agency could require us to take corrective actions, including the submission of an improvement plan that would strengthen the capital base, a reduction (or slowing of increase) of total assets, a reduction in the size of some business operations, a disposition of subsidiary shares and a suspension of all or a portion of business operations. Such events could adversely affect our business, financial condition and results of operations.
Total Loss Absorbing Capacity (TLAC) regulations
In November 2015, the Financial Stability Board released a final document requiring
G-SIBs
to have a certain minimum total loss absorbing capacity (TLAC).The phased application by the Financial Services Agency of TLAC regulations in Japan to Japanese
G-SIBs,
including us, began on March 31, 2019 with full application, with certain limited exception, to take effect from March 31, 2022. In June 2020, the Financial Services Agency introduced temporary measures to exclude amounts of deposits to the Bank of Japan from the total exposure, which is the denominator, in calculating leverage ratio when a ratio, which is separately determined by the Commissioner of the Financial Services Agency taking into account an exceptional macroeconomic condition, applies as minimum regulatory requirements for such leverage ratio. The temporary measures were at first implemented as effective until March 31, 2021, but were later extended to be effective until March 31, 2022. If excluding such amounts of deposits in calculating leverage ratio, such amounts of deposits are also excluded from the total exposure, which is the denominator, in calculating external TLAC ratio on total exposure basis and minimum internal TLAC. These regulations are applicable to
G-SIBs
such as us, in addition to capital adequacy regulations. See “Item 5. Operating and Financial Review and Prospects—Capital Adequacy” and “Item 4.B. Business Overview—Supervision and Regulation—Capital Adequacy.” If the TLAC of us or our material subsidiaries fall below a certain threshold, the Financial Services Agency could require the submission of a plan to improve TLAC or may issue a business improvement order which could include various restrictions on, or suspension of portions of, our business. Such events could adversely affect our business, financial condition and results of operations.
Capital procurement
The capital raising that we conduct in light of our regulatory capital requirements, including those conducted in response to TLAC requirements but excluding Common Equity Tier 1 capital requirements, consists primarily of the issuance of debt instruments. However, in the event of a deterioration in our financial condition or results of operations, a downgrade in our credit rating, or the spread of negative rumors or other
15
reputational damage, an economic downturn in Japan or overseas, financial system instability or financial market turmoil, we may become unable to raise capital at commercially reasonable costs, or at all. This could negatively affect our ability to maintain or improve our capital adequacy ratios in accordance with our plans, and our business, financial condition and results of operations could be materially and adversely affected.
Problems relating to our information technology (IT) systems could significantly disrupt our business operations.
We depend significantly on information technology systems with respect to almost all aspects of our business operations. Our information technology systems network, including those relating to bank accounting and cash settlement systems, interconnects our branches and other offices, our customers and various clearing and settlement systems located worldwide. We endeavor to sustain stable daily operations and develop contingency plans for unexpected events, including the implementation of backup and redundancy measures.
However, we may not be able to prevent significant disruptions to our information technology systems caused by, among other things, human error, accidents and development and renewal of computer systems. In the event of any future disruptions in our IT systems, our business, financial condition and results of operations could be materially and adversely affected due to information leaks, malfunctions or disruptions in our business operations, liability to customers and others, regulatory actions or harm to our reputation.
In February and March 2021, there were several system failure incidents at Mizuho Bank that resulted in aborted customer transactions across our network in Japan, including ATM and internet banking transactions and foreign exchange
remittances
. In order to evaluate the causes for these incidents, our board of directors established an independent investigative committee of external professionals and specialists with no vested interest in us. We also established an independent evaluation committee, comprised of external directors only, to evaluate the effectiveness of our internal measures to prevent future incidents. In June 2021, we received the investigation report from the above independent investigative committee. Based on the assessment and suggestions in the investigation report, we and Mizuho Bank then disclosed our conclusion of the investigative efforts and preventive measures that are to be taken. In 2002 and 2011, we received business improvement orders from the Financial Services Agency for incidents involving systems failures, and there have been recent media reports speculating on the imminent issuance of a business improvement order in connection with the recent incidents. There can be no assurance that such an order or other sanctions will not be issued in connection with these incidents nor, if issued, regarding the timing of such order or sanctions.
Problems relating to cyber attacks could significantly impair our ability to protect our customer’s private information and disrupt our business operations.
Our business depends on the secure processing, storage and transmission of confidential and other information within our global IT systems. There have been a number of highly publicized cases involving financial services companies, consumer-based companies, governmental agencies and other organizations reporting the unauthorized disclosure of client, customer or other confidential information in recent years, as well as cyber attacks involving the dissemination, theft and destruction of corporate information or other assets, as a result of failure by employees or contractors to follow procedures or as a result of actions by third parties, including actions by foreign governments.
As we and our outside contractors continue to be the target of unauthorized access attacks, mishandling or misuse of information, computer viruses or malware, cyber attacks designed to obtain confidential information, destroy data, disrupt or degrade service, sabotage systems or cause other damage, denial of service attacks, data breaches and other events, there can be no assurance that we will not suffer any losses or other consequences in the future as a result of significant incidents due to these cyber attacks. Although our Cyber Incident Response Team (CIRT) has led the implementation of, and continuously endeavors to upgrade, our protective measures
16
using advanced technologies, our IT systems, software and computer networks may be vulnerable to unauthorized access, misuse, computer viruses, ransomware or other malicious code and other events that could have a security impact. Due to the complexity and interconnectedness of our global IT systems, these protective measures may be ineffective, and the process of enhancing our protective measures can itself create a risk of system disruption and security issues, and there can be no assurance that our current or future countermeasures will be sufficient to prevent or mitigate the impact of such incidents.
A cyber attack, information or security breach or a technology failure that involves us or our outside contractors could jeopardize our or our customers’, employees’, partners’, vendors’ or counterparties’ personal, confidential, proprietary or other information processed and stored in, and transmitted through, our and our outside contractors’ IT systems. Furthermore, such events could cause interruptions or malfunctions in our, our customers’, employees’, partners’, vendors’, counterparties’ or outside contractor’s operations, as well as the unauthorized release, gathering, monitoring, misuse, loss or destruction of confidential, proprietary and other information of ours, our employees, our customers or of other third parties. Any of these events could result in reputational damage with our customers and the market, customer dissatisfaction or financial losses, any of which could adversely affect our financial condition and results of operations.
Our reputation could be harmed and we may be subject to liabilities and regulatory actions if we are unable to protect personal and other confidential information, including as a result of cyber attacks.
We handle various confidential or
non-public
information, including those of our individual and corporate customers, in the ordinary course of our business. The information management policies we maintain and enforce to prevent information leaks and improper access to such information, including those that we require of our outside contractors and those designed to meet the strict requirements of the Personal Information Protection Act of Japan, may not be effective in preventing all such problems. Leakage of important information in the future, including as a result of cyber attacks, could result in liabilities and regulatory actions and may also lead to significant harm to our reputation. In addition, recent or future regulatory changes, such as the Japan Amended Personal Information Protection Act, the EU General Data Protection Regulation and the UK Competition and Markets Authority’s Open Banking standard, increase the risks relating to our ability to comply with rules that impact our ability to protect information.
Non-compliance
with such regulations could result in regulatory proceedings, litigation, enforcement or the imposition of fines or penalties. As a result, our business, financial condition and results of operations could be materially and adversely affected.
Inadequacies in anti-money laundering and counter-terrorism financing measures could subject us to regulatory actions and harm our reputation.
As financial crimes become more diverse and sophisticated, and incidents of terrorism continue to occur around the world, the importance of anti-money laundering measures and the need to counter the financing of terrorism is rapidly increasing and is a key priority for financial authorities worldwide, including Japan. We have developed a system to comply with applicable laws and regulations in Japan and overseas, and we are continuously implementing measures to further strengthen measures against money laundering. However, there can be no assurance that such measures will be effective in preventing all violations, and failure to comply with regulations and requirements can result in enforcement and/or regulatory proceedings. If we fail to meet the regulatory requirements to which we are subject, or to maintain risk and control procedures and processes that meet the heightened standards established by our regulators and other government agencies, we could be required to enter into settlements, comply with orders, pay additional fines, penalties or judgments, or accept material regulatory restrictions on our businesses. As a result, our business, financial condition and results of operations may be materially and adversely affected.
17
Transactions with counterparties in Iran and other countries designated by the U.S. Department of State as state sponsors of terrorism may lead some potential customers and investors to avoid doing business with us or investing in our securities or have other adverse effects.
U.S. law generally prohibits U.S. persons from doing business with countries designated by the U.S. Department of State as state sponsors of terrorism (the “Designated Countries”), which currently includes Iran, Syria, North Korea and Cuba (added in January 2021), and we maintain policies and procedures to comply with applicable U.S. laws. Our
non-U.S.
offices engage in transactions relating to the Designated Countries on a limited basis and in compliance with applicable laws and regulations, including trade financing with respect to our customers’ export or import transactions and maintenance of correspondent banking accounts. In addition, we maintain a representative office in Iran. We do not believe our operations relating to the Designated Countries are material to our business, financial condition or results of operations. We maintain policies and procedures to ensure compliance with applicable Japanese and U.S. laws and regulations.
The laws and regulations applicable to dealings involving the Designated Countries are subject to further strengthening or changes. If the U.S. government considers that our compliance measures are inadequate, we may be subject to regulatory action which could materially and adversely affect our business. In addition, we may become unable to retain or acquire customers or investors in our securities, or our reputation may suffer, potentially having adverse effects on our business or the price of our securities.
Violations of laws and regulations related to financial market activities could subject us to adverse consequences such as regulatory actions and reputational harm.
In conducting our market operations in Japan and overseas, we are subject to the application of the laws and regulations of Japan and other countries and stock exchange rules, as well as being under the supervision of various financial authorities.
While we maintain compliance measures and endeavor to manage compliance risks, there can be no assurance that such measures will be effective in preventing all violations. Misconduct by employees, including improper or illegal conduct, can cause significant reputational harm as well as litigation and regulatory action. As a result, our business, financial condition and results of operations could be materially and adversely affected due to such regulatory actions and reputational damage.
Violations of applicable laws and regulations and misconduct by our officers or employees could result in penalties and other regulatory actions as well as harm to our reputation.
Our business and employees in Japan are subject to various laws and regulations, including those applicable to financial institutions as well as general laws applicable to our business activities, and we are under the regulatory oversight of the Financial Services Agency. Our businesses outside of Japan are also subject to the laws and regulations of the jurisdictions in which they operate and are subject to oversight by the regulatory authorities of those jurisdictions. In addition to our compliance with applicable laws and regulations, our officers and employees are expected to meet the expectations of our customers and society regarding compliance with relevant social rules and norms, and the standards relating to such expectations are likely to become higher and the rules and norms are subject to change over time.
Our compliance and legal risk management structures are designed to prevent violations of such laws and regulations and cultivate a risk-sensitive culture among our officers and employees, but they may not be effective in preventing all violations and
non-compliance.
Violations of laws and regulations and our officers’ or employees’ misconduct could result in regulatory action and harm our reputation, and our business, financial condition and results of operations could be materially and adversely affected.
18
Our Five-Year Business Plan and other strategic initiatives and measures may not result in the anticipated outcome.
We have been implementing strategic initiatives and measures in various areas. In May 2019, we announced our Five-Year Business Plan for the five fiscal years ending March 31, 2023. However, we may not be successful in implementing such initiatives and measures, or even if we are successful in implementing them, the implementation of such initiatives and measures may not have their anticipated effects. In addition, we may not be able to meet the key targets announced due to these or other factors, including, but not limited to, differences in the actual economic environment compared to our assumptions, as well as the risks enumerated in these “Risk Factors.”
For further information of our Five-Year Business Plan, see “Item 4. Business Overview—General and structural reforms.”
We will be exposed to new or increased risks as we expand the range of our products and services.
As a financial consulting group, we offer a broad range of financial services, including banking, trust banking, securities and other services. As the needs of our customers become more sophisticated and broader in scope, and as the Japanese financial industry continues to be deregulated, we have been entering into various new areas of business, including through various business and equity alliances, which expose us to new risks. While we have developed and intend to maintain risk management policies that we believe are appropriate to address such risks, if a risk materializes in a manner or to a degree outside of our expectations, our business, financial condition and results of operations could be materially and adversely affected.
Employee errors and misconduct could subject us to losses and reputational harm.
Because we process a large number of transactions in a broad range of businesses, we are subject to the risk of various operational errors and misconduct, including those caused by employees. Our measures to reduce employee errors, including establishment of operational procedures, regular reviews regarding compliance with these procedures, employee training and automation of our operations, may not be effective in preventing all employee errors and misconduct. Significant operational errors and misconduct could result in losses, regulatory actions or harm to our reputation. As a result, our business, financial condition and results of operations could be materially and adversely affected.
Our business would be harmed if we are unable to attract and retain skilled employees.
Many of our employees possess skills and expertise that are important to maintain our competitiveness and to operate our business efficiently. We may not be successful in attracting and retaining sufficient skilled employees through our hiring efforts and training programs aimed to maintain and enhance the skills and expertise of our employees, in which event our competitiveness and efficiency could be significantly impaired. As a result, our business, financial condition and results of operations could be materially and adversely affected.
Our failure to establish, maintain and apply adequate internal controls over financial reporting could negatively impact investor confidence in the reliability of our financial statements.
As a New York Stock Exchange-listed company and an SEC registrant, we have developed disclosure controls and procedures and internal control over financial reporting pursuant to the requirements of the Sarbanes-Oxley Act of 2002 and rules and regulations of the SEC promulgated pursuant thereto. Our management reports on, and our independent registered public accounting firm attests to, the effectiveness of our internal controls over financial reporting, as required, in our annual report on Form
20-F.
In addition, our management is required to report on our internal control over financial reporting, and our independent registered public accounting firm is required to provide its opinion concerning the report of our management, in accordance with the Financial Instruments and Exchange Act of Japan. To the extent any issues are identified through the
19
foregoing processes, there can be no assurance that we will be able to address them in a timely manner or at all. Furthermore, even if our management concludes that our internal control over financial reporting are effective, our independent registered public accounting firm may still be unable to issue a report that concludes that our internal control over financial reporting are effective. In either case, we may lose investor confidence in the reliability of our financial statements.
We are subject to risk of litigation and other legal proceedings.
As a financial institution engaging in banking and other financial businesses in and outside of Japan, we are subject to the risk of litigation for damages and other legal proceedings in the ordinary course of our business. Adverse developments related to legal proceedings could have a material adverse effect on our business, financial condition and results of operations.
Our risk management policies and procedures may not adequately address unidentified or unanticipated risks.
We devote significant resources to strengthen our risk management policies and procedures. Despite this, and particularly in light of the rapid evolution of our operations, our policies and procedures designed to identify, monitor and manage risks may not be fully effective. Some of our methods of managing risks are based upon our use of observed historical market behavior. As a result, these methods may not accurately predict future risk exposures, which could be significantly greater than the historical measures indicate. If our risk management policies and procedures do not function effectively, our financial condition and results of operations could be materially and adversely affected.
We may be subject to risks related to dividend distributions.
As a holding company, we rely on dividend payments from our banking and other subsidiaries for almost all of our income. As a result of restrictions, such as those on distributable amounts under Japan’s Companies Act, or otherwise, our banking and other subsidiaries may decide not to pay dividends to us. In addition, we may experience difficulty in making, or become unable to make, dividend payments to our shareholders and dividend or interest payments on capital securities issued by our group due to the deterioration of our results of operations and financial condition and/or the restrictions under the Companies Act or due to the strengthening of bank capital regulations. For more information on restrictions to dividend payments under the Companies Act and bank capital regulations, see “Item 10.B. Additional Information—Memorandum and Articles of Association” and “Item 4.B. Business Overview—Supervision and Regulation—Japan.”
We may be adversely affected if economic or market conditions in Japan or elsewhere deteriorate.
We conduct a wide variety of business operations in Japan as well as overseas, including in the United States, Europe and Asia. If general economic conditions in Japan or other regions were to deteriorate or if the financial markets become subject to turmoil, we could experience weakness in our business, as well as deterioration in the quality of our assets. As a result, our financial condition and results of operations could be materially and adversely affected.
Amendments and other changes to the laws and regulations that are applicable to us could have an adverse effect on us.
We are subject to general laws, regulations and accounting rules applicable to our business activities in and outside of Japan. We are also subject to various laws and regulations applicable to financial institutions such as the Banking Act, including capital adequacy requirements, in and outside of Japan. If the laws and regulations that are applicable to us are amended or otherwise changed, such as in a way that restricts us from engaging in business activities that we currently conduct or that requires us to incur additional costs related to our IT systems, our business, financial condition and results of operations could be materially and adversely affected.
20
Uncertainties regarding the future of LIBOR as an interest rate benchmark and any successor thereto subjects us to various risks.
Many of our products and services refer to benchmark interest rates such as the London Interbank Offered Rate (“LIBOR”) in many currencies, including the U.S. dollar. We also utilize such benchmark interest rates for our own evaluation of financial instruments and various other internal management purposes.
In light of the LIBOR manipulation scandal that surfaced in 2012, many financial authorities around the world have commented on a transition to the risk-free rate as the benchmark interest rate to improve reliability and transparency. In addition, in July 2017, the Chief Executive of the Financial Conduct Authority of the United Kingdom (“FCA”), which regulates LIBOR, announced that the FCA will no longer persuade or compel banks to present rates for the calculation of the LIBOR benchmark after 2021. Later in March 2021, ICE Benchmark Administration Limited (“IBA”), the administrator of LIBOR, announced that it will cease the publication of JPY, GBP, EUR, CHF LIBOR and certain USD LIBOR settings immediately after the end of 2021 and cease the publication of the remaining USD LIBOR settings immediately after the end of June 2023. FCA thus announced the formal cessation and loss of representativeness of LIBOR.
We have established a special division tasked to prepare us for the cessation of publication of LIBOR and the shift to a successor interest rate benchmark. However, issues such as the transition of a particular benchmark to a replacement rate could result in wide spread dislocation in the financial markets, engender volatility in the pricing of securities, derivatives and other instruments, and suppress capital markets activities. As a result, the transition could, for example, cause hedging accounting items to be derecognized and increase litigation risks regarding our existing products and services, which could adversely impact our profitability. There can be no assurance that a change in the benchmark interest rate and related valuation methods will not have a material adverse effect on our financial condition and results of operations. We may also be adversely affected if the change restricts our ability to provide products and services or if it necessitates the development of additional information technology systems.
Our reputation could be adversely affected if our business operations are perceived as being harmful to the environment and society.
As concerns regarding environmental and social issues such as climate change have heightened in recent years, we believe that our stakeholders as well as the society at large expect that we, as a financial services provider, give increasing consideration to such issues. While we are strengthening our efforts to reduce environmental and social risks, including establishing comprehensive policies for, among others, engaging with specific sectors that are likely to exacerbate negative impacts on the environment and society or engagement across multiple sectors, the expectations placed upon us and companies which we invest in or extend loans to continue to heighten day by day. Our reputation may be harmed and credit-related costs could rise if our or such companies’ efforts fall short of such expectations. As a result, our business, financial condition and results of operations could be materially and adversely affected.
Climate change could have an adverse effect on us.
Following the adoption of the Paris Agreement in 2015, measures to reduce greenhouse gases that are seen as the cause of climate change have been accelerating globally, and the importance of addressing climate change risks, among various environmental and social issues, has been increasing.
We believe climate change is a threat to our environment, society, daily lives and the activities of companies, and view it as one of the most important global issues which may affect the stability of financial markets. Climate change risks include transition risks caused by changes in a wide range of policies, laws and regulations, technologies and markets due to moving to a low carbon economy. Typical examples of such transition risks include
mid-
to long-term credit-related cost increases for business sectors that emit more
21
greenhouse gases. We may also suffer a deterioration of our reputation due to our financing of businesses that, for example, handle fossil fuels such as coal-fired power generation businesses. Climate change risks may also include physical risks, such as direct damages to assets, or indirect effects, such as the severance of supply chains. Examples of potential risks in the near term include increases in credit-related costs due to deterioration in the business performance of our customers as a result of stagnation in their businesses or decreases in the value of collateral assets caused by changes in climate and the effects thereof. Examples of potential long-term risks include increases in credit-related costs due to deteriorating macroeconomic conditions, which may be caused in part by an increase in infectious diseases, heatstroke or other related ailments.
We have implemented a review of our strategy and risk management structure in order to manage the aforementioned risks, while paying attention to global trends. However, if our initiatives do not have their anticipated effects and climate change risks, whether or not contemplated above, materialize, our business operations, results and financial conditions could be materially and adversely affected.
Intensification of competition in the market for financial services in Japan could have an adverse effect on us.
We offer comprehensive financial services globally, centered on banking, trust banking and securities, and are subject to intense competition both domestically and internationally with large financial institutions,
non-bank
financial institutions and others. In addition, as a result of technological advances called “FinTech,” an increasing number of companies have recently been crossing industry lines and entering the field of finance, and it is possible that the competitive environment surrounding us may further intensify. Moreover, due to the reforms to financial regulations made to date, it may become difficult to differentiate strategies between us and our competitors, resulting in the intensification of competition in specific businesses.
If we are unable to respond effectively to current or future competition, our business, financial condition and results of operations could be adversely affected. In addition, intensifying competition and other factors could lead to reorganization within the financial services industry, and this could have an adverse effect on our competitive position or otherwise adversely affect the price of our securities.
Our business could be significantly disrupted due to natural disasters, accidents or other causes.
Our headquarters, branch offices, information technology centers, computer network connections and other facilities are subject to the risk of damage from natural disasters such as earthquakes and typhoons as well as from acts of terrorism and other criminal acts. In addition, our business could be materially disrupted as a result of an epidemic outbreak. Our business, financial condition and results of operations could be adversely affected if our recovery efforts, including our implementation of contingency plans that we have developed such as establishing
back-up
offices, are not effective in preventing significant disruptions to our business operations caused by such natural disasters and criminal acts. For example, massive natural disasters such as the March 2011 Great East Japan Earthquake may have various adverse effects, including a deterioration in economic conditions, declines in the business performance of many of our corporate customers and declines in stock prices. As a result, our financial condition and results of operations could be materially and adversely affected due to an increase in the amount of problem loans and credit-related costs as well as an increase in unrealized losses on, or losses from sales of, equity securities and financial products.
Negative rumors about us could have an adverse effect on us.
Our business depends on maintaining the trust of depositors and other customers and market participants. Negative rumors about us, spread through media coverage, communications between market participants, Internet postings or otherwise, could lead to our customers and market participants believing factually incorrect information about us and harm our reputation. In the event we are unable to dispel such rumors or otherwise restore our reputation, our business, financial condition, results of operations and the price of our securities could be materially and adversely affected.
22
Risks Related to Owning Our Shares
Rights of shareholders under Japanese law may be more limited than under the law of other jurisdictions.
Our articles of incorporation, our regulations of the board of directors and Japan’s Companies Act govern our corporate affairs. Legal principles relating to such matters as the validity of corporate procedures, directors’ and officers’ fiduciary duties and shareholders’ rights may be different from or less clearly defined than those that would apply if we were incorporated in another jurisdiction. For example, under the Companies Act, only holders of 3% or more of the total voting rights or total outstanding shares are entitled to examine our accounting books and records. Shareholders’ rights under Japanese law may not be as extensive as shareholders’ rights under the law of jurisdictions within the United States or other countries. For more information on the rights of shareholders under Japanese law, see “Item 10.B. Additional Information—Memorandum and Articles of Association.”
It may not be possible for investors to effect service of process within the United States upon us or our directors, executive officers or senior management, or to enforce against us or those persons judgments obtained in U.S. courts predicated upon the civil liability provisions of the federal securities laws of the United States.
We are a joint stock corporation incorporated under the laws of Japan. Almost all of our directors, executive officers and senior management reside outside the United States. Many of the assets of us and these persons are located in Japan and elsewhere outside the United States. It may not be possible, therefore, for U.S. investors to effect service of process within the United States upon us or these persons or to enforce, against us or these persons, judgments obtained in the U.S. courts predicated upon the civil liability provisions of the federal securities laws of the United States. We believe that there is doubt as to the enforceability in Japan, in original actions or in actions to enforce judgments of U.S. courts, of claims predicated solely upon the federal securities laws of the United States.
Risks Related to Owning Our ADSs
As a holder of ADSs, you have fewer rights than a shareholder and you must act through the depositary to exercise these rights.
The rights of our shareholders under Japanese law to take actions such as voting their shares, receiving dividends and distributions, bringing derivative actions, examining our accounting books and records and exercising appraisal rights are available only to shareholders of record. Because the depositary, through its custodian, is the record holder of the shares underlying the ADSs, a holder of ADSs may not be entitled to the same rights as a shareholder. In your capacity as an ADS holder, you are not able to bring a derivative action, examine our accounting books and records or exercise appraisal rights, except through the depositary.
Foreign exchange rate fluctuations may affect the U.S. dollar value of our ADSs and dividends payable to holders of our ADSs.
Market prices for our ADSs may fall if the value of the yen declines against the U.S. dollar. In addition, the U.S. dollar amount of cash dividends and other cash payments made to holders of our ADSs would be reduced if the value of the yen declines against the U.S. dollar.
23
|
ITEM 4.
|
INFORMATION ON THE COMPANY
|
4.A. History and Development of the Company
The Mizuho Group
The Mizuho group was created on September 29, 2000 through the establishment of Mizuho Holdings, Inc. as a holding company of our three predecessor banks, The
Dai-Ichi
Kangyo Bank, The Fuji Bank and The Industrial Bank of Japan. On October 1, 2000, the respective securities subsidiaries of the predecessor banks merged to form Mizuho Securities Co., Ltd., and the respective trust bank subsidiaries merged on the same date to form Mizuho Trust & Banking.
A further major step in the Mizuho group’s development occurred in April 2002 when the operations of our three predecessor banks were realigned through a corporate split and merger process under Japanese law into a wholesale banking subsidiary, the former Mizuho Corporate Bank, and a banking subsidiary serving primarily retail and small and
exchange with Mizuho Holdings, which became an intermediate holding company focused on management of the Mizuho group’s banking and securities businesses. The legal and commercial name of the company is Mizuho Financial Group, Inc.
medium-sized
enterprise customers, the former Mizuho Bank. As an additional step for realigning the group structure, Mizuho Financial Group was established on January 8, 2003 as a corporation organized under the laws of Japan, and on March 12, 2003, it became the holding company for the Mizuho group through a
stock-for-stock
In May 2003, we initiated a project to promote early corporate revitalization of customers in need of revitalization or restructuring and to separate the oversight of restructuring borrowers from the normal credit origination function. In July 2003, our three principal banking subsidiaries, the former Mizuho Corporate Bank, the former Mizuho Bank and Mizuho Trust & Banking each transferred loans, equity securities and other claims outstanding relating to approximately 950 companies to new subsidiaries that they formed. In October 2005, based on the significant reduction in the balance of nonaccrual loans held by these new subsidiaries, which we call the “revitalization subsidiaries,” we deemed the corporate revitalization project to be complete, and each of the revitalization subsidiaries was merged into its respective banking subsidiary parent.
In the fiscal year ended March 31, 2006, we realigned our entire business operations into a Global Corporate Group, Global Retail Group and Global Asset and Wealth Management Group. In October 2005, in connection with this realignment, we established Mizuho Private Wealth Management Co., Ltd., a private banking subsidiary, and converted Mizuho Holdings on October 1, 2005 from an intermediate holding company into Mizuho Financial Strategy Co., Ltd., an advisory company that provides advisory services to financial institutions.
In May 2009, Mizuho Securities and Shinko Securities Co., Ltd. conducted their merger, with the aim of improving our service-providing capabilities to our clients and to offer competitive cutting-edge financial services on a global basis.
In September 2011, Mizuho Trust & Banking became a wholly-owned subsidiary of Mizuho Financial Group, Mizuho Securities became an unlisted subsidiary of the former Mizuho Corporate Bank, and Mizuho Investors Securities became a wholly-owned subsidiary of the former Mizuho Bank, through their respective
exchanges. The purpose of these
exchanges is to further enhance the “group collective capabilities” by integrating group-wide business operations and optimizing management resources such as workforce and branch network.
stock-for-stock
stock-for-stock
In January 2013, Mizuho Securities and Mizuho Investors Securities merged in order to provide integrated securities services as the full-line securities company of the Mizuho group. Mizuho Securities aims to further strengthen collaboration among banking, trust banking and securities businesses of the group, expand the company’s customer base to enhance the domestic retail business, and rationalize and streamline management infrastructure.
24
In April 2013, we turned Mizuho Securities, a consolidated subsidiary of Mizuho Financial Group, into a directly-held subsidiary of Mizuho Financial Group, whereby we moved to a new group capital structure, placing banking, trust banking, securities and other major group companies under the direct control of the holding company.
In July 2013, the former Mizuho Bank and the former Mizuho Corporate Bank merged, and the former Mizuho Corporate Bank, the surviving entity, changed its trade name to Mizuho Bank, Ltd. The purpose of the merger was to become able to provide directly and promptly diverse and functional financial services to both the former Mizuho Bank and the former Mizuho Corporate Bank customers, utilizing the current “strengths” and “advantages” of the former Mizuho Bank and the former Mizuho Corporate Bank, and to continue to improve customer services by further enhancing group collaboration among the banking, trust banking and securities functions and, at the same time, to realize further enhancement of the consolidation of group-wide business operations and optimization of management resources, such as workforce and branch network, by strengthening group governance and improving group management efficiency.
In July 2016, with consideration of the rule of the Board of Governors of the Federal Reserve System (the “Federal Reserve Board”) regarding the operations of foreign banking organizations with U.S. operations, we established a bank holding company, Mizuho Americas LLC, which holds our primary U.S.-based banking, securities and institutional custody services (trust banking) entities together under it, with the aim to proactively strengthen corporate governance and expand our profit base through the consistent implementation of our collaborative corporate and investment banking, securities and institutional custody services strategy in the United States in line with the global operation of our new
in-house
company system.
In December 2017, two subsidiaries of Mizuho Americas LLC, the former Mizuho Bank (USA) and the Mizuho Trust & Banking Co. (USA), merged. The merged entity, Mizuho Bank (USA), provides both banking services and trust services.
In October 2016, with a view to strengthening our respective asset management businesses, we and The
Dai-ichi
Life Insurance Company, Limited integrated the asset management functions of both groups, namely, DIAM Co., Ltd., the asset management function of Mizuho Trust & Banking, Mizuho Asset Management Co., Ltd. and Shinko Asset Management Co., Ltd., and formed a new company named Asset Management One Co., Ltd., a consolidated subsidiary of Mizuho Financial Group.
In March 2017, we, Sumitomo Mitsui Trust Holdings, Inc., Resona Bank, Limited as a subsidiary of Resona Holdings, Inc. and The
Dai-ichi
Life Insurance Company, Limited as a subsidiary of
Dai-ichi
Life Holdings, Inc. executed a memorandum of understanding to commence detailed analysis and negotiations in preparation for the management integration of Japan Trustee Services Bank, Ltd. (“JTSB”) and Trust & Custody Services Bank, Ltd. (“TCSB”), which was a consolidated subsidiary of Mizuho Financial Group. In October 2018, TCSB and JTSB incorporated JTC Holdings, Ltd. (“JTC Holdings”) by joint share transfer. After the joint share transfer, TCSB and JTSB became wholly-owned subsidiaries of JTC Holdings, and JTC Holdings, TCSB and JTSB became equity-method affiliates of Mizuho Financial Group. In July 2020, JTC Holdings and TCSB merged with JTSB as the surviving entity, which changed its trade name to Custody Bank of Japan, Ltd. The purpose of the integration is to contribute to further growth in the domestic securities settlement market and domestic investment chain by realizing more stable and higher quality operations and strengthening its system development capabilities by seeking the benefits of scale.
In May 2020, we decided to integrate three consolidated subsidiaries of Mizuho Financial Group, Mizuho Information & Research Institute, Inc. (“MHIR”), Mizuho Research Institute Ltd. (“MHRI”) and Mizuho Trust Systems Company, Limited (“MHTS”) with MHIR as the surviving entity. Based on this decision, MHIR and MHTS executed a merger agreement with MHIR as the surviving entity in November 2020, and the two entities merged in January 2021. In February 2021, MHIR and MHRI executed a merger agreement, and the two entities were integrated and became a new company, Mizuho Research & Technologies Corporation (“MHRT”), in April
25
2021. The purpose of the integration is to significantly improve the ability of the Mizuho group to provide “New value beyond the conventional boundaries of finance” by organically combining and amalgamating each company’s research, consulting, and IT development capabilities.
Other Information
Our registered address is
Otemachi,
1-5-5,
Chiyoda-ku,
Tokyo
100-8176,
Japan, and our telephone number is
81-3-5224-1111.
The SEC maintains an Internet site that contains reports, proxy and information statements, and other information regarding issuers that file electronically with the SEC at www.sec.gov. As a foreign private issuer, we are exempt from the rules under the Exchange Act that prescribe the furnishing and content of proxy statements to shareholders. Our corporate website is
www.mizuho-fg.co.jp/index.html.
4.B. Business Overview
General
We engage in banking, trust banking, securities and other businesses related to financial services.
We are working to fulfill objectives set in our medium-term business plan spanning a five-year period starting from the fiscal year ended March 31, 2020, which is titled
“5-Year
Business Plan: Transitioning to the Next Generation of Financial Services.” During the fiscal year ended March 31, 2021, the global spread of
COVID-19
has led to significant and rapid changes in people’s lifestyles as well as in the state of the economy and society as a whole. The business environment of our group has also changed significantly. In light of the foregoing, we have been fortifying our preparations for the potential risks related to adverse changes to our business environment so that we may continue to fulfill our role of providing funding and other financial services. Moreover, we have worked to further strengthen our relationships with customers. Through such measures and the strengthening of our business foundations with a view to the
post-COVID-19
world and further pursuit of structural reforms, we have strived to accelerate our “Transitioning to the Next Generation of Financial Services.”
With respect to our business structure reforms, we have worked to fully draw on our strengths that we have cultivated thus far and go beyond the conventional boundaries of finance in order to provide optimal services and solutions. For more information on initiatives that we have taken in the fiscal year ended March 31, 2021, see “—Group Operations—Group Management Structure.”
With respect to our finance structure reforms, we have worked to reallocate corporate resources and strengthen our stable revenue base to enable us to pursue the transformation of our business portfolio to further enhance efficiency and our ability to capture stable revenue streams. While allowing for a temporary increase in risk assets due to our provision of financing to customers negatively affected by
COVID-19,
we have strived to conduct our business from the viewpoint of maintaining capital resilience through measures such as the dedicated pursuit of credit risk management. In addition, through the further promotion of structural reforms that takes into account the changing business environment and workstyles due to
COVID-19,
we have endeavored to improve our cost structure and strengthen our revenue base.
In terms of corporate foundations reforms, by restructuring our subsidiaries and integrating their business functions of research, consulting and IT system development, we established Mizuho Research & Technologies, Ltd. on April 1, 2021 as a core group company that supports
non-financing
business areas. Meanwhile, we have also been implementing various measures in connection with new human resources strategies and promoting new workstyles for our employees.
26
In addition to the above-mentioned initiatives, we have proceeded with initiatives such as the creation of new business opportunities and the expansion of solution domains through the use of digital technology and open collaboration with third parties, including those in other industries.
We actively promote sustainability throughout the group, under the concept: “Mizuho’s sustainable and steady growth, the conservation of the environment and the sustainable development and prosperity of the economy, industry, and society both in Japan and around the world.” Sustainability has become one of the key issues on our management agenda that is discussed at the Executive Management Committee, Risk Committee and by the Board of Directors, and we have been striving to strengthen our engagement in these issues. Specifically, we have improved measures to promote sustainable business for the group as a whole and set long-term objectives, including for sustainable finance, to capture business opportunities. From the perspective of risk management, we have strengthened our risk management framework to better monitor and manage environmental and social risks stemming from issues such as climate change.
Moreover, we have been working to improve communications with various stakeholders and enhance information disclosure. New disclosures include the TCFD Report, ESG Databook, SASB Index and our responses to the Principles for Responsible Banking.
Investigations into Incidents of System Failure and Measures to Prevent Further Incidents
In response to the system failures at our subsidiary, Mizuho Bank, that occurred several times from February to March 2021, and in consideration of the suggestions made by our System Failure Special Investigative Committee in June 2021, we will make a concerted effort to enhance the Multi-layered Capabilities for Failure Response through strengthening the functions of “System” and “Customer Response and Crisis Management” as well as promoting cross-departmental coordination in a flexible manner. By aiming to realize the Multi-layered Capabilities for Failure Response and by resolving the fundamental issues for the Mizuho group as a whole that underlie the issues relating to functions of “System” and “Customer Response and Crisis Management,” we will strive to achieve sustainable growth for both the organization and its individual constituents.
To ensure effective implementation of the above measures, we will establish a System Failure Improvement Promotion Committee at Mizuho Financial Group and Mizuho Bank, chaired by the President & Group CEO and the President & CEO of Mizuho Bank, respectively. In addition, our System Failure Response Evaluation Committee, comprised of external directors only, will supervise the implementation of preventive measures and monitor the issue going forward. Moreover, we will establish another evaluation committee at Mizuho Bank. Such committee will be composed of both external and internal directors and will oversee implementation status of the preventive measures.
We aim to heighten our awareness regarding the social role and public responsibility inherent in a financial group. We also strive to conduct our business with a customer-focused mindset and stable business operations in order to support our customers and society. We are determined to prevent similar incidents from occurring in the future and take this incident as an opportunity to further enhance the resilience of our organization.
Implementing the
5-Year
Business Plan
In the
5-Year
Business Plan, we are aiming to transition to the next generation of financial services by building new forms of partnerships with our customers so that we can respond to their needs as the times change. Our objective is to build a stronger and more resilient financial group on which our customers can depend in the coming era. In addition to megatrends such as digitalization, an aging society with a low birthrate in Japan and globalization, and the global spread of
COVID-19
has challenged people’s lifestyles, the state of the economy and societies to change greatly and at a rapid speed. In order to be a company that provides new value that goes beyond the conventional boundaries of finance in the coming era, we aim to steadily implement three forward-looking structural reforms.
27
Priority business domains
Business structural reforms
We intend to implement business structural reforms focused on the following initiatives to better enable us to respond to structural shifts occurring in the economy, industry and society while drawing on our strengths:
| • |
Be a partner that helps customers design their lives in a changing society.
|
| • |
Assist customers with asset building to support their life design in an era of lengthening lifespans, and develop professionals capable of providing this assistance.
|
| • |
Provide sophisticated solutions for business succession needs and assist clients with needs regarding identifying candidates for senior management roles.
|
| • |
Create next-generation branches focused on consulting that combine physical locations and digital channels.
|
| • |
Appeal to new customer demographics and create new demand through the application of technology and open collaboration.
|
| • |
Be a strategic partner for business development under a changing industrial structure.
|
| • |
Open collaboration for growth acceleration, including financing the growth of startups and forming industry-government-academia partnerships.
|
| • |
Utilize our industry knowledge and other insights to build new forms of partnerships that share business risks.
|
| • |
Leveraging our Asian client base and networks in order to support the business development of global clients.
|
| • |
Be a partner with expert knowledge of market mechanisms and the ability to draw on a range of intermediary functions.
|
| • |
By strengthening our global network and products framework, draw on a broad range of intermediary functions to connect investors with other investors and connect issuers with investors.
|
| • |
Enhance the sophistication of our ALM and portfolio management through flexible asset allocation while maintaining a focus on achieving a balance between realized gains and unrealized gains/losses.
|
Financial structure reforms
We intend to implement financial structure reforms focused on the following initiatives to transition to a flexible business/earnings structure that can better respond to changes in the business and competitive environments:
| • |
Identify business/earnings structure issues in each business domain, focusing on the following four perspectives:
|
| • |
Risk and return (gross profits ROE)
|
| • |
Cost and return (expense ratio)
|
| • |
Growth potential
|
| • |
Stability
|
| • |
Based on the above factors, streamline certain areas and
concentrate/re-allocate
corporate resources to growth areas.
|
28
| • |
After establishing a stable profit base, transition to an earnings structure centered on proactively pursuing earnings streams with upside potential.
|
Corporate foundations reforms
We intend to implement the following initiatives in order to strengthen our corporate foundations as a means of supporting continued competitive advantages:
| • |
Transform our approach to new business and our working style.
|
| • |
Focus on the areas of personnel/workplace, IT systems/digital, sales channels and group companies.
|
| • |
Revise our human resources management in line with an approach that prioritizes employees’ professional growth and career preferences and promote a new human resources management strategy focused on maximizing our workforce value in a manner that is universally recognizable.
|
| • |
Strengthen group governance.
|
| • |
Expand the use of
“dual-hat”
appointments of executive officers between our holding company and group companies and other methods of strengthening unified management of the group, including group companies other than banking, trust banking and securities subsidiaries. This will enhance our ability to implement key strategies and structural reforms.
|
| • |
Cultivate a new corporate culture centered on communication.
|
Sustainability initiatives
Based on the Basic Policy on Sustainability Initiatives, we will make a concerted effort as a whole to promote our sustainability initiatives to improve the corporate value and contribute to a more sustainable society.
Specifically, we have designated key sustainability projects to be implemented throughout the Mizuho group with efforts from different work unit levels ranging from internal companies, units and the group as a whole. The key projects were determined by assessing their significance and compatibility with our strategy and
mid-
to long-term influence on our corporate value, taking into account requests and expectations from stakeholders.
Regarding climate change, one of the most important global challenges, we amended our Environmental Policies in April 2021, which clarified our contribution to achieving a
low-carbon
society by 2050 and phased transformation of our portfolio to align with the targets of the Paris Agreement. Discussions regarding the specific pathways to achieving the goals are ongoing.
Meanwhile, we will continue to enhance our information disclosure system in recognition of the importance of dialogue with various stakeholders to ensure that our sustainability measures align with expectations from society.
Group Operations
Group Management Structure
We operate our group through five
in-house
companies, which determine and promote strategies group-wide across banking, trust banking, securities and other business areas according to the attributes of customers, and two units that support all of the
in-house
companies.
Retail & Business Banking Company
The Retail & Business Banking Company is responsible for customer segments consisting of individual customers, SMEs and middle-market corporations, engages in consulting services that integrate banking, trust banking, securities and other functions within the Mizuho group, as well as providing convenient financial services by leveraging advanced technologies and forming alliances with other companies.
29
For individual customers, the Retail & Business Banking Company will strive to improve our capacity to provide consulting services, including asset management and asset succession, while working on the development and provision of convenient services by leveraging advanced technologies and forming alliances with other companies and institutions.
As a reliable partner in an era of lengthening lifespans, we support customers who have concerns about their long term plans, and in addition to the consulting services that combine banking, trust banking and securities functions, we offer our customers asset formation support that utilizes advanced technologies, such as
AI-powered
asset management advisory services and asset management support utilizing remote channels, etc. Accordingly, in addition to strengthening our efforts related to NISA, a tax exemption program for small investments, and iDeCo, an individual-type defined contribution pension plan, we will strengthen financial education through seminars.
Furthermore, to support the smooth asset succession, we provide services such as inheritance distribution service and testamentary-trust that utilize trust function. We have also expanded our line of products and services such as Multifunctional Safety Trust and a web based app that can be used to manage inheritance.
With respect to the loan business, we have expanded our line of housing loan and card loan products and offer various products and services in response to each customer’s life stage, including firstly products that meet a diverse range of needs, internet-based services and the development of a new business model that utilizes advanced technology.
We also provide products/services to officers and employees of our corporate clients, such as opening account for payrolls, providing housing loans, management of retirement payments, etc.
In addition, in an effort to increase customer convenience, we have enhanced the efficiency of our branch network and ATM network throughout Japan. As part of the effort, we pushed for the banking, trust and securities services to be provided at the same location, including by setting up Mizuho Securities’ “Planet Booths” and Mizuho Trust & Banking’s “Trust Lounges” in the branches and offices of Mizuho Bank.
Moreover, with the aim of constructing a convenient and efficient channel network that responds to changes in customer needs, we are promoting the next generation of branches and offices which serve as consulting spaces along with a reduction of the number of branches and offices through reorganization and consolidation.
We have also made efforts to enhance customer convenience. For example, we are engaging in collaboration with other companies and are utilizing advanced technologies to offer new financial and other services and to enhance the quality of our internet and smart phone services, in light of changing customer needs due to ongoing digitalization.
In the fiscal year ended March 31, 2021, we expanded our businesses, including forming a strategic alliance with Softbank Corp. to develop the next-generation of financial services tailored to new lifestyles.
Further, we undertake a business related to lottery tickets, such as the sales of lottery tickets issued by prefectures and ordinance-designated cities.
For small- and
medium-sized
enterprises and middle-market firms, the Retail & Business Banking Company provides solutions with respect to both types of needs: management issues such as business development, and personal issues of customers who are business owners, such as asset inheritance and management, etc.
In response to increasing customer needs related to their growth strategy or business succession in an unclear business environment, we offer multi-layered solutions in response to the various development stages of our customers’ businesses through the combined strength of our banking, trust banking, securities, asset management and research and consulting functions, based on a customer-focused approach.
30
Specifically, we offer syndicated loans, advisory services related to overseas expansions, mergers and acquisitions-related services, and business matching services, depending on the customers’ business strategies, in addition to brokering financial products and expanding the customer base for trustee business for defined contribution pension plans, combining financial services and advanced advisory services.
Furthermore, due to the aging of Japanese business owners, business succession and asset inheritance has become a matter of urgency. Using our succession and property
know-how,
we actively offer solutions for optimal and smooth business succession and asset inheritance, including the inheritance of business ownership and corporate stock as well as corporate reorganization, addressing both individual and corporate needs.
Moreover, we leverage our existing customer base to support the growth of innovative companies that show future promise by means of finance and other solutions.
In light of structural changes in customer needs against the backdrop of further progress in digitalization, an aging society with a low birthrate and other factors, we aim to enhance the efficiency of sales channels, including physical storefronts, and expand new business areas to realize the wants and desires of individual customers as well as the sustainable growth of corporate customers.
In order to achieve this goal, we intend to take advantage of our broad customer base, trustworthiness and dependability, as well as our consulting capabilities. At the same time, we intend to collaborate openly with those both inside and outside the Mizuho group to provide new value incorporating both financial and
non-financial
products and services, as a partner for individual customers’ life design and corporate customers’ growth strategies and business succession.
Corporate & Institutional Company
The Corporate & Institutional Company is responsible for customer segments consisting of large corporations, financial institutions and public-sector entities in Japan, provides custom-designed solutions for each client on a group-wide basis to meet their needs, both financial or
non-financial.
For large corporate customers, based on our solid customer relationships and utilizing our global industry knowledge, we offer group-wide financial solutions such as fund management, underwriting of equity and bonds, M&A advisory and risk hedging products, etc., on a global basis to meet their needs in fund-raising, investment, management and financial strategies.
Mizuho Bank and Mizuho Securities have introduced the
dual-hat
structure in Japan. Through the inter-sectoral group collaboration, they provide our customers with solutions tailored to their capital management, business strategy and financial strategy.
Mizuho Bank and Mizuho Trust & Banking together provide solutions related to real estate, where we have a leading track record in the industry in Japan. They also work together in the areas of pension, asset securitization, securities management, stock transfer agent, consulting, etc., in response to our customers’ diversified needs.
For financial institutions, we offer advisory services and solutions, such as advice on financial strategy and proposals on various investment products, by concentrating our various financial expertise from each group company to meet the increasingly sophisticated and diversified needs of customers.
For public sector customers, as a leading bank with a wealth of experience and a solid track record, we provide optimal financial services group-wide that include funding support as a trustee and underwriter of public bonds and services as a designated financial institution. In addition, in the field of revitalizing rural regions in Japan, an important matter to the Japanese economy, we engage in Public Private Partnerships/Private Finance Initiatives (PPP and PFI) projects in collaboration with regional financial institutions, national and regional government entities and their affiliates.
31
We will build new relationships with customers and endeavor to realize value
co-creation
and
co-prosperity
based on changes in customer needs in response to changes in social and industrial structures.
The environment that our customers are facing is changing rapidly due to such factors as the progress of industry transformation and the society’s heightened interest in sustainability. Under such circumstances, we strive to become the most reliable wholesale bank as well as a value
co-creation
partner for our customers in order to help them achieve sustainable growth by not only providing financing, but also coordinating group-wide resources and setting up different sales frameworks for different industry sectors, and providing solutions with
in-depth
industry- and product-specific knowledge.
Global Corporate Company
The Global Corporate Company is responsible for customer segments consisting of both Japanese companies operating outside Japan and
non-Japanese
companies, provides various solutions by taking advantage of our deep understanding of our clients’ businesses and our strengths in corporate finance and transaction banking, such as lending and corporate bond underwriting.
For our Japanese corporate customers, we provide integrated support both in and outside Japan to help them expand their overseas operations. We offer highly specialized services that use our advanced financial technologies and expertise. Particularly in Asia, we support Japanese corporate customers developing new markets by offering advisory and other services.
In addition, through our Global 300 Strategy, which involves focusing on a group of approximately 300 blue-chip
non-Japanese
companies, we are expanding business with
non-Japanese
corporate customers. We aim to provide LCM/DCM financing and financial solutions to global companies developing business in Asia, by utilizing our high presence in the U.S. capital markets and network in Asian economic regions that have been growing rapidly.
Meanwhile, we are enhancing our channels with customers in order to strengthen the framework to support their business outside Japan. We are forming business alliances with local financial institutions and government-affiliated institutions to provide
local information to our customers. We are also enhancing our service framework to address the diverse business needs of customers. We will aim to build long-term relationships with customers by utilizing business, financial and ESG consulting and our close relationships with the top management of corporate customers based on our
up-to-date
know-how
and insight regarding each country and industry sector.
In anticipation of future growth constraints, such as the phased implementation of Basel regulations and our foreign currency funding capabilities, we will continue our initiatives such as raise of our profit capabilities by strengthening current business bases and diversifying product lineup, reform of cost structure and adjustment of our business portfolio through selection and concentration.
Global Markets Company
The Global Markets Company is responsible for market-related businesses, engages in sales and trading services for a wide range of customers, from individuals to institutional investors, by offering market products to meet their risk hedging and asset management needs and also conducts ALM and investment business, including stable capital raising and balance sheet management as well as management of portfolios of fixed income, equity and other securities.
To become a
top-class
Asian player in the global markets, our basic strategy is to enhance our presence in the market so that we can develop the most suitable products and organizational structure based on arising customer needs.
32
With respect to the sales and trading business, we have improved the profitability of the integrated banking and securities functions, which were led by our branches in the United States and Europe. Meanwhile, we have been seizing opportunities in the domestic market, including those related to currency fluctuations and stock price increases, to increase profits.
We will accelerate the integration of banking and securities functions in Japan and Asia. We aim to further enhance our presence by providing solutions more effectively and improving our trading capabilities through consolidating global risks and setting up electronic trading platforms to meet our customers’ diversified needs.
With respect to our ALM and investment business, in the face of significant changes in the market environment, through utilizing methodologies including our advanced early warning control and hedging methodologies, we adjust our asset allocation with flexibility to increase realized profits and accumulate unrealized profits. Through flexible balance sheet management and stable fund raising that take into account changes in the foreign currency deposit-loan ratio, we are supporting our customer’s global businesses. We strive for stable and efficient operations on a global basis to contribute to the well-being of the overall business performance of the Mizuho group.
Moreover, we are promoting sustainability in various functions of sales and trading, investment and fund raising businesses.
In addition, we have been working on maintaining and strengthening our competitiveness by enhancing our infrastructure, including next generation trading rooms in anticipation of technological progress and our market system based on strategic management resources allocation and reducing costs, and further strengthening digital literacy of personnel for market business and developing personnel with highly specialized knowledge.
We aim to realize a stable earnings structure in ALM and the investment business and to improve sales and trading services with clearly defined focus areas which enable us to draw on diverse intermediary functions through the market and create diverse value for our customers.
In order to achieve this goal, as a partner with expert knowledge of market mechanisms that has insight into markets, we will aim to enhance our asset allocation and product lineup and aim to establish a stable profit base. At the same time, we will strive to provide appropriate investment opportunities to investors with different risk appetite.
Asset Management Company
The Asset Management Company is responsible for businesses related to asset management, provides products and services that meet the asset management needs of our wide range of customers, from individuals to institutional investors, through the collaboration between the group’s banking, trust banking and securities functions as well as Asset Management One Co., Ltd.
For individual customers, we offer investment products that contribute to their medium- to long-term asset formation in order to meet their various needs.
For institutional investors such as pension funds, we make our asset management capabilities more sophisticated and offer comprehensive solution services to meet their diversified and sophisticated asset management needs.
We offer our customers investment products that are best suited to them by strengthening our asset management capabilities in collaboration with our group companies and affiliates such as the New York subsidiary and other foreign subsidiaries of Asset Management One that are established for diversified global investments, Asset Management One Alternative Investments, Ltd. located in Tokyo that selects and offers hedge funds, and Matthews Asia, an independent, privately owned firm and the largest dedicated Asia investment specialist in the United States.
33
In addition, in various product fields, we are focusing on developing and offering products through collaboration with BlackRock, Inc. and Partner Group AG.
By providing these solutions, addressing ESG issues through engagement in responsible investment and seeking efficiency and innovativeness through innovation and operating process reforms, we aim to contribute to the revitalization of financial assets in Japan and realize medium- to long-term growth of our asset management business.
Global Products Unit
The Global Products Unit is in charge of providing investment banking and transaction solution services to customers in a wide range of segments, including individual customers, corporate clients and investors. We aim to respond to customer needs that are becoming sophisticated and diverse by drawing on our high level of expertise in each area, including M&A, real estate, project finance, domestic and foreign payments, asset management and stock transfer agency.
In the investment banking business we provide sophisticated financial solutions mainly in the business areas as follows:
| • |
In the mergers and acquisitions business, with an aim to increase the corporate value of our customers, we offer sophisticated solutions in response to our customers’ needs, mainly in the areas of cross-border mergers and acquisitions, business succession and management buyouts.
|
| • |
In the real estate business, by taking full advantage of our extensive knowledge and skills developed through the collaboration of our group companies, we offer various real estate-backed financing methods and real estate-related investment strategy support.
|
| • |
In the asset finance business, by strengthening the collaboration between banking, trust banking and securities functions and by arranging customers’ asset securitization, we satisfy their demands such as diversification of fund-raising sources and improvement of financial indices achieved by removing assets from their balance sheet.
|
| • |
In the project finance business, we provide various financial products and services internationally, including long-term loan facilities for large-scale mining and public infrastructure development, and domestically, including loans for renewable energy-related projects and arrangement of PFI/PPP deals.
|
| • |
In the corporate finance business, we proactively provide a wide variety of fund raising solutions in the syndicated loan and debt and equity capital markets.
|
In the transaction business we provide various solutions in accordance with customer needs and the character of their business:
| • |
For our corporate customers in the transaction business, we offer various financial services and products such as online banking, cash management solutions, Renminbi-denominated services and trade finance on a global basis.
|
| • |
For financial institutions and institutional investors, we promote custody, global custody and yen correspondence settlement, asset management and stock transfer agent services.
|
| • |
In addition, we are further expanding our range of services in collaboration with our group companies and leveraging the latest technological innovations.
|
As uncertainty persists in the global economy’s recovery, we will strive to capture the changes in the environment in a timely manner to provide the best support in order for our customers to reform business structures and increase corporate value.
34
Furthermore, we will closely collaborate with offices in Japan and around the world to respond with flexibility on a global basis to a diverse range of needs of our customers, especially for cash management, settlements and other transaction banking services, as well as services in the area of project finance. In addition, we are working to provide solutions from a long-term perspective by capturing market trends in various business areas such as sustainability issues and enhancement of payment services in light of digitalization.
Research & Consulting Unit
The Research & Consulting Unit offers a wide variety of solutions with research functions that provide deep analysis, spanning from industrial to macroeconomic analysis and consulting functions that cover many fields, including business strategy.
In the research field, we conduct deep investigations and wide-ranging analyses from macro-economics to industry and corporation trends, and link research and business origination function.
In the consulting field, we also offer a wide range of functions to help solve various issues that companies face, including those regarding management /HR planning/IT strategy and creation of new businesses, as well as social issues within the public sector, including the environment, energy, infrastructure and health care by utilizing financial engineering and digital knowledge.
COVID-19
has been a trigger to a new set of values and behavioral patterns, as well as the acceleration of digitalization. In addition, sustainability has become a growing trend in which corporations become more active in contributing to a carbon-free and recycling-based society. By taking initiatives such as enhancing the sophistication of research and expansion of consultation, we will intend to further contribute to creating new value for our customers and society by utilizing our industry, economic and social expertise, including those in relation to sustainability and digitalization, and by becoming the starting point of value chains of our value creation.
Competition
We engage in banking, trust banking, securities and other businesses related to financial services and face strong competition in all of those areas of businesses.
Our major competitors in Japan include:
| • |
Japan’s other major banking groups: Mitsubishi UFJ Financial Group and Sumitomo Mitsui Financial Group.
|
| • |
Other banking institutions: These include city banks, trust banks, regional banks, shinkin banks (or credit associations), credit cooperatives, agricultural cooperatives, foreign banks and retail-oriented banks.
|
| • |
Securities companies and investment banks: These include both domestic securities companies and the Japanese affiliates of global investment banks.
|
| • |
Government financial institutions: These include Japan Finance Corporation, Japan Post Bank, Development Bank of Japan and Japan Bank for International Cooperation.
|
| • |
Non-bank
finance companies: These include credit card issuers, installment shopping credit companies, leasing companies and other
non-bank
finance companies.
|
| • |
Asset management companies.
|
| • |
Other financial service providers, such as those utilize “FinTech.”
|
35
In global markets, we face competition with other commercial banks and other financial institutions, particularly major global banks and the leading local banks in those financial markets outside Japan in which we conduct business.
Japanese Banking and Securities Industry
Private banking institutions in Japan are normally classified into two categories (the following numbers are based on information published by the Financial Services Agency, available as of June 19, 2021): (i) ordinary banks, of which there were 121, not including foreign commercial banks with banking operations in Japan; and (ii) trust banks, of which there were 13, including Japanese subsidiaries of foreign financial institutions and subsidiaries of Japanese financial institutions.
Ordinary banks consist mainly of city banks and regional banks. City banks, including Mizuho Bank, are based in large cities, operate domestically on a nation-wide scale through networks of branch offices and have strong links with large corporate customers in Japan. In light of deregulation and other competitive factors, however, many of these banks have placed increasing emphasis on other markets, including retail banking, small and
medium-sized
enterprise banking, international operations and investment banking. Regional banks are mostly based in one of the prefectures of Japan and are generally much smaller in terms of total assets than city banks. In recent years, as a consequence of changes in the business environment, the number of regional banks that integrate their businesses with other regional banks has been increasing. Customers of regional banks, other than local retail customers, include mostly regional enterprises and local public utilities, although regional banks also lend to large corporations. In addition to these types of banks, new retail-oriented banks have emerged in recent years, including Internet banks and banks specializing in placing their ATMs in convenience stores and supermarkets without maintaining a branch network.
Trust banks, including Mizuho Trust & Banking, are engaged in trust services in relation to, among others, money trust, pension trust and real estate trust services, in addition to banking business.
Based on information published by the Financial Services Agency, available as of June 19, 2021, there were 55 foreign banks operating banking businesses in Japan. These banks are subject to a statutory framework similar to the regulations applicable to Japanese domestic banks. Their principal sources of funds come from their overseas head offices or other branches.
A number of government financial institutions, organized in order to supplement the activities of the private banking institutions, have been in the process of business and organizational restructuring in recent years. In October 2008, some of the government financial institutions were consolidated to form Japan Finance Corporation, which mainly provides financing for small and
medium-sized
enterprises and those engaged in agriculture, forestry and fishery, and also provides export financing for Japanese corporations. In October 2008, Development Bank of Japan, which mainly engages in corporate financing, and Shoko Chukin Bank, which mainly engages in financing for small and
medium-sized
enterprises, were transformed into joint stock corporations. Japan Housing Finance Agency supports housing loans of private institutions through the securitization of such loans.
In April 2012, Japan Bank for International Cooperation, which provides policy-based finance with a mission to contribute to the sound development of Japan and the international economy and society, was spun off from Japan Finance Corporation and was established as a joint stock corporation wholly owned by the Japanese government.
Another distinctive element of the Japanese banking system is the role of the postal savings system. Postal savings deposits are gathered through the network of governmental post offices scattered throughout Japan, and their balance of deposits totaled over 200 trillion yen in the past. In recent years, the governmental postal business has been in the process of organizational restructuring. In 2003, the governmental postal business was
36
transferred to Japan Post, a government-owned entity established in the same year, and in 2007, Japan Post was transformed into a government-owned joint stock corporation holding four operating companies including Japan Post Bank, which currently operates as an ordinary bank. In November 2015, the shares of three main companies of the Japan Post group were listed on the Tokyo Stock Exchange, with Japan Post Holdings disposing of approximately 11% of its ownership in the two subsidiaries, while the Japanese government disposed of approximately 11% of its ownership in Japan Post Holdings. Japan Post Holdings plans to initially dispose of its two subsidiaries shares gradually down to approximately 50% ownership. In April 2019, the maximum deposit amount that Japan Post Bank Co., Ltd. may accept increased from 13 million yen in aggregate for ordinary deposits and time deposits to a total of 26 million yen, 13 million yen each for ordinary deposits and time deposits.
In recent years, as a result of technological advances in the digital field called “FinTech,” entry from different industries into areas considered to be the inherent business of financial institutions such as settlement services has been increasing.
In the Japanese securities market, a large number of registered entities are engaged in securities businesses, such as sales and underwriting of securities, investment advisory and investment management services. As deregulation of the securities market progressed, several of the country’s banking groups have entered into this market through their subsidiaries. In addition, foreign financial institutions have been active in this market.
Supervision and Regulation
Japan
Pursuant to the Banking Act (Ginkou Hou) (Act No. 59 of 1981, as amended), the Prime Minister of Japan has authority to supervise banks in Japan and delegates certain supervisory control over banks in Japan to the Commissioner of the Financial Services Agency. The Bank of Japan also has supervisory authority over banks in Japan, based primarily on its contractual agreements and transactions with the banks.
Financial Services Agency
Although the Prime Minister has supervisory authority over banks in Japan, except for matters prescribed by government order, this authority is generally entrusted to the Commissioner of the Financial Services Agency. Additionally, the position of Minister for Financial Services was established by the Cabinet to direct the Commissioner of the Financial Services Agency and to support the Prime Minister.
Under the Banking Act, the Prime Minister’s authority over banks and bank holding companies in Japan extends to various areas, including granting and cancellation of licenses, ordering the suspension of business in whole or in part and requiring submission of business reports or materials. Under the prompt corrective action system, the Financial Services Agency, acting on behalf of the Prime Minister, may take corrective action in the case of failure to meet the minimum capital adequacy ratio or the minimum leverage ratio of banks, bank holding companies, their subsidiaries and companies having special relationships prescribed by the cabinet order. See “Capital Adequacy” below. These actions include requiring a financial institution to formulate and implement reform measures, requiring it to reduce assets or take other specific actions and issuing an order to suspend all or part of its business operations.
In addition, under the capital distribution constraints system introduced in March 2016, the Financial Services Agency, acting on behalf of the Prime Minister, may order a bank holding company or bank to submit and carry out a capital distribution constraints plan. See “Capital Adequacy” below. The capital distribution constraints plan is required to be considered reasonable to restore the capital buffer and include restrictions on capital distributions, such as dividends, share buybacks and bonuses payments, up to a certain amount as determined depending on the level of the capital buffer.
37
Furthermore, under the Japanese TLAC regulations introduced in March 2019, the Financial Services Agency, acting on behalf of the Prime Minister, may order the bank holding company of a G-SIB in Japan designated as the domestic resolution entity of such G-SIB to submit reports related to improvement of TLAC or may issue a business improvement order to such domestic resolution entity if the external TLAC ratio of the domestic resolution entity or the internal TLAC of its material subsidiaries in Japan fall below the minimum requirements. See “Total Loss Absorbing Capacity” below.
Under the prompt warning system introduced in December 2002, the Financial Services Agency may take precautionary measures to maintain and promote the sound operations of financial institutions, even before those financial institutions become subject to the prompt corrective action system. These measures require a financial institution to reform profitability, credit risk management, stability and cash flow.
The Bank of Japan
The Bank of Japan is Japan’s central bank and serves as the principal instrument for the execution of Japan’s monetary policy. The principal measures by which the Bank of Japan implements monetary policy are the adjustment of its discount rate, its operations in the open market and the imposition of deposit reserve requirements. Banks in Japan are allowed to obtain borrowings from, and rediscount bills with, the Bank of Japan. Moreover, most banks in Japan maintain current accounts under agreements with the Bank of Japan pursuant to which the Bank of Japan is entitled to supervise, examine and audit the banks. The supervisory functions of the Bank of Japan are intended to enable it to ensure smooth settlement of funds among banks and other financial institutions, thereby contributing to the maintenance of an orderly financial system, whereas the supervisory practices of the Prime Minister or the Commissioner of the Financial Services Agency are intended to maintain the sound operations of banks and promote the security of depositors.
Examination of Banks
The Banking Act authorizes the Prime Minister to inspect banks and bank holding companies in Japan at any time. By evaluating banks’ systems of self-assessment, auditing their accounts and reviewing their compliance with laws and regulations, the Financial Services Agency monitors the financial soundness of banks, including the status and performance of their control systems for business activities.
The inspection of banks had been performed pursuant to a Financial Inspection Manual published by the Financial Services Agency, but on December 15, 2017 the Financial Services Agency announced a plan to repeal the Financial Inspection Manual after April 1, 2019 and establish a new framework for bank supervision. In order to upgrade the quality of its supervisory activities, strengthen Japan’s financial infrastructure, and to enable the Japanese economy to realize its full potential, the Financial Services Agency embarked on the review of the supervisory approaches. The Financial Services Agency announced the “JFSA’s supervisory approaches — Replacing checklists with engagement” in June 2018, and is committed to continuous improvement of the supervisory approaches through dialogue with financial institutions, etc. by using theme-specific reports, etc. Based on this, the Financial Services Agency repealed the Financial Inspection Manual, including the appendix that was referred to for self-assessment and determining the
write-off
and allowance.
In addition to individual financial institutions, the Financial Services Agency also supervises financial groups as a whole based on its Guidelines.
The Bank of Japan also conducts examinations of banks. The examinations are normally conducted once every few years, and involve such matters as examining asset quality, risk management and reliability of operations. Through these examinations, the Bank of Japan seeks to identify problems at an early stage and give corrective guidance where necessary.
In March 2021, the Financial Services Agency and the Bank of Japan released the “Initiatives for strengthening the cooperation between the Financial Services Agency and the Bank of Japan,” which aims to
38
increase efficiency and reduce the burden on financial institutions without compromising the comprehensiveness of the regulation. To achieve this, the two institutions would strengthen cooperation among their regulation schemes including the inspections and supervision by the Financial Services Agency, as well as the
on-site
inspections and
off-site
monitoring conducted by the Bank of Japan.
In addition, the Securities and Exchange Surveillance Commission examines banks in connection with their financial instruments business activities in accordance with the Financial Instruments and Exchange Act of Japan (Kinyu Shouhin Torihiki Hou) (Act No. 25 of 1948, as amended).
Examination and Reporting Applicable to Shareholders
Under the Banking Act, a person who intends to hold 20% (in certain exceptional cases, 15%) or more of the voting rights of a bank is required to obtain prior approval of the Commissioner of the Financial Services Agency. In addition, the Financial Services Agency may request reports or submission of materials from, or inspect, any principal shareholder who holds 20% (in certain exceptional cases, 15%) or more of the voting rights of a bank, if necessary in order to secure the sound and appropriate operation of the business of such bank. Under limited circumstances, the Financial Services Agency may order such principal shareholder to take such measures as the Financial Services Agency deems necessary.
Furthermore, under the Banking Act, any person who becomes a holder of more than 5% of the voting rights of a bank holding company or bank must report its ownership of voting rights to the director of the relevant local finance bureau within five business days. In addition, a similar report must be made in respect of any subsequent change of 1% or more in any previously reported holding or any change in material matters set forth in reports previously filed, with some exceptions.
Deposit Insurance System
Under the Deposit Insurance Act (Yokin Hoken Hou) (Act No. 34 of 1971, as amended), depositors are protected through the Deposit Insurance Corporation in cases where financial institutions fail to meet their obligations. The Deposit Insurance Corporation is supervised by the Prime Minister and the Minister of Finance. Subject to limited exceptions, the Prime Minister’s authority is entrusted to the Commissioner of the Financial Services Agency.
The Deposit Insurance Corporation receives annual insurance premiums from insured banks. The effective premium rate from April 2021, which is the weighted average of the rates for deposits that bear no interest, are redeemable upon demand and are used by depositors primarily for payment and settlement purposes, and for other deposits, is 0.031%.
The insurance money may be paid out in case of a suspension of deposit repayments, banking license revocation, dissolution or bankruptcy of the bank. Pay outs are generally limited to a maximum of ¥10 million of principal amount, together with any interest accrued with respect to each depositor. Only
non-interest
bearing deposits, redeemable on demand and used by depositors primarily for payment and settlement functions are protected in full.
Participation in the deposit insurance system is compulsory for city banks (including Mizuho Bank), regional banks, trust banks (including Mizuho Trust & Banking), credit associations and
co-operatives,
labor banks and other financial institutions.
Governmental Measures to Treat Troubled Institutions
Under the Deposit Insurance Act, a Financial Reorganization Administrator can be appointed by the Prime Minister if the bank is unable to fully perform its obligations with its assets or may suspend or has suspended
39
repayment of deposits. The Financial Reorganization Administrator will take control of and dispose of the assets of the bank and search for another institution willing to take over its business. Its business may also be transferred to a “bridge bank” established by the Deposit Insurance Corporation for the purpose of the temporary maintenance and continuation of operations of these types of institutions, and the bridge bank will seek to transfer the bank’s assets to another financial institution or dissolve the bank. The financial aid provided by the Deposit Insurance Corporation to assist another financial institution with succeeding the failed bank’s business may take the form of a monetary grant, loan or deposit of funds, purchase of assets, guarantee or assumption of debts, subscription of preferred stock or subordinated bonds, lending of subordinated loans, or loss sharing.
Where the Prime Minister recognizes that the failure of a bank which falls into any of (i) through (iii) below may cause an extremely grave problem in maintaining the financial order in Japan or the region where such bank is operating (“systemic risk”), without taking any of the measures described in (i) through (iii) below, the Prime Minister may confirm (nintei) to take any of the following measures, after the deliberation at the Financial Crisis Management Meeting: (i) if the bank does not fall into either of the banks described in (ii) or (iii), the Deposit Insurance Corporation may subscribe for shares or subordinated bonds of, or lend subordinated loans to the bank, or subscribe for shares of the bank holding company of the bank, in order to enhance capital adequacy of the bank (item 1 measures (dai ichigo sochi)); (ii) if the bank is likely to suspend or has suspended repayment of deposits or is unable to fully perform its obligations with its assets, financial aid exceeding the
pay-off
cost may be available to such bank (item 2 measures (dai nigo sochi)); and (iii) if the bank is likely to suspend or has suspended repayment of deposits and is unable to fully perform its obligations with its assets, and the systemic risk cannot be avoided by the measure mentioned in (ii) above, the Deposit Insurance Corporation may acquire all of the bank’s shares (item 3 measures (dai sango sochi)). The expenses for implementation of the above measures will be borne by the bank industry, with an exception under which the Government of Japan may provide partial subsidies for such expenses.
New orderly and effective resolution regimes for financial institutions have been discussed internationally and “Key Attributes of Effective Resolution Regimes for Financial Institutions” was published by the Financial Stability Board in November 2011 and endorsed by the G20 leaders at the Cannes summit held in November 2011. Reflecting this global trend, pursuant to certain amendments to the Deposit Insurance Act that were promulgated in June 2013 and became effective on March 6, 2014, a new resolution regime was introduced in Japan.
Under the new resolution regime stipulated in the amendments to the Deposit Insurance Act and implementing ordinances thereunder, which became effective on March 6, 2014, financial institutions including banks, insurance companies and securities companies and their holding companies, are subject to the regime.
Further, under the new resolution regime, among other things, where the Prime Minister recognizes that the failure of a financial institution which falls into either (a) or (b) below may cause significant disruption in the financial markets or other financial systems in Japan without taking any of the measures described in (a) (specified item 1 measures)(tokutei dai ichigo sochi) stipulated in Article
126-2,
Paragraph 1, Item 1 of the Deposit Insurance Act or the measures described in (b) (specified item 2 measures)(tokutei dai nigo sochi) stipulated in Article
126-2,
Paragraph 1, Item 2 of the Deposit Insurance Act, the Prime Minister may confirm (specified confirmation)(tokutei nintei) to take any of the following measures, after the deliberation at the Financial Crisis Management Meeting; (a) if the financial institution does not fall into a financial institution which is unable to fully perform its obligations with its assets, the Deposit Insurance Corporation shall supervise the operation of the business of and the management and disposal of assets of that financial institution (tokubetsu kanshi), and may provide it with loans or guarantees necessary to avoid the risk of significant disruption in the financial systems in Japan (shikin no kashitsuke tou), or subscribe for shares or subordinated bonds of, or lend subordinated loans to the financial institutions (tokutei kabushiki tou no hikiuke tou), in each case to be taken as necessary taking into consideration of the financial conditions of the financial institution; and (b) if the financial institution is or is likely to be unable to fully perform its obligations with its assets or has suspended or is likely to suspend repayment of its obligations, the Deposit Insurance Corporation shall supervise that financial
40
institution (tokubetsu kanshi), and may provide financial aid necessary to assist merger, business transfer, corporate split or other reorganization in respect to such failed financial institution (tokutei shikin enjo). The expenses for implementation of the measures under this regime will be borne by the financial industry, with an exception under which the Government of Japan may provide partial subsidies for such expenses. If a measure set out in (b) above is determined to be taken with respect to a financial institution, the Prime Minister may order that the financial institution’s operation and assets be under the special control (tokutei kanri) of the Deposit Insurance Corporation. The business or liabilities of the financial institution subject to the special supervision (tokubetsu kanshi) or special control (tokutei kanri) by the Deposit Insurance Corporation as set forth above may also be transferred to a “bridge bank” established by the Deposit Insurance Corporation for the purpose of the temporary maintenance and continuation of operations of, or repayment of the liabilities of, such financial institutions, and the bridge bank will seek to transfer the bank’s business or liabilities to another financial institution or dissolve the bank. The financial aid provided by the Deposit Insurance Corporation to assist merger, business transfer, corporate split or other reorganization in respect to the financial institution set out in (b) above may take the form of a monetary grant, loan or deposit of funds, purchase of assets, guarantee or assumption of debts, subscription of preferred stock or subordinated bonds, lending of subordinated loan, or loss sharing.
If the Deposit Insurance Corporation has provided such financial assistance, the Prime Minister may designate the movable assets and claims of the failed financial institution as not subject to attachment under Article
126-16
of the Deposit Insurance Act, and such merger, business transfer, corporate split or other reorganization may be conducted outside of the court-administrated insolvency proceedings.
If the financial institution subject to the special supervision or the special control by the Deposit Insurance Corporation as set forth above is or is likely to be unable to fully perform its obligations with its assets or has suspended or is likely to suspend repayment of its obligations, the financial institution may transfer all or a material portion of its business or all or a portion of shares of its subsidiaries or implement corporate split or certain other corporate actions with court permission in lieu of any shareholder resolutions under Article
126-13
of the Deposit Insurance Act. In addition, the Deposit Insurance Corporation must request other financial institution creditors of the failed financial institution to refrain from exercising their rights against the failed financial institution until measures necessary to avoid the risk of significant disruption to the financial system in Japan have been taken, if it is recognized that such exercise of their rights is likely to make it difficult to conduct an orderly resolution of the failed financial institution.
According to the announcement made by the Financial Services Agency in March 2014, (i) Additional Tier 1 instruments and Tier 2 instruments under Basel III issued by a bank must be written down or converted into common shares when the Prime Minister confirms that item 2 measures (dai nigo sochi), item 3 measures (dai sango sochi) or specified item 2 measures (tokutei dai nigo sochi) need to be applied to the bank, and (ii) Additional Tier 1 instruments and Tier 2 instruments under Basel III issued by a bank holding company must be written down or converted into common shares when the Prime Minister confirms that specified item 2 measures (tokutei dai nigo sochi) need to be applied to the bank holding company.
Further, under a possible model of Single Point of Entry (“SPE”) resolution described in the Japanese TLAC regulations published by the Financial Services Agency in March 2019, if the Financial Services Agency determines that a material subsidiary in Japan of a Japanese financial institution that is a
G-SIB
is
non-viable
due to material deterioration of its financial condition after recognizing that it is or is likely to be unable to fully perform its obligations with its assets, or that it has suspended, or is likely to suspend, repayment of its obligations, and issues an order concerning restoration of financial soundness, including recapitalization and restoration of liquidity of such material subsidiary, to the resolution entity in Japan of such financial institution, the material subsidiary’s internal TLAC instruments will be written off or, if applicable, converted into equity in accordance with the applicable terms of such internal TLAC instruments. Following the
write-off
or conversion of internal TLAC instruments, if the Prime Minister recognizes that the resolution entity in Japan of the financial institution is or is likely to be unable to fully perform its obligations with its assets, or that it has suspended or is likely to suspend, repayment of its obligations, as a result of the resolution entity’s loans to, or other investment
41
in, its material subsidiaries that are designated by the Financial Services Agency as being systemically important or that are subject to TLAC requirements or similar requirements imposed by a relevant foreign authority, becoming subject to loss absorption or otherwise, and further recognizes that the failure of such resolution entity is likely to cause a significant disruption to the Japanese financial market or system, the Prime Minister may, following deliberation by the Financial Crisis Management Meeting, confirm that specified item 2 measures (tokutei dai nigo sochi) need to be applied to the resolution entity for its orderly resolution.
Recovery and Resolution Plan
In November 2020, the Financial Stability Board published the latest list of
G-SIBs.
The list is annually updated by the Financial Stability Board in each November, and the list as of November 2020 continues to include us. A recovery and resolution plan must be put in place for each
G-SIB
and be regularly reviewed and updated. In Japan, under the Comprehensive Guidelines for Supervision of Major Banks, etc., as part of crisis management, financial institutions identified as
G-SIBs
must prepare and submit a recovery plan, which includes the triggers to implement the recovery plan and an analysis of recovery options, to the Financial Services Agency, and the Financial Services Agency must prepare a resolution plan for each
G-SIB.
Capital Injection by the Government
The Strengthening Financial Functions Act (Kinyu Kinou no Kyouka no tame no Tokubetsu Sochi ni kansuru Houritsu) (Act No. 128 of 2004) was enacted on June 18, 2004 in order to establish a scheme of public money injection into financial institutions and thereby enhance the soundness of such financial institutions on or prior to March 31, 2008 and revitalize economic activities in the regions where they do business. On December 17, 2008, certain amendments to the Strengthening Financial Functions Act took effect. These amendments relaxed certain requirements for public money injection into Japanese banks and bank holding companies and other financial institutions under the prior scheme and extended the period of application therefor, which had expired on March 31, 2008, to March 31, 2012. These amendments aim to promote not only the soundness of such financial institutions but also the extension of loans or other forms of credit to small and
medium-sized
enterprises in order to revitalize local economies. In response to the Great East Japan Earthquake, the law was amended in June 2011 to extend the period for application to March 31, 2017 and to include special exceptions for disaster-affected financial institutions. In 2016, the law was further amended to extend the period for application to March 31, 2022. Furthermore, in order to strengthen business bases of financial institutions by addressing the effects resulting from
COVID-19
and preventive measures against the coronavirus pandemic, the law was amended in June 2020 to extend the period for application to March 31, 2026 and special exceptions were established for financial institutions that need to improve their capital adequacy due to the adverse effects of
COVID-19.
None of the financial institutions within the Mizuho group are subject to such special exceptions. In May 2021, certain amendments to the Strengthening Financial Functions Act were promulgated, and will become effective by July 2021, which, in order to sustain the financial functions for the revitalization of local economies in regions where the population is decreasing, etc., will establish a grant scheme to support financial institutions that aim to drastically strengthen their business foundation by mergers and other business integration. Application for the grant is open until March 31, 2026.
Bank Holding Companies
Under the amendments to the Banking Act, which became effective from April 2017, a bank holding company is required to administrate the businesses of the bank holding company group and is, in principle, prohibited from carrying out businesses other than administrating such businesses and matters incidental to such businesses; however, given prior approval of the Prime Minister, a bank holding company may carry out certain operations common to its group companies so as to improve the efficiency of their operations. Business activities for subsidiaries of bank holding companies are limited to finance-related businesses and incidental businesses.
The Anti-Monopoly Act (Shiteki Dokusen no Kinshi oyobi Kousei Torihiki no Kakuho ni kansuru Houritsu) (Act No. 54 of 1947, as amended) prohibits a bank from holding more than 5% of another company’s voting
42
rights. This does not apply to a bank holding company, although the bank holding company is subject to general shareholding restrictions under the Anti-Monopoly Act. The Banking Act does, however, in principle, prohibit a bank holding company and its subsidiaries, on an aggregate basis, from holding more than 15% (in contrast to 5% in the case of a bank and its subsidiaries) of the voting rights of certain types of companies not permitted to become subsidiaries of bank holding companies. Despite the foregoing shareholding restrictions, under the amendments to the Banking Act, which became effective from April 2017, bank holding companies and banks, with prior approval of the Prime Minister, can acquire and own voting rights of companies whose businesses contribute or are expected to contribute to the increased sophistication of the banking business or the enhancement of customer convenience by utilizing information and communication technology (“advanced banking service company”) that exceed the threshold of the voting rights described above. In May 2021, certain amendments to the Banking Act were promulgated, and will become effective by November 2021, under which the businesses that contribute to the support and creation of sustainable societies, including revitalization of local economies, are added to the businesses of the advanced banking service company, and the standards for the permission applicable to certain sector businesses are expected to be relaxed.
Financial Instruments and Exchange Act
The Financial Instruments and Exchange Act (Kinyu Shouhin Torihiki Hou) requires Mizuho Financial Group to file with the Director General of the Kanto Local Finance Bureau an annual securities report including consolidated and
non-consolidated
financial statements in respect of each financial period, supplemented by quarterly and extraordinary reports.
Under the Financial Instruments and Exchange Act, registered Financial Instruments Business Operators (kinyu-shouhin torihiki gyousha), such as Mizuho Securities, as well as Registered Financial Institutions (touroku kinyu kikan), such as Mizuho Bank and Mizuho Trust & Banking, are required to provide customers with detailed disclosure regarding the financial products they offer and take other measures to protect investors, including a delivery of explanatory documents to such customers prior to and upon the conclusion of transactional agreements.
Financial Instrument Business Operators and Registered Financial Institutions are subject to the supervision of the Financial Services Agency pursuant to delegation by the Prime Minister of Japan. Some of the supervisory authority of the Financial Services Agency is further delegated to the Securities and Exchange Surveillance Commission, which exercises its supervisory power over such registered institutions by conducting site inspections and requesting information necessary for such inspections.
Non-compliance
or interference with such inspection may result in such registrants being subject to criminal penalty under the Financial Instruments and Exchange Act.
Certain amendments to the Financial Instruments and Exchange Act and the Banking Act, which came into effect in June, 2009, revamped the firewall regulations regarding the holding of concurrent offices or posts among banks, securities firms and insurance firms and required banks, securities firms and insurance firms to establish systems for managing conflicts of interest in order to protect customers’ interests and expanded the types of business services that banks and certain other financial firms can provide. In March 2021, the draft amendments to the Cabinet Office Ordinance under the Financial Instruments and Exchange Act were published, which would relax the firewall regulations to allow
non-public
information, etc. of foreign company customers to be shared within a financial group.
Sales of Financial Products
As a result of financial deregulation, more financial products, including highly structured and complicated products, can now be more freely marketed to customers. In response to this, the Act of Sales of Financial Products (Kinyu Shouhin no Hanbai tou ni kansuru Houritsu) (Act No. 101 of 2000, as amended), effective from April 2001, introduced measures to protect financial service customers by: requiring financial service providers
43
to provide customers with certain important information, including risks with respect to deficit of principal associated with the financial products they offer and any restrictions on the period for exercising rights or the period for rescission, unless the customers fall within the ambit of professional investors or express their intent to the contrary; and holding financial service providers liable for damages caused by a failure to follow those requirements. The amount of loss of principal is refutably presumed to be the amount of damages. Additionally, the law requires financial service providers to follow certain regulations on solicitation measures as well as to endeavor to solicit customers in an appropriate manner and formulate and publicize a solicitation policy.
In June 2020, certain amendments to the law were promulgated, and will become effective within one and a half years from the date of promulgation, by which amendments the name of the law will be changed to “the Act of Provision of Financial Services (Kinyu Sabisu no Teikyou ni kansuru Houritsu)” and the “financial services intermediary business” will be newly introduced thereunder. Under a single registration for financial services intermediary business, registrants will become able to provide intermediary services of each of banking, securities and insurance. The amendments to the law will not require any provider of financial services intermediary business to belong to a specific financial institution, but will impose certain regulations to protect customers, including limitations on the type of services that they may provide, prohibitions on the acceptance of assets of customers and the lodging of a security deposit.
Self-Assessment and Reserves
Financial institutions are required to establish a self-assessment program that complies with related laws such as the Financial Reconstruction Act (Kinyu Kinou no Saisei no tameno Kinkyu Sochi ni kansuru Houritsu) (Act No. 132 of 1998, as amended). Financial institutions are required to analyze their assets, giving due consideration to accounting principles and other applicable rules, and to classify their assets into four categories according to asset recovery risk and risk of impairment based on the classification of the obligor (normal obligors, watch obligors, intensive control obligors, substantially bankrupt obligors and bankrupt obligors), taking into account the likelihood of repayment and the risk of impairment to the value of the assets. The results of self-assessment should be reflected in the
write-off
and allowance according to the standard established by financial institutions pursuant to the guidelines issued by the Japanese Institute of Certified Public Accountants, etc. Based on the results of the self-assessment, financial institutions may establish reserve amounts for their loan portfolio as may be considered adequate at the relevant balance sheet date, even if all or part of such reserves may not be immediately tax deductible under Japanese tax law.
A bank is, in principle, required to determine probable losses by multiplying the amount of claims by the classification of obligors by probable loss ratio, and establish general reserves equivalent to such probable losses for normal obligors and watch obligors (including control obligors). For intensive control obligors, substantially bankrupt obligors and bankrupt obligors, specific reserves corresponding to the amount of bad debt of each obligor are required to be established.
In addition, in December 2019, the Financial Services Agency announced the “JFSA’s supervisory approaches to lending business and loan loss provisioning,” which sets forth fundamental policies concerning estimates that more accurately reflects recognized credit risks to establish reserves taking into account the lending policy of each bank and actual financial status of each obligor, using the aforementioned reserves practice as a starting point.
Credit Limits
The Banking Act restricts the aggregate amount of exposure to any single customer or customer group for the purposes of avoiding excessive concentration of credit risks and promoting the fair and extensive utilization of bank credit. The limits applicable to a bank holding company and bank with respect to their aggregate exposure to any single customer or customer group are established by the Banking Act and regulations thereunder. The Banking Act and the related regulations were amended, which became effective from December
44
2014, to tighten the previous restrictions to meet international standards. As a result of these amendments, the credit limit for a single customer or a customer group was set at 25% of the total qualifying capital, with certain adjustments, of the bank holding company or bank and its subsidiaries and affiliates. In addition, in light of the Basel Committee on Banking Supervision’s final standard regarding the larger exposure framework published in April 2014, further amendments to the cabinet order and related regulations under the Banking Act became effective in April 2020, which tighten the credit limit applicable to (i) the bank holding companies and banks with international operations for a single customer or a customer group at 25% of the Tier 1 capital, instead of the total qualifying capital, and (ii) a Japanese
G-SIBs
such as us for another
G-SIB
at 15% of its Tier 1 capital, and introduced a look-through approach concerning credit to funds and securitized products, and require recognition of the amount of exposures reduced by credit risk mitigation methods as exposures to credit risk mitigation providers.
Restriction on Shareholdings
The Act Concerning Restriction on Shareholdings by Banks (Ginkou tou no Kabushiki tou no Hoyu no Seigen tou ni kansuru Houritsu) (Act No. 131 of 2001, as amended) requires Japanese banks (including bank holding companies) and their subsidiaries to limit the aggregate market value (excluding unrealized gains, if any) of their holdings in equity securities to an amount equal to 100% of their Tier 1 capital in order to reduce exposure to stock price fluctuations.
Share Purchase Program
The Banks’ Shareholdings Purchase Corporation was established in January 2002 in order to purchase shares from banks and other financial institutions until September 30, 2006 pursuant to the Act Concerning Restriction on Shareholdings by Banks. The Banks’ Shareholdings Purchase Corporation is allowed to resume purchases of shares held by financial institutions as well as shares of financial institutions held by
non-financial
institutions, up to a maximum amount of ¥20 trillion between March 12, 2009 and March 31, 2022. The Banks’ Shareholdings Purchase Corporation purchased ¥1,640.8 billion of shares during the period from March 12, 2009 through March 31, 2021. The Banks’ Shareholdings Purchase Corporation will dispose of the purchased shares by March 31, 2032, the end of the duration of the Banks’ Shareholdings Purchase Corporation, by taking into consideration the effects on the stock market. In May 2021, certain amendments to the Act Concerning Restriction on Shareholdings by Banks were promulgated, and will become effective by November 2021, under which the abovementioned ends of the purchase period and the duration of the Banks’ Shareholdings Purchase Corporation will be extended to March 31, 2026 and March 31, 2036, respectively.
The Bank of Japan also purchased ¥387.8 billion of shares held by banks and other financial institutions during the period from February 23, 2009 through April 30, 2010. The Bank of Japan will dispose of the purchased shares between April 2016 and March 31, 2026, by taking into consideration the effects on the stock market.
Capital Adequacy
The capital adequacy guidelines applicable to Japanese banks and bank holding companies with international operations supervised by the Financial Services Agency closely follow the risk-adjusted approach proposed by the Bank for International Settlements and are intended to further strengthen the soundness and stability of Japanese banks. Under the risk-based capital framework of these guidelines, balance sheet assets and
off-balance-sheet
exposures are assessed according to broad categories of relative risk, based primarily on the credit risk of the counterparty, country transfer risk and the risk regarding the category of transactions.
In December 2010, the Basel Committee on Banking Supervision issued its Basel III rules text, which builds on the International Convergence of Capital Measurement and Capital Standards document (“Basel II”), to strengthen the regulation, supervision, and risk management of the banking sector. Basel III text presents the
45
details of global regulatory standards on bank capital adequacy and liquidity. The rules text sets out higher and better-quality capital, better risk coverage, the introduction of a leverage ratio as a backstop to the risk-based requirement, measures to promote the
build-up
of capital that can be drawn down in periods of stress, and the introduction of two global liquidity standards. For further information of the leverage ratio and the two global liquidity standards, see “Leverage Ratio” and “Liquidity” below, respectively.
The Financial Services Agency’s revisions to its capital adequacy guidelines became effective from March 31, 2013, which generally reflect rules in the Basel III text that have been applied from January 1, 2013.
Under the revised guidelines, the minimum capital adequacy ratio is 8% on both a consolidated and
non-consolidated
basis for banks with international operations, such as Mizuho Bank and Mizuho Trust & Banking or on a consolidated basis for bank holding companies with international operations, such as Mizuho Financial Group. Within the minimum capital adequacy ratio, the Common Equity Tier 1 capital requirement is 4.5% and the Tier 1 capital requirement is 6.0%.
Japanese banks with only domestic operations and bank holding companies the subsidiaries of which operate only within Japan are subject to the revised capital adequacy guidelines that have been applied from March 31, 2014, and those banks and bank holding companies are required to have a minimum Core Capital ratio of 4%. However, those banks and bank holding companies that apply the internal rating based approach are required to have a minimum Common Equity Tier 1 ratio of 4.5% on both a consolidated and
non-consolidated
basis, calculated on the assumption that the banks and bank holding companies are those with international operations.
Under the revised capital adequacy guidelines based on the Basel III rules that have been applied to banks and bank holding companies each with international operations from March 31, 2013, there are regulatory adjustments such as goodwill and other intangibles, deferred tax assets, investments in the capital of banking, financial and insurance entities etc. shall be deducted under certain conditions for the purpose of calculating capital adequacy ratios, and the requirements of regulatory adjustments were enhanced under the revised capital adequacy guidelines. For example, under the capital adequacy guidelines prior to the revision thereto under the Basel III rules, the maximum amount of net deferred tax assets under Japanese GAAP that major Japanese banks, including bank holding companies, could record without diminishing the amount of Tier 1 capital for purposes of calculating capital adequacy ratio was 20% of Tier 1 capital. Under the revised capital adequacy guidelines based on the Basel III rules, deferred tax assets that arise from temporary differences will be recognized as part of Common Equity Tier 1 capital, with recognition capped at 10% of Common Equity Tier 1 capital under certain conditions, while other deferred tax assets, such as those relating to net loss carryforwards, will be deducted in full from Common Equity Tier 1 capital net of deferred tax liabilities.
In November 2015, the Financial Services Agency published revised capital adequacy guidelines and related ordinances to introduce the capital buffer requirements under the Basel III rules for Japanese banks and bank holding companies with international operations, which include the capital conservation buffer, the countercyclical buffer and the additional loss absorbency requirements for
G-SIBs
and domestic systemically important banks
(“D-SIBs”).
These guidelines have become effective on March 31, 2016. The capital conservation buffer, the countercyclical capital buffer and the additional loss absorption capacity requirement for
G-SIBs
and
D-SIBs
must be met with Common Equity Tier 1 capital under the revised guidelines, and if such buffer requirements are not satisfied, a capital distribution constraints plan is required to be submitted to the Financial Services Agency and carried out. The capital conservation buffer is 2.5% from March 2019. In addition, subject to national discretion by the respective regulatory authorities, if the relevant national authority judges a period of excess credit growth to be leading to the
build-up
of system-wide risk, a countercyclical capital buffer ranging from 0% to 2.5% would also be imposed on banking organizations. The countercyclical capital buffer is a weighted average of the buffers deployed across all the jurisdictions to which the banking organization has credit exposures. Further, we were designated as both a
G-SIB
and
D-SIB,
and the additional loss absorption capacity requirement applied to us was 1.0%. The additional loss absorption capacity requirement
46
was the same as that imposed by the Financial Stability Board, which is 1.0% from March 2019. The Basel Committee on Banking Supervision (“BCBS”) published the newsletter with regard to the usability of these buffers and emphasized that these buffers are designed to be usable. While each of these buffers seek to mitigate specific risks, they share similar design features and are all underpinned by the following objectives: (i) absorbing losses in times of stress by having an additional overlay of capital that is above minimum requirements and that can be drawn down; and (ii) helping to maintain the provision of key financial services to the real economy in a downturn by reducing incentives for banks to deleverage abruptly and excessively.
Under the capital adequacy guidelines, banks and bank holding companies each with international operations are required to measure and apply capital charges with respect to their credit risk, market risk and operational risk.
Under the guidelines, banks and bank holding companies have several choices for the methodologies to calculate their capital requirements for credit risk, market risk and operational risk. Approval of the Financial Services Agency is necessary to adopt advanced methodologies for calculation, and Mizuho Financial Group started to apply the AIRB approach for the calculation of credit risk from the fiscal year ended March 31, 2009 and also apply the AMA for the calculation of operational risk from September 30, 2009.
In December 2017, BCBS published the finalized Basel III reforms endorsed by the Group of Central Bank Governors and Heads of Supervision. The finalized reforms complement the initial phase of Basel III reforms set forth above, seek to restore credibility in the calculation of risk-weighted assets and improve the comparability of banks’ capital ratios. Such reforms include the following elements:
| • |
a revised standardized approach for credit risk, which is designed to improve the robustness and risk sensitivity of the existing approach;
|
| • |
revisions to the internal ratings-based approach for credit risk, where the use of the most advanced internally modelled approaches for
low-default
portfolios will be limited;
|
| • |
revisions to the credit valuation adjustment (CVA) framework, including the removal of the internally modelled approach and the introduction of a revised standardized approach;
|
| • |
a revised standardized approach for operational risk, which will replace the existing standardized approaches and the advanced measurement approaches;
|
| • |
revisions to the capital floor, under which banks’ risk-weighted assets generated by internal models must be no lower than 72.5% of the total risk-weighted assets as calculated using only the standardized approaches under the revised Basel III framework; and
|
| • |
requirements to disclose their risk-weighted assets based on the standardized approaches.
|
In addition, under the finalized Basel III reforms,
G-SIBs
are required to meet a leverage ratio buffer, which will take the form of a Tier 1 capital buffer set at 50% of the applicable
G-SIB’s
risk-weighted capital buffer, and various refinements are made to the definition of the leverage ratio exposure measure based on the text of the leverage ratio framework issued by the BCBS in January 2014.
In March 2020, the Basel Committee’s oversight body, the Group of Central Bank Governors and Heads of Supervision (“GHOS”), announced a deferral of the implementation date of the finalized Basel III reform by one year to increase operational capacity of banks and supervisors to respond to
COVID-19.
As a result, it will mainly take effect from January 1, 2023, and the revisions to the capital floor will be phased in from January 1, 2023, with the initial capital floor of 50%, and will be fully implemented at 72.5% from January 1, 2028. Following such announcement, the Financial Services Agency announced on March 30, 2020 that the Basel III finalization framework is scheduled to be implemented in Japan from March 2023. Furthermore, it published its draft regulatory policy directions for the implementation of the Basel III finalization framework in Japan on December 24, 2020 and the draft amendments to the regulatory notices regarding operational risk under the Basel III finalization framework on March 31, 2021.
47
For further information regarding capital adequacy, see “Item 5. Operating and Financial Review and Prospects—Capital Adequacy—Regulatory Capital Requirements.”
Leverage Ratio
The leverage ratio framework is critical and complementary to the risk-based capital framework that will help ensure broad and adequate capture of both
on-
and
off-balance
sheet sources of banks’ leverage. This simple,
non-risk-based
measure will restrict the
build-up
of excessive leverage in the banking sector to avoid destabilizing deleveraging processes that can damage the broader financial system and the economy. Implementation of the leverage ratio requirements began with bank-level reporting to national supervisors of the leverage ratio and its components, and public disclosure is required from January 2015. Basel III’s leverage ratio is defined as the “capital measure” (numerator) divided by the “exposure measure” (denominator) and is expressed as a percentage. The capital measure is defined as Tier 1 capital, and the minimum leverage ratio is defined as 3%. The Financial Services Agency applied the requirement from March 31, 2019 to meet the minimum leverage ratio for bank holding companies and banks with international operations.
The implementation of the leverage ratio requirements under the finalized definition of the leverage ratio exposure measure and the leverage ratio buffer requirement for
G-SIBs,
were deferred for one year according to the deferral of Basel III implementation announced by GHOS described above. They will take effect from January 1, 2023.
In June 2020, in coordination with the monetary policy of the Bank of Japan in response to the impact of the
COVID-19,
the Financial Services Agency published amendments to the leverage ratio regulations which introduced the temporary measure to exclude amounts of deposits to the Bank of Japan from calculation of the leverage ratio from June 30, 2020 to March 31, 2021. In March 2021, the implementation period of this temporary measure was extended for one year until March 31, 2022.
For further information regarding the leverage ratio, see “Item 5. Operating and Financial Review and Prospects—Capital Adequacy—Regulatory Capital Requirements.”
Liquidity
There are two minimum standards for funding liquidity: LCR and NSFR (each as defined below).
The liquidity coverage ratio (“LCR”) is intended to promote resilience to potential liquidity disruptions over a thirty-day horizon and help ensure that global banks have sufficient, unencumbered, high-quality liquid assets (“HQLA”) to offset the net cash outflows it could encounter under an acute short-term stress scenario. The GHOS agreed on a revised LCR standard on January 6, 2013, and the BCBS issued the text of the revised LCR standard on January 7, 2013. The LCR guidelines of the Financial Services Agency, which reflect the rules in such text, have been applied to banks and bank holding companies with international operations from March 31, 2015. Under the LCR guidelines, LCR is defined as the ratio obtained by dividing the sum of the amounts of HQLA by the amount of net cash outflows, each as defined in and calculated pursuant to such guidelines. In accordance with the LCR standard under the LCR guidelines, the stock of unencumbered HQLA is to constitute “level 1” assets, which include cash, central bank reserves and certain marketable securities backed by sovereigns and central banks, and “Level 2” assets, which include certain government securities covered bonds, corporate debt securities and, to a limited extent, lower-rated corporate bonds, residential mortgage-backed securities and equities that meet certain conditions. “Level 2” assets are subject to certain haircuts based on types of securities and credit ratings. The minimum LCR under the LCR guidelines is 100% on both a consolidated and non-consolidated basis for banks with international operations or on a consolidated basis for bank holding companies with international operations. The BCBS issued final requirements for LCR-related disclosures on January 12, 2014, and the LCR disclosure guidelines of the Financial Services Agency, which reflect such requirements, have been applied to banks and bank holding companies with international operations from
48
June 30, 2015. The LCR disclosure guidelines require such banks and bank holding companies to disclose their LCR in common templates starting from information as of June 30, 2015.
The net stable funding ratio (“NSFR”) requires a minimum amount of stable sources of funding at a bank relative to the liquidity profiles of the assets, as well as the potential for contingent liquidity needs arising from
off-balance
sheet commitments, over a
one-year
horizon. The BCBS finalized the NSFR framework in October 2014. The Financial Services Agency has postponed the introduction of the NSFR as a minimum standard in Japan in light of the implementation status in other countries, but in March 2021, it published the amendments to the regulatory notices and guidelines pertaining to liquidity ratio requirements under which the NSFR will be introduced in Japan with effect from September 30, 2021. Under the NSFR guidelines, NSFR is defined as the ratio obtained by dividing the sum of the amounts of available stable funding by the amount of required stable funding, each as defined in and calculated pursuant to such guidelines. The minimum NSFR under the NSFR guidelines is 100% on both a consolidated and
non-consolidated
basis for banks with international operations or on a consolidated basis for bank holding companies with international operations. The BCBS issued final requirements for NSFR-related disclosures on June 22, 2015, and the NSFR disclosure guidelines of the Financial Services Agency, which reflect such requirements, will be applied to banks and bank holding companies with international operations from September 30, 2021. The NSFR disclosure guidelines require such banks and bank holding companies to disclose their NSFR in common templates starting from September 30, 2021.
Total Loss Absorbing Capacity
Related to regulatory capital requirements, in November 2015, the FSB issued the final TLAC standard for
G-SIBs.
The TLAC standard has been designed so that failing
G-SIBs
will have sufficient loss-absorbing and recapitalization capacity available in resolution for authorities to implement an orderly resolution.
G-SIBs
will be required to meet the TLAC requirement alongside the minimum regulatory requirements set out in the Basel III framework.
Following the publication of the final TLAC standards for
basis considering the actual condition of the relevant Covered SIB in crisis. To implement this SPE resolution strategy effectively, the Financial Services Agency requires the ultimate holding company in Japan of the relevant Covered SIB designated as the resolution entity in Japan of such Covered SIB by the Financial Services Agency to (i) meet the minimum external TLAC requirements, and (ii) cause their material subsidiaries or material
G-SIBs
by the FSB, in April 2016, the Financial Services Agency published an explanatory paper outlining its approach for the introduction of the TLAC framework in Japan, and a revised version of this document was published in April 2018. In March 2019, the Financial Services Agency published regulatory notices and related materials to implement the TLAC requirements in Japan, which is being phased in for (i) Japanese
G-SIBs
beginning March 31, 2019, and (ii) a financial group designated as a
D-SIB
by the Financial Services Agency which is deemed to be in particular need of a cross-border resolution arrangement and to be of particular systemic significance to the Japanese financial system in the event of its failure (together with Japanese
G-SIBs,
the “Covered SIBs”) beginning March 31, 2021. According to the Financial Services Agency’s approach above, which is subject to change based on future international discussions, the preferred resolution strategy for the Covered SIBs is SPE resolution, in which resolution tools are applied to the ultimate holding company of a group by a single national resolution authority, although the actual measures to be taken will be determined on a
case-by-case
sub-groups
that are designated as systemically important by the Financial Services Agency or that are subject to TLAC requirements or similar requirements by the relevant foreign authority to maintain a certain level of capital and debt recognized as having loss-absorbing and recapitalization capacity, or internal TLAC. Under the Japanese TLAC regulations, the Financial Services Agency designated Mizuho Financial Group as the resolution entity in Japan for our group, which is subject to the external TLAC requirements in Japan, and designated Mizuho Bank, Mizuho Trust & Banking and Mizuho Securities as Mizuho Financial Group’s material subsidiaries in Japan which are subject to Japan’s internal TLAC requirements. In addition, under the Japanese TLAC regulations,
G-SIBs
are required to meet a minimum TLAC requirement of at least 16% of the resolution group’s risk-weighted assets
49
from March 31, 2019 and at least 18% from March 31, 2022. Minimum TLAC must also be at least 6% of the Basel III leverage ratio denominator from March 31, 2019, and at least 6.75% from March 31, 2022. Japanese
G-SIBs
are allowed to count the Japanese Deposit Insurance Fund Reserves in an amount equivalent to 2.5% of their consolidated risk-weighted assets from March 31, 2019, and 3.5% of their consolidated risk-weighted assets from March 31, 2022, as their external TLAC.
Protection of Personal Information
The Personal Information Protection Act (Kojin Jouhou no Hogo ni kansuru Houritsu) (Act No. 57 of 2003, as amended) and related guidelines impose various requirements on businesses, including us, that use databases containing personal information, such as appropriate custody of such information and restrictions on information sharing with third parties.
Non-compliance
with the order issued by the Personal Information Protection Commission to take necessary measures to comply with the law will subject us to criminal and/or administrative sanctions.
Prevention of Money Laundering
Under the Act Preventing Transfer of Profits Generated from Crime (Hanzai ni yoru Syueki no Iten Boushi ni kansuru Houritsu) (Act No. 22 of 2007, as amended), which addresses money laundering and terrorism concerns, financial institutions and other entities such as credit card companies are required to perform customer identification, submit suspicious transaction reports and maintain records of transactions. Certain amendments to the law became effective in April 2013, which tightened, among other things, customer identification requirements. Further amendments to the law were promulgated in November 2014 and became effective on October 1, 2016 for clarification of the judgment method of suspicious transactions, strict verification at the time of the conclusion of correspondence contracts and expansion of the obligation for business operators to make efforts to develop necessary systems.
In February 2018, the Financial Services Agency issued “Guidelines for Anti-Money Laundering and Combating the Financing of Terrorism” to clarify the basic stance on risk management practices against money laundering and terrorists financing in order to encourage financial institutions to improve their regimes to effectively prevent money laundering and terrorists financing. The guidelines were partially revised on April 10, 2019 and February 19, 2021, intending to further enhance financial institutions’ risk management for anti-money laundering and combating the financing of terrorism.
Act Concerning Protection of Depositors from Illegal Withdrawals Made by Forged or Stolen Cards
The Act Concerning Protection of Depositors from Illegal Withdrawals Made by Forged or Stolen Cards (Gizou Kaado tou oyobi Tounan Kaado tou wo Mochiite Okonawareru Fuseina Kikaishiki Yochokin Haraimodoshi tou karano Yochokinsha no Hogo tou ni kansuru Houritsu) (Act No. 94 of 2005, as amended) requires financial institutions to establish internal systems to prevent illegal withdrawals of deposits using forged or stolen bank cards. The law also requires financial institutions, among other matters, to compensate depositors for any amount illegally withdrawn using forged bankcards, unless the financial institution can verify that it acted in good faith without negligence and that there was gross negligence on the part of the relevant account holder.
United States
As a result of our operations in the United States, we are subject to extensive U.S. federal and state supervision and regulation. We engage in U.S. banking activities through Mizuho Bank’s New York, Chicago, Los Angeles and 1251 Building (New York) branches and Houston, Atlanta, Dallas, San Francisco and Washington, D.C. representative offices. We also own one bank in the United States, Mizuho Bank (USA), which is engaged primarily in the banking services, trust services and custody business, and Mizuho Securities USA LLC, a U.S. broker dealer engaged in the securities business.
50
The Bank Secrecy Act, as amended by the USA PATRIOT Act of 2001 (the “PATRIOT Act”), contains measures to prevent, detect and prosecute terrorism and international money laundering by imposing significant compliance and due diligence obligations, creating new crimes and penalties and expanding the extraterritorial jurisdiction of the United States. The Bank Secrecy Act, as amended, imposes anti-money laundering compliance obligations on U.S. financial institutions, including the U.S. offices of foreign banks. In recent years, federal and state regulatory and law enforcement authorities have closely scrutinized the compliance by financial institutions with the Bank Secrecy Act and anti-money laundering rules.
Mizuho Financial Group, Mizuho Bank and Mizuho Americas are financial holding companies (“FHCs”) within the meaning of the U.S. Bank Holding Company Act of 1956, as amended (the “BHCA”), and are subject to regulation and supervision thereunder by the Federal Reserve. As a matter of law, these three companies are required to act as a source of financial strength to Mizuho Bank (USA). The BHCA generally prohibits us from acquiring, directly or indirectly, the ownership or control of more than 5% of any class of voting shares of any company engaged in the United States in activities other than banking or activities that are financial in nature or incidental or complementary to financial activity. This general prohibition is subject to certain exceptions, including an exception that permits us to acquire up to 100% of the voting interests in any company engaged in nonfinancial activities that we do not routinely manage, generally for a period of up to 10 years, under our merchant banking authority. In addition, U.S. regulatory approval is generally required for us to acquire more than 5% of any class of voting shares of a U.S. bank, savings association or bank holding company.
Mizuho Financial Group and the former Mizuho Corporate Bank, now Mizuho Bank, became FHCs in December 2006, and Mizuho Americas became an FHC in July 2016. As FHCs, we, Mizuho Bank, and Mizuho Americas and the companies under their control are permitted to engage in a broader range of activities in the U.S. and abroad than permitted for bank holding companies and their subsidiaries. For example, FHC status under the BHCA permits banking groups in the United States to engage in comprehensive investment banking businesses, such as the underwriting of and dealing in corporate bonds, equities and other types of securities, and therefore enables our group to promote our investment banking business on a broader basis in the United States. FHC status also permits banking groups in the United States to engage in merchant banking activities, as described above.
To retain our status as an FHC, we must also comply with certain additional regulatory requirements. For example, we and each of our U.S. insured depository institution subsidiaries with operations in the United States must be “well capitalized,” meaning maintenance of a common equity Tier 1 risk-based capital ratio of at least 6.5%, a Tier 1 risk-based capital ratio of at least 8%, a total risk-based capital ratio of at least 10% and a leverage ratio of at least 5%. We and each of our U.S. insured depository institution subsidiaries must also be “well managed,” including that we and they maintain examination ratings that are at least satisfactory. Further, Mizuho Financial Group and Mizuho Bank must also meet such capital standards as calculated under their home country standards (which must be comparable to the capital required for a U.S. bank) and must be well managed under standards comparable to those required for a U.S. bank. Failure to comply with such requirements would require us to prepare a remediation plan, and we would not be able to undertake new business activities or acquisitions based on our status as an FHC during any period of noncompliance without the prior approval of the Federal Reserve Board, and divestiture or termination of certain business activities, or termination of our U.S. branches and agencies, may be required as a consequence of failing to correct such conditions within 180 days.
U.S. branches, agencies and representative offices of foreign banks must be licensed, and are also supervised and regulated, by either a state banking authority or by the Office of the Comptroller of the Currency, the U.S. federal bank regulatory agency that charters and regulates national banks and federal branches and agencies of foreign banks. Each branch and representative office in the United States of Mizuho Bank is state-licensed. Under U.S. federal banking laws, state-licensed branches and agencies of foreign banks, as a general matter, may engage only in activities that would be permissible for their federally-licensed counterparts, unless the Federal Reserve Board determines that the additional activity is consistent with sound practices. U.S. federal banking laws also subject state-licensed branches and agencies to the same single-borrower lending limits that
51
apply to federal branches and agencies, which are substantially similar to the lending limits applicable to national banks, but are based on the capital of the entire foreign bank.
The New York branch of Mizuho Bank is subject to supervision, examination and regulation by the New York State Department of Financial Services (“NYDFS”) as well as by the Federal Reserve. Except for a prohibition on such branch accepting retail deposits, a state-licensed branch generally has the same powers as a state-chartered bank in such state. New York State has an asset pledge requirement for branches equal to the greater of 1% of average total liabilities for the previous month or $2 million, provided that an institution designated as a “well-rated foreign banking corporation” is permitted to maintain a reduced asset pledge with a cap of $100 million. The NYDFS may require higher amounts for supervisory reasons. Each other U.S. branch and representative office of Mizuho Bank is also subject to regulation and examination by the state banking authority of the state in which such branch or representative office is located. The deposits of Mizuho Bank’s U.S. branches are not insured by the Federal Deposit Insurance Corporation (“FDIC”).
Mizuho Bank (USA) is a New York state-chartered bank that is a member of the Federal Reserve System whose deposits are insured by the FDIC. As such, Mizuho Bank (USA) is subject to regulation, supervision and examination by the Federal Reserve and the NYDFS, as well as to relevant FDIC regulation.
In the United States, U.S.-registered broker-dealers are regulated by the U.S. Securities and Exchange Commission (the “SEC”). As a U.S.-registered broker-dealer, Mizuho Securities USA is subject to regulations that cover all aspects of the securities business, including sales methods, trade practices among broker-dealers, use and safekeeping of customers’ funds and securities, capital structure, recordkeeping, the financing of customers’ purchases and the conduct of directors, officers and employees.
In the United States, comprehensive financial regulatory reform legislation, titled the Dodd-Frank Wall Street Reform and Consumer Protection Act of 2010 (the “Dodd-Frank Act”), provides a broad framework for significant regulatory changes across most areas of U.S. financial regulation. Among other things, the Dodd-Frank Act addresses systemic risk oversight, minimum leverage and risk-based capital requirements for insured depository institutions and depository institution holding companies, and the resolution of failing systemically significant financial institutions.
The Dodd-Frank Act provides regulators with tools to impose greater capital, leverage and liquidity requirements and other prudential standards, particularly for financial institutions that pose significant systemic risk and bank holding companies with significant consolidated assets. In imposing such heightened prudential standards on foreign banking organizations such as Mizuho Bank, the Federal Reserve Board is directed to take into account the principle of national treatment and equality of competitive opportunity, and the extent to which the foreign banking organization is subject to comparable home country standards. In February 2014, the Federal Reserve Board finalized rules (the “FBO Rules”) under Regulation YY that impose enhanced prudential standards on certain large foreign banking organizations having a U.S. presence, such as Mizuho Bank. Under the FBO Rules, large foreign banking organizations, including us, and their U.S. operations are subject to risk management requirements, risk-based capital and leverage limits, capital stress testing requirements, liquidity requirements and, in certain circumstances, asset management requirements. Additionally, in August 2018, the Federal Reserve Board finalized single counterparty credit limits for large foreign banking organizations with respect to their U.S. operations. In addition, under the FBO Rules, foreign banking organizations with consolidated U.S. assets of $50 billion or more (excluding the assets of U.S. branches and agencies) are, as of July 1, 2016, required to establish or designate a separately capitalized
top-tier
U.S. intermediate holding company (“IHC”) that would hold all of its U.S. subsidiaries and be subject to certain capital, liquidity and other enhanced prudential standards on an IHC consolidated basis. In consideration of certain enhanced prudential requirements under the FBO Rules, we established a new U.S. bank holding company, Mizuho Americas, a wholly owned direct subsidiary of Mizuho Bank as of July 1, 2016. Mizuho Americas is currently the holding company for our U.S. bank subsidiary, Mizuho Bank (USA), our U.S. securities broker-dealer, Mizuho Securities USA LLC, and certain other of our U.S. subsidiaries. The establishment of Mizuho Americas was part of a larger
52
internal corporate reorganization, which was taken with the aim of, among other things, strengthening corporate governance practices and operations.
On May 24, 2018, the U.S. Economic Growth, Regulatory Relief and Consumer Protection Act (the “EGRRCPA”) was signed into law. Among other regulatory changes, the EGRRCPA raised the asset threshold for automatic application of enhanced prudential standards to banking organizations under the Dodd-Frank Act from $50 billion in total consolidated assets to $250 billion (which statutory threshold, in the case of foreign banking organizations (“FBOs”) is measured on the basis of total global consolidated assets). The EGRRCPA exempted banking organizations with total consolidated assets of less than $100 billion from these enhanced prudential standards effective immediately upon enactment of the bill, but granted the Federal Reserve the discretionary authority, after the asset threshold increase became effective, to apply any enhanced prudential standards to any banking organization with between $100 billion and $250 billion in total consolidated assets that would otherwise be exempt under the legislation.
In October 2019, the Federal Reserve Board finalized a rule to implement the EGRRCPA’s changes to the application of enhanced prudential standards for large U.S. banking organizations and FBOs (the “Tailoring Rule”). The Tailoring Rule delineates three categories, Category II, Category III and Category IV, of enhanced prudential standards applicable to FBOs based on an FBO’s asset size and other factors such as the degree of the cross-jurisdictional activity, reliance on short-term wholesale funding, nonbank assets, and
off-balance
sheet exposures of an FBO’s U.S. operations. The Tailoring Rule generally determines the stringency of enhanced prudential standards applicable to FBOs based on the risk profile of the FBO’s U.S. operations, rather than its global footprint, with most enhanced prudential standards applying only to FBOs with combined U.S. assets of at least $100 billion. FBOs with global assets of $100 billion or more and relatively limited U.S. presence will be subject to certain minimum standards, with the Federal Reserve Board relying primarily on compliance with comparable home-country prudential standards with respect to such FBOs.
We are subject to enhanced prudential standards tailored by the Tailoring Rule.
Also in October 2019, the Federal Reserve Board and the FDIC finalized a rule (the “Resolution Planning Rule”) that modifies resolution plan requirements according to the EGRRCPA. The Resolution Planning Rule tailors those requirements based on the category as determined by the Tailoring Rule.
Under Section 13 of the Bank Holding Company Act, as amended by the EGRRCPA, also known as the “Volcker Rule,” any insured depository institution (subject to certain exceptions including for depository institutions that do not have, and are not controlled by a company that has, more than $10 billion in total consolidated assets and significant trading assets and liabilities), any company that controls such an institution, any
non-U.S.
bank with branches in the United States, such as Mizuho Bank, and any affiliate or subsidiary of such entities (each, a “banking entity”) is prohibited from engaging in proprietary trading or from investing in or sponsoring private equity or hedge funds, subject to certain limited exceptions. In July 2019, U.S. federal regulatory agencies adopted amendments to the Volcker Rule regulations to implement the Volcker Rule amendments included in the EGRRCPA, and also in 2019 such U.S. federal regulatory agencies adopted certain targeted amendments to the Volcker Rule regulations to simplify and tailor certain compliance requirements relating to the Volcker Rule. In June 2020, U.S. federal regulatory agencies adopted additional revisions to the Volcker Rule’s restrictions on banking entities sponsoring and investing in certain covered hedge funds and private equity funds, including by proposing new exemptions allowing banking entities to sponsor and invest without limit in credit funds, venture capital funds, customer facilitation funds and family wealth management vehicles (the “Covered Fund Amendments”). The Covered Fund Amendments also loosen certain other restrictions on extraterritorial fund activities and direct parallel or
co-investments
made alongside covered funds.
The current regulatory environment in the United States may be impacted by future legislative developments, such as amendments to key provisions of the Dodd-Frank Act. For example, on May 24, 2018, the U.S. Economic Growth, Regulatory Relief and Consumer Protection Act (the “EGRRCPA”) was signed into law.
53
Among other regulatory changes, the EGRRCPA amends various sections of the Dodd-Frank Act, including by modifying the Volcker Rule to exempt depository institutions that do not have, and are not controlled by a company that has, more than $10 billion in total consolidated assets or significant trading assets and liabilities, and by raising the threshold for automatic application of enhanced prudential standards to FBOs under the Dodd-Frank Act. In addition, the current regulatory environment in the United States may be impacted by changes in U.S. executive administration or Congressional leadership. The scope of any additional future legislation or regulatory developments is not possible to determine at this time, and we cannot predict what impact, if any, such future legislative or regulatory developments will have on us if and when such legislation or regulations is enacted or adopted, as applicable.
Cybersecurity and privacy developments in Europe and the U.S.
The European Union General Data Protection Regulation (“GDPR”) replaced the existing E.U. Data Protection Directive and, as a regulation, took effect in all EU member states from May 25, 2018. Although a number of the existing principles for the protection of personal data remains, the GDPR is designed to harmonize data privacy laws across Europe and reshape the way organizations approach data privacy. The GDPR introduced new obligations and expanded its territorial reach. It applies to all organizations processing or holding personal data of EU ‘data subjects’ (regardless of the organization’s location) as well as to organizations outside the EU that offer goods or services in the EU, or that monitor the behavior of EU data subjects. Personal data is information that can be used to identify a natural person, including a name, a photo, an email address, or a computer IP address. Compliance with the GDPR requires companies to analyze and evaluate how they handle data in the ordinary course of their business, from processes to technology. It imposes a prescriptive approach to compliance requiring organizations to demonstrate and record compliance and to provide much more detailed information to data subjects regarding processing. EU data subjects need to be given full disclosure about how their personal data is used and stored. In that connection, consent must be explicit and companies must be in a position to delete information from their global systems permanently if consent were withdrawn. Financial regulators and data protection authorities throughout the EU have significantly increased audit and investigatory powers under GDPR to probe how personal data is being used and processed. Penalties for
non-compliance
are material. Serious breaches of GDPR may result in antitrust-like fines on companies of up to the greater of €20 million or 4% of global group turnover in the preceding year, regulatory action and reputational risk.
In the United States, federal and state regulators, including the Financial Industry Regulatory Authority (“FINRA”) and the NYDFS, have increasingly focused on cybersecurity risks and responses for regulated entities. For example, on March 1, 2017, the revised NYDFS cybersecurity regulation became effective. The regulation applies to any person licensed or chartered by the NYDFS, including New York state-chartered banks and NYDFS-licensed branches of
non-U.S.
banks such as Mizuho Bank (USA) and the New York branch of Mizuho Bank, and requires each company to assess its specific risk profile periodically and design a program that addresses its risks “in a robust fashion,” including addressing risks posed by third-party service providers, training and retention of specialized staff to address cybersecurity risks, maintaining systems designed to reconstruct material financial transactions and complying with security requirements for
non-public
information. Each covered entity must monitor its systems and networks and notify the superintendent of the NYDFS within 72 hours after it is determined that a material cybersecurity event has occurred. Senior management of the covered entity has been required to file an annual certification confirming compliance with the NYDFS regulations since February 15, 2018. Similarly, FINRA has identified cybersecurity as a significant risk and assesses firms’ programs to mitigate those risks.
Disclosure Pursuant to Section 219 of the Iran Threat Reduction and Syria Human Rights Act
Section 219 of the Iran Threat Reduction and Syria Human Rights Act of 2012 (“Section 219”) added Section 13(r) to the U.S. Securities Exchange Act of 1934, requiring each SEC reporting issuer to disclose in its annual and, if applicable, quarterly reports whether it or any of its affiliates have knowingly engaged in specified activities, transactions or dealings relating to Iran or with the Government of Iran or certain designated persons or
54
entities involved in terrorism or the proliferation of weapons of mass destruction during the period covered by such filing. Section 219 requires disclosure even of certain activities not prohibited by U.S. or other law and even if such activities were conducted outside the United States by
non-U.S.
affiliates in compliance with local law.
Our affiliate Mizuho Bank is our only affiliate to have engaged in activity that is relevant for this purpose. Mizuho Bank maintains compliance policies and procedures to conform its operations to all applicable economic sanctions laws and regulations, and is increasing resources dedicated to this effort. In that context, and only after confirming that such transactions do not involve prohibited or sanctionable activity under U.S. or other economic sanctions,
non-U.S.
branches of Mizuho Bank engage in a limited number of activities reportable under Section 219.
No branches of Mizuho Bank were involved in any of these activities in the fiscal year ended March 31, 2021.
Activities through correspondent banking accounts
In the fiscal year ended March 31, 2021, Mizuho Bank continued to maintain accounts for Iranian banks related to the Government of Iran and a bank designated under E.O. 13224, but conducted no funds transfers through these accounts or through other correspondent banking accounts on behalf of such Iranian banks. Mizuho Bank has policies and procedures to process transfers through these accounts only after confirming that such transactions do not involve prohibited or sanctionable activity under U.S. or other economic sanctions and obtaining licenses issued by Japan’s Ministry of Finance where necessary. Mizuho Bank will process transfers through these accounts only under the limited circumstances where Mizuho Bank believes the transfer would conform to its compliance policies and procedures, applicable international sanctions laws, and after obtaining a license issued by Japan’s Ministry of Finance where necessary.
Other Jurisdictions
Our operations elsewhere in the world are subject to regulation and control by local supervisory authorities, including local central banks.
55
The following diagram shows our basic corporate structure as of March 31, 2021:
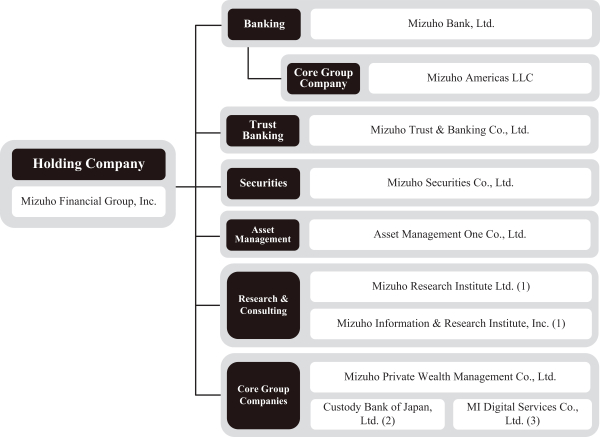
Notes:
| (1) |
Mizuho Information & Research Institute, and Mizuho Research Institute merged as of April 1, 2021, and changed the trade name of the merged entity to “Mizuho Research & Technologies, Ltd.”
|
| (2) |
Custody Bank of Japan, in which we have a 27.0% equity interest, is an equity-method affiliate of ours.
|
| (3) |
MI Digital Services, in which we have a 35.0% equity interest, is an equity-method affiliate of ours.
|
56
The following table sets forth information with respect to our principal consolidated subsidiaries as of March 31, 2021:
|
Name
|
Country of
organization
|
Main business
|
Proportion of
ownership
interest
(%)
|
Proportion of
voting
interest
(%)
|
||||
|
Domestic
|
||||||||
|
Mizuho Bank, Ltd
|
Japan | Banking | 100.0% | 100.0% | ||||
|
Mizuho Trust & Banking Co., Ltd.
|
Japan | Trust and banking | 100.0% | 100.0% | ||||
|
Mizuho Securities Co., Ltd.
|
Japan | Securities | 95.8% | 95.8% | ||||
|
Mizuho Research Institute Ltd
|
Japan | Research and consulting | 100.0% | 100.0% | ||||
|
Mizuho Information & Research Institute, Inc
|
Japan |
Information technology
|
100.0% | 100.0% | ||||
|
Asset Management One Co., Ltd.
|
Japan | Investment management | 70.0% | 51.0% | ||||
|
Mizuho Private Wealth Management Co., Ltd
|
Japan |
Consulting
|
100.0% | 100.0% | ||||
|
Mizuho Credit Guarantee Co., Ltd.
|
Japan | Credit guarantee | 100.0% | 100.0% | ||||
|
Mizuho Factors, Limited
|
Japan | Factoring | 100.0% | 100.0% | ||||
|
UC Card Co., Ltd.
|
Japan | Credit card | 100.0% | 100.0% | ||||
|
Mizuho Realty One Co., Ltd.
|
Japan |
Holding company
|
100.0% | 100.0% | ||||
|
Mizuho Business Service Co., Ltd.
|
Japan |
Subcontracted operations
|
100.0% | 100.0% | ||||
|
Mizuho Realty Co., Ltd.
|
Japan |
Real estate agency
|
99.8% | 95.1% | ||||
|
Defined Contribution Plan Services Co., Ltd
|
Japan
|
Pension plan-related business
|
60.0%
|
60.0%
|
||||
|
Mizuho-DL
Financial Technology Co., Ltd
|
Japan
|
Application and Sophistication of Financial Technology
|
60.0%
|
60.0%
|
||||
|
J.Score Co., Ltd.
|
Japan | Lending | 50.0% | 50.0% | ||||
|
Mizuho Capital Co., Ltd.
|
Japan |
Venture capital
|
50.0% | 50.0% | ||||
|
Overseas
|
||||||||
|
Mizuho Americas LLC
|
USA |
Holding company
|
100.0% | 100.0% | ||||
|
Mizuho Bank (China), Ltd
|
China |
Banking
|
100.0% | 100.0% | ||||
|
Mizuho International plc
|
UK |
Securities and banking
|
100.0% | 100.0% | ||||
|
Mizuho Capital Markets LLC
|
USA |
Derivatives
|
100.0% | 100.0% | ||||
|
Mizuho Securities Asia Limited
|
China |
Securities
|
100.0% | 100.0% | ||||
|
Mizuho Securities USA LLC
|
USA |
Securities
|
100.0% | 100.0% | ||||
|
Mizuho Bank Europe N.V.
|
Netherlands |
Banking and securities
|
100.0% | 100.0% | ||||
|
Banco Mizuho do Brasil S.A.
|
Brazil |
Banking
|
100.0% | 100.0% | ||||
|
Mizuho Trust & Banking (Luxembourg) S.A.
|
Luxembourg |
Trust and banking
|
100.0% | 100.0% | ||||
|
Mizuho Bank (USA)
|
USA |
Banking and trust
|
100.0% | 100.0% | ||||
|
Mizuho Securities Europe GmbH
|
Germany |
Securities
|
100.0% | 100.0% | ||||
|
PT. Bank Mizuho Indonesia
|
Indonesia |
Banking
|
99.0% | 99.0% | ||||
Note:
| (1) |
Mizuho Information & Research Institute, and Mizuho Research Institute merged as of April 1, 2021, and changed the trade name of the merged entity to “Mizuho Research & Technologies, Ltd.”
|
57
4.D. Property, Plant and Equipment
The following table shows the breakdown of our premises and equipment at cost as of March 31, 2020 and 2021:
|
As of March 31,
|
||||||||
|
2020
|
2021
|
|||||||
|
(in millions of yen)
|
||||||||
|
Land
|
¥ | 557,943 | ¥ | 569,337 | ||||
|
Buildings
|
657,774 | 737,144 | ||||||
|
Equipment and furniture
|
442,302 | 414,201 | ||||||
|
Leasehold improvements
|
228,383 | 222,296 | ||||||
|
Construction in progress
|
73,164 | 23,441 | ||||||
|
Software
|
1,359,120 | 1,372,364 | ||||||
|
|
|
|
|
|||||
|
Total
|
3,318,686 | 3,338,783 | ||||||
|
Less: Accumulated depreciation and amortization
|
1,462,438 | 1,527,325 | ||||||
|
|
|
|
|
|||||
|
Premises and equipment—net
|
¥ | 1,856,248 | ¥ | 1,811,458 | ||||
|
|
|
|
|
|||||
Our head office is located at
Otemachi,
1-5-5
Chiyoda-ku,
Tokyo, Japan. The headquarter building is leased from a third party.
The total area of land related to our material office and other properties as of March 31, 2021 was approximately 605,000 square meters for owned land and approximately 12,000 square meters for leased land.
Our owned land and buildings are primarily used by our branches. Most of the buildings and land owned by us are free from material encumbrances.
|
ITEM 4A.
|
UNRESOLVED STAFF COMMENTS
|
None.
58
ITEM 5. OPERATING AND FINANCIAL REVIEW AND PROSPECTS
The following discussion and analysis should be read in conjunction with “Item 3.A. Key Information—Selected Financial Data,” “Selected Statistical Data” and our consolidated financial statements, including the notes thereto, included elsewhere in this annual report.
Table of Contents for Item 5.
|
Page
|
||||
| 59 | ||||
| 65 | ||||
| 68 | ||||
| 74 | ||||
| 78 | ||||
| 80 | ||||
| 93 | ||||
| 95 | ||||
| 100 | ||||
| 102 | ||||
| 102 | ||||
| 103 | ||||
Overview
The Mizuho Group
We provide a broad range of financial services in domestic and overseas markets. Our principal activities and subsidiaries are the following:
| • |
Mizuho Bank provides a wide range of financial products and services mainly in relation to deposits, lending and exchange settlement to individuals, small and
medium-sized
enterprises (“SMEs”), large corporations, financial institutions, public sector entities and foreign corporations, including foreign subsidiaries of Japanese corporations;
|
| • |
Mizuho Trust & Banking provides products and services related to trust, real estate, securitization and structured finance, pension and asset management and stock transfer agency; and
|
| • |
Mizuho Securities provides full-line securities services to individuals, corporations, financial institutions and public sector entities.
|
We also provide products and services such as those related to trust and custody, asset management, private banking, research services, information technology-related services and advisory services for financial institutions through various subsidiaries and affiliates.
For a further discussion of our business and group organization, see “Item 4.B. Information on the Company—Business Overview.”
Principal Sources of Income and Expenses
Net Interest Income
Net interest income arises principally from the lending and deposit-taking and securities investment activities of our banking subsidiaries and is a function of:
| • |
the amount of interest-earning assets and interest-bearing liabilities;
|
59
| • |
the average interest rate spread (the difference between the average yield of interest earned on interest-earning assets and the average rate of interest paid on interest-bearing liabilities); and
|
| • |
the general level of interest rates.
|
Principal items constituting interest-earning assets include loans, investments, trading account assets, receivables under resale agreements and receivables under securities borrowing transactions. Principal items constituting interest-bearing liabilities include deposits, trading account liabilities, short-term borrowings (such as payables under repurchase agreements and payables under securities lending transactions) and long-term debt.
Provision (Credit) for Credit Losses
Provision (credit) for credit losses is charged against (or credited to) income mainly to keep the allowance for credit losses on loans at a level that is appropriate to estimate the net amount expected to be collected from the financial asset, inclusive of loans. For a description of the approach and methodology used to establish the allowance for credit losses on loans, see “—Financial Condition—Allowance for Credit Losses on Loans.”
Noninterest Income
Noninterest income consists mainly of fee and commission, investment gains (losses)—net, trading account gains (losses)—net and foreign exchange gains (losses)—net.
Fee and commission include the following:
| • |
fee and commission from securities-related business, including brokerage fee and commission related to the execution of customer transactions and sales commission of investment trusts and asset-based revenue, which mainly include fees received from investment trust management companies in return for administration services, such as record keeping services, of investment trusts;
|
| • |
fee and commission from deposits, including fees related to deposits such as account transfer charges;
|
| • |
fee and commission from lending business, including fees related to the arrangement of syndicated loans and other financing transactions such as arrangement fees related to management
buy-out
transactions;
|
| • |
fee and commission from remittance business, including service charges for domestic and international funds transfers and collections;
|
| • |
fee and commission from asset management business, including investment trust management fees and investment advisory fees for investment trusts;
|
| • |
fee and commission from trust-related business, including trust fees earned primarily through fiduciary asset management and administration service for corporate pension plans and investment funds and other trust-related fees such as brokerage commissions of real estate property, sales commissions of beneficial interest in real estate trust and charges for stock transfer agent services;
|
| • |
fee and commission from agency business, including administration service fees related to our agency business such as Japan’s principal public lottery program and revenue from standing proxy services; and
|
| • |
fees for other customer services, including various revenues such as guarantee fees, sales commissions of life insurance, service charges for electronic banking, financial advisory fees and service charges for software development.
|
Investment gains (losses)—net primarily include net gains and losses on sales of marketable securities, such as equity and bond investments. In addition, impairment losses are recognized when management concludes that declines in the fair value of investments are other-than-temporary.
Trading account gains (losses)—net include gains and losses from transactions undertaken for trading purposes, including both market making for customers and proprietary trading, or transactions through which we
60
seek to capture gains arising from short-term changes in market value. Trading account gains (losses)—net also include gains and losses related to changes in the fair value of derivatives and other financial instruments not eligible for hedge accounting under U.S. GAAP that are utilized to offset mainly interest rate risk related to our various assets and liabilities, as well as gains and losses related to changes in the fair value of foreign currency-denominated debt securities reported as Trading securities.
Foreign exchange gains (losses)—net mainly include translation gains and losses related to our foreign currency-denominated assets and liabilities and gains and losses related to foreign exchange trading activities, including market making for customers and proprietary trading.
Noninterest Expenses
Noninterest expenses primarily include salaries and employee benefits, general and administrative expenses, occupancy expenses and fee and commission expenses.
Salaries and employee benefits include expenses incurred for salaries, bonuses and compensation to directors and employees. They also include expenses related to pension and other employee retirement benefit plans.
The principal items included in general and administrative expenses are amortization of software, tax expenses such as consumption tax and property tax that are not income taxes and other expenses, including premiums for deposit insurance.
The principal items included in occupancy expenses are expenses related to premises and equipment, including depreciation, losses on disposal and lease expenses.
The principal items included in fee and commission expenses are fee and commission expenses for remittance services, which mainly include commission expenses paid in connection with remittance transactions and the securities-related businesses, which mainly include transactions costs such as brokerage fees paid.
Operating Environment
We operate principally in Japan, and our performance has generally tracked the macro economy of Japan.
As to the recent economic environment, the global economy has continued to recover after falling sharply due to the worldwide spread of
COVID-19.
However, the spread of variants of
COVID-19
in some regions, including in Japan, has been recently inhibiting recovery.
In Japan, the economy recovered to an extent in the second calendar half of 2020, mainly through consumption and exports, after falling sharply due to the plummet caused by the restrictions on economic activities following the spread of
COVID-19.
However, the recent resurgence of
COVID-19
and related restrictions resulted in an economic decline for the first calendar quarter of 2021 and have been casting a shadow on the recovery. Although the rise in the rate of unemployment and the number of corporate bankruptcies have been restrained because of policy measures taken by the Japanese government and the Bank of Japan, the slump in service-related consumption has been a weight on the economic recovery.
In the United States, the rate of unemployment rose rapidly due to the spread of
COVID-19,
but the employment environment has been improving as economic activity has resumed. The Federal Open Market Committee (“FOMC”) has been supporting the economy by indicating that it will continue monetary easing and additional large-scale economic stimulus measures have been also expected to boost the economy. Furthermore, progress in the vaccination rollout and other efforts has slowed down the spread of new infections. However, the number of new infections still remains high and the future of the economy remains uncertain, including due to recent data indicating a potential rise in inflation.
61
In Europe, stringent lockdown measures caused a sharp contraction in consumption and production activities, but the economic downturn seems to have bottomed out with the resumption of economic activities. In addition, as negotiations for a free trade agreement between the United Kingdom and the European Union concluded, the negative impact of Brexit on the economy has been expected to be limited. However, as economic activity has remained stagnant due to the resurgence of
COVID-19
and the subsequent resumption of lockdowns, there have been concerns about the future of the economy.
In Asia, the Chinese economy has continued to recover led by infrastructure investment and also experienced a recovery in private demand with rising consumer spending led by improvements in employment and income. However, considering its ongoing conflicts with the United States, there has remained a high degree of uncertainty with respect to China’s trade and other issues.
In emerging countries, some countries have been experiencing additional pressure on their economies due to resurgence of
COVID-19.
Even in countries that have brought
COVID-19
under control, there has remained adverse economic impact on countries highly dependent on natural resources and tourism and countries that have little capacity for fiscal stimulus or high levels of public debt.
As for the future outlook of the global economy, it is expected to recover gradually, supported by the increasing availability of vaccines, monetary easing and fiscal stimulus measures by governments around the world. However, if vaccination rollout does not proceed as smoothly as expected, there are concerns that the constraints on economic activities will continue and demand will further shrink due to worsening employment and income. As for the Japanese economy, there is a possibility that the economic slump will continue for a long period, with a large cumulative negative impact.
Key indicators of Japanese economic conditions in recent periods include the following:
| • |
Japan’s real gross domestic product on a
year-on-year
year-on-year
|
| • |
In September 2016, the Bank of Japan decided to introduce “quantitative and qualitative monetary easing with yield curve control” by strengthening its two previous policy frameworks, namely “quantitative and qualitative monetary easing (“QQE”)” and “QQE with a negative interest rate,” aiming that the observed consumer price index exceeds the price stability target of 2% and stays above the target in a stable manner. Under the new policy framework, the Bank of Japan decided to set the guideline for market operations under which, regarding short-term interest rates, the Bank of Japan will apply a negative interest rate of minus 0.1% to certain excess balances in current accounts held by financial institutions at the Bank of Japan, while for long-term interest rates, it would purchase Japanese government bonds to control long-term interest rates so that the yield of
10-year
Japanese government bonds will remain at around 0%.
|
In July 2018, the Bank of Japan decided to strengthen its commitment to achieving its price stability target by introducing forward guidance for policy rates, and to enhance the sustainability of “quantitative and qualitative monetary easing with yield curve control,” stating that the yield of 10 year Japanese government bonds could move upward and downward from around 0% to some extent mainly depending on developments in economic activity and prices. In October 2019, the Bank of Japan decided on a new forward guidance for policy rates, in respect of which, the Bank of Japan stated its expectation that short-term and long-term interest rates will remain at their present or lower levels as long as it is necessary to pay close attention to the possibility that the momentum toward achieving the price stability target will be lost.
62
In March 2020, in light of the impact of the spread of
COVID-19,
the Bank of Japan judged it appropriate to enhance monetary easing through (1) the further ample supply of funds by conducting various operations including purchases of Japanese government bonds and the U.S. dollar funds-supplying operations, (2) measures to facilitate corporate financing including the introduction of the “special funds-supplying operations to facilitate corporate financing regarding the novel coronavirus
(COVID-19)”
and (3) active purchases of exchange-traded funds and Japan real estate investment trusts.
Furthermore, in April 2020, the Bank of Japan judged it appropriate to enhance monetary easing through (1) an increase in purchases of commercial paper and corporate bonds, (2) strengthening of the “special funds-supplying operations to facilitate corporate financing regarding the novel coronavirus
(COVID-19)”
and (3) further active purchases of Japanese government bonds and treasury discount bills.
| • |
The yields on newly issued
10-year
Japanese government bonds, which is a key long-term interest rate indicator, were minus 0.081%, 0.022% and 0.095% as of March 29, 2019, March 31, 2020 and March 31, 2021, respectively. The yield fluctuated between minus 0.038% and 0.162% during the fiscal year ended March 31, 2021. Thereafter, the yield decreased to 0.087% as of May 31, 2021.
|
| • |
According to Teikoku Databank, a Japanese research institution, there were 8,057 corporate bankruptcies in the fiscal year ended March 31, 2019, involving approximately ¥1.6 trillion in total liabilities, 8,480 corporate bankruptcies in the fiscal year ended March 31, 2020, involving approximately ¥1.2 trillion in total liabilities, and 7,314 corporate bankruptcies in the fiscal year ended March 31, 2021, involving approximately ¥1.2 trillion in total liabilities. The number of corporate bankruptcies showed a decrease from the previous fiscal year for the first time in two years. The amount of total liabilities for the fiscal year ended March 31, 2021 was slightly decreased by 0.1% from those for the previous fiscal year.
|
| • |
The Nikkei Stock Average, which is an average of the price of 225 stocks listed on the Tokyo Stock Exchange, decreased by 1.2% to ¥21,205.81 during the fiscal year ended March 31, 2019, followed by a 10.8% decrease to ¥18,917.01 during the fiscal year ended March 31, 2020 and a 54.2% increase to ¥29,178.80 during the fiscal year ended March 31, 2021. Thereafter, the Nikkei Stock Average decreased to ¥28,860.08 as of May 31, 2021.
|
| • |
The yen to U.S. dollar spot exchange rate, according to the Bank of Japan, was ¥110.75 to $1.00 as of March 29, 2019, ¥108.42 to $1.00 as of March 31, 2020 and ¥110.74 to $1.00 as of March 31, 2021. The rate fluctuated between ¥102.75 and ¥110.74 to $1.00 during the fiscal year ended March 31, 2021. Thereafter, the yen strengthened to ¥109.72 to $1.00 as of May 31, 2021.
|
| • |
According to the Ministry of Land, Infrastructure, Transport and Tourism of Japan, housing starts in Japan increased by 0.7% in the fiscal year ended March 31, 2019 and decreased by 7.3% and 8.1% in the fiscal years ended March 31, 2020 and 2021, respectively.
|
| • |
According to the Ministry of Land, Infrastructure, Transport and Tourism of Japan, the average published housing land prices in Japan increased by 0.6% and 0.8% in calendar years 2018 and 2019, respectively, and decreased by 0.4% in calendar year 2020.
|
Capital Improvements
All yen figures and percentages in this subsection are truncated.
We implemented disciplined capital management for the fiscal year ended March 31, 2021 by pursuing the optimal balance between strengthening of stable capital base and steady returns to shareholders as described below.
63
Strengthening of Stable Capital Base
In the fiscal year ended March 31, 2021, we strengthened our capital base mainly as a result of earning ¥471.0 billion of profit attributable to owners of parent (under Japanese GAAP).
With respect to redemptions of previously issued securities, we redeemed various securities that are eligible regulatory capital instruments under Basel III upon their respective initial optional redemption dates or their respective maturity dates. As for Additional Tier 1 capital, in December 2020, we redeemed ¥300.0 billion of unsecured perpetual subordinated bonds with an optional redemption clause and a write-down clause issued to qualified institutional investors in Japan by Mizuho Financial Group in July 2015. As for Tier 2 capital, in June 2020, we redeemed ¥10.0 billion of unsecured fixed-term subordinated bonds with an optional redemption clause and a write-down clause issued by Mizuho Financial Group in June 2015. In August 2020 and December 2020, we redeemed ¥10.0 billion and ¥10.0 billion of unsecured fixed-term subordinated bonds compliant to Basel II and subject to
phase-out
arrangements under Basel III issued by Mizuho Bank in August 2005 and by Mizuho Trust and Banking in December 2005, respectively.
Meanwhile, as for new issuances of Additional Tier 1 capital, in July 2020 and December 2020, we issued ¥207.0 billion and ¥131.0 billion, respectively, of unsecured perpetual subordinated bonds with an optional redemption clause and a write-down clause through public offerings to wholesale investors in Japan. With respect to new issuances of Tier 2 capital, in June 2020 and October 2020, we issued ¥80.0 billion and ¥137.0 billion of unsecured fixed-term subordinated bonds with a write-down clause through public offerings to wholesale and retail investors in Japan, respectively.
Our Common Equity Tier 1 capital ratio under Basel III was 11.65% and 11.63% as of March 31, 2020 and 2021, respectively.
Steady Returns to Shareholders
Annual cash dividends for the fiscal year ended March 31, 2021 were ¥75 per share of common stock (including interim dividend payments of ¥37.5 per share, which reflected the impact from the share consolidation of the shares of common stock on the basis of one post-consolidation share per ten
pre-consolidation
shares effective as of October 1, 2020), which was substantially the same amount as the previous fiscal year.
New Capital Management and Shareholder Return Policy
In response to the development of our capital accumulation, we changed our approach with regard to capital management and decided to pursue the optimum balance between capital adequacy, growth investment and enhancement of shareholder return. Our new shareholder return policy is progressive dividends being our principal approach while executing flexible and intermittent share buybacks. As for the dividends, we will decide them based on the steady growth of our stable earnings base, taking 40% of the dividend payout ratio as a guide into consideration. As for share buybacks, we will determine them considering our business results and capital adequacy, our stock price and the opportunities for growth investment.
Business Trends
See “Item 4.B. Information on the Company—Business Overview,” “Item 5. Operating and Financial Review and Prospects—Operating Results” and “Item 5. Operating and Financial Review and Prospects—Financial Condition.”
64
Others
Integration of three of our consolidated subsidiaries
In May 2020, we decided to integrate three consolidated subsidiaries of Mizuho Financial Group, Mizuho Information &Research Institute, Inc. (“MHIR”), Mizuho Research Institute Ltd. (“MHRI”) and Mizuho Trust Systems Company, Limited (“MHTS”) with MHIR as the surviving entity. Based on this decision, MHIR and MHTS executed a merger agreement with MHIR as the surviving entity in November 2020, and the two entities merged in January 2021. In February 2021, MHIR and MHRI executed a merger agreement, and the two entities were integrated and became a new company, Mizuho Research & Technologies Corporation (“MHRT”), in April 2021. The purpose of the integration is to significantly improve the ability of the Mizuho group to provide “New value beyond the conventional boundaries of finance” by organically combining and amalgamating each company’s research, consulting, and IT development capabilities.
Disposing of Our Cross-shareholdings
Reflecting the potential impact on our financial position associated with the risk of stock price fluctuation, as a basic policy, unless we consider holdings to be meaningful, we will not hold the shares of other companies as cross-shareholdings. Even though we consider the holdings to be meaningful, we will also endeavor to reduce them through dialogue with the issuing companies. We promote cross-shareholdings disposal through initiatives to enhance capital efficiency by implementing
in-house
company return on equity as an internal performance indicator. Under Japanese GAAP on an acquisition cost basis, our total Japanese stock portfolio (included within other securities which have readily determinable fair value) as of March 31, 2019 was ¥1,419.8 billion, and we have reduced such amount by ¥252.1 billion as of March 31, 2021.
Critical Accounting Estimates
Note 1 to our consolidated financial statements included elsewhere in this annual report contains a summary of our significant accounting policies. These accounting policies are essential to understanding our financial condition and results of operations. Certain of these accounting policies require management to make critical accounting estimates that involve complex and subjective judgments and the use of assumptions, some of which may be for matters that are inherently uncertain and susceptible to change. Such critical accounting estimates are based on information available to us as of the date of the financial statements and could change from period to period. Critical accounting estimates could also involve estimates for which management could have reasonably used another estimate for the relevant accounting period. The use of different estimates could have a material impact on our financial condition and results of operations. The following is a discussion of significant accounting policies for which critical accounting estimates are used.
Allowance for Credit Losses
On April 1, 2020, we adopted ASC 326, “Financial Instruments—Credit Losses” (“ASC 326”). The adoption of this guidance established a single allowance framework for all financial assets measured at amortized cost and certain
off-balance-sheet
instrument exposures. This framework requires management’s estimate to reflect credit losses over the instrument’s remaining expected lives and consider expected future changes in macroeconomic conditions.
We maintain an appropriate allowance for credit losses to represent management’s estimate of the expected credit losses in our financial assets measured at amortized cost and certain
off-balance
sheet instruments. The management evaluates the appropriateness of the allowance for credit losses semi-annually. The allowance considers expected credit losses over the remaining expected lives of the applicable instruments. The expected life of each instrument is determined by considering expected prepayments, contractual terms and cancellation features.
65
When determining expected credit losses, a single forward-looking macroeconomic scenario is considered over a reasonable and supportable forecast period. This forward-looking macroeconomic scenario is consistent to what is used in our stress testing and is in line with the scenario used for our business plan. If the scenario does not reflect a sudden change in economic conditions adequately, it could be possible to make adjustments to the scenario. After the forecast period, we revert to long-term historical loss experience with a certain graduated transition period, to estimate losses over the remaining lives of financial assets measured at amortized cost and certain
off-balance-sheet
instruments. The macroeconomic scenario is updated at least semi-annually and is reviewed accordingly to reflect current economic conditions and our expectation of future conditions on a timely basis. For April 1, 2020 and March 31, 2021, we used the most recent macroeconomic scenario available during our credit loss estimation process.
In terms of the internal risk ratings, for the corporate portfolio segment, the credit quality review process and the credit rating process serve as the basis for determining the allowance for credit losses on loans. Through such processes loans are categorized into groups to reflect the probability of default, whereby our management assesses the ability of borrowers to service their debt, taking into consideration current financial information, ability to generate cash, historical payment experience, analysis of relevant industry segments and current trends. For the retail portfolio segment, the different categories of past due status of loans are primarily utilized in the credit quality review and the credit rating processes as the basis for determining the allowance for credit losses on loans.
Our methodology for determining the appropriate allowance for credit losses on loans also considers the imprecision inherent in the methodologies used. As a result, the amounts determined under the methodologies described above could be adjusted by management to consider the potential impact of other qualitative factors which include, but are not limited to, imprecision in macroeconomic scenario assumptions and emerging risks related to changes in the environment that are affecting specific portfolio segments. Considering internal and external factors affecting the credit quality of the portfolio, we incorporated the estimated impact of the
COVID-19
pandemic into the macroeconomic scenario by using assumptions such as anticipated business recovery period and current forecast for the growth rate of gross domestic product.
The allowance for credit losses involves significant judgments on a number of matters including expectations of future economic conditions, assignment of obligor ratings, valuation of collateral, and the development of qualitative adjustments as discussed above. Furthermore, information available at the time of the determination is limited, and it is not possible to eliminate uncertainty. Significant changes in any of the factors underlying our determination of the allowances could materially affect our financial condition and results of operations. For example, in response to the unexpected deterioration of future macroeconomic conditions and the consequent decline in internal risk rating, we may need to increase the allowances with additional charges to earnings. Additionally, changes in economic variables such as gross domestic product, unemployment rate and real estate prices which may not move in a correlated manner as variables may move in opposite directions or differ across portfolios or geography, so that improvement in one factor or input may offset deterioration in others.
See note 1 to our consolidated financial statements included elsewhere in this annual report for further information on our policies and methodologies used to determine the allowance for credit losses.
66
Valuation of Financial Instruments
ASC 820, “Fair Value Measurement” (“ASC 820”) specifies a hierarchy of valuation techniques based on whether the inputs to those valuation techniques are observable or unobservable. The standard describes the following three levels of inputs that may be used to measure fair value:
|
Level 1
|
Quoted prices in active markets for identical assets or liabilities. Level 1 assets and liabilities include debt and equity securities and derivative contracts that are traded in an active exchange market. | |
|
Level 2
|
Observable inputs other than Level 1 prices, such as quoted prices for similar assets or liabilities; quoted prices in markets that are not active; or other inputs that are observable or can be corroborated by observable market data for substantially the full term of the assets or liabilities. Level 2 assets and liabilities include debt securities with quoted prices that are traded less frequently than exchange-traded instruments. If no quoted market prices are available, the fair values of debt securities and
over-the-counter
|
|
|
Level 3
|
Unobservable inputs that are supported by little or no market activity and that are significant to the fair value of the assets or liabilities. Level 3 assets and liabilities include financial instruments whose values are determined using pricing models, discounted cash flow methodologies, or similar techniques. | |
For assets and liabilities classified in Level 1 and 2 of the hierarchy, where inputs are principally based on observable market data, there is less judgment or estimate in determining fair value, while the determination of fair value of Level 3 assets and liabilities involves more significant management judgments and estimates. For further information, including valuation methodologies and the use of management estimates and judgments in connection therewith, see note 28 to the consolidated financial statements included elsewhere in this annual report.
Pension and Other Employee Benefit Plans
Mizuho Financial Group, its principal banking subsidiaries and certain other subsidiaries sponsor severance indemnities and pension plans, which provide defined benefits to retired employees. Periodic expense and accrued liabilities are computed based on a number of actuarial assumptions, including mortality, withdrawals, discount rates, expected long-term rates of return on plan assets and rates of increase in future compensation levels.
Actual results that differ from the assumptions are accumulated and amortized over future periods and therefore generally affect future pension expenses. While management believes that the assumptions used are appropriate, differences in actual experience or changes in assumptions may adversely affect pension expenses in the future.
In estimating the discount rates, we look to interest rates on a portfolio of high-quality fixed-income government and corporate bonds. The durations of such bonds closely match those of the benefit obligations. Assumed discount rates are reevaluated at each measurement date.
The expected rate of return for each asset category is based primarily on various aspects of the long-term prospects for the economy that include historical performance and the market environment.
For further information on our pension and other employee benefits, see note 20 to the consolidated financial statements included elsewhere in this annual report.
67
Operating Results
The following discussion relates to our operating results for the fiscal years ended March 31, 2020 and 2021. For the discussion on our operating results for the fiscal year ended March 31, 2019, including certain comparative discussion on our operating results for the fiscal years ended March 31, 2019 and 2020, please refer to “Item 5. Operating and Financial Review and Prospects—Operating Results” in our annual report on Form
20-F
for the fiscal year ended March 31, 2020, filed with the SEC on July 2, 2020.
The following table shows certain information as to our income, expenses and net income for the fiscal years ended March 31, 2020 and 2021:
|
Fiscal years ended March 31,
|
||||||||
|
2020
|
2021
|
|||||||
|
(in billions of yen)
|
||||||||
|
Interest and dividend income
|
¥ | 2,150 | ¥ | 1,457 | ||||
|
Interest expense
|
1,271 | 468 | ||||||
|
|
|
|
|
|||||
|
Net interest income
|
879 | 989 | ||||||
|
Provision (credit) for credit losses
|
156 | 113 | ||||||
|
|
|
|
|
|||||
|
Net interest income after provision (credit) for credit losses
|
723 | 876 | ||||||
|
Noninterest income
|
1,308 | 2,041 | ||||||
|
Noninterest expenses
|
1,878 | 1,888 | ||||||
|
|
|
|
|
|||||
|
Income before income tax expense
|
153 | 1,029 | ||||||
|
Income tax expense
|
47 | 211 | ||||||
|
|
|
|
|
|||||
|
Net income
|
106 | 818 | ||||||
|
Less: Net income (loss) attributable to noncontrolling interests
|
(44 | ) | 236 | |||||
|
|
|
|
|
|||||
|
Net income attributable to MHFG shareholders
|
¥ | 150 | ¥ | 582 | ||||
|
|
|
|
|
|||||
The following is a discussion of major components of our net income attributable to MHFG shareholders for the fiscal years ended March 31, 2020 and 2021.
68
Net Interest Income
The following table shows the average balances of interest-earning assets and interest-bearing liabilities, interest amounts and the average interest rates on such assets and liabilities for the fiscal years ended March 31, 2020 and 2021:
|
Fiscal years ended March 31,
|
||||||||||||||||||||||||
|
2020
|
2021
|
|||||||||||||||||||||||
|
Average
balance
|
Interest
amount
|
Interest
rate
|
Average
balance
|
Interest
amount
|
Interest
rate
|
|||||||||||||||||||
|
(in billions of yen, except percentages)
|
||||||||||||||||||||||||
|
Domestic:
|
||||||||||||||||||||||||
|
Interest-bearing deposits in other banks
|
¥ | 34,333 | ¥ | 26 | 0.08 | % | ¥ | 35,177 | ¥ | 29 | 0.08 | % | ||||||||||||
|
Call loans and funds sold, and receivables under resale agreements and securities borrowing transactions
|
9,322 | 27 | 0.30 | 10,132 | 4 | 0.04 | ||||||||||||||||||
|
Trading account assets
|
7,753 | 72 | 0.93 | 6,386 | 79 | 1.24 | ||||||||||||||||||
|
Investments
|
16,532 | 85 | 0.51 | 24,617 | 68 | 0.27 | ||||||||||||||||||
|
Loans
|
54,777 | 535 | 0.98 | 59,115 | 488 | 0.82 | ||||||||||||||||||
|
|
|
|
|
|
|
|
|
|||||||||||||||||
|
Total interest-earning assets
|
122,717 | 745 | 0.61 | 135,427 | 668 | 0.49 | ||||||||||||||||||
|
|
|
|
|
|
|
|
|
|||||||||||||||||
|
Deposits
|
87,143 | 90 | 0.10 | 92,761 | 26 | 0.03 | ||||||||||||||||||
|
Short-term borrowings
(1)
|
10,918 | 63 | 0.58 | 15,087 | 25 | 0.17 | ||||||||||||||||||
|
Trading account liabilities
|
1,591 | 41 | 2.59 | 1,574 | 47 | 3.00 | ||||||||||||||||||
|
Long-term debt
|
9,631 | 198 | 2.05 | 9,892 | 175 | 1.77 | ||||||||||||||||||
|
|
|
|
|
|
|
|
|
|||||||||||||||||
|
Total interest-bearing liabilities
|
109,283 | 392 | 0.36 | 119,314 | 273 | 0.23 | ||||||||||||||||||
|
|
|
|
|
|
|
|
|
|||||||||||||||||
|
Net
|
13,434 | 353 | 0.25 | 16,113 | 395 | 0.26 | ||||||||||||||||||
|
|
|
|
|
|
|
|
|
|||||||||||||||||
|
Foreign:
|
||||||||||||||||||||||||
|
Interest-bearing deposits in other banks
|
5,716 | 79 | 1.39 | 8,785 | 15 | 0.17 | ||||||||||||||||||
|
Call loans and funds sold, and receivables under resale agreements and securities borrowing transactions
|
11,301 | 249 | 2.21 | 10,564 | 40 | 0.38 | ||||||||||||||||||
|
Trading account assets
|
8,859 | 150 | 1.69 | 13,243 | 158 | 1.19 | ||||||||||||||||||
|
Investments
|
4,096 | 81 | 1.98 | 4,164 | 45 | 1.07 | ||||||||||||||||||
|
Loans
|
28,827 | 846 | 2.94 | 32,355 | 531 | 1.64 | ||||||||||||||||||
|
|
|
|
|
|
|
|
|
|||||||||||||||||
|
Total interest-earning assets
|
58,799 | 1,405 | 2.39 | 69,111 | 789 | 1.14 | ||||||||||||||||||
|
|
|
|
|
|
|
|
|
|||||||||||||||||
|
Deposits
|
27,507 | 526 | 1.91 | 31,070 | 134 | 0.43 | ||||||||||||||||||
|
Short-term borrowings
(1)
|
15,112 | 334 | 2.21 | 20,282 | 50 | 0.25 | ||||||||||||||||||
|
Trading account liabilities
|
1,009 | 12 | 1.16 | 794 | 6 | 0.70 | ||||||||||||||||||
|
Long-term debt
|
678 | 7 | 1.13 | 816 | 5 | 0.65 | ||||||||||||||||||
|
|
|
|
|
|
|
|
|
|||||||||||||||||
|
Total interest-bearing liabilities
|
44,306 | 879 | 1.98 | 52,962 | 195 | 0.37 | ||||||||||||||||||
|
|
|
|
|
|
|
|
|
|||||||||||||||||
|
Net
|
14,493 | 526 | 0.41 | 16,149 | 594 | 0.77 | ||||||||||||||||||
|
|
|
|
|
|
|
|
|
|||||||||||||||||
|
Total:
|
||||||||||||||||||||||||
|
Total interest-earning assets
|
181,516 | 2,150 | 1.19 | 204,538 | 1,457 | 0.71 | ||||||||||||||||||
|
Total interest-bearing liabilities
|
153,589 | 1,271 | 0.83 | 172,276 | 468 | 0.27 | ||||||||||||||||||
|
|
|
|
|
|
|
|
|
|||||||||||||||||
|
Net
|
¥ | 27,927 | ¥ | 879 | 0.36 | ¥ | 32,262 | ¥ | 989 | 0.44 | ||||||||||||||
|
|
|
|
|
|
|
|
|
|||||||||||||||||
Note:
| (1) |
Short-term borrowings consist of due to trust accounts, call money and funds purchased, payables under repurchase agreements and securities lending transactions and other short-term borrowings.
|
69
Fiscal Year Ended March 31, 2021 Compared to Fiscal Year Ended March 31, 2020
Interest and dividend income decreased by ¥693 billion, or 32.2%, from the previous fiscal year to ¥1,457 billion in the fiscal year ended March 31, 2021. Domestic interest and dividend income accounted for ¥668 billion of the total amount, a decrease of ¥77 billion from the previous fiscal year, and foreign interest and dividend income accounted for ¥789 billion, a decrease of ¥616 billion from the previous fiscal year.
Long-term interest rates continued to be in the vicinity of 0% under the Bank of Japan’s “Quantitative and Qualitative Monetary Easing with Yield Curve Control.” Short-term interest rates also continued to be in the vicinity of 0%. Under such circumstances, the average yield on domestic loans slightly decreased by 0.16 percentage points from the previous fiscal year to 0.82% in the fiscal year ended March 31, 2021, and the average rate on domestic deposits remained at a low level and slightly decreased by 0.07 percentage points from the previous fiscal year to 0.03% in the fiscal year ended March 31, 2021. The average yield on foreign loans decreased by 1.30 percentage points from the previous fiscal year to 1.64% in the fiscal year ended March 31, 2021, and the average rate on foreign deposits decreased by 1.48 percentage points from the previous fiscal year to 0.43% in the fiscal year ended March 31, 2021.
The decrease in domestic interest and dividend income was due mainly to a decrease in interest income from domestic loans. The decrease in interest income from domestic loans was due mainly to a decline in yields despite an increase in the average balance of loans due to the
COVID-19.
Changes in the average yields on domestic interest-earning assets contributed to a decrease in interest and dividend income of ¥123 billion, and changes in the average balances of domestic interest-earning assets contributed to an increase of ¥46 billion, resulting in the ¥77 billion decrease in domestic interest and dividend income.
The decrease in foreign interest and dividend income was due mainly to decreases in interest income from foreign loans and in interest income from foreign call loans and funds sold, and receivable under resale agreements and securities borrowing transactions. The decrease in interest income from loans and interest income from foreign call loans and funds sold, and receivable under resale agreements and securities borrowing transactions were due mainly to a decrease in the average yield. Changes in the average yield on foreign interest-earning assets contributed to a decrease in interest and dividend income of ¥717 billion, and changes in the average balance of foreign interest-earning assets contributed to an increase of ¥101 billion, resulting in the ¥616 billion overall decrease in foreign interest and dividend income.
Interest expense decreased by ¥803 billion, or 63.2%, from the previous fiscal year to ¥468 billion in the fiscal year ended March 31, 2021. Domestic interest expense accounted for ¥273 billion of the total amount, a decrease of ¥119 billion from the previous fiscal year, and foreign interest expense accounted for ¥195 billion of the total amount, a decrease of ¥684 billion from the previous fiscal year.
The decrease in domestic interest expense was due mainly to a decrease in interest expense from domestic deposits, which was primarily a result of a decrease in average interest rates. The changes in the average interest rates on domestic interest-bearing liabilities contributed to a decrease in interest expense of ¥132 billion, and the changes in the average balance of domestic interest-bearing liabilities contributed to an increase in interest expense of ¥13 billion, resulting in the ¥119 billion overall decrease in domestic interest expense.
The decrease in foreign interest expense was due mainly to decreases in the average interest rates on foreign deposits and short-term borrowings. The changes in the average interest rates on foreign interest-bearing liabilities contributed to a decrease in interest expense of ¥711 billion, and the changes in the average balance of foreign interest-bearing liabilities contributed to an increase in interest expense of ¥27 billion, resulting in the ¥684 billion overall decrease in foreign interest expense.
As a result of the foregoing, net interest income increased by ¥110 billion, or 12.5%, from the previous fiscal year to ¥989 billion. The average interest rate spread rose by 0.08 percentage points from the previous
70
fiscal year to 0.44% in the fiscal year ended March 31, 2021. The rise of the average interest rate spread was not significant because both the average yields on total interest-earning assets and the average interest rates on total interest-bearing liabilities generally moved in tandem between these periods.
Provision (Credit) for Credit Losses
Fiscal Year Ended March 31, 2021 Compared to Fiscal Year Ended March 31, 2020
Provision for credit losses decreased by ¥43 billion from March 31, 2020 to ¥113 billion at March 31, 2021. Provision for credit losses for the fiscal year ended March 31, 2020 were larger than that for the fiscal year ended March 31, 2021 due mainly to the effects of the outbreak of
COVID-19
pandemic on the former. Since we adopted ASC 326 using a modified retrospective approach, ¥156 billion of transition adjustment was recorded in Retained earnings through a cumulative-effect adjustment rather than in Provision (credit) for credit losses. For further information of the adoption of ASC 326, see notes 1 and 2 to our consolidated financial statements included elsewhere in this annual report.
Noninterest Income
The following table shows a breakdown of noninterest income for the fiscal years ended March 31, 2020 and 2021:
|
Fiscal years ended March 31,
|
||||||||
|
2020
|
2021
|
|||||||
|
(in billions of yen)
|
||||||||
|
Fee and commission
|
¥ | 868 | ¥ | 913 | ||||
|
Fee and commission from deposits and lending business
|
158 | 174 | ||||||
|
Fee and commission from securities-related business
|
139 | 170 | ||||||
|
Fee and commission from trust related business
|
129 | 122 | ||||||
|
Fee and commission from remittance business
|
112 | 109 | ||||||
|
Fee and commission from asset management business
|
99 | 105 | ||||||
|
Fee and commission from agency business
|
32 | 32 | ||||||
|
Fee and commission from guarantee related business
|
29 | 32 | ||||||
|
Fees for other customer services
|
170 | 169 | ||||||
|
Foreign exchange gains (losses)—net
|
44 | 89 | ||||||
|
Trading account gains (losses)—net
|
746 | 121 | ||||||
|
Investment gains (losses)—net
|
(526 | ) | 829 | |||||
|
Debt securities
|
31 | (22 | ) | |||||
|
Equity securities
|
(557 | ) | 851 | |||||
|
Equity in earnings (losses) of equity method investees—net
|
34 | 31 | ||||||
|
Gains on disposal of premises and equipment
|
3 | 7 | ||||||
|
Other noninterest income
|
139 | 51 | ||||||
|
|
|
|
|
|||||
|
Total noninterest income
|
¥ | 1,308 | ¥ | 2,041 | ||||
|
|
|
|
|
|||||
Fiscal Year Ended March 31, 2021 Compared to Fiscal Year Ended March 31, 2020
Noninterest income increased by ¥733 billion, or 56.0%, from the previous fiscal year to ¥2,041 billion in the fiscal year ended March 31, 2021. The increase was due mainly to investment gains—net of ¥829 billion compared to investment losses—net of ¥526 billion in the previous fiscal year, offset in part by a decrease in trading account gains—net of ¥625 billion, or 83.8%.
71
Fee and commission
Fee and commission increased by ¥45 billion, or 5.2%, from the previous fiscal year to ¥913 billion in the fiscal year ended March 31, 2021. The increase was due mainly to an increase in fee and commission from securities-related business of ¥31 billion, or 22.3%, and fee and commission from deposits and lending business of ¥16 billion, or 10.1%. The increase in fee and commission from securities-related business was due mainly to the relative strength in market conditions in the fiscal year ended March 31, 2021 compared to the previous fiscal year.
Foreign exchange gains (losses)—net
Foreign exchange gains—net increased by ¥45 billion, or 102.3%, from the previous fiscal year to ¥89 billion in the fiscal year ended March 31, 2021. The increase was due mainly to fluctuations in foreign exchange rates in the fiscal year ended March 31, 2021.
Trading account gains (losses)—net
Trading account gains—net decreased by ¥625 billion, or 83.8%, from the previous fiscal year to ¥121 billion in the fiscal year ended March 31, 2021. The decrease in trading account gains—net was due mainly to a decrease in gains related to changes in the fair value of foreign currency-denominated securities and a decrease in gains related to changes in the fair value of receive-fixed,
pay-variable
interest-rate swaps reflecting low volatility in long-term interest rates.
Investment gains (losses)—net
Investment gains—net was a gain of ¥829 billion in the fiscal year ended March 31,2021 compared to a loss of ¥526 billion in the previous fiscal year, among which investment gains—net related to equity securities was a gain of ¥851 billion in the fiscal year ended March 31,2021 compared to a loss of ¥557 billion in the previous fiscal year. The increase in investment gains related to equity securities was due mainly to an increase in gains related to changes in the fair value of Japanese equity securities in the fiscal year ended March 31, 2021, which mostly reflected the strength in market conditions. For further information, see note 3 to our consolidated financial statements included elsewhere in this annual report.
Noninterest Expenses
The following table shows a breakdown of noninterest expenses for the fiscal years ended March 31, 2020 and 2021:
|
Fiscal years ended March 31,
|
||||||||
|
2020
|
2021
|
|||||||
|
(in billions of yen)
|
||||||||
|
Salaries and employee benefits
|
¥ | 677 | ¥ | 686 | ||||
|
General and administrative expenses
|
649 | 624 | ||||||
|
Occupancy expenses
|
215 | 206 | ||||||
|
Fee and commission expenses
|
194 | 190 | ||||||
|
Provision (credit) for credit losses on
off-balance-sheet
instruments
|
19 | 18 | ||||||
|
Other noninterest expenses
|
124 | 164 | ||||||
|
|
|
|
|
|||||
|
Total noninterest expenses
|
¥ | 1,878 | ¥ | 1,888 | ||||
|
|
|
|
|
|||||
Fiscal Year Ended March 31, 2021 Compared to Fiscal Year Ended March 31, 2020
Noninterest expenses increased by ¥10 billion, or 0.5%, from the previous fiscal year to ¥1,888 billion in the fiscal year ended March 31, 2021. The increase was due mainly to an increase in other noninterest expenses of ¥40 billion, or 32.3%, offset in part by a decrease in general and administrative expenses of ¥25 billion.
72
General and administrative expenses
General and administrative expenses decreased by ¥25 billion, or 3.9%, from the previous fiscal year to ¥624 billion in the fiscal year ended March 31, 2021. The decrease was due mainly to our group-wide continuous effort at cost reduction initiatives.
Provision (credit) for credit losses on
off-balance-sheet
instruments
Provision for credit losses on
off-balance-sheet
instruments decreased by ¥1 billion, or 5.3%, from the previous fiscal year to ¥18 billion in the fiscal year ended March 31, 2021. Upon adoption of ASC 326 on April 1, 2020, we recorded ¥20 billion increase to the allowance for credit losses on off-balance-sheet instruments. Since we adopted ASC 326 using a modified retrospective approach, ¥20 billion of transition adjustment was recorded in Retained earnings through a cumulative-effect adjustment rather than in Provision (credit) for credit losses on off-balance-sheet instruments. For further information of the adoption of ASC 326, see notes 1 and 2 to our consolidated financial statements included elsewhere in this annual report.
Income Tax Expense
The following table shows the components of income tax expense (benefit) for the fiscal years ended March 31, 2020 and 2021:
|
Fiscal years ended March 31,
|
||||||||
|
2020
|
2021
|
|||||||
|
(in billions of yen)
|
||||||||
|
Current:
|
||||||||
|
Domestic
|
¥ | 96 | ¥ | 81 | ||||
|
Foreign
|
53 | 79 | ||||||
|
|
|
|
|
|||||
|
Total current tax expense
|
149 | 160 | ||||||
|
Deferred:
|
||||||||
|
Domestic
|
(111 | ) | 56 | |||||
|
Foreign
|
9 | (5 | ) | |||||
|
|
|
|
|
|||||
|
Total deferred tax expense (benefit)
|
(102 | ) | 51 | |||||
|
|
|
|
|
|||||
|
Total income tax expense
|
¥ | 47 | ¥ | 211 | ||||
|
|
|
|
|
|||||
Fiscal Year Ended March 31, 2021 Compared to Fiscal Year Ended March 31, 2020
Income tax expense increased by ¥164 billion, or 348.9%, from the previous fiscal year to ¥211 billion in the fiscal year ended March 31, 2021 due to an increase in current tax expense of ¥11 billion and an increase in deferred tax expense of ¥153 billion. The increase in current tax expense was due mainly to increases in the taxable income of our subsidiaries in the United States. The increase in deferred tax expense was due mainly to increases in deferred tax liabilities of our principal banking subsidiaries.
We consider the sales of
securities and equity securities to be a qualifying
available-for-sale
tax-planning
strategy that is a possible source of future taxable income to the extent necessary in the future mainly with respect to our principal banking subsidiaries in Japan. The reliance on this
tax-planning
strategy of our subsidiaries in Japan was immaterial.
73
The following table shows the components of deferred tax assets (liabilities) as of March 31, 2020 and 2021:
|
As of March 31,
|
||||||||
|
2020
|
2021
|
|||||||
|
(in billions of yen)
|
||||||||
|
Deferred tax assets:
|
||||||||
|
Allowance for credit losses
|
¥ | 166 | ¥ | 248 | ||||
|
Lease liabilities
|
192 | 196 | ||||||
|
Premises and equipment
|
78 | 64 | ||||||
|
Derivative financial instruments
|
5 | 15 | ||||||
|
Trading securities
|
— | 9 | ||||||
|
Available-for-sale
|
6 | 1 | ||||||
|
Investments
|
4 | — | ||||||
|
Net operating loss carryforwards
|
163 | 151 | ||||||
|
Other
|
201 | 238 | ||||||
|
|
|
|
|
|||||
|
Gross deferred tax assets
|
815 | 922 | ||||||
|
|
|
|
|
|||||
|
Valuation allowance
|
(165 | ) | (129 | ) | ||||
|
|
|
|
|
|||||
|
Deferred tax assets, net of valuation allowance
|
650 | 793 | ||||||
|
Deferred tax liabilities:
|
||||||||
|
Prepaid pension cost and accrued pension liabilities
|
203 | 292 | ||||||
|
Investments
|
— | 259 | ||||||
|
Right-of-use
|
189 | 189 | ||||||
|
Trading securities
|
58 | — | ||||||
|
Other
|
89 | 85 | ||||||
|
|
|
|
|
|||||
|
Gross deferred tax liabilities
|
539 | 825 | ||||||
|
|
|
|
|
|||||
|
Net deferred tax assets (liabilities)
|
¥ | 111 | ¥ | (32 | ) | |||
|
|
|
|
|
|||||
Net Income (Loss) Attributable to Noncontrolling Interests
Fiscal Year Ended March 31, 2021 Compared to Fiscal Year Ended March 31, 2020
Net income (loss) attributable to noncontrolling interests was income of ¥236 billion in the fiscal year ended March 31, 2021 compared to a loss of ¥44 billion in the previous fiscal year.
Net Income Attributable to MHFG Shareholders
Fiscal Year Ended March 31, 2021 Compared to Fiscal Year Ended March 31, 2020
As a result of the foregoing, net income attributable to MHFG shareholders increased by ¥432 billion, or 288.0%, from the previous fiscal year to ¥582 billion in the fiscal year ended March 31, 2021.
Business Segments Analysis
The following discussion relates to our business segment analysis for the fiscal years ended March 31, 2020 and 2021. For the discussion on our business segment analysis for the fiscal year ended March 31, 2019, including certain comparative discussion on our operating results for the fiscal years ended March 31, 2019 and 2020, please refer to “Item 5. Operating and Financial Review and Prospects—Business Segment Analysis” in our annual report on Form
20-F
for the fiscal year ended March 31, 2020, filed with the SEC on July 2, 2020.
We manage our group under an
in-house
company system based on our diverse customer segments. The aim of this system is to leverage our strengths and competitive advantage, which is the seamless integration of our
74
banking, trust banking and securities functions under a holding company structure, to speedily provide high-quality financial services that closely match customer needs.
Specifically, the company system is classified into the following five
in-house
companies, each based on a customer segment: the Retail & Business Banking Company, the Corporate & Institutional Company, the Global Corporate Company, the Global Markets Company, and the Asset Management Company. We regard these customer segments as our operating segments.
For a brief description of our each business segment, see note 31 to our consolidated financial statements included elsewhere in this annual report.
Results of Operations by Business Segment
Consolidated Results of Operations
Consolidated gross profits + net gains related to ETFs and others for the fiscal year ended March 31, 2021 were ¥2,200.8 billion, an increase of ¥128.0 billion compared to the fiscal year ended March 31, 2020. Consolidated general and administrative expenses for the fiscal year ended March 31, 2021 were ¥1,408.7 billion, a decrease of ¥2.8 billion compared to the fiscal year ended March 31, 2020. Consolidated equity in earnings of equity method investees—net for the fiscal year ended March 31, 2021 was ¥19.9 billion, a decrease of ¥10.5 billion compared to the fiscal year ended March 31, 2020. Consolidated net business profits + net gains related to ETFs and others for the fiscal year ended March 31, 2021 were ¥799.8 billion, an increase of ¥127.2 billion compared to the fiscal year ended March 31, 2020.
|
Mizuho Financial Group (Consolidated)
|
||||||||||||||||||||||||||||
|
Fiscal year ended March 31, 2020
(1)
:
|
Retail &
Business
Banking
Company
|
Corporate &
Institutional
Company
|
Global
Corporate
Company
|
Global
Markets
Company
|
Asset
Management
Company
|
Others
(6)
|
Total
|
|||||||||||||||||||||
|
(in billions of yen)
|
||||||||||||||||||||||||||||
|
Gross profits + Net gains (losses) related to ETFs and others
(2)
|
¥ | 676.4 | ¥ | 459.5 | ¥ | 410.9 | ¥ | 411.5 | ¥ | 52.9 | ¥ | 61.6 | ¥ | 2,072.8 | ||||||||||||||
|
General and administrative expenses
(3)
|
673.2 | 215.7 | 245.3 | 202.6 | 33.1 | 41.6 | 1,411.5 | |||||||||||||||||||||
|
Equity in earnings (losses) of equity method investees—net
|
11.7 | 2.0 | 10.4 | — | 1.3 | 5.0 | 30.4 | |||||||||||||||||||||
|
Amortization of goodwill and others
|
2.7 | 0.1 | 0.4 | 1.1 | 7.8 | 1.1 | 13.2 | |||||||||||||||||||||
|
Others
|
— | — | — | — | — | (5.9 | ) | (5.9 | ) | |||||||||||||||||||
|
|
|
|
|
|
|
|
|
|
|
|
|
|
|
|||||||||||||||
|
Net business profits (losses)
(4)
+ Net gains (losses) related to ETFs and others
|
¥ | 12.2 | ¥ | 245.7 | ¥ | 175.6 | ¥ | 207.8 | ¥ | 13.3 | ¥ | 18.0 | ¥ | 672.6 | ||||||||||||||
|
|
|
|
|
|
|
|
|
|
|
|
|
|
|
|||||||||||||||
|
Fixed assets
(5)
|
¥ | 520.1 | ¥ | 197.3 | ¥ | 161.0 | ¥ | 92.3 | ¥ | 0.1 | ¥ | 769.0 | ¥ | 1,739.8 | ||||||||||||||
|
|
|
|
|
|
|
|
|
|
|
|
|
|
|
|||||||||||||||
75
|
Mizuho Financial Group (Consolidated)
|
||||||||||||||||||||||||||||
|
Fiscal year ended March 31, 2021
(1)
:
|
Retail &
Business
Banking
Company
|
Corporate &
Institutional
Company
|
Global
Corporate
Company
|
Global
Markets
Company
|
Asset
Management
Company
|
Others
(6)
|
Total
|
|||||||||||||||||||||
|
(in billions of yen)
|
||||||||||||||||||||||||||||
|
Gross profits + Net gains (losses) related to ETFs and others
(2)
|
¥ | 679.9 | ¥ | 491.9 | ¥ | 450.6 | ¥ | 487.2 | ¥ | 50.4 | ¥ | 40.8 | ¥ | 2,200.8 | ||||||||||||||
|
General and administrative expenses
(3)
|
640.6 | 209.6 | 251.1 | 218.2 | 32.9 | 56.3 | 1,408.7 | |||||||||||||||||||||
|
Equity in earnings (losses) of equity method investees—net
|
5.5 | 3.9 | 10.9 | — | 1.1 | (1.5 | ) | 19.9 | ||||||||||||||||||||
|
Amortization of goodwill and others
|
2.3 | 0.1 | 0.4 | 0.8 | 7.6 | 1.0 | 12.2 | |||||||||||||||||||||
|
Others
|
— | — | — | — | — | — | — | |||||||||||||||||||||
|
|
|
|
|
|
|
|
|
|
|
|
|
|
|
|||||||||||||||
|
Net business profits (losses)
(4)
+ Net gains (losses) related to ETFs and others
|
¥ | 42.5 | ¥ | 286.1 | ¥ | 210.0 | ¥ | 268.2 | ¥ | 11.0 | ¥ | (18.0 | ) | ¥ | 799.8 | |||||||||||||
|
|
|
|
|
|
|
|
|
|
|
|
|
|
|
|||||||||||||||
|
Fixed assets
(5)
|
¥ | 547.0 | ¥ | 185.1 | ¥ | 162.1 | ¥ | 93.9 | ¥ | 0.1 | ¥ | 767.5 | ¥ | 1,755.7 | ||||||||||||||
|
|
|
|
|
|
|
|
|
|
|
|
|
|
|
|||||||||||||||
Notes:
| (1) |
Income and expenses of foreign branches of Mizuho Bank and foreign subsidiaries with functional currencies other than Japanese Yen have been translated for purposes of segment reporting using the budgeted foreign currency rates. Prior period comparative amounts for such foreign currency income and expenses have been translated using current period budgeted foreign currency rates.
|
| (2) |
“Gross profits + Net gains (losses) related to ETFs and others” is reported instead of sales reported by general corporations. Gross profits is defined as the sum of net interest income, fiduciary income, net fee and commission income, net trading income and net other operating income. Net gains (losses) related to ETFs and others consist of net gains (losses) on ETFs held by Mizuho Bank and Mizuho Trust & Banking on their
non-consolidated
basis and net gains (losses) on operating investment securities of Mizuho Securities on its consolidated basis. For the fiscal years ended March 31, 2020 and 2021, net gains (losses) related to ETFs and others amounted to ¥10.6 billion and ¥2.0 billion, respectively, of which ¥7.3 billion and ¥(1.3) billion are included in “Global Markets Company,” respectively.
|
| (3) |
“General and administrative expenses” excludes
non-allocated
gains (losses), net.
|
| (4) |
Net business profits (losses) is used in Japan as a measure of the profitability of core banking operations, and is defined as gross profits (as defined above) less general and administrative expenses (excluding
non-allocated
gains (losses), net) plus equity in earnings (losses) of equity method investees—net and others. Measurement of net business profits (losses) is required for regulatory reporting to the Financial Services Agency of Japan.
|
| (5) |
“Fixed assets” is presented based on Japanese GAAP and corresponds to the total amount of the following U.S. GAAP accounts: Premises and
equipment-net;
Goodwill; Intangible assets; and
right-of-use
|
| (6) |
“Others” includes the following items:
|
| • |
profits and expenses pertaining to consolidated subsidiaries that are not subject to allocation;
|
| • |
consolidating adjustments, including elimination of internal transaction between each segment;
|
| • |
equity in earnings (losses) of equity method
investees-net
that are not subject to allocation; and
|
| • |
profits and losses pertaining to derivative transactions that reflect the counterparty risk of the individual parties and other factors in determining fair market value.
|
76
Fiscal Year Ended March 31, 2021 Compared to Fiscal Year Ended March 31, 2020
Retail & Business Banking Company
Gross profits + net gains related to ETFs and others for the fiscal year ended March 31, 2021 were ¥679.9 billion, an increase of ¥3.5 billion, or 0.5%, compared to the fiscal year ended March 31, 2020. The increase was attributable mainly to an increase in commission income from sales of investment products to individuals which was offset in part by a decrease in deposit revenue due to declining U.S. interest rates.
General and administrative expenses for the fiscal year ended March 31, 2021 decreased by ¥32.6 billion, or 4.8%, compared to the fiscal year ended March 31, 2020 to ¥640.6 billion.
Equity in earnings of equity method investees—net for the fiscal year ended March 31, 2021 decreased by ¥6.2 billion, or 53.0%, compared to the fiscal year ended March 31, 2020 to ¥5.5 billion.
As a result, net business profits + net gains related to ETFs and others for the fiscal year ended March 31, 2021 increased by ¥30.3 billion, or 248.4%, compared to the fiscal year ended March 31, 2020 to ¥42.5 billion.
Corporate & Institutional Company
Gross profits + net gains related to ETFs and others for the fiscal year ended March 31, 2021 were ¥491.9 billion, an increase of ¥32.4 billion, or 7.1%, compared to the fiscal year ended March 31, 2020. The increase was attributable mainly to increases in loan interest income and solution-related revenue relating to our engagement on a large project.
General and administrative expenses for the fiscal year ended March 31, 2021 decreased by ¥6.1 billion, or 2.8%, compared to the fiscal year ended March 31, 2020 to ¥209.6 billion.
Equity in earnings of equity method investees—net for the fiscal year ended March 31, 2021 increased by ¥1.9 billion, or 95.0%, compared to the fiscal year ended March 31, 2020 to ¥3.9 billion.
As a result, net business profits + net gains related to ETFs and others for the fiscal year ended March 31, 2021 increased by ¥40.4 billion, or 16.4%, compared to the fiscal year ended March 31, 2020 to ¥286.1 billion.
Global Corporate Company
Gross profits + net gains related to ETFs and others for the fiscal year ended March 31, 2021 were ¥450.6 billion, an increase of ¥39.7 billion, or 9.7%, compared to the fiscal year ended March 31, 2020. The increase was attributable mainly to increases in loan interest income and debt capital markets-related revenue which were offset in part by a decrease in deposit revenue due to declining U.S. interest rates.
General and administrative expenses for the fiscal year ended March 31, 2021 increased by ¥5.8 billion, or 2.4%, compared to the fiscal year ended March 31, 2020 to ¥251.1 billion.
Equity in earnings of equity method investees—net for the fiscal year ended March 31, 2021 increased by ¥0.5 billion, or 4.8%, compared to the fiscal year ended March 31, 2020 to ¥10.9 billion.
As a result, net business profits + net gains related to ETFs and others for the fiscal year ended March 31, 2021 increased by ¥34.4 billion, or 19.6%, compared to the fiscal year ended March 31, 2020 to ¥210.0 billion.
Global Markets Company
Gross profits + net losses related to ETFs and others for the fiscal year ended March 31, 2021 were ¥487.2 billion, an increase of ¥75.7 billion, or 18.4%, compared to the fiscal year ended March 31, 2020. The increase was attributable mainly to strong performance in sales and trading activities.
77
General and administrative expenses for the fiscal year ended March 31, 2021 increased by ¥15.6 billion, or 7.7%, compared to the fiscal year ended March 31, 2020 to ¥218.2 billion.
As a result, net business profits + net losses related to ETFs and others for the fiscal year ended March 31, 2021 increased by ¥60.4 billion, or 29.1%, compared to the fiscal year ended March 31, 2020 to ¥268.2 billion.
Asset Management Company
Gross profits + net gains related to ETFs and others for the fiscal year ended March 31, 2021 decreased by ¥2.5 billion, or 4.7%, compared to the fiscal year ended March 31, 2020 to ¥50.4 billion. The decrease was attributable mainly to a decrease in fair market value of assets under management.
General and administrative expenses for the fiscal year ended March 31, 2021 decreased by ¥0.2 billion, or 0.6%, compared to the fiscal year ended March 31, 2020 to ¥32.9 billion.
Equity in earnings of equity method investees—net for the fiscal year ended March 31, 2021 decreased by ¥0.2 billion, or 15.4%, compared to the fiscal year ended March 31, 2020 to ¥1.1 billion.
As a result, net business profits + net gains related to ETFs and others for the fiscal year ended March 31, 2021 decreased by ¥2.3 billion, or 17.3%, compared to the fiscal year ended March 31, 2020 to ¥11.0 billion.
Geographical Segment Analysis
The following discussion relates to our geographical segment analysis for the fiscal years ended March 31, 2020 and 2021. For the discussion on our geographical segment analysis for the fiscal year ended March 31, 2019, including certain comparative discussion on our operating results for the fiscal years ended March 31, 2019 and 2020, please refer to “Item 5. Operating and Financial Review and Prospects—Geographical Segment Analysis” in our annual report on Form
20-F
for the fiscal year ended March 31, 2020, filed with the SEC on July 2, 2020.
The following table presents consolidated income statement and total assets information by major geographic area. Foreign activities are defined as business transactions that involve customers residing outside of Japan. However, as our operations are highly integrated globally, we have made estimates and assumptions for the allocation of assets, liabilities, income and expenses among the geographic areas.
|
Americas
|
Asia/Oceania
excluding
Japan,
and others
|
|||||||||||||||||||||||
|
Japan
|
United
States
|
Others
|
Europe
|
Total
|
||||||||||||||||||||
|
(in billions of yen)
|
||||||||||||||||||||||||
|
Fiscal year ended March 31, 2020:
|
||||||||||||||||||||||||
|
Total revenue
(1)
|
¥ | 1,681 | ¥ | 801 | ¥ | 95 | ¥ | 270 | ¥ | 611 | ¥ | 3,458 | ||||||||||||
|
Total expenses
(2)
|
2,009 | 679 | 41 | 239 | 337 | 3,305 | ||||||||||||||||||
|
|
|
|
|
|
|
|
|
|
|
|
|
|||||||||||||
|
Income (loss) before income tax expense
|
(328 | ) | 122 | 54 | 31 | 274 | 153 | |||||||||||||||||
|
|
|
|
|
|
|
|
|
|
|
|
|
|||||||||||||
|
Net income (loss)
|
¥ | (313 | ) | ¥ | 100 | ¥ | 51 | ¥ | 24 | ¥ | 244 | ¥ | 106 | |||||||||||
|
|
|
|
|
|
|
|
|
|
|
|
|
|||||||||||||
|
Total assets at end of fiscal year
|
¥ | 137,471 | ¥ | 34,650 | ¥ | 4,137 | ¥ | 15,487 | ¥ | 19,474 | ¥ | 211,219 | ||||||||||||
|
Fiscal year ended March 31, 2021:
|
||||||||||||||||||||||||
|
Total revenue
(1)
|
¥ | 2,291 | ¥ | 504 | ¥ | 154 | ¥ | 189 | ¥ | 360 | ¥ | 3,498 | ||||||||||||
|
Total expenses
(2)
|
1,918 | 244 | 14 | 116 | 177 | 2,469 | ||||||||||||||||||
|
|
|
|
|
|
|
|
|
|
|
|
|
|||||||||||||
|
Income before income tax expense
|
373 | 260 | 140 | 73 | 183 | 1,029 | ||||||||||||||||||
|
|
|
|
|
|
|
|
|
|
|
|
|
|||||||||||||
|
Net income
|
¥ | 236 | ¥ | 227 | ¥ | 137 | ¥ | 61 | ¥ | 157 | ¥ | 818 | ||||||||||||
|
|
|
|
|
|
|
|
|
|
|
|
|
|||||||||||||
|
Total assets at end of fiscal year
|
¥ | 152,614 | ¥ | 31,940 | ¥ | 4,405 | ¥ | 14,150 | ¥ | 18,542 | ¥ | 221,651 | ||||||||||||
78
Notes:
| (1) |
Total revenue includes interest and dividend income and noninterest income.
|
| (2) |
Total expenses include interest expense, provision (credit) for credit losses and noninterest expenses.
|
Fiscal Year Ended March 31, 2021 Compared to Fiscal Year Ended March 31, 2020
In the fiscal year ended March 31, 2021, 28.8% of our net income was derived from Japan, 27.8% from the United States, 16.8% from the Americas excluding the United States, 7.4% from Europe and 19.2% from Asia/Oceania excluding Japan, and others. At March 31, 2021, 68.8% of total assets were allocated to Japan, 14.4% to the United States, 2.0% to the Americas excluding the United States, 6.4% to Europe and 8.4% to Asia/Oceania excluding Japan, and others.
In Japan, total revenue increased by ¥610 billion from the previous fiscal year due primarily to a change from investment losses related to equity securities to investment gains related to equity securities, offset in part by a change from trading account gains—net to trading account losses—net. The change from investment losses related to equity securities to investment gains related to equity securities was due mainly to an increase in gains related to changes in the fair value of Japanese equity securities in the fiscal year ended March 31, 2021, which mostly reflected the strength in market conditions. The change from trading account gains—net to trading account losses—net was due mainly to a decrease in gains related to changes in the fair value of derivatives and foreign currency-denominated securities. Total expenses decreased by ¥91 billion from the previous fiscal year due mainly to a decrease in expenses on deposits. In addition, we recorded an income tax expense of ¥137 billion in Japan in the fiscal year ended March 31, 2021 compared to an income tax benefit of ¥15 billion in the previous fiscal year. As a result, we recorded net income of ¥236 billion in Japan in the fiscal year ended March 31, 2021 compared to net loss of ¥313 billion in the previous fiscal year. Total assets in Japan increased by ¥15,143 billion due primarily to an increase in investments.
In the United States, total revenue decreased by ¥297 billion due primarily to a decrease in interest income from receivables under resale agreements and securities borrowing transactions. Total expenses decreased by ¥435 billion due mainly to decreases in expenses on payables under repurchase agreements and securities lending transactions and deposits. As a result, net income in the United States increased by ¥127 billion. Total assets in the United States decreased by ¥2,710 billion due primarily to decreases in receivables under resale agreements and loans.
In the Americas excluding the United States, total revenue increased by ¥59 billion due primarily to an increase in trading account gains—net, offset in part by a decrease in interest income from loans, including fees. Total expenses decreased by ¥27 billion due mainly to a decrease in expenses on deposits. As a result, net income in the Americas excluding the United States increased by ¥86 billion. Total assets in the Americas excluding the United States increased by ¥268 billion due primarily to an increase in receivables under resale agreements.
In Europe, total revenue decreased by ¥81 billion due primarily to a decrease in interest income from loans, including fees. Total expenses decreased by ¥123 billion due mainly to a decrease in expenses on deposits. As a result, net income in Europe increased by ¥37 billion. Total assets in Europe decreased by ¥1,337 billion due primarily to a decrease in trading account assets.
In Asia/Oceania excluding Japan, and others, total revenue decreased by ¥251 billion due primarily to a decrease in interest income from loans, including fees. Total expenses decreased by ¥160 billion due mainly to a decrease in expenses on deposits. As a result, net income in Asia/Oceania excluding Japan, and others decreased by ¥87 billion. Total assets in Asia/Oceania excluding Japan, and others decreased by ¥932 billion due primarily to decreases in cash and due from banks and interest-bearing deposits.
79
Financial Condition
Assets
Our assets as of March 31, 2020 and 2021 were as follows:
|
As of March 31,
|
Increase
(decrease)
|
|||||||||||
|
2020
|
2021
|
|||||||||||
|
(in billions of yen)
|
||||||||||||
|
Cash and due from banks
|
¥ | 2,325 | ¥ | 1,601 | ¥ | (724 | ) | |||||
|
Interest-bearing deposits in other banks
|
39,626 | 47,134 | 7,508 | |||||||||
|
Call loans and funds sold
|
1,007 | 859 | (148 | ) | ||||||||
|
Receivables under resale agreements
|
18,581 | 11,623 | (6,958 | ) | ||||||||
|
Receivables under securities borrowing transactions
|
2,216 | 2,694 | 478 | |||||||||
|
Trading account assets
|
28,093 | 26,753 | (1,340 | ) | ||||||||
|
Investments
|
23,676 | 33,041 | 9,365 | |||||||||
|
Loans
|
87,528 | 88,581 | 1,053 | |||||||||
|
Allowance for credit losses on loans
|
(441 | ) | (651 | ) | (210 | ) | ||||||
|
|
|
|
|
|
|
|||||||
|
Loans, net of allowance
|
87,087 | 87,930 | 843 | |||||||||
|
Premises and equipment—net
|
1,856 | 1,811 | (45 | ) | ||||||||
|
Due from customers on acceptances
|
168 | 237 | 69 | |||||||||
|
Accrued income
|
324 | 317 | (7 | ) | ||||||||
|
Goodwill
|
93 | 93 | — | |||||||||
|
Intangible assets
|
65 | 56 | (9 | ) | ||||||||
|
Deferred tax assets
|
137 | 45 | (92 | ) | ||||||||
|
Other assets
|
5,965 | 7,457 | 1,492 | |||||||||
|
|
|
|
|
|
|
|||||||
|
Total assets
|
¥ | 211,219 | ¥ | 221,651 | ¥ | 10,432 | ||||||
|
|
|
|
|
|
|
|||||||
Total assets increased by ¥10,432 billion from March 31, 2020 to ¥221,651 billion as of March 31, 2021. The increase was due mainly to increases of ¥9,365 billion in investments, ¥7,508 billion in interest-bearing deposits in other banks and ¥1,492 billion in other assets, offset by decreases of ¥6,958 billion in receivables under resale agreements and ¥1,340 billion in trading account assets.
80
Loans
Loans outstanding
The following table shows our loans outstanding as of March 31, 2020 and 2021 based on classifications by domicile and industry segment:
|
As of March 31,
|
Increase
(decrease)
|
|||||||||||||||||||||||
|
2020
|
2021
|
|||||||||||||||||||||||
|
(in billions of yen, except percentages)
|
||||||||||||||||||||||||
|
Domestic:
|
||||||||||||||||||||||||
|
Manufacturing
|
¥ | 9,731 | 11.1 | % | ¥ | 11,011 | 12.4 | % | ¥ | 1,280 | 1.3 | % | ||||||||||||
|
Construction and real estate
|
9,603 | 11.0 | 10,492 | 11.8 | 889 | 0.8 | ||||||||||||||||||
|
Services
|
5,993 | 6.8 | 6,406 | 7.2 | 413 | 0.4 | ||||||||||||||||||
|
Wholesale and retail
|
5,220 | 6.0 | 5,357 | 6.0 | 137 | 0.0 | ||||||||||||||||||
|
Transportation and communications
|
3,833 | 4.4 | 3,886 | 4.4 | 53 | 0.0 | ||||||||||||||||||
|
Banks and other financial institutions
(1)
|
4,635 | 5.3 | 4,696 | 5.3 | 61 | 0.0 | ||||||||||||||||||
|
Government and public institutions
|
2,199 | 2.5 | 1,898 | 2.1 | (301 | ) | (0.4 | ) | ||||||||||||||||
|
Other industries
(2)
|
5,389 | 6.0 | 5,918 | 6.8 | 529 | 0.8 | ||||||||||||||||||
|
Individuals
|
9,428 | 10.8 | 8,984 | 10.1 | (444 | ) | (0.7 | ) | ||||||||||||||||
|
Mortgage loans
|
8,567 | 9.8 | 8,194 | 9.2 | (373 | ) | (0.6 | ) | ||||||||||||||||
|
Other
|
861 | 1.0 | 790 | 0.9 | (71 | ) | (0.1 | ) | ||||||||||||||||
|
|
|
|
|
|
|
|
|
|
|
|
|
|||||||||||||
|
Total domestic
|
56,031 | 63.9 | 58,648 | 66.1 | 2,617 | 2.2 | ||||||||||||||||||
|
Foreign:
|
||||||||||||||||||||||||
|
Commercial and industrial
(3)
|
20,819 | 23.7 | 19,455 | 21.9 | (1,364 | ) | (1.8 | ) | ||||||||||||||||
|
Banks and other financial institutions
(4)
|
10,475 | 11.9 | 10,449 | 11.8 | (26 | ) | (0.1 | ) | ||||||||||||||||
|
Government and public institutions
|
317 | 0.4 | 177 | 0.2 | (140 | ) | (0.2 | ) | ||||||||||||||||
|
Other
|
35 | 0.1 | 19 | 0.0 | (16 | ) | (0.1 | ) | ||||||||||||||||
|
|
|
|
|
|
|
|
|
|
|
|
|
|||||||||||||
|
Total foreign
|
31,646 | 36.1 | 30,100 | 33.9 | (1,546 | ) | (2.2 | ) | ||||||||||||||||
|
|
|
|
|
|
|
|
|
|
|
|
|
|||||||||||||
|
Subtotal
|
87,677 | 100.0 | % | 88,748 | 100.0 | % | 1,071 | — | ||||||||||||||||
|
|
|
|
|
|||||||||||||||||||||
|
Less: Unearned income and deferred loan fees—net
|
(149 | ) | (167 | ) | (18 | ) | ||||||||||||||||||
|
|
|
|
|
|
|
|||||||||||||||||||
|
Total loans before allowance for credit losses on loans
|
¥ | 87,528 | ¥ | 88,581 | ¥ | 1,053 | ||||||||||||||||||
|
|
|
|
|
|
|
|||||||||||||||||||
Note:
| (1) |
Banks and other financial institutions under Domestic includes mainly banks, securities companies, insurance companies and credit card companies.
|
| (2) |
Other industries under Domestic includes trade receivables and lease receivables of consolidated variable interest entities.
|
| (3) |
Commercial and industrial under Foreign includes ¥173 billion and ¥222 billion of lease receivables that are receivables arising from direct financing leasing for the fiscal years ended March 31, 2020 and 2021, respectively.
|
| (4) |
Banks and other financial institutions under Foreign includes mainly banks and financial services companies.
|
Total loans before allowance for credit losses on loans increased by ¥1,053 billion from March 31, 2020 to ¥88,581 billion as of March 31, 2021. Loans to domestic borrowers increased by ¥2,617 billion to ¥58,648 billion due mainly to increases in loans to manufacturing and construction and real estate, offset in part by a decrease in individuals.
Loans to foreign borrowers decreased by ¥1,546 billion from March 31, 2020 to ¥30,100 billion as of March 31, 2021. The decrease in loans to foreign borrowers was due mainly to a decrease in loans to commercial and industrial.
81
Within our loan portfolio, the proportion of loans to domestic borrowers against gross total loans increased from 63.9% to 66.1%, while that of loans to foreign borrowers against gross total loans decreased from 36.1% to 33.9%. Loans to foreign borrowers were regionally diversified.
Nonaccrual Loans
General
In accordance with our group’s credit risk management policies, we use an internal rating system that consists of credit ratings for the corporate portfolio segment and pool allocations for the retail portfolio segment as the basis of our risk management infrastructure. Credit ratings consist of obligor ratings which represent the level of credit risk of the obligor, and transaction ratings which represent the ultimate possibility of losses expected on individual loans by taking into consideration various factors such as collateral or guarantees involved. In principle, obligor ratings are applied to all obligors except those to which pool allocations are applied, and are subject to regular review at least once a year as well as special review which is required whenever the obligor’s credit standing changes. Pool allocations are applied to small loans that are less than a specified amount by pooling customers and loans with similar risk characteristics, and the risk is assessed mainly based on past due status and managed according to such pools. We generally review the appropriateness and effectiveness of the approach to obligor ratings and pool allocations once a year in accordance with predetermined policies and procedures.
We do not record expected credit losses for accrued interest receivables because uncollectible accrued interest is reversed through interest income in a timely manner in line with our nonaccrual and past due policies for loans. The amount of accrued interest receivables at March 31, 2021 was ¥78 billion and included in accrued income.
82
The table below presents our definition of obligor ratings used by Mizuho Bank and Mizuho Trust & Banking:
|
Obligor category
(1)(2)
|
Obligor rating
|
Definition
|
||
|
Normal
|
A | Obligors whose certainty of debt fulfillment is very high, hence their level of credit risk is very low. | ||
| B | Obligors whose certainty of debt fulfillment poses no problems for the foreseeable future, and their level of credit risk is low. | |||
| C | Obligors whose certainty of debt fulfillment and their level of credit risk pose no problems for the foreseeable future. | |||
| D | Obligors whose current certainty of debt fulfillment poses no problems, however, their resistance to future economic environmental changes is low. | |||
|
Watch
|
E1 | Obligors that require observation going forward because of either minor concerns regarding their financial position, or their somewhat weak or unstable business conditions. | ||
| E2 | Obligors that require special observation going forward because of problems with their borrowings such as reduced or suspended interest payments, problems with debt fulfillment such as failure to make principal or interest payments, or problems with their financial position as a result of their weak or unstable business conditions. | |||
|
Intensive control
|
F | Obligors that are not yet bankrupt but are in financial difficulties and are deemed likely to become bankrupt in the future because of insufficient progress in implementing their management improvement plans or other measures (including obligors that are receiving ongoing support from financial institutions). | ||
| Substantially bankrupt | G | Obligors that have not yet become legally or formally bankrupt but are substantially insolvent because they are in serious financial difficulties and are deemed to be incapable of being restructured. | ||
|
Bankrupt
|
H | Obligors that have become legally or formally bankrupt. |
Notes:
| (1) |
Special attention obligors are watch obligors with debt in troubled debt restructuring or 90 days or more delinquent debt. Loans to such obligors are considered nonaccrual.
|
| (2) |
We classify loans to special attention, intensive control, substantially bankrupt and bankrupt obligors as nonaccrual loans.
|
We consider loans to be nonaccrual when it is probable that we will be unable to collect all the scheduled payments of principal and interest when due according to the contractual terms of the loans. We classify loans to special attention, intensive control, substantially bankrupt and bankrupt obligors as nonaccrual loans. We do not have any loans to borrowers that cause management to have serious doubts as to the ability of such borrowers to comply with the present loan repayment terms for the periods presented other than those already designated as nonaccrual loans. See “Item 11. Quantitative and Qualitative Disclosures about Credit, Market and Other Risk—Credit Risk Management” for descriptions of our self-assessment procedures and our internal credit rating system.
Our credit management activities consist of activities such as efforts to provide management consultation to support borrowers’ business initiatives, to increase the quantity and enhance the quality of loan collateral, and to adjust loan balances to an appropriate level, when the borrower’s credit quality is showing a decline. These activities can lead to improvements in obligor classifications through improvements in the business and financial condition of borrowers and, as a result, a reduction in allowance for credit losses on loans.
83
We endeavor to remove nonaccrual loans from our balance sheet within three years from the time when they are categorized through methods such as collection, charge-offs, disposal and improving the borrowers’ credit rating through restructuring efforts.
Loan modifications
Restructuring efforts are made through our various business revitalization support measures conducted based on requests from borrowers that are in a weakened state that require some form of support. When confronted with the decision of whether to agree to business revitalization support, which includes forgiveness of debt (including debt to equity swaps), reductions in stated interest rates to below market levels and postponement of payment of principal and/or interest (other than insignificant extensions), we carefully consider whether it is beneficial to our shareholders and depositors based on various factors such as whether (i) a legal reorganization process would significantly damage the obligor’s business value so that there is a fear that the obligor will not be able to restructure its business, (ii) the restructuring plan is appropriate and is economically rational from the viewpoint of minimizing Mizuho’s losses compared to other processes, (iii) both the management and shareholders of the obligor will clearly bear responsibility, and (iv) the allocation of losses among creditors is rational and highly justifiable. The triggers and factors that we review to identify restructured loans are modifications imposed by law or a court of law and alterations based on agreement with the borrower such as the reduction of the stated interest rate and forgiveness of debt (including debt to equity swaps), and we consider restructured loans, with respect to which concessions that it would not otherwise consider were granted to obligors in financial difficulty, as “troubled debt restructuring.” We consider the relevant obligor to be in financial difficulty when its rating based on our internal rating system is E2 or below. The types of concessions that we would not otherwise consider include the various forms of business revitalization support described above. In general, troubled debt restructurings will return to accrual loans when we determine that the borrower poses no problems regarding current certainty of debt fulfillment, i.e., the borrower qualifies for a rating of D or above based on our internal rating system. Based on our historical experience, it typically takes approximately 1.5 years for the troubled debt restructuring loans in nonaccrual status to be returned to accrual status.
We determine whether restructured loans other than troubled debt restructurings are nonaccrual loans based on the application of our internal rating system as we do generally with respect to all obligors. We determine whether restructured loans are past due or current by comparing the obligors’ payments with the modified contract terms. The effect of the restructuring on the obligors is considered in developing the allowance based on the restructuring’s effect on the estimation of future cash flows of such loans. At March 31, 2021, the balance of restructurings that are troubled debt restructurings was ¥382 billion, and the balance of restructurings that are not troubled debt restructurings was ¥24 billion. Also, the amount of charge-offs recorded as a result of troubled debt restructurings that were made during the fiscal year ended March 31, 2021 was ¥5 billion.
While we maintain basic guidelines covering restructured loans, we do not have any standardized modification programs. Instead, we apply various modifications as is appropriate for the specific circumstances of the obligor in question. We do not have a policy that specifically limits the number of modifications that can be performed for a specific loan.
84
Balance of nonaccrual loans
The following table shows our nonaccrual loans as of March 31, 2020 and 2021:
|
As of March 31,
|
Increase (decrease)
|
|||||||||||||||||||||||
|
2020
|
2021
|
|||||||||||||||||||||||
|
Nonaccrual
loans |
Ratio to gross
total loans
|
Nonaccrual
loans |
Ratio to gross
total loans
|
Nonaccrual
loans |
Ratio to gross
total loans
|
|||||||||||||||||||
|
(in billions of yen, except percentages)
|
||||||||||||||||||||||||
|
Domestic:
|
||||||||||||||||||||||||
|
Corporate:
|
||||||||||||||||||||||||
|
Large companies
|
¥ | 343 | 0.9 | % | ¥ | 816 | 1.9 | % | ¥ | 473 | 1.0 | % | ||||||||||||
|
Small and
medium-sized
companies
|
120 | 3.7 | 142 | 4.3 | 22 | 0.6 | ||||||||||||||||||
|
Retail:
|
||||||||||||||||||||||||
|
Housing Loan
|
58 | 0.7 | 63 | 0.8 | 5 | 0.1 | ||||||||||||||||||
|
Others
|
60 | 3.1 | 59 | 3.1 | (1 | ) | 0.0 | |||||||||||||||||
|
|
|
|
|
|
|
|||||||||||||||||||
|
Total domestic
|
581 | 1.0 | 1,080 | 1.8 | 499 | 0.8 | ||||||||||||||||||
|
Foreign
|
135 | 0.4 | 144 | 0.5 | 9 | 0.1 | ||||||||||||||||||
|
|
|
|
|
|
|
|||||||||||||||||||
|
Total nonaccrual loans
|
¥ | 716 | 0.8 | ¥ | 1,224 | 1.4 | ¥ | 508 | 0.6 | |||||||||||||||
|
|
|
|
|
|
|
|||||||||||||||||||
Nonaccrual loans increased by ¥508 billion from March 31, 2020 to ¥1,224 billion as of March 31, 2021. Nonaccrual loans to domestic borrowers increased by ¥499 billion due mainly to downgrades related to some large corporate borrowers reflecting changes in business environment surrounding some domestic obligors. Nonaccrual loans to foreign borrowers increased by ¥9 billion, with the effect of the depreciation of the yen against other currencies contributing to approximately
one-half
of the ¥9 billion increase.
Reflecting the aforementioned change, the percentage of nonaccrual loans within gross total loans increased from 0.8% as of March 31, 2020 to 1.4% as of March 31, 2021. The percentage of nonaccrual loans net of allowance for credit losses on loans to gross total loans net of allowance for credit losses on loans increased from 0.32% as of March 31, 2020 to 0.65% as of March 31, 2021 due to a larger percentage increase in nonaccrual loans net of allowance for credit losses on loans than the percentage increase in gross total loans net of allowance for credit losses on loans.
Allowance for Credit Losses on Loans
Calculation of allowance for credit losses on loans
Effective April 1, 2020, the allowance for credit losses on loans is established for current expected credit losses (“CECL“) on our loan portfolio in accordance with ASC 326. Additionally, as of April 1, 2020, we did not elect the fair value option for certain financial assets measured at amortized cost basis. Prior to April 1, 2020, the allowance for credit losses on loans was established based on an incurred loss model in accordance with ASC 310 and ASC 450.
We make adjustments to the allowance for credit losses on loans through provision (credit) for credit losses in the consolidated statements of income in each subsequent reporting period. Loan principal that management judges to be uncollectible, based on detailed loan reviews and a credit quality assessment, is charged off against the allowance for credit losses on loans. In general, we charge off loans when we determine that the obligor should be classified as substantially bankrupt or bankrupt. For the definition of obligor categories, see the table above in “—Nonaccrual Loans—General.” Obligors in the retail portfolio segment are generally determined to be substantially bankrupt when they are past due for more than six months, and as for obligors in the corporate portfolio segment, we separately monitor the credit quality of each obligor without using time-based triggers.
85
We maintain an appropriate allowance for credit losses on loans to represent management’s estimate of the expected credit losses in our loan portfolio. The management evaluates the appropriateness of the allowance for credit losses on loans semi-annually. The allowance considers expected credit losses over the remaining expected lives of the applicable instruments. The expected life of each instrument is determined by considering expected prepayments, contractual terms and cancellation features. The allowance for credit losses involves significant judgments on a number of matters including expectations of future economic conditions, assignment of obligor ratings, valuation of collateral, and the development of qualitative adjustments.
When determining expected credit losses, a single forward-looking macroeconomic scenario is considered over a reasonable and supportable forecast period. This forward-looking macroeconomic scenario is consistent to what is used in our stress testing and is in line with the scenario used for our business plan. If the scenario does not reflect a sudden change in economic conditions adequately, it could be possible to make adjustments to the scenario. After the forecast period, we revert to long-term historical loss experience with a certain graduated transition period, to estimate losses over the remaining lives of financial assets measured at amortized cost and certain
off-balance-sheet
instruments. The macroeconomic scenario is updated at least semiannually and is reviewed accordingly to reflect current economic conditions and our expectation of future conditions on a timely basis. For April 1, 2020 and March 31, 2021, we used the most recent macroeconomic scenario available during our credit loss estimation process.
In terms of the internal risk ratings, for the corporate portfolio segment, the credit quality review process and the credit rating process serve as the basis for determining the allowance for credit losses on loans. Through such processes loans are categorized into groups to reflect the probability of default, whereby our management assesses the ability of borrowers to service their debt, taking into consideration current financial information, ability to generate cash, historical payment experience, analysis of relevant industry segments and current trends. For the retail portfolio segment, the different categories of past due status of loans are primarily utilized in the credit quality review and the credit rating processes as the basis for determining the allowance for credit losses on loans.
In general, we estimate expected credit losses collectively on the loans in the case of normal and watch obligors, considering the risk associated with a particular pool and the probability that the exposures within the pool will deteriorate or default. The allowance for credit losses on nonaccrual loans includes the allowance for groups of loans which were collectively evaluated for expected credit losses, in addition to the allowance for those loans that were individually evaluated for expected credit losses. See note 4 to our consolidated financial statements included elsewhere in this annual report for the definitions of obligor categories and classification of nonaccrual loans.
The estimation of expected credit losses that are evaluated collectively begins with a quantitative calculation that considers the likelihood of the borrower changing delinquency status or moving from one obligor category or rating to another. The quantitative calculation covers expected credit losses over an instrument’s expected life and is estimated by applying credit loss factors to our estimated exposure at default. The credit loss factors incorporate the probability of default as well as the loss given default based on the historical loss rates. To supplement the historical loss data for overseas obligors, external credit ratings such as S&P are also used to calculate the probability of default. The model and inputs used to determine credit losses on loans that are evaluated collectively are analyzed on a periodic basis by comparing the estimated values with the actual results subsequent to the balance sheet date.
We divide its overall portfolio into domestic and foreign portfolios, and categorizes the domestic portfolio into four portfolio segments according to their risk profiles: corporate, retail, sovereign, and banks and financial institutions.
The corporate portfolio segment consists of loans originated primarily by Mizuho Bank and Mizuho Trust & Banking, and includes mainly business loans such as those used for working capital and capital expenditure, as well as loans for which the primary source of repayment of the obligation is income generated by the relevant
86
assets such as project finance, asset finance and real estate finance. The corporate portfolio segment is divided into two classes based on their risk characteristics: large companies, and small and
medium-sized
companies. For the corporate portfolio segment, we consider key economic factors such as gross domestic products for Japan and each relevant foreign location, where the portfolio is significant, and the interest rates in Japan when estimating the credit loss.
The retail portfolio segment consists mainly of residential mortgage loans originated by Mizuho Bank, and it is divided into two classes based on their risk characteristics: housing loan and others. For the retail portfolio segment, the Japanese unemployment rate is applied as a key factor. As it pertains to troubled debt restructurings in the retail portfolio segment, the restructuring itself, as well as subsequent payment defaults, if any, are considered in determining obligor categories. Expected credit loss estimates also include consideration of expected cash recoveries on loans previously
charged-off,
or expected recoveries on collateral dependent loans where recovery is expected through sale of the collateral.
The allowance recorded for individually evaluated loans is based on (1) the present value of expected future cash flows, after considering the restructuring effect and subsequent payment default with respect to troubled debt restructurings, discounted at the loan’s initial effective interest rate, (2) the loan’s observable market price, or (3) the fair value of the collateral if the loan is collateral dependent. The collateral that we obtain for loans consists primarily of real estate. In obtaining the collateral, we evaluate the fair value of the collateral and its legal enforceability. We also perform subsequent
re-evaluations
at least once a year. As it pertains to real estate collateral, valuation is generally performed by an appraising subsidiary which is independent from our loan origination departments by using generally accepted valuation techniques such as (1) the replacement cost approach, (2) the sales comparison approach or (3) the income approach. In the case of large real estate collateral, we generally engage third-party appraisers to perform the valuation.
Our methodology for determining the appropriate allowance for credit losses on loans also considers the imprecision inherent in the methodologies used. As a result, the amounts determined under the methodologies described above could be adjusted by management to consider the potential impact of other qualitative factors which include, but are not limited to, imprecision in macroeconomic scenario assumptions and emerging risks related to changes in the environment that are affecting specific portfolio segments. We incorporated the estimated impact of
COVID-19
pandemic into the macroeconomic scenario by using assumptions such as anticipated business recovery period and current forecast for the growth rate of gross domestic product.
Balance of allowance for credit losses on loans
The following table summarizes the allowance for credit losses on loans by component and as a percentage of the corresponding loan balance as of March 31, 2020 and 2021:
|
As of March 31,
|
Increase
(decrease)
|
|||||||||||
|
2020
|
2021
|
|||||||||||
|
(in billions of yen, except percentages)
|
||||||||||||
|
Total allowance for credit losses on loans (A)
|
¥ | 441 | ¥ | 651 | ¥ | 210 | ||||||
|
|
|
|
|
|
|
|||||||
|
Nonaccrual loans with an allowance (B)
|
¥ | 596 | ¥ | 1,113 | ¥ | 517 | ||||||
|
Nonaccrual loans without an allowance (C)
|
120 | 111 | (9 | ) | ||||||||
|
Accrual loans
(1)
(D)
|
86,961 | 87,524 | 563 | |||||||||
|
|
|
|
|
|
|
|||||||
|
Gross total loans (E)
|
¥ | 87,677 | ¥ | 88,748 | ¥ | 1,071 | ||||||
|
|
|
|
|
|
|
|||||||
|
Percentage of total allowance for credit losses on loans against gross total loans (A)/(E)x100
|
0.50 | % | 0.73 | % | 0.23 | % | ||||||
Note:
| (1) |
Accrual loans refer to loans categorized as “normal obligors” and “watch obligors (excluding special attention obligors)” under our internal rating system.
|
87
Allowance for credit losses on loans increased by ¥210 billion from March 31, 2020 to ¥651 billion as of March 31, 2021 due to the recognition of expected credit losses as a result of the adoption of ASU
No.2016-13.
As a result, the percentage of total allowance for credit losses on loans against gross total loans increased by 0.23 percentage points to 0.73%. For further information of the adoption of ASU
No.2016-13,
see notes 1 and 2 to our consolidated financial statements included elsewhere in this annual report.
In the fiscal year ended March 31, 2021, nonaccrual loans increased by 70.9% due mainly to an increase in domestic nonaccrual loans. Allowance for credit losses on loans increased by 47.6%.
The coverage ratio for nonaccrual loans, calculated as the percentage of total allowance for credit losses on loans against total nonaccrual loans, decreased by 8.39 percentage points as of March 31, 2021 compared to the previous fiscal year. The decrease was due to a larger percentage increase in total nonaccrual loans than the percentage increase in total allowance for credit losses on loans.
88
Provision (credit) for credit losses on loans
The following table summarizes changes in our allowance for credit losses on loans, including a breakdown of charge-offs and recoveries by domicile and industry segment, in the fiscal years ended March 31, 2020 and 2021:
|
Fiscal years ended March 31,
|
Increase
(decrease)
|
|||||||||||
|
2020
|
2021
|
|||||||||||
|
(in billions of yen)
|
||||||||||||
|
Allowance for credit losses on loans at beginning of fiscal year
|
¥ | 307 | ¥ | 441 | ¥ | 134 | ||||||
|
April 1, 2020 adoption of CECL
|
— | 156 | 156 | |||||||||
|
|
|
|
|
|
|
|||||||
|
Adjusted Balance at beginning of period
|
307 | 597 | 290 | |||||||||
|
Provision (credit) for credit losses on loans
|
156 | 113 | (43 | ) | ||||||||
|
Charge-offs:
|
||||||||||||
|
Domestic:
|
||||||||||||
|
Manufacturing
|
(6 | ) | (19 | ) | (13 | ) | ||||||
|
Construction and real estate
|
(1 | ) | (1 | ) | — | |||||||
|
Services
|
(2 | ) | (4 | ) | (2 | ) | ||||||
|
Wholesale and retail
|
(16 | ) | (10 | ) | 6 | |||||||
|
Transportation and communications
|
(1 | ) | (3 | ) | (2 | ) | ||||||
|
Other industries
|
— | — | — | |||||||||
|
Individuals
|
(5 | ) | (4 | ) | 1 | |||||||
|
|
|
|
|
|
|
|||||||
|
Total domestic charge-offs
|
(31 | ) | (41 | ) | (10 | ) | ||||||
|
Foreign
|
(13 | ) | (38 | ) | (25 | ) | ||||||
|
|
|
|
|
|
|
|||||||
|
Total charge-offs
|
(44 | ) | (79 | ) | (35 | ) | ||||||
|
|
|
|
|
|
|
|||||||
|
Recoveries:
|
||||||||||||
|
Domestic:
|
||||||||||||
|
Manufacturing
|
1 | 1 | — | |||||||||
|
Construction and real estate
|
20 | — | (20 | ) | ||||||||
|
Services
|
1 | — | (1 | ) | ||||||||
|
Wholesale and retail
|
4 | 2 | (2 | ) | ||||||||
|
Individuals
|
1 | 1 | — | |||||||||
|
|
|
|
|
|
|
|||||||
|
Total domestic recoveries
|
27 | 4 | (23 | ) | ||||||||
|
Foreign
|
1 | 10 | 9 | |||||||||
|
|
|
|
|
|
|
|||||||
|
Total recoveries
|
28 | 14 | (14 | ) | ||||||||
|
|
|
|
|
|
|
|||||||
|
Net charge-offs
|
(16 | ) | (65 | ) | (49 | ) | ||||||
|
Others
(1)
|
(6 | ) | 6 | 12 | ||||||||
|
|
|
|
|
|
|
|||||||
|
Balance at end of fiscal year
|
¥ | 441 | ¥ | 651 | ¥ | 210 | ||||||
|
|
|
|
|
|
|
|||||||
Note:
| (1) |
“Others” includes primarily foreign exchange translation.
|
Provision for credit losses on loans decreased by ¥43 billion from March 31, 2020 to ¥113 billion at March 31, 2021. Provision for credit losses on loans for the fiscal year ended March 31, 2020 were larger than that for the fiscal year ended March 31, 2021 due mainly to the effects of the outbreak of
COVID-19
pandemic on the former. Since we adopted ASC 326 using a modified retrospective approach, ¥156 billion of transition adjustment was recorded in Retained earnings through a cumulative-effect adjustment rather than in Provision (credit) for credit losses. For further information of the adoption of ASC 326, see notes 1 and 2 to our consolidated financial statements included elsewhere in this annual report.
89
Charge-offs increased by ¥35 billion from the previous fiscal year to ¥79 billion for the fiscal year ended March 31, 2021. The increase was due mainly to increases in charge-offs of foreign loans and domestic loans to certain borrows in manufacturing.
Investments
The majority of our investments are
and
securities, which at March 31, 2020 and 2021 were as follows:
available-for-sale
held-to-maturity
|
As of March 31,
|
Increase (decrease)
|
|||||||||||||||||||||||||||||||||||
|
2020
|
2021
|
|||||||||||||||||||||||||||||||||||
|
Amortized
cost
|
Fair
value
|
Net
unrealized
gains
(losses)
|
Amortized
cost
|
Fair
value
|
Net
unrealized
gains
(losses)
|
Amortized
cost
|
Fair
value
|
Net
unrealized
gains
(losses)
|
||||||||||||||||||||||||||||
|
(in billions of yen)
|
||||||||||||||||||||||||||||||||||||
|
Available-for-sale
|
||||||||||||||||||||||||||||||||||||
|
Debt securities:
|
||||||||||||||||||||||||||||||||||||
|
Japanese government bonds
|
¥ | 12,652 | ¥ | 12,603 | ¥ | (49 | ) | ¥ | 20,954 | ¥ | 20,921 | ¥ | (33 | ) | ¥ | 8,302 | ¥ | 8,318 | ¥ | 16 | ||||||||||||||||
|
Other than Japanese government bonds
|
6,481 | 6,510 | 29 | 6,903 | 6,932 | 29 | 422 | 422 | — | |||||||||||||||||||||||||||
|
|
|
|
|
|
|
|
|
|
|
|
|
|
|
|
|
|
|
|||||||||||||||||||
|
Total
|
¥ | 19,133 | ¥ | 19,113 | ¥ | (20 | ) | ¥ | 27,857 | ¥ | 27,853 | ¥ | (4 | ) | ¥ | 8,724 | ¥ | 8,740 | ¥ | 16 | ||||||||||||||||
|
|
|
|
|
|
|
|
|
|
|
|
|
|
|
|
|
|
|
|||||||||||||||||||
|
Held-to-maturity
|
||||||||||||||||||||||||||||||||||||
|
Debt securities:
|
||||||||||||||||||||||||||||||||||||
|
Japanese government bonds
|
¥ | 480 | ¥ | 493 | ¥ | 13 | ¥ | 480 | ¥ | 490 | ¥ | 10 | ¥ | — | ¥ | (3 | ) | ¥ | (3 | ) | ||||||||||||||||
|
Agency mortgage-backed securities
|
382 | 382 | — | 407 | 414 | 7 | 25 | 32 | 7 | |||||||||||||||||||||||||||
|
|
|
|
|
|
|
|
|
|
|
|
|
|
|
|
|
|
|
|||||||||||||||||||
|
Total
|
¥ | 862 | ¥ | 875 | ¥ | 13 | ¥ | 887 | ¥ | 904 | ¥ | 17 | ¥ | 25 | ¥ | 29 | ¥ | 4 | ||||||||||||||||||
|
|
|
|
|
|
|
|
|
|
|
|
|
|
|
|
|
|
|
|||||||||||||||||||
Available-for-sale
Held-to-maturity
The amount of our funding through deposits significantly exceeds our total loans. As a result, we allocate a significant portion of such excess among investments in debt securities, including Japanese government bonds and investments in equity securities consisting mainly of common stock of Japanese listed company customers. We will continue our efforts to dispose of cross-shareholdings in order to decrease the potential impact on our financial position due to fluctuations in stock prices, and to be able to fully perform financial intermediary functions even under periods of stress.
Fluctuations in long-term interest rates lead to changes in the fair value of our portfolio of debt securities, a majority of which consists of Japanese government bonds. As of March 31, 2021, we had a total of ¥27,853 billion of
securities within our investments, of which ¥20,921 billion was Japanese government bonds. We had ¥19,113 billion and ¥27,853 billion of
securities measured at fair value as of March 31, 2020 and 2021, respectively, and net unrealized losses of ¥20 billion and ¥4 billion were reflected in accumulated other comprehensive income, net of tax as of such dates, respectively. As the negative interest rate policy of the Bank of Japan started in February 2016 and the resulting fluctuations in interest rates may have a substantial impact on the value of our Japanese government bond portfolio, in order to prepare for the risk of sudden and significant future interest rate change, we continue to manage our Japanese government bond portfolio conservatively by managing the average remaining period of our portfolio and strengthening risk management, including through the use of internal stress tests. Average remaining period of our Japanese government bond portfolio as of March 31, 2021 was approximately 1.1 years compared to 2.4 years as of March 31, 2020.
available-for-sale
available-for-sale
90
Risk management related to our securities portfolio continues to be a key focus in light of the increase in instability and uncertainty in the global economy in recent years.
Trading Account Assets
Trading account assets decreased by ¥1,340 billion from March 31, 2020 to ¥26,753 billion at March 31, 2021. The decrease was due mainly to decreases in the market value of receive-fixed,
pay-variable
derivative instruments based on interest rate contracts reflecting a fluctuation in long-term interest rates and in U.S. treasury bonds and other foreign government bonds for which the fair value option was elected due to sales and redemptions.
Liabilities
The following table shows our liabilities as of March 31, 2020 and 2021:
|
As of March 31,
|
Increase
(decrease)
|
|||||||||||
|
2020
|
2021
|
|||||||||||
|
(in billions of yen)
|
||||||||||||
|
Deposits
|
¥ | 144,948 | ¥ | 151,010 | ¥ | 6,062 | ||||||
|
Due to trust accounts
|
250 | 381 | 131 | |||||||||
|
Call money and funds purchased
|
2,263 | 1,313 | (950 | ) | ||||||||
|
Payables under repurchase agreements
|
17,971 | 18,607 | 636 | |||||||||
|
Payables under securities lending transactions
|
1,424 | 1,208 | (216 | ) | ||||||||
|
Other short-term borrowings
|
4,914 | 9,086 | 4,172 | |||||||||
|
Trading account liabilities
|
12,417 | 10,878 | (1,539 | ) | ||||||||
|
Bank acceptances outstanding
|
168 | 237 | 69 | |||||||||
|
Income taxes payable
|
69 | 57 | (12 | ) | ||||||||
|
Deferred tax liabilities
|
26 | 77 | 51 | |||||||||
|
Accrued expenses
|
249 | 194 | (55 | ) | ||||||||
|
Long-term debt
|
10,346 | 11,706 | 1,360 | |||||||||
|
Other liabilities
|
6,998 | 7,209 | 211 | |||||||||
|
|
|
|
|
|
|
|||||||
|
Total liabilities
|
¥ | 202,043 | ¥ | 211,963 | ¥ | 9,920 | ||||||
|
|
|
|
|
|
|
|||||||
Total liabilities increased by ¥9,920 billion from March 31, 2020 to ¥211,963 billion as of March 31, 2021. The increase was due primarily to increases of ¥6,062 billion in deposits, ¥3,773 billion in short-term borrowings and ¥1,360 billion in long-term debt, offset by a decrease of ¥1,539 billion in trading account liabilities. We analyze short-term borrowings, consisting of due to trust accounts, call money and funds purchased, payables under repurchase agreements, payables under securities lending transactions and other short-term borrowings, on a combined basis.
91
Deposits
The following table shows a breakdown of our deposits as of March 31, 2020 and 2021:
|
As of March 31,
|
Increase
(decrease)
|
|||||||||||
|
2020
|
2021
|
|||||||||||
|
(in billions of yen)
|
||||||||||||
|
Domestic:
|
||||||||||||
|
Noninterest-bearing deposits
|
28,110 | ¥ | 29,818 | ¥ | 1,708 | |||||||
|
Interest-bearing deposits
|
86,651 | 92,037 | 5,386 | |||||||||
|
|
|
|
|
|
|
|||||||
|
Total domestic deposits
|
114,761 | 121,855 | 7,094 | |||||||||
|
|
|
|
|
|
|
|||||||
|
Foreign:
|
||||||||||||
|
Noninterest-bearing deposits
|
2,186 | 2,332 | 146 | |||||||||
|
Interest-bearing deposits
|
28,001 | 26,823 | (1,178 | ) | ||||||||
|
|
|
|
|
|
|
|||||||
|
Total foreign deposits
|
30,187 | 29,155 | (1,032 | ) | ||||||||
|
|
|
|
|
|
|
|||||||
|
Total deposits
|
¥ | 144,948 | ¥ | 151,010 | ¥ | 6,062 | ||||||
|
|
|
|
|
|
|
|||||||
Deposits increased by ¥6,062 billion from March 31, 2020 to ¥151,010 billion at March 31, 2021. Domestic deposits increased by ¥7,094 billion from March 31, 2020 to ¥121,855 billion at March 31, 2021. Domestic interest-bearing deposits increased by ¥5,386 billion from March 31, 2020 to ¥92,037 billion at March 31, 2021 due mainly to increases in ordinary deposits and certificates of deposit, offset in part by a decrease in time deposits. Domestic noninterest-bearing deposits increased by ¥1,708 billion to ¥29,818 billion at March 31, 2021 due mainly to an increase in current accounts. Foreign deposits decreased by ¥1,032 billion from March 31, 2020 to ¥29,155 billion at March 31, 2021 due mainly to a decrease in time deposits, offset in part by an increase in certificates of deposit.
Short-term Borrowings
The following table shows a breakdown of our short-term borrowings as of March 31, 2020 and 2021:
|
As of March 31,
|
Increase(decrease)
|
|||||||||||||||||||||||||||||||||||
|
2020
|
2021
|
|||||||||||||||||||||||||||||||||||
|
Domestic
|
Foreign
|
Total
|
Domestic
|
Foreign
|
Total
|
Domestic
|
Foreign
|
Total
|
||||||||||||||||||||||||||||
|
(in billions of yen)
|
||||||||||||||||||||||||||||||||||||
|
Due to trust accounts
|
¥ | 250 | ¥ | — | ¥ | 250 | ¥ | 381 | ¥ | — | ¥ | 381 | ¥ | 131 | ¥ | — | ¥ | 131 | ||||||||||||||||||
|
Call money and funds purchased, and payables under repurchase agreements and securities lending transactions
|
6,616 | 15,042 | 21,658 | 5,205 | 15,923 | 21,128 | (1,411 | ) | 881 | (530 | ) | |||||||||||||||||||||||||
|
Other short-term borrowings
|
4,442 | 472 | 4,914 | 6,783 | 2,303 | 9,086 | 2,341 | 1,831 | 4,172 | |||||||||||||||||||||||||||
|
|
|
|
|
|
|
|
|
|
|
|
|
|
|
|
|
|
|
|||||||||||||||||||
|
Total short-term borrowings
|
¥ | 11,308 | ¥ | 15,514 | ¥ | 26,822 | ¥ | 12,369 | ¥ | 18,226 | ¥ | 30,595 | ¥ | 1,061 | ¥ | 2,712 | ¥ | 3,773 | ||||||||||||||||||
|
|
|
|
|
|
|
|
|
|
|
|
|
|
|
|
|
|
|
|||||||||||||||||||
Short-term borrowings increased by ¥3,773 billion from March 31, 2020 to ¥30,595 billion at March 31, 2021. Domestic short-term borrowings increased by ¥1,061 billion due mainly to an increase in other short-term borrowings, offset in part by a decrease in call money. Foreign short-term borrowings increased by ¥2,712 billion due mainly to increases in other short-term borrowings and payables under repurchase agreements.
Trading Account Liabilities
Trading account liabilities decreased by ¥1,539 billion from March 31, 2020 to ¥10,878 billion at March 31, 2021. The decrease was due mainly to a decrease in the market value of receive-variable,
pay-fixed
derivative instruments based on interest rate contracts reflecting a fluctuation in long-term interest rates.
92
Equity
The following table shows a breakdown of equity as of March 31, 2020 and 2021:
|
As of March 31,
|
Increase
(decrease)
|
|||||||||||
|
2020
|
2021
|
|||||||||||
|
(in billions of yen)
|
||||||||||||
|
MHFG shareholders’ equity:
|
||||||||||||
|
Common stock
|
¥ | 5,827 | ¥ | 5,827 | ¥ | — | ||||||
|
Retained earnings
|
2,700 | 2,967 | 267 | |||||||||
|
Accumulated other comprehensive income (loss), net of tax
|
(9 | ) | 318 | 327 | ||||||||
|
Treasury stock, at cost
|
(6 | ) | (7 | ) | (1 | ) | ||||||
|
|
|
|
|
|
|
|||||||
|
Total MHFG shareholders’ equity
|
8,512 | 9,105 | 593 | |||||||||
|
Noncontrolling interests
|
664 | 583 | (81 | ) | ||||||||
|
|
|
|
|
|
|
|||||||
|
Total equity
|
¥ | 9,176 | ¥ | 9,688 | ¥ | 512 | ||||||
|
|
|
|
|
|
|
|||||||
Total equity increased by ¥512 billion from March 31, 2020 to ¥9,688 billion due mainly to the change from accumulated other comprehensive loss, net of tax to accumulated other comprehensive income, net of tax, and an increase in retained earnings, offset in part by a decrease in noncontrolling interests.
Retained earnings increased by ¥267 billion from March 31, 2020 to ¥2,967 billion at March 31, 2021. This increase was due primarily to net income attributable to MHFG shareholders for the fiscal year ended March 31, 2021 of ¥582 billion, offset in part by dividend payments of ¥190 billion.
We recorded accumulated other comprehensive income, net of tax of ¥318 billion as of March 31, 2021 compared to accumulated other comprehensive loss, net of tax of ¥9 billion as of March 31, 2020. The change was due primarily to pension liability adjustments of ¥328 billion.
Noncontrolling interests decreased by ¥81 billion from March 31, 2020 to ¥583 billion at March 31, 2021. The decrease was due mainly to deconsolidation of certain investment funds, offset in part by increases in net assets of certain investment funds that we consolidate.
Liquidity
We continuously endeavor to enhance the management of our liquidity profile to meet our customers’ loan demand and deposit withdrawals and respond to unforeseen situations such as adverse movements in stock prices, foreign currencies exchange rates, interest rates and other markets or changes in general domestic or international conditions. We manage our liquidity profile through the continuous monitoring of our cash flow situation, the enforcement of upper limits on funds raised in financial markets and other means as further set forth in “Item 11. Quantitative and Qualitative Disclosures about Credit, Market and Other Risk—Liquidity Risk Management.”
Deposits, based on our broad customer base and brand recognition in Japan, have been our primary source of liquidity. Our total deposits increased by ¥6,062 billion, or 4.2%, from the end of the previous fiscal year to ¥151,010 billion as of March 31, 2021. Our average balance of deposits for the fiscal year ended March 31, 2021 of ¥152,547 billion exceeded our average balance of loans for the same period by ¥61,077 billion. We invested the excess portion primarily in marketable securities and other high liquidity assets.
Secondary sources of liquidity include short-term borrowings such as call money and funds purchased and payables under repurchase agreements. We also issue long-term debt, including both senior and subordinated debt, as additional sources for liquidity. We utilize short-term borrowings to diversify our funding sources and to manage our funding costs. We raise subordinated long-term debt for the purpose of improving our capital
93
adequacy ratios, which also enhances our liquidity profile. We believe we are able to access such sources of liquidity on a stable and flexible basis based on our current credit ratings. The following table shows credit ratings assigned to us and to our principal banking subsidiaries by S&P and Moody’s as of May 31, 2021:
|
As of May 31, 2021
|
||||||||||||||||||||||
|
S&P
|
Moody’s
|
|||||||||||||||||||||
|
Long-term
|
Short-term
|
Stand-alone
credit profile
|
Long-term
|
Short-term
|
Baseline credit
assessment
|
|||||||||||||||||
|
Mizuho Financial Group
|
A- | — | — | A1 |
P-1
|
— | ||||||||||||||||
|
Mizuho Bank
|
A |
A-1
|
a | A1 |
P-1
|
baa1 | ||||||||||||||||
|
Mizuho Trust & Banking
|
A |
A-1
|
a | A1 |
P-1
|
baa1 | ||||||||||||||||
We source our funding in foreign currencies primarily from corporate customers, foreign governments, financial institutions and institutional investors, through short-term and long-term financing, under terms and pricing commensurate with our credit ratings above, and customer deposits. In the event of future declines in our credit quality or that of Japan in general, we expect to be able to purchase foreign currencies in sufficient amounts using the yen funds raised through our domestic customer base. As further measures to support our foreign currency liquidity, we hold foreign debt securities, maintain credit lines and swap facilities denominated in foreign currencies.
In order to maintain appropriate funding liquidity, our principal banking subsidiaries hold highly liquid investment assets such as Japanese government bonds as liquidity reserve assets. We monitor the amount of liquidity reserve assets and report such amount to the Risk Management Committee, the Balance Sheet Management Committee, the Executive Management Committee and the President & Group CEO on a regular basis. Minimum regulatory reserve amounts, or the reserve amount deposited with the Bank of Japan pursuant to applicable regulations that is calculated as a specified percentage of the amount of deposits held by our principal banking subsidiaries, are excluded in connection with our management of liquidity reserve asset levels. We established and apply classifications for the cash flow conditions affecting the group, including the amount of liquidity reserve assets, that range from “Normal” to “Anxious” and “Crisis” categories, and take appropriate actions based on such conditions. As of March 31, 2021, the balance of Japanese government bonds included within our investments and measured at fair value was ¥20.9 trillion (excluding
securities), and a majority of this amount, which has historically not fluctuated significantly over the course of a fiscal year, was classified as the principal component of liquidity reserve assets.
held-to-maturity
94
Set forth below are the averages of the daily end balances of consolidated LCR data of Mizuho Financial Group, and consolidated and
non-consolidated
LCR data of our principal banking subsidiaries, for the fourth quarter of the fiscal year ended March 31, 2021. The figures are calculated based on our financial statements prepared in accordance with Japanese GAAP and the LCR guidelines established by the Financial Services Agency. All yen figures in this table are truncated.
|
Fourth quarter of fiscal year
ended March 31, 2021
|
||||
|
(in billions of yen,
except percentages)
|
||||
|
Mizuho Financial Group (Consolidated)
|
||||
|
Total high-quality liquid assets (“HQLA”) allowed to be included in the calculation (weighted)
|
¥ | 72,792 | ||
|
Net cash outflows (weighted)
|
53,607 | |||
|
LCR
|
135.8 | % | ||
|
Mizuho Bank (Consolidated)
|
||||
|
Total HQLA allowed to be included in the calculation (weighted)
|
¥ | 69,061 | ||
|
Net cash outflows (weighted)
|
51,160 | |||
|
LCR
|
135.0 | % | ||
|
Mizuho Bank
(Non-consolidated)
|
||||
|
Total HQLA allowed to be included in the calculation (weighted)
|
¥ | 68,427 | ||
|
Net cash outflows (weighted)
|
49,601 | |||
|
LCR
|
137.9 | % | ||
|
Mizuho Trust and Banking (Consolidated)
|
||||
|
Total HQLA allowed to be included in the calculation (weighted)
|
¥ | 1,959 | ||
|
Net cash outflows (weighted)
|
1,387 | |||
|
LCR
|
141.9 | % | ||
|
Mizuho Trust and Banking
(Non-consolidated)
|
||||
|
Total HQLA allowed to be included in the calculation (weighted)
|
¥ | 1,901 | ||
|
Net cash outflows (weighted)
|
1,266 | |||
|
LCR
|
151.0 | % | ||
For more information on LCR, see “Item 4. Information on the Company—Supervision and Regulation—Liquidity.”
Capital Adequacy
All yen figures and percentages in this subsection are truncated. Accordingly, the total of each column of figures may not be equal to the total of the individual items.
Regulatory Capital Requirements
Mizuho Financial Group and its principal banking subsidiaries are subject to regulatory capital requirements administered by the Financial Services Agency in accordance with the provisions of the Banking Act and related regulations. Failure to meet minimum capital requirements may initiate certain mandatory actions by regulators that, if undertaken, could have a direct material effect on our financial condition and results of operations.
The capital adequacy guidelines applicable to Japanese banks and bank holding companies with international operations supervised by the Financial Services Agency closely follow the risk-adjusted approach proposed by BCBS and are intended to further strengthen the soundness and stability of Japanese banks. In December 2010, BCBS issued the Basel III rules text (later revised in June 2011, January 2013, October 2014 and December 2017), which presents the details of global regulatory standards on bank capital adequacy and liquidity agreed by the Governors and Heads of Supervision, which is the oversight body of BCBS, and endorsed
95
by the G20 Leaders at the Seoul summit in November 2010. The rules text sets out higher and better-quality capital, better risk coverage, the introduction of a leverage ratio as a backstop to the risk-based requirement, and the introduction of the capital conservation buffer and countercyclical capital buffer as measures to promote the
build-up
of capital that can be drawn down in periods of stress, and the introduction of two global liquidity standards. The Financial Services Agency’s revisions to its capital adequacy guidelines became effective from March 31, 2013, which generally reflect the rules in the Basel III rules text that have been applied from January 1, 2013. The framework of Basel III is based on the following three pillars: minimum capital requirements; supervisory review; and market discipline. Under the first pillar, the capital ratio is calculated by dividing regulatory capital, or risk-based capital, by risk-weighted assets. Under the second pillar, banks are required to maintain adequate capital to support all of the major risks in their business and are encouraged to develop and use better risk management techniques in monitoring and managing such risks. Under the third pillar, banks are required to enhance disclosure, including disclosure of details of the capital adequacy ratio, the amount of each type of risk and the method of calculation used so that the market may make more effective evaluations.
With regard to risk-based capital, the guidelines based on Basel III set out higher and better-quality capital standards compared to those under Basel II, which had been effective until Basel III was applied. The guidelines based on Basel III require a target minimum standard capital adequacy ratio of 8%, Tier 1 capital ratio of 6% and Common Equity Tier 1 capital ratio of 4.5%, on both a consolidated and
non-consolidated
basis for banks with international operations, such as Mizuho Bank and Mizuho Trust & Banking, or on a consolidated basis for bank holding companies with international operations, such as Mizuho Financial Group.
Risk-based capital, calculated from financial statements prepared under Japanese GAAP, is classified into the following two tiers: Tier 1 capital; and Tier 2 capital. Tier 1 capital consists of Common Equity Tier 1 capital and Additional Tier 1 capital. Common Equity Tier 1 capital generally consists of common stock, capital surplus, retained earnings, accumulated other comprehensive income and other disclosed reserves and others less any regulatory adjustments. Additional Tier 1 capital generally consists of instruments issued by a bank or its holding company that meet the criteria for inclusion in Additional Tier 1 capital and others less any regulatory adjustments. Tier 2 capital generally consists of instruments issued by a bank or its holding company such as subordinated debt that meet the criteria for inclusion in Tier 2 capital, general reserve for possible losses on loans (equaling the sum of (i) the excess of the amount of qualified reserves over the amount of expected losses and (ii) the amount of general reserves calculated based on the standardized approach) and others less any regulatory adjustments. Regulatory adjustments such as goodwill and other intangibles, and defined benefit pension fund assets and liabilities, are to be applied mainly to the calculation of Common Equity Tier 1 capital in the form of deductions.
Under Basel III, capital instruments that no longer qualify as Additional Tier 1 capital or Tier 2 capital are being phased out beginning March 2013 by increments of 10% until becoming fully effective in March 2022. Our existing subordinated debt issued before March 2013 (the amounts thereof included within Tier 2 capital as of March 31, 2021 being ¥168.7 billion) are subject to the
phase-out
arrangements.
In November 2011, the Financial Stability Board (“FSB”) published policy measures to address the systemic and moral hazard risks associated with systemically important financial institutions. The policy measures include requirements for
G-SIBs
to have additional loss absorption capacity tailored to the impact of their default, ranging from 1% to 2.5% of risk-weighted assets, to be met with Common Equity Tier 1 capital, which would be in addition to the minimum Common Equity Tier 1 capital ratio of 4.5%, the capital conservation buffer of 2.5% and the countercyclical capital buffer. We were included in the list of
G-SIBs
updated in November 2020 and were allocated to the category that would require 1.0% of additional loss absorbency.
In November 2015, the Financial Services Agency published the revised capital adequacy guidelines to introduce the Basel III rules text regarding the capital conservation buffer, the countercyclical capital buffer and the additional loss absorption capacity requirement for
G-SIBs
and domestic systemically important banks
96
(“D-SIBs”).
These guidelines became effective on March 31, 2016. The capital conservation buffer, the countercyclical capital buffer and the additional loss absorption capacity requirement for
G-SIBs
and
D-SIBs
must be met with Common Equity Tier l capital under the revised guidelines, and if such buffer and requirement are not satisfied, a capital distribution constraints plan is required to be submitted to the Financial Services Agency and carried out. The capital conservation buffer became fully effective in March 2019 at 2.5%. In addition, subject to national discretion by the respective regulatory authorities, if the relevant national authority judges a period of excess credit growth to be leading to the
build-up
of system-wide risk, a countercyclical capital buffer ranging from 0% to 2.5% would also be imposed on banking organizations. The countercyclical capital buffer is a weighted average of the buffers deployed across all the jurisdictions to which the banking organization has credit exposures.
In December 2015, the Financial Services Agency published a capital adequacy guideline regarding the designation of
G-SIBs
and
D-SIBs
in Japan. We were designated as both a
G-SIB
and a
D-SIB,
and the additional loss absorption capacity requirement applicable to us was 1.0% on a fully effective basis. The additional loss absorption capacity requirement was the same as that imposed by the FSB, which became fully effective in March 2019 at 1.0%.
The Leverage Ratio framework is critical and complementary to the risk-based capital framework that will help ensure broad and adequate capture of both
on-
and
off-balance
sheet sources of banks’ leverage. This simple,
non-risk-based
measure is intended to restrict the
build-up
of excessive leverage in the banking sector to avoid destabilizing deleveraging processes that can damage the broader financial system and the economy. Implementation of the leverage ratio requirements began with bank-level reporting to national supervisors of the leverage ratio and its components, and public disclosure is required from January 2015. Basel III’s leverage ratio is defined as the “capital measure” (numerator) divided by the “exposure measure” (denominator) and is expressed as a percentage. The capital measure is defined as Tier 1 capital, and the minimum leverage ratio is defined as 3%.
The Financial Services Agency applied the requirement to meet the minimum leverage ratio for bank holding companies and banks with international operations from March 31, 2019. The minimum leverage ratio is defined as 3% on a consolidated basis for bank holding companies with international operations, such as Mizuho Financial Group, or on both a consolidated and
non-consolidated
basis for banks with international operations, such as Mizuho Bank and Mizuho Trust & Banking.
Related to regulatory capital requirements, in November 2015, the FSB issued the final TLAC standard for
G-SIBs.
The TLAC standard has been designed so that failing
G-SIBs
will have sufficient loss-absorbing and recapitalization capacity available in resolution for authorities to implement an orderly resolution.
G-SIBs
are required to meet the TLAC requirement alongside the minimum regulatory requirements set out in the Basel III framework.
Following the publication of the final TLAC standards for
basis considering the actual condition of the relevant Covered SIB in crisis. To implement this SPE resolution strategy effectively under the FSB’s final TLAC standards and the Japanese TLAC requirements, the ultimate holding company in Japan of the relevant Covered SIB designated as the resolution entity in Japan of such Covered SIB by the Financial Services Agency (the “Domestic Resolution Entity”) are required to (i) meet the minimum external TLAC requirements, and (ii) cause their material
G-SIBs
by the FSB, in April 2016, the Financial Services Agency published an explanatory paper outlining its approach for the introduction of the TLAC framework in Japan, and a revised version of this document was published in April 2018. In March 2019, the Financial Services Agency published regulatory notices and related materials to implement the TLAC requirements in Japan, which is phased in for Japanese
G-SIBs
from March 31, 2019. According to the Financial Services Agency’s approach above, which is subject to change based on future international discussions, the preferred resolution strategy for Covered SIBs is SPE resolution, in which resolution tools are applied to the ultimate holding company of a group by a single national resolution authority, although the actual measures to be taken will be determined on a
case-by-case
97
subsidiaries or material
sub-groups
that are designated as systemically important by the Financial Services Agency or that are subject to TLAC requirements or similar requirements by the relevant foreign authority to maintain a certain level of capital and debt recognized as having loss-absorbing and recapitalization capacity, or internal TLAC. Under the Japanese TLAC regulations, the Financial Services Agency designated Mizuho Financial Group as the Domestic Resolution Entity, and designated Mizuho Bank, Mizuho Trust & Banking and Mizuho Securities as Mizuho Financial Group’s material subsidiaries in Japan. External TLAC eligible instruments generally consist of instruments issued by the Domestic Resolution Entity of the relevant Covered SIB that meet the criteria for inclusion in external TLAC requirements and others less any regulatory adjustments. Internal TLAC eligible instruments generally consist of instruments issued by the material subsidiaries of the relevant Covered SIBs as systemically important by the Financial Services Agency, which are subject to the internal TLAC requirements such as subordinated debt that meet the criteria for inclusion in internal TLAC requirements and others less any regulatory adjustments.
Under the Japanese TLAC regulations,
G-SIBs
are required to meet a minimum TLAC requirement of at least 16% of the resolution group’s risk-weighted assets as from March 31, 2019 and at least 18% as from March 31, 2022. Minimum TLAC must also be at least 6% of the Basel III leverage ratio denominator from March 31, 2019, and at least 6.75% from March 31, 2022. In addition, Japanese
G-SIBs
are allowed to count the Japanese Deposit Insurance Fund Reserves in an amount equivalent to 2.5% of their consolidated risk-weighted assets from March 31, 2019, and 3.5% of their consolidated risk-weighted assets from March 31, 2022, as their external TLAC. For more information regarding the Japanese TLAC regulations, see “Item 4. Information on the Company—Supervision and Regulation—Total Loss Absorbing Capacity.”
In December 2017, the BCBS published the finalized Basel III reforms endorsed by the GHOS. The finalized reforms complement the initial phase of Basel III reforms, seek to restore credibility in the calculation of risk-weighted assets and improve the comparability of banks’ capital ratios. In addition, under the finalized Basel III reforms,
G-SIBs
are required to meet a leverage ratio buffer, which will take the form of a Tier 1 capital buffer set at 50% of the applicable
G-SIB’s
risk-weighted capital buffer, and various refinements are made to the definition of the leverage ratio exposure measure based on the text of the leverage ratio framework issued by the BCBS in January 2014. Furthermore, in January 2019, the GHOS endorsed the finalized market risk capital framework that was scheduled to take effect as of January 1, 2022, concurrent with the implementation of the finalized Basel III reforms. The revised framework was initially scheduled to mainly take effect from January 1, 2022. In March 2020, however, the GHOS announced that, in order to provide additional operational capacity for banks and supervisors to respond to the immediate financial stability priorities resulting from the impact of the coronavirus disease
(COVID-19)
on the global banking system, it endorsed a set of measures, including the deferral of the implementation date of the finalized Basel III reforms by one year to January 1, 2023, and the extension of the accompanying transitional arrangements for the output floor by one year to January 1, 2028, as well as the implementation date of the finalized market risk capital framework by one year to January 1, 2023. As a result, under the finalized Basel III reforms, the revisions to the capital floor will be phased in from January 1, 2023, with the initial capital floor of 50%, and will be fully implemented at 72.5% from January 1, 2028, and the leverage ratio requirements under the finalized definition of the leverage ratio exposure measure and the leverage ratio buffer requirement for
G-
SIBs will take effect from January 1, 2023.
Following the announcement by the GHOS described above, on March 30, 2020, the Financial Services Agency also announced that the Basel III finalization framework is scheduled to be implemented in Japan from March 2023. Furthermore, the Financial Services Agency published its draft regulatory policy directions for the implementation of the Basel III finalization framework in Japan on December 24, 2020 and the draft amendments to the regulatory notices regarding operational risk under the Basel III finalization framework on March 31, 2021. In June 2020, in coordination with the monetary policy of the Bank of Japan in response to the impact of the
COVID-19,
the Financial Services Agency amended the leverage ratio regulations and TLAC regulations which introduced the temporary measures to exclude amounts of deposits to the Bank of Japan from calculation of the leverage ratio and external TLAC ratio on total exposure basis from June 30, 2020 until
98
March 31, 2021, due to the uncertainty on the impact of
COVID-19.
In March 2021, the implementation period of such temporary measures was extended for one year until March 31, 2022. For more information, see “Item 4. Information on the Company—Supervision and Regulation—Capital Adequacy” and “Item 4. Information on the Company—Supervision and Regulation—Leverage Ratio.”
If the capital adequacy ratio or the leverage ratio of a financial institution falls below the required level, the Financial Services Agency may, depending upon the extent of capital deterioration, take certain corrective action, including requiring the financial institution to submit an improvement plan to strengthen its capital base, reduce its total assets, restrict its business operations or other actions that could have a material effect on its financial condition and results of operations. If the capital conservation buffer, the countercyclical capital buffer and the additional loss absorption capacity requirement for
G-SIBs
and
D-SIBs
are not satisfied, a capital distribution constraints plan is required to be submitted to the Financial Services Agency and carried out. The capital distribution constraints plan is required to be considered reasonable to restore the capital buffer and include restrictions on capital distributions, such as dividends, share buybacks and bonuses payments, up to a certain amount as determined depending on the level of the capital buffer.
Unless otherwise specified, the regulatory capital information set forth in this “—Capital Adequacy” is based on the current Basel III rules.
Consolidated Capital Adequacy Ratios and Leverage Ratios
Our capital adequacy ratios and leverage ratios as of March 31, 2020 and 2021, calculated in accordance with Japanese GAAP and the guidelines established by the Financial Services Agency, were as set forth in the following table:
|
As of
|
Increase
(decrease)
|
|||||||||||
|
March 31,
2020
|
March 31,
2021
|
|||||||||||
|
(in billions of yen, except percentages)
|
||||||||||||
|
Common Equity Tier 1 capital
|
¥
|
7,244.7
|
|
¥
|
7,849.9
|
|
¥
|
605.1
|
|
|||
|
Additional Tier 1 capital
|
|
1,779.6
|
|
|
1,851.9
|
|
|
72.3
|
|
|||
|
|
|
|
|
|
|
|||||||
|
Tier 1 capital
|
|
9,024.4
|
|
|
9,701.9
|
|
|
677.5
|
|
|||
|
Tier 2 capital
|
|
1,697.8
|
|
|
1,683.4
|
|
|
(14.4
|
)
|
|||
|
|
|
|
|
|
|
|||||||
|
Total capital
|
¥
|
10,722.2
|
|
¥
|
11,385.3
|
|
¥
|
663.1
|
|
|||
|
|
|
|
|
|
|
|||||||
|
Risk-weighted assets
|
¥
|
62,141.2
|
|
¥
|
67,481.9
|
|
¥
|
5,340.7
|
|
|||
|
Common Equity Tier 1 capital ratio
|
|
11.65
|
%
|
|
11.63
|
%
|
|
(0.02
|
)%
|
|||
|
Required Common Equity Tier 1 capital ratio
(1)
|
|
8.01
|
%
|
|
8.01
|
%
|
|
—
|
|
|||
|
Tier 1 capital ratio
|
|
14.52
|
%
|
|
14.37
|
%
|
|
(0.15
|
)%
|
|||
|
Required Tier 1 capital ratio
(1)
|
|
9.51
|
%
|
|
9.51
|
%
|
|
—
|
|
|||
|
Total capital ratio
|
|
17.25
|
%
|
|
16.87
|
%
|
|
(0.38
|
)%
|
|||
|
Required total capital ratio
(1)
|
|
11.51
|
%
|
|
11.51
|
%
|
|
—
|
|
|||
|
CET1 available after meeting the bank’s minimum capital requirements
|
|
7.15
|
%
|
|
7.13
|
%
|
|
(0.02
|
)%
|
|||
|
Leverage ratio
|
|
4.08
|
%
|
|
4.83
|
%
(2)
|
|
0.75
|
%
|
|||
Note:
| (1) |
The required ratios described above, as of March 31, 2020 and 2021, include the capital conservation buffer of 2.5%, the countercyclical capital buffer of 0.01%, and the additional loss absorbency requirements for
G-SIBs
and
D-SIBs
of 1.00%, which are all in addition to the regulatory minima. The respective required amounts are determined by applying the ratios to the sum of the risk-weighted assets and certain other risk amounts. These buffers and additional loss absorbency requirements are applied to us but not to our banking subsidiaries.
|
99
| (2) |
As of March 31, 2021, the leverage ratio on a consolidated basis (excluding the impact of any applicable temporary exemption of deposits with the Bank of Japan) was 4.03%.
|
Our total capital ratio as of March 31, 2021 was 16.87%, a decrease of 0.38 % points compared to March 31, 2020. Our Tier 1 capital ratio as of March 31, 2021 was 14.37%, a decrease of 0.15 % points compared to March 31, 2020. Our Common Equity Tier 1 capital ratio as of March 31, 2021 was 11.63%, a decrease of 0.02% points compared to March 31, 2020. Our total capital ratio, Tier 1 capital ratio and Common Equity Tier 1 capital ratio decreased due mainly to an increase in the risk-weighted assets partly as a result of funding support related to
COVID-19
pandemic. We believe that we were in compliance with all capital adequacy requirements to which we were subject as of March 31, 2021.
Principal Banking Subsidiaries
Capital adequacy ratios and leverage ratios of our principal banking subsidiaries, on a consolidated basis, as of March 31, 2020 and 2021, calculated in accordance with Japanese GAAP and the guidelines established by the Financial Services Agency, were as set forth in the following table:
|
As of
|
Increase
(decrease)
|
|||||||||||
|
March 31,
2020
|
March 31,
2021
|
|||||||||||
|
Mizuho Bank
|
|
|
|
|
|
|
|
|
|
|||
|
Common Equity Tier 1 capital ratio
|
|
11.39
|
%
|
|
11.11
|
%
|
|
(0.28
|
)%
|
|||
|
Tier 1 capital ratio
|
|
14.50
|
%
|
|
14.05
|
%
|
|
(0.45
|
)%
|
|||
|
Total capital ratio
|
|
17.29
|
%
|
|
16.57
|
%
|
|
(0.72
|
)%
|
|||
|
Leverage ratio
|
|
4.02
|
%
|
|
4.67
|
%
|
|
0.65
|
%
|
|||
|
Mizuho Trust & Banking
|
||||||||||||
|
Common Equity Tier 1 capital ratio
|
|
23.64
|
%
|
|
28.94
|
%
|
|
5.30
|
%
|
|||
|
Tier 1 capital ratio
|
|
23.66
|
%
|
|
28.94
|
%
|
|
5.28
|
%
|
|||
|
Total capital ratio
|
|
23.74
|
%
|
|
28.94
|
%
|
|
5.20
|
%
|
|||
|
Leverage ratio
|
|
6.79
|
%
|
|
11.41
|
%
|
|
4.62
|
%
|
|||
We believe each of our principal banking subsidiaries was in compliance with all capital adequacy requirements to which it was subject as of March 31, 2021.
Our securities subsidiary in Japan is also subject to the capital adequacy requirement under the Financial Instruments and Exchange Act. Under this requirement, securities firms whose total assets exceed ¥1 trillion, such as Mizuho Securities, must maintain a minimum capital adequacy ratio of 120% both on a consolidated and
non-consolidated
basis calculated as a percentage of capital accounts less certain assets, as determined in accordance with Japanese GAAP, against amounts equivalent to market, counterparty and basic risks. Specific guidelines are issued as a ministerial ordinance and a regulatory notice that detail the definition of essential components of the capital ratios, including capital, disallowed assets and risks, and related measures. Failure to maintain a minimum capital ratio will trigger mandatory regulatory actions. For example, each on a
non-consolidate
basis, a capital ratio of less than 140% will call for regulatory reporting, a capital ratio of less than 120% may lead to an order to change the business conduct or place the property in trust and a capital ratio of less than 100% may lead to a temporary suspension of all or part of the business operations and further, to the cancellation of the license to act as a securities broker and dealer. We believe, as of March 31, 2021, that our securities subsidiary in Japan was in compliance with all capital adequacy requirements to which it was subject.
Off-balance-sheet
Arrangements
We engage in various types of
off-balance-sheet
arrangements in the ordinary course of our business to meet the financing needs of our customers. These arrangements include various guarantees and commitments. The
100
following tables show the contractual or notional amounts of our guarantees and undrawn commitments as of March 31, 2020 and 2021:
|
As of March 31,
|
Increase
(decrease)
|
|||||||||||
|
2020
|
2021
|
|||||||||||
|
(in billions of yen)
|
||||||||||||
|
Guarantees:
|
||||||||||||
|
Performance guarantees
|
¥ | 2,456 | ¥ | 2,730 | ¥ | 274 | ||||||
|
Guarantees on loans
|
301 | 348 | 47 | |||||||||
|
Guarantees on securities
|
110 | 79 | (31 | ) | ||||||||
|
Other guarantees
|
2,314 | 2,390 | 76 | |||||||||
|
Guarantees for the repayment of trust principal
|
59 | 28 | (31 | ) | ||||||||
|
Liabilities of trust accounts
|
446 | 480 | 34 | |||||||||
|
Derivative financial instruments
|
21,756 | 23,933 | 2,177 | |||||||||
|
As of March 31,
|
Increase
(decrease)
|
|||||||||||
|
2020
|
2021
|
|||||||||||
|
(in billions of yen)
|
||||||||||||
|
Commitments:
|
||||||||||||
|
Commitments to extend credit
|
¥ | 76,633 | ¥ | 93,999 | ¥ | 17,366 | ||||||
|
Commercial letters of credit
|
690 | 797 | 107 | |||||||||
|
|
|
|
|
|
|
|||||||
|
Total commitments
|
¥ | 77,323 | ¥ | 94,796 | ¥ | 17,473 | ||||||
|
|
|
|
|
|
|
|||||||
See note 23 to our consolidated financial statements included elsewhere in this annual report for the description of the nature of the various types of guarantees and commitments.
The contractual or notional amounts of these instruments generally represent the maximum potential amounts of future payments without consideration of possible recoveries under recourse provisions or from collateral held. For example, the amount under commitments to extend credit does not necessarily equal the impact that such commitment will have on our future cash flow, because many of these commitments expire without our making actual credit extensions up to the full commitment amount or at all. Also, many of the agreements related to the commitments to extend credit include terms that allow us to refuse, or reduce the amount of, credit extensions based on changes in the financial environment, declines in the obligor’s credit quality and other reasons. Finally, we receive collateral such as real estate and securities at the time of the contract as we deem necessary, and we regularly review the credit quality of the customer based on the internal guidelines and revise the terms of the contract as we deem necessary to manage credit risks.
Some of our
off-balance-sheet
arrangements are related to activities of special purpose entities, most of which are variable interest entities. For further information, see note 24 to our consolidated financial statements included elsewhere in this annual report.
101
Tabular Disclosure of Contractual Obligations
In the normal course of business, we enter into contractual obligations that require future cash payments. The following table sets forth a summary of our contractual cash obligations as of March 31, 2021:
|
Due in one
year or less
|
Due from
one year to
two years
|
Due from
two years to
three years
|
Due from
three years to
four years
|
Due from
four years to
five years
|
Due after
five years
|
Total
|
||||||||||||||||||||||
|
(in billions of yen)
|
||||||||||||||||||||||||||||
|
Time deposits
|
¥ | 31,711 | ¥ | 1,534 | ¥ | 1,154 | ¥ | 356 | ¥ | 353 | ¥ | 200 | ¥ | 35,308 | ||||||||||||||
|
Certificates of deposit
|
16,871 | 164 | 73 | 84 | 1 | — | 17,193 | |||||||||||||||||||||
|
Long-term debt
|
1,380 | 1,348 | 811 | 1,366 | 580 | 6,221 | 11,706 | |||||||||||||||||||||
|
Finance leases
|
5 | 3 | 1 | — | — | — | 9 | |||||||||||||||||||||
|
Operating leases
|
95 | 64 | 57 | 50 | 41 | 357 | 664 | |||||||||||||||||||||
|
|
|
|
|
|
|
|
|
|
|
|
|
|
|
|||||||||||||||
|
Total
(1)(2)
|
¥ | 50,057 | ¥ | 3,110 | ¥ | 2,095 | ¥ | 1,856 | ¥ | 975 | ¥ | 6,778 | ¥ | 64,871 | ||||||||||||||
|
|
|
|
|
|
|
|
|
|
|
|
|
|
|
|||||||||||||||
Notes:
| (1) |
Contribution paid to our pension plans, which is not included in the above table, is expected to be approximately ¥31 billion in the fiscal year ending March 31, 2022, based on the current funded status and expected asset return assumptions. For further information, see note 20 to our consolidated financial statements included elsewhere in this annual report.
|
| (2) |
The amount of unrecognized tax benefits, which is not included in the above table, was ¥4.4 billion, of which ¥1.5 billion was interest and penalties, as of March 31, 2021. For further information, see note 19 to our consolidated financial statements included elsewhere in this annual report.
|
Recent Accounting Pronouncements
See note 2 to our consolidated financial statements included elsewhere in this annual report.
102
Reconciliation with Japanese GAAP
Our consolidated financial statements are prepared in accordance with accounting principles and policies as summarized in note 1 to our consolidated financial statements included elsewhere in this annual report. These principles and policies differ in some respects from Japanese GAAP. For reporting based on Japanese banking regulations, we prepare our annual financial results using financial statements in accordance with Japanese GAAP. In addition, pursuant to the Japanese securities law and the requirements of the Tokyo Stock Exchange, we prepare quarterly financial statements which are also under Japanese GAAP. To show the major reconciling items between our U.S. GAAP financial statements and our Japanese GAAP financial statements, we have provided below, with respect to our most recent fiscal year, a reconciliation of consolidated net income and shareholders’ equity under U.S. GAAP with those amounts under Japanese GAAP.
|
As of and for the fiscal
year ended March 31, 2021
|
||||||||
|
Total MHFG
shareholders’
equity
|
Net income
attributable
to MHFG
shareholders
|
|||||||
|
(in billions of yen)
|
||||||||
|
U.S. GAAP
|
¥ | 9,105.3 | ¥ | 581.7 | ||||
|
Differences arising from different accounting for:
|
||||||||
|
1. Derivative financial instruments and hedging activities
|
53.8 | 84.9 | ||||||
|
2. Investments
|
(108.4 | ) | (526.1 | ) | ||||
|
3. Loans
|
193.6 | 16.9 | ||||||
|
4. Allowances for credit losses on loans and
off-balance-sheet
instruments
|
183.5 | (83.3 | ) | |||||
|
5. Premises and equipment
|
(270.2 | ) | 56.8 | |||||
|
6. Land revaluation
|
163.9 | (5.6 | ) | |||||
|
7. Business combinations
|
(79.6 | ) | 0.7 | |||||
|
8. Pension liabilities
|
90.6 | 153.2 | ||||||
|
9. Consolidation of variable interest entities
|
69.8 | 126.3 | ||||||
|
10. Deferred taxes
|
(158.6 | ) | 42.1 | |||||
|
11. Foreign currency translation
|
— | 27.6 | ||||||
|
12. Other
|
12.7 | (4.2 | ) | |||||
|
|
|
|
|
|||||
|
Japanese GAAP
|
¥ | 9,256.4 | ¥ | 471.0 | ||||
|
|
|
|
|
|||||
Note:
| (1) |
Includes total accumulated other comprehensive income and stock acquisition rights
|
The following is a summary of the significant adjustments made to consolidated shareholders’ equity and net income, as shown in the above table, to reconcile the U.S. GAAP results with the Japanese GAAP results. The paragraphs below refer to the corresponding items set forth in the table above.
1. Derivative financial instruments and hedging activities
Under U.S. GAAP, for a derivative to qualify for hedge accounting, it must be highly effective in achieving offsetting changes in fair values or variable cash flows of the hedged items attributable to the particular risk being hedged. The hedging relationship must be designated and formally documented at inception. Such documentation must include the particular risk management objective and strategy for the hedge, the identification of the derivative used as the hedging instrument, the hedged item and the risk exposure being hedged and the method for assessing the hedge effectiveness. The criteria for designation and measurement of hedge effectiveness under U.S. GAAP are more rigorous than under Japanese GAAP. As a result, most of the eligible hedge derivatives under Japanese GAAP are accounted for as trading account assets or liabilities under U.S. GAAP with changes in fair value of the derivatives recognized in earnings.
103
Requirements for bifurcation of embedded derivatives differ between Japanese GAAP and U.S. GAAP. Embedded derivatives that are deemed to be clearly and closely related to their host contracts are not bifurcated under U.S. GAAP, while Japanese GAAP allows an entity to bifurcate embedded derivatives if the entity manages the risk of the embedded derivatives and host contracts separately. Bifurcated derivatives are recorded on the balance sheet at fair value with changes in fair value recognized in earnings under both Japanese GAAP and U.S. GAAP.
2. Investments
The cost basis of certain investments differs between Japanese GAAP and U.S. GAAP primarily due to the following reasons:
Under U.S. GAAP, equity securities (except those accounted for under the equity method of accounting or those that result in consolidation of the investee) are measured at fair value with changes in fair value recognized in earnings, while under Japanese GAAP, those securities are measured at fair value with changes in fair value recognized in other comprehensive income.
Under U.S. GAAP, we report foreign currency denominated debt securities as trading securities, and the entire amount of changes in their fair values are recognized in earnings, while under Japanese GAAP, only the changes attributable to movements in foreign currency exchange rates are recognized in earnings.
Under U.S. GAAP,
debt securities are impaired if the fair value is less than the amortized cost (excluding accrued interest receivable). For
debt securities, in the cases where we have the intent to sell an
debt security or more likely than not will be required to sell an
debt security before the recovery of its amortized cost basis, the entire difference between amortized cost basis and fair value is recognized immediately through earnings. In other cases, we evaluate expected cash flows to be received and determine if a credit loss exists, and if so, the amount of the credit loss is recognized in provision (credit) for credit losses, while the remaining decline in fair value is recognized in other comprehensive income, net of applicable taxes. Under Japanese GAAP, significant declines in the fair value of securities below cost that are deemed to be “other-than-temporary” are recorded in earnings unless short term recovery is reasonably expected. A decline in the fair value of a security of 50% or more of its cost is a strong indicator of an other-than-temporary decline, which requires compelling evidence to prove otherwise. A decline in the fair value of 30% or more but less than 50% of its cost is an indicator of an other-than-temporary decline, in which case the probability of recovery must be evaluated to determine whether an other-than-temporary decline has occurred. Generally, if the decline in the fair value is less than 30%, it is not considered to be an other-than-temporary decline.
available-for-sale
available-for-sale
available-for-sale
available-for-sale
3. Loans
Under U.S. GAAP, loan origination fees, net of certain direct origination costs, are deferred and recognized in interest income over the contractual life of the relevant loan using the interest method, while certain fees and costs are recognized in earnings at the time the loan is originated under Japanese GAAP.
In addition, certain loan participations and sales of loans to special purpose vehicles in connection with asset securitization transactions under Japanese GAAP do not meet sales criteria under U.S. GAAP due to different applicable criteria, and therefore the relevant loans are recognized on the balance sheet under U.S. GAAP.
4. Allowances for credit losses on loans and
off-balance-sheet
instruments
Effective April 1, 2020, the allowance for credit losses on loans was established for current expected credit losses on our loan portfolio in accordance with ASC 326. The allowance considers expected credit losses over the remaining expected lives of the applicable instruments. The expected life of each loan is determined by
104
considering expected prepayments, contractual terms and cancellation features. When determining expected credit losses, a single forward-looking macroeconomic scenario is considered over a reasonable and supportable forecast period. This forward-looking macroeconomic scenario is consistent with what is used in our stress testing and is in line with the scenario used for our business plan. If the scenario does not reflect a sudden change in economic conditions adequately, it could be possible to make adjustments to the scenario. After the forecast period, we revert to long-term historical loss experience with a certain graduated transition period, to estimate losses over the remaining lives of loans.
In general, we estimate expected credit losses collectively on the loans in the case of “normal obligors and Watch Obligors”, considering the risk associated with a particular pool and the probability that the exposures within the pool will deteriorate or default. The estimation of expected credit losses that are evaluated collectively begins with a quantitative calculation that considers the likelihood of the borrower changing delinquency status or moving from one obligor category or rating to another. The quantitative calculation covers expected credit losses over an instrument’s expected life and is estimated by applying credit loss factors to our estimated exposure at default. Under Japanese GAAP, a collective allowance is generally estimated using historical loss experience based on historical results according to the obligor ratings, whereas under U.S. GAAP the allowance is based on the methodology that reflects expected credit losses over the remaining lives and requires consideration of a broader range of information such as relevant information about past events supportable forecasts, inclusive of macroeconomic assumptions, and the expected life of the loan.
Under both Japanese GAAP and U.S. GAAP, the allowance for credit losses for specifically identified nonaccrual loans is based on the present value of expected future cash flows discounted at the loan’s initial effective interest rate or, as a practical expedient, the loan’s observable market price or the fair value of the collateral if the loan is collateral dependent. The differences between Japanese GAAP and U.S. GAAP arise from the difference in the scope of the loans that are subject to the individual and portfolio nonaccrual analysis.
In addition to these effects based on differences between Japanese GAAP and U.S. GAAP, due to the difference in the timing of public filings between our consolidated financial statements under U.S. GAAP and those under Japanese GAAP, we evaluate newly available information such as macroeconomic assumptions and obligor credit worthiness, which could result in the allowance for credit losses on loans being different between Japanese GAAP and U.S. GAAP .
This reconciling item also includes the differences between U.S. GAAP and Japanese GAAP relating to the allowance for credit losses on
off-balance-sheet
instruments. We generally use the same methodology to reserve for losses on these instruments as we do for loans.
5. Premises and equipment
Under Japanese GAAP, a company can elect to allocate entity-wide long-lived assets that do not have identifiable cash flows that are largely independent of the cash flows of other assets and liabilities, among individual divisions within an entity, whereas U.S. GAAP does not have such an election. Under Japanese GAAP, we have been making this election since the fiscal year ended March 31, 2019.
Under U.S. GAAP, the fair value of a
non-monetary
asset acquired in exchange for another
non-monetary
asset is generally deemed to be the new cost of the asset acquired in the exchange, and a gain or loss is recognized on the exchange. Under Japanese GAAP, the cost of the asset surrendered is assigned to the newly acquired asset in certain types of exchange transactions, resulting in no gains or losses.
With regard to
internal-use
software, under U.S. GAAP, the costs to develop or obtain software that allow for access to or conversion of old data by new systems are capitalized and amortized once the software is ready for its intended use, while they are expensed after full implementation across the company under Japanese GAAP. On the other hand, the general and administrative costs and the overhead costs are expensed as the costs of
internal-use
software under U.S. GAAP, but they are capitalized under Japanese GAAP.
105
6. Land revaluation
Under Japanese GAAP, we revalued our holdings of land during the fiscal year ended March 31, 1998 pursuant to the Act Concerning Revaluation of Land (Act No. 34 of 1998). The revaluation gains are recorded directly in equity, and the related deferred tax liabilities are also recognized. Under U.S. GAAP, there is no applicable provision that allows for the revaluation of land other than for impairments, and accordingly the revaluation gains are reversed.
7. Business combinations
Under U.S. GAAP, goodwill is not amortized and an impairment loss is recorded to the extent the carrying amount of the goodwill exceeds its estimated fair value at the measurement date. Under Japanese GAAP, goodwill is amortized over an appropriate period not to exceed 20 years and an impairment loss is recorded only if the effects of the goodwill are no longer expected.
8. Pension liabilities
Under Japanese GAAP, we adopted as of April 1, 2000 pension accounting that is based on the actuarial present value of accrued benefit obligations. The cumulative effect of the accounting change was amortized over a specified number of years, and actuarial gains and losses are amortized over a specified number of years. Under U.S. GAAP, we recalculated the benefit obligation at April 1, 2004 and accounted for the obligation as if we had adopted the accounting method in accordance with ASC 715, “Compensation—Retirement Benefits,” beginning in the fiscal year ended March 31, 1990, as permitted for a foreign private issuer. The cumulative effect of the accounting change, as well as actuarial gains and losses since the adoption, had been fully amortized by April 1, 2004.
Under both Japanese GAAP and U.S. GAAP, an employer is required to recognize the overfunded or underfunded status of a defined benefit plan as an asset or liability in its consolidated balance sheets. Actuarial gains or losses and prior service costs or benefits that have not yet been recognized through earnings as net periodic benefit cost are recognized in other comprehensive income, net of tax, until they are amortized as a component of net periodic benefit cost. Actuarial gains or losses are amortized based on the corridor approach according to ASC 715 under U.S. GAAP, while they are amortized over a specified number of years under Japanese GAAP. Due mainly to the differences in the balances of actuarial gains or losses and prior service costs or benefits and in amortization methods, there are differences in the amounts of shareholders’ equity and net income between U.S. GAAP and Japanese GAAP.
Under U.S. GAAP, we enhanced the calculation of the benefit obligations by refining the anticipated future mortality rate assumption improvement in the calculation.
During the fiscal year ended March 31, 2021, a subsidiary of ours partially withdrew assets from employee retirement benefit trusts, which were established for the payment of employees’ severance pay and retirement pensions. Under U.S. GAAP, no gains or losses have been recognized as a consequence of this transaction.
See note 20 to our consolidated financial statements included elsewhere in this annual report for further discussion.
9. Consolidation of variable interest entities
Under U.S. GAAP, variable interest entities are to be consolidated if we are deemed to be the primary beneficiary of the variable interest entity. Under Japanese GAAP, consolidation is not based on variable interests. We consolidate certain variable interest entities, such as entities related to asset-backed securitizations, investments in securitization products and investment funds. See note 24 to our consolidated financial statements included elsewhere in this annual report for further discussion.
106
10. Deferred taxes
Under U.S. GAAP, all available evidence, both positive and negative, must be considered to determine whether, based on the weight of that evidence, deferred tax assets are realizable or whether a valuation allowance is needed. Possible sources of taxable income, which are considered to determine whether deferred tax assets are realizable, include net unrealized gains on
securities. Under Japanese GAAP, the assessment as to whether deferred tax assets are realizable is primarily based on estimates of future taxable income.
available-for-sale
Additionally, differences in the carrying amount of assets and liabilities between U.S. GAAP and Japanese GAAP create temporary differences that result in differences in deferred tax assets and liabilities.
11. Foreign currency translation
Under Japanese GAAP, the income statement items of our foreign entities are translated into yen, our presentation currency, using the respective
fiscal-year-end
exchange rates, while under U.S. GAAP, they are translated into the presentation currency using the average rates of exchange for the respective fiscal years.
12. Other
This adjustment reflects the effects of miscellaneous items.
107
|
ITEM 6.
|
DIRECTORS, SENIOR MANAGEMENT AND EMPLOYEES
|
6.A. Directors and Senior Management
Directors
Shown below is information regarding the directors of Mizuho Financial Group as of July 1, 2021:
|
Name
|
Age
|
Director Type
|
Chair
of the Board
|
Committee Membership
|
||||||||||||
|
Nominating
|
Compensation
|
Audit
|
Risk
(4)
|
|||||||||||||
|
Tatsufumi Sakai
|
61 |
Executive
(1)
|
— | — | — | — | — | |||||||||
|
Seiji Imai
|
59 |
Executive
(1)
|
— | — | — | — | — | |||||||||
|
Makoto Umemiya
|
56 |
Executive
(1)
|
— | — | — | — | — | |||||||||
|
Motonori Wakabayashi
|
56 |
Executive
(1)
|
— | — | — | — | — | |||||||||
|
Nobuhiro Kaminoyama
|
53 |
Executive
(1)
|
— | — | — | — | — | |||||||||
|
Yasuhiro Sato
|
69 |
Non-executive
(2)
|
— | — | — | — | — | |||||||||
|
Hisaaki Hirama
|
58 |
Non-executive
(2)
|
— | — | — | Member |
Chair
|
|||||||||
|
Tatsuo Kainaka
|
81 |
Independent
(3)
|
— |
Chair
|
Member | Member | — | |||||||||
|
Yoshimitsu Kobayashi
|
74 |
Independent
(3)
|
— | Member | — | — | — | |||||||||
|
Ryoji Sato
|
74 |
Independent
(3)
|
— | — | — | Member | — | |||||||||
|
Takashi Tsukioka
|
70 |
Independent
(3)
|
— | Member | Member |
Chair
|
— | |||||||||
|
Masami Yamamoto
|
67 |
Independent
(3)
|
— | Member |
Chair
|
— | — | |||||||||
|
Izumi Kobayashi
|
62 |
Independent
(3)
|
Chair
|
Member | — | — | Member | |||||||||
Notes:
| (1) |
Directors concurrently serving as executive officers.
|
| (2) |
Directors not concurrently serving as executive officers, employees or executive directors of Mizuho Financial Group or its subsidiaries.
|
| (3) |
Directors satisfying the requirements for outside directors, as defined in the Companies Act of Japan, and those for independent directors, as defined both by the Tokyo Stock Exchange and by Mizuho Financial Group.
|
| (4) |
Risk Committee consists of the two directors and two outside experts, who are not directors.
|
The directors’ current positions, key business experiences in the past and major concurrent offices (if any) are as follows:
Mr. Tatsufumi Sakai
Mr. Seiji Imai
Mr. Makoto Umemiya
108
Mr. Motonori Wakabayashi
Mr. Nobuhiro Kaminoyama
Mr. Yasuhiro Sato
non-executive
Member of the Board of Directors and Chairman (
Kaicho
Note: Chairman (Kaicho) Sato engages in the company’s external activities, but does not chair the Board meetings. The Board meetings are chaired by the independent director chair Izumi Kobayashi.
Mr. Hisaaki Hirama
non-executive
Member of the Board of Directors since June 2019. Previously, he had been Head of Internal Audit Group of Mizuho Bank from April 2017 to April 2019; Executive Officer, General Manager of Nagoya Corporate Branch of Mizuho Bank from April 2015 to April 2017; and Executive Officer, General Manager of Marunouchi-Chuo Branch Division No.1 of Mizuho Bank from April 2014 to April 2015.
Mr. Tatsuo Kainaka
Attorney-at-law
Mr. Yoshimitsu Kobayashi
Mr. Ryoji Sato
Mr. Takashi Tsukioka
Mr. Masami Yamamoto
Ms. Izumi Kobayashi
109
Executive Officers
Shown below are information regarding the executive officers of Mizuho Financial Group as of July 1, 2021:
|
Name
|
Age
|
Title
|
Area of Oversight
|
|||||
|
Tatsufumi Sakai
(1)
|
61 |
President & CEO
(2)
|
Chief Executive Officer of Mizuho group (Group CEO) | |||||
|
Seiji Imai
(1)
|
59 |
Deputy President & Senior Executive Officer
(2)
|
Head of Corporate & Institutional Company /
Head of Global Corporate Company
|
|||||
|
Satoshi Ishii
|
57 |
Senior Executive Officer
(2)
|
Group Chief Digital Innovation Officer (Group CDIO)/ Head of IT & Systems Group (Group CIO)/ Head of Operations Group (Group COO) | |||||
|
Masahiro Otsuka
|
59 | Senior Executive Officer | Head of Retail & Business Banking Company | |||||
|
Naofumi Fuke
|
63 | Senior Executive Officer |
Co-Head
of Retail & Business Banking Company
|
|||||
|
Masatoshi Yoshihara
|
58 | Senior Executive Officer |
Co-Head
of Global Markets Company
|
|||||
|
Yasuhiro Shibata
|
57 | Senior Executive Officer |
Co-Head
of Global Markets Company
|
|||||
|
Masamichi Ishikawa
|
57 | Senior Executive Officer | Head of Asset Management Company / Deputy Head of Strategic Planning Group | |||||
|
Masahiro Kihara
|
55 | Senior Executive Officer | Head of Global Products Unit / Deputy Head of Corporate & Institutional Company / Deputy Head of Global Corporate Company | |||||
|
Yasuhiko Ushikubo
|
54 | Senior Executive Officer | Head of Research & Consulting Unit | |||||
|
Naoshi Inomata
|
54 | Senior Executive Officer | Head of Strategic Planning Group (Group CSO) | |||||
|
Makoto Umemiya
(1)
|
56 | Senior Executive Officer | Head of Financial Control & Accounting Group (Group CFO) | |||||
|
Motonori Wakabayashi
(1)
|
56 | Senior Executive Officer | Head of Risk Management Group (Group CRO) | |||||
|
Nobuhiro Kaminoyama
(1)
|
53 | Senior Executive Officer | Head of Human Resources Group (Group CHRO) | |||||
|
Koji Yonei
|
59 | Senior Executive Officer |
Co-Head
of IT & Systems Group
|
|||||
|
Masaomi Takada
|
54 | Senior Executive Officer | Head of Compliance Group (Group CCO) | |||||
|
Hisashi Kikuchi
|
55 | Senior Executive Officer | Head of Internal Audit Group (Group CA) | |||||
Notes:
| (1) |
Executive officers concurrently serving as directors.
|
| (2) |
Representative Executive Officer.
|
The executive officers’ current positions, key business experiences in the past and major concurrent offices (if any) are as follows:
For information on
see “—Directors.”
Messrs. Tatsufumi Sakai, Seiji imai, Makoto Umemiya, Motonori Wakabayash, and Nobuhiro Kaminoyama,
Mr. Satoshi Ishii
Mr. Masahiro Otsuka
110
April 2019; Deputy Head of Retail & Business Banking Company or in charge of similar responsibilities from April 2015 to April 2017; and General Manager of Retail Banking Coordination Division from April 2012 to April 2015. He concurrently serves as President & CEO of Mizuho Research & Technologies, Ltd.
Mr. Naofumi Fuke
Co-Head
of Retail & Business Banking Company since April 2020. Previously, he had been Head of Retail & Business Banking Division of Mizuho Securities or in charge of similar responsibilities from May 2016 to April 2021; Chairman (Representative Director) of Nikko Systems Solutions, Ltd. from April 2014 to April 2016; and Senior Executive Managing Director of Nikko Cordial Securities Inc. / SMBC Nikko Securities Inc. from December 2008 to April 2014.
Mr. Masatoshi Yoshihara
Co-Head
of Global Markets Company since April 2020. Previously, he had been Deputy Head of Global Markets Company or in charge of similar responsibilities; and Executive Officer, General Manager of International Treasury Division of Mizuho Bank.
Mr. Yasuhiro Shibata
Co-Head
of Global Markets Company since April 2020. Previously, he had been Head of Global Markets Division of Mizuho Securities from April 2019 to April 2020; Deputy President of Mizuho Securities USA LLC from December 2017 to April 2019; and
Co-Head
of Fixed Income Business Division of Mizuho Securities from April 2016 to December 2017. He concurrently serves as Managing Executive Officer of Mizuho Bank and Mizuho Trust & Banking.
Mr. Masamichi Ishikawa
Mr. Masahiro Kihara
Mr. Yasuhiko Ushikubo
Mr. Naoshi Inomata
Mr. Koji Yonei
Co-Head
of IT & Systems Group since July 2021. Previously, he had been Vice President, COO of MI Digital Services Co., Ltd; and Deputy Head of IT & Systems Group or in charge of similar responsibilities from April 2013 to April 2020. He concurrently serves as Deputy President & Executive Officer of Mizuho Bank.
Mr. Masaomi Takada
Mr. Hisashi Kikuchi
111
2020; Member of the Board of Directors from June 2018 to June 2019; and General Manager of Corporate Secretariat from April 2015 to June 2018. He concurrently serves as Member of the Board of Directors (Audit & Supervisory Committee Member) of Mizuho Bank, Mizuho Trust & Banking and Mizuho Securities; and Audit & Supervisory Board Member of Mizuho Research & Technologies, Ltd.
No family relationship exists among any of the directors and executive officers.
6.B. Compensation
Mizuho Financial Group transformed from a Company with Audit & Supervisory Board into a Company with Three Committees on June 24, 2014. The following provides information before and after the transformation.
Before the transformation, in accordance with the Companies Act, as a Company with Audit & Supervisory Board, compensation for directors and audit & supervisory board members, including bonuses, retirement allowances and incentive stock options, needed to be approved at general meetings of shareholders, as the articles of incorporation did not specify otherwise. The shareholders’ approval specified the upper limit of the aggregate amount of compensation and included the description of benefits in kind. Compensation for a director or audit & supervisory board member was fixed by the Board of Directors or by consultation among audit & supervisory board members in accordance with Mizuho Financial Group’s internal regulations and practice and, in the case of retirement allowances, generally reflected the position of the director or audit & supervisory board member at the time of retirement, the length of his service as a director or audit & supervisory board member and his contribution to the company’s performance.
After the transformation, in accordance with the Companies Act, as a Company with Three Committees, compensation for each individual director and executive officer as defined in the Companies Act, including bonuses, retirement allowances, incentive stock options, performance payments and stock compensation, needs to be determined at the Compensation Committee, which is required to consist of at least three directors and the majority of which is required to consist of outside directors. See “Item 6. C. Board Practices” for more information regarding Mizuho Financial Group’s corporate governance.
The aggregate compensation paid by Mizuho Financial Group and its subsidiaries to the directors and executive officers as defined in the Companies Act of Mizuho Financial Group for the fiscal years ended March 31, 2021 (basic salaries, stock compensation I (paid or expected to be paid at the time of retirement) and others) and March 31, 2020 (performance payments and stock compensation II (paid during the term in office)) are shown on the following table:
|
Classification
|
Number of
Persons (Note 2) |
Aggregate
Amount of Compensation (in millions of yen) (Note 3) |
Aggregate Amounts of Compensation by Type (in millions of yen)
|
|||||||||||||||||||||||||||||||||||||||||||||
|
For the fiscal year ended
March 31, 2021 |
For the fiscal year ended
March 31, 2020 |
|||||||||||||||||||||||||||||||||||||||||||||||
|
Basic Salaries
|
Stock
Compensation I
(paid or
expected to be
paid at the time
of retirement)
|
Other
|
Performance
Payments |
Stock
Compensation II
(paid during the
term in office)
|
||||||||||||||||||||||||||||||||||||||||||||
|
Number
of
Persons
|
Amount
|
Number
of Persons |
Amount
|
Number
of Persons |
Amount
|
Number
of Persons |
Amount
|
Number
of Persons |
Amount
|
|||||||||||||||||||||||||||||||||||||||
|
Directors
|
10 | 242 | 10 | 210 | 8 | 31 | 10 | 0 | — | — | — | — | ||||||||||||||||||||||||||||||||||||
|
Executive officers as defined in the Companies Act
|
20 | 1,054 | 16 | 674 | 16 | 71 | 16 | 0 | 12 | 165 | 12 | 142 | ||||||||||||||||||||||||||||||||||||
112
Notes:
| (1) |
Fractions are rounded down.
|
| (2) |
With respect to the number of persons, the directors and executive officers as defined in the Companies Act who were actually paid or expected to be paid for the fiscal years ended March 31, 2020 and 2021 are stated.
|
| (3) |
With respect to the amounts, the aggregate amounts paid or expected to be paid for the fiscal years ended March 31, 2020 and 2021 are stated.
|
| (4) |
The aggregate compensation paid to directors who concurrently serve as executive officers as defined in the Companies Act is included in the above table as those of “Executive officers as defined in the Companies Act.”
|
| (5) |
Two directors who resigned as of June 25, 2020 are included in the number of directors in the “Basic Salaries” and “Other” columns for the fiscal year ended March 31, 2021. Four executive officers as defined in the Companies Act who retired as of April 1, 2020 are included in the number of executive officers in the “Performance Payments” and “Stock Compensation II” columns for the fiscal year ended March 31, 2020.
|
| (6) |
With respect to the Stock Compensation I for the directors and the executive officers as defined in the Companies Act, the amounts given are obtained by multiplying the stock ownership points granted by the Compensation Committee of Mizuho Financial Group in July 2020 based on each position, as the stock ownership points granted for the fiscal year ended March 31, 2021 (one (1) point translates into one (1) share of common stock of Mizuho Financial Group) by the book value of Mizuho Financial Group stock (¥1,369.231 per share).
|
| (7) |
The condolence money premiums subsidies concerning the fiscal year ended March 31, 2021 are included in the above table as “Other,” which are based on the decision by the Compensation Committee.
|
| (8) |
Because the amount of the performance payments and stock compensation II to be paid with respect to the fiscal year ended March 31, 2021 has not yet been determined at present, the aggregate compensation above does not include the amount of such performance payments and stock compensation II; however, the necessary reserve is recorded for accounting purposes. The metric for such performance payments and stock compensation II for the fiscal year ended March 31, 2021 was our consolidated net business profits and net gains or losses related to ETFs and others. The target amount and result of such metric were ¥570.0 billion and ¥799.7 billion, respectively.
|
| (9) |
With respect to the performance payments for executive officers as defined in the Companies Act, the amounts decided by the Compensation Committee of Mizuho Financial Group in July 2020 as the performance payments for the fiscal year ended March 31, 2020 are stated.
|
| (10) |
With respect to the Stock Compensation II for the executive officers as defined in the Companies Act, the amounts given are obtained by multiplying the stock ownership points granted by the Compensation Committee of Mizuho Financial Group in July 2020 based on each position and performance, as the stock ownership points granted for the fiscal year ended March 31, 2020 by the book value of Mizuho Financial Group stock (¥1,369.231 per share). Stock Compensation for the fiscal year ended March 31, 2020 is expected to be paid as deferred payments over three years from the fiscal year ending March 31, 2022.
|
113
Listed companies in Japan are required under Cabinet Office Ordinance on Disclosure of Corporate Affairs, etc., to disclose the compensation provided to their directors, audit & supervisory board members and executive officers as defined in the Companies Act for the relevant fiscal year if the aggregate annual compensation per the director / audit & supervisory board member / executive officer as defined in the Companies Act equals or exceeds ¥100 million (including any compensation provided by major subsidiaries of such listed company as directors and audit & supervisory board members of such subsidiaries). The following table sets forth the relevant information that Mizuho Financial Group has disclosed pursuant to such regulations:
|
Name
(Classification)
|
Aggregate
Amount of
Compensation
(in millions of yen)
|
Company
|
Aggregate Amounts of Compensation by Type (in millions of yen)
|
|||||||||||||||||||||||
|
For the fiscal year ended
March 31,2021
|
For the fiscal year ended
March 31, 2020
|
|||||||||||||||||||||||||
|
Basic Salaries
|
Stock
Compensation I
(paid or
expected to be
paid at the time
of retirement)
|
Other
|
Performance
Payments
|
Stock
Compensation II
(paid during the
term in office)
|
||||||||||||||||||||||
|
Tatsufumi Sakai (Executive officer as defined in the Companies Act)
|
151 |
Mizuho Financial Group
|
74 | 13 | 0 | 23 | 23 | |||||||||||||||||||
|
Mizuho Bank
|
4 | 0 | — | 1 | 1 | |||||||||||||||||||||
|
Mizuho Trust & Banking
|
1 | 0 | — | 0 | 0 | |||||||||||||||||||||
|
Mizuho Securities
|
2 | 0 | — | 0 | 0 | |||||||||||||||||||||
Note:
| (1) |
Fractions are rounded down.
|
Mizuho Financial Group and some of its subsidiaries, including the former Mizuho Bank and the former Mizuho Corporate Bank, abolished their respective retirement allowance programs for directors, audit & supervisory board members and officers. At the ordinary general meeting of shareholders held in June 2008, Mizuho Financial Group and such subsidiaries obtained shareholders’ approval for a payment of lump sum retirement allowances for directors and audit & supervisory board members (other than those elected after such shareholders’ meeting) at the time of their respective retirement.
In conjunction with the abolishment of the retirement allowance program, Mizuho Financial Group obtained shareholders’ approval for the introduction of stock acquisition rights for directors (excluding outside directors) at the ordinary general meeting of shareholders held on June 26, 2008. On January 30, 2009, the Board of Directors resolved to issue stock acquisition rights to directors and executive officers and subsequently allotted an aggregate of 5,409 stock acquisition rights on February 16, 2009. As the directors of Mizuho Financial Group, the directors received 435 stock acquisition rights. Each stock acquisition right represents a right to purchase 100 shares of the common stock at ¥1 per share of common stock. The period during which the stock acquisition rights may be exercised shall be until February 16, 2029. Their exercise is conditioned on the holder losing his or her status as director or executive officer. The book value of each stock acquisition right was ¥190,910 as of March 31, 2021.
On September 3, 2009, the Board of Directors resolved to issue stock acquisition rights to directors and executive officers and subsequently allotted an aggregate of 5,835 stock acquisition rights on September 25, 2009. As the directors of Mizuho Financial Group, the directors received 500 stock acquisition rights. Each stock acquisition right represents a right to purchase 100 shares of the common stock at ¥1 per share of common stock. The period during which the stock acquisition rights may be exercised shall be until September 25, 2029. Their exercise is conditioned on the holder losing his or her status as director or executive officer. The book value of each stock acquisition right was ¥168,690 as of March 31, 2021.
On July 30, 2010, the Board of Directors resolved to issue stock acquisition rights to directors and executive officers and subsequently allotted an aggregate of 6,808 stock acquisition rights on August 26, 2010. As the directors of Mizuho Financial Group, the directors received 500 stock acquisition rights. Each stock acquisition right represents a right to purchase 100 shares of the common stock at ¥1 per share of common stock. The period
114
during which the stock acquisition rights may be exercised shall be until August 26, 2030. Their exercise is conditioned on the holder losing his or her status as director or executive officer. The book value of each stock acquisition right was ¥119,520 as of March 31, 2021.
On November 18, 2011, the Board of Directors resolved to issue stock acquisition rights to directors and executive officers, and subsequently allotted an aggregate of 12,452 stock acquisition rights on December 8, 2011. As the directors of Mizuho Financial Group, the directors received 500 stock acquisition rights. Each stock acquisition right represents a right to purchase 100 shares of the common stock at ¥1 per share of common stock. The period during which the stock acquisition rights may be exercised shall be until December 8, 2031. Their exercise is conditioned on the holder losing his or her status as director or executive officer. The book value of each stock acquisition right was ¥91,840 as of March 31, 2021.
On July 31, 2012, the Board of Directors resolved to issue stock acquisition rights to directors and executive officers, and subsequently allotted an aggregate of 11,776 stock acquisition rights on August 31, 2012. As the directors of Mizuho Financial Group, the directors received 498 stock acquisition rights. Each stock acquisition right represents a right to purchase 100 shares of the common stock at ¥1 per share of common stock. The period during which the stock acquisition rights may be exercised shall be until August 31, 2032. Their exercise is conditioned on the holder losing his or her status as director or executive officer. The book value of each stock acquisition right was ¥113,250 as of March 31, 2021.
On January 31, 2014, the Board of Directors resolved to issue stock acquisition rights to directors and executive officers, and subsequently allotted an aggregate of 7,932 stock acquisition rights on February 17, 2014. As the directors of Mizuho Financial Group, the directors received 184 stock acquisition rights. Each stock acquisition right represents a right to purchase 100 shares of the common stock at ¥1 per share of common stock. The period during which the stock acquisition rights may be exercised shall be until February 17, 2034. Their exercise is conditioned on the holder losing his or her status as director or executive officer. The book value of each stock acquisition right was ¥192,610 as of March 31, 2021.
On May 14, 2014, the Board of Directors determined to delegate to the President & CEO the authority to determine to issue stock acquisition rights to directors and executive officers, provided that Mizuho Financial Group would transform from a Company with Audit & Supervisory Board into a Company with Three Committees. Later, on June 24, 2014, the transformation was approved at the ordinary general meeting of shareholders.
On November 14, 2014, the President & CEO determined to issue stock acquisition rights to directors and executive officers and subsequently allotted an aggregate of 9,602 stock acquisition rights on December 1, 2014. As the directors of Mizuho Financial Group, the directors received 126 stock acquisition rights. Each stock acquisition right represents a right to purchase 100 shares of the common stock at ¥1 per share of common stock. The period during which the stock acquisition rights may be exercised shall be until December 1, 2034. Their exercise is conditioned on the holder losing his or her status as director or executive officer. The book value of each stock acquisition right was ¥186,990 as of March 31, 2021.
Mizuho Financial Group’s Compensation Committee resolved, at the meeting held on May 15, 2015, to discontinue the incentive stock option program along with the introduction of performance payments and stock compensation for directors and officers. In addition, the Compensation Committee resolved, at the meeting held on June 14, 2018, to amend the compensation system in order to further clarify the linkage between business performance and compensation. For further information on the current compensation system, including performance payments and stock compensation, see “Mizuho Financial Group Basic Policy for Executive Compensation” below.
“Mizuho Financial Group Basic Policy for Executive Compensation”
Mizuho Financial Group set out the “Mizuho Financial Group Basic Policy for Executive Compensation” (the “Basic Policy for Executive Compensation”) concerning the determination of compensation for each
115
individual director, executive officer and specialist officer (“Officers, etc.”) of Mizuho Financial Group as well as Mizuho Bank, Mizuho Trust & Banking and Mizuho Securities (the “Three Core Companies”).
Basic Principle
Executive compensation shall be provided as compensation for the responsibilities assigned to and the performance of each individual director and executive officer (the “Officers”) and function as an incentive for each of the Officers to exercise their designated function to the fullest in our effort to realize management that contributes to value creation for various stakeholders and improve corporate value through continuous and stable corporate growth, based on our basic management policies under our corporate philosophy.
Executive Compensation System
| 1. |
Executive compensation for each Officer shall be determined based on a
pre-determined
executive compensation system.
|
| 2. |
The executive compensation system shall include systems and rules related to, among other factors, payment compensation standard (standard amounts), structure (such as fixed and variable portions), form (such as cash or stocks) and timing (such as regular payment or payment at resignation).
|
| 3. |
The executive compensation system shall be established in accordance with both domestic and foreign rules and guidelines concerning executive compensation.
|
| 4. |
The executive compensation system shall reflect our economic and social environment as well as our group’s medium- and long-term business performance, and we shall establish our system appropriately by referring to such systems of other companies, including our competitors, in its establishment.
|
Control
| 1. |
Part of an Officer’s executive compensation shall be provided on a deferred payment basis over multiple years in order to mitigate risks stemming from actions taken for short-term gains that are excessively risky or could compromise value creation for various stakeholders.
|
| 2. |
We shall introduce, as necessary, methods to decrease or compel forfeiture of such deferred amounts or to compel forfeiture of, in whole or in part, compensation already paid.
|
Governance
| 1. |
In order to effectively secure objectivity, appropriateness and fairness with respect to executive compensation, the Compensation Committee shall determine important related matters such as this policy, the design of the executive compensation system and the executive compensation for each of director and executive officer as defined in the Companies Act.
|
| 2. |
All members of the Compensation Committee shall be in principle appointed from among outside directors (or at least
non-executive
directors), and the Chairman thereof shall be an outside director.
|
Disclosure
In order to effectively secure transparency with respect to executive compensation, this policy, the executive compensation system and executive compensation that has been decided, shall be disclosed in a lawful, appropriate manner through suitable means.
Compensation System
Compensation for Officers, etc., shall, in principle, consist of a “Basic Salary,” “Performance Payment” and “Stock Compensation.”
116
| (1) |
“Basic Salaries” shall factor in the function and responsibility of each Officer, etc., in addition to the standard amount for each position, and payment will be made monthly in cash.
|
| (2) |
“Performance Payments” shall be made as a monetary incentive for Officers, etc., to achieve the annual budget and as compensation for their achievement. The payment thereof shall reflect the results of organizations (our
in-house
companies and units, etc.) that each Officer, etc., is in charge of and the performance of each Officer, etc., in addition to the standard amount for each position. A system shall be adopted which, based on resolution by the Compensation Committee, etc., enables certain amounts of deferred payments of the performance payments over three years, as well as a decrease or forfeiture of the deferred amount depending on performance, etc., of the company or the individual.
|
| (3) |
“Stock Compensation” shall be paid in the form of shares of common stock of Mizuho Financial Group consisting of “Stock Compensation I” and “Stock Compensation II,” (together “Stock Compensation I and II”) acquired from the stock market through a trust with an aim to align the interests of Officers, etc., with those of the shareholders and increase the incentive to enhance corporate value.
|
| (a) |
“Stock Compensation I” shall be paid at the time of retirement of each Officer, etc., in the form of shares of common stock of Mizuho Financial Group calculated based on each position. A system shall be adopted which enables a decrease or forfeiture of the amount by resolution of the Compensation Committee, etc., depending on performance of the company or the individual.
|
| (b) |
“Stock Compensation II” shall be paid in accordance with the status of achieving our Five-Year Business Plan in addition to the standard amount for each position. A system shall be adopted which enables the entire amount of deferred payments over three years, as well as a decrease or forfeiture of the deferred amount by resolution of the Compensation Committee, etc., depending on performance of the company or the individual.
|
Among the Officers, etc., the compensation system for the directors, the executive officers as defined in the Companies Act, the executive officers as defined in our internal regulations (the “Officers Responsible for Business Execution”) shall be separate from the compensation system for the directors responsible for management supervision
(“Non-Executive
Officers Responsible for Management Supervision”).
| 1) |
The basic compensation system for Officers Responsible for Business Execution shall be a “Basic Salary,” “Performance Payment” and “Stock Compensation I and II.”
|
| (a) |
The composition ratio of compensation is determined in accordance with the roles and responsibilities of Officers and is determined so that the composition ratio of fixed compensation for Group CEO is minimized.
|
| (b) |
“Performance Payment” shall be paid, in principle, within the range of 0% to 170% of the standard amount for each position.
|
| (c) |
“Stock Compensation II” shall be paid, in principle, within the range of 0% to 130% of the standard amount for each position.
|
| 2) |
The compensation for
Non-Executive
Officers Responsible for Management Supervision, in principle, shall be in the form of fixed compensation from the perspective of ensuring the effectiveness of the supervisory function. The compensation system shall consist of “Basic Salaries” and “Stock Compensation I,” and the composition shall, in principle, be 85% and 15% for “Basic Salaries” and “Stock Compensation I,” respectively.
|
There are cases where compensation for some personnel, including those officers recruited locally in countries other than Japan, may be designed individually in compliance with local compensation regulations while taking into consideration local compensation practices, compensation levels of our competitors and the responsibilities, business characteristics and market value, etc., of each respective officer. For cases where compensation is designed individually, payment of compensation is also made in accordance with the
117
performance of the company or the individual. Payment of compensation is designed to avoid excessive risk-taking through a system which enables certain amount or a portion of deferred payments and
non-monetary
payments such as stock, as well as a decrease or forfeiture of the deferred amount depending on the performance, etc., of the company or the individual.
118
The following diagram shows our executive compensation structure.
«Composition of Compensation»
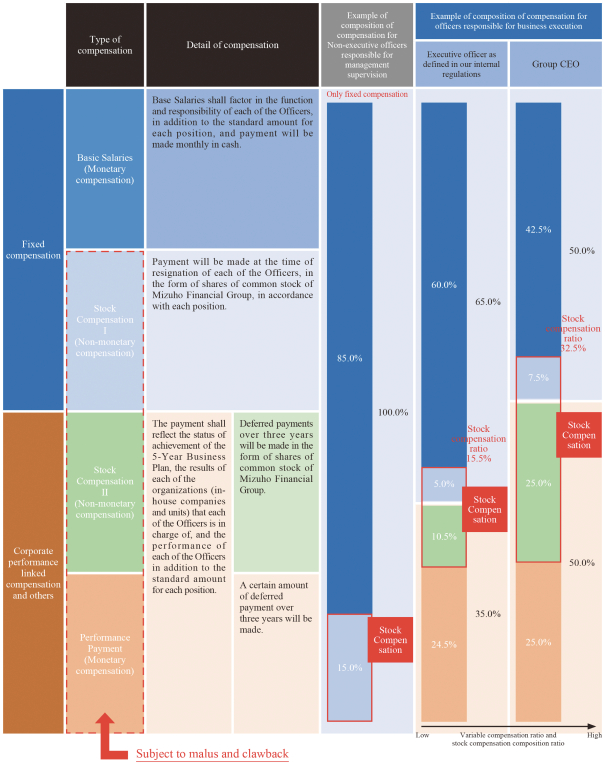
119
Compensation Determination Process
The Compensation Committee shall determine the executive compensation system, including the compensation system set out in “Compensation System,” taking into account the Basic Policy for Executive Compensation. In addition, in order to ensure fairness and objectivity concerning the compensation for each of the Officers, the Compensation Committee shall determine the compensation for each individual director and executive officer of Mizuho Financial Group as defined in the Companies Act and approve the compensation of each individual director of the Three Core Companies.
The President & CEO, pursuant to this policy and regulations and detailed rules, etc., shall determine the compensation for each executive officer as defined in our internal regulations, and approve the compensation of each individual executive officer of the Three Core Companies.
The Compensation Committee shall verify the validity of the compensation system and standards based on economic and social conditions and survey data with respect to management compensation provided by external specialized organizations.
The Compensation Committee may have officers who are not members of the committee (including officers of the Three Core Companies) such as the President & CEO and external experts, etc., attend its meetings and provide their opinion in order to facilitate adequate and appropriate discussions and determinations.
Revision and Abolishment of the Policy
Revision and abolishment of the Basic Policy for Executive Compensation shall be resolved by the Compensation Committee of Mizuho Financial Group.
6.C. Board Practices
Under the Companies Act, Companies with Three Committees are required to establish a nominating committee, a compensation committee and an audit committee and the majority of the respective committee members must be outside directors, as defined under the Companies Act. Such companies are also required to appoint executive officers under the Companies Act.
Mizuho Financial Group transformed into a Company with Three Committees from a Company with Audit & Supervisory Board in June 2014. We believe that, under the current legal system, a Company with Three Committees is the most effective as a system to realize the basic policy regarding our corporate governance system for the following reasons:
| • |
To allow executive officers to make swift and flexible decisions on business execution delegated by the Board of Directors and to implement business execution, and to allow the Board of Directors to focus on determining matters such as basic management policies and effectively supervising management.
|
| • |
To secure to the fullest extent possible a checks and balances function that fully utilizes the viewpoints of outside parties and objectively secure appropriateness and fairness in decision-making through members of the Nominating Committee, the Compensation Committee and the Audit Committee, which consist mainly of outside directors.
|
| • |
To make possible the creation of systems that are necessary to realize the fundamental perspectives regarding our corporate governance in a form that takes into account what we aim to be and our challenges.
|
| • |
To be in line with governance systems that are required globally with a strong recognition that we operate globally and are in a position in which we should play a leading role in the industry as a financial group that is a
G-SIFI
to continue constructing an even stronger governance system that will agilely respond to domestic and global structural changes and overcome a highly competitive environment; and as a result, to allow us to fulfill our social role and mission, which is to realize
|
120
|
continuous and stable corporate growth and improved corporate value and shareholder interests and contribute to domestic and global economic and industrial development and prosperity of society, in response to the demands of our stakeholders.
|
Pursuant to its articles of incorporation, Mizuho Financial Group has established general meetings of shareholders, individual directors, the Board of Directors, the Nominating Committee, the Compensation Committee, the Audit Committee and an independent accounting auditor as the primary components of its corporate governance system.
Board of Directors
Under the Companies Act, directors are elected by resolution of the general meetings of shareholders, and their term of office ends at the close of the ordinary general meeting of shareholders relating to the fiscal year ending within a year following their appointment.
In addition, under the Companies Act, the duties of the board of directors include making decisions on business execution and supervision of the execution of duties of directors and executive officers, and by its resolution, it may delegate making decisions on business execution (excluding certain specified matters) to the executive officers.
The main roles of the Board of Directors are making decisions on business execution such as basic management policies, which are legally matters to be determined solely by the Board of Directors, and supervising the execution of duties by directors and executive officers. In order to fulfill the roles mentioned above, the Board of Directors shall appropriately establish and supervise the operation of the internal control systems (regarding matters such as risk management, compliance and internal auditing) and risk governance systems of our group. The Board of Directors shall, in principle, delegate to the President & CEO, who is also the Group CEO, decisions on business execution (excluding matters that are legally required to be determined solely by the Board of Directors), for the purpose of realizing swift and flexible decision-making and expeditious corporate management and strengthening the supervision of directors and executive officers by the Board of Directors.
Pursuant to the articles of incorporation, Mizuho Financial Group may have no more than 15 directors. Mizuho Financial Group maintains the following structure in order to manage the Board of Directors in an effective and stable manner. In light of the role of the Board of Directors to supervise management, (i) outside directors and internal directors who do not concurrently serve as persons performing executive roles (“Internal
Non-Executive
Directors,” and together with outside directors,
“Non-Executive
Directors”) comprise a majority of the directors in the Board of Directors and (ii) at least a third of the members of the Board of Directors are outside directors. Currently, the Board of Directors consists of a total of 13 directors (six outside directors, two Internal
Non-Executive
Directors and five directors concurrently serving as executive officers).
The Chairman of the Board of Directors shall, in principle, be an outside director (or at least a
Non-Executive
Director) in light of the role of the Board of Directors to supervise management. Currently, Ms. Izumi Kobayashi serves as the Chairman of the Board of Directors.
The Board of Directors held 15 meetings in the fiscal year ended March 31, 2021. In particular, the Board had discussions for the progress of our structural reforms and our sustainability initiatives. The average attendance rate was 100%.
Nominating Committee
Under the Companies Act, the nominating committee is required to consist of at least three directors, and the majority of its members is required to consist of outside directors. The duties of the nominating committee include the determination of the contents of proposals regarding the appointment and dismissal of directors to be submitted to the general meetings of shareholders.
121
The main roles of the Nominating Committee of Mizuho Financial Group are determining the contents of proposals regarding the appointment and dismissal of directors of Mizuho Financial Group to be submitted to the general meetings of shareholders, exercising the approval rights held by Mizuho Financial Group with respect to the appointment and dismissal of directors of each of the Three Core Companies, and exercising the approval rights held by Mizuho Financial Group with respect to the appointment and removal of representative directors and senior directors of the Three Core Companies.
The Chairman of the Nominating Committee shall be an outside director, and in principle its members shall be appointed from among outside directors (or at least
Non-Executive
Directors) in order to ensure objectivity and transparency in the appointment of directors. Currently, all members of the Nominating Committee, including the Chairman, are outside directors. As of June 23, 2021, the members of the Nominating Committee are Mr. Tatsuo Kainaka (Chairman), Mr. Yoshimitsu Kobayashi, Mr. Takashi Tsukioka, Mr. Masami Yamamoto and Ms. Izumi Kobayashi.
The Nominating Committee held seven meetings in the fiscal year ended March 31, 2021. In particular, the Committee received reports on the status of formulation and operation of the succession plan as well as the human resources development and had discussions on director nomination and appointment for the fiscal year ending March 31, 2022 at Mizuho Financial Group and the Three Core Companies. The average attendance rate was 100%.
Compensation Committee
Under the Companies Act, the compensation committee is required to consist of at least three directors, and the majority of its members is required to consist of outside directors. The duties of the compensation committee include the determination of the compensation for each individual director and executive officer.
The main roles of the Compensation Committee of Mizuho Financial Group are determining the compensation for each individual director and executive officer of Mizuho Financial Group, exercising the approval rights held by Mizuho Financial Group regarding compensation of each individual director of the Three Core Companies, and determining the basic policies and compensation system for directors and executive officers of Mizuho Financial Group and the Three Core Companies.
The Chairman of the Compensation Committee shall be an outside director, and in principle its members shall be appointed from among the outside directors (or at least
Non-Executive
Directors) in order to ensure objectivity and transparency in the compensation of directors and executive officers. Currently, all members of the Compensation Committee, including the Chairman, are outside directors. As of June 23, 2021, the members of the Compensation Committee are Mr. Masami Yamamoto (Chairman), Mr. Tatsuo Kainaka and Mr. Takashi Tsukioka.
The Compensation Committee held five meetings in the fiscal year ended March 31, 2021. In particular, the Committee reviewed the revision of the basic policy on executive compensation in light of domestic and international regulations, as well as economic and social conditions, and discussed the ideal form of executive compensation in order to maximize the roles that each director and executive officer should fulfill. The average attendance rate was 100%.
Audit Committee
Under the Companies Act, the audit committee is required to consist of at least three
Non-Executive
Directors, and the majority of its members is required to consist of outside directors. The duties of the audit committee include the audit of the execution of duties by directors and executive officers and preparation of audit reports.
The main roles of the Audit Committee of Mizuho Financial Group are auditing the execution of duties by the directors and executive officers, monitoring and inspecting the establishment and management of the internal
122
control system of Mizuho Financial Group and its subsidiaries, monitoring and inspecting the condition of the execution of duties with respect to corporate management of subsidiaries and others by executive officers, preparing audit reports, and determining the contents of proposals regarding the appointment, dismissal and
non-reappointment
of independent accounting auditors to be submitted to the general meetings of shareholders, and adopting resolutions regarding the approval of basic internal audit plans, as well as the Internal Audit Group’s budget, commission of Group Chief Auditor, and appointment of the General Manager of the Internal Audit Group.
Given that it is necessary for the Audit Committee to gather information through internal directors who are familiar with the financial business and related regulations, share information among the Audit Committee and to have sufficient coordination with internal control departments, Mizuho Financial Group shall in principle appoint one or two Internal
Non-Executive
Directors as full-time members of the Audit Committee. The majority of its members including the Chairman shall be outside directors. Currently, among the four members of the Audit Committee, one member is appointed among Internal
Non-Executive
Directors as full-time members of the Audit Committee, and three members including the Chairman are appointed among outside directors. As of June 23, 2021 the members of the Audit Committee are Mr. Takashi Tsukioka (Chairman), Mr. Tatsuo Kainaka, Mr. Ryoji Sato and Mr. Hisaaki Hirama.
The Audit Committee held 17 meetings in the fiscal year ended March 31, 2021. In particular, the Committee confirmed the effectiveness of the Structure for Ensuring Appropriate Conduct of Operations (internal control system) and provided relevant opinions. The average attendance rate was 100%.
The members of the Audit Committee shall meet independence requirements under the U.S. securities laws and regulations as may from time to time be applicable to the Company. Further, at least one member of the Audit Committee shall be a “financial expert” as defined under U.S. laws.
Mizuho Financial Group has established committees and other organizations on a voluntary basis in addition to the above legally-required three committees as set forth below:
| • |
Risk Committee
|
The Risk Committee shall advise the Board of Directors regarding decision-making and supervision relating to risk governance and supervision of matters such as the status of risk management.
The Risk Committee shall, in principle, comprise no less than three members who shall be
Non-Executive
Directors or outside experts. Currently, the Risk Committee comprises Internal
Non-Executive
Director, who serves as the Chairman, an outside director, and two outside experts.
The Risk Committee held eight meetings in the fiscal year ended March 31, 2021. In particular, the Committee had discussions on the risks of climate change, acknowledgement of overseas risks by region and the operation of risk appetite framework in the fiscal year ending March 31, 2022. The average attendance rate was 100%.
| • |
Human Resources Review Meeting
|
The Human Resources Review Meeting shall deliberate over plans for the appointment and dismissal of Mizuho Financial Group’s executive officers as defined in the Companies Act and plans for the appointment and removal of or commission to Mizuho Financial Group’s executive officers (as defined in the Companies Act or our internal regulations) with special titles, such plans to be decided upon by the Board of Directors. Additionally, the Human Resources Review Meeting shall deliberate over plans for the appointment and removal of or commission to the Three Core Companies’ executive officers as defined in our internal regulations with special titles, such plans to be approved by the Board of Directors.
123
The Human Resources Review Meeting shall comprise the members of the Nominating Committee, the members of the Compensation Committee, and the Group CEO from the perspective of ensuring transparency and fairness in the appointment of executive officers.
The Human Resources Review Meeting was held 10 times in the fiscal year ended March 31, 2021. In particular, the Meeting received reports on the status of formulation and operation of the succession plan and had discussions on the appointment of executive officers for the fiscal year ending March 31, 2022 at Mizuho Financial Group and the Three Core Companies. The average attendance rate was 100%.
| • |
Outside Director Session
|
The Outside Director Session shall comprise only outside directors and exchange information and share understanding with each other and provide objective and candid opinions to management based on the outside directors’ perspectives as outsiders.
The Outside Director Session was held once in the fiscal year ended March 31, 2021. In particular, the Session had discussions on the management of the Board of Directors and the
medium-to
long-term issues. The average attendance rate was 100%.
Executive Officers
Under the Companies Act, Companies with Three Committees are required to appoint at least one executive officer by resolution of the board of directors, and its term of office ends at the close of the meeting of the board of directors initially convened following the close of the ordinary general meeting of shareholders relating to the fiscal year ending within a year following appointment. Executive officers shall decide on the business execution delegated by a resolution of the board of directors and implement business execution.
Executive officers of Mizuho Financial Group take charge of making decisions on business execution delegated by a resolution of the Board of Directors and implementing business execution of Mizuho Financial Group.
Mizuho Financial Group shall appoint as executive officers the Group CEO and, in principle, all heads of
In-house
Companies, Units and Groups based on the policy that it is necessary to appoint as executive officers people who make decisions on business execution delegated by the Board of Directors as managers of Mizuho Financial Group and who assume a comprehensive role of business execution.
While the President & CEO is responsible for business execution at Mizuho Financial Group, after the President & CEO makes decisions on matters delegated by the Board of Directors, determined matters shall be reported to the Board of Directors at least once every three months as part of the status of the execution of duties.
Agreements with Directors, etc.
None of the directors has service contracts with Mizuho Financial Group providing for benefits upon termination of service.
Mizuho Financial Group’s articles of incorporation, in accordance with the Companies Act, allows the company to enter into an agreement with outside directors that limits their liabilities incurred in connection with their service. The limitation of liabilities under such agreement, if the outside director performed his/her duty in good faith without gross negligence, must be the higher of either (i) a
pre-determined
amount not less than ¥20 million or (ii) the amount prescribed in laws and regulations, which is currently equivalent to two times the annual compensation of such outside director. Pursuant to the provisions in its articles of incorporation, Mizuho Financial Group has entered into such agreements with all of its outside directors that are in office.
124
Based on the rules of the Tokyo Stock Exchange, listed companies are required to have at least one member of the board of directors or one member of the audit & supervisory board to be “independent.” Further, listed companies that have less than two independent outside directors must disclose the reason for it. Currently, all of Mizuho Financial Group’s outside directors meet such independence requirements.
For additional information on directors and the board practices, see “Item 6.A. Directors and Senior Management—Directors” and “Item 10.B. Additional Information—Memorandum and Articles of Association” in this annual report.
The rights of holders of American Depositary Receipts, or ADRs, which evidence ADSs, including such ADR holders’ rights relating to corporate governance practices, are governed by the deposit agreement, which is included as Exhibit 2.2 to this annual report.
Corporate Governance Practices
Companies listed on the New York Stock Exchange, or NYSE, must comply with certain standards regarding corporate governance under Section 303A of the NYSE Listed Company Manual. However, NYSE-listed companies that are foreign private issuers meeting certain criteria, such as Mizuho Financial Group, are permitted to follow home country practices in lieu of certain provisions of Section 303A, and the company is relying on this exemption. See “Item 16.G. Corporate Governance” for a summary of significant ways in which corporate governance practices of Mizuho Financial Group differ from those followed by NYSE-listed U.S. companies.
6.D. Employees
As of March 31, 2019, 2020 and 2021, we had 59,132, 57,264 and 54,492 employees, respectively, on a consolidated basis, including overseas local staff but excluding advisers and temporary employees. We also had an average of approximately 15,309 temporary employees during the fiscal year ended March 31, 2021.
The following tables show our full-time employees as of March 31, 2021 and the average number of temporary employees for the fiscal year ended March 31, 2021, each broken down based on business segment and geographical location:
|
Business segment
|
Number of
full-time employees
|
Average number of
temporary employees
|
||||||
|
Retail & Business Banking Company
|
22,522 | 9,456 | ||||||
|
Corporate &Institutional Company
|
2,259 | 287 | ||||||
|
Global Corporate Company
|
9,181 | 59 | ||||||
|
Global Markets Company
|
1,307 | 65 | ||||||
|
Asset Management Company
|
1,567 | 119 | ||||||
|
Others
|
17,656 | 5,323 | ||||||
|
|
|
|
|
|||||
|
Total
|
54,492 | 15,309 | ||||||
|
|
|
|
|
|||||
|
Location
|
Percentage of
full-time employees
|
Average percentage of
temporary employees
|
||||||
|
Japan
|
90.4 | % | 99.7 | % | ||||
|
Americas
|
3.5 | % | 0.0 | % | ||||
|
Europe
|
1.6 | % | 0.2 | % | ||||
|
Asia/Oceania (excluding Japan) and others
|
4.5 | % | 0.1 | % | ||||
|
|
|
|
|
|||||
|
Total
|
100.0 | % | 100.0 | % | ||||
|
|
|
|
|
|||||
Most of our full-time
non-management
employees in Japan are members of a labor union. Outside Japan, some of our employees are members of local unions. We consider our labor relations with employees to be good.
125
6.E. Share Ownership
Shown below are two types of numbers of shares of Mizuho Financial Group’s common stock held by its directors and executive officers as of July 1, 2021: One column shows the actual number of shares held; and the other shows the potential number of additional shares to be held (i.e., the number of shares that are scheduled to be delivered equivalent to the stock ownership points granted by the current stock compensation system and upon exercise of the stock acquisition rights granted by the former stock option system).
|
Directors
|
Actual number of
shares held
|
Potential number of
additional shares to be held
|
||||||
|
Tatsufumi Sakai
|
39,740 | 49,152 | ||||||
|
Seiji Imai
|
21,908 | 27,758 | ||||||
|
Makoto Umemiya
|
9,686 | 17,600 | ||||||
|
Motonori Wakabayashi
|
8,730 | 19,394 | ||||||
|
Nobuhiro Kaminoyama
|
570 | 8,054 | ||||||
|
Yasuhiro Sato
|
105,452 | 61,540 | ||||||
|
Hisaaki Hirama
|
19,953 | 10,095 | ||||||
|
Tatsuo Kainaka
|
4,017 | 4,070 | ||||||
|
Yoshimitsu Kobayashi
|
1,256 | 1,700 | ||||||
|
Ryoji Sato
|
1,128 | 1,700 | ||||||
|
Takashi Tsukioka
|
— | — | ||||||
|
Masami Yamamoto
|
7,334 | 2,950 | ||||||
|
Izumi Kobayashi
|
2,778 | 4,070 | ||||||
|
Executive Officers
|
Actual number of
shares held
|
Potential number of
additional shares to be held
|
||||||
|
Tatsufumi Sakai
|
See above | See above | ||||||
|
Seiji Imai
|
See above | See above | ||||||
|
Satoshi Ishii
|
35,783 | 26,867 | ||||||
|
Masahiro Otsuka
|
16,473 | 18,307 | ||||||
|
Naofumi Fuke
|
12,602 | 36,720 | ||||||
|
Masatoshi Yoshihara
|
16,877 | 17,426 | ||||||
|
Yasuhiro Shibata
|
2,906 | 21,142 | ||||||
|
Masamichi Ishikawa
|
7,984 | 2,360 | ||||||
|
Masahiro Kihara
|
2,194 | 13,772 | ||||||
|
Yasuhiko Ushikubo
|
1,852 | 13,612 | ||||||
|
Naoshi Inomata
|
— | 9,479 | ||||||
|
Makoto Umemiya
|
See above | See above | ||||||
|
Motonori Wakabayashi
|
See above | See above | ||||||
|
Nobuhiro Kaminoyama
|
See above | See above | ||||||
|
Koji Yonei
|
24,240 | 6,953 | ||||||
|
Masaomi Takada
|
1,691 | 11,405 | ||||||
|
Hisashi Kikuchi
|
10,104 | 16,917 | ||||||
None of the directors or executive officers is the owner of more than one percent of Mizuho Financial Group’s common stock, and no director or executive officer has voting rights with respect to our common stock that are different from any other holder of our common stock.
For information on our former stock option system and current stock compensation system for directors and executive officers, see “Item 6.B Compensation.”
126
We maintain an employee stock ownership plan under which participating employees of the companies listed below are able to contribute funds deducted from their salary and bonus payments to purchase our shares. The plan administrator makes open-market purchases of our shares for the account of the plan on a monthly basis. The companies contribute matching funds equivalent to 5% of the amounts contributed by the participating employees. The following table shows the number of shares that the plan held as of March 31, 2021:
|
As of March 31, 2021
|
||||||
|
Plan
|
Employer companies
|
Number of
shares owned
|
||||
|
Mizuho Employee Stock Ownership Plan
|
Mizuho Financial Group | |||||
| Mizuho Bank | ||||||
| Mizuho Trust & Banking | ||||||
| Mizuho Research Institute | ||||||
| Mizuho Information & Research Institute | ||||||
|
|
|
|||||
|
Total
|
11,698,881 | |||||
|
|
|
|||||
|
ITEM 7.
|
MAJOR SHAREHOLDERS AND RELATED PARTY TRANSACTIONS
|
7.A. Major Shareholders
The following table sets forth information about the ten largest holders of shares of our common stock appearing on the register of shareholders as of March 31, 2021:
|
As of March 31, 2021
|
||||||||
|
Name
|
Number of
shares owned |
Percentage of
outstanding shares |
||||||
|
The Master Trust Bank of Japan, Ltd. (trustee account)
|
210,539,400 | 8.29 | ||||||
|
Custody Bank of Japan, Ltd. (trustee account)
|
114,941,800 | 4.53 | ||||||
|
State Street Bank West Client – Treaty 505234
|
41,977,995 | 1.65 | ||||||
|
Custody Bank of Japan, Ltd. (trustee account 5)
|
41,106,300 | 1.62 | ||||||
|
Custody Bank of Japan, Ltd. (trustee account 6)
|
36,427,700 | 1.43 | ||||||
|
Custody Bank of Japan, Ltd. (trustee account 7)
|
33,474,400 | 1.32 | ||||||
|
Custody Bank of Japan, Ltd. (trustee account 1)
|
32,692,100 | 1.29 | ||||||
|
JP Morgan Chase Bank 385781
|
30,723,102 | 1.21 | ||||||
|
Custody Bank of Japan, Ltd. (trustee account 4)
|
26,582,760 | 1.05 | ||||||
|
Custody Bank of Japan, Ltd. (taxable trust money account)
|
26,416,350 | 1.04 | ||||||
|
|
|
|
|
|||||
|
Total
|
594,881,907 | 23.43 | ||||||
|
|
|
|
|
|||||
As of March 31, 2021, there were 215 record holders of our common stock with addresses in the United States, whose shareholdings represented approximately 9% of our outstanding common stock on that date. Because some of these shares were held by brokers or other nominees, the number of record holders with addresses in the United States might not fully reflect the number of beneficial owners in the United States.
7.B. Related Party Transactions
We and our subsidiary banks had, and expect to have in the future, banking transactions and other transactions in the ordinary course of business with our related parties. Although, for the fiscal year ended March 31, 2021, such transactions included, but were not limited to, call money, loans, deposits, guarantees and foreign exchange transactions, those transactions were immaterial and were made on substantially the same terms, including interest rates and collateral, as those prevailing at the time for comparable transactions with third parties and did not involve more than the normal risk of collectability or present other unfavorable features.
127
During the fiscal year ended March 31, 2021, none of the directors or executive officers, and none of the close members of their respective families, had any transactions that are material or any transactions that are unusual in their nature or conditions, involving goods, services or tangible or intangible assets, to which we were, are or will be a party, and there were no such transactions proposed as of March 31, 2021.
During the fiscal year ended March 31, 2021, no loans were made to the directors or executive officers other than loans in the ordinary course of business, on substantially the same terms, including interest rates and collateral, as those prevailing at the time for comparable transactions with other persons, and involving no more than the normal risk of collectability or presenting other unfavorable features.
7.C. Interests of Experts and Counsel
Not applicable.
|
ITEM 8.
|
FINANCIAL INFORMATION
|
8.A. Consolidated Statements and Other Financial Information
Financial Statements
Our consolidated financial statements are set forth in this annual report under “Item 18. Financial Statements.”
Legal Proceedings
We are involved in normal collection proceedings initiated by us and other legal proceedings in the ordinary course of our business, none of which is currently expected to have a material adverse effect on our financial condition or results of operations. However, there can be no assurance that an adverse decision in one or more of these lawsuits will not have a material adverse effect.
Shareholder Return Policy
We implemented disciplined capital management by pursuing the optimal balance between strengthening of stable capital base and steady returns to shareholders. Our shareholder return policy was maintaining the current level of dividends for the time being while aiming to strengthen our capital base further to enhance returns to shareholders at an early stage.
Based on the above policy, annual cash dividends for the fiscal year ended March 31, 2021 were ¥75 per share of common stock (each of interim and year-end cash dividends was ¥37.5 per share of common stock (interim cash dividends reflected the impact from the share consolidation of the shares of common stock on the basis of one post-consolidation share per ten pre-consolidation shares effective as of October 1, 2020)), which was the same amount as the previous fiscal year.
We intend to issue dividends twice per year to shareholders recorded in the shareholder register as of March 31 and September 30 in each year as year-end dividends and as interim dividends, respectively, to return profits to shareholders in a timely way.
In accordance with our articles of incorporation, we may decide to issue dividends by a resolution of the Board of Directors unless otherwise stipulated by laws or regulations. Annual cash dividends for the fiscal year ended March 31, 2021 were decided by a resolution of our Board of Directors.
In response to the development of our capital accumulation, we changed our thoughts with regard to capital management and decided to pursue the optimum balance between capital adequacy, growth investment and enhancement of shareholder return. Our new shareholder return policy is progressive dividends being our principal approach while executing flexible and intermittent share buybacks. As for the dividends, we will decide
128
them based on the steady growth of our stable earnings base, taking 40% of the dividend payout ratio as a guide into consideration. As for share buybacks, we will determine them with considering our business results and capital adequacy, our stock price and the opportunities for growth investment.
8.B. Significant Changes
Except as described in this annual report, no significant change in our financial position has occurred since the date of the financial statements included in this annual report.
|
ITEM 9.
|
THE OFFER AND LISTING
|
9.A. Listing Details
The principal trading market for our shares of common stock is the First Section of the Tokyo Stock Exchange. Our shares have been listed on the First Section of the Tokyo Stock Exchange, under the code “8411,” since our establishment as the holding company of the Mizuho group on March 12, 2003, as the successor to Mizuho Holdings.
Our ADSs have been listed on the New York Stock Exchange since November 8, 2006 and are quoted under the ticker symbol “MFG.”
9.B. Plan of Distribution
Not applicable.
9.C. Markets
See “Item 9.A. The Offer and Listing—Listing Details.”
9.D. Selling Shareholders
Not applicable.
9.E. Dilution
Not applicable.
9.F. Expenses of the Issue
Not applicable.
|
ITEM 10.
|
ADDITIONAL INFORMATION
|
10.A. Share Capital
Not applicable.
10.B. Memorandum and Articles of Association
Objects and Purposes in our Articles of Incorporation
Our corporate purpose, as specified in Article 2 of our articles of incorporation, which is included in this annual report as Exhibit 1.1, is to engage in the following businesses as a bank holding company:
| • |
operation and management of bank holding companies, banks, specialized securities companies and other companies which we may own as our subsidiaries under the Banking Act, and any other business incidental thereto; and
|
| • |
any other business that a bank holding company may engage in under the Banking Act.
|
129
Our Board of Directors
Under the Companies Act (Kaisha Hou) (Act No. 86 of 2005, as amended), because we have adopted the “Company with Three Committees” system, our directors have no power to execute our business except in limited circumstances as permitted by law. If a director also serves concurrently as an executive officer, then he or she can execute our business in the capacity of executive officer. There is no provision in our articles of incorporation as to our directors’ power to vote on a proposal, arrangement or contract in which a director is materially interested. The Companies Act, however, requires such director to refrain from voting on such matters at meetings of the board of directors.
The amount of compensation to each our director is determined by the Compensation Committee, which consists of our directors, the majority of whom are outside directors (See “Item 6.C. Board Practices”).
The borrowing powers have been delegated to the executive officers by the Board of Directors in accordance with the Companies Act.
Neither the Companies Act nor our articles of incorporation set a mandatory retirement age for our directors.
There is no requirement concerning the number of shares an individual must hold to qualify as a director under the Companies Act or our articles of incorporation.
Common Stock
General
Unless otherwise specified, set forth below is information concerning our shares of common stock as of the date hereof, including brief summaries of certain provisions of our articles of incorporation, our share handling regulations and the Companies Act relating to joint stock corporations (kabushiki kaisha) and certain related legislation, all as currently in effect.
Under our articles of incorporation, we are authorized to issue 4,800,000,000 shares of common stock.
As of March 31, 2021, 2,539,249,894 shares of common stock were issued.
The ordinary general meeting of shareholders held on June 25, 2020 approved the share consolidation in respect of common stock on the basis of one post-consolidation share per ten pre-consolidation shares and a partial amendment to the articles of incorporation to decrease the number of shares of common stock authorized to be issued to 4,800,000,000, and such share consolidation and the decrease of the number of shares of common stock authorized to be issued became effective on October 1, 2020.
Where relevant to the common stock, provisions of our preferred stock are also described below.
Distribution of Surplus
General
Under the Companies Act, distribution of cash or other assets by a joint stock corporation to its shareholders, including dividends, takes the form of distribution of Surplus (as defined in “—Restriction on Distribution of Surplus”). We are permitted to make distributions of Surplus to our shareholders any number of times per fiscal year, subject to certain limitations described in “—Restriction on Distribution of Surplus.” Under the Companies Act and our articles of incorporation, distributions of Surplus are in principle permitted by a resolution of the Board of Directors as long as our non-consolidated annual financial statements and certain
130
documents for the latest fiscal year fairly present our assets and profit and loss, as required by an ordinance of the Ministry of Justice.Distributions of Surplus are, however, required to be authorized by a resolution of a general meeting of shareholders if the aforementioned condition is not met, and even if the aforementioned condition is met, distribution of Surplus may be authorized by a resolution of a general meeting of shareholders.
Distributions of Surplus may be made in cash or in kind in proportion to the number of shares of common stock held by each shareholder. A resolution of the Board of Directors or a general meeting of shareholders authorizing a distribution of Surplus must specify the kind and aggregate book value of the assets to be distributed, the manner of allocation of such assets to shareholders, and the effective date of the distribution. If a distribution of Surplus is to be made in kind, we may, pursuant to a resolution of the Board of Directors or (as the case may be) a general meeting of shareholders, grant the right to our shareholders to require us to make such distribution in cash instead of in kind. If no such right is granted to shareholders, the relevant distribution of Surplus must be approved by a special resolution of a general meeting of shareholders (see “—Voting Rights” with respect to a “special resolution”).
Under our articles of incorporation, the record date for annual dividends and interim dividends is March 31 and September 30, respectively, in each year. In Japan, the “ex-dividend date” (the date from which purchasers of shares through Japanese stock exchanges will not be entitled to the dividends to be paid to registered shareholders as of any record date) and the record date for dividends precede the date of determination of the amount of the dividend to be paid. The ex-dividend date of the shares of common stock is generally the first business day prior to the record date.
Restriction on Distribution of Surplus
Payment of annual dividends on shares of common stock is subject to the prior payment of annual preferred dividends on the shares of any series of preferred stock. Payment of an interim dividend on shares of our common stock is also subject to the prior payment of an interim preferred dividend of one-half the annual preferred dividend amount on the shares of any series of preferred stock. In making a distribution of Surplus, we must set aside in our additional paid-in capital and/or legal reserve an amount equal to one-tenth of the amount of Surplus so distributed, until the sum of its additional paid-in capital and legal reserve reaches one-quarter of its stated capital.
The amount of Surplus at any given time must be calculated in accordance with the following formula:
A + B + C + D - (E + F + G)
In the above formula:
“A” = the total amount of other capital surplus and other retained earnings, each such amount being that appearing on our non-consolidated balance sheet as of the end of the last fiscal year
“B” = (if we have disposed of our treasury stock after the end of the last fiscal year) the amount of the consideration for such treasury stock received by us less the book value thereof
“C” = (if we have reduced our stated capital after the end of the last fiscal year) the amount of such reduction less the portion thereof that has been transferred to additional paid-in capital or legal reserve (if any)
“D” = (if we have reduced our additional paid-in capital or legal reserve after the end of the last fiscal year) the amount of such reduction less the portion thereof that has been transferred to stated capital (if any)
“E” = (if we have cancelled our treasury stock after the end of the last fiscal year) the book value of such treasury stock
“F” = (if we have distributed Surplus to our shareholders after the end of the last fiscal year) the total book value of the Surplus so distributed
131
“G” = certain other amounts set forth in an ordinance of the Ministry of Justice, including:
| • |
if we have reduced Surplus and increased our stated capital, additional paid-in capital or legal reserve after the end of the last fiscal year, the amount of such reduction; and
|
| • |
if we have distributed Surplus to shareholders after the end of the last fiscal year, the amount set aside in our additional paid-in capital or legal reserve, if any, as required by ordinances of the Ministry of Justice.
|
The aggregate book value of Surplus distributed by us may not exceed a prescribed distributable amount (the “Distributable Amount”), as calculated on the effective date of such distribution. The Distributable Amount at any given time shall be the amount of Surplus less the aggregate of (a) the book value of our treasury stock, (b) the amount of consideration for any of our treasury stock disposed of by us after the end of the last fiscal year and (c) certain other amounts set forth in an ordinance of the Ministry of Justice, including (if the sum of one-half of our goodwill and deferred assets exceeds the total of the stated capital, additional paid-in capital and legal reserve, each such amount being the amount in our non-consolidated balance sheet as of the end of the last fiscal year) all or certain part of such exceeding amount as calculated in accordance with the ordinances of the Ministry of Justice.
If we have become at our option a company with respect to which its consolidated balance sheet should also be considered in the calculation of the Distributable Amount (renketsu haito kisei tekiyo kaisha), we shall further deduct from the amount of Surplus the excess amount, if any, of (x) the total amount of the shareholders’ equity appearing on our non-consolidated balance sheet as of the end of the last fiscal year and certain other amounts set forth by an ordinance of the Ministry of Justice over (y) the total amount of the shareholders’ equity and certain other amounts set forth by an ordinance of the Ministry of Justice appearing on our consolidated balance sheet as of the end of the last fiscal year. We did not opt for becoming such a company with respect to the fiscal year ended March 31, 2021.
If we have prepared interim financial statements as described below, and if such interim financial statements have been approved by the Board of Directors or (if so required by the Companies Act) by a general meeting of shareholders, then the Distributable Amount must be adjusted to take into account the amount of profit or loss, and the amount of consideration for any of our treasury stock disposed of by us, during the period in respect of which such interim financial statements have been prepared. We may prepare non-consolidated interim financial statements consisting of a balance sheet as of any date subsequent to the end of the last fiscal year and an income statement for the period from the first day of the current fiscal year to the date of such balance sheet. Interim financial statements so prepared by us must be audited by our corporate auditors and/or outside accounting auditor, as required by an ordinance of the Ministry of Justice.
Capital and Reserves
We may reduce our additional paid-in capital or legal reserve generally by resolution of a general meeting of shareholders and, if so decided by the same resolution, may account for the whole or any part of the amount of such reduction as stated capital. On the other hand, we may reduce our stated capital generally by special resolution of a general meeting of shareholders and, if so decided by the same resolution, may account for the whole or any part of the amount of such reduction as additional paid-in capital or legal reserve. In addition, we may reduce our Surplus and increase either (i) stated capital or (ii) additional paid-in capital and/or legal reserve by the same amount, in either case by resolution of a general meeting of shareholders.
Stock Splits
We may at any time split shares of common stock into a greater number of shares of common stock by determination by executive officers under the authority delegated by resolution of the Board of Directors. When a stock split is to be made, so long as our only class of outstanding stock is the common stock, we may increase
132
the number of authorized shares in the same ratio as that of such stock split by amending our articles of incorporation, of which amendment may be effected by resolution of the Board of Directors without approval by shareholders.
Share Consolidation
We may at any time consolidate shares of common stock into a smaller number of shares of common stock by special resolution of a general meeting of shareholders. When a share consolidation is to be made, we must give public notice at least two weeks (or, in the case where any fractions of shares are left as a result of the share consolidation, 20 days) prior to the effective date of the share consolidation. We must disclose the reason for the share consolidation at the general meeting of shareholders.
During the fiscal year ended March 31, 2021, the share consolidation on the basis of one post-consolidation share per ten pre-consolidation shares was approved at the ordinary general meeting of shareholders held on June 25, 2020. As a result, the shares of our common stock held by the shareholders recorded in the shareholder register as of September 30, 2020 was consolidated on October 1, 2020.
After such share consolidation, shareholders who owned fewer than 10 shares as of September 30, 2020, lost their status as shareholders. In addition, shareholders who owned 100 to fewer than 1,000 shares as of September 30, 2020, became owners of shares constituting less than one unit of shares. See “—Unit Share System.”
Unit Share System
We have adopted the unit share system under which shareholders will have one voting right for each unit of shares consisting of 100 shares held by them at general meetings of shareholders or at meetings of holders of a particular class of shares, and shares constituting less than a full unit will carry no voting rights. See “—Preferred Stock—Voting Rights” for information on the voting rights that holders of preferred stock may have at general meetings of shareholders. Our articles of incorporation provide that the holders of shares constituting less than a full unit will not have shareholder rights, except for those specified in an ordinance of the Ministry of Justice which include rights (i) to receive dividends, (ii) to receive cash or other assets in case of a consolidation or split of shares, share exchange or share transfer, or merger or (iii) to be allotted rights to subscribe for free for new shares and stock acquisition rights when such rights are granted to shareholders. Holders of shares constituting less than a full unit may at any time request us to purchase such shares constituting less than a full unit (a) at the current market price as determined pursuant to the Companies Act in cases of such shares having a market price (such as our common stock) or (b) at the price as determined through negotiations between the holders of shares constituting less than a full unit and us in cases where such shares have no market price (such as our preferred stock), which request may not be withdrawn without our consent. In addition, holders of shares constituting less than a full unit may require us to sell them such number of shares, which, when combined with the number of shares already held by such holder, shall constitute a whole unit of shares; provided that we will be obliged to comply with such request only when we own a sufficient number of shares to accommodate such request. As prescribed in our share handling regulations, such requests shall be made through an account managing institution at which such shareholder has its account and Japan Securities Depository Center, Inc. (“JASDEC”) pursuant to the rules of JASDEC, without going through the notification procedure required for the exercise of shareholders’ rights entitled regardless of record dates as described in “—Transfer of Shares.” The executive officers under the authority delegated by the Board of Directors may reduce the number of shares constituting one unit of shares or cease to use the unit share system by amendments to the articles of incorporation without a special resolution of the general meeting of shareholders which would otherwise be required.
General Meetings of Shareholders
The ordinary general meeting of shareholders shall be held no later than three months from the last day of each business year and is normally held in June of each year. In addition, we may hold an extraordinary general
133
meeting of shareholders whenever necessary. Notice of a general meeting of shareholders stating the place, the time and the purpose thereof must be given to each shareholder having voting rights (or, in the case of a non-resident shareholder, to its standing proxy or mailing address in Japan) at least two weeks prior to the date set for the meeting. The record date for an ordinary general meeting of shareholders is March 31 of each year.
Any shareholder holding at least 300 voting rights or 1% of the total number of voting rights for six months or longer may propose a matter to be considered at a general meeting of shareholders, and request to include the proposal in a notice of a general meeting of shareholders, by submitting a request to a representative executive officer at least eight weeks prior to the date of such meeting. However, the number of proposals that such shareholder may request to be included in such notice is limited up to 10 proposals, and we are able to decline to include the excessive proposals in such notice in the case where the number of proposal requested by each shareholder exceeds 10. Any of the minimum percentages, time periods and number of voting rights necessary for exercising the minority shareholder rights described above may be decreased or shortened if our articles of incorporation so provide.
Voting Rights
Our shareholders have one voting right for each unit of shares held by them (regarding the voting rights held by holders of preferred stock, see “—Preferred Stock—Voting Rights”).
Except as otherwise provided by law or in our articles of incorporation, a resolution shall be adopted at a general meeting of shareholders by a majority of the voting rights held by the shareholders present at the meeting. Our articles of incorporation provide that the quorum for election of directors is one-third of the total number of voting rights. Our shareholders are not entitled to cumulative voting in the election of directors. A shareholder may exercise its voting rights in writing or through a proxy, provided that the proxy shall also be a holder of our shares having voting rights at such meeting.
The Companies Act provides that certain important matters shall be approved by a “special resolution” of a general meeting of shareholders. Under our articles of incorporation, the quorum for a special resolution is one-third of the total number of voting rights, and the approval of not less than two-thirds of the voting rights held by the shareholders present at the meeting is required for adopting a special resolution. Such important matters include:
| 1. |
any amendment to our articles of incorporation (except for such amendments that may be authorized by executive officers under the authority delegated by the board of directors under the Companies Act such as (i) an increase of the number of authorized shares in the same ratio as that of a stock split, (ii) a reduction of the number of shares per unit of shares and (iii) abolishing the unit share system);
|
| 2. |
our dissolution, merger or consolidation requiring shareholders’ approval;
|
| 3. |
establishment of a parent and wholly-owned subsidiary relationship by way of a share transfer (kabushiki-iten) or share exchange (kabushiki-kokan), or establishment of a parent and subsidiary relationship by way of a partial share exchange (kabushiki-kofu), requiring shareholders’ approval;
|
| 4. |
transfer of the whole or a substantial part of our business;
|
| 5. |
transfer of the whole or a part of our shares in any of our subsidiaries requiring shareholders’ approval;
|
| 6. |
taking over of the whole of the business of another company requiring shareholders’ approval;
|
| 7. |
our corporate split requiring shareholders’ approval;
|
| 8. |
consolidation of shares of common stock;
|
| 9. |
acquisition of shares of common stock by us from a specific shareholder other than our subsidiary;
|
| 10. |
distribution of Surplus in kind (except when shareholders are granted the right to require to make such distribution in cash instead of in kind);
|
134
| 11. |
issuance or transfer of new shares or existing shares held by us as treasury stock to persons other than the shareholders at a “specially favorable” price; and
|
| 12. |
issuance of stock acquisition rights (including those incorporated in bonds with stock acquisition rights) to persons other than the shareholders at a “specially favorable” price or under “specially favorable” conditions.
|
Liquidation Rights
In the event of our liquidation, the assets remaining after payment of all debts, liquidation expenses, taxes and distributions of residual assets relating to the then outstanding preferred stock will be distributed among holders of common stock in proportion to the respective numbers of shares held by them. Regarding distributions of residual assets relating to the then outstanding preferred stock, see “—Preferred Stock—Liquidation Rights.”
Issue of Additional Shares and Pre-emptive Rights
Holders of the common stock have no pre-emptive rights. Authorized but unissued shares of common stock may be issued at such times and upon such terms as executive officers under the authority delegated by the Board of Directors determine, subject to the limitations as to the issuance of new shares of common stock at a “specially favorable” price mentioned in “—Voting Rights.”
In the case of an issuance or transfer of shares or stock acquisition rights by way of an allotment to a third party whereby the third party will hold more than 50% of the voting rights of all shareholders, we shall give notice (including a public notice) to our shareholders in advance, and if shareholders who hold one-tenth or more of the voting rights of all shareholders dissent from the third-party allotment, the approval by an ordinary resolution of a general meeting of shareholders is generally required before the payment date for such issuance or transfer pursuant to the Companies Act. In addition, pursuant to the regulations of the stock exchanges in Japan, in the case of an issuance or transfer of shares or stock acquisition rights by way of an allotment to a third party which would dilute the outstanding voting shares by 25% or more or change the controlling shareholder, in addition to a determination by the executive officers, the approval of the shareholders or an affirmative opinion from a person independent of our management is generally required.
Executive officers under the authority delegated by the Board of Directors may, however, determine that shareholders of a particular class of stock shall be given subscription rights to new shares of the same class, in which case they must be given on uniform terms to all shareholders of that class as of a record date of which not less than two weeks’ prior public notice must be given. Each of the shareholders to whom such rights are given must also be given at least two weeks’ prior notice of the date on which such rights expire (but see “—Preferred Stock—Issue of Additional Shares and Pre-emptive Rights” regarding our preferred stock).
Stock Acquisition Rights
We may issue stock acquisition rights
). Holders of stock acquisition rights are entitled to acquire shares from us, upon payment of the applicable exercise price, and subject to other terms and conditions thereof. We may also issue bonds with stock acquisition rights (
). The issuance of stock acquisition rights and bonds with stock acquisition rights may be authorized by executive officers under the authority delegated by the Board of Directors unless it is made at a “specially favorable” price or under “specially favorable” conditions, as described in “—Voting Rights” and subject to the approval of the shareholders or an affirmative opinion from an independent person in certain cases, as described in “—Issue of Additional Shares and Pre-emptive Rights.”
(shinkabu yoyakuken
shinkabu yoyakuken-tsuki shasai
Record Date
As mentioned above, March 31 is the record date for the payment of annual dividends and the determination of shareholders entitled to vote at the ordinary general meeting of shareholders. September 30 is the record date
135
for the payment of interim dividends. In addition, by a determination by executive officers under the authority delegated by the Board of Directors and after giving at least two weeks’ prior public notice, we may at any time set a record date in order to determine the shareholders who are entitled to certain rights pertaining to our stock.
JASDEC is required to give us notice of the names and addresses of our shareholders, the numbers of shares held by them and other relevant information as of such record date promptly after we set each record date.
Acquisition by Us of Common Stock
We may acquire shares of common stock:
| 1. |
by way of purchase on any Japanese stock exchange on which the shares of our common stock are listed or by way of tender offer (in either case pursuant to a resolution of the Board of Directors as long as our non-consolidated annual financial statements and certain documents for the latest fiscal year fairly present our assets and profit and loss, as required by an ordinance of the Ministry of Justice);
|
| 2. |
from a specific shareholder other than any of our subsidiaries (pursuant to a special resolution of a general meeting of shareholders); or
|
| 3. |
from any of our subsidiaries (pursuant to a determination by executive officers under the authority delegated by the Board of Directors).
|
In the case of 2. above, any other shareholder may make a request to us to be included as a seller in the proposed purchase, unless the purchase price or any other consideration to be received by the relevant specific shareholder will not exceed the last trading price of the shares on the relevant stock exchange on the day immediately preceding the date on which the resolution mentioned in 2. above was adopted (or, if there is no trading in the shares on the stock exchange or if the stock exchange is not open on such day, the price at which the shares are first traded on such stock exchange thereafter).
The total amount of the purchase price of shares of common stock may not exceed the Distributable Amount, as described in “—Distribution of Surplus—Restriction on Distribution of Surplus.”
We may hold the shares of common stock acquired, and may generally transfer or cancel such shares by a determination by executive officers under the authority delegated by the Board of Directors.
Disposal of Shares of Common Stock Held by Shareholders whose Location is Unknown
We are not required to send notices to a shareholder if notices given by us to such shareholder fail to arrive for five consecutive years or more at its address registered in our register of shareholders or otherwise notified to us.
In the above case, if the relevant shareholder also fails to receive dividends on the shares continuously for five years or more at its address registered in our register of shareholders or otherwise notified to us, then we may in general dispose of such shares at their then market price and hold or deposit the proceeds of such disposition on behalf of the relevant shareholder.
Reporting of Substantial Shareholders
The Financial Instruments and Exchange Act and its related regulations require any person who has become, beneficially and solely or jointly, a holder of more than 5% of the total issued shares of capital stock of a company that is listed on any Japanese stock exchange to file a report with the Director of the relevant Local Finance Bureau of the Ministry of Finance within five business days. With certain exceptions, a similar report must also be filed in respect of any subsequent change of 1% or more in the holding or of any change in material
136
matters set forth in any previously filed reports. For this purpose, shares issuable to such person upon conversion of convertible securities or exercise of share subscription warrants or stock acquisition rights are taken into account in determining both the number of shares held by the holder and the company’s total issued share capital. Any such report shall be filed with the Director of the relevant Local Finance Bureau of the Ministry of Finance through the Electronic Disclosure for Investors’ Network (EDINET) system.
There are other reporting requirements under the Banking Act. See “Item 4.B. Information on the Company—Business Overview—Supervision and Regulation—Japan—Examination and Reporting Applicable to Shareholders.”
Holding of Shares of Our Common Stock by Foreign Investors
There are no limitations imposed by the laws of Japan, our articles of incorporation or our other constituent documents on the rights of non-residents or foreign shareholders to hold or exercise voting rights on our shares of common stock or preferred stock.
Transfer of Shares
At present, JASDEC is the only institution that is designated by the relevant authorities as a clearing house which is permitted to engage in the clearing operations of listed shares under the Act on Book-Entry Transfer of Corporate Bonds, Stocks, etc. (Act No. 75 of 2001, including regulations promulgated thereunder; the “Book-entry Act”). Under the clearing system above, in order for any person to hold, sell or otherwise dispose of listed shares, such person must have an account at an account managing institution unless such person has an account at JASDEC. “Account managing institutions” are financial instruments business operators (i.e., securities companies), banks, trust companies and certain other financial institutions which meet the requirements prescribed by the Book-entry Act, and only those financial institutions that meet further stringent requirements of the Book-entry Act can open accounts directly at JASDEC. Under the Book-entry Act, any transfer of shares is effected through book entry, and title to the shares passes to the transferee at the time when the transferred number of the shares is recorded at the transferee’s account at an account managing institution or JASDEC. The holder of an account at an account managing institution or JASDEC is presumed to be the legal owner of the shares held in such account. Under the Companies Act and the Book-entry Act, in order to assert shareholders’ rights to which shareholders as of record dates are entitled (such as the rights to vote at a general meeting of shareholders or receive dividends) against us, a shareholder must have its name and address registered in our register of shareholders. Under the clearing system, such registration is made upon our receipt of necessary information from JASDEC. On the other hand, in order to assert shareholders’ rights to which shareholders are entitled regardless of record dates such as minority shareholders’ rights including the right to propose a matter to be considered at a general meeting of shareholders and to request to include the proposal in a notice of a general meeting of shareholders, except for shareholders’ rights to request us to purchase or sell shares constituting less than a full unit (as described in “—Unit Share System”), upon the shareholder’s request, JASDEC shall issue a notice of certain information, including the name and address of such shareholder, to us. Thereafter, such shareholder is required to present us a receipt of the request of the notice in accordance with our share handling regulations. Under the Book-entry Act, the shareholder shall exercise such shareholders’ right within four weeks after the notice above. Non-resident shareholders are required to appoint a standing proxy in Japan or provide a mailing address in Japan. Each such shareholder must give notice of such standing proxy or mailing address to the relevant account managing institution. Such notice will be forwarded to us through JASDEC. Japanese securities companies and commercial banks customarily act as standing proxies and provide related services for standard fees. Notices from us to non-resident shareholders are delivered to such standing proxies or mailing addresses.
Under the clearing system, shares constituting less than one unit are transferable. Under the rules of the Japanese stock exchanges, however, shares constituting less than one unit do not comprise a trading unit, except in limited circumstances, and accordingly may not be sold on Japanese stock exchanges.
137
Our transfer agent is Mizuho Trust & Banking, located at 2-1, Yaesu 1-chome, Chuo-ku, Tokyo 103-8670, Japan.
The registered holder of deposited shares underlying the ADSs is the depositary for the ADSs. Accordingly, holders of ADSs will not be able to directly assert their shareholders’ rights against us.
Preferred Stock
Unless otherwise specified, the following is a summary of information concerning the shares of our preferred stock as of the date hereof, including brief summaries of the relevant provisions of our articles of incorporation, our share handling regulations and the Companies Act and certain related legislation, all as currently in effect. The detailed rights of our preferred stock are set forth in our articles of incorporation and the resolutions of our Board of Directors or a determination by executive officer(s) under the authority delegated by the Board of Directors relating to the issuance of the relevant series of preferred stock.
General
Under our articles of incorporation, we are authorized to issue 90,000,000 shares of each of the first to fourth series of class XIV preferred stock (provided that the aggregate number of shares authorized to be issued with respect to the four series of class XIV preferred stock may not exceed 90,000,000 shares), 90,000,000 shares of each of the first to fourth series of class XV preferred stock (provided that the aggregate number of shares authorized to be issued with respect to the four series of class XV preferred stock may not exceed 90,000,000 shares), 150,000,000 shares of each of the first to fourth series of class XVI preferred stock (provided that the aggregate number of shares authorized to be issued with respect to the four series of class XVI preferred stock may not exceed 150,000,000 shares).
As of March 31, 2021, there was no outstanding preferred stock.
Preferred Dividends
Payment of annual dividends on shares of common stock is subject to the prior payment of the annual preferred dividends on shares of preferred stock. The amount of preferred dividends for each series of the preferred stock is as follows:
| • |
Each of the first to fourth series of class XIV preferred stock (currently not in issue) bears an annual non-cumulative dividend of the amount to be determined by resolution of the Board of Directors or determination by executive officer(s) under the authority delegated by the Board of Directors at the time of issuance, up to a maximum of ¥1,000 per share, and in the event we pay an interim dividend, holders are entitled to receive one half of such amount per share in preference to common stock.
|
| • |
Each of the first to fourth series of class XV preferred stock (currently not in issue) bears an annual non-cumulative dividend of the amount to be determined by resolution of the Board of Directors or determination by executive officer(s) under the authority delegated by the Board of Directors at the time of issuance, up to a maximum of ¥1,000 per share, and in the event we pay an interim dividend, holders are entitled to receive one half of such amount per share in preference to common stock.
|
| • |
Each of the first to fourth series of class XVI preferred stock (currently not in issue) bears an annual non-cumulative dividend of the amount to be determined by resolution of the Board of Directors or determination by executive officer(s) under the authority delegated by the Board of Directors at the time of issuance, up to a maximum of ¥1,000 per share, and in the event we pay an interim dividend, holders are entitled to receive one half of such amount per share in preference to common stock.
|
The amount of any interim preferred dividend will be deducted from the annual preferred dividend payable on preferred stock in respect of the same fiscal year.
138
No payment of dividends on our preferred stock or any other stock may be made unless we have sufficient Distributable Amount and a resolution to pay such dividend is obtained at the Board of Directors or at the relevant general meeting of shareholders, as the case may be.
Dividends on our preferred stock are non-cumulative. If the full amount of any dividend is not declared on our preferred stock in respect of any fiscal year, holders of our preferred stock do not have any right to receive dividends in respect of the deficiency in any subsequent fiscal year, and we will have no obligation to pay the deficiency or to pay any interest regardless of whether or not dividends are paid in respect of any subsequent fiscal year. The holders of our preferred stock are not entitled to any further dividends or other participation in or distribution of surplus.
Liquidation Rights
In the event of our voluntary or involuntary liquidation, holders of our preferred stock will be entitled, equally in rank as among themselves and in preference over shares of common stock, to receive a distribution of ¥10,000 per share out of our residual assets upon our liquidation.
Holders of our preferred stock are not entitled to any further dividends or other participation in or distribution of our residual assets upon our liquidation.
Voting Rights
No holder of preferred stock has a right to receive notice of, or to vote at, a general meeting of shareholders, except as otherwise specifically provided under the Companies Act or other applicable law or our articles of incorporation. Under our articles of incorporation, holders of units of our preferred stock will be entitled to receive notice of, and to vote at, general meetings of shareholders:
| • |
from the commencement of any ordinary general meeting of shareholders if an agenda for approval to declare a preferred dividend is not submitted to such meeting (except in the case where a resolution of the Board of Directors to pay the preferred dividends is made pursuant to our articles of incorporation between the last day of the business year and the date of such meeting); or
|
| • |
from the close of any ordinary general meeting of shareholders if a proposed resolution to declare a preferred dividend is not approved at such meeting,
|
until such time as a resolution of the Board of Directors to pay the preferred dividends is made pursuant to our articles of incorporation or a resolution of an ordinary general meeting of shareholders declaring a preferred dividend is approved.
A separate resolution of a meeting of the holders of the preferred stock is required in order to approve the following matters which would prejudice the interests of the holders of the relevant preferred stock:
| (i) |
an amendment to the articles of incorporation to add new classes of shares to be issued, alter the terms of the shares or increase the number of authorized number of shares or authorized number of any class of shares, with certain exceptions;
|
| (ii) |
consolidation or split of shares;
|
| (iii) |
pro rated allocation of shares or stock acquisition rights to shareholders without any consideration;
|
| (iv) |
granting pre-emptive rights for new shares or stock acquisition rights to shareholders;
|
| (v) |
amalgamations or mergers;
|
| (vi) |
certain corporate splits;
|
| (vii) |
share exchanges;
|
139
| (viii) |
share transfers;
|
| (ix) |
partial share exchanges; and
|
| (x) |
other matters set forth in the articles of incorporation.
|
Such separate resolution is not required when the articles of incorporation so provide, except in the case of (i) above.
A separate resolution of a meeting of the holders of the common stock is also required in cases where the above matters would prejudice the interests of the holders of the common stock.
Under our articles of incorporation, in cases where a matter to be resolved at an ordinary general meeting of shareholders is required to be approved by such separate resolution, the record date for the relevant meeting of the holders of the common stock or the preferred stock, as the case may be, is the same date as the record date for the ordinary general meeting of shareholders, when is March 31 of each year.
Ranking
We will not (unless the requisite sanction has been given by holders of preferred stock) create or issue any other shares ranking, as regards order of participation in the profits or assets of us on a liquidation or otherwise, in priority to the preferred stock in issue, but we may issue, without obtaining the consent of holders of the preferred stock in issue, other preferred stock ranking pari passu with the preferred stock in issue as regards the order of such participation in profits or assets of us and carrying such rights as to rates of preferred dividends or terms of conversion as the Board of Directors may determine, subject to the limitations set forth in our articles of incorporation and the Companies Act.
Acquisition of Preferred Stock
We may, if required, subject to regulatory approval, acquire any shares of the preferred stock then outstanding at any time out of the Distributable Amount (as defined in “—Common Stock—Restriction on Distribution of Surplus”). On or after the date to be determined by a resolution of the Board of Directors or a determination by executive officer(s) under the authority delegated by the Board of Directors relating to the issuance of the relevant preferred stock, we may also acquire all or a portion of each series of the first to fourth series of class XV (currently not in issue) or the first to fourth series of class XVI preferred stock (currently not in issue) at the acquisition price to be determined by a resolution of the Board of Directors or a determination by executive officer(s) under the authority delegated by the Board of Directors relating to the issuance of the relevant preferred stock on the date separately determined by a resolution of the Board of Directors or a determination by executive officer(s) under the authority delegated by the Board of Directors, without consent of the holders of such preferred stock. When a portion of a certain class of preferred stock is acquired, such acquisition shall be made from each holder thereof in number of shares determined by way of a lot or pro rata allocation.
Stock Splits
Our articles of incorporation provide that no stock split, stock consolidation or free distribution of stock shall be made in respect of the preferred stock unless otherwise provided for in any law or regulation.
Issue of Additional Shares and Pre-emptive Rights
Our articles of incorporation provide that no holder of our preferred stock has any pre-emptive right to subscribe for or purchase shares, stock acquisition rights or bonds with stock acquisition rights in the event of an issuance of additional shares or bonds and that no free distribution of stock acquisition rights may be made to the holders of our preferred stock.
140
Conversion
Our articles of incorporation provide that holders of the first to fourth series of class XIV (currently not in issue) or the first to fourth series of class XV (currently not in issue) preferred stock may, at their option, convert their shares to common stock by requesting us to acquire such shares and issue or transfer common stock to them. Other classes of our preferred stock are non-convertible.
Our articles of incorporation also provide that the first to fourth series of class XIV (currently not in issue) or the first to fourth series of class XV (currently not in issue) preferred stock outstanding on the last day of the acquisition period will be mandatorily acquired by us on the immediately following day (the “mandatory conversion date”) in consideration of shares of common stock of which number shall be calculated at the then-current market price per share of our common stock (the “mandatory conversion price”).
Acquisition of Preferred Stock without Consideration or in Exchange for Common Stock
In order to enable the relevant preferred stock to meet the criteria for inclusion in Additional Tier 1 capital under the capital adequacy guidelines of the Financial Services Agency under the Basel III rules, the first to fourth series of class XIV (currently not in issue), the first to fourth series of class XV (currently not in issue) and the first to fourth series of class XVI (currently not in issue) preferred stock have the following feature.
In respect of the first and second series of class XIV (currently not in issue), the first and second series of class XV (currently not in issue) and the first and second series of class XVI (currently not in issue) preferred stock, upon the occurrence of an event determined by a resolution of the Board of Directors or a determination by executive officer(s) under the authority delegated by the Board of Directors relating to the issuance of the relevant preferred stock as an event where a write-off of the relevant preferred stock or a conversion of the relevant preferred stock into common stock, or financial support or other similar measures taken by a public sector, without which we would become non-viable, is determined to be necessary, we shall mandatorily acquire the relevant preferred stock, in whole, free of consideration, on a date which falls after the occurrence of such event as determined by the resolution of the Board of Directors or a determination by executive officer(s) under the authority delegated by the Board of Directors relating to the issuance of the relevant preferred stock and which date shall be separately determined by a resolution of the Board of Directors or a determination by executive officer(s) under the authority delegated by the Board of Directors after the issuance of the relevant preferred stock, or a date which falls after the occurrence of the relevant certain event and which date shall be determined by the resolution of the Board of Directors or a determination by executive officer(s) under the authority delegated by the Board of Directors relating to the issuance of the relevant preferred stock, giving due consideration to the capital adequacy requirements applicable to us and other factors.
In respect of the third and fourth series of class XIV (currently not in issue), the third and fourth series of class XV (currently not in issue) and the third and fourth series of class XVI (currently not in issue) preferred stock, upon the occurrence of an event determined by a resolution of the Board of Directors or a determination by executive officer(s) under the authority delegated by the Board of Directors relating to the issuance of the relevant preferred stock as an event where a write-off of the relevant preferred stock or a conversion of the relevant preferred stock into common stock, or financial support or other similar measures taken by a public sector, without which we would become non-viable, is determined to be necessary, we shall mandatorily acquire the relevant preferred stock, in whole, on a date which falls after the occurrence of such event as determined by the resolution of the Board of Directors or a determination by executive officer(s) under the authority delegated by the Board of Directors relating to the issuance of the relevant preferred stock and which date shall be separately determined by a resolution of the Board of Directors or a determination by executive officer(s) under the authority delegated by the Board of Directors after the issuance of the relevant preferred stock, or a date which falls after the occurrence of the relevant certain event and which date shall be determined by the resolution of the Board of Directors or a determination by executive officer(s) under the authority delegated by the Board of Directors relating to the issuance of the relevant preferred stock, giving due consideration to the capital adequacy
141
requirements applicable to us and other factors, and instead, we shall deliver our own common stock to holders of the relevant preferred stock. In this case, the terms of acquisition, including the number of shares of the common stock to be delivered in exchange for the acquisition of one (1) share of the relevant preferred stock, shall be determined by the resolution of the relevant Board of Directors or the determination by relevant executive officer(s) under the authority delegated by the Board of Directors relating to the issuance of the relevant preferred stock, giving due consideration to the market price of common stock, the subscription price of the relevant preferred stock and other factors.
10.C. Material Contracts
There were no material contracts entered into by us for the two years preceding the filing of this annual report that were not entered into in the ordinary course of business.
10.D. Exchange Controls
Foreign Exchange and Foreign Trade Act
The following is a general summary of major Japanese foreign exchange controls regulations applicable to holders of our shares, voting rights or ADSs who are non-residents of Japan or foreign investors, each as described below. The statements regarding Japanese foreign exchange control regulations set forth below are based on the laws and regulations in force and as interpreted by the Japanese authorities as of the date of this annual report and are subject to subsequent changes in the applicable Japanese laws or interpretations thereof. This summary is not exhaustive of all possible foreign exchange controls considerations that may apply to a particular investor, and potential investors are advised to satisfy themselves as to the overall foreign exchange controls consequences of the acquisition, ownership and disposition of our shares, voting rights or ADSs by consulting their own advisors.
The Foreign Exchange and Foreign Trade Act of Japan (Act No. 228 of 1949, as amended) and the cabinet orders and ministerial ordinances incidental thereto, collectively the Foreign Exchange Act, set forth, among other matters, the regulations relating to the receipt by non-residents of Japan of payment with respect to shares to be issued by us and the acquisition and holding of our shares and voting rights by non-residents of Japan and the inward direct investment by foreign investors, each as described below. It also applies to the acquisition and holding of ADSs representing authority to exercise our voting rights by foreign investors that constitutes an inward direct investment. Generally, the Foreign Exchange Act currently in effect does not affect the right of a non-resident of Japan to purchase or sell ADSs outside Japan for non-Japanese currency unless such transaction constitutes an inward direct investment and requires prior notification filing.
“Non-residents of Japan” are defined as individuals who are not resident in Japan and corporations whose principal offices are located outside Japan. Generally, the branches and offices of non-resident corporations that are located in Japan are regarded as residents of Japan while the branches and offices of Japanese corporations located outside Japan are regarded as non-residents of Japan.
“Foreign investors” are the following persons who make “inward direct investments,” which is described below:
| • |
individuals not resident in Japan;
|
| • |
judicial persons or other organizations that are organized under the laws of foreign countries or whose principal offices are located outside Japan;
|
| • |
corporations of which 50% or more of the voting rights are held by (i) individuals not resident in Japan, (ii) judicial persons or other organizations that are organized under the laws of foreign countries or whose principal offices are located outside Japan, (iii) corporations of which 50% or more of the capital are held by such individuals falling within (i) above and/or judicial persons or other organizations
|
142
|
falling within (ii) above, and/or (iv) subsidiary corporations (as defined under the Japan’s Companies Act, but excluding judicial persons or other organizations that are organized under the laws of foreign countries or whose principal offices are located outside Japan) of such corporation falling within (iii) above;
|
| • |
partnerships under the Civil Code of Japan (Act No. 89 of 1896, as amended) established to invest in corporations, limited partnerships for investment under the Limited Partnership Act for Investment of Japan (Act No. 90 of 1998, as amended) or any other similar partnerships under the laws of foreign countries of which (i) 50% or more of the contributions are made by individuals not resident in Japan, judicial persons or other organizations that are organized under the laws of foreign countries or whose principal offices are located outside Japan and/or any other persons or organizations prescribed in the Foreign Exchange Act, or (ii) a majority of the general partners are individuals not resident in Japan, judicial persons or other organizations that are organized under the laws of foreign countries or whose principal offices are located outside Japan and/or any other persons or organizations prescribed in Foreign Exchange Act; and
|
| • |
judicial persons or other organizations, a majority of officers (or a majority of officers having the power of representation) of which are not resident in Japan.
|
An “inward direct investment” is a certain action defined in the Foreign Exchange Act and includes the following actions conducted by a foreign investor:
| • |
acquisition of shares or voting rights of a corporation listed on a Japanese stock exchange (the “listed corporation”), including authority to exercise, either directly or through instructions, such voting rights owned by others, that result in such foreign investor, together with parties that have a special relationship with that foreign investor, holding or having authority to exercise 1% or more of the total issued shares or voting rights;
|
| • |
acceptance of authority to exercise proxy voting rights on behalf of another shareholder of a listed corporation in respect of certain matters controlling or having material influence on its management (as prescribed in the Foreign Exchange Act), including election or removal of directors or transfer of its business, that result in such foreign investor, together with parties that have a special relationship with that foreign investor, holding or having authority to exercise 10% or more of the total voting rights;
|
| • |
obtaining consent from another foreign investor holding the voting rights of a listed corporation to exercise, either directly or through instructions, voting rights jointly, that result in such foreign investor obtaining such consent and such other foreign investor making such consent, together with parties that have a special relationship with those foreign investors, respectively, holding or having authority to exercise 10% or more of the total voting rights;
|
| • |
making consents at the general meeting of shareholders of a listed corporation to certain proposals having material influence on its management (as prescribed in the Foreign Exchange Act), including (a) election of the foreign investor making such consent or its related persons (as defined in the Foreign Exchange Act) as its directors or corporate auditors, or (b) transfer or discontinuation of its business, if such foreign investor, together with parties that have a special relationship with that foreign investor, holds or has authority to exercise 1% or more of the total voting rights.
|
Dividends and Proceeds of Sales
Under the Foreign Exchange Act, dividends paid on, and the proceeds of sales in Japan of, shares held by non-residents of Japan may in general be converted into any foreign currency and repatriated abroad. The acquisition of our shares by non-residents of Japan by way of a stock split is not subject to any notification or reporting requirements.
143
Acquisition of Shares
In general, a non-resident of Japan who acquires shares from a resident of Japan is not subject to any prior filing requirement, although the Foreign Exchange Act empowers the Minister of Finance of Japan to require prior approval for any such acquisition in certain limited circumstances. While such prior approval is not required in general, in the case where a resident of Japan transfers shares of a Japanese company for consideration exceeding 100 million yen to a non-resident of Japan, the resident of Japan that transfers the shares is required to report the transfer to the Minister of Finance of Japan within 20 days from the date of the transfer or the date of the payment for such transfer, whichever is later, unless the transfer is made through a bank or financial instruments business operator licensed or registered under Japanese law.
Inward Direct Investment
Prior Notification Requirements
If a foreign investor intends to consummate an action in respect of a listed corporation that constitutes an inward direct investment as described above, in certain circumstances, such as where the foreign investor is in a country that is not listed on an exemption schedule in the Foreign Exchange Act, or where that listed corporation is engaged in certain businesses designated by the Foreign Exchange Act (the “Designated Businesses”), prior notification of the relevant inward direct investment must be filed with the Minister of Finance and any other competent Ministers.
However, a foreign investor seeking to acquire shares or voting rights, including authority to exercise, either directly or through instructions, voting rights owned by others, of a listed corporation that constitutes an inward direct investment may be eligible for the exemptions, if certain conditions as described below are met. In the case of an acquisition of shares or voting rights, including authority to exercise, either directly or through instructions, voting rights owned by others, of a listed corporation engaged in certain Designated Businesses designated by the Foreign Exchange Act as core sector businesses (the “Core Sector Designated Businesses”), the foreign investor may be exempted from the prior notification requirement if, as a result of such acquisition, the foreign investor, together with parties that have a special relationship with that foreign investor, holds or has authority to exercise less than 10% of the total issued shares or voting rights of such corporation, and such foreign investor complies with the following conditions (the “Exemption Conditions”):
| • |
the foreign investor or its closely-related persons (as defined in the Foreign Exchange Act) will not become directors or corporate auditors of such corporation;
|
| • |
the foreign investor will not make certain proposals (as prescribed in the Foreign Exchange Act) at the general meeting of shareholders, including transfer or discontinuation of the Designated Businesses of such corporation;
|
| • |
the foreign investor will not access non-public technical information in relation to the Designated Businesses of such corporation, or take certain other actions that may lead to the leak of such non-public technical information (as prescribed in the Foreign Exchange Act);
|
| • |
the foreign investor will not attend, or not cause any persons designated by it to attend, meetings of such corporation’s board of directors, or meetings of committees having authority to make important decisions, in respect of the Core Sector Designated Businesses of such corporation; and
|
| • |
the foreign investor will not make, or not cause any persons designated by it to make, proposals to such board or committees or their members in writing or electronic form requesting any response or actions by certain deadlines in respect of the Core Sector Designated Businesses of such corporation.
|
Notwithstanding the above, if a foreign investor falls under a category of disqualified investors designated by the Foreign Exchange Act (including (a) investors who have records of certain sanctions due to violations of the Foreign Exchange Act and (b) certain investors who are state-owned enterprises or other related entities
144
excluding those who are accredited by the Minister of Finance), in no event may such foreign investor be eligible for the exemptions described above. On the other hand, if a foreign investor, excluding the disqualified investors described in the foregoing sentence, falls under a category of certain foreign financial institutions (as prescribed in the Foreign Exchange Act) and complies with the first three conditions included in the Exemption Conditions, such foreign investor may be eligible for the exemptions, even if, as a result of acquisition of shares or voting rights, including authority to exercise, either directly or through instructions, voting rights owned by others, such foreign investor, together with parties that have a special relationship with that foreign investor, holds or has authority to exercise 10% or more of the total issued shares or voting rights of a listed corporation engaged in the Core Sector Designated Businesses.
A subsidiary of ours currently engages in the businesses of software designed for cybersecurity business and such businesses fall into the category of the Core Sector Designated Businesses. For reference purposes only, the Minister of Finance publishes, and may update from time to time, a list that classifies listed corporations into the following categories: (i) corporations engaged only in businesses other than the Designated Businesses; (ii) corporations engaged in the Designated Businesses other than the Core Sector Designated Businesses; and (iii) corporations engaged in the Core Sector Designated Businesses. According to the list published by the Minister of Finance as of July 10, 2020, we are classified within category (iii) above.
In addition, if a foreign investor intends to (i) accept authority to exercise proxy voting rights on behalf of another shareholder of a listed corporation engaged in the Designated Businesses, or (ii) obtain consent from another foreign investor holding the voting rights of such corporation to exercise voting rights jointly, or (iii) consent to a proposal at the general meeting of shareholders of such corporation, in each case, that constitutes an inward direct investment as described above, prior notification of the relevant inward direct investment must be filed with the Minister of Finance and any other competent Ministers. In such cases, the newly introduced exemptions from the prior notification requirements may not be available, except for cases where a foreign investor obtains consent from another foreign investor holding the voting rights of such corporation to exercise voting rights jointly in respect of matters other than certain matters controlling or having a material influence on the management of such corporation (as prescribed in the Foreign Exchange Act), including election or removal of directors or transfer of business.
If such prior notification is filed, the proposed inward direct investment may not be consummated until after 30 days have passed from the date of filing, although this screening period may be shortened to two weeks unless the Minister of Finance and any other competent Ministers deem it necessary to review the proposed inward direct investment. The Ministers may extend the screening period up to five months if they deem it necessary to review the proposed inward direct investment and may recommend any modification or prohibition of the proposed inward direct investment and, if the foreign investor does not accept such recommendation, the Ministers may order the modification or prohibition of such inward direct investment. In addition, if a foreign investor (i) consummates such inward direct investment without filing the prior notification described above, (ii) consummates such inward direct investment before the expiration of the screening period described above, (iii) makes false statements in the prior notification described above or (iv) does not follow the recommendation or order issued by the Ministers to modify or prohibit such inward direct investment, the Ministers may order such foreign investor to dispose of all or part of the shares acquired or take other necessary measures.
If a foreign investor who consummated an inward direct investment without filing the prior notification due to the exemptions from such prior notification requirements as described above does not comply with any Exemption Conditions, the Ministers may recommend to take necessary measures and, if the foreign investor does not accept such recommendation, the Ministers may order to take such measures. If such foreign investor does not follow the order issued by the Ministers to take such measures, the Ministers may order such foreign investor to dispose of all or part of the shares acquired or take other necessary measures.
145
Post Facto Reporting Requirements
A foreign investor who consummates an inward direct investment as described above through an acquisition of shares or voting rights, including authority to exercise, either directly or through instructions, voting rights owned by others, of a listed corporation engaged in the Designated Businesses, including us (as of the date of this annual report), but is not subject to the prior notification requirements described above due to the exemptions from such prior notification requirements, in general, must file a report of the relevant inward direct investment with the Minister of Finance and any other competent Ministers within 45 days of the date when, as a result of such acquisition, the foreign investor (excluding, in the cases of (i) and (ii) below, a foreign investor who falls under a category of certain foreign financial institutions (as prescribed in the Foreign Exchange Act)), together with parties that have a special relationship with that foreign investor, holds or has authority to exercise (i) 1% or more but less than 3% of the total issued shares or voting rights, for the first time, (ii) 3% or more but less than 10% of the total issued shares or voting rights, for the first time, or (iii) 10% or more of the total issued shares or voting rights.
Acquisition of ADSs and Deposit and Withdrawal under American Depositary Facility
In respect of the acquisition of ADSs upon the deposit of shares with Mizuho Bank, in its capacity as custodian and agent for the depositary, in Tokyo, or otherwise, or the withdrawal of the underlying shares upon the surrender of the ADR, in each case by a foreign investor, where such acquisition of ADSs or withdrawal of the underlying shares constitutes an inward direct investment, in general, a prior notification will be required unless the exemption is available, as noted above, and if such prior notification is not required due to the exemption, a report will be required, as noted above.
10.E. Taxation
Japanese Taxation
The following is a general summary of major Japanese tax consequences (limited to national tax) to holders of shares of our common stock or ADSs representing shares of our common stock who are
non-residents
of Japan or
non-Japanese
corporations without a permanent establishment in Japan, which we refer to as
“non-resident
holders” in this section. The statements regarding Japanese tax laws set forth below are based on the laws and treaties in force and as interpreted by the Japanese tax authorities as at the date of this Annual Report and are subject to changes in the applicable Japanese laws or tax treaties, conventions or agreements, or interpretations thereof, occurring after that date. This summary is not exhaustive of all possible tax considerations that may apply to a particular investor, and potential investors are advised to satisfy themselves as to the overall tax consequences of the acquisition, ownership and disposition of shares of our common stock or ADSs, including specifically the tax consequences under Japanese law, the laws of the jurisdiction of which they are resident, and any tax treaty, convention or agreement between Japan and their country of residence, by consulting their own tax advisers.
For the purpose of Japanese tax law and the tax treaty between the United States and Japan, a U.S. holder of ADSs will generally be treated as the owner of the shares underlying the ADSs evidenced by the ADRs.
Generally, a
non-resident
holder of shares of our common stock or ADSs is subject to Japanese income tax collected by way of withholding on dividends paid by us, and such tax will be withheld prior to payment of dividends. Stock splits are, in general, not a taxable event.
In the absence of any applicable tax treaty, convention or agreement reducing the maximum rate of Japanese withholding tax or allowing exemption from Japanese withholding tax, the rate of Japanese withholding tax applicable to dividends paid by Japanese corporations on their shares of stock to
non-resident
holders is generally 20.42% under Japanese tax law. However, with respect to dividends paid on listed shares issued by a Japanese corporation (such as shares of our common stock or ADSs) to
non-resident
holders, other than any individual
146
shareholder who holds 3% or more of the total number of shares issued by the relevant Japanese corporation, the aforementioned 20.42% withholding tax rate is reduced to 15.315% for dividends due and payable on or before December 31, 2037. Due to the imposition of a special additional withholding tax (2.1% of the original withholding tax amount) to secure funds for reconstruction from the Great East Japan Earthquake, the original withholding tax rate of 15% and 20%, as applicable, has been effectively increased, respectively, to 15.315% and 20.42%, during the period beginning on January 1, 2013 and ending on December 31, 2037.
Under the income tax treaty between the United States and Japan, the maximum rate of Japanese withholding tax which may be imposed on dividends paid to a qualified United States resident eligible to enjoy treaty benefits that is either a corporation owning, directly or indirectly, less than 10% of the voting stock of a Japanese corporation or an individual is generally reduced to 10% of the gross amount actually distributed, except where such United States resident conducts business in Japan through a permanent establishment situated therein and the holding in respect of which the dividends are paid is effectively connected with such permanent establishment. Dividends paid to pension funds which are qualified United States residents eligible to enjoy treaty benefits are exempt from Japanese income taxation by way of withholding or otherwise unless such dividends are derived from the carrying on of a business, directly or indirectly, by such pension funds. Under Japanese tax law, any reduced maximum rate applicable under a tax treaty shall be available when such maximum rate is below the rate otherwise applicable under the Japanese tax law referred to in the preceding paragraph with respect to the dividends to be paid by us on shares of our common stock or ADSs. A
non-resident
holder of shares of our common stock who is entitled, under any applicable tax treaty, to a reduced rate of Japanese withholding tax, or exemption therefrom, as the case may be, is required to submit an Application Form for Income Tax Convention Regarding Relief from Japanese Income Tax and Special Income Tax for Reconstruction on Dividends (together with any other required forms and documents) in advance, through the withholding agent, to the relevant tax authority before payment of dividends. A standing proxy for a
non-resident
holder may provide such application service. In addition, a certain simplified special filing procedure is available for
non-resident
holders to claim treaty benefits of exemption from or reduction of Japanese withholding tax, by submitting a Special Application Form for Income Tax Convention Regarding Relief from Japanese Income Tax and Special Income Tax for Reconstruction on Dividends of Listed Stocks (together with any other required forms and documents). With respect to ADSs, this reduced rate or exemption will be applicable to
non-resident
holders of ADSs if the depositary or its Agent submits two Application Forms (one before payment of dividends and the other within eight months after the record date concerning such payment of dividends), together with certain other documents. To claim this reduced rate or exemption,
non-resident
holders of ADSs will be required to file a proof of taxpayer status, residence and beneficial ownership, as applicable, and to provide other information or documents as may be required by the depositary.
Non-resident
holders who are entitled, under any applicable tax treaty, to a reduced rate of Japanese withholding tax below the rate otherwise applicable under Japanese tax law, or exemption therefrom, as the case may be, but fail to submit the required application in advance may nevertheless be entitled to claim a refund from the relevant Japanese tax authority of withholding taxes withheld in excess of the rate under an applicable tax treaty (if such
non-resident
holders are entitled to a reduced treaty rate under the applicable tax treaty) or the full amount of tax withheld (if such
non-resident
holders are entitled to an exemption under the applicable tax treaty), as the case may be, by complying with a certain subsequent filing procedure.
We do not assume any responsibility to ensure withholding at the reduced rate, or exemption therefrom, for
non-resident
holders who would be so eligible under an applicable tax treaty but where the required procedures as stated above are not followed.
Gains derived from the sale or other disposition of shares of our common stock or ADSs outside Japan by a
non-resident
holder, who is a portfolio investor, are not, in general, subject to Japanese income tax or corporation tax.
Any deposits or withdrawals of shares of our common stock by a
non-resident
holder in exchange for ADSs are, in general, not subject to Japanese income or corporation tax.
147
Japanese inheritance and gift taxes, at progressive rates, may be payable by an individual who has acquired our shares of our common stock or ADSs from an individual, as a legatee, heir or donee, even if none of the acquiring individual, the decedent or the donor is a Japanese resident.
U.S. Taxation
The following sets forth the material United States federal income tax consequences of the ownership of shares and ADSs as of the date hereof. The discussion set forth below is applicable to U.S. holders (as defined below) (i) who are residents of the United States for purposes of the current income tax treaty between Japan and the United States (the “Treaty”), (ii) whose shares or ADSs are, for purposes of the Treaty, neither effectively connected with nor attributable to a permanent establishment in Japan and (iii) who otherwise qualify for the full benefits of the Treaty.
The following summary is not a complete analysis or description of all potential U.S. federal income tax consequences to a particular U.S. holder. It does not address all U.S. federal income tax considerations that may be relevant to all categories of potential purchasers, certain of which (such as banks or other financial institutions, insurance companies, dealers in securities or currencies,
method of accounting for their securities, regulated investment companies, real estate investment trusts, holders whose “functional currency” is not the U.S. dollar, holders liable for alternative minimum tax, persons required to accelerate the recognition of any item of gross income with respect to shares or ADSs as a result of such income being recognized on an applicable financial statement and holders of 10% or more of our shares by vote or value) are subject to special tax treatment. This summary does not address the Medicare tax on net investment income or any foreign, state, local or other tax consequences of investments in our shares or ADSs.
tax-exempt
entities,
non-U.S.
persons, persons holding a share or an ADS as part of a “straddle,” “hedge,” conversion or integrated transaction, partnerships or other pass-through entities for U.S. federal income tax purposes, traders in securities who have elected the
mark-to-market
This summary addresses only shares or ADSs held as capital assets.
As used herein, a “U.S. holder” is a beneficial owner of shares or ADSs, as the case may be, that is, for U.S. federal income tax purposes:
| • |
an individual citizen or resident of the United States;
|
| • |
a corporation (or other entity treated as a corporation for U.S. federal income tax purposes) created or organized in or under the laws of the United States or any political subdivision thereof;
|
| • |
an estate, the income of which is subject to U.S. federal income tax regardless of its source; or
|
| • |
a trust if it (1) is subject to the primary supervision of a court within the United States and the control of one or more U.S. persons as described in Section 7701(a)(30) of the Code or (2) has a valid election in effect under applicable U.S. Treasury regulations to be treated as a U.S. person.
|
If a partnership holds shares or ADSs, the tax treatment of a partner will generally depend on the status of the partner and the activities of the partnership. If you are a partner of a partnership holding shares or ADSs, you should consult your tax advisor.
The discussion below is based upon the provisions of the Internal Revenue Code of 1986, as amended (the “Code”), and regulations, rulings and judicial decisions thereunder as of the date hereof, and such authorities may be replaced, revoked or modified so as to result in U.S. federal income tax consequences different from those discussed below. In addition, this summary is based, in part, upon representations made by the depositary to us and assumes that the deposit agreement, and all other related agreements, will be performed in accordance with their terms.
148
We urge U.S. holders to consult their own tax advisors concerning the U.S. federal, state and local and other tax consequences to them of the purchase, ownership and disposition of shares or ADSs.
ADSs
If a U.S. holder holds ADSs, for U.S. federal income tax purposes, such holder will generally be treated as the owner of the underlying shares that are represented by such ADSs. Accordingly, deposits or withdrawals of shares in exchange for ADSs are not subject to U.S. federal income tax.
Taxation of Dividends
Subject to the discussion under “—U.S. Taxation—Passive Foreign Investment Company Rules” below, the gross amount of any distribution received with respect to our shares or ADSs (including amounts withheld to reflect Japanese withholding taxes) will be taxable as dividends, to the extent paid out of our current or accumulated earnings and profits (as determined for U.S. federal income tax purposes). The amount of distribution of property other than cash will be the fair market value of such property on the date of the distribution. Such cash or
non-cash
income, including withheld taxes, will be includable in a U.S. holder’s gross income as ordinary income on the day actually or constructively received by such U.S. holder in the case of shares, or by the depositary in the case of ADSs. Such dividends received by a U.S. holder will not be eligible for the “dividends-received deduction” allowed to U.S. corporations in respect of dividends received from other U.S. corporations. To the extent that an amount received by a U.S. holder exceeds such holder’s allocable share of our current and accumulated earnings and profits, such excess will be applied first to reduce such holder’s tax basis in its shares or ADSs, thereby increasing the amount of gain or decreasing the amount of loss recognized on a subsequent disposition of the shares or ADSs. Then, to the extent such distribution exceeds such U.S. holder’s tax basis, such excess will be treated as capital gain. However, we do not expect to keep earnings and profits in accordance with U.S. federal income tax principles. Therefore, U.S. holders should expect that a distribution will generally be treated as a dividend.
The amount of the dividend paid in yen will be the U.S. dollar value of the yen payments received. This value will be determined at the spot yen/U.S. dollar rate on the date the dividend is received by the depositary in the case of U.S. holders of ADSs, or by the shareholder in the case of U.S. holders of shares, regardless of whether the dividend payment is in fact converted into U.S. dollars at that time. If the yen received as a dividend are not converted into U.S. dollars on the date of receipt, a U.S. holder will have basis in such yen equal to their dollar value on the date of receipt, and any foreign currency gains or losses resulting from the conversion of the yen will generally be treated as U.S. source ordinary income or loss.
The maximum rate of withholding tax on dividends paid to you pursuant to the Treaty is 10%. As discussed under “—Japanese Taxation” above, if the Japanese statutory rate applicable to you is higher than the maximum Treaty rate, you will be required to properly demonstrate to the Japanese tax authorities your entitlement to the reduced withholding rate under the Treaty. Subject to certain limitations, the Japanese tax withheld may be creditable against the U.S. holder’s U.S. federal income tax liability or may be claimed as a deduction from the U.S. holder’s federal adjusted gross income provided that the U.S. holder elects to deduct all foreign taxes paid or accrued in the same taxable year. For foreign tax credit limitation purposes, the dividend will be income from sources outside the United States. The limitation on foreign taxes eligible for credit is calculated separately with respect to specific classes of income. For this purpose, dividends we pay will generally constitute “passive category income.” Further, in certain circumstances, if a U.S. holder:
| • |
has held shares or ADSs for less than a specified minimum period during which such U.S. holder is not protected from the risk of loss; or
|
| • |
is obligated to make payments related to the dividends,
|
such U.S. holder will not be allowed a foreign tax credit for foreign taxes imposed on dividends paid on shares or ADSs. The rules governing U.S. foreign tax credits are very complex and U.S. holders should consult their tax advisors regarding the availability of foreign tax credits under their particular circumstances.
149
With respect to
non-corporate
U.S. investors, certain dividends received from a qualified foreign corporation may be subject to reduced rates of taxation. A qualified foreign corporation includes a corporation that is eligible for the benefits of a comprehensive income tax treaty with the United States which the U.S. Treasury Department determines to be satisfactory for these purposes and which includes an exchange of information provision. The U.S. Treasury Department has determined that the Treaty meets these requirements. In addition, it is expected that we will be eligible for the benefits of the Treaty. A foreign corporation is also treated as a qualified foreign corporation with respect to dividends paid by that corporation on shares (or ADSs backed by such shares) that are readily tradable on an established securities market in the United States. United States Treasury Department guidance indicates that our ADSs (which are listed on the New York Stock Exchange), but not the shares, are readily tradable on an established securities market in the United States. There can be no assurance that our ADSs will be considered readily tradable on an established securities market in later years.
Non-corporate
holders who do not meet a minimum holding period requirement during which they are not protected from a risk of loss or that elect to treat the dividend income as “investment income” pursuant to Section 163(d)(4) of the Code will not be eligible for the reduced rates of taxation. In addition, the rate reduction will not apply to dividends if the recipient of a dividend is obligated to make related payments with respect to positions in substantially similar or related property. This disallowance applies even if the minimum holding period has been met. U.S. holders should consult their own tax advisors regarding the application of the foregoing rules to their particular circumstances.
Taxation of Capital Gains
Upon a sale or other disposition of shares or ADSs, a U.S. holder will recognize gain or loss in an amount equal to the difference between the U.S. dollar value of the amount realized and the U.S. holder’s tax basis, determined in U.S. dollars, in such shares or ADSs. Subject to the discussion under “—U.S. Taxation—Passive Foreign Investment Company Rules” below, such gain or loss will be capital gain or loss and will be long-term capital gain or loss if the U.S. holder’s holding period for such shares or ADSs exceeds one year. A U.S. holder’s tax basis in its shares or ADSs will generally be the cost to the holder of such shares or ADSs. Any such gain or loss realized by a U.S. holder upon disposal of the shares or ADSs will generally be income or loss from sources within the United States for foreign tax credit limitation purposes. The deductibility of capital losses is subject to limitations.
Passive Foreign Investment Company Rules
Based on our past and projected composition of income and assets and the valuation of our assets, including goodwill, we do not believe that we were a passive foreign investment company (“PFIC”) for our most recent taxable year and do not expect to become one in the current taxable year or the foreseeable future, although there can be no assurance in this regard. However, PFIC status is a factual determination that is made annually. Accordingly, it is possible that we may become a PFIC in the current or any future taxable year due to changes in the composition of our income or assets or the valuation of our assets. In addition, this determination is based in part upon certain proposed U.S. Treasury regulations that are not yet in effect (the “Proposed Regulations”) and are subject to change in the future. The Proposed Regulations and other administrative pronouncements from the Internal Revenue Service (the “IRS”) provide special rules for determining the character of income and assets derived in the banking business for purposes of the PFIC rules. Although we believe we have adopted a reasonable interpretation of the Proposed Regulations and administrative pronouncements, there can be no assurance that the IRS will follow the same interpretation.
In general, a foreign corporation is considered a PFIC for any taxable year if either:
| • |
at least 75% of its gross income is passive income; or
|
| • |
at least 50% of the value of its assets is attributable to assets that produce or are held for the production of passive income.
|
150
The 50% of value test is based on the average of the value of our assets for each quarter during the taxable year. If we own at least 25% by value of another company’s stock, we will be treated, for purposes of the PFIC rules, as owning the proportionate share of the assets and receiving our proportionate share of the income of that company.
If we are a PFIC for any taxable year during which a U.S. holder holds shares or ADSs, the U.S. holder will be subject to special tax rules with respect to any “excess distribution” that the U.S. holder receives and any gain the U.S. holder realizes from the sale or other disposition (including a pledge) of shares or ADSs. Additionally,
non-corporate
U.S. holders will not be eligible for reduced rates of taxation on any dividends received from us if we are a PFIC in the taxable year in which such dividends are paid or in the preceding taxable year.
These special tax rules generally will apply even if we cease to be a PFIC in future years. Distributions U.S. holders receive in a taxable year that are greater than 125% of the average annual distributions they received during the shorter of the three preceding taxable years or their holding period for shares or ADSs will be treated as excess distributions. Under these special tax rules:
| • |
the excess distribution or gain will be allocated ratably over the U.S. holder’s holding period for shares or ADSs;
|
| • |
the amount allocated to the current taxable year, and any taxable year prior to the first taxable year in which we were a PFIC, will be treated as ordinary income; and
|
| • |
the amount allocated to each other year will be subject to tax at the highest tax rate in effect for that year for individuals or corporations, as applicable, and the interest charge generally applicable to underpayments of tax will be imposed on the resulting tax attributable to each such year.
|
Alternatively, a U.S. holder could make a
election provided that shares or ADSs are regularly traded on a qualified exchange. Under current law, the
election may be available to U.S. holders of ADSs because the ADSs are listed on the New York Stock Exchange which constitutes a qualified exchange, although there can be no assurance that the ADSs will be “regularly traded” for purposes of the
election. Under current law, the
election may be available to U.S. holders of shares because the shares are listed on the Tokyo Stock Exchange, which constitutes a qualified exchange, although there can be no assurance that the shares will be “regularly traded” for purposes of the
election. U.S. holders should consult their own tax advisors regarding the potential availability and consequences of a
election. In addition, a U.S. holder of shares or ADSs in a PFIC can sometimes avoid the rules described above by electing to treat the company as a “qualified electing fund” under Section 1295 of the Code. This option is not available to U.S. holders of shares or ADSs because we do not intend to comply with the requirements necessary to permit U.S. holders to make this election.
mark-to-market
mark-to-market
mark-to-market
mark-to-market
mark-to-market
mark-to-market
If a U.S. holder holds shares or ADSs in any year in which we are classified as a PFIC, such holder may be required to file IRS Form 8621.
U.S. holders should consult their own tax advisors concerning the determination of our PFIC status and the U.S. federal income tax consequences of holding shares or ADSs if we are considered a PFIC in any taxable year.
Information Reporting and Backup Withholding
In general, information reporting requirements will apply to dividends in respect of the shares or ADSs or the proceeds from the sale, exchange or other disposition of the shares or ADSs paid within the United States, and, in some cases, outside of the United States, to you, unless you are an exempt recipient. In addition, backup withholding tax may apply to those amounts if you fail to provide an accurate taxpayer identification number or fail either to report interest and dividends required to be shown on your U.S. federal income tax returns or to
151
make certain certifications. The amount of any backup withholding from a payment to you will be allowed as a refund or credit against your U.S. federal income tax liability, provided you furnish the required information to the IRS.
Certain U.S. holders are required to report information with respect to their investment in shares or ADSs not held in an account maintained by certain financial institutions to the IRS. Investors who fail to report required information by attaching a complete IRS Form 8938, Statement of Specified Foreign Financial Assets, on their tax return for each year in which they hold shares or ADSs could become subject to substantial penalties. Potential investors are urged to consult with their own tax advisors regarding the possible implications of these rules on their investment in shares or ADSs.
10.F. Dividends and Paying Agents
Not applicable.
10.G. Statement by Experts
Not applicable.
10.H. Documents on Display
We file annual reports on Form
20-F
with, and furnish periodic reports on Form
6-K
to, the U.S. Securities and Exchange Commission via the Electronic Data Gathering, Analysis, and Retrieval system. These reports, including this annual report on Form
20-F
and the exhibits thereto, and other information can be inspected on the Commission’s website (https://www.sec.gov).
10.I. Subsidiary Information
Not applicable.
152
|
ITEM 11.
|
QUANTITATIVE AND QUALITATIVE DISCLOSURES ABOUT CREDIT, MARKET AND OTHER RISK
|
Amid the growing diversity and complexity of banking operations, financial institutions are exposed to various risks, including credit, market, operations, information technology, legal, settlement and other risks. We recognize the conducting of operations tailored to the risks and managing such risks as a key issue relating to overall management. In order to implement our business strategy while maintaining our financial stability, we maintain comprehensive risk management and control measures. Mizuho Financial Group maintains basic policies for risk management established by our Board of Directors that are applicable to the entire Mizuho group. These policies clearly define the kinds of risks to be managed, set forth the organizational structure and provide for the human resources training necessary for appropriate levels of risk management. The policies also provide for audits to measure the effectiveness and suitability of the risk management structure. In line with these basic policies, we maintain various measures to strengthen and enhance the sophistication of our risk management system.
All yen figures and percentages in this item are truncated. Accordingly, the total of each column of figures may not be equal to the total of the individual items.
Overview of Risk Management
Risk Management Structure
Each of our subsidiaries adopts appropriate risk management measures for its business based on the size and nature of its risk exposures, while Mizuho Financial Group controls risk management for the Mizuho group as a whole. At Mizuho Financial Group, the Risk Management Committee, which is one of the Business Policy Committees of Mizuho Financial Group and chaired by the Group Chief Risk Officer, provides integrated monitoring and management of the overall risk for the Mizuho group. The Group Chief Risk Officer reports the risk management situation to the Board of Directors, the Risk Committee and the Executive Management Committee, etc., on a regular basis and as needed. Mizuho Financial Group regularly receives reports and applications concerning the risk management situation from our principal banking subsidiaries and other core group companies and gives them appropriate instructions concerning risk management. Our principal banking subsidiaries and other core group companies each maintain their own systems for managing various types of risk, receiving reports on the status of risk at their respective subsidiaries, and gives them appropriate instructions concerning risk management as necessary.
Basic Approach
We classify the risks arising from the group’s businesses into different types of risk such as credit risk, market risk, liquidity risk and operational risk according to their risk factors, and manage each type of risk depending on its characteristics. Furthermore, each group entity manages such risks according to the characteristics of its business operations (i.e., management of risks associated with settlement and trust businesses, etc.). In addition to managing each type of risk individually, we have established a comprehensive risk management structure to identify and evaluate overall risk and to keep risk within limits that are managerially acceptable. In line with the basic policies relating to overall risk management laid down by Mizuho Financial Group, companies within the Mizuho group identify risk broadly and take a proactive and sophisticated approach to risk management.
Risk Capital Allocation
We endeavor to obtain a clear grasp of the group’s risk exposure and have implemented measures to control such risks within the group’s financial base in accordance with the risk capital allocation framework. More specifically, we allocate risk capital to our principal banking subsidiaries, including their respective subsidiaries, and other core group companies to control risk within the limits set for each company. We also control risk
153
within managerially acceptable limits by working to ensure that the overall risk we hold on a consolidated basis does not exceed our financial strength. To ensure the ongoing financial soundness of Mizuho Financial Group, our principal banking subsidiaries and other core group companies, we regularly monitor the manner in which risk capital is being used in order to obtain a proper grasp of the risk profile within this framework. Reports are also submitted to the Board of Directors and other committees of each company. Risk capital is allocated to Mizuho Bank, Mizuho Trust & Banking, Mizuho Securities and Mizuho Americas by risk category, and is further allocated within their respective business units based on established frameworks.
Stress Testing
For the purpose of verifying the appropriateness of the Mizuho group’s risk appetite and the adequacy of its business plans, we carry out stress testing on our entire portfolio by measuring and assessing the impacts on our capital ratio and financial performance of the stress events assumed in the scenarios set by the group. Stress testing is carried out to confirm that the required capital ratio and financial performance can be secured on the occurrence of any of the assumed stress events. When our capital ratio or financial performance falls below the required level, we will consider and carry out a revision of our risk appetite and business plans. We also calculate the impacts of assumed stress events on risk volumes, including interest rate risk related to our banking book that is not covered by regulatory capital, to confirm whether the risk volumes balance with the group’s capital when a risk event occurs. The calculated risk volumes are used for assessing the group’s internal capital adequacy. Risk scenarios are set considering the current and projected economic conditions, as well as vulnerabilities in the group’s business and financial structure. Moreover, we have established a robust risk management framework under which stress testing is respectively carried out for each risk category, including market risk. Through such stress testing, we deepen our understanding of the distinctive features of our businesses and portfolios, and proactively determine action to be taken if a stress event happens. In this way, we are committed to enhancing our risk management capabilities on a continued basis.
Credit Risk Management
Basic Approach
We define credit risk as the Mizuho group’s exposure to the risk of losses that may be incurred due to a decline in, or total loss of, the value of assets (including
off-balance-sheet
instruments), as a result of deterioration in obligors’ financial position. Mizuho Financial Group manages credit risk for the group as a whole. Specifically, Mizuho Financial Group establishes the group’s fundamental credit risk policy to manage major group companies, and monitors and manages the credit risks of the group as a whole.
Credit Risk Management Structure
Our Board of Directors determines the Mizuho group’s basic matters pertaining to credit risk management. In addition, the Risk Management Committee broadly discusses and coordinates matters relating to basic policies and operations in connection with credit risk management and matters relating to credit risk monitoring for the Mizuho group. Under the control of the Group Chief Risk Officer of Mizuho Financial Group, the Credit Risk Management Department and the Risk Management Department jointly monitor, analyze and submit suggestions concerning credit risk and formulate and execute plans in connection with basic matters pertaining to credit risk management.
Our principal banking subsidiaries and other core group companies manage their credit risk according to the scale and nature of their exposures in line with basic policies set forth by Mizuho Financial Group. The Board of Directors of each company determines key matters pertaining to credit risk management.
The Balance Sheet & Risk Management Committee and the Credit Committee, each of which is a Business Policy Committee of our principal banking subsidiaries, are responsible for discussing and coordinating overall
154
management of their individual credit portfolios and transaction policies towards obligors. The respective Chief Risk Officers of our principal banking subsidiaries are responsible for matters relating to planning and implementing credit risk management. The credit risk management departments of our principal banking subsidiaries are in charge of planning and administering credit risk management and conducting credit risk measuring and monitoring. Such departments regularly present reports regarding their risk management situation to Mizuho Financial Group. The credit departments of our principal banking subsidiaries determine policies and approve/disapprove individual transactions in terms of credit review, credit management and collection from obligors in accordance with the lines of authority set forth respectively by our principal banking subsidiaries. In addition, our principal banking subsidiaries have established internal audit groups that are independent of the business departments in order to ensure appropriate credit risk management.
Method of Credit Risk Management
We have adopted two different but mutually complementary approaches to credit risk management. The first approach is “individual credit management,” in which we manage the process for each individual transaction and individual obligor from execution until collection, based on our assessment of the credit quality of the obligor. Through this process, we curb losses in the case of a credit event. The second is “credit portfolio management,” in which we utilize statistical methods to assess the potential for losses related to credit risk. Through this process, we identify credit risks and respond appropriately.
Individual Credit Management
Credit Codes
The basic code of conduct for all of our officers and employees engaged in the credit business is set forth in our credit code. Seeking to fulfill the bank’s mission and social responsibilities, our basic policy for credit business is determined in light of fundamental principles focusing on public welfare, safety, growth and profitability.
Internal Rating System
One of the most important elements of the risk management infrastructure of our principal banking subsidiaries is the use of an internal rating system that consists of credit ratings and pool allocations. Credit ratings consist of obligor ratings which represent the level of credit risk of the obligor, and transaction ratings which represent the possibility of ultimately incurring losses related to each individual claim by taking into consideration the nature of any collateral or guarantee and the seniority of the claim. In principle, obligor ratings apply to all obligors and are subject to regular reviews at least once a year to reflect promptly the fiscal period end financial results of the obligors, as well as special reviews as required whenever an obligor’s credit standing changes. This enables our principal banking subsidiaries to monitor both individual obligors and the status of the overall portfolio in a timely fashion. Because we consider obligor ratings to be an initial phase of the self-assessment process regarding the quality of our loans and
off-balance-sheet
instruments, such obligor ratings are closely linked to the obligor classifications and are an integral part of the process for determining the provision for credit losses on loans and charge-offs in our self-assessment of loans and
off-balance-sheet
instruments.
To assign obligor ratings, we have a quantitative evaluation system (rating model) in place to enable proper assessment of an obligor’s credit standing. The system gives a quantitative rating to an obligor based on obligor-specific characteristics such as type of business (corporation or individual) and geography (in Japan or outside Japan). We categorize our rating models for companies in Japan into those for large companies and those for small and
medium-sized
companies. The former consist of 13 models according to industry-specific factors, while the latter consist of three models. For companies outside Japan, we utilize nine models.
These were developed by the Credit Risk Management Department based on a statistical methodology and approved by the Chief Risk Officer.
155
Pool allocations are applied to small claims that are less than a specified amount by pooling obligors and claims with similar risk characteristics and assessing and managing the risk for each such pool. Our principal banking subsidiaries efficiently manage credit risk and credit screening by dispersing a sufficient number of small claims within each pool. Our principal banking subsidiaries generally review the appropriateness and effectiveness of our approach to obligor ratings and pool allocations once a year in accordance with predetermined procedures, which is audited by the Internal Audit Group.
Mizuho Financial Group defines a Restructured Loan as a loan extended to a Watch Obligor when the following conditions are met: an obligor is experiencing financial difficulties; and lending conditions were amended favorably to the obligor such as allowing interest rate reduction, postponement of principal repayment/interest payment, debt forgiveness, etc.
An overdue loan is defined as a loan for a Watch Obligor of which the loan principal or interest is overdue for three months or more following the contractual payment date.
Self-assessment, Provision for Credit Losses on Loans and
Off-Balance-Sheet
Instruments and Charge-Offs
We conduct self-assessment of assets to ascertain the status of assets both as an integral part of credit risk management and in preparation for appropriate accounting treatment, including provision for credit losses on loans and
off-balance-sheet
instruments and charge-offs. During the process of self-assessment, obligors are categorized into certain groups taking into consideration their financial condition and their ability to make payments, and credit ratings are assigned to all obligors, in principle, to reflect the extent of their credit risks. The related assets are then categorized into certain classes based on the risk of impairment. This process allows us to identify and control the actual quality of assets and determine the appropriate accounting treatment, including provision for credit losses on loans and
off-balance-sheet
instruments and charge-offs. Specifically, the credit risk management department of each of our principal subsidiaries is responsible for the overall control of the self-assessment of assets of the respective banking subsidiaries, cooperating with the administrative departments specified for each type of asset, including loan portfolios and securities, in executing and managing self-assessments. In our assessment of the probability of obligor bankruptcy, we deem an obligor that is rated as being insolvent or lower as being bankrupt.
Credit Review
Prevention of new nonaccrual loans through routine credit management is important in maintaining the quality of our overall loan assets. Credit review involves analysis and screening of each potential transaction within the relevant business department. In case the screening exceeds the authority of the department, the credit department in charge at headquarters carries out the review. We have specialist departments for different industries, business sizes and regions, carries out timely and specialized examinations based on the characteristics of the obligor and its market, and provides appropriate advice to the business department. In addition, in the case of obligors with low credit ratings and high downside risks, the business department and credit department jointly clarify their credit policy and in appropriate cases assist the obligors at an early stage in working towards credit soundness.
Credit Portfolio Management
Risk Measurement
We use statistical methodologies that involve a risk measurement system (enterprise value corporate valuation model, holding period of one year) to manage the possibility of losses by measuring the expected average loss for a
one-year
risk horizon (“Expected Loss”) and the maximum loss within a certain confidence interval (“credit VAR”). The difference between Expected Loss and credit VAR is measured as the credit risk amount (“Unexpected Loss”). The risk measurement system covers the following account items reported by each
156
Mizuho Financial Group company: credit transactions including loans and discounts; securities; obligor’s liabilities for acceptances and guarantees; deposits and foreign exchange; derivatives including swaps and options;
off-balance-sheet
items including commitments; and other assets involving credit risk.
In establishing transaction spread guidelines for credit transactions, we aim to ensure an appropriate return from the transaction in light of the level of risk by utilizing credit cost data as a reference. Also, we monitor our credit portfolio from various perspectives and set guidelines noted below so that losses incurred through a hypothetical realization of the full credit VAR would be within the amount of risk capital and loan loss reserves.
Risk Control Methods
Our principal banking subsidiaries have established guidelines to manage “credit concentration risk,” which stems from granting excessive credit to certain corporate groups. Our principal banking subsidiaries also set the credit limit based on verification of status of capital adequacy. In cases where the limit is exceeded, our principal banking subsidiaries will formulate a handling policy and/or action plan. In addition to the above, our principal banking subsidiaries monitor total credit exposure, credit exposure per rating, credit concentration per corporate group, geographic area and business sector to make a periodical report to the Balance Sheet & Risk Management Committee and the Credit Committee.
157
The following diagram shows our risk management structure:
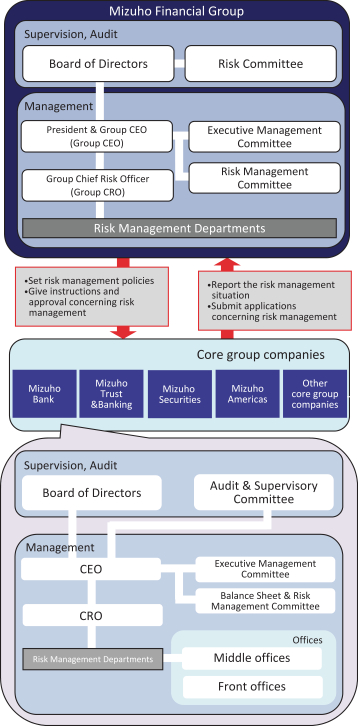
158
Market Risk Management
Basic Approach
We define market risk as the risk of losses incurred by the group due to fluctuations in interest rates, stock prices, foreign exchange rates, etc. Market risk includes market liquidity risk; i.e., the risk that we will suffer a loss due to market disruptions or other disorders that prevent us from conducting transactions in the market or require us to pay significantly higher prices than normal to conduct transactions. Mizuho Financial Group manages market risk for the Mizuho group as a whole. Specifically, Mizuho Financial Group establishes the fundamental risk management policy for the entire group, manages the market risk of our principal banking subsidiaries and other core group companies and monitors how the group’s market risk is being managed as a whole.
Market Risk Management Structure
Our Board of Directors determines basic matters pertaining to market risk management policies. The Risk Management Committee of Mizuho Financial Group broadly discusses and coordinates matters relating to basic policies in connection with market risk management, market risk operations and market risk monitoring. The Chief Risk Officer of Mizuho Financial Group is responsible for matters relating to market risk management planning and operations.
The Risk Management Department of Mizuho Financial Group is responsible for monitoring market risk, reporting and analyzing, making proposals, setting limits and guidelines, and formulating and implementing plans relating to market risk management.
The Risk Management Department submits reports regarding status of market risk to the President and Group CEO on a daily basis and to the Board of Directors on a regular basis. For the purpose of managing the market risk of our principal banking subsidiaries and other core group companies, the Department regularly receives reports from each of them to properly identify and manage their market risk. These subsidiaries and core group companies, which account for most of the Mizuho group’s exposure to market risk, establish their basic policies based on ours, and their Boards of Directors determine important matters relating to market risk management.
Market Risk Management Method
To manage market risk, we set limits that correspond to risk capital allocations according to the risk profile of each of our principal banking subsidiaries and other core group companies and thereby prevent the overall market risk we hold from exceeding our financial strength represented by capital, etc. The amount of risk capital allocated to market risk corresponds to
(the “VAR”) and additional costs that may arise in order to close relevant positions.
value-at-risk
Setting Limits
When the said limits are set, various factors are taken into account, including business strategies, historical limit usage ratios, risk-bearing capacity (profits, equity capital and risk management framework), profit targets and the market liquidity of the products involved. The limits are discussed and coordinated by the Risk Management Committee, discussed further by the Executive Management Committee and then determined by the President & Group CEO. For trading and banking activities, we set limits for VAR and for losses. For banking activities, we set position limits based on interest rate sensitivity (10 BPV) as needed. An excess over any of these limits is immediately reported and addressed according to a
pre-determined
procedure.
Monitoring
To provide a system of mutual checks and balances in market operations, we have established middle offices specializing in risk management that are independent of front offices which engage in market transactions
159
and of back offices which are responsible for book entries and settlements. When VAR is not adequate to control risk, the middle offices manage risk using additional risk indices, carry out stress testing and set stop loss limits as needed. We monitor market liquidity risk for individual financial products in the market while taking turnover and other factors into consideration.
Value-at-Risk
We use the VAR method, supplemented with stress testing, as our principal tool to measure market risk. The VAR method measures the maximum possible loss that could be incurred due to market movements within a certain time period (or holding period) and degree of probability (or confidence interval).
Trading Activities
VAR related to our trading activities is based on the following:
| • |
historical simulation method;
|
| • |
confidence interval:
one-tailed
99.0%;
|
| • |
holding period of one day; and
|
| • |
historical observation period of three years.
|
The following tables show the VAR related to our trading activities by risk category for the fiscal years ended March 31, 2019, 2020 and 2021 and as of March 31, 2019, 2020 and 2021:
|
Fiscal year ended March 31, 2019
|
As of
March 31, 2019
|
|||||||||||||||
|
Risk category
|
Daily average
|
Maximum
|
Minimum
|
|||||||||||||
|
(in billions of yen)
|
||||||||||||||||
|
Interest rate
|
¥ | 2.0 | ¥ | 2.9 | ¥ | 1.3 | ¥ | 2.0 | ||||||||
|
Foreign exchange
|
0.8 | 2.8 | 0.1 | 0.3 | ||||||||||||
|
Equities
|
0.6 | 7.7 | 0.2 | 0.5 | ||||||||||||
|
Commodities
|
0.0 | 0.0 | 0.0 | 0.0 | ||||||||||||
|
|
|
|
|
|
|
|
|
|||||||||
|
Total
|
¥ | 3.4 | ¥ | 9.2 | ¥ | 2.4 | ¥ | 2.6 | ||||||||
|
|
|
|
|
|
|
|
|
|||||||||
|
Fiscal year ended March 31, 2020
|
As of
March 31, 2020
|
|||||||||||||||
|
Risk category
|
Daily average
|
Maximum
|
Minimum
|
|||||||||||||
|
(in billions of yen)
|
||||||||||||||||
|
Interest rate
|
¥ | 2.7 | ¥ | 7.2 | ¥ | 1.3 | ¥ | 6.7 | ||||||||
|
Foreign exchange
|
0.4 | 1.1 | 0.1 | 0.8 | ||||||||||||
|
Equities
|
0.6 | 4.5 | 0.2 | 1.7 | ||||||||||||
|
Commodities
|
0.0 | 0.0 | 0.0 | 0.0 | ||||||||||||
|
|
|
|
|
|
|
|
|
|||||||||
|
Total
|
¥ | 3.8 | ¥ | 11.8 | ¥ | 2.3 | ¥ | 8.3 | ||||||||
|
|
|
|
|
|
|
|
|
|||||||||
|
Fiscal year ended March 31, 2021
|
As of
March 31, 2021
|
|||||||||||||||
|
Risk category
|
Daily average
|
Maximum
|
Minimum
|
|||||||||||||
|
(in billions of yen)
|
||||||||||||||||
|
Interest rate
|
¥ | 4.3 | ¥ | 8.6 | ¥ | 1.7 | ¥ | 2.6 | ||||||||
|
Foreign exchange
|
0.7 | 1.3 | 0.3 | 0.4 | ||||||||||||
|
Equities
|
1.1 | 6.6 | 0.1 | 0.7 | ||||||||||||
|
Commodities
|
0.0 | 0.0 | 0.0 | 0.0 | ||||||||||||
|
|
|
|
|
|
|
|
|
|||||||||
|
Total
|
¥ | 5.4 | ¥ | 9.1 | ¥ | 2.4 | ¥ | 2.7 | ||||||||
|
|
|
|
|
|
|
|
|
|||||||||
160
The following graph shows VAR figures of our trading activities for the fiscal year ended March 31, 2021:
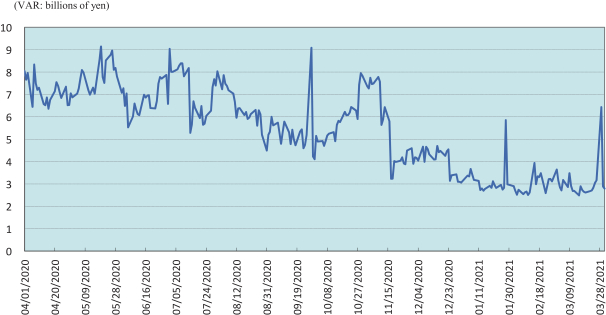
The following table shows VAR figures of our trading activities for the fiscal years indicated:
|
Fiscal years ended March 31,
|
||||||||||||||||
|
2019
|
2020
|
2021
|
Change
|
|||||||||||||
|
(in billions of yen)
|
||||||||||||||||
|
As of fiscal year end
|
¥ | 2.6 | ¥ | 8.3 | ¥ | 2.7 | ¥ | (5.5 | ) | |||||||
|
Maximum
|
9.2 | 11.8 | 9.1 | (2.7 | ) | |||||||||||
|
Minimum
|
2.4 | 2.3 | 2.4 | 0.1 | ||||||||||||
|
Average
|
3.4 | 3.8 | 5.4 | 1.6 | ||||||||||||
Non-trading
Activities
The VAR related to our banking activities is based on the same conditions as those of trading activities, but the holding period is one month. In addition, as for risk management of banking activities, it is important to properly measure interest rate risk so that we calculate interest risk using appropriate methods such as recognizing demand deposits as “core deposits.”
161
The following graph shows the VAR related to our banking activities excluding our cross-shareholdings portfolio for the year ended March 31, 2021:
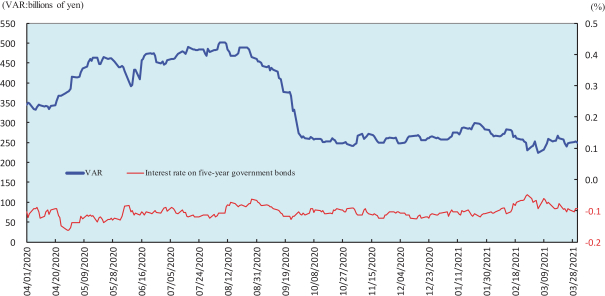
The following table shows the VAR figures relating to our banking activities for the fiscal years indicated:
|
Fiscal years ended March 31,
|
||||||||||||||||
|
2019
|
2020
|
2021
|
Change
|
|||||||||||||
|
(in billions of yen)
|
||||||||||||||||
|
As of fiscal year end
|
¥ | 194.4 | ¥ | 361.4 | ¥ | 249.4 | ¥ | (111.9 | ) | |||||||
|
Maximum
|
298.5 | 361.4 | 501.7 | 140.3 | ||||||||||||
|
Minimum
|
194.4 | 167.9 | 224.0 | 56.0 | ||||||||||||
|
Average
|
255.5 | 215.7 | 346.5 | 130.7 | ||||||||||||
VAR is a commonly used market risk management technique. However, VAR models have the following shortcomings:
| • |
By its nature as a statistical approach, VAR estimates possible losses over a certain period at a particular confidence level using past market movement data. Past market movement, however, is not necessarily a good indicator of future events, particularly potential future events that are extreme in nature.
|
| • |
VAR may underestimate the probability of extreme market movements.
|
| • |
The use of a 99.0% confidence level does not take account of, nor makes any statement about, any losses that might occur beyond this confidence level.
|
| • |
VAR does not capture all complex effects of various risk factors on the value of positions and portfolios and could underestimate potential losses.
|
Cross-shareholdings Portfolio Management Activities
We take the market risk management approach with use of VAR and risk indices for cross-shareholdings portfolio management activities to properly manage stock price risk. Specifically, we monitor VAR measurements and the state of risk capital on a daily basis. Moreover, in order to control stock price risk, we are working on the reduction in cross-shareholdings through careful negotiations with counterparties.
162
Back Testing
In order to evaluate the effectiveness of market risk measurements calculated using the VAR method, we carry out regular back tests to compare VAR with assumptive profits and losses. Assumptive profits and losses accounts for general market risk. The graph below shows daily VAR of trading activities for the fiscal year ended March 31, 2021 and the corresponding paired distribution of profits and losses. We had one case where losses exceeded VAR during the period. In addition, we conduct evaluations of the assumptions related to the VAR models. Based on the number of times losses exceeded VAR through back testing and the results of the evaluation of the model assumptions, we will make adjustments to the models as appropriate. Changes to fundamental portions of the VAR models are subject to the approval of our Group Chief Risk Officer.
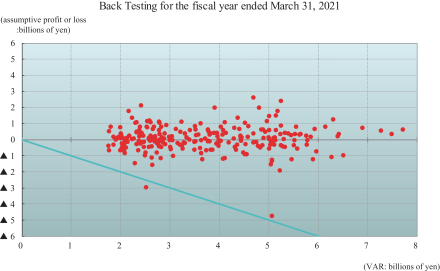
| Note: |
We conduct our back testing and assess the number of cases where losses exceed VAR based on a 250 business day year. The expected average number of instances where
one-day
trading losses exceeded VAR at the 99% confidence level is 2.5.
|
Stress Testing
Because the VAR method is based on statistical assumptions, we conduct stress testing to simulate the levels of losses that could be incurred in cases where the market moves suddenly to levels that exceed these assumptions. The stress testing methods we use include the calculation of losses under scenarios in which stresses are applied to interest rate risk and stock price risk based on current and projected economic conditions, historical market events, etc.
Liquidity Risk Management
Basic Approach
We define liquidity risk as the risk of losses arising from funding difficulties due to a deterioration in our financial position that makes it difficult for us to raise necessary funds or that forces us to raise funds at significantly higher interest rates than usual. Mizuho Financial Group manages liquidity risk for the Mizuho group as a whole. Specifically, Mizuho Financial Group establishes the fundamental liquidity risk management policy for the entire group, manages the liquidity risk of our principal banking subsidiaries and other core group companies and monitors how the group’s liquidity risk is being managed as a whole.
163
Liquidity Risk Management Structure
Our Board of Directors determines basic matters pertaining to liquidity risk management policies. The Risk Management Committee of Mizuho Financial Group broadly discusses and coordinates matters relating to basic policies in connection with liquidity risk management, operations, monitoring and proposes responses to emergencies such as sudden market changes. The Group Chief Risk Officer of Mizuho Financial Group is responsible for matters relating to liquidity risk management planning and operations. The Risk Management Department of Mizuho Financial Group is responsible for monitoring liquidity risk, reporting and analyzing making proposals, and formulating and implementing plans relating to liquidity risk management. In addition, the Group Chief Financial Officer of Mizuho Financial Group is additionally responsible for matters relating to planning and running cash flow management operations, and the Financial Planning Department is responsible for monitoring and adjusting cash flow management situation and for planning and implementing cash flow management to maintain appropriate funding liquidity. Reports on the liquidity risk management are submitted to the Risk Management Committee and the Balance Sheet Management Committee (each of which is a Business Policy Committee), the Executive Management Committee and the President & Group CEO on a regular basis.
Our principal banking subsidiaries and other core group companies also establish their basic policies on liquidity risk management to properly identify and manage liquidity risk.
Liquidity Risk Management Method
We manage liquidity risk with the use of “Liquidity Risk Management Indicators” and “Liquidity Categorization.” The former is determined for the purpose of managing limits on funds raised in the market considering our fund raising capabilities, and the latter is determined based on our funding conditions. We also carry out liquidity stress testing to verify the sufficiency of liquidity reserve assets and the effectiveness of countermeasures against a possible outflow of funds during a stress event. The results of stress testing are used for cash flow management operations.
Liquidity Risk Management Indicators
Limits on funds raised in the market are set based on a number of time horizons taking into account characteristics and strategies of each of our principal banking subsidiaries and other core group companies. Such limits are discussed and coordinated by the Risk Management Committee, discussed further by the Executive Management Committee and determined by the President & Group CEO. An excess over any of these limits is immediately reported and addressed according to a
pre-determined
procedure.
Liquidity Categorization
We have established a group-wide framework of liquidity risk stages such as “Normal,” “Anxious” and “Crisis,” which reflects funding conditions. In addition, we set Early Warning Indicators (“EWIs”) and monitor on a daily basis to manage funding conditions. As EWIs, we select stock prices, credit ratings, amount of liquidity reserve assets such as Japanese government bonds, our funding situations and others.
Liquidity Stress Testing
We carry out stress testing regularly based on market-wide factors, idiosyncratic factors of the group and a combination of both types of factors to verify the sufficiency of liquidity reserve assets and the effectiveness of our liquidity contingency funding plans. Furthermore, we utilize stress testing for evaluating the appropriateness of our annual funding plan.
164
Operational Risk Management
Basic Approach
We define operational risk as the risk of loss that we may incur resulting from inadequate or failed internal processes, people and systems or from external events. We control operational risk management for the Mizuho group as a whole. Considering that operational risk includes information technology risk, operations risk, legal risk, human resources risk, tangible asset risk, regulatory change risk and reputational risk, we have separately determined the fundamental risk management policies for these different types of risk. We manage the operational risk associated with our principal banking subsidiaries and other core group companies while monitoring the state of group-wide operational risk.
Operational Risk Management Structure
Our Board of Directors determines basic matters pertaining to operational risk management policies. The Risk Management Committee of Mizuho Financial Group broadly discusses and coordinates matters relating to basic policies in connection with operational risk management, operational risk operations and operational risk monitoring. The Group Chief Risk Officer of Mizuho Financial Group is responsible for matters relating to operational risk management planning and operations. The Risk Management Department of Mizuho Financial Group is responsible for monitoring market risk, reporting and analyzing making proposals, setting limits and guidelines, and formulating and implementing plans relating to operational risk management.
Our principal banking subsidiaries and core group companies establish their basic policies on operational risk management, and their Boards of Directors determine important matters relating to operational risk management.
Operational Risk Management Method
To manage operational risk, we set common rules for data gathering to develop various databases shared by the group and measure operational risk as operational VAR on a regular basis, taking into account possible future loss events and changes in the business environment and internal management.
We have established and are strengthening management methods and systems to appropriately identify, assess, measure, monitor and control the operational risks that arise from the growing sophistication and diversification of financial operations and developments relating to information technology by utilizing control self-assessments and improving measurement methods.
Definition of Risks and Risk Management Methods
As shown in the table below, we have defined each component of operational risk, and we apply appropriate risk management methods in accordance with the scale and nature of each risk.
|
Definition
|
Principal Risk Management Methods
|
|||
| Information Technology Risk | Information technology risk (“IT risk”) refers to the risk that problems (e.g. malfunctions, disruptions, etc.) with the computer systems or improper use of the computers in these systems, which cause disruptions of the services provided to customers, or have significant impact on settlement systems, etc., will result in losses for customers, and the incurrence of losses (tangible or intangible) by our group companies. |
• Identify and evaluate the risk by setting specific standards that need to be complied with and implementing measures tailored based on evaluation results to reduce the risk.
• Ensure ongoing project management in systems development and quality control.
• Strengthen security to prevent information leaks.
|
165
|
Definition
|
Principal Risk Management Methods
|
|||
|
• Strengthen capabilities for rapidly and effectively dealing with cyberattacks.
• Improve effectiveness of emergency responses by improving backup systems and holding drills.
|
||||
| Operations Risk | The risk of customers incurring a loss or the risk of the Company Group incurring tangible and/or intangible losses due to the disruption of services to customers or major incidents affecting settlement systems, etc., as a result of inadequate operations caused by fraudulent acts, errors or negligence, etc., of senior executives or employees, or inadequacies in the operational structure itself. |
• Establish clearly defined procedures for handling operations.
• Periodically check the status of operational processes.
• Conduct training and development programs by headquarters.
• Introduce information technology, office automation and centralization for operations.
• Improve the effectiveness of emergency responses by holding drills.
|
||
| Legal Risk |
Risk that the group may incur losses due to violation of laws and regulations, breach of contract, entering into improper contracts or
other legal factors.
|
• Review and confirm legal issues, including the legality of material decisions, agreements and external documents, etc.
• Collect and distribute legal information and conduct internal training programs.
• Analyze and manage issues related to lawsuits.
|
||
| Human Resources Risk | Risk that the group may incur losses due to drain or loss of personnel, deterioration of morale, inadequate development of human resources, inappropriate working schedule, inappropriate working and safety environment, inequality or inequity in human resource management or discriminatory conduct. |
• Conduct employee satisfaction surveys.
• Understand the status of working hours.
• Understand the status of vacation days taken by personnel.
• Understand the status of voluntary resignations.
• Understand the status of the stress check system.
|
||
| Tangible Asset Risk | Risk that the group may incur losses from damage to tangible assets or a decline in the quality of working environment as a result of disasters, criminal actions or defects in asset maintenance. |
• Manage the planning and implementation of construction projects related to the repair and replacement of facilities.
• Identify and evaluate the status of damage to tangible assets caused by natural disasters, etc., and respond appropriately to such damage.
|
||
| Regulatory Change Risk | Risk that the group may incur losses due to changes in various regulations or systems, such as those related to law, taxation and accounting. |
• Understand important changes in regulations or systems that have significant influence on our business operations or financial condition in a timely and accurate manner.
• Analyze degree of influence of regulatory changes and establish countermeasures.
|
||
166
|
Definition
|
Principal Risk Management Methods
|
|||
|
• Continuously monitor our regulatory change risk management mentioned above.
|
||||
|
Reputational
Risk
|
Risk that the group may incur losses due to damage to our credibility or the value of the “Mizuho” brand when market participants or others learn about, or the media reports on, various adverse events, including actual materialization of risks or false rumors. |
• Establish framework to identify and manage, on an integrated basis, information that may have a serious impact on group management and respond to such risk in a manner appropriate to its scale and nature.
• Swiftly identify rumors and devise appropriate responses depending on the urgency and possible impact of the situation to minimize possible losses.
|
||
We also recognize and manage “Information Security Risk” and “Compliance Risk,” which constitute a combination of more than one of the above components of operational risk, as operational risk.
Measurement of operational risk equivalent
Implementation of the AMA/Advanced Measurement Approach (“AMA”)
We have adopted the AMA for the calculation of operational risk equivalent in association with capital adequacy ratios based on Basel Regulation. However, we use the Basic Indicator Approach for entities that are deemed to be less important in the measurement of operational risk equivalent.
The measurement results under the AMA are used not only as the operational risk equivalent in the calculation of capital adequacy ratios based on Basel Regulation, but also as operational VAR for internal risk management purposes for implementing action plans to reduce operational risk, etc.
Outline of the AMA
| • |
Outline of measurement system
|
We have established the model by taking account of four elements: internal loss data; external loss data; scenario analysis; business environment and internal control factors (BEICFs). We calculate the operational risk amount by estimating the maximum loss, using a 99.9th percentile
one-tailed
confidence interval and a
one-year
holding period, etc., as operational risk equivalent, employing both internal loss data (i.e., actually experienced operational loss events) and scenario data to reflect unexperienced potential future loss events in the measurement.
In the measurement of operational risk equivalent as of March 31, 2021, we did not exclude expected losses and also did not recognize the risk mitigating impact of insurance. In addition, we did not take into account the events related to credit risk in measuring operational risk equivalent.
| • |
Outline of measurement model
|
Operational risk equivalent is calculated as a simple sum of those risk amounts related to the seven loss event types defined in the FSA’s Capital Adequacy Notice, large-scale natural disasters and litigation. In the measurement of operational risk equivalent as of March 31, 2021, we did not reflect the correlation effects among operational risk related to each of the seven loss event types.
167
| • |
Operational risk by loss event type
|
Loss Distribution (Compound Poisson Distribution) Approach (LDA) is adopted for the calculation of operational risk. LDA is based on the assumption that Poisson Distribution applies to the occurrence frequency of operational risk events, and loss severity is expressed through a separate distribution. Operational risk is calculated for each of the seven loss event types employing both internal loss data, based on our actual experience as operational loss events and scenario data. Scenario data, expressed as numerical values of occurrence frequency and loss severity, reflects external loss data and BEICFs, in order to estimate unexperienced potential future loss events (of low frequency and high severity).
“Frequency Distribution” and “Severity Distribution” are estimated employing the above mentioned internal loss data and scenario data, and Monte-Carlo simulations are then applied to these distributions to measure operational risk. The detailed steps of creation of scenario data are explained later in “Scenario Analysis.”
| • |
Estimation of “Frequency Distribution” and “Loss Severity Distribution”
|
“Frequency Distribution” is estimated by applying information on occurrence frequency of both internal loss data and scenario data to Poisson Distribution. “Loss Severity Distribution” is generated as the result of combining, through a statistical approach (Extreme Value Theory), of the actual distribution for the low severity distribution portion created by internal loss data and another loss distribution
(Log-normal
Distribution or Generalized Pareto Distribution) for the high severity distribution portion created by scenario data.
| • |
Operational risk of large-scale natural disasters
|
Monte-Carlo simulation is applied to the datasets expressed as a combination of the probability of occurrence of large-scale natural disasters and the probable loss amount in case of such occurrence, as opposed to estimating “Frequency Distribution” and “Loss Severity Distribution.”
| • |
Operational risk of litigation
|
Each litigation is converted into data according to the profile of the individual litigation to which Monte-Carlo simulation is applied, as opposed to estimating “Frequency Distribution” and “Loss Severity Distribution.”
| • |
Verification
|
We confirm the appropriateness of the measurement model by verifying it, in principle, semi-annually.
Scenario Analysis
| • |
Outline of scenario analysis
|
In the process of scenario analysis, scenario data is created as numerical values of occurrence frequency and loss severity reflecting external loss data and BEICFs, in order to estimate unexperienced potential future operational risk events (of low frequency and high severity).
As for external loss data, we refer to data publicly reported by domestic and overseas media, and such data are reflected in the estimation of occurrence frequency and loss severity distribution in the process of scenario analysis. In addition, BEICFs are utilized as indices to adjust occurrence frequency and loss severity distribution in the process of scenario analysis.
168
We categorize scenario analysis into four approaches in accordance with the characteristics of each loss event type and risk management structures.
|
Approach
|
Loss event type(s) to be applied
|
|
| A | Internal fraud / External fraud / Clients, products and business practices / Execution, delivery and process management | |
| B | Employment practices and workplace safety | |
| C | Damage to physical assets | |
| D | Business disruption and system failure |
At Mizuho Financial Group, loss event types to which Approach A is applied account for a considerable amount of operational risk. The detailed process of Approach A is explained below as a typical example of scenario analysis.
| • |
Setting units for scenario analysis
|
In order to ensure completeness and sufficiency, we set units that are commonly applied across group entities that adopt AMA (the “Group Entities”) by referencing and categorizing risk scenarios recognized through control self-assessment, internal loss data of the Group Entities and external loss data, etc. Then each of the Group Entities selects the unit on which scenario analysis is conducted from the units established on a group-wide basis in accordance with its business activities and operational risk profile.
| • |
Estimation of occurrence frequency
|
Basic occurrence frequency (once a year) is calculated for each scenario analysis unit. If a certain scenario analysis unit has relevant internal loss data of a
pre-determined
threshold amount or above, its basic occurrence frequency is calculated based on such data, and if not, the basic occurrence frequency (the occurrence frequency per year of losses at or above a
pre-determined
threshold) is calculated with reference to the situation of occurrence of internal loss data of less than the threshold amount and/or external loss data. The basic occurrence frequency is then adjusted within a
pre-determined
range for the purpose of reflecting the most recent BEICFs to determine the final occurrence frequency.
| • |
Estimation of loss severity distribution
|
In order to estimate loss severity distribution, we use a
pre-determined
series of severity ranges. Basic loss severity distribution is calculated for each scenario analysis unit as an occurrence ratio (in percentile figures) of loss at each severity range when losses at or above a
pre-determined
threshold occurred, with reference to transaction amount data, external loss data, etc. Then the basic severity distribution is adjusted, if necessary, from the viewpoint of statistical data processing to determine the final loss severity distribution.
| • |
Creation of scenario data
|
For each scenario analysis unit, scenario data is generated as a series of combinations of occurrence frequency per year at each severity range, based on the final occurrence frequency and the final loss severity distribution.
Compliance
As a leading Japanese financial services group with a global presence and a broad customer base, we remain conscious of the importance of our social responsibilities and public mission at all times. We define compliance as “the strict observance of all laws and regulations and the pursuit of fair and honest corporate activities that conform to the norms accepted by society” and view ongoing compliance as one of the basic principles of sound business management. Each of our group companies maintains its own compliance structure in line with the basic policies established by Mizuho Financial Group.
169
Compliance Structure
The chief executive officers of Mizuho Financial Group, Mizuho Bank, Mizuho Trust & Banking and Mizuho Securities generally oversee compliance matters of their respective companies, and the chief executive officer, etc., also head their respective compliance committees at which important matters concerning compliance are discussed. The four companies also have compliance divisions under their respective chief compliance officers. These divisions are responsible for compliance planning and implementation and control overall compliance management at their respective companies. At the organizational unit level (such as branches and divisions) at each of the four companies, the head of the unit is responsible for guidance and implementation related to compliance matters within such unit, and the compliance officer or the compliance administrator at each unit reviews the status of compliance within such unit.
Other core group companies have also established compliance structures adapted to the characteristics of their respective businesses.
Mizuho Financial Group monitors the status of compliance of the Mizuho group through reports submitted by our principal banking subsidiaries and other core group companies and adopts appropriate responses when necessary.
Compliance at subsidiaries of our principal banking subsidiaries and other core group companies is monitored and managed by their respective parents.
Compliance Activities
We have established the “Mizuho Code of Conduct,” which sets forth clear and concrete standards of ethical behavior, and have distributed it to all directors, senior management and employees of the Mizuho group so that they are well aware of its content and act accordingly.
Each of our group companies has also prepared a compliance manual, which serves as a practical guidebook for rigorous compliance enforcement and clarifies the laws and regulations that the group companies must observe in pursuing their business activities and the compliance activities they are required to follow.
We conduct compliance training for directors, senior management and employees so that they are fully acquainted with the contents of the compliance manual.
We monitor the status of compliance levels through self-assessments conducted by individual organizational units and through monitoring conducted by the compliance division of each group company.
Every fiscal year, each of our group companies establishes a compliance program, which contains concrete measures for compliance enforcement such as measures related to the management of the compliance framework, training and assessments. Progress regarding the implementation of the compliance program is monitored every six months.
Internal Audit
Internal audit refers to the series of activities, ranging from the objective and comprehensive evaluation of the effectiveness and appropriateness of each process relating to governance, risk management and control, to providing recommendations and corrective guidance, etc., toward the resolution of problems from an independent standpoint of the departments and business processes that are subject to the audit, based on a plan approved by the board of directors of each of our group companies. Through these series of activities, internal audits assist the board of directors of each of our group companies to fulfill their managerial duties efficiently and effectively.
In line with the Basic Policy for Internal Audit established by Mizuho Financial Group, our principal banking subsidiaries and other core group companies conduct internal audits, which include the internal auditing
170
of their respective subsidiaries. In addition, with respect to the management of risks applicable across the Mizuho group, we coordinate internal audits throughout the group to assess the risk management status of the group as a whole.
Internal Audit Management Structure
Mizuho Financial Group
Our Internal Audit Committee determines all important matters concerning internal audits at Mizuho Financial Group. The committee is chaired by our President & Group CEO and is independent of our other business operations. The Head of the Internal Audit Group, a group established under our Internal Audit Committee, reports the progress of individual audits and plans to the Audit Committee, responds to requests for inspections, and receives specific instructions from the committee. In addition, our Internal Audit Committee monitors and manages internal audits at our principal banking subsidiaries and other core group companies through internal audit reports submitted by such subsidiaries. Our Internal Audit Committee discusses and makes decisions regarding internal audits at our principal banking subsidiaries and other core group companies and submits the results, together with the results of their examination of the internal audit reports, to the Audit Committee and our Board of Directors.
Mizuho Bank and Mizuho Trust & Banking
Each of Mizuho Bank and Mizuho Trust & Banking has also established an internal audit committee that is independent of their other business operations. In both banks, the Head of the Internal Audit Group reports the progress of individual audits and plans to the audit & supervisory committee, responds to requests for inspections, and receives specific instructions from the committee.
Both banks have established internal audit departments to conduct internal audits at their respective domestic and overseas business offices, head office departments and group companies. Specifically, the internal audit departments assess the suitability and effectiveness of business activities associated with compliance and risk management.
Other Core Group Companies
Other core group companies have also established effective and efficient internal audit structures adapted to the characteristics of their respective businesses.
|
ITEM 12.
|
DESCRIPTION OF SECURITIES OTHER THAN EQUITY SECURITIES
|
12.A. Debt Securities
Not applicable.
12.B. Warrants and Rights
Not applicable.
12.C. Other Securities
Not applicable.
171
12.D. American Depositary Shares
The depositary collects its fees for delivery and surrender of ADSs directly from investors depositing shares or surrendering ADSs for the purpose of withdrawal or from intermediaries acting for them. The table below sets out such fees payable to the depositary:
|
Persons depositing or withdrawing shares must pay:
|
For:
|
|
|
$5.00 (or less) per 100 ADSs (or portion of 100 ADSs)
|
– Delivery of ADRs and the surrender of ADRs | |
|
$.05 (or less) per ADS
|
– Any cash distribution to ADS registered holders | |
|
A fee equivalent to the fee that would be payable if securities distributed to you had been shares and the shares had been deposited for issuance of ADSs
|
– Distribution of securities distributed to holders of deposited securities that are distributed by the depositary to ADS registered holders | |
|
$.05 (or less) per ADS
|
– General depositary services | |
|
Registration or transfer fees
|
– Transfer and registration of shares on our share register to or from the name of the depositary or its agent when you deposit or withdraw shares | |
|
Expenses of the depositary
|
– Cable, telex and facsimile transmissions expenses (as are expressly provided in the deposit agreement)
– Converting foreign currency to U.S. dollars
|
|
|
Taxes and other governmental charges
|
– As necessary | |
|
Any other charge incurred by the depositary or its agents in connection with the servicing of the deposited securities
|
– As necessary | |
The Bank of New York Mellon (“BNYM”), as depositary, has agreed to reimburse us annually for expenses related to the administration and maintenance of the depositary receipt facility including, but not limited to, investor relations expenses, legal fees, New York Stock Exchange continued listing fees or any other direct or non-direct depositary receipt program related expenses. There are limits on the amount of expenses for which the depositary will reimburse us. In the fiscal year ended March 31, 2021, the depositary reimbursed us $500,000 for such expenses.
172
PART II
|
ITEM 13.
|
DEFAULTS, DIVIDEND ARREARAGES AND DELINQUENCIES
|
None.
|
ITEM 14.
|
MATERIAL MODIFICATIONS TO THE RIGHTS OF SECURITY HOLDERS AND USE OF PROCEEDS
|
None.
|
ITEM 15.
|
CONTROLS AND PROCEDURES
|
Disclosure Controls and Procedures
We carried out an evaluation under the supervision and with the participation of our management, including our Chief Executive Officer and Chief Financial Officer, of the effectiveness of the design and operation of our disclosure controls and procedures (as defined in Rule
13a-15(e)
under the Securities Exchange Act of 1934) as of March 31, 2021. There are inherent limitations to the effectiveness of any system of disclosure controls and procedures, including the possibility of human error and the circumvention or overriding of the controls and procedures. Accordingly, even effective disclosure controls and procedures can only provide reasonable, not absolute, assurance of achieving their control objectives. Also, projections of any evaluation of effectiveness to future periods are subject to the risk that controls may become inadequate because of changes in conditions, or that the degree of compliance with the policies or procedures may deteriorate. Based upon the evaluation referred to above, our Chief Executive Officer and Chief Financial Officer concluded that the design and operation of our disclosure controls and procedures as of March 31, 2021 were effective to provide reasonable assurance that information required to be disclosed in the reports that we file or submit under the Exchange Act is recorded, processed, summarized and reported within the time periods specified in the SEC’s rules and forms.
Management’s Annual Report on Internal Control over Financial Reporting
Our management is responsible for establishing and maintaining adequate internal control over financial reporting, as defined in Rule
13a-15(f)
under the Securities Exchange Act of 1934. Our internal control over financial reporting is designed to provide reasonable assurance regarding the reliability of financial reporting and the preparation of financial statements for external purposes in accordance with applicable generally accepted accounting principles. Our internal control over financial reporting includes those policies and procedures that:
| (i) |
pertain to the maintenance of records that, in reasonable detail, accurately and fairly reflect the transactions and dispositions of our assets;
|
| (ii) |
provide reasonable assurance that transactions are recorded as necessary to permit preparation of financial statements in accordance with generally accepted accounting principles, and that our receipts and expenditures are being made only in accordance with authorizations of management and directors; and
|
| (iii) |
provide reasonable assurance regarding prevention or timely detection of unauthorized acquisition, use or disposition of our assets that could have a material effect on the financial statements.
|
Because of its inherent limitations, internal control over financial reporting may not prevent or detect misstatements. Also, projections of any evaluation of effectiveness to future periods are subject to the risk that controls may become inadequate because of changes in conditions, or that the degree of compliance with the policies or procedures may deteriorate.
173
Our management evaluated the effectiveness of our internal control over financial reporting as of March 31, 2021 based on the criteria established in “Internal Control—Integrated Framework” issued by the Committee of Sponsoring Organizations of the Treadway Commission (2013 framework) (COSO). Based on the evaluation, management has concluded that we maintained effective internal control over financial reporting as of March 31, 2021.
Our independent registered public accounting firm, Ernst & Young ShinNihon LLC has issued an attestation report on our internal control over financial reporting as of March 31, 2021, which appears on page
F-6.
Attestation Report of the Registered Public Accounting Firm
See the attestation report of our independent registered public accounting firm, Ernst & Young ShinNihon LLC, which appears on page F-6.
Changes in Internal Control over Financial Reporting
During the period covered by this annual report, there were no changes in our internal control over financial reporting that have materially affected, or that are reasonably likely to materially affect, our internal control over financial reporting.
|
ITEM 16A.
|
AUDIT COMMITTEE FINANCIAL EXPERT
|
Our board of directors has determined that Messrs. Ryoji Sato and Hisaaki Hirama each qualifies as an “audit committee financial expert” as defined in Item 16A of Form
20-F
under the Securities Exchange Act of 1934, as amended. In addition, Mr. Ryoji Sato is determined to be “independent” as defined under the New York Stock Exchange (“NYSE”) Corporate Governance Standards.
|
ITEM 16B.
|
CODE OF ETHICS
|
Mizuho Financial Group has adopted a code of ethics, titled “Code of Ethics for Financial Professionals,” which is applicable to all directors and executive officers, as well as all specialist officers and other employees of Mizuho Financial Group who engage in financial reporting, accounting or disclosure. The code of ethics of Mizuho Financial Group is included in this annual report as Exhibit 11.
|
ITEM 16C.
|
PRINCIPAL ACCOUNTANT FEES AND SERVICES
|
Fees for Services provided by Ernst & Young ShinNihon LLC
The aggregate fees billed by Ernst & Young ShinNihon LLC, our independent registered public accounting firm, and its affiliates, for the fiscal years ended March 31, 2020 and 2021 are presented in the following table:
|
Fiscal years ended March 31,
|
||||||||
|
2020
|
2021
|
|||||||
|
(in millions of yen)
|
||||||||
|
Audit fees
(1)
|
¥ | 4,962 | ¥ | 4,924 | ||||
|
Audit-related fees
(2)
|
248 | 277 | ||||||
|
Tax fees
(3)
|
80 | 93 | ||||||
|
All other fees
(4)
|
3 | 6 | ||||||
|
|
|
|
|
|||||
|
Total
|
¥ | 5,293 | ¥ | 5,300 | ||||
|
|
|
|
|
|||||
Notes:
| (1) |
Audit fees primarily include fees related to the audit of U.S. GAAP financial statements as well as Japanese GAAP financial statements used for home-country reporting purposes.
|
| (2) |
Audit-related fees primarily include fees for services relating to agreed-upon procedures on internal controls and advisory services relating to regulatory filings.
|
| (3) |
Tax fees primarily include fees for services relating to the preparation of tax returns and tax advice.
|
174
| (4) |
All other fees primarily include fees for services relating to education to improve the financial business knowledge of our employees.
|
Pre-Approval Policies and Procedures
We established the pre-approval policies and procedures required by the Sarbanes-Oxley Act on April 1, 2006. Under the procedures, Mizuho Financial Group and its subsidiaries must apply to our audit committee for pre-approval before entering into an agreement regarding audit and permitted non-audit services with Ernst & Young ShinNihon LLC.
We follow two types of pre-approval policies and procedures:
| General pre-approval | General pre-approval is required for services which are expected to be performed during a given fiscal year. Our audit committee reviews the specific maximum fee amount for new services and the maximum amount of increase/decrease from previous fee amounts for the same type of services as those performed in the past and authorizes pre-approval at the beginning of each fiscal year. | |
| Specific pre-approval | For those services which have not been approved pursuant to the general pre-approval procedure, specific pre-approval by our audit committee is required prior to each engagement. With respect to such services, full-time audit committee member(s) must provide pre-approval and report such pre-approval at the monthly meeting of the audit committee. | |
|
ITEM 16D.
|
EXEMPTIONS FROM THE LISTING STANDARDS FOR AUDIT COMMITTEES
|
Not applicable.
|
ITEM 16E.
|
PURCHASE OF EQUITY SECURITIES BY THE ISSUER AND AFFILIATED PURCHASERS
|
The following table sets forth purchases of our common stock by us and our affiliated purchasers during the fiscal year ended March 31, 2021:
|
Total number of
shares purchased
(2)
|
Average price
paid per share
(2)
|
Total number of
shares purchased
as part of publicly
announced plans
or programs
|
Maximum
number of shares
that may yet be
purchased under
the plans
or programs
|
|||||||||||||
|
April 1 to April 30, 2020
|
150 | 1,221.3 | — | — | ||||||||||||
|
May 1 to May 31, 2020
|
182 | 1,226.5 | — | — | ||||||||||||
|
June 1 to June 30, 2020
|
154 | 1,354.0 | — | — | ||||||||||||
|
July 1 to July 31, 2020
|
690 | 1,354.7 | — | — | ||||||||||||
|
August 1 to August 31, 2020
|
563 | 1,388.0 | — | — | ||||||||||||
|
September 1 to September 30, 2020
|
489 | 1,421.5 | — | — | ||||||||||||
|
October 1 to October 31, 2020
|
53,224 | 1,307.9 | — | — | ||||||||||||
|
November 1 to November 30, 2020
|
43,137 | 1,395.1 | — | — | ||||||||||||
|
December 1 to December 31, 2020
|
25,474 | 1,349.9 | — | — | ||||||||||||
|
January 1 to January 31, 2021
|
26,850 | 1,409.5 | — | — | ||||||||||||
|
February 1 to February 28, 2021
|
36,826 | 1,503.2 | — | — | ||||||||||||
|
March 1 to March 31, 2021
|
54,389 | 1,619.6 | — | — | ||||||||||||
|
|
|
|
|
|
|
|
|
|||||||||
|
Total
(1)
|
242,128 | 1,439.3 | — | — | ||||||||||||
|
|
|
|
|
|
|
|
|
|||||||||
Note:
| (1) |
A total of 242,128 shares were purchased other than through publicly announced plans or programs during the fiscal year ended March 31, 2021, due to (i) our purchase of shares constituting less than one (1) unit
|
175
|
|
from registered holders of such shares at the current market price of those shares and (ii) our purchase of all fractions of shares less than one shares resulting from the share consolidation effective as of October 1, 2020. For more information on the share consolidation, see “Item 10.B. Memorandum and Articles of Association—Common Stock—Share Consolidation.”
|
| (2) |
Mizuho Financial Group adopted the share consolidation of the shares of common stock on the basis of one post-consolidation share per ten pre-consolidation shares effective as of October 1, 2020. For purposes of the total number of shares purchased and the average price paid per share, we have assumed the effective date of the share consolidation to be April 1, 2020. For more information on the share consolidation, see “Item 10.B. Memorandum and Articles of Association—Common Stock—Share Consolidation.”
|
|
ITEM 16F.
|
CHANGE IN REGISTRANT’S CERTIFYING ACCOUNTANT
|
None.
|
ITEM 16G.
|
CORPORATE GOVERNANCE
|
Mizuho Financial Group’s corporate governance practices are governed by applicable Japanese laws, specifically the Companies Act and Financial Instruments and Exchange Act of Japan, and its articles of incorporation and corporate governance guidelines. The company transformed itself from a Company with Audit & Supervisory Board to a Company with Three Committees as of June 24, 2014.
Because Mizuho Financial Group’s shares are registered with the U.S. Securities and Exchange Commission and are listed on the New York Stock Exchange (“NYSE”), the company is also subject to corporate governance requirements applicable to NYSE-listed foreign private issuers. NYSE-listed companies that are foreign private issuers meeting certain criteria are permitted to follow home country practices in lieu of certain provisions of Section 303A, and Mizuho Financial Group is relying on this exemption.
A NYSE-listed foreign private issuer is required to provide to its U.S. investors a brief, general summary of the significant differences of corporate governance practices that differ from those followed by NYSE-listed U.S. companies. The following is a summary of the significant ways in which Mizuho Financial Group’s corporate governance practices differ from NYSE listing standards followed by U.S. companies:
| • |
A NYSE-listed U.S. company is required to have a majority of directors that meet the independence requirements under Section 303A of the NYSE’s Listed Company Manual. The Companies Act does not require Mizuho Financial Group to have a majority of “independent” directors on the board; rather, it requires the company to have a majority of “outside” directors on each of the Nominating Committee, the Compensation Committee and the Audit Committee, each established as a committee, pursuant to the requirements that apply to a Company with Three Committees. An outside director is defined under the Companies Act as a director who meets all of the following requirements: (a) a person who is not currently, and has not been in the ten years prior to his or her assumption of office as outside director, an executive director, an executive officer, a manager, or any other type of employee (“Executive Director, etc.”) of the company or its subsidiaries; (b) if a person has been a non-executive director, an audit & supervisory board member, or an accounting adviser of the company or its subsidiaries within the ten years prior to his or her assumption of office as outside director, a person who was not an Executive Director, etc., of the company or its subsidiaries in the ten years prior to his or her assumption of office as such; (c) a person who is not (i) a person who controls the company (including the company’s parent company) (“Parent Company, etc.”) and who is a natural person or (ii) a director, an executive officer, a manager or any other type of employee of a Parent Company, etc.; (d) a person who is not an Executive Director, etc., of another subsidiary of a Parent Company, etc.; and (e) a person who is not a spouse or a family member within the second degree of kinship of (i) a director, an executive officer, a manager, or any other type of important employee of the company or (ii) a Parent Company, etc., who is a natural person. In addition to the requirements under the Companies Act, Mizuho Financial Group’s
|
176
|
independence standards for outside directors set forth additional independence requirements on a voluntary basis. Such additional requirements include, but are not limited to, restrictions against persons that are related to a principal business counterparty of Mizuho Financial Group and its Three Core Companies, entities to which Mizuho Financial Group and its Three Core Companies are a principal business counterparty, entities that receive more than a specified amount of donations from Mizuho Financial Group or its Three Core Companies, entities to which directors have been transferred from us, our accounting auditor, law firms and consulting firms that receive more than a specified amount of fees from Mizuho Financial Group or its Three Core Companies, as well as persons who otherwise are likely to give rise to consistent substantive conflicts of interest in relation to general shareholders. Mizuho Financial Group may, however, appoint a person as an outside director who does not satisfy the additional independence requirements but who it believes to be suitable for the position with sufficient independence in consideration of such person’s character and insight, provided that it externally provides an explanation as to the reason it believes such person qualifies as an outside director with sufficient independence.
|
Currently, Mizuho Financial Group has six outside directors among the thirteen directors.
| • |
A NYSE-listed U.S. company is required to have an audit committee composed entirely of independent directors. Currently, among the four members of the Audit Committee, three members including the Chairman are outside directors and one member is internal non-executive director in compliance with the requirements under the Companies Act, and all such committee members are independent under Rule 10A-3 under the U.S. Securities Exchange Act of 1934 with two members qualified as audit committee financial experts.
|
| • |
A NYSE-listed U.S. company is required to have a nominating/corporate governance committee and a compensation committee, both of which must be composed entirely of independent directors. Currently, the Nominating Committee and the Compensation Committee consist solely of outside directors in compliance with the requirements under the Companies Act.
|
| • |
A NYSE-listed U.S. company must hold regularly scheduled executive sessions where participants are limited to non-executive directors. Currently, the Outside Director Session consists solely of outside directors and is held at least once a year, where the outside directors discuss matters such as issues facing management, the operation of the Board of Directors and the governance systems, and provide opinions as appropriate to the Group CEO.
|
| • |
A NYSE-listed U.S. company must adopt corporate governance guidelines and a code of business conduct and ethics and must post those on its website. While Mizuho Financial Group is not required to adopt such guidelines and code under applicable Japanese laws or the rules of the stock exchange in Japan on which it is listed, the company established in June 2014 and has been updating its corporate governance guidelines that sets forth the basic policy, framework and governing policies regarding the corporate governance system in Mizuho Financial Group and also maintains the “Mizuho Code of Conduct” as its standard for corporate conduct to be observed by the directors, officers and employees.
|
|
ITEM 16H.
|
MINE SAFETY DISCLOSURE
|
Not applicable.
177
PART III
|
ITEM 17. FINANCIAL
|
STATEMENTS
|
We have elected to provide the financial statements and related information specified in Item 18.
|
ITEM 18. FINANCIAL
|
STATEMENTS
|
The information required by this item is set forth in our consolidated financial statements starting on page
F-1
of this annual report.
|
ITEM 19. EXHIBITS
|
|
|
Exhibit
Number
|
Description of Exhibits
|
|
| 1.1 | Articles of Incorporation of Mizuho Financial Group, Inc., dated October 1, 2020 (English Translation) | |
| 1.2 | Regulations of the Board of Directors of Mizuho Financial Group, Inc., as amended on April 1, 2021 (English Translation) | |
| 1.3 | Share Handling Regulations of Mizuho Financial Group, Inc., dated April 1, 2018 (English Translation)* | |
| 2.1 | Form of American Depositary Receipt | |
| 2.2 | Form of Deposit Agreement, amended and restated as of April 2, 2018, among the registrant, The Bank of New York Mellon as Depositary and all owners and holders from time to time of American Depositary Receipts issued thereunder** | |
| 2.3 | Description of Our Shares of Common Stock and Preferred Stock—see “Item 10.B. Memorandum and Articles of Association.” | |
| 2.4 | Description of Our American Depositary Shares | |
| 8 | List of significant subsidiaries of Mizuho Financial Group, Inc.—see “Item 4.C. Information on the Company—Organizational Structure.” | |
| 11 | Code of Ethics for Financial Professionals of Mizuho Financial Group, Inc., as amended on April 1, 2021 (English Translation) | |
| 12.1 | CEO Certification required by Rule 13a-14(a) (17 CFR 240.13a-14(a)). | |
| 12.2 | CFO Certification required by Rule 13a-14(a) (17 CFR 240.13a-14(a)). | |
| 13.1 | Certification required by Rule 13a-14(b) (17 CFR 240.13a-14(b)) and Section 1350 of Chapter 63 of Title 18 of the United States Code (18 U.S.C. 1350). | |
| 15 | Consent of Independent Registered Public Accounting Firm | |
| 101.INS | Inline XBRL Instance Document - the instance document does not appear in the Interactive Data File because its XBRL tags are embedded within the Inline XBRL document | |
| 101.SCH | Inline XBRL Taxonomy Extension Schema | |
| 101.CAL | Inline XBRL Taxonomy Extension Calculation Linkbase | |
| 101.DEF | Inline XBRL Taxonomy Extension Definition Linkbase | |
| 101.LAB | Inline XBRL Taxonomy Extension Label Linkbase | |
| 101.PRE | Inline XBRL Taxonomy Extension Presentation Linkbase | |
| 104 | The cover page for the Company’s Annual Report on From 20-F for the year ended March 31, 2021, has been formatted in Inline XBRL | |
| * |
Incorporated by reference to our annual report on Form 20-F (No. 001-33098) filed on July 3, 2018
|
| ** |
Incorporated by reference to our annual report on Form 20-F (No. 001-33098) filed on July 3, 2018, except Exhibit A thereto. Exhibit A to the Deposit Agreement has been revised as of October 1, 2020. For the latest Exhibit A, see Exhibit 2.1 to this annual report.
|
178
SELECTED STATISTICAL DATA
In preparing the selected statistical data set forth below, foreign activities are defined as business transactions that involve customers residing outside of Japan. However, as the operations of Mizuho Financial Group, Inc. and its subsidiaries (“the MHFG Group” or “the Group”) are highly and globally integrated, the MHFG Group has made certain estimates and assumptions in allocating assets, liabilities, income and expense between domestic and foreign operations. The Group considers domestic and foreign activities determined by such methods to be representative of the Group’s operations.
A-1
I. Distribution of assets, liabilities and equity; interest rates and interest differential
Average balances of balance sheet items, interest and dividend income, interest expense and average yields and rates
The following tables show the MHFG Group’s average balances of balance sheet items, Interest and dividend income, Interest expense, average yields on interest-earning assets, and average rates on interest-bearing liabilities for the fiscal years ended March 31, 2019, 2020 and 2021. Average balances are generally based on a daily average.
Month-end
or
quarter-end
averages are used for certain average balances where it is not practicable to obtain applicable daily averages. The average balances determined by such methods are considered to be representative of the MHFG Group’s operations.
|
2019
|
2020
|
2021
|
||||||||||||||||||||||||||||||||||
|
Average
balance
|
Interest and
dividend
income
|
Average
yield
|
Average
balance
|
Interest and
dividend
income
|
Average
yield
|
Average
balance
|
Interest and
dividend
income
|
Average
yield
|
||||||||||||||||||||||||||||
|
(in billions of yen, except percentages)
|
||||||||||||||||||||||||||||||||||||
|
Assets:
|
||||||||||||||||||||||||||||||||||||
|
Interest-earning assets:
|
||||||||||||||||||||||||||||||||||||
|
Interest-bearing deposits in other banks:
|
||||||||||||||||||||||||||||||||||||
|
Domestic
|
38,914 | 26 | 0.07 | % | 34,333 | 26 | 0.08 | % | 35,177 | 29 | 0.08 | % | ||||||||||||||||||||||||
|
Foreign
|
5,951 | 95 | 1.59 | % | 5,716 | 79 | 1.39 | % | 8,785 | 15 | 0.17 | % | ||||||||||||||||||||||||
|
|
|
|
|
|
|
|
|
|
|
|
|
|||||||||||||||||||||||||
|
Total
|
44,865 | 121 | 0.27 | % | 40,049 | 105 | 0.26 | % | 43,962 | 44 | 0.10 | % | ||||||||||||||||||||||||
|
|
|
|
|
|
|
|
|
|
|
|
|
|||||||||||||||||||||||||
|
Call loans and funds sold, and receivables under resale agreements and securities borrowing transactions:
|
||||||||||||||||||||||||||||||||||||
|
Domestic
|
6,201 | 32 | 0.51 | % | 9,322 | 27 | 0.30 | % | 10,132 | 4 | 0.04 | % | ||||||||||||||||||||||||
|
Foreign
|
9,924 | 228 | 2.30 | % | 11,301 | 249 | 2.21 | % | 10,564 | 40 | 0.38 | % | ||||||||||||||||||||||||
|
|
|
|
|
|
|
|
|
|
|
|
|
|||||||||||||||||||||||||
|
Total
|
16,125 | 260 | 1.62 | % | 20,623 | 276 | 1.34 | % | 20,696 | 44 | 0.22 | % | ||||||||||||||||||||||||
|
|
|
|
|
|
|
|
|
|
|
|
|
|||||||||||||||||||||||||
|
Trading account assets:
|
||||||||||||||||||||||||||||||||||||
|
Domestic
|
5,930 | 71 | 1.19 | % | 7,753 | 72 | 0.93 | % | 6,386 | 79 | 1.24 | % | ||||||||||||||||||||||||
|
Foreign
|
9,197 | 141 | 1.53 | % | 8,859 | 150 | 1.69 | % | 13,243 | 158 | 1.19 | % | ||||||||||||||||||||||||
|
|
|
|
|
|
|
|
|
|
|
|
|
|||||||||||||||||||||||||
|
Total
|
15,127 | 212 | 1.40 | % | 16,612 | 222 | 1.34 | % | 19,629 | 237 | 1.21 | % | ||||||||||||||||||||||||
|
|
|
|
|
|
|
|
|
|
|
|
|
|||||||||||||||||||||||||
|
Investments:
|
||||||||||||||||||||||||||||||||||||
|
Domestic
|
20,109 | 137 | 0.68 | % | 16,532 | 85 | 0.51 | % | 24,617 | 68 | 0.27 | % | ||||||||||||||||||||||||
|
Foreign
|
4,471 | 95 | 2.13 | % | 4,096 | 81 | 1.98 | % | 4,164 | 45 | 1.07 | % | ||||||||||||||||||||||||
|
|
|
|
|
|
|
|
|
|
|
|
|
|||||||||||||||||||||||||
|
Total
|
24,580 | 232 | 0.95 | % | 20,628 | 166 | 0.80 | % | 28,781 | 113 | 0.39 | % | ||||||||||||||||||||||||
|
|
|
|
|
|
|
|
|
|
|
|
|
|||||||||||||||||||||||||
|
Loans
(1)
:
|
||||||||||||||||||||||||||||||||||||
|
Domestic
|
55,897 | 531 | 0.95 | % | 54,777 | 535 | 0.98 | % | 59,115 | 488 | 0.82 | % | ||||||||||||||||||||||||
|
Foreign
|
28,037 | 851 | 3.03 | % | 28,827 | 846 | 2.94 | % | 32,355 | 531 | 1.64 | % | ||||||||||||||||||||||||
|
|
|
|
|
|
|
|
|
|
|
|
|
|||||||||||||||||||||||||
|
Total
|
83,934 | 1,382 | 1.65 | % | 83,604 | 1,381 | 1.65 | % | 91,470 | 1,019 | 1.11 | % | ||||||||||||||||||||||||
|
|
|
|
|
|
|
|
|
|
|
|
|
|||||||||||||||||||||||||
|
Total interest-earning assets:
|
||||||||||||||||||||||||||||||||||||
|
Domestic
|
127,051 | 797 | 0.63 | % | 122,717 | 745 | 0.61 | % | 135,427 | 668 | 0.49 | % | ||||||||||||||||||||||||
|
Foreign
|
57,580 | 1,410 | 2.45 | % | 58,799 | 1,405 | 2.39 | % | 69,111 | 789 | 1.14 | % | ||||||||||||||||||||||||
|
|
|
|
|
|
|
|
|
|
|
|
|
|||||||||||||||||||||||||
|
Total
|
184,631 | 2,207 | 1.20 | % | 181,516 | 2,150 | 1.19 | % | 204,538 | 1,457 | 0.71 | % | ||||||||||||||||||||||||
|
|
|
|
|
|
|
|
|
|
|
|
|
|||||||||||||||||||||||||
|
Noninterest-earning assets:
|
||||||||||||||||||||||||||||||||||||
|
Cash and due from banks
|
3,832 | 3,465 | 3,490 | |||||||||||||||||||||||||||||||||
|
Other noninterest-earning assets
(2)
|
17,646 | 18,146 | 18,917 | |||||||||||||||||||||||||||||||||
|
Allowance for credit losses
|
(297 | ) | (346 | ) | (623 | ) | ||||||||||||||||||||||||||||||
|
|
|
|
|
|
|
|||||||||||||||||||||||||||||||
|
Total noninterest-earning assets
|
21,181 | 21,265 | 21,784 | |||||||||||||||||||||||||||||||||
|
|
|
|
|
|
|
|||||||||||||||||||||||||||||||
|
Total average assets
|
205,812 | 202,781 | 226,322 | |||||||||||||||||||||||||||||||||
|
|
|
|
|
|
|
|||||||||||||||||||||||||||||||
Notes:
| (1) |
Average balances of loans include all nonaccrual loans. The amortized portion of net loan origination fees (costs) is included in interest income on loans.
|
| (2) |
The fair value carrying amounts of derivative contracts are reported in Other noninterest-earning assets.
|
A-2
Within total average assets, the percentage attributable to foreign activities was 31.3%, 32.5% and 34.1%, respectively, for the fiscal years ended March 31, 2019, 2020 and 2021.
|
2019
|
2020
|
2021
|
||||||||||||||||||||||||||||||||||
|
Average
balance
|
Interest
expense
|
Average
rate
|
Average
balance
|
Interest
expense
|
Average
rate
|
Average
balance
|
Interest
expense
|
Average
rate
|
||||||||||||||||||||||||||||
|
(in billions of yen, except percentages)
|
||||||||||||||||||||||||||||||||||||
|
Liabilities and equity:
|
||||||||||||||||||||||||||||||||||||
|
Interest-bearing liabilities:
|
||||||||||||||||||||||||||||||||||||
|
Deposits:
|
||||||||||||||||||||||||||||||||||||
|
Domestic
|
87,168 | 94 | 0.11 | % | 87,143 | 90 | 0.10 | % | 92,761 | 26 | 0.03 | % | ||||||||||||||||||||||||
|
Foreign
|
26,693 | 519 | 1.95 | % | 27,507 | 526 | 1.91 | % | 31,070 | 134 | 0.43 | % | ||||||||||||||||||||||||
|
|
|
|
|
|
|
|
|
|
|
|
|
|||||||||||||||||||||||||
|
Total
|
113,861 | 613 | 0.54 | % | 114,650 | 616 | 0.54 | % | 123,831 | 160 | 0.13 | % | ||||||||||||||||||||||||
|
|
|
|
|
|
|
|
|
|
|
|
|
|||||||||||||||||||||||||
|
Short-term borrowings
(1)
:
|
||||||||||||||||||||||||||||||||||||
|
Domestic
|
14,011 | 69 | 0.49 | % | 10,918 | 63 | 0.58 | % | 15,087 | 25 | 0.17 | % | ||||||||||||||||||||||||
|
Foreign
|
15,094 | 357 | 2.37 | % | 15,112 | 334 | 2.21 | % | 20,282 | 50 | 0.25 | % | ||||||||||||||||||||||||
|
|
|
|
|
|
|
|
|
|
|
|
|
|||||||||||||||||||||||||
|
Total
|
29,105 | 426 | 1.47 | % | 26,030 | 397 | 1.53 | % | 35,369 | 75 | 0.21 | % | ||||||||||||||||||||||||
|
|
|
|
|
|
|
|
|
|
|
|
|
|||||||||||||||||||||||||
|
Trading account liabilities:
|
||||||||||||||||||||||||||||||||||||
|
Domestic
|
1,735 | 34 | 1.93 | % | 1,591 | 41 | 2.59 | % | 1,574 | 47 | 3.00 | % | ||||||||||||||||||||||||
|
Foreign
|
1,249 | 16 | 1.29 | % | 1,009 | 12 | 1.16 | % | 794 | 6 | 0.70 | % | ||||||||||||||||||||||||
|
|
|
|
|
|
|
|
|
|
|
|
|
|||||||||||||||||||||||||
|
Total
|
2,984 | 50 | 1.66 | % | 2,600 | 53 | 2.04 | % | 2,368 | 53 | 2.22 | % | ||||||||||||||||||||||||
|
|
|
|
|
|
|
|
|
|
|
|
|
|||||||||||||||||||||||||
|
Long-term debt:
|
||||||||||||||||||||||||||||||||||||
|
Domestic
|
12,285 | 217 | 1.77 | % | 9,631 | 198 | 2.05 | % | 9,892 | 175 | 1.77 | % | ||||||||||||||||||||||||
|
Foreign
|
701 | 7 | 0.95 | % | 678 | 7 | 1.13 | % | 816 | 5 | 0.65 | % | ||||||||||||||||||||||||
|
|
|
|
|
|
|
|
|
|
|
|
|
|||||||||||||||||||||||||
|
Total
|
12,986 | 224 | 1.72 | % | 10,309 | 205 | 1.99 | % | 10,708 | 180 | 1.68 | % | ||||||||||||||||||||||||
|
|
|
|
|
|
|
|
|
|
|
|
|
|||||||||||||||||||||||||
|
Total interest-bearing liabilities:
|
||||||||||||||||||||||||||||||||||||
|
Domestic
|
115,199 | 414 | 0.36 | % | 109,283 | 392 | 0.36 | % | 119,314 | 273 | 0.23 | % | ||||||||||||||||||||||||
|
Foreign
|
43,737 | 899 | 2.06 | % | 44,306 | 879 | 1.98 | % | 52,962 | 195 | 0.37 | % | ||||||||||||||||||||||||
|
|
|
|
|
|
|
|
|
|
|
|
|
|||||||||||||||||||||||||
|
Total
|
158,936 | 1,313 | 0.83 | % | 153,589 | 1,271 | 0.83 | % | 172,276 | 468 | 0.27 | % | ||||||||||||||||||||||||
|
|
|
|
|
|
|
|
|
|
|
|
|
|||||||||||||||||||||||||
|
Noninterest-bearing liabilities
(2)
|
38,548 | 40,803 | 45,482 | |||||||||||||||||||||||||||||||||
|
|
|
|
|
|
|
|||||||||||||||||||||||||||||||
|
Equity
|
8,328 | 8,389 | 8,564 | |||||||||||||||||||||||||||||||||
|
|
|
|
|
|
|
|||||||||||||||||||||||||||||||
|
Total average liabilities and equity
|
205,812 | 202,781 | 226,322 | |||||||||||||||||||||||||||||||||
|
|
|
|
|
|
|
|||||||||||||||||||||||||||||||
|
Net interest income and average interest rate spread
|
894 | 0.37 | % | 879 | 0.36 | % | 989 | 0.44 | % | |||||||||||||||||||||||||||
|
|
|
|
|
|
|
|||||||||||||||||||||||||||||||
|
Net interest income as a percentage of average total interest-earning assets
|
0.48 | % | 0.48 | % | 0.48 | % | ||||||||||||||||||||||||||||||
Notes:
| (1) |
Short-term borrowings consist of Due to trust accounts, Call money and funds purchased, Payables under repurchase agreements and securities lending transactions, and Other short-term borrowings.
|
| (2) |
The fair value carrying amounts of derivative contracts are reported in Noninterest-bearing liabilities.
|
Within total average liabilities, which is the total of interest-bearing liabilities and noninterest-bearing liabilities shown in the above table, the percentage attributable to foreign activities was 27.6%, 29.2% and 29.3%, respectively, for the fiscal years ended March 31, 2019, 2020 and 2021.
A-3
Analysis of net interest income
The following tables show changes in the MHFG Group’s Interest and dividend income, Interest expense, and Net interest income based on changes in volume and changes in rate for the fiscal year ended March 31, 2020 compared to the fiscal year ended March 31, 2019 and the fiscal year ended March 31, 2021 compared to the fiscal year ended March 31, 2020. Changes attributable to the combined impact of changes in rate and volume have been allocated proportionately to the changes due to volume changes and changes due to rate changes.
|
Fiscal year ended March 31, 2020
versus
fiscal year ended March 31, 2019
|
Fiscal year ended March 31, 2021
versus
fiscal year ended March 31, 2020
|
|||||||||||||||||||||||
|
Increase (decrease) due to
changes in |
Net
change
|
Increase (decrease) due to
changes in |
Net
change
|
|||||||||||||||||||||
|
Volume
|
Yield
|
Volume
|
Yield
|
|||||||||||||||||||||
|
(in billions of yen)
|
||||||||||||||||||||||||
|
Interest and dividend income:
|
||||||||||||||||||||||||
|
Interest-bearing deposits in other banks:
|
||||||||||||||||||||||||
|
Domestic
|
(3 | ) | 3 | — | 1 | 2 | 3 | |||||||||||||||||
|
Foreign
|
(4 | ) | (12 | ) | (16 | ) | 5 | (69 | ) | (64 | ) | |||||||||||||
|
|
|
|
|
|
|
|
|
|
|
|
|
|||||||||||||
|
Total
|
(7 | ) | (9 | ) | (16 | ) | 6 | (67 | ) | (61 | ) | |||||||||||||
|
|
|
|
|
|
|
|
|
|
|
|
|
|||||||||||||
|
Call loans and funds sold, and receivables under resale agreements and securities borrowing transactions:
|
||||||||||||||||||||||||
|
Domestic
|
9 | (14 | ) | (5 | ) | — | (23 | ) | (23 | ) | ||||||||||||||
|
Foreign
|
30 | (9 | ) | 21 | (15 | ) | (194 | ) | (209 | ) | ||||||||||||||
|
|
|
|
|
|
|
|
|
|
|
|
|
|||||||||||||
|
Total
|
39 | (23 | ) | 16 | (15 | ) | (217 | ) | (232 | ) | ||||||||||||||
|
|
|
|
|
|
|
|
|
|
|
|
|
|||||||||||||
|
Trading account assets:
|
||||||||||||||||||||||||
|
Domestic
|
17 | (16 | ) | 1 | (13 | ) | 20 | 7 | ||||||||||||||||
|
Foreign
|
(5 | ) | 14 | 9 | 52 | (44 | ) | 8 | ||||||||||||||||
|
|
|
|
|
|
|
|
|
|
|
|
|
|||||||||||||
|
Total
|
12 | (2 | ) | 10 | 39 | (24 | ) | 15 | ||||||||||||||||
|
|
|
|
|
|
|
|
|
|
|
|
|
|||||||||||||
|
Investments:
|
||||||||||||||||||||||||
|
Domestic
|
(22 | ) | (30 | ) | (52 | ) | 22 | (39 | ) | (17 | ) | |||||||||||||
|
Foreign
|
(8 | ) | (6 | ) | (14 | ) | 1 | (37 | ) | (36 | ) | |||||||||||||
|
|
|
|
|
|
|
|
|
|
|
|
|
|||||||||||||
|
Total
|
(30 | ) | (36 | ) | (66 | ) | 23 | (76 | ) | (53 | ) | |||||||||||||
|
|
|
|
|
|
|
|
|
|
|
|
|
|||||||||||||
|
Loans:
|
||||||||||||||||||||||||
|
Domestic
|
(10 | ) | 14 | 4 | 36 | (83 | ) | (47 | ) | |||||||||||||||
|
Foreign
|
23 | (28 | ) | (5 | ) | 58 | (373 | ) | (315 | ) | ||||||||||||||
|
|
|
|
|
|
|
|
|
|
|
|
|
|||||||||||||
|
Total
|
13 | (14 | ) | (1 | ) | 94 | (456 | ) | (362 | ) | ||||||||||||||
|
|
|
|
|
|
|
|
|
|
|
|
|
|||||||||||||
|
Total interest and dividend income:
|
||||||||||||||||||||||||
|
Domestic
|
(9 | ) | (43 | ) | (52 | ) | 46 | (123 | ) | (77 | ) | |||||||||||||
|
Foreign
|
36 | (41 | ) | (5 | ) | 101 | (717 | ) | (616 | ) | ||||||||||||||
|
|
|
|
|
|
|
|
|
|
|
|
|
|||||||||||||
|
Total
|
27 | (84 | ) | (57 | ) | 147 | (840 | ) | (693 | ) | ||||||||||||||
|
|
|
|
|
|
|
|
|
|
|
|
|
|||||||||||||
A-4
|
Fiscal year ended March 31, 2020
versus
fiscal year ended March 31, 2019
|
Fiscal year ended March 31, 2021
versus
fiscal year ended March 31, 2020
|
|||||||||||||||||||||||
|
Increase (decrease) due to
changes in |
Net
change
|
Increase (decrease) due to
changes in |
Net
change
|
|||||||||||||||||||||
|
Volume
|
Rate
|
Volume
|
Rate
|
|||||||||||||||||||||
|
(in billions of yen)
|
||||||||||||||||||||||||
|
Interest expense:
|
||||||||||||||||||||||||
|
Deposits:
|
||||||||||||||||||||||||
|
Domestic
|
— | (4 | ) | (4 | ) | 1 | (65 | ) | (64 | ) | ||||||||||||||
|
Foreign
|
16 | (9 | ) | 7 | 15 | (407 | ) | (392 | ) | |||||||||||||||
|
|
|
|
|
|
|
|
|
|
|
|
|
|||||||||||||
|
Total
|
16 | (13 | ) | 3 | 16 | (472 | ) | (456 | ) | |||||||||||||||
|
|
|
|
|
|
|
|
|
|
|
|
|
|||||||||||||
|
Short-term borrowings:
|
||||||||||||||||||||||||
|
Domestic
|
(15 | ) | 9 | (6 | ) | 7 | (45 | ) | (38 | ) | ||||||||||||||
|
Foreign
|
— | (23 | ) | (23 | ) | 13 | (297 | ) | (284 | ) | ||||||||||||||
|
|
|
|
|
|
|
|
|
|
|
|
|
|||||||||||||
|
Total
|
(15 | ) | (14 | ) | (29 | ) | 20 | (342 | ) | (322 | ) | |||||||||||||
|
|
|
|
|
|
|
|
|
|
|
|
|
|||||||||||||
|
Trading account liabilities:
|
||||||||||||||||||||||||
|
Domestic
|
(3 | ) | 10 | 7 | — | 6 | 6 | |||||||||||||||||
|
Foreign
|
(3 | ) | (1 | ) | (4 | ) | (2 | ) | (4 | ) | (6 | ) | ||||||||||||
|
|
|
|
|
|
|
|
|
|
|
|
|
|||||||||||||
|
Total
|
(6 | ) | 9 | 3 | (2 | ) | 2 | — | ||||||||||||||||
|
|
|
|
|
|
|
|
|
|
|
|
|
|||||||||||||
|
Long-term debt:
|
||||||||||||||||||||||||
|
Domestic
|
(47 | ) | 28 | (19 | ) | 5 | (28 | ) | (23 | ) | ||||||||||||||
|
Foreign
|
— | — | — | 1 | (3 | ) | (2 | ) | ||||||||||||||||
|
|
|
|
|
|
|
|
|
|
|
|
|
|||||||||||||
|
Total
|
(47 | ) | 28 | (19 | ) | 6 | (31 | ) | (25 | ) | ||||||||||||||
|
|
|
|
|
|
|
|
|
|
|
|
|
|||||||||||||
|
Total interest expense:
|
||||||||||||||||||||||||
|
Domestic
|
(65 | ) | 43 | (22 | ) | 13 | (132 | ) | (119 | ) | ||||||||||||||
|
Foreign
|
13 | (33 | ) | (20 | ) | 27 | (711 | ) | (684 | ) | ||||||||||||||
|
|
|
|
|
|
|
|
|
|
|
|
|
|||||||||||||
|
Total
|
(52 | ) | 10 | (42 | ) | 40 | (843 | ) | (803 | ) | ||||||||||||||
|
|
|
|
|
|
|
|
|
|
|
|
|
|||||||||||||
|
Net interest income:
|
||||||||||||||||||||||||
|
Domestic
|
56 | (86 | ) | (30 | ) | 33 | 9 | 42 | ||||||||||||||||
|
Foreign
|
23 | (8 | ) | 15 | 74 | (6 | ) | 68 | ||||||||||||||||
|
|
|
|
|
|
|
|
|
|
|
|
|
|||||||||||||
|
Total
|
79 | (94 | ) | (15 | ) | 107 | 3 | 110 | ||||||||||||||||
|
|
|
|
|
|
|
|
|
|
|
|
|
|||||||||||||
A-5
II. Investment portfolio
The following table shows the amortized cost, fair value and net unrealized gains (losses) of
and
securities at March 31, 2019, 2020 and 2021:
available-for-sale
held-to-maturity
|
2019
|
2020
|
2021
|
||||||||||||||||||||||||||||||||||
|
Amortized
cost
|
Fair
value
|
Net
unrealized
gains
(losses)
|
Amortized
cost
|
Fair
value
|
Net
unrealized
gains
(losses)
|
Amortized
cost
|
Fair
value
|
Net
unrealized
gains
(losses)
|
||||||||||||||||||||||||||||
|
(in billions of yen)
|
||||||||||||||||||||||||||||||||||||
|
Available-for-sale
|
||||||||||||||||||||||||||||||||||||
|
Domestic:
|
||||||||||||||||||||||||||||||||||||
|
Japanese government bonds
|
11,889 | 11,897 | 8 | 12,652 | 12,603 | (49 | ) | 20,954 | 20,921 | (33 | ) | |||||||||||||||||||||||||
|
Agency mortgage-backed securities
(1)
|
503 | 517 | 14 | 495 | 505 | 10 | 513 | 521 | 8 | |||||||||||||||||||||||||||
|
Corporate bonds and other debt securities
|
2,546 | 2,560 | 14 | 2,801 | 2,807 | 6 | 3,140 | 3,154 | 14 | |||||||||||||||||||||||||||
|
|
|
|
|
|
|
|
|
|
|
|
|
|
|
|
|
|
|
|||||||||||||||||||
|
Total domestic
|
14,938 | 14,974 | 36 | 15,948 | 15,915 | (33 | ) | 24,607 | 24,596 | (11 | ) | |||||||||||||||||||||||||
|
|
|
|
|
|
|
|
|
|
|
|
|
|
|
|
|
|
|
|||||||||||||||||||
|
Foreign:
|
||||||||||||||||||||||||||||||||||||
|
U.S. Treasury bonds and federal agency securities
|
1,009 | 1,009 | — | 927 | 935 | 8 | 907 | 911 | 4 | |||||||||||||||||||||||||||
|
Other foreign government bonds
|
1,342 | 1,342 | — | 1,408 | 1,411 | 3 | 1,505 | 1,507 | 2 | |||||||||||||||||||||||||||
|
Agency mortgage-backed securities
(2)
|
27 | 27 | — | — | — | — | — | — | — | |||||||||||||||||||||||||||
|
Corporate bonds and other debt securities
|
778 | 781 | 3 | 850 | 852 | 2 | 838 | 839 | 1 | |||||||||||||||||||||||||||
|
|
|
|
|
|
|
|
|
|
|
|
|
|
|
|
|
|
|
|||||||||||||||||||
|
Total foreign
|
3,156 | 3,159 | 3 | 3,185 | 3,198 | 13 | 3,250 | 3,257 | 7 | |||||||||||||||||||||||||||
|
|
|
|
|
|
|
|
|
|
|
|
|
|
|
|
|
|
|
|||||||||||||||||||
|
Total
|
18,094 | 18,133 | 39 | 19,133 | 19,113 | (20 | ) | 27,857 | 27,853 | (4 | ) | |||||||||||||||||||||||||
|
|
|
|
|
|
|
|
|
|
|
|
|
|
|
|
|
|
|
|||||||||||||||||||
|
Held-to-maturity
|
||||||||||||||||||||||||||||||||||||
|
Domestic:
|
||||||||||||||||||||||||||||||||||||
|
Japanese government bonds
|
1,120 | 1,140 | 20 | 480 | 493 | 13 | 480 | 490 | 10 | |||||||||||||||||||||||||||
|
|
|
|
|
|
|
|
|
|
|
|
|
|
|
|
|
|
|
|||||||||||||||||||
|
Total domestic
|
1,120 | 1,140 | 20 | 480 | 493 | 13 | 480 | 490 | 10 | |||||||||||||||||||||||||||
|
|
|
|
|
|
|
|
|
|
|
|
|
|
|
|
|
|
|
|||||||||||||||||||
|
Foreign:
|
||||||||||||||||||||||||||||||||||||
|
Agency mortgage-backed securities
(3)
|
484 | 470 | (14 | ) | 382 | 382 | — | 407 | 414 | 7 | ||||||||||||||||||||||||||
|
|
|
|
|
|
|
|
|
|
|
|
|
|
|
|
|
|
|
|||||||||||||||||||
|
Total foreign
|
484 | 470 | (14 | ) | 382 | 382 | — | 407 | 414 | 7 | ||||||||||||||||||||||||||
|
|
|
|
|
|
|
|
|
|
|
|
|
|
|
|
|
|
|
|||||||||||||||||||
|
Total
|
1,604 | 1,610 | 6 | 862 | 875 | 13 | 887 | 904 | 17 | |||||||||||||||||||||||||||
|
|
|
|
|
|
|
|
|
|
|
|
|
|
|
|
|
|
|
|||||||||||||||||||
Notes:
| (1) |
All domestic agency mortgage-backed securities are issued by Japan Housing Finance Agency, a Japanese government-sponsored enterprise.
|
| (2) |
Foreign agency mortgage-backed securities primarily consist of Government National Mortgage Association (“Ginnie Mae”) securities, which are guaranteed by the United States government.
|
| (3) |
All foreign agency mortgage-backed securities presented in this line are Ginnie Mae securities.
|
A-6
The following table shows the book values, contractual maturities and weighted average yields of
and
debt securities at March 31, 2021. Fair value and amortized cost are the basis of the book value for
and
debt securities, respectively. Weighted average yields are calculated based on amortized cost for all debt securities.
available-for-sale
held-to-maturity
available-for-sale
held-to-maturity
|
Maturity
|
||||||||||||||||||||||||||||||||||||||||
|
One year or less
|
After one year
through
five years
|
After five years
through
ten years
|
After ten years
|
Total
|
||||||||||||||||||||||||||||||||||||
|
Amount
|
Yield
|
Amount
|
Yield
|
Amount
|
Yield
|
Amount
|
Yield
|
Amount
|
Yield
|
|||||||||||||||||||||||||||||||
|
(in billions of yen, except percentages)
|
||||||||||||||||||||||||||||||||||||||||
|
Available-for-sale
|
||||||||||||||||||||||||||||||||||||||||
|
Domestic:
|
||||||||||||||||||||||||||||||||||||||||
|
Japanese government bonds
|
15,466 | (0.13 | )% | 4,388 | (0.16 | )% | 1,014 | (0.27 | )% | 53 | 0.32 | % | 20,921 | (0.14 | )% | |||||||||||||||||||||||||
|
Agency mortgage-backed securities
|
— | — | — | — | — | — | 521 | 0.90 | % | 521 | 0.90 | % | ||||||||||||||||||||||||||||
|
Corporate bonds and other debt securities
|
164 | 0.22 | % | 1,362 | 0.26 | % | 985 | 0.23 | % | 643 | 2.17 | % | 3,154 | 0.64 | % | |||||||||||||||||||||||||
|
|
|
|
|
|
|
|
|
|
|
|||||||||||||||||||||||||||||||
|
Total domestic
|
15,630 | (0.13 | )% | 5,750 | (0.06 | )% | 1,999 | (0.03 | )% | 1,217 | 1.55 | % | 24,596 | (0.02 | )% | |||||||||||||||||||||||||
|
|
|
|
|
|
|
|
|
|
|
|||||||||||||||||||||||||||||||
|
Foreign:
|
||||||||||||||||||||||||||||||||||||||||
|
U.S. Treasury bonds and federal agency securities
|
266 | 0.88 | % | 645 | 0.45 | % | — | — | — | — | 911 | 0.58 | % | |||||||||||||||||||||||||||
|
Other foreign government bonds
|
1,174 | 0.17 | % | 331 | 0.83 | % | 1 | 7.86 | % | 1 | 7.37 | % | 1,507 | 0.32 | % | |||||||||||||||||||||||||
|
Agency mortgage-backed securities
|
— | — | — | — | — | — | — | 6.00 | % | — | 6.00 | % | ||||||||||||||||||||||||||||
|
Corporate bonds and other debt securities
|
454 | 1.14 | % | 308 | 2.30 | % | 70 | 1.60 | % | 7 | 0.04 | % | 839 | 1.60 | % | |||||||||||||||||||||||||
|
|
|
|
|
|
|
|
|
|
|
|||||||||||||||||||||||||||||||
|
Total foreign
|
1,894 | 0.50 | % | 1,284 | 1.00 | % | 71 | 1.69 | % | 8 | 1.18 | % | 3,257 | 0.72 | % | |||||||||||||||||||||||||
|
|
|
|
|
|
|
|
|
|
|
|||||||||||||||||||||||||||||||
|
Total
|
17,524 | (0.06 | )% | 7,034 | 0.13 | % | 2,070 | 0.03 | % | 1,225 | 1.54 | % | 27,853 | 0.06 | % | |||||||||||||||||||||||||
|
|
|
|
|
|
|
|
|
|
|
|||||||||||||||||||||||||||||||
|
Held-to-maturity
|
||||||||||||||||||||||||||||||||||||||||
|
Domestic:
|
||||||||||||||||||||||||||||||||||||||||
|
Japanese government bonds
|
— | — | 480 | 0.67 | % | — | — | — | — | 480 | 0.67 | % | ||||||||||||||||||||||||||||
|
|
|
|
|
|
|
|
|
|
|
|||||||||||||||||||||||||||||||
|
Total domestic
|
— | — | 480 | 0.67 | % | — | — | — | — | 480 | 0.67 | % | ||||||||||||||||||||||||||||
|
|
|
|
|
|
|
|
|
|
|
|||||||||||||||||||||||||||||||
|
Foreign:
|
||||||||||||||||||||||||||||||||||||||||
|
Agency mortgage-backed securities
|
— | — | — | — | — | — | 407 | 3.25 | % | 407 | 3.25 | % | ||||||||||||||||||||||||||||
|
|
|
|
|
|
|
|
|
|
|
|||||||||||||||||||||||||||||||
|
Total foreign
|
— | — | — | — | — | — | 407 | 3.25 | % | 407 | 3.25 | % | ||||||||||||||||||||||||||||
|
|
|
|
|
|
|
|
|
|
|
|||||||||||||||||||||||||||||||
|
Total
|
— | — | 480 | 0.67 | % | — | — | 407 | 3.25 | % | 887 | 1.85 | % | |||||||||||||||||||||||||||
|
|
|
|
|
|
|
|
|
|
|
|||||||||||||||||||||||||||||||
Other than Japanese government bonds, the MHFG Group did not have any securities of individual issuers with respect to which their aggregate book value exceeded 10% of the Group’s shareholders’ equity at March 31, 2021.
In addition to
securities and
securities, the MHFG Group’s Investments also include Equity securities and Other investments. See Note 3 “Investments” to the consolidated financial statements included elsewhere in this annual report for information regarding Equity securities and Other investments.
Available-for-sale
Held-to-maturity
A-7
III. Loan portfolio
Types of loans
The following table shows loans outstanding by domicile and industry of borrower at March 31, 2017, 2018, 2019, 2020 and 2021:
|
2017
|
2018
|
2019
|
2020
|
2021
|
||||||||||||||||
|
(in billions of yen)
|
||||||||||||||||||||
|
Domestic:
|
||||||||||||||||||||
|
Manufacturing
|
8,730 | 8,150 | 9,554 | 9,731 | 11,011 | |||||||||||||||
|
Construction and real estate
|
7,751 | 8,095 | 8,950 | 9,603 | 10,492 | |||||||||||||||
|
Services
|
4,633 | 4,924 | 5,017 | 5,993 | 6,406 | |||||||||||||||
|
Wholesale and retail
|
5,131 | 5,108 | 5,159 | 5,220 | 5,357 | |||||||||||||||
|
Transportation and communications
|
3,567 | 3,632 | 3,693 | 3,833 | 3,886 | |||||||||||||||
|
Banks and other financial institutions
|
4,087 | 4,527 | 4,346 | 4,635 | 4,696 | |||||||||||||||
|
Government and public institutions
|
8,532 | 8,882 | 2,359 | 2,199 | 1,898 | |||||||||||||||
|
Other industries
(Note)
|
4,426 | 5,013 | 5,473 | 5,389 | 5,918 | |||||||||||||||
|
Individuals:
|
||||||||||||||||||||
|
Mortgage loans
|
9,960 | 9,445 | 8,950 | 8,567 | 8,194 | |||||||||||||||
|
Other
|
840 | 884 | 908 | 861 | 790 | |||||||||||||||
|
|
|
|
|
|
|
|
|
|
|
|||||||||||
|
Total domestic
|
57,657 | 58,660 | 54,409 | 56,031 | 58,648 | |||||||||||||||
|
|
|
|
|
|
|
|
|
|
|
|||||||||||
|
Foreign:
|
||||||||||||||||||||
|
Commercial and industrial
|
16,972 | 17,225 | 19,126 | 20,819 | 19,455 | |||||||||||||||
|
Banks and other financial institutions
|
7,403 | 7,435 | 9,087 | 10,475 | 10,449 | |||||||||||||||
|
Government and public institutions
|
217 | 303 | 297 | 317 | 177 | |||||||||||||||
|
Other
|
191 | 38 | 33 | 35 | 19 | |||||||||||||||
|
|
|
|
|
|
|
|
|
|
|
|||||||||||
|
Total foreign
|
24,783 | 25,001 | 28,543 | 31,646 | 30,100 | |||||||||||||||
|
|
|
|
|
|
|
|
|
|
|
|||||||||||
|
Total
|
82,440 | 83,661 | 82,952 | 87,677 | 88,748 | |||||||||||||||
|
Less: Unearned income and deferred loan fees—net
|
156 | 146 | 152 | 149 | 167 | |||||||||||||||
|
|
|
|
|
|
|
|
|
|
|
|||||||||||
|
Total loans before allowance for credit losses on loans
|
82,284 | 83,515 | 82,800 | 87,528 | 88,581 | |||||||||||||||
|
|
|
|
|
|
|
|
|
|
|
|||||||||||
| Note: |
Other industries of domestic includes trade receivables and lease receivables of consolidated variable interest entities.
|
There were no concentrations of loans exceeding 10% of total loans which are not disclosed as a category of loans in the table above.
A-8
Maturities and sensitivities of loans to changes in interest rates
The following table shows the maturities of loan portfolio by domicile and industry of borrower at March 31, 2021:
|
Maturity
|
||||||||||||||||
|
One year
or less
|
After one year
through
five years
|
After
five years
|
Total
|
|||||||||||||
|
(in billions of yen)
|
||||||||||||||||
|
Domestic:
|
||||||||||||||||
|
Manufacturing
|
4,065 | 4,827 | 2,119 | 11,011 | ||||||||||||
|
Construction and real estate
|
1,743 | 4,219 | 4,530 | 10,492 | ||||||||||||
|
Services
|
2,772 | 2,714 | 920 | 6,406 | ||||||||||||
|
Wholesale and retail
|
3,050 | 1,822 | 485 | 5,357 | ||||||||||||
|
Transportation and communications
|
1,191 | 1,916 | 779 | 3,886 | ||||||||||||
|
Banks and other financial institutions
|
2,252 | 1,922 | 522 | 4,696 | ||||||||||||
|
Government and public institutions
|
1,361 | 269 | 268 | 1,898 | ||||||||||||
|
Other industries
|
3,508 | 1,284 | 1,126 | 5,918 | ||||||||||||
|
Individuals
|
1,242 | 2,145 | 5,597 | 8,984 | ||||||||||||
|
|
|
|
|
|
|
|
|
|||||||||
|
Total domestic
|
21,184 | 21,118 | 16,346 | 58,648 | ||||||||||||
|
Foreign:
|
||||||||||||||||
|
Total foreign
|
14,876 | 12,968 | 2,256 | 30,100 | ||||||||||||
|
|
|
|
|
|
|
|
|
|||||||||
|
Total
|
36,060 | 34,086 | 18,602 | 88,748 | ||||||||||||
|
|
|
|
|
|
|
|
|
|||||||||
Of the above loans due after one year, loans which have floating rates and fixed rates at March 31, 2021 are as follows:
|
(in billions of yen)
|
||||
|
Floating rates
|
39,554 | |||
|
Fixed rates
|
13,134 | |||
|
|
|
|||
|
Total
|
52,688 | |||
|
|
|
|||
A-9
Nonaccrual loans
The MHFG Group considers loans to be nonaccrual when it is probable that the Group will be unable to collect all the scheduled payments of principal and interest when due according to the contractual terms of the loans. The Group classifies loans to special attention, intensive control, substantially bankrupt and bankrupt obligors as nonaccrual loans. Nonaccrual loans include loans past due for 90 days or more and restructured loans that meet the definition of troubled debt restructuring in accordance with ASC 310, “Receivables”(“ASC 310”). There are no loans that are ninety days past due and still accruing. The Group does not have any loans to borrowers that cause management to have serious doubts as to the ability of such borrowers to comply with the present loan repayment terms for the periods presented other than those already designated as nonaccrual loans. The following table shows the distribution of nonaccrual loans at March 31, 2017, 2018, 2019, 2020 and 2021 by domicile and industry of borrower:
|
2017
|
2018
|
2019
|
2020
|
2021
|
||||||||||||||||
|
(in billions of yen)
|
||||||||||||||||||||
|
Domestic:
|
||||||||||||||||||||
|
Manufacturing
|
379 | 142 | 109 | 159 | 568 | |||||||||||||||
|
Construction and real estate
|
57 | 41 | 46 | 55 | 56 | |||||||||||||||
|
Services
|
66 | 58 | 74 | 81 | 164 | |||||||||||||||
|
Wholesale and retail
|
147 | 131 | 135 | 148 | 149 | |||||||||||||||
|
Transportation and communications
|
23 | 28 | 31 | 23 | 23 | |||||||||||||||
|
Banks and other financial institutions
|
6 | 12 | 10 | 12 | 23 | |||||||||||||||
|
Other industries
|
7 | 4 | 9 | 19 | 10 | |||||||||||||||
|
Individuals
|
105 | 90 | 81 | 84 | 87 | |||||||||||||||
|
|
|
|
|
|
|
|
|
|
|
|||||||||||
|
Total domestic
|
790 | 506 | 495 | 581 | 1,080 | |||||||||||||||
|
Foreign:
|
||||||||||||||||||||
|
Total foreign
|
191 | 109 | 151 | 135 | 144 | |||||||||||||||
|
|
|
|
|
|
|
|
|
|
|
|||||||||||
|
Total nonaccrual loans
|
981 | 615 | 646 | 716 | 1,224 | |||||||||||||||
|
|
|
|
|
|
|
|
|
|
|
|||||||||||
Had interest on nonaccrual loans been accrued at the original contractual terms, gross interest income on domestic and foreign nonaccrual loans outstanding during the fiscal year ended March 31, 2021 would have been ¥17 billion and ¥4 billion, respectively. The MHFG group recognized interest income on these domestic and foreign loans of ¥17 billion and ¥2 billion, respectively, in the consolidated statements of income for the fiscal year ended March 31, 2021.
A-10
Cross-border outstandings
Cross-border outstandings are defined as loans (including accrued interest), acceptances, interest-bearing deposits with other banks, other interest-bearing investments and any other monetary assets denominated in Japanese yen or other
non-local
currencies. This cross-border disclosure is based on the reports to the Bank of Japan required under Japanese foreign exchange-related law. Local currency outstandings are netted out from cross-border outstandings.
The following table sets forth the cross-border outstandings to borrowers in countries with respect to which the total of such outstandings exceeded 0.75% of consolidated total assets at March 31, 2019, 2020 and 2021:
|
Public
institutions
|
Banks
|
Others
|
Total
|
% of total
assets
|
Undrawn
commitments
|
|||||||||||||||||||
|
(in billions of yen, except percentages)
|
||||||||||||||||||||||||
|
2019
|
||||||||||||||||||||||||
|
United States
|
1,440 | 352 | 3,966 | 5,758 | 2.91 | % | 7,847 | |||||||||||||||||
|
United Kingdom
|
10 | 664 | 2,829 | 3,503 | 1.77 | % | 1,210 | |||||||||||||||||
|
France
|
1,475 | 177 | 955 | 2,607 | 1.32 | % | 619 | |||||||||||||||||
|
2020
|
||||||||||||||||||||||||
|
United States
|
5,085 | 621 | 7,324 | 13,030 | 6.17 | % | 7,014 | |||||||||||||||||
|
United Kingdom
|
6 | 570 | 3,815 | 4,391 | 2.08 | % | 893 | |||||||||||||||||
|
France
|
734 | 278 | 1,406 | 2,418 | 1.15 | % | 629 | |||||||||||||||||
|
2021
|
||||||||||||||||||||||||
|
United States
|
4,007 | 513 | 10,787 | 15,307 | 6.91 | % | 8,459 | |||||||||||||||||
|
United Kingdom
|
29 | 397 | 2,862 | 3,288 | 1.48 | % | 1,393 | |||||||||||||||||
|
France
|
367 | 189 | 1,589 | 2,145 | 0.97 | % | 931 | |||||||||||||||||
A-11
IV. Summary of loan loss experience
The following table shows an analysis of loan loss experience by domicile and industry of borrower for the fiscal years ended March 31, 2017, 2018, 2019, 2020 and 2021:
|
2017
|
2018
|
2019
|
2020
|
2021
|
||||||||||||||||
|
(in billions of yen, except percentages)
|
||||||||||||||||||||
|
Allowance for credit losses on loans at beginning of fiscal year
|
451 | 480 | 310 | 307 | 441 | |||||||||||||||
|
April 1,2020 adoption of CECL
|
— | — | — | — | 156 | |||||||||||||||
|
|
|
|
|
|
|
|
|
|
|
|||||||||||
|
Adjusted Balance at beginning of period
|
451 | 480 | 310 | 307 | 597 | |||||||||||||||
|
Provision (credit) for credit losses on loans
|
38 | (126 | ) | 32 | 156 | 113 | ||||||||||||||
|
|
|
|
|
|
|
|
|
|
|
|||||||||||
|
Charge-offs:
|
||||||||||||||||||||
|
Domestic:
|
||||||||||||||||||||
|
Manufacturing
|
2 | 6 | 4 | 6 | 19 | |||||||||||||||
|
Construction and real estate
|
1 | — | 1 | 1 | 1 | |||||||||||||||
|
Services
|
3 | 5 | 2 | 2 | 4 | |||||||||||||||
|
Wholesale and retail
|
6 | 12 | 10 | 16 | 10 | |||||||||||||||
|
Transportation and communications
|
1 | 1 | — | 1 | 3 | |||||||||||||||
|
Other industries
|
— | — | 2 | — | — | |||||||||||||||
|
Individuals
|
7 | 5 | 5 | 5 | 4 | |||||||||||||||
|
|
|
|
|
|
|
|
|
|
|
|||||||||||
|
Total domestic
|
20 | 29 | 24 | 31 | 41 | |||||||||||||||
|
Total foreign
|
11 | 27 | 24 | 13 | 38 | |||||||||||||||
|
|
|
|
|
|
|
|
|
|
|
|||||||||||
|
Total charge-offs
|
31 | 56 | 48 | 44 | 79 | |||||||||||||||
|
|
|
|
|
|
|
|
|
|
|
|||||||||||
|
Recoveries:
|
||||||||||||||||||||
|
Domestic:
|
||||||||||||||||||||
|
Manufacturing
|
1 | 1 | 1 | 1 | 1 | |||||||||||||||
|
Construction and real estate
|
2 | 1 | 1 | 20 | — | |||||||||||||||
|
Services
|
1 | 2 | 1 | 1 | — | |||||||||||||||
|
Wholesale and retail
|
5 | 1 | 3 | 4 | 2 | |||||||||||||||
|
Transportation and communications
|
4 | — | — | — | — | |||||||||||||||
|
Banks and other financial institutions
|
— | 1 | — | — | — | |||||||||||||||
|
Individuals
|
3 | 2 | 1 | 1 | 1 | |||||||||||||||
|
|
|
|
|
|
|
|
|
|
|
|||||||||||
|
Total domestic
|
16 | 8 | 7 | 27 | 4 | |||||||||||||||
|
Total foreign
|
10 | 7 | 7 | 1 | 10 | |||||||||||||||
|
|
|
|
|
|
|
|
|
|
|
|||||||||||
|
Total recoveries
|
26 | 15 | 14 | 28 | 14 | |||||||||||||||
|
|
|
|
|
|
|
|
|
|
|
|||||||||||
|
Net charge-offs
|
5 | 41 | 34 | 16 | 65 | |||||||||||||||
|
|
|
|
|
|
|
|
|
|
|
|||||||||||
|
Others
(Note)
|
(4 | ) | (3 | ) | (1 | ) | (6 | ) | 6 | |||||||||||
|
Balance at end of fiscal year
|
480 | 310 | 307 | 441 | 651 | |||||||||||||||
|
|
|
|
|
|
|
|
|
|
|
|||||||||||
|
Ratio of net charge-offs to average loans outstanding
|
0.01 | % | 0.05 | % | 0.04 | % | 0.02 | % | 0.07 | % | ||||||||||
|
|
|
|
|
|
|
|
|
|
|
|||||||||||
Note: Others includes primarily foreign exchange translation.
A-12
The following table shows an allocation of the MHFG Group’s allowance for credit losses by on loans domicile and industry of borrower at March 31, 2017, 2018, 2019, 2020 and 2021:
|
2017
|
2018
|
2019
|
2020
|
2021
|
||||||||||||||||||||||||||||||||||||
|
Amount
|
% of
loans in
each
category
to total
loans
|
Amount
|
% of
loans in
each
category
to total
loans
|
Amount
|
% of
loans in
each
category
to total
loans
|
Amount
|
% of
loans in
each
category
to total
loans
|
Amount
|
% of
loans in
each
category
to total
loans
|
|||||||||||||||||||||||||||||||
|
(in billions of yen, except percentages)
|
||||||||||||||||||||||||||||||||||||||||
|
Domestic:
|
||||||||||||||||||||||||||||||||||||||||
|
Manufacturing
|
201 | 10.59 | % | 85 | 9.74 | % | 75 | 11.52 | % | 135 | 11.10 | % | 233 | 12.41 | % | |||||||||||||||||||||||||
|
Construction and real estate
|
20 | 9.40 | % | 17 | 9.68 | % | 18 | 10.79 | % | 40 | 10.95 | % | 40 | 11.82 | % | |||||||||||||||||||||||||
|
Services
|
28 | 5.62 | % | 20 | 5.88 | % | 23 | 6.05 | % | 34 | 6.84 | % | 90 | 7.22 | % | |||||||||||||||||||||||||
|
Wholesale and retail
|
63 | 6.22 | % | 52 | 6.11 | % | 48 | 6.22 | % | 69 | 5.95 | % | 56 | 6.04 | % | |||||||||||||||||||||||||
|
Transportation and communications
|
10 | 4.33 | % | 10 | 4.34 | % | 17 | 4.45 | % | 12 | 4.37 | % | 31 | 4.38 | % | |||||||||||||||||||||||||
|
Banks and other financial institutions
|
13 | 4.96 | % | 20 | 5.41 | % | 4 | 5.24 | % | 6 | 5.29 | % | 21 | 5.29 | % | |||||||||||||||||||||||||
|
Other industries
(Note)
|
6 | 15.72 | % | 7 | 16.61 | % | 11 | 9.44 | % | 14 | 8.66 | % | 19 | 8.80 | % | |||||||||||||||||||||||||
|
Individuals
|
34 | 13.10 | % | 25 | 12.35 | % | 20 | 11.88 | % | 20 | 10.75 | % | 75 | 10.12 | % | |||||||||||||||||||||||||
|
Mortgage loans
|
27 | 12.08 | % | 19 | 11.29 | % | 15 | 10.79 | % | 13 | 9.77 | % | 67 | 9.23 | % | |||||||||||||||||||||||||
|
Other
|
7 | 1.02 | % | 6 | 1.06 | % | 5 | 1.09 | % | 7 | 0.98 | % | 8 | 0.89 | % | |||||||||||||||||||||||||
|
|
|
|
|
|
|
|
|
|
|
|
|
|
|
|
|
|
|
|
|
|||||||||||||||||||||
|
Total domestic
|
375 | 69.94 | % | 236 | 70.12 | % | 216 | 65.59 | % | 330 | 63.91 | % | 565 | 66.08 | % | |||||||||||||||||||||||||
|
Total foreign
|
105 | 30.06 | % | 74 | 29.88 | % | 91 | 34.41 | % | 111 | 36.09 | % | 86 | 33.92 | % | |||||||||||||||||||||||||
|
|
|
|
|
|
|
|
|
|
|
|
|
|
|
|
|
|
|
|
|
|||||||||||||||||||||
|
Total allowance for credit losses on loans
|
480 | 100.00 | % | 310 | 100.00 | % | 307 | 100.00 | % | 441 | 100.00 | % | 651 | 100.00 | % | |||||||||||||||||||||||||
|
|
|
|
|
|
|
|
|
|
|
|
|
|
|
|
|
|
|
|
|
|||||||||||||||||||||
Note: Other industries includes government and public institutions.
A-13
V. Deposits
The following table shows the average amount of, and the average rate on, the following deposit categories for the fiscal years ended March 31, 2019, 2020 and 2021:
|
2019
|
2020
|
2021
|
||||||||||||||||||||||
|
Average
amount
|
Average
rate
|
Average
amount
|
Average
rate
|
Average
amount
|
Average
rate
|
|||||||||||||||||||
|
(in billions of yen, except percentages)
|
||||||||||||||||||||||||
|
Domestic offices:
|
||||||||||||||||||||||||
|
Noninterest-bearing demand deposits
|
22,116 | — | % | 23,219 | — | % | 26,604 | — | % | |||||||||||||||
|
Interest-bearing demand deposits
|
53,700 | 0.02 | % | 57,080 | 0.02 | % | 62,739 | — | % | |||||||||||||||
|
Time deposits
|
26,424 | 0.31 | % | 21,943 | 0.36 | % | 19,837 | 0.12 | % | |||||||||||||||
|
Certificates of deposit
|
7,044 | 0.01 | % | 8,120 | 0.01 | % | 10,185 | 0.01 | % | |||||||||||||||
|
|
|
|
|
|
|
|||||||||||||||||||
|
Foreign offices:
|
||||||||||||||||||||||||
|
Noninterest-bearing demand deposits
|
1,750 | — | % | 2,093 | — | % | 2,112 | — | % | |||||||||||||||
|
Interest-bearing deposits, principally time deposits
|
20,169 | 1.93 | % | 20,957 | 1.90 | % | 24,573 | 0.44 | % | |||||||||||||||
|
Certificates of deposit
|
6,524 | 1.99 | % | 6,550 | 1.93 | % | 6,497 | 0.41 | % | |||||||||||||||
|
|
|
|
|
|
|
|||||||||||||||||||
|
Total
|
137,727 | 0.45 | % | 139,962 | 0.44 | % | 152,547 | 0.11 | % | |||||||||||||||
|
|
|
|
|
|
|
|||||||||||||||||||
The total amounts of deposits by foreign depositors in domestic offices at March 31, 2019, 2020 and 2021 were ¥1,625 billion, ¥1,512 billion and ¥1,298 billion, respectively.
At March 31, 2021, the balance and remaining maturities of time deposits and certificates of deposit issued by domestic offices in amounts of ¥10 million (approximately US$90 thousand at the Federal Reserve Bank of New York’s noon buying rate on March 31, 2021) or more and the balances of these deposits issued by foreign offices in amounts of US$100,000 or more are shown in the following table:
|
Time
deposits
|
Certificates of
deposit
|
Total
|
||||||||||
|
(in billions of yen)
|
||||||||||||
|
Domestic offices:
|
||||||||||||
|
Due in three months or less
|
5,480 | 8,870 | 14,350 | |||||||||
|
Due after three months through six months
|
2,447 | 1,074 | 3,521 | |||||||||
|
Due after six months through twelve months
|
2,893 | 501 | 3,394 | |||||||||
|
Due after twelve months
|
1,038 | 154 | 1,192 | |||||||||
|
|
|
|
|
|
|
|||||||
|
Total
|
11,858 | 10,599 | 22,457 | |||||||||
|
Foreign offices
|
14,979 | 6,594 | 21,573 | |||||||||
|
|
|
|
|
|
|
|||||||
|
Total
|
26,837 | 17,193 | 44,030 | |||||||||
|
|
|
|
|
|
|
|||||||
A-14
VI. Short-term borrowings
The following table shows certain additional information with respect to the MHFG Group’s short-term borrowings for the fiscal years ended March 31, 2019, 2020 and 2021:
|
2019
|
2020
|
2021
|
||||||||||
|
(in billions of yen, except percentages)
|
||||||||||||
|
Due to trust accounts:
|
||||||||||||
|
Average balance outstanding during the fiscal year
|
2,534 | 377 | 470 | |||||||||
|
Maximum balance outstanding at any
month-end
during the fiscal year
|
4,125 | 452 | 618 | |||||||||
|
Balance at end of fiscal year
|
312 | 250 | 381 | |||||||||
|
Weighted average interest rate during the fiscal year
|
0.02 | % | 0.15 | % | 0.16 | % | ||||||
|
Weighted average interest rate on balance at end of fiscal year
|
0.21 | % | 0.22 | % | 0.15 | % | ||||||
|
Call money and funds purchased, and payables under repurchase agreements and securities lending transactions:
|
||||||||||||
|
Average balance outstanding during the fiscal year
|
24,609 | 23,691 | 26,761 | |||||||||
|
Maximum balance outstanding at any
month-end
during the fiscal year
|
27,694 | 22,616 | 24,994 | |||||||||
|
Balance at end of fiscal year
|
19,280 | 21,658 | 21,128 | |||||||||
|
Weighted average interest rate during the fiscal year
|
1.60 | % | 1.55 | % | 0.21 | % | ||||||
|
Weighted average interest rate on balance at end of fiscal year
|
1.53 | % | 1.15 | % | 0.11 | % | ||||||
|
Other short-term borrowings:
|
||||||||||||
|
Average balance outstanding during the fiscal year
|
1,962 | 1,962 | 8,138 | |||||||||
|
Maximum balance outstanding at any
month-end
during the fiscal year
|
2,091 | 4,914 | 9,629 | |||||||||
|
Balance at end of fiscal year
|
1,995 | 4,914 | 9,086 | |||||||||
|
Weighted average interest rate during the fiscal year
|
1.67 | % | 1.49 | % | 0.22 | % | ||||||
|
Weighted average interest rate on balance at end of fiscal year
|
1.99 | % | 0.63 | % | 0.12 | % | ||||||
A-15
MIZUHO FINANCIAL GROUP, INC.
Index to Consolidated Financial Statements
|
Page
|
||||
|
Consolidated Financial Statements of Mizuho Financial Group, Inc. and Subsidiaries
|
||||
| F-8 | ||||
| F-10 | ||||
| F-11 | ||||
| F-12 | ||||
| F-13 | ||||
| F-15 | ||||
F-1
Report of Independent Registered Public Accounting Firm
To the Shareholders and the Board of Directors
of Mizuho Financial Group, Inc.
Opinion on the Financial Statements
We have audited the accompanying consolidated balance sheets of Mizuho Financial Group, Inc. and subsidiaries (the “Company”) as of March 31, 2021 and 2020, the related consolidated statements of income, comprehensive income, equity and cash flows for each of the three years in the period ended March 31, 2021, and the related notes (collectively referred to as the “consolidated financial statements”). In our opinion, the consolidated financial statements present fairly, in all material respects, the financial position of the Company at March 31, 2021 and 2020, and the results of its operations and its cash flows for each of the three years in the period ended March 31, 2021, in conformity with U.S. generally accepted accounting principles.
We also have audited, in accordance with the standards of the Public Company Accounting Oversight Board (United States) (PCAOB), the Company’s internal control over financial reporting as of March 31, 2021, based on criteria established in Internal Control-Integrated Framework issued by the Committee of Sponsoring Organizations of the Treadway Commission (2013 framework) and our report dated July 2, 2021 expressed an unqualified opinion thereon.
Adoption of New Accounting Standard
As discussed in Notes 1 and 2 to the consolidated financial statements, the Company changed its method for accounting for credit losses in the year ended March 31, 2021. As explained below, auditing the Company’s allowance for credit losses, was a critical audit matter.
Basis for Opinion
These financial statements are the responsibility of the Company’s management. Our responsibility is to express an opinion on the Company’s financial statements based on our audits. We are a public accounting firm registered with the PCAOB and are required to be independent with respect to the Company in accordance with the U.S. federal securities laws and the applicable rules and regulations of the Securities and Exchange Commission and the PCAOB.
We conducted our audits in accordance with the standards of the PCAOB. Those standards require that we plan and perform the audit to obtain reasonable assurance about whether the financial statements are free of material misstatement, whether due to error or fraud. Our audits included performing procedures to assess the risks of material misstatement of the financial statements, whether due to error or fraud, and performing procedures that respond to those risks. Such procedures included examining, on a test basis, evidence regarding the amounts and disclosures in the financial statements. Our audits also included evaluating the accounting principles used and significant estimates made by management, as well as evaluating the overall presentation of the financial statements. We believe that our audits provide a reasonable basis for our opinion.
Critical Audit Matters
The critical audit matters communicated below are matters arising from the current period audit of the financial statements that were communicated or required to be communicated to the audit committee and that: (1) relate to accounts or disclosures that are material to the financial statements and (2) involved our especially challenging, subjective or complex judgments. The communication of critical audit matters does not alter in any way our opinion on the consolidated financial statements, taken as a whole, and we are not, by communicating the critical audit matters below, providing separate opinions on the critical audit matters or on the accounts or disclosures to which they relate.
F-2
|
Allowance for Credit Losses
|
||
|
Description of the Matter
|
The Company’s loan portfolio and the associated allowance for credit losses (ACL) for the loan portfolio, were JPY 88,581 billion and JPY 651 billion as of March 31, 2021, respectively. As discussed in Notes 1 and 5 to the consolidated financial statements, the allowance for credit losses involves significant judgment on a number of matters including expectations of future economic conditions, assignment of obligor ratings, valuation of collateral, and the development of qualitative adjustments. When determining expected credit losses, a single forward-looking macroeconomic scenario is considered over a reasonable and supportable forecast period. In terms of the internal risk ratings, for the corporate portfolio segment, the credit quality review process and the credit rating process serve as the basis for determining the allowance for credit losses on loans. Through such processes loans are categorized into groups to reflect the probability of default (PD), whereby the Company’s management assesses the ability of borrowers to service their debt, taking into consideration current financial information, ability to generate cash, historical payment experience, analysis of relevant industry segments and current trends. For the retail portfolio segment, the different categories of past due status of loans are primarily utilized in the credit quality review and the credit rating processes as the basis for determining the allowance for credit losses on loans. The quantitative calculation covers expected credit losses over an instrument’s expected life and is estimated by applying credit loss factors to the Company’s estimated exposure at default (EAD). The credit loss factors incorporate the PD as well as the loss given default (LGD) based on the historical loss rates. To supplement the historical loss data for overseas obligors, external credit ratings such as S&P are also used to calculate the PD.
The Company’s methodology for determining the appropriate ACL on loans also considers the imprecision inherent in the methodologies used. As a result, the amounts determined under the methodologies described above are adjusted by management to consider the potential impact of other qualitative factors which include, but are not limited to, imprecision in macroeconomic scenario assumptions and emerging risks related to changes in the environment that are affecting specific portfolio segments. The Company incorporated the estimated impact of
COVID-19
pandemic into the macroeconomic scenario by using assumptions such as anticipated business recovery period and current forecast for the growth rate of gross domestic product.
Auditing management’s loan ACL estimate is challenging and complex due to the models used to estimate the PD, LGD and EAD which incorporate a forward-looking macroeconomic scenario and subjective nature of the qualitative factors which require auditor judgment. Therefore, professionals with specialized skills and knowledge as well as experience in the industry are necessary.
|
|
|
How We Addressed the Matter in Our Audit
|
We obtained an understanding, evaluated the design and tested the operating effectiveness of the controls over the Company’s process for establishing the loan ACL, including management’s controls over (i) selection and implementation of forward-looking macro-economic factors used in determining PD, LGD and EAD, (ii) expected loss models and methodologies used in quantitative calculations, including model validation, (iii) completeness and accuracy of key inputs and assumptions used in quantitative calculations and (iv) adjustments to reflect management’s consideration of qualitative factors.
With the support of our specialists, we assessed the macro-economic scenario by, among other procedures, evaluating management’s methodology and agreeing a
|
|
F-3
|
sample of key economic factors used to external sources. We also performed and considered the results of various sensitivity analyses and analytical procedures, including comparison of a sample of the key economic factors to alternative external sources, historical statistics and peer bank information.
With respect to expected loss models, with the support of our specialists, we evaluated model calculation design
and re-performed the
calculation for a sample of models. We also tested the appropriateness of key inputs and assumptions used in these models by agreeing a sample of inputs to internal sources, including historical loss statistics.
Regarding management’s qualitative adjustments to the quantitative calculation, with support of our specialists, we evaluated the macro-economic factors and emerging risks related to changes in the environment impacting specific portfolio segments. We also evaluated and tested internal and external data used in the qualitative adjustments by agreeing significant inputs and underlying data to internal and external sources, when available, that corroborated or contradicted management’s assumptions used in the qualitative adjustments.
We evaluated the overall loan ACL amount, including model estimates and qualitative adjustments to the quantitative calculation, and whether the ACL appropriately reflects expected credit losses on the loan portfolio. We reviewed peer-bank information, subsequent events and transactions including changes to the obligor ratings and other credit trends and considered whether they corroborate or contradict the Company’s measurement of the ACL.
|
||
|
Valuation of Certain Level 3 Financial Instruments
|
||
|
Description of the Matter
|
As described in Notes 1 and 27 to the consolidated financial statements, the Company carries various types of
over-the-counter
Auditing management’s determination of the valuation of certain level 3 financial instruments is challenging because the determination of certain significant unobservable inputs requires significant judgment and effort in performing procedures related to valuing these instruments.
|
|
|
How We Addressed the Matter in Our Audit
|
We obtained an understanding, evaluated the design and tested the operating effectiveness of the controls over the Company’s derivatives and debt fair valuation processes. The controls tested included, but were not limited to, controls over significant inputs included in the fair value measurements and controls over the appropriateness of the valuation techniques utilized within the internally developed valuation models. | |
F-4
|
Our audit procedures included, among others, evaluating the valuation techniques used, testing certain significant unobservable inputs used, comparing the Company’s valuation inputs to independent, third-party market information, where available, and testing the mathematical accuracy of the Company’s valuation calculation. We involved our specialists to evaluate certain significant unobservable inputs, the sensitivity of the inputs and the valuation techniques utilized within the internally developed valuation models.
|
/s/ Ernst & Young ShinNihon LLC
We have served as the Company’s auditor for SEC reporting purposes since 2006, and as its Japanese statutory auditor since 2000, which included the years we served as joint auditors.
Tokyo, Japan
July 2, 2021
F-5
Report of Independent Registered Public Accounting Firm
To the Shareholders and the Board of Directors
of Mizuho Financial Group, Inc.
Opinion on Internal Control Over Financial Reporting
We have audited Mizuho Financial Group, Inc. and subsidiaries’ internal control over financial reporting as of March 31, 2021, based on criteria established in Internal Control—Integrated Framework issued by the Committee of Sponsoring Organizations of the Treadway Commission (2013 framework) (the COSO criteria). In our opinion, Mizuho Financial Group, Inc. and subsidiaries (the Company) maintained, in all material respects, effective internal control over financial reporting as of March 31, 2021, based on the COSO criteria.
We also have audited, in accordance with the standards of the Public Company Accounting Oversight Board (United States) (PCAOB), the consolidated balance sheets of the Company as of March 31, 2021 and 2020, the related consolidated statements of income, comprehensive income, equity and cash flows for each of the three years in the period ended March 31, 2021, and the related notes and our report dated July 2, 2021 expressed an unqualified opinion thereon.
Basis for Opinion
The Company’s management is responsible for maintaining effective internal control over financial reporting and for its assessment of the effectiveness of internal control over financial reporting included in the accompanying Management’s Annual Report on Internal Control over Financial Reporting. Our responsibility is to express an opinion on the Company’s internal control over financial reporting based on our audit. We are a public accounting firm registered with the PCAOB and are required to be independent with respect to the Company in accordance with the U.S. federal securities laws and the applicable rules and regulations of the Securities and Exchange Commission and the PCAOB.
We conducted our audit in accordance with the standards of the PCAOB. Those standards require that we plan and perform the audit to obtain reasonable assurance about whether effective internal control over financial reporting was maintained in all material respects.
Our audit included obtaining an understanding of internal control over financial reporting, assessing the risk that a material weakness exists, testing and evaluating the design and operating effectiveness of internal control based on the assessed risk, and performing such other procedures as we considered necessary in the circumstances. We believe that our audit provides a reasonable basis for our opinion.
Definition and Limitations of Internal Control Over Financial Reporting
A company’s internal control over financial reporting is a process designed to provide reasonable assurance regarding the reliability of financial reporting and the preparation of financial statements for external purposes in accordance with generally accepted accounting principles. A company’s internal control over financial reporting includes those policies and procedures that (1) pertain to the maintenance of records that, in reasonable detail, accurately and fairly reflect the transactions and dispositions of the assets of the company; (2) provide reasonable assurance that transactions are recorded as necessary to permit preparation of financial statements in accordance with generally accepted accounting principles, and that receipts and expenditures of the company are being made only in accordance with authorizations of management and directors of the company; and (3) provide reasonable assurance regarding prevention or timely detection of unauthorized acquisition, use, or disposition of the company’s assets that could have a material effect on the financial statements.
F-6
Because of its inherent limitations, internal control over financial reporting may not prevent or detect misstatements. Also, projections of any evaluation of effectiveness to future periods are subject to the risk that controls may become inadequate because of changes in conditions, or that the degree of compliance with the policies or procedures may deteriorate.
/s/ Ernst & Young ShinNihon LLC
Tokyo, Japan
July 2, 2021
F-7
MIZUHO FINANCIAL GROUP, INC. AND SUBSIDIARIES
CONSOLIDATED BALANCE SHEETS
MARCH 31, 2020 AND 2021
|
|
2020
|
|
|
2021
|
|
|||
|
|
(in millions of yen)
|
|
||||||
|
Assets:
|
||||||||
|
Cash and due from banks
|
|
|
||||||
|
Interest-bearing deposits in other banks
|
|
|
||||||
|
Call loans and funds sold
|
|
|
||||||
|
Receivables under resale agreements
|
|
|
||||||
|
Receivables under securities borrowing transactions
|
|
|
||||||
|
Trading account assets (including assets pledged that secured parties are permitted to sell or repledge of ¥
|
|
|
||||||
|
Investments (Note 3):
|
||||||||
|
Available-for-sale
|
|
|
||||||
|
Held-to-maturity
|
|
|
||||||
|
Equity securities
|
|
|
||||||
|
Other investments
|
|
|
||||||
|
Loans (Notes 4 and 5)
|
|
|
||||||
|
Allowance for credit losses on loans
|
(
|
) |
(
|
) | ||||
|
|
|
|
|
|||||
|
Loans, net of allowance
|
|
|
||||||
|
Premises and equipment—net (Note 6)
|
|
|
||||||
|
Due from customers on acceptances
|
|
|
||||||
|
Accrued income
|
|
|
||||||
|
Goodwill (Note 7)
|
|
|
||||||
|
Intangible assets (Note 7)
|
|
|
||||||
|
Deferred tax assets
|
|
|
||||||
|
Other assets (Note 12)
|
|
|
||||||
|
|
|
|
|
|||||
|
Total assets
|
|
|
||||||
|
|
|
|
|
|||||
| The following table presents the assets of consolidated variable interest entities (“VIE”s), which are included in the consolidated balance sheets above. The assets in the table below can be used only to settle obligations of consolidated VIEs. |
|
|||||||
|
2020
|
2021
|
|||||||
|
(in millions of yen)
|
||||||||
|
Assets of consolidated VIEs:
|
||||||||
|
Cash and due from banks
|
|
|
||||||
|
Interest-bearing deposits in other banks
|
|
|
||||||
|
Call loans and funds sold
|
|
|
||||||
|
Trading account assets
|
|
|
||||||
|
Investments
|
|
|
||||||
|
Loans, net of allowance
|
|
|
||||||
|
All other assets
|
|
|
||||||
|
|
|
|
|
|||||
|
Total assets
|
|
|
||||||
|
|
|
|
|
|||||
See the accompanying Notes to the Consolidated Financial Statements.
F-
8
MIZUHO FINANCIAL GROUP, INC. AND SUBSIDIARIES
CONSOLIDATED BALANCE SHEETS—(Continued)
MARCH 31, 2020 AND 2021
|
2020
|
2021
|
|||||||
|
(in millions of yen)
|
||||||||
|
Liabilities and equity:
|
||||||||
|
Deposits:
|
||||||||
|
Domestic:
|
||||||||
|
Noninterest-bearing deposits
|
|
|
||||||
|
Interest-bearing deposits
|
|
|
||||||
|
Foreign:
|
||||||||
|
Noninterest-bearing deposits
|
|
|
||||||
|
Interest-bearing deposits
|
|
|
||||||
|
Due to trust accounts
|
|
|
||||||
|
Call money and funds purchased
|
|
|
||||||
|
Payables under repurchase agreements (Note 29)
|
|
|
||||||
|
Payables under securities lending transactions (Note 29)
|
|
|
||||||
|
Other short-term borrowings (Note 11)
|
|
|
||||||
|
Trading account liabilities
|
|
|
||||||
|
Bank acceptances outstanding
|
|
|
||||||
|
Income taxes payable
|
|
|
||||||
|
Deferred tax liabilities
|
|
|
||||||
|
Accrued expenses
|
|
|
||||||
|
Long-term debt (including liabilities accounted for at fair value of ¥
|
|
|
||||||
|
Other liabilities (Note 12)
|
|
|
||||||
|
|
|
|
|
|||||
|
Total liabilities
|
|
|
||||||
|
|
|
|
|
|||||
|
Commitments and contingencies (Note 23)
|
|
|
||||||
|
Equity:
|
||||||||
|
MHFG shareholders’ equity:
|
||||||||
|
Common stock (Note 14)—
|
|
|
||||||
|
Retained earnings
|
|
|
||||||
|
Accumulated other comprehensive income (loss), net of tax (Note 16)
|
(
|
) |
|
|||||
|
Less: Treasury stock, at cost—Common stock
20
, and
1
|
(
|
) |
(
|
) | ||||
|
|
|
|
|
|||||
|
Total MHFG shareholders’ equity
|
|
|
||||||
|
Noncontrolling interests
|
|
|
||||||
|
|
|
|
|
|||||
|
Total equity
|
|
|
||||||
|
|
|
|
|
|||||
|
Total liabilities and equity
|
|
|
||||||
|
|
|
|
|
|||||
The following table presents the liabilities of consolidated VIEs, which are included in the consolidated balance sheets above. The creditors or investors of the consolidated VIEs have no recourse to the MHFG Group, except where the Group provides credit enhancement through guarantees or other means.
|
2020
|
2021
|
|||||||
|
(in millions of yen)
|
||||||||
|
Liabilities of consolidated VIEs:
|
||||||||
|
Payables under securities lending transactions
|
|
|
||||||
|
Other short-term borrowings
|
|
|
||||||
|
Trading account liabilities
|
|
|
||||||
|
Long-term debt
|
|
|
||||||
|
All other liabilities
|
|
|
||||||
|
|
|
|
|
|||||
|
Total liabilities
|
|
|
||||||
|
|
|
|
|
|||||
See the accompanying Notes to the Consolidated Financial Statements.
F-
9
MIZUHO FINANCIAL GROUP, INC. AND SUBSIDIARIES
CONSOLIDATED STATEMENTS OF INCOME
FOR THE FISCAL YEARS ENDED MARCH 31, 2019, 2020 AND 2021
|
|
|
2019
|
|
|
2020
|
|
|
2021
|
|
|||
|
|
|
(in millions of yen)
|
|
|||||||||
|
Interest and dividend income:
|
||||||||||||
|
Loans, including fees
|
|
|
|
|||||||||
|
Investments:
|
||||||||||||
|
Interest
|
|
|
|
|||||||||
|
Dividends
|
|
|
|
|||||||||
|
Trading account assets
|
|
|
|
|||||||||
|
Call loans and funds sold
|
|
|
|
|||||||||
|
Receivables under resale agreements and securities borrowing transactions
|
|
|
|
|||||||||
|
Deposits in other banks
|
|
|
|
|||||||||
|
|
|
|
|
|
|
|||||||
|
Total interest and dividend income
|
|
|
|
|||||||||
|
|
|
|
|
|
|
|||||||
|
Interest expense:
|
||||||||||||
|
Deposits
|
|
|
|
|||||||||
|
Trading account liabilities
|
|
|
|
|||||||||
|
Call money and funds purchased
|
|
|
|
|||||||||
|
Payables under repurchase agreements and securities lending transactions
|
|
|
|
|||||||||
|
Other short-term borrowings
|
|
|
|
|||||||||
|
Long-term debt
|
|
|
|
|||||||||
|
|
|
|
|
|
|
|||||||
|
Total interest expense
|
|
|
|
|||||||||
|
|
|
|
|
|
|
|||||||
|
Net interest income
|
|
|
|
|||||||||
|
Provision (credit) for credit losses (Note 3 and 5)
|
|
|
|
|||||||||
|
|
|
|
|
|
|
|||||||
|
Net interest income after provision (credit) for credit losses
|
|
|
|
|||||||||
|
|
|
|
|
|
|
|||||||
|
Noninterest income (Note 25):
|
||||||||||||
|
Fee and commission income
|
|
|
|
|||||||||
|
Foreign exchange gains (losses)—net (Note 26)
|
|
|
|
|||||||||
|
Trading account gains (losses)—net (Note 26)
|
|
|
|
|||||||||
|
Investment gains (losses)—net:
|
||||||||||||
|
Debt securities
|
(
|
) |
|
(
|
)
|
|||||||
|
Equity securities
|
(
|
)
|
(
|
)
|
|
|||||||
|
Equity in earnings (losses) of equity method investees—net
|
|
|
|
|||||||||
|
Gains on disposal of premises and equipment
|
|
|
|
|||||||||
|
Other noninterest income
|
|
|
|
|||||||||
|
|
|
|
|
|
|
|||||||
|
Total noninterest income
|
|
|
|
|||||||||
|
|
|
|
|
|
|
|||||||
|
Noninterest expenses:
|
||||||||||||
|
Salaries and employee benefits
|
|
|
|
|||||||||
|
General and administrative expenses
|
|
|
|
|||||||||
|
Occupancy expenses
|
|
|
|
|||||||||
|
Fee and commission expenses
|
|
|
|
|||||||||
|
Provision (credit) for credit losses on
off-balance-sheet
instruments
|
(
|
) |
|
|
||||||||
|
Other noninterest expenses
|
|
|
|
|||||||||
|
|
|
|
|
|
|
|||||||
|
Total noninterest expenses
|
|
|
|
|||||||||
|
|
|
|
|
|
|
|||||||
|
Income before income tax expense
|
|
|
|
|||||||||
|
Income tax expense (Note 19)
|
|
|
|
|||||||||
|
|
|
|
|
|
|
|||||||
|
Net income
|
|
|
|
|||||||||
|
Less: Net income (loss) attributable to noncontrolling interests
|
(
|
) |
(
|
) |
|
|||||||
|
|
|
|
|
|
|
|||||||
|
Net income attributable to MHFG shareholders
|
|
|
|
|||||||||
|
|
|
|
|
|
|
|||||||
|
Earnings per common share (Note 18):
|
(in yen)
|
|||||||||||
|
Basic net income per common share
|
|
|
|
|||||||||
|
|
|
|
|
|
|
|||||||
|
Diluted net income per common share
|
|
|
|
|||||||||
|
|
|
|
|
|
|
|||||||
|
Dividends per share:
|
||||||||||||
|
Class XI preferred stock
|
— | — |
|
|||||||||
|
Common stock
|
|
|
|
|||||||||
|
|
|
|
|
|
|
|||||||
See the accompanying Notes to the Consolidated Financial Statements.
F-
10
MIZUHO FINANCIAL GROUP, INC. AND SUBSIDIARIES
CONSOLIDATED STATEMENTS OF COMPREHENSIVE INCOME
FOR THE FISCAL YEARS ENDED MARCH 31, 2019, 2020 AND 2021
|
|
|
2019
|
|
|
2020
|
|
|
2021
|
|
|||
|
|
|
(in millions of yen)
|
|
|||||||||
|
Net income
(Note)
|
|
|
|
|||||||||
|
|
|
|
|
|
|
|||||||
|
Other comprehensive income (loss), net of tax:
|
||||||||||||
|
Net unrealized gains (losses) on
available-for-sale
|
(
|
)
|
(
|
)
|
|
|||||||
|
Foreign currency translation adjustments, net of tax
|
(
|
) |
(
|
) |
|
|||||||
|
Pension liability adjustments, net of tax
|
(
|
) |
(
|
) |
|
|||||||
|
Own credit risk adjustments, net of tax
|
|
|
(
|
)
|
||||||||
|
|
|
|
|
|
|
|||||||
|
Total other comprehensive income (loss), net of tax
|
(
|
) |
(
|
) |
|
|||||||
|
|
|
|
|
|
|
|||||||
|
Total comprehensive income (loss)
|
|
(
|
) |
|
||||||||
|
Less: Total comprehensive income (loss) attributable to noncontrolling interests
|
(
|
) |
(
|
) |
|
|||||||
|
|
|
|
|
|
|
|||||||
|
Total comprehensive income (loss) attributable to MHFG shareholders
|
|
(
|
) |
|
||||||||
|
|
|
|
|
|
|
|||||||
| Note: |
The amounts that have been reclassified out of Accumulated other comprehensive income (loss), net of tax into net income are presented in Note 16 “Accumulated other comprehensive income (loss), net of tax.”
|
See the accompanying Notes to the Consolidated Financial Statements.
F-
11
MIZUHO FINANCIAL GROUP, INC. AND SUBSIDIARIES
CONSOLIDATED STATEMENTS OF EQUITY
FOR THE FISCAL YEARS ENDED MARCH 31, 2019, 2020 AND 2021
|
|
|
2019
|
|
|
2020
|
|
|
2021
|
|
|||
|
|
|
(in millions of yen)
|
|
|||||||||
|
Common stock:
|
|
|
|
|||||||||
|
Balance at beginning of fiscal year
|
|
|
|
|||||||||
|
Issuance of new shares of common stock due to exercise of stock acquisition rights
|
|
— | — | |||||||||
|
Performance-based stock compensation program
|
(
|
) |
(
|
) |
(
|
) | ||||||
|
Other
|
|
(
|
) |
(
|
) | |||||||
|
|
|
|
|
|
|
|||||||
|
Balance at end of fiscal year
|
|
|
|
|||||||||
|
|
|
|
|
|
|
|||||||
|
Retained earnings:
|
||||||||||||
|
Balance at beginning of fiscal year, previously reported
|
|
|
|
|||||||||
|
Cumulative effect of change in accounting principles, net of tax (Note 2)
|
|
(2)
|
|
(3)
|
(
|
)
(4)
|
||||||
|
Balance at beginning of fiscal year, adjusted
|
|
|
|
|||||||||
|
Net income attributable to MHFG shareholders
|
|
|
|
|||||||||
|
Dividends declared
|
(
|
) |
(
|
) |
(
|
) | ||||||
|
Other
|
— |
(
|
) |
(
|
) | |||||||
|
|
|
|
|
|
|
|||||||
|
Balance at end of fiscal year
|
|
|
|
|||||||||
|
|
|
|
|
|
|
|||||||
|
Accumulated other comprehensive income (loss), net of tax (Note 16)
(1)
:
|
||||||||||||
|
Balance at beginning of fiscal year, previously reported
|
|
|
(
|
) | ||||||||
|
Cumulative effect of change in accounting principles
|
(
|
)
(2)
|
(
|
)
(3)
|
— | |||||||
|
Balance at beginning of fiscal year, adjusted
|
|
|
(
|
) | ||||||||
|
Change during year
|
(
|
) |
(
|
) |
|
|||||||
|
|
|
|
|
|
|
|||||||
|
Balance at end of fiscal year
|
|
(
|
) |
|
||||||||
|
|
|
|
|
|
|
|||||||
|
Treasury stock, at cost:
|
||||||||||||
|
Balance at beginning of fiscal year
|
(
|
) |
(
|
) |
(
|
) | ||||||
|
Purchases of treasury stock
|
(
|
) |
(
|
) |
(
|
) | ||||||
|
Disposal of treasury stock
|
|
|
|
|||||||||
|
|
|
|
|
|
|
|||||||
|
Balance at end of fiscal year
|
(
|
) |
(
|
) |
(
|
) | ||||||
|
|
|
|
|
|
|
|||||||
|
Total MHFG shareholders’ equity
|
|
|
|
|||||||||
|
|
|
|
|
|
|
|||||||
|
Noncontrolling interests:
|
||||||||||||
|
Balance at beginning of fiscal year, previously reported
|
|
|
|
|||||||||
|
Cumulative effect of change in accounting principles
|
(
|
)
(2)
|
— | — | ||||||||
|
Balance at beginning of fiscal year, adjusted
|
|
|
|
|||||||||
|
Transactions between the MHFG Group and the noncontrolling interest shareholders
|
|
(
|
) |
(
|
) | |||||||
|
Dividends paid to noncontrolling interests
|
(
|
) |
(
|
) |
(
|
) | ||||||
|
Net income (loss) attributable to noncontrolling interests
|
(
|
) |
(
|
) |
|
|||||||
|
Other
|
(
|
) |
|
(
|
) | |||||||
|
|
|
|
|
|
|
|||||||
|
Balance at end of fiscal year
|
|
|
|
|||||||||
|
|
|
|
|
|
|
|||||||
|
Total equity
|
|
|
|
|||||||||
|
|
|
|
|
|
|
|||||||
Notes:
| (1) |
The amounts that have been reclassified out of Accumulated other comprehensive income (loss), net of tax into net income are presented in Note 16 “Accumulated other comprehensive income (loss), net of tax.”
|
| (2) |
These amounts resulted mainly from the adoption of ASU
No.2016-01,
“Financial Instruments—Overall (Subtopic
825-10)—Recognition
and Measurement of Financial Assets and Financial Liabilities.”
|
| (3) |
These amounts resulted from the adoption of ASU
No.2017-12,
“Derivatives and Hedging (Topic 815)—Targeted Improvements to Accounting for Hedging Activities.”
|
| (4) |
These amounts resulted from the adoption of ASU
No.2016-13,
“Financial Instruments—Credit Losses (Topic 326)—Measurement of Credit Losses on Financial Instruments” and subsequent amendments. See Note 2 “Issued accounting pronouncements” for further details.
|
See the accompanying Notes to the Consolidated Financial Statements.
F-
12
MIZUHO FINANCIAL GROUP, INC. AND SUBSIDIARIES
CONSOLIDATED STATEMENTS OF CASH FLOWS
FOR THE FISCAL YEARS ENDED MARCH 31, 2019, 2020 AND 2021
|
|
|
2019
|
|
|
2020
|
|
|
2021
|
|
|||
|
|
|
(in millions of yen)
|
|
|||||||||
|
Cash flows from operating activities:
|
|
|
|
|||||||||
|
Net income
|
|
|
|
|||||||||
|
Less: Net income (loss) attributable to noncontrolling interests
|
(
|
) |
(
|
) |
|
|||||||
|
|
|
|
|
|
|
|||||||
|
Net income attributable to MHFG shareholders
|
|
|
|
|||||||||
|
Adjustments to reconcile net income to net cash provided by (used in) operating activities:
|
||||||||||||
|
Depreciation and amortization
|
|
|
|
|||||||||
|
Provision (credit) for credit losses
|
|
|
|
|||||||||
|
Investment losses (gains)—net
|
|
|
(
|
)
|
||||||||
|
Equity in losses (earnings) of equity method investees—net
|
(
|
)
|
(
|
)
|
(
|
)
|
||||||
|
Foreign exchange losses (gains)—net
|
|
(
|
) |
|
||||||||
|
Deferred income tax expense (benefit)
|
(
|
) |
(
|
) |
|
|||||||
|
Net change in trading account assets
|
|
(
|
) |
|
||||||||
|
Net change in trading account liabilities
|
(
|
) |
|
(
|
) | |||||||
|
Net change in loans held for sale
|
|
(
|
) |
|
||||||||
|
Net change in accrued income
|
(
|
) |
|
|
||||||||
|
Net change in accrued expenses
|
|
(
|
) |
(
|
) | |||||||
|
Other—net
|
|
|
|
|||||||||
|
|
|
|
|
|
|
|||||||
|
Net cash provided by (used in) operating activities
|
|
(
|
) |
|
||||||||
|
|
|
|
|
|
|
|||||||
|
Cash flows from investing activities:
|
||||||||||||
|
Proceeds from sales of
Available-for-sale
|
|
|
|
|||||||||
|
Proceeds from sales of Equity securities
(1)
|
|
|
|
|||||||||
|
Proceeds from maturities of
Available-for-sale
|
|
|
|
|||||||||
|
Proceeds from maturities of
Held-to-maturity
|
|
|
|
|||||||||
|
Purchases of
Available-for-sale
|
(
|
) |
(
|
) |
(
|
) | ||||||
|
Purchases of
Held-to-maturity
|
(
|
) | — |
(
|
) | |||||||
|
Purchases of Equity securities
(1)
|
(
|
) |
(
|
) |
(
|
) | ||||||
|
Proceeds from sales of loans
|
|
|
|
|||||||||
|
Net change in loans
|
(
|
) |
(
|
) |
(
|
) | ||||||
|
Net change in call loans and funds sold, and receivables under resale agreements and securities borrowing transactions
|
(
|
) |
(
|
) |
|
|||||||
|
Proceeds from sales of premises and equipment
|
|
|
|
|||||||||
|
Purchases of premises and equipment
|
(
|
) |
(
|
) |
(
|
) | ||||||
|
Proceeds from sales of investments in subsidiaries (affecting the scope of consolidation)
|
|
|
|
|||||||||
|
Purchases of investments in subsidiaries (affecting the scope of consolidation)
|
|
|
—
|
|
|
|
—
|
|
|
|
(
|
)
|
|
Cash outflow from deconsolidation of a subsidiary
|
(
|
) | — | — | ||||||||
|
|
|
|
|
|
|
|||||||
|
Net cash used in investing activities
|
(
|
) |
(
|
) |
(
|
) | ||||||
|
|
|
|
|
|
|
|||||||
|
Cash flows from financing activities:
|
||||||||||||
|
Net change in deposits
|
|
|
|
|||||||||
|
Net change in call money and funds purchased, and payables under repurchase agreements and securities lending transactions
|
|
|
(
|
) | ||||||||
|
Net change in due to trust accounts
|
(
|
) |
(
|
) |
|
|||||||
|
Net change in other short-term borrowings
|
|
|
|
|||||||||
|
Proceeds from issuance of long-term debt
|
|
|
|
|||||||||
|
Repayment of long-term debt
|
(
|
) |
(
|
) |
(
|
) | ||||||
|
Proceeds from noncontrolling interests
|
|
|
|
|||||||||
|
Payments to noncontrolling interests
|
(
|
) |
(
|
) |
(
|
) | ||||||
|
Proceeds from issuance of common stock
|
|
— | — | |||||||||
|
Proceeds from sales of treasury stock
|
|
|
|
|||||||||
|
Purchases of treasury stock
|
(
|
) |
(
|
) |
(
|
) | ||||||
|
Purchases of treasury stock of subsidiaries
|
— | — |
(
|
) | ||||||||
|
Dividends paid
|
(
|
) |
(
|
) |
(
|
) | ||||||
|
Dividends paid to noncontrolling interests
|
(
|
) |
(
|
) |
(
|
) | ||||||
|
|
|
|
|
|
|
|||||||
|
Net cash provided by financing activities
|
|
|
|
|||||||||
|
|
|
|
|
|
|
|||||||
|
Effect of exchange rate changes on cash and cash equivalents
|
|
(
|
) |
|
||||||||
|
|
|
|
|
|
|
|||||||
|
Net increase (decrease) in cash and cash equivalents
|
(
|
) |
(
|
) |
|
|||||||
|
Cash and cash equivalents at beginning of fiscal year
|
|
|
|
|||||||||
|
|
|
|
|
|
|
|||||||
|
Cash and cash equivalents at end of fiscal year
|
|
|
|
|||||||||
|
|
|
|
|
|
|
|||||||
See the accompanying Notes to the Consolidated Financial Statements.
F-
13
MIZUHO FINANCIAL GROUP, INC. AND SUBSIDIARIES
CONSOLIDATED STATEMENTS OF CASH FLOWS—(Continued)
FOR THE FISCAL YEARS ENDED MARCH 31, 2019, 2020 AND 2021
|
|
|
2019
|
|
|
2020
|
|
|
2021
|
|
|||
|
|
|
(in millions of yen)
|
|
|||||||||
|
Supplemental disclosure of cash flow information:
|
|
|
|
|
|
|
|
|
|
|||
|
Interest paid
|
|
|
|
|
|
|||||||
|
Income taxes paid
|
|
|
|
|
||||||||
|
Noncash investing activities:
|
||||||||||||
|
Transfer of loans into loans
held-for-sale
|
|
|
|
|||||||||
|
Deconsolidation of Trust & Custody Services Bank, Ltd:
|
||||||||||||
|
Decrease in total assets
|
|
— | — | |||||||||
|
of which Cash and cash equivalents
|
|
— | — | |||||||||
|
Decrease in total liabilities
|
|
— | — | |||||||||
|
of which Due to trust accounts
|
|
— | — | |||||||||
|
Noncash assets acquired at fair value in an equity method investee
(2)
|
|
— | — | |||||||||
Notes:
|
(1)
|
Proceeds from sales of Equity securities as well as Purchases of Equity securities include cash activity related to Other investments, the amounts of which are not significant.
|
|
(2)
|
Noncash assets acquired at fair value in an equity method investee was from deconsolidation of Trust & Custody Services Bank, Ltd.
|
See the accompanying Notes to the Consolidated Financial Statements.
F-1
4
MIZUHO FINANCIAL GROUP, INC. AND SUBSIDIARIES
NOTES TO CONSOLIDATED FINANCIAL STATEMENTS
1. Basis of presentation and summary of significant accounting policies
Basis of presentation
Mizuho Financial Group, Inc. (“MHFG”) is a joint stock corporation with limited liability under the laws of Japan. MHFG is a holding company for Mizuho Bank, Ltd. (“MHBK”), Mizuho Trust & Banking Co., Ltd. (“MHTB”), Mizuho Securities Co., Ltd. (“MHSC”), Asset Management One Co., Ltd. (“Asset Management One”), and other subsidiaries. MHFG, through its subsidiaries (“the MHFG Group,” or “the Group”), provides domestic and international financial services in Japan and other countries. For a discussion of the Group’s segment information, see Note 31 “Business segment information.”
MHFG and its domestic subsidiaries as well as its foreign subsidiaries maintain their accounting records in accordance with the accounting standards of Japan and those standards of the countries in which they are domiciled. Certain adjustments and reclassifications have been incorporated in the accompanying consolidated financial statements to conform them to the accounting principles generally accepted in the United States of America (“U.S. GAAP”). The consolidated financial statements are stated in Japanese yen, the currency of the country in which MHFG is incorporated and principally operates.
The accompanying consolidated financial statements include the accounts of MHFG and its subsidiaries. MHFG’s fiscal year ends on March 31. MHFG’s subsidiaries fiscal year end is determined by each subsidiary. If the fiscal year end of a subsidiary has more than three months discrepancy from the MHFG’s fiscal year end, the subsidiary executes provisional financial closing. For those subsidiaries where the fiscal year end is not on March 31 and where the subsidiaries do not execute provisional financial close, the effect on the MHFG Group’s consolidated financial statements of all material events through the date of each of the periods presented in the consolidated financial statements has been considered for adjustment and/or disclosure. When determining whether to consolidate investee entities, the MHFG Group performs an analysis of the facts and circumstances of the particular relationships between the MHFG Group and the investee entities as well as the ownership of voting shares. The consolidated financial statements also include the accounts of VIEs for which MHFG or its subsidiaries have been determined to be the primary beneficiary in accordance with the Financial Accounting Standards Board (“FASB”) Accounting Standards Codification (“ASC”) 810, “Consolidation” (“ASC 810”). All significant intercompany transactions and balances have been eliminated upon consolidation. The MHFG Group accounts for investments in entities over which it has significant influence by using the equity method of accounting. These investments are included in Other investments and the Group’s proportionate share of income or loss is included in Equity in earnings (losses) of equity method investees—net.
On October 1, 2020, a
share
consolidation became effective. All share and per share information with respect to MHFG’s common stock and preferred stock have been restated to reflect the effect of the share consolidation and related amendments to the articles of incorporation for all periods presented. See Equity on the consolidated balance sheets, Earnings per common share and Dividends per share on the consolidated statements of income, Note 13 “Preferred stock,” Note 14 “Common stock,” Note 18 “Earnings per common share,” and Note 21 “Stock-based compensation” for the restated figures. In addition, certain other comparative amounts for the prior period have been reclassified in order to conform to the current period’s presentation.
1-for-10
Use of estimates
The preparation of the consolidated financial statements in conformity with U.S. GAAP requires management to make estimates and assumptions that affect reported amounts and related disclosures. Specific areas, among others, requiring the application of management’s estimates and judgment include assumptions pertaining to the allowance for credit losses, valuation of deferred tax assets, valuation of derivative financial instruments,
F-1
5
MIZUHO FINANCIAL GROUP, INC. AND SUBSIDIARIES
NOTES TO CONSOLIDATED FINANCIAL STATEMENTS—(Continued)
valuation of investments, valuation of certain long-term debt where fair value option has been elected, valuation of pension and other employee benefits, and impairment of long-lived assets. During times of pandemics, such as
COVID-19,
estimates become more sensitive and it is reasonably possible that actual results could differ from estimates and assumptions made.
Definition of cash and cash equivalents
For purposes of the consolidated statements of cash flows, Cash and cash equivalents consists of Cash and due from banks and Interest-bearing deposits in other banks. Cash deposited with central banks that must be maintained to meet minimum regulatory requirements is classified as restricted cash and included in Cash and cash equivalents. See Note 8 “Pledged assets and collateral” for more information on restricted cash.
Translation of foreign currency financial statements and foreign currency transactions
Financial statements of overseas entities are prepared using the functional currency of each entity and translated into Japanese yen for consolidation purposes. Assets and liabilities are translated using the
fiscal-year-end
exchange rate of each functional currency, and income and expenses are translated using the average rate of each functional currency for the period.
Foreign currency translation gains and losses related to the financial statements of overseas entities of the MHFG Group, net of related income tax effects, are credited or charged directly to Foreign currency translation adjustments, a component of Accumulated other comprehensive income (loss), net of tax (“AOCI”). The tax effects of gains and losses related to the foreign currency translation of financial statements of overseas entities are not recognized unless it is apparent that the temporary differences will reverse in the foreseeable future.
Assets and liabilities of domestic and overseas entities denominated in foreign currencies are remeasured into the functional currency of the respective entity at the fiscal
year-end
foreign exchange rates, and gains and losses resulting from such remeasurement are included in Foreign exchange gains (losses)—net. Foreign currency denominated income and expenses are remeasured using the average exchange rates for the period.
Call loans and call money
Call loans and call money represent lending/borrowing, primarily through the Japanese short-term money market, to/from other financial institutions such as banks, insurance companies, and securities brokerage houses.
Repurchase and resale agreements, securities lending and borrowing and other secured financing transactions
Securities sold under agreements to repurchase (“repurchase agreements”), securities purchased under agreements to resell (“resale agreements”) and securities lending and borrowing transactions are accounted for as secured financing or lending transactions when control over the underlying securities is not deemed to be surrendered by the transferor. Otherwise, they are recorded as sales of securities with related forward repurchase commitments or purchases of securities with related forward resale commitments in accordance with ASC 860, “Transfers and Servicing” (“ASC 860”).
Under resale agreements, securities borrowing and certain derivatives transactions, the MHFG Group receives collateral in the form of securities. In many cases, the MHFG Group is permitted to sell or repledge the securities obtained as collateral. Disclosures in respect of such collateral are presented in Note 8 “Pledged assets and collateral.” With respect to repurchase agreements, securities lending, and certain derivative transactions, counterparties may have the right to sell or repledge securities that the MHFG Group has pledged as collateral. The MHFG Group separately discloses these pledged securities in the consolidated balance sheets.
F-1
6
MIZUHO FINANCIAL GROUP, INC. AND SUBSIDIARIES
NOTES TO CONSOLIDATED FINANCIAL STATEMENTS—(Continued)
The MHFG Group monitors credit exposure arising from resale agreements, repurchase agreements, securities borrowing and securities lending transactions on a regular basis, and additional collateral is obtained from or returned to counterparties, as appropriate.
Trading securities and trading securities sold, not yet purchased
Trading securities consist of securities and money market instruments that are bought and held principally for the purpose of reselling in the near term with the objective of generating profits on short-term fluctuations in price. Trading securities sold, not yet purchased, are securities and money market instruments sold to third parties that the MHFG Group does not own and is obligated to purchase at a later date to cover the short position. Trading securities and trading securities sold, not yet purchased, are recorded on the trade date. Trading securities and trading securities sold, not yet purchased, are recorded at fair value in the consolidated balance sheets in Trading account assets and Trading account liabilities with realized and unrealized gains and losses recorded on a trade date basis in Trading account gains (losses)—net in the consolidated statements of income. Interest and dividends on trading securities, including securities sold, not yet purchased, are recorded in Interest and dividend income or Interest expense on an accrual basis.
Investments
Debt securities that the MHFG Group has both the positive intent and ability to hold to maturity are classified as
securities and carried at amortized cost. Debt securities that the MHFG Group may not hold to maturity, other than those classified as trading securities, are classified as
securities, and are carried at fair value, with unrealized gains and losses reported in AOCI after any applicable allowance for credit losses. Equity securities that do not meet the classification of trading securities are measured at fair value with unrealized gains and losses reported in Investment gains (losses)—net Equity securities.
Held-to-maturity
Available-for-sale
At the end of each reporting period the MHFG Group performs a review to identify impaired
securities in accordance with ASC 326, “Financial Instruments—Credit Losses” (“ASC 326”). See allowance and provision (credit) for credit losses on
securities in this Note for further detail. Interest and dividends, as well as amortization of premiums and accretion of discounts, are reported in Interest and dividend income. Amortization of premiums and accretion of discounts on debt securities are recognized over their remaining maturities under the interest method. Gains and losses on disposition of investments are computed using the
available-for-sale
available-for-sale
first-in
first-out
method for debt securities and the average method for equity securities, and are recorded on the trade date.
Other investments include marketable and
non-marketable
equity securities accounted for using the equity method and marketable and
non-marketable
investments held by consolidated investment companies carried at fair value under specialized industry accounting principles for investment companies.
Derivative financial instruments
Derivative financial instruments are bought and held principally for the purpose of market making for customers, proprietary trading in order to generate trading revenues and fee income, and also to manage the MHFG Group’s exposure to interest rate, credit and market risks related to asset and liability management. Such derivative financial instruments include interest rate, foreign currency, equity, commodity and credit default swap agreements, options, caps and floors, and financial futures and forward contracts.
Derivatives bought and held for trading purposes are recorded in the consolidated balance sheets at fair value in Trading account assets and Trading account liabilities. The fair values of derivatives in a gain position and a loss position are reported as Trading account assets and Trading account liabilities, respectively.
F-1
7
MIZUHO FINANCIAL GROUP, INC. AND SUBSIDIARIES
NOTES TO CONSOLIDATED FINANCIAL STATEMENTS—(Continued)
Derivatives used for asset and liability management include contracts that qualify for hedge accounting under ASC 815, “Derivatives and Hedging” (“ASC 815”). To be eligible for hedge accounting, derivative instruments must be highly effective in achieving offsetting changes in fair values or variable cash flows of the hedged items attributable to the particular risk being hedged. All qualifying hedging derivatives are valued at fair value and included in Trading account assets or Trading account liabilities. Derivatives that do not qualify for hedge accounting under ASC 815 are treated as trading positions and are accounted for as such. The fair value amounts recognized for all derivatives are presented on a gross basis and not offset against the amounts recognized for the right to reclaim cash collateral or the obligation to return cash collateral under the master netting agreement with the same counterparty.
The fair values of derivative financial instruments are determined based on quoted market prices or broker-dealer quotes, if available. If not available, the fair values are estimated using quoted market prices for similar instruments, option or binomial pricing models or a present value cash flow analysis, utilizing current observable market information, where available. In determining the fair values, the Group considers various factors such as exchange or
market quotes, time value of money and volatility factors for options and warrants, observed prices for similar or synthetic instruments, and counterparty credit quality including potential exposure.
over-the-counter
Changes in the fair values of all derivatives are recorded in earnings, except for derivatives qualifying as net investment hedges under ASC 815 which are recorded in AOCI. The changes in the fair values of all derivatives relating to foreign currency exchange rates are included in Foreign exchange gains (losses)—net and Trading account gains (losses)—net. Other elements of the changes in the fair values, including interest rate, equity and credit related components, except these of certain credit derivatives hedging the credit risk in the corporate loan portfolio, are recognized in Trading account gains (losses)—net. The net gain (loss) resulting from changes in the fair values of certain credit derivatives where the Group purchases protection to mitigate its credit risk exposure related to its corporate loan portfolio is recorded in Other noninterest income (expenses).
Certain financial and hybrid instruments often contain embedded derivative instruments that possess implicit or explicit contract terms similar to those of a derivative instrument. Such derivative instruments are required to be fair-valued separately from the host contracts if they meet the bifurcation criteria of an embedded derivative. Such criteria include that the entire instrument is not marked to market through earnings, the economic characteristics and risks of the embedded contract terms are not clearly and closely related to those of the host contract and the embedded contract terms would meet the definition of a derivative on a stand-alone basis.
Loans
Loans are generally carried at the principal amount adjusted for unearned income and deferred net nonrefundable loan fees and costs. Loan origination fees, net of certain direct origination costs, are deferred and recognized over the contractual life of the loan as an adjustment of yield using a method that approximates the interest method. Interest income on performing loans is accrued and credited to income as it is earned. Unearned income and discounts or premiums on purchased loans are deferred and recognized over the life of the loan using a method that approximates the interest method.
Loans are considered nonaccrual when, based on current information and events, it is probable that the MHFG Group will be unable to collect all the scheduled payments of principal and interest when due according to the contractual terms of the loans. Factors considered by management in determining if a loan is nonaccrual include delinquency status and the ability of the debtor to make payments of the principal and interest when due. Nonaccrual loans include loans past due for
90
days or more and restructured loans that meet the definition of a troubled debt restructuring (“TDR”) in accordance with ASC 310, “Receivables” (“ASC 310”). The majority of
F-1
8
MIZUHO FINANCIAL GROUP, INC. AND SUBSIDIARIES
NOTES TO CONSOLIDATED FINANCIAL STATEMENTS—(Continued)
nonaccrual loans have no contractual delinquency due to interest reductions and/or postponement of principal and interest.
In March 2020, the Coronavirus, Aid, Relief, and Economic Security Act (“the CARES Act”) was approved. The CARES Act and U.S. banking agencies have among other items, provided optional, temporary relief related to accounting for certain TDRs. The temporary TDR relief is available to banks for loan modifications related to obligors who were adversely impacted by
COVID-19.
During the year the TDR relief provision was extended to January 1, 2022. The MHFG Group has not elected any of the temporary TDR relief or any of the other provisions provided by the CARES Act and U.S. banking agencies throughout the year ended March 31, 2021.
In case loans are designated as nonaccrual loans, interest accruals and the amortization of net origination fees are suspended and capitalized interest is written off. Cash received on nonaccrual loans is accounted for as a reduction of the loan principal if the ultimate collectability of the principal amount is in doubt, otherwise, as interest income. Loans are not restored to accrual status until interest and principal payments are current and future payments are reasonably assured. Nonaccrual loans are restored to accrual loans and accrual status, when the MHFG Group determines that the borrower poses no concerns regarding current certainty of debt fulfillment. In general, such determination is made if the borrower qualifies for an obligor rating of E2 or above and is not classified as a special attention obligor. With respect to loans restructured in a TDR, in general, such loans are restored to accrual loans, and accrual status, when the borrower qualifies for an obligor rating of D or above. See Note 4 “Loans” for the definitions of obligor ratings.
Loans that have been identified for sale are classified as loans held for sale within Other assets and are accounted for at the lower of cost or fair value on an individual loan basis. If management decides to retain certain loans held for sale for the foreseeable future or until maturity or payoff, such items are transferred to Loans at the lower of cost or fair value.
Financial instruments—current expected credit losses (“CECL”)
The adoption of this guidance established a single allowance framework for all financial assets measured at amortized cost and certain
debt securities be presented as an allowance for credit losses rather than as a write-down, and limits the amount of the allowance for credit losses to the amount by which fair value is below amortized cost. Per the accounting policy election the Group does not record expected credit losses for accrued interest receivables because uncollectible accrued interest is reversed through interest income in a timely manner in line with the Group’s nonaccrual and past due policies. The amount of accrued interest receivable reverse through interest income was not significant for the year ended March 31, 2021. The following note and Note 2 “Issued accounting pronouncements,” Note 3 “Investments,” Note 4 “Loans” and Note 5 “Allowance for credit losses on loans” provide further information about the impact that the adoption of ASC 326 had on the MHFG Group. In conjunction with the adoption of CECL, the Group has reclassified certain of its portfolio segments to align to its
off-balance-sheet
instrument exposures. This framework requires management’s estimate to reflect credit losses over the instrument’s remaining expected lives and consider expected future changes in macroeconomic conditions. ASC 326 replaced the incurred loss impairment methodology in prior U.S. GAAP with a methodology that reflects expected credit losses and requires consideration of a broader range of information such as relevant information about past events including historical experience, current conditions and reasonable and supportable forecasts that affect the collectability of the reported amount, for the purpose of informing credit loss estimates. This ASC requires a financial asset (or a group of financial assets) measured at amortized cost basis to be presented at the net amount expected to be collected. The income statement reflects the measurement of credit losses for newly recognized financial assets, as well as the expected increases or decreases of expected credit losses that have taken place during the period. This ASC also requires that credit losses on
available-for-sale
F-1
9
MIZUHO FINANCIAL GROUP, INC. AND SUBSIDIARIES
NOTES TO CONSOLIDATED FINANCIAL STATEMENTS—(Continued)
CECL methodology. Certain prior period disclosure amounts in Note 4 “Loans” have been reclassified in order to conform to the current period’s presentation.
Allowance and provision (credit) for credit losses on loans
Effective April 1, 2020, the allowance for credit losses on loans is established for current expected credit losses on the MHFG Group’s loan portfolio in accordance with ASC 326. Additionally, as of April 1, 2020, the Group did not elect the fair value option for certain financial assets measured at amortized cost basis. Prior to April 1, 2020, the allowance for credit losses on loans was established based on an incurred loss model in accordance with ASC 310, “Receivables” (“ASC 310”) and ASC 450, “Contingencies” (“ASC 450”).
The MHFG Group makes adjustments to the allowance for credit losses on loans through Provision (credit) for credit losses in the consolidated statements of income in each subsequent reporting period. Loan principal that management judges to be uncollectible, based on detailed loan reviews and a credit quality assessment, is charged off against the allowance for credit losses on loans. In general, the Group charges off loans when the Group determines that the obligor should be classified as substantially bankrupt or bankrupt. See Note 4 “Loans” for the definitions of obligor categories. Obligors in the retail portfolio segment are generally determined to be substantially bankrupt when they are past due for more than
six months
, and as for obligors in the corporate portfolio segment, the Group separately monitors the credit quality of each obligor without using time-based triggers.
The MHFG Group maintains an appropriate allowance for credit losses on loans to represent management’s estimate of the expected credit losses in the Group’s loan portfolio. The management evaluates the appropriateness of the allowance for credit losses on loans semi-annually. The allowance considers expected credit losses over the remaining expected lives of the applicable instruments. The expected life of each instrument is determined by considering expected prepayments, contractual terms and cancellation features. The allowance for credit losses involves significant judgments on a number of matters including expectations of future economic conditions, assignment of obligor ratings, valuation of collateral, and the development of qualitative adjustments.
When determining expected credit losses, a single forward-looking macroeconomic scenario is considered over a reasonable and supportable forecast period. This forward-looking macroeconomic scenario is consistent to what is used in the Group’s stress testing and is in line with the scenario used for the Group’s business plan. If the scenario does not reflect a sudden change in economic conditions adequately, it could be possible to make adjustments to the scenario. After the forecast period, the Group reverts to long-term historical loss experience with a certain graduated transition period, to estimate losses over the remaining lives of financial assets measured at amortized cost and certain
off-balance-sheet
instruments. The macroeconomic scenario is updated at least semi-annually and is reviewed accordingly to reflect current economic conditions and the Group’s expectation of future conditions on a timely basis. For April 1, 2020 and March 31, 2021, the Group used the most recent macroeconomic scenario available during the Group’s credit loss estimation process.
In terms of the internal risk ratings, for the corporate portfolio segment, the credit quality review process and the credit rating process serve as the basis for determining the allowance for credit losses on loans. Through such processes loans are categorized into groups to reflect the probability of default, whereby the MHFG Group’s management assesses the ability of borrowers to service their debt, taking into consideration current financial information, ability to generate cash, historical payment experience, analysis of relevant industry segments and current trends. For the retail portfolio segment, the different categories of past due status of loans are primarily utilized in the credit quality review and the credit rating processes as the basis for determining the allowance for credit losses on loans.
In general, the MHFG Group estimates expected credit losses collectively on the loans in the case of normal and watch obligors, considering the risk associated with a particular pool and the probability that the exposures
F-
20
MIZUHO FINANCIAL GROUP, INC. AND SUBSIDIARIES
NOTES TO CONSOLIDATED FINANCIAL STATEMENTS—(Continued)
within the pool will deteriorate or default. The allowance for credit losses on nonaccrual loans includes the allowance for groups of loans which were collectively evaluated for expected credit losses, in addition to the allowance for those loans that were individually evaluated for expected credit losses. See Note 4 “Loans” for the definitions of obligor categories and classification of nonaccrual loans.
The estimation of expected credit losses that are evaluated collectively begins with a quantitative calculation that considers the likelihood of the borrower changing delinquency status or moving from one obligor category or rating to another. The quantitative calculation covers expected credit losses over an instrument’s expected life and is estimated by applying credit loss factors to the MHFG Group’s estimated exposure at default. The credit loss factors incorporate the probability of default as well as the loss given default based on the historical loss rates. To supplement the historical loss data for overseas obligors, external credit ratings such as S&P are also used to calculate the probability of default. The model and inputs used to determine credit losses on loans that are evaluated collectively are analyzed on a periodic basis by comparing the estimated values with the actual results subsequent to the balance sheet date.
The MHFG Group divides its overall portfolio into domestic and foreign portfolios, and categorizes the domestic portfolio into four portfolio segments according to their risk profiles: corporate, retail, sovereign, and banks and financial institutions.
The corporate portfolio segment consists of loans originated primarily by MHBK and MHTB, and includes mainly business loans such as those used for working capital and capital expenditure, as well as loans for which the primary source of repayment of the obligation is income generated by the relevant assets such as project finance, asset finance and real estate finance. The corporate portfolio segment is divided into two classes based on their risk characteristics: large companies, and small and
medium-sized
companies. For the corporate portfolio segment, the MHFG Group considers key economic factors such as gross domestic products for Japan and each relevant foreign location, where the portfolio is significant, and the interest rates in Japan when estimating the credit loss.
The retail portfolio segment consists mainly of residential mortgage loans originated by MHBK, and it is divided into two classes based on their risk characteristics: housing loan and others. For the retail portfolio segment, the Japanese unemployment rate is applied as a key factor. As it pertains to TDRs in the retail portfolio segment, the restructuring itself, as well as subsequent payment defaults, if any, are considered in determining obligor categories. Expected credit loss estimates also include consideration of expected cash recoveries on loans previously
charged-off,
or expected recoveries on collateral dependent loans where recovery is expected through sale of the collateral.
The allowance recorded for individually evaluated loans is based on (1) the present value of expected future cash flows, after considering the restructuring effect and subsequent payment default with respect to TDRs, discounted at the loan’s initial effective interest rate, or (2) the loan’s observable market price, or (3) the fair value of the collateral if the loan is collateral dependent. The collateral that the MHFG Group obtains for loans consists primarily of real estate. In obtaining the collateral, the Group evaluates the fair value of the collateral and its legal enforceability. The Group also performs subsequent
re-evaluations
at least once a year. As it pertains to real estate collateral, valuation is generally performed by an appraising subsidiary which is independent from the Group’s loan origination departments by using generally accepted valuation techniques such as (1) the replacement cost approach, (2) the sales comparison approach or (3) the income approach. In the case of large real estate collateral, the Group generally engages third-party appraisers to perform the valuation.
The MHFG Group’s methodology for determining the appropriate allowance for credit losses on loans also considers the imprecision inherent in the methodologies used. As a result, the amounts determined under the
F-
2
1
MIZUHO FINANCIAL GROUP, INC. AND SUBSIDIARIES
NOTES TO CONSOLIDATED FINANCIAL STATEMENTS—(Continued)
methodologies described above could be adjusted by management to consider the potential impact of other qualitative factors which include, but are not limited to, imprecision in macroeconomic scenario assumptions and emerging risks related to changes in the environment that are affecting specific portfolio segments. Considering internal and external factors affecting the credit quality of the portfolio, the Group incorporated the estimated impact of COVID-19 pandemic into the macroeconomic scenario by using assumptions such as anticipated business recovery period and current forecast for the growth rate of gross domestic product.
Allowance and provision (credit) for credit losses on
off-balance-sheet
instruments
The MHFG Group maintains an allowance for credit losses on
off-balance-sheet
instruments, such as guarantees and standby letters of credit in the same manner as the allowance for credit losses on loans. The Group similarly assesses the expected loss amounts for commitments to invest in securities and commitments to extend credit, taking into account the probability of drawdowns. The allowance is recorded in Other liabilities. Net changes in the allowance for credit losses on
off-balance-sheet
instruments are accounted for in Provision (credit) for credit losses on
off-balance-sheet
instruments in the consolidated statements of income.
Allowance and provision (credit) for credit losses on
securities
available-for-sale
The MHFG Group performs periodic reviews to identify impaired securities in accordance with ASC 326.
securities are impaired if the fair value is less than the amortized cost (excluding accrued interest receivable). For
debt securities, in the cases where the Group has the intent to sell an
debt security or more likely than not will be required to sell an
debt security before the recovery of its amortized cost basis, the entire difference between amortized cost basis and fair value is recognized immediately through earnings. In other cases, the Group evaluates expected cash flows to be received and determines if a credit loss exists, and if so, the amount of the credit loss is recognized in Provision (credit) for credit losses, while the remaining decline in fair value is recognized in other comprehensive income, net of applicable taxes. For additional information, see Note 4 “Loans.” Before the adoption of ASC 326, the previous other-than-temporary impairment model was applied for
debt securities.
Available-for-sale
available-for-sale
available-for-sale
available-for-sale
available-for-sale
Premises and equipment
Premises and equipment are stated at historical cost, and depreciation and amortization are recorded over the estimated useful lives of the assets, except for leasehold improvements, which are amortized over the shorter of the estimated useful lives of the assets or the lease term. Depreciation and amortization are principally computed in accordance with the straight-line method with respect to buildings and leasehold improvements and in accordance with the declining-balance method with respect to other premises and equipment.
The useful lives of premises and equipment are as follows:
|
Years
|
||||
|
Buildings
|
|
|||
|
Equipment and furniture
|
|
|||
Regular repairs and maintenance costs that do not extend the estimated useful life of an asset are charged to expense as incurred. Upon sale or disposition of premises and equipment, the cost and related accumulated depreciation or amortization are removed from the accounts, and any gains or losses on disposal are included in Gains on disposal of premises and equipment or Occupancy expenses.
F-
22
MIZUHO FINANCIAL GROUP, INC. AND SUBSIDIARIES
NOTES TO CONSOLIDATED FINANCIAL STATEMENTS—(Continued)
Impairment of long-lived assets
The MHFG Group’s long-lived assets that are held for use are reviewed periodically for events or changes in circumstances that indicate possible impairment. The Group’s impairment review is based on an undiscounted cash flow analysis of a group of assets, combined with associated liabilities, at the lowest level for which identifiable cash flows exist. Impairment occurs when the carrying value of the asset group exceeds the future undiscounted cash flows that the asset group is expected to generate. When impairment is identified, the future cash flows are then discounted to determine the estimated fair value of the asset group and an impairment charge is recorded for the difference between the carrying value and the estimated fair value of the asset group. The long-lived assets to be disposed of by sale are carried at the lower of the carrying amount or fair value, less estimated cost to sell.
Software
Internal and external costs incurred in connection with developing and obtaining software for internal use during the application development stage are capitalized. Such costs include salaries and benefits for employees directly involved with and who devote time to the project, to the extent such time is incurred directly on the internal use software project. The capitalization of software ceases when the software project has been substantially completed. The capitalized software is amortized on a straight-line basis over the estimated useful life, generally
5
to
10
years. Internal use software is reviewed for impairment whenever events or changes in circumstances indicate that its carrying amount may not be recoverable.
Goodwill
Goodwill represents the excess of the total fair value of the acquired company, which consists of the consideration transferred, the fair value of any interest in the acquiree already held by the acquirer and the fair value of any noncontrolling interest in the acquiree over the fair value of net identifiable assets acquired at the date of acquisition in a business combination. The MHFG Group accounts for goodwill in accordance with ASC 350, “Intangibles—Goodwill and Other” (“ASC 350”). Goodwill is recorded at a designated reporting unit level for the purpose of assessing impairment. Goodwill is not amortized but is tested for impairment at least annually or more often if events or circumstances indicate there may be impairment. For both the annual and interim tests, the Group has the option to either (a) perform a quantitative impairment test or (b) first perform a qualitative assessment to determine whether it is more likely than not that the fair value of a reporting unit is less than its carrying amount, in which case the Group would perform the quantitative test. An impairment loss is recorded to the extent the carrying amount of goodwill exceeds its estimated fair value. The estimated fair value of the reporting units is derived based on valuation techniques that the Group believes market participants would use for each of the reporting units. The Group generally determines the estimated fair value by utilizing a discounted cash flow methodology or methodologies that incorporate
multiples of certain comparable companies.
price-to-book
Intangible assets
Intangible assets having definite useful lives are amortized over their estimated useful lives on either a straight-line basis or the method that reflects the pattern in which the economic benefits of the intangible assets are consumed. Intangible assets acquired in connection with the merger of MHSC and Shinko Securities Co., Ltd. (“Shinko”) and the integration of asset management functions of DIAM Co., Ltd. (“DIAM”), MHTB, Mizuho Asset Management Co., Ltd. (“MHAM”) and Shinko Asset Management Co., Ltd. (“Shinko Asset Management”) consist primarily of customer relationship intangibles, and are amortized over weighted-average amortization periods of
16
years and
16.9
years, respectively. Intangible assets having indefinite useful lives are
F-
23
MIZUHO FINANCIAL GROUP, INC. AND SUBSIDIARIES
NOTES TO CONSOLIDATED FINANCIAL STATEMENTS—(Continued)
not amortized and are subject to impairment tests. An impairment loss is recorded to the extent that the carrying amount of the indefinite-lived intangible asset exceeds its estimated fair value. For intangible assets subject to amortization, an impairment loss is recorded if the carrying amount is not recoverable and exceeds its estimated fair value.
Leases
The MHFG Group, as a lessee, recognizes liabilities to make lease payments and
assets representing its right to use the underlying assets for the lease term. The lease terms include periods covered by options to extend or terminate the lease that the Group is reasonably certain to exercise. The Group uses its incremental borrowing rates at the lease commencement to determine the lease liability, which is measured at the present value of future lease payments, when the rate implicit in the lease is not readily determinable. The Group has elected not to separate lease and
assets and liabilities for leases with terms of twelve months or less. For operating leases, the
assets and related liabilities are included in Other assets and Other liabilities, respectively, on the consolidated balance sheets. Expenses are recognized on a straight-line basis over the lease term and are included in Occupancy expenses on the consolidated statements of income. Variable lease payments not included in the
assets or the lease liabilities are recognized as incurred in Occupancy expenses. For finance leases,
assets and related liabilities are included in Premises and equipment and Long-term debt, respectively, on the consolidated balance sheets.
right-of-use
non-lease
components of a contract that is or contains a lease for its equipment leases. The Group has elected not to recognize
right-of-use
right-of-use
right-of-use
right-of-use
Pension and other employee benefits
MHFG and certain subsidiaries sponsor pension plans which provide defined benefits to retired employees and other postretirement benefit plans, including severance indemnities. Severance indemnities are amounts payable to eligible employees upon termination of employment and are payable as a lump sum. Periodic expense and accrued liabilities are computed based on the actuarial present value of benefits, net of investment returns expected from plan assets and their fair values at the balance sheet date. Net periodic expense is charged to Salaries and employee benefits. Net actuarial gains and losses that arise from differences between actual experience and assumptions are generally amortized over the average remaining service period of participating employees if they exceed the corridor, which is defined as the greater of 10% of plan assets or the projected benefit obligation.
Stock-based compensation
MHFG, MHBK, MHTB and MHSC have a position-based stock compensation program for Directors (“Stock Compensation I”) and a performance-based stock compensation program for Directors (“Stock Compensation II”). For both programs, the stock-based compensation cost is determined based on the fair value of MHFG’s common stock as of grant date. For Stock Compensation I and II, the liability related to the cash-based compensation cost is remeasured at each reporting date based on the fair value of MHFG’s common stock. For Stock Compensation II, the stock-based compensation costs are recognized evenly over the graded-vesting period, which is three years. For Stock Compensation I, as the program is effectively vested on the grant date, the stock-based compensation cost is recognized on the grant date.
See Note 21 “Stock-based compensation” for further details of the stock options and the stock compensation programs.
F-2
4
MIZUHO FINANCIAL GROUP, INC. AND SUBSIDIARIES
NOTES TO CONSOLIDATED FINANCIAL STATEMENTS—(Continued)
Long-term debt
Premiums, discounts and issuance costs of long-term debt are amortized based on a method that approximates the interest method over the respective terms of the long-term debt.
Obligations under guarantees
The MHFG Group provides customers with a variety of guarantees and similar arrangements, including standby letters of credit, financial and performance guarantees, credit protection, and liquidity facilities. The MHFG Group recognizes guarantee fee income over the guarantee period. The MHFG Group receives such a guarantee fee at the inception of the guarantee or in installments and, in either case, the present value of the total fees approximates the fair value of the guarantee.
Fair Value Measurements
The MHFG Group carries certain of its financial assets and liabilities at fair value on a recurring basis. These financial assets and liabilities are primarily composed of trading account assets, trading account liabilities and
securities. In addition, the Group measures certain financial assets and liabilities, at fair value on a
available-for-sale
non-recurring
basis. Those assets and liabilities primarily include items that are measured at the lower of cost or fair value such as loans held for sale, and items that were initially measured at cost and have been written down to fair value due to impairments, such as loans and equity securities without readily determinable fair values.
Fair value is defined as the price that would be received to sell an asset or paid to transfer a liability in an orderly transaction between market participants at the measurement date. In accordance with ASC 820, “Fair Value Measurement” (“ASC 820”), the Group classifies its financial assets and liabilities into the fair value hierarchy (Level 1, 2, and 3). See Note 27 “Fair value” for the detailed definition of each level.
When determining fair value, the MHFG Group considers the principal or most advantageous market in which the Group would transact and considers assumptions that market participants would use when pricing the asset or liability. The Group maximizes the use of observable inputs and minimizes the use of unobservable inputs when measuring fair value. See Note 27 “Fair value” for descriptions of valuation methodologies used for its assets and liabilities by product.
Fee and commission income
The MHFG Group recognizes revenue from contracts with customers in an amount that reflects the consideration to which the Group expects to be entitled in exchange for transferring control of a promised service. The timing of revenue recognition is dependent on whether the Group satisfies a performance obligation by transferring control of the service to a customer over time or at a point in time. Fee and commission income is presented exclusive of consumption taxes. The major components of fee and commission income are as follows.
Securities-related business fees mainly consist of brokerage fees and commissions, and asset-based revenues. Brokerage fees and commissions mainly include fees earned from the execution of customer transactions and sales commissions of investment trusts. Brokerage fees and commissions are recognized at the point in time on transaction date. Asset-based revenues mainly include fees received from investment trust management companies in return for administration services, such as record keeping services, of investment trusts. The amounts of asset-based revenues are calculated based on customer’s net asset value and recognized over time in the period when the related service is provided.
F-2
5
MIZUHO FINANCIAL GROUP, INC. AND SUBSIDIARIES
NOTES TO CONSOLIDATED FINANCIAL STATEMENTS—(Continued)
Deposit-related fees include service charges on consumer and commercial deposit accounts such as account transfer charges. Deposit-related fees are recognized at the point in time when the transactions occur or the related service is provided.
Lending-related fees include fees for lending business such as commitment fees and arrangement fees.
Remittance business fees include service charges for domestic and international funds transfers and collections. These fees are recognized at the point in time when the related service is provided.
Asset management business fees consist of investment trust management fees and investment advisory fees for investment trusts. These fees are received from investment trusts in return for asset management services and/or investment advisory services on behalf of customers. The amounts of these fees are calculated based on a percentage of customer’s net asset value. These fees are recognized over time in the period when the management and/or advisory service is provided and the amount is fixed.
Trust-related business fees consist of trust fees earned primarily through fiduciary asset management and administrative service and other trust-related fees. Fees for fiduciary asset management and administration services for corporate pension plans and investment funds are recognized over time in the period when the related service is provided. Other trust-related fees mainly include brokerage commissions of real estate property, sales commissions of beneficial interest in real estate trust and charges for stock transfer agent services. These fees are mainly earned on a transaction basis and recognized at the point in time when the related service is provided.
Agency business fees mainly include administration service fees related to the MHFG Group’s agency business such as Japan’s principal public lottery program and revenues from standing proxy services. These fees are recognized at the point in time when the related service is provided.
Fees for other customer services include various revenues such as sales commissions of life insurance, service charges for electronic banking, financial advisory fees, and service charges for software development. Sales commissions from life insurance sales are received from insurance companies in return for selling insurance products and recognized when the insurance product is sold to customers. Service charges for electronic banking are mainly monthly basic usage fees and recognized over the related transaction period. Financial advisory fees are recognized over time in the period when the related advisory service based on the contract is rendered. Service charges for software development are recognized over time according to the progress of the development.
Fee and commission expenses
The principal items included in fee and commission expenses are fee and commission expenses for remittance services and brokerages fees paid for securities transactions. These expenses are generally recognized on an incurred basis.
Income taxes
Income taxes are accounted for in accordance with ASC 740, “Income Taxes” (“ASC 740”). Deferred income taxes reflect the net tax effects of (1) temporary differences between the carrying amounts of assets and liabilities for financial reporting purposes and the corresponding amounts used for income tax purposes, and (2) operating loss and tax credit carryforwards. A valuation allowance is recorded for any portion of the deferred tax assets unless it is more likely than not that the deferred tax assets will be realized.
F-2
6
MIZUHO FINANCIAL GROUP, INC. AND SUBSIDIARIES
NOTES TO CONSOLIDATED FINANCIAL STATEMENTS—(Continued)
Deferred income tax benefit or expense is recognized for the changes in the net deferred tax asset or liability between periods.
Earnings per common share
Basic earnings per common share are computed by dividing net income attributable to MHFG common shareholders by the weighted average number of common shares outstanding during the fiscal year. Diluted earnings per common share reflect all dilutive potential common shares such as stock options and the common shares of MHFG under the stock compensation programs. See Note 18 “Earnings per common share” for the computation of basic and diluted earnings per common share.
2. Issued accounting pronouncements
Adopted accounting pronouncements
In June 2016, the FASB issued ASU
176
billion, or approximately 40% increase to the allowance for credit losses. After adjusting for deferred taxes, ¥
125
billion decrease was recorded in Retained earnings through a cumulative-effect adjustment. The increase to the allowance at adoption was primarily related to both corporate and retail portfolio segments where the allowance for loan losses had not previously considered the full term of the loans and forward-looking macroeconomic scenario, including further consideration of potential impact of
debt securities, a majority of which consists of Japanese government bonds.
The following table reconciles the closing allowance for loans and
No.2016-13,
“Financial Instruments—Credit Losses (Topic 326)—Measurement of Credit Losses on Financial Instruments” (“ASU
No.2016-13”).
In April 2019, the FASB issued ASU
No.2019-04,
“Codification Improvements to Topic 326, Financial Instruments—Credit Losses” (“ASU
No.2019-04”).
The ASU clarifies the scope of the credit losses standard and addresses issues related to accrued interest receivable balances, recoveries, variable interest rates and prepayments, among other things. In May 2019, the FASB issued ASU
No.2019-05,
“Financial Instruments—Credit Losses (Topic 326) —Targeted Transition Relief” (“ASU
No.2019-05”).
The ASU provides an option to irrevocably elect the fair value option for certain financial assets previously measured at amortized cost basis. In November 2019, the FASB issued ASU
No.2019-11,
“Codification Improvements to Topic 326, Financial Instruments—Credit Losses (Topic 326)” (“ASU
No.2019-11”).
The ASU clarifies or addresses specific issues about certain aspects of the amendments in ASU
No.2016-13,
such as expected recoveries for purchased financial assets with credit deterioration and financial assets secured by collateral maintenance provisions. These ASUs replaced the incurred loss impairment methodology in prior U.S. GAAP with a methodology that reflects expected credit losses and requires consideration of a broader range of information such as relevant information about past events including historical experience, current conditions and reasonable and supportable forecasts that affect the collectability of the reported amount, for the purpose of informing credit loss estimates. The MHFG Group adopted ASU
No.2016-13,
2019-04,
2019-05,
and
2019-11
on April 1, 2020 using a modified retrospective approach. Upon adoption of these ASUs on April 1, 2020, the Group recorded ¥
COVID-19.
On the other hand, at April 1, 2020, the adoption of these ASUs did not have a material impact on
available-for-sale
off-balance-sheet
instruments in accordance with ASC 310 and ASC 450 at March 31, 2020 to the opening allowance determined with ASC 326 at April 1, 2020:
|
At March 31, 2020
(ASC 310/450) |
Transition Adjustment
|
At April 1, 2020
(ASC 326) |
||||||||||
|
(in billions of yen)
|
||||||||||||
|
Loans:
|
||||||||||||
|
Corporate
|
|
|
|
|||||||||
|
Retail
|
|
|
|
|||||||||
|
Off-balance-sheet
instruments
|
|
|
|
|||||||||
F-2
7
MIZUHO FINANCIAL GROUP, INC. AND SUBSIDIARIES
NOTES TO CONSOLIDATED FINANCIAL STATEMENTS—(Continued)
The allowance for credit losses on off-balance-sheet instruments was ¥
87
off-balance-sheet
instruments. For additional information, see Note 1 “Basis of presentation and summary of significant accounting policies,” Note 3 “Investments,” Note 4 “Loans” and Note 5 “Allowance for credit losses on loans.”
In August 2018, the FASB issued ASU
No.2018-13,
“Fair Value Measurement (Topic 820)—Disclosure Framework—Changes to the Disclosure Requirements for Fair Value Measurement” (“ASU
No.2018-13”).
The ASU modifies the disclosure requirements for fair value measurements in order to improve the effectiveness of the notes to financial statements. The amendments require additional disclosure on changes in unrealized gains and losses, the range and weighted average of significant unobservable inputs used to develop Level 3 fair value measurements, and the narrative description of measurement uncertainty. The MHFG Group adopted ASU
No.2018-13
on April 1, 2020. Certain of the requirements are applied prospectively, and other amendments are applied retrospectively. The current disclosure within the Group’s consolidated financial statements has been updated to conform to this guidance.
In August 2018, the FASB issued ASU
No.2018-14,
“Compensation—Retirement Benefits—Defined Benefit Plans—General (Subtopic
715-20)—Disclosure
Framework—Changes to the Disclosure Requirements for Defined Benefit Plans” (“ASU
No.2018-14”).
The ASU removes disclosures that no longer are considered cost beneficial, clarifies the specific requirements of disclosures, and adds disclosure requirements identified as relevant. The MHFG Group adopted ASU
No.2018-14
on April 1, 2020. The requirements are applied retrospectively on the Group’s disclosures for the fiscal year ended March 31, 2020. The adoption of ASU
No.2018-14
did not have a material impact on disclosures in the Group’s consolidated financial statements.
In October 2018, the FASB issued ASU
No.2018-17,
“Consolidation (Topic 810)—Targeted Improvements to Related Party Guidance for Variable Interest Entities” (“ASU
No.2018-17”).
The ASU requires indirect interests held through related parties in common control arrangements to be considered on a proportional basis for determining whether fees paid to decision makers and service providers are variable interests. The MHFG Group adopted ASU
No.2018-17
on April 1, 2020 using a cumulative-effect adjustment to Retained earnings as of April 1, 2020. The adoption of ASU
No.2018-17
did not have a material impact on the Group’s consolidated results of operations or financial condition.
In March 2020, the FASB issued ASU
No.2020-04,
“Reference Rate Reform (Topic 848)—Facilitation of the Effects of Reference Rate Reform on Financial Reporting” (“ASU
No.2020-04”).
The ASU provides optional expedients and exceptions for contracts, hedging relationships, and other transactions affected by reference rate reform. In January 2021, the FASB issued ASU
No.2021-01,
“Reference Rate Reform (Topic 848)—Scope” (“ASU
No.2021-01”).
The ASU clarifies that certain optional expedients and exceptions for contract modifications and hedge accounting apply to derivatives that are affected by the discounting transition. ASU
No.2020-04
is effective as of March 12, 2020 through December 31, 2022. ASU
No.2021-01
is effective as of January 7, 2021 through December 31, 2022. The MHFG Group has elected the practical expedient for modifications of contracts within the scope of ASC 310; the Group is currently evaluating the potential impact that the relief for other topics will have on its consolidated results of operations or financial condition and has not elected any of other expedients and exceptions at this time. The practical expedient which the Group has elected provides an election to account for certain contract amendments related to reference rate reform prospectively as minor modifications without the requirement to assess the significance of the modifications. The main reason for applying the practical expedient is to ease the administrative burden of accounting for contracts impacted by reference rate reform. This election did not have a material impact on the Group’s consolidated results of operations or financial condition.
F-2
8
MIZUHO FINANCIAL GROUP, INC. AND SUBSIDIARIES
NOTES TO CONSOLIDATED FINANCIAL STATEMENTS—(Continued)
3. Investments
Available-for-sale
held-to-maturity
The amortized cost, net of allowance for credit losses, gross unrealized gains and losses, and fair value of
and
securities at March 31, 2020 and 2021 are as follows:
available-for-sale
held-to-maturity
|
Amortized cost
(4)(5)
|
Gross unrealized
gains
|
Gross unrealized
losses
|
Fair value
|
|||||||||||||
|
(in millions of yen)
|
||||||||||||||||
|
2020
|
||||||||||||||||
|
Available-for-sale
|
||||||||||||||||
|
Debt securities:
|
||||||||||||||||
|
Japanese government bonds
|
|
|
|
|
||||||||||||
|
Japanese local government bonds
|
|
|
|
|
||||||||||||
|
U.S. Treasury bonds and federal agency securities
|
|
|
|
|
||||||||||||
|
Other foreign government bonds
|
|
|
|
|
||||||||||||
|
Agency mortgage-backed securities
(1)
|
|
|
|
|
||||||||||||
|
Residential mortgage-backed securities
|
|
|
|
|
||||||||||||
|
Commercial mortgage-backed securities
|
|
|
|
|
||||||||||||
|
Japanese corporate bonds and other debt securities
|
|
|
|
|
||||||||||||
|
Foreign corporate bonds and other debt securities
(2)
|
|
|
|
|
||||||||||||
|
|
|
|
|
|
|
|
|
|||||||||
|
Total
|
|
|
|
|
||||||||||||
|
|
|
|
|
|
|
|
|
|||||||||
|
Held-to-maturity
|
||||||||||||||||
|
Debt securities:
|
||||||||||||||||
|
Japanese government bonds
|
|
|
— |
|
||||||||||||
|
Agency mortgage-backed securities
(3)
|
|
|
|
|
||||||||||||
|
|
|
|
|
|
|
|
|
|||||||||
|
Total
|
|
|
|
|
||||||||||||
|
|
|
|
|
|
|
|
|
|||||||||
|
Amortized cost
(4)(5)
|
Gross unrealized
gains
|
Gross unrealized
losses
|
Fair value
|
|||||||||||||
|
(in millions of yen)
|
||||||||||||||||
|
2021
|
||||||||||||||||
|
Available-for-sale
|
||||||||||||||||
|
Debt securities:
|
||||||||||||||||
|
Japanese government bonds
|
|
|
|
|
||||||||||||
|
Japanese local government bonds
|
|
|
|
|
||||||||||||
|
U.S. Treasury bonds and federal agency securities
|
|
|
|
|
||||||||||||
|
Other foreign government bonds
|
|
|
|
|
||||||||||||
|
Agency mortgage-backed securities
(1)
|
|
|
|
|
||||||||||||
|
Residential mortgage-backed securities
|
|
|
|
|
||||||||||||
|
Commercial mortgage-backed securities
|
|
|
|
|
||||||||||||
|
Japanese corporate bonds and other debt securities
|
|
|
|
|
||||||||||||
|
Foreign corporate bonds and other debt securities
(2)
|
|
|
|
|
||||||||||||
|
|
|
|
|
|
|
|
|
|||||||||
|
Total
|
|
|
|
|
||||||||||||
|
|
|
|
|
|
|
|
|
|||||||||
|
Held-to-maturity
|
||||||||||||||||
|
Debt securities:
|
||||||||||||||||
|
Japanese government bonds
|
|
|
|
|
||||||||||||
|
Agency mortgage-backed securities
(3)
|
|
|
|
|
||||||||||||
|
|
|
|
|
|
|
|
|
|||||||||
|
Total
|
|
|
|
|
||||||||||||
|
|
|
|
|
|
|
|
|
|||||||||
Notes:
| (1) |
Agency mortgage-backed securities presented in this line consist of Japanese and Foreign agency mortgage-backed securities, of which the fair values were ¥
|
| (2) |
Other debt securities presented in this line primarily consist of Foreign negotiable certificates of deposit (“NCDs”) and asset-backed securities (“ABS”), of which the total fair values were ¥
|
| (3) |
All Agency mortgage-backed securities presented in this line are Ginnie Mae securities.
|
F-2
9
MIZUHO FINANCIAL GROUP, INC. AND SUBSIDIARIES
NOTES TO CONSOLIDATED FINANCIAL STATEMENTS—(Continued)
| (4) |
Amortized cost, net of the allowance for credit losses, of which the amounts related to
available-for-sale
|
| (5) |
Accrued interest receivables are excluded from amortized cost, of which the amount was ¥
|
Contractual maturities
The amortized cost, net of allowance for credit losses, and fair value of
and
securities at March 31, 2021 are shown in the table below based on their contractual maturities. Expected maturities may differ from contractual maturities because some securities are not due at a single maturity date, and some securities, such as mortgage-backed securities, contain embedded call or prepayment options.
available-for-sale
held-to-maturity
|
Amortized cost
|
Due in one
year or less
|
Due after one
year through five years |
Due after five
years through ten years |
Due after
ten years |
Total
|
|||||||||||||||
|
(in millions of yen)
|
||||||||||||||||||||
|
Available-for-sale
|
||||||||||||||||||||
|
Debt securities:
|
||||||||||||||||||||
|
Japanese government bonds
|
|
|
|
|
|
|||||||||||||||
|
Japanese local government bonds
|
|
|
|
|
|
|||||||||||||||
|
U.S. Treasury bonds and federal agency securities
|
|
|
|
|
|
|||||||||||||||
|
Other foreign government bonds
|
|
|
|
|
|
|||||||||||||||
|
Agency mortgage-backed securities
|
|
|
|
|
|
|||||||||||||||
|
Residential mortgage-backed securities
|
|
|
|
|
|
|||||||||||||||
|
Commercial mortgage-backed securities
|
|
|
|
|
|
|||||||||||||||
|
Japanese corporate bonds and other debt securities
|
|
|
|
|
|
|||||||||||||||
|
Foreign corporate bonds and other debt securities
|
|
|
|
|
|
|||||||||||||||
|
|
|
|
|
|
|
|
|
|
|
|||||||||||
|
Total
|
|
|
|
|
|
|||||||||||||||
|
|
|
|
|
|
|
|
|
|
|
|||||||||||
|
Held-to-maturity
|
||||||||||||||||||||
|
Debt securities:
|
||||||||||||||||||||
|
Japanese government bonds
|
|
|
|
|
|
|||||||||||||||
|
Agency mortgage-backed securities
|
|
|
|
|
|
|||||||||||||||
|
|
|
|
|
|
|
|
|
|
|
|||||||||||
|
Total
|
|
|
|
|
|
|||||||||||||||
|
|
|
|
|
|
|
|
|
|
|
|||||||||||
|
Fair value
|
Due in one
year or less
|
Due after one
year through
five years
|
Due after five
years through
ten years
|
Due after
ten years
|
Total
|
|||||||||||||||
|
(in millions of yen)
|
||||||||||||||||||||
|
Available-for-sale
|
||||||||||||||||||||
|
Debt securities:
|
||||||||||||||||||||
|
Japanese government bonds
|
|
|
|
|
|
|||||||||||||||
|
Japanese local government bonds
|
|
|
|
|
|
|||||||||||||||
|
U.S. Treasury bonds and federal agency securities
|
|
|
|
|
|
|||||||||||||||
|
Other foreign government bonds
|
|
|
|
|
|
|||||||||||||||
|
Agency mortgage-backed securities
|
|
|
|
|
|
|||||||||||||||
|
Residential mortgage-backed securities
|
|
|
|
|
|
|||||||||||||||
|
Commercial mortgage-backed securities
|
|
|
|
|
|
|||||||||||||||
|
Japanese corporate bonds and other debt securities
|
|
|
|
|
|
|||||||||||||||
|
Foreign corporate bonds and other debt securities
|
|
|
|
|
|
|||||||||||||||
|
|
|
|
|
|
|
|
|
|
|
|||||||||||
|
Total
|
|
|
|
|
|
|||||||||||||||
|
|
|
|
|
|
|
|
|
|
|
|||||||||||
|
Held-to-maturity
|
||||||||||||||||||||
|
Debt securities:
|
||||||||||||||||||||
|
Japanese government bonds
|
|
|
|
|
|
|||||||||||||||
|
Agency mortgage-backed securities
|
|
|
|
|
|
|||||||||||||||
|
|
|
|
|
|
|
|
|
|
|
|||||||||||
|
Total
|
|
|
|
|
|
|||||||||||||||
|
|
|
|
|
|
|
|
|
|
|
|||||||||||
F-
30
MIZUHO FINANCIAL GROUP, INC. AND SUBSIDIARIES
NOTES TO CONSOLIDATED FINANCIAL STATEMENTS—(Continued)
Credit losses
The other-than-temporary impairment losses on
securities for the fiscal years ended March 31, 2019 and 2020 were not significant. No impairment losses were recognized on
securities for the periods. As a result of the adoption of the ASU
securities were recognized at April 1, 2020. The MHFG Group recognized ¥
14
No
allowance for credit losses were recognized on
securities at April 1, 2020 and March 31, 2021, respectively because
securities consist of Japanese government bond and agency mortgage-backed securities like Ginnie Mae securities. See Note 1 “Basis of presentation” for further details of the methodology used to determine the allowance for credit losses.
available-for-sale
held-to-maturity
No.2016-13,
2019-04,
2019-05
and
2019-11,
no material allowance for credit losses on
available-for-sale
billion of allowance for credit losses on available-for-sale securities for the period ending March 31, 2021. The increase was due mainly to an increase of credit losses for certain Japanese corporate bonds and other debt securities.
held-to-maturity
held-to-maturity
F-
31
MIZUHO FINANCIAL GROUP, INC. AND SUBSIDIARIES
NOTES TO CONSOLIDATED FINANCIAL STATEMENTS—(Continued)
Continuous unrealized loss position
The following table shows the gross unrealized losses, net of allowance for credit losses, and fair value of
and
securities, aggregated by the length of time that individual securities have been in a continuous unrealized loss position, at March 31, 2020 and 2021:
available-for-sale
held-to-maturity
|
Less than 12 months
|
12 months or more
|
Total
|
||||||||||||||||||||||
|
Fair
value
|
Gross
unrealized
losses
|
Fair
value
|
Gross
unrealized
losses
|
Fair
value
|
Gross
unrealized
losses
|
|||||||||||||||||||
|
(in millions of yen)
|
||||||||||||||||||||||||
|
2020
|
||||||||||||||||||||||||
|
Available-for-sale
|
||||||||||||||||||||||||
|
Debt securities:
|
||||||||||||||||||||||||
|
Japanese government bonds
|
|
|
|
|
|
|
||||||||||||||||||
|
Japanese local government bonds
|
|
|
|
|
|
|
||||||||||||||||||
|
U.S. Treasury bonds and federal agency securities
|
|
|
|
|
|
|
||||||||||||||||||
|
Other foreign government bonds
|
|
|
|
|
|
|
||||||||||||||||||
|
Agency mortgage-backed securities
(1)
|
|
|
|
|
|
|
||||||||||||||||||
|
Residential mortgage-backed securities
|
|
|
|
|
|
|
||||||||||||||||||
|
Commercial mortgage-backed securities
|
|
|
|
|
|
|
||||||||||||||||||
|
Japanese corporate bonds and other debt securities
|
|
|
|
|
|
|
||||||||||||||||||
|
Foreign corporate bonds and other debt securities
|
|
|
|
|
|
|
||||||||||||||||||
|
|
|
|
|
|
|
|
|
|
|
|
|
|||||||||||||
|
Total
|
|
|
|
|
|
|
||||||||||||||||||
|
|
|
|
|
|
|
|
|
|
|
|
|
|||||||||||||
|
Held-to-maturity
|
||||||||||||||||||||||||
|
Debt securities:
|
||||||||||||||||||||||||
|
Agency mortgage-backed securities
(2)
|
|
|
|
|
|
|
||||||||||||||||||
|
|
|
|
|
|
|
|
|
|
|
|
|
|||||||||||||
|
Total
|
|
|
|
|
|
|
||||||||||||||||||
|
|
|
|
|
|
|
|
|
|
|
|
|
|||||||||||||
|
2021
|
||||||||||||||||||||||||
|
Available-for-sale
|
||||||||||||||||||||||||
|
Debt securities:
|
||||||||||||||||||||||||
|
Japanese government bonds
|
|
|
|
|
|
|
||||||||||||||||||
|
Japanese local government bonds
|
|
|
|
|
|
|
||||||||||||||||||
|
U.S. Treasury bonds and federal agency securities
|
|
|
|
|
|
|
||||||||||||||||||
|
Other foreign government bonds
|
|
|
|
|
|
|
||||||||||||||||||
|
Agency mortgage-backed securities
(1)
|
|
|
|
|
|
|
||||||||||||||||||
|
Residential mortgage-backed securities
|
|
|
|
|
|
|
||||||||||||||||||
|
Commercial mortgage-backed securities
|
|
|
|
|
|
|
||||||||||||||||||
|
Japanese corporate bonds and other debt securities
|
|
|
|
|
|
|
||||||||||||||||||
|
Foreign corporate bonds and other debt securities
|
|
|
|
|
|
|
||||||||||||||||||
|
|
|
|
|
|
|
|
|
|
|
|
|
|||||||||||||
|
Total
|
|
|
|
|
|
|
||||||||||||||||||
|
|
|
|
|
|
|
|
|
|
|
|
|
|||||||||||||
Notes:
| (1) |
Agency mortgage-backed securities presented in this line consist of Japanese agency mortgage-backed securities, of which the fair values were ¥
|
| (2) |
All Agency mortgage-backed securities presented in this line are Ginnie Mae securities.
|
F-
32
MIZUHO FINANCIAL GROUP, INC. AND SUBSIDIARIES
NOTES TO CONSOLIDATED FINANCIAL STATEMENTS—(Continued)
At March 31, 2021, the MHFG Group did not intend to sell the debt securities in an unrealized loss position and it was not more likely than not that the MHFG Group would be required to sell them before the recovery of their amortized cost bases. For Japanese government bonds, U.S. Treasury bonds and federal agency securities and Agency mortgage-backed securities, their entire amortized cost bases were expected to be recovered since the unrealized losses had not resulted from credit deterioration, but primarily from changes in interest rates. For the debt securities other than those described above, except for the securities for which credit losses have been recognized in income, the MHFG Group determined that their entire amortized cost bases were expected to be recovered, after considering various factors such as the extent to which their fair values were below their amortized cost bases, the external and/or internal ratings and the present values of cash flows expected to be collected. Based on the aforementioned evaluation, except for the securities for which credit losses have been recognized in income, the MHFG Group determined that the debt securities in an unrealized loss position were not considered credit losses.
Realized gains and losses
The following table shows the realized gains and losses on sales of
securities for the fiscal years ended March 31, 2019, 2020 and 2021. See “Consolidated Statements of Cash Flows for the fiscal years ended March 31, 2019, 2020 and 2021” for the proceeds from sales of investments.
available-for-sale
|
2019
|
2020
|
2021
|
||||||||||
|
(in millions of yen)
|
||||||||||||
|
Gross realized gains
|
|
|
|
|||||||||
|
Gross realized losses
|
(
|
) |
(
|
) |
(
|
) | ||||||
|
|
|
|
|
|
|
|||||||
|
Net realized gains (losses) on sales of
available-for-sale
|
(
|
) |
|
(
|
) | |||||||
|
|
|
|
|
|
|
|||||||
Equity securities
Equity securities include securities which have readily determinable fair values, securities which qualify for the practical expedient to estimate fair value using the net asset value per share (or its equivalent), and securities which are without readily determinable fair values. Equity securities which have readily determinable fair values mainly consist of common stock of Japanese listed companies. Equity securities without readily determinable fair values include
non-marketable
stock including preferred stock issued by equity method investees.
Net gains and losses
The following table shows the details of the net gains and losses on Equity securities for the fiscal years ended March 31, 2019, 2020 and 2021:
|
2019
|
2020
|
2021
|
||||||||||
|
(in millions of yen)
|
||||||||||||
|
Net gains (losses) recognized during the period on equity securities
|
(
|
) |
(
|
) |
|
|||||||
|
Less: Net gains (losses) recognized during the period on equity securities sold during the period
|
|
|
|
|||||||||
|
|
|
|
|
|
|
|||||||
|
Unrealized gains (losses) recognized during the reporting period on equity securities still held at the reporting period
|
(
|
) |
(
|
) |
|
|||||||
|
|
|
|
|
|
|
|||||||
F-
33
MIZUHO FINANCIAL GROUP, INC. AND SUBSIDIARIES
NOTES TO CONSOLIDATED FINANCIAL STATEMENTS—(Continued)
Equity securities without readily determinable fair values
The following table shows carrying amounts of equity securities without readily determinable fair values, for which the measurement alternative is used, and cumulative amounts due to downward adjustments and impairments and upward adjustments, at March 31, 2019, 2020 and 2021:
|
2019
|
2020
|
2021
|
||||||||||
|
(in millions of yen)
|
||||||||||||
|
Carrying amounts at the end of the period
|
|
|
|
|||||||||
|
Downward adjustments and impairments
|
|
|
|
|||||||||
|
Upward adjustments
|
|
|
|
|||||||||
The following table shows amounts recognized in earnings during the period due to downward adjustments and impairments and upward adjustments for equity securities without readily determinable fair values.
|
2019
|
2020
|
2021
|
||||||||||
|
(in millions of yen)
|
||||||||||||
|
Downward adjustments and impairments
|
|
|
|
|||||||||
|
Upward adjustments
|
|
|
|
|||||||||
The MHFG Group elected to measure all equity securities without readily determinable fair values, which do not qualify for the practical expedient to estimate fair value, using the measurement alternative, which is made on an
basis. Under the measurement alternative, equity securities are carried at cost plus or minus changes resulting from observable price changes in orderly transactions for the identical or similar securities of the same issuer. In addition, the MHFG Group assesses whether these equity securities are impaired. Impairment is primarily based on a liquidation value technique that considers the financial condition, credit ratings, and near-term prospects of the issuers. When observable price changes or impairments exist, the securities are adjusted to fair value, with the full difference between the fair value of the security and its carrying amount recognized in earnings.
instrument-by-instrument
Other investments
The following table summarizes the composition of Other investments at March 31, 2020 and 2021:
|
2020
|
2021
|
|||||||
|
(in millions of yen)
|
||||||||
|
Equity method investments
|
|
|
||||||
|
Investments held by consolidated investment companies
|
|
|
||||||
|
|
|
|
|
|||||
|
Total
|
|
|
||||||
|
|
|
|
|
|||||
Equity method investments
Investments in investees over which the MHFG Group has the ability to exert significant influence are accounted for using the equity method of accounting. Such investments included marketable equity securities with carrying values of ¥
213,243
million and ¥
229,156
million, at March 31, 2020 and 2021, respectively. The aggregate market values of these marketable equity securities were ¥
287,488
million and ¥
424,267
million, respectively. The majority of aggregate market values of these marketable equity securities include Orient Corporation, the Chiba Kogyo Bank, Ltd., Joint Stock Commercial Bank for Foreign Trade of Vietnam and Mizuho Leasing Company, Limited of which the MHFG Group’s proportionate share of the total outstanding common stock were
49.00
%,
16.89
%,
15.00
% and
23.52
%, respectively, as of March 31, 2021. In addition, equity method
F-3
4
MIZUHO FINANCIAL GROUP, INC. AND SUBSIDIARIES
NOTES TO CONSOLIDATED FINANCIAL STATEMENTS—(Continued)
investments include
16.41
% and
27.00
%, respectively, as of March 31, 2021.
non-marketable
equity securities such as Matthews International Capital Management, LLC and Custody Bank of Japan, Ltd. of which the MHFG Group’s proportionate share of the total outstanding common stock were
Investments held by consolidated investment companies
The MHFG Group consolidates certain investment companies over which it has control through either ownership or other means. Investment companies are subject to specialized industry accounting which requires investments to be carried at fair value, with changes in fair value recorded in earnings. The MHFG Group maintains this specialized industry accounting for investments held by consolidated investment companies, which consist of marketable and
non-marketable
investments.
4. Loans
The table below presents loans outstanding by domicile and industry of borrower at March 31, 2020 and 2021:
|
2020
|
2021
|
|||||||
|
(in millions of yen)
|
||||||||
|
Domestic:
|
||||||||
|
Manufacturing
|
|
|
||||||
|
Construction and real estate
|
|
|
||||||
|
Services
|
|
|
||||||
|
Wholesale and retail
|
|
|
||||||
|
Transportation and communications
|
|
|
||||||
|
Banks and other financial institutions
(1)
|
|
|
||||||
|
Government and public institutions
|
|
|
||||||
|
Other industries
(2
)
|
|
|
||||||
|
Individuals:
|
||||||||
|
Mortgage loans
|
|
|
||||||
|
Other
|
|
|
||||||
|
|
|
|
|
|||||
|
Total domestic
|
|
|
||||||
|
|
|
|
|
|||||
|
Foreign:
|
||||||||
|
Commercial and industrial
(3)
|
|
|
||||||
|
Banks and other financial institutions
(
4
)
|
|
|
||||||
|
Government and public institutions
|
|
|
||||||
|
Other
|
|
|
||||||
|
|
|
|
|
|||||
|
Total foreign
|
|
|
||||||
|
|
|
|
|
|||||
|
Total
|
|
|
||||||
|
Less: Unearned income and deferred loan fees—net
|
|
|
||||||
|
|
|
|
|
|||||
|
Total loans before allowance for credit losses on loans
|
|
|
||||||
|
|
|
|||||||
Notes:
|
(1)
|
Banks and other financial institutions of domestic includes mainly banks, securities companies, insurance companies and credit card companies.
|
|
(2)
|
Other industries of domestic includes trade receivables and lease receivables of consolidated VIEs.
|
|
(3)
|
Commercial and industrial of foreign includes ¥
|
|
(4)
|
Banks and other financial institutions of foreign includes mainly banks and financial services companies.
|
F-3
5
MIZUHO FINANCIAL GROUP, INC. AND SUBSIDIARIES
NOTES TO CONSOLIDATED FINANCIAL STATEMENTS—(Continued)
Net losses on sales of loans were ¥
2,018
million, ¥
1,036
million and ¥
8,172
million including unrealized losses related to recording loans held for sale at the lower of cost or fair value for the fiscal years ended March 31, 2019, 2020 and 2021, respectively. The gains and losses on sales of loans are recorded in Other noninterest i
n
come and expenses, respectively.
Credit quality information
In accordance with the MHFG Group’s credit risk management policies, the Group uses an internal rating system that consists of credit ratings for the corporate portfolio segment and pool allocations for the retail portfolio segment as the basis of its risk management infrastructure. Credit ratings consist of obligor ratings which represent the level of credit risk of the obligor, and transaction ratings which represent the ultimate possibility of losses expected on individual loans by taking into consideration various factors such as collateral or guarantees involved. In principle, obligor ratings are applied to all obligors except those to which pool allocations are applied, and are subject to regular review at least once a year as well as special review which is required whenever the obligor’s credit standing changes. Pool allocations are applied to small loans that are less than a specified amount by pooling customers and loans with similar risk characteristics, and the risk is assessed mainly based on past due status and managed according to such pools. The Group generally reviews the appropriateness and effectiveness of the approach to obligor ratings and pool allocations once a year in accordance with predetermined policies and procedures. See Note 3 “Investments” for the credit losses related to
and
debt securities.
held-to-maturity
available-for-sale
The Group does not record expected credit losses for accrued interest receivables because uncollectible accrued interest is reversed through interest income in a timely manner in line with the Group’s nonaccrual and past due policies for loans. The amount of accrued interest receivables at March 31, 2021 was ¥
77,764
million and included in Accrued income.
F-3
6
MIZUHO FINANCIAL GROUP, INC. AND SUBSIDIARIES
NOTES TO CONSOLIDATED FINANCIAL STATEMENTS—(Continued)
The table below presents the MHFG Group’s definition of obligor ratings used by MHBK and MHTB, and equivalent obligor ratings are determined for the other subsidiari
e
s:
|
Obligor category
(1)(2)
|
Obligor rating
|
Definition
|
||
|
Normal
|
A | Obligors whose certainty of debt fulfillment is very high, hence their level of credit risk is very low. | ||
| B | Obligors whose certainty of debt fulfillment poses no problems for the foreseeable future, and their level of credit risk is low. | |||
| C | Obligors whose certainty of debt fulfillment and their level of credit risk pose no problems for the foreseeable future. | |||
| D | Obligors whose current certainty of debt fulfillment poses no problems, however, their resistance to future economic environmental changes is low. | |||
|
Watch
|
E1 | Obligors that require observation going forward because of either minor concerns regarding their financial position, or their somewhat weak or unstable business conditions. | ||
| E2 | Obligors that require special observation going forward because of problems with their borrowings such as reduced or suspended interest payments, problems with debt fulfillment such as failure to make principal or interest payments, or problems with their financial position as a result of their weak or unstable business conditions. | |||
|
Intensive control
|
F | Obligors that are not yet bankrupt but are in financial difficulties and are deemed likely to become bankrupt in the future because of insufficient progress in implementing their management improvement plans or other measures (including obligors that are receiving ongoing support from financial institutions). | ||
|
Substantially bankrupt
|
G | Obligors that have not yet become legally or formally bankrupt but are substantially insolvent because they are in serious financial difficulties and are deemed to be incapable of being restructured. | ||
|
Bankrupt
|
H | Obligors that have become legally or formally bankrupt. | ||
Notes:
| (1) |
Special attention obligors are watch obligors with debt in TDR or 90 days or more delinquent debt. Loans to such obligors are considered nonaccrual.
|
| (2) |
The Group classifies loans to special attention, intensive control, substantially bankrupt and bankrupt obligors as nonaccrual loans.
|
F-3
7
MIZUHO FINANCIAL GROUP, INC. AND SUBSIDIARIES
NOTES TO CONSOLIDATED FINANCIAL STATEMENTS—(Continued)
The table below presents credit quality information of loans based on the MHFG Group’s internal rating system at March 31, 2020 and 2021:
|
March 31, 2021
|
March 31,
2020 |
|||||||||||||||||||||||||||||||||||
|
Term loans by origination year
|
||||||||||||||||||||||||||||||||||||
|
2020
|
2019
|
2018
|
2017
|
2016
|
Prior to
2016 |
Revolving
Loans
|
Total
|
Total
|
||||||||||||||||||||||||||||
|
(in millions of yen)
|
||||||||||||||||||||||||||||||||||||
|
Domestic:
|
||||||||||||||||||||||||||||||||||||
|
Corporate:
|
||||||||||||||||||||||||||||||||||||
|
Large companies:
|
||||||||||||||||||||||||||||||||||||
|
Normal obligors
|
|
|
|
|
|
|
|
|
|
|||||||||||||||||||||||||||
|
Watch obligors excluding special attention obligors
|
|
|
|
|
|
|
|
|
|
|||||||||||||||||||||||||||
|
Nonaccrual loans
|
|
|
|
|
|
|
|
|
|
|||||||||||||||||||||||||||
|
Small and
medium-sized
companies:
|
||||||||||||||||||||||||||||||||||||
|
Normal obligors
|
|
|
|
|
|
|
|
|
|
|||||||||||||||||||||||||||
|
Watch obligors excluding special attention obligors
|
|
|
|
|
|
|
|
|
|
|||||||||||||||||||||||||||
|
Nonaccrual loans
|
|
|
|
|
|
|
|
|
|
|||||||||||||||||||||||||||
|
Retail:
|
||||||||||||||||||||||||||||||||||||
|
Housing Loan:
|
||||||||||||||||||||||||||||||||||||
|
Normal obligors
|
|
|
|
|
|
|
|
|
|
|||||||||||||||||||||||||||
|
Watch obligors excluding special attention obligors
|
|
|
|
|
|
|
|
|
|
|||||||||||||||||||||||||||
|
Nonaccrual loans
|
|
|
|
|
|
|
|
|
|
|||||||||||||||||||||||||||
|
Others:
|
||||||||||||||||||||||||||||||||||||
|
Normal obligors
|
|
|
|
|
|
|
|
|
|
|||||||||||||||||||||||||||
|
Watch obligors excluding special attention obligors
|
|
|
|
|
|
|
|
|
|
|||||||||||||||||||||||||||
|
Nonaccrual loans
|
|
|
|
|
|
|
|
|
|
|||||||||||||||||||||||||||
|
Sovereign:
|
||||||||||||||||||||||||||||||||||||
|
Normal obligors
|
|
|
|
|
|
|
|
|
|
|||||||||||||||||||||||||||
|
Watch obligors excluding special attention obligors
|
|
|
|
|
|
|
|
|
|
|||||||||||||||||||||||||||
|
Nonaccrual loans
|
|
|
|
|
|
|
|
|
|
|||||||||||||||||||||||||||
|
Banks and other financial institutions
(4)
:
|
||||||||||||||||||||||||||||||||||||
|
Normal obligors
|
|
|
|
|
|
|
|
|
|
|||||||||||||||||||||||||||
|
Watch obligors excluding special attention obligors
|
|
|
|
|
|
|
|
|
|
|||||||||||||||||||||||||||
|
Nonaccrual loans
|
|
|
|
|
|
|
|
|
|
|||||||||||||||||||||||||||
|
|
|
|
|
|
|
|
|
|
|
|
|
|
|
|
|
|
|
|||||||||||||||||||
|
Total domestic
|
|
|
|
|
|
|
|
|
|
|||||||||||||||||||||||||||
|
|
|
|
|
|
|
|
|
|
|
|
|
|
|
|
|
|
|
|||||||||||||||||||
|
Foreign:
|
||||||||||||||||||||||||||||||||||||
|
Corporate:
|
||||||||||||||||||||||||||||||||||||
|
Normal obligors
|
|
|
|
|
|
|
|
|
|
|||||||||||||||||||||||||||
|
Watch obligors excluding special attention obligors
|
|
|
|
|
|
|
|
|
|
|||||||||||||||||||||||||||
|
Nonaccrual loans
|
|
|
|
|
|
|
|
|
|
|||||||||||||||||||||||||||
|
Retail:
|
||||||||||||||||||||||||||||||||||||
|
Normal obligors
|
|
|
|
|
|
|
|
|
|
|||||||||||||||||||||||||||
|
Watch obligors excluding special attention obligors
|
|
|
|
|
|
|
|
|
|
|||||||||||||||||||||||||||
|
Nonaccrual loans
|
|
|
|
|
|
|
|
|
|
|||||||||||||||||||||||||||
|
Sovereign:
|
||||||||||||||||||||||||||||||||||||
|
Normal obligors
|
|
|
|
|
|
|
|
|
|
|||||||||||||||||||||||||||
|
Watch obligors excluding special attention obligors
|
|
|
|
|
|
|
|
|
|
|||||||||||||||||||||||||||
|
Nonaccrual loans
|
|
|
|
|
|
|
|
|
|
|||||||||||||||||||||||||||
|
Banks and other financial institutions
(5)
:
|
||||||||||||||||||||||||||||||||||||
|
Normal obligors
|
|
|
|
|
|
|
|
|
|
|||||||||||||||||||||||||||
|
Watch obligors excluding special attention obligors
|
|
|
|
|
|
|
|
|
|
|||||||||||||||||||||||||||
|
Nonaccrual loans
|
|
|
|
|
|
|
|
|
|
|||||||||||||||||||||||||||
|
|
|
|
|
|
|
|
|
|
|
|
|
|
|
|
|
|
|
|||||||||||||||||||
|
Total foreign
|
|
|
|
|
|
|
|
|
|
|||||||||||||||||||||||||||
|
|
|
|
|
|
|
|
|
|
|
|
|
|
|
|
|
|
|
|||||||||||||||||||
|
Total
|
|
|
|
|
|
|
|
|
|
|||||||||||||||||||||||||||
|
|
|
|
|
|
|
|
|
|
|
|
|
|
|
|
|
|
|
|||||||||||||||||||
F-3
8
MIZUHO FINANCIAL GROUP, INC. AND SUBSIDIARIES
NOTES TO CONSOLIDATED FINANCIAL STATEMENTS—(Continued)
Notes:
| (1) |
Special attention obligors are watch obligors with debt in TDR or 90 days or more delinquent debt. Loans to such obligors are considered nonacccrual.
|
| (2) |
The primary component of the retail portfolio segment is housing loans to individuals which obligor category is classified based on past due status. The trigger to reclassify obligors from normal obligors to watch obligors excluding special attention obligors is when the past due status is more than 30 days.
|
| (3) |
There were no significant revolving line of credit arrangements that converted to term loans during the fiscal year ended March 31, 2021.
|
|
(4)
|
Banks and other financial i
n
stitutions of domestic includes mainly banks and securities companies.
|
|
(5)
|
Banks and other financial institutions of foreign includes mainly banks.
|
Nonaccrual loans
The MHFG Group considers loans to be nonaccrual when it is probable that the Group will be unable to collect all the scheduled payments of principal and interest when due according to the contractual terms of the loans. The Group classifies loans to special attention, intensive control, substantially bankrupt and bankrupt obligors as nonaccrual loans. There are no loans that are ninety days past due and still accruing. The Group does not have any loans to borrowers that cause management to have serious doubts as to the ability of such borrowers to comply with the present loan repayment terms for the periods presented other than those already designated as nonaccrual loans.
The table below presents nonaccrual loans information at March 31, 2020 and 2021:
|
Amortized cost
|
Interest
income
recognized
|
|||||||||||||||
|
Nonaccrual
loans with an
allowance
|
Nonaccrual
loans without
an allowance
|
Total
nonaccrual
loans
|
||||||||||||||
|
(in millions of yen)
|
||||||||||||||||
|
2020
|
||||||||||||||||
|
Domestic:
|
||||||||||||||||
|
Corporate:
|
||||||||||||||||
|
Large companies
|
|
|
|
|
||||||||||||
|
Small and
medium-sized
companies
|
|
|
|
|
||||||||||||
|
Retail:
|
||||||||||||||||
|
Housing Loan
|
|
|
|
|
||||||||||||
|
Others
|
|
|
|
|
||||||||||||
|
|
|
|
|
|
|
|
|
|||||||||
|
Total domestic
|
|
|
|
|
||||||||||||
|
|
|
|
|
|
|
|
|
|||||||||
|
Foreign:
|
||||||||||||||||
|
Total foreign
|
|
|
|
|
||||||||||||
|
|
|
|
|
|
|
|
|
|||||||||
|
Total
|
|
|
|
|
||||||||||||
|
|
|
|
|
|
|
|
|
|||||||||
|
2021
|
||||||||||||||||
|
Domestic:
|
||||||||||||||||
|
Corporate:
|
||||||||||||||||
|
Large companies
|
|
|
|
|
||||||||||||
|
Small and
medium-sized
companies
|
|
|
|
|
||||||||||||
|
Retail:
|
||||||||||||||||
|
Housing Loan
|
|
|
|
|
||||||||||||
|
Others
|
|
|
|
|
||||||||||||
|
|
|
|
|
|
|
|
|
|||||||||
|
Total domestic
|
|
|
|
|
||||||||||||
|
|
|
|
|
|
|
|
|
|||||||||
|
Foreign:
|
||||||||||||||||
|
Total foreign
|
|
|
|
|
||||||||||||
|
|
|
|
|
|
|
|
|
|||||||||
|
Total
|
|
|
|
|
||||||||||||
|
|
|
|
|
|
|
|
|
|||||||||
Notes:
| (1) |
Amounts represent the outstanding balances of nonaccrual loans. The MHFG Group’s policy for placing loans in nonaccrual status corresponds to the Group’s definition of nonaccrual loans.
|
F-3
9
MIZUHO FINANCIAL GROUP, INC. AND SUBSIDIARIES
NOTES TO CONSOLIDATED FINANCIAL STATEMENTS—(Continued)
| (2) |
Amounts represent the amount of interest income on nonaccrual loans recognized on a cash basis and included in Interest income on loans in the consolidated statements of income.
|
| (3) |
The majority of total foreign consist of corporate.
|
The remaining balance of nonaccrual loans that have been partially charged off, was ¥
20,378
million and ¥
20,197
million as of March 31, 2020 and 2021, respectively.
Troubled debt restructurings
The MHFG Group considers a loan modification to be a TDR when, for economic or legal reasons related to the obligor’s financial difficulties, it grants a concession to the obligor that it would not otherwise consider. The Group considers the relevant obligor to be in financial difficulty generally when its obligor rating is E2 or below.
The following table presents modified loans that were determined to be TDRs during the fiscal years ended March 31, 2020 and 2021:
|
Loan forgiveness or debt to
equity swaps
|
Interest rate
reduction and/or
postponement of
principal and/or
interest
|
|||||||||||
|
Recorded
investment
(1)
|
Charge-offs
|
|||||||||||
|
(in millions of yen)
|
||||||||||||
|
2020
|
||||||||||||
|
Domestic:
|
||||||||||||
|
Corporate:
|
||||||||||||
|
Large companies
|
|
|
|
|||||||||
|
Small and
medium-sized
companies
|
— | — |
|
|||||||||
|
Retail:
|
||||||||||||
|
Housing Loan
|
— | — |
|
|||||||||
|
Others
|
— | — |
|
|||||||||
|
|
|
|
|
|
|
|||||||
|
Total domestic
|
|
|
|
|||||||||
|
|
|
|
|
|
|
|||||||
|
Foreign:
|
||||||||||||
|
Total foreign
|
|
|
|
|||||||||
|
|
|
|
|
|
|
|||||||
|
Total
|
|
|
|
|||||||||
|
|
|
|
|
|
|
|||||||
|
2021
|
||||||||||||
|
Domestic:
|
||||||||||||
|
Corporate:
|
||||||||||||
|
Large companies
|
|
|
|
|||||||||
|
Small and
medium-sized
companies
|
|
|
|
|||||||||
|
Retail:
|
||||||||||||
|
Housing Loan
|
|
|
|
|||||||||
|
Others
|
|
|
|
|||||||||
|
Banks and other financial institutions
|
|
|
|
|||||||||
|
|
|
|
|
|
|
|||||||
|
Total domestic
|
|
|
|
|||||||||
|
|
|
|
|
|
|
|||||||
|
Foreign:
|
||||||||||||
|
Total foreign
|
|
|
|
|||||||||
|
|
|
|
|
|
|
|||||||
|
Total
|
|
|
|
|||||||||
|
|
|
|
|
|
|
|||||||
Notes:
| (1) |
Amounts represent the book values of loans immediately after the restructurings.
|
| (2) |
The majority of total foreign consist of corporate.
|
F-
40
MIZUHO FINANCIAL GROUP, INC. AND SUBSIDIARIES
NOTES TO CONSOLIDATED FINANCIAL STATEMENTS—(Continued)
Payment default is deemed to occur when the loan becomes three months past due or the obligor is downgraded to the category of substantially bankrupt or bankrupt.
The following table presents payment defaults which occurred during the fiscal years ended March 31, 2020 and 2021 with respect to the loans modified as TDRs within the previous twelve months:
|
Recorded investment
|
||||||||
|
2020
|
2021
|
|||||||
|
(in millions of yen)
|
||||||||
|
Domestic:
|
||||||||
|
Corporate:
|
||||||||
|
Large companies
|
|
|
||||||
|
Small and
medium-sized
companies
|
|
|
||||||
|
Retail:
|
||||||||
|
Housing Loan
|
|
|
||||||
|
Others
|
|
|
||||||
|
|
|
|
|
|||||
|
Total domestic
|
|
|
||||||
|
|
|
|
|
|||||
|
Foreign:
|
||||||||
|
Total foreign
|
|
|
||||||
|
|
|
|
|
|||||
|
Total
|
|
|
||||||
|
|
|
|
|
|||||
F-
41
MIZUHO FINANCIAL GROUP, INC. AND SUBSIDIARIES
NOTES TO CONSOLIDATED FINANCIAL STATEMENTS—(Continued)
Age analysis of past due loans
The table below presents an analysis of the age of the amortized cost basis in loans that are past due at March 31, 2020 and 2021:
|
30-59 days
past due
|
60-89 days
past due
|
90 days or
more past due
|
Total past
due
|
Current
|
Total
|
|||||||||||||||||||
|
(in millions of yen)
|
||||||||||||||||||||||||
|
2020
|
||||||||||||||||||||||||
|
Domestic:
|
||||||||||||||||||||||||
|
Corporate:
|
||||||||||||||||||||||||
|
Large companies
|
|
|
|
|
|
|
||||||||||||||||||
|
Small and
medium-sized
companies
|
|
|
|
|
|
|
||||||||||||||||||
|
Retail:
|
||||||||||||||||||||||||
|
Housing Loan
|
|
|
|
|
|
|
||||||||||||||||||
|
Others
|
|
|
|
|
1,901,593 |
|
||||||||||||||||||
|
Sovereign
|
— | — | — | — |
|
|
||||||||||||||||||
|
Banks and other financial institutions
|
— | — | — | — |
|
|
||||||||||||||||||
|
|
|
|
|
|
|
|
|
|
|
|
|
|||||||||||||
|
Total domestic
|
|
|
|
|
|
|
||||||||||||||||||
|
|
|
|
|
|
|
|
|
|
|
|
|
|||||||||||||
|
Foreign:
|
||||||||||||||||||||||||
|
Total foreign
|
|
|
|
|
|
|
||||||||||||||||||
|
|
|
|
|
|
|
|
|
|
|
|
|
|||||||||||||
|
Total
|
|
|
|
|
|
|
||||||||||||||||||
|
|
|
|
|
|
|
|
|
|
|
|
|
|||||||||||||
|
2021
|
||||||||||||||||||||||||
|
Domestic:
|
||||||||||||||||||||||||
|
Corporate:
|
||||||||||||||||||||||||
|
Large companies
|
|
|
|
|
|
|
||||||||||||||||||
|
Small and
medium-sized
companies
|
|
|
|
|
|
|
||||||||||||||||||
|
Retail:
|
||||||||||||||||||||||||
|
Housing Loan
|
|
|
|
|
|
|
||||||||||||||||||
|
Others
|
|
|
|
|
|
|
||||||||||||||||||
|
Sovereign
|
|
|
|
|
|
|
||||||||||||||||||
|
Banks and other financial institutions
|
|
|
|
|
|
|
||||||||||||||||||
|
|
|
|
|
|
|
|
|
|
|
|
|
|||||||||||||
|
Total domestic
|
|
|
|
|
|
|
||||||||||||||||||
|
|
|
|
|
|
|
|
|
|
|
|
|
|||||||||||||
|
Foreign:
|
||||||||||||||||||||||||
|
Total foreign
|
|
|
|
|
|
|
||||||||||||||||||
|
|
|
|
|
|
|
|
|
|
|
|
|
|||||||||||||
|
Total
|
|
|
|
|
|
|
||||||||||||||||||
|
|
|
|
|
|
|
|
|
|
|
|
|
|||||||||||||
| Note: |
The majority of total foreign consist of corporate.
|
Collateral Dependent Loans
The MHFG Group uses, as a practical ex
p
edient, the fair value of the collateral when recording the net carrying amounts of loans and determining the allowance for credit losses of such loans, for which the repayment is expected to be provided substantially through the operation or sale of the collateral, when the borrower is experiencing financial difficulty based on the assessment as of the reporting date. As of March 31, 2021, collateral relating to these loans comprised of real estate, exchange traded equity securities and deposits, etc., and primarily collateral type was real estate. There were no significant changes in the extent to which collateral secures these loans during this fiscal year and no significant concentration of collateral against any portfolio segment.
F-
42
MIZUHO FINANCIAL GROUP, INC. AND SUBSIDIARIES
NOTES TO CONSOLIDATED FINANCIAL STATEMENTS—(Continued)
5. Allowance for credit losses on loans
Changes in Allowance for credit losses on loans by portfolio segment for the fiscal years ended March 31, 2019, 2020 and 2021 are shown below:
|
Corporate
|
Retail
|
Total
|
||||||||||
|
(in millions of yen)
|
||||||||||||
|
2019
|
||||||||||||
|
Balance at beginning of fiscal year
|
|
|
|
|||||||||
|
|
|
|
|
|
|
|||||||
|
Provision (credit) for credit losses on loans
|
|
|
|
|||||||||
|
|
|
|
|
|
|
|||||||
|
Charge-offs
|
(
|
) |
(
|
) |
(
|
) | ||||||
|
Recoveries
|
|
|
|
|||||||||
|
|
|
|
|
|
|
|||||||
|
Net charge-offs
|
(
|
) |
(
|
) |
(
|
) | ||||||
|
|
|
|
|
|
|
|||||||
|
Others
(Note)
|
(
|
) |
(
|
) |
(
|
) | ||||||
|
|
|
|
|
|
|
|||||||
|
Balance at end of fiscal year
|
|
|
|
|||||||||
|
|
|
|
|
|
|
|||||||
|
2020
|
||||||||||||
|
Balance at beginning of fiscal year
|
|
|
|
|||||||||
|
|
|
|
|
|
|
|||||||
|
Provision (credit) for credit losses on loans
|
|
|
|
|||||||||
|
|
|
|
|
|
|
|||||||
|
Charge-offs
|
(
|
) |
(
|
) |
(
|
) | ||||||
|
Recoveries
|
|
|
|
|||||||||
|
|
|
|
|
|
|
|||||||
|
Net charge-offs
|
(
|
) |
(
|
) |
(
|
) | ||||||
|
|
|
|
|
|
|
|||||||
|
Others
(Note)
|
(
|
) |
|
(
|
) | |||||||
|
|
|
|
|
|
|
|||||||
|
Balance at end of fiscal year
|
|
|
|
|||||||||
|
|
|
|
|
|
|
|||||||
|
2021
|
||||||||||||
|
Balance at beginning of fiscal year
|
|
|
|
|||||||||
|
|
|
|
|
|
|
|||||||
|
April 1, 2020 adoption of CECL
|
|
|
|
|||||||||
|
|
|
|
|
|
|
|||||||
|
Adjusted Balance at beginning of period
|
|
|
|
|||||||||
|
|
|
|
|
|
|
|||||||
|
Provision (credit) for credit losses on loans
|
|
(
|
) |
|
||||||||
|
|
|
|
|
|
|
|||||||
|
Charge-offs
|
(
|
) |
(
|
) |
(
|
) | ||||||
|
Recoveries
|
|
|
|
|||||||||
|
|
|
|
|
|
|
|||||||
|
Net charge-offs
|
(
|
) |
(
|
) |
(
|
) | ||||||
|
|
|
|
|
|
|
|||||||
|
Others
(Note)
|
|
(
|
) |
|
||||||||
|
|
|
|
|
|
|
|||||||
|
Balance at end of fiscal year
|
|
|
|
|||||||||
|
|
|
|
|
|
|
|||||||
| Note: |
Others includes primarily foreign exchange translation.
|
F-
43
MIZUHO FINANCIAL GROUP, INC. AND SUBSIDIARIES
NOTES TO CONSOLIDATED FINANCIAL STATEMENTS—(Continued)
6. Premises and equipment
Premises and equipment at March 31, 2020 and 2021 consist of the following:
|
2020
|
2021
|
|||||||
|
(in millions of yen)
|
||||||||
|
Land
|
|
|
||||||
|
Buildings
|
|
|
||||||
|
Equipment and furniture
|
|
|
||||||
|
Leasehold improvements
|
|
|
||||||
|
Construction in progress
|
|
|
||||||
|
Software
|
|
|
||||||
|
|
|
|
|
|||||
|
Total
|
|
|
||||||
|
Less: Accumulated depreciation and amortization
|
|
|
||||||
|
|
|
|
|
|||||
|
Premises and equipment—net
|
|
|
||||||
|
|
|
|
|
|||||
Depreciation and amortization expense for premises and equipment for the fiscal years ended March 31, 2019, 2020 and 2021 was ¥
345,560
million, ¥
234,457
million and ¥
223,164
million, respectively.
Depreciation and amortization expense related to software was reported in General and administrative expenses, and all other depreciation and amortization expense was reported in Occupancy expenses.
The MHFG Group recognized impairment losses of ¥
27,428
million on premises and equipment for the fiscal year ended March 31, 2019, of which ¥
8,910
million was recorded in General and administrative expenses and ¥
18,518
million
15,761
million of impairment losses primarily on real estate of certain branches recognized in Retail & Business Banking Company. In relation to the Group’s branch network strategy, these branches are either no longer being used for its banking operations or the carrying amounts are not recoverable because of the Group’s intention to close these branches.
w
as recorded in Occupancy expenses. Such losses included ¥
The MHFG Group recognized impairment losses of ¥
13,490
million on premises and equipment for the fiscal year ended March 31, 2020, of which ¥
6,813
million was recorded in General and administrative expenses and ¥
6,677
million was recorded in Occupancy expenses. Such losses included ¥
6,774
million of impairment losses related mainly to entity-wide software that are no longer to be used. In addition, ¥
5,587
million of impairment losses were recognized on real estate used mainly as the entity-wide assets and certain branches in Retail & Business Banking Company. These real estates are either no longer being used or the carrying amounts are not recoverable.
The MHFG Group recognized impairment losses of ¥
7,101
million on premises and equipment for the fiscal year ended March 31, 2021, of which ¥
3,872
million was recorded in General and administrative expenses and ¥
3,229
million was recorded in Occupancy expenses. Such losses included ¥
3,397
million of impairment losses related mainly to entity-wide software that are no longer to be used. In addition, ¥
2,275
million of impairment losses were recognized on real estate used mainly as certain branches in Global Corporate Company or Retail & Business Banking Company. These real estates are either no longer being used or the carrying amounts are not recoverable.
F-4
4
MIZUHO FINANCIAL GROUP, INC. AND SUBSIDIARIES
NOTES TO CONSOLIDATED FINANCIAL STATEMENTS—(Continued)
7. Goodwill and intangible assets
Goodwill
The changes in Goodwill during the fiscal years ended March 31, 2019, 2020 and 2021 are as follows:
|
2019
|
2020
|
2021
|
||||||||||
|
(in millions of yen)
|
||||||||||||
|
Balance at beginning of fiscal year
|
|
|
|
|||||||||
|
Impairment losses recognized
|
|
(
|
) |
(
|
) | |||||||
|
Foreign exchange translation
|
(
|
) |
|
— | ||||||||
|
Balance at end of fiscal year
|
|
|
|
|||||||||
|
|
|
|
|
|
|
|||||||
|
Gross amount of goodwill
(Note)
|
|
|
|
|||||||||
|
Accumulated impairment losses
|
|
|
|
|||||||||
| Note: |
Goodwill is recorded at a designated reporting unit level for the purpose of assessing impairment. Goodwill is not allocated to the reportable segments in Note 31 “Business segment information.”
|
Intangible assets
The table below presents the gross carrying amount, accumulated amortization and net carrying amount of intangible assets, at March 31, 2020 and 2021:
|
2020
|
2021
|
|||||||||||||||||||||||
|
Gross
carrying
amount
|
Accumulated
amortization
|
Net
carrying
amount
|
Gross
carrying
amount
|
Accumulated
amortization
|
Net
carrying
amount
|
|||||||||||||||||||
|
(in millions of yen)
|
||||||||||||||||||||||||
|
Intangible assets subject to amortization:
|
||||||||||||||||||||||||
|
Customer relationships
(Note)
|
|
|
|
|
|
|
||||||||||||||||||
|
Other
|
|
|
|
|
|
|
||||||||||||||||||
|
|
|
|
|
|
|
|
|
|
|
|
|
|||||||||||||
|
Total
|
|
|
|
|
|
|
||||||||||||||||||
|
|
|
|
|
|
|
|
|
|
|
|
|
|||||||||||||
|
Intangible assets not subject to amortization:
|
||||||||||||||||||||||||
|
Total
|
|
— |
|
|
— |
|
||||||||||||||||||
|
|
|
|
|
|
|
|
|
|
|
|
|
|||||||||||||
|
Total
|
|
|
|
|
|
|
||||||||||||||||||
|
|
|
|
|
|
|
|
|
|
|
|
|
|||||||||||||
| Note: |
Customer relationships were acquired in connection with the merger of MHSC and Shinko on May 7, 2009 and the integration among asset management companies on October 1, 2016. See Note 1 “Basis of presentation and summary of significant accounting policies” for further information.
|
For the fiscal years ended March 31, 2019, 2020 and 2021, the MHFG Group recognized ¥
9,604
million, ¥
9,267
million and ¥
8,513
million, respectively, of amortization expense in respect of intangible assets, reported in Other noninterest expenses.
F-4
5
MIZUHO FINANCIAL GROUP, INC. AND SUBSIDIARIES
NOTES TO CONSOLIDATED FINANCIAL STATEMENTS—(Continued)
The table below presents the estimated aggregate amortization expense in respect of intangible assets for the next five years:
|
(in millions of yen)
|
||||
|
Fiscal year ending March 31:
|
||||
|
2022
|
|
|||
|
2023
|
|
|||
|
2024
|
|
|||
|
2025
|
|
|||
|
2026
|
|
|||
8. Pledged assets and collateral
The following amounts, by balance sheet classification, have been pledged as collateral for borrowings and for other purposes at March 31, 2020 and 2021:
|
2020
|
2021
|
|||||||
|
(in billions of yen)
|
||||||||
|
Interest-bearing deposits in other banks
|
|
|
||||||
|
Trading account assets
|
|
|
||||||
|
Investments
|
|
|
||||||
|
Loans
|
|
|
||||||
|
Other assets
|
|
|
||||||
|
|
|
|
|
|||||
|
Total
|
|
|
||||||
|
|
|
|
|
|||||
The associated liabilities collateralized by the above assets at March 31, 2020 and 2021 are summarized below:
|
2020
|
2021
|
|||||||
|
(in billions of yen)
|
||||||||
|
Deposits
|
|
|
||||||
|
Payables under repurchase agreements
|
|
|
||||||
|
Payables under securities lending transactions
|
|
|
||||||
|
Other short-term borrowings
|
|
|
||||||
|
Long-term debt
|
|
|
||||||
|
|
|
|
|
|||||
|
Total
|
|
|
||||||
|
|
|
|
|
|||||
The Bank of Japan (“the BOJ”) requires private depository institutions to maintain a certain amount of funds as reserves in current accounts with the BOJ, based on average deposit balances and certain other factors. There are similar reserve deposit requirements for foreign branches and subsidiaries engaged in banking businesses in foreign countries. These amounts are deemed to be restricted cash. At March 31, 2020 and 2021, the deposit amounts maintained with the BOJ and foreign central banks, which were included in Cash and due from banks and Interest-bearing deposits in other banks, were ¥
38,808
billion and ¥
46,346
billion, respectively. These balances included the reserve funds required to be maintained by the MHFG Group, which amounted to ¥
1,507
billion and ¥
1,617
billion at March 31, 2020 and 2021, respectively.
At March 31, 2020 and 2021, the MHFG Group had received collateral that can be sold or repledged, with a fair value of ¥
20,663
billion and ¥
13,882
billion, respectively, of which ¥
18,824
billion and ¥
12,583
billion, respectively, was sold and repledged. Such collateral was primarily obtained in connection with resale or
F-4
6
MIZUHO FINANCIAL GROUP, INC. AND SUBSIDIARIES
NOTES TO CONSOLIDATED FINANCIAL STATEMENTS—(Continued)
securities borrowing agreements, and was generally used as collateral for repurchase or securities lending agreements, or to cover short sales. This collateral received isn’t recognized on balance sheet.
9. Deposits
The balances of time deposits and certificates of deposit issued by domestic offices in amounts of ¥
10
million (approximately US$
90
thousand at the Federal Reserve Bank of New York’s noon buying rate on March 31, 2021) or more and the balances of these deposits issued by foreign offices in amounts of US$
100,000
or more at March 31, 2020 and 2021 are as follows:
|
2020
|
2021
|
|||||||
|
(in millions of yen)
|
||||||||
|
Domestic offices:
|
||||||||
|
Time deposits
|
|
|
||||||
|
Certificates of deposit
|
|
|
||||||
|
|
|
|
|
|||||
|
Total
|
|
|
||||||
|
|
|
|
|
|||||
|
Foreign offices:
|
||||||||
|
Time deposits
|
|
|
||||||
|
Certificates of deposit
|
|
|
||||||
|
|
|
|
|
|||||
|
Total
|
|
|
||||||
|
|
|
|
|
|||||
The aggregate amount of demand deposits in overdraft status that have been reclassified as loan balances at March 31, 2020 and 2021 was ¥
696
billion and ¥
627
billion, respectively.
F-4
7
MIZUHO FINANCIAL GROUP, INC. AND SUBSIDIARIES
NOTES TO CONSOLIDATED FINANCIAL STATEMENTS—(Continued)
The balance and remaining maturities of time deposits and certificates of deposit issued by domestic and foreign offices at March 31, 2021 are shown in the following table:
|
Time
deposits
|
Certificates of
deposit
|
Total
|
||||||||||
|
(in millions of yen)
|
||||||||||||
|
Domestic offices:
|
||||||||||||
|
Due in one year or less
|
|
|
|
|||||||||
|
Due after one year through two years
|
|
|
|
|||||||||
|
Due after two years through three years
|
|
|
|
|||||||||
|
Due after three years through four years
|
|
|
|
|||||||||
|
Due after four years through five years
|
|
|
|
|||||||||
|
Due after five years
|
|
|
|
|||||||||
|
|
|
|
|
|
|
|||||||
|
Total
|
|
|
|
|||||||||
|
|
|
|
|
|
|
|||||||
|
Foreign offices:
|
||||||||||||
|
Due in one year or less
|
|
|
|
|||||||||
|
Due after one year through two years
|
|
|
|
|||||||||
|
Due after two years through three years
|
|
|
|
|||||||||
|
Due after three years through four years
|
|
|
|
|||||||||
|
Due after four years through five years
|
|
|
|
|||||||||
|
Due after five years
|
|
|
|
|||||||||
|
|
|
|
|
|
|
|||||||
|
Total
|
|
|
|
|||||||||
|
|
|
|
|
|
|
|||||||
|
Total
|
|
|
|
|||||||||
|
|
|
|
|
|
|
|||||||
10. Due to trust accounts
MHTB holds assets on behalf of its customers in an agent, fiduciary or trust capacity. Such trust account assets are not the MHFG Group’s proprietary assets and are managed and accounted for separately. However, the cash in individual trust accounts is often placed with MHTB for the customers’ short-term investment needs. These amounts which MHTB owes to the trust accounts are recorded as Due to trust accounts.
11. Short-term borrowings and long-term debt
Short-term borrowings
Short-term borrowings consist of Due to trust accounts, Call money and funds purchased, Payables under repurchase agreements and securities lending transactions, and Other short-term borrowings.
Details of Other short-term borrowings at March 31, 2020 and 2021 are as follows:
|
2020
|
2021
|
|||||||
|
(in millions of yen)
|
||||||||
|
Short-term notes issued by consolidated VIEs of asset-backed commercial paper programs
(1)
|
|
|
||||||
|
Commercial paper and short-term notes issued by MHFG’s subsidiaries
(1) (2)
|
|
|
||||||
|
Borrowings from the Bank of Japan
|
|
|
||||||
|
Other
|
|
|
||||||
|
|
|
|
|
|||||
|
Total
|
|
|
||||||
|
|
|
|
|
|||||
F-4
8
MIZUHO FINANCIAL GROUP, INC. AND SUBSIDIARIES
NOTES TO CONSOLIDATED FINANCIAL STATEMENTS—(Continued)
Notes:
| (1) |
Short-term notes are issued under the laws of Japan in the form of commercial paper.
|
| (2) |
The amounts of commercial paper and short-term notes issued by MHFG’s subsidiaries were ¥
|
Long-term debt
Long-term debt with original maturities of more than one year at March 31, 2020 and 2021 is comprised of the following:
|
2020
|
2021
|
|||||||
|
(in millions of yen)
|
||||||||
|
Obligations under finance leases
|
|
|
||||||
|
Loan participation borrowings
|
|
|
||||||
|
Senior borrowings and bonds
|
|
|
||||||
|
Subordinated borrowings and bonds
|
|
|
||||||
|
|
|
|
|
|||||
|
Total
|
|
|
||||||
|
|
|
|
|
|||||
The following table presents the interest rates and maturities of senior borrowings and bonds, and subordinated borrowings and bonds:
|
Interest rates
(1)
|
Maturities
(2)
|
2020
|
2021
|
|||||||||||
|
(%)
|
(in millions of yen)
|
|||||||||||||
|
Senior borrowings and bonds:
|
||||||||||||||
|
fixed rate denominated in Japanese yen
|
|
-
|
|
|
||||||||||
|
fixed rate denominated in U.S. dollars
|
|
-
|
|
|
||||||||||
|
fixed rate denominated in other currencies
|
|
-
|
|
|
||||||||||
|
floating rate denominated in Japanese yen
|
|
-
|
|
|
||||||||||
|
floating rate denominated in U.S. dollars
|
|
-
|
|
|
||||||||||
|
floating rate denominated in other currencies
|
|
-
|
|
|
||||||||||
|
|
|
|
|
|||||||||||
|
Total
|
|
|
||||||||||||
|
|
|
|
|
|||||||||||
|
Subordinated borrowings and bonds:
|
||||||||||||||
|
fixed rate denominated in Japanese yen
|
|
-Perpetual |
|
|
||||||||||
|
fixed rate denominated in U.S. dollars
|
|
-
|
|
|
||||||||||
|
|
|
|
|
|||||||||||
|
Total
|
|
|
||||||||||||
|
|
|
|
|
|||||||||||
|
Total
|
|
|
||||||||||||
|
|
|
|
|
|||||||||||
Notes:
| (1) |
The interest rates disclosed reflect the range of contractual rates in effect at March 31, 2021.
|
| (2) |
Maturity information disclosed is the range of maturities at March 31, 2021.
|
| (3) |
None of the long-term debt issuances above are convertible to common stock.
|
| (4) |
Certain debt agreements permit the MHFG Group to redeem the related debt, in whole or in part, prior to maturity at the MHFG Group’s option on terms specified in the respective agreements.
|
F-4
9
MIZUHO FINANCIAL GROUP, INC. AND SUBSIDIARIES
NOTES TO CONSOLIDATED FINANCIAL STATEMENTS—(Continued)
The following is a summary of contractual maturities of long-term debt subsequent to March 31, 2021:
|
(in millions of yen)
|
||||
|
Fiscal year ending March 31:
|
||||
|
2022
|
|
|||
|
2023
|
|
|||
|
2024
|
|
|||
|
2025
|
|
|||
|
2026
|
|
|||
|
2027 and thereafter
|
|
|||
|
|
|
|||
|
Total
|
|
|||
|
|
|
|||
12. Other assets and liabilities
The following table sets forth the details of other assets and liabilities at March 31, 2020 and 2021:
|
2020
|
2021
|
|||||||
|
(in millions of yen)
|
||||||||
|
Other assets:
|
||||||||
|
Accounts receivable:
|
||||||||
|
Receivables from brokers, dealers and customers for securities transactions
|
|
|
||||||
|
Other
|
|
|
||||||
|
Collateral pledged:
|
||||||||
|
Collateral pledged for derivative transactions
|
|
|
||||||
|
Margins provided for futures contracts
|
|
|
||||||
|
Other
|
|
|
||||||
|
Prepaid pension cost
|
|
|
||||||
|
Right-of-use
|
|
|
||||||
|
Security deposits
|
|
|
||||||
|
Loans held for sale
|
|
|
||||||
|
Other
|
|
|
||||||
|
|
|
|
|
|||||
|
Total
|
|
|
||||||
|
|
|
|
|
|||||
|
Other liabilities:
|
||||||||
|
Accounts payable:
|
||||||||
|
Payables to brokers, dealers and customers for securities transactions
|
|
|
||||||
|
Other
|
|
|
||||||
|
Guaranteed trust principal
(Note)
|
|
|
||||||
|
liabilities
|
|
|
||||||
|
Collateral accepted:
|
||||||||
|
Collateral accepted for derivative transactions
|
|
|
||||||
|
Margins accepted for futures contracts
|
|
|
||||||
|
Unearned income
|
|
|
||||||
|
Other
|
|
|
||||||
|
|
|
|
|
|||||
|
Total
|
|
|
||||||
|
|
|
|
|
|||||
| Note: |
Guaranteed trust principal, included in All other liabilities in the disclosure about consolidated VIEs in the accompanying balance sheets, is a liability of certain consolidated trust arrangements that meet the
|
F-
50
MIZUHO FINANCIAL GROUP, INC. AND SUBSIDIARIES
NOTES TO CONSOLIDATED FINANCIAL STATEMENTS—(Continued)
| definition of a VIE for which the MHFG Group provides guarantees for the repayment of principal. See Note 24 “Variable interest entities and securitizations” for further discussion of the guaranteed principal money trusts. |
13. Preferred stock
The composition of preferred stock at March 31, 2019, 2020 and 2021 is as follows:
|
March 31, 2019
|
March 31, 2020
|
March 31, 2021
|
||||||||||||||||||||||
|
Class of stock
|
Authorized
|
Issued
|
Authorized
|
Issued
|
Authorized
|
Issued
|
||||||||||||||||||
|
(number of shares)
|
||||||||||||||||||||||||
|
Class XIV preferred stock
|
|
|
|
|
|
|
||||||||||||||||||
|
Class XV preferred stock
|
|
|
|
|
|
|
||||||||||||||||||
|
Class XVI preferred stock
|
|
|
|
|
|
|
||||||||||||||||||
Holders or registered pledgees of preferred stock are entitled to receive annual dividends, and distribution of residual assets of MHFG as set out above at the liquidation value per share, prior to holders of common stock but pari passu among themselves. MHFG may pay up to
one-half
of the annual dividend payable on each class of preferred stock as an interim dividend. Dividends on preferred stock are not cumulative. Holders of preferred stock are not entitled to vote at a general meeting of shareholders except where the articles of incorporation entitle holders of preferred stock to vote.
Except for the 1-for-10 share consolidation noted in Note 1 “Basis of presentation and summary of
significant accounting poli
c
ies,” there was no change in balance of the preferred stock in the fiscal years ended March 31, 2019, 2020 and 2021.
14. Common stock
The following table shows the changes in the number of issued shares of common stock during the fiscal years ended March 31, 2019, 2020 and 2021:
|
2019
|
2020
|
2021
|
||||||||||
|
(shares)
|
||||||||||||
|
Balance at beginning of fiscal year
|
|
|
|
|||||||||
|
Issuance of new shares of common stock due to exercise of stock acquisition rights
|
|
|
|
|||||||||
|
|
|
|
|
|
|
|||||||
|
Balance at end of fiscal year
|
|
|
|
|||||||||
|
|
|
|
|
|
|
|||||||
15. Dividends
The amount available for dividends under Japan’s Companies Act is based on the amount recorded in MHFG’s
2,256,768
million, ¥
1,196,660
million and ¥
1,949,956
million, respectively, under Japanese GAAP.
non-consolidated
general books of account, maintained in accordance with accounting principles generally accepted in Japan (“Japanese GAAP”) and adjusted by post
period-end
changes. Therefore, the consolidated shareholders’ equity under U.S. GAAP has no effect on the determination of the amount available for dividends. On March 31, 2021, MHFG’s capital stock, capital surplus and retained earnings were ¥
one-tenth
of the amount of retained earnings so distributed, until its legal reserve reaches
one-quarter
of its capital stock
F-
51
MIZUHO FINANCIAL GROUP, INC. AND SUBSIDIARIES
NOTES TO CONSOLIDATED FINANCIAL STATEMENTS—(Continued)
In addition to the provision that requires an appropriation for the legal reserve, the Companies Act and Japan’s Banking Act impose certain limitations on the amount available for dividends. Under the Companies Act, MHFG’s maximum amount available for dividends, at March 31, 2021, was ¥
1,939,807
million, based on the amount recorded in MHFG’s general books of account under Japanese GAAP. Under the Banking Act and related regulations, MHFG has to meet the minimum capital adequacy requirements. Distributions of retained earnings, which are otherwise distributable to shareholders, are restricted in order to maintain the minimum capital requirements. See Note 17 “Regulatory matters” for further discussion of regulatory capital requirements.
Payment of dividends on shares of common stock is also subject to the prior payment of dividends on shares of preferred stock, if any are outstanding.
F-
52
MIZUHO FINANCIAL GROUP, INC. AND SUBSIDIARIES
NOTES TO CONSOLIDATED FINANCIAL STATEMENTS—(Continued)
16. Accumulated other comprehensive income (loss), net of tax
Changes in each component of AOCI for the fiscal years ended March 31, 2019, 2020 and 2021 are as follows:
|
2019
|
2020
|
2021
|
||||||||||
|
(in millions of yen)
|
||||||||||||
|
AOCI, balance at beginning of fiscal year, previously reported
|
|
|
(
|
) | ||||||||
|
Cumulative effect of change in accounting principles
|
(
|
) |
(
|
) | — | |||||||
|
AOCI, balance at beginning of fiscal year, adjusted
|
|
|
(
|
) | ||||||||
|
Net unrealized gains (losses) on
available-for-sale
|
||||||||||||
|
Balance at beginning of fiscal year, previously reported
|
|
|
(
|
) | ||||||||
|
Cumulative effect of change in accounting principles
(1)
|
(
|
) | — | — | ||||||||
|
Balance at beginning of fiscal year, adjusted
|
|
|
(
|
) | ||||||||
|
Unrealized holding gains (losses) during year
|
(
|
) |
(
|
) |
(
|
) | ||||||
|
Less: reclassification adjustments for losses (gains) included in net income
|
|
(
|
) |
|
||||||||
|
|
|
|
|
|
|
|||||||
|
Change during year
|
(
|
) |
(
|
) |
|
|||||||
|
|
|
|
|
|
|
|||||||
|
Balance at end of fiscal year
|
|
(
|
) |
(
|
) | |||||||
|
Foreign currency translation adjustments:
|
||||||||||||
|
Balance at beginning of fiscal year, previously reported
|
(
|
) |
(
|
) |
(
|
) | ||||||
|
Cumulative effect of change in accounting principles
(2)
|
— |
(
|
) | — | ||||||||
|
Balance at beginning of fiscal year, adjusted
|
(
|
) |
(
|
) |
(
|
) | ||||||
|
Foreign currency translation adjustments during year
|
(
|
) |
(
|
) |
|
|||||||
|
Less: reclassification adjustments for losses (gains) included in net income
|
(
|
) |
(
|
) |
|
|||||||
|
|
|
|
|
|
|
|||||||
|
Change during year
|
(
|
) |
(
|
) |
|
|||||||
|
|
|
|
|
|
|
|||||||
|
Balance at end of fiscal year
|
(
|
) |
(
|
) |
(
|
) | ||||||
|
Pension liability adjustments:
|
||||||||||||
|
Balance at beginning of fiscal year
|
|
|
|
|||||||||
|
Unrealized gains (losses) during year
|
(
|
) |
(
|
) |
|
|||||||
|
Less: reclassification adjustments for losses (gains) included in net income
|
(
|
) |
(
|
) |
(
|
) | ||||||
|
|
|
|
|
|
|
|||||||
|
Change during year
|
(
|
) |
(
|
) |
|
|||||||
|
|
|
|
|
|
|
|||||||
|
Balance at end of fiscal year
|
|
|
|
|||||||||
|
Own credit risk adjustments
|
||||||||||||
|
Balance at beginning of fiscal year, previously reported
|
— |
|
|
|||||||||
|
Cumulative effect of change in accounting principles
(1)
|
(
|
) | — | — | ||||||||
|
Balance at beginning of fiscal year, adjusted
|
(
|
) |
|
|
||||||||
|
Unrealized gains (losses) during year
|
|
|
(
|
) | ||||||||
|
Less: reclassification adjustments for losses (gains) included in net income
|
(
|
) |
|
(
|
) | |||||||
|
|
|
|
|
|
|
|||||||
|
Change during year
|
|
|
(
|
) | ||||||||
|
|
|
|
|
|
|
|||||||
|
Balance at end of fiscal year
|
|
|
|
|||||||||
|
Total other comprehensive income (loss), net of tax attributable to MHFG shareholders
|
(
|
) |
(
|
) |
|
|||||||
|
|
|
|
|
|
|
|||||||
|
AOCI, balance at end of fiscal year
|
|
(
|
) |
|
||||||||
|
|
|
|
|
|
|
|||||||
F-
53
MIZUHO FINANCIAL GROUP, INC. AND SUBSIDIARIES
NOTES TO CONSOLIDATED FINANCIAL STATEMENTS—(Continued)
Notes:
| (1) |
The MHFG Group adopted ASU
No.2016-01,
“Financial Instruments—Overall (Subtopic
825-10)—Recognition
and Measurement of Financial Assets and Financial Liabilities” (“ASU
No.2016-01”)
on April 1, 2018. The ASU
No.2016-01
requires equity investments (except those accounted for under the equity method of accounting or those that result in consolidation of the investee) to be measured at fair value with changes in fair value recognized in net income. The ASU
No.2016-01
also requires an entity to present separately in other comprehensive income the portion of the total change in the fair value of a liability resulting from a change in the instrument-specific credit risk when the entity has elected to measure the liability at fair value in accordance with the fair value option for financial instruments. Cumulative-effect adjustments to the consolidated balance sheets were recognized upon adoption.
|
| (2) |
The MHFG Group adopted ASU
No.2017-12,
“Derivatives and Hedging (Topic 815)—Targeted Improvements to Accounting for Hedging Activities” (“ASU
No.2017-12”)
on April 1, 2019 and the ASU
No.2017-12
eliminated the separate measurement and reporting of hedge ineffectiveness. Cumulative-effect adjustment to the consolidated balance sheets was recognized upon adoption.
|
The following table shows the amounts reclassified out of AOCI into net income during the fiscal year ended March 31, 2021:
|
Before
tax
(1)
|
Tax
effect
(2)
|
Net of tax
before
allocation to
noncontrolling
interests
|
Net of tax
attributable to
noncontrolling
interests
(2)
|
Net of tax
attributable
to MHFG
shareholders
|
||||||||||||||||||
|
(in millions of yen)
|
||||||||||||||||||||||
|
Amounts reclassified out of AOCI into net income:
|
Affected line items in the consolidated statements of income:
|
|||||||||||||||||||||
|
Net unrealized gains (losses) on
available-for-sale
|
(
|
) |
|
(
|
) |
|
(
|
) |
Investment gains (losses)—net
Provision (credit) for credit losses
|
|||||||||||||
|
Foreign currency translation adjustments
|
(
|
) |
|
(
|
) |
|
(
|
) |
Investment gains (losses)—net
|
|||||||||||||
|
Pension liability adjustments
|
|
(
|
) |
|
|
|
Salaries and employee benefits
|
|||||||||||||||
|
Own credit risk adjustments
|
|
(
|
) |
|
(
|
) |
|
Other noninterest income (expenses)
|
||||||||||||||
|
|
|
|
|
|
|
|
|
|
|
|||||||||||||
|
Total
|
(
|
) |
|
(
|
) |
(
|
) |
(
|
) | |||||||||||||
|
|
|
|
|
|
|
|
|
|
|
|||||||||||||
Notes:
| (1) |
The financial statement line item in which the amounts in the before tax column are reported in the consolidated statements of income is listed to the right of the table.
|
| (2) |
The financial statement line items in which the amounts in the tax effect and the net of tax attributable to noncontrolling interest columns are reported in the consolidated statements of income are Income tax expense and Net income, respectively.
|
F-5
4
MIZUHO FINANCIAL GROUP, INC. AND SUBSIDIARIES
NOTES TO CONSOLIDATED FINANCIAL STATEMENTS—(Continued)
17. Regulatory matters
Regulatory capital requirements
MHFG, MHBK, and MHTB are subject to regulatory capital requirements supervised by the Financial Services Agency in accordance with the provisions of Japan’s Banking Act and related regulations. Certain foreign banking subsidiaries are subject to regulation and control by local supervisory authorities, including central banks. Failure to meet minimum capital requirements may initiate certain mandatory actions by regulators that, if undertaken, could have a direct material effect on the MHFG Group’s consolidated financial condition and results of operations.
The capital adequacy guidelines applicable to Japanese banks and bank holding companies with international operations supervised by the Financial Services Agency closely follow the risk-adjusted approach proposed by the Bank for International Settlements and are intended to further strengthen the soundness and stability of Japanese banks.
In December 2010, Basel Committee on Banking Supervision (“BCBS”) issued the Basel III rules text, which builds on the International Convergence of Capital Measurement and Capital Standards document (“Basel II”), to strengthen the regulation, supervision and risk management of the banking sector. Basel III rules text presents the details of global regulatory standards on bank capital adequacy and liquidity. The rules text sets out higher and better-quality capital, better risk coverage, introduction of a leverage ratio as a backstop to the risk-based requirement, measures to promote the
build-up
of capital that can be drawn down in periods of stress, and introduction of two
g
lobal liquidity standards.
The Financial Services Agency’s capital adequacy guidelines became effective from March 31, 2013, which generally reflect the rules in the Basel III rules text that have been applied from January 1, 2013.
There are three primary regulatory capital ratios used to assess capital adequacy: Common Equity Tier 1, Tier 1 and Total risk-based capital ratios. The ratios are comprised of Common Equity Tier 1 capital, Tier 1 capital (Common Equity Tier 1 capital and Additional Tier 1 capital) and total risk-based capital (Tier 1 and Tier 2 capital) divided by risk-weighted assets. Common Equity Tier 1 capital primarily consists of common stock, capital surplus, retained earnings and AOCI. Regulatory adjustments including certain intangible fixed assets, such as goodwill, and defined-benefit pension fund assets will be deducted from Common Equity Tier 1. Additional Tier 1 capital generally consists of Basel III compliant preferred securities and other capital that meets Tier 1 requirements under Basel II standards, net of regulatory adjustments. Tier 2 capital generally consists of Basel III compliant deferred obligations, such as subordinated debts, capital that meets Tier 2 requirements under Basel II standards, certain allowances for credit losses and noncontrolling interests in subsidiaries’ Tier 2 instruments.
Under the revised guidelines, the minimum capital adequacy ratio is
8
% on both a consolidated and
4.5
% and the Tier 1 capital requirement is
6.0
%.
non-consolidated
basis for banks with international operations, such as MHBK and MHTB, or on a consolidated basis for bank holding companies with international operations, such as MHFG. Within the minimum capital adequacy ratio, the Common Equity Tier 1 capital requirement is
Under Basel III, capital instruments that no longer qualify as Tier 2 capital are being phased out beginning March 2013 by increments of
10
% until becoming fully effective in March 2022. The MHFG Group’s existing subordinated debt issued before March 2013 (the amounts thereof included within Tier 2 capital as of March 31, 2021 being ¥
168.7
billion) are subject to the
phase-out
arrangements.
In November 2015, the Financial Services Agency published the revised capital adequacy guidelines and related ordinances to introduce the capital buffer requirements under the Basel III rules for Japanese banks and bank holding companies with international operations, which include the capital conservation buffer, the
F-5
5
MIZUHO FINANCIAL GROUP, INC. AND SUBSIDIARIES
NOTES TO CONSOLIDATED FINANCIAL STATEMENTS—(Continued)
countercyclical capital buffer and the additional loss absorbency requirements for global systemically important banks
0
% to
2.5
% would also be imposed on banking organizations. The countercyclical capital buffer is a weighted average of the buffers deployed across all the jurisdictions to which the banking organization has credit exposures. Further, MHFG is currently designated as both a
1.0
%. The additional loss absorption capacity requirement was the same as that imposed by the Financial Stability Board, which became fully effective in March 2019 at 1.0%.
(“G-SIBs”)
and domestic systemically important banks
(“D-SIBs”).
These guidelines have become effective on March 31, 2016. The capital conservation buffer, the countercyclical capital buffer and the additional loss absorption capacity requirement for
G-SIBs
and
D-SIBs
must be met with Common Equity Tier l capital under the revised guidelines, and if such buffer requirements are not satisfied, a capital distribution constraints plan is required to be submitted to the Financial Services Agency and carried out. The capital conservation buffer became fully effective in March 2019 at 2.5%. In addition, subject to national discretion by the respective regulatory authorities, if the relevant national authority judges a period of excess credit growth to be leading to the
build-up
of system-wide risk, a countercyclical capital buffer ranging from
G-SIB
and
D-SIB,
and the additional loss absorption capacity requirement applied to MHFG was
Leverage ratio
The leverage ratio framework is critical and complementary to the risk-based capital framework that will help ensure broad and adequate capture of both
on-
and
off-balance
sheet sources of banks’ leverage.
Basel III’s leverage ratio is defined as the capital measure (numerator) divided by the exposure measure (denominator) and is expressed as a percentage. The capital measure for the leverage ratio is the Tier 1 capital of the risk-based capital framework, and the exposure measure is the sum of the
on-balance
sheet exposures, derivative exposures, securities financing transaction exposures and
off-balance
sheet items.
In March 2019, the Financial Services Agency published the revised leverage ratio framework and the minimum leverage ratio is defined as
3
% on both a consolidated and
non-consolidated
basis for banks with international operations, such as MHBK and MHTB, or on a consolidated basis for bank holding companies with international operations, such as MHFG.
The capital requirements and regulatory adjustments are being phased in over a transitional period as follows (italicized percentages indicate those still in transition periods):
|
March
2020
|
March
2021
|
March
2022
|
March
2023
|
|||||||||||||
|
Minimum Common Equity Tier 1 capital
|
|
% |
|
% |
|
% |
|
% | ||||||||
|
Minimum Tier 1 capital
|
|
% |
|
% |
|
% |
|
% | ||||||||
|
Minimum total capital
|
|
% |
|
% |
|
% |
|
% | ||||||||
|
Phase out of recognition of capital instruments that no longer qualify as capital
|
|
%
|
|
%
|
|
% |
|
% | ||||||||
|
Capital conservation buffer
|
|
% |
|
% |
|
% |
|
% | ||||||||
|
Countercyclical capital buffer
(1)
|
|
% |
|
% |
|
% |
|
% | ||||||||
|
Additional loss absorbency requirements for
G-SIBs
and
D-SIBs
(2)
|
|
% |
|
% |
|
% |
|
% | ||||||||
|
Minimum Leverage Ratio
|
|
% |
|
% |
|
% |
|
%
(3)
|
||||||||
Notes:
| (1) |
Figures assume that the countercyclical capital buffer will continue to be
|
| (2) |
Figures assume that the additional loss absorbency requirements applied to the Group as a
G-SIB
and
D-SIB
continue to be
|
| (3) |
This figure includes a leverage ratio buffer required to be met at
G-SIB
under the finalized Basel III reforms.
|
F-5
6
MIZUHO FINANCIAL GROUP, INC. AND SUBSIDIARIES
NOTES TO CONSOLIDATED FINANCIAL STATEMENTS—(Continued)
If the capital adequacy ratio and leverage ratio of a financial institution falls below the required level, the Financial Services Agency may, depending upon the extent of capital deterioration, take certain corrective action, including requiring the financial institution to submit an improvement plan to strengthen its capital base, reduce its total assets, restrict its business operations or other actions that could have a material effect on its financial condition and results of operations.
Capital adequacy ratios and leverage ratios of MHFG, MHBK, and MHTB as of March 31, 2020 and 2021 calculated in accordance with Japanese GAAP and the guidelines established by the Financial Services Agency are set forth in the following table:
|
2020
|
2021
|
|||||||||||||||
|
Amount
|
Ratio
|
Amount
|
Ratio
|
|||||||||||||
|
(in billions of yen, except percentages)
|
||||||||||||||||
|
Consolidated:
|
||||||||||||||||
|
MHFG:
|
||||||||||||||||
|
Common Equity Tier 1 capital:
|
||||||||||||||||
|
Required
(1)
|
|
|
|
|
||||||||||||
|
Actual
|
|
|
|
|
||||||||||||
|
Tier 1 capital:
|
||||||||||||||||
|
Required
(1)
|
|
|
|
|
||||||||||||
|
Actual
|
|
|
|
|
||||||||||||
|
Total risk-based capital:
|
||||||||||||||||
|
Required
(1)
|
|
|
|
|
||||||||||||
|
Actual
|
|
|
|
|
||||||||||||
|
Leverage Ratio
(2)
:
|
||||||||||||||||
|
Required
|
|
|
|
|
||||||||||||
|
Actual
|
|
|
|
|
||||||||||||
|
MHBK:
|
||||||||||||||||
|
Common Equity Tier 1 capital:
|
||||||||||||||||
|
Required
|
|
|
|
|
||||||||||||
|
Actual
|
|
|
|
|
||||||||||||
|
Tier 1 capital:
|
||||||||||||||||
|
Required
|
|
|
|
|
||||||||||||
|
Actual
|
|
|
|
|
||||||||||||
|
Total risk-based capital:
|
||||||||||||||||
|
Required
|
|
|
|
|
||||||||||||
|
Actual
|
|
|
|
|
||||||||||||
|
Leverage
Ratio
(2)
:
|
||||||||||||||||
|
Required
|
|
|
|
|
||||||||||||
|
Actual
|
|
|
|
|
||||||||||||
|
MHTB:
|
||||||||||||||||
|
Common Equity Tier 1 capital:
|
||||||||||||||||
|
Required
|
|
|
|
|
||||||||||||
|
Actual
|
|
|
|
|
||||||||||||
|
Tier 1 capital:
|
||||||||||||||||
|
Required
|
|
|
|
|
||||||||||||
|
Actual
|
|
|
|
|
||||||||||||
|
Total risk-based capital:
|
||||||||||||||||
|
Required
|
|
|
|
|
||||||||||||
|
Actual
|
|
|
|
|
||||||||||||
|
Leverage
Ratio
(2)
:
|
||||||||||||||||
|
Required
|
|
|
|
|
||||||||||||
|
Actual
|
|
|
|
|
||||||||||||
|
Non-consolidated:
|
||||||||||||||||
|
MHBK:
|
||||||||||||||||
|
Common Equity Tier 1 capital:
|
||||||||||||||||
|
Required
|
|
|
|
|
||||||||||||
|
Actual
|
|
|
|
|
||||||||||||
|
Tier 1 capital:
|
||||||||||||||||
|
Required
|
|
|
|
|
||||||||||||
|
Actual
|
|
|
|
|
||||||||||||
F-5
7
MIZUHO FINANCIAL GROUP, INC. AND SUBSIDIARIES
NOTES TO CONSOLIDATED FINANCIAL STATEMENTS—(Continued)
|
2020
|
2021
|
|||||||||||||||
|
Amount
|
Ratio
|
Amount
|
Ratio
|
|||||||||||||
|
(in billions of yen, except percentages)
|
||||||||||||||||
|
Total risk-based capital:
|
||||||||||||||||
|
Required
|
|
|
|
|
||||||||||||
|
Actual
|
|
|
|
|
||||||||||||
|
Leverage
Ratio
(2)
:
|
||||||||||||||||
|
Required
|
|
|
|
|
||||||||||||
|
Actual
|
|
|
|
|
||||||||||||
|
MHTB:
|
||||||||||||||||
|
Common Equity Tier 1 capital:
|
||||||||||||||||
|
Required
|
|
|
|
|
||||||||||||
|
Actual
|
|
|
|
|
||||||||||||
|
Tier 1 capital:
|
||||||||||||||||
|
Required
|
|
|
|
|
||||||||||||
|
Actual
|
|
|
|
|
||||||||||||
|
Total risk-based capital:
|
||||||||||||||||
|
Required
|
|
|
|
|
||||||||||||
|
Actual
|
|
|
|
|
||||||||||||
|
Leverage
Ratio
(2)
:
|
||||||||||||||||
|
Required
|
|
|
|
|
||||||||||||
|
Actual
|
|
|
|
|
||||||||||||
Notes:
| (1) |
The required ratios disclosed above, at March 31, 2020 and 2021, include the capital conservation buffer of
G-SIBs
and
D-SIBs
of
|
| (2) |
The required and actual amounts disclosed above at March 31, 2021 exclude amounts of deposits to the Bank of Japan.
|
MHFG’s securities subsidiary in Japan is also subject to the capital adequacy requirement under Japan’s Financial Instruments and Exchange Act. Under this requirement, securities firms must maintain a minimum capital adequacy ratio of
120
% calculated as a percentage of capital accounts less certain assets, as calculated using Japanese GAAP figures, against amounts equivalent to market, counterparty, and basic risks. Specific guidelines are issued as a ministerial ordinance that details the definition of essential components of the capital ratios, including capital, disallowed assets and risks, and related measures. Failure to maintain a minimum capital ratio will trigger mandatory regulatory actions.
A capital ratio of less than
140
% will call for regulatory reporting and a capital ratio of less than
100
% may lead to a temporary suspension of all or part of the business operations and further, to the cancellation of the license to act as a securities broker and dealer.
Management believes, as of each latest balance sheet date, that MHFG, MHBK, MHTB, and their securities subsidiary in Japan and foreign banking subsidiaries were in compliance with all capital adequacy requirements to which they were subject.
F-5
8
MIZUHO FINANCIAL GROUP, INC. AND SUBSIDIARIES
NOTES TO CONSOLIDATED FINANCIAL STATEMENTS—(Continued)
18. Earnings per common share
The following table sets forth the computation of basic and diluted earnings per common share for the fiscal years ended March 31, 2019, 2020 and 2021:
|
2019
|
2020
|
2021
|
||||||||||
|
(in millions of yen)
|
||||||||||||
|
Net income:
|
||||||||||||
|
Net income attributable to MHFG common shareholders
|
|
|
|
|||||||||
|
|
|
|
|
|
|
|||||||
|
Effect of dilutive securities
|
— | — | — | |||||||||
|
|
|
|
|
|
|
|||||||
|
Net income attributable to common shareholders after assumed conversions
|
|
|
|
|||||||||
|
|
|
|
|
|
|
|||||||
|
2019
|
2020
|
2021
|
||||||||||
|
(thousands of shares)
|
||||||||||||
|
Shares:
|
||||||||||||
|
Weighted average common shares outstanding
|
|
|
|
|||||||||
|
|
|
|
|
|
|
|||||||
|
Effect of dilutive securities:
|
||||||||||||
|
Stock options and the common shares of MHFG under the stock compensation programs
(Note)
|
|
|
|
|||||||||
|
|
|
|
|
|
|
|||||||
|
Weighted average common shares after assumed conversions
|
|
|
|
|||||||||
|
|
|
|
|
|
|
|||||||
|
2019
|
2020
|
2021
|
||||||||||
|
(in yen)
|
||||||||||||
|
Earnings per common share:
|
||||||||||||
|
Basic net income per common share
|
|
|
|
|||||||||
|
|
|
|
|
|
|
|||||||
|
Diluted net income per common share
(Note)
|
|
|
|
|||||||||
|
|
|
|
|
|
|
|||||||
| Note: |
For the fiscal years ended March 31, 2020 and 2021, the performance-based plan under the stock compensation programs could potentially dilute earnings per common share but were not included in the computation of diluted earnings per common share due to their antidilutive effects.
|
F-5
9
MIZUHO FINANCIAL GROUP, INC. AND SUBSIDIARIES
NOTES TO CONSOLIDATED FINANCIAL STATEMENTS—(Continued)
19. Income taxes
Income tax expense
The following table presents the components of Income tax expense for the fiscal years ended March 31, 2019, 2020 and 2021:
|
2019
|
2020
|
2021
|
||||||||||
|
(in millions of yen)
|
||||||||||||
|
Current:
|
||||||||||||
|
Domestic
|
|
|
|
|||||||||
|
Foreign
|
|
|
|
|||||||||
|
|
|
|
|
|
|
|||||||
|
Total current tax expense
|
|
|
|
|||||||||
|
|
|
|
|
|
|
|||||||
|
Deferred:
|
||||||||||||
|
Domestic
|
(
|
) |
(
|
) |
|
|||||||
|
Foreign
|
|
|
(
|
) | ||||||||
|
|
|
|
|
|
|
|||||||
|
Total deferred tax expense (benefit)
|
(
|
) |
(
|
) |
|
|||||||
|
|
|
|
|
|
|
|||||||
|
Total income tax expense
|
|
|
|
|||||||||
|
|
|
|
|
|
|
|||||||
The preceding table does not reflect the tax effects of items recorded directly in Equity for the fiscal years ended March 31, 2019, 2020 and 2021. The detailed amounts recorded directly in Equity are as follows:
|
2019
|
2020
|
2021
|
||||||||||
|
(in millions of yen)
|
||||||||||||
|
Net unrealized gains (losses) on
available-for-sale
|
||||||||||||
|
Unrealized gains (losses)
|
(
|
) |
(
|
) |
(
|
) | ||||||
|
Less: reclassification adjustments
|
|
(
|
) |
|
||||||||
|
|
|
|
|
|
|
|||||||
|
Total
|
(
|
) |
(
|
) |
|
|||||||
|
|
|
|
|
|
|
|||||||
|
Pension liability adjustments:
|
||||||||||||
|
Unrealized gains (losses)
|
(
|
) |
(
|
) |
|
|||||||
|
Less: reclassification adjustments
|
(
|
) |
(
|
) |
(
|
) | ||||||
|
|
|
|
|
|
|
|||||||
|
Total
|
(
|
) |
(
|
) |
|
|||||||
|
|
|
|
|
|
|
|||||||
|
Own credit risk adjustments
|
||||||||||||
|
Unrealized gains (losses)
|
|
|
|
|||||||||
|
Less: reclassification adjustments
|
(
|
) |
|
(
|
) | |||||||
|
|
|
|
|
|
|
|||||||
|
Total
|
|
|
(
|
) | ||||||||
|
|
|
|
|
|
|
|||||||
|
Total tax effect before allocation to noncontrolling interests
|
(
|
) |
(
|
) |
|
|||||||
|
|
|
|
|
|
|
|||||||
F-
60
MIZUHO FINANCIAL GROUP, INC. AND SUBSIDIARIES
NOTES TO CONSOLIDATED FINANCIAL STATEMENTS—(Continued)
Reconciliation of Income tax expense
The following table shows a reconciliation of Income tax expense at the effective statutory tax rate to the actual income tax expense for the fiscal years ended March 31, 2019, 2020 and 2021:
|
2019
|
2020
|
2021
|
||||||||||
|
(in millions of yen, except tax rates)
|
||||||||||||
|
Income before income tax expense
|
|
|
|
|||||||||
|
Effective statutory tax rate
|
|
% |
|
% |
|
% | ||||||
|
|
|
|
|
|
|
|||||||
|
Income tax calculated at the statutory tax rate
|
|
|
|
|||||||||
|
Income not subject to tax
|
(
|
) |
(
|
) |
(
|
) | ||||||
|
Expenses not deductible for tax purposes
|
|
|
|
|||||||||
|
Tax rate differentials of subsidiaries
|
(
|
) |
(
|
) |
(
|
) | ||||||
|
Change in valuation allowance
|
(
|
) |
|
(
|
) | |||||||
|
Noncontrolling interest income (loss) of consolidated VIEs
|
|
|
(
|
) | ||||||||
|
Effect of enacted change in tax rates
|
(
|
) |
(
|
) |
(
|
) | ||||||
|
Change in unrecognized tax benefits
|
|
— | — | |||||||||
|
Other
(Note)
|
(
|
) |
(
|
) |
|
|||||||
|
|
|
|
|
|
|
|||||||
|
Income tax expense
|
|
|
|
|||||||||
|
|
|
|
|
|
|
|||||||
| Note: |
In the fiscal year ended March 31, 2019, the MHFG Group derecognized the majority of deferred tax liabilities for undistributed earnings of foreign subsidiaries because the Group has intent and ability to reinvest those earnings indefinitely in certain foreign subsidiaries.
|
F-
61
MIZUHO FINANCIAL GROUP, INC. AND SUBSIDIARIES
NOTES TO CONSOLIDATED FINANCIAL STATEMENTS—(Continued)
Deferred tax assets and liabilities
The components of net deferred tax assets (liabilities) at March 31, 2020 and 2021 are as follows:
|
2020
|
2021
|
|||||||
|
(in millions of yen)
|
||||||||
|
Deferred tax assets:
|
||||||||
|
Allowance for credit losses
|
|
|
||||||
|
Lease liabilities
|
|
|
||||||
|
Premises and equipment
|
|
|
||||||
|
Derivative financial instruments
|
|
|
||||||
|
Trading securities
|
— |
|
||||||
|
Available-for-sale
|
|
|
||||||
|
Investments
|
|
|
||||||
|
Net operating loss carryforwards
(Note)
|
|
|
||||||
|
Other
|
|
|
||||||
|
|
|
|
|
|||||
|
|
|
|||||||
|
Valuation allowance
(Note)
|
(
|
) |
(
|
) | ||||
|
|
|
|
|
|||||
|
Deferred tax assets, net of valuation allowance
|
|
|
||||||
|
|
|
|
|
|||||
|
Deferred tax liabilities:
|
||||||||
|
Prepaid pension cost and accrued pension liabilities
|
|
|
||||||
|
Investments
|
— |
|
||||||
|
Right-of-use
|
|
|
||||||
|
Trading securities
|
|
— | ||||||
|
Other
|
|
|
||||||
|
|
|
|
|
|||||
|
Deferred tax liabilities
|
|
|
||||||
|
|
|
|
|
|||||
|
Net deferred tax assets (liabilities)
|
|
(
|
) | |||||
|
|
|
|
|
|||||
| Note: |
The amount includes ¥
|
Deferred tax assets and deferred tax liabilities within the same tax jurisdiction have been netted for presentation purposes in the consolidated balance sheets.
As of March 31, 2021, the accumulated amount of undistributed earnings that will be indefinitely reinvested and the unrecognized deferred tax liabilities related to such subsidiaries are approximately ¥
233
billion and ¥
22
billion, respectively.
F-
62
MIZUHO FINANCIAL GROUP, INC. AND SUBSIDIARIES
NOTES TO CONSOLIDATED FINANCIAL STATEMENTS—(Continued)
The following table and accompanying footnotes provide a breakdown of deferred tax assets and the valuation allowance recognized in respect of net operating loss carryforwards by tax jurisdiction and by year of expiration as of March 31, 2020 and 2021:
|
Deferred tax assets
|
Valuation allowance
|
Deferred tax assets,
net of valuation allowance
|
||||||||||
|
(in billions of yen)
|
||||||||||||
|
2020
|
||||||||||||
|
Japan
(1)
|
|
(
|
) |
|
||||||||
|
The United States
|
|
— |
|
|||||||||
|
The United Kingdom
(2)
|
|
(
|
) | — | ||||||||
|
Others
|
|
(
|
) |
|
||||||||
|
|
|
|
|
|
|
|||||||
|
Total
|
|
(
|
) |
|
||||||||
|
|
|
|
|
|
|
|||||||
|
2021
|
||||||||||||
|
Japan
(3)
|
|
(
|
) |
|
||||||||
|
The United States
|
|
— |
|
|||||||||
|
The United Kingdom
(2)
|
|
(
|
) | — | ||||||||
|
Others
|
|
— |
|
|||||||||
|
|
|
|
|
|
|
|||||||
|
Total
|
|
(
|
) |
|
||||||||
|
|
|
|
|
|
|
|||||||
Notes:
| (1) |
¥
|
| (2) |
The United Kingdom net operating loss carryforwards may be carried forward indefinitely for tax purposes.
|
| (3) |
¥
|
Determination of valuation allowance
In accordance with ASC 740, when the MHFG Group determines whether and to what extent a valuation allowance is needed, the Group considers all available evidence, both positive and negative, to estimate future taxable income. In this regard, the Group considers reversals of existing taxable temporary differences, projected future taxable income (exclusive of reversals of existing temporary differences) and qualifying
securities and equity securities
to constitute a prudent and feasible
securities and equity securities with unrealized gains and losses are sold in order to accelerate or decelerate taxable or deductible amounts. The Group also has a long history of effecting such sales as necessary in order to utilize net operating loss carryforwards or otherwise realize deferred tax assets.
tax-planning
strategies to be possible sources of future taxable income. The Group considers the specific pattern and timing of future reversals of existing taxable and deductible temporary differences on
available-for-sale
tax-planning
strategy and strong positive evidence. The Group has the ability to control when its
available-for-sale
Positive evidence includes the Group’s results of operations for the current and preceding years on an overall consolidated basis and for most of the principal subsidiaries. In particular, the strong results of operations in recent years of MHFG’s principal banking subsidiaries in Japan represent positive evidence that can be objectively verified.
Negative evidence includes the existence of significant amounts of net operating loss carryforwards or cumulative losses recorded at certain entities, and the expiration of unused net operating loss carryforwards in recent years.
F-
63
MIZUHO FINANCIAL GROUP, INC. AND SUBSIDIARIES
NOTES TO CONSOLIDATED FINANCIAL STATEMENTS—(Continued)
A valuation allowance is recorded against deferred tax assets as of the balance sheet date to the extent the Group estimates it is more likely than not that sufficient future taxable income is not available to realize such deferred tax assets. As the Group did not apply a consolidated taxation system for the fiscal years ended March 31, 2019, 2020 and 2021, with a few exceptions of certain subsidiaries, deferred tax assets and liabilities are calculated separately for each legal entity. The Group is applying to the consolidated taxation system beginning with the fiscal year ending March 31, 2022. A consolidated basis for corporate income taxes results in the reporting of taxable income or loss based upon the combined profits or losses of the parent company and its wholly-owned domestic subsidiaries. Therefore, when calculating deferred tax assets and liabilities and valuation allowance as of March 31, 2021, the Group considered the effect of the change to consolidated taxation system. The impact of the change to consolidated taxation system was not material to the cons
o
lidated financial statements. The changes in the valuation allowance are primarily due to changes in deductible temporary differences, net operating loss carryforwards and the estimated availability of future taxable income sources.
In general, a valuation allowance is recognized against deferred tax assets related to entities that have accumulated significant net operating loss carryforwards. As of March 31, 2021, the Group’s valuation allowance was primarily related to entities in Japan, the United States and the United Kingdom. The valuation allowance was partially recognized in Japan and in the United States, while the valuation allowance was fully recognized in the United Kingdom.
The Group determined whether cumulative losses were recognized by aggregating pretax results for the recent three years as part of the analysis of potential indicators of negative evidence. In each tax jurisdiction, certain entities recognized a cumulative loss on the basis of the most recent three years’ pretax results as of March 31, 2021. A valuation allowance was fully recognized against the deferred tax assets if the Group determined there was no positive evidence that overcame the negative evidence. As of March 31, 2021, MHFG’s securities subsidiary in the United Kingdom recorded cumulative losses on the basis of the recent three years’ pretax results and recognized a full valuation allowance, as there was no positive evidence to overcome the negative evidence. MHFG and its principal banking subsidiaries in Japan did not record cumulative losses in the periods presented.
Change in valuation allowance
The following table presents a roll-forward of the valuation allowance for the fiscal years ended March 31, 2019, 2020 and 2021:
|
2019
|
2020
|
2021
|
||||||||||
|
(in millions of yen)
|
||||||||||||
|
Balance at beginning of fiscal year
|
|
|
|
|||||||||
|
Changes that directly affected Income tax expense
|
(
|
) |
|
(
|
) | |||||||
|
Changes that did not affect Income tax expense:
|
||||||||||||
|
Expiration of net operating loss carryforwards
|
— | — | — | |||||||||
|
Others
|
(
|
) |
|
|
||||||||
|
|
|
|
|
|
|
|||||||
|
Total
|
(
|
) |
|
|
||||||||
|
|
|
|
|
|
|
|||||||
|
Balance at end of fiscal year
|
|
|
|
|||||||||
|
|
|
|
|
|
|
|||||||
The decrease in the fiscal year ended March 31, 2019 of ¥
2,444
million in the valuation allowance that directly affected Income tax expense was primarily related to an increase of the realizability of deferred tax assets of MHFG’s subsidiaries.
The increase in the fiscal years ended March 31, 2020 of ¥
5,984
million in the valuation allowance that directly affected Income tax expense was primarily related to a decrease of the realizability of deferred tax assets of MHFG and its subsidiaries.
F-6
4
MIZUHO FINANCIAL GROUP, INC. AND SUBSIDIARIES
NOTES TO CONSOLIDATED FINANCIAL STATEMENTS—(Continued)
The decrease in the fiscal years ended March 31, 2021 of ¥
39,410
million in the valuation allowance that directly affected Income tax expense was primarily related to an increase of the realizability of deferred tax assets of MHFG and its subsidiaries.
Net operating loss carryforwards
At March 31, 2021, the MHFG Group had net operating loss carryforwards totaling ¥
615
billion. These carryforwards are scheduled to expire as follows:
|
Net operating loss
carryforwards
|
||||
|
(in billions of yen)
|
||||
|
Fiscal year ending March 31:
|
||||
|
2022
|
|
|||
|
2023
|
|
|||
|
2024
|
|
|||
|
2025
|
|
|||
|
2026
|
|
|||
|
2027 and thereafter
(Note)
|
|
|||
|
|
|
|||
|
Total
|
|
|||
|
|
|
|||
| Note: |
Including the net operating loss carryforwards which may be carried forward indefinitely in the United Kingdom.
|
In addition, included in the net operating loss carryforwards in the above table are MHSC’s net operating loss carryforwards of ¥
281
billion resulting mainly from the reversal of an outside basis difference related to certain foreign subsidiaries due to their organizational restructuring. The tax loss was recorded at MHSC in accordance with Japanese tax law. The net operating loss carryforwards due to this restructuring will expire during the fiscal year ending March 31, 2026.
Uncertainty in income tax
The following table is a roll-forward of unrecognized tax benefits for the fiscal years ended March 31, 2019, 2020 and 2021:
|
2019
|
2020
|
2021
|
||||||||||
|
(in millions of yen)
|
||||||||||||
|
Total unrecognized tax benefits at beginning of fiscal year
|
|
|
|
|||||||||
|
|
|
|
|
|
|
|||||||
|
Gross amount of increases related to positions taken during prior years
|
|
|
|
|||||||||
|
Gross amount of increases related to positions taken during the current year
|
|
|
|
|||||||||
|
Amount of decreases related to settlements
|
— |
(
|
) | — | ||||||||
|
Foreign exchange translation
|
|
(
|
) |
|
||||||||
|
|
|
|
|
|
|
|||||||
|
Total unrecognized tax benefits at end of fiscal year
|
|
|
|
|||||||||
|
|
|
|
|
|
|
|||||||
The total amount of unrecognized tax benefits including ¥
2,164
million, ¥
1,477
million and ¥
1,463
million of interest and penalties was ¥
12,323
million, ¥
3,374
million and ¥
4,401
million at March 31, 2019, 2020 and 2021, respectively, which would, if recognized, affect the Group’s effective tax rate. The Group classifies interest and penalties accrued relating to unrecognized tax benefits as Income tax expense.
F-6
5
MIZUHO FINANCIAL GROUP, INC. AND SUBSIDIARIES
NOTES TO CONSOLIDATED FINANCIAL STATEMENTS—(Continued)
The MHFG Group is currently subject to ongoing tax audits in some jurisdictions. The oldest years open to tax audits in Japan, the United States and the United Kingdom are 2012, 2002 and 2017, respectively. The Group does not anticipate that increases or decreases of unrecognized tax benefits within the next twelve months would have a material effect on its consolidated results of operations or financial condition.
20. Pension and other employee benefit plans
Severance indemnities and pension plans
MHFG and certain subsidiaries sponsor and offer their employees, other than directors and corporate auditors, contributory and
non-contributory
defined benefit plans. Under these plans, employees are provided with
lump-sum
cash payments upon leaving the company. The amount of benefits under each plan is principally determined based on the positions in career, the length of service and the reason for severance. When employees meet certain conditions including the length of service, they may opt to receive annuity payments instead of
lump-sum
payments. MHFG and certain subsidiaries also offer special termination benefits to former employees whose contributions during their careers were deemed meritorious and to those with particular circumstances.
Certain foreign offices and subsidiaries have defined contribution plans and/or defined benefit plans, of which disclosures are combined with those for domestic benefit plans, as they are not significant and those plans don’t use significantly different assumptions.
MHFG and certain subsidiaries have several defined contribution plans. The costs recognized in respect of contributions to the plans for the fiscal years ended March 31, 2019, 2020 and 2021 were ¥
3,217
million, ¥
3,142
million and ¥
4,510
million, respectively.
Pension plans are not fully integrated among subsidiaries of MHFG and plan assets are managed separately by each plan.
Net periodic benefit cost and funded status
The following table presents the components of net periodic cost of the severance indemnities and pension plans for the fiscal years ended March 31, 2019, 2020 and 2021:
|
2019
|
2020
|
2021
|
||||||||||
|
(in millions of yen)
|
||||||||||||
|
Service cost-benefits earned during the fiscal year
|
|
|
|
|||||||||
|
Interest costs on projected benefit obligations
|
|
|
|
|||||||||
|
Expected return on plan assets
|
(
|
) |
(
|
) |
(
|
) | ||||||
|
Amortization of prior service cost (benefits)
|
|
|
(
|
) | ||||||||
|
Amortization of net actuarial loss (gain)
|
(
|
) |
(
|
) |
|
|||||||
|
Special termination benefits
|
|
|
|
|||||||||
|
Loss (gain) on settlement
|
— | — |
(
|
) | ||||||||
|
|
|
|
|
|
|
|||||||
|
Net periodic benefit cost
|
|
|
|
|||||||||
|
|
|
|
|
|
|
|||||||
F-6
6
MIZUHO FINANCIAL GROUP, INC. AND SUBSIDIARIES
NOTES TO CONSOLIDATED FINANCIAL STATEMENTS—(Continued)
Other changes in plan assets and benefit obligations recognized in other comprehensive income (loss)
before-tax
for the fiscal years ended March 31, 2020 and 2021 are summarized as follows:
|
2020
|
2021
|
|||||||
|
(in millions of yen)
|
||||||||
|
Net actuarial gain (loss)
|
(
|
) |
|
|||||
|
Amortization of net actuarial loss (gain)
|
(
|
) |
|
|||||
|
Settlement loss (gain) of net actuarial loss (gain)
|
— |
(
|
) | |||||
|
Prior service benefits (cost)
|
(
|
) |
|
|||||
|
Amortization of prior service cost (benefits)
|
|
(
|
) | |||||
|
|
|
|
|
|||||
|
Total recognized in other comprehensive income (loss)
before-tax
|
(
|
) |
|
|||||
|
|
|
|
|
|||||
Weighted-average assumptions used to determine benefit obligations and net periodic benefit cost are as follows:
|
2019
|
2020
|
2021
|
||||||||||
|
Weighted-average assumptions used to determine benefit obligations at fiscal year end:
|
||||||||||||
|
Discount rates
|
|
% |
|
% |
|
% | ||||||
|
Rates of increase in future compensation levels
|
|
% |
|
% |
|
% | ||||||
|
Interest credit rates
|
|
% |
|
% |
|
% | ||||||
|
Weighted-average assumptions used to determine net periodic benefit cost during the year:
|
||||||||||||
|
Discount rates
|
|
% |
|
% |
|
% | ||||||
|
Rates of increase in future compensation levels
|
|
% |
|
% |
|
% | ||||||
|
Expected rates of return on plan assets
|
|
% |
|
% |
|
% | ||||||
|
Interest credit rates
|
|
|
|
%
|
|
|
|
%
|
|
|
|
%
|
In estimating the discount rates, the MHFG Group looks to interest rates on a portfolio of high-quality fixed-income government and corporate bonds. The durations of these bonds closely match those of the benefit obligations. Discount rates are evaluated at each measurement date. The expected rate of return for each asset category is based primarily on various aspects of the long-term prospects for the economy that include historical performance and the market environment.
F-6
7
MIZUHO FINANCIAL GROUP, INC. AND SUBSIDIARIES
NOTES TO CONSOLIDATED FINANCIAL STATEMENTS—(Continued)
The following table sets forth the combined funded status and amounts recognized in the accompanying consolidated balance sheets at March 31, 2020 and 2021 for the plans of MHFG and its subsidiaries:
|
2020
|
2021
|
|||||||
|
(in millions of yen)
|
||||||||
|
Change in benefit obligations:
|
||||||||
|
Benefit obligations at beginning of fiscal year
|
|
|
||||||
|
Service cost
|
|
|
||||||
|
Interest cost
|
|
|
||||||
|
Plan participants’ contributions
|
|
|
||||||
|
Amendments
(1)
|
|
(
|
) | |||||
|
Actuarial loss (gain)
|
|
(
|
) | |||||
|
Foreign exchange translation
|
(
|
) |
|
|||||
|
Benefits paid
|
(
|
) |
(
|
) | ||||
|
Lump-sum
payments
|
(
|
) |
(
|
) | ||||
|
Settlement
(2)
|
— |
(
|
) | |||||
|
|
|
|
|
|||||
|
Benefit obligations at end of fiscal year
|
|
|
||||||
|
|
|
|
|
|||||
|
Change in plan assets:
|
||||||||
|
Fair value of plan assets at beginning of fiscal year
|
|
|
||||||
|
Actual return (negative return) on plan assets
|
(
|
) |
|
|||||
|
Foreign exchange translation
|
(
|
) |
|
|||||
|
Partial withdrawal of assets from employee retirement benefits trusts
(3)
|
— |
(
|
) | |||||
|
Employer contributions
|
|
|
||||||
|
Plan participants’ contributions
|
|
|
||||||
|
Benefits paid
|
(
|
) |
(
|
) | ||||
|
Settlement
(2)
|
— |
(
|
) | |||||
|
|
|
|
|
|||||
|
Fair value of plan assets at end of fiscal year
|
|
|
||||||
|
|
|
|
|
|||||
|
Funded status
|
|
|
||||||
|
|
|
|
|
|||||
|
Amounts recognized in the consolidated balance sheets consist of:
|
||||||||
|
Prepaid pension cost
|
|
|
||||||
|
Accrued pension liability
|
(
|
) |
(
|
) | ||||
|
|
|
|
|
|||||
|
Net amount recognized
|
|
|
||||||
|
|
|
|
|
|||||
|
Amounts recognized in Accumulated other comprehensive income (loss)
before-tax
consist of:
|
||||||||
|
Prior service benefits (cost)
|
(
|
) |
|
|||||
|
Net actuarial gain (loss)
|
|
|
||||||
|
|
|
|
|
|||||
|
Net amount recognized
|
|
|
||||||
|
|
|
|
|
|||||
Notes:
| (1) |
The amount of ¥
|
F-6
8
MIZUHO FINANCIAL GROUP, INC. AND SUBSIDIARIES
NOTES TO CONSOLIDATED FINANCIAL STATEMENTS—(Continued)
| (2) |
The amount of ¥
|
| (3) |
During the fiscal year ended March 31, 2021, certain subsidiaries of MHFG partially withdrew assets from employee retirement benefit trusts, which were established for the payment of employees’ severance pay and retirement pensions. Overall, the trusts remain in overfunded status as of March 31, 2021.
|
The aggregated accumulated benefit obligations of these plans were ¥
1,571,296
million and ¥
1,437,843
million, as of March 31, 2020 and 2021, respectively. The defined benefit plans generally employ a multi-variable and
Employees with service in excess of one year are qualified to receive lump-sum severance indemnities.
non-linear
formula based upon rank and years of service.
The following table shows the projected benefit obligations and the fair value of plan assets for the plans of MHFG and its subsidiaries with projected benefit obligations in excess of plan assets, and the accumulated benefit obligations and the fair value of plan assets for the plans with accumulated benefit obligations in excess of plan assets at March 31, 2020 and 2021:
|
2020
|
2021
|
|||||||
|
(in millions of yen)
|
||||||||
|
Plans with projected benefit obligations in excess of plan assets:
|
||||||||
|
Projected benefit obligations
|
|
|
||||||
|
Fair value of plan assets
|
|
|
||||||
|
Plans with accumulated benefit obligations in excess of plan assets:
|
||||||||
|
Accumulated benefit obligations
|
|
|
||||||
|
Fair value of plan assets
|
|
|
||||||
| Note: |
The plans with projected benefit obligations in excess of plan assets include those with accumulated benefit obligations in excess of plan assets.
|
Investment policies and asset allocation
In managing plan assets, the MHFG Group determines the appropriate levels of risk that the Group can assume under the given circumstances to maximize the investment returns from a long-term perspective while ensuring that sufficient funds will be available to plan participants and beneficiaries. Generally, the investment returns are relative to the risks involved. In considering the maximum levels of risk that the MHFG Group can assume, it primarily considers the following factors: the employers’ burden of maintaining the benefit plans based on the design of the plans and future plan contributions, the age distribution of the plan participants and beneficiaries, the financial conditions of the employers, and the employers’ ability to absorb future variability in plan premiums. The long-term asset allocation to each asset category such as Japanese equity securities, Japanese debt securities, foreign equity securities and foreign debt securities is determined based upon the optimal portfolio, which is estimated to yield the maximum return within the range of an acceptable level of risk. Additionally, the asset allocation is reviewed whenever there are large fluctuations in pension plan liabilities caused by modifications of pension plans, or there are changes in the market environment. When selecting an investment in each asset category, the MHFG Group takes into consideration credit standing of an investee, concentration of credit risk to a certain investee and liquidity of a financial instrument among other things. The investments in each asset category are further diversified across funds, strategies and sectors along with other things. There is no significant investment in a single investee except Japanese government bonds.
F-6
9
MIZUHO FINANCIAL GROUP, INC. AND SUBSIDIARIES
NOTES TO CONSOLIDATED FINANCIAL STATEMENTS—(Continued)
Certain subsidiaries of MHFG established employee retirement benefit trusts and transferred their assets to the trusts as plan assets. These assets are separated from the employer’s proprietary assets for the payment to the plan beneficiaries. The assets held in these trusts are primarily Japanese equity securities and have been entrusted directly to qualified trustees including trust banks.
MHFG and certain subsidiaries’ target allocation for the plan assets, excluding those of the employee retirement benefit trusts, at March 31, 2021 is as follows:
|
Asset category
|
Asset ratio
|
|||
|
Japanese equity securities
|
|
% | ||
|
Japanese debt securities
|
|
% | ||
|
Foreign equity securities
|
|
% | ||
|
Foreign debt securities
|
|
% | ||
|
General account of life insurance companies
|
|
% | ||
|
Other
|
|
% | ||
|
|
|
|||
|
Total
|
|
% | ||
|
|
|
|||
| Note: |
General account of life insurance companies is a contract with life insurance companies which guarantees payments of principal and predetermined interest payments.
|
F-
70
MIZUHO FINANCIAL GROUP, INC. AND SUBSIDIARIES
NOTES TO CONSOLIDATED FINANCIAL STATEMENTS—(Continued)
Fair value of plan assets
The following table presents the fair value of plan assets of MHFG and its subsidiaries at March 31, 2020 and 2021, by asset class. For the detailed information on fair value measurements, including descriptions of Level 1, 2 and 3 of the fair value hierarchy and the valuation methodologies, see Note 27 “Fair value.”
|
2020
|
2021
|
|||||||||||||||||||||||||||||||
|
Level 1
|
Level 2
|
Level 3
|
Total
|
Level 1
|
Level 2
|
Level 3
|
Total
|
|||||||||||||||||||||||||
|
(in billions of yen)
|
||||||||||||||||||||||||||||||||
|
Japanese equity securities:
|
||||||||||||||||||||||||||||||||
|
Common stocks
(1)
|
|
— | — |
|
|
— | — |
|
||||||||||||||||||||||||
|
Pooled funds
(2)
|
|
|
— |
|
|
|
— |
|
||||||||||||||||||||||||
|
Japanese debt securities:
|
||||||||||||||||||||||||||||||||
|
Government bonds
|
|
— | — |
|
|
— | — |
|
||||||||||||||||||||||||
|
Pooled funds
(2)
|
— |
|
— |
|
— |
|
— |
|
||||||||||||||||||||||||
|
Other
|
— |
|
— |
|
— |
|
— |
|
||||||||||||||||||||||||
|
Foreign equity securities:
|
||||||||||||||||||||||||||||||||
|
Common stocks
|
|
— | — |
|
|
— | — |
|
||||||||||||||||||||||||
|
Pooled funds
(2)
|
— |
|
— |
|
— |
|
— |
|
||||||||||||||||||||||||
|
Foreign debt securities:
|
||||||||||||||||||||||||||||||||
|
Government bonds
|
|
|
— |
|
|
|
— |
|
||||||||||||||||||||||||
|
Pooled funds
(2)
|
— |
|
— |
|
— |
|
— |
|
||||||||||||||||||||||||
|
Other
|
— |
|
— |
|
— |
|
— |
|
||||||||||||||||||||||||
|
General account of life insurance companies
(3)
|
— |
|
— |
|
— |
|
— |
|
||||||||||||||||||||||||
|
Other
|
|
(4)
|
|
— |
|
|
(4)
|
(
|
) | — |
|
|||||||||||||||||||||
|
Plan assets measured at net asset value
(5)
|
|
|
||||||||||||||||||||||||||||||
|
|
|
|
|
|
|
|
|
|
|
|
|
|
|
|
|
|||||||||||||||||
|
Total assets at fair value
|
|
|
— |
|
|
|
— |
|
||||||||||||||||||||||||
|
|
|
|
|
|
|
|
|
|
|
|
|
|
|
|
|
|||||||||||||||||
Notes:
| (1) |
This class represents equity securities held in the employee retirement benefit trusts of ¥
|
| (2) |
These classes primarily include pension investment fund trusts. Investments in these classes are generally measured at fair value and can be redeemed within a short-term period upon request.
|
| (3) |
Investments in this class are measured at conversion value, which is equivalent to fair value.
|
| (4) |
Amounts primarily include cash and short-term assets carried at fair value.
|
| (5) |
In accordance with ASC 820, certain plan assets that are measured at fair value using the net asset value per share (or its equivalent) practical expedient have not been classified in the fair value hierarchy.
|
There were no returns on and purchases and sales of Level 3 assets during the fiscal years ended March 31, 2020 and 2021.
Contributions
The total contribution of approximately ¥
31
billion is expected to be paid to the pension plans during the fiscal year ending March 31, 2022, based on the current funded status and expected asset return assumptions.
F-
71
MIZUHO FINANCIAL GROUP, INC. AND SUBSIDIARIES
NOTES TO CONSOLIDATED FINANCIAL STATEMENTS—(Continued)
Estimated future benefit payments
The following table presents forecasted benefit payments including the effect of expected future service for the fiscal years indicated:
|
(in millions of yen)
|
||||
|
Fiscal year ending March 31:
|
||||
|
2022
|
|
|||
|
2023
|
|
|||
|
2024
|
|
|||
|
2025
|
|
|||
|
2026
|
|
|||
|
2027-2031
|
|
|||
21. Stock-based compensation
Stock options
MHFG, MHBK, MHTB and MHSC have stock options, in the form of stock acquisition rights, for directors (excluding the outside directors) and executive officers of the respective companies (hereinafter referred to collectively as the “Directors”).
In this plan (“MHFG Stock Plan”),
100
shares of MHFG common stock shall be issued or transferred upon exercise of each of the stock acquisition rights. The exercise price is
1
yen per share. The contractual term of the stock acquisition rights is
20
years. A holder may exercise the stock acquisition rights only after the date on which such holder loses the status as a Director of MHFG, MHBK, MHTB or MHSC.
The following is a roll-forward of MHFG Stock Plan for the fiscal year ended March 31, 2021:
|
Number of
shares |
Weighted-average
exercise price |
Weighted-average
remaining contractual term |
Aggregate
intrinsic value |
|||||||||||||
|
(in yen)
|
(in years)
|
(in millions of yen)
|
||||||||||||||
|
Outstanding at beginning of fiscal year
|
|
|
||||||||||||||
|
Exercised during fiscal year
|
|
|
||||||||||||||
|
|
|
|||||||||||||||
|
Outstanding at end of fiscal year
|
|
|
|
|
||||||||||||
|
|
|
|||||||||||||||
|
Exercisable at end of fiscal year
|
— | — | — | — | ||||||||||||
|
|
|
|||||||||||||||
There were
no
non-vested stock options remaining as of March 31, 2021.
In May 2015, MHFG discontinued the stock option program. Thereafter, MHFG has not issued any new stock options.
Stock compensation programs
MHFG, MHBK, MHTB and MHSC introduced a position-based stock compensation program for Directors (“Stock Compensation I”) in July 2018 and a performance-based stock compensation program for Directors (“Stock Compensation II”) in May 2015. The stock compensation is paid in the form of shares of common stock of MHFG, acquired from the stock market through a trust, with the aim of aligning the Directors’ interests with
F-
72
MIZUHO FINANCIAL GROUP, INC. AND SUBSIDIARIES
NOTES TO CONSOLIDATED FINANCIAL STATEMENTS—(Continued)
those of the shareholders and increasing the incentive to enhance corporate value. Stock Compensation I, in principle, is paid at the time of retirement of the individual Directors in the form of common stock of MHFG and cash, calculated based on their position. Stock Compensation II is calculated and then paid to the Directors based on MHFG Group’s immediate, prior-period performance, the recent performance of organizations that the Directors are in charge of, and the performance of each Director. The payment in the form of common stock of MHFG and cash is deferred over a
three-year
, graded-vesting period. The amount of Stock Compensation I and II is subject to reduction or forfeiture.
The following table presents activities related to the stock compensation programs for the fiscal years ended March 31, 2020 and 2021:
|
Stock Compensation I
|
Stock Compensation II
|
|||||||||||||||
|
2020
|
Number of
shares |
Weighted-average
grant-date fair value |
Number of
shares |
Weighted-average
grant-date fair value |
||||||||||||
|
(per share in yen)
|
(per share in yen)
|
|||||||||||||||
|
Nonvested at the beginning of the year
|
— | — |
|
|
||||||||||||
|
Granted during fiscal year
|
|
|
|
|
||||||||||||
|
Vested during fiscal year
|
|
|
|
|
||||||||||||
|
Forfeited during fiscal year
|
— | — | — | — | ||||||||||||
|
|
|
|
|
|
|
|
|
|||||||||
|
Nonvested at the end of the year
|
— | — |
|
|
||||||||||||
|
|
|
|
|
|
|
|
|
|||||||||
|
Stock Compensation I
|
Stock Compensation II
|
|||||||||||||||
|
2021
|
Number of
shares |
Weighted-average
grant-date fair value |
Number of
shares |
Weighted-average
grant-date fair value |
||||||||||||
|
(per share in yen)
|
(per share in yen)
|
|||||||||||||||
|
Nonvested at the beginning of the year
|
|
|
|
|
||||||||||||
|
Granted during fiscal year
|
|
|
|
|
||||||||||||
|
Vested during fiscal year
|
|
|
|
|
||||||||||||
|
Forfeited during fiscal year
|
|
|
|
|
||||||||||||
|
|
|
|
|
|
|
|
|
|||||||||
|
Nonvested at the end of the year
|
|
|
|
|
||||||||||||
|
|
|
|
|
|
|
|
|
|||||||||
The following table presents the total fair value of the stock compensation that vested and the total amount of the common stock acquired from the stock market by the trustee for the fiscal years ended March 31, 2020 and 2021:
|
2020
|
2021
|
|||||||||||||||
|
Stock
Compensation I |
Stock
Compensation II |
Stock
Compensation I |
Stock
Compensation II |
|||||||||||||
|
(in millions of yen)
|
||||||||||||||||
|
Fair value of vested shares
|
|
|
|
|
||||||||||||
|
Common stock shares acquired
|
|
|
|
|
||||||||||||
For both programs, the stock-based compensation cost is determined based on the fair value of MHFG’s common stock as of grant date. For Stock Compensation I and II, the liability related to the cash-based compensation cost is remeasured at each reporting date based on the fair value of MHFG’s common stock. For Stock Compensation II, the stock-based compensation costs are recognized evenly over the graded-vesting period, which is three years. For Stock Compensation I, as the program is effectively vested on the grant date, the stock-based
F-
73
MIZUHO FINANCIAL GROUP, INC. AND SUBSIDIARIES
NOTES TO CONSOLIDATED FINANCIAL STATEMENTS—(Continued)
compensation cost is recognized on the grant date.
The following table presents the compensation cost recognized in the stock compensation programs for the fiscal years ended March 31, 2019, 2020 and 2021:
|
2019
|
2020
|
2021
|
||||||||||
|
(in millions of yen)
|
||||||||||||
|
Stock Compensation I
|
|
|
|
|||||||||
|
Stock Compensation II
|
|
|
|
|||||||||
With regard to Stock Compensation II, the total compensation cost related to non-vested awards not yet recognized is ¥
1,180
million, and this cost will be recognized over
1.83
years as of the fiscal year ended March 31, 2021.
22. Derivative financial instruments
The MHFG Group enters into derivative financial instruments in response to the diverse needs of customers, to manage the risk related to the assets and liabilities of the Group, as part of its asset and liability management, and for proprietary trading purposes. The Group is exposed primarily to market risk associated with interest rate, commodity, foreign currency, and equity products. Market risk arises from changes in market prices or indices, interest rates and foreign exchange rates that may result in an adverse change in the market value of the financial instrument or an increase in its funding costs. Exposure to market risk is managed by imposing position limits and monitoring procedures and by initiating hedging transactions. In addition to market risk, the Group is exposed to credit risk associated with counterparty default or nonperformance in respect of transactions. Counterparty credit risk arises when a counterparty fails to perform according to the terms and conditions of the contract and the value of the underlying collateral held, if applicable, is not sufficient to recover resulting losses. The exposure to counterparty credit risk is measured by the fair value of all derivatives and its potential exposure at the balance sheet dates. The exposure to counterparty credit risk is managed by entering into legally enforceable master netting agreements to mitigate the overall counterparty credit risk, requiring underlying collateral and guarantees based on an individual credit analysis of each obligor and evaluating the credit features of each instrument. In addition, credit approvals, limits and monitoring procedures are also imposed.
F-7
4
MIZUHO FINANCIAL GROUP, INC. AND SUBSIDIARIES
NOTES TO CONSOLIDATED FINANCIAL STATEMENTS—(Continued)
Notional and fair value amounts of derivative instruments
The following table summarizes the notional and fair value amounts of derivative instruments outstanding as of March 31, 2020 and 2021. The fair values of derivatives are presented on a gross basis; derivative receivables and payables are not offset. In addition, they are not offset against the amounts recognized for the right to reclaim cash collateral or the obligation to return cash collateral under master netting agreements in the consolidated balance sheets, or the table below.
|
Fair value
|
||||||||||||||||||||
|
Derivative receivables
(2)
|
Derivative payables
(2)
|
|||||||||||||||||||
|
2020
|
Notional amount
(1)
|
Designated
as hedges
|
Not designated
as hedges
|
Designated
as hedges
|
Not designated
as hedges
|
|||||||||||||||
|
(in billions of yen)
|
||||||||||||||||||||
|
Interest rate contracts
|
|
— |
|
— |
|
|||||||||||||||
|
Foreign exchange contracts
|
|
— |
|
— |
|
|||||||||||||||
|
Equity-related contracts
|
|
— |
|
— |
|
|||||||||||||||
|
Credit-related contracts
|
|
— |
|
— |
|
|||||||||||||||
|
Other contracts
|
|
— |
|
— |
|
|||||||||||||||
|
|
|
|
|
|
|
|
|
|
|
|||||||||||
|
Total
|
|
— |
|
— |
|
|||||||||||||||
|
|
|
|
|
|
|
|
|
|
|
|||||||||||
|
Fair value
|
||||||||||||||||||||
|
Derivative receivables
(2)
|
Derivative payables
(2)
|
|||||||||||||||||||
|
2021
|
Notional amount
(1)
|
Designated
as hedges
|
Not designated
as hedges
|
Designated
as hedges
|
Not designated
as hedges
|
|||||||||||||||
|
(in billions of yen)
|
||||||||||||||||||||
|
Interest rate contracts
|
|
— |
|
— |
|
|||||||||||||||
|
Foreign exchange contracts
|
|
— |
|
— |
|
|||||||||||||||
|
Equity-related contracts
|
|
— |
|
— |
|
|||||||||||||||
|
Credit-related contracts
|
|
— |
|
— |
|
|||||||||||||||
|
Other contracts
|
|
— |
|
— |
|
|||||||||||||||
|
|
|
|
|
|
|
|
|
|
|
|||||||||||
|
Total
|
|
— |
|
— |
|
|||||||||||||||
|
|
|
|
|
|
|
|
|
|
|
|||||||||||
Notes:
| (1) |
Notional amount includes the sum of gross long and gross short third-party contracts.
|
| (2) |
Derivative receivables and payables are recorded in Trading account assets and Trading account liabilities, respectively.
|
The MHFG Group provided and/or accepted cash collateral for derivative transactions under master netting agreements. The cash collateral, which was not offset against derivative positions, was included in Other assets and Other liabilities, respectively, of which the amounts were ¥
1,246
billion and ¥
846
billion at March 31, 2020, and ¥
1,108
billion and ¥
764
billion at March 31, 2021, respectively.
Hedging activities
In order to qualify for hedge accounting, a derivative must be considered highly effective at reducing the risk associated with the exposure being hedged. Each derivative must be designated as a hedge, with documentation of the risk management objective and strategy, including identification of the hedging instrument, the hedged item and the risk exposure, and how effectiveness is to be assessed prospectively and retrospectively. The extent
F-7
5
MIZUHO FINANCIAL GROUP, INC. AND SUBSIDIARIES
NOTES TO CONSOLIDATED FINANCIAL STATEMENTS—(Continued)
to which a hedging instrument is effective at achieving offsetting changes in fair value or cash flows must be assessed at least quarterly. The MHFG Group’s hedging activities include fair value and net investment hedges.
Net investment hedges
The MHFG Group uses forward foreign exchange contracts and foreign currency-denominated debt instruments to protect the value of net investments in
non-Japanese
subsidiaries from foreign currency exposure. Under net investment hedges, both derivatives and nonderivative financial instruments qualify as hedging instruments. The foreign currency-denominated debt instruments qualifying as hedging instruments include deposits and long-term debt, of which the carrying amounts of the portion designated as net investment hedges are included within the respective items in the consolidated balance sheets as well as relevant accompanying notes. For net investment hedges, the entire change in the fair value of a hedging derivative instrument or nonderivative hedging financial instrument is recorded in Foreign currency translation adjustments within Accumulated other comprehensive income, provided that the hedging instrument is designated as a hedge of the net investment.
The following table summarizes gains and losses information related to net investment hedges for the fiscal years ended March 31, 2019, 2020 and 2021:
|
Gains (losses) recorded in other comprehensive income (“OCI”)
|
||||||||||||
|
2019
|
2020
|
2021
|
||||||||||
|
(in millions of yen)
|
||||||||||||
|
Financial instruments hedging foreign exchange risk
|
|
|
|
|||||||||
|
|
|
|
|
|
|
|||||||
|
Total
|
|
|
|
|||||||||
|
|
|
|
|
|
|
|||||||
| Note: |
Related to the net investment hedges, gains (losses) of ¥
|
Derivative instruments not designated or qualifying as hedges
The MHFG Group enters into the following derivative transactions that do not qualify for hedge accounting with a view to implementing risk management strategies: (1) interest-rate swap transactions for the purpose of economically managing the interest-rate risks in deposits, loans etc., (2) currency swap transactions for the purpose of economically managing the foreign exchange risk of these assets, and (3) credit derivatives for the purpose of economically managing the credit risk in loans, residential mortgage-backed securities (“RMBS”), commercial mortgage-backed securities (“CMBS”), collateralized loan obligations (“CLO”) and other similar assets. Such derivatives are accounted for as trading positions. The changes in fair value of these instruments are primarily recorded in Trading account gains (losses)—net, even though they are used to mitigate or transform the risk of exposures arising from banking activities. The net gains (losses) resulting from changes in the fair value of certain credit derivatives where the Group purchases protection to mitigate its credit risk exposure, related to its corporate loan portfolio, is recorded in Other noninterest income (expenses).
F-7
6
MIZUHO FINANCIAL GROUP, INC. AND SUBSIDIARIES
NOTES TO CONSOLIDATED FINANCIAL STATEMENTS—(Continued)
The following table summarizes gains and losses on derivatives not designated or qualifying as hedges during the fiscal years ended March 31, 2019, 2020 and 2021:
|
Gains (losses) recorded in income
|
||||||||||||
|
2019
|
2020
|
2021
|
||||||||||
|
(in millions of yen)
|
||||||||||||
|
Interest rate contracts
|
|
|
(
|
) | ||||||||
|
Foreign exchange contracts
|
|
(
|
) |
|
||||||||
|
Equity-related contracts
(1)
|
|
|
(
|
) | ||||||||
|
Credit-related contracts
(2)
|
(
|
) |
|
(
|
) | |||||||
|
Other contracts
|
(
|
) |
(
|
) |
|
|||||||
|
|
|
|
|
|
|
|||||||
|
Total
|
|
|
(
|
) | ||||||||
|
|
|
|
|
|
|
|||||||
Notes:
| (1) |
The net gains (losses) excluded from the assessment of the effectiveness of fair value hedges is not included in the above table.
|
| (2) |
Amounts include the net gains (losses) of ¥(
|
Credit derivatives
A credit derivative is a bilateral contract between a seller and a buyer of protection against the credit risk of a particular entity. Credit derivatives generally require that the seller of credit protection make payments to the buyer upon the occurrence of predefined credit events, which include bankruptcy, dissolution or insolvency of the referenced entity. The MHFG Group either purchases or writes protection on either a single name or a portfolio of reference credits. The Group enters into credit derivatives to help mitigate credit risk in its corporate loan portfolio and other cash positions, to take proprietary trading positions, and to facilitate client transactions.
The notional amount of credit derivatives represents the maximum potential amount of future payments the seller could be required to make. If the predefined credit event occurs, the seller will generally have a right to collect on the underlying reference credit and the related cash flows, while being liable for the full notional amount of credit protection to the buyer. The Group manages credit risk associated with written protection by purchasing protection with identical or similar underlying reference credits, which substantially offsets its exposure. Thus, the notional amount is not necessarily a reliable indicator of the Group’s actual loss exposure.
The following table summarizes the notional and fair value amounts of credit derivatives at March 31, 2020 and 2021:
|
2020
|
2021
|
|||||||||||||||
|
Notional amount
|
Fair value
|
Notional amount
|
Fair value
|
|||||||||||||
|
(in billions of yen)
|
||||||||||||||||
|
Credit protection written:
|
||||||||||||||||
|
Investment grade
|
|
(
|
) |
|
|
|||||||||||
|
Non-investment
grade
|
|
|
|
|
||||||||||||
|
|
|
|
|
|
|
|
|
|||||||||
|
Total
|
|
(
|
) |
|
|
|||||||||||
|
|
|
|
|
|
|
|
|
|||||||||
|
Credit protection purchased
|
|
|
|
(
|
) | |||||||||||
|
|
|
|
|
|
|
|
|
|||||||||
F-7
7
MIZUHO FINANCIAL GROUP, INC. AND SUBSIDIARIES
NOTES TO CONSOLIDATED FINANCIAL STATEMENTS—(Continued)
| Note: |
The rating scale is based upon either the external ratings or the internal ratings of the underlying reference credit. The lowest investment grade rating is considered to be BBB-, while anything below or unrated is considered to be
non-investment
grade.
Non-investment
grade credit derivatives primarily consist of unrated credit default swap indices such as CDX and iTraxx.
|
The following table shows the maximum potential amount of future payments for credit protection written by expiration period at March 31, 2020 and 2021:
|
Maximum payout/Notional amount
|
||||||||
|
2020
|
2021
|
|||||||
|
(in billions of yen)
|
||||||||
|
One year or less
|
|
|
||||||
|
After one year through five years
|
|
|
||||||
|
After five years
|
|
|
||||||
|
|
|
|
|
|||||
|
Total
|
|
|
||||||
|
|
|
|
|
|||||
| Note: |
The maximum potential amount of future payments is the aggregate notional amount of the credit derivatives where the Group wrote the credit protection, and it has not been reduced by the effect of any amounts that the Group may possibly collect on the underlying assets and the related cash flows, nor netted against that of credit protection purchased.
|
Credit-related contingent features
Certain of the MHFG Group’s derivative instruments contain provisions that require the Group’s debt to maintain an investment grade credit rating from the major credit rating agencies. If the Group’s debt credit rating were to fall below investment grade, the counterparties to the derivative instruments could request immediate payment or demand immediate and ongoing full overnight collateralization on derivative instruments which are in net liability positions for the Group.
The following table shows the quantitative information about derivative instruments with credit-risk-related contingent features at March 31, 2020 and 2021:
|
2020
|
2021
|
|||||||
|
(in billions of yen)
|
||||||||
|
Aggregate fair value of derivative instruments with credit-risk-related contingent features in net liability positions
|
|
|
||||||
|
Collateral provided to counterparties in the normal course of business
|
|
|
||||||
|
Amount required to be posted as collateral or settled immediately if credit-risk-related contingent features were triggered
|
|
|
||||||
23. Commitments and contingencies
Obligations under guarantees
The MHFG Group provides guarantees or indemnifications to counterparties to enhance their credit standing and enable them to complete a variety of business transactions. A guarantee represents an obligation to make payments to third parties if the counterparty fails to fulfill its obligation under a borrowing arrangement or other contractual obligation.
F-7
8
MIZUHO FINANCIAL GROUP, INC. AND SUBSIDIARIES
NOTES TO CONSOLIDATED FINANCIAL STATEMENTS—(Continued)
The types of guarantees under ASC 460, “Guarantees” (“ASC 460”) provided by the MHFG Group are described below.
Performance guarantees
Performance guarantees are issued to guarantee customers’ performance under contractual arrangements such as a tender bid on a construction project or the completion of a construction project.
Guarantees on loans
Guarantees on loans include obligations to guarantee the customers’ borrowing contracts. The MHFG Group is required to make payments to the guaranteed parties in the event that customers fail to fulfill obligations under the contracts.
Guarantees on securities
Guarantees on securities include obligations to guarantee securities, such as bonds issued by customers.
Other guarantees
Other guarantees include obligations to guarantee customers’ payments, such as tax payments.
Guarantees for the repayment of trust principal
The MHFG Group provides certain trust products with guarantees for the repayment of trust principal, e.g., loan trusts and certain jointly operated designated money trusts. Pursuant to Japanese trust-related laws, trustees are prohibited from compensating beneficiaries for any loss in the beneficial interests in each trust. However, under a special condition of the Japanese trust-related laws, trust banks as trustees are allowed to enter into an agreement to provide compensation for any loss in the principal of the trust. The MHFG Group manages and administers the trust assets to minimize exposures against losses from the guarantees for the repayment of trust principal, including
writing-off
nonaccrual loans and charging it to the trust account profits. In performing its fiduciary duties, the MHFG Group also manages the trust assets separately from its own proprietary assets on behalf of customers and keeps separate records for the trust activities. The MHFG Group consolidates certain guaranteed principal money trusts. See Note 24 “Variable interest entities and securitizations” for further discussion of the guaranteed principal money trusts. The contract amounts of guarantees for repayment of unconsolidated trust principal are presented in the tables below.
Part of the trust account profits is set aside as a reserve in trust accounts to absorb losses in the trust asset portfolios in accordance with relevant Japanese laws concerning the trust business and/or trust agreements. Statutory reserves for loan trusts and reserves for jointly operated designated money trusts are calculated based on the trust principal or the balance of loans and other assets in the trust accounts. Since the probability of principal indemnification is considered to be remote, the MHFG Group had no related reserve for credit losses recorded in its consolidated financial statements.
Liabilities of trust accounts
The MHFG Group, as trustee, may enter into an agreement with a third party who is not the party to the relevant trust agreement to the extent necessary to handle the trust affairs for the purpose of fulfilling the objectives of the trust and, as such, the trustee shall be allowed to assume certain liabilities. Pursuant to Japanese trust-related
F-7
9
MIZUHO FINANCIAL GROUP, INC. AND SUBSIDIARIES
NOTES TO CONSOLIDATED FINANCIAL STATEMENTS—(Continued)
laws, the trustee is ultimately liable to pay those liabilities out of its proprietary assets in the event that the trust assets are insufficient to cover those liabilities. The amount of trust liabilities rarely exceeds the amount of trust assets and, therefore, those liabilities are generally covered by the corresponding trust assets. To avoid the demand for payment out of the proprietary assets, the trustee can enter into a special covenant of limited liability under which the trust creditors agree to limit the trustee’s liability to the value of the trust assets and to waive the right for compulsory execution against the trustee’s proprietary assets. The MHFG Group regularly monitors the condition of trust accounts to minimize exposures against making payment.
The amounts of such liabilities in the trust accounts, excluding those with the special covenant of limited liability, are presented in the tables below. Liabilities of trust accounts principally include obligations to return collateral under security lending transactions and other transactions.
Derivative financial instruments
Certain written options and credit default swaps are deemed guarantees pursuant to the definition of guarantees in ASC 460 if these contracts require the MHFG Group to make payments to counterparties based on changes in an underlying instrument or index that is related to an asset, a liability, or an equity security of the counterparties. The MHFG Group’s payments could involve a gross settlement or a net settlement. Because it is difficult in practice to determine whether the counterparty has the asset, the liability or the equity security relating to the underlying, the MHFG Group has decided to include all credit default swaps and written options, excluding written options outside the scope of ASC 460, in the guarantee disclosures.
The MHFG Group records all guarantees and similar obligations subject to ASC 460 at fair value in the consolidated balance sheets at the inception of the guarantee. The total carrying amount of guarantees and similar obligations at March 31,2020 and 2021 was ¥
521
billion and ¥
160
billion, respectively, and was included in Other liabilities and Trading account liabilities. The total includes the carrying amounts of derivatives that are deemed to be guarantees, which amounted to ¥
502
billion and ¥
138
billion at March 31, 2020 and 2021, respectively.
The table below summarizes the remaining term and maximum potential amount of future payments by type of guarantee at March 31, 2020 and 2021. The maximum potential amount of future payments disclosed below represents the contractual amounts that could be required to be repaid in the event of the guarantees being executed, without consideration of possible recoveries under recourse provisions or from collateral held. With respect to written options included in derivative financial instruments in the table below, in theory, the MHFG Group is exposed to unlimited losses; therefore, the table shows the notional amounts of the contracts as a substitute for the maximum exposure.
F-
80
MIZUHO FINANCIAL GROUP, INC. AND SUBSIDIARIES
NOTES TO CONSOLIDATED FINANCIAL STATEMENTS—(Continued)
The MHFG Group, when necessary, requires collateral such as cash, investment securities and real estate or third-party guarantees depending on the amount of credit risk involved, and employs means such as
sub-participation
to reduce the credit risk associated with guarantees. The maximum exposure or notional amount below does not represent the expected losses from the execution of the guarantees.
|
2020
|
Maximum
potential/Contractual
or Notional amount
|
Amount by expiration period
|
||||||||||||||
|
One year or
less |
After one year
through
five years
|
After five years
|
||||||||||||||
|
(in billions of yen)
|
||||||||||||||||
|
Performance guarantees
|
|
|
|
|
||||||||||||
|
Guarantees on loans
|
|
|
|
|
||||||||||||
|
Guarantees on securities
|
|
|
|
— | ||||||||||||
|
Other guarantees
|
|
|
|
|
||||||||||||
|
Guarantees for the repayment of trust principal
|
|
— |
|
|
||||||||||||
|
Liabilities of trust accounts
|
|
|
|
|
||||||||||||
|
Derivative financial instruments
|
|
|
|
|
||||||||||||
|
2021
|
Maximum
potential/Contractual
or Notional amount
|
Amount by expiration period
|
||||||||||||||
|
One year or
less |
After one year
through
five years
|
After five years
|
||||||||||||||
|
(in billions of yen)
|
||||||||||||||||
|
Performance guarantees
|
|
|
|
|
||||||||||||
|
Guarantees on loans
|
|
|
|
|
||||||||||||
|
Guarantees on securities
|
|
|
|
— | ||||||||||||
|
Other guarantees
|
|
|
|
|
||||||||||||
|
Guarantees for the repayment of trust principal
|
|
|
|
|
||||||||||||
|
Liabilities of trust accounts
|
|
|
|
|
||||||||||||
|
Derivative financial instruments
|
|
|
|
|
||||||||||||
The table below presents the maximum potential amount of future payments of performance guarantees, guarantees on loans, guarantees on securities and other guarantees classified based on internal ratings at March 31, 2020 and 2021:
|
2020
|
2021
|
|||||||
|
(in billions of yen)
|
||||||||
|
Investment grade
|
|
|
||||||
|
Non-investment
grade
|
|
|
||||||
|
|
|
|
|
|||||
|
Total
|
|
|
||||||
|
|
|
|
|
|||||
| Note: |
Investment grade in the internal rating scale generally corresponds to
BBB-
or above in the external rating scale.
|
Other
off-balance-sheet
instruments
In addition to guarantees, the MHFG Group issues other
off-balance-sheet
instruments to its customers, such as lending-related commitments and commercial letters of credit. Under the terms of these arrangements, the MHFG Group is required to extend credit or make certain payments upon the customers’ requests.
F-
81
MIZUHO FINANCIAL GROUP, INC. AND SUBSIDIARIES
NOTES TO CONSOLIDATED FINANCIAL STATEMENTS—(Continued)
Commitments to extend credit
Commitments to extend credit are legally binding agreements to lend to customers on demand. They usually have set maturity dates. These agreements differ from guarantees in that they are generally revocable or contain provisions that enable the MHFG Group to avoid payment or reduce the amount of credit extended under certain conditions, such as the deterioration of the borrower’s financial condition or other reasonable conditions. The MHFG Group monitors the financial condition of the potential borrowers throughout the commitment period to determine whether additional collateral or changes in the terms of the commitment are necessary. Since many of these commitments to extend credit expire without being drawn upon, the total commitment amounts do not necessarily represent future cash requirements.
Commitments to invest in securities
Commitments to invest in securities include legally binding contracts to make additional contributions to investment funds, such as private equity funds in accordance with the terms of investment agreements.
Commercial letters of credit
Commercial letters of credit are issued in connection with customers’ trade transactions. Normally, the customers cannot receive the goods until they make payment to a bank, and therefore these commercial letters of credit are collateralized by the underlying goods. Upon issuance of commercial letters of credit, the MHFG Group monitors the credit risk associated with these transactions to determine if additional collateral is required.
The table below summarizes the contractual amounts with regard to these undrawn commitments at March 31, 2020 and 2021:
|
2020
|
2021
|
|||||||
|
(in billions of yen)
|
||||||||
|
Commitments to extend credit
(Note)
|
|
|
||||||
|
Commercial letters of credit
|
|
|
||||||
|
|
|
|
|
|||||
|
Total
|
|
|
||||||
|
|
|
|
|
|||||
| Note: |
Commitments to extend credit include commitments to invest in s
e
curities.
|
Legal proceedings and investigations
The MHFG Group is involved in normal collection proceedings initiated by the Group, other legal proceedings and investigations in the ordinary course of business. In accordance with ASC 450, the Group recognizes a liability for loss contingencies arising from such proceedings and investigations when a loss is probable and the loss amount or the range of the loss can be reasonably estimated. If a loss does not meet this condition but is reasonably possible, the Group does not recognize a liability but discloses the detail of such proceedings and investigations. Based on the information available as of the date of the consolidated financial statements, the Group believes that the outcome of the collection, legal proceedings and investigations will not have a significant adverse effect on the consolidated financial statements.
Leases
The MHFG Group is obligated under a number of lease arrangements. The Group’s lessee arrangements mainly consist of operating leases for real estate, such as office space, including its head office, and branches. Finance leases are not significant. Some of the Group’s operating leases include variable lease payments.
F-8
2
MIZUHO FINANCIAL GROUP, INC. AND SUBSIDIARIES
NOTES TO CONSOLIDATED FINANCIAL STATEMENTS—(Continued)
operating
leases as of March 31, 2020 and 2021:
|
2020
|
2021
|
|||||||
|
(in millions of yen, except for remaining lease
term and discount rate) |
||||||||
|
Right-of-use
(Note)
|
|
|
||||||
|
Lease liabilities
(Note)
|
|
|
||||||
|
Weighted average:
|
||||||||
|
Remaining lease term
|
|
years |
|
years | ||||
|
Discount rate
|
|
% |
|
% | ||||
| Note: |
Right-of-use
|
|
2020
|
2021
|
|||||||
|
(in millions of yen)
|
||||||||
|
Lease cost
(Note)
|
|
|
||||||
|
Right-of-use
|
|
|
||||||
|
Operating cash flows
|
|
|
||||||
| Note: |
Lease cost for operating leases are included in Occupancy expenses on the consolidated statements of income. The Group’s variable lease costs and costs for leases with terms of twelve months or less are not significant. Total rental expense for the fiscal year ended March 31, 2019 prior to the adoption of ASU
No.2016-02,
“Leases (Topic 842)” was ¥
|
|
As of March 31, 2021
|
||||
|
(in millions of yen)
|
||||
|
Fiscal year ending March 31:
|
||||
|
2022
|
|
|||
|
2023
|
|
|||
|
2024
|
|
|||
|
2025
|
|
|||
|
2026
|
|
|||
|
2027 and thereafter
|
|
|||
|
|
|
|||
|
Total lease payments
|
|
|||
|
|
|
|||
|
Amount representing interest
|
|
|||
|
|
|
|||
|
Total lease liabilities for operating leases
|
|
|||
|
|
|
|||
24. Variable interest entities and securitizations
Variable interest entities
In the normal course of business, the MHFG Group is involved with VIEs primarily through the following types of transactions: asset-backed commercial paper/loan programs, asset-backed securitizations, investments in
F-
83
MIZUHO FINANCIAL GROUP, INC. AND SUBSIDIARIES
NOTES TO CONSOLIDATED FINANCIAL STATEMENTS—(Continued)
securitization products, investment funds, trust arrangements, structured finance, and funding vehicles. The Group consolidates certain of these VIEs, where the Group is deemed to be the primary beneficiary because it has both (1) the power to direct the activities of the VIE that most significantly impact the VIE’s economic performance and (2) the obligation to absorb losses or the right to receive benefits that could potentially be significant to the VIE. The MHFG Group reassesses whether it is the primary beneficiary on an ongoing basis as long as the Group has any continuing involvement with the VIE. There are also other VIEs, where the Group has determined that it is not the primary beneficiary but has significant variable interests. In evaluating the significance of the variable interests, the Group takes into consideration the extent of its involvement with each VIE, such as the seniority of its investments, the share of its holding in each tranche and the variability it expects to absorb, as well as other relevant facts and circumstances. The likelihood of loss is not necessarily relevant to the determination of significance, and therefore, “significant” does not imply that there is high likelihood of loss. The maximum exposure to loss that is discussed in this section refers to the maximum loss that the Group could possibly be required to record in its consolidated statements of income as a result of its involvement with the VIEs. This represents exposures associated with both
on-balance-sheet
assets and
off-balance-sheet
liabilities related to the VIEs. Further, this maximum potential loss is disclosed regardless of the probability of such losses and, therefore, it is not indicative of the ongoing exposure which is managed within the Group’s risk management framework.
F-
8
4
MIZUHO FINANCIAL GROUP, INC. AND SUBSIDIARIES
NOTES TO CONSOLIDATED FINANCIAL STATEMENTS—(Continued)
The table below shows the consolidated assets of the Group’s consolidated VIEs as well as total assets and maximum exposure to loss for its significant unconsolidated VIEs, in which the Group has determined that its maximum exposure to loss is greater than specific thresholds or meets certain other criteria as of March 31, 2020 and 2021:
|
Consolidated VIEs
|
Significant
unconsolidated VIEs
|
|||||||||||
|
2020
|
Consolidated assets
|
Total assets
|
Maximum
exposure to loss
|
|||||||||
|
(in billions of yen)
|
||||||||||||
|
Asset-backed commercial paper/loan programs
|
|
— | — | |||||||||
|
Asset-backed securitizations
|
|
|
|
|||||||||
|
Investments in securitization products
|
|
— | — | |||||||||
|
Investment funds
|
|
|
|
|||||||||
|
Trust arrangements and other
|
|
— | — | |||||||||
|
|
|
|
|
|
|
|||||||
|
Total
|
|
|
|
|||||||||
|
|
|
|
|
|
|
|||||||
|
Consolidated VIEs
|
Significant
unconsolidated VIEs
|
|||||||||||
|
2021
|
Consolidated assets
|
Total assets
|
Maximum
exposure to loss
|
|||||||||
|
(in billions of yen)
|
||||||||||||
|
Asset-backed commercial paper/loan programs
|
|
— | — | |||||||||
|
Asset-backed securitizations
|
|
|
|
|||||||||
|
Investments in securitization products
|
|
— | — | |||||||||
|
Investment funds
|
|
|
|
|||||||||
|
Trust arrangements and other
|
|
— | — | |||||||||
|
|
|
|
|
|
|
|||||||
|
Total
|
|
|
|
|||||||||
|
|
|
|
|
|
|
|||||||
As of March 31, 2020 and 2021, the noncontrolling interests in consolidated VIEs amounted to ¥
541
billion and ¥
464
billion, respectively, and included in the Group’s equity-classified noncontrolling interests.
The Group has not provided financial or other support to consolidated or unconsolidated VIEs that the Group was not previously contractually required to provide.
The tables below present the carrying amounts and classification of assets and liabilities on the MHFG Group’s balance sheets that relate to its variable interests in significant unconsolidated VIEs, as of March 31, 2020 and 2021:
|
Assets on balance sheets related to unconsolidated VIEs:
|
2020
|
2021
|
||||||
|
(in billions of yen)
|
||||||||
|
Trading account assets
|
|
|
||||||
|
Investments
|
|
|
||||||
|
Loans
|
|
|
||||||
|
|
|
|
|
|||||
|
Total
|
|
|
||||||
|
|
|
|
|
|||||
F-
85
MIZUHO FINANCIAL GROUP, INC. AND SUBSIDIARIES
NOTES TO CONSOLIDATED FINANCIAL STATEMENTS—(Continued)
|
Liabilities on balance sheets and maximum exposure to loss related to unconsolidated VIEs:
|
2020
|
2021
|
||||||
|
(in billions of yen)
|
||||||||
|
Payables under securities lending transactions
|
|
|
||||||
|
Trading account liabilities
|
|
|
||||||
|
|
|
|
|
|||||
|
Total
|
|
|
||||||
|
|
|
|
|
|||||
|
Maximum exposure to loss
(Note)
|
|
|
||||||
|
|
|
|
|
|||||
| Note: |
This represents the maximum amount the Group could possibly be required to record in its consolidated statements of income associated with
on-balance-sheet
exposures and
off-balance-sheet
liabilities such as undrawn commitments.
|
In the table above the nature of the Group’s variable interest can take different forms, as described further in the notes below. Additionally the Group’s exposure to the obligations of VIEs is generally limited to its interest in these entities. In certain instances the Group provides undrawn commitments to the VIEs.
The Group’s maximum exposure to loss presented in the table above does not include the benefit of offsetting financial instruments that are held to mitigate the risks associated with these variable interests. Furthermore, the Group’s maximum exposure to loss presented in the table above is not reduced by the amount of collateral held as part of the transaction with the VIE or any party to the VIE directly against a specific exposure to loss.
Asset-backed commercial paper/loan programs
The MHFG Group manages several asset-backed commercial paper/loan programs that provide its clients with
off-balance-sheet
and/or cost-effective financing. The VIEs used in the programs purchase financial assets, primarily receivables, from clients participating in the programs and provide liquidity through the issuance of commercial paper or borrowings from the MHFG Group backed by the financial assets. While customers normally continue to service the transferred receivables, the MHFG Group underwrites, distributes, and makes a market in commercial paper issued by the conduits. The MHFG Group typically provides program-wide liquidity and credit support facilities and, in some instances, financing to the VIEs. The MHFG Group has the power to determine which assets will be held by the VIEs and has an obligation to monitor these assets. The Group is also responsible for liability management. In addition, through the liquidity and credit support facilities provided to the VIEs, the Group has the obligation to absorb losses that could potentially be significant to the VIEs. Therefore, the Group consolidates such VIEs.
Asset-backed securitizations
The MHFG Group acts as an arranger of various types of structured finance schemes to meet its clients’ needs for
off-balance-sheet
financing. In substantially all of these structured financing transactions, the transfer of the financial asset by the client is structured to be bankruptcy remote by use of a bankruptcy remote entity, which is deemed to be a VIE because its equity holder does not have decision making rights. The MHFG Group receives fees for structuring and/or distributing the securities sold to investors. In some cases, the MHFG Group itself purchases the securities issued by the entities and/or provides loans to the VIEs.
In addition, the MHFG Group establishes several single-issue and multi-issue special purpose entities that issue collateralized debt obligations (“CDO”) or CLO, synthetic CDO/CLO or other repackaged instruments to meet clients’ and investors’ financial needs. The MHFG Group also arranges securitization transactions including CMBS, RMBS and others. In these transactions, the MHFG Group acts as an underwriter, placement agent, asset manager, derivatives counterparty, and/or investor in debt and equity instruments.
F-
86
MIZUHO FINANCIAL GROUP, INC. AND SUBSIDIARIES
NOTES TO CONSOLIDATED FINANCIAL STATEMENTS—(Continued)
In these cases, the MHFG Group consider that these variable interests are not significant as the MHFG Group does not have material balance sheet or
off-balance
exposure at risk related to these variable interests. However, when the MHFG Group has invested in securities issued by the VIEs and/or provides loans to the VIEs and its investment is most part
o
f shares, such variable interests are deemed to be “significant.” In certain VIEs, where the MHFG Group provides liquidity and credit support facilities, writes credit protection or invests in debt or equity instruments in its role as an arranger, servicer, administrator or asset manager, etc., the Group has the power to determine which assets will be held by the VIEs or to manage and monitor these assets. In addition, through the variable interests above, the Group has the obligation to absorb losses and the right to receive benefits that could potentially be significant to the VIEs. Therefore, the Group consolidates such VIEs.
The MHFG Group established certain VIEs to securitize its own mortgage loans. The Group provides servicing for and holds retained subordinated beneficial interests in the securitized mortgage loans. In addition, the Group retains credit exposure in the form of guarantees on these loans. In its role as a servicer, the Group has the power to direct the entity’s activities that most significantly impact the entity’s economic performance by managing defaulted mortgage loans. In addition, through its retained interests and its aforementioned involvement as a guarantor, the Group has the obligation to absorb losses and the right to receive benefits that could potentially be significant to the entity. Therefore, the Group consolidates such VIEs.
The MHFG Group started Tender Option Bond (“TOB”) programs in the fiscal year ended March 31, 2020, which is associated with trusts that hold highly-rated, fixed-rate and
38
billion at March 31, 2021. The residual holders of customer TOB trusts are obligated to reimburse the Group for any payment the Group makes under those liquidity and credit support facilities. In
tax-exempt
municipal bonds. The trust finances the purchase of their municipal bonds by issuing two types of certificates: (1) short-term puttable and floating-rate certificates (“floaters”), typically purchased by money market funds and (2) certificates that earn all excess cash flow received by the trust after floaters and fees are paid (“residuals”), purchased by the transferor of the municipal bond to the trust as a sponsor. The Group is engaged in two types of TOB trusts: customer TOB trusts and
non-customer
TOB trusts. Customer TOB trusts are those for which the residuals are purchased by customers of the Group, whereas the residuals issued by
non-customer
TOB trusts are purchased by the Group. Both types of TOB trusts are deemed to be VIEs because its equity holder does not have decision making rights. The MHFG Group considers that it is a “significant” variable interest when the Group has the residuals as a sponsor and/or provides liquidity and credit support facilities. For customer TOB trusts, often times, the Group commits to provide liquidity to the trusts and the maximum exposure to loss from these liquidity agreements was ¥
non-customer
TOB trusts, where MHFG Group holds the residuals as a sponsor, the Group has the power to determine which assets will be held by the VIEs or to manage and monitor these assets. In addition, through the variable interests above, the Group has the obligation to absorb losses and the right to receive benefits that could potentially be significant to the VIEs. Therefore, the Group consolidates such VIEs. Customer TOB trusts are not consolidated in the financial statements of the Group, as the residuals are held by customers and the Group does not have power to determine which assets will be held by the VIEs or to manage and monitor these assets.
Investments in securitization products
The MHFG Group invests in, among other things, various types of CDO/CLO, synthetic CDO/CLO and repackaged instruments, CMBS and RMBS arranged by third parties for the purpose of generating current income or capital appreciation, which all utilize entities that are deemed to be VIEs. By design, such investments were investment grade at issuance and held by a diverse group of investors. The potential loss amounts of the securities and the loans are generally limited to the amounts invested because the Group has no contractual involvement in such VIEs beyond its investments. Since the Group is involved in these VIEs only as an investor, the Group does not ordinarily have the power to direct the VIEs’ activities that most significantly impact the
F-
87
MIZUHO FINANCIAL GROUP, INC. AND SUBSIDIARIES
NOTES TO CONSOLIDATED FINANCIAL STATEMENTS—(Continued)
VIEs’ economic performance. Similar to the criteria noted in the asset-backed securitization section, the Group views this investment activity to be “significant” when it has a large investment share and/or provides loans to the VIEs. The Group consolidates VIEs, where the transactions are tailored by the third party arrangers to meet the Group’s needs as a main investor, who is ultimately deemed to have the power to determine which assets are to be held by the VIEs. The Group also invests in certain beneficial interests issued by VIEs which hold real estate that the Group utilizes. In addition to these variable interests, when the Group has the power including the sole unilateral ability to liquidate the VIEs, the Group consolidates such VIEs.
Investment funds
The MHFG Group invests in various investment funds, including securities investment trusts, which collectively invest in equity and debt securities that include listed Japanese securities and investment grade bonds. Investment advisory companies or fund management companies, including the Group’s subsidiaries and affiliates, administer and make investment decisions about such investment funds. The Group considers that it is a “significant” variable interest when the Group’s investment share is greater than threshold. The Group consolidates certain investment funds where it is deemed to be the primary beneficiary.
The Group determines whether it is the primary beneficiary by evaluating whether it has both (1) the power to make investment decisions about the investment funds and (2) the obligation to absorb losses or the right to receive benefits that could potentially be significant to the investment funds. The Group consolidates certain investment funds where it is deemed to be the primary beneficiary.
Trust arrangements
The MHFG Group offers a variety of asset management and administration services under trust arrangements including security investment trusts, pension trusts and trusts used in the securitization of assets originated by and transferred to third parties. The Group receives trust fees for providing services as an agent or fiduciary on behalf of beneficiaries. In these cases, the MHFG Group considers that these variable interests are not significant other than specific involvements such as the following;
With respect to guaranteed principal money trust products, the MHFG Group assumes certain risks by providing guarantees for the repayment of principal as required by the trust agreements or relevant Japanese legislation. The MHFG Group manages entrusted funds primarily through the origination of high quality loans and other credit-related products, investing in investment grade marketable securities such as Japanese government bonds and placing cash with the MHFG Group’s subsidiary trust banks. The Group has the power to determine which assets will be held by the VIEs or to manage these assets. In addition, through the principal guarantee agreements, the Group has the obligation to absorb losses that could potentially be significant to the VIEs. Therefore, the Group consolidates such VIEs. However, the MHFG Group does not consolidate certain guaranteed principal money trusts, which invest all the entrusted funds in the MHFG Group itself, as the Group has determined that it has no variable interests. See Note 23 “Commitments and contingencies” for the balances of guaranteed trust principal that are not consolidated at March 31, 2020 and 2021.
With respect to
non-guaranteed
trust arrangements, the MHFG Group manages and administers assets on behalf of its customers (trust beneficiaries) in the capacity of a trustee and fiduciary. For substantially all
non-guaranteed
trust arrangements, the Group generally does not have the power to direct the activities of the VIEs that most significantly impact the VIEs’ economic performance or has neither the obligation to absorb losses nor the right to receive benefits that could potentially be significant to the VIEs. Therefore, such trust accounts are not included in the consolidated financial statements of the MHFG Group.
F-
88
MIZUHO FINANCIAL GROUP, INC. AND SUBSIDIARIES
NOTES TO CONSOLIDATED FINANCIAL STATEMENTS—(Continued)
The MHFG Group has established a trust in August 2020, which holds the Group’s housing loans and in turn issues beneficiary interests to the Group, as a result from Special Funds-Supplying Operations implemented by the Bank of Japan to facilitate financing in response to
COVID-19.
The Group pledges the beneficiary interests as a collateral for borrowing from the Bank of Japan. In its role as a servicer, the Group has power to direct the entity’s activities that most significantly impact the entity’s economic performance by managing mortgage loans owned by a trust. The Group considers that it is a “significant” variable interest since the Group can determine which assets will be held by the VIE. In addition, through the beneficiary interest, the Group has obligation to absorb losses and the right to receive benefits that could potentially be significant to the VIE. Therefore, the Group consolidates the VIE.
Special purpose entities created for structured finance
The MHFG Group is involved in real estate, commercial aircraft and
o
ther vessel and machinery and equipment financing to VIEs and financing in securitized receivable. As the Group typically only provides senior financing with credit enhanced by subordinated interests and may sometimes act as an interest rate swap counterparty, the Group has determined that it does not have the power to direct the activities of the VIEs that most significantly impact the VIEs’ economic performance, or it does not have “significant” variable interests. Therefore, the Group does not consolidate such VIEs.
Funding Vehicles
The MHFG Group has established several wholly-owned
356
billion and ¥
332
billion at March 31, 2020 and 2021, respectively.
off-shore
vehicles which issue securities, typically preferred stock that is fully guaranteed by the MHFG Group, to investors unrelated to the MHFG Group to fund purchases of debt instruments issued by the MHFG Group. These entities are considered VIEs because they lack sufficient equity to finance their activities; however, the MHFG Group’s investment in the vehicles’ equity is not a variable interest because the investment is not considered to be at risk as the entire amount raised by the vehicles was used to purchase debt instruments issued by the MHFG Group. Because the MHFG Group does not have variable interests in these vehicles, the MHFG Group does not consolidate these entities. Debt instruments issued by the MHFG Group, which are included in Long-term debt, were ¥
Securitization
The MHFG Group engages in securitization activities and securitizes mortgage loans, other loans, government and corporate securities and other types of financial assets in the normal course of business. In these securitization transactions, the Group records the transfer of a financial asset as a sale when all the accounting criteria for a sale under ASC 860 are met. These criteria are (1) the transferred financial assets are legally isolated from the Group’s creditors, (2) the transferee or beneficial interest holder has the right to pledge or exchange the transferred financial assets, and (3) the Group does not maintain effective control over the transferred financial assets. If all the criteria are not met, the transfer is accounted for as a secured borrowing.
For the fiscal years ended March 31, 2019, 2020 and 2021, the MHFG Group neither made significant transfers of financial assets nor recognized significant gains or losses in securitization transactions accounted for as sales. The Group did not retain significant interests in securitization transactions accounted for as sales as of March 31, 2020 and 2021.
There are certain transactions where transfers of financial assets do not qualify for the aforementioned sales criteria and are accounted for as secured borrowings. These transferred assets continue to be carried on the
F-
8
9
MIZUHO FINANCIAL GROUP, INC. AND SUBSIDIARIES
NOTES TO CONSOLIDATED FINANCIAL STATEMENTS—(Continued)
consolidated balance sheets of the MHFG Group. Such assets are associated with securitization transactions and loan participation transactions, which amounted to ¥
176
billion and ¥
153
billion as of March 31, 2020, and ¥
176
billion and ¥
181
billion as of March 31, 2021, respectively. Liabilities associated with securitization and loan participation transactions are presented as Payables under securities lending transactions and Other short-term borrowings or Long-term debt, respectively, on the consolidated balance sheets
.
25. Noninterest income
Details of Noninterest income for the fiscal years ended March 31, 2019, 2020 and 2021 are as follows:
|
2019
|
2020
|
2021
|
||||||||||
|
(in millions of yen)
|
||||||||||||
|
Fee and commission income:
|
||||||||||||
|
Securities-related business
(1)
|
|
|
|
|||||||||
|
Deposits and lending business
(2)
|
|
|
|
|||||||||
|
Remittance business
(1)
|
|
|
|
|||||||||
|
Asset management business
(1)
|
|
|
|
|||||||||
|
Trust-related business
(1)
|
|
|
|
|||||||||
|
Agency business
(1)
|
|
|
|
|||||||||
|
Guarantee-related business
(3)
|
|
|
|
|||||||||
|
Fees for other customer services
(1)
|
|
|
|
|||||||||
|
|
|
|
|
|
|
|||||||
|
Total Fee and commission income
|
|
|
|
|||||||||
|
|
|
|
|
|
|
|||||||
|
Foreign exchange gains (losses)—net
(3)
|
|
|
|
|||||||||
|
Trading account gains (losses)—net
(2)
|
|
|
|
|||||||||
|
Investment gains (losses)—net:
|
||||||||||||
|
Debt securities
(3)
|
(
|
) |
|
(
|
) | |||||||
|
Equity securities
(3)
|
(
|
) |
(
|
) |
|
|||||||
|
Equity in earnings (losses) of equity method investees—net
(3)
|
|
|
|
|||||||||
|
Gains on disposal of premises and equipment
(3)
|
|
|
|
|||||||||
|
Other noninterest income
(2)
(4)
|
|
|
|
|||||||||
|
|
|
|
|
|
|
|||||||
|
Total
|
|
|
|
|||||||||
|
|
|
|
|
|
|
|||||||
Notes:
| (1) |
These amounts are revenues from contracts within the scope of ASC 606, “Revenue from contracts with customers” (“ASC 606”).
|
| (2) |
Part of these amounts are considered to be revenues from contracts that are within the scope of ASC 606.
|
| (3) |
These amounts are revenues from contracts that do not meet the scope of ASC 606.
|
| (4) |
These amounts include the net unrealized gains resulting from changes in fair values of structured notes that contain embedded derivatives. See Note 27 “Fair value” for further details.
|
Certain Fee and commission income, Trading account gains (losses)—net and Other noninterest income outlined in the table above are considered to be revenues from contracts that are within the scope of ASC 606. The MHFG Group disaggregates Fee and commission income, which is the main part of revenues within the scope of ASC 606, by type of business or service in the table above.
Fee and commission income
For the MHFG Group’s accounting policy for the recognition of Fee and commission income, see Note 1 “Basis of presentation and summary of significant accounting policies.”
F-
90
MIZUHO FINANCIAL GROUP, INC. AND SUBSIDIARIES
NOTES TO CONSOLIDATED FINANCIAL STATEMENTS—(Continued)
Deposits and lending business fees consist of deposit-related fees
and lending-related fees. Deposit-related fees, which amounted to ¥
14
billion and ¥
15
billion for the fiscal years ended March 31, 2020 and 2021, respectively, are within the scope of ASC 606. Lending-related fees amounted to ¥
143
billion and ¥
159
billion for the fiscal years ended March 31, 2020 and 2021, respectively. Most of the lending-related fees such as commitment fees and arrangement fees are not within the scope of ASC 606.
Trust-related business fees consist of trust fees earned primarily through fiduciary asset management and administrative service and other trust-related fees, which amounted to ¥
51
billion and ¥
74
billion for the fiscal year ended March 31, 2019, respectively, ¥
54
billion and ¥
75
billion for the fiscal year ended March 31, 2020, respectively, and ¥
51
billion and ¥
71
billion for the fiscal year ended March 31, 2021, respectively.
Trading account gains (losses)—net and Other noninterest income
In addition to Fee and commission income, Trading account gains (losses)—net and Other noninterest income include certain revenues within the scope of ASC 606. Underwriting fees from trading securities, which amounted to ¥
68
billion, ¥
60
billion and ¥
86
billion for the fiscal years ended March 31, 2019, 2020 and 2021, respectively, are within the scope of ASC 606 and accounted for in Trading account gains (losses)—net. Underwriting fees are primarily recognized at the point in time and all considerations of the transaction are fixed on trade date or pricing date . For the fiscal years ended March 31, 2019, 2020 and 2021, approximately ¥
26
billion, ¥
24
billion and ¥
15
billion, respectively, of Other noninterest income were within the scope of ASC 606. Credit card interchange fees are within the scope of ASC 606 and accounted for in Other noninterest income. Credit card interchange fees are earned on credit card transactions conducted through payment networks and recognized upon settlement of the credit card payment transactions.
Contract balances relating to revenues from contracts with customers subject to ASC 606
Contract assets and receivables from contracts with customers subject to ASC 606 are recognized in Accrued income or accounts receivable of Other assets. As of March 31, 2020 and 2021, the balance of contract assets was not material. Contract liabilities are recognized in unearned income of Other liabilities. As of March 31, 2020 and 2021, the balance of contract liabilities was not material.
Remaining performance obligations relating to revenues from contracts with customers subject to ASC 606
Remaining performance obligations are services that the MHFG Group has committed to provide in the future in connection with its contracts with customers. As of March 31, 2020 and 2021, the amount of expected revenues from current obligations to provide services in the future was not material. It excludes revenues from contracts less than one year or contracts that have provisions that allow the Group to recognize revenue at the amount it has the right to invoice.
26. Trading account gains and losses
The MHFG Group performs trading activities through market making, sales, and arbitrage. Accordingly, Trading account gains (losses)—net include gains and losses from transactions undertaken for trading purposes, including both market making for customers and proprietary trading, or transactions through which the Group seeks to capture gains arising from short-term changes in market value. Trading account gains (losses)—net also include gains and losses related to changes in the fair value of derivatives and other financial instruments not eligible for hedge accounting under U.S. GAAP that are utilized to offset mainly interest rate risk related to the Group’s various assets and liabilities, as well as gains and losses related to
F-
91
MIZUHO FINANCIAL GROUP, INC. AND SUBSIDIARIES
NOTES TO CONSOLIDATED FINANCIAL STATEMENTS—(Continued)
changes in the fair value of foreign currency-denominated debt securities reported as Trading securities.
Net trading gains (losses) for the fiscal years ended March 31, 2019, 2020 and 2021 are comprised of the following:
|
2019
|
2020
|
2021
|
||||||||||
|
(in millions of yen)
|
||||||||||||
|
Trading account gains (losses)—net:
|
||||||||||||
|
Trading securities
|
|
|
|
|||||||||
|
Derivative contracts:
|
||||||||||||
|
Interest rate contracts
|
|
|
(
|
) | ||||||||
|
Foreign exchange contracts
(1)
|
|
(
|
) |
|
||||||||
|
Equity-related contracts
(2)
|
|
|
(
|
) | ||||||||
|
Credit-related contracts
(3)
|
|
|
(
|
) | ||||||||
|
Other contracts
|
(
|
) |
(
|
) |
|
|||||||
|
|
|
|
|
|
|
|||||||
|
Total
|
|
|
|
|||||||||
|
Foreign exchange gains (losses)—net
(4)
|
|
|
|
|||||||||
|
|
|
|
|
|
|
|||||||
|
Net trading gains (losses)
|
|
|
|
|||||||||
|
|
|
|
|
|
|
|||||||
Notes:
|
(1)
|
Amounts include gains and losses on currency swaps.
|
|
(2)
|
The net gains (losses) excluded from the assessment of the effectiveness of fair value hedges is included in the above table.
|
|
(3)
|
Amounts do not include the net gains (losses) of ¥(
|
|
(4)
|
Amounts include realized and unrealized gains and losses on both derivative instruments and nonderivative instruments. Amounts on derivative instruments include gains and losses on forward foreign exchange contracts and currency options. Amounts on nonderivative instruments include translation gains and losses related to foreign currency-denominated debt securities reported as Trading securities.
|
27. Fair value
Fair value measurements
ASC 820 defines fair value as the exchange price that would be received for an asset or paid to transfer a liability (an exit price) in the principal or most advantageous market for the asset or liability in an orderly transaction between market participants on the measurement date. ASC 820 also establishes a fair value hierarchy which requires an entity to maximize the use of observable inputs and minimize the use of unobservable inputs when measuring fair value. In addition, ASC 820 precludes (1) the deferral of gains and losses at inception of certain derivative contracts whose fair value was not evidenced by market-observable data, and (2) the use of block discounts when measuring the fair value of instruments traded in an active market, which were previously applied to large holdings of publicly traded financial instruments.
F-
92
MIZUHO FINANCIAL GROUP, INC. AND SUBSIDIARIES
NOTES TO CONSOLIDATED FINANCIAL STATEMENTS—(Continued)
Fair value hierarchy
ASC 820 specifies a hierarchy of valuation techniques based on whether the inputs to those valuation techniques are observable or unobservable. The standard describes three levels of inputs that may be used to measure fair value:
|
Level 1
|
Quoted prices in active markets for identical assets or liabilities. Level 1 assets and liabilities include debt and equity securities and derivative contracts that are traded in an active exchange market. | |
|
Level 2
|
Observable inputs other than Level 1 prices, such as quoted prices for similar assets or liabilities; quoted prices in markets that are not active; or other inputs that are observable or can be corroborated by observable market data for substantially the full term of the assets or liabilities. Level 2 assets and liabilities include debt securities with quoted prices that are traded less frequently than exchange-traded instruments. If no quoted market prices are available, the fair values of debt securities and
over-the-counter
|
|
|
Level 3
|
Unobservable inputs that are supported by little or no market activity and that are significant to the fair value of the assets or liabilities. Level 3 assets and liabilities include financial instruments whose values are determined using pricing models, discounted cash flow methodologies, or similar techniques, as well as instruments for which the determination of fair value requires significant management judgment or estimation. | |
Valuation process
The MHFG Group has established valuation policies which govern the principles of fair value measurements and the authority and duty of each department. The Group has also established procedure manuals which describe valuation techniques and related inputs for determining the fair values of various financial instruments. The policies require that the measurement of fair values be carried out in accordance with the procedures performed by the risk management departments or the back offices which are independent from the front offices. The policies also require the risk management departments to check and verify whether the valuation methodologies defined in the procedure manuals are fair and proper and the internal audit departments to periodically review the compliance with the procedures throughout the Group. Although the valuation methodologies and related inputs are consistently used from period to period, a change in the market environment sometimes leads to a change in the valuation methodologies and the inputs. For instance, a change in market liquidity due to a delisting or a new listing is one of the key drivers of revisions to the valuation methodologies and the inputs. The key drivers also include the availability or the lack of market observable inputs and the development of new valuation methodologies. Price verification performed through the Group’s internal valuation process has an important role in identifying whether the valuation methodologies and the inputs need to be changed. The internal valuation process over the prices broker-dealers provide, primarily for Japanese securitization products, is described in more detail below in
securities.
A change in the valuation methodologies and/or the inputs requires the revision of the valuation policies and procedure manuals, which is required to be approved by the appropriate authority, either the CEO, the head of risk management, and/or the head of accounting, depending on the nature and characteristics of the change.
Available-for-sale
The following is a description of valuation methodologies and inputs used for assets and liabilities measured at fair value on a recurring basis, including the general classification of such instruments pursuant to the fair value hierarchy and the MHFG Group’s valuation techniques used to measure fair values. During the fiscal year ended March 31, 2021, there were no significant changes made to the Group’s valuation techniques and related inputs.
F-
93
MIZUHO FINANCIAL GROUP, INC. AND SUBSIDIARIES
NOTES TO CONSOLIDATED FINANCIAL STATEMENTS—(Continued)
Trading securities and trading securities sold, not yet purchased
When quoted prices for identical securities are available in an active market, the Group uses the quoted prices to measure the fair values of securities and such securities are classified in Level 1 of the fair value hierarchy. Level 1 securities include highly liquid government bonds and equity securities. When quoted prices for identical securities are available, but not actively traded, such securities are classified in Level 2 of the fair value hierarchy. When no quoted market prices are available, the Group estimates fair values by using pricing models with inputs that are observable in the market and such securities are classified in Level 2 of the fair value hierarchy. Level 2 securities include Japanese local government bonds, corporate bonds, and commercial paper. When less liquid market conditions exist for securities, the quoted prices are stale or the prices from independent sources vary significantly, such securities are generally classified in Level 3 of the fair value hierarchy. The fair values of securitization products such as RMBS, CMBS, ABS, and CLO are determined primarily by using a discounted cash flow model. The key inputs used for the model include default rates, recovery rates, prepayment rates, and discount rates. In the event that certain key inputs are unobservable or cannot be corroborated by observable market data, these financial instruments are classified in Level 3.
Hedge funds the Group invests in are primarily multi strategy funds that employ a
fundamental
ten-year
period.
bottom-up
investment approach across various asset classes globally. Hedge funds are measured at the net asset value (“NAV”) per share and the Group has the ability to redeem its investment with the investees at the NAV per share at the measurement date or within the near term. Private equity funds have specific investment objectives in connection with their acquisition of equity interests in new and emerging firms in need of capital. Employing venture capital strategies, they provide financing and other support to
start-up
businesses, medium and small entities in particular geographical areas, and to companies with certain technologies or companies in high-growth industries. Real estate funds invest globally and primarily in real estate companies, debt recapitalizations and direct property. Private equity funds and real estate funds are measured using the NAV per share practical expedient and the Group does not have the ability to redeem its investment in the investees at the NAV per share at the measurement date or within the near term. It is estimated that the underlying assets of the funds would be liquidated within a
Derivative financial instruments
Exchange-traded derivatives are valued using quoted market prices and consequently are classified in Level 1 of the fair value hierarchy. However, the majority of derivatives entered into by the Group are executed
and are valued using internal valuation techniques as no quoted market prices are available for such instruments. The valuation techniques depend on the type of derivatives. The principal techniques used to value these instruments are discounted cash flow models and the Black-Scholes option pricing model, which are widely accepted in the financial services industry. The key inputs vary by the type of derivatives and the nature of the underlying instruments and include interest rate yield curves, foreign exchange rates, the spot price of the underlying, volatility and correlation. Each item is classified in either Level 2 or Level 3 depending on the observability of the significant inputs to the model. Level 2 derivatives include plain vanilla interest rate and currency swaps and option contracts. Derivative contracts valued using significant unobservable correlation or volatility are classified in Level 3 of the fair value hierarchy. In addition, the Group records credit-risk valuation adjustments on
derivatives to reflect the credit quality of its counterparties. The Group calculates these credit-risk valuation adjustments using modeled expected exposure, and default probabilities and severity factors that are developed from market credit spreads and other related market information. Also, the Group records funding valuation adjustments to reflect the impact of funding on uncollateralized
derivatives and derivatives where the Group is not permitted to use the collateral received, and is recognized where there is evidence that a market participant would incorporate the adjustment into the transfer of the instrument. The Group calculates these funding valuation adjustments incorporating the expected future
over-the-counter
over-the-counter
over-the-counter
F-9
4
MIZUHO FINANCIAL GROUP, INC. AND SUBSIDIARIES
NOTES TO CONSOLIDATED FINANCIAL STATEMENTS—(Continued)
funding requirements arising from
the Group’s positions and the estimated market funding cost which considers the Group’s credit risk.
Available-for-sale
The fair values of
securities are determined primarily using the same procedures described under trading securities above. Since private placement bonds have no quoted market prices, the fair values of such bonds are estimated based on a discounted cash flow model using interest rates approximating the current rates for instruments with similar maturities and credit risk. Private placement bonds are classified in either Level 2 or Level 3 depending on the observability of the significant inputs to the model, such as credit risk. The fair values of securitization products such as RMBS, CMBS and ABS are generally based upon single
available-for-sale
non-binding
quoted prices from broker-dealers. Such quotes are validated through the Group’s internal processes and controls. In rare instances where the Group finds the quoted prices to be invalid through its internal valuation process, it adjusts those prices or alternatively estimates their fair values by using a discounted cash flow model to incorporate the Group’s estimates of key inputs such as the most recent value of each underlying asset, cash flows of the underlying assets, and discount margin. The validation of such prices varies depending on the nature and type of the products. For the majority of RMBS and ABS, broker quotes are validated by investigating significant unusual monthly valuation fluctuations and comparing to prices internally computed through discounted cash flow models using assumptions and parameters provided by brokers such as the cash flows of underlying assets, yield curve, prepayment speed and credit spread. For the majority of CMBS, the Group validates broker quotes through a review process that includes the investigation of significant unusual monthly valuation fluctuations and/or a review of underlying assets with significant differences between the valuations of the Group and the broker-dealers being identified. Though most Japanese securitization products are classified in Level 3, certain securitization products such as Japanese RMBS are classified in Level 2, if the quoted prices are verified through either recent market transactions or a pricing model that can be corroborated by observable market data.
Equity securities
Equity securities mainly consist of marketable equity securities. The fair values of the marketable equity securities are based upon quoted market prices for identical equity securities trading as securities in an active market. Equity securities also include investments in certain investment funds measured using the NAV per share practical expedient including private equity funds and real estate funds. These securities are determined primarily using the same procedures described under
above.
Trading securities and trading securities sold, not yet purchased
Other investments
Other investments consist of investments held by consolidated investment companies. These companies typically hold investments in marketable and
non-marketable
equity securities and debt securities. The fair value of the marketable equity securities is based upon quoted market prices. The fair value of the
non-marketable
equity securities is based upon significant management judgment, as very limited quoted prices exist. When evaluating such securities, the Group firstly considers recent market transactions of identical securities, if applicable. Thereafter, the Group uses commonly accepted valuation techniques such as earnings multiples based on comparable public securities.
Non-marketable
equity securities are generally classified in Level 3 of the fair value hierarchy. The fair value of the debt securities is estimated using a discounted cash flow model, since they have no quoted market prices. Those debt securities are classified in Level 3, because the credit risk is unobservable.
F-9
5
MIZUHO FINANCIAL GROUP, INC. AND SUBSIDIARIES
NOTES TO CONSOLIDATED FINANCIAL STATEMENTS—(Continued)
Long-term debt
Fair value accounting is elected for certain long-term debt instruments with embedded derivatives. The fair values are determined using a discounted cash flow model that considers the embedded derivatives and the terms and payment structures of the notes. The fair values of the derivatives embedded in such notes are primarily derived by using the same procedures described in
above. Such notes are classified in Level 2 or Level 3 depending on the observability of the significant inputs into the model used to determine the fair value of the embedded derivatives. The Group also measures certain notes that contain embedded derivatives at fair value under the practicability exception. For these instruments, fair value is based on quoted prices for identical debt traded as a security in inactive markets. These instruments are classified in Level 2 of the fair value hierarchy.
Derivative financial instruments
Items measured at fair value on a recurring basis
Assets and liabilities measured at fair value on a recurring basis at March 31, 2020 and 2021, including those for which the MHFG Group has elected the fair value option, are summarized below:
|
2020
|
Level 1
|
Level 2
|
Level 3
|
Assets/
Liabilities
measured
at fair value
|
||||||||||||
|
(in billions of yen)
|
||||||||||||||||
|
Assets:
|
||||||||||||||||
|
Trading securities
(1)
:
|
||||||||||||||||
|
Japanese government bonds
|
|
|
— |
|
||||||||||||
|
Japanese local government bonds
|
— |
|
— |
|
||||||||||||
|
U.S. Treasury bonds and federal agency securities
|
|
|
— |
|
||||||||||||
|
Other foreign government bonds
|
|
|
— |
|
||||||||||||
|
Agency mortgage-backed securities
|
— |
|
— |
|
||||||||||||
|
Residential mortgage-backed securities
|
— | — |
|
|
||||||||||||
|
Certificates of deposit and commercial paper
|
— |
|
— |
|
||||||||||||
|
Corporate bonds and other
(2)
|
|
|
|
|
||||||||||||
|
Equity securities
|
|
|
|
|
||||||||||||
|
Trading securities measured at net asset value
(3)
|
|
|||||||||||||||
|
Derivative financial instruments:
|
||||||||||||||||
|
Interest rate contracts
|
|
|
|
|
||||||||||||
|
Foreign exchange contracts
|
|
|
|
|
||||||||||||
|
Equity-related contracts
|
|
|
|
|
||||||||||||
|
Credit-related contracts
|
— |
|
|
|
||||||||||||
|
Other contracts
|
|
|
|
|
||||||||||||
|
Available-for-sale
|
||||||||||||||||
|
Japanese government bonds
|
|
|
— |
|
||||||||||||
|
Japanese local government bonds
|
— |
|
— |
|
||||||||||||
|
U.S. Treasury bonds and federal agency securities
|
|
— | — |
|
||||||||||||
|
Other foreign government bonds
|
|
|
— |
|
||||||||||||
|
Agency mortgage-backed securities
|
— |
|
— |
|
||||||||||||
|
Residential mortgage-backed securities
|
— |
|
|
|
||||||||||||
|
Commercial mortgage-backed securities
|
— | — |
|
|
||||||||||||
|
Japanese corporate bonds and other debt securities
|
— |
|
|
|
||||||||||||
|
Foreign corporate bonds and other debt securities
|
— |
|
|
|
||||||||||||
|
Equity securities:
|
|
|
|
|
|
|
|
|
|
|
|
|
|
|
|
|
|
Equity securities with readily determinable fair values
|
|
|
|
|
|
|
|
|
|
|
—
|
|
|
|
|
|
F-9
6
MIZUHO FINANCIAL GROUP, INC. AND SUBSIDIARIES
NOTES TO CONSOLIDATED FINANCIAL STATEMENTS—(Continued)
|
2020
|
Level 1
|
Level 2
|
Level 3
|
Assets/
Liabilities
measured
at fair value
|
||||||||||||
|
(in billions of yen)
|
||||||||||||||||
|
Equity securities measured at net asset value
(3)
|
|
|||||||||||||||
|
Other investments
|
— | — |
|
|
||||||||||||
|
|
|
|
|
|
|
|
|
|||||||||
|
Total assets measured at fair value on a recurring basis
|
|
|
|
|
||||||||||||
|
|
|
|
|
|
|
|
|
|||||||||
|
Liabilities:
|
||||||||||||||||
|
Trading securities sold, not yet purchased
|
|
|
— |
|
||||||||||||
|
Derivative financial instruments:
|
||||||||||||||||
|
Interest rate contracts
|
|
|
|
|
||||||||||||
|
Foreign exchange contracts
|
|
|
|
|
||||||||||||
|
Equity-related contracts
|
|
|
|
|
||||||||||||
|
Credit-related contracts
|
— |
|
|
|
||||||||||||
|
Other contracts
|
|
|
|
|
||||||||||||
|
Long-term debt
(4)
|
— |
|
|
|
||||||||||||
|
|
|
|
|
|
|
|
|
|||||||||
|
Total liabilities measured at fair value on a recurring basis
|
|
|
|
|
||||||||||||
|
|
|
|
|
|
|
|
|
|||||||||
F-9
7
MIZUHO FINANCIAL GROUP, INC. AND SUBSIDIARIES
NOTES TO CONSOLIDATED FINANCIAL STATEMENTS—(Continued)
|
2021
|
Level 1
|
Level 2
|
Level 3
|
Assets/
Liabilities
measured
at fair value
|
||||||||||||
|
(in billions of yen)
|
||||||||||||||||
|
Assets:
|
||||||||||||||||
|
Trading securities
(1)
:
|
||||||||||||||||
|
Japanese government bonds
|
|
|
—
|
|
||||||||||||
|
Japanese local government bonds
|
— |
|
— |
|
||||||||||||
|
U.S. Treasury bonds and federal agency securities
|
|
|
— |
|
||||||||||||
|
Other foreign government bonds
|
|
|
— |
|
||||||||||||
|
Agency mortgage-backed securities
|
— |
|
— |
|
||||||||||||
|
Residential mortgage-backed securities
|
— | — |
|
|
||||||||||||
|
Certificates of deposit and commercial paper
|
— |
|
— |
|
||||||||||||
|
Corporate bonds and other
(2)
|
|
|
|
|
||||||||||||
|
Equity securities
|
|
|
|
|
||||||||||||
|
Trading securities measured at net asset value
(3)
|
|
|||||||||||||||
|
Derivative financial instruments:
|
||||||||||||||||
|
Interest rate contracts
|
|
|
|
|
||||||||||||
|
Foreign exchange contracts
|
— |
|
|
|
||||||||||||
|
Equity-related contracts
|
|
|
|
|
||||||||||||
|
Credit-related contracts
|
— |
|
|
|
||||||||||||
|
Other contracts
|
|
|
|
|
||||||||||||
|
Available-for-sale
|
||||||||||||||||
|
Japanese government bonds
|
|
|
— |
|
||||||||||||
|
Japanese local government bonds
|
— |
|
— |
|
||||||||||||
|
U.S. Treasury bonds and federal agency securities
|
|
— | — |
|
||||||||||||
|
Other foreign government bonds
|
|
|
— |
|
||||||||||||
|
Agency mortgage-backed securities
|
— |
|
— |
|
||||||||||||
|
Residential mortgage-backed securities
|
— |
|
|
|
||||||||||||
|
Commercial mortgage-backed securities
|
— | — |
|
|
||||||||||||
|
Japanese corporate bonds and other debt securities
|
— |
|
|
|
||||||||||||
|
Foreign corporate bonds and other debt securities
|
— |
|
|
|
||||||||||||
|
Equity securities:
|
||||||||||||||||
|
Equity securities with readily determinable fair values
|
|
|
— |
|
||||||||||||
|
Equity securities measured at net asset value
(3)
|
|
|||||||||||||||
|
Other investments
|
|
— |
|
|
||||||||||||
|
|
|
|
|
|
|
|
|
|||||||||
|
Total assets measured at fair value on a recurring basis
|
|
|
|
|
||||||||||||
|
|
|
|
|
|
|
|
|
|||||||||
|
Liabilities:
|
||||||||||||||||
|
Trading securities sold, not yet purchased
|
|
|
— |
|
||||||||||||
|
Derivative financial instruments:
|
||||||||||||||||
|
Interest rate contracts
|
|
|
|
|
||||||||||||
|
Foreign exchange contracts
|
— |
|
|
|
||||||||||||
|
Equity-related contracts
|
|
|
|
|
||||||||||||
|
Credit-related contracts
|
— |
|
|
|
||||||||||||
|
Other contracts
|
|
|
|
|
||||||||||||
|
Long-term debt
(4)
|
— |
|
|
|
||||||||||||
|
|
|
|
|
|
|
|
|
|||||||||
|
Total liabilities measured at fair value on a recurring basis
|
|
|
|
|
||||||||||||
|
|
|
|
|
|
|
|
|
|||||||||
F-9
8
MIZUHO FINANCIAL GROUP, INC. AND SUBSIDIARIES
NOTES TO CONSOLIDATED FINANCIAL STATEMENTS—(Continued)
Notes:
| (1) |
Trading securities include foreign currency denominated securities for which the MHFG Group elected the fair value option.
|
| (2) |
The amount includes CLO and convertible bonds, which are classified in Level 3.
|
| (3) |
In accordance with ASC 820, certain investments that are measured at fair value using the net asset value per share (or its equivalent) practical expedient have not been classified in the fair value hierarchy. The fair value amounts presented for these classes of assets are intended to permit the reconciliation of the fair value hierarchy to the amounts presented in the statements of financial position. The amounts of unfunded commitments related to these investments at March 31, 2020 and 2021 were ¥
|
| (4) |
Amounts represent items for which the Group elected the fair value option or for which it applied the practicability exception.
|
Items measured at fair value on a recurring basis using significant unobservable inputs (Level 3)
The following table presents a reconciliation for all assets and liabilities measured at fair value on a recurring basis using significant unobservable inputs (Level 3) for the fiscal years ended March 31, 2020 and 2021:
|
2020
|
|
April 1,
2019
|
|
Gains
(losses) in
Earnings
|
|
Gains
(losses)
in OCI
|
|
Transfers
into
Level 3
|
|
Transfers
out of
Level 3
|
|
Purchases
|
|
Sales
|
|
Issuances
|
|
Settle-
ments
|
|
March 31,
2020
|
|
Change in
unrealized
gains
(losses)
still held
(6)
|
|||||||||||||||||||||||||||||||||
|
|
|
(in billions of yen)
|
|||||||||||||||||||||||||||||||||||||||||||||||||||||
|
Assets:
|
|
|
|
|
|
|
|
|
|
|
|
|
|
|
|
|
|
|
|
|
|
|
|||||||||||||||||||||||||||||||||
|
Trading securities:
|
|
|
|
|
|
|
|
|
|
|
|
|
|
|
|
|
|
|
|
|
|
|
|||||||||||||||||||||||||||||||||
|
Residential mortgage- backed securities
|
|
|
|
|
|
|
|
—
|
(2)
|
|
|
|
—
|
|
|
|
—
|
|
|
|
—
|
|
|
|
—
|
|
|
|
—
|
|
|
|
—
|
|
|
|
(
|
)
|
|
|
|
|
|
|
|
—
|
|||||||||
|
Corporate bonds and other
|
|
|
|
|
|
|
|
(
|
)
(2)
|
|
|
|
—
|
|
|
|
—
|
|
|
|
—
|
|
|
|
|
|
|
|
(
|
)
|
|
|
|
—
|
|
|
|
(
|
)
|
|
|
|
|
|
|
|
(
|
)
|
|||||||
|
Equity securities
|
|
|
|
|
|
|
|
(
|
)
(2)
|
|
|
|
—
|
|
|
|
—
|
|
|
|
—
|
|
|
|
|
|
|
|
(
|
)
|
|
|
|
—
|
|
|
|
(
|
)
|
|
|
|
|
|
|
|
(
|
)
|
|||||||
|
Derivative financial instruments, net
(1)
:
|
|
|
|
|
|
|
|
|
|
|
|
|
|
|
|
|
|
|
|
|
|
|
|||||||||||||||||||||||||||||||||
|
Interest rate contracts
|
|
|
|
|
|
|
|
(
|
)
(2)
|
|
|
|
—
|
|
|
|
|
|
|
|
—
|
|
|
|
—
|
|
|
|
—
|
|
|
|
—
|
|
|
|
(
|
)
|
|
|
|
(
|
)
|
|
|
|
(
|
)
|
|||||||
|
Foreign exchange contracts
|
|
|
|
|
|
|
|
(
|
)
(2)
|
|
|
|
—
|
|
|
|
—
|
|
|
|
—
|
|
|
|
—
|
|
|
|
—
|
|
|
|
—
|
|
|
|
(
|
)
|
|
|
|
|
|
|
|
(
|
)
|
||||||||
|
Equity-related contracts
|
|
|
|
(
|
)
|
|
|
|
(
|
)
(2)
|
|
|
|
—
|
|
|
|
—
|
|
|
|
—
|
|
|
|
—
|
|
|
|
—
|
|
|
|
—
|
|
|
|
(
|
)
|
|
|
|
(
|
)
|
|
|
|
(
|
)
|
||||||
|
Credit-related contracts
|
|
|
|
|
|
|
|
(
|
)
(2)
|
|
|
|
—
|
|
|
|
(
|
)
|
|
|
|
(
|
)
|
|
|
|
—
|
|
|
|
—
|
|
|
|
—
|
|
|
|
|
|
|
|
(
|
)
|
|
|
|
(
|
)
|
||||||
|
Other contracts
|
|
|
|
|
|
|
|
|
(2)
|
|
|
|
—
|
|
|
|
—
|
|
|
|
—
|
|
|
|
—
|
|
|
|
—
|
|
|
|
—
|
|
|
|
(
|
)
|
|
|
|
|
|
|
|
|
|||||||||
|
Available-for-sale
|
|
|
|
|
|
|
|
|
|
|
|
|
|
|
|
|
|
|
|
|
|
|
|||||||||||||||||||||||||||||||||
|
Residential mortgage- backed securities
|
|
|
|
|
|
|
|
—
|
(3)
|
|
|
|
—
|
(4)
|
|
|
|
—
|
|
|
|
—
|
|
|
|
|
|
|
|
—
|
|
|
|
—
|
|
|
|
(
|
)
|
|
|
|
|
|
|
|
—
|
||||||||
|
Commercial mortgage- backed securities
|
|
|
|
|
|
|
|
—
|
(3)
|
|
|
|
|
(4)
|
|
|
|
—
|
|
|
|
—
|
|
|
|
|
|
|
|
(
|
)
|
|
|
|
—
|
|
|
|
(
|
)
|
|
|
|
|
|
|
|
—
|
|||||||
|
Japanese corporate bonds and other debt securities
|
|
|
|
|
|
|
|
|
(3)
|
|
|
|
—
|
(4)
|
|
|
|
—
|
|
|
|
—
|
|
|
|
|
|
|
|
—
|
|
|
|
—
|
|
|
|
(
|
)
|
|
|
|
|
|
|
|
—
|
||||||||
|
Foreign corporate bonds and other debt securities
|
|
|
|
|
|
|
|
—
|
(3)
|
|
|
|
(
|
)
(4)
|
|
|
|
—
|
|
|
|
—
|
|
|
|
|
|
|
|
—
|
|
|
|
—
|
|
|
|
(
|
)
|
|
|
|
|
|
|
|
—
|
||||||||
|
Other investments
|
|
|
|
|
|
|
|
|
(3)
|
|
|
|
—
|
|
|
|
—
|
|
|
|
—
|
|
|
|
|
|
|
|
—
|
|
|
|
—
|
|
|
|
(
|
)
|
|
|
|
|
|
|
|
|
|||||||||
|
Liabilities:
|
|
|
|
|
|
|
|
|
|
|
|
|
|
|
|
|
|
|
|
|
|
|
|||||||||||||||||||||||||||||||||
|
Trading securities sold, not yet purchased
|
|
|
|
|
|
|
|
—
|
(2)
|
|
|
|
—
|
|
|
|
—
|
|
|
|
—
|
|
|
|
(
|
)
|
|
|
|
|
|
|
|
—
|
|
|
|
—
|
|
|
|
—
|
|
|
|
—
|
|||||||||
|
Long-term debt
|
|
|
|
|
|
|
|
|
(5)
|
|
|
|
|
(4)
|
|
|
|
|
|
|
|
(
|
)
|
|
|
|
—
|
|
|
|
—
|
|
|
|
|
|
|
|
(
|
)
|
|
|
|
|
|
|
|
|
|||||||
F-9
9
MIZUHO FINANCIAL GROUP, INC. AND SUBSIDIARIES
NOTES TO CONSOLIDATED FINANCIAL STATEMENTS—(Continued)
|
2021
|
|
April 1,
2020
|
|
Gains
(losses) in
Earnings
|
|
Gains
(losses)
in OCI
|
|
Transfers
into
Level 3
|
|
Transfers
out of
Level 3
|
|
Purchases
|
|
Sales
|
|
Issuances
|
|
Settle-
ments
|
|
March 31,
2021
|
|
Change in
unrealized
gains
(losses)
still held
(6)
|
|||||||||||||||||||||||||||||||||
|
|
|
(in billions of yen)
|
|||||||||||||||||||||||||||||||||||||||||||||||||||||
|
Assets:
|
|
|
|
|
|
|
|
|
|
|
|
|
|
|
|
|
|
|
|
|
|
|
|||||||||||||||||||||||||||||||||
|
Trading securities:
|
|
|
|
|
|
|
|
|
|
|
|
|
|
|
|
|
|
|
|
|
|
|
|||||||||||||||||||||||||||||||||
|
Residential mortgage- backed securities
|
|
|
|
|
|
|
|
—
|
(2)
|
|
|
|
—
|
|
|
|
—
|
|
|
|
—
|
|
|
|
—
|
|
|
|
—
|
|
|
|
—
|
|
|
|
(
|
)
|
|
|
|
|
|
|
|
—
|
|||||||||
|
Corporate bonds and other
|
|
|
|
|
|
|
|
|
(2)
|
|
|
|
—
|
|
|
|
—
|
|
|
|
(
|
)
|
|
|
|
|
|
|
|
(
|
)
|
|
|
|
—
|
|
|
|
(
|
)
|
|
|
|
|
|
|
|
|
|||||||
|
Equity securities
|
|
|
|
|
|
|
|
|
(2)
|
|
|
|
—
|
|
|
|
—
|
|
|
|
—
|
|
|
|
|
|
|
|
(
|
)
|
|
|
|
—
|
|
|
|
(
|
)
|
|
|
|
|
|
|
|
—
|
||||||||
|
Derivative financial instruments, net
(1)
:
|
|
|
|
|
|
|
|
|
|
|
|
|
|
|
|
|
|
|
|
|
|
|
|||||||||||||||||||||||||||||||||
|
Interest rate contracts
|
|
|
|
(
|
)
|
|
|
|
|
(2)
|
|
|
|
—
|
|
|
|
—
|
|
|
|
—
|
|
|
|
—
|
|
|
|
—
|
|
|
|
—
|
|
|
|
|
|
|
|
|
|
|
|
|
|||||||||
|
Foreign exchange contracts
|
|
|
|
|
|
|
|
|
(2)
|
|
|
|
—
|
|
|
|
—
|
|
|
|
—
|
|
|
|
—
|
|
|
|
—
|
|
|
|
—
|
|
|
|
(
|
)
|
|
|
|
|
|
|
|
|
|||||||||
|
Equity-related contracts
|
|
|
|
(
|
)
|
|
|
|
|
(2)
|
|
|
|
—
|
|
|
|
—
|
|
|
|
—
|
|
|
|
—
|
|
|
|
—
|
|
|
|
—
|
|
|
|
(
|
)
|
|
|
|
(
|
)
|
|
|
|
(
|
)
|
||||||
|
Credit-related contracts
|
|
|
|
(
|
)
|
|
|
|
|
(2)
|
|
|
|
—
|
|
|
|
|
|
|
|
|
|
|
|
—
|
|
|
|
—
|
|
|
|
—
|
|
|
|
(
|
)
|
|
|
|
|
|
|
|
|
||||||||
|
Other contracts
|
|
|
|
|
|
|
|
—
|
(2)
|
|
|
|
—
|
|
|
|
—
|
|
|
|
—
|
|
|
|
—
|
|
|
|
—
|
|
|
|
—
|
|
|
|
(
|
)
|
|
|
|
—
|
|
|
|
—
|
|||||||||
|
Available-for-sale
|
|
|
|
|
|
|
|
|
|
|
|
|
|
|
|
|
|
|
|
|
|
|
|||||||||||||||||||||||||||||||||
|
Residential mortgage- backed securities
|
|
|
|
|
|
|
|
—
|
(3)
|
|
|
|
—
|
(4)
|
|
|
|
—
|
|
|
|
—
|
|
|
|
—
|
|
|
|
—
|
|
|
|
—
|
|
|
|
(
|
)
|
|
|
|
|
|
|
|
—
|
||||||||
|
Commercial mortgage- backed securities
|
|
|
|
|
|
|
|
—
|
(3)
|
|
|
|
|
(4)
|
|
|
|
—
|
|
|
|
—
|
|
|
|
|
|
|
|
(
|
)
|
|
|
|
—
|
|
|
|
(
|
)
|
|
|
|
|
|
|
|
—
|
|||||||
|
Japanese corporate bonds and other debt securities
|
|
|
|
|
|
|
|
(
|
)
(3)
|
|
|
|
|
(4)
|
|
|
|
—
|
|
|
|
(
|
)
|
|
|
|
|
|
|
|
(
|
)
|
|
|
|
—
|
|
|
|
(
|
)
|
|
|
|
|
|
|
|
(
|
)
|
|||||
|
Foreign corporate bonds and other debt securities
|
|
|
|
|
|
|
|
|
(3)
|
|
|
|
|
(4)
|
|
|
|
|
|
|
|
—
|
|
|
|
|
|
|
|
—
|
|
|
|
—
|
|
|
|
(
|
)
|
|
|
|
|
|
|
|
—
|
||||||||
|
Other investments
|
|
|
|
|
|
|
|
|
(3)
|
|
|
|
—
|
|
|
|
—
|
|
|
|
—
|
|
|
|
|
|
|
|
(
|
)
|
|
|
|
—
|
|
|
|
(
|
)
|
|
|
|
|
|
|
|
|
||||||||
|
Liabilities:
|
|
|
|
|
|
|
|
|
|
|
|
|
|
|
|
|
|
|
|
|
|
|
|||||||||||||||||||||||||||||||||
|
Trading securities sold, not yet purchased
|
|
|
|
—
|
|
|
|
—
|
(2)
|
|
|
|
—
|
|
|
|
—
|
|
|
|
—
|
|
|
|
(
|
)
|
|
|
|
|
|
|
|
—
|
|
|
|
—
|
|
|
|
—
|
|
|
|
—
|
|||||||||
|
Long-term debt
|
|
|
|
|
|
|
|
(
|
)
(5)
|
|
|
|
(
|
)
(4)
|
|
|
|
|
|
|
|
(
|
)
|
|
|
|
—
|
|
|
|
—
|
|
|
|
|
|
|
|
(
|
)
|
|
|
|
|
|
|
|
(
|
)
|
||||||
Notes:
| (1) |
Total Level 3 derivative exposures have been netted on the table for presentation purposes only.
|
| (2) |
Gains (losses) in Earnings are reported in Trading account gains (losses)—net, Foreign exchange gains (losses)—net or Other noninterest income (expenses).
|
| (3) |
Gains (losses) in Earnings are reported in Investment gains (losses)—net.
|
| (4) |
Gains (losses) in OCI are reported in Other comprehensive income (loss).
|
| (5) |
Gains (losses) in Earnings are reported in Other noninterest income (expenses).
|
| (6) |
Amounts represent total gains or losses recognized in earnings and OCI during the period. These gains or losses were attributable to the change in fair value relating to assets and liabilities classified as Level 3 that were still held at March 31, 2020 and 2021. The amounts of unrealized gains (losses) in OCI related to
Available-for-sale
|
Transfers between levels
During the fiscal year ended March 31, 2020, the transfers into Level 3 included ¥
billion of net Derivative assets, ¥
billion of net Derivative liabilities and ¥
billion of Long-term debt. Transfers into Level 3 for net Derivative assets and liabilities were primarily due to changes in the observability of the inputs used to measure fair value of certain interest rate derivatives and credit-related derivatives. Transfers into Level 3 for Long-term debt were primarily due to changes in the observability of the default rate when valuing certain structured notes. During the fiscal year ended March 31, 2020, the transfers out of Level 3 included ¥
1
billion of net Derivative assets and ¥
8
billion of Long-term debt. Transfers out of Level 3 for net Derivative assets were primarily due to
F-
100
MIZUHO FINANCIAL GROUP, INC. AND SUBSIDIARIES
NOTES TO CONSOLIDATED FINANCIAL STATEMENTS—(Continued)
changes in the observability of the inputs used
to measure fair value of certain credit-related derivatives. Transfers out of Level 3 for Long-term debt were primarily due to changes in the observability of the default rate when valuing certain structured notes.
During the fiscal year ended March 31, 2021, the transfers into Level 3 included ¥
1
billion of net Derivative assets, ¥
12
billion of Available-for-sale securities and ¥
billion of Long-term debt. Transfers into Level 3 for net Derivative assets were primarily due to changes in the observability of the inputs used to measure fair value of certain credit-related derivatives. Transfers into Level 3 for Available-for-sale securities were primarily due to decreased liquidity for certain Foreign corporate bonds and other debt securities. Transfers into Level 3 for
Long-term
debt were primarily due to changes in the observability of the default rate when valuing certain structured notes. During the fiscal year ended March 31, 2021, the transfers out of Level 3
included ¥
billion of Trading securities, ¥
billion of net Derivative liabilities, ¥
22
billion of Available-for-sale securities and ¥
42
billion of Long-term debt. Transfers out of Level 3 for Trading securities were primarily due to increased price transparency for certain Japanese corporate bonds. Transfers out of Level 3 for net Derivative liabilities were primarily due to changes in the observability of the inputs used to measure fair value of certain
credit-related
derivatives. Transfers out of Level 3 for Available-for-sale securities were primarily due to increased liquidity for certain Japanese corporate bonds and other debt securities. Transfers out of Level 3 for Long-term debt were primarily due to changes in the observability of the default rate when valuing certain structured notes.
F-
101
MIZUHO FINANCIAL GROUP, INC. AND SUBSIDIARIES
NOTES TO CONSOLIDATED FINANCIAL STATEMENTS—(Continued)
Quantitative information about Level 3 fair value measurements
The following table presents information about significant unobservable inputs related to the MHFG Group’s material classes of Level 3 assets and liabilities at March 31, 2020 and 2021:
|
2020
|
|
|||||||||||||
|
Products/Instruments
|
|
Fair value
|
|
|
Principal valuation technique
|
|
Unobservable inputs
|
|
Range of input values
|
|
Weighted average
(5)
|
|
||
|
(in billions of yen, except for percentages and basis points)
|
|
|||||||||||||
|
Trading securities and
Available-for-sale
|
|
|
|
|
|
|||||||||
|
Residential mortgage-backed
securities
|
|
Discounted cash flow
Price-based
|
Prepayment rate
Default rate
Recovery rate
Discount margin
|
|
|
|
|
|||||||
|
|
|
|
|
|
|
|
|
|||||||
|
Commercial
mortgage-backed
securities
|
|
Discounted cash flow
Price-based
|
Discount margin |
|
|
|||||||||
|
|
|
|
|
|
|
|
|
|||||||
|
Corporate bonds and other
debt securities
|
|
Discounted cash flow
Price-based
|
Prepayment rate
(1)
Default rate
(1)
Recovery rate
(1)
Discount margin
(1)
Discount margin
(2)
|
|
|
|
|
|||||||
|
|
|
|
|
|
|
|
|
|||||||
|
Derivative financial instruments, net:
|
||||||||||||||
|
Interest rate contracts
|
(
|
) |
Internal valuation model
(3)
|
IR – IR correlation
Default rate
(4)
|
|
|||||||||
|
|
|
|
|
|
|
|||||||||
|
Foreign exchange contracts
|
|
Internal valuation model
(3)
|
FX – IR correlation
FX – FX correlation
Default rate
(4)
|
-
|
||||||||||
|
|
|
|
|
|
|
|||||||||
|
Equity-related contracts
|
(
|
) |
Internal valuation model
(3)
|
Equity – IR correlation
Equity correlation
Equity volatility
|
|
|||||||||
|
|
|
|
|
|
|
|||||||||
|
Credit-related contracts
|
(
|
) |
Internal valuation model
(3)
|
Default rate
Credit correlation
|
|
|||||||||
|
|
|
|
|
|
|
|||||||||
|
Long-term debt
|
|
Internal valuation model
(3)
|
IR – IR correlation |
|
||||||||||
| FX – IR correlation |
-
|
|||||||||||||
| FX – FX correlation |
|
|||||||||||||
| Equity – IR correlation |
|
|||||||||||||
| Equity – FX correlation |
-
|
|||||||||||||
| Equity correlation |
|
|||||||||||||
| Equity volatility |
|
|||||||||||||
| Default rate |
|
|||||||||||||
| Credit correlation |
|
|||||||||||||
F-
102
MIZUHO FINANCIAL GROUP, INC. AND SUBSIDIARIES
NOTES TO CONSOLIDATED FINANCIAL STATEMENTS—(Continued)
|
2021
|
|
|||||||||||||
|
Products/Instruments
|
|
Fair value
|
|
|
Principal valuation technique
|
|
Unobservable inputs
|
|
Range of input values
|
|
A
verage
(5)
|
|
||
|
(in billions of yen, except for percentages and basis points)
|
|
|||||||||||||
|
Trading securities and
Available-for-sale
|
|
|
|
|
|
|||||||||
|
Residential mortgage-backed securities
|
|
|
|
|
|
Discounted cash flow
|
|
Prepayment rate
|
|
|
|
|
|
|
|
|
|
Price-based
|
|
Default rate
|
|
|
|
|
|
|
||||
|
|
|
|
Recovery rate
|
|
|
|
|
|
|
|||||
|
|
|
|
Discount margin
|
|
|
|
|
|
|
|||||
|
|
|
|
|
|
|
|
|
|
|
|
|
|
|
|
|
Commercial
mortgage-backed
securities
|
|
|
|
|
|
Discounted cash flow
Price-based
|
|
Discount margin
|
|
|
|
|
|
|
|
|
|
|
|
|
|
|
|
|
|
|
|
|
|
|
|
Corporate bonds and other debt securities
|
|
|
|
|
|
Discounted cash flow
|
|
Prepayment rate
(1)
|
|
|
|
|
|
|
|
|
|
Price-based
|
|
Default rate
(1)
|
|
|
|
|
|
|
||||
|
|
|
|
Recovery rate
(1)
|
|
|
|
|
|
|
|||||
|
|
|
|
Discount margin
(1)
|
|
|
|
|
|
|
|||||
|
|
|
|
Discount margin
(2)
|
|
|
|
|
|
|
|||||
|
|
|
|
|
|
|
|
|
|
|
|
|
|
|
|
|
Derivative financial instruments, net:
|
|
|
|
|
|
|||||||||
|
Interest rate contracts
|
|
|
|
|
|
Internal valuation model
(3)
|
|
IR – IR correlation
|
|
|
|
|
|
|
|
|
|
|
|
|
|
|
|
|
|
|
|
|
|
|
|
Foreign exchange contracts
|
|
|
|
|
|
Internal valuation model
(3)
|
|
FX – IR correlation
|
|
|
|
|
|
|
|
|
|
|
FX – FX correlation
|
|
|
|
|
|
|
|||||
|
|
|
|
|
|
|
|
|
|
|
|
|
|
|
|
|
Equity-related contracts
|
|
|
(
|
)
|
|
Internal valuation model
(3)
|
|
Equity – IR correlation
|
|
|
|
|
|
|
|
|
|
Equity correlation
|
|
|
|
|
|
|
||||||
|
|
|
|
Equity volatility
|
|
|
|
|
|
|
|||||
|
|
|
|
|
|
|
|
|
|
|
|
|
|
|
|
|
Credit-related contracts
|
|
|
|
|
|
Internal valuation model
(3)
|
|
Default rate
|
|
|
|
|
|
|
|
|
|
Credit correlation
|
|
|
|
|
|
|
||||||
|
|
|
|
|
|
|
|
|
|
|
|
|
|
|
|
|
Other contracts
|
|
|
|
|
|
Internal valuation model
(3)
|
|
Commodity volatility
|
|
|
|
|
|
|
|
|
|
|
|
|
|
|
|
|
|
|
|
|
|
|
|
Long-term debt
|
|
|
|
|
|
Internal valuation model
(3)
|
|
IR – IR correlation
|
|
|
|
|
|
|
|
|
|
|
FX – IR correlation
|
|
|
|
|
|
|
|||||
|
|
|
|
FX – FX correlation
|
|
|
|
|
|
|
|||||
|
|
|
|
Equity – IR correlation
|
|
|
|
|
|
|
|||||
|
|
|
|
Equity – FX correlation
|
|
-
|
|
|
|
|
|||||
|
|
|
|
Equity correlation
|
|
|
|
|
|
|
|||||
|
|
|
|
Equity volatility
|
|
|
|
|
|
|
|||||
|
|
|
|
Default rate
|
|
|
|
|
|
|
|||||
|
|
|
|
Credit correlation
|
|
|
|
|
|
|
|||||
Notes:
|
(1)
|
These inputs are mainly used for determining the fair values of securitization products such as CDO, CLO and ABS, other than RMBS and CMBS.
|
|
(2)
|
This input is mainly used for determining the fair values of Japanese corporate bonds and foreign corporate bonds.
|
|
(3)
|
Internal valuation model includes discounted cash flow models and the Black-Scholes option pricing model.
|
|
(4)
|
This input represents the counterparty default rate derived from the MHFG Group’s own internal credit analyses.
|
|
(5)
|
Averages are calculated by weighting each input by the relative fair value of the respective financial instruments except for derivative related inputs where medians are used.
|
IR = Interest rate
FX = Foreign exchange
Uncertainty of fair
value measurements relating to unobservable inputs and interrelationships among unobservable inputs
The following is a description of the uncertainty of the fair value measurements from the use of significant unobservable inputs and a description of interrelationships of the significant unobservable inputs used to measure the fair values of Level 3 assets and liabilities.
F-
10
3
MIZUHO FINANCIAL GROUP, INC. AND SUBSIDIARIES
NOTES TO CONSOLIDATED FINANCIAL STATEMENTS—(Continued)
(1) Prepayment rate
The prepayment rate is the estimated rate at which voluntary unscheduled repayments of the principal of the underlying assets are expected to occur. The movement of the prepayment rate is generally negatively correlated with borrower delinquency. A change in prepayment rate would impact the valuation of the fair values of financial instruments either positively or negatively, depending on the structure of financial instruments.
(2) Default rate
The default rate is an estimate of the likelihood of not collecting contractual payments. An increase in the default rate would generally be accompanied by a decrease in the recovery rate and an increase in the discount margin. It would also generally impact the valuation of the fair values of financial instruments negatively.
(3) Recovery rate
The recovery rate is an estimate of the percentage of contractual payments that would be collected in the event of a default. An increase in recovery rate would generally be accompanied by a decrease in the default rate. It would also generally impact the valuation of the fair values of financial instruments positively.
(4) Discount margin
The discount margin is the portion of the interest rate over a benchmark market interest rate such as LIBOR or swap rates. It primarily consists of a risk premium component which is the amount of compensation that market participants require due to the uncertainty inherent in the financial instruments’ cash flows resulting from credit risk. An increase in discount margin would generally impact the valuation of the fair values of financial instruments negatively.
(5) Correlation
Correlation is the likelihood of the movement of one input relative to another based on an established relationship. The change in correlation would impact the valuation of derivatives either positively or negatively, depending on the nature of the underlying assets.
(6) Volatility
Volatility is a measure of the expected change in variables over a fixed period of time. Some financial instruments benefit from an increase in volatility and others benefit from a decrease in volatility. Generally, for a long position in an option, an increase in volatility would result in an increase in the fair values of financial instruments.
F-10
4
MIZUHO FINANCIAL GROUP, INC. AND SUBSIDIARIES
NOTES TO CONSOLIDATED FINANCIAL STATEMENTS—(Continued)
Items measured at fair value on a nonrecurring basis
Certain assets and liabilities are measured at fair value on a nonrecurring basis. These assets and liabilities primarily include items that are measured at the lower of cost or fair value, and items that were initially measured at cost and have been written down to fair value as a result of impairment.
The following table shows the fair value hierarchy for these items as of March 31, 2020 and 2021:
|
2020
|
Total
|
Level 1
|
Level 2
|
Level 3
|
Aggregate cost
|
|||||||||||||||
|
(in billions of yen)
|
||||||||||||||||||||
|
Assets:
|
||||||||||||||||||||
|
Loans
|
|
— | — |
|
|
|||||||||||||||
|
Loans
held-for-sale
|
|
— |
|
|
|
|||||||||||||||
|
Equity securities (without readily determinable fair values)
|
|
— | — |
|
|
|||||||||||||||
|
Premises and equipment—net
|
|
— |
|
— |
|
|||||||||||||||
|
Other assets
|
— | — | — | — |
|
|||||||||||||||
|
Goodwill
|
— | — | — | — |
|
|||||||||||||||
|
|
|
|
|
|
|
|
|
|
|
|||||||||||
|
Total assets measured at fair value on a nonrecurring basis
|
|
— |
|
|
|
|||||||||||||||
|
|
|
|
|
|
|
|
|
|
|
|||||||||||
|
2021
|
Total
|
Level 1
|
Level 2
|
Level 3
|
Aggregate cost
|
|||||||||||||||
|
(in billions of yen)
|
||||||||||||||||||||
|
Assets:
|
||||||||||||||||||||
|
Loans
|
|
— |
|
|
|
|||||||||||||||
|
Loans
held-for-sale
|
|
— |
|
|
|
|||||||||||||||
|
Equity securities (without readily determinable fair values)
|
|
— | — |
|
|
|||||||||||||||
|
Premises and equipment—net
|
— | — | — | — |
|
|||||||||||||||
|
Other assets
|
|
— | — |
|
|
|||||||||||||||
|
|
|
|
|
|
|
|
|
|
|
|||||||||||
|
Total assets measured at fair value on a nonrecurring basis
|
|
— |
|
|
|
|||||||||||||||
|
|
|
|
|
|
|
|
|
|
|
|||||||||||
| Note: |
The fair values may not be current as of the dates indicated, but rather as of the date the fair value change occurred. Accordingly, the carrying values may not equal current fair value.
|
Loans in the table above became nonaccrual and are measured based upon the observable market price of the loan, which is classified as Level 2, or the fair value of the underlying collateral, which is classified as Level 3.
Loans
in the table above are accounted for at the lower of cost or fair value at the end of the period. The items for which fair values are determined by using actual or contractually determined selling price data are classified as Level 2. Due to the lack of current observable market information, the determination of the fair values for items other than the aforementioned requires significant adjustment based upon management judgment and estimation, which results in such items being classified in Level 3 of the hierarchy.
held-for-sale
Equity securities (without readily determinable fair values) in the table above consist of
non-marketable
equity securities which are measured at fair value on a nonrecurring basis, using the measurement alternative for
non-marketable
equity securities. These equity securities are on a nonrecurring basis either (1) written down to fair value as a result of impairment or (2) adjusted upward or downward to fair value as a result of transactions observed for the identical or similar securities of the same issuer. The fair values of the impaired
non-marketable
equity securities are determined primarily by using a liquidation value technique. As significant management judgment or estimation is required in the determination of the fair values of
non-marketable
equity securities, they are classified as Level 3.
F-10
5
MIZUHO FINANCIAL GROUP, INC. AND SUBSIDIARIES
NOTES TO CONSOLIDATED FINANCIAL STATEMENTS—(Continued)
Premises and equipment—net and Other assets in the table above have been impaired and written down to fair value.
Goodwill in the table above is due to the decline in the fair value of the reporting unit, the carrying amount of the goodwill was reduced to its fair value. There was no goodwill measured at fair value on a nonrecurring basis as of March 31, 2021.
Fair value option
The MHFG Group elected the fair value option for certain eligible financial instruments described below.
Foreign currency denominated debt securities
The MHFG Group elected the fair value option for foreign currency denominated debt securities to mitigate the volatility in earnings due to the difference in the recognition of foreign exchange risk between foreign currency denominated debt securities and financial liabilities. Following the election of the fair value option, these debt securities are reported as trading securities in Trading account assets.
Certain hybrid financial instruments
The MHFG Group issues structured notes as part of its client-driven activities. Structured notes are debt instruments that contain embedded derivatives. The Group elected the fair value option for certain structured notes to mitigate accounting mismatches and to achieve operational simplifications. Fair value option has only been elected for part of the portfolio as the Group would not achieve operational simplifications. In addition, the Group measures certain notes that contain embedded derivatives at fair value under the practicability exception. These notes continue to be reported in Long-term debt and interest on these notes continues to be reported in Interest expense on long-term debt based on the contractual rates. Only an immaterial amount included in Long-term debt in the statement of financial position is not eligible for fair value option. The differences between the aggregate fair value of these notes and the aggregate unpaid principal balance of such instruments were ¥
112
billion and ¥
14
billion at March 31, 2020 and 2021, respectively. The net unrealized gains (losses) resulting from changes in fair values of these notes recorded in Other noninterest income (expenses) were of ¥
56
billion and ¥(
10
) billion for the fiscal years ended March 31, 2020 and 2021, respectively. Changes in fair value resulting from changes in instrument-specific credit risk were estimated by incorporating the Company’s current credit spreads observable in the bond market.
Fair value of financial instruments
ASC 825, “Financial Instruments” (“ASC 825”), requires the disclosure of the estimated fair value of financial instruments. The fair value of financial instruments is the amount that would be exchanged between willing parties, other than in a forced sale or liquidation. Quoted market prices, if available, are best utilized as estimates of the fair values of financial instruments. However, since no quoted market prices are available for certain financial instruments, fair values for such financial instruments have been estimated based on management’s assumptions, discounted cash flow models or other valuation techniques. Such estimation methods are described in more detail below. These estimates could be significantly affected by different sets of assumptions. There are certain limitations to management’s best judgment in estimating fair values of financial instruments and inherent subjectivity involved in estimation methodologies and assumptions used to estimate fair value. Accordingly, the net realizable or liquidation values could be materially different from the estimates presented below.
F-10
6
MIZUHO FINANCIAL GROUP, INC. AND SUBSIDIARIES
NOTES TO CONSOLIDATED FINANCIAL STATEMENTS—(Continued)
The following is a description of the valuation methodologies used for estimating the fair value of financial assets and liabilities not carried at fair value on the MHFG Group’s consolidated balance sheets.
Cash and due from banks, interest-bearing deposits in other banks, call loans and funds sold, and receivables under resale agreements and securities borrowing transactions
The carrying value of short-term financial assets, such as cash and due from banks, interest-bearing deposits in other banks, call loans and funds sold, and receivables under resale agreements and securities borrowing transactions approximates the fair value of these assets since they generally involve limited losses from credit risk or have short-term maturities with interest rates that approximate market rates.
Investments
The fair value of
securities is determined primarily by using the same procedures and techniques described for trading securities and
securities aforementioned in this Note. The fair value of
420
billion and ¥
186
billion at March 31, 2020 and 2021, respectively, were not included in the disclosure.
held-to-maturity
available-for-sale
non-marketable
equity securities is not readily determinable, nor practicable to estimate, due to the lack of available information. Their carrying amounts of ¥
Loans
Loans have been fair valued based on the type of loan, credit quality, prepayment assumptions and remaining maturity. The fair value of loans is determined based on discounted cash flows using interest rates approximating the MHFG Group’s current rates for similar loans. The fair value of collateral dependent nonaccrual loans is determined based on the fair value of the underlying collateral.
Other financial assets
The carrying value of other financial assets, which primarily consist of accounts receivable from brokers, dealers, and customers for securities transactions, accrued income and collateral provided for derivative transactions, approximates the fair value of these assets since they generally involve limited losses from credit risk or have short-term maturities with interest rates that approximate market rates. The majority of other financial assets is classified as Level 2, and included in the table in Note 12 “Other assets and liabilities.”
Noninterest-bearing deposits, call money and funds purchased, and payables under repurchase agreements and securities lending transactions
The carrying value of short-term financial liabilities, such as noninterest-bearing deposits, call money and funds purchased, and payables under repurchase agreements and securities lending transactions approximates the fair value of these liabilities since they generally have short-term maturities with interest rates that approximate market rates.
Interest-bearing deposits
The carrying value of demand deposits approximates the fair value since it
represents the amount payable on demand at the balance sheet date. The fair value of time deposits and certificates of deposit is primarily estimated
based on discounted cash flow analysis using current interest rates for instruments with similar maturities. The carrying value of short-term certificates of deposit approximates the fair value.
F-10
7
MIZUHO FINANCIAL GROUP, INC. AND SUBSIDIARIES
NOTES TO CONSOLIDATED FINANCIAL STATEMENTS—(Continued)
Due to trust accounts
The carrying value of due to trust accounts approximates the fair value since they generally have short-term maturities with interest rates that approximate market rates.
Other short-term borrowings
The carrying value of the majority of other short-term borrowings approximates the fair value since they generally have short-term maturities with interest rates that approximate market rates. The fair value of certain borrowings is estimated based on discounted cash flow analysis using interest rates approximating the MHFG Group’s incremental borrowing rates for instruments with similar maturities.
Long-term debt
Long-term debt is fair valued using quoted market prices, if available. Otherwise, the fair value of long-term debt is estimated based on discounted cash flow analysis using interest rates approximating the MHFG Group’s incremental borrowing rates for instruments with similar maturities.
Other financial liabilities
The carrying value of other financial liabilities, which primarily consist of accounts payable to brokers, dealers, and customers for securities transactions, accrued expenses and collateral accepted for derivative transactions, approximates the fair value since they generally have short-term maturities with interest rates that approximate market rates. The majority of other financial liabilities is classified as Level 2, and included in the table in Note 12 “Other assets and liabilities.”
The fair value of certain
off-balance-sheet
financial instruments, such as commitments to extend credit and commercial letters of credit, was not considered material to the consolidated balance sheets at March 31, 2020 and 2021.
F-10
8
MIZUHO FINANCIAL GROUP, INC. AND SUBSIDIARIES
NOTES TO CONSOLIDATED FINANCIAL STATEMENTS—(Continued)
The following table shows the carrying amounts and fair values at March 31, 2020 and 2021, of certain financial instruments, excluding financial instruments which are carried at fair value on a recurring basis and those outside the scope of ASC 825 such as equity method investments as defined in ASC 323, “Investments-Equity Method and Joint Ventures” (“ASC 323”) and lease contracts as defined in ASC 842, “Leases” (“ASC 842”):
|
2020
|
||||||||||||||||||||
|
Carrying
amount
|
Estimated fair value
|
|||||||||||||||||||
|
Total
|
Level 1
|
Level 2
|
Level 3
|
|||||||||||||||||
|
(in billions of yen)
|
||||||||||||||||||||
|
Financial assets:
|
||||||||||||||||||||
|
Cash and due from banks, interest-bearing deposits in other banks, call loans and funds sold, and receivables under resale agreements and securities borrowing transactions
|
|
|
|
|
— | |||||||||||||||
|
Investments
|
|
|
|
|
— | |||||||||||||||
|
Loans, net of allowance for loan losses
(Note)
|
|
|
— | — |
|
|||||||||||||||
|
Financial liabilities:
|
||||||||||||||||||||
|
Noninterest-bearing deposits, call money and funds purchased, and payables under repurchase agreements and securities lending transactions
|
|
|
|
|
— | |||||||||||||||
|
Interest-bearing deposits
|
|
|
|
|
— | |||||||||||||||
|
Due to trust accounts
|
|
|
— |
|
— | |||||||||||||||
|
Other short-term borrowings
|
|
|
— |
|
— | |||||||||||||||
|
Long-term debt
|
|
|
— |
|
|
|||||||||||||||
|
2021
|
||||||||||||||||||||
|
Carrying
amount
|
Estimated fair value
|
|||||||||||||||||||
|
Total
|
Level 1
|
Level 2
|
Level 3
|
|||||||||||||||||
|
(in billions of yen)
|
||||||||||||||||||||
|
Financial assets:
|
||||||||||||||||||||
|
Cash and due from banks, interest-bearing deposits in other banks, call loans and funds sold, and receivables under resale agreements and securities borrowing transactions
|
|
|
|
|
— | |||||||||||||||
|
Investments
|
|
|
|
|
— | |||||||||||||||
|
Loans, net of allowance for loan losses
(Note)
|
|
|
— | — |
|
|||||||||||||||
|
Financial liabilities:
|
||||||||||||||||||||
|
Noninterest-bearing deposits, call money and funds purchased, and payables under repurchase agreements and securities lending transactions
|
|
|
— |
|
— | |||||||||||||||
|
Interest-bearing deposits
|
|
|
— |
|
— | |||||||||||||||
|
Due to trust accounts
|
|
|
— |
|
— | |||||||||||||||
|
Other short-term borrowings
|
|
|
— |
|
— | |||||||||||||||
|
Long-term debt
|
|
|
— |
|
|
|||||||||||||||
| Note: |
Loans, net of allowance include items measured at fair value on a nonrecurring basis.
|
F-
109
MIZUHO FINANCIAL GROUP, INC. AND SUBSIDIARIES
NOTES TO CONSOLIDATED FINANCIAL STATEMENTS—(Continued)
28. Offsetting of financial assets and financial liabilities
Derivatives
The MHFG Group enters into master netting arrangements such as International Swaps and Derivatives Association, Inc. (“ISDA”) or similar agreements with counterparties to manage mainly credit risks associated with counterparty default. If the predetermined events including counterparty default occur, these enforceable master netting arrangements or similar agreements give the Group the right to offset derivative receivables and derivative payables and related financial collateral such as cash and securities with the same counterparty.
Repurchase and resale agreements and securities lending and borrowing transactions
Repurchase and resale agreements and securities lending and borrowing transactions are generally covered by industry standard master repurchase agreements and industry standard master securities lending agreements with netting terms to manage mainly credit risks associated with counterparty default. In the event of default by the counterparty, these agreements with netting terms provide the Group with the right to offset receivables and payables related to such transactions with the same counterparty, and to liquidate the collateral held.
F-1
1
0
MIZUHO FINANCIAL GROUP, INC. AND SUBSIDIARIES
NOTES TO CONSOLIDATED FINANCIAL STATEMENTS—(Continued)
The following table provides information about the offsetting of financial assets and financial liabilities at March 31, 2020 and 2021. The table includes derivatives, repurchase and resale agreements, and securities lending and borrowing transactions that are subject to enforceable master netting arrangements or similar agreements irrespective of whether or not they are offset on the Group’s consolidated balance sheets.
|
Amounts not offset on
the balance sheet
(3)
|
||||||||||||||||||||||||
|
Gross amounts
recognized
|
Gross amounts
offset on the
balance sheet
|
Net amounts
presented on the
balance sheet
(2)
|
Financial
instruments
(4)
|
Cash
collateral
|
Net
amounts
|
|||||||||||||||||||
|
(in billions of yen)
|
||||||||||||||||||||||||
|
2020
|
||||||||||||||||||||||||
|
Assets
(1)
:
|
||||||||||||||||||||||||
|
Derivatives
|
|
|
|
(
|
) |
(
|
) |
|
||||||||||||||||
|
Receivables under resale agreements
|
|
|
|
(
|
) |
|
|
|||||||||||||||||
|
Receivables under securities borrowing transactions
|
|
|
|
(
|
) |
|
|
|||||||||||||||||
|
|
|
|
|
|
|
|
|
|
|
|
|
|||||||||||||
|
Total
|
|
|
|
(
|
) |
(
|
) |
|
||||||||||||||||
|
|
|
|
|
|
|
|
|
|
|
|
|
|||||||||||||
|
Liabilities
(1)
:
|
||||||||||||||||||||||||
|
Derivatives
|
|
|
|
(
|
) |
(
|
) |
|
||||||||||||||||
|
Payables under repurchase agreements
|
|
|
|
(
|
) |
|
|
|||||||||||||||||
|
Payables under securities lending transactions
|
|
|
|
(
|
) |
|
|
|||||||||||||||||
|
|
|
|
|
|
|
|
|
|
|
|
|
|||||||||||||
|
Total
|
|
|
|
(
|
) |
(
|
) |
|
||||||||||||||||
|
|
|
|
|
|
|
|
|
|
|
|
|
|||||||||||||
|
2021
|
||||||||||||||||||||||||
|
Assets
(1)
:
|
||||||||||||||||||||||||
|
Derivatives
|
|
|
|
(5)
|
(
|
) |
(
|
) |
|
|||||||||||||||
|
Receivables under resale agreements
|
|
|
|
(6)
|
(
|
) |
|
|
||||||||||||||||
|
Receivables under securities borrowing transactions
|
|
|
|
(7)
|
(
|
) |
|
|
||||||||||||||||
|
|
|
|
|
|
|
|
|
|
|
|
|
|||||||||||||
|
Total
|
|
|
|
(
|
) |
(
|
) |
|
||||||||||||||||
|
|
|
|
|
|
|
|
|
|
|
|
|
|||||||||||||
|
Liabilities
(1)
:
|
||||||||||||||||||||||||
|
Derivatives
|
|
|
|
(5)
|
(
|
) |
(
|
) |
|
|||||||||||||||
|
Payables under repurchase agreements
|
|
|
|
(6)
|
(
|
) |
|
|
||||||||||||||||
|
Payables under securities lending transactions
|
|
|
|
(7)
|
(
|
) |
|
|
||||||||||||||||
|
|
|
|
|
|
|
|
|
|
|
|
|
|||||||||||||
|
Total
|
|
|
|
(
|
) |
(
|
) |
|
||||||||||||||||
|
|
|
|
|
|
|
|
|
|
|
|
|
|||||||||||||
Notes:
| (1) |
Amounts relating to master netting arrangements or similar agreements where the MHFG Group does not have the legal right of
set-off
or where uncertainty exists as to the enforceability of these agreements are excluded. For derivatives, the table includes amounts relating to
over-the-counter
OTC-cleared
derivatives that are subject to enforceable master netting arrangements or similar agreements.
|
| (2) |
Derivative assets and liabilities are recorded in Trading account assets and Trading account liabilities, respectively.
|
| (3) |
Amounts do not exceed the net amounts presented on the balance sheet and do not include the effect of overcollateralization, where it exists.
|
| (4) |
For derivatives, amounts include derivative assets or liabilities and securities collateral that are eligible for offsetting under enforceable master netting arrangements or similar agreements.
|
F-
111
MIZUHO FINANCIAL GROUP, INC. AND SUBSIDIARIES
NOTES TO CONSOLIDATED FINANCIAL STATEMENTS—(Continued)
| (5) |
The amounts of derivative assets and liabilities subject to enforceable master netting arrangements or similar agreements at March 31, 2021 were ¥
|
| (6) |
The amounts of Receivables under resale agreements and Payables under repurchase agreements subject to enforceable industry standard master repurchase agreements with netting terms at March 31, 2021 were ¥
|
| (7) |
The amounts of Receivables under securities borrowing transactions and Payables under securities lending transactions subject to enforceable industry standard master lending agreements with netting terms at March 31, 2021 were ¥
|
29. Repurchase agreements and securities lending transactions accounted for as secured borrowings
The following table shows the gross amounts of liabilities associated with repurchase agreements and securities lending transactions, by remaining contractual maturity at March 31, 2020 and 2021:
|
Overnight and
continuous
|
Up to 30 days
|
31-90 days
|
Greater than
90 days
|
Total
|
||||||||||||||||
|
(in billions of yen)
|
||||||||||||||||||||
|
2020
|
||||||||||||||||||||
|
Repurchase agreements
|
|
|
|
|
|
|||||||||||||||
|
Securities lending transactions
|
|
|
— |
|
|
|||||||||||||||
|
|
|
|
|
|
|
|
|
|
|
|||||||||||
|
Total
|
|
|
|
|
|
|||||||||||||||
|
|
|
|
|
|
|
|
|
|
|
|||||||||||
|
2021
|
||||||||||||||||||||
|
Repurchase agreements
|
|
|
|
|
|
|||||||||||||||
|
Securities lending transactions
|
|
|
— |
|
|
|||||||||||||||
|
|
|
|
|
|
|
|
|
|
|
|||||||||||
|
Total
|
|
|
|
|
|
|||||||||||||||
|
|
|
|
|
|
|
|
|
|
|
|||||||||||
The following table shows the gross amounts of liabilities associated with repurchase agreements and securities lending transactions, by class of underlying collateral at March 31, 2020 and 2021:
|
Repurchase
agreements
|
Securities lending
transactions
|
|||||||
|
(in billions of yen)
|
||||||||
|
2020
|
||||||||
|
Japanese government bonds and Japanese local government bonds
|
|
|
||||||
|
Foreign government bonds and foreign agency mortgage-backed securities
|
|
|
||||||
|
Commercial paper and corporate bonds
|
|
|
||||||
|
Equity securities
|
|
|
||||||
|
Other
|
|
|
||||||
|
|
|
|
|
|||||
|
Total
(Note)
|
|
|
||||||
|
|
|
|
|
|||||
|
2021
|
||||||||
|
Japanese government bonds and Japanese local government bonds
|
|
|
||||||
|
Foreign government bonds and foreign agency mortgage-backed securities
|
|
|
||||||
|
Commercial paper and corporate bonds
|
|
|
||||||
|
Equity securities
|
|
|
||||||
|
Other
|
|
|
||||||
|
|
|
|
|
|||||
|
Total
|
|
|
||||||
|
|
|
|
|
|||||
F-1
12
MIZUHO FINANCIAL GROUP, INC. AND SUBSIDIARIES
NOTES TO CONSOLIDATED FINANCIAL STATEMENTS—(Continued)
| Note: |
Amounts exceeded the gross amounts recognized in Note 28 “Offsetting of financial assets and financial liabilities” by ¥
set-off
or where uncertainty exists as to the enforceability.
|
The MHFG Group is required to post securities as collateral with a fair value equal to or in excess of the principal amount of the cash borrowed under repurchase agreements. For securities lending transactions, the Group receives collateral in the form of cash. These contracts involve risks, including (1) the counterparty may fail to return the securities at maturity and (2) the fair value of the securities posted may decline below the amount of the Group’s obligation and therefore the counterparty may require additional amounts. The Group attempts to mitigate these risks by entering into transactions mainly with central counterparty clearing houses which revalue assets and perform margin maintenance activities on a regular basis, diversifying the maturities and counterparties, and using mainly highly liquid securities.
30. Related party transactions
The banking subsidiaries of MHFG make loans to the MHFG Group’s directors, executive officers, and other related parties. At March 31, 2020 and 2021, the aggregate loans to the Group’s equity method investees amounted to ¥
497
billion and ¥
550
billion
, respectively, and outstanding loans to MHFG Group’s directors, executive officers, and other related parties were not considered significant. There were
no
loans to related parties that were
considered nonaccrual. During the fiscal year ended March 31, 2021, certain subsidiaries of MHFG partially withdrew assets from employee retirement benefit trusts, which were established for the payment of employees’ severance pay and retirement pensions. See Note 20 “Pension and other employee benefit plans” for further details. In addition, the other transactions with the related parties excluding loan transactions and partial withdrawal of assets from employee retirement benefit trusts, are considered immaterial.
Summarized Financial Information of the MHFG Group’s Equity Method Investees
Summarized financial information of the MHFG Group’s equity method investees as of March 31, 2020 and 2021, and for each of the three years ended March 31, 2021, is as follows:
|
2020
|
2021
|
|||||||
|
(in billions of yen)
|
||||||||
|
Loans
|
|
|
||||||
|
Total assets
|
|
|
||||||
|
Deposits
|
|
|
||||||
|
Total liabilities
|
|
|
||||||
|
Total equity
|
|
|
||||||
|
Noncontrolling interests
|
|
|
||||||
|
2019
|
2020
|
2021
|
||||||||||
|
(in billions of yen)
|
||||||||||||
|
Total interest and dividend income
|
|
|
|
|||||||||
|
Total interest expense
|
|
|
|
|||||||||
|
Provision (credit) for credit losses
|
|
|
|
|||||||||
|
Net interest income after provision (credit) for credit losses
|
|
|
|
|||||||||
|
Income before income tax expense
|
|
|
|
|||||||||
|
Net income
|
|
|
|
|||||||||
F-1
13
MIZUHO FINANCIAL GROUP, INC. AND SUBSIDIARIES
NOTES TO CONSOLIDATED FINANCIAL STATEMENTS—(Continued)
31. Business segment information
The MHFG Group consists of the following
five
in-house
companies which are categorized based on a customer segment: the Retail & Business Banking Company, the Corporate & Institutional Company, the Global Corporate Company, the Global Markets Company, and the Asset Management Company. These customer segments are regarded as operating segments and constitute reportable segments.
The services that each
in-house
company is in charge of are as follows.
Retail & Business Banking Company
This company provides financial services for individual customers, small and
medium-sized
enterprises and middle market firms in Japan.
Corporate & Institutional Company
This company provides financial services for large corporations, financial institutions and public corporations in Japan.
Global Corporate Company
This company provides financial services for Japanese overseas affiliated corporate customers and
non-Japanese
corporate customers.
Global Markets Company
This company invests in financial products with market risk, such as interest rate risk, equity risk, and credit risk.
Asset Management Company
This company develops financial products and provides financial services that match the asset management needs of its wide range of customers from individuals to institutional investors.
F-11
4
MIZUHO FINANCIAL GROUP, INC. AND SUBSIDIARIES
NOTES TO
CONSOLIDATED FINANCIAL STATEMENTS—(Continued)
Therefore,
they are not consistent with the consolidated financial statements prepared in accordance with U.S. GAAP. A reconciliation is provided for the total amount of all business segments’ “Net business profits (losses) + Net gains (losses) related to ETFs and others” with income before income tax expense under U.S. GAAP, and the total amount of all business segments’ “Fixed assets” with the total amount of Premises and
assets related to operating leases included in Other assets reported under U.S. GAAP. “Fixed assets” pertaining to MHBK, MHTB, and MHSC have been allocated to each
segment.
equipment-net,
Goodwill, Intangible assets, and
right-of-use
|
MHFG (Consolidated)
|
||||||||||||||||||||||||||||
|
2019
(1)
|
Retail &
Business
Banking
Company
|
Corporate &
Institutional
Company
|
Global
Corporate
Company
|
Global
Markets
Company
|
Asset
Management
Company
|
Others
(6)
|
Total
|
|||||||||||||||||||||
|
(in billions of yen)
|
||||||||||||||||||||||||||||
|
Gross profits + Net gains (losses) related to ETFs and others
(2)
|
|
|
|
|
|
|
|
|||||||||||||||||||||
|
General and administrative expenses
(3)
|
|
|
|
|
|
|
|
|||||||||||||||||||||
|
Equity in earnings (losses) of equity method investees—net
|
|
|
|
— |
|
|
|
|||||||||||||||||||||
|
Amortization of goodwill and others
|
|
|
|
|
|
|
|
|||||||||||||||||||||
|
Others
|
— | — | — | — | — |
(
|
) |
(
|
) | |||||||||||||||||||
|
|
|
|
|
|
|
|
|
|
|
|
|
|
|
|||||||||||||||
|
Net business profits (losses)
(4)
+ Net gains (losses) related to ETFs and others
|
|
|
|
(
|
) |
|
(
|
) |
|
|||||||||||||||||||
|
|
|
|
|
|
|
|
|
|
|
|
|
|
|
|||||||||||||||
|
Fixed assets
(5)
|
|
|
|
|
|
|
|
|||||||||||||||||||||
|
|
|
|
|
|
|
|
|
|
|
|
|
|
|
|||||||||||||||
|
MHFG (Consolidated)
|
||||||||||||||||||||||||||||
|
2020
(1)
|
Retail &
Business
Banking
Company
|
Corporate &
Institutional
Company
|
Global
Corporate
Company
|
Global
Markets
Company
|
Asset
Management
Company
|
Others
(6)
|
Total
|
|||||||||||||||||||||
|
(in billions of yen)
|
||||||||||||||||||||||||||||
|
Gross profits + Net gains (losses) related to ETFs and others
(2)
|
|
|
|
|
|
|
|
|||||||||||||||||||||
|
General and administrative expenses
(3)
|
|
|
|
|
|
|
|
|||||||||||||||||||||
|
Equity in earnings (losses) of equity method investees—net
|
|
|
|
— |
|
|
|
|||||||||||||||||||||
|
Amortization of goodwill and others
|
|
|
|
|
|
|
|
|||||||||||||||||||||
|
Others
|
— | — | — | — | — |
(
|
) |
(
|
) | |||||||||||||||||||
|
|
|
|
|
|
|
|
|
|
|
|
|
|
|
|||||||||||||||
|
Net business profits (losses)
(4)
+ Net gains (losses) related to ETFs and others
|
|
|
|
|
|
|
|
|||||||||||||||||||||
|
|
|
|
|
|
|
|
|
|
|
|
|
|
|
|||||||||||||||
|
Fixed assets
(5)
|
|
|
|
|
|
|
|
|||||||||||||||||||||
|
|
|
|
|
|
|
|
|
|
|
|
|
|
|
|||||||||||||||
F-11
5
MIZUHO FINANCIAL GROUP, INC. AND SUBSIDIARIES
NOTES TO CONSOLIDATED FINANCIAL STATEMENTS—(Continued)
|
MHFG (Consolidated)
|
||||||||||||||||||||||||||||
|
2021
(1)
|
Retail &
Business
Banking
Company
|
Corporate &
Institutional
Company
|
Global
Corporate
Company
|
Global
Markets
Company
|
Asset
Management
Company
|
Others
(6)
|
Total
|
|||||||||||||||||||||
|
(in billions of yen)
|
||||||||||||||||||||||||||||
|
Gross profits + Net gains (losses) related to ETFs and others
(2)
|
|
|
|
|
|
|
|
|||||||||||||||||||||
|
General and administrative expenses
(3)
|
|
|
|
|
|
|
|
|||||||||||||||||||||
|
Equity in earnings (losses) of equity method investees—net
|
|
|
|
— |
|
(
|
) |
|
||||||||||||||||||||
|
Amortization of goodwill and others
|
|
|
|
|
|
|
|
|||||||||||||||||||||
|
Others
|
— | — | — | — | — | — | — | |||||||||||||||||||||
|
|
|
|
|
|
|
|
|
|
|
|
|
|
|
|||||||||||||||
|
Net business profits (losses)
(4)
+ Net gains (losses) related to ETFs and others
|
|
|
|
|
|
(
|
) |
|
||||||||||||||||||||
|
|
|
|
|
|
|
|
|
|
|
|
|
|
|
|||||||||||||||
|
Fixed assets
(5)
|
|
|
|
|
|
|
|
|||||||||||||||||||||
|
|
|
|
|
|
|
|
|
|
|
|
|
|
|
|||||||||||||||
Notes:
| (1) |
Income and expenses of foreign branches of MHBK and foreign subsidiaries with functional currencies other than Japanese Yen have been translated for purposes of segment reporting using the budgeted foreign currency rates. Prior period comparative amounts for such foreign currency income and expenses have been translated using current period budgeted foreign currency rates.
|
| (2) |
“Gross profits + Net gains (losses) related to ETFs and others” is reported instead of sales reported by general corporations. Gross profits is defined as the sum of net interest income, fiduciary income, net fee and commission income, net trading income and net other operating income. Net gains (losses) related to ETFs and others consist of net gains (losses) on ETFs held by MHBK and MHTB on their
non-consolidated
basis and net gains (losses) on operating investment securities of MHSC on its consolidated basis. For the fiscal years ended March 31, 2019, 2020 and 2021, net gains (losses) related to ETFs and others amounted to ¥
|
| (3) |
“General and administrative expenses” excludes
non-allocated
gains (losses), net.
|
| (4) |
Net business profits (losses) is used in Japan as a measure of the profitability of core banking operations, and is defined as gross profits (as defined above) less general and administrative expenses (excluding
non-allocated
gains (losses), net) plus equity in earnings (losses) of equity method investees—net and others. Measurement of net business profits (losses) is required for regulatory reporting to the Financial Services Agency of Japan.
|
| (5) |
“Fixed assets” is presented based on Japanese GAAP and corresponds to the total amount of the following U.S. GAAP accounts: Premises and
equipment-net;
Goodwill; Intangible assets; and
right-of-use
|
|
(6)
|
“Others” includes the following items:
|
|
|
•
|
|
profits and expenses pertaining to consolidated subsidiaries that are not subject to allocation;
|
|
|
•
|
|
consolidating adjustments, including elimination of internal transaction between each segment;
|
F-11
6
MIZUHO FINANCIAL GROUP, INC. AND SUBSIDIARIES
NOTES TO CONSOLIDATED FINANCIAL STATEMENTS—(Continued)
|
|
•
|
|
equity in earnings (losses) of equity method
investees-net
that are not subject to allocation; and
|
|
|
•
|
|
profits and losses pertaining to derivative transactions that reflect the counterparty risk of the individual parties and other factors in determining fair market value.
|
Reconciliation
As explained above, the measurement bases of the
internal management
reporting systems and the income
and expenses items included are different from the accompanying consolidated statements of income. Therefore, it is impracticable to present reconciliations of all the business segment’s information, other than net business profits (losses), to the corresponding items in the accompanying consolidated statements of income.
A reconciliation of “Net business profits (losses) + Net gains (losses) related to ETFs and others” for the fiscal years ended March 31, 2019, 2020 and 2021 presented above to income before income tax expense shown on the consolidated statements of income and a reconciliation of “Fixed assets” at March 31, 2020 and 2021 to the total amount of Premises and
assets related to operating leases included in Other assets are as follows:
equipment-net,
Goodwill, Intangible assets, and
right-of-use
|
2019
|
2020
|
2021
|
||||||||||
|
(in billions of yen)
|
||||||||||||
|
Net business profits (losses) + Net gains (losses) related to ETFs and others
|
|
|
|
|||||||||
|
|
|
|
|
|
|
|||||||
|
Adjustment to reconcile management reporting to Japanese GAAP:
|
||||||||||||
|
General and administrative expenses:
non-allocated
gains (losses), net
|
|
|
|
|||||||||
|
Expenses related to portfolio problems (including reversal of (provision for) general reserve for losses on loans)
|
(
|
) |
(
|
) |
(
|
) | ||||||
|
Gains on reversal of reserves for possible losses on loans, and others
|
|
|
|
|||||||||
|
Net gains (losses) related to stocks—Net gains (losses) related to ETFs and others
|
|
|
|
|||||||||
|
Net extraordinary gains (losses)
|
(
|
) |
(
|
) |
|
|||||||
|
Others
|
(
|
) |
(
|
) |
(
|
) | ||||||
|
|
|
|
|
|
|
|||||||
|
Income before income tax expense under Japanese GAAP
|
|
|
|
|||||||||
|
Adjustment to reconcile Japanese GAAP to U.S. GAAP:
|
||||||||||||
|
Derivative financial instruments and hedging activities
|
|
|
(
|
) | ||||||||
|
Investments
|
(
|
) |
(
|
) |
|
|||||||
|
Loans
|
(
|
) |
(
|
) |
(
|
) | ||||||
|
Allowances for credit losses
(1)
|
(
|
) |
|
|
||||||||
|
Premises and equipment
|
|
(
|
) |
(
|
) | |||||||
|
Land revaluation
|
|
|
|
|||||||||
|
Business combinations
|
(
|
) |
|
(
|
) | |||||||
|
Pension liabilities
|
(
|
) |
(
|
) |
(
|
) | ||||||
|
Consolidation of variable interest entities
|
(
|
) |
|
|
||||||||
|
Foreign currency translation
|
|
|
(
|
) | ||||||||
|
Others
|
(
|
) |
(
|
) |
|
|||||||
|
|
|
|
|
|
|
|||||||
|
Income before income tax expense under U.S. GAAP
|
|
|
|
|||||||||
|
|
|
|
|
|
|
|||||||
|
2019
|
2020
|
2021
|
||||||||||
|
(in billions of yen)
|
||||||||||||
|
Fixed assets
|
|
|
|
|||||||||
|
|
|
|
|
|
|
|||||||
|
U.S. GAAP adjustments
(2)
|
|
|
|
|||||||||
|
|
|
|
|
|
|
|||||||
|
Premises and
equipment-net,
Goodwill, Intangible assets, and
right-of-use
|
|
|
|
|||||||||
|
|
|
|
|
|
|
|||||||
F-11
7
MIZUHO FINANCIAL GROUP, INC. AND SUBSIDIARIES
NOTES TO CONSOLIDATED FINANCIAL STATEMENTS—(Continued
)
Notes:
| (1) |
The MHFG Group adopted ASU
No.2016-13,
2019-04,
2019-05,
and
2019-11
on April 1, 2020. Allowances for credit losses for the fiscal year ended March 31, 2021 substitute allowances for loan losses and
off-balance-sheet
instruments for the fiscal years ended March 31, 2019 and 2020. See Note 2 “Issued accounting pronouncements” for further details.
|
| (2) |
The U.S. GAAP adjustments are primarily comprised of GAAP differences mainly from
right-of-use
.
|
F-11
8
MIZUHO FINANCIAL GROUP, INC. AND SUBSIDIARIES
NOTES TO CONSOLIDATED FINANCIAL STATEMENTS—(Continued)
32. Foreign activities
The following table presents consolidated income statement and total assets information by major geographic area. Foreign activities are defined as business transactions that involve customers residing outside of Japan. However, as the MHFG Group’s operations are highly integrated globally, estimates and assumptions have been made for an allocation among the geographic areas.
|
Americas
|
||||||||||||||||||||||||
|
Japan
|
United
States of
America
|
Others
|
Europe
|
Asia/Oceania
excluding
Japan,
and others
|
Total
|
|||||||||||||||||||
|
(in billions of yen)
|
||||||||||||||||||||||||
|
Fiscal year ended March 31, 2019:
|
||||||||||||||||||||||||
|
Total revenue
(1)
|
|
|
|
|
|
|
||||||||||||||||||
|
Total expenses
(2)
|
|
|
|
|
|
|
||||||||||||||||||
|
|
|
|
|
|
|
|
|
|
|
|
|
|||||||||||||
|
Income (loss) before income tax expense
|
(
|
) |
|
|
|
|
|
|||||||||||||||||
|
|
|
|
|
|
|
|
|
|
|
|
|
|||||||||||||
|
Net income (loss)
|
(
|
) |
|
|
|
|
|
|||||||||||||||||
|
|
|
|
|
|
|
|
|
|
|
|
|
|||||||||||||
|
Total assets at end of fiscal year
|
|
|
|
|
|
|
||||||||||||||||||
|
|
|
|
|
|
|
|
|
|
|
|
|
|||||||||||||
|
Fiscal year ended March 31, 2020:
|
||||||||||||||||||||||||
|
Total revenue
(1)
|
|
|
|
|
|
|
||||||||||||||||||
|
Total expenses
(2)
|
|
|
|
|
|
|
||||||||||||||||||
|
|
|
|
|
|
|
|
|
|
|
|
|
|||||||||||||
|
Income (loss) before income tax expense
|
(
|
) |
|
|
|
|
|
|||||||||||||||||
|
|
|
|
|
|
|
|
|
|
|
|
|
|||||||||||||
|
Net income (loss)
|
(
|
) |
|
|
|
|
|
|||||||||||||||||
|
|
|
|
|
|
|
|
|
|
|
|
|
|||||||||||||
|
Total assets at end of fiscal year
|
|
|
|
|
|
|
||||||||||||||||||
|
|
|
|
|
|
|
|
|
|
|
|
|
|||||||||||||
|
Fiscal year ended March 31, 2021:
|
||||||||||||||||||||||||
|
Total revenue
(1)
|
|
|
|
|
|
|
||||||||||||||||||
|
Total expenses
(2)
|
|
|
|
|
|
|
||||||||||||||||||
|
|
|
|
|
|
|
|
|
|
|
|
|
|||||||||||||
|
Income (loss) before income tax expense
|
|
|
|
|
|
|
||||||||||||||||||
|
|
|
|
|
|
|
|
|
|
|
|
|
|||||||||||||
|
Net income (loss)
|
|
|
|
|
|
|
||||||||||||||||||
|
|
|
|
|
|
|
|
|
|
|
|
|
|||||||||||||
|
Total assets at end of fiscal year
|
|
|
|
|
|
|
||||||||||||||||||
|
|
|
|
|
|
|
|
|
|
|
|
|
|||||||||||||
Notes:
| (1) |
Total revenue is comprised of Interest and dividend income and Noninterest income.
|
| (2) |
Total expenses are comprised of Interest expense, Provision (credit) for credit losses and Noninterest expenses.
|
F-11
9
MIZUHO FINANCIAL GROUP, INC. AND SUBSIDIARIES
NOTES TO CONSOLIDATED FINANCIAL STATEMENTS—(Continued)
33. Mizuho Financial Group, Inc., parent company
The following tables present the parent company only financial information of MHFG:
Condensed balance sheets
|
2020
|
2021
|
|||||||
|
(in millions of yen)
|
||||||||
|
Assets:
|
||||||||
|
Cash and due from banking subsidiaries
|
|
|
||||||
|
Interest-bearing deposits in banking subsidiaries
|
|
|
||||||
|
Investments in subsidiaries and affiliated companies:
|
||||||||
|
Banking subsidiaries
|
|
|
||||||
|
Non-banking
subsidiaries and affiliated companies
|
|
|
||||||
|
Long-term loans receivable from a banking subsidiary
|
|
|
||||||
|
Other
|
|
|
||||||
|
|
|
|
|
|||||
|
Total
|
|
|
||||||
|
|
|
|
|
|||||
|
Liabilities and shareholders’ equity:
|
||||||||
|
Short-term borrowings from a banking subsidiary
|
|
|
||||||
|
Long-term debt
|
|
|
||||||
|
Other liabilities
|
|
|
||||||
|
Shareholders’ equity
|
|
|
||||||
|
|
|
|
|
|||||
|
Total
|
|
|
||||||
|
|
|
|
|
|||||
F-1
20
MIZUHO FINANCIAL GROUP, INC. AND SUBSIDIARIES
NOTES TO CONSOLIDATED FINANCIAL STATEMENTS—(Continued)
Condensed statements of income
|
2019
|
2020
|
2021
|
||||||||||
|
(in millions of yen)
|
||||||||||||
|
Income:
|
||||||||||||
|
Dividends from subsidiaries and affiliated companies:
|
||||||||||||
|
Banking subsidiaries
|
|
|
|
|||||||||
|
Non-banking
subsidiaries and affiliated companies
|
|
|
|
|||||||||
|
Management fees from subsidiaries
|
|
|
|
|||||||||
|
Interest income on loans and discounts
|
|
|
|
|||||||||
|
Gains on disposal of premises and equipment
|
— |
|
— | |||||||||
|
Other income
|
|
|
|
|||||||||
|
|
|
|
|
|
|
|||||||
|
Total
|
|
|
|
|||||||||
|
|
|
|
|
|
|
|||||||
|
Expenses:
|
||||||||||||
|
Operating expenses
|
|
|
|
|||||||||
|
Interest expense
|
|
|
|
|||||||||
|
Other expense
|
|
|
|
|||||||||
|
|
|
|
|
|
|
|||||||
|
Total
|
|
|
|
|||||||||
|
|
|
|
|
|
|
|||||||
|
Equity in undistributed net income (loss) of subsidiaries
|
(
|
) |
|
|
||||||||
|
|
|
|
|
|
|
|||||||
|
Income before income tax expense
|
|
|
|
|||||||||
|
Income tax expense (benefit)
|
(
|
) |
|
(
|
) | |||||||
|
|
|
|
|
|
|
|||||||
|
Net income
|
|
|
|
|||||||||
|
|
|
|
|
|
|
|||||||
F-1
21
MIZUHO FINANCIAL GROUP, INC. AND SUBSIDIARIES
NOTES TO CONSOLIDATED FINANCIAL STATEMENTS—(Continued)
Condensed statements of cash flows
|
2019
|
2020
|
2021
|
||||||||||
|
(in millions of yen)
|
||||||||||||
|
Cash flows from operating activities:
|
||||||||||||
|
Net income
|
|
|
|
|||||||||
|
Adjustments and other
|
|
(
|
) |
(
|
) | |||||||
|
|
|
|
|
|
|
|||||||
|
Net cash provided by operating activities
|
|
|
|
|||||||||
|
|
|
|
|
|
|
|||||||
|
Cash flows from investing activities:
|
||||||||||||
|
Proceeds from sales of Equity securities
|
|
— | — | |||||||||
|
Net change in loans
|
(
|
) |
(
|
) |
(
|
) | ||||||
|
Purchases of premises and equipment
|
(
|
) |
(
|
) |
(
|
) | ||||||
|
Proceeds from sales of premises and equipment
|
— |
|
|
|||||||||
|
Net change in other investing activities
|
(
|
) |
(
|
) |
(
|
) | ||||||
|
|
|
|
|
|
|
|||||||
|
Net cash used in investing activities
|
(
|
) |
(
|
) |
(
|
) | ||||||
|
|
|
|
|
|
|
|||||||
|
Cash flows from financing activities:
|
||||||||||||
|
Net change in short-term borrowings
|
(
|
) |
(
|
) |
(
|
) | ||||||
|
Proceeds from issuance of long-term debt
|
|
|
|
|||||||||
|
Repayment of long-term debt
|
— |
(
|
) |
(
|
) | |||||||
|
Proceeds from issuance of common stock
|
|
— | — | |||||||||
|
Purchases of treasury stock
|
(
|
) |
(
|
) |
(
|
) | ||||||
|
Dividends paid
|
(
|
) |
(
|
) |
(
|
) | ||||||
|
Net change in other financing activities
|
|
|
|
|||||||||
|
|
|
|
|
|
|
|||||||
|
Net cash provided by financing activities
|
|
|
|
|||||||||
|
|
|
|
|
|
|
|||||||
|
Effect of exchange rate changes on cash and cash equivalents
|
|
— | — | |||||||||
|
|
|
|
|
|
|
|||||||
|
Net increase (decrease) in cash and cash equivalents
|
|
(
|
) |
|
||||||||
|
Cash and cash equivalents at beginning of fiscal year
|
|
|
|
|||||||||
|
|
|
|
|
|
|
|||||||
|
Cash and cash equivalents at end of fiscal year
|
|
|
|
|||||||||
|
|
|
|
|
|
|
|||||||
34. Subsequent events
Sale of partial shares of our subsidiary in response to the subsidiary’s share buyback
MHFG sold a part of its common shares of MHSC in response to the share buyback conducted by MHSC. The details are as follows.
(1) Reason of MHSC’s share buyback
MHSC conducted the share buyback for capital improvement following the MHFG Gr
o
up’s capital policy, which MHFG, the parent company of MHSC, presented in light of the MHFG Group’s financial structure reforms.
(2) The number of sold shares, the selling price and the date of the sale
|
The number of sold shares
|
|
|
|
The selling price
|
|
¥
|
|
The date of the sale
|
|
|
F-1
22
MIZUHO FINANCIAL GROUP, INC. AND SUBSIDIARIES
NOTES TO CONSOLIDATED FINANCIAL STATEMENTS—(Continued)
(3) Impact of the share sale on the MHFG Group’s future consolidated results of operations or financial condition.
The sale of some of MHSC’s shares is expected to impact the results of operations such as decreasing MHFG’s taxable income. Currently an estimated impact cannot be made as MHFG Group is evaluating the impact of this sale on the MHFG Group’s consolidated results of operations or financial condition.
F-
123
EXHIBIT INDEX
|
Exhibit
Number
|
|
Description of Exhibits
|
|
1.1
|
|
|
|
1.2
|
|
|
|
1.3
|
|
|
|
2.1
|
|
|
|
2.2
|
|
|
|
2.3
|
|
|
|
2.4
|
|
|
|
8
|
|
|
|
11
|
|
|
|
12.1
|
|
|
|
12.2
|
|
|
|
13.1
|
|
|
|
15
|
|
|
|
101.INS
|
|
Inline XBRL Instance Document—the instance document does not appear in the Interactive Data File because its XBRL tags are embedded within the Inline XBRL document
|
|
101.SCH
|
|
Inline XBRL Taxonomy Extension Schema
|
|
101.CAL
|
|
Inline XBRL Taxonomy Extension Calculation Linkbase
|
|
101.DEF
|
|
Inline XBRL Taxonomy Extension Definition Linkbase
|
|
101.LAB
|
|
Inline XBRL Taxonomy Extension Label Linkbase
|
|
101.PRE
|
|
Inline XBRL Taxonomy Extension Presentation Linkbase
|
|
104
|
|
The cover page for the Company’s Annual Report on From
20-F
for the year ended March 31, 2021, has been formatted in Inline XBRL
|
|
*
|
Incorporated by reference to our annual report on Form
20-F
(No.
001-33098)
filed on July 3, 2018
|
|
**
|
Incorporated by reference to our annual report on Form
20-F
(No.
001-33098)
filed on July 3, 2018, except Exhibit A thereto. Exhibit A to the Deposit Agreement has been revised as of October 1, 2020. For the latest Exhibit A, see Exhibit 2.1 to this annual report.
|
Signature
The registrant hereby certifies that it meets all of the requirements for filing on Form 20-F and that it has duly caused and authorized the undersigned to sign this annual report on its behalf.
|
MIZUHO FINANCIAL GROUP, INC.
|
||
|
By:
|
|
/s/ Tatsufumi Sakai
|
|
Name:
|
|
Tatsufumi Sakai
|
|
Title:
|
|
President & Group CEO
|
July 2, 2021
TABLE OF CONTENTS
Part IItem 1. Identity Of Directors, Senior Management and AdvisersItem 2. Offer Statistics and Expected TimetableItem 3. Key InformationItem 4. Information on The CompanyItem 4A. Unresolved Staff CommentsItem 5. Operating and Financial Review and ProspectsItem 6. Directors, Senior Management and EmployeesItem 7. Major Shareholders and Related Party TransactionsItem 8. Financial InformationItem 9. The Offer and ListingItem 10. Additional InformationItem 11. Quantitative and Qualitative Disclosures About Credit, Market and Other RiskItem 12. Description Of Securities Other Than Equity SecuritiesPart IIItem 13. Defaults, Dividend Arrearages and DelinquenciesItem 14. Material Modifications To The Rights Of Security Holders and Use Of ProceedsItem 15. Controls and ProceduresItem 16A. Audit Committee Financial ExpertItem 16B. Code Of EthicsItem 16C. Principal Accountant Fees and ServicesItem 16D. Exemptions From The Listing Standards For Audit CommitteesItem 16E. Purchase Of Equity Securities By The Issuer and Affiliated PurchasersItem 16F. Change in Registrant S Certifying AccountantItem 16G. Corporate GovernanceItem 16H. Mine Safety DisclosurePart IIIItem 17. Financial StatementsItem 17. FinancialItem 18. Financial StatementsItem 18. FinancialItem 19. Exhibits