MAGNITE, INC.
10-Ks and 10-Qs
|
|
|
|
|
|
|
|
|
|
|
|
|
|
|
|
|
|
|
|
|
|
|
|
|
|
|
|
|
|
|
|
|
|
|
|
|
|
|
|
|
UNITED STATES
SECURITIES AND EXCHANGE COMMISSION
Washington, D.C. 20549
__________________
FORM 10-K
__________________
(Mark One)
x
ANNUAL REPORT PURSUANT TO SECTION 13 OR 15(d) OF THE SECURITIES EXCHANGE ACT OF 1934
For the fiscal year ended
December 31, 2014
OR
o
TRANSITION REPORT PURSUANT TO SECTION 13 OR 15(d) OF THE SECURITIES EXCHANGE ACT OF 1934
For the transition period from _____________ to _____________
Commission File Number: 001-36384
__________________
THE RUBICON PROJECT, INC.
(Exact name of registrant as specified in its charter)
__________________
|
Delaware
|
20-8881738
|
|
|
(State or other jurisdiction of Incorporation or organization)
|
(I.R.S. Employer Identification No.)
|
|
|
12181 Bluff Creek Drive, 4th Floor
|
||
|
Los Angeles, CA 90094
|
||
|
(Address of principal executive offices, including zip code)
|
||
|
Registrant’s telephone number, including area code:
|
||
|
(310) 207-0272
|
||
|
Securities registered pursuant to Section 12(b) of the Act:
|
||
|
Title of each class
|
Name of each exchange on which registered
|
|
|
Common Stock, $0.00001 par value
|
|
New York Stock Exchange
|
|
Securities registered pursuant to Section 12(g) of the Act:
|
||
|
None
|
||
__________________
Indicate by check mark if the registrant is a well-known seasoned issuer, as defined in Rule 405 of the Securities Act. Yes
¨
No
x
Indicate by check mark if the registrant is not required to file reports pursuant to Section 13 or 15(d) of the Exchange Act. Yes
¨
No
x
Indicate by check mark whether the registrant (1) has filed all reports required to be filed by Section 13 or 15(d) of the Securities Exchange Act of 1934 during the preceding 12 months (or for such shorter period that the registrant was required to file such reports), and (2) has been subject to such filing requirements for the past 90 days. Yes
x
No
¨
Indicate by check mark whether the registrant has submitted electronically and posted on its corporate Web site, if any, every Interactive Data File required to be submitted and posted pursuant to Rule 405 of Regulation S-T (§232.405 if this chapter) during the preceding 12 months (or for such shorter period that the registrant was required to submit and post such files). Yes
x
No
¨
Indicate by check mark if disclosure of delinquent filers pursuant to Item 405 of Regulation S-K (§229.405 of this chapter) is not contained herein, and will not be contained, to the best of the registrant's knowledge, in definitive proxy or information statements incorporated by reference in Part III of this Form 10-K or any amendment to this Form 10-K.
¨
Indicate by check mark whether the registrant is a large accelerated filer, an accelerated filer, a non-accelerated filer or a smaller reporting company. See definition of “large accelerated filer,” “accelerated filer” and “smaller reporting company” in Rule 12b-2 of the Exchange Act.
|
Large accelerated filer
¨
|
Accelerated filer
¨
|
|
|
Non-accelerated filer
x
(Do not check if a smaller reporting company) |
Smaller reporting company
¨
|
|
Indicate by check mark whether the registrant is a shell company (as defined in Rule 12b-2 of the Exchange Act).
o
Yes
x
No
As of June 30, 2014, the aggregate market value of shares held by non-affiliates of the registrant (based on the closing sales price of such shares on the New York Stock Exchange on June 30, 2014) was approximately
$211.7 million
.
Indicate the number of shares outstanding of each of the issuer’s classes of common stock, as of the latest practicable date.
|
Class
|
Outstanding as of February 27, 2015
|
|
|
Common Stock, $0.00001 par value
|
37,750,998
|
|
DOCUMENTS INCORPORATED BY REFERENCE
Portions of the registrant's Proxy Statement for the 2015 Annual Meeting of Stockholders are incorporated herein by reference in Part III of this Annual Report on Form 10-K to the extent stated herein. Such proxy statement will be filed with the Securities and Exchange Commission within 120 days of the registrant's fiscal year ended December 31, 2014.
THE RUBICON PROJECT, INC.
FORM 10-K
FOR THE FISCAL YEAR ENDED DECEMBER 31, 2014
TABLE OF CONTENTS
|
Page
No.
|
||
|
Special Note About Forward-Looking Statements
|
||
|
Part I
|
||
|
Item 1.
|
Business
|
|
|
Item 1A.
|
Risk Factors
|
|
|
Item 1B.
|
Unresolved Staff Comments
|
|
|
Item 2.
|
Properties
|
|
|
Item 3.
|
Legal Proceedings
|
|
|
Item 4.
|
Mine Safety Disclosures
|
|
|
Part II
|
||
|
Item 5.
|
Market for Registrant's Common Equity, Related Stockholder Matters and Issuer Purchases of Equity Securities
|
|
|
Item 6.
|
Selected Financial Data
|
|
|
Item 7.
|
Management's Discussion and Analysis of Financial Condition and Results of Operations
|
|
|
Item 7A.
|
Quantitative and Qualitative Disclosures About Market Risk
|
|
|
Item 8.
|
Financial Statements and Supplementary Data
|
|
|
Item 9.
|
Changes in and Disagreements with Accountants on Accounting and Financial Disclosure
|
|
|
Item 9A.
|
Controls and Procedures
|
|
|
Item 9B.
|
Other Information
|
|
|
Part III
|
||
|
Item 10.
|
Directors, Executive Officers and Corporate Governance
|
|
|
Item 11.
|
Executive Compensation
|
|
|
Item 12.
|
Security Ownership of Certain Beneficial Owners and Management and Related Stockholder Matters
|
|
|
Item 13.
|
Certain Relationships and Related Transactions, and Director Independence
|
|
|
Item 14.
|
Principal Accounting Fees and Services
|
|
|
Part IV
|
||
|
Item 15.
|
Exhibits and Financial Statement Schedules
|
|
|
Signatures
|
||
2
SPECIAL NOTE ABOUT FORWARD-LOOKING STATEMENTS
This Annual Report on Form 10-K contains forward-looking statements, including statements based upon or relating to our expectations, assumptions, estimates, and projections. In some cases, you can identify forward-looking statements by terms such as “may,” “might,” “will,” “objective,” “intend,” “should,” “could,” “can,” “would,” “expect,” “believe,” “design,” “anticipate,” “estimate,” “predict,” “potential,” “plan” or the negative of these terms, and similar expressions. Forward-looking statements may include, but are not limited to, statements concerning our anticipated performance, including revenue, margin, cash flow, balance sheet, and profit expectations; development of our technology; introduction of new offerings; scope and duration of client relationships; business mix; sales growth; client utilization of our offerings; market conditions and opportunities; and operational measures including managed revenue, paid impressions, average CPM, and take rate; and factors that could affect these and other aspects of our business. These statements are not guarantees of future performance; they reflect our current views with respect to future events and are based on assumptions and estimates and subject to known and unknown risks, uncertainties and other factors that may cause our actual results, performance or achievements to be materially different from expectations or results projected or implied by forward-looking statements. These risks include, but are not limited to:
|
•
|
our ability to grow rapidly and to manage our growth effectively;
|
|
•
|
our ability to develop innovative new technologies and remain a market leader;
|
|
•
|
our ability to attract and retain buyers and sellers and increase our business with them;
|
|
•
|
the freedom of buyers and sellers to direct their spending and inventory to competing sources of inventory and demand;
|
|
•
|
our ability to use our solution to purchase and sell higher value advertising and to expand the use of our solution by buyers and sellers utilizing evolving digital media platforms;
|
|
•
|
our ability to introduce new solutions and bring them to market in a timely manner;
|
|
•
|
uncertainty of our estimates and expectations associated with new offerings, including private marketplace, mobile, bidding, and solutions;
|
|
•
|
our ability to maintain a supply of advertising inventory from sellers;
|
|
•
|
our limited operating history and history of losses;
|
|
•
|
our ability to continue to expand into new geographic markets;
|
|
•
|
the effects of increased competition in our market and our ability to compete effectively and to maintain our pricing and take rate;
|
|
•
|
potential adverse effects of malicious activity such as fraudulent inventory and malware;
|
|
•
|
the effects of seasonal trends on our results of operations;
|
|
•
|
costs associated with defending intellectual property infringement and other claims;
|
|
•
|
our ability to attract and retain qualified employees and key personnel;
|
|
•
|
our ability to consummate future acquisitions of or investments in complementary companies or technologies;
|
|
•
|
our ability to comply with, and the effect on our business of, evolving legal standards and regulations, particularly concerning data protection and consumer privacy; and
|
|
•
|
our ability to develop and maintain our corporate infrastructure, including our finance and information technology systems and controls.
|
We discuss many of these risks in Item 1A of this Annual Report on Form 10-K in greater detail under the heading “Risk Factors” and in other filings we make from time to time with the SEC. Also, these forward-looking statements represent our estimates and assumptions only as of the date of this Annual Report on Form 10-K. Unless required by federal securities laws, we assume no obligation to update any of these forward-looking statements, or to update the reasons actual results could differ materially from those anticipated, to reflect circumstances or events that occur after the statements are made. Without limiting the foregoing, we generally give guidance only in connection with quarterly and annual earnings announcements, without interim updates, and we may appear at industry conferences or make other public statements without disclosing material nonpublic information in our possession. Given these uncertainties, investors should not place undue reliance on these forward-looking statements.
Investors should read this Annual Report on Form 10-K and the documents that we reference in this report and have filed with the Securities and Exchange Commission completely and with the understanding that our actual future results may be materially different from what we expect. We qualify all of our forward-looking statements by these cautionary statements.
3
We are a technology company on a mission to automate the buying and selling of advertising. Our Advertising Automation Cloud is a highly scalable platform that provides leading user reach and a marketplace for the real time trading of digital advertising between buyers and sellers. Through the speed and big data analytics of our algorithm-based solution, we have transformed the cumbersome, complex process of direct buying and selling of digital advertising into a seamless automated process that optimizes results for both buyers and sellers. Buyers of digital advertising use our platform to reach approximately 600 million Internet users globally on some of the world’s leading sellers’ websites and applications. Sellers of digital advertising use our platform to maximize revenue from advertising, decrease costs and protect their brands and user experience, while accessing a global market of buyers representing top advertiser brands around the world. We believe the benefits we provide to both buyers and sellers, and the time and effort spent by both buyers and sellers to integrate with our platform and associated applications give us a critical position in the digital advertising ecosystem. The Company is a Delaware corporation established in 2007. The Company is headquartered in Los Angeles, California.
Our Advertising Automation Cloud features applications for digital advertising sellers, including websites, mobile applications and other digital media properties, to sell their advertising inventory; applications for buyers, including advertisers, agencies, agency trading desks, or ATDs, demand side platforms, or DSPs, and ad networks, to buy advertising inventory; and a marketplace over which such transactions are executed. Together, these features power and optimize a comprehensive, transparent, and independent advertising marketplace that brings buyers and sellers together and facilitates intelligent decision-making and automated transaction execution for the advertising inventory we manage on our platform. Our Advertising Automation Cloud incorporates proprietary machine-learning algorithms, sophisticated data processing, high-volume storage, detailed analytics capabilities, and a distributed infrastructure. We analyze billions of data points in real time to enable our solution to make approximately 300 data-driven decisions per transaction in milliseconds, and to execute up to 3.5 million peak queries per second, and 5 trillion bid requests per month. Since 2012, we have processed approximately 100 trillion bid requests. We believe we help increase the volume and effectiveness of advertising, increasing revenue for sellers and improving return on advertising investment for buyers.
We have direct relationships built on technical integration with our sellers, including over 50% of the U.S. comScore 100, which is a list of the top U.S. digital sellers by user reach. We believe that our direct relationships and integrations with sellers differentiate us from many other participants in the advertising ecosystem, and make us a vital participant in the digital advertising industry. Our integration of sellers into our platform gives sellers the ability to monetize a full variety and volume of inventory. At the same time, buyers leverage our platform to manage their advertising spending, simplify order management and campaign tracking, obtain actionable insights into audiences for their advertising and access impression-level purchasing from hundreds of sellers. We believe buyers need our platform because of our powerful solution and our direct relationships and integrations with some of the world’s largest sellers. Our solution is constantly self-optimizing based on our ability to analyze and learn from vast volumes of data. The additional data we obtain from the volume of transactions on our platform help make our machine-learning algorithms more intelligent, leading to higher quality matching between buyers and sellers, better return on investment for buyers and higher revenue for sellers. As a result of that high-quality matching, we attract even more sellers, which in turn attracts more buyers and vice versa. We believe this self-reinforcing dynamic creates a strong platform for growth.
In 2014, we expanded our orders automation technology and expanded our capabilities in the automated guaranteed market with the acquisition of two companies, iSocket, Inc., or iSocket, and Shiny Inc, or Shiny. The addition of iSocket and Shiny provides additional solutions to automate the buying and selling of direct-sold, guaranteed deals, which according to eMarketer, is a market that is forecasted to surpass $8 billion in the U.S. alone by 2016. When combined with our existing orders technology, these acquisitions further extend our leadership position, and have helped us create a fully integrated solution for automating, streamlining, and managing the processes of direct buying and selling of guaranteed and non-guaranteed advertising.
For the year ended December 31, 2014 our revenue was
$125.3 million
, a
49%
increase over the same period in 2013. We recorded a net loss of
$18.7 million
and Adjusted EBITDA of
$19.1 million
for the year ended December 31, 2014, compared with a net loss of
$9.2 million
and Adjusted EBITDA of
$11.2 million
for the year ended December 31, 2013. In 2013, our revenue was $83.8 million, a 47% increase over 2012. We recorded a net loss of $2.4 million and Adjusted EBITDA of $9.2 million in 2012. For information on how we compute Adjusted EBITDA, and a reconciliation of Adjusted EBITDA to net loss on the basis of accounting principles generally accepted in the United States, or GAAP, please refer to Item 6 “Selected Financial Data.”
4
Advertising spending transacted on our platform has grown significantly. Managed revenue is an operational measure that represents this advertising spending. Managed revenue would represent our revenue if we were to record our revenue on a gross basis instead of a net basis. Managed revenue does not represent revenue reported on a GAAP basis. We review managed revenue for internal management purposes to assess market share and scale and to compare our performance to others in our industry that report revenue on a gross basis. Our managed revenue was
$667.8 million
in 2014, which represents a
38%
increase over managed revenue of
$485.1 million
in 2013, and a
97%
increase over managed revenue of $338.9 million in 2012.
Our net loss and Adjusted EBITDA will be impacted by the rate at which our revenue increases, seasonality, amount and the timing of our investments in our operations.
Substantially all of our revenue is U.S. revenue, determined based on the location of our legal entity that is a party to the relevant transaction.
Our Industry
Shift Towards Digital Advertising
The advertising industry is in the midst of a decades-long shift from advertising in analog and print media, such as newspapers, magazines, broadcast radio and television, to digital advertising. Content is increasingly delivered to users over the Internet, mobile networks and digital television, creating an opportunity for buyers to target audiences more accurately and deliver more relevant advertising in real time on multiple screens. Buyers are able to utilize various technologies to analyze data relating to return on investment, demographics, user behavior, and other attributes that enable them to create and deliver targeted advertisements to users that help achieve specific advertising goals. As a result, digital advertising has the potential to drive return on advertising investment significantly higher than print, broadcast radio and television. Technological advances are also enabling sellers to sell their inventory on an impression-by-impression basis, as well as in bulk, making it easier for sellers to better optimize and expand the monetization of their inventory.
Development of a Complex Digital Advertising Ecosystem Comprising a Large Number of Buyers, Sellers and Other Participants
In the early stages of the digital advertising market, buyers and sellers of inventory transacted directly with one another or through a small number of intermediaries. As Internet usage increased and the scale of sellers and data expanded, it became increasingly difficult for buyers to effectively target users and for sellers to effectively monetize their inventory. To address these challenges, buyers and sellers of inventory have come to rely on an ecosystem of multiple technology and service providers, described below.
Buyers:
At one end of the ecosystem, spending begins with advertisers, who execute digital advertising campaigns directly or through various intermediaries, including:
|
•
|
Advertisers: Companies marketing their brands, products and services through advertising campaigns.
|
|
•
|
Agencies: Advertising holding companies and their owned agencies that plan and execute advertising campaigns for their commercial clients.
|
Agency trading desks, or ATDs: Typically, agencies plan and execute media purchases by interacting with DSPs through their own in-house ATDs. Advertising agencies often centralize their digital advertising expertise into an ATD in order to better optimize advertiser campaigns and digital media purchases.
|
•
|
Demand side platforms, or DSPs: There are many DSPs in the digital advertising industry and they generally use real-time bidding, or RTB, to purchase advertising inventory from sellers on an automated, impression-by-impression basis. DSPs may earn revenue through arbitrage, like ad networks, or they may charge fees for their services.
|
|
•
|
Ad networks: There are hundreds of ad networks that seek to optimize campaigns to achieve advertiser and agency goals. Ad networks may arbitrage by purchasing advertising inventory from sellers and then selling it to advertisers at higher prices. Ad networks may be broad and cover more than one industry or cover various niche areas, such as a specific industry like retail.
|
Sellers:
At the other end of the ecosystem, sellers create websites and applications that contain viewable space for advertisements, or impressions, that can be delivered to users as they visit and navigate through websites, channels and applications across different platforms, such as desktop, mobile devices, satellite, cable, smart TV, or set-top boxes. These impressions can be sold to buyers, either in advance via manual or automated direct sales efforts, or in real time on an impression-by-impression basis via a third party through the digital advertising ecosystem.
5
Other Sell-Side Participants:
Sellers may use additional sell-side representatives in connecting with buyers:
|
•
|
Supply side platforms, or SSPs: Sellers often sell their advertising inventory through a third party SSP, which is a platform that helps sellers offer and optimize their advertising inventory in real time.
|
|
•
|
Ad servers: Sellers use ad servers to display advertisements received from buyers and to track the delivery of advertisements to users. Typically these platforms can easily integrate with SSPs and act as the last link in the chain between buyers and Internet users.
|
Marketplace:
Buyers and sellers may sometimes come together through a marketplace, which matches and presents available impressions to buyers. Once the impression has been matched, the marketplace enables the advertisement to be served and may manage the financial aspects of the transaction. Marketplaces can enable increased liquidity and transparency in transactions between buyers and sellers.
Costs, Inefficiencies and Lack of Transparency Inherent in Existing Ecosystem
This ecosystem of various buyers, sellers and other intermediaries has helped buyers access digital media, but it has fallen short of truly enabling them to take advantage of the potential of digital advertising and has led to a system that is highly complex and inefficient. We believe, based on industry research, that due to the complex ecosystem of multiple players that has developed to accommodate both buyers and sellers, as little as $0.40 of every dollar spent by an advertiser may ultimately be realized by the seller.
Complicated and Manual Workflow for Direct Buying and Selling of Digital Advertising
Despite significant technological advances made with respect to delivery of digital advertising, the process of planning and executing a digital advertising campaign directly remains cumbersome. Before an advertisement can be delivered to a seller, an advertiser and its agency typically undergo a highly manual, multi-step and complicated order process. The internal workflow of selling inventory is similarly complex for sellers. These manual and complicated workflows for a typical digital display order process lead to inefficiencies, wasted dollars for sellers and missed opportunities for buyers to reach users. The typical order process involves close to a dozen manual steps to match an advertiser with a seller. According to NextMark, it can cost a buyer up to $40,000 and 480 man-hours to plan and execute a $500,000 advertising campaign.
Due to the size and complexity of the advertising ecosystem and purchasing process, manual processes can no longer effectively optimize or manage digital advertising. In addition, both buyers and sellers are demanding more transparency, better controls and more relevant insights from their advertising purchases and sales. This has created a need to automate the digital advertising industry and to simplify the process of buying and selling advertising.
Digital Advertising is Complex and Challenging to Automate
A number of factors make digital advertising complex and challenging to automate:
|
•
|
Perishable Inventory.
An Internet user’s visit to a website or application creates a unique opportunity to reach the user by inserting advertisements into one or more of the impressions designed into the website or application. In order to generate revenue for a seller these impressions must be filled before the page content loads. The inventory of available impressions is highly perishable due to the fact that each impression must be valued, auctioned, successfully purchased, and the advertisement must be delivered in the split second between the time a user types in a web-address or is redirected to a website or application and the time the page is loaded. Buyers and sellers need a solution that can analyze and execute on their objectives in an automated fashion at virtually instantaneous speed, or real time.
|
|
•
|
Complex Impression-Level Matching.
Sellers aim to sell impressions to maximize revenue, while enhancing the users’ experience and preserving the sellers’ brand. Buyers wish to purchase impression-level inventory to maximize targeting of specific audiences and return on investment for their advertising spending. As a result of this dynamic, there is a need for a technology solution that can match buyer and seller objectives at a large scale to optimize the delivery of advertising on an impression-by-impression basis.
|
|
•
|
Large Multi-Variate Datasets.
Trillions of data points relating to browsing behavior, geographic information, user preferences, engagement with an advertisement, and effectiveness of an advertisement are created as users visit sellers’ websites and applications. Each piece of data represents a valuable piece of information that can facilitate and improve current and subsequent targeting and monetization of impressions. However, the volume of data available is so large that it is difficult for buyers and sellers to effectively manage the information flow to extract maximum value from the data. As a result, buyers and sellers need a solution capable of analyzing, processing, and interpreting large amounts of data and executing buy and sell orders informed by such data, all in real time.
|
6
|
•
|
Fragmented Buyer and Seller Base.
In the digital advertising industry, there is an enormous variety of buyers, as well as an enormous number of sellers who have a wide variety of advertising inventory available for sale. Historically, this fragmentation has been disadvantageous for sellers, because they could not efficiently transact with many buyers to maximize revenue due to manual inefficiencies. The fragmentation of the seller base makes it very difficult for buyers to make large volume buys safely and securely to meet their investment objectives. This enormous variety of buyers and sellers has created a need for a solution that is capable of seamlessly connecting a highly fragmented global buyer and seller base.
|
|
•
|
Brand Security and User Experience Concerns.
Buyers are concerned about being associated with content they consider inappropriate, competitive, or inconsistent with their advertising themes. Sellers want to prevent advertisements that are inappropriate, competitively sensitive or otherwise do not comport with their brand image from appearing on their websites or applications. As sellers try to make their inventory available to a wider group of buyers, and buyers extend their reach in pursuit of target audiences, the importance of brand security increases for both buyers and sellers. Both buyers and sellers need a solution that is capable of following specified rules to maintain brand integrity and deliver relevant advertisements that create a positive user experience, while efficiently executing a large volume of transactions.
|
|
•
|
Large and Highly Unpredictable Traffic Volumes.
The scale of user traffic and the dollar value of digital advertisements is difficult to manage efficiently. A large seller may have tens of millions of users per month, creating hundreds of millions of monthly impressions. The volume of traffic for any given seller is extremely difficult to predict. Popular stories, as an example, create spikes in traffic on news websites for a period of time. As a result, sellers need a platform that can effectively respond to and monetize inventory during unpredictable spikes in volumes.
|
|
•
|
Lack of Standardized Ad Formats and Data.
An available advertising impression can vary based on a number of factors, such as seller, ad format, screen size, pricing mechanism, content type, and audience demographic. It is challenging for buyers to efficiently evaluate and bid on trillions of impressions that are based on hundreds of ad formats in the context of millions of highly customized data fields. As a result, buyers and sellers require a platform that can, on a real time basis, match a large variety of available advertising impressions with those potential buyers.
|
Rubicon Project: Our Advertising Automation Cloud Enables the Digital Advertising Marketplace
Rubicon Project, Inc., or Rubicon Project, was founded to address the challenges associated with the digital advertising ecosystem and to enable a marketplace where buyers and sellers can transact in an efficient and transparent manner. To achieve this, we have created our Advertising Automation Cloud.
Our Advertising Automation Cloud is a technology platform that creates and powers a marketplace for buyers and sellers to readily buy and sell advertising. Our solution provides a critical connection between buyers and sellers and allows large numbers of buyers and sellers to transact on an automated basis. Buyers can direct their spending towards the impressions that are of most value to them based on demographics, pricing, timing, and other targeting objectives. Sellers can optimize the amount of revenue per impression, while adhering to their own specific rules around advertising that is permissible on their websites and applications. Our platform enables the real time exchange of high volumes of information in a transparent marketplace that in turn enables sellers to match buyers’ advertising campaigns with their available advertising inventory.
Sellers have a broad spectrum of advertising inventory available for sale, ranging from premium inventory located on their homepages, to secondary placements, which are generally located on pages deeper within their websites or applications. Sellers may also have different versions of their websites and applications optimized for a variety of devices, from computers to tablets to smartphones, which also increases the variety of advertising inventory available for sale. As referenced in the illustration below, our Advertising Automation Cloud optimizes the sale and purchase of advertising across a full spectrum of inventory for all types of buyers and sellers and across many devices.
7

Our solution enables buyers and sellers to transact through our comprehensive automation offerings:
Orders: Guaranteed
—automates one-to-one guaranteed inventory purchases between buyers and sellers.
Orders: Non-Guaranteed
—automates one-to-one non-guaranteed orders arranged directly between specific buyers and sellers on the platform.
Real Time Bidding
—enables the sale and purchase of inventory on an impression-by-impression basis. Buyers are able to leverage our platform to select individual impressions that meet their targeting criteria and sellers are able to leverage our platform to auction their inventory on an impression-by-impression basis to optimize revenue.
Static Bidding
—enables buyers to provide static or pre-set bids, to buy targeted inventory in bulk, while providing additional monetization for sellers of their lower value inventory that they may not otherwise be able to sell.
Our solution integrates RTB, static bid and orders offerings into a unified auction across all types of buyers, while matching available impressions with advertisements based upon various criteria. In a typical RTB transaction, the following steps occur within milliseconds :
|
•
|
A user visits a website or application, creating an available impression from the seller’s inventory.
|
|
•
|
Our algorithms profile the impression, including the location of the website or application, advertisement size, advertising placement, browser and operating system, and additional data points such as user location and preferences.
|
|
•
|
Using the impression profile and historical bidding activity, we send bid requests for participation in the auction to selected bidders most likely to respond.
|
|
•
|
Simultaneously, the Advertising Automation Cloud reviews static bids currently in the system to determine which bids are eligible and match the available impression.
|
|
•
|
Bid responses are received from bidders interested in purchasing the impression, including information on price, buyer, and type of advertisement.
|
|
•
|
All advertisements are reviewed by our Advertising Automation Cloud for quality, security, conformity to seller requirements and conflicts with seller restrictions, to determine if they are eligible to win the impression.
|
|
•
|
Eligible bids are then checked against rules set by sellers to ensure they meet the applicable criteria.
|
|
•
|
Once all validations have been executed, remaining bids are compared and generally the highest qualifying bidder wins the impression.
|
|
•
|
The winning advertisement is served into the impression and delivered to the user
|
8

By accommodating all types of digital advertising inventory, our solution provides greater coverage of a seller’s websites and applications and attracts all types of buyers, thereby giving buyers the ability to fulfill their audience needs in a more cost-effective manner and optimizing the price at which sellers’ inventory is sold. In addition, our orders integrations further our access to premium inventory not historically available to us, because it was sold through manual efforts.
Big Data Analytics and Machine-Learning Algorithms
A core aspect of our value proposition is our big data and machine-learning platform that is able to discover unique insights from our massive data repositories containing proprietary information on trillions of bid requests and served advertisements. Our systems collect and analyze non-personally identifiable information such as pricing of advertisements, historical clearing prices, bid responses, what types of ads are allowed on a particular website, which sellers’ websites a buyer prefers, what ad formats are available to be served, advertisement size and location, where a user is located, which users a buyer wants to target, how many ads the user has seen, browser or device information, and sellers’ proprietary data about users. We have developed proprietary machine-learning algorithms that analyze billions of these data points to enable our solution to make approximately 300 real time data-driven decisions per transaction and to execute approximately 5 trillion bid requests per month.
Dual Network Effects Drive an Efficient and Self-Optimizing Marketplace
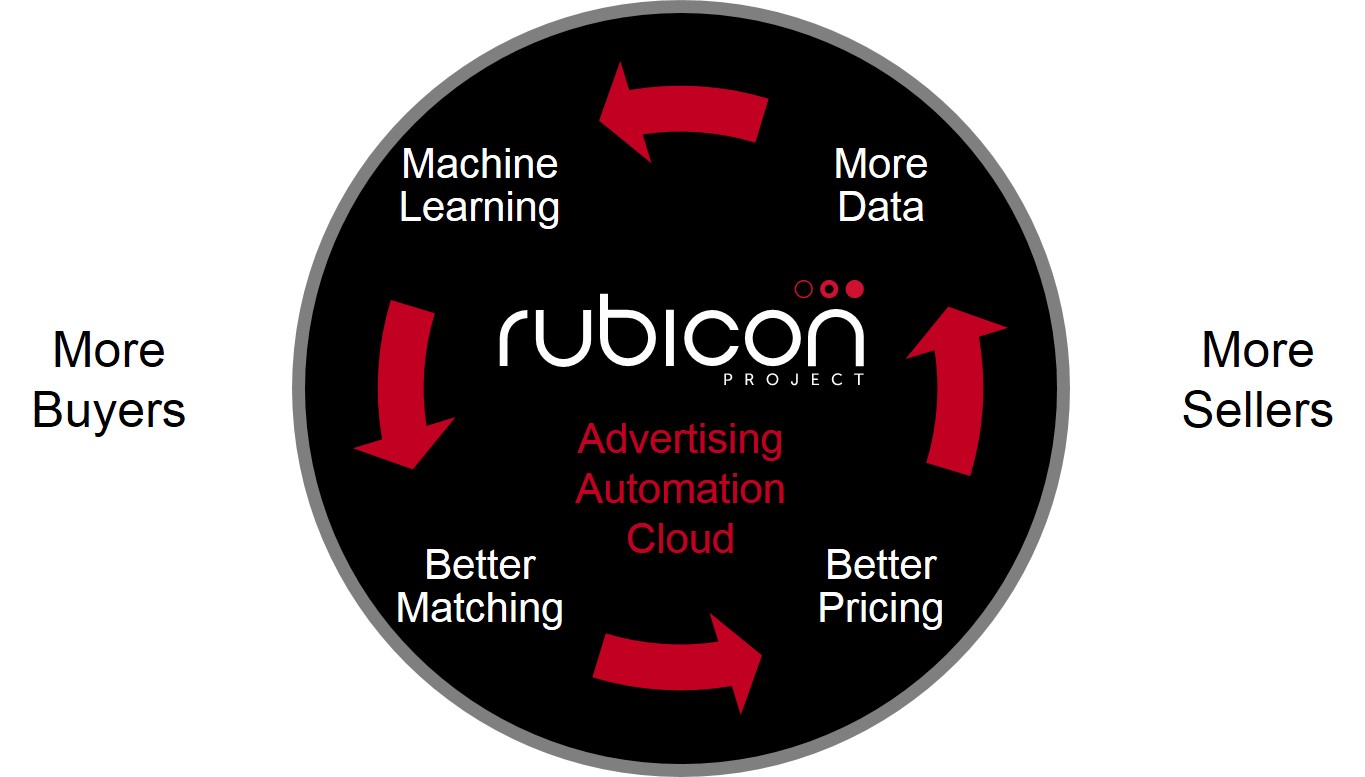
We bring value to both buyers and sellers through the dual network effects created by our solution—large volumes of data lead to better matching, which attracts more buyers and sellers, leading to more data. We have one of the largest digital advertising data repositories in the world, which puts us in a unique position to develop differentiated insights to help both buyers and sellers. Our solution is constantly self-optimizing based on our ability to analyze and learn from vast volumes of data. As our Advertising Automation Cloud processes more volume on our automated platform in the form of bid requests, user visits, events and transactions, we accumulate more data. This additional data helps make our machine-learning algorithms more intelligent and this leads to higher-quality matching between buyers and sellers, leading to better return on investment for buyers and higher revenue for sellers. As a result of that high-quality matching, we attract even more sellers, which in turn attracts more buyers and vice versa. We believe this self-reinforcing dynamic creates a strong platform for growth.
9
Critical Position in Digital Advertising Ecosystem
Our Advertising Automation Cloud and the applications we provide for buyers and sellers are a critical element of the digital advertising ecosystem. We have direct relationships and integrations with sellers of inventory. In order to maximize the monetization of their advertising inventory through our platform, sellers integrate with our seller applications, train their teams to use our platform for planning and executing campaigns, and automate their workflow to leverage our platform. We believe that there are few market participants that are directly integrated with sellers in a way that allows sellers to make a full range and volume of their advertising inventory readily available in the marketplace. Sellers use our platform to access actionable insights from the data we have amassed and to consolidate and compile payments and billing. The selling, planning, training integration, and optimization period for each seller requires an investment of time and effort. Once integrated, we believe sellers would experience high switching costs to move large volumes of their inventory to a new platform, likely lost monetization while new algorithms relearn data characteristics, and may require multiple platforms to replace our comprehensive solution. At the same time, buyers leverage our platform to manage their advertising spending, simplify order management and campaign tracking, attain actionable insights, and get access to impression level purchasing from hundreds of sellers. We believe that buyers need our platform to take advantage of our direct relationships and integrations with some of the world’s largest sellers. The benefits we provide to both buyers and sellers, and the time and effort spent by both buyers and sellers to integrate with our applications, give Rubicon Project a critical position in the digital advertising ecosystem. As a result, we have historically been successful in growing our seller base.
Platform Applications
To enhance the value our Advertising Automation Cloud brings to the marketplace, we offer a number of applications to address the critical needs of buyers and sellers:
Applications for Sellers.
We have direct relationships and integrations with the sellers on our platform. Our user interface offers key time savings features and granular reporting and analytics capabilities that help sellers optimize the use of our platform to fit their needs. Our solution includes applications to help them increase their digital advertising revenue, reduce costs, protect their brands and user experience, and reach more buyers efficiently to increase digital advertising revenue by monetizing their full variety and volume of inventory.
Sellers realize the following benefits from our platform:
|
•
|
Maximized Revenue for a Broad Range of Digital Advertising Inventory Without Volume or Geographic Constraints.
We provide applications that help a seller monetize a broad base of advertising inventory with virtually no constraints on the type or volume of inventory that can be sold or the number or location of potential buyers. While offering to take a wide variety and volume of inventory, we are also able to process it effectively, both from a speed perspective and from a price optimization standpoint.
|
10
|
•
|
Automated Sales with Leading Buyers Via RTB, Static Bidding, and Orders.
Through our solution, sellers gain instant access to the world’s largest automated digital advertising buyers, including approximately 400 DSPs and ad networks. Our platform offers sellers significant flexibility by enabling them to sell their advertising inventory in an automated fashion on an impression-by-impression basis, such as with RTB, in bulk, or in orders pursuant to arrangements directly between the seller and the buyer.
|
|
•
|
Integrated Solution for Digital Advertising Needs.
We provide sellers with a single web-based interface which serves as their central location to manage, analyze and maximize digital advertising spending from hundreds of different buyers via orders, RTB or static bidding. This centralized view allows sellers to cost-effectively optimize monetization, control workflow, run analytics, and perform other critical functions. Our solution provides monetization for most inventory placements (orders, RTB, and static bidding), advertising units (video, native, and display), and platforms (desktop and mobile).
|
|
•
|
Significantly Streamlined Sales, Operations, and Finance Workflow.
Our platform streamlines the management of digital advertisement sales by aggregating demand and providing a suite of software applications that automate the process of making inventory available for sale. Our expansive marketplace allows sellers to connect quickly and efficiently with tens of thousands of brands. Additionally, we provide a web interface that transforms time consuming and manual order entry and processing, across orders, RTB, or static bidding, into an automated process.
|
|
•
|
Security for Brand and User Experience.
Our platform is designed to ensure that advertisements shown on a seller website or application conform to the seller’s guidelines, which specify what advertisers, type of product, or type of advertisement may not be shown on the seller’s website or application. Our systems scan all advertisements to verify, in real time, that each advertisement is appropriate for the seller and conforms to our platform-wide advertising quality requirements.
|
|
•
|
Advanced Reporting and Analytics and Actionable Insights.
We have developed a robust set of reporting features that sellers can access and use to analyze the vast array of data we collect for them. We provide sellers with actionable insight in order to leverage that data. Using our analytics, sellers can readily gather impression data, yield optimization data, brand security data and pricing data needed to manage their digital business effectively.
|
|
•
|
Consolidated Payments and Transparent Tracking and Billing System.
We provide consolidated billing and collection for sellers who would otherwise be required to dedicate additional resources to cost-effectively manage financial relationships with a large base of buyers.
|
Applications for Buyers.
Buyers leverage our applications to access a large audience and to purchase advertising inventory based on their key demographic, economic, and timing criteria. These applications help streamline a buyer’s purchasing operations, increase the efficiency of its spending and the effectiveness of its advertising campaigns. Buyers can execute highly automated campaigns and take advantage of unique targeting data and optimization technology that is provided by our platform. Buyers are also able to use unified reporting and analytics through our buyer-user interface that has been designed to specifically address buyer preferences.
Buyers realize the following benefits from our platform:
|
•
|
Direct Access to a Global Audience and Hundreds of Premium Sellers.
By leveraging our platform, buyers can reach approximately 600 million Internet users globally, including over 50% of the U.S. comScore 100 sellers. Furthermore, unlike many organizations in the digital advertising industry, we have direct relationships with sellers and can enable buyers to circumvent a multistep, expensive, and inefficient process to connect to the seller.
|
|
•
|
Flexible Access to Inventory.
Our platform allows buyers to purchase advertising inventory in their preferred manner, whether by RTB, static bidding, or orders. Our solution also has the flexibility to allow buyers to integrate their purchases on our platform through their existing buying technologies or to buy directly through our platform.
|
|
•
|
Optimized Return on Investment by Consolidating Spending on One Platform.
By concentrating more of their spending on our platform, buyers can construct a larger data set specific to our platform, which results in superior targeting and more effective campaigns over time. They also benefit from our machine-learning algorithms, which are constantly analyzing their data in order to improve the effectiveness of their campaigns. Our solution provides access to most inventory placements (orders, RTB, and static bidding), advertising units (video, native, and display), and platforms (desktop and mobile).
|
|
•
|
Simplified Order Management and Campaign Tracking.
By eliminating most manual steps, our applications enable buyers to efficiently manage their digital campaigns and significantly reduce the time it would otherwise take to effectively execute their digital advertising programs.
|
11
|
•
|
Transparency and Control Over Advertising Spending.
Our platform is designed to be transparent and let buyers know and control where their dollars are being spent. Buyers can easily navigate through our interface to choose the list of sellers they want to purchase inventory from and see an indicative price range that they should expect to pay.
|
|
•
|
Brand Security.
Our suite of brand-security technologies and premium seller base ensure buyers that their advertisements will appear in an environment they have pre-approved.
|
|
•
|
Inventory Quality.
We provide systems and processes to detect and minimize questionable inventory, such as non-human traffic.
|
Our Market Opportunity
We believe that important trends greatly enhance our market opportunity, namely the shift in advertising spending to digital advertising, the move towards automation, and the convergence of media across multiple channels.
Rapid Growth in Digital Advertising Spending
While media consumption and time spent by consumers have shifted relatively quickly from television, broadcast radio, and print to Internet, digital television, and mobile devices, the shift in advertising spending from analog and print to digital has lagged to date. This is consistent with historical patterns, in which audience adoption of new platforms has preceded the migration of advertiser spending, with that gap decreasing over time. The rapid growth in digital media consumption has driven growth in digital advertising spending, which is growing at a significantly faster rate than advertising spending on analog and print media. Furthermore, we believe that there will be continued expansion of digital advertising as advertising spending “catches up” to time spent on the Internet and mobile devices. According to the PwC Entertainment and Media Global Outlook: 2014-2018, display, mobile and video digital advertising are forecasted to grow from approximately $62 billion in 2014 to $100 billion in 2018, a 13% compounded annual growth rate, while television advertising is forecasted to grow from approximately $174 billion in 2014 to $215 billion in 2018, a 5% compounded annual growth rate. The continued growth in overall advertisement spending, and the shift in that spending to digital media to keep up with the migration of consumers, yield significant additional opportunities to monetize Internet and mobile traffic.
Increasing Demand for Automation and Real Time Purchase and Sale of Advertising
According to Magna Global (September 2014), the global RTB market will grow from $9.2 billion in 2014 to $28.9 billion by 2018, a compounded annual growth rate of 33%. RTB is just one aspect of advertising automation; other forms of advertising transactions, such as orders and static bids, can also benefit significantly from automation.
Trend Towards Automation of Analog and Print Advertising Markets
Over time, we also expect analog and print advertising markets to automate, and we view our long-term mission, and opportunity, as the automation of the buying and selling of all advertising. We believe buyers want to be able to reach users across multiple channels and to have a platform that can unify their advertising spending. Consumption patterns for television are changing, with viewers migrating to digital platforms and using multiple devices to view video programming. According to comScore, television viewership is increasingly moving to the Internet, with 45% of 18-34 year olds watching television via the Internet, along with 29% of 35-54 year olds and 17% of the 55+ age group (comScore, "The US Total Video Report," Oct 14, 2014). At the same time, as more content is being delivered to users digitally, television and Internet content are beginning to converge, blurring the historical distinctions between analog and print media and digital media, and requiring buyers to consider their advertising strategies over multiple media. We believe these trends give us the opportunity to automate a portion of the larger advertising market.
The need for automation of advertising will grow as complexity increases and as digital media continues to converge with analog and print media. While the market we serve today is the digital advertising market, we expect to be able to leverage our unique marketplace and technology to ultimately automate all of these markets and enhance the experience of buyers and sellers across the entire advertising ecosystem.
12
Competitive Strengths
We believe the following key strengths differentiate us from our competitors and strategically position us within the digital advertising marketplace:
|
•
|
Technology Platform with Differentiated Scalability and Real-Time Processing Speed
.
Our real-time Advertising Automation Cloud serves buyers and sellers by providing optimal execution of media trades. We have designed and deployed our proprietary high-volume transaction processing hardware, called Rubicube, and a distributed networking infrastructure, which we believe enable us to offer one of the fastest and most scalable digital advertising technology platforms in the industry. We estimate our cloud currently executes up to 3.5 million peak queries per second and approximately 18 billion transactions per week. The speed of our platform provides buyers and sellers with reduced latency, limited loss of perishable inventory, better matching, and increased efficacy of advertisements, which perform better the faster they are delivered. The scale of our platform supports the volume, diversity, and complexity of buyers’ bids on sellers’ advertising inventory, thereby increasing market liquidity and access, and achieving optimal pricing using our machine-learning algorithms.
|
|
•
|
Highly Evolved Machine-Learning Algorithms that Leverage Big Data.
We have developed proprietary highly sophisticated machine-learning algorithms that optimize pricing and sellers’ monetization of their inventory. These algorithms analyze billions of data points, enabling our solution to make 300 real-time data-driven decisions per transaction and process trillions of bid requests per month. Our big data also allows buyers to deploy sophisticated targeting options to maximize the impact of their advertising spending.
|
|
•
|
Dual Network Effects.
As we process more volume on our automated platform in the form of bid requests, events and transactions, we accumulate more data, such as pricing, geographic and preference information, data on how best to optimize yield for sellers, and more. This additional data helps make our machine-learning algorithms more intelligent and this leads to more effective matching between buyers and sellers. As a result, more buyers and sellers are attracted to our platform, from which we get more data, which further reinforces the network effect and thereby increases market liquidity, which benefits both buyers and sellers.
|
|
•
|
Direct Relationships and Integrations with High-Quality Sellers.
Our Advertising Automation Cloud builds on our direct relationships and integrations with our seller base. We integrate our technology into their systems and have a direct financial relationship with them. Our teams also interact with sellers on an almost daily basis. This is a major distinction, as illustrated by our comScore reach, relative to many digital advertising companies who rely on our platform or third parties to access sellers and do not have direct relationships. We believe that these direct relationships and integrations make us a critical participant in the digital advertising ecosystem, and make our solution one that would be difficult and time consuming for sellers to replicate, resulting in low seller attrition. Our direct seller relationships also provide us with an existing sales channel through which to expand the functionality offered by our applications to include additional services, such as our solutions for automated orders and mobile applications.
|
|
•
|
Leading User Reach and Significant Scale.
Our reach of approximately 600 million Internet users globally enables us to provide buyers with the ability to execute their largest campaigns and easily reach their target audiences. The scale of our solution is evidenced by the amount of advertising spending transacted on our platform, as demonstrated by our managed revenue, which was
$667.8 million
for the year ended
December 31, 2014
.
|
|
•
|
Comprehensive Solution Covering All Types of Inventory and Demand.
We believe there are few participants in our market that are directly integrated with sellers in a way that allows them to make a full range and volume of advertising inventory readily available in the marketplace. We enable sellers to offer their inventory through several types of transactions, including RTB, static bidding, and orders. The availability of this wide range and volume of inventory, together with the multiple ways of purchasing, attracts a similarly wide variety of buyers, providing us access to not only buyers in the $9 billion global RTB market, but also to the entire $62 billion display, mobile, and video market. We believe we are well positioned to provide our solution to buyers and sellers as new platforms, such as satellite, cable, smart TV, and set-top boxes, become available for the automation of advertising.
|
|
•
|
Scalable Business Model.
As we bring buyers and sellers onto our platform, they transact in an automated fashion without additional sales and marketing efforts from us. This allows us to grow the managed revenue on our platform without a proportional increase in our sales and marketing expenses.
|
13
|
•
|
Brand Security.
We believe we are able to uniquely incorporate brand security for both buyers and sellers in a manner that allows them to buy and sell inventory safely despite the challenges presented by the volume of content and dynamic nature of digital advertising. Buyers and sellers are concerned about being associated with content they view as inappropriate, competitive or inconsistent with their advertising themes. As sellers try to make their inventory available to a wider group of buyers, and buyers extend their reach in pursuit of target audiences, the importance of brand security and the effort necessary to screen buyers and inventory for brand appropriateness increases. Our platform has the business rules, scalability and speed necessary to ensure that we are able to provide a customizable brand-safe environment for both buyers and sellers.
|
|
•
|
Independence.
Some industry participants have incentives to isolate their viewers and deploy specialized technology for their audiences, making buyers dependent on them to reach the users of their particular websites, applications, devices, or other hardware. In addition, those participants have their own owned and operated properties to which they have an incentive to give preferred treatment, which can lead to sub-optimal pricing and access for others in the market. We believe our independent market position enables us to better serve buyers and sellers because we are not burdened with any structural conflicts.
|
|
•
|
Orders.
Our work flow capabilities and automation of premium inventory enable sales teams to exponentially increase their productivity by using data and workflow applications to process more sales of inventory at optimal prices. Workflow capabilities enable buyers and sellers to communicate directly and use shared data to execute campaigns. These capabilities support sales functions rather than replacing them, enhancing their adoption without friction. A significant amount of television advertising is purchased and sold on a guaranteed basis; therefore, we believe that our guaranteed orders capabilities will help position us to automate the purchase and sale of television advertising.
|
Growth Strategies
The core elements of our growth strategy include:
|
•
|
Growing Our Business with Existing Buyers and Attracting New Buyers to Our Platform.
We believe we can attract a greater portion of buyers’ spending by continued improvement of our matching and pricing algorithms as well as enhanced features, functionality, and service of our solution. We see an opportunity with existing buyers to offer them additional inventory to make buying more efficient on our platform. We plan to invest in our sales organization to drive increased spending by existing buyers on our platform and to attract new buyers to our platform.
|
|
•
|
Increasing Penetration of Existing Sellers and Attracting New Sellers.
We see an opportunity to increase the share of seller inventory that we currently monetize by enhancing our cloud and applications, offering additional applications, and increasing our relationships with buyers and sellers that engage in orders relationships through our solution. In addition, we expect to benefit generally from the growing adoption of automation for sales of advertising inventory. We also see an opportunity to form relationships with new sellers for which our platform offers the best solution for monetizing their digital advertising inventory.
|
|
•
|
Enhancing Our Leadership Position by Investing in Innovation and Expansion.
We intend to build upon our current technology and extend our market leadership through innovation. Our investments will focus on improving our machine-learning algorithms, expanding further into mobile and video, data analytics, audience extension, API integration, building additional features to extend further into order management, building self-service capabilities for buyers and sellers, and enhancing and expanding our current server infrastructure.
|
|
•
|
Building Our Orders Business.
A significant portion of premium inventory is purchased and sold on a guaranteed basis. We believe that some sellers will continue to rely on their own sales forces for sales of premium inventory, but will benefit from automation to better price, match and place campaigns, and to automate manual operations such as ad trafficking, quality assurance, and billing and collections. We have invested in workflow capabilities and automation of premium inventory transactions to enable sales teams to increase their productivity and process more sales of inventory at optimal prices. Workflow capabilities enable buyers and sellers to communicate directly and use shared data to execute campaigns. These capabilities support sales functions rather than replacing them, enhancing their adoption without friction. We plan to build upon these investments to capitalize upon the growth we anticipate in the market for automation of direct transactions. In addition, we believe that our guaranteed orders capabilities will help to position us to automate the purchase and sale of television advertising.
|
14
|
•
|
Expanding Our Buyer Offerings.
The various buyers in the market, including brand advertisers, agencies, ATDs, ad networks and DSPs, utilize a variety of inventory placements to purchase inventory. Our offering covers all primary forms of digital inventory placement, giving us the ability to serve all buyers. We intend to expand our relationships across all buyer types and inventory placements. We plan to utilize our offerings that facilitate the direct processing of transactions between buyers and sellers to increase our participation in the direct purchase of premium inventory by agencies and their advertisers through our orders business.
|
|
•
|
Accelerating Our Global Expansion and Entering New Markets.
We currently operate globally from our offices in nine countries. We believe we can extend our marketplace platform through international expansion to help automate and improve advertising for buyers and sellers globally. We recently initiated operations in Japan and we intend to grow our market share in our existing international markets. We also plan to expand our operations in Asia and Latin America.
|
|
•
|
Bringing Automation to Additional Media.
Historically, our solution has focused on display advertising. We believe, however, that television and other analog and print media will eventually converge with existing digital platforms, creating opportunities for us to expand our solution beyond digital media to analog and print media, such as television, radio, and magazines. We intend to extend our solution to track this convergence and support increasingly complex volumes of advertisements spanning multiple media. Our combined offering of inventory placements and ad units may be packaged for multiple distribution platforms, including mobile, desktop and television (satellite, cable, smart TV, and set-top box). We intend to accelerate our expansion in mobile for both mobile web and applications and to build the foundation to automate television advertising. In addition to platform expansion, we intend to extend beyond our current capabilities for display, native, and video to other forms of advertising units as they may arise.
|
Buyers Using Our Solution
Buyers purchase digital advertising inventory in the marketplace powered by our Advertising Automation Cloud. Buyers include DSPs, ad networks and ATDs, which act as representatives of advertising agencies and advertisers that direct advertising spending. Recently, we have introduced our buyer-focused offerings that allow buyers to buy inventory directly using our solution and reach sellers directly through our marketplace. These applications include important workflow functionality, essential for managing spend and effectively reaching sellers on an automated basis. Collectively, these buyers have purchased advertising for tens of thousands of unique brands on our platform. Because our buyer base consists of a broad range of DSPs, ad networks, and ATDs, we do not expect significant increases or decreases in the overall number of buyers using our solution, but we expect the average spending per buyer to increase over time as buyers continue to increase their use of our solution. Average managed revenue per buyer on our platform has grown considerably over our history, as depicted below:

15
We attract a wide variety of buyers in part because our solution allows buyers to execute purchases in a variety of ways, including RTB, static bidding, and orders. RTB is the fastest growing area of our business. Managed revenue attributable to RTB grew 71% from 2013 to 2014.

Sellers Using Our Solution
We have direct relationships and integrations with sellers in over 40 countries. In the United States, we have relationships with over 50% of the comScore 100. We consider organizations within the same corporate structure as one seller. We are continuing to build on our international reach, including through recent establishment of operating presence and buyer and seller relationships in Latin America and Asia.
Our Technology
To support our solution, we have developed a network of remote servers hosted on the Internet that run our proprietary software, including analytics and decision-making algorithms, and store, manage, and process rules set by buyers and sellers and data about demographics, economics, timing, and preferences. We have specially engineered a high-volume transaction processing hardware, called the Rubicube, that provides significant scale and is programmed for high-frequency, low-latency trading. This infrastructure is supported by a real-time data pipeline, a system that quickly moves volumes of data generated by our business into reporting systems that allow usage both internally and by buyers and sellers, and a 24-hour Network Operations Center, which provides failure protection by monitoring and rerouting traffic in the event of equipment failure or network performance issues between buyers and our marketplace.
We estimate that our Advertising Automation Cloud currently executes up to 3.5 million peak queries per second and averages approximately 18 billion transactions per week, and since 2012, we have transacted approximately 100 trillion bid requests. It utilizes over 35,000 central processing units, which read and execute our program instructions. In addition, our Advertising Automation Cloud supports 300 gigabytes of data transfer per second and stores more than 3.6 petabytes of data, backed by our globally distributed infrastructure hosted at data centers in the U.S., Europe, and Asia. We lease data center capacity on market standard terms pursuant to leases expiring between February 2015 and December 2017. We believe that having a distributed infrastructure is useful to reduce latency. We regularly change and add data center capacity to support growth and to find the best pricing and locations for our business. We are not dependent on any single provider of data center capacity and we believe that, if we require additional data center capacity, or if a contract with a data center terminates unexpectedly, we will be able to obtain additional capacity on commercially reasonable terms and within a relatively short time period.
16
Our infrastructure provides buyers and sellers with reduced latency, while the scale of the infrastructure supports the volume, diversity, and complexity of buyers’ bids on sellers’ advertising inventory, which increases market liquidity and achieves optimal pricing using our machine-learning algorithms. Our platform’s architecture allows for additional scale through enhancements and additions to the infrastructure, which enables us to better evolve and adapt to the demands of buyers and sellers and remain competitive in the marketplace.
Our proprietary data-driven machine-learning algorithms enable our solution to make decisions that maximize revenue for sellers and improve return on investment for buyers. These algorithms combine and analyze multiple types of data and enable our systems to execute over 45 million decisions per second, all in time to allow transactions to be executed in milliseconds.
Decisions processed through these algorithms relate to the following types of data:
|
•
|
Pricing Metadata
—We provide information on historical pricing, bids, buyer type and buyers to determine auction winners between RTB and static bidding. This data includes approximately 5 trillion bid requests per month, 3.5 million peak bids per second and data from tens of thousands of brands and all major DSPs, ad networks and ATDs;
|
|
•
|
Audience Data
—We reach approximately 600 million Internet users globally on a monthly basis. We have direct relationships with over 50% of the top 100 U.S. sellers as ranked by comScore in terms of reach. This reach provides us with a large volume of data about users and audiences, such as pricing of advertisements, historical clearing prices, bid responses, what types of ads are allowed on a particular website, which sellers’ websites a buyer prefers, what ad formats are available to be served, advertisement size and location, where a user is located, what users a buyer wants to target, how many ads the user has seen, browser or device information, and sellers’ proprietary data about users.
|
Auction and security algorithms use matchmaking algorithms with both historical and real time data to drive automated decision-making processes.
Pricing algorithms perform the following functions, among many others:
|
•
|
Impression Profiling
—Determines key data related to the impression, such as demographic data, geographic data and historical data to send to potential bidders and collect for reporting and analysis by buyers and sellers.
|
|
•
|
Algorithmic Pricing
—Adjusts pricing for impressions based on historical bidding activity and valuation signals to increase marketplace liquidity.
|
|
•
|
Rules Management
—Ensures adherence to seller rules that set minimum prices for advertising inventory, determine which buyers are eligible to purchase advertising, identify buyers and categories of advertisements that are not allowed on a seller’s website, application or other digital media property, and specify security and other criteria.
|
Proprietary protection technologies we have developed include:
|
•
|
Helix
—Captures and catalogs the thousands of advertising creatives (the graphics used for the advertisement) that flow through our systems every day, which our quality team reviews using our advertising quality management applications.
|
|
•
|
Protective Screening
—Helps protect sellers and users from malware (software that can infect computers with malicious software), checks each advertisement delivered through our solution for the presence of any malicious or questionable activity or characteristics, stops unsanctioned advertisements, and reduces recurrence.
|
|
•
|
AdCheq
—Provides reviews of advertisements, creating multiple reviews of each. These creatives are categorized and associated with buyers and industries so that our systems can automatically enforce each seller’s specific advertisement quality policies.
|
|
•
|
Brand Security Dashboard
—Provides visibility into quality-related activity, showing how different buyers behave relating to advertisement quality, details on the level of malware threats, and data leakage reporting (shows questionable activity related to third parties gathering data on their inventory).
|
|
•
|
Traffic Quality Monitoring
—Monitoring of traffic to minimize the incidence of non-human traffic or other inappropriate traffic.
|
|
•
|
Vantage
—An extension for Web browsers that lets sellers monitor ads served in context on their sites, providing insight, diagnostic applications, and ad-quality controls.
|
17
|
•
|
Creative Approval API
—A programmatic interface that sellers can use to retrieve a comprehensive set of individual advertising creatives that have bid or served on their sites, and instruct our delivery systems to approve or reject those creatives for future impressions.
|
Bid efficiency algorithms provide bid prediction (which buyers are most likely to bid on a given impression) and throttling (the volume of bid requests a given buyer can process), to optimize infrastructure load and execute transactions in the most timely manner possible by only sending bid requests to those buyers of advertising inventory who can handle the volume and are likely to respond.
Technology and Development
Innovation is key to our success. We have developed a research and development center designed for innovation for which we continue to invest. In addition, our core technology and development team is responsible for the design, development, maintenance, and operation of our platform. Our technology and development process emphasizes frequent, iterative, and incremental development cycles, and we typically release improvements and new features weekly. Within the technology and development team, we have several highly aligned, independent sub-teams that focus on particular features of our platform. Each of these sub-teams includes engineers, quality assurance specialists, and product developers responsible for the initial and ongoing development of each sub-team’s feature. In addition, the technology and development team includes our technical operations sub-team, which is responsible for the performance and capacity of our platform. While our sub-teams operate independently, the combined work is coordinated by our project management team, which manages dependencies and optimizes the schedule of the entire team towards common goals.
Technology and development expenses are included in both cost of revenue and technology and development on our consolidated statement of operations. These combined expenses were
$43.5 million
,
$34.0 million
and
$25.5 million
for the years ended December 31, 2014, 2013 and 2012, respectively. We believe that continued investment in our platform, including its technologies and functionalities, is critical to our success and long-term growth. We therefore expect technology and development expenses to increase as we continue to invest in technology infrastructure to support an increased volume of advertising spending on our platform and international expansion, as well as to expand our engineering and technology teams to maintain and support our technology and development efforts. We also intend to invest in new and enhanced technologies and functionalities to enhance our platform and further automate our business processes with the goal of enhancing our future profitability.
Sales and Marketing
We sell our solution to buyers and sellers through our global direct sales team, which operates from various locations around the world. This team leverages its market knowledge and expertise to demonstrate the benefits to buyers and sellers of advertising automation and our solution. We deploy a professional services team with each seller integration to ensure that a seller extracts the most value from our solution. We are focused on managing our brand, increasing market awareness, and generating new advertising campaigns. To do so, we often present at industry conferences, create custom events, and invest in public relations. In addition, our marketing team advertises online, in print, and in other forms of media, creates case studies, sponsors research, authors whitepapers, publishes marketing collateral, generates blog posts and undertakes customer research studies.
Our Competition
Our industry is highly competitive and fragmented. We compete for buyer spending against many digital media companies, including Google. We compete for advertising inventory with SSPs and advertising exchanges, also including Google. As we introduce new offerings, as our existing offerings evolve, or as other companies introduce new products and services, we may be subject to additional competition.
We compete for advertising spending and seller inventory made available on our platform. Our product must remain competitive in terms of scope, ease of use, scalability, speed, brand security, customer service, and other technological features that assist buyers in increasing the return on their advertising investment. We compete for digital advertising inventory based on our ability to maximize the value of sellers’ inventory, provide the greatest array of product components covering their various inventory types, and increase fill rates. While our industry is evolving rapidly and becoming increasingly competitive, we believe that our solution enables us to compete favorably on the factors described above.
Our Team and Culture
Our management team consists of founders of ad serving and paid search companies, as well as RTB pioneers, and our team draws from a broad spectrum of experience, including data science, artificial intelligence, machine-learning algorithms, auctions, infrastructure, and software development.
18
We focus heavily upon developing and maintaining a company culture that supports our goals, and we manage our culture like a product, with a dedicated product manager, budget, measurement, and roadmap. We have a goal of building and growing a truly unique company, focused on the automation of advertising and solving problems through innovation, both internally and for buyers and sellers, to help deliver value. We strive to make our company an exciting place to work, not just a “job.” We have a culture committee whose members rotate every quarter and include representation from across the company, both by function and geography, to ensure a comprehensive perspective. We reward team and individual excellence and constantly strive to build a stronger, more innovative team and a consistent culture across all our locations.
As of
December 31, 2014
, we had
470
employees, of whom
382
are in the United States.
Our Intellectual Property
Our proprietary technologies are an important component of our success, and we rely upon trade secret, trademark, copyright, and patent laws in the United States and abroad to establish and protect our intellectual property and protect our proprietary technologies.
We have four active U.S. patents, as described below. Additionally, we have seven pending non-provisional applications in the United States and two pending non-U.S. applications. None of these patents has been litigated and we are not licensing any of the patents. Their importance to our business is uncertain and there are no guarantees that any of the patents will serve as protection for our technology or market in the United States or any other country in which an application has been filed. U.S. Patent No. 8,554,683, titled Content Security for Real-Time Bidding, was filed January 7, 2011, issued October 8, 2013, and expires on June 18, 2028. U.S. Patent No. 8,472,728, titled System and Method for Identifying and Characterizing Content within Electronic Files Using Example Sets, was filed October 30, 2009, issued June 25, 2013, and expires on June 7, 2031. U.S. Patent No. 8,473,346, titled Ad Network Optimization System and Method Thereof, was filed September 1, 2009, issued June 25, 2013, and expires on February 12, 2031. U.S. Patent No. 8,831,987, titled Managing Bids in a Real-Time Auction for Advertisements, was filed on April 20, 2011, issued September 9, 2014, and expires December 18, 2027.
We register certain domain names, trademarks and service marks in the United States and in certain locations outside the United States. We also rely upon common law protection for certain trademarks. We generally enter into confidentiality and invention assignment agreements with our employees and contractors, and confidentiality agreements with parties with whom we conduct business, in order to limit access to, and disclosure and use of, our proprietary information. We also use measures designed to control access to our technology and proprietary information. We view our trade secrets and know-how as a significant component of our intellectual property assets, which we believe differentiate us from our competitors.
Any impairment of our intellectual property rights, or any unauthorized disclosure or use of our intellectual property or technology, could harm our business, our ability to compete and our operating results.
Regulation
Interest-based advertising, or the use of data to draw inferences about a user’s interests and deliver relevant advertising to that user, has come under increasing scrutiny by legislative, regulatory, and self-regulatory bodies in the United States and abroad that focus on consumer protection or data privacy. In particular, this scrutiny has focused on the use of cookies and other technology to collect or aggregate information about Internet users’ online browsing activity. Because we, and our customers, rely upon large volumes of such data collected primarily through cookies, it is essential that we monitor developments in this area domestically and globally, and engage in responsible privacy practices, including providing consumers with notice of the types of data we collect and how we use that data to provide our services.
We provide this notice through our privacy policy, which can be found on our website at http://www.rubiconproject.com/privacy. As stated in our privacy policy, we do not collect information, such as name, address, or phone number, that can be used directly to identify a real person, and we take steps not to collect and store such personally identifiable information from any source. Instead, we rely on non-personally identifiable information about Internet users and do not attempt to associate this data with other data that can be used to identify real people. However, the definition of personally identifiable information, or personal data varies by country, and continues to evolve in ways that may require us to adapt our practices to avoid violating laws or regulations related to the collection, storage, and use of consumer data. For example, some European countries may consider IP addresses or unique device identifiers to be personal data subject to heightened legal and regulatory requirements. As a result, our technology platform and business practices must be assessed regularly in each country in which we do business.
19
There are also a number of specific laws and regulations governing the collection and use of certain types of consumer data relevant to our business. For example, the Children’s Online Privacy Protection Act, or COPPA, imposes restrictions on the collection and use of data about users of child-directed websites. To comply with COPPA, we have taken various steps to implement a system that: (i) flags seller-identified child-directed sites to buyers, (ii) limits advertisers’ ability to serve interest-based advertisements, (iii) helps limit the types of information that our advertisers have access to when placing advertisements on child-directed sites, and (iv) limits the data that we collect and use on such child-directed sites.
Additionally, our compliance with our privacy policy and our general consumer privacy practices are also subject to review by the Federal Trade Commission, which may bring enforcement actions to challenge allegedly unfair and deceptive trade practices, including the violation of privacy policies and representations therein. Certain State Attorneys General may also bring enforcement actions based on comparable State laws. Outside of the United States, our privacy and data practices are subject to regulation by data protection authorities and other regulators in the countries in which we do business.
Beyond laws and regulations, we are also members of self-regulatory bodies that impose additional requirements related to the collection, use, and disclosure of consumer data, including the Internet Advertising Bureau, or IAB, the Digital Advertising Alliance, the Network Advertising Initiative, and the Europe Interactive Digital Advertising Alliance. Under the requirements of these self-regulatory bodies, in addition to other compliance obligations, we provide consumers with notice via our privacy policy about our use of cookies and other technologies to collect consumer data, and of our collection and use of consumer data to deliver interest-based advertisements. We also allow consumers to opt-out from the use of data we collect for purposes of interest-based advertising through a mechanism on our website, linked through our privacy policy.
Business Seasonality
Our managed revenue, revenue, cash flow from operations, operating results and other key operating and financial measures may vary from quarter to quarter due to the seasonal nature of buyer spending. For example, many buyers devote a disproportionate amount of their advertising budgets to the fourth quarter of the calendar year to coincide with increased holiday purchasing. We expect our revenue, cash flow, operating results and other key operating and financial measures to fluctuate based on seasonal factors from period to period and expect these measures to be higher in the fourth quarters than in prior quarters.
Available Information
The Company’s Annual Report on Form 10-K, Quarterly Reports on Form 10-Q, Current Reports on Form 8-K, and amendments to reports filed pursuant to Sections 13(a) and 15(d) of the Securities Exchange Act of 1934, as amended, or the Exchange Act, are filed with the Securities and Exchange Commission, or the SEC. The Company is subject to the informational requirements of the Exchange Act and files or furnishes reports, proxy statements and other information with the SEC. Such reports and other information filed by the Company with the SEC are available free of charge on the Company’s website at investor.rubiconproject.com as soon as reasonably practicable after such materials are filed with or furnished to the SEC. The public may read and copy any materials filed by the Company with the SEC at the SEC’s Public Reference Room at 100 F Street, NE, Washington, DC 20549. The public may obtain information on the operation of the Public Reference Room by calling the SEC at 1-800-SEC-0330. The SEC maintains an Internet site that contains reports, proxy and information statements and other information regarding issuers that file electronically with the SEC at www.sec.gov. The contents of these websites are not incorporated into this Annual Report on Form 10-K or into any other report or document we file with the SEC, and any references to the URLs for these websites are intended to be inactive textual references only.
Investing in our common stock involves a high degree of risk, including but not limited to the risks described below, each of which may be relevant to decisions regarding an investment in or ownership of our stock. The occurrence of any of these risks could have a significant adverse effect on our reputation, business, financial condition, results of operations, growth and ability to accomplish our strategic objectives and could cause the trading price of our common stock to decline. You should carefully consider the risks set forth below and the other information contained in this report, including our consolidated financial statements and related notes and Management’s Discussion and Analysis of Financial Condition and Results of Operations, before investing in our common stock. However, this report cannot anticipate and fully address all possible risks of investing in our common stock, and the risks of investing in our common stock may change over time, new risks may emerge, and different risks may be more prominent at different times. Accordingly, you are advised to consider additional sources of information and exercise your own judgment in addition to the information we provide. We have organized the description of these risks into groupings in an effort to enhance readability, but many of the risks interrelate or could be grouped or ordered in other ways, so no special significance should be attributed to the groupings or order below.
20
Risks Relating to Our Business, Growth Prospects and Operating Results
We must grow rapidly to remain a market leader and to accomplish our strategic objectives. If we fail to grow, or fail to manage our growth effectively, the value of our company may decline.
The advertising technology market is dynamic, and our success depends upon the continued adoption of advertising automation and our ability to develop innovative new technologies and solutions for the evolving needs of sellers of advertising, including websites, applications and other digital media property owners, and buyers of advertising. We also need to grow significantly and expand the scope of our offering in order to develop the market reach and scale necessary to compete effectively with large competitors. This growth depends to a significant degree upon the quality of our strategic vision and planning. The advertising market is evolving rapidly, and if we make strategic errors, there is a significant risk that we will lose our competitive position and be unable to recover and achieve our objectives. Our ability to grow requires access to, and prudent deployment of, capital for hiring, expansion of physical infrastructure to run our solution, acquisition of companies or technologies, and development and integration of supporting sales, marketing, finance, administrative, and managerial infrastructure. Further, the rapid growth we are pursuing will itself strain the organization and our ability to continue that growth and to maintain the quality of our operations. If we are not able to innovate and grow successfully, the value of the company may be adversely affected.
In order to meet our growth objectives, we will need to rely upon our ability to innovate, the continued adoption of our solution by buyers and sellers for higher value advertising inventory, the extension of the reach of our solution into evolving digital media, continued growth into new geographic markets, and the implementation of new offerings.
Historically, the real-time auction of lower value display advertising has been the largest portion of the business transacted through our solution. While we expect that market to continue to be attractive for us, we believe growth opportunities in other areas of digital advertising are important. Our growth plans depend upon our ability to innovate, attract buyers and sellers to our solution for purposes of buying and selling higher value inventory, expand the scope of our solution and its use by buyers and sellers utilizing other digital media platforms and advertising units, such as mobile and video. Our growth plans also depend on our ability to further increase our business in new international markets, and effectively drive increasing automation in the advertising industry through implementation of new offerings, such as private marketplace. In order to innovate successfully, we must hire, train, motivate and retain talented engineers in a competitive recruiting environment, and we must deploy them based on the development priorities we establish in light of our view of the future of our industry. Mobile, video, and other emerging digital platforms require different technology and business expertise than display advertising, and also present other challenges that may be difficult for us to overcome, including inventory quality issues. Many of our competitors in these emerging platforms have a significant head start in terms of technology and buyer or seller relationships. Our business model may not translate well into higher-value advertising due to market resistance or other factors, and we may not be able to innovate quickly or successfully enough to compete effectively on new platforms, or to adapt our solution and infrastructure to international markets. New offerings may not correctly anticipate market demand, may not address demand as effectively as competing offerings, and may not deliver the results we expect.
21
Our technology development efforts may be inefficient or ineffective, which may impair our ability to attract buyers and sellers.
Our future success will depend in part upon our ability to enhance our existing solution, to develop and introduce competing new solutions in a timely manner with features and pricing that meet changing client and market requirements, and to persuade buyers and sellers to adopt our new solutions. New elements of our offering must compete with established competitors and may require significant investment in development and marketing to achieve parity, and buyers and sellers may not be ready to adopt new solutions we acquire or develop. We schedule and prioritize these development efforts according to a variety of factors, including our perceptions of market trends, client requirements, and resource availability. We face intense competition in the marketplace and are confronted by rapidly changing technology, evolving industry standards and consumer needs, and the frequent introduction of new solutions by our competitors that we must adapt and respond to. Our solution is complex and requires a significant investment of time and resources to develop, test, introduce into use, and enhance. These activities can take longer than we expect. We may encounter unanticipated difficulties that require us to re-direct or scale-back our efforts and we may need to modify our plans in response to changes in buyer and seller requirements, market demands, resource availability, regulatory requirements or other factors. If development of our solution becomes significantly more expensive due to changes in regulatory requirements or industry practices, or other factors, we may find ourselves at a disadvantage to larger competitors with more resources to devote to development. These factors place significant demands upon our engineering organization, require complex planning and decision making, and can result in acceleration of some initiatives and delay of others. If we do not manage our development efforts efficiently and effectively, we may fail to produce, or timely produce, solutions that respond appropriately to the needs of buyers and sellers, and competitors may develop offerings that more successfully anticipate market evolution and address market expectations. If our solution is not responsive and competitive, buyers and sellers can be expected to shift their business to competing solutions. Buyers and sellers may also resist adopting our new solutions for various reasons, including reluctance to disrupt existing relationships and business practices or to invest in necessary technological integration or preference for competitors’ offerings or self-developed capabilities.
We must scale our technology infrastructure to support our growth and transaction volumes. If we fail to do so, we may lose buyers, sellers and revenue from transactions.
When a user visits a website or uses an application where our auctions technology is integrated, our technology must process a transaction for that seller and conduct an auction, often among hundreds of buyers and tens of thousands of advertiser brands, within milliseconds. Our technology must scale to process all of the advertising impressions from the collection of all of the visitors of all of the websites and applications offered on our platform combined. Additionally, for each individual advertising impression, our technology must be able to send bid requests to appropriate and available buyers on our platform. It must perform these transactions end-to-end at speeds often faster than the page or application loads for the user. In short, our technology needs to process the combined volume of every website and application and all of the buyers’ bidding technologies, which evolve over time, at speeds that are often faster than their capabilities. The addition of new services, support of evolving advertising formats, and overall growth also place increasing demands upon our technology infrastructure. We must be able to continue to increase the capacity of our platform in order to support substantial increases in the number of buyers and sellers, to support an increasing variety of advertising formats and platforms and to maintain a stable service infrastructure and reliable service delivery, all to support the network effect of our solution. If we are unable to effectively increase the scale of our platform to support and manage a substantial increase in the number of transactions, as well as a substantial increase in the amount of data we process, on a cost effective basis, while also maintaining a high level of performance, the quality of our services could decline and our reputation and business could be seriously harmed. In addition, if we are not able to continue processing these transactions at fast enough speeds or if we are unable to support emerging advertising formats or services preferred by buyers, we may be unable to obtain new buyers or sellers, we may lose existing buyers or sellers or we could lose revenue from failure to process auction transactions in a timely manner, any of which could cause our revenue to decline. We expect to continue to invest in our platform in order to meet increasing demand. Such investment may negatively affect our profitability and results of operations.
22
Our belief that there is significant and growing demand for private marketplace and automated guaranteed solutions may be inaccurate, and we may not realize a return from our investments in that area.
We believe there is significant and growing demand for private marketplace and automated guaranteed solutions, and we have made significant investments to meet that demand through internal development efforts and through acquisitions. We believe our technology will be embraced by the market and contribute in a meaningful way to our revenue growth. However, the market for these solutions is new and unproven and, as such, may not grow as we expect or at all, or it could have slow adoption rates. It is our expectation that private marketplaces and automated guaranteed solutions may involve lower fees, which may not be offset by anticipated higher CPMs. Even if the market for these solutions develops as we anticipate, buyers and sellers might not embrace our offerings to the degree we expect due to various factors. For example, we may not be successful in building out these offerings consistent with our vision, or competitive offerings may be offered at lower prices or be perceived as having better features and functionality. Even if the market for these solutions develops as we anticipate, and our buyers and sellers embrace our offerings, the positive effect of our private marketplace and automated guaranteed offerings on our results of operations may be negated by other adverse developments or by similar offerings from our competitors.
We have invested heavily in the mobile platform, which poses additional risks that did not affect our legacy display business. If mobile connected devices or any other devices, their operating systems, Internet browsers or content distribution channels, including those controlled by our competitors, develop in ways that make it difficult for advertisements to be delivered to their users, our ability to grow our business will be impaired.
We have invested heavily in the mobile platform and are relying upon that business to help fuel our continued growth. Because the mobile platform uses different methods of recording payable transactions, different data capture techniques, different buyer budgets, may require us to enter emerging markets in which we have less experience, including China, and involves development challenges imposed by differing technological requirements and standards, there can be no assurance that we will be successful in developing this market. Moreover, buyers’ desire to spend advertising money to reach consumers via the mobile platform may be less or evolve more slowly than expected. Our mobile investment has been focused on real-time bidding of mobile impressions, and that market may not grow as we expect. Our mobile revenue growth is largely dependent on the success of our new Exchange API technology, and there can be no assurance that this technology will work as anticipated, without costly bugs or errors.
Our success in the mobile channel depends upon the ability of our technology solution to provide advertising for most mobile connected devices, as well as the major operating systems or Internet browsers that run on them and the thousands of applications that are downloaded onto them. The design of mobile devices and operating systems or Internet browsers is controlled by third parties with whom we generally do not have any formal relationships. These parties frequently introduce new devices, and from time to time they may introduce new operating systems or Internet browsers or modify existing ones in ways that may significantly affect our business. Network carriers may also impact the ability to access specified content on mobile devices. If our solution is unable to work on these devices, operating systems or Internet browsers, either because of technological constraints or because a maker of these devices or developer of these operating systems or Internet browsers wished to impair our ability to provide advertisements on them or our ability to fulfill advertising inventory from developers whose applications are distributed through their controlled channels, our ability to generate revenue through the mobile platform could be significantly harmed.
Fee pressure may result in a reduction in spending on our platform or a reduction in the fees we are able to charge on our platform, which could have a material adverse effect on our business and reduce our take rate.
Our proprietary auction algorithms include a buyer fee for use of our technology, and we have typically charged buyers a variable price for real-time bidding impressions without specifying the amount or method of determination of the fee that is included in the price. We also charge fees to sellers for use of our technology, typically as a percentage of the cost of media. As is normal in most industries and companies, the introduction of new offerings requires different pricing rates or structures. Projecting a market’s acceptance of a new price or structure is imperfect and we may price too high or too low, both of which may carry adverse consequences. Although we believe our pricing is competitive, we experience requests for fee revisions from time to time or greater levels of pricing specificity. Sellers and potential sellers may also seek fee revisions. If large buyers or sellers, or large numbers of small buyers or sellers are able to compel us to charge lower fees, or provide fee concessions or refunds, we may not be able to maintain appropriate volumes of inventory supply and demand without agreeing to these concessions. In addition, the fees we charge are likely to change in response to evolution in the market, customer demands, market opportunities, new products, or competitive pressure. If we cannot maintain and grow our revenue and profitability through volume increases that compensate for any price reductions, or if we are forced to make significant fee concessions or refunds, or if buyers reduce spending with us due to fee disputes or pricing issues, our revenue, take rate, the value of our business, and the price of our stock could be adversely affected.
23
We have a history of losses and may not achieve and sustain profitability in the future.
We incurred net losses of
$18.7 million
,
$9.2 million
, and
$2.4 million
during the years ended
December 31,
2014
,
2013
, and
2012
, respectively. As of
December 31, 2014
, we had an accumulated deficit of
$80.7 million
. We may not be able to sustain the revenue growth we have experienced in recent periods, and revenue may decrease, due to competitive pressures, maturation of our business or other factors. Our expenses have increased with our revenue growth, primarily due to substantial investments in our business. Our historical revenue growth should not be considered as indicative of our future performance. We expect our expenses to continue to increase substantially in the foreseeable future as we continue to expand our business, including by hiring engineering, sales, marketing and related support employees in existing and new territories, investing in our technology and developing additional digital media platforms, such as mobile and video. Accordingly, we may not be able to achieve or sustain profitability in the future. If our revenue growth declines or our expenses exceed expectations, our financial performance will be adversely affected.
Our limited operating history makes it difficult to evaluate our business and prospects and may increase the risks associated with an investment in our common stock.
We were incorporated in 2007 and consequently have only a limited operating history upon which our business and future prospects may be evaluated. We may not be able to sustain the rate of growth we have achieved to date, or even maintain our current revenue levels. We have encountered and will continue to encounter risks and difficulties frequently experienced by growing companies in rapidly evolving industries, including challenges related to recruiting; allocating and making effective use of our limited resources; achieving market acceptance of our existing and future solutions; competing against companies with greater financial and technical resources; integrating, motivating, and retaining qualified employees; developing relationships with buyers and sellers; developing new solutions; integrating new technologies or companies we acquire; and establishing and maintaining our corporate infrastructure, including internal controls relating to our financial and information technology systems. We must improve our current operational infrastructure and technology to support significant growth and to respond to the evolution of our market and competitors’ developments. Our business prospects depend in large part on our ability to:
|
•
|
build and maintain our reputation for innovation and solutions that meet the evolving needs of buyers and sellers;
|
|
•
|
distinguish ourselves from the wide variety of solutions available in our industry;
|
|
•
|
maintain and expand our relationships with buyers and sellers;
|
|
•
|
respond to evolving industry standards and government regulations that impact our business, particularly in the areas of data collection and consumer privacy;
|
|
•
|
prevent or otherwise mitigate failures or breaches of security or privacy;
|
|
•
|
attract, hire, integrate and retain qualified employees;
|
|
•
|
effectively execute upon our international expansion plans;
|
|
•
|
evaluate new acquisition targets, and successfully integrate acquired companies’ business and technologies;
|
|
•
|
maintain our cloud-based technology solution continuously without interruption 24 hours a day, seven days a week; and
|
|
•
|
anticipate and respond to varying product life cycles, regularly enhance our existing advertising solutions and introduce new advertising solutions on a timely basis.
|
There is no assurance that we will meet these and other challenges, and failure to meet one or more of these objectives or otherwise adequately address the risks and difficulties that we face will have an adverse effect on our business and may result in revenue loss and inability to sustain profitability or achieve further growth.
Our operating results may fluctuate significantly depending upon various factors, which could make our future operating results difficult to predict and cause our operating results to fall below analysts’ and investors’ expectations.
Our operating results may be difficult to predict, particularly because we generally do not have long-term contracts with buyers or sellers. We have from time to time experienced significant variations in revenue and operating results from period to period. Our operating results may continue to fluctuate and be difficult to predict due to a number of factors, including:
|
•
|
seasonality in demand for digital advertising;
|
|
•
|
changes in pricing of advertising inventory or pricing for our solution and our competitors’ offerings, including potential reductions in our pricing and overall “take rate” as a result of competitive pressure, changes in supply, improvements in technology and extension of automation to higher-value inventory, uncertainty regarding rate of adoption, changes in the allocation of demand spend by buyers, changes in revenue mix, auction dynamics, pricing discussions or negotiations with clients and potential clients, and other factors;
|
24
|
•
|
diversification of our revenue mix to include new services, some of which may have lower pricing than our historic lower-value inventory business or may cannibalize existing business;
|
|
•
|
the addition or loss of buyers or sellers;
|
|
•
|
changes in the advertising strategies or budgets or financial condition of advertisers;
|
|
•
|
the performance of our technology and the cost, timeliness and results of our technology innovation efforts;
|
|
•
|
advertising technology and digital media industry conditions and the overall demand for advertising, or changes and uncertainty in the regulatory environment for us or buyers or sellers, including with respect to privacy regulation;
|
|
•
|
the introduction of new technologies or service offerings by our competitors and market acceptance of such technologies or services;
|
|
•
|
our level of expenses, including investment required to support our technology development, scale our technology infrastructure and business expansion efforts, including acquisitions, hiring and capital expenditures, or expenses related to litigation;
|
|
•
|
the impact of changes in our stock price on valuation of stock-based compensation, warrants or other instruments that are marked to market;
|
|
•
|
the effect of our efforts to maintain the quality of transactions on our platform, including the blocking of non-human inventory and traffic, which could cause a reduction in our revenue if there are fewer transactions consummated through our platform even though the overall quality of the transactions may have improved;
|
|
•
|
the effectiveness of our financial and information technology infrastructure and controls; and
|
|
•
|
changes in accounting policies and principles and the significant judgments and estimates made by management in the application of these policies and principles.
|
Because significant portions of our expenses are relatively fixed, variation in our quarterly revenue could cause significant variations in operating results and resulting stock price volatility from quarter to quarter. Our business has evolved significantly since our founding, and we expect the business to continue to evolve rapidly. In the event of pricing pressures and to minimize adverse effects on revenue, we must increase our scale and add more high-value inventory, which requires ongoing investment that can have an adverse effect at the expense of earnings and might ultimately be unsuccessful. Period-to-period comparisons of our historical results of operations are not necessarily meaningful, and historical operating results may not be indicative of future performance. If our revenue or operating results fall below the expectations of investors or securities analysts, or below any guidance we may provide to the market, the price of our common stock could decline substantially.
Our revenue and operating results are highly dependent on the overall demand for advertising. Factors that affect the amount of advertising spending, such as economic downturns, particularly in the fourth quarter of our fiscal year, can make it difficult to predict our revenue and could adversely affect our business.
Our business depends on the overall demand for advertising and on the economic health of our current and prospective sellers and buyers. If advertisers reduce their overall advertising spending, our revenue and results of operations are directly affected. Many advertisers devote a disproportionate amount of their advertising budgets to the fourth quarter of the calendar year to coincide with increased holiday purchasing, and buyers may spend more in the fourth quarter for budget reasons. As a result, any events that reduce the amount of advertising spending during the fourth quarter, or reduce the amount of inventory available to buyers during that period, could have a disproportionate adverse effect on our revenue and operating results for that fiscal year. Economic downturns or instability in political or market conditions generally may cause current or new advertisers to reduce their advertising budgets. Reductions in inventory due to loss of sellers would make our solution less robust and attractive to buyers. Adverse economic conditions and general uncertainty about economic recovery are likely to affect our business prospects. In particular, uncertainty regarding economic conditions in the United States and other countries may cause general business conditions in the United States and elsewhere to deteriorate or become volatile, which could cause buyers to delay, decrease or cancel purchases, exposing us to reduced demand for our solution, and increased credit risk on buyer orders. Moreover, any changes in the favorable tax treatment of advertising expenses and the deductibility thereof would likely cause a reduction in advertising demand. In addition, concerns over the sovereign debt situation in certain countries in the European Union as well as continued geopolitical turmoil in many parts of the world have and may continue to put pressure on global economic conditions, which could lead to reduced spending on advertising.
25
Seasonal fluctuations in digital advertising activity, which may historically have been less apparent due to our historical revenue growth, could adversely affect our cash flows and operating results.
Our managed revenue, revenue, cash flow from operations, operating results and other key operating and financial measures may vary from quarter to quarter due to the seasonal nature of advertiser spending. For example, many advertisers devote a disproportionate amount of their advertising budgets to the fourth quarter of the calendar year to coincide with increased holiday purchasing. Moreover, advertising inventory in the fourth quarter may be more expensive due to increased demand for advertising inventory. Seasonal fluctuations historically have been less apparent due to our historical revenue growth, but if our growth rate declines or seasonal spending becomes more pronounced, seasonality could result in material fluctuations of our revenue, cash flow, operating results and other key operating and financial measures from period to period.
Our corporate culture has contributed to our success, and if we cannot successfully maintain our culture as we assimilate new employees, we could lose the innovation, creativity and teamwork fostered by our culture.
We are undergoing rapid growth, including in our employee headcount. As of
December 31, 2014
, we had
470
employees. A significant portion of our management team joined us in 2013. We expect that significant additional hiring will be necessary to support our strategic plans, including increased hiring in other countries. We have in the past added significant numbers of employees through acquisitions, and we may continue to do so. This rapid influx of large numbers of people from different business backgrounds may make it difficult for us to maintain our corporate culture. We believe our culture has contributed significantly to our ability to attract and retain talent, to acquire companies and to innovate and grow successfully. If our culture is negatively affected, our ability to support our growth and innovation may diminish.
Risks Related to the Advertising Technology Industry, Market and Competition
The digital advertising market is relatively new, dependent on growth in various digital advertising channels, and vulnerable to adverse public perceptions and increased regulatory responses. If this market develops more slowly or differently than we expect, or if issues encountered by other participants or the industry generally are imputed to or affect us, our business, growth prospects and financial condition would be adversely affected.
The digital advertising market is relatively new and our solution may not achieve or sustain high levels of demand and market acceptance. While display advertising has been used successfully for many years, marketing via new digital advertising channels, such as mobile and social media and digital video advertising, is not as well established. The future growth of our business could be constrained by the level of acceptance and expansion of emerging digital advertising channels, as well as the continued use and growth of existing channels, such as digital display advertising, in which our capabilities are more established. In addition, as we push for the expansion and adoption of increased automation in the advertising industry, it will be important for the success of any such expansion for personnel at buyers and sellers to adopt our solution in lieu of their traditional methods of order placement. It is difficult to predict adoption rates, demand for our solution, the future growth rate and size of the digital advertising solutions market or the entry of competitive solutions.
Further, the digital advertising industry is complex, and evolving, and there are relatively few publicly traded companies operating in the business. Consequently, the digital advertising industry may not be as widely followed or understood in the financial markets as more mature industries. Problems experienced by one industry participant (even private companies) or issues affecting a part of the business have the potential to have adverse effects on other participants in the industry or even the entire industry. Emerging understanding of how the digital advertising industry operates has spurred privacy concerns and misgivings about exploitation of consumer information and prompted regulatory responses that limit operational flexibility and impose compliance costs upon industry participants. As a general matter the digital advertising business is relatively new and digital advertising companies and their specific product and service offerings are not well understood. The markets may not fully appreciate our particular place in the industry and our strengths and differentiating factors, which could have an adverse impact on the trading price of our shares.
Any expansion of the market for digital advertising solutions depends on a number of factors, including social and regulatory acceptance, the growth of the digital advertising market, the growth of social, mobile and video as advertising channels, and the actual or perceived technological viability, quality, cost, performance and value associated with emerging digital advertising solutions. If demand for digital display advertising and adoption of automation does not continue to grow, or if digital advertising solutions or advertising automation do not achieve widespread adoption, or there is a reduction in demand for digital advertising caused by weakening economic conditions, decreases in corporate spending, quality, viewability, malware issues or other issues associated with buyers, advertising channels or inventory, negative perceptions of digital advertising, additional regulatory requirements, or other factors, or if we fail to develop or acquire capabilities to meet the evolving business and regulatory requirements and needs of buyers and sellers of multi-channel advertising, our competitive position will be weakened and our revenue and results of operations could be harmed.
26
We operate in an intensely competitive market that includes companies that have greater financial, technical and marketing resources than we do.
We face intense competition in the marketplace. We are confronted by rapidly changing technology, evolving user needs and the frequent introduction by our competitors of new and enhanced solutions. We compete for advertising spending against competitors, that, in some cases, are also buyers on our platform. We also compete for supply of advertising inventory against a variety of competitors. Some of our existing and potential competitors are better established, benefit from greater name recognition, may have offerings and technology that we do not have or that are more evolved and established than ours, and have significantly more financial, technical, sales, and marketing resources than we do. In addition, some competitors, particularly those with a more diversified revenue base and a broader offering, may have greater flexibility than we do to compete aggressively on the basis of price and other contract terms, or to compete with us by including in their product offerings services that we may not provide. Some competitors are able or willing to agree to contract terms that expose them to risks that might be more appropriately allocated to buyers or sellers of advertising (including inventory risk and the risk of having to pay sellers for unsold advertising impressions), and in order to compete effectively we might need to accommodate risks that could be difficult to manage or insure against. Some buyers that use our solution, and some potential buyers, have their own relationships with sellers and can directly connect advertisers with sellers. Our business may suffer to the extent that buyers and sellers purchase and sell advertising inventory directly from one another or through intermediaries other than us. In addition, as a result of solutions introduced by us or our competitors in the rapidly evolving and fluid advertising market, our marketplace will experience disruptions and changes in business models, which may result in our loss of buyers or sellers. Our innovation efforts may lead us to introduce new solutions that compete with our existing solutions. New or stronger competitors may emerge through acquisitions and industry consolidation or through development of disruptive technologies. Strong and evolving competition could lead to a loss of our market share or compel us to reduce our prices and could make it more difficult to grow our business profitably.
There has been consolidation in the advertising technology industry, and we anticipate continued consolidation increasing the capabilities and competitive posture of larger companies, particularly those who are already dominant in various ways, and enabling new or stronger competitors to emerge. As technology continues to improve and market factors continue to compel investment by others in the business, market saturation may change the competitive landscape in favor of larger competitors with greater scale and broader offerings, including those that can afford to spend more than us to grow more quickly and strengthen their competitive position through innovation, development and acquisitions. In order to compete effectively, we may need to expand the scope of our operations more quickly than would be feasible through our own internal efforts. However, because some capabilities may reside only in a small number of companies, our ability to accomplish necessary expansion through acquisitions may be limited because available companies may not wish to be acquired or may be acquired by larger competitors with the resources to outbid us, or we may need to pay substantial premiums to acquire those businesses. Our ability to make strategic acquisitions could also be hampered if the value of our stock, which we might seek to use as acquisition currency, is trading at prices below what we believe is our inherent value or is viewed negatively by an acquisition target. Accordingly, the amount of dilution that we incur may be impacted by our stock price.
Many buyers and sellers are large consolidated organizations that may need to acquire other companies in order to grow. Smaller buyers and sellers may need to consolidate in order to compete effectively. There is a finite number of large buyers and sellers in our target markets, and any consolidation of buyers or sellers may give the resulting enterprises greater bargaining power or result in the loss of buyers and sellers that use our platform, and thus reduce our potential base of buyers and sellers, each of which would lead to erosion of our revenue.
Our business depends on our ability to collect and use data to deliver advertisements, and to disclose data relating to the performance of advertisements. Any limitation imposed on our collection, use or disclosure of this data could significantly diminish the value of our solution and cause us to lose sellers, buyers and revenue.
When advertisements are placed through our solution, we are able to collect non-personal information about the placement of the advertisement and the interaction of the device user with the advertisement, such as whether the user visited a landing page. We are also able to collect information about pricing of advertisements, historical clearing prices, bid responses, what types of advertisements are allowed on a particular website, which websites a buyer prefers, what ad formats are available to be served, advertisement size and location, where a user is located, how many advertisements the user has seen, browser or device information and sellers’ proprietary data about users. As we collect and aggregate this data provided by trillions of advertising impressions, we analyze it in order to facilitate optimization of the pricing, placement and scheduling of advertisements purchased by buyers across the advertising inventory provided by sellers.
27
Sellers, buyers, or Internet users might decide not to allow us to collect some or all of the data we collect or might limit our use of it. For example, a seller might not agree to provide us with data generated by interactions with the content on its applications, a buyer might not agree to allow us to analyze bid responses, or device users might not consent to share their information about device usage. Any limitation on our ability to collect data about user behavior and interaction with content could make it more difficult for us to deliver effective solutions that meet the needs of sellers and buyers. This, in turn, could hurt our revenue and impair our business.
Although our contracts with sellers generally permit us to aggregate data from advertising placements, sellers in the future may prohibit the collection or use of this data or request that we discontinue using data obtained from their transactions that has already been aggregated with other data. It would be difficult, if not impossible, and costly to comply with these requests. Interruptions, failures or defects in our data collection, mining, analysis and storage systems, as well as privacy concerns and regulatory obligations regarding the collection, use and processing of data, could also limit our ability to aggregate and analyze the data from transactions effected through our solution. Restrictions or limitations on our use of data could reduce the utility and value of our solution, resulting in loss of volume and reduced pricing.
If the use of “third-party cookies” is restricted or otherwise subject to unfavorable regulation, our performance may decline and we may lose buyers and revenue.
We primarily use “cookies,” or small text files, to gather data to enable our solution to be more effective. Cookies that we place are generally regarded as “third-party cookies” because they are placed on individual browsers when Internet users visit a website owned by a seller, advertiser or other first party that has given us permission to place cookies. These cookies are placed through an Internet browser on an Internet user’s computer and correspond with a data set that we keep on our servers. Our cookies record non-personal information, such as when an Internet user views or clicks on an advertisement, where a user is located, how many advertisements the user has seen and browser or device information. We may also receive information from cookies placed by buyers or other parties who give us permission to use their cookies. We use data from cookies to help buyers decide whether to bid on, and how to price, an opportunity to place an advertisement in a certain location, at a given time, in front of a particular Internet user. Without cookie data, transactions occurring through our solution would be executed with less insight into activity that has taken place through an Internet user’s browser, reducing the ability of buyers to make accurate decisions about which inventory to purchase for an advertiser’s campaign. This could make placement of advertising through our solution less valuable, with commensurate reduction in pricing. In addition to cookies, we sometimes place pixels on seller websites to track data regarding users’ visits to such websites. We may use such information internally to optimize our services, and may provide such data, or analysis based on such data, to buyers or sellers as part of our services. If sellers restrict our ability to place such pixels on their websites or limit information that may be shared with buyers, or if the use of such tracking mechanisms is restricted by laws in the future, it may diminish the value of our services.
In addition, in the European Union, or EU, Directive 2009/136/EC, commonly referred to as the “Cookie Directive,” directs EU member states to ensure that storing or accessing information on an Internet user’s computer, such as through a cookie, is allowed only if the Internet user has given his or her consent. Because we lack a direct relationship with Internet users, we rely on our sellers, both practically and contractually, to obtain such consent. Additionally, some member states have adopted and implemented, and may continue to adopt and implement, legislation that negatively impacts the use of cookies for digital advertising. Some of these member states, such as the Netherlands, have also considered requiring prior express user consent, as opposed to merely implied consent, to permit the placement and use of cookies. If member states require prior express consent, our ability to deliver advertisements on certain websites or to certain users may be impaired.
Limitations on the use or effectiveness of cookies, whether imposed by regulation or otherwise, may impact the performance of our solution. We may be required to, or otherwise may determine that it is advisable to, develop or obtain additional applications and technologies to compensate for the lack of cookie data, which may require substantial investment on our part. However, we may not be able to develop or implement additional applications that compensate for the lack of cookie data. Moreover, even if we are able to do so, such additional applications may be subject to further regulation, time consuming to develop or costly to obtain, and less effective than our current use of cookies.
28
Prominent sellers have announced plans to replace cookies with alternative mechanisms, and if cookies are discontinued in favor of proprietary tracking mechanisms, our costs to develop alternatives could increase, our ability to optimize advertisements may suffer, and we may be placed at a competitive disadvantage to others that utilize proprietary user tracking mechanisms.
Google and Microsoft have announced intentions to discontinue the use and deployment of cookies, and to develop alternative methods and mechanisms for tracking web users. There are also reports that other prominent web sellers, such as Amazon, Facebook, and Apple, are also developing alternative web tracking technologies to displace the use of cookies. These alternative mechanisms have not been described in technical detail, and have not been announced with any specific stated time line. It is possible that these companies may rely on proprietary algorithms or statistical methods to track web users without the deployment of cookies, or may utilize log-in credentials entered by users into other web properties owned by these companies, such as their digital email services, to track web usage without deploying third-party cookies. Alternatively, such companies may build alternative and potentially proprietary user tracking methods into their widely-used web browsers.
If cookies are effectively replaced by proprietary alternatives, any continued attempt by us to use cookie-based methods may face negative consumer sentiment and otherwise place us at a competitive disadvantage. If cookies are replaced, in whole or in part, by proprietary alternatives, we would need to develop alternative proprietary tracking methodologies, which would require substantial investment from us, or which may not be commercially feasible given our relatively small size and the fact that development of such technologies may require technical skills that differ from our core engineering competencies. If we find that the development of alternative tracking methodologies is not feasible, we may be effectively obligated to license proprietary tracking mechanisms and data from companies that have developed them, which also compete with us as advertising networks, and we may only be able to obtain such licenses on economically and operationally unfavorable terms. If such proprietary web-tracking standards are owned by companies that compete with us, they may be unwilling to make such technology available to us. Further, if such proprietary web tracking standards are owned by sellers or browser operators that have access to user information by virtue of their popular consumer-oriented websites or browsers and have the technology designed for use in conjunction with the types of user information collected from their websites, we may still be at a competitive disadvantage even if we license their technology.
If cookies are effectively replaced by tracking technologies that are adopted as open industry-wide standards rather than proprietary standards, we may still incur substantial costs to replace cookie-based tracking mechanisms with these new tracking technologies. This may impose substantial re-engineering implementation costs, and may also diminish the quality or value of our services to buyers, if such new web-tracking technologies do not provide us with the quality or timeliness of the tracking data that we currently generate from cookies.
If the use of “third-party cookies” or digital advertising generally is rejected by Internet users, our performance may decline and we may lose buyers and revenue.
Cookies may easily be deleted or blocked by Internet users. All of the most commonly used Internet browsers (Chrome, Firefox, Internet Explorer, and Safari) allow Internet users to modify their browser settings to prevent first party or third-party cookies from being accepted by their browsers. Most browsers also now support temporary privacy modes that allow the user to suspend, with a single click, the placement of new cookies or reading or updates of existing cookies. Internet users can also delete cookies from their computers at any time. Some Internet users also download free or paid “ad blocking” software that prevents third-party cookies from being stored on a user’s computer. If more Internet users adopt these ad blocking settings, utilize privacy modes when browsing seller websites, or delete their cookies more frequently than they currently do, our business could be harmed. In addition, the Safari browser blocks third-party cookies by default. Many applications and other devices allow users to avoid receiving advertisements by paying for subscriptions or other downloads. The browser developer Mozilla, which publishes Firefox, has previously announced an intention to block third-party cookies by default in a future iteration of the Firefox browser, and other browsers may do the same. Mobile devices based upon the Android operating system use cookies only in their web browser applications, so that cookies do not track Android users while they are using other applications on the device. As a consequence, fewer of our cookies or sellers’ cookies may be set in browsers or accessible in mobile devices, which adversely affects our business.
29
“Do Not Track” options in web browsers, “Limit Ad Tracking” options on mobile devices, as well as emerging government disclosure obligations and other potential regulations, could negatively impact our business by limiting our access to the anonymous user data that informs the advertising campaigns transacted through our solution, and as a result may degrade our performance for our buyers or sellers.
Current versions of the most widely used web browsers, such as Chrome, Firefox, Internet Explorer and Safari, allow users to send “Do Not Track” signals, to indicate that they do not wish to have their web usage tracked. However, there is currently no definition of “tracking” and no standards regarding how to respond to a “Do Not Track” preference that are accepted or standardized in the industry. The World Wide Web Consortium, or W3C, chartered a “Tracking Protection Working Group” in 2011 to convene a multi-stakeholder group of academics, thought leaders, companies, industry groups and consumer advocacy organizations to create a voluntary “Do Not Track” standard for the web. The W3C is continuing to work on a policy specification that will provide guidance as to how websites and buyers should respond to a “Do Not Track” signal, but it is unclear exactly what that specification will advise, and to what extent that specification will be accepted by legislators and regulators worldwide.
Even absent an industry standard, various government authorities have indicated an intent to implement some type of “Do Not Track” standard. For example, the Federal Trade Commission, or FTC, has previously stated that it will pursue a legislative solution if the industry does not agree to a standard. Similarly, the European Commission, which proposes legislation to the European Parliament, has suggested that it intends to consider “Do Not Track” legislation in the absence of an industry standard. Some proposed
“
Do Not Track
”
standards, including the current draft specifications being considered by the W3C, impose limits or requirements that apply to data gathering and use by third parties like us, but not to first parties. Laws or regulations could take a similar approach. Any such standard, law, or regulation could place us at a competitive disadvantage to first-party data owners such as large website operators, many of whom own or are developing or acquiring capabilities that compete with our solutions.
Effective January 1, 2014, amendments to the California Online Privacy Protection Act of 2003, California Business and Professional Code § 22575 et seq., require operators of websites or online services to disclose how the operator responds to “Do Not Track” signals regarding the collection of personally identifiable information about an individual consumer’s online activities over time and across third-party Web sites or online services, as well as to disclose whether third parties may collect personally identifiable information about an individual consumer’s online activities over time and across different Web sites or online services. It is possible that other states could adopt legislation similar to California’s. The Do-Not-Track Online Act of 2013 was introduced in the United States Senate in February 2013, and it is possible that the federal government may adopt Do Not Track legislation. We may be subject to disclosure requirements such as California’s, and while we do not collect data that is traditionally considered personally identifiable information in the United States without user consent, we may nonetheless elect to respond by adopting a policy to discontinue profiling or web tracking in response to “Do Not Track” requests, and it is possible that we could in the future be prohibited from using non-personal consumer data by industry standards or state or federal legislation, which may diminish our ability to optimize and target advertisements, and the value of our services.
In addition to
“
Do Not Track
”
options, certain mobile devices allow users to
“
Limit Ad Tracking
”
on their device. Like
“
Do Not Track,
”
“
Limit Ad Tracking
”
is a signal that is sent by particular mobile devices, when a user chooses to send such a signal. While there is no clear guidance on how third parties must respond upon receiving such a signal, it is possible that sellers, regulators, or future legislation may dictate a response that would limit our access to data, and consequently negatively impact the effectiveness of our solution and the value of our services.
Legislation and regulation of digital businesses, including privacy and data protection regimes, could create unexpected additional costs, subject us to enforcement actions for compliance failures, or cause us to change our technology solution or business model, which may have an adverse effect on the demand for our solution.
In the course of our business, we collect, store, transmit and use information (including geo-location information) related to computing and communications devices (mobile and stationary), user activity on devices and advertisements placed through our solution. U.S. and foreign governments have enacted or are considering legislation related to digital advertising and we expect to see an increase in legislation and regulation related to digital advertising, the use of geo-location data to inform advertising, the collection and use of anonymous Internet user data and unique device identifiers, such as IP address or mobile unique device identifiers, and other data protection and privacy regulation. Such legislation could affect the costs of doing business online and may adversely affect the demand for or effectiveness and value of our solution.
30
A wide variety of local, state, national and international laws and regulations apply to the collection, use, retention, protection, disclosure, transfer and other processing of data collected from and about consumers and devices, and the regulatory framework for privacy issues is evolving worldwide. Various government and consumer agencies and public advocacy groups have called for new regulation and changes in industry practices, including some directed at the digital advertising industry in particular. Some of our competitors may have more access to lobbyists or governmental officials and may use such access to effect statutory or regulatory changes in a manner to commercially harm us while favoring their solutions. It is possible that new laws and regulations will be adopted in the United States and internationally, or existing laws and regulations may be interpreted in new ways, that would affect our business, particularly with regard to collection or use of data to target advertisements and communication with consumers through mobile devices and/or using location and the collection of data from apps and websites that are targeted to children.
The U.S. government, including the FTC and the Department of Commerce, has announced that it is reviewing the need for greater regulation of the collection of consumer information, including regulation aimed at restricting some targeted advertising practices. For example, the U.S. Senate is currently considering enacting the Location Privacy Protection Act, which would place significant restrictions on the collection and use of geo-location data, including for advertising purposes. More recently, U.S. President Barack Obama has announced that he intends to encourage the U.S. Congress to pass legislation that would codify the “Consumer Bill of Rights” that his office issued in February 2012, which would impose detailed restrictions on the collection, use, and disclosure of certain types of consumer information. The FTC has also adopted revisions to the Children’s Online Privacy Protection Act that expand liability for the collection of information (including certain anonymous information such as persistent identifiers) by operators of websites and other online services that are directed to children or that otherwise use (for certain purposes) information collected from or about children. In addition, the European Union has adopted Directive 2002/58/EC, commonly referred to as the EU e-Privacy Directive, and is in the process of proposing reforms to its existing data protection legal framework, which may result in a greater compliance burden for us in the course of delivering our solution in Europe. Complying with any new regulatory requirements could force us to incur substantial costs or require us to change our business practices in a manner that could reduce our revenue or compromise our ability to effectively pursue our growth strategy.
Further, many governments are restricting the movement of information about individuals beyond their national borders. Such restrictions could, depending upon their scope, limit our ability to utilize technology infrastructure consolidation, redundancy, and load-balancing techniques, resulting in increased infrastructure costs, decreased operational efficiencies and performance, and potentially a greater risk of system failure.
We strive to comply with all applicable laws and regulations relating to privacy and data collection processing, use and disclosure, but these laws and regulations are continually evolving, not always clear, and not always consistent across the jurisdictions in which we do business. We take measures to protect the security of information that we collect, use and disclose in the operation of our business, and to offer certain privacy protections with respect to such information, but such measures may not always be effective. Our failure to comply with applicable laws and regulations or industry standards applicable to personal data or other data relating to consumers, or to protect such data, could result in enforcement action against us, including fines, imprisonment of our officers and public censure, claims for damages by consumers and other affected individuals, damage to our reputation and loss of goodwill. This is particularly true given that the FTC, Attorneys General of various U.S. States and various international regulators (including numerous data protection authorities in the European Union), have specifically cited as enforcement priorities certain practices that relate to digital advertising, such as the use of geo-location for advertising purposes, the delivery of targeted advertising to children, and the placement of cookies and the EU
“
Cookie Directive.
”
Even the perception of concerns relating to our collection, use, disclosure, and retention of data, including our security measures applicable to the data we collect, whether or not valid, may harm our reputation and inhibit adoption of our solution by current and future buyers and sellers. We are aware of ongoing lawsuits filed against, or regulatory investigations into, companies in the digital advertising industry concerning various alleged violations of consumer protection, data protection, and computer crime laws, asserting various privacy-related theories. Any such proceedings brought against us could hurt our reputation, force us to spend significant amounts in defense of these proceedings, distract our management, increase our costs of doing business, adversely affect the demand for our services and ultimately result in the imposition of monetary liability or restrictions on our ability to conduct our business. We may also be contractually liable to indemnify and hold harmless buyers or sellers from the costs or consequences of litigation or regulatory investigations resulting from using our services or from the disclosure of confidential information, which could damage our reputation among our current and potential sellers or buyers, require significant expenditures of capital and other resources and cause us to lose business and revenue.
Further, privacy and other regulatory violations by other participants in the digital advertising ecosystem could lead to increased regulatory and enforcement activities, reductions in the growth of demand for digital advertising, and increased user requirements, all of which could have adverse consequences and impose additional costs for all industry participants, including us.
31
The European Parliament is considering revocation of the EU-U.S. Safe Harbor Framework, under which personal data of EU residents may be transferred to the United States, and this revocation, if implemented, could hamper our plans to expand our business in Europe.
The use and transfer of personal data in EU member states is currently governed under Directive 95/46/EC (which is commonly referred to as the Data Protection Directive) as well as legislation adopted in the member states to implement the Data Protection Directive. The transfer of what is deemed to be personal data of EU subjects to countries (like the United States) that are determined to have inadequate privacy protections for such data is currently permitted under, among other methods, a process agreed to by the EU and the United States known as the EU-U.S. Safe Harbor Framework, pursuant to which U.S. businesses commit to treat the personal data of EU residents in accordance with privacy principles promulgated by the Data Protection Directive, and may self-certify their compliance with the Safe Harbor Framework.
Currently, we do not participate in the Safe Harbor Framework. Nonetheless, recent developments have called into question whether we would be able to participate in the future, should we decide to do so, or should participation become necessary. The EU is currently considering adoption of a General Data Protection Regulation to supersede the Data Protection Directive, and a European Parliament Inquiry has recently indicated that it will recommend suspension of the Safe Harbor Framework as part of the General Data Protection Regulation. Meanwhile, the European Commission recently published its analysis of the Safe Harbor Framework and concluded that it should be revised to include greater transparency and active enforcement. More recently, the High Court of Ireland has referred to the European Court of Justice a case that calls into question the continued viability of adequacy programs like the Safe Harbor Framework. If restrictions are adopted by the EU that completely prohibit the transfer of our data regarding EU subjects to our computer servers in the U.S., or if the European Court of Justice determines that the Safe Harbor Framework is not sufficient to permit transfer of data between the EU and the United States, we would no longer have the option of participating in the Safe Harbor Framework (in which we currently do not participate), and may be forced to create duplicative, and potentially expensive, information technology infrastructure and business operations in Europe, which may hinder our expansion plans in Europe, or render such plans commercially infeasible.
Changes to the definition of personal information or personal data, as well as jurisdictional variances regarding what constitutes personal information or personal data, may require us to change our business practices, which may inhibit our ability to conduct our business.
Although we do not collect data that is traditionally considered personal data in the United States, such as names, email addresses, addresses, phone numbers, social security numbers, credit card numbers, or financial or health data in the ordinary course of providing our solution (except to the limited extent personal data is voluntarily submitted by a user or collected by us with the user’s knowledge and consent), we typically do collect and store IP addresses, geo-location information, and device or other persistent identifiers that are or may be considered personal data in some jurisdictions or otherwise may be the subject of legislation or regulation. For example, some jurisdictions in the EU regard IP addresses as personal data, and certain regulators, like the California Attorney General’s Office, have advocated for including IP addresses, GPS-level geolocation data, and unique device identifiers as personal data under California law.
Evolving definitions of personal data, within the EU, the United States and elsewhere, especially relating to the classification of IP addresses, machine or device identifiers, geo-location data and other such information, may cause us in the future to change our business practices, diminish the quality of our data and the value of our solution, and hamper our ability to expand our offerings into the EU or other jurisdictions outside of the United States. They might likewise result in additional regulatory, legislative or public scrutiny, including investigations. While we have not collected data that is traditionally considered personal data, such as name, email address, address, phone numbers or social security numbers, we typically do collect and store IP addresses and other device identifiers. Our failure to comply with evolving interpretations of applicable laws and regulations, or to adequately protect personal data, could result in enforcement action against us or reputational harm, which could have a material adverse impact on our business, financial condition and results of operations.
Changes in tax laws affecting us and other market participants could have a material adverse effect on our business.
U.S. legislative proposals have been made that, if enacted, would limit or delay the deductibility of advertising costs for U.S. federal income tax purposes. Any such proposals, if enacted, will likely cause advertisers to reduce their advertising spending in order to mitigate or offset any loss resulting from a change in the tax treatment of such costs. Accordingly, any such changes would likely have a negative impact on the advertising industry and us by reducing the aggregate amount of money spent on advertising.
U.S. legislation has also been proposed that would limit the ability to defer taxation for U.S. federal income tax purposes of earnings outside the United States until those earnings are repatriated. Any changes in the taxation of our non-U.S. earnings could increase our tax expense and harm our financial position and results of operations.
32
We generally do not have privity with Internet users who view advertisements that we place, and we may not be able to disclaim liabilities from such Internet users or consumers.
Advertisements on websites, applications and other digital media properties of sellers purchased through our solution are viewed by Internet users visiting these digital media properties. Sellers often have terms of use in place with their users that disclaim or limit their potential liabilities to such users, or pursuant to which users waive rights to bring class-actions against the sellers. Potential liabilities could include liabilities to Internet users arising as a result of malicious activities, such as the introduction of malware into users’ computers through advertisements served through our platform. Certain of our competing advertisement networks are also prominent sellers, and may be able to include protections in their website terms of use that also limit liability to users for their advertising services. We generally do not have terms of use in place with such users. As a consequence, we generally cannot disclaim or limit potential liabilities to such users through terms of use, which may expose us to greater liabilities than competing advertising networks that are also prominent sellers.
Changes in market standards applicable to our solution could require us to incur substantial additional development costs.
Market forces, competitors’ initiatives, regulatory authorities, industry organizations, seller integration revisions and security protocols are causing the emergence of demands and standards that are or could be applicable to our solution. For example, in 2013, changes to the Children’s Online Privacy Protection Act required us to change our system to stop user tracking on some seller websites. In addition, German law required us to make engineering changes to stop tracking IP addresses in that country. Consensus or law on a “Do Not Track” standard could require us to stop tracking many Internet users. Similar dynamics are evolving in international markets.
We expect compliance with these kinds of standards to become increasingly important to buyers and sellers, and conforming to these standards is expected to consume a substantial and increasing portion of our development resources. If our solution is not consistent with emerging standards, our market position and sales could be impaired. If we make the wrong decisions about compliance with these standards, or are late in conforming, or if despite our efforts our solution fails to conform, our offerings will be at a disadvantage in the market to the offerings of competitors who have complied.
Evolving concepts of viewability involve competitive uncertainty and may cause us to incur additional costs and liability risk.
Viewability of digital advertising inventory is relevant to marketers because it represents a way of assessing the value of particular inventory as a means to reach a target audience. However, there is no consensus definition of viewability. Some approaches focus on whether an advertisement can be seen at all, and others focus on whether an advertisement that can be seen is actually seen, in whole or part, or for how long. Low viewability can be caused by various factors, including technical issues (
e.g.
device screen size, browser functionality and settings, web site load times), media design (
e.g.
below-the-fold or sub-page placements), and user behavior (
e.g.
the decision whether to scroll down a website or click on an advertisement or how long to watch a video). Non-viewability is a separate issue and may result, for example, from stacking ads so the one in the back is obscured, or serving ads into a single pixel space too small to be seen. Sometimes these two concepts of viewability are conflated, which tends to obscure analysis.
Aside from non-viewable inventory, which is generally well understood, various vendors and other industry participants advocate definitions and measurements of low viewability that are consistent with their technology or interests. We cannot predict whether consensus views will emerge, or what they will be. Nevertheless, some themes seem to have emerged:
|
•
|
Buyers of advertising inventory are increasingly using technology, often provided by third parties, to assess viewability of impressions for use as a bidding or purchasing criterion, or to determine value for purposes of determining pricing.
|
|
•
|
Assessment of viewability is imperfect, but technology can be expected to improve as data providers, DSPs, and buyers themselves develop viewability assessment tools and build viewability factors into their algorithms for bidding, purchasing, and pricing decisions.
|
|
•
|
Inventory viewability and value correlate. More viewable inventory is more valuable, and viewability of inventory increases in importance with the price paid for that inventory.
|
|
•
|
Viewability can be used as an inventory differentiator, by domain or on an impression level, with higher viewability generally associated with higher value and pricing, and lower viewability generally associated with lower value and pricing.
|
These themes are relevant to our business of facilitating fully informed purchase and sale of advertising, and evolution of viewability standards may represent an opportunity to refine matching of supply and demand. However, incorporating viewability concepts fully into our business as they evolve will require us to incur additional costs to integrate relevant technologies and process additional information through our system. If we do not handle viewability well, we could be competitively disadvantaged.
33
Also, inventory that is well differentiated on the basis of viewability will also be differentiated on the basis of value, with less viewable inventory valued lower. In this context, if we are not positioned to transact the higher viewability inventory competitively, our revenue and profitability could be adversely affected.
Buyers could attempt to hold us responsible for impressions that do not satisfy their viewability requirements or expectations, and depending upon how viewability evolves, market practice or emerging regulation may require us to incur compliance costs and assume some responsibility for viewability of advertisements transacted through our solution. Divergent views of how to measure viewability and imperfect measurement technology could lead to disagreement, increasing risk of disputes, demands for refunds, and reputational harm.
Failure to comply with industry self-regulation could harm our brand, reputation and our business.
In addition to compliance with government regulations, we voluntarily participate in trade associations and industry self-regulatory groups that promulgate best practices or codes of conduct addressing privacy and the provision of Internet advertising. For example, we have undertaken to comply with the Network Advertising Initiative’s Code of Conduct and the Digital Advertising Alliance’s Self-Regulatory Principles for Online Behavioral Advertising in the United States, as well as similar self-regulatory principles in other jurisdictions. On our website, we offer Internet users the ability to opt out of receiving interest-based advertisements based on a cookie we place. However, in the past, some of these guidelines have not comported with our business practices, making them difficult for us to implement. If we encounter difficulties in the future, or our opt-out mechanisms fail to work as designed, or if Internet users misunderstand our technology or our commitments with respect to these principles, we may be subject to negative publicity, as well as investigation and litigation by governmental authorities, self-regulatory bodies or other accountability groups, buyers, sellers, or other private parties. Any such action against us could be costly and time consuming, require us to change our business practices, divert management’s attention and our resources, and be damaging to our reputation and our business. In addition, we could be adversely affected by new or altered self-regulatory guidelines that are inconsistent with our practices or in conflict with applicable laws and regulations in the United States and other countries where we do business. As a result of such inconsistencies or conflicts, or other business or legal considerations, we may choose not to comply with some self-regulatory guidelines. If we fail to abide by or are perceived as not operating in accordance with applicable laws and regulations and industry best practices, or any industry guidelines or codes with regard to privacy or the provision of Internet advertising, our reputation may suffer and we could lose relationships with buyers and sellers.
Forecasts of market growth may prove to be inaccurate, and even if the market in which we compete achieves the forecasted growth, our business may not grow at similar rates, if at all.
We have in the past provided, and may continue to provide, forecasts related to our market, including forecasts relating to the expected growth in the digital advertising market and parts of that market (including display, mobile and digital video advertising), as well as the forecasted trend towards automation of analog and print advertising markets. Growth forecasts are subject to significant uncertainty and are based on assumptions and estimates that may prove to be inaccurate. Moreover, the anticipation that the advertising industry will continue to shift from analog and print media to digital advertising at the rate forecasted, or the anticipation of the shift in advertising spending from analog to digital, may not come to fruition. Further, we may not succeed in our plans to enter or increase our presence in various markets for various reasons, including possible shortfall or misallocation of resources or superior technology development or marketing by competitors.
Risks Related to Our Relationships with Buyers and Sellers and Other Strategic Relationships
We depend on owners of digital media properties for advertising inventory to deliver advertising campaigns, and any decline in the supply of advertising inventory from these sellers could hurt our business.
We depend on digital media properties to provide us with advertising inventory within their websites and applications. The sellers that supply their advertising inventory to us typically do so on a non-exclusive basis and are not required to provide any minimum amounts of advertising inventory to us or provide us with a consistent supply of advertising inventory. Sellers may seek to change the terms at which they offer inventory to us or they may elect to make advertising inventory available to our competitors who offer advertisements to them on more favorable economic terms or may sell inventory directly to buyers through other channels. Supply of advertising inventory is also limited for some sellers, such as special sites or new technologies, and sellers may request higher prices, fixed price arrangements or guarantees. In addition, sellers sometimes place significant restrictions on the sale of their advertising inventory. These restrictions may include strict security requirements, prohibitions on advertisements from specific advertisers or specific industries, or restrictions on the use of specified creative content or format. In addition, sellers or competitors could pressure us to increase the prices for inventory, which may reduce our operating margins, or otherwise block our access to that inventory, without which we would be unable to deliver advertisements using our solution.
34
If sellers decide not to make advertising inventory available to us, decide to increase the price of inventory, or place significant restrictions on the sale of their advertising inventory, we may not be able to replace this with inventory from other sellers that satisfies our requirements in a timely and cost-effective manner. In addition, significant sellers in the industry may enter into exclusivity arrangements with our competitors, which could limit our access to a meaningful supply of advertising inventory. If any of this happens, the value of our solution to buyers could decrease and our revenue could decline or our cost of acquiring inventory could increase, lowering our operating margins.
Our contracts with buyers and sellers are generally not exclusive and generally do not require minimum volumes or long-term commitments. If buyers, or sellers representing a significant portion of the demand or inventory in our marketplace decides to materially reduce the use of our solution, we could experience an immediate and significant decline in our revenue and profitability and harm to our business.
Generally, our buyers and sellers are not obligated to provide us with any minimum volumes of business, have established relationships and may also do business with our competitors as well as with us, and may bypass us and transact directly with each other or through other intermediaries. Most of our business with buyers originates pursuant to “insertion orders” or other arrangements that are limited in scope and can be reduced or canceled by the buyer without penalty. Similarly, sellers make inventory available to us on a discretionary basis. Accordingly, our business is highly vulnerable to changes in the macro environment and development of new or more compelling offerings by our competitors, which could reduce business generally or motivate buyers or sellers to migrate to competitors’ offerings. Further, if our relationships with buyers or sellers become strained due to service failures or other reasons, including possible perceptions that our buyer applications compete with buyers, it might not be difficult for some of these buyers to reduce or terminate their business with us. Because we do not have long-term contracts, our future revenue may be difficult to predict and there is no assurance that our current buyers will continue to use our solution or that we will be able to replace lost buyers or sellers with new ones. If a buyer or group of buyers representing a significant portion of the demand in our marketplace, or a seller or group of sellers representing a significant portion of the inventory in our marketplace decides to materially reduce use of our solution, it could cause an immediate and significant decline in our revenue and profitability and harm to our business. Additionally, if we overestimate future usage, we may incur additional expenses in adding infrastructure without a commensurate increase in revenue, which would harm our profitability and other operating results. If a buyer or group of buyers representing a significant portion of our business decides to materially reduce use of our solution, it could cause an immediate and significant decline in our revenue and profitability and harm to our business.
Loss of business associated with large buyers or sellers could have significant negative impact on our results of operations and overall financial condition.
Certain large buyers and sellers have accounted for and will continue to account for a disproportionate share of business transacted through our solution. Our contracts with buyers and sellers generally do not provide for any minimum volumes or may be terminated on relatively short notice. Buyer and seller needs and plans can change quickly, and buyers or sellers may reduce volumes or terminate their arrangements with us for a variety of reasons, including financial issues or other changes in circumstances; development or acquisition by buyers or sellers of their own technologies that reduce their reliance upon us; new offerings by or strategic relationships with our competitors; opportunities for buyers and sellers to bypass us and deal directly with each other; change in control (including consolidations through mergers and acquisitions); or declining general economic conditions (including those resulting from dissolutions of companies). Technical issues could also cause a decline in spending. The number of large media buyers in the market is finite, and it could be difficult for us to replace revenue loss from any buyers whose relationships with us diminish or terminate. Similarly, it could be difficult for us to replace inventory loss from any large sellers whose relationships with us diminish or terminate. Just as growth in our inventory strengthens buyer activity in a network effect, loss of inventory or buyers could have the opposite effect. Loss of revenue from significant buyers or failure to collect accounts receivable, whether as a result of buyer payment default, contract termination or other factors, or significant reductions in inventory, could have a significant negative impact on our results of operation and overall financial condition.
We must provide value to both buyers and sellers of advertising without being perceived as favoring one over the other.
Buyers and sellers have different interests, and we are interposed between them. To be successful, we must continue to find ways of providing value to both. For example, our proprietary auction algorithms, which are designed to optimize auction outcomes, influence the allocation and pricing of impressions and must do so in ways that add value to both buyers and sellers. Because new business models continue to emerge, we must constantly adapt our relationship with buyers and sellers and how we market ourselves to each. Further, consistent with our mission of connecting buyers and sellers, we inevitably grow closer to each, and we must take care that our deeper connections with buyers, on the one hand, or sellers, on the other hand, do not come at the expense of the other’s interests. If we fail to achieve this balance, our ability to provide a full suite of services and our growth prospects may be compromised.
35
We rely on buyers to use our solution to purchase advertising on behalf of advertisers. Such buyers may have or develop high-risk credit profiles, which may result in credit risk to us.
Our revenue is generated from advertising spending transacted over our platform using our technology solution. We invoice and collect from buyers the full purchase price for impressions they have purchased, retain our fees (where applicable), and remit the balance to sellers. However, in some cases, we may be required to pay sellers for impressions delivered even if we are unable to collect from the buyer of those impressions. There can be no assurances that we will not experience bad debt in the future. Any such write-offs for bad debt could have a materially negative effect on our results of operations for the periods in which the write-offs occur.
Our sales efforts with buyers and sellers may require significant time and expense.
Attracting new buyers and sellers and increasing our business with existing buyers and sellers involves substantial time and expense, and we may not be successful in establishing new relationships or in maintaining or advancing our current relationships. We may spend substantial time and effort educating buyers and sellers about our offerings, including providing demonstrations and comparisons against other available solutions. This process can be costly and time-consuming, and is complicated by us having to spend time integrating our solution with software of buyers and sellers. Because our solution may be less familiar in some markets outside the United States, the time and expense involved with attracting, educating and integrating buyers and sellers in international markets may be even greater than in the United States. If we are not successful in targeting, supporting and streamlining our sales processes, our ability to grow our business may be adversely affected.
If we are unable to maintain or expand our sales and marketing capabilities, we may not be able to generate anticipated revenue.
Increasing our base of buyers and sellers and achieving broader market acceptance of our solution will depend to a significant extent on our ability to expand our sales and marketing operations and activities. We are substantially dependent on our sales force to obtain new buyers and sellers and to drive sales to our existing buyers. We currently plan to expand our sales team in order to increase revenue from new and existing buyers and sellers and to further penetrate our existing markets and expand into new advertising channels and additional international markets. Our solution requires a sophisticated sales force with specific sales skills and specialized technical knowledge that takes time to develop. Competition for qualified sales personnel is intense, and we may not be able to retain our existing sales personnel or attract, integrate or retain sufficient highly qualified sales personnel. In particular, it may be difficult to find qualified sales personnel in international markets, or sales personnel with experience in emerging segments of the market. Our ability to achieve revenue growth in the future will depend, in large part, on our success in recruiting, training and retaining sufficient numbers of sales personnel. These new employees require significant training and experience before they achieve full productivity. We estimate that it takes approximately six months before a newly hired domestic sales representative is fully trained and productive in selling our solution, and often longer in the case of non-U.S. sales representatives and sales personnel focused on new geographies or specific market segments. As a result, the cost of hiring and carrying new sales team members cannot be offset by the revenue they produce for a significant period of time. Our recent hires and planned hires may not become productive as quickly as we would like, and we may not be able to hire or retain sufficient numbers of qualified individuals in the markets where we do business. Our business will be seriously harmed if these expansion efforts do not generate a corresponding significant increase in revenue.
Legal claims resulting from the actions of buyers or sellers could expose us to liabilities, damage our reputation, and be costly to defend.
The buyers and sellers engaging in transactions through our platform impose various requirements upon each other, and they and the underlying advertisers are subject to regulatory requirements by governments and standards bodies applicable to their activities. We assume responsibility for satisfying or facilitating the satisfaction of some of these requirements through the contracts we enter into with buyers and sellers. In addition, we may have responsibility for some acts or omissions of buyers or sellers transacting business through our solution under applicable laws or regulations or as a result of common law duties, even if we have not assumed responsibility contractually. These responsibilities could expose us to significant liabilities, perhaps without the ability to impose effective mitigating controls upon, or to recover from, buyers and sellers. Moreover, for those third parties who are both a buyer and seller on our platform, it is feasible that they could use our platform to buy and sell advertisements in an effort to inflate their own revenue. While we do not believe we would have legal liability in connection with such a scheme, we could still nevertheless be subject to litigation as a result of such actions, and, if we were sued, we would incur legal costs in our defense and cannot guarantee that a court would not attribute some liability to us.
36
We generally attempt to obtain representations from buyers that the advertising they place through our solution complies with applicable laws and regulations and does not violate third-party intellectual property rights, and from sellers about the quality and characteristics of the impressions they provide. We also generally receive representations from buyers and sellers about their privacy practices and compliance with applicable laws and regulations, including their maintenance of adequate privacy policies that disclose and permit our data collection practices. However, we are not always able to verify or control their compliance with their obligations under their agreements with us or to consumers or other third parties, and the acts or omissions of sellers, buyers or advertisers may subject us to regulatory action, legal claims and liability that would be difficult and costly to defend and expose us to significant costs and reputational harm. We may not have adequate indemnity to protect us against, and our policies of insurance may not cover, such claims and losses.
Our business relationships expose us to risk of substantial liability for contract breach, violation of laws and regulations, intellectual property infringement and other losses, and our contractual indemnities and limitations of liability may not protect us adequately.
Our agreements with sellers, buyers and other third parties typically obligate us to provide indemnity and defense for losses resulting from claims of intellectual property infringement, damages to property or persons, business losses or other liabilities. Generally, these indemnity and defense obligations relate to our own business operations, obligations and acts or omissions. However, under some circumstances, we agree to indemnify and defend contract counterparties against losses resulting from their own business operations, obligations and acts or omissions, or the business operations, obligations and acts or omissions of third parties. For example, because our business interposes us between buyers and sellers in various ways, buyers often require us to indemnify them against acts and omissions of sellers, and sellers often require us to indemnify them against acts and omissions of buyers. In addition, our agreements with sellers, buyers and other third parties typically include provisions limiting our liability to the counterparty and the counterparty’s liability to us. These limits sometimes do not apply to certain liabilities, including indemnity obligations. These indemnity and limitation of liability provisions generally survive termination or expiration of the agreements in which they appear.
We have limited ability to control acts and omissions of buyers and sellers or other third parties that could trigger our indemnity obligations, and our policies of insurance may not cover us for acts and omissions of others. We attempt to obtain indemnity from buyers and sellers (as well as other third parties) to protect us in case we become liable for their acts and omissions, but because we contract with many buyers and sellers and those contracts are individually negotiated with different scopes of indemnity and different limits of liability, it is possible that in any case our obligation to provide indemnity for the acts or omissions of a third party such as a buyer or seller may exceed what we are able to recover from that party. Further, contractual limits on our liability may not apply to our indemnity obligations, contractual limits on our counterparties’ liability may limit what we can recover from them, and contract counterparties may be unable to meet their obligations to indemnify and defend us as a result of insolvency or other factors. Large indemnity obligations, or obligations to third parties not adequately covered by the indemnity obligations of our contract counterparties, could expose us to significant costs.
In addition to the effects on indemnity described above, the limitation of liability provisions in our contracts may, depending upon the circumstances, be too high to protect us from significant liability for our own acts or omissions, or so low as to prevent us from recovering fully for the acts or omissions of our counterparties.
Our solution relies on third-party open source software components. Failure to comply with the terms of the underlying open source software licenses could expose us to liabilities, and the combination of certain open source software with code that we develop could compromise the proprietary nature of our solution.
Our solution utilizes software licensed to us by third-party authors under “open source” licenses. The use of open source software may entail greater risks than the use of third-party commercial software, as open source licensors generally do not provide warranties or other contractual protections regarding infringement claims or the quality of the code. Some open source licenses contain requirements that we make available source code for modifications or derivative works we create based upon the type of open source software we use. If we combine our proprietary software with open source software in a certain manner, we could, under certain open source licenses, be required to release the source code of our proprietary software to the public. This would allow our competitors to create similar solutions with lower development effort and time and ultimately put us at a competitive disadvantage.
Although we monitor our use of open source software in an effort to avoid subjecting our products to conditions we do not intend, the terms of many open source licenses have not been interpreted by U.S. courts, and there is a risk that these licenses could be construed in a way that could impose unanticipated conditions or restrictions on us. Moreover, we cannot guarantee that our processes for controlling our use of open source software will be effective. If we are held to have breached the terms of an open source software license, we could be required to seek licenses from third parties to continue operating using our solution on terms that are not economically feasible, to re-engineer our solution or the supporting computational infrastructure to discontinue use of certain code, or to make generally available, in source code form, portions of our proprietary code.
37
Risks Relating to Our Operations
Real or perceived errors or failures in the operation of our solution could damage our reputation and impair our sales.
Our solution processes more than 3.5 million peak queries per second and approximately 5 trillion bid requests per month and must operate without interruption to support the needs of sellers and buyers. Because our software is complex, undetected errors and failures may occur, especially when new versions or updates are made to our software or network infrastructure or changes are made to sellers’ or buyers’ software interfacing with our solution. Errors or bugs in our software, faulty algorithms, technical or infrastructure problems, or updates to our systems could lead to an inability to process data to place advertisements or price inventory effectively, cause the inadvertent disclosure of proprietary data or cause advertisements to display improperly or be placed in proximity to inappropriate content. Despite testing by us, errors or bugs in our software have in the past, and may in the future, not be found until the software is in our live operating environment. For example, changes to our solution have in the past caused errors in the reporting and analytics applications for buyers, resulting in delays in their spending on our platform. Errors or failures in our solution, even if caused by the implementation of changes by buyers or sellers to their systems, could also result in negative publicity, damage to our reputation, loss of or delay in market acceptance of our solution, increased costs or loss of revenue, loss of competitive position, or claims by advertisers for losses sustained by them.
We may make errors in the measurement of transactions conducted through our solution, causing discrepancies with the measurements of buyers and sellers, which can lead to a lack in confidence in us and require us to reduce our fees or provide refunds to buyers and sellers. Alleviating problems resulting from errors in our software could require significant expenditures of capital and other resources and could cause interruptions, delays or the cessation of our business.
Various risks could interrupt access to our network infrastructure or data, exposing us to significant costs and other liabilities.
Our revenue depends on the technological ability of our solution to deliver and measure advertising impressions, and the operation of our exchange and our ability to place impressions depend on the continuing and uninterrupted performance of our IT systems. Our platform operates on our data processing equipment that is housed in third-party commercial data centers that we do not control. In addition, our systems interact with systems of buyers and sellers and their contractors. All of these facilities and systems are vulnerable to interruption and/or damage from a number of sources, many of which are beyond our control, including, without limitation: (i) power loss, loss of adequate cooling and telecommunications failures; (ii) fire, flood, earthquake, hurricane and other natural disasters; (iii) software and hardware errors, failures or crashes; (iv) financial insolvency; and (v) computer viruses, malware, hacking, terrorism, and similar disruptive problems. In particular, intentional cyber-attacks present a serious issue because of the difficulty associated with prevention and remediation of intentional attacks and sabotage, and because they can be used to defraud our buyers and sellers and their customers, and to steal confidential or proprietary data from us or our users. Further, because our Los Angeles headquarters and San Francisco office and our California and Japan data center sites are in seismically active areas, earthquakes present a particularly serious risk of business disruption. These vulnerabilities may increase with the complexity and scope of our systems and their interactions with buyer and seller systems.
We attempt to mitigate these risks to our business through various means, including redundant infrastructure, disaster recovery plans, separate test systems and change control and system security measures, but our precautions may not protect against all problems, and our ability to mitigate risks to related third-party systems is limited. In addition, we rely to a significant degree upon security and business continuity measures of our data center operators, which may be ineffective. Our disaster recovery and business continuity plans rely upon third-party providers of related services, and if those vendors fail us, we could be unable to meet the needs of buyers and sellers. Any steps we take to increase the reliability and redundancy of our systems may be expensive and may not be successful in preventing system failures. Inaccessibility of our data would have a significant adverse effect upon the operation of our solution. Any failures with our solution or delays in the execution of transactions through our system may result in the loss of advertising placements on impressions and, as a result, the loss of revenue. Our facilities would be costly to repair or replace, and any such efforts would likely require substantial time.
Buyers may perceive any technical disruption or failure in the performance of advertisements on seller’s digital media properties to be attributable to us, and our reputation could similarly suffer, or buyers may seek to avoid payment or demand future credits for disruptions or failures, any of which could harm our business and results of operations. If we are unable to operate our exchange and deliver advertising impressions successfully, our ability to attract potential buyers and sellers and retain and expand business with existing buyers and sellers could be harmed and our business, financial condition and operating results could be adversely affected.
Malfunction or failure of our systems, or other systems that interact with our systems, could disrupt our operations and negatively impact our business and results of operations to a level in excess of any applicable business interruption insurance. Interruption in the operation of our solution would result in a loss of revenue and potential liability to buyers and sellers, and any significant instances of system downtime could negatively affect our reputation and ability to sell our solution.
38
Any breach of our computer systems or confidential data in our possession could expose us to significant expense and liabilities and harm our reputation.
We must maintain facility and systems security measures to preserve the confidentiality of certain data belonging or related to sellers, buyers and their clients that is transmitted through or stored on our systems or is otherwise in our possession. Additionally, we maintain our own confidential information, and confidential information received from other third parties, in our facilities and systems. We take steps to protect the security, integrity and confidentiality of this data, but there is no guarantee that inadvertent or unauthorized use or disclosure will not occur or that third parties will not gain unauthorized access to this data despite our efforts.
Security breaches, computer malware and computer hacking attacks may occur on our systems or those of our information technology vendors in the future. Any security breach, whether caused by hacking, the inadvertent transmission of computer viruses or other harmful software code, or otherwise, could result in the unauthorized disclosure, misuse or loss of information, legal claims and litigation, indemnity obligations, regulatory fines and penalties, contractual obligations and liabilities, other liabilities and significant costs for remediation and re-engineering to prevent future occurrences. Any such security breach could interrupt, disable, or interfere with our computer systems or networks, and could materially interfere with or prevent us from providing services to our sellers, buyers or their clients. In addition, if our security measures or those of our vendors are breached or unauthorized access to consumer data otherwise occurs, our solution may be perceived as not being secure, and sellers and buyers may reduce or cease the use of our solution.
Despite our security measures, and those of buyers and sellers, we are subject to ongoing threats and, therefore, these security measures may be breached as a result of employee error, failure to implement appropriate processes and procedures, malfeasance, third-party action, including cyber-attacks, cyber-extortion or other intentional misconduct by computer hackers, or otherwise. Additionally, buyers and sellers typically have security measures in place, but we typically do not have means for controlling the adequacy or efficacy of their security measures. Third parties could obtain unauthorized access to our computer systems or networks, or to sellers’ or buyers’ data or our data, including personally identifiable information, intellectual property and other confidential business information. Third parties may also attempt to fraudulently induce employees into disclosing sensitive information such as user names, passwords or other information in order to gain access to our buyers’ data or our data, including intellectual property and other confidential business information.
Because techniques used to obtain unauthorized access or sabotage systems change frequently and generally are not identified until they are launched against a target, we may be unable to anticipate these techniques or to implement adequate preventative or mitigation measures. Though it is difficult to determine what harm may directly result from any specific interruption or breach, any failure to maintain performance, reliability, security and availability of our network infrastructure or otherwise to maintain the confidentiality, security, and integrity of data that we store or otherwise maintain could result in significant distraction to our business, adverse publicity, and damage to our reputation, our relationships with buyers and sellers and our ability to retain and attract new buyers and sellers.
If any such unauthorized disclosure or access does occur, we may be required to notify buyers and sellers or those persons whose information was improperly used, disclosed or accessed. We may also be subject to claims of breach of contract for such use or disclosure, investigation and penalties by regulatory authorities and potential claims by persons whose information was improperly used or disclosed. The unauthorized use or disclosure of information in our control may result in the termination of one or more of our commercial relationships or a reduction in the confidence of buyers, sellers or Internet users and usage of our solution. We may also be subject to litigation and regulatory action alleging the improper use, transmission or storage of confidential information, which could damage our reputation among our current and potential buyers, sellers or Internet users, require significant expenditures of capital and other resources and cause us to lose business and revenue.
Failure to maintain the brand security features of our solution could harm our reputation and expose us to liabilities.
Auction-based advertising is bought and sold through our solution in automated transactions that occur in milliseconds. It is important to sellers that the advertising placed on their media not conflict with existing seller arrangements and be of high quality, consistent with applicable seller standards and compliant with applicable legal and regulatory requirements. It is important to buyers that their advertisements are placed on appropriate media, in proximity with appropriate content, that the impressions for which they are charged are legitimate, and that their advertising campaigns yield their desired results. We use various measures, including proprietary technology, in an effort to store, manage and process rules set by buyers and sellers and to ensure the quality and integrity of the results delivered to sellers and buyers through our solution. If we fail to properly implement or honor rules established by buyers and sellers, advertisements may be improperly placed through our platform, which can result in harm to our reputation as well as the need to pay refunds and other potential legal liabilities.
39
If we fail to detect or prevent fraud, intrusion of malware through our platform into the systems or devices of our clients and their customers, or other actions that impact the integrity of our solution or advertisement performance, sellers and buyers could lose confidence in our solution and we could face legal claims, which would cause our business to suffer. If we terminate relationships with sellers as a result of our screening efforts, our volume of paid impressions may decline.
We have in the past, and may in the future, be subject to fraudulent and malicious activities undertaken by persons seeking to use our platform for improper purposes, including to divert or artificially inflate the purchases by buyers through our platform, or to disrupt or divert the operation of the systems and devices of our clients and their customers to misappropriate information, generate fraudulent billings, stage hostile attacks, or for other illicit purposes. Examples of such activities include the use of bots or other automated or manual mechanisms to generate fraudulent impressions that are delivered through our platform, which could overstate the performance of advertising impressions. Such activities could also include the introduction of malware through our platform by persons seeking to commandeer, or gain access to information, on consumers’ computers. We use proprietary technology to identify non-human inventory and traffic, as well as malware, and we terminate relationships with sellers that appear to be engaging in such activities, which results in fewer paid impressions in the year the relationships are terminated than would have otherwise occurred. Because buyers will frequently re-allocate campaigns to other sellers, it is difficult to measure the precise impact on paid impressions and revenue from the loss of these sellers. Although we assess the quality and performance of advertising on sellers’ digital media properties, it may be difficult to detect fraudulent or malicious activity because we do not own content and we rely in part on sellers and buyers for controls with respect to such activity. Further, perpetrators of fraudulent impressions and malware change their tactics and may become more sophisticated, requiring us to improve over time our processes for assessing the quality of seller’s inventory and controlling fraudulent activity. If fraudulent or other malicious activity is perpetrated by others, and we fail to detect or prevent it, we could face legal claims from customers and/or consumers and the affected advertisers may experience or perceive a reduced return on their investment or heightened risk associated with use of our solution, resulting in dissatisfaction with our solution, refusals to pay, refund demands, loss of confidence of buyers or sellers, or withdrawal of future business. We could experience similar consequences if inventory sold through our platform is not viewable by the consumer for technical or other reasons.
Any acquisitions we undertake may disrupt our business, adversely affect operations and dilute stockholders.
Acquisitions have been an important element of our business strategy. We expect to continue to pursue acquisitions in an effort to increase revenue, expand our market position, add to our technological capabilities, respond to dynamic market conditions, or for other strategic or financial purposes. However, there is no assurance that we will identify suitable acquisition candidates or complete any acquisitions on favorable terms, or at all. Further, any acquisitions we do complete would involve a number of risks, including the following:
|
•
|
The identification, acquisition and integration of acquired businesses require substantial attention from management. The diversion of management’s attention and any difficulties encountered in the transition process could hurt our business.
|
|
•
|
The identification, acquisition and integration of acquired businesses requires significant investment, including to harmonize service offerings, expand management capabilities and market presence, and improve or increase development efforts and technology features and functions.
|
|
•
|
The anticipated benefits from the acquisition may not be achieved, including as a result of loss of customers or personnel of the target, other difficulties in supporting and transitioning the target’s customers, the inability to realize expected synergies from an acquisition or negative culture effects arising from the integration of new personnel.
|
|
•
|
We may face difficulties in integrating the personnel, technologies, solutions, operations, and existing contracts of the acquired business.
|
|
•
|
We may fail to identify all of the problems, liabilities or other shortcomings or challenges of an acquired company, technology or solution, including issues related to intellectual property, solution quality or architecture, income tax and other regulatory compliance practices, revenue recognition or other accounting practices or employee or customer issues.
|
|
•
|
To pay for future acquisitions, we could issue additional shares of our common stock or pay cash. Issuance of shares would dilute stockholders. Use of cash reserves could diminish our ability to respond to other opportunities or challenges. Borrowing to fund any cash purchase price would result in increased fixed obligations and could also include covenants or other restrictions that would impair our ability to manage our operations.
|
|
•
|
Acquisitions expose us to the risk of assumed known and unknown liabilities including contract, tax, and other obligations incurred by the acquired business, for which indemnity obligations, escrow arrangements or insurance are not available or not sufficient to provide coverage.
|
40
|
•
|
New business acquisitions can generate significant intangible assets that result in substantial related amortization charges and possible impairments.
|
|
•
|
The operations of acquired businesses, or our adaptation of those operations, may require that we apply revenue recognition or other accounting methodologies, assumptions, and estimates that are different from those we use in our current business, which could complicate our financial statements, expose us to additional accounting and audit costs, and increase the risk of accounting errors.
|
|
•
|
Acquired businesses may have insufficient internal controls that we must remediate, and the integration of acquired businesses may require us to modify or enhance our own internal controls, in each case resulting in increased administrative expense and risk that we fail to comply with the requirements of Section 404 or that our independent registered public accounting firm is unable to express an opinion as to the effectiveness of our internal control over financial reporting, resulting in late filing of our periodic reports, loss of investor confidence, regulatory investigations, and litigation.
|
If we fail to attract, motivate, train and retain highly qualified engineering, marketing, sales and management personnel, our ability to execute our business strategy could be impaired.
We rely to a significant degree upon our founder, Chief Executive Officer and Chief Product Architect, Frank Addante; our President, Gregory R. Raifman; and our Chief Operating Officer and Chief Financial Officer, Todd Tappin, for their strategic vision, industry knowledge, management execution and leadership. The loss of any of them would have a significant adverse effect upon our business.
In addition, our success depends significantly upon our ability to recruit, train, motivate, and retain key technology, engineering, sales and management personnel. We are a technology-driven company and the innovation and delivery of complex solutions at massive scale upon which our success depends are technological and engineering problems. It is imperative that we have highly skilled mathematicians, computer scientists, engineers and engineering management, and appropriately qualified personnel can be difficult to recruit and retain. In addition, as we execute on our international expansion strategy, we will encounter staffing challenges that are unique to a particular country or region, such as recruiting and retaining qualified personnel in foreign countries and difficulty managing such personnel and integrating them into our culture. Skilled and experienced management is critical to our ability to execute against our strategic vision and maintain our performance through the growth and change we anticipate. For certain of our employees, including our CEO, a significant portion of their equity ownership is vested. As a result, it may be more difficult, and require additional equity awards, for us to continue to retain and motivate these team members.
Competition for employees with experience in our industry can be intense, particularly in California, New York and London, where our operations and the operations of other digital media companies are concentrated and where other technology companies compete for management and engineering talent. Other employers may be able to provide better compensation, more diverse opportunities and better chances for career advancement. None of our founders, officers or other key employees has an employment agreement for a specific term, and any of such individuals may terminate his or her employment with us at any time.
It can be difficult, time-consuming, and expensive to recruit personnel with the combination of skills and attributes required to execute our business strategy, and we may be unable to hire or retain sufficient numbers of qualified individuals in the markets where we do business or plan to do business. New hires require significant training and it may take significant time before they achieve full productivity. As a result, we may incur significant costs to attract and retain employees, including significant expenditures related to salaries and benefits and compensation expenses related to equity awards, and we may lose new employees to our competitors or other companies before we realize the benefit of our investment in recruiting and training. Moreover, new employees may not be or become as productive as we expect, and we may face challenges in adequately or appropriately integrating them into our workforce and culture. In addition, as we move into new geographies, we will need to attract and recruit skilled employees in those areas. We have little experience with recruiting in geographies outside of the United States, and may face additional challenges in attracting, integrating and retaining international employees.
Even if we are successful in hiring qualified new employees, we may be subject to allegations that we have improperly solicited such employees while they remained employed by our competitors, that such employees have improperly solicited other colleagues of theirs employed by the same competitors, or that such employees have divulged proprietary or other confidential information to us in violation of their agreements with such competitors.
41
Our proprietary rights may be difficult to enforce, which could enable others to copy or use aspects of our solution without compensating us, thereby eroding our competitive advantages and harming our business.
Our success depends, in part, on our ability to protect proprietary methods and technologies that we develop or otherwise acquire, so that we can prevent others from using our inventions and proprietary information. If we fail to protect our intellectual property rights adequately, our competitors might gain access to our technology, and our business might be adversely affected. We rely on trademark, copyright, trade secret laws, confidentiality procedures and contractual provisions to protect our proprietary methods and technologies. Our patent strategy is still in its early stages and, while we have four issued patents, seven pending U.S. patent applications and three pending patent applications in other jurisdictions, valid patents may not be issued from our pending applications. Further, the claims of our issued patents or the claims eventually allowed on any pending applications may not be sufficiently broad to protect our technology or offerings and services. Any issued patents may be challenged, invalidated or circumvented, and any rights granted under these patents may not actually provide adequate defensive protection or competitive advantages to us. Additionally, the process of obtaining patent protection is expensive and time-consuming, and we may not be able to prosecute all necessary or desirable patent applications at a reasonable cost or in a timely manner. Additional uncertainty may result from changes to intellectual property legislation enacted in the United States, including the recent America Invents Act, and other countries, and from interpretations of the intellectual property laws of the United States and other countries by applicable courts and agencies. Accordingly, despite our efforts, we may be unable to obtain adequate patent protection, or to prevent third parties from infringing upon or misappropriating our intellectual property.
Unauthorized parties may attempt to copy aspects of our technology or obtain and use information that we regard as proprietary. We generally enter into confidentiality and/or license agreements with our employees, consultants, vendors and buyers, and generally limit access to and distribution of our proprietary information. However, steps taken by us may not prevent misappropriation of our technology and proprietary information or infringement of our intellectual property rights. Policing unauthorized use of our technology and intellectual property is difficult. Effective trade secret, copyright, trademark, domain name and patent protection are expensive to develop and maintain, both in terms of obtaining and maintaining such rights and the costs of defending our rights. We may be required to protect our intellectual property in an increasing number of jurisdictions, a process that is expensive and may not be successful or which we may not pursue in every location. We may, over time, increase our investment in protecting our intellectual property through additional patent filings, which could be expensive and time-consuming and which may not result in issued patents. Our competitors and others could attempt to capitalize on our brand recognition by using domain names or business names similar to ours, and we may be unable to prevent third parties from acquiring or using domain names and other trademarks that infringe on, are similar to, or otherwise decrease the value of our brands, trademarks or service marks. In addition, the laws of some foreign countries may not be as protective of intellectual property rights as those of the United States, and mechanisms for enforcement of our proprietary rights in such countries may be inadequate. Also, despite the steps we have taken to protect our proprietary rights, it may be possible for unauthorized third parties to copy or reverse engineer aspects of our technology or otherwise obtain and use information that we regard as proprietary, or to develop technologies similar or superior to our technology or design around our proprietary rights.
From time to time, legal action by us may be necessary or appropriate to enforce our intellectual property rights, to protect our trade secrets, to determine the validity and scope of the proprietary rights of others, or to defend against claims of infringement. Regardless of the ultimate success of the litigation, such litigation could result in substantial costs and the diversion of limited resources and could negatively affect our business, operating results and financial condition, and might not be successful. If we are unable to protect our proprietary rights (including aspects of our technology solution) we may find ourselves at a competitive disadvantage to others who have not incurred the same level of expense, time and effort to create and protect their technology and intellectual property.
We may be subject to intellectual property rights claims by third parties, which are costly to defend, could require us to pay significant damages and could limit our ability to use certain technologies and intellectual property.
The digital advertising industry is characterized by the existence of large numbers of patents, copyrights, trademarks, trade secrets and other intellectual property and proprietary rights. Companies in this industry are often required to defend against litigation claims that are based on allegations of infringement or other violations of intellectual property rights. Our technologies may not be able to withstand any third-party claims or rights against their use.
Third parties may assert claims of infringement or misappropriation of intellectual property rights in proprietary technology against us or third parties for which we may be liable or have an indemnification obligation. We cannot be certain that we are not infringing or violating any third-party intellectual property rights. From time to time, we or buyers and sellers may be subject to legal proceedings relating to our solution or underlying technology and the intellectual property rights of others, particularly as we expand the complexity and scope of our business. As a result of disclosure of information in filings required of a public company, our business and financial condition will become more visible, which may result in threatened or actual litigation, including by competitors and other third parties.
42
Regardless of whether claims that we are infringing patents or infringing or misappropriating other intellectual property rights have any merit, these claims are time-consuming and costly to evaluate and defend, and can impose a significant burden on management and employees. The outcome of any claim is inherently uncertain, and we may receive unfavorable interim or preliminary rulings in the course of litigation. There can be no assurances that favorable final outcomes will be obtained in all cases. We may decide to settle lawsuits and disputes on terms that are unfavorable to us. Some of our competitors have substantially greater resources than we do and are able to sustain the costs of complex intellectual property litigation to a greater degree and for longer periods of time than we could.
Although third parties may offer a license to their technology or intellectual property, the terms of any offered license may not be acceptable and the failure to obtain a license or the costs associated with any license could cause our business, results of operations or financial condition to be materially and adversely affected. In addition, some licenses may be non-exclusive, and therefore our competitors may have access to the same technology or intellectual property licensed to us. Alternatively, we may be required to develop non-infringing technology or to make other changes, such as to our branding, which could require significant effort and expense and ultimately may not be successful. Furthermore, a successful claimant could secure a judgment or we may agree to a settlement that prevents us from distributing certain products or performing certain services or that requires us to pay substantial damages, including treble damages if we are found to have willfully infringed such claimant’s patents or copyrights, royalties or other fees. Claims of intellectual property infringement or misappropriation also could result in injunctive relief against us, or otherwise result in delays or stoppages in providing all or certain aspects of our solution. Any of the foregoing could adversely affect our relationships with current or future buyers and sellers.
We are subject to government regulations concerning our employees, including wage-hour laws and taxes.
We are subject to applicable rules and regulations relating to our relationship with our employees, including health benefits, unemployment and similar taxes, overtime and working conditions, immigration status and classification of employee benefits for tax purposes. Legislated increases in additional labor cost components, such as employee benefit costs, workers’ compensation insurance rates, compliance costs and fines, as well as the cost of litigation in connection with these regulations, would increase our labor costs. Moreover, we are subject to various laws and regulations in federal, state, and foreign jurisdictions that impose varying rules and obligations on us with respect to the classification of employee benefits for income tax and other purposes and that require us to report and/or withhold in respect of such items. In addition, many employers nationally have been subject to actions brought by governmental agencies and private individuals under wage-hour laws on a variety of claims, such as improper classification of workers as exempt from overtime pay requirements and failure to pay overtime wages properly, and failure to provide meal and rest breaks or pay for missed breaks, with such actions sometimes brought as class actions, and these actions can result in material liabilities and expenses. Should we be subject to employment litigation, such as actions involving wage-hour, overtime, break and working time, it may distract our management from business matters and result in increased labor costs.
Risks Related to Our International Business Strategy
Our international operations and expansion plans require increased expenditures and impose additional risks and compliance imperatives, and failure to execute successfully our international plans will adversely affect our growth and operating results.
We have numerous operations outside of the United States, in Northern Europe, Australia, Japan, Singapore and Brazil. Our expansion plans are also focused on the rest of Asia and other Latin American countries, and other countries in Europe, but many of these operations are nascent. We view further international expansion as imperative, and we expect our international operations to contribute significantly to our future growth, particularly through the mobile business, which could provide access to vast user populations in China and the developing world. However, our experience operating outside the United States is still limited, and our international employees currently represent a modest portion of our headcount. Achievement of our international objectives will require a significant amount of attention from our management, finance, analytics, operations, sales and engineering teams, as well as significant investment in developing the technology infrastructure necessary to deliver our solution and establishing sales, delivery, support, and administrative capabilities in the countries where we operate. Attracting new buyers and sellers outside the United States may require more time and expense than in the United States, in part due to the need to educate such buyers and sellers about our solution, and we may not be successful in establishing and maintaining these relationships. In addition, our international operations will require us to develop and administer our internal controls and legal and compliance practices in countries with different cultural norms, legal requirements and business practices than the United States.
43
International operations also impose risks and challenges in addition to those faced in the United States, including management of a distributed workforce; the need to adapt our offering to satisfy local requirements and standards (including differing privacy policies that are sometimes more stringent); laws and business practices that may favor local competitors; legal requirements or business expectations that agreements be drafted and negotiated in the local language; longer accounts receivable payment cycles and other collection difficulties; the effect of global and regional recessions and economic and political instability; potentially adverse tax consequences in the United States and abroad; staffing challenges, including difficulty in recruiting and retaining qualified personnel as well as managing such a diversity in personnel; reduced or ineffective protection of our intellectual property rights in some countries; and costs and restrictions affecting the repatriation of funds to the United States.
One or more of these requirements and risks may make our international operations more difficult and expensive or less successful than we expect, and may preclude us from operating in some markets. There is no assurance that our international expansion efforts will be successful, and we may not generate sufficient revenue or margins from our international business to cover our expenses or contribute to our growth.
Operating in multiple countries requires us to comply with different legal and regulatory requirements.
Our international operations subject us to laws and regulations of multiple jurisdictions, as well as U.S. laws governing international operations. These various laws and regulations are often evolving and sometimes conflict. For example, the Foreign Corrupt Practices Act, or FCPA, and comparable foreign laws and regulations (including the U.K. Bribery Act) prohibit improper payments or offers of payments to foreign governments and their officials and political parties by U.S. and other business entities for the purpose of obtaining or retaining business. Other laws and regulations prohibit bribery of private parties and other forms of corruption. As we expand our international operations, there is some risk of unauthorized payment or offers of payment or other inappropriate conduct by one of our employees, consultants, agents or other contractors, which could constitute a violation by us of various laws, including the FCPA, even though such parties are not always subject to our control. Safeguards we implement to discourage these practices may prove to be ineffective and violations of the FCPA and other laws may result in severe criminal or civil sanctions, or other liabilities or proceedings against us, including class action lawsuits and enforcement actions from the SEC, Department of Justice and international regulators. Other laws applicable to our international business include local employment, tax, privacy, data security and intellectual property protection laws and regulations, including restrictions on movement of information about individuals beyond national borders. In some cases, buyers and sellers operating in non-U.S. markets may impose additional requirements on our non-U.S. business in efforts to comply with their interpretation of their own or our legal obligations. These requirements may differ significantly from the requirements applicable to our business in the United States and may require engineering, infrastructure and other costly resources to accommodate, and may result in decreased operational efficiencies and performance. As these laws continue to evolve and we expand to more jurisdictions, compliance will become more complex and expensive, and the risk of non-compliance will increase.
Compliance with complex foreign and U.S. laws and regulations that apply to our international operations increases our cost of doing business abroad, and violation of these laws or regulations may interfere with our ability to offer our solution competitively in one or more countries, expose us or our employees to fines and penalties, and result in the limitation or prohibition of our conduct of business. As we continue to grow, we will need to expand into new geographies and learn the regulatory and business laws and customs of each new geography. For example, we are planning to add a data center in Hong Kong, which would be our first business presence in China, a country where intellectual property and other proprietary information may not be protected to the same extent as in the United States and Europe, and where government could exercise significant influence or control over our business operations. We also expect our growing mobile business to rely extensively on China. Intellectual property and other proprietary information may not be protected in China to the same extent as in the United States and Europe, and the Chinese government could exercise significant influence or control over our business operations. The Chinese government has recently announced plans to require certain foreign companies operating in China to submit their software and other technology to intrusive security testing, include indigenous Chinese intellectual property and encryption technology in their software, disclose source code and other proprietary information to the Chinese government, and engineer their products to restrict the flow of data outside of China. It is not clear whether such requirements would apply to us, but our operations could attract Chinese government scrutiny as a result of our significant consumer reach and large database. Also, any censorship of websites and content served on computers in mainland China could result in latency with respect to our services in mainland China if our servers are located in Hong Kong or otherwise outside of mainland China, which could significantly impair our ability to process the auction impressions on a timely basis or our ability generally to facilitate the serving of advertisements in China. These factors could result in increased operational expense, and if we are not able to comply with these new regulatory requirements, our business, results of operations and prospects may be adversely affected.
44
We are subject to governmental export and import controls that could subject us to liability or impair our ability to compete in international markets.
Our operations are subject to U.S. export controls, specifically the Export Administration Regulations, or EAR, and economic sanctions enforced by the Office of Foreign Assets Control. These regulations provide that encryption technology may be exported outside of the United States only with the required export authorizations, including by license, license exception or other appropriate government authorizations, which may require the filing of an encryption registration and classification request. Furthermore, U.S. export control laws and economic sanctions prohibit the shipment of certain products and services to countries, governments and persons targeted by U.S. sanctions. We incorporate encryption technology into the servers that operate our solution. As a result of locating some servers in data centers outside of the United States, we may have exported encryption technology prior to obtaining the required export authorizations and/or submitting the required requests, including a classification request and/or request for an encryption registration number, resulting in a possible inadvertent violation of U.S. export control laws. As a result, in January 2014, we filed a Voluntary Self Disclosure with the U.S. Department of Commerce’s Bureau of Industry and Security, or BIS, concerning these potential violations, and in June 2014, we submitted reports concerning our exports of encryption items with the BIS. While the potential penalties for violations of the EAR include a monetary fine of up to $250,000 or twice the value of the transaction, whichever is greater, per violation and/or a denial of export privileges under the EAR, we do not expect a penalty to be assessed against us in connection with our Voluntary Self Disclosure and, if one is assessed, we do not expect it to be material.
In addition, various countries regulate the import of certain encryption technology, including through import permit and license requirements, and have enacted laws that could limit our ability to deploy our technology or could limit our customers’ ability to use our solution in those countries. Changes in our technology or changes in export and import regulations may create delays in the introduction of our solution or the deployment of our technology in international markets, prevent our customers with international operations from using our solution globally or, in some cases, prevent the export or import of our technology to certain countries, governments or persons altogether. Any change in export or import regulations, economic sanctions or related legislation, shift in the enforcement or scope of existing regulations, or change in the countries, governments, persons or technologies targeted by such regulations, could result in decreased use of our solution by, or in our decreased ability to export our technology to, international markets. Any decreased use of our solution or limitation on our ability to export our technology or sell our solution would likely adversely affect our business, financial condition and results of operations.
Fluctuations in the exchange rates of foreign currencies could result in currency transaction losses that negatively impact our financial results.
We currently have transactions denominated in various non-U.S. currencies, and may, in the future, have sales denominated in the currencies of additional countries. In addition, we incur a portion of our expenses in many of these same currencies, as well as other currencies, and to the extent we need to convert U.S. Dollars or a different foreign currency to pay expenses, we are exposed to unfavorable changes in exchange rates and added transaction costs. We expect international sales and transactions to become an increasingly important part of our business. Such sales and transactions may be subject to unexpected regulatory requirements and other barriers. Any fluctuation in the exchange rates of these foreign currencies may negatively impact our business, financial condition and results of operations. We have not previously engaged in foreign currency hedging. If we decide to hedge our foreign currency exposure, we may not be able to hedge effectively due to lack of experience, unreasonable costs or illiquid markets. In addition, those activities may be limited in the protection they provide us from foreign currency fluctuations and can themselves result in losses.
Risks Related to Our Internal Controls and Finances
We have previously identified certain material weaknesses in our internal control over financial reporting. Failure to maintain effective internal controls could cause our investors to lose confidence in us and adversely affect the market price of our common stock. If our internal controls are not effective, we may not be able to accurately report our financial results or prevent fraud.
Section 404 of the Sarbanes-Oxley Act of 2002, or Section 404, requires that we maintain internal control over financial reporting that meets applicable standards. We may err in the design or operation of our controls, and all internal control systems, no matter how well designed and operated, can provide only reasonable assurance that the objectives of the control system are met. Because there are inherent limitations in all control systems, there can be no absolute assurance that all control issues have been or will be detected. If we are unable, or are perceived as unable, to produce reliable financial reports due to internal control deficiencies, investors could lose confidence in our reported financial information and operating results, which could result in a negative market reaction.
45
When we are no longer an “emerging growth company” we will be required, pursuant to Section 404, to furnish a report by management on, among other things, the effectiveness of our internal control over financial reporting, and we will need to disclose any material weaknesses identified by our management in our internal control over financial reporting. We will also need to provide a statement that our independent registered public accounting firm has issued an opinion on our internal control over financial reporting, provided that our independent registered public accounting firm will not be required to attest to the effectiveness of our internal control over financial reporting until our first annual report required to be filed with the Securities and Exchange Commission, or SEC, following the later of the date we are deemed to be an “accelerated filer” or a “large accelerated filer,” each as defined in the Exchange Act, or the date we are no longer an “emerging growth company,” as defined in the Jumpstart Our Businesses Act of 2012, or the JOBS Act.
We have previously identified certain material weaknesses in our internal controls resulting from:
|
•
|
a historical lack of qualified personnel within our accounting function that possessed an appropriate level of expertise to perform certain functions;
|
|
•
|
absence of formalized and documented policies and procedures;
|
|
•
|
absence of appropriate review and oversight responsibilities;
|
|
•
|
lack of an effective and timely financial close process;
|
|
•
|
lack of general information technology controls over financially significant applications, including inadequate segregation of duties; and
|
|
•
|
lack of regular evaluations of the effectiveness of internal controls over financial reporting.
|
We commenced measures to remediate these material weaknesses during the third quarter of 2013, and remediation has been completed as of
December 31, 2014
. However, completion of remediation does not provide assurance that our remediated controls will continue to operate properly or that our financial statements will be free from error. There may be undetected material weaknesses in our internal control over financial reporting, as a result of which we may not detect financial statement errors on a timely basis. Moreover, in the future we may implement new offerings and engage in business transactions, such as acquisitions, reorganizations or implementation of new information systems, that could require us to develop and implement new controls and could negatively affect our internal control over financial reporting and result in material weaknesses.
We continue to develop our internal controls, processes and reporting systems in an effort to maintain the effectiveness of our internal control over financial reporting, and we expect to incur ongoing costs in this effort. However, we may not be successful in developing and maintaining adequate internal controls, which may undermine our ability to provide accurate, timely and reliable reports on our financial and operating results.
If we identify new material weaknesses in our internal control over financial reporting, if we are unable to comply with the requirements of Section 404 in a timely manner, if we are unable to assert that our internal control over financial reporting is effective, or if our independent registered public accounting firm is unable to express an opinion as to the effectiveness of our internal control over financial reporting, we may be late with the filing of our periodic reports, investors may lose confidence in the accuracy and completeness of our financial reports and the market price of our common stock could be negatively affected. As a result of such failures, we could also become subject to investigations by the stock exchange on which our securities are listed, the SEC, or other regulatory authorities, and become subject to litigation from investors and stockholders, which could harm our reputation, financial condition or divert financial and management resources from our core business.
Impairment of intangible assets could increase our expenses.
A portion of our assets consists of capitalized software development costs, goodwill and other intangible assets acquired in connection with acquisitions. Current accounting standards require us to evaluate goodwill on an annual basis and other intangibles if certain triggering events occur, and adjust the carrying value of these assets to net realizable value when such testing reveals impairment of the assets. Various factors, including regulatory or competitive changes, could affect the value of our intangible assets. If we are required to write-down the value of our goodwill or intangible assets due to impairment, our reported expenses will increase, resulting in a corresponding decrease in our reported profit.
46
If our estimates or judgments relating to our critical accounting policies are erroneous or based on assumptions that change or prove to be incorrect, our operating results could fall below the expectations of securities analysts and investors, resulting in a decline in our stock price.
The preparation of financial statements in conformity with generally accepted accounting principles in the United States, or GAAP, requires management to make estimates and assumptions that affect the amounts reported in the consolidated financial statements and accompanying notes. We base our estimates on our best judgment, historical experience, information derived from third parties, and on various other assumptions that we believe to be reasonable under the circumstances, the results of which form the basis for making judgments about the carrying values of assets, liabilities, equity, revenue and expenses that are not readily apparent from other sources. Our operating results may be adversely affected if our judgments prove to be wrong, assumptions change or actual circumstances differ from those in our assumptions, which could cause our operating results to fall below the expectations of securities analysts and investors or guidance we may have provided, resulting in a decline in our stock price. Significant assumptions and estimates used in preparing our consolidated financial statements include those related to revenue recognition, stock-based compensation and income taxes.
We report revenue on a net basis. If, in the future, we engage in transactions for which revenue is recorded on a gross basis, we may have significant increases in our revenue and decreases in our GAAP margins that do not necessarily correspond with changes in our underlying business, which could cause comparisons with prior periods to be less meaningful and make it more difficult for investors to evaluate our performance.
The recognition of our revenue is governed by certain criteria that must be met and that determine whether we report revenue either on a gross basis, as a principal, or net basis, as an agent, depending upon the nature of the sales transaction. Our revenue is currently recognized on a net basis. In the future we may engage in transactions for which revenue is recorded on a gross basis, due to substantive changes in our business, such as through acquisitions, changes to the commercial terms with buyers and sellers or structural changes to our existing business, or due to changes in accounting standards or interpretations. In that case, we may have significant increases in our revenue and decreases in our GAAP margins that do not necessarily correspond with changes in our underlying activity. We may experience significant fluctuations in revenue and margins in future periods depending upon, in part, the nature of our sales and our recognition of such revenue.
Our tax liabilities may be greater than anticipated.
The U.S. and non-U.S. tax laws applicable to our business activities are subject to interpretation. We are subject to audit by the Internal Revenue Service and by taxing authorities of the state, local and foreign jurisdictions in which we operate. Our tax obligations are based in part on our corporate operating structure, including the manner in which we develop, value, and use our intellectual property and sell our solutions, the jurisdictions in which we operate, how tax authorities assess revenue-based taxes such as sales and use taxes, the scope of our international operations and the value we ascribe to our intercompany transactions. Taxing authorities may challenge our tax positions and methodologies for valuing developed technology or intercompany arrangements, as well as our positions regarding jurisdictions in which we are subject to certain taxes, which could expose us to additional taxes and increase our worldwide effective tax rate. Any adverse outcomes of such challenges to our tax positions could result in additional taxes for prior periods, interest and penalties, as well as higher future taxes. In addition, our future tax expense could increase as a result of changes in tax laws, regulations or accounting principles, or as a result of earning income in jurisdictions that have higher tax rates. An increase in our tax expense could have a negative effect on our financial position and results of operations. Moreover, the determination of our provision for income taxes and other tax liabilities requires significant estimates and judgment by management, and the tax treatment of certain transactions is uncertain. Although we believe we will make reasonable estimates and judgments, the ultimate outcome of any particular issue may differ from the amounts previously recorded in our financial statements and any such occurrence could materially affect our financial position and results of operations.
47
Our ability to use our net operating losses and tax credit carryforwards to offset future taxable income may be subject to certain limitations, which could result in higher tax liabilities.
Our ability to fully utilize our net operating loss and tax credit carryforwards to offset future taxable income may be limited. At
December 31, 2014
, we had U.S. federal net operating loss carryforwards, or NOLs, of approximately
$65.4 million
, state NOLs of approximately
$61.5 million
, federal research and development tax credit carryforwards, or credit carryforwards, of approximately
$4.3 million
, and state credit carryforwards of approximately
$3.4 million
. A lack of future taxable income would adversely affect our ability to utilize these NOLs and credit carryforwards. In addition, under Section 382 and 383 of the Internal Revenue Code of 1986, as amended, or the Code, and comparable state income tax laws, a corporation that undergoes an “ownership change” is subject to limitations on its ability to utilize its NOLs and credit carryforwards to offset future taxable income following the ownership change. As a result, future changes in our stock ownership, including because of issuance of shares of common stock in connection with acquisitions or other direct or indirect changes in our ownership that may be outside of our control, could result in limitations on our ability to fully utilize our NOLs and credit carryforwards. The Company had an ownership change in January 2008 and $2.3 million of federal and state NOLs are already subject to limitation under Section 382. Additionally, approximately $3.4 million of our federal NOLs and approximately $3.4 million of our state NOLs were generated during the pre-acquisition period by corporations that we acquired, and thus those NOLs already are subject to limitation under Section 382 of the Code and comparable state income tax laws. In addition, depending on the level of our taxable income, all or a portion of our NOLs and credit carryforwards may expire unutilized, which could prevent us from offsetting future taxable income by the entire amount of our current and future NOLs and credit carryforwards. We have recorded a full valuation allowance related to our NOLs, credit carryforwards and other net deferred tax assets due to the uncertainty of the ultimate realization of the future benefits of those assets. To the extent we determine that all, or a portion of, our valuation allowance is no longer necessary, we will reverse the valuation allowance and recognize an income tax benefit in the reported financial statement earnings in that period. Once the valuation allowance is eliminated or reduced, its reversal will no longer be available to offset our current financial statement tax provision in future periods.
We may require additional capital to support growth, and such capital might not be available on terms acceptable to us, if at all. Inability to obtain financing could limit our ability to conduct necessary operating activities and make strategic investments.
We intend to continue to make investments in pursuit of our strategic objectives and to support our business growth. Various business challenges may require additional funds, including the need to respond to competitive threats or market evolution by developing new solutions and improving our operating infrastructure, either through additional hiring or acquisition of complementary businesses or technologies, or both. In addition, we could incur significant expenses or shortfalls in anticipated cash generated as a result of unanticipated events in our business or competitive, regulatory, or other changes in our market.
Our available cash and cash equivalents, including the proceeds from our IPO, the cash we anticipate generating from operations and our available line of credit under our credit facility may not be adequate to meet our capital needs, and therefore we may need to engage in equity or debt financings to secure additional funds. We may not be able to obtain additional financing on terms favorable to us, if at all. If we are unable to obtain adequate financing on terms satisfactory to us when we require it, our ability to continue to support our business growth and respond to business challenges could be significantly impaired, and our business may be adversely affected.
If we do raise additional funds through future issuances of equity or convertible debt securities, our existing stockholders could suffer significant dilution, and any new equity securities we issue could have rights, preferences and privileges superior to those of holders of our common stock. Any debt financing that we secure in the future could involve restrictive covenants relating to our capital raising activities and other financial and operational matters, including the ability to pay dividends. This may make it more difficult for us to obtain additional capital and to pursue business opportunities, including potential acquisitions. In addition, if we issue debt, the holders of that debt would have prior claims on the Company’s assets, and in case of insolvency, the claims of creditors would be satisfied before distribution of value to equity holders, which would result in significant reduction or total loss of the value of our equity.
Our credit facility subjects us to operating restrictions and financial covenants that impose risk of default and may restrict our business and financing activities.
On September 27, 2011, we entered into a loan and security agreement with Silicon Valley Bank that, as amended to date, provides a senior secured revolving credit facility in the aggregate principal amount of $40 million. At
December 31, 2014
, we had
no
amounts outstanding under this loan and security agreement. Borrowings under this agreement are secured by substantially all of our tangible personal property assets and all of our intangible assets are subject to a negative pledge in favor of Silicon Valley Bank. This credit facility is subject to certain financial ratio and liquidity covenants, as well as restrictions that limit our ability, among other things, to:
|
•
|
dispose of or sell our assets;
|
|
•
|
make material changes in our business or management;
|
48
|
•
|
consolidate or merge with other entities;
|
|
•
|
incur additional indebtedness;
|
|
•
|
create liens on our assets;
|
|
•
|
pay dividends;
|
|
•
|
make investments;
|
|
•
|
enter into transactions with affiliates; and
|
|
•
|
pay off or redeem subordinated indebtedness.
|
These covenants may restrict our ability to finance our operations and to pursue our business activities and strategies. Our ability to comply with these covenants may be affected by events beyond our control. In the past, we were not compliant with certain administrative covenants. Although the bank waived such noncompliance or agreed to amend certain covenants in the past, there is no guarantee it will do so in the future. If a default were to occur and not be waived, such default could cause, among other remedies, all of the outstanding indebtedness under our loan and security agreement to become immediately due and payable. In such an event, our liquid assets might not be sufficient to meet our repayment obligations, and we might be forced to liquidate collateral assets at unfavorable prices or our assets may be foreclosed upon and sold at unfavorable valuations.
Our ability to renew our existing credit facility, which matures in September 2018, or to enter into a new credit facility to replace or supplement the existing facility may be limited due to various factors, including the status of our business, global credit market conditions, and perceptions of our business or industry by sources of financing. In addition, if credit is available, lenders may seek more restrictive covenants and higher interest rates that may reduce our borrowing capacity, increase our costs, and reduce our operating flexibility.
If we do not have or are unable to generate sufficient cash available to repay our debt obligations when they become due and payable, either upon maturity or in the event of a default, we may not be able to obtain additional debt or equity financing on favorable terms, if at all. Our inability to obtain financing may negatively impact our ability to operate and continue our business as a going concern.
Risks Related to the Securities Markets and Ownership of our Common Stock
The price of our common stock may be volatile and the value of an investment in our common stock could decline.
Technology stocks have historically experienced high levels of volatility. The trading price of our common stock has fluctuated substantially and may continue to do so. These fluctuations could result in significant decreases in the value of an investment in our common stock. Factors that could cause fluctuations in the trading price of our common stock include the following:
|
•
|
announcements of new offerings, products, services or technologies, commercial relationships, acquisitions or other events by us or our competitors;
|
|
•
|
price and volume fluctuations in the overall stock market from time to time;
|
|
•
|
significant volatility in the market price and trading volume of technology companies in general and of companies in the digital advertising industry in particular;
|
|
•
|
fluctuations in the trading volume of our shares or the size of our public float;
|
|
•
|
actual or anticipated changes or fluctuations in our results of operations;
|
|
•
|
actual or anticipated changes in the expectations of investors or securities analysts, and whether our results of operations meet these expectations;
|
|
•
|
litigation involving us, our industry, or both;
|
|
•
|
regulatory developments in the United States, foreign countries, or both;
|
|
•
|
general economic conditions and trends;
|
|
•
|
major catastrophic events;
|
|
•
|
breaches or system outages;
|
|
•
|
sales of large amounts of our common stock or the perception that such sales could occur, as a result of open trading windows under our Insider Trading Policy, pre-arranged sales by insiders under Rule 10b5-1 promulgated under the Exchange Act, sales to cover taxes upon vesting of restricted stock awards or RSUs, or other factors;
|
|
•
|
departures of officers or other key employees; or
|
49
|
•
|
an adverse impact on the company resulting from other causes, including any of the other risks described in this Annual Report.
|
In addition, if the market for technology stocks or the stock market, in general, experiences a loss of investor confidence, the trading price of our common stock could decline for reasons unrelated to our business, results of operations or financial condition. The trading price of our common stock might also decline in reaction to events that affect other companies in our industry even if these events do not directly affect us. In the past, volatility in the market price of a company’s securities has often resulted in securities litigation being brought against that company. Declines in the price of our common stock, even following increases, may result in securities litigation against us, which would result in substantial costs and divert our management’s attention and resources from our business.
Sales of substantial amounts of our common stock in the public markets, or the perception that sales might occur, could reduce the price of our common stock and may dilute the voting power and ownership interest of investors in our common stock.
Sales of a substantial number of shares of our common stock in the public market, or the perception that these sales could occur, could adversely affect the market price of our common stock and may make it more difficult for investors in our common stock to sell their shares at a time and price that they deem appropriate. As of
February 27, 2015
, we had
37,750,998
shares of common stock outstanding, including
1,705,378
shares of restricted stock issued pursuant to our 2007 Stock Incentive Plan, none of which were vested, but excluding shares of common stock issuable upon exercise of outstanding stock options and vesting of restricted stock units. As of
February 27, 2015
, we had outstanding options to purchase an aggregate of
6,206,758
shares of our common stock issued pursuant to our 2007 Stock Incentive Plan, of which
3,591,402
were vested at a weighted-average exercise price of
$6.23
per share, and options to purchase an aggregate of
1,076,150
shares of our common stock issued pursuant to our 2014 Equity Incentive Plan, of which
312
were vested at a weighted-average exercise price of
$12.15
per share, options to purchase an aggregate of
99,666
shares of our common stock issued pursuant to the iSocket, Inc. 2009 Equity Incentive Plan, of which
63,135
were vested at a weighted-average exercise
$3.93
per share, and
115,000
shares of our common stock issued pursuant to our 2014 Inducement Grant Equity Incentive Plan, none of which were vested. Furthermore, as of
February 27, 2015
, we had outstanding
2,091
restricted stock units issued pursuant to our 2007 Stock Incentive Plan,
801,834
restricted stock units issued pursuant to our 2014 Equity Incentive Plan, and
114,050
restricted stock units issued pursuant to our 2014 Inducement Grant Equity Incentive Plan. All of these outstanding stock options, together with an additional
2,958,475
shares of our common stock reserved for issuance under our 2014 Equity Incentive Plan,
137,577
shares of common stock reserved under our iSocket, Inc. 2009 Equity Incentive Plan,
770,950
shares of common stock reserved under our 2014 Inducement Grant Equity Incentive Plan,
896,927
shares of common stock reserved under our 2014 Employee Stock Purchase Plan, and any increase in the shares available pursuant to the plans’ evergreen provisions (if applicable), are registered for offer and sale on Form S-8 under the Securities Act of 1933. We also intend to register the offer and sale of all other shares of common stock that may be authorized under our current or future equity compensation plans, issued under equity plans we may assume in acquisitions, or issued as inducement awards under New York Stock Exchange rules. Shares registered under these registration statements on Form S-8 will be available for sale in the public market subject to vesting arrangements and exercise of options, our Insider Trading Policy trading blackouts, and the restrictions of Rule 144 in the case of our affiliates.
Under our Insider Trading Policy, we impose trading blackouts during the period beginning on the first day of the last month of each quarter and ending after two trading days following the filing of our next quarterly report on Form 10-Q or Annual Report on Form 10-K. A substantial portion of the equity issued to certain of our officers and employees is in the form of stock options that are vested and in-the-money, and can be exercised for shares that are eligible for sale during open trading windows. Sales of a substantial number of such shares, or the perception that such sales may occur, could cause our share price to fall or make it more difficult for investors to sell our common stock at a time and price that they deem appropriate.
Pre-IPO investors have rights, subject to some conditions, to require us to file registration statements covering the sale of their shares in registration statements that we may file for ourselves or other stockholders.
We may issue our shares of common stock or securities convertible into our common stock from time to time in connection with financings, acquisitions, investments or otherwise. Any such issuance could result in substantial dilution to our existing stockholders and cause the trading price of our common stock to decline.
50
Insiders have substantial control over us, which could limit investors’ ability to influence the outcome of key transactions, including a change of control.
Our directors, executive officers and stockholders who own greater than 5% of our outstanding common stock, in the aggregate, beneficially own approximately
53%
of the shares of our common stock outstanding as of
February 27, 2015
. As a result, these stockholders will be able to influence or control matters requiring approval by our stockholders, including the election of directors and the approval of mergers, acquisitions or other extraordinary transactions. They may also have interests that differ from other investors and may vote in a manner that is adverse to investors’ interests. This concentration of ownership may have the effect of deterring, delaying or preventing a change of control of the company, could deprive our stockholders of an opportunity to receive a premium for their common stock as part of a sale of the company, and might ultimately affect the market price of our common stock.
The trading market for our stock is new and not fully developed, and small trading volumes can contribute to sudden declines in price and make it more difficult to sell significant numbers of shares quickly without adversely affecting the market price for our stock.
Our common stock has been publicly traded only since
April 2, 2014
, and the trading volumes for our stock have been relatively small due to the fact that only
18%
of our outstanding shares, at the time of the initial public offering, were sold in our initial public offering, and the holders of the balance of our outstanding common stock were subject to lock-up agreements that prohibited sales of their shares until September 29, 2014. Now that the lock-ups have expired, we expect more shares to be sold in the public market. In addition, we have and may continue to make acquisitions that include the additional issuance of stock, which may increase dilution and potentially increase the number of shares available for sale. However, our trading volumes may remain relatively small for some time for various reasons, including the fact that we are new to the public markets and not well known to analysts, investors, and others who could influence demand for our shares. Further, because we are a relatively small company without an established history of profitability, the range of investors willing to invest in our shares may be relatively limited. As a result of these factors, our shares can be susceptible to sudden, rapid declines in price, especially when large blocks of shares are sold by investors or upon exercise of employee stock options or vesting of restricted stock and restricted stock unit awards and the subsequent or concurrent sale of shares to cover the holders’ tax obligations. Sales of substantial amounts of common stock by stockholders, or even the potential for such sales, may cause the market price to decline, which could make it more difficult for our stockholders to sell their shares at the time or price they desire, and could also impair our ability to raise capital through the sale of equity securities.
Our business could be negatively affected as a result of actions of activist stockholders.
Campaigns by stockholders to effect changes at publicly traded companies are sometimes led by investors seeking to increase short-term stockholder value through actions such as financial restructuring, increased debt, special dividends, stock repurchases or sales of assets or the entire company. If we are targeted by an activist stockholder in the future, the process could be costly and time-consuming, disrupt our operations and divert the attention of management and our employees from executing our strategic plan. Additionally, perceived uncertainties as to our future direction as a result of stockholder activism or changes to the composition of our board of directors may lead to the perception of a change in the direction of our business, instability or lack of continuity, which may be exploited by our competitors, cause concern to current or potential buyers and sellers on our platform, and make it more difficult to attract and retain qualified personnel. If buyers and/or sellers choose to delay, defer or reduce transactions with us or through our platform or transact with our competitors instead of us because of any such issues, then our revenue, earnings and operating cash flows could be adversely affected.
The requirements of being a public company may strain our resources, divert our management’s attention and affect our ability to attract and retain qualified board members.
As a public company, we are subject to the reporting requirements of the Exchange Act, and are required to comply with the applicable requirements of the Sarbanes-Oxley Act and the Dodd-Frank Wall Street Reform and Consumer Protection Act, the listing requirements of the New York Stock Exchange, and other applicable securities rules and regulations. Among other things, we must file annual, quarterly and current reports with respect to our business and results of operations, maintain effective disclosure controls and procedures and internal control over financial reporting, and comply with various requirements regarding the composition and operation of our board of directors. Compliance with these rules and regulations requires significant resources and management oversight, increases our legal and financial compliance costs, makes some activities more difficult, time-consuming or costly and increases demand on our systems and resources. As a result, management’s attention and company resources may be diverted from other business concerns. Although we have already hired additional employees to help us comply with these requirements, we may need to hire even more employees in the future, which would increase our costs.
51
The risks and costs associated with being a public company and complying with related rules and regulations have also made it significantly more expensive for us to obtain director and officer liability insurance, and we may be required to accept reduced coverage or incur substantially higher costs to obtain coverage as a result of risks or claims we encounter. These factors could also make it more difficult and expensive for us to attract and retain qualified members of our board of directors, particularly to serve on our Audit Committee and Compensation Committee, and qualified executive officers.
We are an “emerging growth company,” and we cannot be certain if the reduced disclosure requirements applicable to emerging growth companies will make our common stock less attractive to investors.
For as long as we remain an “emerging growth company,” as defined in the JOBS Act, we may take advantage of certain exemptions from various requirements that are applicable to public companies that are not “emerging growth companies.” For example, we are not required to comply with the independent auditor attestation requirements of Section 404, we may provide reduced disclosure regarding executive compensation in our periodic reports and proxy statements, and we are exempt from the requirements of holding a nonbinding advisory vote on executive compensation and stockholder approval of any golden parachute payments not previously approved. We may take advantage of these exemptions for as long as we are an “emerging growth company,” which could be as long as five years following the completion of our initial public offering, although, if we have more than $1.0 billion in annual revenue, if the market value of our common stock that is held by non-affiliates exceeds $700 million as of June 30 of any year, or we issue more than $1.0 billion of non-convertible debt over a three-year period before the end of that five-year period, we would cease to be an “emerging growth company” as of the following December 31. Investors may find our common stock less attractive because we rely on these exemptions, which could contribute to a less active trading market for our common stock, and increased volatility or reduction in our stock price.
If securities or industry analysts do not publish research or reports about our business, or publish inaccurate or unfavorable research or reports about our business, our share price and trading volume could decline.
The trading market for our common stock to some extent depends on the research and reports that securities or industry analysts publish about us or our business. We do not have any control over these analysts, and their reports or analyst consensus may not reflect our guidance, plans, or expectations. If one or more of the analysts who cover us downgrades our shares or changes their opinion of our business prospects, our share price could decline. If one or more of these analysts decreases or ceases coverage of our company, we could lose visibility in the financial markets, which could cause our share price or trading volume to decline.
We do not intend to pay dividends for the foreseeable future and, consequently, investors’ ability to achieve a return on their investment will depend on appreciation in the price of our common stock.
We have never declared or paid any dividends on our common stock. We intend to retain any earnings to finance the operation and expansion of our business, and we do not anticipate paying any cash dividends in the future. In addition, our credit facility contains restrictions on our ability to pay dividends. As a result, investors may only receive a return on their investment in our common stock if the market price of our common stock increases. In addition, our credit facility contains restrictions on our ability to pay dividends.
Provisions of our charter documents and Delaware law may inhibit a potential acquisition of the company and limit the ability of stockholders to cause changes in company management.
Our amended and restated certificate of incorporation and amended and restated bylaws include provisions, as described below, that could delay or prevent a change in control of the company, and make it difficult for stockholders to elect directors who are not nominated by the current members of our board of directors or take other actions to change company management.
|
•
|
Our certificate of incorporation gives our board of directors the authority to issue shares of preferred stock in one or more series, and to establish from time to time the number of shares in each series and to fix the price, designations, powers, preferences and relative, participating, optional or other rights, if any, and the qualifications, limitations, or restrictions of each series of the preferred stock without any further vote or action by stockholders. The issuance of shares of preferred stock may discourage, delay or prevent a merger or acquisition of the company by significantly diluting the ownership of a hostile acquirer, resulting in the loss of voting power and reduced ability to cause a takeover or effect other changes.
|
52
|
•
|
Our certificate of incorporation provides that our board of directors is classified, with only one of its three classes elected each year, and directors may be removed only for cause and only with the vote of 66
2
/
3
% of the voting power of stock outstanding and entitled to vote thereon. Further, the number of directors is determined solely by our board of directors, and because we do not allow for cumulative voting rights, holders of a majority of shares of common stock entitled to vote may elect all of the directors standing for election. These provisions could delay the ability of stockholders to change the membership of a majority of our board of directors.
|
|
•
|
Under our bylaws, only the board of directors or a majority of remaining directors, even if less than a quorum, may fill vacancies resulting from an increase in the authorized number of directors or the resignation, death or removal of a director.
|
|
•
|
Our certificate of incorporation prohibits stockholder action by written consent, so any action by stockholders may only be taken at an annual or special meeting.
|
|
•
|
Our certificate of incorporation provides that a special meeting of stockholders may be called only by the board of directors. This could delay any effort by stockholders to force consideration of a proposal or to take action, including the removal of directors.
|
|
•
|
Under our bylaws, advance notice must be given to nominate directors or submit proposals for consideration at stockholders’ meetings. This gives our board of directors time to defend against takeover attempts and could discourage or deter a potential acquirer from soliciting proxies or making proposals related to an unsolicited takeover attempt.
|
|
•
|
The provisions of our certificate of incorporation noted above may be amended only with the affirmative vote of holders of at least 66
2
/
3
% of the voting power of all of the then-outstanding shares of the company’s voting stock, voting together as a single class. The same two-thirds vote is required to amend the provision of our certificate of incorporation imposing these supermajority voting requirements. Further, our bylaws may be amended only by our board of directors or by the same percentage vote of stockholders noted above as required to amend our certificate of incorporation. These supermajority voting requirements may inhibit the ability of a potential acquirer to effect such amendments to facilitate an unsolicited takeover attempt.
|
|
•
|
Our board of directors may amend our bylaws by majority vote. This could allow the board to use bylaw amendments to delay or prevent an unsolicited takeover, and limits the ability of an acquirer to amend the bylaws to facilitate an unsolicited takeover attempt.
|
We are also subject to Section 203 of the Delaware General Corporation Law, or the DGCL, which prohibits us from engaging in any business combination with an interested stockholder for a period of three years from the date the person became an interested stockholder, unless certain conditions are met. These provisions make it more difficult for stockholders or potential acquirers to acquire the company without negotiation and may apply even if some of our stockholders consider the proposed transaction beneficial to them. For example, these provisions might discourage a potential acquisition proposal or tender offer, even if the acquisition proposal or tender offer were to be at a premium over the then current market price for our common stock. These provisions could also limit the price that investors are willing to pay in the future for shares of our common stock.
None.
Our corporate headquarters are located in Los Angeles, California, where we occupy facilities totaling approximately 47,000 square feet under a lease which expires in 2021, with an early termination option in 2016. We use these facilities for our principal administration, sales and marketing, technology and development and engineering activities. We also maintain additional offices and data centers in the U.S., Europe, and Asia, including offices in New York, San Francisco, London, Paris, and Sydney. We believe that our current facilities are adequate to meet our current needs, and that, if we require additional space, we will be able to obtain additional facilities on commercially reasonable terms.
53
We and our subsidiaries may from time to time be parties to legal or regulatory proceedings, lawsuits and other claims incident to our business activities and to our status as a public company. Such matters may include, among other things, assertions of contract breach or intellectual property infringement, claims for indemnity arising in the course of our business, regulatory investigations or enforcement proceedings, and claims by persons whose employment has been terminated. Such matters are subject to many uncertainties, and outcomes are not predictable with assurance. Consequently, we are unable to ascertain the ultimate aggregate amount of monetary liability, amounts which may be covered by insurance or recoverable from third parties, or the financial impact with respect to such matters as of
December 31, 2014
. However, based on our knowledge as of
December 31, 2014
, we believe that the final resolution of such matters pending at the time of this report, individually and in the aggregate, will not have a material adverse effect upon our consolidated financial position, results of operations or cash flows.
Not applicable.
Our common stock has been listed on the New York Stock Exchange, or the NYSE, since April 1, 2014, under the symbol "RUBI". Prior to our initial public offering, or IPO, there was no public market for our common stock. The following table sets forth, for the indicated periods, the high and low sales prices of our common stock as reported on the NYSE.
|
Fiscal 2014 Quarters Ended:
|
High
|
Low
|
||||||
|
June 30, 2014 (from April 1, 2014)
|
$
|
23.20
|
|
$
|
11.15
|
|
||
|
September 30, 2014
|
$
|
13.45
|
|
$
|
8.76
|
|
||
|
December 31, 2014
|
$
|
17.00
|
|
$
|
8.76
|
|
||
Holders of Record
As of December 31, 2014, there were approximately 121 holders of record of our common stock. The actual number of stockholders is greater than this number of record holders and includes stockholders who are beneficial owners but whose shares are held in street name by brokers and other nominees. This number of holders also does not include stockholders whose shares may be held in trust by other entities.
Dividend Policy
We have never declared or paid any dividends on our common stock, and we do not anticipate paying any cash dividends in the foreseeable future. We currently intend to retain any earnings to finance the operation and expansion of our business. Any future determination to pay dividends will be at the discretion of our board of directors and will be dependent upon then-existing conditions, including our earnings, capital requirements, results of operations, financial condition, business prospects and other factors that our board of directors considers relevant. See Item 7 “Management’s Discussion and Analysis of Financial Condition and Results of Operations” for additional information regarding our financial condition. In addition, our credit facility contains restrictions on our ability to pay dividends.
Purchases of Equity Securities by the Issuer and Affiliated Purchasers
In November 2014 we purchased
174,495
shares of our common stock at an average price of
$13.32
. All these purchases reflect shares withheld upon vesting of restricted stock for minimum tax withholding obligations.
We presently have no publicly announced repurchase plan or program.
Recent Sale of Unregistered Securities
On November 14, 2014, we entered into an agreement and plan of merger to acquire iSocket, Inc. The acquisition closed on November 17, 2014. As part of the acquisition, we agreed to issue
840,885
shares of our common stock (valued at approximately $11.2 million based on the stock price at the time of acquisition) to stockholders of iSocket in private placements under Section 4(a)(2) of the Securities Act.
54
Use of Proceeds
On April 7, 2014, we closed our IPO, whereby we sold 6,432,445 shares of common stock (including 1,015,649 shares sold pursuant to the underwriters' exercise of their over-allotment option), and the selling stockholders sold 1,354,199 shares of common stock. The offer and sale of all of the shares in the IPO were registered under the Securities Act pursuant to a registration statement on Form S-1 (File No. 333-193739), which was declared effective by the SEC on April 1, 2014. Morgan Stanley & Co. LLC, Goldman, Sachs & Co. and RBC Capital Markets, LLC acted as joint book-running managers for the offering. Needham & Company, LLC, Oppenheimer & Co. Inc., and LUMA Securities LLC acted as co-managers for the offering. The public offering price of the shares sold in the offering was $15.00 per share. We did not receive any proceeds from the sale of shares by the selling stockholders. The total gross proceeds from the offering to us were $96.5 million. After deducting underwriting discounts and commissions of $6.8 million and offering expenses payable by us of $3.5 million, we received approximately $86.2 million. There has been no material change in the planned use of proceeds from our IPO as described in our final prospectus filed with the SEC on April 2, 2014 pursuant to Rule 424(b) of the Securities Act.
Stock Performance Graph
This performance graph shall not be deemed "soliciting material" or to be "filed" with the SEC for purposes of Section 18 of the Exchange Act, or otherwise subject to the liabilities under that Section, and shall not be deemed to be incorporated by reference into any filing of ours under the Securities Act of 1933, as amended, except as shall be expressly set forth by specific reference in such filing.
The following graph compares the cumulative total stockholder return on an initial investment of $100 in our common stock between April 1, 2014 (the date of our IPO) and December 31, 2014, with the comparative cumulative total returns of the S&P 500 Index and NYSE Composite Index over the same period. As previously discussed, we have not paid any cash dividends and, therefore, the cumulative total return calculation for us is based solely upon stock price appreciation (depreciation) and not reinvestment of cash dividends, whereas the data for the S&P 500 Index and NYSE Composite Index assumes reinvestments of dividends. The graph assumes our closing sales price on April 1, 2014 of $15.00 per share as the initial value of our common stock. The returns shown are based on historical results and are not necessarily indicative of, nor intended to forecast, future stock price performance.

55
The following selected consolidated financial data should be read in conjunction with Item 7 "Management's Discussion and Analysis of Financial Condition and Results of Operations" and our consolidated financial statements and the related notes appearing in Item 8 "Financial Statements and Supplementary Data" of this Annual Report on Form 10-K.
The following table sets forth our selected consolidated historical financial and operating data for the periods indicated. The consolidated statements of operations data for the years ended December 31, 2014, 2013, and 2012 and the consolidated balance sheet data as of December 31, 2014 and 2013 have been derived from our audited consolidated financial statements included elsewhere in this Annual Report on Form 10-K.
|
Year Ended
|
||||||||||||||||
|
December 31, 2014
|
December 31, 2013
|
December 31, 2012
|
December 31, 2011
|
|||||||||||||
|
(in thousands, except per share data)
|
||||||||||||||||
|
Revenue
|
$
|
125,295
|
|
$
|
83,830
|
|
$
|
57,072
|
|
$
|
37,059
|
|
||||
|
Expenses:
|
||||||||||||||||
|
Costs of revenue
(1)
|
20,754
|
|
15,358
|
|
12,367
|
|
12,893
|
|
||||||||
|
Sales and marketing
(1)
|
43,203
|
|
25,811
|
|
20,458
|
|
17,748
|
|
||||||||
|
Technology and development
(1)
|
22,718
|
|
18,615
|
|
13,115
|
|
12,496
|
|
||||||||
|
General and administrative
(1)
|
57,398
|
|
27,926
|
|
12,331
|
|
8,926
|
|
||||||||
|
Total expenses
|
144,073
|
|
87,710
|
|
58,271
|
|
52,063
|
|
||||||||
|
Loss from operations
|
(18,778
|
)
|
(3,880
|
)
|
(1,199
|
)
|
(15,004
|
)
|
||||||||
|
Other (income) expense, net
|
(277
|
)
|
5,122
|
|
1,029
|
|
269
|
|
||||||||
|
Loss before income taxes
|
(18,501
|
)
|
(9,002
|
)
|
(2,228
|
)
|
(15,273
|
)
|
||||||||
|
Provision for income taxes
|
172
|
|
247
|
|
134
|
|
136
|
|
||||||||
|
Net loss
|
(18,673
|
)
|
(9,249
|
)
|
(2,362
|
)
|
(15,409
|
)
|
||||||||
|
Cumulative preferred stock dividends
(2)
|
(1,116
|
)
|
(4,244
|
)
|
(4,255
|
)
|
(4,244
|
)
|
||||||||
|
Net loss attributable to common stockholders
|
$
|
(19,789
|
)
|
$
|
(13,493
|
)
|
$
|
(6,617
|
)
|
$
|
(19,653
|
)
|
||||
|
Basic and diluted net loss per share attributable to common stockholders
(3)(4)
|
$
|
(0.70
|
)
|
$
|
(1.17
|
)
|
$
|
(0.60
|
)
|
$
|
(1.95
|
)
|
||||
|
Basic and diluted weighted-average shares used to compute net loss per share attributable to common stockholders
(4)
|
28,217
|
|
11,488
|
|
11,096
|
|
10,099
|
|
||||||||
|
(1)
|
Stock-based compensation expense included in our expenses was as follows:
|
|
Year Ended
|
||||||||||||||||
|
December 31, 2014
|
December 31, 2013
|
December 31, 2012
|
December 31, 2011
|
|||||||||||||
|
Cost of revenue
|
$
|
166
|
|
$
|
87
|
|
$
|
78
|
|
$
|
270
|
|
||||
|
Sales and marketing
|
3,217
|
|
1,105
|
|
1,039
|
|
309
|
|
||||||||
|
Technology and development
|
2,228
|
|
1,645
|
|
828
|
|
858
|
|
||||||||
|
General and administrative
|
18,235
|
|
3,515
|
|
1,099
|
|
831
|
|
||||||||
|
Total
|
$
|
23,846
|
|
$
|
6,352
|
|
$
|
3,044
|
|
$
|
2,268
|
|
||||
|
(2)
|
The holders of our convertible preferred stock were entitled to cumulative dividends prior and in preference to common stock. Because the holders of our convertible preferred stock were entitled to participate in dividends, net loss attributable to common stockholders is equal to net loss adjusted for cumulative preferred stock dividends for the period. Immediately upon the closing of the initial public offering in April 2014, each outstanding share of convertible preferred stock was automatically converted into one-half of a share of our common stock and these holders were no longer entitled to the cumulative dividends. See Note 11 to our consolidated financial statements for a description of our convertible preferred stock.
|
|
(3)
|
See Note 2 to our consolidated financial statements for a description of the method used to compute basic and diluted net loss per share attributable to common stockholders.
|
56
|
(4)
|
All share, per-share and related information has been retroactively adjusted, where applicable, to reflect the impact of a 1-for-2 reverse stock split, including an adjustment to the preferred stock conversion ratio, which was effected on March 18, 2014.
|
|
At December 31
|
||||||||||||||||
|
2014
|
2013
|
2012
|
2011
|
|||||||||||||
|
(in thousands)
|
||||||||||||||||
|
Cash and cash equivalents
|
$
|
97,196
|
|
$
|
29,956
|
|
$
|
21,616
|
|
$
|
16,252
|
|
||||
|
Accounts receivable, net
|
$
|
133,267
|
|
$
|
94,722
|
|
$
|
67,335
|
|
$
|
40,580
|
|
||||
|
Property, equipment and capitalized software, net
|
$
|
26,697
|
|
$
|
15,916
|
|
$
|
12,697
|
|
$
|
10,411
|
|
||||
|
Total assets
|
$
|
296,481
|
|
$
|
149,887
|
|
$
|
108,014
|
|
$
|
71,142
|
|
||||
|
Debt and capital lease obligations, current and non-current
|
$
|
105
|
|
$
|
4,181
|
|
$
|
5,215
|
|
$
|
5,504
|
|
||||
|
Total liabilities
|
$
|
167,729
|
|
$
|
133,727
|
|
$
|
90,005
|
|
$
|
55,341
|
|
||||
|
Convertible preferred stock
|
$
|
—
|
|
$
|
52,571
|
|
$
|
52,571
|
|
$
|
52,571
|
|
||||
|
Common stockholders’ equity (deficit)
|
$
|
128,752
|
|
$
|
(36,411
|
)
|
$
|
(34,562
|
)
|
$
|
(36,770
|
)
|
||||
Operational and Financial Measures
|
Year Ended
|
||||||||||||||||
|
December 31, 2014
|
December 31, 2013
|
December 31, 2012
|
December 31, 2011
|
|||||||||||||
|
Operational Measures:
|
||||||||||||||||
|
Managed revenue (in thousands)
|
$
|
667,796
|
|
$
|
485,080
|
|
$
|
338,918
|
|
$
|
238,838
|
|
||||
|
Paid impressions (in billions)
|
999
|
|
1,336
|
|
1,431
|
|
980
|
|
||||||||
|
Average CPM
|
$
|
0.67
|
|
$
|
0.36
|
|
$
|
0.24
|
|
$
|
0.24
|
|
||||
|
Take rate
|
18.8
|
%
|
17.3
|
%
|
16.8
|
%
|
15.5
|
%
|
||||||||
|
Financial Measures:
|
||||||||||||||||
|
Revenue (in thousands)
|
$
|
125,295
|
|
$
|
83,830
|
|
$
|
57,072
|
|
$
|
37,059
|
|
||||
|
Adjusted EBITDA (in thousands)
|
$
|
19,098
|
|
$
|
11,223
|
|
$
|
9,205
|
|
$
|
(6,698
|
)
|
||||
Managed Revenue
Managed revenue is an operational measure that represents the advertising spending transacted on our platform, and would represent our revenue if we were to record our revenue on a gross basis instead of a net basis. Managed revenue does not represent revenue reported on a GAAP basis. We review managed revenue for internal management purposes to assess market share and scale. Many companies in our industry record revenue on a gross basis, so tracking our managed revenue allows us to compare our results to the results of those companies. Our managed revenue is influenced by the volume and characteristics of paid impressions and average CPM.
Our managed revenue has increased period over period as a result of increased use of our solution by buyers and sellers and increases in average CPM. We expect managed revenue to continue to grow with increases in the pricing or volume of transactions on our platform, which can result from increases in the number of buyers or advertising spending, and from improvements in our auction algorithms. This increase may fluctuate due to seasonality and increases or decreases in average CPM and paid impressions. In addition, we generally experience higher managed revenue during the fourth quarter of a given year, resulting from higher advertising spending and more bidding activity, which may drive higher volumes of paid impressions or average CPM.
57
Paid Impressions
We define a paid impression as an impression sold to a buyer and into which an advertisement is served for display to a user on a website or mobile application, which is transacted via our platform through either direct or indirect relationships between buyers and sellers and us, or between buyers and sellers directly. We use paid impressions as one measure to assess the performance of our platform, including the effectiveness and efficiency at which buyers and sellers are trading via our platform and using our solution, and to assist us in tracking our revenue-generating performance and operational efficiencies. The number of paid impressions may fluctuate based on various factors, including the number and spend of buyers using our solution, the number of sellers, their allocation of advertising inventory using our solution, our traffic quality control initiatives, and the seasonality in our business. Because of the volatility of this metric, we believe that paid impressions are useful to review on an annual basis.
Average CPM
Pricing is generally expressed as average cost per thousand impressions, or average CPM. Average CPM is an operational measure that represents the average price at which paid impressions are sold. We review average CPM for internal management purposes to assess buyer spend, liquidity in the marketplace, inventory quality, and integrity of our algorithms. Average CPM may be influenced by our inventory placements and demand for such inventory facilitated by our relationships with both buyers and sellers, as well as by a variety of other factors, including the precision of matching an advertisement to an audience, changes in our algorithms, seasonality, quality of inventory provided by sellers, penetration of various channels and advertising units, and changes in buyer spend levels. We expect average CPM to increase with the continued adoption of our solution by premium buyers and sellers, resulting in a higher quantity of premium advertising inventory available to advertisers. Because of the volatility of this metric, we believe that average CPM is useful to review on an annual basis. We compute average CPM by dividing managed revenue by total paid impressions and multiplying by 1,000.
Take Rate
Take rate is an operational measure that represents our share of managed revenue. We review take rate for internal management purposes to assess the development of our marketplace with buyers and sellers. Our take rate can be affected by a variety of factors, including the terms of our arrangements with buyers and sellers active on our platform in a particular period, the scale of a buyer or seller’s activity on our platform, product mix, the implementation of new products, platforms and solution features, auction dynamics, and the overall development of the digital advertising ecosystem.
Adjusted EBITDA
Adjusted EBITDA is a non-GAAP financial measure defined by us as net income (loss) adjusted for stock-based compensation expense, depreciation and amortization, interest income or expense, change in fair value of pre-IPO convertible preferred stock warrant liabilities, and other income or expense, which mainly consists of foreign exchange gains and losses, certain other non-recurring income or expenses such as acquisition and related costs, and provision for income taxes. Adjusted EBITDA should not be considered as an alternative to net income (loss), operating income, or any other measure of financial performance calculated and presented in accordance with GAAP. Adjusted EBITDA eliminates the impact of items that we do not consider indicative of our core operating performance. You are encouraged to evaluate these adjustments and the reason we consider them appropriate. We believe Adjusted EBITDA is useful to investors in evaluating our operating performance for the following reasons:
|
•
|
Adjusted EBITDA is widely used by investors and securities analysts to measure a company’s operating performance without regard to items such as stock-based compensation expense, depreciation and amortization, interest income or expense, change in fair value of preferred stock warrant liabilities, foreign exchange gains and losses, certain other non-recurring income or expenses such as acquisition and related costs, and provision for income taxes that can vary substantially from company to company depending upon their financing, capital structures, and the method by which assets were acquired;
|
|
•
|
our management uses Adjusted EBITDA in conjunction with GAAP financial measures for planning purposes, including the preparation of our annual operating budget, as a measure of operating performance and the effectiveness of our business strategies, and in communications with our board of directors concerning our financial performance;
|
|
•
|
Adjusted EBITDA may sometimes be considered by the compensation committee of our board of directors in connection with the determination of compensation for our executive officers; and
|
|
•
|
Adjusted EBITDA provides consistency and comparability with our past financial performance, facilitates period-to-period comparisons of operations and also facilitates comparisons with other peer companies, many of which use similar non-GAAP financial measures to supplement their GAAP results.
|
58
Although Adjusted EBITDA is frequently used by investors and securities analysts in their evaluations of companies, Adjusted EBITDA has limitations as an analytical tool, and you should not consider it in isolation or as a substitute for analysis of our results of operations as reported under GAAP. These limitations include:
|
•
|
stock-based compensation is a non-cash charge and is and will remain an element of our long-term incentive compensation package, although we exclude it as an expense when evaluating our ongoing operating performance for a particular period
;
|
|
•
|
depreciation and amortization are non-cash charges, and the assets being depreciated or amortized will often have to be replaced in the future; Adjusted EBITDA does not reflect any cash requirements for these replacements;
|
|
•
|
Adjusted EBITDA does not reflect changes in, or cash requirements for, our working capital needs or contractual commitments, and therefore may not reflect periodic increases in capital expenditures;
|
|
•
|
Adjusted EBITDA does not reflect cash requirements for income taxes and the cash impact of other income or expense; and
|
|
•
|
other companies may calculate Adjusted EBITDA differently than we do, limiting its usefulness as a comparative measure.
|
Our Adjusted EBITDA will be impacted by the rate at which our revenue increases and the timing of our investments in our operations.
The following table presents a reconciliation of net loss, the most comparable GAAP measure, to Adjusted EBITDA for each of the periods indicated:
|
Year Ended
|
||||||||||||||||
|
December 31, 2014
|
December 31, 2013
|
December 31, 2012
|
December 31, 2011
|
|||||||||||||
|
(in thousands)
|
||||||||||||||||
|
Financial Measure:
|
||||||||||||||||
|
Net loss
|
$
|
(18,673
|
)
|
$
|
(9,249
|
)
|
$
|
(2,362
|
)
|
$
|
(15,409
|
)
|
||||
|
Add back (deduct):
|
||||||||||||||||
|
Depreciation and amortization expense
|
12,517
|
|
8,438
|
|
6,857
|
|
5,538
|
|
||||||||
|
Stock-based compensation expense
|
23,846
|
|
6,352
|
|
3,044
|
|
2,268
|
|
||||||||
|
Acquisition and related items
|
1,513
|
|
313
|
|
503
|
|
500
|
|
||||||||
|
Interest expense, net
|
110
|
|
273
|
|
343
|
|
252
|
|
||||||||
|
Change in fair value of preferred stock warrant liabilities
|
732
|
|
4,121
|
|
515
|
|
304
|
|
||||||||
|
Foreign currency (gain) loss, net
|
(1,119
|
)
|
728
|
|
171
|
|
216
|
|
||||||||
|
Other income
|
—
|
|
—
|
|
—
|
|
(503
|
)
|
||||||||
|
Provision for income taxes
|
172
|
|
247
|
|
134
|
|
136
|
|
||||||||
|
Adjusted EBITDA
|
$
|
19,098
|
|
$
|
11,223
|
|
$
|
9,205
|
|
$
|
(6,698
|
)
|
||||
59
You should read the following discussion and analysis of our financial condition and results of operations in conjunction with the consolidated financial statements and the related notes to those statements included in Item 8 to this Annual Report on Form 10-K. In addition to historical financial information, the following discussion contains forward-looking statements that reflect our plans, estimates, beliefs and expectations that involve risks and uncertainties. Our actual results and the timing of events could differ materially from those discussed in these forward-looking statements. Factors that could cause or contribute to these differences include those discussed below and elsewhere in this Annual Report on Form 10-K, particularly in "Item 1A. Risk Factors" and the "Special Note Regarding Forward-Looking Statements."
Overview
We are a technology company on a mission to automate the buying and selling of advertising. Our Advertising Automation Cloud is a highly scalable platform that provides leading user reach and a marketplace for the real-time trading of digital advertising between buyers and sellers. Through the speed and big data analytics of our algorithm-based solution, we have transformed the cumbersome, complex process of direct buying and selling of digital advertising into a seamless automated process that optimizes results for both buyers and sellers. Buyers of digital advertising use our platform to reach approximately 600 million Internet users globally on some of the world’s leading sellers. Sellers of digital advertising use our platform to maximize revenue from advertising, decrease costs, and protect their brands and user experience, while accessing a global market of buyers representing top advertiser brands around the world. We believe the benefits we provide to both buyers and sellers, and the time and effort spent by both buyers and sellers to integrate with our platform and associated applications, give us a critical position in the digital advertising ecosystem.
Our Advertising Automation Cloud features applications for digital advertising sellers, including websites, applications and other digital media properties, to sell their advertising inventory; applications for buyers, including advertisers, agencies, ATDs, DSPs, and ad networks, to buy advertising inventory; and a marketplace over which such transactions are executed. Together, these features power and optimize a comprehensive, transparent, independent advertising marketplace that brings buyers and sellers together and facilitates intelligent decision-making and automated transaction execution for the advertising inventory we manage on our platform. Our Advertising Automation Cloud incorporates proprietary machine-learning algorithms, sophisticated data processing, high-volume storage, detailed analytics capabilities, and a distributed infrastructure. We analyze billions of data points in real time to enable our solution to make approximately 300 data-driven decisions per transaction in milliseconds, and to execute up to 3.5 million peak queries per second, and 5 trillion bid requests per month. Since 2012, we have processed approximately 100 trillion bid requests. We believe we help increase the volume and effectiveness of advertising, increasing revenue for sellers and improving return on advertising investment for buyers.
We have direct relationships built on technical integration with our sellers, including over 50% of the U.S. comScore 100. We believe that our direct relationships and integrations with sellers differentiate us from many other participants in the advertising ecosystem and make us a vital participant in the digital advertising industry. Our integration of sellers into our platform gives sellers the ability to monetize a full variety and volume of inventory. At the same time, buyers leverage our platform to manage their advertising spending, simplify order management and campaign tracking, obtain actionable insights into audiences for their advertising, and access impression-level purchasing from hundreds of sellers. We believe buyers need our platform because of our powerful solution and our direct relationships and integrations with some of the world’s largest sellers. Our solution is constantly self-optimizing based on our ability to analyze and learn from vast volumes of data. The additional data we obtain from the volume of transactions on our platform help make our machine-learning algorithms more intelligent, leading to higher quality matching between buyers and sellers, better return on investment for buyers, and higher revenue for sellers. As a result of that high quality matching, we attract even more sellers which in turn attracts more buyers and vice versa. We believe this self-reinforcing dynamic creates a strong platform for growth.
Since our incorporation in April 2007, we have invested in our solution to meet the complex needs of buyers and sellers of digital advertising. We have achieved significant growth as we have scaled our solution, including the functionality of our Advertising Automation Cloud and its applications for buyers and sellers. During our early stages, our solution helped sellers to automate their existing advertising network relationships to match the right buyer with each impression, as well as increase their revenue and decrease their costs. Between 2008 and 2009, we developed direct relationships with buyers and created applications to assist buyers to increase their return on investment. During 2010, we added RTB capabilities, allowing sellers’ inventory to be sold in an auction to buyers, creating a real time unified auction where buyers compete to purchase sellers’ advertising inventory. During 2012, we launched our private marketplace, which allows sellers to connect directly with pre-approved buyers to execute direct sales of previously unsold advertising inventory.
60
In 2014, we expanded our orders automation technology and expanded our capabilities in the automated guaranteed market with the acquisition of two companies, iSocket, Inc., or iSocket, and Shiny Inc., or Shiny. The addition of iSocket and Shiny provides additional solutions to automate the buying and selling of direct-sold, guaranteed deals, which according to eMarketer, is a market that is forecasted to surpass $8 billion in the U.S. alone by 2016. When combined with our existing orders technology, these acquisitions have helped us create a fully integrated solution for automating, streamlining, and managing the processes of direct buying and selling of guaranteed and non-guaranteed advertising.
According to Magna Global (September 2014), the global RTB market will grow from $9.2 billion in 2014 to $28.9 billion by 2018, a compounded annual growth rate of 33%. RTB is the fastest growing area of our business. Managed revenue attributable to RTB grew 884% from 2010 to 2011, 191% from 2011 to 2012, 94% from 2012 to 2013 and 71% from 2013 to 2014. We believe this trend will directly benefit us and our prospects for continued growth.
Large agencies, DSPs and ad networks, many of which are already established in size and scale, are responsible for the majority of automated digital advertising spending. Accordingly, we believe our growth will be less affected by an increase in buyers than by increases in the amount of spending per buyer as more advertising shifts from traditional to automated buying and selling.
Another industry trend is the expansion of automated buying and selling of advertising through new channels. The growth of automated buying and selling advertising is also expanding into new markets, and in some markets the adoption of automated digital advertising is greater than in the United States. We intend to expand our business in existing territories served and enter new territories.
We generate revenue from buyers and sellers who use our solution for the purchase and sale of advertising inventory. Buyers use our solution to reach their intended audiences by purchasing advertising inventory that we make available from sellers through our solution. We recognize revenue upon the completion of a transaction, which is when an impression has been delivered to the consumer viewing a website or application, subject to satisfying all other revenue recognition criteria. We are responsible for the completion of the transaction. We generally bill and collect the full purchase price of impressions from buyers, together with other fees, if applicable. We report revenue net of amounts we pay sellers for the impressions they provide. In some cases, we generate revenue directly from sellers who maintain the primary relationship with buyers and utilize our solution to transact and optimize their activities.
For the years ended
December 31, 2014
, 2013 and 2012 our revenue was
$125.3 million
,
$83.8 million
and $57.1 million, respectively, representing a year-over-year increase of
49%
during 2014 and 47% during 2013, and our managed revenue was
$667.8 million
,
$485.1 million
and $338.9 million, respectively, representing a year-over-year increase of
38%
during 2014 and 43% during 2013. For the
year ended
December 31, 2014
,
2013
, and 2012 our net loss was
$18.7 million
,
$9.2 million
and $2.4 million, respectively, and our Adjusted EBITDA was
$19.1 million
,
$11.2 million
and $9.2 million, respectively. Adjusted EBITDA is a non-GAAP financial measure. For information on how we compute Adjusted EBITDA, and a reconciliation of Adjusted EBITDA to net income (loss) on a GAAP basis, please refer to “Key Operational and Financial Measures.”
Our net income (loss) and Adjusted EBITDA will be impacted by the rate at which our revenue increases, seasonality, amount and the timing of our investments in our operations.
Substantially all of our revenue is U.S. revenue, determined based on the location of our legal entity that is a party to the relevant transaction.
Key Operational and Financial Measures
We regularly review our key operational and financial performance measures, including those set forth below, to help us evaluate our business, measure our performance, identify trends affecting our business, establish budgets, measure the effectiveness of investments in our technology and development and sales and marketing, and assess our operational efficiencies. In addition to revenue, we also review managed revenue and Adjusted EBITDA, which are discussed immediately following the table below. Revenue is discussed under the headings “Components of Our Results of Operations” and “Results of Operations.” We report our financial results as one operating segment. Our consolidated operating results, together with the following operating and financial measures, are regularly reviewed by our chief operating decision maker, principally to make decisions about how we allocate our resources and to measure our consolidated operating performance.
61
|
Year Ended
|
|||||||||||
|
December 31, 2014
|
December 31, 2013
|
December 31, 2012
|
|||||||||
|
Operational Measures:
|
|||||||||||
|
Managed revenue (in thousands)
|
$
|
667,796
|
|
$
|
485,080
|
|
$
|
338,918
|
|
||
|
Paid impressions (in billions)
|
999
|
|
1,336
|
|
1,431
|
|
|||||
|
Average CPM
|
$
|
0.67
|
|
$
|
0.36
|
|
$
|
0.24
|
|
||
|
Take rate
|
18.8
|
%
|
17.3
|
%
|
16.8
|
%
|
|||||
|
Financial Measures:
|
|||||||||||
|
Revenue (in thousands)
|
$
|
125,295
|
|
$
|
83,830
|
|
$
|
57,072
|
|
||
|
Adjusted EBITDA (in thousands)
|
$
|
19,098
|
|
$
|
11,223
|
|
$
|
9,205
|
|
||
Managed Revenue
Managed revenue is an operational measure that represents the advertising spending transacted on our platform, and would represent our revenue if we were to record our revenue on a gross basis instead of a net basis. Managed revenue does not represent revenue reported on a GAAP basis. We review managed revenue for internal management purposes to assess market share and scale. Many companies in our industry record revenue on a gross basis, so tracking our managed revenue allows us to compare our results to the results of those companies. Our managed revenue is influenced by the volume and characteristics of paid impressions and average CPM.
Our managed revenue has increased period over period as a result of increased use of our solution by buyers and sellers and increases in average CPM. We expect managed revenue to continue to grow with increases in the pricing or volume of transactions on our platform, which can result from increases in the number of buyers or advertising spending, and from improvements in our auction algorithms. This increase may fluctuate due to seasonality and increases or decreases in average CPM and paid impressions. In addition, we generally experience higher managed revenue during the fourth quarter of a given year, resulting from higher advertising spending and more bidding activity, which may drive higher volumes of paid impressions or average CPM.
Paid Impressions
Paid impressions is an operational measure. We define a paid impression as an impression sold to a buyer and into which an advertisement is served for display to a user on a website or mobile application, which is transacted via our platform through either direct or indirect relationships between buyers and sellers and us, or between buyers and sellers directly. We use paid impressions as one measure to assess the performance of our platform, including the effectiveness and efficiency at which buyers and sellers are trading via our platform and using our solution, and to assist us in tracking our revenue-generating performance and operational efficiencies. The number of paid impressions may fluctuate based on various factors, including the number and spend of buyers using our solution, the number of sellers, their allocation of advertising inventory using our solution, our traffic quality control initiatives, and the seasonality in our business. Because of the volatility of this metric, we believe that paid impressions are useful to review on an annual basis.
Average CPM
Pricing is generally expressed as average cost per thousand impressions, or average CPM. Average CPM is an operational measure that represents the average price at which paid impressions are sold. We review average CPM for internal management purposes to assess buyer spend, liquidity in the marketplace, inventory quality, and integrity of our algorithms. Average CPM may be influenced by our inventory placements and demand for such inventory facilitated by our relationships with both buyers and sellers, as well as by a variety of other factors, including the precision of matching an advertisement to an audience, changes in our algorithms, seasonality, quality of inventory provided by sellers, penetration of various channels and advertising units, and changes in buyer spend levels. We expect average CPM to increase with the continued adoption of our solution by premium buyers and sellers, resulting in a higher quantity of premium advertising inventory available to advertisers. Because of the volatility of this metric, we believe that average CPM is useful to review on an annual basis. We compute average CPM by dividing managed revenue by total paid impressions and multiplying by 1,000.
62
Take Rate
Take rate is an operational measure that represents our share of managed revenue. We review take rate for internal management purposes to assess the development of our marketplace with buyers and sellers. Our take rate can be affected by a variety of factors, including the terms of our arrangements with buyers and sellers active on our platform in a particular period, the scale of a buyer
’
s or seller’s activity on our platform, product mix, the implementation of new products, platforms and solution features, auction dynamics, and the overall development of the digital advertising ecosystem.
Adjusted EBITDA
Adjusted EBITDA is a non-GAAP financial measure defined by us as net income (loss) adjusted for stock-based compensation expense, depreciation and amortization, interest income or expense, change in fair value of pre-IPO convertible preferred stock warrant liabilities, and other income or expense, which mainly consists of foreign exchange gains and losses, certain other non-recurring income or expenses such as acquisition and related costs, and provision for income taxes. Adjusted EBITDA should not be considered as an alternative to net income (loss), operating income, or any other measure of financial performance calculated and presented in accordance with GAAP. Adjusted EBITDA eliminates the impact of items that we do not consider indicative of our core operating performance. You are encouraged to evaluate these adjustments and the reason we consider them appropriate. We believe Adjusted EBITDA is useful to investors in evaluating our operating performance for the following reasons:
|
•
|
Adjusted EBITDA is widely used by investors and securities analysts to measure a company’s operating performance without regard to items such as stock-based compensation expense, depreciation and amortization, interest income or expense, change in fair value of preferred stock warrant liabilities, foreign exchange gains and losses, certain other non-recurring income or expenses such as acquisition and related costs, and provision for income taxes that can vary substantially from company to company depending upon their financing, capital structures, and the method by which assets were acquired;
|
|
•
|
our management uses Adjusted EBITDA in conjunction with GAAP financial measures for planning purposes, including the preparation of our annual operating budget, as a measure of operating performance and the effectiveness of our business strategies, and in communications with our board of directors concerning our financial performance;
|
|
•
|
Adjusted EBITDA may sometimes be considered by the compensation committee of our board of directors in connection with the determination of compensation for our executive officers; and
|
|
•
|
Adjusted EBITDA provides consistency and comparability with our past financial performance, facilitates period-to-period comparisons of operations and also facilitates comparisons with other peer companies, many of which use similar non-GAAP financial measures to supplement their GAAP results.
|
Although Adjusted EBITDA is frequently used by investors and securities analysts in their evaluations of companies, Adjusted EBITDA has limitations as an analytical tool, and you should not consider it in isolation or as a substitute for analysis of our results of operations as reported under GAAP. These limitations include:
|
•
|
stock-based compensation is a non-cash charge and is and will remain an element of our long-term incentive compensation package, although we exclude it as an expense when evaluating our ongoing operating performance for a particular period;
|
|
•
|
depreciation and amortization are non-cash charges, and the assets being depreciated or amortized will often have to be replaced in the future; Adjusted EBITDA does not reflect any cash requirements for these replacements;
|
|
•
|
Adjusted EBITDA does not reflect changes in, or cash requirements for, our working capital needs or contractual commitments, and therefore may not reflect periodic increases in capital expenditures;
|
|
•
|
Adjusted EBITDA does not reflect cash requirements for income taxes and the cash impact of other income or expense; and
|
|
•
|
other companies may calculate Adjusted EBITDA differently than we do, limiting its usefulness as a comparative measure.
|
Our Adjusted EBITDA will be impacted by the rate at which our revenue increases and the timing of our investments in our operations. Please see below for a reconciliation of Adjusted EBITDA to net income (loss), the most directly comparable financial measure calculated in accordance with GAAP.
63
The following table presents a reconciliation of net loss, the most comparable GAAP measure, to Adjusted EBITDA for the
year ended
December 31, 2014
, 2013, and 2012:
|
Year Ended
|
|||||||||||
|
December 31, 2014
|
December 31, 2013
|
December 31, 2012
|
|||||||||
|
(in thousands)
|
|||||||||||
|
Financial Measure:
|
|||||||||||
|
Net loss
|
$
|
(18,673
|
)
|
$
|
(9,249
|
)
|
$
|
(2,362
|
)
|
||
|
Add back (deduct):
|
|
|
|||||||||
|
Depreciation and amortization expense
|
12,517
|
|
8,438
|
|
6,857
|
|
|||||
|
Stock-based compensation expense
|
23,846
|
|
6,352
|
|
3,044
|
|
|||||
|
Acquisition and related items
|
1,513
|
|
313
|
|
503
|
|
|||||
|
Interest expense, net
|
110
|
|
273
|
|
343
|
|
|||||
|
Change in fair value of preferred stock warrant liabilities
|
732
|
|
4,121
|
|
515
|
|
|||||
|
Foreign currency (gain) loss, net
|
(1,119
|
)
|
728
|
|
171
|
|
|||||
|
Provision for income taxes
|
172
|
|
247
|
|
134
|
|
|||||
|
Adjusted EBITDA
|
$
|
19,098
|
|
$
|
11,223
|
|
$
|
9,205
|
|
||
Components of Our Results of Operations
Revenue
We generate revenue from buyers and sellers who use our solution for the purchase and sale of advertising inventory. Buyers use our solution to reach their intended audiences by buying advertising inventory that we make available from sellers through our solution. Our solution enables buyers and sellers to purchase and sell advertising inventory, matches buyers and sellers, and establishes rules and parameters for open and transparent auctions of advertising inventory. We recognize revenue upon the completion of a transaction, that is, when an impression has been made available to the consumer viewing a website or application, subject to satisfying all other revenue recognition criteria. We are responsible for the completion of the transaction. We generally bill and collect the full purchase price of impressions from buyers, together with other fees, if applicable. We report revenue net of amounts we pay sellers for the impressions they provide. In some cases, we generate revenue directly from sellers who maintain the primary relationship with buyers and utilize our solution to transact and optimize their activities. Our accounts receivable are recorded at the amount of gross billings to buyers, net of allowances, for the amounts we are responsible to collect, and our accounts payable are recorded at the net amount payable to sellers. Accordingly, both accounts receivable and accounts payable appear large in relation to revenue reported on a net basis.
Our revenue, cash flow from operations, operating results and key operational and financial performance may vary from quarter to quarter due to the seasonal nature of advertiser spending, as well as other circumstances that affect advertising activity. For example, many advertisers devote a disproportionate amount of their advertising budgets to the fourth quarter of the calendar year to coincide with increased holiday purchasing. Moreover, advertising inventory in the fourth quarter may be more expensive due to increased demand. Historically, the fourth quarter of the year reflects our highest level of revenue, and the first quarter reflects the lowest level of our revenue.
Our revenue recognition policies are discussed in more detail in the notes to our consolidated financial statements presented in "Item 8. Financial Statements and Supplementary Data."
Expenses
We classify our expenses into the following four categories:
Cost of Revenue
. Our cost of revenue consists primarily of data center costs, bandwidth costs, depreciation and maintenance expense of hardware supporting our revenue-producing platform, amortization of software costs for the development of our revenue-producing platform, amortization expense associated with acquired developed technologies, personnel costs, and facilities-related costs. Personnel costs included in cost of revenue include salaries, bonuses, stock-based compensation, and employee benefit costs, and are primarily attributable to personnel in our network operations group, who support our platform. We capitalize costs associated with software that is developed or obtained for internal use and amortize the costs associated with our revenue-producing platform in cost of revenue over their estimated useful lives. Many of these expenses are generally fixed and do not increase or decrease proportionately with increases or decreases in our revenue.
64
Sales and Marketing
. Our sales and marketing expenses consist primarily of personnel costs, including stock-based compensation and the sales bonuses paid to our sales organization, and marketing expenses such as brand marketing, travel expenses, trade shows and marketing materials, professional services, and to a lesser extent, facilities-related costs and depreciation and amortization. Our sales organization focuses on marketing our solution to increase the adoption of our solution by existing and new buyers and sellers.
Technology and Development
. Our technology and development expenses consist primarily of personnel costs, including stock-based compensation, and professional services associated with the ongoing development and maintenance of our solution, and to a lesser extent, facilities-related costs and depreciation and amortization. These expenses include costs incurred in the development, implementation, and maintenance of internal use software, including platform and related infrastructure. Technology and development costs are expensed as incurred, except to the extent that such costs are associated with internal use software development that qualifies for capitalization, which are then recorded as internal use software development costs, net on our consolidated balance sheet. We amortize internal use software development costs that relate to our revenue-producing activities on our platform to cost of revenue and amortize other internal use software development costs to technology and development costs or general and administrative expenses, depending on the nature of the related project.
General and Administrative
. Our general and administrative expenses consist primarily of personnel costs, including stock-based compensation, associated with our executive, finance, legal, human resources, compliance, and other administrative personnel, as well as accounting and legal professional services fees, facilities-related costs and depreciation, and other corporate related expenses. General and administrative expenses also include amortization of internal use software development costs that relate to general and administrative functions.
Other Expense, Net
Interest Expense, Net
. Interest expense is mainly related to our credit facility and capital lease arrangements. Interest income consists of interest earned on our cash equivalents and was insignificant for the years ended
December 31, 2014
,
2013
and 2012.
Change in Fair Value of Convertible Preferred Stock Warrant Liability
. Prior to our initial public offering, the convertible preferred stock warrants were subject to re-measurement to fair value at each balance sheet date, and any change in fair value was recognized as a component of other expense, net. In connection with the closing of our IPO in
April 2014
, one warrant for
845,867
shares of convertible preferred stock was exercised on a net basis, resulting in the issuance of
286,055
shares of common stock, and the remaining warrant for
25,174
shares of convertible preferred stock was automatically converted into a warrant exercisable for
12,587
shares of common stock. Following the closing of our IPO, we are no longer required to re-measure the converted common stock warrants to fair value and record any changes in the fair value of these liabilities in our statement of operations. The common stock warrant was net exercised in June 2014. As of
December 31, 2014
, we had no outstanding warrants.
Foreign Currency Exchange (Gain) Loss, Net
. Foreign currency exchange (gain) loss, net consists primarily of gains and losses on foreign currency transactions. We have foreign currency exposure related to our accounts receivable and accounts payable that are denominated in currencies other than the U.S. Dollar, principally the British Pound and Euro.
Provision for Income Taxes
Provision for income taxes consists primarily of federal, state, and foreign income taxes. Due to uncertainty as to the realization of benefits from our domestic deferred tax assets, including net operating loss carryforwards and research and development tax credits, we have a full valuation allowance reserved against such assets. We expect to maintain this full valuation allowance in the near term.
65
Results of Operations
The following tables set forth our consolidated results of operations and our consolidated results of operations as a percentage of revenue for the periods presented:
|
Year Ended
|
|||||||||||
|
December 31, 2014
|
December 31, 2013
|
December 31, 2012
|
|||||||||
|
(in thousands)
|
|||||||||||
|
Revenue
|
$
|
125,295
|
|
$
|
83,830
|
|
$
|
57,072
|
|
||
|
Expenses:
|
|||||||||||
|
Costs of revenue
(1)
|
20,754
|
|
15,358
|
|
12,367
|
|
|||||
|
Sales and marketing
(1)
|
43,203
|
|
25,811
|
|
20,458
|
|
|||||
|
Technology and development
(1)
|
22,718
|
|
18,615
|
|
13,115
|
|
|||||
|
General and administrative
(1)
|
57,398
|
|
27,926
|
|
12,331
|
|
|||||
|
Total expenses
|
144,073
|
|
87,710
|
|
58,271
|
|
|||||
|
Loss from operations
|
(18,778)
|
|
(3,880)
|
|
(1,199)
|
|
|||||
|
Other (income) expense, net
|
(277
|
)
|
5,122
|
|
1,029
|
|
|||||
|
Loss before income taxes
|
(18,501)
|
|
(9,002)
|
|
(2,228)
|
|
|||||
|
Provision for income taxes
|
172
|
|
247
|
|
134
|
|
|||||
|
Net loss
|
$
|
(18,673
|
)
|
$
|
(9,249
|
)
|
$
|
(2,362
|
)
|
||
(1)
Stock-based compensation expense included in our expenses was as follows:
|
Year Ended
|
|||||||||||
|
December 31, 2014
|
December 31, 2013
|
December 31, 2012
|
|||||||||
|
(in thousands)
|
|||||||||||
|
Costs of revenue
|
$
|
166
|
|
$
|
87
|
|
$
|
78
|
|
||
|
Sales and marketing
|
3,217
|
|
1,105
|
|
1,039
|
|
|||||
|
Technology and development
|
2,228
|
|
1,645
|
|
828
|
|
|||||
|
General and administrative
|
18,235
|
|
3,515
|
|
1,099
|
|
|||||
|
Total
|
$
|
23,846
|
|
$
|
6,352
|
|
$
|
3,044
|
|
||
|
Year Ended*
|
||||||||
|
December 31, 2014
|
December 31, 2013
|
December 31, 2012
|
||||||
|
Revenue
|
100
|
%
|
100
|
%
|
100
|
%
|
||
|
Cost of revenue
|
17
|
%
|
18
|
%
|
22
|
%
|
||
|
Sales and marketing
|
34
|
%
|
31
|
%
|
36
|
%
|
||
|
Technology and development
|
18
|
%
|
22
|
%
|
23
|
%
|
||
|
General and administrative
|
46
|
%
|
33
|
%
|
22
|
%
|
||
|
Total expenses
|
115
|
%
|
105
|
%
|
102
|
%
|
||
|
Loss from operations
|
(15
|
)%
|
(5
|
)%
|
(2
|
)%
|
||
|
Other (income) expense, net
|
—
|
%
|
6
|
%
|
2
|
%
|
||
|
Loss before income taxes
|
(15
|
)%
|
(11
|
)%
|
(4
|
)%
|
||
|
Provision for income taxes
|
—
|
%
|
—
|
%
|
—
|
%
|
||
|
Net loss
|
(15
|
)%
|
(11
|
)%
|
(4
|
)%
|
||
* Certain figures may not sum due to rounding.
66
Comparison of the Years Ended
December 31, 2014
,
2013
and 2012
Revenue
|
Year Ended
|
|||||||||||
|
December 31, 2014
|
December 31, 2013
|
December 31, 2012
|
|||||||||
|
(in thousands)
|
|||||||||||
|
Revenue
|
$
|
125,295
|
|
$
|
83,830
|
|
$
|
57,072
|
|
||
Revenue increased $
41.5 million
, or
49%
, for the
year ended December 31, 2014
compared to the
year ended December 31, 2013
. The increase in revenue was primarily due to an increase in the amount of advertising spending on our platform during the
year ended December 31, 2014
compared to the
year ended December 31, 2013
. This increase was primarily attributable to an increase in average CPM of $0.31, or 86%, partially offset by a decrease of 25% in paid impressions during the
year ended December 31, 2014
compared to the
year ended December 31, 2013
. This increase in average CPM during the period was due to an increase in average spend per buyer transacted on our platform in association with increased matching efficiency. In addition, the increase in average CPM was due to a shift in mix of advertising spend on our platform from lower-priced higher-volume static inventory to higher-priced lower-volume RTB transactions. Our paid impressions decreased during the
year ended December 31, 2014
compared to the
year ended December 31, 2013
due to the shift in mix of advertising spend on our platform from lower-priced higher-volume static inventory to higher-priced lower-volume RTB transactions and our traffic quality control initiatives put into place during the last several months of 2013 to maintain a high standard of quality advertising inventory and reduce lower quality traffic.
Revenue increased $26.8 million, or 47%, during the year ended December 31, 2013 compared to the year ended December 31, 2012 primarily for the same reasons described above. The increase was primarily attributable to an increase of $0.12, or 50%, in average CPM during the year ended December 31, 2013 compared to the year ended December 31, 2012, representing an increase in revenue of approximately $30.5 million after consideration of our take rate. The increase in average CPM was partially offset by a decrease of 7% in paid impressions during the year ended December 31, 2013 compared to the year ended December 31, 2012, representing a decrease in revenue by approximately $3.8 million after consideration of our take rate.
We expect revenue to continue to grow on an annual basis. Revenue may be impacted by seasonality, the amounts of fees we are able to charge buyers and sellers, and other factors such as changes in the market, our execution of the business, and competition.
Cost of Revenue
|
Year Ended
|
|||||||||||
|
December 31, 2014
|
December 31, 2013
|
December 31, 2012
|
|||||||||
|
(in thousands, except percentages)
|
|||||||||||
|
Costs of revenue
|
$
|
20,754
|
|
$
|
15,358
|
|
$
|
12,367
|
|
||
|
Percent of revenue
|
17
|
%
|
18
|
%
|
22
|
%
|
|||||
Cost of revenue increased by $
5.4 million
, or
35%
, for the
year ended December 31, 2014
compared to the
year ended December 31, 2013
. This increase was primarily due to an increase of
$3.6 million
in depreciation and amortization expense and an increase in data center, hosting, and bandwidth costs of
$1.2 million
. The increase in depreciation and amortization was primarily attributable to increase in depreciation of computer equipment and network hardware and amortization of capitalized internal use software primarily due to additional personnel and their development of new features and functionality to our solution. The amortization of capitalized internal use software reflected in cost of revenue was
$4.3 million
and
$2.6 million
for the
year ended December 31, 2014
and
2013
, respectively. The increases in data center, hosting, and bandwidth costs were primarily attributable to support the increase in the use of our platform and international expansion efforts requiring additional hardware, software, and maintenance expenses.
67
Cost of revenue increased by $3.0 million, or 24%, during the year ended December 31, 2013 compared to the year ended December 31, 2012. This increase was primarily due to an increase in data center, hosting, and bandwidth costs of $1.4 million, and an increase of $1.1 million in depreciation and amortization expense, including amortization of capitalized internal use software. The increases in data center, hosting, and bandwidth costs were primarily attributable to data center locations added during the year ended December 31, 2013 in order to support the increase in bidding volume on our platform and resulting additional hardware, software, and maintenance expenses. The increase in depreciation and amortization was primarily attributable to an increase in depreciation of computer equipment and network hardware and amortization of capitalized internal use software due to our continued investment in our revenue-producing platform. The amortization of capitalized internal use software reflected in cost of revenue was $2.6 million and $1.9 million for the years ended December 31, 2013 and 2012, respectively.
We expect cost of revenue to increase in absolute dollars in future periods as we continue to invest additional capital into our data centers, hire additional personnel to continue to build and maintain our systems, and invest in our technology. As a percentage of revenue, cost of revenue may fluctuate on a quarterly basis based on revenue levels, the timing of these investments, and due to increased amortization of acquired technology from business combinations.
Sales and Marketing
|
Year Ended
|
|||||||||||
|
December 31, 2014
|
December 31, 2013
|
December 31, 2012
|
|||||||||
|
(in thousands, except percentages)
|
|||||||||||
|
Sales and marketing
|
$
|
43,203
|
|
$
|
25,811
|
|
$
|
20,458
|
|
||
|
Percent of revenue
|
34
|
%
|
31
|
%
|
36
|
%
|
|||||
Sales and marketing expense increased by $
17.4 million
, or
67%
, for the
year ended December 31, 2014
compared to the
year ended December 31, 2013
. This increase was primarily due to an increase in personnel costs of
$13.4 million
, and to a lesser extent, an increase in marketing expenses of
$1.1 million
. The increase in personnel costs was primarily due to an increase in sales and marketing headcount in order to support our sales efforts and continue to develop and maintain relationships with buyers and sellers, as well as an increase in marketing, which was mainly related to our participation in industry events and tradeshows and related public relations activities.
Sales and marketing expense increased by $5.4 million, or 26%, during the year ended December 31, 2013 compared to the year ended December 31, 2012. This increase was primarily due to an increase in personnel expenses of $3.4 million, primarily due to an increase in sales and marketing headcount. Our sales and marketing headcount increased in order to support our sales efforts and continue to develop and maintain relationships with buyers and sellers, as well as to provide information to the market with respect to our solution.
We expect sales and marketing expenses to increase in absolute dollars in future periods as we continue to invest in our business, including expanding our domestic and international business. Sales and marketing expense as a percentage of revenue may fluctuate from period to period based on revenue levels, the timing of our investments, the seasonality in our industry and business, and increased amortization as a result of customer relationship intangibles acquired in our 2014 business combinations.
Technology and Development
|
Year Ended
|
|||||||||||
|
December 31, 2014
|
December 31, 2013
|
December 31, 2012
|
|||||||||
|
(in thousands, except percentages)
|
|||||||||||
|
Technology and development
|
$
|
22,718
|
|
$
|
18,615
|
|
$
|
13,115
|
|
||
|
Percent of revenue
|
18
|
%
|
22
|
%
|
23
|
%
|
|||||
Technology and development expense increased by
$4.1 million
, or
22%
, for the
year ended December 31, 2014
compared to the
year ended December 31, 2013
. This increase was primarily due to an increase in personnel costs of
$3.3 million
. The increase in personnel costs was primarily due to an increase in headcount, which reflects our continued hiring of engineers to maintain and support our technology and development efforts.
68
Technology and development expense increased by $5.5 million, or 42%, during the year ended December 31, 2013 compared to the year ended December 31, 2012. This increase was primarily due to an increase in personnel expense of $4.7 million. The increase in personnel expense was primarily due to an increase in headcount, which reflects our continued hiring of engineers to maintain and support our technology and development efforts primarily for the same reasons described above.
We expect technology and development expense to increase in absolute dollars in future periods as we continue to invest in our engineering and technology teams to support our technology and development efforts; however, the timing and amount of our capitalized development and enhancement projects may affect the amount of development costs expensed in any given period. Technology and development expense as a percentage of revenue may fluctuate from period to period based on revenue levels, the timing of these investments, the timing and the rate of the amortization of capitalized projects, and increased amortization as a result of non-compete intangibles acquired in our 2014 business combinations.
General and Administrative
|
Year Ended
|
|||||||||||
|
December 31, 2014
|
December 31, 2013
|
December 31, 2012
|
|||||||||
|
(in thousands, except percentages)
|
|||||||||||
|
General and administrative
|
$
|
57,398
|
|
$
|
27,926
|
|
$
|
12,331
|
|
||
|
Percent of revenue
|
46
|
%
|
33
|
%
|
22
|
%
|
|||||
General and administrative expense increased by $
29.5 million
, or
106%
, for the
year ended December 31, 2014
compared to the
year ended December 31, 2013
. This increase was primarily due to an increase in personnel costs of
$23.5 million
and an increase in professional services fees of
$2.6 million
. The increase in personnel costs was primarily due to an increase in stock-based compensation of
$14.7 million
and increased headcount. The increase in stock-based compensation expense was primarily associated with equity awards granted subsequent to
December 31, 2013
. The increase in headcount and third-party professional services fees was primarily related to supporting our operations as a public company.
General and administrative expense increased by $15.6 million, or 126%, during the year ended December 31, 2013 compared to the year ended December 31, 2012. This increase was primarily due to an increase in personnel expense of $8.4 million and an increase in professional services of $5.2 million. The increase in personnel costs was driven primarily by increased headcount to support our growth. The increase in third-party professional services was related to accounting, audit, tax and legal services as we continued to invest in our infrastructure, processes, and controls to support our growth and in preparation for our initial public offering and becoming a public company.
We expect general and administrative expense to increase in absolute dollars as we continue to invest in corporate infrastructure to support our growth and our operation as a public company, including professional services fees, insurance premiums and compliance costs associated with operating as a public company.
Other (Income) Expense, Net
|
Year Ended
|
|||||||||||
|
December 31, 2014
|
December 31, 2013
|
December 31, 2012
|
|||||||||
|
(in thousands)
|
|||||||||||
|
Interest expense, net
|
$
|
110
|
|
$
|
273
|
|
$
|
343
|
|
||
|
Change in fair value of convertible preferred stock warrant liabilities
|
732
|
|
4,121
|
|
515
|
|
|||||
|
Foreign exchange (gain) loss, net
|
(1,119
|
)
|
728
|
|
171
|
|
|||||
|
Total other (income) expense, net
|
$
|
(277
|
)
|
$
|
5,122
|
|
$
|
1,029
|
|
||
Following the closing of our IPO, we were no longer required to re-measure the warrants to fair value and record any changes in the fair value of these liabilities in our statement of operations, and accordingly, we did not record any related expenses subsequent to the closing of our IPO. The change in fair value of the preferred stock warrant liabilities for the year ended December 31, 2014 reflected an increase in the valuation of our convertible preferred stock from January 1, 2014 through the close of our IPO, due to increases in our value driven by our growth and progress toward becoming a public company. The change in fair value of the preferred stock warrant liabilities for the year ended December 31, 2013 reflected an increase in the valuation of our preferred stock from January 1, 2013 through December 31, 2013.
69
Foreign exchange (gain) loss, net is impacted by movements in exchange rates, primarily the British Pound and Euro relative to the U.S. Dollar, and the amount of foreign-currency denominated receivables and payables, which are impacted by our billings to buyers and payments to sellers. The foreign currency gain, net during the
year ended December 31, 2014
was primarily attributable to the strengthening of the U.S. Dollar in relation to the British Pound and Euro for foreign denominated transactions. The foreign currency loss, net during the
year ended December 31, 2013
was primarily attributable to the weakening of the U.S. Dollar in relation to the British Pound and Euro for foreign denominated transactions.
Provision for Income Taxes
Our provision for income taxes during the years ended
December 31, 2014
,
2013
, and
2012
of
$0.2 million
, $0.2 million and $0.1 million, respectively, was primarily related to taxes due in foreign jurisdictions.
At
December 31, 2014
, we had U.S. federal net operating loss carryforwards, or NOLs, of approximately
$65.4 million
, which will begin to expire in
2027
. At
December 31, 2014
, we had state NOLs of approximately
$61.5 million
, which will also begin to expire in
2027
. At
December 31, 2014
, we had federal research and development tax credit carryforwards, or credit carryforwards, of approximately
$4.3 million
, which will begin to expire in
2027
. At
December 31, 2014
, we had state research and development tax credits of approximately
$3.4 million
, which carry forward indefinitely. Utilization of certain NOLs and credit carryforwards may be subject to an annual limitation due to ownership change limitations set forth in the Code and similar state provisions. Any future annual limitation may result in the expiration of NOLs and credit carryforwards before utilization. A prior ownership change and certain acquisitions resulted in us having NOLs subject to insignificant annual limitations.
Quarterly Results of Operations and Key Metrics
The following tables set forth our quarterly consolidated statements of operations data in dollars and as a percentage of total revenue for each of the eight quarters in the two year period ended December 31, 2014. We have prepared the quarterly unaudited consolidated statements of operations data on a basis consistent with the audited consolidated financial statements included elsewhere in this Annual Report on Form 10-K. In the opinion of management, the financial information in these tables reflects all adjustments, consisting only of normal recurring adjustments, which management considers necessary for a fair statement of this data. This information should be read in conjunction with the audited consolidated financial statements and related notes included elsewhere in this Annual Report on Form 10-K. The results of historical periods are not necessarily indicative of the results for any future period.
|
Three Months Ended
|
||||||||||||||||||||||||||||||||
|
Mar. 31, 2013
|
June 30, 2013
|
Sept. 30, 2013
|
Dec. 31, 2013
|
Mar. 31, 2014
|
June 30, 2014
|
Sept. 30, 2014
|
Dec. 31, 2014
|
|||||||||||||||||||||||||
|
(in thousands)
|
||||||||||||||||||||||||||||||||
|
Revenue
|
$
|
16,600
|
|
$
|
19,035
|
|
$
|
20,063
|
|
$
|
28,132
|
|
$
|
23,015
|
|
$
|
28,283
|
|
$
|
32,165
|
|
$
|
41,832
|
|
||||||||
|
Expenses:
|
||||||||||||||||||||||||||||||||
|
Cost of revenue
(1)
|
3,437
|
|
3,594
|
|
4,181
|
|
4,146
|
|
4,460
|
|
4,852
|
|
5,144
|
|
6,298
|
|
||||||||||||||||
|
Sales and marketing
(1)
|
6,195
|
|
6,167
|
|
6,405
|
|
7,044
|
|
9,027
|
|
10,296
|
|
11,540
|
|
12,340
|
|
||||||||||||||||
|
Technology and development
(1)
|
4,111
|
|
5,138
|
|
4,823
|
|
4,543
|
|
4,677
|
|
4,598
|
|
5,766
|
|
7,677
|
|
||||||||||||||||
|
General and administrative
(1)
|
4,634
|
|
5,726
|
|
7,603
|
|
9,963
|
|
11,320
|
|
15,653
|
|
15,157
|
|
15,268
|
|
||||||||||||||||
|
Total expenses
|
18,377
|
|
20,625
|
|
23,012
|
|
25,696
|
|
29,484
|
|
35,399
|
|
37,607
|
|
41,583
|
|
||||||||||||||||
|
Income (loss) from operations
|
(1,777
|
)
|
(1,590
|
)
|
(2,949
|
)
|
2,436
|
|
(6,469
|
)
|
(7,116
|
)
|
(5,442
|
)
|
249
|
|
||||||||||||||||
|
Other (income) expense, net
|
335
|
|
452
|
|
1,922
|
|
2,413
|
|
(405
|
)
|
2,138
|
|
(803
|
)
|
(1,207
|
)
|
||||||||||||||||
|
Income (loss) before income taxes
|
(2,112
|
)
|
(2,042
|
)
|
(4,871
|
)
|
23
|
|
(6,064
|
)
|
(9,254
|
)
|
(4,639
|
)
|
1,456
|
|
||||||||||||||||
|
Provision (benefit) for income taxes
|
50
|
|
63
|
|
74
|
|
60
|
|
50
|
|
112
|
|
(17
|
)
|
27
|
|
||||||||||||||||
|
Net income (loss)
|
$
|
(2,162
|
)
|
$
|
(2,105
|
)
|
$
|
(4,945
|
)
|
$
|
(37
|
)
|
$
|
(6,114
|
)
|
$
|
(9,366
|
)
|
$
|
(4,622
|
)
|
$
|
1,429
|
|
||||||||
|
Net income (loss) per share attributable to common stockholders:
|
||||||||||||||||||||||||||||||||
|
Basic
|
$
|
(0.28
|
)
|
$
|
(0.28
|
)
|
$
|
(0.52
|
)
|
$
|
(0.10
|
)
|
$
|
(0.59
|
)
|
$
|
(0.29
|
)
|
$
|
(0.14
|
)
|
$
|
0.04
|
|
||||||||
|
Diluted
|
$
|
(0.28
|
)
|
$
|
(0.28
|
)
|
$
|
(0.52
|
)
|
$
|
(0.10
|
)
|
$
|
(0.59
|
)
|
$
|
(0.29
|
)
|
$
|
(0.14
|
)
|
$
|
0.04
|
|
||||||||
70
|
(1)
|
Stock-based compensation expense included in our expenses was as follows:
|
|
Three Months Ended
|
||||||||||||||||||||||||||||||||
|
Mar. 31, 2013
|
June 30, 2013
|
Sept. 30, 2013
|
Dec. 31, 2013
|
Mar. 31, 2014
|
June 30, 2014
|
Sept. 30, 2014
|
Dec. 31, 2014
|
|||||||||||||||||||||||||
|
(in thousands)
|
||||||||||||||||||||||||||||||||
|
Cost of revenue
|
$
|
18
|
|
$
|
22
|
|
$
|
24
|
|
$
|
23
|
|
$
|
31
|
|
$
|
57
|
|
$
|
39
|
|
$
|
39
|
|
||||||||
|
Sales and marketing
|
340
|
|
223
|
|
242
|
|
300
|
|
577
|
|
700
|
|
793
|
|
1,147
|
|
||||||||||||||||
|
Technology and development
|
368
|
|
419
|
|
396
|
|
462
|
|
303
|
|
424
|
|
530
|
|
971
|
|
||||||||||||||||
|
General and administrative
|
778
|
|
850
|
|
887
|
|
1,000
|
|
1,567
|
|
5,918
|
|
5,788
|
|
4,962
|
|
||||||||||||||||
|
Total
|
$
|
1,504
|
|
$
|
1,514
|
|
$
|
1,549
|
|
$
|
1,785
|
|
$
|
2,478
|
|
$
|
7,099
|
|
$
|
7,150
|
|
$
|
7,119
|
|
||||||||
The following table sets forth our consolidated results of operations for the specified periods as a percentage of our revenue for those periods.
|
Three Months Ended*
|
||||||||||||||||||||||||
|
Mar. 31, 2013
|
June 30, 2013
|
Sept. 30, 2013
|
Dec. 31, 2013
|
Mar. 31, 2014
|
June 30, 2014
|
Sept. 30, 2014
|
Dec. 31, 2014
|
|||||||||||||||||
|
Revenue
|
100
|
%
|
100
|
%
|
100
|
%
|
100
|
%
|
100
|
%
|
100
|
%
|
100
|
%
|
100
|
%
|
||||||||
|
Expenses:
|
||||||||||||||||||||||||
|
Cost of revenue
|
21
|
|
19
|
|
21
|
|
15
|
|
19
|
|
17
|
|
16
|
|
15
|
|
||||||||
|
Sales and marketing
|
37
|
|
32
|
|
32
|
|
25
|
|
39
|
|
36
|
|
36
|
|
29
|
|
||||||||
|
Technology and development
|
25
|
|
27
|
|
24
|
|
16
|
|
20
|
|
16
|
|
18
|
|
18
|
|
||||||||
|
General and administrative
|
28
|
|
30
|
|
38
|
|
35
|
|
49
|
|
55
|
|
47
|
|
36
|
|
||||||||
|
Total expenses
|
111
|
|
108
|
|
115
|
|
91
|
|
128
|
|
125
|
|
117
|
|
99
|
|
||||||||
|
Income (loss) from operations
|
(11
|
)
|
(8
|
)
|
(15
|
)
|
9
|
|
(28
|
)
|
(25
|
)
|
(17
|
)
|
1
|
|
||||||||
|
Other (income) expense, net
|
2
|
|
2
|
|
10
|
|
9
|
|
(2
|
)
|
8
|
|
(2
|
)
|
(3
|
)
|
||||||||
|
Income (loss) before income taxes
|
(13
|
)
|
(11
|
)
|
(24
|
)
|
—
|
|
(26
|
)
|
(33
|
)
|
(14
|
)
|
4
|
|
||||||||
|
Provision (benefit) for income taxes
|
—
|
|
—
|
|
—
|
|
—
|
|
—
|
|
—
|
|
—
|
|
—
|
|
||||||||
|
Net income (loss)
|
(13
|
)%
|
(11
|
)%
|
(25
|
)%
|
—
|
%
|
(27
|
)%
|
(33
|
)%
|
(14
|
)%
|
4
|
%
|
||||||||
* Certain figures may not sum due to rounding.
Key Operational and Financial Measures
|
Three Months Ended
|
||||||||||||||||||||||||||||||||
|
Mar. 31, 2013
|
June 30, 2013
|
Sept. 30, 2013
|
Dec. 31, 2013
|
Mar. 31, 2014
|
June 30, 2014
|
Sept. 30, 2014
|
Dec. 31, 2014
|
|||||||||||||||||||||||||
|
(in thousands, except for percentages)
|
||||||||||||||||||||||||||||||||
|
Operational Measures:
|
||||||||||||||||||||||||||||||||
|
Managed revenue
|
$
|
96,359
|
|
$
|
112,743
|
|
$
|
117,554
|
|
$
|
158,424
|
|
$
|
129,566
|
|
$
|
153,540
|
|
$
|
168,213
|
|
$
|
216,477
|
|
||||||||
|
Take rate
|
17.2
|
%
|
16.9
|
%
|
17.1
|
%
|
17.8
|
%
|
17.8
|
%
|
18.4
|
%
|
19.1
|
%
|
19.3
|
%
|
||||||||||||||||
|
Financial Measures:
|
||||||||||||||||||||||||||||||||
|
Revenue
|
$
|
16,600
|
|
$
|
19,035
|
|
$
|
20,063
|
|
$
|
28,132
|
|
$
|
23,015
|
|
$
|
28,283
|
|
$
|
32,165
|
|
$
|
41,832
|
|
||||||||
|
Adjusted EBITDA
|
$
|
1,976
|
|
$
|
2,089
|
|
$
|
632
|
|
$
|
6,526
|
|
$
|
(1,616
|
)
|
$
|
2,661
|
|
$
|
4,778
|
|
$
|
13,275
|
|
||||||||
For information on how we define operational metrics and financial measures see “—Key Operational and Financial Measures.” For more information as to the limitations of using non-GAAP measurements, see “Selected Financial Data.”
71
The following table presents a reconciliation of Adjusted EBITDA to net income (loss), the most directly comparable financial measure calculated in accordance with GAAP:
|
Three Months Ended
|
||||||||||||||||||||||||||||||||
|
Mar. 31, 2013
|
June 30, 2013
|
Sept. 30, 2013
|
Dec. 31, 2013
|
Mar. 31, 2014
|
June 30, 2014
|
Sept. 30, 2014
|
Dec. 31, 2014
|
|||||||||||||||||||||||||
|
(in thousands)
|
||||||||||||||||||||||||||||||||
|
Other Financial Data:
|
||||||||||||||||||||||||||||||||
|
Net income (loss)
|
$
|
(2,162
|
)
|
$
|
(2,105
|
)
|
$
|
(4,945
|
)
|
$
|
(37
|
)
|
$
|
(6,114
|
)
|
$
|
(9,366
|
)
|
$
|
(4,622
|
)
|
$
|
1,429
|
|
||||||||
|
Add back (deduct):
|
||||||||||||||||||||||||||||||||
|
Depreciation and amortization expense
|
2,061
|
|
2,040
|
|
2,032
|
|
2,305
|
|
2,375
|
|
2,678
|
|
3,070
|
|
4,394
|
|
||||||||||||||||
|
Stock-based compensation expense
|
1,504
|
|
1,514
|
|
1,549
|
|
1,785
|
|
2,478
|
|
7,099
|
|
7,150
|
|
7,119
|
|
||||||||||||||||
|
Acquisition and related items
|
188
|
|
125
|
|
—
|
|
—
|
|
—
|
|
—
|
|
—
|
|
1,513
|
|
||||||||||||||||
|
Interest expense, net
|
91
|
|
69
|
|
69
|
|
44
|
|
57
|
|
14
|
|
23
|
|
16
|
|
||||||||||||||||
|
Change in fair value of preferred stock warrant liabilities
|
549
|
|
428
|
|
1,090
|
|
2,054
|
|
(1,010
|
)
|
1,742
|
|
—
|
|
—
|
|
||||||||||||||||
|
Foreign currency (gain) loss, net
|
(305
|
)
|
(45
|
)
|
763
|
|
315
|
|
548
|
|
382
|
|
(826
|
)
|
(1,223
|
)
|
||||||||||||||||
|
Provision (benefit) for income taxes
|
50
|
|
63
|
|
74
|
|
60
|
|
50
|
|
112
|
|
(17
|
)
|
27
|
|
||||||||||||||||
|
Adjusted EBITDA
|
$
|
1,976
|
|
$
|
2,089
|
|
$
|
632
|
|
$
|
6,526
|
|
$
|
(1,616
|
)
|
$
|
2,661
|
|
$
|
4,778
|
|
$
|
13,275
|
|
||||||||
Liquidity and Capital Resources
From our incorporation in April 2007 until our IPO, we financed our operations and capital expenditures primarily through private sales of convertible preferred stock, our use of our credit facilities, and cash generated from operations. Between 2007 and 2010, we raised $52.6 million from the sale of preferred stock. On
April 7, 2014
, we completed our IPO and received proceeds from the offering of approximately
$86.2 million
after deducting the underwriting discounts and commissions, and offering expenses. At
December 31, 2014
, we had cash and cash equivalents of
$97.2 million
, of which
$1.4 million
was held in cash accounts overseas, and restricted cash of
$1.4 million
.
On April 14, 2014, we repaid all of the outstanding debt under the line of credit with Silicon Valley Bank of
$3.8 million
and during the year ended
December 31, 2014
we repaid capital lease obligations in the amount of
$0.3 million
. At
December 31, 2014
, we had
no
amounts outstanding under our credit facility with Silicon Valley Bank, and
$40 million
was available for additional borrowings.
At our option, loans under the credit facility may bear interest based on either the LIBOR rate or the prime rate plus, in each case, an applicable margin. The applicable margins under the credit facility are (i) 2.00% or 3.50% per annum in the case of LIBOR rate loans, and (ii) 0.00% or 1.50% per annum in the case of prime rate loans (based on Silicon Valley Bank’s net exposure to us after giving effect to unrestricted cash held at Silicon Valley Bank and its affiliates plus up to $3.0 million held at other institutions). In addition, an unused revolver fee in the amount of 0.15% per annum of the average unused portion of the credit facility is payable by us to Silicon Valley Bank monthly in arrears.
Our credit facility restricts our ability to, among other things, sell assets, make changes to the nature of our business, engage in mergers or acquisitions, incur, assume or permit to exist additional indebtedness and guarantees, create or permit to exist liens, pay dividends, make distributions or redeem or repurchase capital stock or make other investments, engage in transactions with affiliates and make payments in respect of subordinated debt.
In addition, in the event that the amount available to be drawn is less than 20% of the maximum line amount of the credit facility, or if an event of default exists, we are required to satisfy a minimum fixed charge coverage ratio test of 1.10 to 1.00. Currently, we would not satisfy this minimum fixed charge coverage ratio test, which is defined as a ratio of Adjusted EBITDA to the sum of interest accrual and principal payments required to be paid during the relevant measurement period. However, we meet the specified excess availability threshold, so we are not currently required to satisfy the fixed charge coverage ratio test. At
December 31, 2014
, our fixed charge coverage ratio was
(1.7)
to 1.0.
The credit facility also includes customary representations and warranties, affirmative covenants, and events of default, including events of default upon a change of control and material adverse change (as defined in the credit facility). Following an event of default, Silicon Valley Bank would be entitled to, among other things, accelerate payment of amounts due under the credit facility and exercise all rights of a secured creditor. We were in compliance with the covenants under the credit facility at
December 31, 2014
.
72
We believe our existing cash and cash flow from operations, together with the undrawn balance under our credit facility with Silicon Valley Bank, will be sufficient to meet our working capital requirements for at least the next 12 months. However, our liquidity assumptions may prove to be incorrect, and we could utilize our available financial resources sooner than we currently expect, particularly if we decide to pursue an acquisition or other strategic investment. Our future capital requirements and the adequacy of available funds will depend on many factors, including those set forth in Item 1A: “Risk Factors.”
In the future, we may attempt to raise additional capital through the sale of equity securities or through equity-linked or debt financing arrangements. If we raise additional funds by issuing equity or equity-linked securities, the ownership of our existing stockholders will be diluted. If we raise additional financing by the incurrence of indebtedness, we will be subject to increased fixed payment obligations and could also be subject to restrictive covenants, such as limitations on our ability to incur additional debt, and other operating restrictions that could adversely impact our ability to conduct our business. Any future indebtedness we incur may result in terms that could be unfavorable to equity investors.
There can be no assurances that we will be able to raise additional capital, which would adversely affect our ability to achieve our business objectives. In addition, if our operating performance during the next twelve months is below our expectations, our liquidity and ability to operate our business could be adversely affected.
Cash Flows
The following table summarizes our cash flows for the periods presented:
|
Year Ended
|
|||||||||||
|
December 31, 2014
|
December 31, 2013
|
December 31, 2012
|
|||||||||
|
(in thousands)
|
|||||||||||
|
Cash flows provided by operating activities
|
$
|
6,645
|
|
$
|
21,092
|
|
$
|
15,598
|
|
||
|
Cash flows used in investing activities
|
(23,123
|
)
|
(11,862
|
)
|
(9,030
|
)
|
|||||
|
Cash flows provided by (used in) financing activities
|
83,794
|
|
(796
|
)
|
(1,399
|
)
|
|||||
|
Effects of exchange rates on cash and cash equivalents
|
(76
|
)
|
(94
|
)
|
195
|
|
|||||
|
Increase in cash and cash equivalents
|
$
|
67,240
|
|
$
|
8,340
|
|
$
|
5,364
|
|
||
Operating Activities
Our cash flows from operating activities are primarily influenced by increases or decreases in collections from buyers and related payments to sellers, as well as our investment in personnel and infrastructure to support the anticipated growth of our business. Cash flows from operating activities have been further affected by changes in our working capital, particularly changes in accounts receivable and accounts payable. The timing of cash receipts from buyers and payments to sellers can significantly impact our cash flows from operating activities for any period presented. We typically collect from buyers in advance of payments to sellers; our collection and payment cycle can vary from period to period depending upon various circumstances, and we typically experience our highest level of cash flows used in operating activities during the first quarter of a given year due to the seasonality in our business, mainly due to cash flows associated with the activity related to the fourth quarter of the previous year. In addition, we expect seasonality to impact cash flows from operating activities on a sequential quarter basis.
For the
year ended December 31, 2014
, cash provided by operating activities of
$6.6 million
resulted from our net loss of
$18.7 million
, adjusted for non-cash expenses of
$36.5 million
, and net changes in our working capital of
$11.1 million
. The net change in operating working capital was primarily related to an increase in accounts receivable of approximately
$38.0 million
, an increase in prepaid expenses and other current assets of approximately
$2.2 million
, and a decrease in other liabilities of
$0.8 million
, partially offset by an increase in accounts payable and accrued expenses of approximately
$29.9 million
. The increase in prepaid expenses and other current assets was primarily due to an increase in business activity associated with the timing of payments to vendors. The decrease in other liabilities was primarily due to a decrease in business activity associated with the timing of payments to tax authorities. The changes in accounts payable and accrued expenses and accounts receivable was primarily due to the timing of cash receipts from buyers and the timing of payments to sellers.
For the
year ended December 31, 2013
, cash provided by operating activities of
$21.1 million
resulted from our net loss of
$9.2 million
, adjusted for non-cash expenses of
$19.0 million
, and net changes in our working capital of
$11.4 million
. The net change in working capital was primarily related to an increase in accounts payable and accrued expenses of approximately
$39.2 million
, partially offset by an increase in accounts receivable of approximately
$27.1 million
. The changes in accounts payable and accrued expenses and accounts receivable was primarily due to the timing of cash receipts from buyers and the timing of payments to sellers.
73
For the year ended December 31, 2012, cash provided by operating activities of $15.6 million resulted from our net loss of $2.4 million, adjusted for non-cash expenses of $10.2 million, and net changes in our working capital of $7.8 million. The net change in working capital was primarily related to an increase in accounts payable and accrued expenses of approximately $32.3 million, and an increase in other liabilities of approximately $1.7 million, offset by an increase in accounts receivable of approximately $26.3 million, both due to the growth in our revenues, the timing of cash receipts from buyers, and the timing of payments to sellers.
Investing Activities
Our primary investing activities have consisted of purchases of property and equipment in support of our expanding headcount as a result of our growth, and capital expenditures to develop our internal use software in support of creating and enhancing our technology infrastructure. Purchases of property and equipment may vary from period-to-period due to the timing of the expansion of our operations, the addition of headcount and the development cycles of our internal use software development. As our business grows, we expect our capital expenditures and our investment activity to continue to increase.
During the
year ended December 31, 2014
, we used
$23.1 million
of cash in investing activities, consisting of
$10.7 million
in investments in property and equipment and
$8.8 million
of investments in our internal use software, net of amounts reflected in accounts payable and accrued expenses at
December 31, 2014
. In addition, during the
year ended December 31, 2014
, we used
$4.6 million
for the acquisition of Shiny Inc., net of cash acquired, which was partially offset by cash of
$0.6 million
assumed in the acquisition of iSocket, Inc. In conjunction with our corporate office building lease, restricted cash decreased by
$0.3 million
.
During the
year ended December 31, 2013
, we used
$11.9 million
of cash in investment activities, consisting of
$6.8 million
of investments in property and equipment, net of amounts financed through capital leases,
$3.9 million
of investments in our internal use software, and
$1.2 million
of cash reclassified to restricted cash in conjunction with our corporate office building lease.
During the year ended December 31, 2012, we used $9.0 million of cash in investing activities, consisting of $3.7 million of investments in our internal use software and $3.0 million of investments in property and equipment, net of amounts reflected in accounts payable and accrued expenses at December 31, 2012 and net of amounts financed through capital leases. In addition, during the year ended December 31, 2012, we used $1.7 million for the acquisition of MobSmith, Inc., net of cash acquired. In conjunction with software license agreements, we reclassified $0.6 million of cash to restricted cash.
Financing Activities
Our financing activities consisted primarily of proceeds and expenses from our IPO, borrowings and repayments under our Silicon Valley Bank credit facility, including the equipment loans, and the issuance of shares of common stock upon the exercise of stock options.
For the
year ended December 31, 2014
, cash provided by financing activities of
$83.8 million
was primarily due to the net proceeds received from our IPO of
$89.7 million
, net of underwriting commissions and discounts, and proceeds of
$3.5 million
from stock option exercises, offset by the repayment of our Silicon Valley Bank credit facility and payments on our capital lease obligations of
$4.1 million
, payments of
$3.0 million
for offering costs related to our IPO, and payments of
$2.3 million
for taxes paid related to a net share settlement of stock-based awards.
For the
year ended December 31, 2013
, cash used in financing activities of
$0.8 million
was primarily due to payments of
$1.2 million
on our debt and capital lease obligations, partially offset by proceeds of
$0.9 million
from stock option exercises.
For the year ended December 31, 2012, cash used in financing activities of $1.4 million was primarily due to payments of $1.5 million on our equipment loan and capital lease obligations, partially offset by proceeds of $0.1 million from stock option exercises.
Off-Balance Sheet Arrangements
We do not have any relationships with other entities or financial partnerships, such as entities often referred to as structured finance or special purpose entities, that have been established for the purpose of facilitating off-balance sheet arrangements or other contractually narrow or limited purposes. We did not have any other off-balance sheet arrangements at
December 31, 2014
other than operating leases and the indemnification agreements described below.
74
Contractual Obligations and Known Future Cash Requirements
Our principal commitments consist of leases for our various office facilities, including our corporate headquarters in Los Angeles, California, and non-cancelable operating lease agreements with data centers that expire at various times through 2024. In certain cases, the terms of the lease agreements provide for rental payments on a graduated basis.
The following table summarizes our contractual obligations, including interest, at December 31, 2014:
|
2015
|
2016
|
2017
|
2018
|
2019
|
Thereafter
|
Total
|
||||||||||||||||||||||
|
(in thousands)
|
||||||||||||||||||||||||||||
|
Capital lease obligations
|
$
|
106
|
|
$
|
—
|
|
$
|
—
|
|
$
|
—
|
|
$
|
—
|
|
$
|
—
|
|
$
|
106
|
|
|||||||
|
Operating lease obligations
|
6,197
|
|
3,135
|
|
1,847
|
|
1,052
|
|
497
|
|
608
|
|
13,336
|
|
||||||||||||||
|
Total minimum payments
|
$
|
6,303
|
|
$
|
3,135
|
|
$
|
1,847
|
|
$
|
1,052
|
|
$
|
497
|
|
$
|
608
|
|
$
|
13,442
|
|
|||||||
At
December 31, 2014
, liabilities for unrecognized tax benefits of
$2.1 million
, which are attributable to U.S. income taxes, were not included in our contractual obligations because, due to their nature, there is a high degree of uncertainty regarding the time of future cash outflows and other events that extinguish these liabilities.
In the ordinary course of business, we enter into agreements with sellers, buyers and other third parties pursuant to which we agree to indemnify buyers, sellers, vendors, lessors, business partners, lenders, stockholders, and other parties with respect to certain matters, including, but not limited to, losses resulting from claims of intellectual property infringement, damages to property or persons, business losses, or other liabilities. Generally, these indemnity and defense obligations relate to our own business operations, obligations, and acts or omissions. However, under some circumstances, we agree to indemnify and defend contract counterparties against losses resulting from their own business operations, obligations, and acts or omissions, or the business operations, obligations, and acts or omissions of third parties. These indemnity provisions generally survive termination or expiration of the agreements in which they appear. In addition, we have entered into indemnification agreements with our directors, executive officers and certain other officers that will require us, among other things, to indemnify them against certain liabilities that may arise by reason of their status or service as directors, officers or employees. No demands have been made upon us to provide indemnification under such agreements and there are no claims that we are aware of that could have a material effect on our consolidated financial statements.
Critical Accounting Policies and Estimates
Our consolidated financial statements are prepared in accordance with GAAP. The preparation of these consolidated financial statements requires us to make estimates and assumptions that affect the reported amounts of assets, liabilities, revenue, expenses and related disclosures. We evaluate our estimates and assumptions on an ongoing basis. Our estimates are based on historical experience and various other assumptions that we believe to be reasonable under the circumstances. Our actual results could differ from these estimates.
We believe that the assumptions and estimates associated with the evaluation of revenue recognition criteria, including the determination of revenue recognition as net versus gross in our revenue arrangements, internal-use software development costs, including assumptions used in the valuation models to determine the fair value of stock options and stock-based compensation expense, the assumptions used in the valuation of acquired assets and liabilities in business combinations, and income taxes, including the realization of tax assets and estimates of tax liabilities, have the greatest potential impact on our consolidated financial statements. Therefore, we consider these to be our critical accounting policies and estimates.
We have previously identified several material weaknesses in our internal control over financial reporting. For additional information, see the risk factor in Item 1A entitled “
We have previously identified certain material weaknesses in our internal control over financial reporting. Failure to maintain effective internal controls could cause our investors to lose confidence in us and adversely affect the market price of our common stock. If our internal controls are not effective, we may not be able to accurately report our financial results or prevent fraud
.”
75
Revenue Recognition
We generate revenue from buyers and sellers who use our solution for the buying and selling of advertising inventory. We recognize revenue when four basic criteria are met: (i) persuasive evidence of an arrangement exists, (ii) delivery has occurred or services have been rendered, (iii) the fees are fixed or determinable, and (iv) collectibility is reasonably assured. We maintain separate arrangements with each buyer and seller either in the form of a master agreement, which specifies the terms of the relationship and access to our solution, or by insertion orders which specify price and volume requests. We also generate revenue directly from sellers who maintain the primary relationship with buyers and utilize our solution. We recognize revenue upon the completion of a transaction, that is, when an impression has been delivered to the consumer viewing a website or application. We assess whether fees are fixed or determinable based on impressions delivered and the contractual terms of the arrangements. Subsequent to the delivery of an impression, the fees are generally not subject to adjustment or refund. Historically, any refunds and adjustments have not been material. We assess collectibility based on a number of factors, including the creditworthiness of a buyer and seller and payment and transaction history. Our revenue arrangements do not include multiple deliverables. We generally bill buyers for the gross amount of advertising inventory they purchase plus fees, if any, and we remit to a seller the amount spent by the buyer for the advertising inventory purchased less our fees.
We also report revenue in conformity with
Revenue Recognition-Principal Agent Considerations
. The determination of whether we are the principal or agent, and hence whether to report revenue on a gross basis for the amount of the advertising inventory buyers purchase using our platform, plus fees, if any, or on a net basis for the amount of fees charged to the buyer, if any, and retained fees from or charged to the seller, requires us to evaluate a number of indicators, none of which is presumptive or determinative. Our solution enables buyers and sellers to purchase and sell advertising inventory, and matches buyers and sellers and establishes rules and parameters for advertising inventory transactions. Pricing is generally determined through our auction process. We do not purchase advertising inventory. As a result of these and other factors, we have determined we are not the principal in the purchase and sale of advertising inventory in all of its arrangements and we therefore report revenue on a net basis.
Internal Use Software Development Costs
We capitalize certain internal use software development costs associated with creating and enhancing internally developed software related to our technology infrastructure. These costs include personnel and related employee benefits expenses for employees who are directly associated with and who devote time to software projects, and external direct costs of materials and services consumed in developing or obtaining the software. Software development costs that do not meet the qualification for capitalization, as further discussed below, are expensed as incurred and recorded in technology and development expenses in the results of operations.
Software development activities generally consist of three stages, (i) the planning stage, (ii) the application and infrastructure development stage, and (iii) the post implementation stage. Costs incurred in the planning and post implementation stages of software development, including costs associated with the post-configuration training and repairs and maintenance of the developed technologies, are expensed as incurred. We capitalize costs associated with software developed for internal use when both the preliminary project stage is completed, management has authorized further funding for the completion of the project, and it is probable that the project will be completed and perform as intended. Costs incurred in the application and infrastructure development stages, including significant enhancements and upgrades, are capitalized. Capitalization ends once a project is substantially complete and the software and technologies are ready for their intended purpose. Internal use software development costs are amortized using a straight-line method over the estimated useful life of three years, commencing when the software is ready for its intended use. The straight-line recognition method approximates the manner in which the expected benefit will be derived.
We do not transfer ownership of our software, or lease our software, to third parties.
Stock-Based Compensation
Compensation expense related to employee stock-based awards is measured and recognized in the consolidated financial statements based on the fair value of the awards granted. We have granted awards to employees that vest based solely on continued service, or service conditions, awards that vest based on the achievement of performance targets, or performance conditions, and awards that vest based on our stock price exceeding a peer index, or market conditions. The fair value of each option award containing service and/or performance conditions is estimated on the grant date using the Black-Scholes option-pricing model. The fair value of awards containing market conditions is estimated using a Monte-Carlo lattice model. For service condition awards, stock-based compensation expense is recognized on a straight-line basis, net of forfeitures, over the requisite service periods of the awards, which is generally
four
years. For performance condition and market condition awards, stock-based compensation expense is recognized using a graded vesting model, over the requisite service period of the awards. For market condition awards, expense recognized is not subsequently reversed if the market conditions are not achieved.
76
Stock-based awards issued to non-employees are accounted for at fair value determined by using the Black-Scholes option-pricing model. We believe that the fair value of the stock options is more reliably measured than the fair value of the services received. The fair value of each non-employee stock-based compensation award is re-measured each period until a commitment date is reached, which is generally the vesting date.
Determining the fair value of stock-based awards at the grant date requires judgment. Our use of the Black-Scholes option-pricing model and Monte-Carlo lattice model requires the input of subjective assumptions such as the expected term of the option, the expected volatility of the price of our common stock, risk-free interest rates, the expected dividend yield of our common stock, and for periods prior to our IPO, the fair value of our common stock. The assumptions used in our valuation models represent management’s best estimates. These estimates involve inherent uncertainties and the application of management’s judgment. If factors change and different assumptions are used, our stock-based compensation expense could be materially different in the future.
These assumptions and estimates are as follows:
Fair Value of Common Stock.
For stock options granted subsequent to our IPO, the fair value of common stock is based on the closing price of our common stock as reported on the New York Stock Exchange, or the NYSE, on the date of grant. Prior to the IPO, the board of directors determined the fair value of the common stock at the time of the grant of options and restricted stock awards by considering a number of objective and subjective factors. The fair value was determined in accordance with applicable elements of the practice aid issued by the American Institute of Certified Public Accountants titled Valuation of Privately Held Company Equity Securities Issued as Compensation.
Risk-Free Interest Rate.
We base the risk-free interest rate used in the Black-Scholes option-pricing model on the yields of U.S. Treasury securities with maturities appropriate for the term of employee stock option awards.
Expected Term.
For employee options that contain service conditions, we apply the simplified approach, in which the expected term of an award is presumed to be the mid-point between the vesting date and the expiration date of the award. The expected term of employee stock options that contain performance conditions represents the weighted-average period that the stock options are estimated to remain outstanding.
Volatility.
Because we do not have significant trading history for our common stock, we determine the price volatility based on the historical volatilities of a publicly traded peer group based on daily price observations over a period equivalent to the expected term of the stock option grants.
Dividend Yield.
The dividend yield assumption is based on our history and current expectations of dividend payouts. We have never declared or paid any cash dividends on our common stock and we do not anticipate paying any cash dividends in the foreseeable future, so we used an expected dividend yield of
zero
.
The following table summarizes the weighted-average assumptions used in the Black-Scholes option-pricing model to determine the fair value of our stock options as follows:
|
Year Ended
|
|||||||||||
|
December 31, 2014
|
December 31, 2013
|
December 31, 2012
|
|||||||||
|
Fair value of common stock
|
$
|
13.88
|
|
$
|
8.76
|
|
$
|
4.70
|
|
||
|
Expected term (in years)
|
5.7
|
|
6.0
|
|
5.8
|
|
|||||
|
Risk-free interest rate
|
1.75
|
%
|
1.28
|
%
|
0.94
|
%
|
|||||
|
Expected volatility
|
51
|
%
|
58
|
%
|
59
|
%
|
|||||
|
Dividend yield
|
—
|
%
|
—
|
%
|
—
|
|
|||||
In addition to the above assumptions, we also estimate a forfeiture rate to calculate the stock-based compensation expense for stock based awards. Our forfeiture rate is based on an analysis of our historical forfeitures and estimated future forfeitures. Changes in the estimated forfeiture rate may have a significant impact on our stock-based compensation expense as the cumulative effect of adjusting the rate is recognized in the period the forfeiture estimate is changed.
We will continue to use judgment in evaluating the assumptions related to our stock-based compensation. Future expense amounts for any particular period could be affected by changes in our assumptions or market conditions.
Due to the full valuation allowance provided on our net deferred tax assets, we have not recorded any tax benefit attributable to stock-based awards for the years ended December 31, 2014, 2013, and 2012.
77
Business Combinations
The results of businesses acquired in a business combination are included in our consolidated financial statements from the date of acquisition. We allocate the purchase price, which is the sum of the consideration provided which may consist of cash, equity or a combination of the two, in a business combination to the identifiable assets and liabilities of the acquired business at their acquisition date fair values. The excess of the purchase price over the amount allocated to the identifiable assets and liabilities, if any, is recorded as goodwill. Determining the fair value of assets acquired and liabilities assumed requires management to use significant judgment and estimates including the selection of valuation methodologies, estimates of future revenues and cash flows, discount rates and selection of comparable companies.
When we issue stock-based or cash awards to an acquired company’s stockholders, we evaluate whether the awards are contingent consideration or compensation for post-business combination services. The evaluation includes, among other things, whether the vesting of the awards is contingent on the continued employment of the selling stockholder beyond the acquisition date. If continued employment is required for vesting, the awards are treated as compensation for post-acquisition services and recognized as expense over the requisite service period.
We estimate the fair value of intangible assets acquired generally using a discounted cash flow approach, which includes an analysis of the future cash flows expected to be generated by the asset and the risk associated with achieving these cash flows. The key assumptions used in the discounted cash flow model include the discount rate that is applied to the forecasted future cash flows to calculate the present value of those cash flows and the estimate of future cash flows attributable to the acquired intangible asset, which include revenue, expenses and taxes. The carrying value of acquired working capital assets and liabilities approximates its fair value, given the short-term nature of these assets and liabilities.
Acquisition-related transaction costs are not included as a component of consideration transferred, but are accounted for as an expense in the period in which the costs are incurred.
Income Taxes
Deferred income tax assets and liabilities are determined based upon the net tax effects of the differences between our consolidated financial statements carrying amounts and the tax basis of assets and liabilities and are measured using the enacted tax rate expected to apply to taxable income in the years in which the differences are expected to be reversed.
A valuation allowance is used to reduce some or all of the deferred tax assets if, based upon the weight of available evidence, it is more likely than not that those deferred tax assets will not be realized. We have established a full valuation allowance to offset our domestic net deferred tax assets due to the uncertainty of realizing future tax benefits from the net operating loss carryforwards and other deferred tax assets.
We recognize the tax benefit from an uncertain tax position only if it is more likely than not that the tax position will be sustained on examination by the taxing authorities, based on the technical merits of the position. The tax benefits recognized in the consolidated financial statements from such positions are then measured based on the largest benefit that has a greater than 50% likelihood of being realized. We recognize interest and penalties accrued related to our uncertain tax positions in our income tax provision in the accompanying consolidated statements of operations.
We recognize excess tax benefits associated with stock-based compensation to stockholders’ equity only when realized based on applying a with-and-without approach.
Recently Issued Accounting Pronouncements
For information regarding recent accounting pronouncements, refer to Note 2 of Item 8
Financial Statements and Supplementary Data
included in this Annual Report on Form 10-K.
78
We have operations both within the United States and internationally, and we are exposed to market risks in the ordinary course of our business. These risks include primarily interest rate, foreign exchange and inflation risks.
Interest Rate Fluctuation Risk
Our cash and cash equivalents consist of cash and money market funds. The primary objective of our investment activities is to preserve principal while maximizing income without significantly increasing risk. Because our cash and cash equivalents have a relatively short maturity, our portfolio’s fair value is relatively insensitive to interest rate changes. Our line of credit is at variable interest rates. We had no amounts outstanding under our credit facility at
December 31, 2014
. We do not believe that an increase or decrease in interest rates of 100 basis points would have a material effect on our operating results or financial condition. In future periods, we will continue to evaluate our investment policy relative to our overall objectives.
Foreign Currency Exchange Risk
We have foreign currency risks related to our revenue and expenses denominated in currencies other than the U.S. Dollar, principally British Pounds and Euro. The volatility of exchange rates depends on many factors that we cannot forecast with reliable accuracy. We have experienced and will continue to experience fluctuations in our net loss as a result of transaction gains and losses related to translating certain cash balances, trade accounts receivable and payable balances and intercompany balances that are denominated in currencies other than the U.S. Dollar. The effect of an immediate 10% adverse change in foreign exchange rates on foreign-denominated accounts at
December 31, 2014
, including intercompany balances, would result in a foreign currency loss of approximately
$2.7 million
. In the event our non-U.S. Dollar denominated sales and expenses increase, our operating results may be more greatly affected by fluctuations in the exchange rates of the currencies in which we do business. At this time we do not, but we may in the future, enter into derivatives or other financial instruments in an attempt to hedge our foreign currency exchange risk. It is difficult to predict the impact hedging activities would have on our results of operations.
Inflation Risk
We do not believe that inflation has had a material effect on our business, financial condition or results of operations. If our costs were to become subject to significant inflationary pressures, we might not be able to fully offset such higher costs through price increases. Our inability or failure to do so could harm our business, financial condition and results of operations.
79
The Rubicon Project, Inc.
INDEX TO CONSOLIDATED FINANCIAL STATEMENTS
|
Report of Independent Registered Public Accounting Firm
|
|
|
Consolidated Financial Statements:
|
|
|
Consolidated Balance Sheets
|
|
|
Consolidated Statements of Operations
|
|
|
Consolidated Statements of Comprehensive Loss
|
|
|
Consolidated Statements of Convertible Preferred Stock and Stockholders' Deficit
|
|
|
Consolidated Statements of Cash Flows
|
|
|
Notes to Consolidated Financial Statements
|
|
80
REPORT OF INDEPENDENT REGISTERED PUBLIC ACCOUNTING FIRM
The Board of Directors and Stockholders of The Rubicon Project, Inc.
In our opinion, the accompanying consolidated balance sheets and the related consolidated statements of operations, comprehensive loss, convertible preferred stock and stockholders’ equity (deficit) and cash flows present fairly, in all material respects, the financial position of The Rubicon Project, Inc. and its subsidiaries (the “Company”) at December 31, 2014 and 2013 and the results of their operations and their cash flows for each of the three years in the period ended December 31, 2014 in conformity with accounting principles generally accepted in the United States of America. These consolidated financial statements are the responsibility of the Company’s management. Our responsibility is to express an opinion on these consolidated financial statements based on our audits. We conducted our audits of these statements in accordance with the standards of the Public Company Accounting Oversight Board (United States). Those standards require that we plan and perform the audit to obtain reasonable assurance about whether the consolidated financial statements are free of material misstatement. An audit includes examining, on a test basis, evidence supporting the amounts and disclosures in the consolidated financial statements, assessing the accounting principles used and significant estimates made by management, and evaluating the overall consolidated financial statement presentation. We believe that our audits provide a reasonable basis for our opinion.
/s/ PricewaterhouseCoopers LLP
Los Angeles, California
March 6, 2015
81
THE RUBICON PROJECT, INC.
CONSOLIDATED BALANCE SHEETS
(In thousands, except per share amounts)
|
December 31, 2014
|
December 31, 2013
|
||||||
|
ASSETS
|
|||||||
|
Current assets:
|
|||||||
|
Cash and cash equivalents
|
$
|
97,196
|
|
$
|
29,956
|
|
|
|
Accounts receivable, net
|
133,267
|
|
94,722
|
|
|||
|
Prepaid expenses and other current assets
|
7,514
|
|
4,141
|
|
|||
|
TOTAL CURRENT ASSETS
|
237,977
|
|
128,819
|
|
|||
|
Property and equipment, net
|
15,196
|
|
8,712
|
|
|||
|
Internal use software development costs, net
|
11,501
|
|
7,204
|
|
|||
|
Goodwill
|
16,290
|
|
1,491
|
|
|||
|
Intangible assets, net
|
14,090
|
|
510
|
|
|||
|
Other assets, non-current
|
1,427
|
|
3,151
|
|
|||
|
TOTAL ASSETS
|
$
|
296,481
|
|
$
|
149,887
|
|
|
|
LIABILITIES, CONVERTIBLE PREFERRED STOCK AND STOCKHOLDERS’ EQUITY (DEFICIT)
|
|||||||
|
LIABILITIES
|
|||||||
|
Current liabilities:
|
|||||||
|
Accounts payable and accrued expenses
|
$
|
151,021
|
|
$
|
120,198
|
|
|
|
Debt and capital lease obligations, current portion
|
105
|
|
288
|
|
|||
|
Other current liabilities
|
3,276
|
|
2,901
|
|
|||
|
TOTAL CURRENT LIABILITIES
|
154,402
|
|
123,387
|
|
|||
|
Debt and capital leases, net of current portion
|
—
|
|
3,893
|
|
|||
|
Convertible preferred stock warrant liabilities
|
—
|
|
5,451
|
|
|||
|
Other liabilities, non-current
|
1,879
|
|
996
|
|
|||
|
Contingent consideration liability
|
11,448
|
|
—
|
|
|||
|
TOTAL LIABILITIES
|
167,729
|
|
133,727
|
|
|||
|
Commitments and contingencies (Note 16)
|
|
|
|||||
|
Series A, B, C, and D convertible preferred stock, $0.00001 par value, 29,691 shares authorized at December 31, 2013; 28,820 shares issued and outstanding at December 31, 2013
|
—
|
|
52,571
|
|
|||
|
STOCKHOLDERS’ EQUITY (DEFICIT)
|
|||||||
|
Preferred stock, $0.00001 par value, 10,000 shares authorized at December 31, 2014; 0 shares issued and outstanding at December 31, 2014
|
—
|
|
|
—
|
|
||
|
Common stock, $0.00001 par value; 500,000 and 73,380 shares authorized at December 31, 2014 and December 31, 2013, respectively; 37,192 and 11,855 shares issued and outstanding at December 31, 2014 and December 31, 2013, respectively
|
—
|
|
—
|
|
|||
|
Additional paid-in capital
|
209,472
|
|
25,532
|
|
|||
|
Accumulated other comprehensive (loss) income
|
(8)
|
|
96
|
|
|||
|
Accumulated deficit
|
(80,712)
|
|
(62,039)
|
|
|||
|
TOTAL STOCKHOLDERS’ EQUITY (DEFICIT)
|
128,752
|
|
(36,411)
|
|
|||
|
TOTAL LIABILITIES, CONVERTIBLE PREFERRED STOCK AND STOCKHOLDERS’ EQUITY (DEFICIT)
|
$
|
296,481
|
|
$
|
149,887
|
|
|
The accompanying notes to consolidated financial statements are an integral part of these statements.
82
THE RUBICON PROJECT, INC.
(In thousands, except per share amounts)
|
|
Year Ended
|
||||||||||
|
|
December 31, 2014
|
December 31, 2013
|
December 31, 2012
|
||||||||
|
Revenue
|
$
|
125,295
|
|
$
|
83,830
|
|
$
|
57,072
|
|
||
|
Expenses:
|
|
||||||||||
|
Cost of revenue
|
20,754
|
|
15,358
|
|
12,367
|
|
|||||
|
Sales and marketing
|
43,203
|
|
25,811
|
|
20,458
|
|
|||||
|
Technology and development
|
22,718
|
|
18,615
|
|
13,115
|
|
|||||
|
General and administrative
|
57,398
|
|
27,926
|
|
12,331
|
|
|||||
|
Total expenses
|
144,073
|
|
87,710
|
|
58,271
|
|
|||||
|
Loss from operations
|
(18,778
|
)
|
(3,880
|
)
|
(1,199
|
)
|
|||||
|
Other (income) expense:
|
|
||||||||||
|
Interest expense, net
|
110
|
|
273
|
|
343
|
|
|||||
|
Change in fair value of preferred stock warrant liabilities
|
732
|
|
4,121
|
|
515
|
|
|||||
|
Foreign exchange (gain) loss, net
|
(1,119
|
)
|
728
|
|
171
|
|
|||||
|
Total other (income) expense, net
|
(277
|
)
|
5,122
|
|
1,029
|
|
|||||
|
Loss before income taxes
|
(18,501
|
)
|
(9,002
|
)
|
(2,228
|
)
|
|||||
|
Provision for income taxes
|
172
|
|
247
|
|
134
|
|
|||||
|
Net loss
|
(18,673
|
)
|
(9,249
|
)
|
(2,362
|
)
|
|||||
|
Cumulative preferred stock dividends
|
(1,116
|
)
|
(4,244
|
)
|
(4,255
|
)
|
|||||
|
Net loss attributable to common stockholders
|
$
|
(19,789
|
)
|
$
|
(13,493
|
)
|
$
|
(6,617
|
)
|
||
|
Basic and diluted net loss per share attributable to common stockholders
|
$
|
(0.70
|
)
|
$
|
(1.17
|
)
|
$
|
(0.60
|
)
|
||
|
Basic and diluted weighted-average shares used to compute net loss per share attributable to common stockholders
|
28,217
|
|
11,488
|
|
11,096
|
|
|||||
The accompanying notes to consolidated financial statements are an integral part of these statements.
83
THE RUBICON PROJECT, INC.
CONSOLIDATED STATEMENTS OF COMPREHENSIVE LOSS
(In thousands)
|
Year Ended
|
|||||||||||
|
December 31, 2014
|
|
December 31, 2013
|
December 31, 2012
|
||||||||
|
Net loss
|
$
|
(18,673
|
)
|
$
|
(9,249
|
)
|
$
|
(2,362
|
)
|
||
|
Other comprehensive income (loss):
|
|||||||||||
|
Foreign currency translation adjustments
|
(104
|
)
|
1
|
|
2
|
|
|||||
|
Comprehensive loss
|
$
|
(18,777
|
)
|
$
|
(9,248
|
)
|
$
|
(2,360
|
)
|
||
The accompanying notes to consolidated financial statements are an integral part of these statements.
84
THE RUBICON PROJECT, INC.
CONSOLIDATED STATEMENTS OF CONVERTIBLE PREFERRED STOCK AND
STOCKHOLDERS’ EQUITY (DEFICIT)
(In thousands)
|
Preferred Stock
|
Common Stock
|
Additional
Paid-In Capital |
Accumulated Other
Comprehensive Income |
Accumulated
Deficit |
Total
Stockholders’ Equity (Deficit) |
||||||||||||||||||||||||
|
Shares
|
Amount
|
Shares
|
Amount
|
||||||||||||||||||||||||||
|
Balance at December 31, 2011
|
28,820
|
|
$
|
52,571
|
|
10,839
|
|
$
|
—
|
|
$
|
13,565
|
|
$
|
93
|
|
$
|
(50,428
|
)
|
$
|
(36,770
|
)
|
|||||||
|
Exercise of common stock options
|
—
|
|
—
|
|
163
|
|
—
|
|
125
|
|
—
|
|
—
|
|
125
|
|
|||||||||||||
|
Equity issued for acquisitions
|
—
|
|
—
|
|
245
|
|
—
|
|
1,237
|
|
—
|
|
—
|
|
1,237
|
|
|||||||||||||
|
Stock-based compensation
|
—
|
|
—
|
|
154
|
|
—
|
|
3,206
|
|
—
|
|
—
|
|
3,206
|
|
|||||||||||||
|
Foreign exchange translation adjustment
|
—
|
|
—
|
|
—
|
|
—
|
|
—
|
|
2
|
|
—
|
|
2
|
|
|||||||||||||
|
Net loss
|
—
|
|
—
|
|
—
|
|
—
|
|
—
|
|
—
|
|
(2,362
|
)
|
(2,362
|
)
|
|||||||||||||
|
Balance at December 31, 2012
|
28,820
|
|
52,571
|
|
11,401
|
|
—
|
|
18,133
|
|
95
|
|
(52,790
|
)
|
(34,562
|
)
|
|||||||||||||
|
Exercise of common stock options
|
—
|
|
—
|
|
454
|
|
—
|
|
866
|
|
—
|
|
—
|
|
866
|
|
|||||||||||||
|
Stock-based compensation
|
—
|
|
—
|
|
—
|
|
—
|
|
6,533
|
|
—
|
|
—
|
|
6,533
|
|
|||||||||||||
|
Foreign exchange translation adjustment
|
—
|
|
—
|
|
—
|
|
—
|
|
—
|
|
1
|
|
—
|
|
1
|
|
|||||||||||||
|
Net loss
|
—
|
|
—
|
|
—
|
|
—
|
|
—
|
|
—
|
|
(9,249
|
)
|
(9,249
|
)
|
|||||||||||||
|
Balance at December 31, 2013
|
28,820
|
|
52,571
|
|
11,855
|
|
—
|
|
25,532
|
|
96
|
|
(62,039
|
)
|
(36,411
|
)
|
|||||||||||||
|
Exercise of common stock options
|
—
|
|
—
|
|
1,360
|
|
—
|
|
3,498
|
|
—
|
|
—
|
|
3,498
|
|
|||||||||||||
|
Restricted stock awards
|
—
|
|
—
|
|
2,168
|
|
—
|
|
—
|
|
—
|
|
—
|
|
—
|
|
|||||||||||||
|
Shares withheld related to net share settlement
|
—
|
|
—
|
|
(174
|
)
|
—
|
|
(2,324
|
)
|
—
|
|
—
|
|
(2,324
|
)
|
|||||||||||||
|
Issuance of common stock related to RSU vesting
|
—
|
|
—
|
|
4
|
|
—
|
|
—
|
|
—
|
|
—
|
|
—
|
|
|||||||||||||
|
Net exercise of warrant for convertible preferred stock
|
572
|
|
—
|
|
—
|
|
—
|
|
5,983
|
|
—
|
|
—
|
|
5,983
|
|
|||||||||||||
|
Conversion of convertible preferred stock to common stock
|
(29,392
|
)
|
(52,571
|
)
|
14,696
|
|
—
|
|
52,571
|
|
—
|
|
—
|
|
52,571
|
|
|||||||||||||
|
Conversion of warrant for convertible preferred stock to a warrant for common stock
|
—
|
|
—
|
|
—
|
|
—
|
|
200
|
|
—
|
|
—
|
|
200
|
|
|||||||||||||
|
Issuance of common stock from initial public offering, net of issuance costs
|
—
|
|
—
|
|
6,432
|
|
—
|
|
86,200
|
|
—
|
|
—
|
|
86,200
|
|
|||||||||||||
|
Net exercise of warrant for common stock
|
—
|
|
—
|
|
10
|
|
—
|
|
—
|
|
—
|
|
—
|
|
—
|
|
|||||||||||||
|
Issuance of common stock and exchange of stock options related to acquisitions
|
—
|
|
—
|
|
841
|
|
—
|
|
13,342
|
|
—
|
|
—
|
|
13,342
|
|
|||||||||||||
|
Stock-based compensation
|
—
|
|
—
|
|
—
|
|
—
|
|
24,470
|
|
—
|
|
—
|
|
24,470
|
|
|||||||||||||
|
Foreign exchange translation adjustment
|
—
|
|
—
|
|
—
|
|
—
|
|
—
|
|
(104
|
)
|
—
|
|
(104
|
)
|
|||||||||||||
|
Net loss
|
—
|
|
—
|
|
—
|
|
—
|
|
—
|
|
—
|
|
(18,673
|
)
|
(18,673
|
)
|
|||||||||||||
|
Balance at December 31, 2014
|
—
|
|
$
|
—
|
|
37,192
|
|
$
|
—
|
|
$
|
209,472
|
|
$
|
(8
|
)
|
$
|
(80,712
|
)
|
$
|
128,752
|
|
|||||||
The accompanying notes to consolidated financial statements are an integral part of these statements.
85
THE RUBICON PROJECT, INC.
(In thousands)
|
Year Ended
|
|||||||||||
|
December 31, 2014
|
December 31, 2013
|
December 31, 2012
|
|||||||||
|
OPERATING ACTIVITIES:
|
|||||||||||
|
Net loss
|
$
|
(18,673
|
)
|
$
|
(9,249
|
)
|
$
|
(2,362
|
)
|
||
|
Adjustments to reconcile net loss to net cash provided by operating activities:
|
|||||||||||
|
Depreciation and amortization
|
12,517
|
|
8,438
|
|
6,857
|
|
|||||
|
Stock-based compensation
|
23,846
|
|
6,352
|
|
3,044
|
|
|||||
|
Loss (gain) on disposal of property and equipment, net
|
202
|
|
(7
|
)
|
6
|
|
|||||
|
Change in fair value of preferred stock warrant liabilities
|
732
|
|
4,121
|
|
515
|
|
|||||
|
Contingent consideration accretion
|
66
|
|
—
|
|
—
|
|
|||||
|
Deferred income taxes
|
(145
|
)
|
—
|
|
(20
|
)
|
|||||
|
Unrealized foreign currency (gain) loss
|
(763
|
)
|
68
|
|
(231
|
)
|
|||||
|
Changes in operating assets and liabilities, net of effect of business acquisitions:
|
|||||||||||
|
Accounts receivable
|
(38,023
|
)
|
(27,102
|
)
|
(26,339
|
)
|
|||||
|
Prepaid expenses and other assets
|
(2,152
|
)
|
(1,966
|
)
|
84
|
|
|||||
|
Accounts payable and accrued expenses
|
29,861
|
|
39,168
|
|
32,348
|
|
|||||
|
Other liabilities
|
(823
|
)
|
1,269
|
|
1,696
|
|
|||||
|
Net cash provided by operating activities
|
6,645
|
|
21,092
|
|
15,598
|
|
|||||
|
INVESTING ACTIVITIES:
|
|||||||||||
|
Purchases of property and equipment
|
(10,706
|
)
|
(6,785
|
)
|
(3,040
|
)
|
|||||
|
Capitalized internal use software development costs
|
(8,779
|
)
|
(3,926
|
)
|
(3,699
|
)
|
|||||
|
Acquisitions, net of cash acquired
|
(3,983
|
)
|
—
|
|
(1,741
|
)
|
|||||
|
Change in restricted cash
|
345
|
|
(1,151
|
)
|
(550
|
)
|
|||||
|
Net cash used in investing activities
|
(23,123
|
)
|
(11,862
|
)
|
(9,030
|
)
|
|||||
|
FINANCING ACTIVITIES:
|
|||||||||||
|
Proceeds from the issuance of common stock in initial public offering, net of underwriting discounts and commissions
|
89,733
|
|
—
|
|
—
|
|
|||||
|
Payments of initial public offering costs
|
(3,037
|
)
|
(496
|
)
|
—
|
|
|||||
|
Proceeds from exercise of stock options
|
3,498
|
|
866
|
|
125
|
|
|||||
|
Taxes paid related to net share settlement
|
(2,324
|
)
|
—
|
|
—
|
|
|||||
|
Repayment of debt and capital lease obligations
|
(4,076
|
)
|
(1,166
|
)
|
(1,524
|
)
|
|||||
|
Net cash provided by (used in) financing activities
|
83,794
|
|
(796
|
)
|
(1,399
|
)
|
|||||
|
EFFECT OF EXCHANGE RATE CHANGES ON CASH AND CASH EQUIVALENTS
|
(76
|
)
|
(94
|
)
|
195
|
|
|||||
|
INCREASE IN CASH AND CASH EQUIVALENTS
|
67,240
|
|
8,340
|
|
5,364
|
|
|||||
|
CASH--Beginning of period
|
29,956
|
|
21,616
|
|
16,252
|
|
|||||
|
CASH AND CASH EQUIVALENTS--End of period
|
$
|
97,196
|
|
$
|
29,956
|
|
$
|
21,616
|
|
||
|
SUPPLEMENTAL DISCLOSURES OF OTHER CASH FLOW INFORMATION:
|
|||||||||||
|
Cash paid for income taxes
|
$
|
403
|
|
$
|
307
|
|
$
|
13
|
|
||
|
Cash paid for interest
|
$
|
122
|
|
$
|
241
|
|
$
|
303
|
|
||
|
Capitalized assets financed by accounts payable and accrued expenses
|
$
|
1,872
|
|
$
|
194
|
|
$
|
340
|
|
||
|
Assets acquired under capital leases
|
$
|
—
|
|
$
|
—
|
|
$
|
1,235
|
|
||
|
Leasehold improvements paid by landlord
|
$
|
803
|
|
$
|
—
|
|
$
|
—
|
|
||
|
Capitalized stock-based compensation
|
$
|
624
|
|
$
|
181
|
|
$
|
162
|
|
||
|
Conversion of preferred stock to common stock
|
$
|
52,571
|
|
$
|
—
|
|
$
|
—
|
|
||
|
Reclassification of preferred stock warrant liabilities to additional-paid-in-capital
|
$
|
6,183
|
|
$
|
—
|
|
$
|
—
|
|
||
|
Reclassification of deferred offering costs to additional-paid-in-capital
|
$
|
3,533
|
|
|
$
|
—
|
|
$
|
—
|
|
|
|
Deferred offering costs included in accounts payable and accrued expenses
|
$
|
—
|
|
$
|
865
|
|
$
|
—
|
|
||
|
Common stock and exchange of stock options for business acquisitions
|
$
|
13,342
|
|
$
|
—
|
|
$
|
1,237
|
|
||
The accompanying notes to consolidated financial statements are an integral part of these statements.
86
THE RUBICON PROJECT, INC.
NOTES TO CONSOLIDATED FINANCIAL STATEMENTS
Company Overview
The Rubicon Project, Inc., or Rubicon Project or the Company, was formed on April 20, 2007 in Delaware and began operations in April 2007. The Company is headquartered in Los Angeles, California.
The Company is a technology company with a mission to automate the buying and selling of advertising. The Company offers a highly scalable platform that creates and powers a marketplace for trading digital advertising between buyers and sellers.
The Company delivers value to buyers and sellers of digital advertising through the Company’s proprietary advertising automation solution, which provides critical functionality to both buyers and sellers. The advertising automation solution consists of applications for sellers, including providers of websites, applications and other digital media properties, to sell their advertising inventory; applications for buyers, including advertisers, agencies, agency trading desks, demand side platforms, and ad networks, to buy advertising inventory; and a marketplace over which such transactions are executed. This solution incorporates proprietary machine-learning algorithms, sophisticated data processing, high-volume storage, detailed analytics capabilities, and a distributed infrastructure. Together, these features form the basis for the Company’s advertising marketplace that brings buyers and sellers together and facilitates intelligent decision-making and automated transaction execution for the advertising inventory managed on the Company’s platform.
Initial Public Offering
In
April 2014
, the Company completed an initial public offering, or IPO, whereby
6,432,445
shares of common stock were issued and sold by the Company, and
1,354,199
shares of common stock were sold by selling stockholders. Upon the closing of the IPO, all outstanding shares of preferred stock of the Company converted into common stock. See Note 11.
Risks
The Company is subject to certain business risks, including dependence on key employees, competition, market acceptance of its platform solution, ability to source demand from buyers of advertising inventory and source supply from sellers of advertising inventory, and dependence on growth to achieve its business plan.
Basis of Consolidation
The accompanying consolidated financial statements are presented in accordance with accounting principles generally accepted in the United States of America, or GAAP, and include the operations of the Company and its wholly owned subsidiaries. All significant inter-company transactions and balances have been eliminated in consolidation.
Segments
Management has determined that it operates in
one
segment. The Company’s chief operating decision maker reviews financial information on an aggregated and consolidated basis, together with certain operating and performance measures principally to make decisions about how to allocate resources and to measure the Company’s performance.
Stock Split
On
March 18, 2014
, the Company effected a 1-for-2 reverse stock split of its common stock. The convertible preferred stock was not split at
March 18, 2014
; instead the convertible preferred stock conversion ratio was adjusted to effect the stock split at the time of conversion of the preferred stock to common stock. All share, per share and related information presented in the consolidated financial statements and accompanying notes has been retroactively adjusted, where applicable, to reflect the reverse stock split.
Use of Estimates
The preparation of consolidated financial statements in conformity with GAAP requires management to make estimates and assumptions that affect the reported and disclosed financial statements and accompanying footnotes. Actual results could differ materially from these estimates.
87
On an ongoing basis, management evaluates its estimates, primarily those related to: (i) revenue recognition criteria, including the determination of revenue reporting as net versus gross in the Company’s revenue arrangements, (ii) accounts receivable and allowances for doubtful accounts, (iii) the useful lives of intangible assets and property and equipment, (iv) valuation of long-lived assets and their recoverability, including goodwill, (v) the realization of tax assets and estimates of tax liabilities, (vi) the valuation of common and preferred stock and preferred stock warrants prior to the Company’s IPO, (vii) assumptions used in valuation models to determine the fair value of stock-based awards, (viii) fair value of financial instruments, (ix) the recognition and disclosure of contingent liabilities, and (x) the assumptions used in valuing acquired assets and assumed liabilities in business combinations. These estimates are based on historical data and experience, as well as various other factors that management believes to be reasonable under the circumstances, the results of which form the basis for making judgments about the carrying value of assets and liabilities that are not readily apparent from other sources. Estimates relating to the valuation of stock and business combinations require the selection of appropriate valuation methodologies and models, and significant judgment in evaluating ranges of assumptions and financial inputs. Actual results may differ materially from those estimates under different assumptions or circumstances.
Revenue Recognition
The Company generates revenue from buyers and sellers who use the Company’s solution for the buying and selling of advertising inventory. The Company recognizes revenue when four basic criteria are met: (i) persuasive evidence of an arrangement exists, (ii) delivery has occurred or services have been rendered, (iii) the fees are fixed or determinable, and (iv) collectibility is reasonably assured. The Company maintains separate arrangements with each buyer and seller either in the form of a master agreement, which specifies the terms of the relationship and access to the Company’s solution, or by insertion orders which specify price and volume requests. The Company also generates revenue directly from sellers who maintain the primary relationship with buyers and utilize the Company’s solution. The Company recognizes revenue upon the completion of a transaction, that is, when an impression has been delivered to the consumer viewing a website or application. The Company assesses whether fees are fixed or determinable based on impressions delivered and the contractual terms of the arrangements. Subsequent to the delivery of an impression, the fees are generally not subject to adjustment or refund. Historically, any refunds and adjustments have not been material. The Company assesses collectibility based on a number of factors, including the creditworthiness of a buyer and seller and payment and transaction history. The Company’s revenue arrangements do not include multiple deliverables. The Company generally bills buyers for the gross amount of advertising inventory they purchase plus fees, if any, and the Company remits to a seller the amount spent by the buyer for the advertising inventory purchased less the Company’s fees.
The Company also reports revenue in conformity with
Revenue Recognition-Principal Agent Considerations
. The determination of whether the Company is the principal or agent, and hence whether to report revenue on a gross basis for the amount of the advertising inventory buyers purchase using the Company’s platform, plus fees, if any, or on a net basis for the amount of fees charged to the buyer, if any, and retained fees from or charged to the seller, requires the Company to evaluate a number of indicators, none of which is presumptive or determinative. The Company’s solution enables buyers and sellers to purchase and sell advertising inventory, and matches buyers and sellers and establishes rules and parameters for advertising inventory transactions. Pricing is generally determined through the Company’s auction process. The Company does not purchase advertising inventory. As a result of these and other factors, the Company has determined it is not the principal in the purchase and sale of advertising inventory in all of its arrangements and the Company therefore reports revenue on a net basis.
Expenses
The Company classifies its expenses into four categories:
Cost of Revenue
The Company’s cost of revenue consists primarily of data center costs, bandwidth costs, depreciation and maintenance expense of hardware supporting the Company’s revenue-producing platform, amortization of software costs for the development of the Company’s revenue-producing platform, amortization expense associated with acquired developed technologies, personnel costs, and facilities-related costs. Personnel costs included in cost of revenue include salaries, bonuses, stock-based compensation, and employee benefit costs, and are primarily attributable to personnel in our network operations group, who support the Company’s platform. The Company capitalizes costs associated with software that is developed or obtained for internal use and amortizes the costs associated with the Company’s revenue-producing platform in cost of revenue over their estimated useful lives. Many of these expenses are generally fixed and do not increase or decrease proportionately with increases or decreases in our revenue.
88
Sales and Marketing
The Company’s sales and marketing expenses consist primarily of personnel costs, including stock-based compensation and the sales bonuses paid to the Company’s sales organization, and marketing expenses such as brand marketing, travel expenses, trade shows and marketing materials, professional services, and to a lesser extent, facilities-related costs and depreciation and amortization. The Company's sales organization focuses on marketing the Company's solution to increase the adoption of the solution by existing and new buyers and sellers.
Technology and Development
The Company’s technology and development expenses consist primarily of personnel costs, including stock-based compensation, and professional services associated with the ongoing development and maintenance of the Company’s solution, and to a lesser extent, facilities-related costs and depreciation and amortization. These expenses include costs incurred in the development, implementation, and maintenance of internal use software, including platform and related infrastructure. Technology and development costs are expensed as incurred, except to the extent that such costs are associated with internal use software development that qualifies for capitalization, which are then recorded as
Internal use software development costs, net
on the Company’s consolidated balance sheet. The Company amortizes internal use software development costs that relate to its revenue-producing activities on its platform to cost of revenue and amortizes other internal use software development costs to technology and development costs or general and administrative expenses, depending on the nature of the related project.
General and Administrative
The Company’s general and administrative expenses consist primarily of personnel costs, including stock-based compensation, associated with the Company’s executive, finance, legal, human resources, compliance, and other administrative personnel, as well as accounting and legal professional services fees, facilities-related costs and depreciation, and other corporate related expenses. General and administrative expenses also include amortization of internal use software development costs that relate to general and administrative functions.
Stock-Based Compensation
Compensation expense related to employee stock-based awards is measured and recognized in the consolidated financial statements based on the fair value of the awards granted. The Company has granted awards to employees that vest based solely on continued service, or service conditions, awards that vest based on the achievement of performance targets, or performance conditions, and awards that vest based on the Company's stock price exceeding a peer index, or market conditions. The fair value of each option award containing service and/or performance conditions is estimated on the grant date using the Black-Scholes option-pricing model. The fair value of awards containing market conditions is estimated using a Monte-Carlo lattice model. For service condition awards, stock-based compensation expense is recognized on a straight-line basis, net of forfeitures, over the requisite service periods of the awards, which is generally
four
years. For performance condition and market condition awards, stock-based compensation expense is recognized using a graded vesting model, over the requisite service period of the awards. For market condition awards, expense recognized is not subsequently reversed if the market conditions are not achieved.
Stock-based awards issued to non-employees are accounted for at fair value determined by using the Black-Scholes option-pricing model. The Company believes that the fair value of the stock options is more reliably measured than the fair value of the services received. The fair value of each non-employee stock-based compensation award is re-measured each period until a commitment date is reached, which is generally the vesting date.
Determining the fair value of stock-based awards at the grant date requires judgment. The Company’s use of the Black-Scholes option-pricing model and Monte-Carlo lattice model requires the input of subjective assumptions such as the expected term of the option, the expected volatility of the price of the Company’s common stock, risk-free interest rates, the expected dividend yield of the Company’s common stock, and for periods prior to the Company's IPO, the fair value of the Company's common stock. The assumptions used in the Company’s valuation models represent management’s best estimates. These estimates involve inherent uncertainties and the application of management’s judgment. If factors change and different assumptions are used, the Company’s stock-based compensation expense could be materially different in the future.
These assumptions and estimates are as follows:
Fair Value of Common Stock.
For stock options granted subsequent to the Company's IPO, the fair value of common stock is based on the closing price of the Company's common stock as reported on the New York Stock Exchange, or the NYSE, on the date of grant. Prior to the IPO, the board of directors determined the fair value of the common stock at the time of the grant of options and restricted stock awards by considering a number of objective and subjective factors. The fair value was determined in accordance with applicable elements of the practice aid issued by the American Institute of Certified Public Accountants titled Valuation of Privately Held Company Equity Securities Issued as Compensation.
89
Risk-Free Interest Rate.
The Company bases the risk-free interest rate used in the Black-Scholes option-pricing model on the yields of U.S. Treasury securities with maturities appropriate for the term of employee stock option awards.
Expected Term.
For employee options that contain service conditions, the Company applies the simplified approach, in which the expected term of an award is presumed to be the mid-point between the vesting date and the expiration date of the award. The expected term of employee stock options that contain performance conditions represents the weighted-average period that the stock options are estimated to remain outstanding.
Volatility.
Because the Company does not have significant trading history for the Company’s common stock, the Company determines the price volatility based on the historical volatilities of a publicly traded peer group based on daily price observations over a period equivalent to the expected term of the stock option grants.
Dividend Yield.
The dividend yield assumption is based on the Company’s history and current expectations of dividend payouts. The Company has never declared or paid any cash dividends on its common stock and does not anticipate paying any cash dividends in the foreseeable future, so the Company used an expected dividend yield of
zero
.
In addition to the above assumptions, the Company also estimates a forfeiture rate to calculate the stock-based compensation expense for stock based awards. The Company’s forfeiture rate is based on an analysis of the Company’s historical forfeitures and estimated future forfeitures. Changes in the estimated forfeiture rate may have a significant impact on the Company’s stock-based compensation expense as the cumulative effect of adjusting the rate is recognized in the period the forfeiture estimate is changed.
The Company will continue to use judgment in evaluating the assumptions related to the Company’s stock-based compensation. Future expense amounts for any particular period could be affected by changes in the Company’s assumptions or market conditions.
Due to the full valuation allowance provided on its net deferred tax assets, the Company has not recorded any tax benefit attributable to stock-based awards for the years ended
December 31, 2014
,
2013
, and
2012
.
Income Taxes
Deferred income tax assets and liabilities are determined based upon the net tax effects of the differences between the Company’s consolidated financial statements carrying amounts and the tax basis of assets and liabilities and are measured using the enacted tax rate expected to apply to taxable income in the years in which the differences are expected to be reversed.
A valuation allowance is used to reduce some or all of the deferred tax assets if, based upon the weight of available evidence, it is more likely than not that those deferred tax assets will not be realized. The Company has established a full valuation allowance to offset its domestic net deferred tax assets due to the uncertainty of realizing future tax benefits from the net operating loss carryforwards and other deferred tax assets.
The Company recognizes the tax benefit from an uncertain tax position only if it is more likely than not that the tax position will be sustained on examination by the taxing authorities, based on the technical merits of the position. The tax benefits recognized in the consolidated financial statements from such positions are then measured based on the largest benefit that has a greater than 50% likelihood of being realized. The Company recognizes interest and penalties accrued related to its uncertain tax positions in its income tax provision in the accompanying consolidated statements of operations.
The Company recognizes excess tax benefits associated with stock-based compensation to stockholders’ equity only when realized based on applying a with-and-without approach.
Net Loss Per Share Attributable to Common Stockholders
Basic net loss per share of common stock is calculated by dividing the net loss attributable to common stockholders by the weighted-average number of shares of common stock outstanding. Net loss attributable to common stockholders is equal to net loss adjusted for declared or cumulative preferred stock dividends for the period. Prior to the IPO, because the holders of the Company’s convertible preferred stock were entitled to participate in dividends, the Company applied the two-class method in calculating earnings per share for periods when the Company generated net income. The two-class method requires net income to be allocated between the common and preferred stockholders based on their respective rights to receive dividends, whether or not declared. However, because the convertible preferred stock was not contractually obligated to share in the Company’s losses, no such allocation was made for any period presented given the Company’s net losses.
90
Diluted loss per share attributable to common stockholders adjusts the basic weighted-average number of shares of common stock outstanding for the effect of potentially dilutive securities during the period. Potentially dilutive securities consist of stock options, restricted stock awards, restricted stock units, potential shares issued under the Company's Employee Stock Purchase Plan, shares held in escrow and potential shares issuable as part of contingent consideration as a result of business combinations, warrants and convertible preferred stock. For purposes of this calculation, potentially dilutive securities are excluded from the calculation of diluted net loss per share attributable to common stockholders if their effect is anti-dilutive.
Prior to the Company's IPO, the Company had two classes of stock, Class A and Class B. Basic and diluted net loss per share attributable to common stockholders were the same for Class A and Class B common stock because they were entitled to the same liquidation and dividend rights. In connection with the IPO, the outstanding shares of Class A common stock and Class B common stock were converted into shares of a single class of common stock on a
one
-for-one basis. See Note 11.
Comprehensive Loss
Comprehensive loss encompasses all changes in equity other than those arising from transactions with stockholders, and consists of net loss and foreign currency translation adjustments.
Cash and Cash Equivalents
The Company considers cash and cash equivalents to include short-term, highly liquid investments that are readily convertible to known amounts of cash and so near their maturity that they present insignificant risk of changes in their value, including investments with original or remaining maturities from the date of purchase of three months or less. At December 31, 2014 and 2013, cash and cash equivalents consisted of cash balances and money market funds of
$97.2 million
and
$30.0 million
, respectively.
Restricted Cash
The Company holds restricted cash required to fulfill its payment obligations if the Company should default under a software license agreement and the building lease for its headquarters in Los Angeles, California. At December 31, 2014 and 2013, restricted cash included in prepaid expenses and other current assets was
$0.4 million
and
$0.4 million
, respectively. At December 31, 2014 and 2013, restricted cash included in other assets, non-current was
$1.0 million
and
$1.3 million
, respectively.
Accounts Receivable Allowance for Doubtful Accounts
Accounts receivable are recorded at the invoiced amount, are unsecured, and do not bear interest. The allowance for doubtful accounts is based on the best estimate of the amount of probable credit losses in existing accounts receivable. The allowance for doubtful accounts is determined based on historical collection experience and the review in each period of the status of the then-outstanding accounts receivable, while taking into consideration current customer information, subsequent collection history and other relevant data. The Company reviews the allowance for doubtful accounts on a quarterly basis. Account balances are charged off against the allowance when the Company believes it is probable the receivable will not be recovered. The Company’s allowance for doubtful accounts was approximately
$0.3 million
and
$0.7 million
at December 31, 2014 and 2013, respectively. During the years ended December 31, 2014, and 2013, the Company reserved an additional
$0.2 million
and
$1.0 million
, respectively, for doubtful accounts and wrote-off
$0.6 million
and
$0.4 million
, respectively, of accounts receivable. Activity for the year ended December 31, 2012 was not significant.
Property and Equipment, Net
Property and equipment are recorded at historical cost, less accumulated depreciation and amortization. Depreciation is computed using the straight-line method based upon the estimated useful lives of the assets. The estimated useful lives of the Company’s property and equipment are as follows:
|
Years
|
|
|
Purchased and internally developed software
|
3
|
|
Computer equipment and network hardware
|
3
|
|
Furniture, fixtures and office equipment
|
5 to 7
|
|
Leasehold improvements
|
Shorter of useful
life or life of lease |
|
Computer equipment under capital leases
|
Shorter of useful
life or life of lease |
91
Repair and maintenance costs are charged to expense as incurred, while renewals and improvements are capitalized. When assets are retired or otherwise disposed of, the cost and related accumulated depreciation are removed from the accounts and any resulting gain or loss is reflected in the Company’s results of operations.
Internal Use Software Development Costs
The Company capitalizes certain internal use software development costs associated with creating and enhancing internally developed software related to the Company’s technology infrastructure. These costs include personnel and related employee benefits expenses for employees who are directly associated with and who devote time to software projects, and external direct costs of materials and services consumed in developing or obtaining the software. Software development costs that do not meet the qualification for capitalization, as further discussed below, are expensed as incurred and recorded in technology and development expenses in the results of operations.
Software development activities generally consist of three stages, (i) the planning stage, (ii) the application and infrastructure development stage, and (iii) the post implementation stage. Costs incurred in the planning and post implementation stages of software development, including costs associated with the post-configuration training and repairs and maintenance of the developed technologies, are expensed as incurred. The Company capitalizes costs associated with software developed for internal use when both the preliminary project stage is completed, management has authorized further funding for the completion of the project, and it is probable that the project will be completed and perform as intended. Costs incurred in the application and infrastructure development stages, including significant enhancements and upgrades, are capitalized. Capitalization ends once a project is substantially complete and the software and technologies are ready for their intended purpose. Internal use software development costs are amortized using a straight-line method over the estimated useful life of three years, commencing when the software is ready for its intended use. The straight-line recognition method approximates the manner in which the expected benefit will be derived.
The Company does not transfer ownership of its software, or lease its software, to third parties.
Intangible Assets
Intangible assets primarily consist of acquired developed technology, customer relationships and non-compete agreements resulting from business combinations, which are recorded at cost, less accumulated amortization. The Company determines the appropriate useful life of its intangible assets by performing an analysis of expected cash flows of the acquired assets. Intangible assets are amortized over their estimated useful lives using a straight-line method, which approximates the pattern in which the economic benefits are consumed.
The estimated useful lives of the Company’s intangible assets are as follows:
|
Years
|
|
|
Developed technology
|
3 to 5
|
|
Non-compete agreements
|
2 to 3
|
|
Customer relationships
|
2.5
|
|
Other intangible assets
|
0.5 to 1.5
|
Impairment of Long-Lived Assets including Internal Use Capitalized Software Costs
The Company assesses the recoverability of its long-lived assets when events or changes in circumstances indicate their carrying value may not be recoverable. Such events or changes in circumstances may include: a significant adverse change in the extent or manner in which a long-lived asset is being used, significant adverse change in legal factors or in the business climate that could affect the value of a long-lived asset, an accumulation of costs significantly in excess of the amount originally expected for the acquisition or development of a long-lived asset, current or future operating or cash flow losses that demonstrate continuing losses associated with the use of a long-lived asset, or a current expectation that, more likely than not, a long-lived asset will be sold or otherwise disposed of significantly before the end of its previously estimated useful life. The Company performs impairment testing at the asset group level that represents the lowest level for which identifiable cash flows are largely independent of the cash flows of other assets and liabilities. The Company assesses recoverability of a long-lived asset by determining whether the carrying value of the asset group can be recovered through projected undiscounted cash flows over their remaining lives. If the carrying value of the asset group exceeds the forecasted undiscounted cash flows, an impairment loss is recognized, measured as the amount by which the carrying amount exceeds estimated fair value. An impairment loss is charged to operations in the period in which management determines such impairment.
92
Business Combinations
The results of businesses acquired in a business combination are included in the Company’s consolidated financial statements from the date of acquisition. The Company allocates the purchase price, which is the sum of the consideration provided which may consist of cash, equity or a combination of the two, in a business combination to the identifiable assets and liabilities of the acquired business at their acquisition date fair values. The excess of the purchase price over the amount allocated to the identifiable assets and liabilities, if any, is recorded as goodwill. Determining the fair value of assets acquired and liabilities assumed requires management to use significant judgment and estimates including the selection of valuation methodologies, estimates of future revenues and cash flows, discount rates and selection of comparable companies.
When the Company issues stock-based or cash awards to an acquired company’s stockholders, the Company evaluates whether the awards are contingent consideration or compensation for post-business combination services. The evaluation includes, among other things, whether the vesting of the awards is contingent on the continued employment of the selling stockholder beyond the acquisition date. If continued employment is required for vesting, the awards are treated as compensation for post-acquisition services and recognized as expense over the requisite service period.
The Company estimates the fair value of intangible assets acquired generally using a discounted cash flow approach, which includes an analysis of the future cash flows expected to be generated by the asset and the risk associated with achieving these cash flows. The key assumptions used in the discounted cash flow model include the discount rate that is applied to the forecasted future cash flows to calculate the present value of those cash flows and the estimate of future cash flows attributable to the acquired intangible asset, which include revenue, expenses and taxes. The carrying value of acquired working capital assets and liabilities approximates its fair value, given the short-term nature of these assets and liabilities.
Acquisition-related transaction costs are not included as a component of consideration transferred, but are accounted for as an expense in the period in which the costs are incurred.
Goodwill
Goodwill represents the excess of the aggregate fair value of the consideration transferred in a business combination over the fair value of the assets acquired, net of liabilities assumed. Goodwill is not amortized, but is subject to an annual impairment test. The Company tests for impairment of goodwill annually during the fourth quarter or more frequently if events or changes in circumstances indicate that the goodwill may be impaired.
Events or changes in circumstances which could trigger an impairment review include a significant adverse change in legal factors or in the business climate, an adverse action or assessment by a regulator, unanticipated competition, a loss of key personnel, significant changes in the manner of the Company’s use of the acquired assets or the strategy for the Company’s overall business, significant negative industry or economic trends, or significant underperformance relative to expected historical or projected future results of operations.
The Company has the option to first assess qualitative factors to determine whether the existence of events or circumstances leads to a determination that it is more likely than not that the fair value of a reporting unit is less than its carrying amount. If, after assessing the totality of events or circumstances, an entity determines it is not more likely than not that the fair value of a reporting unit is less than its carrying amount, then additional impairment testing is not required. However, if an entity concludes otherwise, then it is required to perform the first of a two-step impairment test.
The first step involves comparing the estimated fair value of a reporting unit with its respective book value, including goodwill. If the estimated fair value exceeds book value, goodwill is considered not to be impaired and no additional steps are necessary. If, however, the fair value of the reporting unit is less than book value, then a second step is required which requires the carrying amount of the goodwill be compared with its implied fair value. The estimate of implied fair value of goodwill may require valuations of certain internally generated and unrecognized intangible and tangible net assets. If the carrying amount of goodwill exceeds the implied fair value of the goodwill, an impairment loss is recognized in an amount equal to the excess.
Operating and Capital Leases
The Company records rent expense for operating leases, some of which have escalating rent payments, over the term of the lease, on a straight-line basis over the lease term. The Company begins recognition of rent expense on the date of initial possession, which is generally when the Company enters the leased premises and begins to make improvements in preparation for its intended use. Some of the Company’s lease arrangements provide for concessions by the landlords, including payments for leasehold improvements and rent-free periods. The Company accounts for the difference between the straight-line rent expense and rent paid as a deferred rent liability.
93
The Company leases equipment under capital lease arrangements. The assets and liabilities under capital lease are recorded at the lesser of present value of aggregate future minimum lease payments, including estimated bargain purchase options, or the fair value of the asset under lease. Assets under capital lease are amortized using the straight-line method over the estimated useful lives of the assets.
Preferred Stock Warrant Liabilities
The Company issued warrants to purchase preferred stock in connection with professional services and financing arrangements and accounted for these warrants as liabilities at fair value because the underlying shares of convertible preferred stock were contingently redeemable, including in the case of a deemed liquidation, which may have obligated the Company to transfer assets to the warrant holders. The preferred stock warrants were recorded at fair value at the time of issuance and changes in the fair value of the preferred stock warrants each reporting period were recorded as part of other expense, net in the Company’s consolidated statements of operations until the earlier of the exercise or expiration of the warrants or the warrants’ conversion to warrants to purchase common stock, at which time any remaining liability was reclassified to additional paid-in capital. Following the closing of the Company's IPO, the Company was no longer required to re-measure the warrants to fair value and record any changes in the fair value of these liabilities in the statement of operations, and accordingly, the Company did not record any related expenses subsequent to the closing of the IPO.
Fair Value of Financial Instruments
Fair value represents the exchange price that would be received for an asset or paid to transfer a liability (an exit price) in the principal or most advantageous market for the asset or liability in an orderly transaction between market participants on the measurement date. Valuation techniques used to measure fair value must maximize the use of observable inputs and minimize the use of unobservable inputs. The fair value hierarchy is based on the following three levels of inputs, of which the first two are considered observable and the last one is considered unobservable:
|
•
|
Level 1 – Quoted prices (unadjusted) in active markets for identical assets or liabilities that the Company has the ability to access at the measurement date.
|
|
•
|
Level 2 – Inputs other than quoted prices included within Level 1 that are observable for the asset or liability, either directly or indirectly.
|
|
•
|
Level 3 – Unobservable inputs.
|
Observable inputs are based on market data obtained from independent sources.
At,
December 31, 2014
, the Company's contingent consideration liability was measured using unobservable inputs that required a high level of judgment to determine fair value, and thus classified as Level 3. At December 31, 2013 the Company’s warrants to purchase preferred stock were measured using unobservable inputs that required a high level of judgment to determine fair value, and thus classified as Level 3. The Company's warrants to purchase preferred stock were re-measured to fair value through closing of the IPO. See Note 8.
The carrying amounts of cash equivalents, accounts receivable, accounts payable, accrued expenses, and seller payables approximate fair value due to the short-term nature of these instruments. The carrying value of the line of credit approximates fair value based on borrowing rates currently available to the Company for financing with similar terms and were determined to be Level 2.
Certain assets, including goodwill and intangible assets are also subject to measurement at fair value on a non-recurring basis if they are deemed to be impaired as a result of an impairment review.
Concentration of Risk
Financial instruments that potentially subject the Company to concentration of credit risk consist principally of cash, cash equivalents, restricted cash and accounts receivable. The Company maintains its cash and cash equivalents with financial institutions which exceed the Federal Deposit Insurance Corporation, or FDIC, federally insured limits.
Accounts receivable include amounts due from buyers with principal operations primarily in the United States. The Company performs ongoing credit evaluations of its buyers.
At
December 31, 2014
,
two
buyers accounted for
15%
and
11%
, respectively, of consolidated accounts receivable. At December 31, 2013,
two
buyers accounted for
13%
and
10%
, respectively, of consolidated accounts receivable.
94
For the years ended
December 31, 2014
,
2013
, and
2012
,
no
buyer or seller of advertising inventory comprised
10%
or more of consolidated revenue.
At
December 31, 2014
, one seller of advertising inventory comprised
14%
of consolidated accounts payable. At
December 31, 2013
,
no
seller of advertising inventory comprised
10%
or more of consolidated accounts payable.
Foreign Currency Transactions and Translation
Transactions in foreign currencies are translated into the functional currency of the applicable entity at the rates of exchange in effect at the date of the transaction. Foreign exchange gains, net was approximately
$1.1 million
for the year ended
December 31, 2014
and foreign exchange losses, net were approximately
$0.7 million
and
$0.2 million
for the years ended
December 31, 2013
and
2012
, respectively, and are included in other expense, net in the accompanying consolidated statements of operations. To the extent that the functional currency is different than the U.S Dollar, the financial statements have then been translated into U.S. Dollars using period-end exchanges rates for assets and liabilities and average exchanges rates for the results of operations. Foreign currency translation gains and losses are included as a component of accumulated other comprehensive loss on the consolidated balance sheet.
Recent Accounting Pronouncements
Under the Jumpstart Our Business Startups Act, or the JOBS Act, the Company meets the definition of an emerging growth company. The Company has irrevocably elected to opt out of the extended transition period for complying with new or revised accounting standards pursuant to Section 107(b) of the JOBS Act.
In
April 2014
, the Financial Accounting Standards Board, or FASB, issued new accounting guidance that raises the threshold for a disposal to qualify as a discontinued operation and requires new disclosures of both discontinued operations and certain other disposals that do not meet the definition of a discontinued operation. The new guidance is effective for fiscal years beginning on or after December 15, 2014. Early adoption is permitted but only for disposals that have not been reported in financial statements previously issued. As of
December 31, 2014
, the adoption of this guidance is not expected to have a material impact on the Company's consolidated financial statements.
In
May 2014
, the FASB issued new accounting guidance that requires an entity to recognize the amount of revenue it expects to earn from the transfer of promised goods or services to customers. The new accounting guidance will replace most existing GAAP revenue recognition guidance when it becomes effective. The new guidance is effective for annual reporting periods (including interim periods within those periods) beginning after December 15, 2016. Early adoption is not permitted. The guidance permits the use of either the retrospective or cumulative effect transition method. The Company will evaluate the effect, if any, the guidance will have on the Company's consolidated financial statements and related disclosures. The Company has not yet selected a transition method nor has it determined the effect of the guidance on its ongoing financial reporting.
In
August 2014
, the FASB issued an amendment to the accounting guidance related to the evaluation of an entity to continue as a going concern. The amendment establishes management
’
s responsibility to evaluate whether there is a substantial doubt about an entity's ability to continue as a going concern in connection with preparing financial statements for each annual and interim reporting period. The amendment also gives guidance to determine whether to disclose information about relevant conditions and events when there is substantial doubt about an entity's ability to continue as a going concern. The new guidance is effective as of December 15, 2016. The adoption of this guidance is not expected to have a material impact on the Company's consolidated financial statements.
The following table presents the basic and diluted net loss per share attributable to common stockholders:
|
Year Ended
|
||||||||||||
|
December 31, 2014
|
December 31, 2013
|
December 31, 2012
|
||||||||||
|
(In thousands, except per share data)
|
||||||||||||
|
Net loss attributable to common stockholders
|
$
|
(19,789
|
)
|
$
|
(13,493
|
)
|
$
|
(6,617
|
)
|
|||
|
Weighted-average common shares outstanding
|
29,921
|
|
11,540
|
|
11,179
|
|
||||||
|
Weighted-average unvested restricted shares
|
(1,704
|
)
|
(52
|
)
|
(83
|
)
|
||||||
|
Weighted-average common shares outstanding used to compute net loss per share attributable to common stockholders
|
28,217
|
|
11,488
|
|
11,096
|
|
||||||
|
Basic and diluted net loss per share attributable to common stockholders
|
$
|
(0.70
|
)
|
$
|
(1.17
|
)
|
$
|
(0.60
|
)
|
|||
95
The following shares have been excluded from the calculation of diluted net loss per share attributable to common stockholders for each period presented because they are anti-dilutive:
|
December 31, 2014
|
December 31, 2013
|
December 31, 2012
|
||||||
|
(in thousands)
|
||||||||
|
Options to purchase common stock
|
8,113
|
|
8,360
|
|
5,771
|
|
||
|
Unvested restricted stock awards
|
1,750
|
|
—
|
|
135
|
|
||
|
Unvested restricted stock units
|
845
|
|
—
|
|
—
|
|
||
|
Shares held in escrow
|
125
|
|
—
|
|
—
|
|
||
|
Conversion of convertible preferred stock
|
—
|
|
14,410
|
|
14,410
|
|
||
|
Conversion of preferred stock warrants
|
—
|
|
436
|
|
436
|
|
||
|
Total shares excluded from net loss per share attributable to common stockholders
|
10,833
|
|
23,206
|
|
20,752
|
|
||
In addition to the above anti-dilutive shares, shares contingently issuable if certain milestones are achieved on December 31, 2015 related to a business combination that occurred during the year
December 31, 2014
have been excluded from the calculation of diluted net loss per share attributable to common stockholders for the year ended December 31, 2014. See Note 6.
For the years ended
December 31, 2014
,
2013
, and
2012
the Company increased its net loss by
$1.1 million
,
$4.2 million
, and
$4.3 million
, respectively, for cumulative preferred stock dividends in determining its net loss attributable to common stockholders. Upon the completion of the Company
’
s IPO in
April 2014
, all of the preferred stock converted to common stock and accordingly, after the IPO the Company was no longer required to increase its net loss for preferred stock dividends in determining its net loss attributable to common stockholders.
Major classes of property and equipment were as follows:
|
December 31, 2014
|
December 31, 2013
|
|||||||
|
(in thousands)
|
||||||||
|
Purchased software
|
$
|
1,651
|
|
$
|
1,534
|
|
||
|
Computer equipment and network hardware
|
24,673
|
|
16,189
|
|
||||
|
Furniture, fixtures and office equipment
|
1,491
|
|
1,047
|
|
||||
|
Leasehold improvements
|
2,994
|
|
830
|
|
||||
|
30,809
|
|
19,600
|
|
|||||
|
Accumulated depreciation
|
(15,613
|
)
|
(10,888
|
)
|
||||
|
$
|
15,196
|
|
$
|
8,712
|
|
|||
96
Depreciation expense on property and equipment totaled
$6.5 million
,
$4.9 million
and
$3.9 million
for the years ended
December 31, 2014
,
2013
, and
2012
, respectively.
At
December 31, 2014
and
2013
, property and equipment includes property and equipment under capital leases with a cost basis of
$0.6 million
and
$1.3 million
, respectively. Accumulated depreciation on property and equipment under capital leases at
December 31, 2014
and
2013
was
$0.5 million
and
$0.9 million
, respectively.
Depreciation expense on property and equipment under capital leases was
$0.3 million
,
$0.5 million
and
$0.4 million
for the years ended
December 31, 2014
,
2013
, and
2012
, respectively.
There were
no
impairment charges to property and equipment for the years ended
December 31, 2014
,
2013
, and
2012
.
Internal use software development costs were as follows:
|
December 31, 2014
|
December 31, 2013
|
|||||||
|
(in thousands)
|
||||||||
|
Internal use software development costs, gross
|
$
|
20,926
|
|
$
|
12,656
|
|
||
|
Accumulated amortization
|
(9,425
|
)
|
(5,452
|
)
|
||||
|
Internal use software development costs, net
|
$
|
11,501
|
|
$
|
7,204
|
|
||
During the years ended
December 31, 2014
,
2013
, and
2012
, the Company capitalized
$9.4 million
,
$4.1 million
and
$3.9 million
of internal use software development costs. Amortization expense was
$5.1 million
,
$2.7 million
and
$2.0 million
for the years ended
December 31, 2014
,
2013
, and
2012
. In the years ended December 31, 2014 and 2013, amortization expense included the write-off of software development costs, net, of
$0.7 million
and
$0.2 million
, respectively. Based on the Company’s internal use software development costs at
December 31, 2014
, estimated amortization expense of
$5.2 million
,
$4.0 million
,
$2.2 million
and
$0.1 million
is expected to be recognized in 2015, 2016, 2017, and 2018, respectively.
There were
no
impairment charges to internal use software development costs for the years ended
December 31, 2014
,
2013
, and
2012
.
2014 Acquisitions
iSocket, Inc.
On
November 17, 2014
, the Company completed the acquisition of all the issued and outstanding shares of iSocket, Inc., or iSocket, a San Francisco, California based technology company focused on automating the direct buying and selling of premium, guaranteed ad inventory. iSocket provided automated applications for advertisers to plan, negotiate and purchase guaranteed inventory and for publishers to manage and streamline the direct sales process.
Purchase consideration for the acquisition was
840,885
shares of the Company’s common stock, with a fair value of approximately
$11.2 million
, based on the Company’s common stock price as reported on the NYSE on the acquisition date.
125,116
of the
840,885
shares were placed in escrow to secure post-closing indemnification obligations of the sellers and any shares remaining in escrow after satisfaction of any resolved indemnity claims, less any shares withheld to satisfy pending claims, will be released from escrow on
February 17, 2016
.
The purchase consideration also included contingent consideration of up to
$12.0 million
worth of common stock if certain performance milestones are achieved on December 31, 2015. The number of shares to be issued is based on the average closing price of the Company's common stock for the
ten
consecutive trading days ending on (and including) the last trading day of 2015. The Company determined it was probable that the performance milestones would be achieved and accordingly, the full amount of the contingent consideration of
$12.0 million
was discounted to fair value at a discount rate of
4.8%
, based on an estimate of the Company's incremental borrowing rate. In accordance with ASC 480,
Distinguishing Liabilities from Equity
, the contingent consideration has been recorded as a non-current liability in the consolidated balance sheet as the contingent consideration is payable in a variable number of shares.
97
As part of the acquisition, existing stock options to purchase common stock of iSocket, were exchanged for options to purchase the Company's common stock. The fair value of stock options exchanged, measured on the acquisition date, of
$3.1 million
was attributed to pre-acquisition and post-acquisition services. The fair value attributed to pre-acquisition services of
$2.1 million
was recorded as purchase consideration and the fair value attributed to post-acquisition services of
$1.0 million
is expected to be recognized as compensation expense on the Company's consolidated statements of operations over their remaining vesting periods.
The total purchase consideration and the allocation of the total purchase consideration to assets acquired and liabilities assumed is summarized below (in thousands):
|
Fair value of common stock
|
$
|
11,200
|
|
|
Fair value of contingent consideration
|
11,382
|
|
|
|
Fair value attributed to pre-acquisition stock options exchanged
|
2,142
|
|
|
|
Total purchase consideration, including contingent consideration
|
24,724
|
|
|
|
Other assets, including cash acquired of $0.6 million
|
1,521
|
|
|
|
Intangible assets
|
12,193
|
|
|
|
Goodwill
|
11,778
|
|
|
|
Other liabilities
|
(768
|
)
|
|
|
Net assets acquired
|
$
|
24,724
|
|
The following table summarizes the components of the acquired intangible assets and estimated useful lives (in thousands, except for estimated useful life):
|
Estimated Useful Life
|
||||
|
Technology
|
$
|
9,310
|
|
5.0 years
|
|
Customer relationships
|
2,880
|
|
2.5 years
|
|
|
Trademarks
|
3
|
|
0.5 years
|
|
|
Total intangible assets acquired
|
$
|
12,193
|
|
|
|
|
||||
Goodwill is primarily attributable to expected synergies from assembled workforce, an increase in development capabilities, increased offerings to customers, and enhanced opportunities for growth and innovation. Goodwill generated in the iSocket acquisition is not deductible for tax purposes.
The Company recognized approximately
$0.4 million
of acquisition related costs during the year ended
December 31, 2014
, that are recorded within general and administrative expenses in the Company’s consolidated statements of operations. The operations of iSocket were fully integrated into the operations of the Company upon acquisition. The results of operations of iSocket were insignificant to the Company’s consolidated statements of operations from the acquisition date of
November 17, 2014
through the period ended
December 31, 2014
.
As part of the acquisition, the Company recorded deferred tax assets of
$6.4 million
, primarily related to net operating loss carry forwards, which were offset by deferred tax liabilities of
$4.8 million
, related to acquired intangible assets, and a valuation allowance of
$1.6 million
. See Note 13 for additional information related to net operating loss carryforwards associated with this acquisition.
Shiny Inc.
On
October 20, 2014
, the Company completed the acquisition of all the issued and outstanding shares of Shiny Inc., or Shiny, a Toronto, Canada based technology company focused on providing an end-to-end automated direct advertising platform for digital buyers of all sizes. Shiny also offered an open application programming interface to support real-time buying of guaranteed advertising as well as a self-serve automated guaranteed platform for digital buyers and sellers.
The purchase consideration of Shiny was paid in cash by the Company at the acquisition date;
$0.7 million
of which was held in escrow subject to the continued employment of certain employees post-acquisition. The
$0.7 million
has been excluded from the purchase consideration; rather, the Company will record it as compensation expense post acquisition.
98
The Company’s allocation of the total purchase considerations is summarized below (in thousands):
|
Cash purchase consideration (excluding $0.7 million tied to continued employment)
|
$
|
4,651
|
|
|
Other assets, including cash acquired of $0.1 million
|
737
|
|
|
|
Intangible assets
|
2,300
|
|
|
|
Goodwill
|
3,021
|
|
|
|
Other liabilities
|
(1,407
|
)
|
|
|
Net assets acquired
|
$
|
4,651
|
|
The following table summarizes the components of the acquired intangible assets and estimated useful lives (in thousands, except for estimated useful life):
|
Estimated Useful Life
|
||||
|
Technology
|
$
|
1,360
|
|
3.0 years
|
|
Customer relationships
|
450
|
|
2.5 years
|
|
|
Non-compete agreements
|
490
|
|
3.0 years
|
|
|
Total intangible assets acquired
|
$
|
2,300
|
|
|
|
|
||||
Goodwill is primarily attributable to expected synergies from assembled workforce, an increase in development capabilities, increased offerings to customers, and enhanced opportunities for growth and innovation. A portion,
$0.2 million
, of the goodwill generated in the Shiny acquisition is not tax deductible while the remaining
$2.8 million
is deductible.
Unaudited Pro Forma Information - 2014 Acquisitions
The following table provides unaudited pro forma information for the years ended
December 31, 2014
and
2013
, as if iSocket and Shiny had been acquired as of January 1, 2013. The unaudited pro forma results reflect certain adjustments such as the fair values of the assets acquired and liabilities assumed and additional depreciation and amortization resulting from the fair value adjustments. The unaudited pro forma results do not include any anticipated synergies or other effects of the integration of iSocket or Shiny or recognition relating to the contingent consideration accretion or compensation expense related to the earn-out. Accordingly, such unaudited pro forma amounts are not necessarily indicative of the results that actually would have occurred had the acquisition been completed on the dates indicated, nor is it indicative of the future operating results of the combined company.
|
Year Ended
December 31, 2014
|
Year Ended
December 31, 2013
|
|||||||
|
(in thousands)
|
||||||||
|
Pro forma revenues
|
$
|
125,834
|
|
$
|
84,249
|
|
||
|
Pro forma net loss
|
$
|
(27,659
|
)
|
$
|
(23,419
|
)
|
||
2012 Acquisition
MobSmith, Inc.
On
May 22, 2012
, the Company completed the acquisition of all the issued and outstanding shares of MobSmith, Inc., or MobSmith, a San Francisco, California based technology company focused on ad-delivery to mobile devices. MobSmith provided a mobile platform for sellers to directly sell their mobile web and in-app advertising inventory on leading mobile devices. Purchase consideration for the acquisition was approximately
$1.8 million
in cash and
244,738
shares of the Company’s Class A common stock, with a fair value of approximately
$1.2 million
, valued on the acquisition date. The fair value of the Class A common stock was determined by the board of directors based on a valuation of common stock using the market comparable approach. The market comparable approach estimates value based on multiples of metrics of comparable public companies in a similar line of business. Goodwill is attributable to expected synergies of combining MobSmith’s mobile solution with the platform providing buyers and sellers access to a single platform solution and marketplace for buying and selling of both display and mobile advertising inventory, and the acquired workforce.
99
The Company’s allocation of the total purchase considerations is summarized below (in thousands):
|
Cash paid
|
$
|
1,750
|
|
|
Common shares
|
1,237
|
|
|
|
Total purchase consideration
|
$
|
2,987
|
|
|
Other assets, including cash acquired of $9
|
$
|
52
|
|
|
Intangible assets
|
1,550
|
|
|
|
Goodwill
|
1,391
|
|
|
|
Other liabilities
|
(6
|
)
|
|
|
Net assets acquired
|
$
|
2,987
|
|
The acquired intangible assets consisted of developed technology with a fair value of
$0.8 million
, non-compete agreements with a fair value of
$0.6 million
, customer relationships with a fair value of
$0.1 million
, and a trademark with a fair value of
$10,000
. The developed technology, non-compete agreements, customer relationships, and trademark are being amortized over a weighted-average useful life of
2.5 years
.
The Company recognized approximately
$0.1 million
of acquisition related costs during the year ended
December 31, 2012
, that are reflected within general and administrative expenses in the Company’s consolidated statements of operations.
In addition, upon acquisition, the Company issued
135,000
restricted shares of Class A common stock, with a fair value of approximately
$0.6 million
and agreed to pay
$0.8 million
in cash upon the one year anniversary of the acquisition, subject to the continued employment of certain employees of MobSmith with the Company. The restricted shares and cash payout were recognized as a post-acquisition compensation expense over the one year period. At
December 31, 2012
, the
135,000
shares remained restricted and
$0.3 million
of the cash compensation was unearned. In May 2013, upon the one-year anniversary of the acquisition, the share restrictions were satisfied and the cash was paid.
The operations of MobSmith were fully integrated into the operations of the Company upon acquisition. The results of operations of MobSmith were insignificant to the Company’s consolidated statements of operations from the acquisition date of
May 22, 2012
through the period ended
December 31, 2012
.
Unaudited Pro Forma Information - 2012 Acquisition
The following table provides unaudited pro forma information for the year ended
December 31, 2012
, as if MobSmith had been acquired as of January 1, 2011. The unaudited pro forma results reflect certain adjustments such as the fair values of the assets acquired and liabilities assumed and additional depreciation and amortization resulting from the fair value adjustments. The unaudited pro forma results do not include any anticipated synergies or other effects of the integration of MobSmith or recognition of compensation expense relating to the earn-out. Accordingly, such unaudited pro forma amounts are not necessarily indicative of the results that actually would have occurred had the acquisition been completed on the dates indicated, nor is it indicative of the future operating results of the combined company.
|
Year Ended
December 31, 2012 |
|||
|
(in thousands)
|
|||
|
Pro forma revenues
|
$
|
57,165
|
|
|
Pro forma net loss
|
$
|
(2,919
|
)
|
Details of the Company’s goodwill were as follows:
|
Year Ended
|
|||||||||||
|
December 31, 2014
|
December 31, 2013
|
December 31, 2012
|
|||||||||
|
(in thousands)
|
|||||||||||
|
Beginning balance
|
$
|
1,491
|
|
$
|
1,491
|
|
$
|
100
|
|
||
|
Additions from the acquisition of iSocket
|
11,778
|
|
—
|
|
—
|
|
|||||
|
Additions from the acquisition of Shiny
|
3,021
|
|
—
|
|
—
|
|
|||||
|
Additions from the acquisition of MobSmith
|
—
|
|
—
|
|
1,391
|
|
|||||
|
Ending balance
|
$
|
16,290
|
|
$
|
1,491
|
|
$
|
1,491
|
|
||
Details of the Company’s intangible assets were as follows:
100
|
December 31, 2014
|
December 31, 2013
|
|||||||
|
(in thousands)
|
||||||||
|
Amortizable intangible assets:
|
||||||||
|
Developed technology
|
$
|
13,176
|
|
$
|
2,560
|
|
||
|
Non-compete agreements
|
490
|
|
610
|
|
||||
|
Customer relationships and other intangible assets
|
3,333
|
|
130
|
|
||||
|
16,999
|
|
3,300
|
|
|||||
|
Accumulated amortization—developed technology
|
(2,704
|
)
|
(2,177
|
)
|
||||
|
Accumulated amortization—non-compete agreements
|
(32
|
)
|
(483
|
)
|
||||
|
Accumulated amortization—customer relationships and other intangible assets
|
(173
|
)
|
(130
|
)
|
||||
|
Total accumulated amortization—intangible assets
|
(2,909
|
)
|
(2,790
|
)
|
||||
|
Total identifiable intangible assets, net
|
$
|
14,090
|
|
$
|
510
|
|
||
Amortization expense of intangible assets for the years ended
December 31, 2014
,
2013
, and
2012
, were
$0.9 million
,
$0.9 million
, and
$1.0 million
, respectively.
As of
December 31, 2014
, the estimated remaining amortization expense associated with the Company’s intangible assets for each of the next five fiscal years was as follows:
|
Fiscal Year
|
Amount
|
||
|
(in thousands)
|
|||
|
2015
|
$
|
3,925
|
|
|
2016
|
3,811
|
|
|
|
2017
|
2,852
|
|
|
|
2018
|
1,862
|
|
|
|
2019
|
1,640
|
|
|
|
Total
|
$
|
14,090
|
|
No
impairment of goodwill or intangible assets was identified for the years ended
December 31, 2014
,
2013
, and
2012
.
Observable inputs are based on market data obtained from independent sources. As of
December 31, 2013
, the Company had two outstanding warrants to purchase shares of the Company's preferred stock; one for
845,867
shares of convertible preferred stock and the other for
25,174
shares of convertible stock. At
December 31, 2013
, the Company’s warrants to purchase preferred stock were measured using unobservable inputs that required a high level of judgment to determine fair value, and thus were classified as Level 3 inputs. The Company's warrants to purchase preferred stock were measured through the closing of the IPO on April 7, 2014 using the closing price of the Company
’
s stock due to the proximity of their conversion to common stock. See Note 11 regarding the exercise of a preferred stock warrant and the conversion of each outstanding share of preferred stock into one half of a share of common stock in connection with the Company's IPO.
The table below sets forth a summary of financial instruments that are measured at fair value on a recurring basis at
December 31, 2014
:
|
December 31, 2014
|
Fair Value Measurements at Reporting Date Using
|
||||||||||||||
|
Quoted Prices in
Active Markets for Identical Assets (Level 1) |
Significant Other
Observable Inputs (Level 2) |
Significant
Unobservable Inputs (Level 3) |
|||||||||||||
|
(in thousands)
|
|||||||||||||||
|
Cash equivalents
|
$
|
55,963
|
|
$
|
55,963
|
|
$
|
—
|
|
$
|
—
|
|
|||
|
Contingent consideration liability
|
$
|
11,448
|
|
$
|
—
|
|
$
|
—
|
|
$
|
11,448
|
|
|||
101
At
December 31, 2014
, cash equivalents of
$56.0 million
consisted of money market funds with original maturities of three months or less.
The Company classifies the contingent consideration liability in connection with the acquisition of iSocket, Inc. within Level 3 as factors used to develop the estimated fair value are unobservable inputs that are not supported by market activity. The Company estimates the fair value of the contingent consideration liability by discounting the present value of probability-weighted future payout related to the contingent earn-out criteria using an estimate of the Company's incremental borrowing rate. At the acquisition date and at
December 31, 2014
, the Company considered it highly likely that the earn-out criteria would be met. For the period from acquisition of iSocket to December 31, 2014, the Company recognized
$0.1 million
in the fair value of the contingent consideration liability relating to the change in the Company’s consolidated statements of operations.
The table below sets forth a summary of financial instruments that are measured at fair value on a recurring basis at
December 31, 2013
:
|
December 31, 2013
|
Fair Value Measurements at Reporting Date Using
|
||||||||||||||
|
Quoted Prices in
Active Markets for Identical Assets (Level 1) |
Significant Other
Observable Inputs (Level 2) |
Significant
Unobservable Inputs (Level 3) |
|||||||||||||
|
(in thousands)
|
|||||||||||||||
|
Convertible preferred stock warrant liability
|
$
|
5,451
|
|
$
|
—
|
|
$
|
—
|
|
$
|
5,451
|
|
|||
The Company’s preferred stock warrants are recorded at fair value and were determined to be Level 3 fair value items. The changes in the fair value of preferred stock warrants are summarized below:
|
|
Year Ended
|
|||||||||||
|
December 31, 2014
|
December 31, 2013
|
December 31, 2012
|
||||||||||
|
(in thousands)
|
||||||||||||
|
Beginning balance
|
$
|
5,451
|
|
$
|
1,330
|
|
$
|
815
|
|
|||
|
Change in value of preferred stock warrants recorded in other expense, net
|
732
|
|
4,121
|
|
515
|
|
||||||
|
Net exercise of preferred stock warrant and conversion of preferred stock warrant to common stock warrant
|
(6,183
|
)
|
—
|
|
—
|
|
||||||
|
Ending balance
|
$
|
—
|
|
$
|
5,451
|
|
$
|
1,330
|
|
|||
The Company determined the fair value of the convertible preferred stock warrants utilizing the Black-Scholes model with the following weighted-average assumptions:
|
Series B December 31,
2013 |
Series B December 31,
2012 |
Series C
December 31, 2013 |
Series C
December 31, 2012 |
|||||||||||||
|
Risk-free interest rate
|
0.18
|
%
|
0.97
|
%
|
0.13
|
%
|
0.16
|
%
|
||||||||
|
Expected term (in years)
|
0.69
|
|
6.17
|
|
0.50
|
|
1.00
|
|
||||||||
|
Estimated dividend yield
|
2.00
|
%
|
8.00
|
%
|
2.00
|
%
|
4.80
|
%
|
||||||||
|
Weighted-average estimated volatility
|
64
|
%
|
60
|
%
|
63
|
%
|
46
|
%
|
||||||||
|
Fair value (in thousands)
|
$
|
173
|
|
$
|
34
|
|
$
|
5,278
|
|
$
|
1,296
|
|
||||
102
In connection with the Company’s IPO in April 2014, the outstanding warrant for
845,867
shares of the Company’s convertible preferred stock was net exercised, resulting in the issuance of
286,055
shares of common stock based on the IPO price of
$15.00
per share and taking into account the 1-for-2 reverse stock split. In connection with the IPO, the remaining warrant for
25,174
shares of convertible preferred stock was automatically converted into a warrant exercisable for
12,587
shares of common stock. Following the closing of the Company’s IPO on April 7, 2014, the Company was no longer required to re-measure the converted common stock warrants to fair value and record any changes in the fair value of these liabilities in the Company's statement of operations. During the
year ended
December 31, 2014
and
2013
, the Company recognized expense of
$0.7 million
and
$4.1 million
, respectively, from the re-measurement of the warrants to fair value. The warrant exercisable for
12,587
shares of common stock was net exercised in June 2014.
For the years ended
December 31, 2014
,
2013
, and
2012
,
no
impairments were recorded on those assets required to be measured at fair value on a non-recurring basis.
Accounts payable and accrued expenses included the following:
|
|
December 31, 2014
|
|
December 31, 2013
|
||||
|
|
(in thousands)
|
||||||
|
Accounts payable—seller
|
$
|
138,366
|
|
|
$
|
111,078
|
|
|
Accounts payable—trade
|
5,350
|
|
|
4,136
|
|
||
|
Accrued employee-related payables
|
7,305
|
|
|
4,984
|
|
||
|
|
$
|
151,021
|
|
|
$
|
120,198
|
|
At
December 31, 2014
and 2013, accounts payable—seller are recorded net of
$0.7 million
and
$0.9 million
, respectively, due from sellers for services provided by the Company to sellers, where the Company has the right of offset.
103
Debt and capital lease arrangements consisted of the following:
|
December 31, 2014
|
December 31, 2013
|
||||||
|
(in thousands)
|
|||||||
|
Secured debt:
|
|||||||
|
Line of credit
|
$
|
—
|
|
$
|
3,788
|
|
|
|
Capital lease obligations
|
105
|
|
393
|
|
|||
|
$
|
105
|
|
$
|
4,181
|
|
||
The Company has a loan and security agreement with Silicon Valley Bank, or the Loan Agreement, that provides a senior secured revolving credit facility up to
$40.0 million
with a maturity date of September 27, 2018. An unused revolver fee in the amount of
0.15%
per annum of the average unused portion of the revolver line will be charged and be payable monthly in arrears. Amounts outstanding under the amended credit facility bear interest, at a rate per annum equal to LIBOR plus
2.0%
if the Company maintains a net cash balance exceeding
$1
. At the option of the bank, advances may bear interest at a rate of prime plus
0%
if the Company maintains a net cash balance exceeding
$1
or
1.50%
if the Company does not maintain a net cash balance of
$1
.
The Loan Agreement is collateralized by security interests in substantially all of the Company’s assets. The Loan Agreement restricts the Company’s ability to pay dividends, sell assets, make changes to the nature of the business, engage in mergers or acquisition, incur, assume or permit to exist, additional indebtedness and guarantees, create or permit to exist, liens, pay dividends, make distributions or redeem or repurchase capital stock, or make other investments, engage in transactions with affiliates, and make payments in respect to subordinated debt, and enter into certain transactions without the consent of the financial institution. The Company is required to maintain a lockbox arrangement where customer payments received in the lockbox will reduce the amounts outstanding on the credit facility only if the Company does not maintain a net cash balance of
$1
or in the event of a default, as defined in the arrangement.
The Loan Agreement requires the Company to comply with financial covenants including minimum levels of adjusted tangible net worth and a fixed charge coverage ratio, as well as certain affirmative covenants. In the event the amount available to be drawn is less than
20%
of the maximum line amount of the credit facility, or in the event that a default exists, the Company is required to satisfy a minimum fixed charge coverage ratio of no less than
1.10
to 1.00 calculated on a
twelve
month trailing basis as of the last day of each month on a consolidated basis. The Company does not currently satisfy this minimum fixed charge coverage ratio test defined as a ratio of Adjusted EBITDA to the sum of interest accrual and principal payments required to be paid during the relevant measurement period. However, the Company is not currently required to satisfy this test as it meets the specified excess availability threshold. The Company was in compliance with the covenants as of
December 31, 2014
and
2013
.
The Loan Agreement includes customary events of defaults, including a change of control default and an event of default in the event a material adverse change occurs. In case of such an event of default, Silicon Valley Bank would be entitled to, among other things, accelerate payment of amounts due under the credit facility and exercise all rights of a secured creditor.
On April 14, 2014, the Company repaid all of the outstanding debt under the line of credit with Silicon Valley Bank in the amount of
$3.8 million
. At
December 31, 2014
,
$40.0 million
was available for borrowing under the credit facility and had
no
amounts were outstanding under this loan.
At
December 31, 2013
, the authorized capital stock of the Company consisted of
73,380,126
shares of common stock, of which
32,500,000
shares were designated Class A common stock and
4,190,063
shares were designated Class B common stock, and
29,691,524
shares of preferred stock. On
March 14, 2014
the authorized capital stock of the Company was increased to
80,608,856
shares of common stock. In connection with the IPO, the outstanding shares of Class A common stock and Class B common stock were converted into shares of a single class of common stock on a one-for-one basis. Class A common stock and Class B common stock are collectively referred to herein as common stock.
Initial Public Offering
On
April 7, 2014
, the Company closed its IPO whereby
6,432,445
shares of common stock were issued and sold by the Company (including
1,015,649
shares sold pursuant to the underwriters
’
exercise of their over-allotment option), and
1,354,199
shares of common stock were sold by selling stockholders at an IPO price of
$15.00
per share. The Company received proceeds from the offering of approximately
$86.2 million
after deducting underwriting discounts and commissions and offering expenses. The Company did not receive any proceeds from the sales of shares by the selling stockholders.
In connection with the Company
’
s IPO: (i) all shares of the Company’s outstanding convertible Series A, B, C and D preferred stock automatically converted into an aggregate of
14,410,238
shares of Class A common stock on a one for one-half basis; (ii) each outstanding share of Class B common stock automatically converted into one share of Class A common stock; (iii) all shares of Class A common stock (including all shares of Class A common stock issued upon conversion of convertible preferred stock and Class B common stock) converted into a single class of common stock; (iv) a warrant for
845,867
shares of convertible preferred stock was net exercised, resulting in the issuance of
286,055
shares of common stock based on the IPO price of
$15.00
per share and taking into account the 1-for-2 reverse stock split; (v) a warrant exercisable for
25,174
shares of convertible preferred stock automatically converted into a warrant exercisable for
12,587
shares of common stock; and (vi) the Company
’
s certificate of incorporation was amended in various respects, including to provide for authorized capital stock of
500,000,000
shares of common stock and
10,000,000
shares of preferred stock. The terms of the preferred stock have not been set. The board of directors is authorized to establish, from time to time, the number of shares to be included in each series of preferred stock, and to fix the designation, powers, privileges, preferences, and relative participating, optional or other rights, if any, of the shares of each series of preferred stock, and any of its qualifications, limitations or restrictions.
In addition, upon completion of the IPO, costs associated with the IPO of
$3.5 million
were reclassified from other assets, non-current to additional paid-in capital.
Convertible Preferred Stock
At December 31, 2013, the Company’s outstanding convertible preferred stock consisted of the following:
104
|
December 31, 2013
|
||||||||||||||
|
Shares
Authorized
|
Shares
Outstanding
|
Carrying
Values
|
Liquidation
Preference
|
|||||||||||
|
(Dollars in thousands)
|
||||||||||||||
|
Series A
|
6,154,000
|
|
6,154,000
|
|
$
|
4,000
|
|
$
|
6,118
|
|
||||
|
Series B
|
13,588,160
|
|
13,562,986
|
|
21,087
|
|
30,754
|
|
||||||
|
Series C
|
4,765,173
|
|
3,919,306
|
|
9,484
|
|
12,779
|
|
||||||
|
Series D
|
5,184,191
|
|
5,184,189
|
|
18,000
|
|
23,121
|
|
||||||
|
Total
|
29,691,524
|
|
28,820,481
|
|
$
|
52,571
|
|
$
|
72,772
|
|
||||
Prior to the conversion of the preferred stock into common stock in April 2014, the rights and preferences of the convertible preferred stock were as follows:
Voting Rights
: On any matters presented to the Company’s stockholders for their action or consideration, each holder of convertible preferred stock was entitled to one vote for each share of Class A common stock into which such holder’s shares of convertible preferred stock were then convertible. Except as provided by law or the Certificate of Incorporation, the holders of the convertible preferred stock and Class A common stock vote together as a single class.
Dividends:
The holders of the convertible preferred stock were entitled, when, as, and if declared by the board of directors, and prior and in preference to common stock, to cumulative dividends at the following per annum rates (pro-rated for partial years elapsed):
$0.052
per share for Series A,
$0.1244480
per share for Series B,
$0.1941832
per share for Series C, and
$0.2844824
per share for Series D. Cumulative preferred stock dividends at December 31, 2013 were
$19.7 million
. Unless declared, dividends were not payable except in the event of a liquidation, dissolution or winding up of the Company. No dividends had been declared or paid to date.
Liquidation:
In the event of any voluntary or involuntary liquidation, dissolution or winding-up of the Company or a sale of the Company, the holders of the convertible preferred stock were entitled to receive out of the assets available for distribution to the Company’s stockholders, on a pari passu basis prior to distribution of any assets of the Company to the holders of common stock, an amount equal to the greater of (a) the original issuance price plus accrued but unpaid dividends, or (b) such amount as would have been payable had the convertible preferred stock converted into common stock immediately prior to the liquidation, dissolution or winding up. If amounts available to be distributed were insufficient to pay the liquidation preferences of the preferred stock in full, then the entire assets and funds of the Company legally available for distribution would be distributed to the holders of convertible preferred stock ratably in proportion to the preferential amount each holder would have otherwise been entitled to receive. After payment of the liquidation preferences to the convertible preferred stock, all remaining assets were to be distributed to the common stock.
The liquidation preference provisions of the convertible preferred stock were considered contingent redemption provisions because there were certain elements that were not solely within the control of the Company, such as a change in control of the Company. Accordingly, the Company presented the convertible preferred stock within the mezzanine portion of the accompanying consolidated balance sheets.
Conversion:
Each outstanding share of convertible preferred stock was convertible, at the holder’s option, into shares of Class A common stock at a conversion rate determined by dividing the original issue price for such share by the then Conversion Price for such share. The original issue price and conversion price of the each series of preferred stock were as follows:
|
Original Issue
Price per share
|
Conversion Price
per share
|
|||||||
|
Series A
|
$
|
0.65
|
|
$
|
1.30
|
|
||
|
Series B
|
$
|
1.55556
|
|
$
|
3.11112
|
|
||
|
Series C
|
$
|
2.42729
|
|
$
|
4.85458
|
|
||
|
Series D
|
$
|
3.55603
|
|
$
|
7.11206
|
|
||
The conversion price was subject to adjustment in the event of certain anti-dilutive issuances of shares of common stock. The conversion price per share in the table above reflects the adjustment for the 1-for-2 reverse stock split of the Company’s common stock effected on March 18, 2014.
105
Each share of convertible preferred stock would automatically convert into shares of common stock at its then effective conversion rate immediately upon the earlier of (i) the closing of a firm commitment underwritten initial public offering pursuant to an effective registration statement under the Securities Act of 1933, as amended, with proceeds to the Company of not less than
$20 million
(net of underwriting discounts and commissions) based on a pre-offering enterprise value of at least
$250 million
, (ii) or upon the consent of the holders on the date specified by a vote of at least
75%
of all then-outstanding shares of convertible preferred stock voting together as a single class on an as-converted to Class A common stock basis, provided that the Series C preferred stock shall not be converted as a result of such a vote without the consent of the holders of a majority of the shares of Series C preferred stock then outstanding, and the Series D preferred stock shall not be converted as a result of such a vote without the consent of the holders of a majority of the shares of Series D preferred stock then outstanding.
Redemption:
The convertible preferred stock was not redeemable at the option of the holder.
Convertible Preferred Stock Warrants
On March 1, 2009, the Company issued a fully vested, non-forfeitable warrant to purchase
25,174
shares of the Company’s Series B preferred stock at an exercise price of
$1.55556
per share. The warrant was issued to the Company’s bank, Silicon Valley Bank, in connection with securing an equipment term loan. The warrant was fully vested upon issuance and expires on March 1, 2019. The holder of the warrant has the right to include shares issued upon exercise of the warrant in certain registered offerings by the Company of its common stock. The fair value of the warrants at issuance was recorded as a deferred financing cost and was amortized over the term of the loan. In connection with the Company's IPO, this warrant was automatically converted into a warrant exercisable for
12,587
shares of common stock, and was net exercised in June 2014.
On January 12, 2010, the Company issued a warrant to an investment bank to purchase
845,867
shares of the Company’s Series C preferred stock at an exercise price of
$2.42729
per share. The warrant was issued for banking and financial advisory services provided to the Company. The warrant was fully vested upon issuance and expired on the earliest of January 12, 2015, a firm commitment underwritten initial public offering if the lead underwriter requests termination, or, under certain circumstances, a liquidation, dissolution, winding up or change in control as defined in the Certificate of Incorporation. The holder of the warrant had the right to exercise the warrant for cash or on a net issuance basis. In December 2013, the lead underwriter of the Company's initial public offering requested the termination of the warrant in connection with the offering, and in March 2014, the warrant holder agreed to net exercise the warrant upon the consummation of the offering. In April 2014, the warrant was net exercised, resulting in the issuance of
286,055
shares of common stock based on the IPO price of
$15.00
per share and taking into account the 1-for-2 reverse stock split.
Common Shares Reserved For Issuance
The Company is required to reserve and keep available out of its authorized but unissued shares of common stock such number of shares sufficient to effect the contingent consideration and the conversion of all shares granted and available for grant under the Company’s stock award plans. The number of shares of the Company's stock reserved for these purposes at
December 31, 2014
consisted of
15,577,350
shares under the Company's stock award plans and for the contingent consideration up to
$12.0 million
worth of common stock if certain performance milestones are achieved on December 31, 2015. See Note 6. The number of shares to be issued is based on the average closing price of the Company's common stock for the
ten
consecutive trading days ending on (and including) the last trading day of 2015.
106
In connection with its IPO, the Company implemented its 2014 Equity Incentive Plan, or the 2014 Plan. The Company assumed the iSocket 2009 Equity Incentive Plan, or the 2009 Plan, in connection with the acquisition. In November 2014, the Company approved the 2014 Inducement Grant Equity Incentive Plan , or the 2014 Inducement Plan. All compensatory equity awards outstanding at
December 31, 2014
were issued pursuant to the Company’s 2014 Equity Incentive Plan, the 2009 Equity Incentive Plan, the 2014 Inducement Grant Equity Incentive Plan, or the 2007 Stock Incentive Plan, or the 2007 Plan and together with the 2014 Plan, the 2009 Plan, and the 2014 Inducement Plan, or the Plans, all of which provide for the grant of non-statutory or incentive stock options, restricted stock, and restricted stock units to the Company’s employees, officers, directors and consultants. The Company’s board of directors administers the Plans. Options outstanding vest at varying rates, but generally over
four years
with
25%
vesting upon completion of one year of service and the remainder vesting monthly thereafter. Restricted stock and restricted stock units vest at varying rates. Options, restricted stock, and restricted stock units granted under the Plans accelerate under certain circumstances on a change in control, as defined. An aggregate of
15,577,350
shares were reserved under the Plans, of which
2,023,690
shares remained available for issuance at
December 31, 2014
. The 2014 Plan has an evergreen provision pursuant to which the share reserve will automatically increase on January 1
st
of each year in an amount equal to five percent (
5%
) of the total number of shares of capital stock outstanding on December 31
st
of the preceding calendar year, although the Company
’
s board of directors may provide for a lesser increase, or no increase, in any year. The 2014 Inducement Plan has a provision pursuant to which the share reserve may be increased at the discretion of the Company's board of directors. No new equity awards will be granted under the 2007 Plan.
Stock Options
A summary of stock option activity for the
year ended
December 31, 2014
is as follows:
|
|
Shares Under Option
|
Weighted- Average Exercise Price
|
Weighted- Average Contractual Life
|
Aggregate Intrinsic Value
|
||||||||
|
|
(in thousands)
|
(in thousands)
|
||||||||||
|
Outstanding at December 31, 2013
|
8,360
|
|
$
|
6.13
|
|
|||||||
|
Granted
|
1,979
|
|
$
|
12.47
|
|
|||||||
|
Exercised
|
(1,433
|
)
|
$
|
3.26
|
|
|||||||
|
Canceled
|
(793
|
)
|
$
|
7.49
|
|
|||||||
|
Outstanding at December 31, 2014
|
8,113
|
|
$
|
8.05
|
|
8.06 years
|
$
|
65,628
|
|
|||
|
Vested and expected to vest December 31, 2014
|
7,339
|
|
$
|
7.96
|
|
8.03 years
|
$
|
60,057
|
|
|||
|
Exercisable at December 31, 2014
|
4,042
|
|
$
|
5.90
|
|
7.42 years
|
$
|
41,397
|
|
|||
The total intrinsic value of options exercised during the years ended
December 31, 2014
,
2013
, and
2012
were
$18.5 million
,
$4.6 million
, and
$0.6 million
, respectively.
At
December 31, 2014
, the Company had unrecognized employee stock-based compensation relating to stock options of approximately
$17.8 million
which is expected to be recognized over a weighted-average period of
2.1 years
.
The weighted average grant date per share fair value of stock options granted for the years ended
December 31, 2014
,
2013
, and
2012
were
$7.41
,
$5.12
, and
$2.58
, respectively.
107
The Company estimates the fair value of stock options that contain service and/or performance conditions using the Black-Scholes option pricing model. The weighted-average input assumptions used by the Company were as follows:
|
Year Ended
|
||||||||
|
December 31, 2014
|
December 31, 2013
|
December 31, 2012
|
||||||
|
Expected term (in years)
|
5.7
|
|
6.0
|
|
5.8
|
|
||
|
Risk-free interest rate
|
1.75
|
%
|
1.28
|
%
|
0.94
|
%
|
||
|
Expected volatility
|
51
|
%
|
58
|
%
|
59
|
%
|
||
|
Dividend yield
|
—
|
%
|
—
|
%
|
—
|
%
|
||
At
December 31, 2014
and
2013
, there were options to purchase
346,986
and
110,024
shares of common stock outstanding, respectively, awarded to non-employees at a weighted-average exercise price of
$4.42
and
$1.86
per share, respectively. These awards generally vest over
4 years
and expire through 2024. The Company recorded stock-based compensation of
$0.8 million
for the
year ended
December 31, 2014
and
$0.1 million
for each of the years ended
December 31, 2013
and
2012
, relating to these awards.
During the years ended
December 31, 2014
,
2013
, and
2012
, the Company modified the terms of existing stock options granted to certain employees and non-employees, to among other things, extend the exercise period and/or accelerate the vesting of options upon termination of employment. In connection with these modifications, the Company recorded stock-based compensation of
$0.2 million
,
$0.6 million
and
$0.1 million
, in the years ended
December 31, 2014
,
2013
, and
2012
, respectively.
Restricted Stock
A summary of restricted stock activity for the
year ended
December 31, 2014
is as follows:
|
Number of Shares
|
||
|
(in thousands)
|
||
|
Nonvested shares of restricted stock outstanding at December 31, 2013
|
—
|
|
|
Granted
|
2,200
|
|
|
Canceled
|
(32
|
)
|
|
Vested
|
(418
|
)
|
|
Nonvested shares of restricted stock outstanding at December 31, 2014
|
1,750
|
|
In
March 2014
, the Company granted to employees, certain executives, and non-employees
2,200,357
shares of restricted stock, which was comprised of
1,287,857
shares of restricted stock that vest over a weighted-average period of
3.3 years
,
632,500
shares of restricted stock granted to certain executives vesting over a weighted-average period of
4.0 years
beginning from the completion of the IPO, and
280,000
shares of restricted stock granted to certain executives that vest based on certain stock price performance metrics, beginning on the completion of the Company
’
s IPO in
April 2014
over an estimated weighted-average period of
1.7 years
.
The grant date fair value per share of the
1,287,857
and
632,500
shares of restricted stock was
$16.22
, which was determined using the Company
’
s stock price on the date of grant.
The grant date fair value per share of the
280,000
shares of restricted stock was
$13.15
, which was estimated using a Monte-Carlo lattice model. The Monte-Carlo lattice model used the following assumptions: expected term ranging from
0.7
to
7.2 years
; volatility ranging from
50%
to
65%
;
no
dividend yield; and risk-free interest rates based on the yields of U.S. Treasury securities with maturities appropriate for the term. The compensation expense will not be reversed if performance metrics are not obtained.
At
December 31, 2014
, the Company had unrecognized employee stock-based compensation relating to restricted stock of approximately
$16.5 million
.
At
December 31, 2014
, there were
50,000
shares of restricted stock outstanding for non-employees. The Company recorded stock-based compensation of
$0.4 million
for the
year ended
December 31, 2014
relating to these awards.
108
Restricted Stock Units
A summary of restricted stock unit activity for the
year ended
December 31, 2014
is as follows:
|
Number of Shares
|
||
|
(in thousands)
|
||
|
Nonvested shares of restricted stock units outstanding at December 31, 2013
|
—
|
|
|
Granted
|
852
|
|
|
Canceled
|
(3
|
)
|
|
Vested
|
(4
|
)
|
|
Nonvested shares of restricted stock units outstanding at December 31, 2014
|
845
|
|
At December 31, 2014, the Company had unrecognized employee stock-based compensation relating to restricted stock units of approximately
$8.3 million
which is expected to be recognized over a weighted-average period of
3.6 years
.
The restricted stock units had a weighted-average grant date value per share of
$13.22
.
Employee Stock Purchase Plan
In November 2013, the Company's board of directors adopted the Company's 2014 Employee Stock Purchase Plan (the "ESPP"). The ESPP is designed to enable eligible employees to periodically purchase shares of the Company's common stock at a discount through payroll deductions of up to
10%
of their eligible compensation, subject to any plan limitations. At the end of each six month offering period, employees are able to purchase shares at
85%
of the lower of the fair market value of the Company's common stock on the first trading day of the offering period or on the last day of the offering period. The first offering period commenced in November 2014 and ends in May 2015.
The Company has reserved
525,000
shares of its common stock for issuance under the ESPP and shares reserved for issuance will increase January 1
st
of each year by the lesser of (i) a number of shares equal to
1%
of the total number of outstanding shares of common stock on December 31
st
immediately prior to the date of increase of (ii) such number of shares as may be determined by the board of directors. The Company estimated the total grant date fair value of the ESPP awards for the first offering period ending in May 2015 of
$0.3 million
, using a Black-Scholes model with the following assumptions: term of
6 months
corresponding with the offering period; volatility of
54%
based on the Company's historical volatility for a six month period;
no
dividend yield; and risk-free interest rate of
0.07%
. Compensation costs are recognized on a straight-line basis over the offering period.
Stock-Based Compensation Expense
Total stock-based compensation expense recorded in the consolidated statements of operations was as follows:
|
Year Ended
|
|||||||||||
|
December 31, 2014
|
December 31, 2013
|
December 31, 2012
|
|||||||||
|
(in thousands)
|
|||||||||||
|
Cost of revenue
|
$
|
166
|
|
$
|
87
|
|
$
|
78
|
|
||
|
Selling and marketing
|
3,217
|
|
1,105
|
|
1,039
|
|
|||||
|
Technology and development
|
2,228
|
|
1,645
|
|
828
|
|
|||||
|
General and administrative
|
18,235
|
|
3,515
|
|
1,099
|
|
|||||
|
Total stock-based compensation
|
$
|
23,846
|
|
$
|
6,352
|
|
$
|
3,044
|
|
||
The following are the domestic and foreign components of the Company’s loss before income taxes for the years ended
December 31, 2014
,
2013
, and
2012
:
109
|
Year Ended
December 31, 2014
|
Year Ended
December 31, 2013
|
Year Ended
December 31, 2012
|
||||||||||
|
(in thousands)
|
||||||||||||
|
Domestic
|
$
|
(19,081
|
)
|
$
|
(9,535
|
)
|
$
|
(2,486
|
)
|
|||
|
International
|
580
|
|
533
|
|
258
|
|
||||||
|
Loss before income taxes
|
$
|
(18,501
|
)
|
$
|
(9,002
|
)
|
$
|
(2,228
|
)
|
|||
The following are the components of the provision for income taxes for the years ended December 31, 2014, 2013 and 2012:
|
Year Ended
December 31, 2014
|
Year Ended
December 31, 2013
|
Year Ended
December 31, 2012
|
||||||||||
|
(in thousands)
|
||||||||||||
|
Current:
|
||||||||||||
|
Federal
|
$
|
—
|
|
$
|
—
|
|
$
|
—
|
|
|||
|
State
|
16
|
|
58
|
|
19
|
|
||||||
|
Foreign
|
308
|
|
189
|
|
135
|
|
||||||
|
Total current provision
|
324
|
|
247
|
|
154
|
|
||||||
|
Deferred:
|
||||||||||||
|
Federal
|
(10
|
)
|
9
|
|
1
|
|
||||||
|
State
|
(1
|
)
|
1
|
|
—
|
|
||||||
|
Foreign
|
(141
|
)
|
(10
|
)
|
(21
|
)
|
||||||
|
Total deferred benefit
|
(152
|
)
|
—
|
|
(20
|
)
|
||||||
|
Total provision for income taxes
|
$
|
172
|
|
$
|
247
|
|
$
|
134
|
|
|||
Set forth below is a reconciliation of the components that caused the Company’s provision for income taxes to differ from amounts computed by applying the U.S. Federal statutory rate of
34%
for the years ended
December 31, 2014
,
2013
, and
2012
:
|
Year Ended December 31, 2014
|
Year Ended December 31, 2013
|
Year Ended December 31, 2012
|
|||||||
|
U.S. federal statutory income tax rate
|
34.0
|
%
|
34.0
|
%
|
34.0
|
%
|
|||
|
State income taxes, net of federal benefit
|
(0.1
|
)%
|
(0.4
|
)%
|
(0.6
|
)%
|
|||
|
Foreign income at other than U.S. rates
|
0.8
|
%
|
—
|
%
|
(1.2
|
)%
|
|||
|
Stock-based compensation expense
|
(4.4
|
)%
|
(10.0
|
)%
|
(29.7
|
)%
|
|||
|
Meals and entertainment
|
(1.7
|
)%
|
(1.3
|
)%
|
(3.4
|
)%
|
|||
|
Acquisition and related items
|
(0.1
|
)%
|
—
|
%
|
(1.0
|
)%
|
|||
|
Non-deductible gifts
|
(0.1
|
)%
|
(0.2
|
)%
|
(2.0
|
)%
|
|||
|
Research and development tax credits
|
4.7
|
%
|
5.6
|
%
|
15.6
|
%
|
|||
|
Other permanent items
|
(1.8
|
)%
|
(0.5
|
)%
|
(0.7
|
)%
|
|||
|
Change in valuation allowance
|
(32.2
|
)%
|
(29.9
|
)%
|
(17.0
|
)%
|
|||
|
Effective income tax rate
|
(0.9
|
)%
|
(2.7
|
)%
|
(6.0
|
)%
|
|||
Set forth below are the tax effects of temporary differences that give rise to a significant portion of the deferred tax assets and deferred tax liabilities as of
December 31, 2014
and
2013
:
110
|
December 31, 2014
|
December 31, 2013
|
|||||||
|
(in thousands)
|
||||||||
|
Deferred Tax Assets:
|
||||||||
|
Accrued liabilities
|
$
|
649
|
|
$
|
577
|
|
||
|
Intangible assets
|
—
|
|
1,416
|
|
||||
|
Stock-based compensation
|
6,401
|
|
1,762
|
|
||||
|
Net operating loss carryovers
|
23,241
|
|
15,018
|
|
||||
|
Research tax credit carryovers
|
4,596
|
|
3,176
|
|
||||
|
Other
|
1,357
|
|
2,760
|
|
||||
|
Total deferred tax assets
|
36,244
|
|
24,709
|
|
||||
|
Less valuation allowance
|
(32,481
|
)
|
(23,963
|
)
|
||||
|
Deferred tax assets, net of valuation allowance
|
3,763
|
|
746
|
|
||||
|
Deferred Tax Liabilities:
|
||||||||
|
Fixed assets
|
(777
|
)
|
(689
|
)
|
||||
|
Intangible assets
|
(3,036
|
)
|
—
|
|
||||
|
Other
|
—
|
|
(11
|
)
|
||||
|
Total deferred tax liabilities
|
(3,813
|
)
|
(700
|
)
|
||||
|
Net deferred tax assets
|
$
|
(50
|
)
|
$
|
46
|
|
||
The change in valuation allowance for the year ended
December 31, 2014
,
2013
, and
2012
was
$8.5 million
,
$1.1 million
and
$1.1 million
, respectively.
At
December 31, 2014
, the Company had U.S. federal net operating loss carryforwards, or NOLs, of approximately
$65.4 million
, which will begin to expire in
2027
. At
December 31, 2014
, the Company had state NOLs of approximately
$61.5 million
, which will begin to expire in
2027
. At
December 31, 2014
, the Company had federal research and development tax credit carryforwards, or credit carryforwards, of approximately
$4.3 million
, which will begin to expire in
2027
. At December 31, 2014, the Company had state research and development tax credits of approximately
$3.4 million
, which carry forward indefinitely. Utilization of certain NOLs and credit carryforwards may be subject to an annual limitation due to ownership change limitations set forth in the Internal Revenue Code of 1986, as amended, or the Code, and comparable state income tax laws. Any future annual limitation may result in the expiration of NOLs and credit carryforwards before utilization. As part of the acquisitions, the Company assumed NOL carry forwards of iSocket of
$14.6 million
. Utilization of these NOLs are subject to annual limitations due to ownership changes set forth in the Code, and comparable state income tax laws, however, such limitations are not expected to impact the Company's ability to utilize these net operating losses.
The Company recognizes excess tax benefits associated with stock-based compensation to stockholders’ deficit only when realized based upon applying a with-and-without approach. At
December 31, 2014
, the Company had approximately
$3.5 million
of unrealized excess tax benefits associated with stock-based compensation.
At December 31, 2014, unremitted earnings of the subsidiaries outside of the United States were approximately
$1.2 million
, on which no U.S. taxes had been paid. The Company’s intention is to indefinitely reinvest these earnings outside the United States. Upon distribution of those earnings in the form of a dividend or otherwise, the Company would be subject to both U.S. income taxes (subject to an adjustment for foreign tax credits) and withholding taxes payable to various foreign countries. The amounts of such tax liabilities that might be payable upon repatriation of foreign earnings, after consideration of corresponding foreign tax credits, are not material.
111
The following table summarizes the activity related to the unrecognized tax benefits (in thousands):
|
Amount
|
||||
|
(in thousands)
|
||||
|
Balance at January 1, 2012
|
$
|
788
|
|
|
|
Increases related to current year tax positions
|
279
|
|
||
|
Balance at December 31, 2012
|
1,067
|
|
||
|
Increases related to current year tax positions
|
408
|
|
||
|
Decreases related to prior year tax positions
|
(21
|
)
|
||
|
Balance as of December 31, 2013
|
1,454
|
|
||
|
Increases related to current year tax positions
|
679
|
|
||
|
Decreases related to prior year tax positions
|
(2
|
)
|
||
|
Balance as of December 31, 2014
|
$
|
2,131
|
|
|
Interest and penalties related to the Company’s unrecognized tax benefits accrued at
December 31, 2014
,
2013
, and
2012
were not material.
Due to the net operating loss carryforwards, the Company’s U.S. federal and state returns are open to examination by the Internal Revenue Service and state jurisdictions for all years since inception. For Australia, Germany, and the United Kingdom, all tax years remain open for examination by the local country tax authorities.
The Company does not expect its uncertain income tax positions to have a material impact on its consolidated financial statements within the next twelve months.
Substantially all of the Company’s revenue is U.S. revenue, determined based on the location of the Company’s legal entity that is a party to the relevant transaction. Revenue originated in foreign countries was not material during the years ended
December 31, 2014
,
2013
, and
2012
.
The Company’s property and equipment, net by geographical region were as follows:
|
December 31, 2014
|
December 31, 2013
|
|||||||
|
(in thousands)
|
||||||||
|
United States
|
$
|
12,680
|
|
$
|
7,388
|
|
||
|
Germany
|
1,449
|
|
—
|
|
||||
|
Netherlands
|
712
|
|
864
|
|
||||
|
Other international
|
355
|
|
460
|
|
||||
|
$
|
15,196
|
|
$
|
8,712
|
|
|||
The Company has a defined contribution savings plan under Section 401(k) of the Code. This plan covers substantially all employees who meet minimum age and service requirements and allows participants to defer a portion of their annual compensation on a pre-tax basis. Company contributions to the plan may be made at the discretion of the board of directors. To date, there have been
no
contributions made to the plan by the Company.
112
Operating Leases
The Company has commitments under non-cancelable operating leases for facilities and certain equipment, and its managed data center facilities. Total rental expenses were
$7.6 million
,
$4.7 million
and
$3.6 million
for the years ended
December 31, 2014
,
2013
, and
2012
, respectively.
As of
December 31, 2014
the Company’s non-cancelable minimum operating lease commitments were as follows:
|
Fiscal Year
|
Amount
|
||
|
(in thousands)
|
|||
|
2015
|
$
|
6,197
|
|
|
2016
|
3,135
|
|
|
|
2017
|
1,847
|
|
|
|
2018
|
1,052
|
|
|
|
2019
|
497
|
|
|
|
Thereafter
|
608
|
|
|
|
Total
|
$
|
13,336
|
|
Guarantees and Indemnification
The Company’s agreements with sellers, buyers, and other third parties typically obligate it to provide indemnity and defense for losses resulting from claims of intellectual property infringement, damages to property or persons, business losses, or other liabilities. Generally these indemnity and defense obligations relate to the Company’s own business operations, obligations, and acts or omissions. However, under some circumstances, the Company agrees to indemnify and defend contract counterparties against losses resulting from their own business operations, obligations, and acts or omissions, or the business operations, obligations, and acts or omissions of third parties. For example, because the Company’s business interposes the Company between buyers and sellers in various ways, buyers often require the Company to indemnify them against acts and omissions of sellers, and sellers often require the Company to indemnify them against acts and omissions of buyers. In addition, the Company’s agreements with sellers, buyers, and other third parties typically include provisions limiting the Company’s liability to the counterparty, and the counterparty’s liability to the Company. These limits sometimes do not apply to certain liabilities, including indemnity obligations. These indemnity and limitation of liability provisions generally survive termination or expiration of the agreements in which they appear. The Company has also entered into indemnification agreements with its directors, executive officers and certain other officers that will require the Company, among other things, to indemnify them against certain liabilities that may arise by reason of their status or service as directors, officers or employees. No demands have been made upon the Company to provide indemnification under such agreements and there are no claims that the Company is aware of that could have a material effect on the Company’s consolidated financial statements.
Litigation
The Company and its subsidiaries may from time to time be parties to legal or regulatory proceedings, lawsuits and other claims incident to their business activities and to the Company
’
s status as a public company. Such matters may include, among other things, assertions of contract breach or intellectual property infringement, claims for indemnity arising in the course of the Company’s business, regulatory investigations or enforcement proceedings, and claims by persons whose employment has been terminated. Such matters are subject to many uncertainties, and outcomes are not predictable with assurance. Consequently, management is unable to ascertain the ultimate aggregate amount of monetary liability, amounts which may be covered by insurance or recoverable from third parties, or the financial impact with respect to such matters as of
December 31, 2014
. However, based on management’s knowledge as of
December 31, 2014
, management believes that the final resolution of these matters, individually and in the aggregate, will not have a material adverse effect upon the Company’s consolidated financial position, results of operations or cash flows.
Employment Contracts
The Company has entered into severance agreements with certain employees and officers, all of whom are employed at-will. The Company may be required to pay severance and accelerate the vesting of certain equity awards in the event of involuntary terminations.
113
Other Contracts
The Company is party to an engagement letter with an investment bank entered into in 2009 and amended in
2012
. Pursuant to the engagement letter, the investment bank provided and may continue to provide strategic and consulting advice to the Company, in exchange for which the Company issued to the investment bank a warrant to purchase
845,867
shares of Series C preferred stock. The warrant was exercised on a net issuance basis for
286,055
shares of the Company’s common stock in connection with the Company’s IPO, after giving effect to the conversion of preferred stock to common stock and the 1-for-2 reverse split of the Company’s common stock effected in connection with the IPO. The engagement letter also provides that, in case of a merger, tender offer, stock purchase, or other transaction resulting in the acquisition of the Company by another entity or the transfer of ownership or control of the Company or substantially all of its assets to another entity (a “Change in Control Transaction”) that is consummated before
December 7, 2016
or pursuant to a definitive agreement entered into before that date, (i) the investment bank will provide investment banking services in connection with a Change in Control Transaction, if requested by the Company, and (ii) the Company will pay to the investment bank a fee equal to
2.5%
of the total consideration paid or payable to the Company or its stockholders in the Change in Control Transaction, whether or not the Company requests such investment banking services. The investment bank was not entitled to participate in and did not receive any fee in connection with the Company's IPO.
For the years ended
December 31, 2014
,
2013
, and
2012
, the Company recognized revenue of approximately
$1.9 million
,
$1.1 million
and
$0.8 million
, respectively, from entities affiliated with a holder of more than
10%
of the Company’s outstanding common stock. At December 31, 2014 and December 31, 2013, accounts payable and accrued expenses included
$3.2 million
and
$2.9 million
, respectively, related to these revenue transactions.
During January 2013, the Company entered into a sublease for its headquarters in Los Angeles, California with an entity affiliated with a holder of more than
10%
of the Company’s outstanding common stock. The sublease term began during June 2013 and terminates in April 2021; however, the Company has the option to terminate the sublease on its third anniversary date if the Company notifies the sublessor
one year
in advance of its intended departure and pays a termination fee of
$1.2 million
. In addition, the early termination fee escalates dollar-per-dollar for any tenant improvement allowance that exceeds
$1.0 million
. The Company expects to utilize its early termination option and has considered the estimated early termination fee in estimating its straight-line rent expense.
On January 1, 2015, shares issuable under the Company’s 2014 Equity Incentive Plan increased by
1,859,636
shares and shares issuable under the Company’s 2014 Employee Stock Purchase Plan increased by
371,927
shares in accordance with the automatic annual increase provisions of such plans.
114
None.
Evaluation of Disclosure Controls and Procedures
Our management, with the participation of our Chief Executive Officer and Chief Financial Officer, evaluated the effectiveness of our disclosure controls and procedures as defined in Rule 13a-15(e) under the Exchange Act. Our disclosure controls and procedures are designed to provide reasonable assurance of achieving their objectives of ensuring that information we are required to disclose in the reports we file or submit under the Exchange Act is accumulated and communicated to our management, including our Chief Executive Officer and Chief Financial Officer, as appropriate to allow timely decisions regarding required disclosures, and is recorded, processed, summarized, and reported, within the time periods specified in the SEC’s rules and forms. There is no assurance that our disclosure controls and procedures will operate effectively under all circumstances. Based upon the evaluation described above, our Chief Executive Officer and Chief Financial Officer concluded that, as of December 31, 2014, our disclosure controls and procedures were effective at the reasonable assurance level.
Remediation of Material Weaknesses
We previously disclosed material weaknesses in our internal control over financial reporting resulting from:
|
•
|
a historical lack of qualified personnel within our accounting function that possessed an appropriate level of expertise to perform certain functions;
|
|
•
|
absence of formalized and documented policies and procedures;
|
|
•
|
absence of appropriate review and oversight responsibilities;
|
|
•
|
lack of an effective and timely financial close process;
|
|
•
|
lack of general information technology controls over financially significant applications, including inadequate segregation of duties; and
|
|
•
|
lack of regular evaluations of the effectiveness of internal control over financial reporting.
|
Management's Remediation
We have implemented controls and processes to remediate the identified material weaknesses including:
|
•
|
a more experienced accounting and finance organization with expertise to perform necessary functions;
|
|
•
|
software systems that manage our revenue and expense processes and that allow us to budget and perform multi-year financial planning and analysis;
|
|
•
|
improved processes and internal control structure, including ongoing senior management review;
|
|
•
|
a corporate governance framework, a new code of business conduct, and formalized accounting policies and procedures;
|
|
•
|
procedures that create an effective and timely close process, including appropriate review procedures, standardized reconciliations, and retaining of control documentation;
|
|
•
|
general information technology controls over financially significant applications, including controls relating to security, change management, data center operations, and segregation of duties; and
|
|
•
|
a framework for regular evaluations of the effectiveness of internal control over financial reporting and commenced testing over these internal controls on a periodic basis.
|
As a result of the remediation activities and controls in place as of
December 31, 2014
described above, we have remediated the previously disclosed material weaknesses. However, completion of remediation does not provide assurance that our remediated controls will continue to operate properly or that our financial statements will be free from error. There may be undetected material weaknesses in our internal control over financial reporting, as a result of which we may not detect financial statement errors on a timely basis. Moreover, in the future we may implement new offerings and engage in business transactions, such as acquisitions, reorganizations or implementation of new information systems, that could require us to develop and implement new controls and could negatively affect our internal control over financial reporting and result in material weaknesses.
115
We continue to develop our internal controls, processes and reporting systems in an effort to maintain the effectiveness of our internal control over financial reporting, and we expect to incur ongoing costs in this effort. However, we may not be successful in developing and maintaining adequate internal controls, which may undermine our ability to provide accurate, timely and reliable reports on our financial and operating results.
Changes in Internal Control over Financial Reporting
There have been no changes in our internal control over financial reporting that occurred during fourth quarter of 2014 that has materially affected, or is reasonably likely to materially affect, our internal control over financial reporting, except as described in
Management's Remediation
above.
Inherent Limitations on Effectiveness of Controls
Management recognizes that a control system, no matter how well conceived and operated, can provide only reasonable, not absolute, assurance that the objectives of the control system are met. Further, the design of a control system must reflect the fact that there are resource constraints, and the benefits of controls must be considered relative to their costs. Because of the inherent limitations in all control systems, no evaluation of controls can provide absolute assurance that all control issues and instances of fraud or error, if any, have been detected. These inherent limitations include the realities that judgments in decision making can be faulty, and that breakdowns can occur because of a simple error or mistake. Additionally, controls can be circumvented by the individual acts of some persons, by collusion of two or more people or by management override of the controls. The design of any system of controls also is based in part upon certain assumptions about the likelihood of future events, and there can be no assurance that any design will succeed in achieving its stated goals under all potential future conditions; over time, controls may become inadequate because of changes in conditions, or the degree of compliance with policies or procedures may deteriorate. Because of the inherent limitations in a cost-effective control system, misstatements due to error or fraud may occur and not be detected.
Management's Assessment Regarding Internal Control Over Financial Reporting
This Annual Report on Form 10-K does not include a report on management's assessment regarding internal control over financial reporting or an attestation report of the Company's independent registered public accounting firm due to a transition period established by the SEC for newly public companies.
Not applicable.
116
The information required by Item 10 will be included under the captions "Directors, Executive Officers and Corporate Governance" and "Section 16(a) Beneficial Ownership Reporting Compliance" in our Proxy Statement for the 2015 Annual Meeting of Stockholders to be filed with the SEC within 120 days of the fiscal year ended December 31, 2014, or the 2015 Proxy Statement, and is incorporated herein by reference.
The information required by Item 11 will be included under the captions "Executive Compensation" and "Director Compensation" in the 2015 Proxy Statement and is incorporated herein by reference.
The information required by Item 12 will be included under the captions "Common Stock Ownership of Certain Beneficial Owners and Management" and "Equity Compensation Plan Information" in the 2015 Proxy Statement and is incorporated herein by reference.
The information required by Item 13 will be included under the captions "Certain Relationships and Related Party Transactions" and "Director Independence" in the 2015 Proxy Statement and is incorporated herein by reference.
The information required by Item 14 will be included under the caption "Independent Registered Public Accounting Firm" in the 2015 Proxy Statement and is incorporated herein by reference.
117
(a) We have filed the following documents as part of this Annual Report on Form 10-K:
1. Consolidated Financial Statements
|
Report of Independent Registered Public Accounting Firm
|
|
|
Consolidated Balance Sheets
|
|
|
Consolidated Statements of Operations
|
|
|
Consolidated Statements of Comprehensive Loss
|
|
|
Consolidated Statements of Convertible Preferred Stock and Common Stockholders' Deficit
|
|
|
Consolidated Statements of Cash Flows
|
|
|
Notes to Consolidated Financial Statements
|
|
2. Financial Statement Schedules
No financial statement schedules are provided because the information called for is not required or is shown in the financial statements of the notes thereto.
3. Exhibits
See the Exhibit index immediately following the signature page of this Annual Report on Form 10-K.
118
SIGNATURES
Pursuant to the requirements of the Securities Exchange Act of 1934, the registrant has duly caused this Annual Report on Form 10-K to be signed on its behalf by the undersigned, thereunto duly authorized.
|
THE RUBICON PROJECT, INC.
(Registrant)
|
|
|
/s/ Todd Tappin |
|
|
Todd Tappin
|
|
|
Chief Operating Officer and Chief Financial Officer
(Principal Financial Officer)
|
|
Date:
March 6, 2015
Pursuant to the requirements of the Securities Exchange Act of 1934, this report has been signed below by the following persons on behalf of the registrant and in the capacities and on the dates indicated:
|
Name
|
Title
|
Date
|
|
/s/ Frank Addante
|
Chief Executive Officer and Director
(Principal Executive Officer)
|
March 6, 2015
|
|
Frank Addante
|
||
|
/s/ Todd Tappin
|
Chief Operating Officer and Chief Financial Officer
(Principal Financial Officer)
|
March 6, 2015
|
|
Todd Tappin
|
||
|
/s/ David Day
|
Chief Accounting Officer
(Principal Accounting Officer)
|
March 6, 2015
|
|
David Day
|
||
|
/s/ Robert J. Frankenberg
|
Director
|
March 6, 2015
|
|
Robert J. Frankenberg
|
||
|
/s/ Sumant Mandal
|
Director
|
March 6, 2015
|
|
Sumant Mandal
|
||
|
Director
|
||
|
Jarl Mohn
|
||
|
/s/ Gregory R. Raifman
|
Director
|
March 6, 2015
|
|
Gregory R. Raifman
|
||
|
/s/ Robert F. Spillane
|
Director
|
March 6, 2015
|
|
Robert F. Spillane
|
||
|
/s/ Lisa L. Troe
|
Director
|
March 6, 2015
|
|
Lisa L. Troe
|
||
EXHIBIT INDEX
|
Number
|
Description
|
|
|
2.1
|
Agreement and Plan of Merger, dated November 13, 2014, by and among the Registrant, Pluto 2014 Acquisition Corp., iSocket, Inc., Shareholder Representative Services LLC, solely in its capacity as the initial Holder Representative thereunder, and certain persons delivering joinder agreements therewith (incorporated by reference to Exhibit 2.1 to the Registrant's Current Report on Form 8-K filed with the Commission on November 17, 2014).
|
|
|
3.1
|
Sixth Amended and Restated Certificate of Incorporation of the Registrant (incorporated by reference to Exhibit 3.1 to the Registrant's Quarterly Report on Form 10-Q filed with the Commission on May 15, 2014).
|
|
|
3.2
|
Amended and Restated Bylaws of the Registrant (incorporated by reference to Exhibit 3.2 to the Registrant's Quarterly Report on Form 10-Q filed with the Commission on May 15, 2014).
|
|
|
10.1+
|
The Rubicon Project, Inc. 2007 Stock Incentive Plan and forms of agreements for employees thereunder (incorporated by reference to Exhibit 10.1 to the Registrant's Registration Statement on Form S-1/A filed with the Commission on March 20, 2014).
|
|
|
10.2(A)+
|
The Rubicon Project, Inc. 2014 Equity Incentive Plan (incorporated by reference to Exhibit 99.1 to the Registrant's Registration Statement on Form S-8 filed with the Commission on May 15, 2014).
|
|
|
10.2(B)*+
|
Form of Stock Option Grant Notice and Award Agreement for Employees under The Rubicon Project, Inc. 2014 Equity Incentive Plan.
|
|
|
10.2(C)*+
|
Form of Restricted Stock Unit Grant Notice and Award Agreement for Employees under The Rubicon Project, Inc. 2014 Equity Incentive Plan.
|
|
|
10.2(D)*+
|
Form of Stock Option Grant Notice and Award Agreement for Non-Employee Directors under The Rubicon Project, Inc. 2014 Equity Incentive Plan.
|
|
|
10.2(E)*+
|
Form of Restricted Stock Unit Grant Notice and Award Agreement for Non-Employee Directors under The Rubicon Project, Inc. 2014 Equity Incentive Plan.
|
|
|
10.3(A)+
|
The Rubicon Project, Inc. 2014 Employee Stock Purchase Plan (incorporated by reference to Exhibit 99.2 to the Registrant's Registration Statement on Form S-8 filed with the Commission on May 15, 2014).
|
|
|
10.3(B)*+
|
Form of Enrollment Agreement under The Rubicon Project, Inc. 2014 Employee Stock Purchase Plan.
|
|
|
10.4(A)+
|
The Rubicon Project, Inc. 2014 Inducement Grant Equity Incentive Plan (incorporated by reference to Exhibit 4.6 to the Registrant's Registration Statement on Form S-8 filed with the Commission on December 19, 2014).
|
|
|
10.4(B)+
|
Form of Restricted Stock Unit Grant Notice under The Rubicon Project, Inc. 2014 Inducement Grant Equity Incentive Plan (incorporated by reference to Exhibit 4.7 to the Registrant’s Registration Statement on Form S-8 filed with the Commission on December 19, 2014).
|
|
|
10.4(C)+
|
Form of Stock Option Grant Notice under The Rubicon Project, Inc. 2014 Inducement Grant Equity Incentive Plan (incorporated by reference to Exhibit 4.8 to the Registrant’s Registration Statement on Form S-8 filed with the Commission on December 19, 2014).
|
|
|
10.4(D)+
|
Form of Restricted Stock Grant Notice under The Rubicon Project, Inc. 2014 Inducement Grant Equity Incentive Plan (incorporated by reference to Exhibit 4.9 to the Registrant’s Registration Statement on Form S-8 filed with the Commission on December 19, 2014).
|
|
|
10.5
|
Amended and Restated Investors' Rights Agreement, dated October 29, 2010, by and among The Rubicon Project, Inc. and certain of its stockholders (incorporated by reference to Exhibit 10.3 to the Registrant’s Registration Statement on Form S-1/A filed with the Commission on March 20, 2014).
|
|
|
10.6+
|
Executive Employment Agreement, dated May 4, 2007, between adMonitor, Inc. and the Registrant's Chief Executive Officer, as amended December 14, 2007 (incorporated by reference to Exhibit 10.4 to the Registrant’s Registration Statement on Form S-1 filed with the Commission on February 4, 2014).
|
|
|
10.7+
|
Offer Letter, dated January 17, 2013, between The Rubicon Project, Inc. and the Registrant's President (incorporated by reference to Exhibit 10.5 to the Registrant’s Registration Statement on Form S-1 filed with the Commission on February 4, 2014).
|
|
|
10.8+
|
Offer Letter, dated January 17, 2013, between The Rubicon Project, Inc. and the Registrant's Chief Operating Officer and Chief Financial Officer (incorporated by reference to Exhibit 10.6 to the Registrant’s Registration Statement on Form S-1 filed with the Commission on February 4, 2014).
|
|
|
10.9*+
|
Performance Restricted Stock Agreement, including Notice of Grant, dated as of October 20, 2014, between the Registrant and the Registrant's Chief Executive Officer.
|
|
|
10.10*+
|
Restricted Stock Agreement (IPO grant), including Notice of Grant, dated as of March 14, 2014, between the Registrant and the Registrant's Chief Executive Officer.
|
|
|
10.11*+
|
Restricted Stock Agreement (CEO catch-up grant), including Notice of Grant, dated as of March 14, 2014, between the Registrant and the Registrant's Chief Executive Officer.
|
|
|
10.12*+
|
Performance Restricted Stock Agreement, including Notice of Grant, dated as of October 20, 2014, between the Registrant and the Registrant's President.
|
|
|
10.13*+
|
Restricted Stock Agreement (IPO grant), including Notice of Grant, dated as of March 14, 2014, between the Registrant and the Registrant's President.
|
|
|
10.14*+
|
Restricted Stock Agreement (2-year vesting), including Notice of Grant, dated as of March 14, 2014, between the Registrant and the Registrant's President.
|
|
|
10.15*+
|
Restricted Stock Agreement (multiple tranches), including Notice of Grant, dated as of March 14, 2014, between the Registrant and the Registrant's President.
|
|
|
10.16*+
|
Performance Restricted Stock Agreement, including Notice of Grant, dated as of October 20, 2014, between the Registrant and the Registrant's Chief Operating Officer and Chief Financial Officer.
|
|
|
10.17*+
|
Restricted Stock Agreement (IPO grant), including Notice of Grant, dated as of March 14, 2014, between the Registrant and the Registrant's Chief Operating Officer and Chief Financial Officer.
|
|
|
10.18*+
|
Restricted Stock Agreement (2-year vesting), including Notice of Grant, dated as of March 14, 2014, between the Registrant and the Registrant's Chief Operating Officer and Chief Financial Officer.
|
|
|
10.19*+
|
Restricted Stock Agreement (multiple tranches), including Notice of Grant, dated as of March 14, 2014, between the Registrant and the Registrant's Chief Operating Officer and Chief Financial Officer.
|
|
|
10.20
|
Loan and Security Agreement, dated September 27, 2011, by and among Silicon Valley Bank, the Registrant, and the other Borrowers thereunder (incorporated by reference to Exhibit 10.7 to the Registrant’s Registration Statement on Form S-1 filed with the Commission on February 4, 2014).
|
|
|
10.21
|
Consent and Amendment to Loan and Security Agreement, dated May 22, 2012, by and among Silicon Valley Bank, the Registrant, and the other Borrowers thereunder (incorporated by reference to Exhibit 10.8 to the Registrant’s Registration Statement on Form S-1 filed with the Commission on February 4, 2014).
|
|
|
10.22
|
First Amendment to Loan and Security Agreement, dated July 24, 2012, by and among Silicon Valley Bank, the Registrant, and the other Borrowers thereunder (incorporated by reference to Exhibit 10.9 to the Registrant’s Registration Statement on Form S-1 filed with the Commission on February 4, 2014).
|
|
|
10.23
|
Assumption and Second Amendment to Loan and Security Agreement, dated September 14, 2012, by and among Silicon Valley Bank, the Registrant, and the other Borrowers thereunder (incorporated by reference to Exhibit 10.10 to the Registrant’s Registration Statement on Form S-1 filed with the Commission on February 4, 2014).
|
|
|
10.24
|
Third Amendment to Loan and Security Agreement, dated September 28, 2012, by and among Silicon Valley Bank, the Registrant, and the other Borrowers thereunder (incorporated by reference to Exhibit 10.11 to the Registrant’s Registration Statement on Form S-1 filed with the Commission on February 4, 2014).
|
|
|
10.25
|
Fourth Amendment to Loan and Security Agreement, dated February 8, 2013, by and among Silicon Valley Bank, the Registrant, and the other Borrowers thereunder (incorporated by reference to Exhibit 10.12 to the Registrant’s Registration Statement on Form S-1 filed with the Commission on February 4, 2014).
|
|
|
10.26
|
Fifth Amendment to Loan and Security Agreement, dated September 30, 2013, by and among Silicon Valley Bank, the Registrant, and the other Borrowers thereunder (incorporated by reference to Exhibit 10.13 to the Registrant’s Registration Statement on Form S-1 filed with the Commission on February 4, 2014).
|
|
|
10.27
|
Sixth Amendment to Loan and Security Agreement, dated December 9, 2013, by and among Silicon Valley Bank, the Registrant, and the other Borrowers thereunder (incorporated by reference to Exhibit 10.14 to the Registrant’s Registration Statement on Form S-1 filed with the Commission on February 4, 2014).
|
|
|
10.28
|
Stock Pledge Agreement, dated October 3, 2013, by and between Silicon Valley Bank and the Registrant (incorporated by reference to Exhibit 10.15 to the Registrant’s Registration Statement on Form S-1 filed with the Commission on February 4, 2014).
|
|
|
10.29
|
Form of Indemnification Agreement entered into between the Registrant and each of its directors and executive officers (incorporated by reference to Exhibit 10.17 to the Registrant’s Registration Statement on Form S-1/A filed with the Commission on March 20, 2014).
|
|
|
10.30+
|
Form of Severance Agreement between the Registrant and certain of its executive officers (incorporated by reference to Exhibit 10.18 to the Registrant’s Registration Statement on Form S-1 filed with the Commission on February 4, 2014).
|
|
|
10.31
|
Sublease, dated January 9, 2013, by and between Fox Interactive Media, Inc. and the Registrant (incorporated by reference to Exhibit 10.19 to the Company’s Registration Statement on Form S-1 filed with the Commission on February 4, 2014).
|
|
|
21.1*
|
List of Subsidiaries of The Rubicon Project, Inc.
|
|
|
23.1*
|
Consent of PricewaterhouseCoopers LLP.
|
|
|
31.1*
|
Certification of Principal Executive Officer Pursuant To Exchange Act Rules 13a-14(a) and 15d-14(a), as adopted pursuant to Section 302 of the Sarbanes-Oxley Act of 2002.
|
|
|
31.2*
|
Certification of Principal Financial Officer Pursuant To Exchange Act Rules 13a-14(a) and 15d-14(a), as adopted pursuant to Section 302 of the Sarbanes-Oxley Act of 2002.
|
|
|
32
(1)
|
Certification of the Principal Executive Officer and Principal Financial Officer Pursuant To 18 U.S.C. Section 1350, as adopted pursuant to Section 906 of the Sarbanes-Oxley Act of 2002.
|
|
|
101.ins
(2)
|
XBRL Instance Document
|
|
|
101.sch
(2)
|
XBRL Taxonomy Schema Linkbase Document
|
|
|
101.cal
(2)
|
XBRL Taxonomy Calculation Linkbase Document
|
|
|
101.def
(2)
|
XBRL Taxonomy Definition Linkbase Document
|
|
|
101.lab
(2)
|
XBRL Taxonomy Label Linkbase Document
|
|
|
101.pre
(2)
|
XBRL Taxonomy Presentation Linkbase Document
|
|
* Filed herewith
+ Indicates a management contract or compensatory plan or arrangement
(1)
The information in this exhibit is furnished and deemed not filed with the Securities and Exchange Commission for purposes of section 18 of the Exchange Act of 1934, as amended (the “Exchange Act”), and is not to be incorporated by reference into any filing of The Rubicon Project, Inc. under the Securities Act of 1933, as amended (the “Securities Act”), or the Exchange Act, whether made before or after the date hereof, regardless of any general incorporation language in such filing.
(2)
In accordance with Rule 406T of Regulation S-T, the information in these exhibits is furnished and deemed not filed or part of a registration statement or prospectus for purposes of sections 11 or 12 of the Securities Act, is deemed not filed for purposes of section 18 of the Exchange Act of 1934, and otherwise is not subject to liability under these sections.
TABLE OF CONTENTS
Part IItem 1. Business OverviewItem 1A. Risk FactorsItem 1B. Unresolved Staff CommentsItem 2. PropertiesItem 3. Legal ProceedingsItem 4. Mine Safety DisclosuresPart IIItem 5. Market For Registrant's Common Equity, Related Stockholder Matters and Issuer Purchases Of Equity SecuritiesItem 6. Selected Financial DataItem 7. Management S Discussion and Analysis Of Financial Condition and Results Of OperationsItem 7A. Quantitative and Qualitative Disclosure About Market RiskItem 8. Financial Statements and Supplementary DataNote 1 Nature Of OperationsNote 2 Basis Of Presentation and Summary Of Significant Accounting PoliciesNote 3 Net Loss Per Share Attributable To Common StockholdersNote 4 Property and EquipmentNote 5 Internal Use Software Development CostsNote 6 Business CombinationsNote 7 Goodwill and Intangible AssetsNote 8 Fair Value MeasurementsNote 9 Accounts Payable and Accrued ExpensesNote 10 Debt and Capital Lease ArrangementsNote 11 CapitalizationNote 12 Stock-based CompensationNote 13 Income TaxesNote 14 Geographic InformationNote 15 401(k) Savings PlanNote 16 Commitments and ContingenciesNote 17 Related Party TransactionsNote 18 Subsequent EventsItem 9. Changes in and Disagreements with Accountants on Accounting and Financial DisclosureItem 9A. Controls and ProceduresItem 9B. Other InformationPart IIIItem 10. Directors, Executive Officers and Corporate GovernanceItem 11. Executive CompensationItem 12. Security Ownership Of Certain Beneficial Owners and Management and Related Stockholder MattersItem 13. Certain Relationships and Related Transactions, and Director IndependenceItem 14. Principal Accounting Fees and ServicesPart IVItem 15. Exhibits and Financial Statement Schedules