MGP INGREDIENTS INC
10-Ks and 10-Qs
|
|
|
|
|
|
|
|
|
|
|
|
|
|
|
|
|
|
|
|
|
|
|
|
|
|
|
|
|
|
|
|
|
|
|
|
|
|
|
|
|
|
|
|
|
|
|
|
|
|
|
|
|
|
|
|
SECURITIES AND EXCHANGE COMMISSION
WASHINGTON, DC 20549
___________________________
FORM 10-K
ANNUAL REPORT
PURSUANT TO SECTION 13 OR 15(D) OF THE
SECURITIES EXCHANGE ACT OF 1934
|
(Mark One)
|
|
|
X
|
ANNUAL REPORT PURSUANT TO SECTION 13 OR 15(d) OF THE SECURITIES EXCHANGE ACT OF 1934
|
For the fiscal year ended
December 31, 2018
OR
|
TRANSITION REPORT PURSUANT TO SECTION 13 OR 15(d) OF THE SECURITIES EXCHANGE ACT OF 1934
|
|
For the transition period from _______ to _______
Commission file number
0-17196

MGP Ingredients, Inc.
(Exact Name of Registrant as Specified in Its Charter)
|
Kansas
|
45-4082531
|
|
(State or Other Jurisdiction
|
(I.R.S. Employer
|
|
of Incorporation or Organization)
|
Identification No.)
|
|
|
|
|
100 Commercial Street, Box 130, Atchison, Kansas
|
66002
|
|
(Address of Principal Executive Offices)
|
(Zip Code)
|
(913) 367-1480
Registrant’s telephone number, including area code
Securities registered pursuant to Section 12(b) of the Act:
|
Title of Each Class
|
Name of Each Exchange on Which Registered
|
|
Common Stock, no par value
|
NASDAQ Global Select Market
|
Securities registered pursuant to Section 12(g) of the Act: None
Indicate by check mark if the registrant is a well-known seasoned issuer, as defined in Rule 405 of the Securities Act. Yes _
X
_ No
__
Indicate by check mark if the registrant is not required to file reports pursuant to Section 13 or Section 15(d) of the Act. Yes __ No
X_
Indicate by check mark whether the registrant: (1) has filed all reports required to be filed by Section 13 or 15(d) of the Securities Exchange Act of 1934 during the preceding 12 months (or for such shorter period that the registrant was required to file such reports), and (2) has been subject to such filing requirements for the past 90 days. Yes
X
No ____
Indicate by check mark whether the registrant has submitted electronically every Interactive Data File required to be submitted pursuant to Rule 405 of Regulation S-T (§232.405 of this chapter) during the preceding 12 months (or for such shorter period that the registrant was required to submit such files). Yes
X
No
Indicate by check mark if disclosure of delinquent filers pursuant to Item 405 of Regulation S-K (§229.405 of this chapter) is not contained herein, and will not be contained, to the best of registrant’s knowledge, in definitive proxy or information statements incorporated by reference in Part III of the Form 10-K or any amendment to the Form 10-K. [ ]
Indicate by check mark whether the registrant is a large accelerated filer, an accelerated filer, a non-accelerated filer, a smaller reporting company, or an emerging growth company. See the definitions of "large accelerated filer," "accelerated filer," "smaller reporting company," and "emerging growth company" in Rule 12b-2 of the Exchange Act. (Check One):
[X] Large accelerated filer [ ] Accelerated filer
[ ] Non-accelerated filer
(Do not check if smaller reporting company
[ ] Smaller Reporting Company
[ ] Emerging growth company
If an emerging growth company, indicate by check mark if the registrant has elected not to use the extended transition period for complying with any new or revised financial accounting standards provided pursuant to Section 13(a) of the Exchange Act. [ ]
Indicate by check mark whether the registrant is a shell company (as defined in Rule 12b-2 of the Exchange Act). Yes ___ No
X_
The aggregate market value of the voting and non-voting common equity held by non-affiliates computed by reference to the price at which the common equity was last sold, as reported by NASDAQ on June 30, 2018, was
$1,162,065,937
.
The number of shares of the registrant’s common stock, no par value ("Common Stock") outstanding as of
February 21, 2019
was
16,957,803
.
DOCUMENTS INCORPORATED BY REFERENCE
The following documents are incorporated herein by reference:
|
(1)
|
Portions of the MGP Ingredients, Inc. Proxy Statement for the Annual Meeting of Stockholders to be held on
May 23, 2019
are incorporated by reference into Part III of this report to the extent set forth herein.
|
CONTENTS PAGE
|
|
|
||
|
|
Business
|
||
|
|
|||
|
|
|||
|
|
|||
|
|
|||
|
|
|||
|
|
|
||
|
|
|||
|
|
|||
|
|
|||
|
|
|||
|
|
|||
|
|
|
||
|
|
|
||
|
|
|
||
|
|
|
||
|
|
|
||
|
|
|
||
|
|
|
||
|
|
|
||
|
|
|||
|
|
|||
|
|
|||
|
|
|
||
|
|
|||
|
|
|||
|
|
|||
|
|
|||
|
|
|||
|
|
|
||
|
|
|||
|
Item 16.
|
Form 10-K Summary
|
||
|
|
|||
The calculation of the aggregate market value of the Common Stock held by non-affiliates is based on the assumption that affiliates include directors and executive officers. Such assumption does not constitute an admission by the Company or any director or executive officer that any director or executive officer is an affiliate of the Company.
i
PART I
ITEM 1. BUSINESS
MGP Ingredients, Inc. was incorporated in 2011 in Kansas, continuing a business originally founded by Cloud L. Cray, Sr. in Atchison, Kansas in 1941. As used herein, the term "MGP," "Company," "we," "our," or "us" refers to MGP Ingredients, Inc. and its subsidiaries unless the context indicates otherwise. In this document, for any references to Note 1 through Note 16 refer to the Notes to Consolidated Financial Statements in Item 8.
AVAILABLE INFORMATION
We make available through our website (www.mgpingredients.com) under "For Investors," free of charge, our annual reports on Form 10-K, quarterly reports on Form 10-Q, current reports on Form 8-K, special reports and other information, and amendments to those reports as soon as reasonably practicable after we electronically file or furnish such material with the Securities and Exchange Commission ("SEC").
The SEC maintains an internet site that contains reports, proxy and information statements, and other information regarding issuers that file electronically with the SEC, including the Company. The address of the SEC site is http://www.sec.gov.
METHOD OF PRESENTATION
All amounts in this report, except for shares, par values, bushels, gallons, pounds, mmbtu, proof gallons, per share, per bushel, per gallon, per proof gallon, and percentage amounts are shown in thousands, unless otherwise noted.
GENERAL INFORMATION
MGP is a leading producer and supplier of premium distilled spirits and specialty wheat protein and starch food ingredients. Distilled spirits include premium bourbon and rye whiskeys and grain neutral spirits ("GNS"), including vodka and gin. MGP is also a top producer of high quality industrial alcohol for use in both food and non-food applications. Our protein and starch food ingredients provide a host of functional, nutritional, and sensory benefits for a wide range of food products to serve the packaged goods industry. Our distillery products are derived from corn and other grains, and our ingredient products are derived from wheat flour. The majority of our distillery and ingredient product sales are made directly, or through distributors, to manufacturers and processors of finished packaged goods or to bakeries.
INFORMATION ABOUT SEGMENTS
As of
December 31, 2018
, we had two reportable segments: distillery products and ingredient solutions.
Distillery Products Segment.
We process corn and other grains (including rye, barley, wheat, barley malt, and milo) into food grade alcohol and distillery co-products, such as distillers feed (commonly called dried distillers grain in the industry), fuel grade alcohol, and corn oil. We also provide warehouse services, including barrel put away, barrel storage, and barrel retrieval services. We have certain contracts with customers to supply distilled products (or "distillate"), as well as certain contracts with customers to provide barreling and warehousing services. Contracts with customers may be monthly, annual, and multi-year with periodic reviews of pricing. Sales of fuel grade alcohol are made on the spot market. Since 2015, our distillery products segment includes production and sales of our own branded alcohol products, including sales under the TILL
®
American Wheat Vodka, George Remus
®
Straight Bourbon Whiskey, Remus Repeal Reserve
®
Straight Bourbon Whiskey, Tanner's Creek
®
Blended Bourbon Whiskey, Rossville Union
®
Master Crafted Straight Rye Whiskey, and Eight & Sand Blended Bourbon Whiskey brands. During
2018
, our five largest distillery products customers, combined, accounted for
22.8 percent
of our consolidated net sales.
Food Grade Alcohol
- The majority of our distillery capacities are dedicated to the production of high quality, high purity food grade alcohol for beverage and industrial applications.
Food grade alcohol sold for beverage applications,
premium beverage alcohol
, consists primarily of premium bourbon and rye whiskeys ("brown goods") and GNS, including vodka and gin ("white goods"). Our premium bourbon is created by distilling grains, primarily corn. Our whiskey is made from fermented grain mash, including rye and corn. Our whiskeys are primarily sold as unaged new distillate, which are then aged by our customers from two to four years and are sold at various proof concentrations. Our GNS is sold in bulk quantities at various proof concentrations. Our gin is created by redistilling GNS together with proprietary formulations of botanicals or botanical oils.
1
Food grade
industrial alcohol
is used as an ingredient in foods (e.g., vinegar and food flavorings), personal care products (e.g., hair sprays and hand sanitizers), cleaning solutions, pharmaceuticals, and a variety of other products. We sell food grade industrial alcohol in tank truck or rail car quantities direct to a number of industrial processors.
Fuel grade alcohol
- Fuel grade alcohol is sold primarily for blending with gasoline to increase the octane and oxygen levels of the gasoline. As an octane enhancer, fuel grade alcohol can serve as a substitute for lead and petroleum-based octane enhancers. As an oxygenate, fuel grade alcohol has been used in gasoline to meet certain environmental regulations and laws relating to air quality by reducing carbon monoxide, hydrocarbon particulates, and other toxic emissions generated from the burning of gasoline. We produce fuel grade alcohol as a co-product of our food grade alcohol business at our Atchison facility.
Distillers Feed and related Co-Products -
The bulk alcohol co-products sales include distillers feed and corn oil. Distillers feed is principally derived from the mash from alcohol processing operations. The mash is dried and sold primarily to processors of animal feeds as a high protein additive. In addition, we produce corn oil as a value added co-product through a corn oil extraction process at our Atchison facility.
Warehouse Services -
Customers who purchase unaged barreled distillate may, and in most cases do, also enter into separate warehouse service agreements with us for the storage of product for aging that include services for barrel put away, barrel storage, and barrel retrieval.
Ingredient Solutions Segment.
Our ingredient solutions segment consists primarily of specialty wheat starches, specialty wheat proteins, commodity wheat starches, and commodity wheat proteins. Contracts with ingredients customers are generally price, volume, and term agreements, which are fixed-term contracts, with very few agreements longer than 12 months in duration. During
2018
, our five largest ingredient solutions customers, combined, accounted for
10.5 percent
of our consolidated net sales.
Specialty Wheat Starches
-
Wheat starch is derived from the carbohydrate-bearing portion of wheat flour. We produce a premium wheat starch powder by extracting the starch from the starch slurry, substantially free of all impurities and fibers, and then dry the starch in spray, flash, or drum dryers.
A substantial portion of our premium wheat starch is altered during processing to produce certain unique specialty wheat starches designed for special applications. We sell our specialty wheat starches on a global basis, primarily to food processors and distributors.
We market our specialty wheat starches under the trademarks Fibersym
®
Resistant Starch series, FiberRite
®
RW Resistant Starch, Pregel
®
Instant Starch series, and Midsol
®
Cook-up Starch series. They are used primarily for food applications as an ingredient in a variety of food products to affect their nutritional profile, appearance, texture, tenderness, taste, palatability, cooking temperature, stability, viscosity, binding, and freeze-thaw characteristics. Important physical properties contributed by wheat starch include whiteness, clean flavor, viscosity, and texture. For example, our starches are used to improve the taste and texture of cream puffs, éclairs, puddings, pie fillings, breading, and batters; to improve the size, symmetry, and taste of angel food cakes; to alter the viscosity of soups, sauces, and gravies; to improve the freeze-thaw stability and shelf life of fruit pies and other frozen foods; to improve moisture retention in microwavable foods; and to add stability and to improve spreadability in frostings, mixes, glazes, and sugar coatings.
Our wheat starches, as a whole, generally compete primarily with corn starch, which dominates the United States starch market. However, the unique characteristics of our specialty wheat starches provide a number of advantages over corn and other starches for certain baking and other end uses.
Specialty Wheat Proteins
- We have developed a number of specialty wheat proteins for food applications. Specialty wheat proteins are derived from vital wheat gluten through a variety of proprietary processes which change its molecular structure. Specialty wheat proteins for food applications include the products Arise
®
and Trutex
®
.
We produce clean label ingredients under our Arise
®
line of wheat protein isolates. Along with Arise
®
8000, this series includes Arise
®
8100 and Arise
®
8200. Each of these ingredients is also Non-GMO ("Non-Genetically Modified Organism") Project Verified. We also offer a Non-GMO Project Verified food ingredients portfolio of TruTex
®
751, TruTex
®
1501, TruTex
®
2240, and TruTex
®
Redishred 65 textured wheat proteins.
2
Our specialty wheat proteins generally compete with other ingredients and modified proteins having similar characteristics, primarily soy proteins and other wheat proteins, with differentiation being based on factors such as functionality, price, and, in the case of food applications, flavor.
Commodity Wheat Starches -
As is the case with value added wheat starches, our commodity wheat starches have both food and non-food applications, but such applications are more limited than those of value added wheat starches and typically sell for a lower price in the marketplace. Commodity wheat starches compete primarily with corn starches, which dominate the marketplace and prices generally track the fluctuations in the corn starch market.
Commodity Wheat Proteins -
Commodity wheat protein, or vital wheat gluten, is a free-flowing light tan powder which contains approximately 70 to 80 percent protein. When we process wheat flour to derive starch, we also derive vital wheat gluten. Vital wheat gluten is added by bakeries and food processors to baked goods, such as breads, and to pet foods, cereals, processed meats, and fish and poultry to improve the nutritional content, texture, strength, shape, and volume of the product. The neutral flavor and color of vital wheat gluten also enhances the flavor and color of certain foods. The cohesiveness and elasticity of the gluten enables the dough in wheat and other high protein breads to rise and to support added ingredients, such as whole cracked grains, raisins and fibers. This allows bakers to make an array of different breads by varying the gluten content of the dough. Vital wheat gluten is also added to white breads, hot dog buns, and hamburger buns to improve the strength and cohesiveness of the product.
COMPETITIVE CONDITION
While we believe that the overall market environment offers considerable growth opportunities for us in 2019 and beyond
, t
he markets in which our products are sold are competitive. Our products compete against similar products of many large and small companies. In our distillery products segment, competition is based primarily on product innovation, product characteristics, functionality, price, service, and quality factors, such as flavor. In our ingredient solutions segment, competition is based primarily on product innovation, product characteristics, price, name, color, flavor, or other properties that affect how the ingredient is being used.
PATENTS, TRADEMARKS, AND LICENSES
We are involved in a number of patent-related activities, primarily within our ingredient solutions segment. We have filed patent applications to protect a range of inventions made in our research and development efforts, including inventions relating to applications for our products. Some of these patents or licenses cover significant product formulation and processes used to manufacture our products.
SEASONALITY
Our sales are generally not seasonal.
TRANSPORTATION
Historically, our output has been transported to customers by truck and rail, most of which is provided by common carriers. We use third party transportation companies to help us manage truck and rail carriers who deliver our products to our North American customers.
RAW MATERIALS, PACKAGING MATERIALS, AND FOOD GRADE ALCOHOL
Our principal distillery products segment raw materials, or input costs, are corn and other grains (including rye, barley, wheat, barley malt, and milo), which are processed into food grade alcohol and distillery co-products consisting of distillers feed, fuel grade alcohol, and corn oil. Our principal ingredient solutions segment raw material is wheat flour, which is processed into starches and proteins. The cost of grain has, at times, been subject to substantial fluctuation.
In
2018
, we purchased most of our grain requirements from two suppliers, Bunge Milling, Inc. ("Bunge") and Consolidated Grain and Barge Co. ("CGB"). Our current grain supply contracts with Bunge and CGB expire on December 31, 2021 and December 31, 2020, respectively. Through these contracts, we purchase grain for delivery into the future at negotiated prices based on several factors. We also order wheat flour for delivery into the future at negotiated prices based on several factors. We provide for our wheat flour requirements through a supply contract with Ardent Mills, which expires August 20, 2023. We typically enter contracts for future delivery only to protect margins on contracted alcohol sales, expected ingredient sales, and general usage.
3
Our principal packaging material for our distillery products segment is oak barrels. Both new and used barrels are utilized for the aging of premium bourbon and rye whiskeys. We purchase oak barrels from multiple suppliers and some customers supply their own barrels.
We also source food grade alcohol from Pacific Ethanol Central, LLC ("Pacific Ethanol"), formerly Illinois Corn Processing, LLC ("ICP"), which was our
30 percent
-owned joint venture until July 3, 2017 when it was divested and sold to Pacific Ethanol (Note 4 and Note 10).
ENERGY
Natural gas is an input cost used to operate boilers to make steam heat. We procure natural gas for our facilities in the open market from various suppliers. We have a risk management program whereby we may purchase contracts for the delivery of natural gas for delivery into the future at negotiated prices based on several factors, or we can purchase futures contracts on the exchange. Historically, prices of natural gas have been higher in the late fall and winter months than during other periods.
EMPLOYEES
As of
December 31, 2018
, we had a total of
332
employees. A collective bargaining agreement covering
105
employees at the Atchison facility expires on August 31, 2019. A collective bargaining agreement covering
64
employees at the Lawrenceburg facility expires on December 31, 2022. We consider our relations with our personnel generally to be good.
REGULATION
We are subject to a broad range of federal, state, local, and foreign laws and regulations intended to protect public health and the environment. Our operations are also subject to regulation by various federal agencies, including the Alcohol and Tobacco Tax Trade Bureau ("TTB"), the Occupational Safety and Health Administration ("OSHA"), the Food and Drug Administration ("FDA") the United States Environmental Protection Agency ("EPA"), and by various state and local authorities. Such laws and regulations cover virtually every aspect of our operations, including production and storage facilities, distillation and maturation requirements, importing ingredients, distribution of beverage alcohol products, marketing, pricing, labeling, packaging, advertising, water usage, waste water discharge, disposal of hazardous wastes and emissions, and other matters. In addition, beverage alcohol products are subject to customs duties or excise taxation in many countries, including taxation at the federal, state, and local level in the United States.
EQUITY METHOD INVESTMENTS
Illinois Corn Processing, LLC ("ICP")
.
In November 2009, we completed a series of transactions to form ICP, which produced high quality food grade alcohol, chemical intermediates, and fuel. In connection with these transactions, we entered into agreements with ICP and ICP Holdings, an affiliate of SEACOR Holdings, Inc. One of the agreements was the LLC Interest Purchase Agreement under which we sold ICP Holdings
50 percent
of the membership interest in ICP. This agreement also gave ICP Holdings the option to purchase up to an additional
20 percent
of the membership interest in ICP, and on February 1, 2012, ICP Holdings exercised its option and purchased an additional
20 percent
from us, reducing our ownership from
50 percent
to
30 percent
.
On July 3, 2017, we completed the sale of our
30 percent
equity ownership interest in ICP to Pacific Ethanol pursuant to an Agreement and Plan of Merger ("Merger Agreement") entered into on June 26, 2017. Illinois Corn Processing Holdings, Inc., an affiliate of SEACOR Holdings, Inc., held the remaining equity in ICP that was also sold pursuant to the Merger Agreement (Note 4).
D.M. Ingredients GmbH ("DMI")
.
Our joint venture terminated effective June 30, 2015, with a return of investment on December 23, 2016 (Note 4).
4
EXECUTIVE OFFICERS OF THE REGISTRANT
Our officers as of
December 31, 2018
and their ages as of
February 27, 2019
:
|
Name
|
Age
|
Principal Occupation and Business Experience
|
|
Augustus C. Griffin
|
59
|
President and Chief Executive Officer for the Company since July 2014 and member of the Board of Directors for the Company since August 2014. Executive Vice President of Marketing for Next Level Spirits from April 2013 to January 2014. Brand and Business Consultant for Nelson's Green Brier Distillery from November 2011 to March 2013. Senior Vice President, Global Managing Director for Brown Forman Corporation's flagship Jack Daniels business from January 2008 to April 2011.
|
|
Thomas K. Pigott
|
54
|
Vice President, Finance and Chief Financial Officer for the Company since September 2015. Vice President of Finance for the Kraft Foods Group Meal Solutions Division from March 2015 to August 2015. Vice President of Finance for the Kraft Foods Group Meals and Desserts Business Unit from May 2014 to March 2015. Vice President of Finance and Chief Audit Executive for the Kraft Foods Group from October 2012 to April 2014. Vice President of Finance for the Pizza Division at Nestle, U.S.A. from April 2010 to October 2012.
|
|
Stephen J. Glaser
|
58
|
Vice President, Production and Engineering for the Company since October 2015. Corporate Director of Operations for the Company from January 2014 to October 2015. Plant Manager for the Company of the Atchison facility from May 2011 to December 2013.
|
|
David E. Dykstra
|
55
|
Vice President, Alcohol Sales and Marketing for the Company since 2009.
|
|
Michael R. Buttshaw
|
56
|
Vice President, Ingredient Sales and Marketing for the Company since December 2014. Vice President of Sales for the ingredient group at Southeastern Mills, Inc. from October 2010 to November 2014.
|
|
David E. Rindom
|
63
|
Vice President and Chief Administrative Officer for the Company since December 2015. Vice President, Human Resources for the Company from June 2000 to December 2015.
|
|
Andrew P. Mansinne
|
59
|
Vice President, Brands for the Company since November 2016. Managing director at Intercontinental Beverage Capital and President of Tattico Strategies from March 2015 to October 2016. President of Aveniu Brands from May 2010 to April 2014.
|
ITEM 1A. RISK FACTORS
Our business is subject to certain risks and uncertainties that could cause actual results and events to differ materially from forward looking statements. The following discussion identifies those which we consider to be most important. The following discussion of risks is not all inclusive. Additional risks not currently known to us or that we currently deem to be immaterial may also materially and adversely affect our business, financial condition, or results of operations.
RISKS THAT AFFECT OUR BUSINESS AS A WHOLE
An interruption of operations, a catastrophic event at our facilities, or a disruption of transportation services could negatively affect our business.
Although we maintain insurance coverage for various property damage and loss events, an interruption in or loss of operations at either of our production facilities could reduce or postpone production of our products, which could have a material adverse effect on our business, results of operations, or financial condition. To the extent that our value added products rely on unique or proprietary processes or techniques, replacing lost production by purchasing from outside suppliers would be difficult.
Our customers store a substantial amount of barreled inventory of aged premium bourbon and rye whiskeys at our Lawrenceburg facility and our nearby warehouses in Williamstown, Kentucky, and Sunman, Indiana. If a catastrophic event were to occur at our Lawrenceburg facility or our warehouses, our customers' business could be adversely affected. The loss of a significant amount of aged inventory through fire, natural disaster, or otherwise could result in a significant reduction in supply of the affected product or products and could result in customer claims against us and a reduction of warehouse services revenue.
We also store a substantial amount of our own inventory of aged premium bourbon and rye whiskeys at our Lawrenceburg facility and our nearby warehouses. If a catastrophic event were to occur at our Lawrenceburg facility or our warehouses, our business, financial condition, or results of operations could be adversely affected. The loss of a significant amount of our aged inventory through fire, natural disaster, or otherwise, could result in a reduction in supply of the affected product or products and could affect our long-term growth.
5
A disruption in transportation services could result in difficulties supplying materials to our facilities and impact our ability to deliver products to our customers in a timely manner, and our business, financial condition, or results of operations could be adversely affected.
Our profitability is affected by the costs of grain, wheat flour, and natural gas, or input costs, that we use in our business, the availability and costs of which are subject to weather and other factors beyond our control. We may not be able to recover the costs of commodities and energy by increasing our selling prices.
Grain and wheat flour costs are a significant portion of our costs of goods sold. Historically, the cost of such raw materials has, at times, been subject to substantial fluctuation, depending upon a number of factors which affect commodity prices in general and over which we have no control. These include crop conditions, weather, disease, plantings, government programs and policies, competition for acquisition of inputs such as agricultural commodities, purchases by foreign governments, and changes in demand resulting from population growth and customer preferences. The price of natural gas also fluctuates based on anticipated changes in supply and demand, weather, and the prices of alternative fuels. Fluctuations in the price of commodities and natural gas can be sudden and volatile at times and have had, from time to time, significant adverse effects on the results of our operations. Higher energy costs could result in higher transportation costs and other operating costs.
We do not enter into futures and options contracts ourselves because we can purchase grain and wheat flour for delivery into the future under our grain and wheat flour supply agreements. We intend to contract for the future delivery of grain and wheat flour only to protect margins on expected sales. On the portion of volume not contracted, we attempt to recover higher commodity costs through higher selling prices, but market considerations may not always permit this result. Even where prices can be adjusted, there is likely a lag between when we experience higher commodity or natural gas costs and when we might be able to increase prices. To the extent we are unable to timely pass increases in the cost of raw materials to our customers under sales contracts, market fluctuations in the cost of grain, natural gas, and ethanol may have a material adverse effect on our business, financial condition, or results of operations.
We have a high concentration of certain raw material and finished goods purchases from a limited number of suppliers which exposes us to risk.
We have signed supply agreements with Bunge and CGB for our grain supply (primarily corn) and with Ardent Mills for our wheat flour. The Company also procures some textured wheat proteins through a third-party toll manufacturer in the United States. If any of these companies encounters an operational or financial issue, or otherwise cannot meet our supply demands, it could lead to an interruption in supply to us and/or higher prices than those we have negotiated or than are available in the market at the time, and in turn, have a material adverse effect on our business, financial condition, or results of operations.
The markets for our products are very competitive, and our business could be negatively affected if we do not compete effectively.
The markets for products in which we participate are very competitive. Our principal competitors in these markets have substantial financial, marketing, and other resources, and several are much larger enterprises than us.
We are dependent on being able to generate net sales and other operating income in excess of the costs of products sold in order to obtain margins, profits, and cash flows to meet or exceed our targeted financial performance measures. Competition is based on such factors as product innovation, product characteristics, product quality, pricing, color, and name. Pricing of our products is partly dependent upon industry capacity, which is impacted by competitor actions to bring online idled capacity or to build new production capacity. If market conditions make our products too expensive for use in consumer goods, our revenues could be affected. If our principal competitors were to decrease their pricing, we could choose to do the same, which could adversely affect our margins and profitability. If we did not do the same, our revenues could be adversely affected due to the potential loss of sales or market share. Our revenue growth could also be adversely affected if we are not successful in developing new products for our customers or as a result of new product introductions by our competitors. In addition, more stringent new customer demands may require us to make internal investments to achieve or sustain competitive advantage and meet customer expectations.
6
Work disruptions or stoppages by our unionized workforce could cause interruptions in our operations.
As of
December 31, 2018
, approximately
169
of our
332
employees were members of a union. Although our relations with our two unions are stable, there is no assurance that we will not experience work disruptions or stoppages in the future, which could have a material adverse effect on our business, financial condition, or results of operations and could adversely affect our relationships with our customers.
If we were to lose any of our key management personnel, we may not be able to fully implement our strategic plan, our system of internal controls could be impacted.
We rely on the continued services of key personnel involved in management, finance, product development, sales, manufacturing and distribution, and, in particular, upon the efforts and abilities of our executive management team. The loss of service of any of our key personnel could have a material adverse effect on our business, financial condition, results of operations, and on our system of internal controls.
If we cannot attract and retain key management personnel, or if our search for qualified personnel is prolonged, our system of internal controls may be affected, which could lead to an adverse effect on our business, financial condition, or results of operations. In addition, it could be difficult, time consuming, and expensive to replace any key management member or other critical personnel, and no guarantee exists that we will be able to recruit suitable replacements or assimilate new key management personnel into our organization.
Covenants and other provisions in our credit arrangements could hinder our ability to operate. Our failure to comply with covenants in our credit arrangements could result in the acceleration of the debt extended under such agreements, limit our liquidity, and trigger other rights of our lenders.
Our credit arrangements (Note 5) contain a number of financial and other covenants that include provisions which require us, in certain circumstances, to meet certain financial tests. These covenants could hinder our ability to operate and could reduce our profitability. The lender may also terminate or accelerate our obligations under our credit arrangements upon the occurrence of various events in addition to payment defaults and other breaches. Any acceleration of our debt or termination of our credit arrangements would negatively impact our overall liquidity and might require us to take other actions to preserve any remaining liquidity. Although we anticipate that we will be able to meet the covenants in our credit arrangements, there can be no assurance that we will do so, as there are a number of external factors that affect our operations over which we have little or no control, that could have a material adverse effect on our business, financial condition, or results of operations.
Product recalls or other product liability claims could materially and negatively affect our business.
Selling products for human consumption involves inherent legal and other risks, including product contamination, spoilage, product tampering, allergens, or other adulteration. We could decide to, or be required to, recall products due to suspected or confirmed product contamination, adulteration, misbranding, tampering, or other deficiencies. Although we maintain product recall insurance, product recalls or market withdrawals could result in significant losses due to their costs, the destruction of product inventory, and lost sales due to the unavailability of the product for a period of time. We could be adversely affected if our customers lose confidence in the safety and quality of certain of our products, or if consumers lose confidence in the food and beverage safety system generally. Negative attention about these types of concerns, whether or not valid, may damage our reputation, discourage consumers from buying our products, or cause production and delivery disruptions.
We may also suffer losses if our products or operations cause injury, illness, or death. In addition, we could face claims of false or deceptive advertising or other criticism. A significant product liability or other legal judgment or a related regulatory enforcement action against us, or a significant product recall, may materially and adversely affect our reputation and profitability. Moreover, even if a product liability or other legal or regulatory claim is unsuccessful, has no merit, or is not pursued, the negative publicity surrounding assertions against our products or processes could have a material adverse effect on our business, financial condition, or results of operations.
7
We are subject to extensive regulation and taxation, as well as compliance with existing or future laws and regulations, which may require us to incur substantial expenditures.
We are subject to a broad range of federal, state, local, and foreign laws and regulations intended to protect public health and the environment. Our operations are also subject to regulation by various federal agencies, including the TTB, OSHA, the FDA, the EPA, and by various state and local authorities. Such laws and regulations cover virtually every aspect of our operations, including production and storage facilities, distillation and maturation requirements, importing ingredients, distribution of beverage alcohol products, marketing, pricing, labeling, packaging, advertising, water usage, waste water discharge, disposal of hazardous wastes and emissions, and other matters. In addition, beverage alcohol products are subject to customs, duties, or excise taxation in many countries, including taxation at the federal, state, and local level in the United States.
Violations of any of these laws and regulations may result in administrative, civil, or criminal fines or penalties being levied against us, including temporary or prolonged cessation of production, revocation or modification of permits, performance of environmental investigatory or remedial activities, voluntary or involuntary product recalls, or a cease and desist order against operations that are not in compliance with applicable laws. These laws and regulations may change in the future and we may incur material costs in our efforts to comply with current or future laws and regulations. These matters may have a material adverse effect on our business, financial condition, or results of operations.
A failure of one or more of our key information technology systems, networks, processes, associated sites, or service providers could have a negative impact on our business.
We rely on information technology ("IT") systems, networks, and services, including internet sites, data hosting and processing facilities and tools, hardware (including laptops and mobile devices), software and technical applications and platforms, some of which are managed and hosted by third party vendors to assist us in the management of our business. The various uses of these IT systems, networks, and services include, but are not limited to: hosting our internal network and communication systems; enterprise resource planning; processing transactions; summarizing and reporting results of operations; business plans, and financial information; complying with regulatory, legal, or tax requirements; providing data security; and handling other processes necessary to manage our business. Any failure of our information systems could adversely impact our ability to operate. Routine maintenance or development of new information systems may result in systems failures, which may have a material adverse effect on our business, financial condition, or results of operations.
Increased IT security threats and more sophisticated cyber crime pose a potential risk to the security of our IT systems, networks, and services, as well as the confidentiality, availability, and integrity of our data. This could lead to outside parties having access to our privileged data or strategic information, our employees, or our customers. Any breach of our data security systems or failure of our information systems may have a material adverse impact on our business operations and financial results. If the IT systems, networks, or service providers we rely upon fail to function properly, or if we suffer a loss or disclosure of business or other sensitive information due to any number of causes, ranging from catastrophic events to power outages to security breaches, and our disaster recovery plans do not effectively address these failures on a timely basis, we may suffer interruptions in our ability to manage operations and reputational, competitive, or business harm, which may have a material adverse effect on our business, financial condition, or results of operations. In addition, such events could result in unauthorized disclosure of material confidential information, and we may suffer financial and reputational damage because of lost or misappropriated confidential information belonging to us or to our partners, our employees, customers, and suppliers. Although we maintain insurance coverage for various cybersecurity risks, in any of these events, we could also be required to spend significant financial and other resources to remedy the damage caused by a security breach or to repair or replace networks and IT systems.
Damage to our reputation, or that of any of our key customers or their brands, could affect our business performance.
The success of our products depends in part upon the positive image that consumers have of the third party brands that use our products. Contamination, whether arising accidentally or through deliberate third party action, or other events that harm the integrity or consumer support for our and/or our customers' products could affect the demand for our and/or our customers' products. Unfavorable media, whether accurate or not, related to our industry, to us, our products, or to the brands that use our products, marketing, personnel, operations, business performance, or prospects could negatively affect our corporate reputation, stock price, ability to attract high quality talent, or the performance of our business. Negative publicity or commentary on social media outlets could cause consumers to react rapidly by avoiding our brands or by choosing brands offered by our competitors, which could have a material adverse effect on our business, financial condition, or results of operations.
8
We may not be able to adequately protect our intellectual property rights or may be accused of infringing intellectual property rights of third parties.
We regard our trademarks, service marks, copyrights, patents, trade dress, trade secrets, proprietary technology, and similar intellectual property as critical to our success, and we rely on trademark, copyright, and patent law, trade secret protection, and confidentiality and/or license agreements with our employees, customers, and others to protect our proprietary rights. We may not be able to discover or determine the extent of any unauthorized use of our proprietary rights. Third parties that license our proprietary rights also may take actions that diminish the value of our proprietary rights or reputation. The protection of our intellectual property may require the expenditure of significant financial and managerial resources. Moreover, the steps we take to protect our intellectual property may not adequately protect our rights or prevent third parties from infringing or misappropriating our proprietary rights.
Our intellectual property rights may not be upheld if challenged. Such claims, if they are proved, could materially and adversely affect our business and may lead to the impairment of the amounts recorded for goodwill and other intangible assets. If we are unable to maintain the proprietary nature of our technologies, we may lose any competitive advantage provided by our intellectual property. We and our customers and other users of our products may be subject to allegations that we or they or certain uses of our products infringe the intellectual property rights of third parties. The outcome of any litigation is inherently uncertain. Any intellectual property claims, with or without merit, could be time-consuming and expensive to resolve, could divert management attention from executing our business plan, and could require us or our customers or other users of our products to change business practices, pay monetary damages, or enter into licensing or similar arrangements. Any adverse determination related to intellectual property claims or litigation could be material to our business, financial condition, or results of operations.
Climate change, or legal, regulatory or market measures to address climate change, may negatively affect our business or operations, and water scarcity or quality could negatively impact our production costs and capacity.
Increasing concentrations of carbon dioxide and other greenhouse gases in the atmosphere may have an adverse effect on global temperatures, weather patterns, and the frequency and severity of extreme weather events and natural disasters. In the event that climate change, or legal, regulatory, or market measures enacted to address climate change, has a negative effect on agricultural productivity in the regions from which we procure agricultural products such as corn and wheat, we could be subject to decreased availability or increased prices for a such agricultural products, which could have a material adverse effect on our business, financial condition, or results of operations.
Water is the main ingredient in substantially all of our distillery products and is necessary for the production of our food ingredients. It is also a limited resource, facing unprecedented changes from climate change, increasing pollution, and poor management. As demand for water continues to increase, water becomes more scarce and the quality of available water deteriorates, we may be affected by increasing production costs or capacity constraints, which could have a material adverse effect on our business, financial condition, or results of operations.
RISKS SPECIFIC TO OUR DISTILLERY PRODUCTS SEGMENT
The relationship between the price we pay for grain and the sales prices of our distillery co-products can fluctuate significantly and negatively impact our business.
Distillers feed, fuel grade alcohol, and corn oil are the principal co-products of our alcohol production process and can contribute in varying degrees to the profitability of our distillery products segment. Distillers feed and corn oil are sold for prices which historically have tracked the price of corn, but are also susceptible to other factors. In the case of distillers feed, other factors could include weather, other available feedstock, and global trade relations. In the case of corn oil, other factors could include soy oil and the overall level of ethanol production. We sell fuel grade alcohol, the prices for which typically, but not always, have tracked price fluctuations in gasoline prices. As a result, the profitability of these products could be adversely affected, which could be material to our business, financial condition, or results of operations.
9
Our strategic plan involves significant investment in the aging of barreled distillate. Decisions concerning the quantity of maturing stock of our aged distillate could materially affect our future profitability.
There is an inherent risk in determining the quantity of maturing stock of aged distillate to lay down in a given year for future sales as a result of changes in consumer demand, pricing, new brand launches, changes in product cycles, and other factors. Demand for products could change significantly between the time of production and the date of sale. It may be more difficult to make accurate predictions regarding new products and brands. Inaccurate decisions and/or estimations could lead to an inability to supply future demand or lead to a future surplus of inventory and consequent write-down in the value of maturing stocks of aged distillate. As a result, our business, financial condition, or results of operations could be materially adversely affected.
If the brands we develop or acquire do not achieve consumer acceptance, our growth may be limited, which could have a material adverse impact on our business, financial condition, or results of operations.
A component of our strategic plan is to develop our own brands, particularly whiskeys. Risks related to this strategy include:
|
•
|
Because our brands, internally developed and acquired, are early in their growth cycle or have not yet been developed, they have not achieved extensive brand recognition. Accordingly, if consumers do not accept our brands, we will not be able to penetrate our markets and our growth may be limited.
|
|
•
|
We depend, in part, on the marketing initiatives and efforts of our independent distributors in promoting our products and creating consumer demand, and we have limited, or no, control regarding their promotional initiatives or the success of their efforts.
|
|
•
|
We depend on our independent distributors to distribute our products. The failure or inability of even a few of our independent distributors to adequately distribute our products within their territories could harm our sales and result in a decline in our results of operations.
|
|
•
|
We compete for shelf space in retail stores and for marketing focus by our independent distributors, most of whom carry extensive product portfolios.
|
|
•
|
The laws and regulations of several states prohibit changes of independent distributors, except under certain limited circumstances, making it difficult to terminate an independent distributor for poor performance without reasonable cause, as defined by applicable statutes. Any difficulty or inability to replace independent distributors, poor performance of our major independent distributors or our inability to collect accounts receivable from our major independent distributors could harm our business. There can be no assurance that the independent distributors and retailers we use will continue to purchase our products or provide our products with adequate levels of promotional support.
|
|
•
|
Our brands compete with the brands of our bulk alcohol customers.
|
Warehouse expansion issues could negatively impact our operations and our business.
On October 21, 2015, we announced a major expansion in warehousing capacity. The program includes both the refurbishment of existing warehouse buildings and the construction of new warehouses. The final phases of the program are expected to be completed by the end of calendar year 2020. There is the potential risk of completion delays, including risk of delay associated with required permits and cost overruns, which could have a material adverse effect our business, financial condition, or results of operations.
We may be subject to litigation directed at the beverage alcohol industry
.
Companies in the beverage alcohol industry are, from time to time, exposed to class action or other litigation relating to alcohol advertising, product liability, alcohol abuse problems or health consequences from the misuse of alcohol. Such litigation may result in damages, penalties or fines as well as damage to our reputation, which could have a material adverse effect on our business, financial condition, or results of operations.
10
A change in public opinion about alcohol could reduce demand for our products.
For many years, there has been a high level of social and political attention directed at the beverage alcohol industry. The attention has focused largely on public health concerns related to alcohol abuse, including drunk driving, underage drinking, and the negative health impacts of the abuse and misuse of beverage alcohol. Anti-alcohol groups have, in the past, advocated successfully for more stringent labeling requirements, higher taxes, and other regulations designed to discourage alcohol consumption. More restrictive regulations, higher taxes, negative publicity regarding alcohol consumption and/or changes in consumer perceptions of the relative healthfulness or safety of beverage alcohol could decrease sales and consumption of alcohol, and thus, the demand for our products. This could, in turn, significantly decrease both our revenues and our revenue growth and have a material adverse effect on our business, financial condition, or results of operations.
Changes in consumer preferences and purchases, and our ability to anticipate or react to them, could negatively affect our business results.
We compete in highly competitive markets, and our success depends on our continued ability to offer our customers and consumers appealing, high-quality products. In recent years there has been increased demand for the products we produce, including, in particular, increased demand for bourbons and rye whiskeys. Customer and consumer preferences and purchases may shift due to a host of factors, many of which are difficult to predict, including:
|
•
|
demographic and social trends;
|
|
•
|
economic conditions;
|
|
•
|
public health policies and initiatives;
|
|
•
|
changes in government regulation and taxation of beverage alcohol products;
|
|
•
|
the potential expansion of legalization of, and increased acceptance or use of, marijuana; and
|
|
•
|
changes in travel, leisure, dining, entertaining, and beverage consumption trends.
|
If our customers and consumers shift away from spirits
(particularly brown spirits, such as our premium bourbon and rye whiskeys), our business, financial condition, or results of operations could be adversely affected.
RISKS SPECIFIC TO OUR INGREDIENT SOLUTIONS SEGMENT
Our focus on higher margin specialty ingredients may make us more reliant on fewer, more profitable customer relationships.
Our strategic plan for our ingredient solutions segment includes focusing our efforts on the sale of specialty proteins and starches to targeted domestic consumer packaged goods customers. Our major focus is directed at food ingredients, which are primarily used in foods that are developed to address consumers’ desire for healthier and more convenient products; these consist of dietary fiber, wheat protein isolates and concentrates, and textured wheat proteins. The bulk of our applications technology and research and development efforts are dedicated to providing customers with specialty ingredient solutions that deliver nutritional benefits, as well as desired functional and sensory qualities to their products. Our business, financial condition, and results of operations could be materially adversely affected if our customers were to reduce their new product development ("NPD") activities or cease using our unique dietary fibers, starches, and proteins in their NPD efforts.
Failure to receive FDA recognition of Fibersym
®
resistant starch as a dietary fiber for purposes of food labeling laws could lead to a decrease in sales volume or pricing, a decrease in margins and lower profitability.
In connection with new food labeling rules, the FDA has published a list of dietary fibers, and our Fibersym resistant starch has not been included on that list. In November 2016, we announced that we filed a citizen petition with the FDA asking the agency to confirm the status of our patented Fibersym
®
RW and FiberRite
®
RW resistant wheat starches as dietary fiber. While our citizen petition is undergoing review, the current status of Fibersym
®
RW, along with FiberRite
®
RW, as accepted dietary fiber and a recognized fiber fortifying ingredient remains in place. A delay in confirmation by the FDA of our Fibersym
®
RW and FiberRite
®
RW resistant wheat starches as dietary fiber under the new food labeling rules in a timely manner could have a material adverse impact on ingredient solutions segment operating results.
11
Adverse public opinion about any of our specialty ingredients could reduce demand for our products.
Consumer preferences with respect to our specialty ingredients might change. In fact, in recent years, we have noticed shifting consumer preferences and media attention directed to gluten, gluten intolerance, and "clean label" products. Shifting consumer preferences could decrease demand for our specialty ingredients. This could, in turn, significantly decrease our revenues and revenue growth, which could have a material adverse affect on our business, financial condition, and results of operations.
RISKS RELATED TO OUR COMMON STOCK
Common Stockholders have limited rights under our Articles of Incorporation
.
Under our Articles of Incorporation, holders of our Preferred Stock are entitled to elect five of our nine directors and only holders of our Preferred Stock are entitled to vote with respect to a merger, dissolution, lease, exchange or sale of substantially all of our assets, or on an amendment to the Articles of Incorporation, unless such action would increase or decrease the authorized shares or par value of the Common or Preferred Stock, or change the powers, preferences or special rights of the Common or Preferred Stock so as to affect the holders of Common Stock adversely. Generally, the Common Stock and Preferred Stock vote as separate classes on all other matters requiring stockholder approval.
The majority of the outstanding shares of our Preferred Stock is beneficially owned by one individual, who is effectively in control of the election of five of our nine directors under our Articles of Incorporation.
ITEM 1B. UNRESOLVED STAFF COMMENTS
None.
ITEM 2. PROPERTIES
MGP has four primary locations, one in Kansas, two in Indiana, and one in Kentucky. Grain processing, distillery, warehousing, research and quality control laboratories, principal executive offices, and a technical innovation center are located in Atchison, Kansas on a
28.5
acre campus. A distillery, warehousing, tank farm, quality control laboratory, and research and development facility are located on a
78
acre campus that spans portions of both Lawrenceburg and Greendale, Indiana. A warehousing facility is located on
33
acres in Williamstown, Kentucky, and a warehousing facility is located on
36.5
acres in Sunman, Indiana that is not yet in service.
These facilities are generally in good operating condition and are generally suitable for the business activity conducted therein. We have existing manufacturing capacity to grow our ingredient solutions business at our Atchison facility, as needed. All of our production facilities, executive office building, and technical innovation center are owned, and all of our owned properties are subject to mortgages in favor of one or more of our lenders. We also own or lease transportation equipment and facilities and a gas pipeline as described under
Item 1. Business - Transportation and Item 1. Business - Energy.
ITEM 3. LEGAL PROCEEDINGS
None (Note 8).
ITEM 4. MINE SAFETY DISCLOSURES
Not applicable.
12
PART II
ITEM 5. MARKET FOR REGISTRANT’S COMMON EQUITY, RELATED STOCKHOLDERS MATTERS, AND ISSUER PURCHASES OF EQUITY SECURITIES
Equity compensation plan information is incorporated by reference from Part III, Item 12, "Security Ownership of Certain Beneficial Owners and Management and Related Stockholder Matters," of this document, should be considered an integral part of Item 5. Our Common Stock is traded on the NASDAQ Global Select Market under the ticker symbol MGPI. As of
February 21, 2019
, there were approximately
394
holders of record of our Common Stock. According to reports received from NASDAQ, the average daily trading volume of our Common Stock (excluding block trades) ranged from
35,400
to
2,603,900
shares during the year ended
December 31, 2018
.
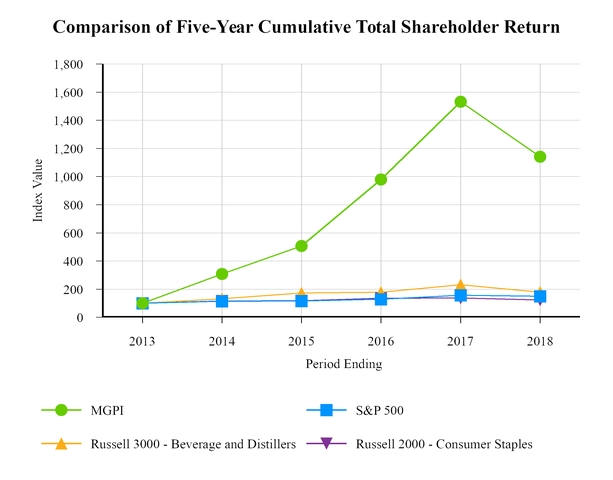
STOCK PERFORMANCE GRAPH
The following graph compares the cumulative total return of our Common Stock for the five year period ended
December 31, 2018
, against the cumulative total return of the S&P 500 Stock Index (broad market comparison), Russell 3000 - Beverage and Distillers (line of business comparison), and Russell 2000 - Consumer Staples (line of business comparison). The graph assumes $100 (one hundred dollars) was invested on
December 31, 2013
, and that all dividends were reinvested.
13
PURCHASES OF EQUITY SECURITIES BY ISSUER
We did not sell equity securities during the quarter ended
December 31, 2018
.
Issuer Purchases of Equity Securities
|
(a) Total
Number of
Shares (or
Units)
Purchased
|
(b) Average
Price Paid
per Share (or
Unit)
|
(c) Total
Number of
Shares (or
Units)
Purchased as
Part of
Publicly
Announced
Plans or
Programs
|
(d) Maximum
Number (or
Approximate
Dollar Value) of
Shares (or Units)
that May Yet Be
Purchased Under
the Plans or
Programs
|
||||||||||||
|
October 1, 2018 through October 31, 2018
|
1,468
|
|
(a)
|
$
|
74.49
|
|
—
|
|
1,408,969
|
|
|||||
|
November 1, 2018 through November 30, 2018
|
—
|
|
—
|
|
—
|
|
—
|
|
|||||||
|
December 1, 2018 through December 31, 2018
|
—
|
|
—
|
|
—
|
|
—
|
|
|||||||
|
Total
|
1,468
|
|
—
|
|
|||||||||||
|
(a)
|
Vested RSU awards under the 2014 Plan that were purchased to cover employee withholding taxes.
|
14
ITEM 6. SELECTED FINANCIAL DATA
|
Year Ended December 31,
|
|||||||||||||||||||
|
2018
(a)(c)
|
2017
(a)(c)(e)(f)
|
2016
(a)(c)(d)
|
2015
(a)
|
2014
(a)(b)
|
|||||||||||||||
|
Consolidated Statements of Income Data:
|
|||||||||||||||||||
|
Net sales
|
$
|
376,089
|
|
$
|
347,448
|
|
$
|
318,263
|
|
$
|
327,604
|
|
$
|
313,403
|
|
||||
|
Income before income taxes
|
$
|
48,980
|
|
$
|
52,758
|
|
$
|
44,717
|
|
$
|
38,418
|
|
$
|
25,940
|
|
||||
|
Net income
|
$
|
37,284
|
|
$
|
41,823
|
|
$
|
31,184
|
|
$
|
26,191
|
|
$
|
23,675
|
|
||||
|
Basic and Diluted Earnings Per Share ("EPS")
|
|||||||||||||||||||
|
Net income
|
$
|
2.17
|
|
$
|
2.44
|
|
$
|
1.82
|
|
$
|
1.48
|
|
$
|
1.32
|
|
||||
|
Dividends and Dividend Equivalents Per Common Share
|
$
|
0.32
|
|
$
|
1.01
|
|
$
|
0.12
|
|
$
|
0.06
|
|
$
|
0.05
|
|
||||
|
Consolidated Balance Sheet Data:
|
|||||||||||||||||||
|
Total assets
|
$
|
277,892
|
|
$
|
240,328
|
|
$
|
225,336
|
|
$
|
194,310
|
|
$
|
160,215
|
|
||||
|
Long-term debt, less current maturities
|
$
|
31,628
|
|
$
|
24,182
|
|
$
|
31,642
|
|
$
|
30,115
|
|
$
|
7,286
|
|
||||
|
(a)
|
During 2018, we determined that we would not "more likely than not" realize a portion of our deferred tax asset and increased our valuation allowance by $1,304. During 2017, 2016, 2015, and 2014, we determined that we would "more likely than not" realize a portion of our deferred tax asset and reduced our valuation allowance by $578, $718, $2,385, and $7,446, respectively.
|
|
(b)
|
In January 2014 and October 2014, we experienced a fire at one of our facilities. Insurance recoveries totaled $8,290 for 2014.
|
|
(c)
|
In March 2016, the FASB issued ASU No. 2016-09,
Compensation—Stock Compensation (Topic 718) Improvements to Employee Share-Based Payment Accounting
. For 2018, 2017, and 2016, respectively, we received a combined federal and state tax effected excess tax benefit of $1,437, $4,625, and $1,571 from windfalls related to employee share-based compensation recognized as a reduction to income tax expense. Retrospective application to 2015 and 2014 was not required.
|
|
(d)
|
Net income for 2016 included a legal settlement agreement and a gain on sale of long-lived assets of $3,385 before tax.
|
|
(e)
|
On July 3, 2017, we completed the sale of our equity ownership interest in ICP to Pacific Ethanol, consistent with a Merger Agreement entered into on June 26, 2017, and, as a result, recorded a gain on sale of equity method investment of
$11,381
before tax, which is included in Net income for 2017 (Note 4).
|
|
(f)
|
On December 22, 2017, the United States enacted tax reform legislation commonly known as the Tax Cuts and Jobs Act (the "Tax Act"), resulting in significant modifications to existing law. Following the guidance in SEC Staff Accounting Bulletin ("SAB") 118, we recorded a provisional discrete net tax benefit in our Consolidated Statements of Income through net income of
$3,343
in 2017. As of December 31, 2018, the accounting for the Tax Act is now complete and the discrete net tax benefit recorded in 2017 is no longer provisional (Note 6).
|
Selected Financial Information.
Selected quarterly financial information (unaudited) is detailed in Note 15.
15
ITEM 7. MANAGEMENT’S DISCUSSION AND ANALYSIS OF FINANCIAL CONDITION AND RESULTS OF OPERATIONS
CAUTIONARY NOTE CONCERNING FACTORS THAT MAY AFFECT FUTURE RESULTS
This Report on Form 10-K contains forward looking statements as well as historical information. All statements, other than statements of historical facts, regarding the prospects of our industry and our prospects, plans, financial position, and strategic plan may constitute forward looking statements. In addition, forward looking statements are usually identified by or are associated with such words as "intend," "plan," "believe," "estimate," "expect," "anticipate," "hopeful," "should," "may," "will," "could," "encouraged," "opportunities," "potential," and/or the negatives or variations of these terms or similar terminology. Forward looking statements are based on current expectations and assumptions that are subject to risks and uncertainties which may cause actual results to differ materially from those expressed or implied in the forward looking statements. A detailed discussion of risks and uncertainties that could cause actual results and events to differ materially from such forward looking statements is included in the section titled "Risk Factors" (Item 1A of this Form 10-K). Forward looking statements are made as of the date of this report, and we undertake no obligation to update or revise publicly any forward looking statements, whether because of new information, future events or otherwise.
Management’s Discussion and Analysis ("MD&A") of Financial Condition and Results of Operations is designed to provide a reader of MGP’s consolidated financial statements with a narrative from the perspective of management. MGP’s MD&A is presented in seven sections:
|
•
|
Overview
|
|
•
|
Results of Operations
|
|
•
|
Distillery Products Segment
|
|
•
|
Ingredient Solutions Segment
|
|
•
|
Cash Flow, Financial Condition and Liquidity
|
|
•
|
Off Balance Sheet Obligations
|
|
•
|
New Accounting Pronouncements
|
OVERVIEW
MGP is a leading producer and supplier of premium distilled spirits and specialty wheat protein and starch food ingredients. Distilled spirits include premium bourbon and rye whiskeys and GNS, including vodka and gin. We are also a top producer of high quality industrial alcohol for use in both food and non-food applications. Our protein and starch food ingredients provide a host of functional, nutritional and sensory benefits for a wide range of food products to serve the packaged goods industry. We have two reportable segments: our distillery products segment and our ingredient solutions segment.
Our Mission
Secure our future by consistently delivering superior financial results by more fully participating in all levels of the alcohol and food ingredients segments for the betterment of our shareholders, employees, partners, consumers, and communities.
Our Strategic Plan
Our strategic plan is designed to leverage our history and strengths. We have a long history in the distilling industry. Our Lawrenceburg facility, which we purchased in 2011, was founded in 1847 and our Atchison facility was opened in 1941. Through these two distilleries, we are involved in producing some of the finest whiskeys, vodkas, and gins in the world. Likewise, our history in the food ingredient business stretches back more than 60 years.
Our strategic plan seeks to leverage the positive macro trends we see in the industries where we compete while providing better insulation from outside factors, including swings in commodity pricing. We believe the successful execution of our strategy will continue to deliver strong operating income growth. Specifically, our strategic plan is built on five key growth strategies:
Maximize Value, Capture Value Share, Invest for Growth,
Operational Excellence, and Build the MGP Brand.
Each of these strategies, along with related
2018
accomplishments, are discussed below.
16
Maximize Value.
We focus on maximizing the value of our current production volumes, particularly taking advantage of favorable macro trends in our distillery products segment, such as the growth of the American whiskey category that has continued to expand over the past several years. This includes shifting sales mix to higher margin products, such as premium bourbon and rye whiskeys, as well as extending the product range of our grain neutral spirits, including vodkas and gins. In our ingredient solutions segment, the macro trends include growth in high fiber, high protein, plant-based proteins, and non-GMO ("non-Genetically Modified Organism") products.
Although these macro trends are currently favorable, we have seen competition intensify as industry participants in both of our segments seek to capitalize on consumers' interest in these categories. While we believe we are well-positioned to benefit from these favorable trends, we may also be negatively affected by the increase in competition in one or both of our segments. We intend to continue to focus on opportunities that will allow us to achieve the highest value from our production facilities.
Accomplishments
|
•
|
In our distillery products segment, our focus on attracting and developing customers for our premium beverage alcohol continued in 2018. Some efforts included increases in sales force and providing more tailored product offerings to our craft customers. As a result, we were able to add new customers throughout the year. Our partnerships with both new and existing customers helped to drive double-digit sales growth for our premium bourbon and rye whiskeys in 2018.
|
|
•
|
In our ingredient solutions segment, we continue to provide outstanding customer solutions, taking advantage of our positioning in the growing plant-based proteins category. We further developed our pipeline of wheat-based protein products to support strong customer growth. Our net sales of specialty wheat proteins grew
8.4 percent
in 2018, and we continued to grow our specialty wheat starch net sales in 2018, despite the 2017 expiration of our Fibersym patent.
|
|
•
|
Our shift in sales mix to higher margin products has contributed to a
7.4 percent
increase in gross profit within the distillery products segment in
2018
over the prior year.
|
|
•
|
Our shift in sales mix to higher margin products has contributed to a
28.3 percent
increase in gross profit within the ingredient solutions segment in
2018
over the prior year.
|
See the "Distillery Products Segment" and "Ingredient Solutions Segment" discussions.
Capture Value Share.
We work to develop partnerships to support brand creation, long-term growth, and to combine our innovation capabilities and industry expertise to provide unique solutions and offerings to the marketplace. In that way, we believe we are able to realize full value for our operational capacity, quality, and commitment.
Accomplishments
|
•
|
In January through April 2018, we announced partnerships with distributors in Minnesota, Arizona, Illinois, and Colorado for the introduction of TILL American Wheat Vodka
®
and George Remus
®
Straight Bourbon Whiskey, as we continue to expand into new markets.
|
|
•
|
In May 2018, we announced the launch of Rossville Union
®
, our first proprietary Rye Whiskey label. Named after the founding distillery in Lawrenceburg, Rossville Union
®
represents a historic return to the home of crafted rye whiskey and honors a spirited tradition that dates back more than 170 years in America’s original “Whiskey City.” Rossville Union
®
is available in two expressions: Rossville Union
®
Master Crafted Straight Rye Whiskey and Rossville Union
®
Master Crafted Barrel Proof Straight Rye Whiskey.
|
|
•
|
In September 2018, we announced the November release of Series II of our annual Remus Repeal Reserve
®
. Produced to commemorate Prohibition Repeal Day, Series II is a highly limited bottling that was available as of the birthdate of brand namesake, George Remus
®
. This year’s medley is the first to utilize aged bourbons from 2007 and 2008, showcasing more than 10 years of aging.
|
|
•
|
In October 2018, we announced our latest product release: Eight & Sand Blended Bourbon Whiskey. Phasing into distribution in 2019, Eight & Sand Blended Bourbon Whiskey celebrates the timeless journey of the American railway-with a classic tribute whiskey crafted by our team in Lawrenceburg.
|
17
Invest for Growth.
We are committed to investing to support our growth. Components of this growth strategy include:
|
•
|
Capital Expenditures:
Capital expenditures focus largely on supporting innovation and product development, improving operational reliability, and strengthening our ability to support all aspects of growth in the American whiskey category.
|
|
•
|
Select Inventories:
As demand grows for American whiskeys, in both the United States and global markets, we are building our inventories of aged premium whiskeys to fully participate in this growth. This initiative helps us build strong partnerships and open new relationships with potential customers, in addition to supporting the development of our own brands.
|
|
•
|
Selling, General, and Administrative Expenses ("SG&A"):
As needed to support our long-term growth objectives, resources and capabilities are being added, particularly in sales and marketing.
|
Accomplishments
|
•
|
Regarding our
Capital Expenditures
growth strategy:
|
In 2018, we continued our warehouse expansion program as part of the implementation of our strategic plan to support the growth of the American whiskey category. The program includes both the refurbishment of existing warehouse buildings and the construction of new warehouses. We invested over
$18,000
in this program in capital expenditures during 2018 and approximately
$44,000
since the program's inception.
|
•
|
Regarding our
Select Inventories
growth strategy:
|
Given the available and anticipated barrel inventory capacity of our warehouses, we produce, and will continue to produce, certain volumes of premium bourbon and rye whiskeys that are in addition to current customer demand. Product is barreled and included in our inventory. Our goal is to maintain inventory levels of premium bourbon and rye whiskeys sufficient to support our own brands, engage in partnerships, and support industry growth. We increased our premium bourbon and rye whiskey inventory by
$10,648
, at cost, during
2018
.
|
•
|
Regarding our
SG&A
growth strategy:
|
We continued to invest in people and programs to support the development of our MGP brands platform and our long-term growth objectives.
Operational Excellence.
We continue a solid commitment to operational excellence across the Company by strengthening our emphasis on excellence in all stages of operations, from sourcing through processing and, ultimately, delivering the finest quality products. This also means striving to de-risk all aspects of our business.
Accomplishments
|
•
|
In February 2018, a new employee-centric initiative designed to raise Company safety practices to a world-class level was announced. Called
Safety Up
, and supported by the motto
It starts with us,
the program focuses on employee engagement, awareness, and standardization to consistently keep on-the-job safety top of mind across all areas of the Company. It is intended to move safety assurance into deeper and broader dimensions, giving each employee and teams of employees greater ability to act more swiftly on safety-related matters.
|
|
•
|
In 2018, we completed a British Retail Consortium ("BRC") audit with outstanding results, achieving a Grade AA rating for both our Atchison and Lawrenceburg facilities. Per the BRC standard, a Grade AA is awarded if five or fewer non-conformances are cited out of 256 total audit items, and our Atchison facility received zero non-conformances. Each year since undergoing its initial BRC audit in 2013, the Atchison facility's distillery has achieved BRC’s highest grade. The same is true with results of annual BRC audits that have been conducted at our Lawrenceburg facility since 2014. For the Atchison facility's protein and starch plant, 2018 marked the eighth time in as many years that it had scored the BRC’s highest rating.
|
18
Build the MGP Brand.
We continue to build our brand across all stakeholders, including shareholders, employees, partners, consumers, and communities. We are achieving this by producing consistent growth through an understandable business model, proactively engaging with the investment community, creating a desirable organization for our employees, strengthening our relationship with our customers and vendors, increasing awareness and understanding of MGP with consumers, and supporting the communities in which we operate.
Accomplishments
|
•
|
In June 2018, Augustus Griffin (President and Chief Executive Officer), Karen Seaberg (Chairman of the Board), and Cloud L. Cray, Jr. (Chairman Emeritus) were winners in the Ernst & Young, LLP
Entrepreneur of the Year 2018 Heartland Awards
in Minneapolis, Minnesota. The award recognizes leaders of successful, growing and dynamic businesses who break the mold to create new solutions, innovations and possibilities.
|
|
•
|
In November 2018, MGP Board of Directors member, Jeannine Strandjord, was named a Director of the Year by the National Association of Corporate Directors, an organization representing 19,000 corporate board members. The honor, given to only two corporate directors, honored Strandjord for her integrity, mature confidence and high ethical standards, among other attributes.
|
|
•
|
In 2018, we continued our unbroken commitment to support our communities by providing strong financial support and donating time and leadership talent.
|
|
◦
|
Through a three-year agreement that took effect April 1, we made a commitment to renewable energy through Westar Wind, a Green e-certified program offered by Westar Energy. As a result, total electric usage at our facilities in Atchison and Lawrenceburg will be offset by green energy provided by Westar’s wind resources in Kansas.
|
|
◦
|
In April, we eliminated the use of all styrofoam and single use plastics, such as cups, plates, utensils, straws and stirrers, at our facilities, replacing those items with compostable and biodegradable alternatives. Timed in alignment with the international observance of Earth Day, this move represents another step in our overall sustainability initiative.
|
19
RESULTS OF OPERATIONS
Consolidated results
The table below details the consolidated results for
2018
and
2017
and 2016:
|
December 31,
|
% Increase (Decrease)
|
|||||||||||||||||
|
2018
|
2017
|
2016
|
2018 v. 2017
|
2017 v. 2016
|
||||||||||||||
|
Net sales
|
$
|
376,089
|
|
$
|
347,448
|
|
$
|
318,263
|
|
8.2
|
%
|
9.2
|
%
|
|||||
|
Cost of sales
|
292,490
|
|
271,432
|
|
252,980
|
|
7.8
|
|
7.3
|
|
||||||||
|
Gross profit
|
83,599
|
|
76,016
|
|
65,283
|
|
10.0
|
|
16.4
|
|
||||||||
|
Gross margin %
|
22.2
|
%
|
|
21.9
|
%
|
|
20.5
|
%
|
0.3
|
|
pp
(a)
|
1.4
|
|
pp
(a)
|
||||
|
SG&A expenses
|
33,451
|
|
33,107
|
|
26,693
|
|
1.0
|
|
24.0
|
|
||||||||
|
Other operating income, net
|
—
|
|
—
|
|
(3,385
|
)
|
N/A
|
|
N/A
|
|
||||||||
|
Operating income
|
50,148
|
|
42,909
|
|
41,975
|
|
16.9
|
|
2.2
|
|
||||||||
|
Operating margin %
|
13.3
|
%
|
|
12.3
|
%
|
13.2
|
%
|
1.0
|
|
pp
|
(0.9
|
)
|
pp
|
|||||
|
Gain on sale of equity method investment
|
—
|
|
11,381
|
|
—
|
|
(100.0
|
)
|
N/A
|
|
||||||||
|
Equity method investment earnings (loss)
|
—
|
|
(348
|
)
|
4,036
|
|
100.0
|
|
(108.6
|
)
|
||||||||
|
Interest expense, net
|
(1,168
|
)
|
(1,184
|
)
|
(1,294
|
)
|
(1.4
|
)
|
(8.5
|
)
|
||||||||
|
Income before income taxes
|
48,980
|
|
|
52,758
|
|
|
44,717
|
|
(7.2
|
)
|
18.0
|
|
||||||
|
Income tax expense
|
11,696
|
|
10,935
|
|
13,533
|
|
7.0
|
|
(19.2
|
)
|
||||||||
|
Effective tax expense rate %
|
23.9
|
%
|
|
20.7
|
%
|
30.3
|
%
|
3.2
|
|
pp
|
(9.6
|
)
|
pp
|
|||||
|
Net income
|
$
|
37,284
|
|
|
$
|
41,823
|
|
|
$
|
31,184
|
|
(10.9
|
)%
|
34.1
|
%
|
|||
|
Net income margin %
|
9.9
|
%
|
|
12.0
|
%
|
9.8
|
%
|
(2.1
|
)
|
pp
|
2.2
|
|
pp
|
|||||
|
|
|
|||||||||||||||||
|
Basic and diluted EPS
|
$
|
2.17
|
|
$
|
2.44
|
|
$
|
1.82
|
|
(11.1
|
)%
|
34.1
|
%
|
|||||
(a)
Percentage points ("pp").
Net sales
2018
to
2017
- Net sales for
2018
were
$376,089
, an increase of
8.2 percent
compared to
2017
, which was the result of increased net sales in both segments. Within the distillery segment, net sales were up
7.9 percent
. Driven by continued strong demand, net sales of premium beverage alcohol products within food grade alcohol increased
5.9 percent
. Industrial alcohol product net sales increased
5.2 percent
, contributing to an overall food grade alcohol net sales increase of
5.7 percent
. Net sales of distillers feed and related co-products and warehouse services revenue both increased and the gains were partially offset by a small decline in the net sales of fuel grade alcohol products. Total ingredient solutions net sales increased
9.9 percent
. This increase was driven by higher net sales across all ingredient solutions product categories, with the largest increases in commodity wheat proteins and specialty wheat proteins.
2017 to 2016
- Net sales for 2017 were $347,448, an increase of 9.2 percent compared to 2016, which was the result of increased net sales in both segments. Within the distillery segment, net sales were up 9.7 percent. Driven by strong demand, net sales of higher margin premium beverage alcohol products increased 18.4 percent, partially offset by a decline in industrial alcohol net sales, which resulted in a net increase in total food grade alcohol net sales of 11.9 percent. Warehouse services revenue related to the storage of barreled whiskey also increased, while lower margin distillers feed and related co-products net sales declined. Within the ingredient solutions segment, net sales were up 6.5 percent. Specialty wheat starches, commodity wheat starches, and specialty wheat proteins increased, while net sales of commodity wheat proteins declined.
Gross profit
2018
to
2017
-
Gross profit for
2018
was
$83,599
, an increase of
10.0 percent
compared to
2017
. The increase was driven by an increase in gross profit in both segments. In the distillery products segment, gross profit grew by
$4,976
, or
7.4 percent
. In the ingredient solutions segment, gross profit grew by
$2,607
, or
28.3 percent
.
20
2017 to 2016 -
Gross profit for 2017 was $76,016, an increase of 16.4 percent compared to 2016. The increase was driven by an increase in gross profit in both segments. In the distillery products segment, gross profit grew by $9,981, or 17.6 percent. In the ingredient solutions segment, gross profit grew by $752, or 8.9 percent.
SG&A expenses
2018
to
2017
-
SG&A expenses for
2018
were
$33,451
, an increase of
1.0 percent
compared to
2017
. The increase in SG&A was primarily due to investments in the MGP brands platform (personnel costs and advertising and promotion).
2017 to 2016 -
SG&A expenses for 2017 were $33,107, an increase of 24.0 percent compared to 2016. The increase in SG&A was primarily due to investments in the MGP brands platform (personnel costs and advertising and promotion) and an increase in incentive compensation.
Operating income
|
Operating income, year versus year
|
Operating income
|
% Increase (Decrease)
|
Operating income
|
% Increase (Decrease)
|
|||||||||||||
|
Operating income for 2017 and 2016
|
$
|
42,909
|
|
$
|
41,975
|
|
|||||||||||
|
|
Increase in gross profit - distillery products segment
(a)
|
4,976
|
|
11.6
|
|
pp
(b)
|
9,981
|
|
23.8
|
|
pp
(b)
|
||||||
|
Increase in gross profit - ingredient solutions segment
(a)
|
2,607
|
|
6.1
|
|
pp
|
752
|
|
1.8
|
|
pp
|
|||||||
|
Change in SG&A expenses
|
(344
|
)
|
(0.8
|
)
|
pp
|
(6,414
|
)
|
(15.3
|
)
|
pp
|
|||||||
|
Change in other operating income, net
|
—
|
|
—
|
|
(3,385
|
)
|
(8.1
|
)
|
pp
|
||||||||
|
Operating income for 2018 and 2017
|
$
|
50,148
|
|
16.9
|
%
|
$
|
42,909
|
|
|
2.2
|
%
|
||||||
(a)
See segment discussion.
(b)
Percentage points ("pp").
2018
to
2017
- Operating income for
2018
increased to
$50,148
from
$42,909
for
2017
, due to gross profit growth in both our distillery products and ingredient solutions segments, partially offset by an increase in SG&A expenses.
2017 to 2016
- Operating income for 2017 increased to $42,909 from $41,975 for 2016, due to gross profit growth in both our distillery products and ingredient solutions segments, partially offset by an increase in SG&A expenses and a decrease in other operating income, net (primarily income recorded related to a legal settlement agreement and a gain on sale of long-lived assets recorded in 2016).
Gain on sale of equity method investment
2018
to
2017
-
There was
no
Gain on sale of equity method investment for
2018
compared to
$11,381
in
2017
, due to the sale of our equity ownership interest in ICP to Pacific Ethanol in that year. As of
December 31, 2018
, the Company's equity method investments were
zero
(Note 4).
2017 to 2016 -
On July 3, 2017, we completed the sale of our 30 percent equity ownership interest in ICP to Pacific Ethanol, consistent with a Merger Agreement entered into on June 26, 2017. Our total transaction proceeds from the ICP sale transaction represented a return of our investment in ICP of $22,832 (net of fees and including additional dividends), which included a gain on sale of equity method investment of $11,381 (before tax) (Note 4).
Equity method investment earnings (loss)
2018
to
2017
- Our equity method investment earnings were
$0
for
2018
, and a loss of
$348
for
2017
. The improvement was due to the sale of our equity ownership interest in ICP (Note 4).
2017 to 2016
- Our equity method investment earnings decreased to a loss of $348 for 2017, from earnings of $4,036 for 2016. The decrease was due to the sale of our 30 percent equity ownership interest in ICP on July 3, 2017, resulting in the gain on sale of equity method investment described above, as well as lower operating results (Note 4).
21
Income tax expense
2018
to
2017
-
Income tax expense for
2018
was
$11,696
, for an effective tax rate for the year of
23.9 percent
. Income tax expense for
2017
was
$10,935
, for an effective tax rate for the year of
20.7 percent
. The principal reasons for the
3.2
percentage point increase in the effective tax rate, year versus year, are the tax impact caused by the re-measurement of our deferred tax assets and liabilities directly into income tax expense from continuing operations at December 31, 2017, the reduction in the tax impact of vested share-based awards
,
the loss of the Domestic Production Activities Deduction as required by the Tax Cuts and Jobs Act (the "Tax Act"), a change in estimate related to the sale of the Company’s equity ownership interest in ICP during 2017, an increase in the Company’s valuation allowance, and lower state income tax credits. These effects were partially offset by the 14 percent rate reduction enacted by the Tax Act, and by the Company not being subject to certain compensation deduction limits as updated by the Tax Act and subsequent guidance issued by the Internal Revenue Service in 2018 (Note 6).
In December 2017, the United States enacted tax reform legislation, the Tax Act, that resulted in significant modifications to existing law. The Tax Act established new tax laws or modified existing tax laws starting in 2018, including, but not limited to, (1) reducing the federal corporate income tax rate to a flat 21 percent rate, (2) eliminating the corporate alternative minimum tax, (3) repealing the domestic production activity deduction, (4) adding a new limitation on deductible interest, (5) changing the limitations on the deductibility of certain executive compensation, and (6) starting in the quarter ended September 30, 2017, changing the bonus depreciation rules to allow full expensing of qualified property. The Securities and Exchange Commission ("SEC") issued guidance, Staff Accounting Bulletin ("SAB") 118, on the financial accounting impact of the Tax Act. Following SAB 118, the Company recorded a provisional discrete net tax benefit in its Consolidated Statements of Income through net income of $3,343 in 2017. As of December 31, 2018, the accounting for the Tax Act is complete, the Company has not recorded a measurement period adjustment, and the discrete net benefit recorded in 2017 is final.
All carrying values for deferred tax assets, liabilities, and corresponding valuation allowances for 2017 and 2018 reflected in the Consolidated Balance Sheets reflect the Tax Act based on the accounting being complete, with no measurement period adjustment required.
2017 to 2016 -
Income tax expense for 2017 was $10,935, for an effective tax rate for the year of 20.7 percent. Income tax expense for 2016 was $13,533, for an effective tax rate for the year of 30.3 percent. The principal reasons for the 9.6 percentage point reduction in the effective tax rate, year versus year, are a provisional re-measurement of our deferred tax assets and liabilities directly into income tax expense based on the Tax Act, the impact of our adoption of ASU 2016-09,
Compensation - Stock Compensation (Topic 718) Improvements to Employee Share-Based Payment Accounting,
and state tax planning (Note 6).
Basic and diluted EPS
|
Change in basic and diluted EPS, year versus year
|
Basic and Diluted EPS
|
% Increase (Decrease)
|
Basic and Diluted EPS
|
% Increase (Decrease)
|
|||||||||||
|
Basic and diluted EPS for 2017 and 2016
|
$
|
2.44
|
|
$
|
1.82
|
|
|||||||||
|
Change in operating income:
|
|||||||||||||||
|
Operations
(a)
|
0.27
|
|
11.1
|
|
pp
(b)
|
0.17
|
|
9.3
|
|
pp
(b)
|
|||||
|
Other operating income, net
(a)
|
—
|
|
—
|
|
pp
|
(0.13
|
)
|
(7.1
|
)
|
pp
|
|||||
|
Gain on sale of equity method investment (Note 4)
(c)
|
(0.44
|
)
|
(18.0
|
)
|
pp
|
0.44
|
|
24.2
|
|
pp
|
|||||
|
Change in equity method investment earnings (loss)
(a)
|
0.01
|
|
0.4
|
|
pp
|
(0.17
|
)
|
(9.3
|
)
|
pp
|
|||||
|
Change in income attributable to participating securities
(d)
|
0.02
|
|
0.8
|
|
pp
|
—
|
|
—
|
|
pp
|
|||||
|
Change in weighted average shares outstanding
(d)
|
(0.01
|
)
|
(0.4
|
)
|
pp
|
(0.02
|
)
|
(1.1
|
)
|
pp
|
|||||
|
Tax: Effect of Tax Act on deferred tax attributes
(e)
|
(0.19
|
)
|
(7.8
|
)
|
pp
|
0.19
|
|
10.4
|
|
pp
|
|||||
|
Tax: Change in discrete items (excluding effect of Tax Act)
|
(0.30
|
)
|
(12.3
|
)
|
pp
|
0.11
|
|
6.0
|
|
pp
|
|||||
|
Tax: Change in effective tax rate (excluding tax items above)
|
0.37
|
|
15.1
|
|
pp
|
0.03
|
|
1.7
|
|
pp
|
|||||
|
Basic and diluted EPS for 2018 and 2017
|
$
|
2.17
|
|
(11.1
|
)%
|
$
|
2.44
|
|
34.1
|
%
|
|||||
|
(a)
|
Items are net of tax based on the effective tax rate for each base year, excluding the effect of the Tax Act and other discrete tax items on the 2017 rate and the adoption of ASU 2016-09 on the 2016 rate.
|
|
(b)
|
Percentage points ("pp").
|
|
(c)
|
Item is net of tax based on the effective tax rate for the transaction.
|
(d)
Income attributable to participating securities changes primarily due to the awarding and vesting of the employee RSUs that receive dividend equivalent payments. Weighted average shares outstanding change primarily due to the vesting of employee RSUs, the granting of Common Stock to directors, our purchase of vested RSUs from employees to pay withholding taxes, and our repurchases of Common Stock.
|
(e)
|
On December 22, 2017, the United States enacted tax reform legislation, the Tax Act, that resulted in significant modifications to existing law. Following guidance in SAB 118, we recorded a provisional discrete net tax benefit resulting from the revaluation of our deferred income taxes in 2017 (Note 6). The accounting for the Tax Act was completed in 2018 and the discrete net benefit recorded in 2017 is no longer provisional.
|
22
2018
to
2017
-
EPS decreased to
$2.17
in
2018
from
$2.44
in
2017
, primarily due to the gain on sale of equity method investment in 2017 (Note 4), partially offset by improved performance from operations.
2017 to 2016 -
EPS increased to $2.44 in 2017 from $1.82 in 2016, primarily due to the gain on sale of equity method investment (Note 4), the effect on tax expense of the new Tax Act legislation (Note 6), improved performance from operations, and the change in the tax effect of the implementation of ASU No. 2016-09,
Compensation—Stock Compensation (Topic 718) Improvements to Employee Share-Based Payment Accounting,
partially offset by a decrease in equity method investment earnings (Note 4), a decline in other operating income, net (the 2016 favorable legal settlement agreement and gain on sale of long-lived assets), and an increase in weighted average shares outstanding.
DISTILLERY PRODUCTS SEGMENT
|
DISTILLERY PRODUCTS NET SALES
|
|||||||||||||||
|
Year Ended December 31,
|
Year-versus-Year Net Sales Change Increase/ (Decrease)
|
||||||||||||||
|
2018
|
2017
|
$ Change
|
% Change
|
||||||||||||
|
Amount
|
Amount
|
||||||||||||||
|
Brown Goods
|
$
|
125,857
|
|
$
|
113,413
|
|
$
|
12,444
|
|
11.0
|
%
|
||||
|
White Goods
|
62,574
|
|
64,585
|
|
(2,011
|
)
|
(3.1
|
)
|
|||||||
|
Premium beverage alcohol
|
188,431
|
|
177,998
|
|
10,433
|
|
5.9
|
|
|||||||
|
Industrial alcohol
|
80,650
|
|
76,636
|
|
4,014
|
|
5.2
|
|
|||||||
|
Food grade alcohol
|
269,081
|
|
254,634
|
|
14,447
|
|
5.7
|
|
|||||||
|
Fuel grade alcohol
|
6,347
|
|
6,368
|
|
(21
|
)
|
(0.3
|
)
|
|||||||
|
Distillers feed and related co-products
|
25,698
|
|
19,332
|
|
6,366
|
|
32.9
|
|
|||||||
|
Warehouse services
|
12,929
|
|
10,674
|
|
2,255
|
|
21.1
|
|
|||||||
|
Total distillery products
|
$
|
314,055
|
|
$
|
291,008
|
|
$
|
23,047
|
|
7.9
|
%
|
||||
|
Change in Year-versus-Year Net Sales Attributed to:
|
|||||||||||||||
|
Total
|
Volume
|
Net Price/Mix
|
|||||||||||||
|
Premium beverage alcohol
|
5.9%
|
(0.9)%
|
6.8%
|
||||||||||||
|
Other Financial Information
|
|||||||||||||||
|
Year Ended December 31,
|
Year-versus-Year Increase/(Decrease)
|
||||||||||||||
|
2018
|
2017
|
Change
|
% Change
|
||||||||||||
|
Gross profit
|
$
|
71,793
|
|
$
|
66,817
|
|
$
|
4,976
|
|
7.4
|
%
|
||||
|
Gross margin %
|
22.9
|
%
|
23.0
|
%
|
(0.1
|
)
|
pp
(a)
|
|
|
||||||
(a)
Percentage points ("pp")
2018
compared to
2017
Total net sales of distillery products increased year versus year by
$23,047
, or
7.9 percent
. Driven by continued strong demand, net sales of premium beverage alcohol products within food grade alcohol increased
5.9 percent
over
2017
, primarily due to an
11.0 percent
increase in brown goods net sales. Industrial alcohol product net sales increased
5.2 percent
, contributing to an overall food grade alcohol net sales increase of
5.7 percent
. Industrial alcohol net sales growth was driven by volume as the average selling price was down due to more difficult market conditions. Net sales of distillers feed and related co-products increased due to a higher average selling price reflecting improved market conditions during the year. An increase in warehouse services revenue was partially offset by a small decline in the net sales of fuel grade alcohol products.
23
Gross profit increased year versus year by
$4,976
, or
7.4 percent
. Gross margin for
2018
remained consistent at
22.9 percent
compared to
23.0 percent
for
2017
. The improvement in gross profit was primarily due to increased net sales of brown goods products, higher gross profit on net sales of distillers feed and related co-products, and an increase in warehouse services revenue. These gains were partially offset primarily by increased input costs and lower gross profit on net sales of white goods, industrial, and fuel grade alcohol products.
|
DISTILLERY PRODUCTS NET SALES
|
||||||||||||||||||
|
Year Ended December 31,
|
Year-versus-Year Net Sales Change Increase/ (Decrease)
|
Year-versus-Year Volume Change
(a)
|
||||||||||||||||
|
2017
|
2016
|
$ Change
|
% Change
|
% Change
|
||||||||||||||
|
Amount
|
Amount
|
|||||||||||||||||
|
Premium beverage alcohol
|
$
|
177,998
|
|
$
|
150,364
|
|
$
|
27,634
|
|
18.4
|
%
|
|||||||
|
Industrial alcohol
|
76,636
|
|
77,290
|
|
(654
|
)
|
(0.8
|
)
|
||||||||||
|
Food grade alcohol
(a)
|
254,634
|
|
227,654
|
|
26,980
|
|
11.9
|
|
||||||||||
|
Fuel grade alcohol
(a)
|
6,368
|
|
7,372
|
|
(1,004
|
)
|
(13.6
|
)
|
||||||||||
|
Distillers feed and related co-products
|
19,332
|
|
21,780
|
|
(2,448
|
)
|
(11.2
|
)
|
||||||||||
|
Warehouse services
|
10,674
|
|
8,437
|
|
2,237
|
|
26.5
|
|
||||||||||
|
Total distillery products
|
$
|
291,008
|
|
$
|
265,243
|
|
$
|
25,765
|
|
9.7
|
%
|
9.2
|
%
|
|||||
|
(a)
Volume change for alcohol products
|
||||||||||||||||||
|
Other Financial Information
|
||||||||||||||||||
|
Year Ended December 31,
|
Year-versus-Year Increase/(Decrease)
|
|||||||||||||||||
|
2017
|
2016
|
Change
|
% Change
|
|||||||||||||||
|
Gross profit
|
$
|
66,817
|
|
$
|
56,836
|
|
$
|
9,981
|
|
17.6
|
%
|
|||||||
|
Gross margin %
|
23.0
|
%
|
21.4
|
%
|
1.6
|
|
pp
(b)
|
|
|
|||||||||
(b)
Percentage points ("pp")
2017 compared to 2016
Driven by strong demand, net sales of higher margin premium beverage alcohol products within food grade alcohol increased 18.4 percent over 2016, while lower margin industrial alcohol product net sales decreased 0.8 percent, resulting in an overall food grade alcohol net sales increase of $26,980, or 11.9 percent. Declines in net sales of distillers feed and related co-products and fuel grade alcohol products were partially offset by an increase in warehouse services revenue, generated by increased storage of customer barrels of whiskey.
Gross profit increased year versus year by $9,981, or 17.6 percent. Gross margin for 2017 increased to 23.0 percent from 21.4 percent for 2016. The improvement in gross profit was primarily due to increased sales of higher margin premium beverage alcohol products, a net decline in input costs, and an increase in warehouse services revenue. These gains were partially offset primarily by lower gross profit on distillers feed and related co-products and industrial alcohol.
24
INGREDIENT SOLUTIONS SEGMENT
|
INGREDIENT SOLUTIONS NET SALES
|
|||||||||||||||
|
Year Ended December 31,
|
Year-versus-Year Net Sales Change Increase/ (Decrease)
|
||||||||||||||
|
2018
|
2017
|
$ Change
|
% Change
|
||||||||||||
|
Amount
|
Amount
|
||||||||||||||
|
Specialty wheat starches
|
$
|
28,594
|
|
$
|
28,092
|
|
$
|
502
|
|
1.8
|
%
|
||||
|
Specialty wheat proteins
|
21,098
|
|
19,458
|
|
1,640
|
|
8.4
|
|
|||||||
|
Commodity wheat starches
|
9,223
|
|
8,288
|
|
935
|
|
11.3
|
|
|||||||
|
Commodity wheat proteins
|
3,119
|
|
602
|
|
2,517
|
|
418.1
|
|
|||||||
|
Total ingredient solutions
|
$
|
62,034
|
|
$
|
56,440
|
|
$
|
5,594
|
|
9.9
|
%
|
||||
|
Change in Year-versus-Year Net Sales Attributed to:
|
|||||||||||||||
|
Total
|
Volume
|
Net Price/Mix
|
|||||||||||||
|
Total ingredient solutions
|
9.9%
|
1.7%
|
8.2%
|
||||||||||||
|
Other Financial Information
|
|||||||||||||||
|
Year Ended December 31,
|
Year-versus-year Increase/Decrease
|
||||||||||||||
|
2018
|
2017
|
Change
|
% Change
|
||||||||||||
|
Gross profit
|
$
|
11,806
|
|
$
|
9,199
|
|
$
|
2,607
|
|
28.3
|
%
|
||||
|
Gross margin %
|
19.0
|
%
|
16.3
|
%
|
2.7
|
|
pp
(a)
|
|
|
||||||
(a)
Percentage points ("pp")
2018
compared to
2017
Total ingredient solutions net sales for
2018
increased by
$5,594
, or
9.9 percent
, compared to
2017
. This increase was driven by higher net sales across all product categories, with the largest increases in commodity wheat proteins and specialty wheat proteins, year versus year. The increase in net sales of wheat proteins was driven by strong demand for the Company's plant-based protein products.
Gross profit increased year versus year by
$2,607
, or
28.3 percent
. Gross margin for
2018
increased to
19.0 percent
from
16.3 percent
for
2017
. The increase in gross profit was primarily due to higher gross profits on specialty wheat proteins and starches and commodity wheat proteins, partially offset by lower gross profits on commodity wheat starches. Overall gross profit growth was aided by improved plant efficiencies relative to the prior year.
25
|
INGREDIENT SOLUTIONS NET SALES
|
|||||||||||||||||
|
Year Ended December 31,
|
Year-versus-Year Net Sales Change Increase/ (Decrease)
|
Year-versus-Year Volume Change
|
|||||||||||||||
|
2017
|
2016
|
$ Change
|
% Change
|
% Change
|
|||||||||||||
|
Amount
|
Amount
|
||||||||||||||||
|
Specialty wheat starches
|
$
|
28,092
|
|
$
|
26,803
|
|
$
|
1,289
|
|
4.8
|
%
|
||||||
|
Specialty wheat proteins
|
19,458
|
|
18,211
|
|
1,247
|
|
6.8
|
|
|||||||||
|
Commodity wheat starches
|
8,288
|
|
7,002
|
|
1,286
|
|
18.4
|
|
|||||||||
|
Commodity wheat proteins
|
602
|
|
1,004
|
|
(402
|
)
|
(40.0
|
)
|
|||||||||
|
Total ingredient solutions
|
$
|
56,440
|
|
$
|
53,020
|
|
$
|
3,420
|
|
6.5
|
%
|
13.3
|
%
|
||||
|
Other Financial Information
|
|||||||||||||||||
|
Year Ended December 31,
|
Year-versus-year Increase/Decrease
|
||||||||||||||||
|
2017
|
2016
|
Change
|
% Change
|
||||||||||||||
|
Gross profit
|
$
|
9,199
|
|
$
|
8,447
|
|
$
|
752
|
|
8.9
|
%
|
||||||
|
Gross margin %
|
16.3
|
%
|
15.9
|
%
|
0.4
|
|
pp
(a)
|
|
|
||||||||
(a)
Percentage points ("pp")
2017 compared to 2016
Total ingredient solutions net sales for 2017 increased by $3,420, or 6.5 percent, compared to 2016. This increase was primarily driven by increased net sales of specialty wheat starches, commodity wheat starches, and specialty wheat proteins, partially offset by decreased net sales of commodity wheat proteins, year versus year.
Gross profit increased year versus year by $752, or 8.9 percent. Gross margin for 2017 increased to 16.3 percent from 15.9 percent for 2016. The improvement in gross profit was primarily due to a net decline in input costs, partially offset by a lower average selling price.
26
CASH FLOW, FINANCIAL CONDITION AND LIQUIDITY
We believe our financial condition continues to be of high quality, as evidenced by our ability to generate adequate cash from operations while having ready access to capital at competitive rates.
Operating cash flow and debt through our Credit Agreement and Note Purchase Agreement (Note 5) provide the primary sources of cash to fund operating needs and capital expenditures. These same sources of cash are used to fund shareholder dividends and other discretionary uses. Going forward, we expect to use cash to implement our invest to grow strategy, particularly in the distillery products segment. Our overall liquidity reflects our strong business results and an effective cash management strategy that takes into account liquidity management, economic factors, and tax considerations. We expect our sources of cash, including our Credit Agreement and Note Purchase Agreement, to be adequate to provide for budgeted capital expenditures and anticipated operating requirements for the foreseeable future.
|
Cash Flow Summary
|
Year Ended December 31,
|
Changes, Year versus Year-Increase / (Decrease)
|
||||||||||||||||||
|
2018
|
2017
|
2016
|
2018 vs. 2017
|
2017 vs. 2016
|
||||||||||||||||
|
Cash provided by operating activities:
|
||||||||||||||||||||
|
Net income, after giving effect to adjustments to reconcile net income to net cash provided by operating activities
|
$
|
53,410
|
|
$
|
48,444
|
|
$
|
43,682
|
|
$
|
4,966
|
|
$
|
4,762
|
|
|||||
|
Receivables, net
|
(4,450
|
)
|
(8,262
|
)
|
4,585
|
|
3,812
|
|
(12,847
|
)
|
||||||||||
|
Inventory
|
(15,620
|
)
|
(14,291
|
)
|
(20,106
|
)
|
(1,329
|
)
|
5,815
|
|
||||||||||
|
Prepaid expenses
|
862
|
|
(498
|
)
|
(622
|
)
|
1,360
|
|
124
|
|
||||||||||
|
Accrued expenses
|
551
|
|
2,278
|
|
(1,407
|
)
|
(1,727
|
)
|
3,685
|
|
||||||||||
|
Income taxes payable/refundable
|
1,268
|
|
725
|
|
(3,390
|
)
|
543
|
|
4,115
|
|
||||||||||
|
Accounts payable and accounts payable to affiliate, net
|
(2,542
|
)
|
6,191
|
|
(2,120
|
)
|
(8,733
|
)
|
8,311
|
|
||||||||||
|
Other, net
|
2
|
|
(1,116
|
)
|
(901
|
)
|
1,118
|
|
(215
|
)
|
||||||||||
|
Total
|
$
|
33,481
|
|
$
|
33,471
|
|
$
|
19,721
|
|
$
|
10
|
|
$
|
13,750
|
|
|||||
|
Cash provided by (used in) investing activities:
|
||||||||||||||||||||
|
Additions to property, plant, and equipment
|
(31,046
|
)
|
(21,055
|
)
|
(17,922
|
)
|
(9,991
|
)
|
(3,133
|
)
|
||||||||||
|
Divestiture of equity method investment, net
|
—
|
|
22,832
|
|
351
|
|
(22,832
|
)
|
22,481
|
|
||||||||||
|
Proceeds from sale of property and other
|
—
|
|
—
|
|
1,209
|
|
—
|
|
(1,209
|
)
|
||||||||||
|
Acquisition of George Remus®
|
—
|
|
—
|
|
(1,551
|
)
|
—
|
|
1,551
|
|
||||||||||
|
Other
|
—
|
|
—
|
|
230
|
|
—
|
|
(230
|
)
|
||||||||||
|
Total
|
$
|
(31,046
|
)
|
$
|
1,777
|
|
$
|
(17,683
|
)
|
$
|
(32,823
|
)
|
$
|
19,460
|
|
|||||
|
Cash used in financing activities:
|
||||||||||||||||||||
|
Payment of dividends and dividend equivalents
|
(5,500
|
)
|
(17,380
|
)
|
(2,066
|
)
|
11,880
|
|
(15,314
|
)
|
||||||||||
|
Purchase of treasury stock for tax withholding on share-based compensation
|
(2,324
|
)
|
(4,663
|
)
|
(1,518
|
)
|
2,339
|
|
(3,145
|
)
|
||||||||||
|
Proceeds (payments) on debt:
|
||||||||||||||||||||
|
Principal payments on long-term debt
|
(372
|
)
|
(358
|
)
|
(2,346
|
)
|
(14
|
)
|
1,988
|
|
||||||||||
|
Proceeds on long-term debt
|
—
|
|
20,000
|
|
—
|
|
(20,000
|
)
|
20,000
|
|
||||||||||
|
Proceeds from credit agreement - revolver
|
28,966
|
|
25,930
|
|
27,184
|
|
3,036
|
|
(1,254
|
)
|
||||||||||
|
Payments on credit agreement - revolver
|
(21,264
|
)
|
(56,885
|
)
|
(22,356
|
)
|
35,621
|
|
(34,529
|
)
|
||||||||||
|
Proceeds (payments) on debt, net
|
7,330
|
|
(11,313
|
)
|
2,482
|
|
18,643
|
|
(13,795
|
)
|
||||||||||
|
Other
|
—
|
|
(377
|
)
|
(114
|
)
|
377
|
|
(263
|
)
|
||||||||||
|
Total
|
$
|
(494
|
)
|
$
|
(33,733
|
)
|
$
|
(1,216
|
)
|
$
|
33,239
|
|
$
|
(32,517
|
)
|
|||||
|
Increase in cash and cash equivalents
|
$
|
1,941
|
|
$
|
1,515
|
|
$
|
822
|
|
$
|
426
|
|
$
|
693
|
|
|||||
27
Changes, 2018 versus 2017.
Cash increased
$1,941
in 2018 compared to an increase of
$1,515
in 2017, for a net increase in cash of
$426
, year versus year.
Cash provided by operating activities for year ended
December 31, 2018
was
$33,481
, which was consistent with cash provided by operating activities of
$33,471
for year ended
December 31, 2017
. Increases in cash flows, year versus year, were mainly due to the change in net income, after giving effect to adjustments to reconcile net income to net cash provided by operating activities of
$4,966
; the change in receivables, net, of
$3,812
, primarily due to the relative timing of net sales in the comparative periods; and the change in prepaid expenses of
$1,360
, primarily due to the timing of payments related to future services. Increases in cash flows were offset by cash flow decreases, year versus year, mainly due to the change in accounts payable and accounts payable to affiliate, net, of
$8,733
, related to the timing of operating expense cash disbursements, as well as the normalization of the timing of cash disbursements that were related to operating expenses associated with the relative timing of net sales in the comparative periods; the change in accrued expenses of
$1,727
, reflecting payment of incentive compensation; and the change in inventory of
$1,329
, primarily due to the change in inventory categories including finished goods, and raw materials.
Cash used in investing activities for year ended
December 31, 2018
was
$31,046
, compared to cash provided by investing activities of
$1,777
for year ended
December 31, 2017
, resulting in decreased cash flows, year versus year, of
$32,823
. Cash flow decreases were mainly due to the proceeds from divestiture of equity method investment for year ended
December 31, 2017
of
$22,832
, as well as an increase in additions to property, plant, and equipment in
2018
of
$9,991
(see Capital Spending).
Cash used in financing activities for year ended
December 31, 2018
was
$494
, compared to cash used in financing activities of
$33,733
for year ended
December 31, 2017
, reflecting increased cash flows, year versus year, of
$33,239
. Increases in cash flows were mainly due to higher proceeds from debt of
$18,643
(see Long-Term and Short-Term Debt), a decrease in dividends and dividend equivalents of
$11,880
(see Dividends and Dividend Equivalents), and decreased purchases of treasury stock for tax withholding on share-based compensation of
$2,339
(see Treasury Purchases).
Changes, 2017 versus 2016.
Cash increased $1,515 in 2017 compared to an increase of $822 in 2016, for a net increase in cash of $693, year versus year.
Cash provided by operating activities for year ended December 31, 2017 was $33,471, compared to cash provided by operating activities of $19,721 for year ended December 31, 2016, resulting in increased cash flows, year versus year, of $13,750. Increases in cash flows were mainly from the change in accounts payable and accounts payable to affiliate, net, of $8,311, primarily due to the timing of cash disbursements related to operating expenses associated with increased net sales in December 2017 compared to December 2016 (the accounts payable to affiliate, net, decreased to zero when we sold our equity ownership interest in ICP on July 3, 2017 as detailed in Note 4); the change in inventory of $5,815, primarily due to inventory categories remaining flat or decreasing in 2017, except barreled distillate inventory for aging, which increased $14,785; the change in net income, after giving effect to adjustments to reconcile net income to net cash provided by operating activities of $4,762; the change in refundable income taxes of $4,115, primarily due to the use of certain tax attributes, including net operating losses and the timing of estimated tax payments; and the change in accrued expenses of $3,685, primarily due to increases in incentive compensation and personnel costs. Increases in cash flows were partially offset by cash flow decreases, mainly related to the change in receivables, net, of $12,847, primarily due to higher net sales in December 2017 compared to December 2016.
Cash provided by investing activities for year ended December 31, 2017 was $1,777, compared to cash used in investing activities of $17,683 for year ended December 31, 2016, resulting in increased cash flows, year versus year, of $19,460. Increases in cash flows were mainly from the sale of our equity ownership interest in ICP during 2017, which resulted in a return of equity method investment of $22,832 (Note 4), as well as the absence of cash used for the acquisition of George Remus
®
, year versus year, of $1,551. Increases in cash flows were partially offset by cash flow decreases, mainly related to an increase in additions to property, plant, and equipment of $3,133, as well as the absence of proceeds from the sale of property and other and the return of our DMI joint venture investment, year versus year, of $1,560 (Note 4). The increase in additions to property, plant, and equipment was primarily due to capital expenditures related to the warehouse expansion program (see Capital Spending).
28
Cash used in financing activities for year ended December 31, 2017 was $33,733, compared to cash used in financing activities of $1,216 for year ended December 31, 2016, resulting in decreased cash flows, year versus year, of $32,517. Decreases in cash flows were mainly from an increase in payments on our credit agreement - revolver of $34,529 (see Long-Term and Short-Term Debt), an increase in payment of dividends and dividend equivalents of $15,314 (see Dividends and Dividend Equivalents), an increase in purchase of treasury stock of $3,145 (see Treasury Purchases), and a decrease in proceeds from the credit agreement - revolver of $1,254. Decreases in cash flows were partially offset by cash flow increases from proceeds on long-term debt of $20,000 and the change in principal payments on long-term debt of $1,988 (see Long-Term and Short-Term Debt).
Capital Spending.
We manage capital spending to support our business growth plans. Investments in plant, property and equipment were
$31,046
,
$21,055
, and
$17,922
, respectively, for years ended
December 31, 2018
,
2017
, and
2016
. Adjusted for the change in capital expenditures in accounts payable for years ended
December 31, 2018
,
2017
, and
2016
of
($2,133)
, $158, and $2,580, respectively, total capital expenditures were
$28,913
, $21,213, and $20,502, respectively. We expect approximately
$23,000
in capital expenditures in 2019 for facility improvement and expansion (including warehouse expansion), facility sustenance projects, and environmental health and safety projects.
As part of our strategic plan to support the growth of the American Whiskey category, we previously announced a $33,800 warehouse expansion project. Based on the continued strong growth in the American Whiskey category and demand for our products, and as announced in 2018, we expanded the scope of the project and added an incremental investment of approximately $18,000, bringing our total warehouse expansion project investment to approximately
$51,800
. As of
December 31, 2018
, we had incurred approximately
$44,000
of the total investment. The estimated project completion date is by the end of calendar year 2020.
Treasury Purchases.
80,343
RSUs vested and converted to common shares during year ended
December 31, 2018
, of which we withheld and purchased for treasury
27,214
shares valued at
$2,324
to cover payment of associated withholding taxes.
203,000 RSUs vested and converted to common shares during year ended
December 31, 2017
, of which we withheld and purchased for treasury 74,132 shares valued at $4,663 to cover payment of associated withholding taxes.
We purchased restricted stock during 2016 from employees to cover associated withholding taxes on vestings of share-based awards. Total purchases added 40,870 shares valued at $1,518 to treasury.
Long-Term and Short-Term Debt.
We maintain debt levels we consider appropriate after evaluating a number of factors, including cash flow expectations, cash requirements for ongoing operations, investment and financing plans (including brand development, share repurchases, and Board-approved dividends) and the overall cost of capital. Total debt was
$32,014
(net of unamortized loan fees of
$580
) at
December 31, 2018
and
$24,554
(net of unamortized loan fees of
$710
) at
December 31, 2017
. During
2018
,
2017
, and
2016
, we had net borrowings / (payments) on our Credit Agreement of
$7,702
,
$(30,955)
, and
$4,828
, and net borrowings / (payments) on our long-term debt of
$(372)
,
$19,642
, and
$(2,346)
, respectively. Net borrowings / (payments) on all debt for
2018
,
2017
, and
2016
were
$7,330
,
$(11,313)
, and
$2,482
, respectively (Note 5).
29
Dividends and Dividend Equivalents
|
Dividend and Dividend Equivalent Information (per Share and Unit)
|
||||||||||||||||||||||||
|
Declaration date
|
Record date
|
Payment date
|
Declared
|
Paid
|
Dividend payment
|
Dividend equivalent payment
(a)(b)
|
Total payment
(b)
|
|||||||||||||||||
|
2018
|
|
|||||||||||||||||||||||
|
February 21
|
March 9
|
March 23
|
$
|
0.08
|
|
$
|
0.08
|
|
$
|
1,348
|
|
$
|
27
|
|
$
|
1,375
|
|
|||||||
|
April 30
|
May 16
|
June 1
|
0.08
|
|
0.08
|
|
1,348
|
|
27
|
|
1,375
|
|
||||||||||||
|
July 31
|
August 16
|
August 31
|
0.08
|
|
0.08
|
|
1,348
|
|
27
|
|
1,375
|
|
||||||||||||
|
October 30
|
November 15
|
November 30
|
0.08
|
|
0.08
|
|
1,349
|
|
26
|
|
1,375
|
|
||||||||||||
|
$
|
0.32
|
|
$
|
0.32
|
|
$
|
5,393
|
|
$
|
107
|
|
$
|
5,500
|
|
||||||||||
|
2017
|
||||||||||||||||||||||||
|
February 15
|
March 1
|
March 24
|
$
|
0.04
|
|
$
|
0.04
|
|
$
|
668
|
|
$
|
20
|
|
$
|
688
|
|
|||||||
|
May 2
|
May 15
|
June 9
|
0.04
|
|
0.04
|
|
668
|
|
20
|
|
688
|
|
||||||||||||
|
August 1
|
August 18
|
September 8
|
0.85
|
|
0.85
|
|
14,215
|
|
413
|
|
14,628
|
|
||||||||||||
|
August 1
|
August 18
|
September 11
|
0.04
|
|
0.04
|
|
669
|
|
19
|
|
688
|
|
||||||||||||
|
October 31
|
November 14
|
December 8
|
0.04
|
|
0.04
|
|
669
|
|
19
|
|
688
|
|
||||||||||||
|
$
|
1.01
|
|
$
|
1.01
|
|
$
|
16,889
|
|
$
|
491
|
|
$
|
17,380
|
|
||||||||||
|
2016
|
||||||||||||||||||||||||
|
March 7
|
March 21
|
April 14
|
$
|
0.08
|
|
$
|
0.08
|
|
$
|
1,335
|
|
$
|
43
|
|
$
|
1,378
|
|
|||||||
|
August 1
|
August 15
|
September 8
|
0.02
|
|
0.02
|
|
334
|
|
10
|
|
344
|
|
||||||||||||
|
October 31
|
November 14
|
December 8
|
0.02
|
|
0.02
|
|
333
|
|
11
|
|
344
|
|
||||||||||||
|
$
|
0.12
|
|
$
|
0.12
|
|
$
|
2,002
|
|
$
|
64
|
|
$
|
2,066
|
|
||||||||||
(a)
Dividend equivalent payments on unvested participating securities (see Note 9).
(b)
Includes estimated forfeitures.
On February 25, 2019, the Board of Directors declared a quarterly dividend payable to stockholders of record as of March 13, 2019, of our Common Stock and a dividend equivalent payable to holders of certain RSUs as of March 13, 2019, of $0.10 per share and per unit. The dividend payment and dividend equivalent payment will occur on March 29, 2019.
Financial Condition and Liquidity
Our principal uses of cash in the ordinary course of business are for input costs used in our production processes, salaries, capital expenditures, and investments supporting our strategic plan, such as the aging of barreled distillate. As part of our strategy, as demand grows for American whiskeys, in both the United States and global markets, we are building our inventories of aged premium whiskeys to fully participate in this growth (see "Barreled distillate (bourbon and whiskey)" in Note 2). Generally, during periods when commodities prices are rising, our operations require increased use of cash to support inventory levels.
Our principal sources of cash are product sales and borrowing on our Credit Agreement and Note Purchase Agreement. Under our Credit Agreement and Note Purchase Agreement, we must meet certain financial covenants and restrictions, and at
December 31, 2018
, we met those covenants and restrictions.
At
December 31, 2018
, our current assets exceeded our current liabilities by
$117,160
, largely due to our inventories, at cost, of
$108,769
. At
December 31, 2018
our cash balance was
$5,025
and we have used our Credit Agreement and Note Purchase Agreement for liquidity purposes, with
$139,000
remaining for additional borrowings. We anticipate being able to support our short-term liquidity and operating needs largely through cash generated from operations. We regularly assesses our cash needs and the available sources to fund these needs. We utilize short-term and long-term debt to fund discretionary items, such as capital investments and dividend payments. In addition, we have strong operating results such that financial institutions should provide sufficient credit funding to meet short-term financing requirements, if needed.
30
OFF BALANCE SHEET OBLIGATIONS
Operating Leases.
We lease railcars and other assets under various operating leases. For railcar leases, we are generally required to pay all service costs associated with the railcars. Rental payments include minimum rentals, and rental expenses with terms longer than one month were
$2,081
,
$2,372
, and
$2,561
for
2018
,
2017
, and
2016
, respectively. Annual commitments under non-cancelable operating leases total
$6,897
for the next five years ending December 31, 2023 and an additional
$55
thereafter.
Industrial Revenue Bonds.
On October 24, 2018, we closed an industrial revenue bond transaction with the City of Williamstown, Kentucky (the "City") in order to receive a 30-year real property tax abatement on our renovated and newly-constructed warehouse buildings near the City. Pursuant to this transaction, the City issued a principal amount of $10,000 of its industrial revenue bonds to us and then used the proceeds to purchase the land and warehouse from us. The City then leased the facilities back to us under a capital lease, the terms of which provide for the payment of basic rent in an amount sufficient to pay principal and interest on the bonds. Our obligation to pay rent under the lease is in the same amount and due on the same date as the City’s obligation to pay debt service on the bonds which we hold. The lease permits us to present the bonds at any time for cancellation, upon which our obligation to pay basic rent would be canceled. The bonds' maturity date is 2047, at which time the facilities will revert to us without costs. If we were to present the bonds for cancellation prior to maturity, a nominal fee would be incurred.
We recorded the land and buildings as assets in property, plant, and equipment, net, on our Consolidated Balance Sheets. Because we own all outstanding bonds, have a legal right to set-off, and intend to set-off the corresponding lease and interest payment, we have netted the capital lease obligation with the bond asset. No amount for our obligation under the capital lease is reflected on our Consolidated Balance Sheet, nor do we reflect an amount for the corresponding industrial revenue bond asset (Note 8).
Contractual Obligations
The following table provides information on the amounts and payments of our contractual obligations at
December 31, 2018
:
|
Payments due by period
|
|||||||||||||||||||
|
Total
|
2019
|
2020-2021
|
2022-2023
|
After 2023
|
|||||||||||||||
|
Long term debt
|
$
|
32,594
|
|
$
|
386
|
|
$
|
2,416
|
|
$
|
17,792
|
|
$
|
12,000
|
|
||||
|
Interest on Long term debt
|
4,180
|
|
759
|
|
1,466
|
|
1,108
|
|
847
|
|
|||||||||
|
Operating leases
|
6,952
|
|
2,224
|
|
3,215
|
|
1,458
|
|
55
|
|
|||||||||
|
Post-employment benefit plan obligations
|
3,049
|
|
467
|
|
877
|
|
778
|
|
927
|
|
|||||||||
|
Purchase commitments
|
133,029
|
|
129,734
|
|
(a)
|
3,251
|
|
43
|
|
1
|
|
||||||||
|
Total
|
$
|
179,804
|
|
$
|
133,570
|
|
$
|
11,225
|
|
$
|
21,179
|
|
$
|
13,830
|
|
||||
(a)
Includes open purchase order commitments related to raw materials and packaging used in the ordinary course of business of
$121,664
.
NEW ACCOUNTING PRONOUNCEMENTS
For information with respect to recent accounting pronouncements and the impact of these pronouncements on our consolidated financial statements, see Note 1.
31
ITEM 7A. QUANTITATIVE AND QUALITATIVE DISCLOSURES ABOUT MARKET RISK
We are exposed to commodity price and interest rate market risks. We monitor and manage these exposures as part of our overall risk management program. Our risk management program focuses on the unpredictability of financial markets and seeks to reduce the potentially adverse effects that the volatility of these markets may have on our operating results.
Commodity Costs.
Certain commodities we use in our production process, or input costs, expose us to market price risk due to volatility in the prices for those commodities. Through our grain supply contracts for our Atchison and Lawrenceburg facilities, our wheat flour supply contract for our Atchison facility, and our natural gas contracts for both facilities, we purchase grain, wheat flour, and natural gas, respectively, for delivery from one to 24 months into the future at negotiated prices. We have determined that the firm commitments to purchase grain, wheat flour, and natural gas under the terms of our supply contracts meet the normal purchases and sales exception as defined under Accounting Standards Codification ("ASC") 815,
Derivatives and Hedging
, because the quantities involved are for amounts to be consumed within the normal expected production process.
Interest Rate Exposures.
Our Credit Agreement and Note Purchase Agreement (Note 5) expose us to market risks arising from adverse changes in interest rates. Established procedures and internal processes govern the management of this market risk.
Increases in market interest rates would cause interest expense to increase and earnings before income taxes to decrease. The change in interest expense and earnings before income taxes would be dependent upon the weighted average outstanding borrowings during the reporting period following an increase in market interest rates. Based on weighted average outstanding variable-rate borrowings at
December 31, 2018
, a 100 basis point increase over the non-default rates actually in effect at such date would increase our interest expense on an annualized basis by
$268
. Based on weighted average outstanding fixed-rate borrowings at
December 31, 2018
, a 100 basis point increase in market rates would result in a decrease in the fair value of our outstanding fixed-rate debt of
$996
, and a 100 basis point decrease in market rates would result in an increase in the fair value of our outstanding fixed-rate debt of
$1,060
.
32
ITEM 8. FINANCIAL STATEMENTS AND SUPPLEMENTARY DATA
MANAGEMENT’S REPORT ON INTERNAL CONTROL OVER FINANCIAL REPORTING
The management of MGP Ingredients, Inc. (the "Company") is responsible for establishing and maintaining adequate internal control over financial reporting, as such term is defined in Exchange Act Rules 13a-15(f). Internal control over financial reporting is a process designed to provide reasonable assurance regarding the reliability of financial reporting and the preparation of financial statements for external purposes in accordance with generally accepted accounting principles. Internal control over financial reporting includes those policies and procedures that (1) pertain to the maintenance of records that, in reasonable detail, accurately and fairly reflect the transactions and dispositions of our assets; (2) provide reasonable assurance that transactions are recorded as necessary to permit preparation of financial statements in accordance with generally accepted accounting principles, and that our receipts and expenditures are being made only in accordance with authorizations of our management and directors; and (3) provide reasonable assurance regarding prevention or timely detection of unauthorized acquisition, use, or disposition of our assets that could have a material effect on the financial statements.
Because of its inherent limitations, our internal control over financial reporting may not prevent or detect misstatements. A control system, no matter how well conceived and operated, can provide only reasonable, not absolute, assurance that the objectives of the control system are met. Because of the inherent limitations in all control systems, no evaluation of controls can provide absolute assurance that all control issues and instances of fraud, if any, have been detected. Also, projections of any evaluation of effectiveness to future periods are subject to the risk that controls may become inadequate because of changes in conditions, or that the degree of compliance with the policies and procedures may deteriorate.
With the participation of the Chief Executive Officer and Chief Financial Officer, our management conducted an evaluation of the effectiveness of our internal control over financial reporting based on the criteria established in
Internal Control - Integrated Framework (2013)
issued by the Committee of Sponsoring Organizations ("COSO") of the Treadway Commission. As a result of this assessment, management has concluded that the Company’s internal control over financial reporting as of
December 31, 2018
was effective.
KPMG, LLP, the independent registered public accounting firm that audited the Company's financial statements contained herein, has issued an audit report on the Company's internal control over financial reporting as of
December 31, 2018
. The combined report on the consolidated financial statements of MGP Ingredients, Inc. and subsidiaries and audit report as to the effectiveness of internal control over financial reporting is included in Item 8 of this Form 10-K.
33
Report of Independent Registered Public Accounting Firm
To the Stockholders and Board of Directors
MGP Ingredients, Inc.:
Opinions on the Consolidated Financial Statements and Internal Control Over Financial Reporting
We have audited the accompanying consolidated balance sheets of MGP Ingredients, Inc. and subsidiaries (the Company) as of December 31, 2018 and 2017, the related consolidated statements of income, comprehensive income, changes in stockholders’ equity, and cash flows for each of the years in the three-year period ended December 31, 2018, and the related notes (collectively, the consolidated financial statements). We also have audited the Company’s internal control over financial reporting as of December 31, 2018, based on criteria established in
Internal Control - Integrated Framework (2013)
issued by the Committee of Sponsoring Organizations of the Treadway Commission.
In our opinion, the consolidated financial statements referred to above present fairly, in all material respects, the financial position of the Company as of December 31, 2018 and 2017, and the results of its operations and its cash flows for each of the years in the three-year period ended December 31, 2018, in conformity with U.S. generally accepted accounting principles. Also in our opinion, the Company maintained, in all material respects, effective internal control over financial reporting as of December 31, 2018 based on criteria established in
Internal Control - Integrated Framework (2013)
issued by the Committee of Sponsoring Organizations of the Treadway Commission.
Basis for Opinions
The Company’s management is responsible for these consolidated financial statements, for maintaining effective internal control over financial reporting, and for its assessment of the effectiveness of internal control over financial reporting, included in the accompanying Management’s Report on Internal Control Over Financial Reporting. Our responsibility is to express an opinion on the Company’s consolidated financial statements and an opinion on the Company’s internal control over financial reporting based on our audits. We are a public accounting firm registered with the Public Company Accounting Oversight Board (United States) (PCAOB) and are required to be independent with respect to the Company in accordance with the U.S. federal securities laws and the applicable rules and regulations of the Securities and Exchange Commission and the PCAOB.
We conducted our audits in accordance with the standards of the PCAOB. Those standards require that we plan and perform the audits to obtain reasonable assurance about whether the consolidated financial statements are free of material misstatement, whether due to error or fraud, and whether effective internal control over financial reporting was maintained in all material respects.
Our audits of the consolidated financial statements included performing procedures to assess the risks of material misstatement of the consolidated financial statements, whether due to error or fraud, and performing procedures that respond to those risks. Such procedures included examining, on a test basis, evidence regarding the amounts and disclosures in the consolidated financial statements. Our audits also included evaluating the accounting principles used and significant estimates made by management, as well as evaluating the overall presentation of the consolidated financial statements. Our audit of internal control over financial reporting included obtaining an understanding of internal control over financial reporting, assessing the risk that a material weakness exists, and testing and evaluating the design and operating effectiveness of internal control based on the assessed risk. Our audits also included performing such other procedures as we considered necessary in the circumstances. We believe that our audits provide a reasonable basis for our opinions.
Definition and Limitations of Internal Control Over Financial Reporting
A company’s internal control over financial reporting is a process designed to provide reasonable assurance regarding the reliability of financial reporting and the preparation of financial statements for external purposes in accordance with generally accepted accounting principles. A company’s internal control over financial reporting includes those policies and procedures that (1) pertain to the maintenance of records that, in reasonable detail, accurately and fairly reflect the transactions and dispositions of the assets of the company; (2) provide reasonable assurance that transactions are recorded as necessary to permit preparation of financial statements in accordance with generally accepted accounting principles, and that receipts and expenditures of the company are being made only in accordance with authorizations of management and directors of the company; and (3) provide reasonable assurance regarding prevention or timely detection of unauthorized acquisition, use, or disposition of the company’s assets that could have a material effect on the financial statements.
34
Because of its inherent limitations, internal control over financial reporting may not prevent or detect misstatements. Also, projections of any evaluation of effectiveness to future periods are subject to the risk that controls may become inadequate because of changes in conditions, or that the degree of compliance with the policies or procedures may deteriorate.
/s/ KPMG LLP
We have served as the Company’s auditor since 2008.
Kansas City, Missouri
February 27, 2019
35
MGP INGREDIENTS, INC.
CONSOLIDATED STATEMENTS OF INCOME
(Dollars in thousands, except per share amounts)
|
|
Year Ended December 31,
|
|||||||||||
|
|
2018
|
2017
|
2016
|
|||||||||
|
Net sales
|
$
|
376,089
|
|
$
|
347,448
|
|
$
|
318,263
|
|
|||
|
Cost of sales
(a)
|
292,490
|
|
271,432
|
|
252,980
|
|
||||||
|
Gross profit
|
83,599
|
|
76,016
|
|
65,283
|
|
||||||
|
Selling, general, and administrative expenses
|
33,451
|
|
33,107
|
|
26,693
|
|
||||||
|
Other operating income, net
|
—
|
|
—
|
|
(3,385
|
)
|
||||||
|
Operating income
|
50,148
|
|
42,909
|
|
41,975
|
|
||||||
|
Gain on sale of equity method investment (Note 4)
|
—
|
|
11,381
|
|
—
|
|
||||||
|
Equity method investment earnings (loss) (Note 4)
|
—
|
|
(348
|
)
|
4,036
|
|
||||||
|
Interest expense, net
|
(1,168
|
)
|
(1,184
|
)
|
(1,294
|
)
|
||||||
|
Income before income taxes
|
48,980
|
|
52,758
|
|
44,717
|
|
||||||
|
Income tax expense (Note 6)
|
11,696
|
|
10,935
|
|
13,533
|
|
||||||
|
Net income
|
37,284
|
|
41,823
|
|
31,184
|
|
||||||
|
|
|
|
||||||||||
|
Income attributable to participating securities
|
708
|
|
996
|
|
954
|
|
||||||
|
Net income attributable to common shareholders and used in Earnings Per Share calculation (Note 7)
|
$
|
36,576
|
|
$
|
40,827
|
|
$
|
30,230
|
|
|||
|
|
|
|
||||||||||
|
Share information
|
|
|
||||||||||
|
Basic and diluted weighted average common shares
|
16,866,176
|
|
16,746,731
|
|
16,643,811
|
|
||||||
|
Basic and diluted EPS
|
$
|
2.17
|
|
$
|
2.44
|
|
$
|
1.82
|
|
|||
|
|
|
|
||||||||||
|
Dividends and dividend equivalents per common share
|
$
|
0.32
|
|
$
|
1.01
|
|
$
|
0.12
|
|
|||
|
(a)
|
Includes related party purchases of
$0
, and
$18,425
,
$29,596
for the years ended
December 31, 2018
,
2017
, and
2016
, respectively.
|
See Accompanying Notes to Consolidated Financial Statements
36
MGP INGREDIENTS, INC.
CONSOLIDATED STATEMENTS OF COMPREHENSIVE INCOME
(Dollars in thousands)
|
Year Ended December 31,
|
||||||||||||
|
|
2018
|
2017
|
2016
|
|||||||||
|
Net income
|
$
|
37,284
|
|
$
|
41,823
|
|
$
|
31,184
|
|
|||
|
Other comprehensive income (loss), net of tax:
|
||||||||||||
|
Company sponsored benefit plan:
|
||||||||||||
|
Change in post-employment benefits
|
147
|
|
66
|
|
134
|
|
||||||
|
Other
|
—
|
|
(4
|
)
|
(7
|
)
|
||||||
|
Other comprehensive income
|
147
|
|
|
62
|
|
127
|
|
|||||
|
Comprehensive income
|
$
|
37,431
|
|
|
$
|
41,885
|
|
$
|
31,311
|
|
||
See Accompanying Notes to Consolidated Financial Statements
37
MGP INGREDIENTS, INC.
CONSOLIDATED BALANCE SHEETS
(Dollars in thousands, except par value)
|
December 31,
|
||||||||
|
|
2018
|
2017
|
||||||
|
Current Assets
|
|
|||||||
|
Cash and cash equivalents
|
$
|
5,025
|
|
$
|
3,084
|
|
||
|
Receivables (less allowance for doubtful accounts at December 31, 2018 and 2017 - $24
|
38,797
|
|
34,347
|
|
||||
|
Inventory
|
108,769
|
|
93,149
|
|
||||
|
Prepaid expenses
|
1,320
|
|
2,182
|
|
||||
|
Refundable income taxes
|
712
|
|
1,980
|
|
||||
|
Total current assets
|
154,623
|
|
134,742
|
|
||||
|
Property, plant, and equipment, net
|
120,788
|
|
103,051
|
|
||||
|
Other assets
|
2,481
|
|
2,535
|
|
||||
|
Total assets
|
$
|
277,892
|
|
$
|
240,328
|
|
||
|
Current Liabilities
|
||||||||
|
Current maturities of long-term debt
|
$
|
386
|
|
$
|
372
|
|
||
|
Accounts payable
|
25,363
|
|
30,037
|
|
||||
|
Accrued expenses
|
11,714
|
|
11,171
|
|
||||
|
Total current liabilities
|
37,463
|
|
41,580
|
|
||||
|
Long-term debt, less current maturities
|
21,040
|
|
21,407
|
|
||||
|
Credit agreement - revolver
|
10,588
|
|
2,775
|
|
||||
|
Deferred credits
|
1,565
|
|
2,151
|
|
||||
|
Accrued retirement, health, and life insurance benefits
|
2,595
|
|
3,133
|
|
||||
|
Other noncurrent liabilities
|
1,523
|
|
540
|
|
||||
|
Deferred income taxes
|
1,677
|
|
12
|
|
||||
|
Total liabilities
|
76,451
|
|
71,598
|
|
||||
|
Commitments and Contingencies – Note 8
|
|
|
|
|
||||
|
Stockholders’ Equity
|
||||||||
|
Capital stock
|
||||||||
|
Preferred, 5% non-cumulative; $10 par value; authorized 1,000 shares; issued and outstanding 437 shares
|
4
|
|
4
|
|
||||
|
Common stock
|
||||||||
|
No par value; authorized 40,000,000 shares; issued 18,115,965 shares at December 31, 2018 and 2017; 16,856,414 and 16,797,420 shares outstanding at December 31, 2018 and 2017, respectively
|
6,715
|
|
6,715
|
|
||||
|
Additional paid-in capital
|
15,375
|
|
13,912
|
|
||||
|
Retained earnings
|
198,914
|
|
167,129
|
|
||||
|
Accumulated other comprehensive loss
|
(164
|
)
|
(311
|
)
|
||||
|
Treasury stock, at cost, 1,259,551 and 1,318,545 shares at December 31, 2018 and 2017, respectively
|
(19,403
|
)
|
(18,719
|
)
|
||||
|
Total stockholders’ equity
|
201,441
|
|
168,730
|
|
||||
|
Total liabilities and stockholders’ equity
|
$
|
277,892
|
|
$
|
240,328
|
|
||
See Accompanying Notes to Consolidated Financial Statements
38
MGP
INGREDIENTS, INC.
CONSOLIDATED STATEMENTS OF CASH FLOWS
(Dollars in thousands)
|
Year Ended December 31,
|
||||||||||||
|
|
2018
|
2017
|
2016
|
|||||||||
|
Cash Flows from Operating Activities
|
||||||||||||
|
Net income
|
$
|
37,284
|
|
$
|
41,823
|
|
$
|
31,184
|
|
|||
|
Adjustments to reconcile net income to net cash provided by operating activities:
|
||||||||||||
|
Depreciation and amortization
|
11,362
|
|
11,308
|
|
11,253
|
|
||||||
|
Gain on sale of equity method investment
|
—
|
|
(11,381
|
)
|
—
|
|
||||||
|
Gain on property insurance recoveries
|
—
|
|
—
|
|
(230
|
)
|
||||||
|
Gain on sale of assets
|
—
|
|
—
|
|
(872
|
)
|
||||||
|
Share-based compensation
|
3,099
|
|
2,574
|
|
2,402
|
|
||||||
|
Equity method investment (earnings) loss
|
—
|
|
348
|
|
(4,036
|
)
|
||||||
|
Distributions received from equity method investee
|
—
|
|
7,131
|
|
3,300
|
|
||||||
|
Deferred income taxes, including change in valuation allowance
|
1,665
|
|
(3,420
|
)
|
681
|
|
||||||
|
Other, net
|
—
|
|
61
|
|
—
|
|
||||||
|
Changes in operating assets and liabilities:
|
||||||||||||
|
Receivables, net
|
(4,450
|
)
|
(8,262
|
)
|
4,585
|
|
||||||
|
Inventory
|
(15,620
|
)
|
(14,291
|
)
|
(20,106
|
)
|
||||||
|
Prepaid expenses
|
862
|
|
(498
|
)
|
(622
|
)
|
||||||
|
Refundable income taxes
|
1,268
|
|
725
|
|
(3,390
|
)
|
||||||
|
Accounts payable
|
(2,542
|
)
|
9,540
|
|
(3,178
|
)
|
||||||
|
Accounts payable to affiliate, net
|
—
|
|
(3,349
|
)
|
1,058
|
|
||||||
|
Accrued expenses
|
551
|
|
2,278
|
|
(1,407
|
)
|
||||||
|
Deferred credits
|
(586
|
)
|
(827
|
)
|
(424
|
)
|
||||||
|
Accrued retirement, health, and life insurance benefits
|
588
|
|
(289
|
)
|
(477
|
)
|
||||||
|
Net cash provided by operating activities
|
33,481
|
|
33,471
|
|
19,721
|
|
||||||
|
Cash Flows from Investing Activities
|
||||||||||||
|
Additions to property, plant, and equipment
|
(31,046
|
)
|
(21,055
|
)
|
(17,922
|
)
|
||||||
|
Divestiture of equity method investment, net
|
—
|
|
22,832
|
|
351
|
|
||||||
|
Proceeds from property insurance recoveries
|
—
|
|
—
|
|
230
|
|
||||||
|
Proceeds from sale of property and other
|
—
|
|
—
|
|
1,209
|
|
||||||
|
Acquisition of George Remus
®
|
—
|
|
—
|
|
(1,551
|
)
|
||||||
|
Net cash provided by (used in) investing
activities
|
(31,046
|
)
|
1,777
|
|
(17,683
|
)
|
||||||
|
Cash Flows from Financing Activities
|
||||||||||||
|
Payment of dividends and dividend equivalents
|
(5,500
|
)
|
(17,380
|
)
|
(2,066
|
)
|
||||||
|
Purchase of treasury stock for tax withholding on equity-based compensation
|
(2,324
|
)
|
(4,663
|
)
|
(1,518
|
)
|
||||||
|
Loan fees incurred with borrowings
|
—
|
|
(377
|
)
|
(114
|
)
|
||||||
|
Principal payments on long-term debt
|
(372
|
)
|
(358
|
)
|
(2,346
|
)
|
||||||
|
Proceeds on long-term debt
|
—
|
|
20,000
|
|
—
|
|
||||||
|
Proceeds from credit agreement - revolver
|
28,966
|
|
25,930
|
|
27,184
|
|
||||||
|
Payments on credit agreement - revolver
|
(21,264
|
)
|
(56,885
|
)
|
(22,356
|
)
|
||||||
|
Net cash used in financing activities
|
(494
|
)
|
(33,733
|
)
|
(1,216
|
)
|
||||||
|
Increase in cash
|
1,941
|
|
1,515
|
|
822
|
|
||||||
|
Cash, beginning of year
|
3,084
|
|
1,569
|
|
747
|
|
||||||
|
Cash, end of year
|
$
|
5,025
|
|
$
|
3,084
|
|
$
|
1,569
|
|
|||
See Accompanying Notes to Consolidated Financial Statements
39
MGP INGREDIENTS, INC.
CONSOLIDATED STATEMENTS OF CHANGES IN STOCKHOLDERS’ EQUITY
(Dollars in thousands)
|
|
Capital
Stock
Preferred
|
Issued
Common
|
Additional
Paid-In
Capital
|
Retained
Earnings
|
Accumulated
Other
Comprehensive
Income (Loss)
|
Treasury
Stock
|
Total
|
||||||||||||||||||||
|
Balance, December 31, 2015
|
$
|
4
|
|
$
|
6,715
|
|
$
|
12,383
|
|
$
|
113,531
|
|
$
|
(500
|
)
|
$
|
(15,973
|
)
|
$
|
116,160
|
|
||||||
|
Comprehensive income:
|
|||||||||||||||||||||||||||
|
Net income
|
—
|
|
—
|
|
—
|
|
31,184
|
|
—
|
|
—
|
|
31,184
|
|
|||||||||||||
|
Other comprehensive income
|
—
|
|
—
|
|
—
|
|
—
|
|
127
|
|
—
|
|
127
|
|
|||||||||||||
|
Dividends and dividend equivalents, net of estimated forfeitures
|
—
|
|
—
|
|
—
|
|
(2,063
|
)
|
—
|
|
—
|
|
(2,063
|
)
|
|||||||||||||
|
Share-based compensation
|
—
|
|
—
|
|
1,896
|
|
—
|
|
—
|
|
—
|
|
1,896
|
|
|||||||||||||
|
Stock shares awarded, forfeited or vested
|
—
|
|
—
|
|
—
|
|
—
|
|
—
|
|
506
|
|
506
|
|
|||||||||||||
|
Stock shares repurchased
|
—
|
|
—
|
|
—
|
|
—
|
|
—
|
|
(1,518
|
)
|
(1,518
|
)
|
|||||||||||||
|
Balance, December 31, 2016
|
$
|
4
|
|
|
$
|
6,715
|
|
|
$
|
14,279
|
|
|
$
|
142,652
|
|
|
$
|
(373
|
)
|
|
$
|
(16,985
|
)
|
|
$
|
146,292
|
|
|
Comprehensive income:
|
|||||||||||||||||||||||||||
|
Net income
|
—
|
|
—
|
|
—
|
|
41,823
|
|
—
|
|
—
|
|
41,823
|
|
|||||||||||||
|
Other comprehensive income
|
—
|
|
—
|
|
—
|
|
—
|
|
62
|
|
—
|
|
62
|
|
|||||||||||||
|
Dividends and dividend equivalents, net of estimated forfeitures
|
—
|
|
—
|
|
—
|
|
(17,346
|
)
|
—
|
|
—
|
|
(17,346
|
)
|
|||||||||||||
|
Share-based compensation
|
—
|
|
—
|
|
2,065
|
|
—
|
|
—
|
|
—
|
|
2,065
|
|
|||||||||||||
|
Stock shares awarded, forfeited or vested
|
—
|
|
—
|
|
(2,432
|
)
|
—
|
|
—
|
|
2,929
|
|
497
|
|
|||||||||||||
|
Stock shares repurchased
|
—
|
|
—
|
|
—
|
|
—
|
|
—
|
|
(4,663
|
)
|
(4,663
|
)
|
|||||||||||||
|
Balance, December 31, 2017
|
$
|
4
|
|
$
|
6,715
|
|
$
|
13,912
|
|
$
|
167,129
|
|
$
|
(311
|
)
|
$
|
(18,719
|
)
|
$
|
168,730
|
|
||||||
|
Comprehensive income:
|
|||||||||||||||||||||||||||
|
Net income
|
—
|
|
—
|
|
—
|
|
$
|
37,284
|
|
—
|
|
—
|
|
37,284
|
|
||||||||||||
|
Other comprehensive income
|
—
|
|
—
|
|
—
|
|
—
|
|
147
|
|
—
|
|
147
|
|
|||||||||||||
|
Dividends and dividend equivalents, net of estimated forfeitures
|
—
|
|
—
|
|
—
|
|
(5,499
|
)
|
—
|
|
—
|
|
(5,499
|
)
|
|||||||||||||
|
Share-based compensation
|
—
|
|
—
|
|
2,687
|
|
—
|
|
—
|
|
—
|
|
2,687
|
|
|||||||||||||
|
Stock shares awarded, forfeited or vested
|
—
|
|
—
|
|
(1,224
|
)
|
—
|
|
—
|
|
1,640
|
|
416
|
|
|||||||||||||
|
Stock shares repurchased
|
—
|
|
—
|
|
—
|
|
—
|
|
—
|
|
(2,324
|
)
|
(2,324
|
)
|
|||||||||||||
|
Balance, December 31, 2018
|
$
|
4
|
|
$
|
6,715
|
|
$
|
15,375
|
|
$
|
198,914
|
|
$
|
(164
|
)
|
$
|
(19,403
|
)
|
$
|
201,441
|
|
||||||
See Accompanying Notes to Consolidated Financial Statements
40
MGP INGREDIENTS, INC.
NOTES TO CONSOLIDATED FINANCIAL STATEMENTS
(Dollars in thousands, unless otherwise noted)
|
NOTE 1:
|
NATURE OF OPERATIONS AND SUMMARY OF SIGNIFICANT ACCOUNTING POLICIES
|
The Company.
MGP Ingredients, Inc. ("Company") is a Kansas corporation headquartered in Atchison, Kansas and is a leading producer and supplier of premium distilled spirits and specialty wheat protein and starch food ingredients. Distilled spirits include premium bourbon and rye whiskeys and grain neutral spirits, including vodka and gin. MGP is also a top producer of high quality industrial alcohol for use in both food and non-food applications. The Company’s protein and starch food ingredients provide a host of functional, nutritional, and sensory benefits for a wide range of food products to serve the packaged goods industry. The Company's distillery products are derived from corn and other grains (including rye, barley, wheat, barley malt, and milo), and its ingredient products are derived from wheat flour. The majority of the Company's sales are made directly or through distributors to manufacturers and processors of finished packaged goods or to bakeries.
Principles of Consolidation.
The consolidated financial statements include the accounts of the Company and its wholly owned subsidiaries. All significant intercompany balances and transactions have been eliminated in consolidation.
Use of Estimates.
The financial reporting policies of the Company conform to accounting principles generally accepted in the United States of America ("GAAP"). The preparation of financial statements in conformity with GAAP requires management to make estimates and assumptions that affect the reported amounts of assets and liabilities, the disclosure of contingent assets and liabilities at the date of the financial statements, and the reported amounts of revenues and expenses during the reporting period. The application of certain of these policies places demands on management’s judgment, with financial reporting results relying on estimation about the effects of matters that are inherently uncertain. For all of these policies, management cautions that future events rarely develop as forecast, and estimates routinely require adjustment and may require material adjustment.
Inventory.
Inventory includes finished goods, raw materials in the form of agricultural commodities used in the production process, and certain maintenance and repair items. Bourbons and whiskeys are normally aged in barrels for several years, following industry practice; all barreled bourbon and whiskey is classified as a current asset. The Company includes warehousing, insurance, and other carrying charges applicable to barreled whiskey in inventory costs.
Inventories are stated at the lower of cost or net realizable value on the first-in, first-out, or FIFO, method. Inventory valuations are impacted by constantly changing prices paid for key materials, primarily corn.
Properties, Depreciation, and Amortization.
Property, plant, and equipment are typically stated at cost. Additions, including those that increase the life or utility of an asset, are capitalized and all properties are depreciated over their estimated remaining useful lives. Depreciation and amortization are computed using the straight line method over the following estimated useful lives:
|
Buildings and improvements
(a)
|
10 – 30 years
|
|
Machinery and equipment
|
3 – 10 years
|
|
Office furniture and equipment
|
5 – 10 years
|
|
Computer equipment and software
|
3 – 5 years
|
|
Motor vehicles
|
5 years
|
(a)
Leasehold improvements are the shorter of economic useful life or life of lease
41
Maintenance costs are expensed as incurred. The cost of property, plant, and equipment sold, retired, or otherwise disposed of, as well as related accumulated depreciation and amortization, are eliminated from the property accounts with related gains and losses reflected in the Consolidated Statements of Income. The Company capitalizes interest costs associated with significant construction projects. Total interest incurred for
2018
,
2017
, and
2016
is noted below:
|
Year Ended December 31,
|
||||||||||||
|
2018
|
2017
|
2016
|
||||||||||
|
Interest costs charged to expense
|
$
|
1,168
|
|
$
|
1,184
|
|
$
|
1,294
|
|
|||
|
Plus: Interest cost capitalized
|
562
|
|
293
|
|
198
|
|
||||||
|
Total
|
$
|
1,730
|
|
$
|
1,477
|
|
$
|
1,492
|
|
|||
Revenue Recognition.
As a result of the adoption of Accounting Standards Update ("ASU") No. 2014-09,
Revenue from Contracts with Customers
and related amendments
("Topic 606") on January 1, 2018, the Company has changed its accounting policy for revenue recognition (see Note 3). Revenue is recognized when control of the promised goods or services, through performance obligations by the Company, is transferred to the customer in an amount that reflects the consideration it expects to be entitled to in exchange for the performance obligations. The term between invoicing and when payment is due is not significant and the period between when the entity transfers the promised good or service to the customer and when the customer pays for that good or service is one year or less.
Excise taxes that are both imposed on and concurrent with a specific revenue-producing transaction, that are collected by the Company from a customer are excluded from revenue. Revenue is recognized for the sale of products at the point in time finished products are delivered to the customer in accordance with shipping terms. This is a faithful depiction of the satisfaction of the performance obligation because, at that point control passes to the customer, the customer has legal title and the risk and rewards of ownership have transferred, and the customer has present obligation to pay.
The Company’s distillery products segment routinely enters into bill and hold arrangements, whereby the Company produces and sells unaged distillate to customers, and the product is subsequently barreled at the customer’s request and warehoused at a Company location for an extended period of time in accordance with directions received from the Company’s customers. Even though the unaged distillate remains in the Company's possession, a sale is recognized at the point in time when the customer obtains control of the product. Control is transferred to the customer in bill and hold transactions when: customer acceptance specifications have been met, legal title has transferred, the customer has a present obligation to pay for the product, the risk and rewards of ownership have transferred to the customer, and all the following additional bill and hold criteria have been met: the customer has requested the product be warehoused, the product has been identified as separately belonging to the customer, the product is currently ready for physical transfer to the customer, and the Company does not have the ability to use the product or direct it to another customer.
Warehouse service revenue is recognized over the time that warehouse services are rendered and as they are rendered. This is a faithful depiction of the satisfaction of the performance obligation because control of the aging products has already passed to the customer and there are no additional performance activities required by the Company, except as requested by the customer. The performance of the service activities, as requested, is invoiced as satisfied and revenue is concurrently recognized.
Income Taxes.
The Company accounts for income taxes using an asset and liability method which requires the recognition of deferred tax assets and liabilities for the expected future tax consequences attributable to differences between the financial statement carrying amounts of existing assets and liabilities and their respective tax basis. A valuation allowance is recognized if it is "more likely than not" that at least some portion of the deferred tax asset will not be realized.
EPS.
Basic and diluted EPS is computed using the two class method, which is an earnings allocation formula that determines net income per share for each class of Common Stock and participating security according to dividends declared and participation rights in undistributed earnings. Per share amounts are computed by dividing net income attributable to common shareholders by the weighted average shares outstanding during each year or period.
42
Fair Value of Financial Instruments.
The Company determines the fair values of its financial instruments based on a fair value hierarchy, which requires an entity to maximize the use of observable inputs and minimize the use of unobservable inputs when measuring fair value. The hierarchy is broken down into three levels based upon the observability of inputs. Fair values determined by Level 1 inputs utilize quoted prices (unadjusted) in active markets for identical assets or liabilities that the Company has the ability to access. Level 2 inputs include quoted prices for similar assets and liabilities in active markets and inputs other than quoted prices that are observable for the asset or liability. Level 3 inputs are unobservable inputs for the asset or liability, and include situations where there is little, if any, market activity for the asset or liability. In certain cases, the inputs used to measure fair value may fall into different levels of the fair value hierarchy. In such cases, the level in the fair value hierarchy within which the fair value measurement in its entirety falls has been determined based on the lowest level input that is significant to the fair value measurement in its entirety. The Company’s assessment of the significance of a particular input to the fair value in its entirety requires judgment and considers factors specific to the asset or liability.
The Company’s short term financial instruments include cash and cash equivalents, accounts receivable and accounts payable. The carrying value of the short term financial instruments approximates the fair value due to their short term nature. These financial instruments have no stated maturities or the financial instruments have short term maturities that approximate market.
The fair value of the Company’s debt is estimated based on current market interest rates for debt with similar maturities and credit quality. The fair value of the Company’s debt was
$32,018
and
$24,838
at
December 31, 2018
and
2017
, respectively. The financial statement carrying value (including unamortized loan fees) was
$32,014
and
$24,554
at
December 31, 2018
and
2017
, respectively. These fair values are considered Level 2 under the fair value hierarchy.
Recently Issued Accounting Pronouncements.
In August 2018, the Financial Accounting Standards Board ("FASB") issued ASU 2018-13,
Fair Value Measurement (Topic 820)
,
which modifies the disclosure requirements on fair value measurements. The amendments are effective for all entities for fiscal years, and interim periods within those fiscal years, beginning after December 15, 2019. Early adoption is permitted upon issuance of this update. An entity is permitted to early adopt any removed or modified disclosures upon issuance of this update and delay adoption of the additional disclosures until their effective date. The Company is evaluating the effect that ASU 2018-13 will have on its consolidated financial statements and related disclosures.
In July 2018, the FASB issued ASU 2018-09,
Codification Improvements
,
which clarifies and corrects unintended application of guidance, and makes improvements to several Codification Topics. Most of the amendments are effective immediately. Some of the amendments are effective for Public business entities for annual and interim periods in fiscal years beginning after December 15, 2018, and for all other entities, for annual periods in fiscal years beginning after December 15, 2019, and interim periods in fiscal years beginning after December 15, 2020. Other amendments, which affect recently issued ASUs that are not yet effective, are effective with the original ASU. The Company is evaluating the effect that ASU 2018-09 will have on its consolidated financial statements and related disclosures.
In February 2018, the FASB issued ASU 2018-02,
Reclassification of Certain Tax Effects from Accumulated Other Comprehensive Income
, which allows a reclassification from accumulated other comprehensive income to retained earnings for stranded tax effects resulting from the Tax Cuts and Jobs Act. This ASU is effective for all entities for annual and interim periods in fiscal years beginning after December 15, 2018. Early adoption is permitted, including adoption in any interim period, (1) for public business entities for reporting periods for which financial statements have not yet been issued and (2) for all other entities for reporting periods for which financial statements have not yet been made available for issuance. The Company is evaluating the effect that ASU 2018-02 will have on its consolidated financial statements and related disclosures.
In February 2016, the FASB issued ASU 2016-02,
Leases
, as well as subsequent guidance, which requires lessees to recognize for all leases a right-of-use asset and a lease obligation in the consolidated balance sheet. Expenses are recognized in the consolidated statements of income in a manner similar to current accounting guidance. Lessees are permitted to make an accounting policy election to not recognize an asset and liability for leases with a term of twelve months or less. Lessor accounting under the new standard is substantially unchanged. Additional qualitative and quantitative disclosures, including significant judgments made by management, will be required. The new standard will become effective for the Company beginning with the first quarter 2019. The Company will adopt the accounting standard using a prospective transition approach, which applies the provisions of the new guidance at the effective date without adjusting the comparative periods presented. The Company is finalizing its evaluation of the impacts that the adoption of this accounting guidance will have on the consolidated financial statements, and estimates approximately
$7,000
of right-of-use assets and lease liabilities related to operating leases will be recognized in its Consolidated Balance Sheet upon adoption.
43
Recently Adopted Accounting Standard Updates.
In March 2017, the FASB issued ASU 2017-07,
Compensation-Retirement Benefits (Topic 715): Improving the Presentation of Net Periodic Pension Cost and Net Periodic Postretirement Benefit Cost
, which requires companies to present the service cost component of net benefit cost in the same line items in which they report compensation cost. Companies will present all other components of net benefit cost outside operating income, if this subtotal is presented. The Company adopted ASU 2017-07 on January 1, 2018, with an immaterial impact on its financial results and presentation for year ended
December 31, 2018
.
In November 2016, the FASB issued ASU 2016-18,
Statement of Cash Flows (Topic 230): Restricted Cash,
which requires companies to include cash and cash equivalents that have restrictions on withdrawal or use in total cash and cash equivalents on the statement of cash flows. The Company adopted ASU 2016-18 on January 1, 2018, and has determined that there was no impact to the presentation of its Consolidated Statements of Cash Flows because the Company had no restricted cash for years ended
December 31, 2018
,
2017
, and
2016
.
In August 2016, the FASB issued ASU 2016-15,
Statement of Cash Flows (Topic 230): Classification of Certain Cash Receipts and Cash Payments
, which addresses eight classification issues related to the statement of cash flows: Debt prepayment or debt extinguishment costs; Settlement of zero coupon bonds; Contingent consideration payments made after a business combination; Proceeds from the settlement of insurance claims; Proceeds from the settlement of corporate owned life insurance policies, including bank owned life insurance policies; Distributions received from equity method investees; Beneficial interests in securitization transactions; and Separately identifiable cash flows and application of the predominance principle. The Company adopted ASU 2016-15 on January 1, 2018, and has determined that there was no impact to the presentation of its Consolidated Statements of Cash Flows for years ended
December 31, 2018
,
2017
, and
2016
.
On January 1, 2018, the Company adopted Topic 606, using the modified retrospective method applied to those contracts which were not completed as of January 1, 2018 (Note 3).
|
NOTE 2:
|
OTHER BALANCE SHEET CAPTIONS
|
Inventory.
|
December 31,
|
||||||||
|
|
2018
|
2017
|
||||||
|
Finished goods
|
$
|
17,296
|
|
$
|
13,284
|
|
||
|
Barreled distillate (bourbons and whiskeys)
|
76,374
|
|
65,726
|
|
||||
|
Raw materials
|
4,906
|
|
3,954
|
|
||||
|
Work in process
|
1,550
|
|
1,935
|
|
||||
|
Maintenance materials
|
7,541
|
|
7,256
|
|
||||
|
Other
|
1,102
|
|
994
|
|
||||
|
Total
|
$
|
108,769
|
|
$
|
93,149
|
|
||
Property, plant, and equipment, net.
|
December 31,
|
||||||||
|
|
2018
|
2017
|
||||||
|
Land, buildings, and improvements
|
$
|
90,992
|
|
$
|
72,223
|
|
||
|
Transportation equipment
|
3,308
|
|
3,286
|
|
||||
|
Machinery and equipment
|
184,779
|
|
175,371
|
|
||||
|
Construction in progress
|
16,814
|
|
16,408
|
|
||||
|
Property, plant, and equipment, at cost
|
295,893
|
|
267,288
|
|
||||
|
Less accumulated depreciation and amortization
|
(175,105
|
)
|
(164,237
|
)
|
||||
|
Property, plant, and equipment, net
|
$
|
120,788
|
|
$
|
103,051
|
|
||
44
Accrued expenses.
|
December 31,
|
|||||||
|
|
2018
|
2017
|
|||||
|
Employee benefit plans
|
$
|
1,288
|
|
$
|
962
|
|
|
|
Salaries and wages
|
7,099
|
|
7,452
|
|
|||
|
Property taxes
|
1,248
|
|
1,185
|
|
|||
|
Other
|
2,079
|
|
1,572
|
|
|||
|
Total
|
$
|
11,714
|
|
$
|
11,171
|
|
|
|
NOTE 3:
|
REVENUE
|
Adoption of
Topic 606
,
Revenue from Contracts with Customers
.
On January 1, 2018, the Company adopted Topic 606, using the modified retrospective method applied to those contracts which were not completed as of January 1, 2018. Financial results for reporting periods beginning after January 1, 2018 are presented under Topic 606, while prior period amounts are not adjusted and continue to be reported in accordance with the Company's historic accounting under ASC 605,
Revenue Recognition
. The Company has completed its evaluation of the impact of Topic 606 and concluded that there is no impact to the financial statements as a result of its adoption. The Company recorded no adjustment to opening retained earnings as of January 1, 2018 related to the transition from ASC 605 to Topic 606 and there are no differences to disclose to reconcile financial statement activity as reported under Topic 606 to ASC 605 for the year ended
December 31, 2018
.
Disaggregation of Revenue.
The following table presents the Company's revenues disaggregated by segment and major products and services.
|
NET SALES
|
|||||||||||||
|
Year Ended December 31,
|
|||||||||||||
|
2018
|
2017
(a)
|
2016
(a)
|
|||||||||||
|
Distillery Products
|
|||||||||||||
|
Premium beverage alcohol
|
$
|
188,431
|
|
$
|
177,998
|
|
$
|
150,364
|
|
||||
|
Industrial alcohol
|
80,650
|
|
76,636
|
|
77,290
|
|
|||||||
|
Food grade alcohol
|
269,081
|
|
254,634
|
|
227,654
|
|
|||||||
|
Fuel grade alcohol
|
6,347
|
|
6,368
|
|
7,372
|
|
|||||||
|
Distillers feed and related co-products
|
25,698
|
|
19,332
|
|
21,780
|
|
|||||||
|
Warehouse services
|
12,929
|
|
10,674
|
|
8,437
|
|
|||||||
|
Total distillery products
|
$
|
314,055
|
|
$
|
291,008
|
|
$
|
265,243
|
|
||||
|
Ingredient Solutions
|
|||||||||||||
|
Specialty wheat starches
|
$
|
28,594
|
|
$
|
28,092
|
|
$
|
26,803
|
|
||||
|
Specialty wheat proteins
|
21,098
|
|
19,458
|
|
18,211
|
|
|||||||
|
Commodity wheat starch
|
9,223
|
|
8,288
|
|
7,002
|
|
|||||||
|
Commodity wheat protein
|
3,119
|
|
602
|
|
1,004
|
|
|||||||
|
Total ingredient solutions
|
$
|
62,034
|
|
$
|
56,440
|
|
$
|
53,020
|
|
||||
|
Total net sales
|
$
|
376,089
|
|
$
|
347,448
|
|
$
|
318,263
|
|
||||
(a)
Prior year amounts were not adjusted upon adoption of
Topic 606.
45
The following table presents the Company's revenues disaggregated by segment and timing of revenue recognition.
|
NET SALES
|
|||||||||||||
|
Year Ended December 31,
|
|||||||||||||
|
2018
|
2017
(a)
|
2016
(a)
|
|||||||||||
|
Distillery Products
|
|||||||||||||
|
Products transferred at a point in time
|
$
|
301,126
|
|
$
|
280,334
|
|
$
|
256,806
|
|
||||
|
Services transferred over time
|
12,929
|
|
10,674
|
|
8,437
|
|
|||||||
|
Total distillery products
|
$
|
314,055
|
|
$
|
291,008
|
|
$
|
265,243
|
|
||||
|
Ingredient Solutions
|
|||||||||||||
|
Products transferred at a point in time
|
$
|
62,034
|
|
$
|
56,440
|
|
$
|
53,020
|
|
||||
|
Total net sales
|
$
|
376,089
|
|
$
|
347,448
|
|
$
|
318,263
|
|
||||
(a)
Prior year amounts were not adjusted upon adoption of
Topic 606.
The Company generates revenues from the distillery products segment by the sale of products and by providing warehouse services related to the storage and aging of customer products. The Company generates revenues from the ingredient solutions segment by the sale of products. Contracts with customers in both segments include a single performance obligation (either the sale of products or the provision of warehouse services).
|
NOTE 4:
|
EQUITY METHOD INVESTMENTS
|
As of
December 31, 2018
and
2017
, the Company's equity method investments were
zero
.
Illinois Corn Processing ("ICP") Investment.
On July 3, 2017, the Company completed the sale of its equity ownership interest in ICP to Pacific Ethanol Central, LLC ("Pacific Ethanol"), consistent with an Agreement and Plan of Merger ("Merger Agreement") entered into on June 26, 2017. The total transaction proceeds to the Company from the ICP sale transaction represented a return of its investment in ICP of
$22,832
(net of fees and including additional dividends), which included a gain on sale of equity method investment of
$11,381
(before tax), on the Company's 2017 Consolidated Statement of Income. The Merger Agreement contemplated a special distribution of all of ICP’s cash and cash equivalents to equity owners prior to the closing, which resulted in the Company receiving cash dividend distributions from ICP during June 2017 totaling
$7,430
that reduced its
30 percent
ownership interest.
On February 26, 2016, the Company received a cash dividend distribution from ICP of
$3,300
that reduced its investment in ICP as of December 31, 2016.
DMI Investment.
Our joint venture terminated effective June 30, 2015, with a return of investment in the amount of
$351
on December 23, 2016.
Related Party Transactions.
See Note 14 for discussion of related party transactions.
Summary Financial Information.
Condensed financial information of the Company’s equity method investment in ICP for the years ended
December 31, 2017
and
2016
:
|
Year Ended December 31,
|
|||||||||
|
ICP’s Operating results:
|
2017
|
2016
|
|||||||
|
Net sales
(a)
|
$
|
78,062
|
|
$
|
177,401
|
|
|||
|
Cost of sales and expenses
(b)
|
(79,224
|
)
|
(163,837
|
)
|
|||||
|
Net income (loss)
|
$
|
(1,162
|
)
|
$
|
13,564
|
|
|||
|
(a)
|
Includes related party sales to MGPI of
$17,672
, and
$27,675
for
2017
and
2016
, respectively.
|
|
(b)
|
Includes depreciation and amortization of
$1,720
and
$3,030
for
2017
and
2016
, respectively.
|
46
The Company’s equity method investment earnings (losses) for the years ended
December 31, 2017
and
2016
:
|
Year Ended December 31,
|
||||||||
|
|
2017
|
2016
|
||||||
|
ICP (30% interest)
|
$
|
(348
|
)
|
$
|
4,069
|
|
||
|
DMI (50% interest)
|
—
|
|
(33
|
)
|
||||
|
Total
|
$
|
(348
|
)
|
$
|
4,036
|
|
||
|
NOTE 5:
|
CORPORATE BORROWINGS
|
Indebtedness Outstanding.
|
|
December 31,
|
||||||||
|
Description
(a)
|
2018
|
2017
|
|||||||
|
Credit Agreement - Revolver, 3.889% (variable rate) due 2022
|
$
|
11,000
|
|
$
|
3,298
|
|
|||
|
Secured Promissory Note, 3.71% (fixed rate) due 2022
|
1,594
|
|
1,966
|
|
|||||
|
Prudential Note Purchase Agreement, 3.53% (fixed rate) due 2027
|
20,000
|
|
20,000
|
|
|||||
|
Total indebtedness outstanding
|
32,594
|
|
25,264
|
|
|||||
|
Less unamortized loan fees
(b)
|
(580
|
)
|
(710
|
)
|
|||||
|
Total indebtedness outstanding, net
|
32,014
|
|
24,554
|
|
|||||
|
Less current maturities of long-term debt
|
(386
|
)
|
(372
|
)
|
|||||
|
Long-term debt
|
$
|
31,628
|
|
$
|
24,182
|
|
|||
(a)
Interest rates are as of
December 31, 2018
.
(b)
Loan fees are being amortized over the life of the Credit Agreement and Note Purchase Agreement.
Credit Agreement and Note Purchase Agreement.
On August 23, 2017, the Company entered into a new credit agreement (the "Credit Agreement") with Wells Fargo Bank, National Association. The Credit Agreement replaced the Company’s Third Amended and Restated Credit Agreement, which included a revolver, a fixed asset sub-line term loan, and a term loan. The Credit Agreement provides for a
$150,000
revolving credit facility. The Company may increase the facility from time to time by an aggregate principal amount of up to
$25,000
provided certain conditions are satisfied and at the discretion of the lender. The Credit Agreement matures on August 23, 2022.
The Credit Agreement includes certain requirements and covenants, which the Company was in compliance with at
December 31, 2018
. The Company incurred
no
new loan fees related to the Credit Agreement during
2018
. The unamortized balance of total loan fees related to the Credit Agreement was
$412
at
December 31, 2018
and is being amortized over the life of the Credit Agreement.
As of
December 31, 2018
, the Company's total outstanding borrowings under the Credit Agreement were
$11,000
leaving
$139,000
available. The interest rate for the borrowings of the Credit Agreement at
December 31, 2018
was
3.9 percent
.
On August 23, 2017, the Company also entered into a Note Purchase and Private Shelf Agreement (the "Note Purchase Agreement") with PGIM, Inc. ("Prudential Capital Group"), an affiliate of Prudential Financial, Inc., and certain affiliates of PGIM, Inc. The Note Purchase Agreement provides for the issuance of up to
$75,000
of Senior Secured Notes, and the Company issued
$20,000
of Senior Secured Notes with a maturity date of August 23, 2027. The Senior Secured Notes bear interest at a rate of
3.5 percent
per year. The Note Purchase Agreement includes certain requirements and covenants, which the Company was in compliance with at
December 31, 2018
. The Company incurred
no
new loan fees related to the Note Purchase Agreement during
2018
. The unamortized balance of total loan fees related to the Note Purchase Agreement was
$168
at
December 31, 2018
and is being amortized over the life of the Note Purchase Agreement.
47
Debt Maturities.
|
Year Ending December 31,
|
|||||
|
2019
|
$
|
386
|
|
||
|
2020
|
400
|
|
|||
|
2021
|
2,016
|
|
|||
|
2022
|
14,592
|
|
|||
|
2023
|
3,200
|
|
|||
|
Thereafter
|
12,000
|
|
|||
|
Total
|
$
|
32,594
|
|
||
|
NOTE 6:
|
INCOME TAXES
|
Income tax expense is composed of the following:
|
Year Ended December 31,
|
|||||||||||
|
|
2018
|
2017
|
2016
|
||||||||
|
Current:
|
|||||||||||
|
Federal
|
$
|
8,844
|
|
$
|
14,020
|
|
$
|
12,637
|
|
||
|
State
|
1,317
|
|
379
|
|
342
|
|
|||||
|
|
10,161
|
|
14,399
|
|
12,979
|
|
|||||
|
Deferred:
|
|||||||||||
|
Federal
|
55
|
|
(3,764
|
)
|
(254
|
)
|
|||||
|
State
|
1,480
|
|
300
|
|
808
|
|
|||||
|
|
1,535
|
|
(3,464
|
)
|
554
|
|
|||||
|
Total
|
$
|
11,696
|
|
$
|
10,935
|
|
$
|
13,533
|
|
||
Income tax expense also included tax expense allocated to comprehensive income for
2018
,
2017
, and
2016
, of
$73
,
$37
, and
$84
, respectively (see the Consolidated Statements of Comprehensive Income).
On December 22, 2017, the United States enacted tax reform legislation commonly known as the Tax Cuts and Jobs Act (the "Tax Act"), resulting in significant modifications to the then existing law, impacting the measurement of income taxes for the year ended December 31, 2017, and the years thereafter. The Tax Act established new tax laws or modified existing tax laws starting in 2018, including but not limited to, (1) reducing the federal corporate income tax rate to a flat
21 percent
rate, (2) eliminating the corporate alternative minimum tax, (3) repealing the domestic production activity deduction, (4) adding a new limitation on deductible interest, (5) changing the limitations on the deductibility of certain executive compensation, and, (6) starting in the quarter ended September 30, 2017, changing the bonus depreciation rules to allow full expensing of qualified property.
In response to the Tax Act, the SEC staff issued SAB 118, which provided guidance on accounting for the tax effects of the Tax Act. SAB 118 provided for a measurement period not to extend beyond one year from the Tax Act enactment date for companies to complete the accounting under ASC 740 -
Income Taxes
. The Company, following the guidance in SAB 118, recorded a provisional discrete net tax benefit in its Consolidated Statement of Income through net income of
$3,343
in the year ended December 31, 2017. This net benefit was driven by a re-measurement of the carrying value of its deferred tax assets and liabilities because of the corporate rate reduction. This net benefit provided a
6.3 percent
reduction in the Company’s effective tax rate for the year ended December 31, 2017.
The Company has evaluated the elements of the Tax Act, including filing its federal income tax return during the quarter ended December 31, 2018. The Company was not required to make a measurement period adjustment. Therefore, the accounting for the Tax Act is now complete, and the discrete net benefit recorded for the year ended December 31, 2017, is no longer provisional. In addition, the Company has incorporated the law changes and subsequent guidance related to the Tax Act into its December 31, 2018, provision for income taxes contained herein.
48
A reconciliation of income tax expense at the normal statutory federal rate to income tax expense included in the accompanying Consolidated Statements of Income is below:
|
Year Ended December 31,
|
||||||||||||
|
2018
|
2017
|
2016
|
||||||||||
|
"Expected" provision at federal statutory rate
|
$
|
10,286
|
|
$
|
18,465
|
|
$
|
15,651
|
|
|||
|
State income taxes, net
(a)
|
2,029
|
|
1,612
|
|
1,672
|
|
||||||
|
Change in valuation allowance
|
1,304
|
|
(578
|
)
|
(718
|
)
|
||||||
|
Domestic production activity deduction
|
—
|
|
(957
|
)
|
(1,247
|
)
|
||||||
|
Share-based compensation
(a)
|
(1,201
|
)
|
(4,254
|
)
|
(1,408
|
)
|
||||||
|
Compensation limits
|
—
|
|
931
|
|
—
|
|
||||||
|
Federal and state tax credits
|
(807
|
)
|
(1,058
|
)
|
(1,065
|
)
|
||||||
|
Tax benefit from the Tax Act
|
—
|
|
(3,343
|
)
|
—
|
|
||||||
|
Other
|
85
|
|
117
|
|
648
|
|
||||||
|
Income tax expense
|
$
|
11,696
|
|
$
|
10,935
|
|
$
|
13,533
|
|
|||
|
Effective tax rate
|
23.9
|
%
|
20.7
|
%
|
30.3
|
%
|
||||||
|
(a)
|
The Company received federal excess tax benefits on share-based compensation awards in 2018, 2017, and 2016 of
$1,201
,
$4,254
, and
$1,408
, respectively, and state benefits of
$236
,
$371
and
$163
, respectively, for excess tax benefits. The state benefits are part of the State income taxes, net, balances in the above table.
|
The tax effects of temporary differences giving rise to deferred income taxes shown on the Consolidated Balance Sheets are as follows:
|
December 31,
|
|||||||
|
|
2018
|
2017
|
|||||
|
Deferred income tax assets:
|
|||||||
|
Post-retirement liability
|
$
|
770
|
|
$
|
910
|
|
|
|
Deferred income
|
393
|
|
543
|
|
|||
|
Share-based compensation
|
1,581
|
|
1,158
|
|
|||
|
Capital loss carryforwards
|
379
|
|
—
|
|
|||
|
State tax credit carryforwards
|
3,245
|
|
3,488
|
|
|||
|
State operating loss carryforwards
|
1,505
|
|
1,434
|
|
|||
|
Inventories
|
1,476
|
|
1,346
|
|
|||
|
Other
|
1,231
|
|
766
|
|
|||
|
Gross deferred income tax assets
|
$
|
10,580
|
|
$
|
9,645
|
|
|
|
Less: valuation allowance
|
(1,452
|
)
|
(148
|
)
|
|||
|
Net deferred income tax assets
|
9,128
|
|
9,497
|
|
|||
|
Deferred income tax liabilities:
|
|||||||
|
Fixed assets
|
(10,497
|
)
|
(9,255
|
)
|
|||
|
Other
|
(308
|
)
|
(254
|
)
|
|||
|
Gross deferred income tax liabilities
|
(10,805
|
)
|
(9,509
|
)
|
|||
|
Net deferred income tax liability
|
$
|
(1,677
|
)
|
$
|
(12
|
)
|
|
49
A schedule of the change in valuation allowance is as follows:
|
Valuation allowance
|
||||
|
Balance at December 31, 2016
|
$
|
726
|
|
|
|
Decrease
|
(578
|
)
|
||
|
Balance at December 31, 2017
|
$
|
148
|
|
|
|
Increase
|
1,304
|
|
||
|
Balance at December 31, 2018
|
$
|
1,452
|
|
|
As of
December 31, 2018
, the Company’s total valuation allowance of
$1,452
related to net operating loss carryforwards in states in which it is not "more likely than not" to create enough state taxable income to fully utilize the carryforwards before expiration of the carryforward periods, and capital loss carryforwards that the Company is not "more likely than not" to use before they expire. Based upon final information received in 2018 concerning the sale of the Company’s equity ownership interest in ICP during 2017, the Company was required to revise the estimate of its ability to use its capital loss carryforwards. This revision increased its deferred tax assets and corresponding valuation allowance by
$379
. The remainder of the change in the Company’s valuation allowance was an increase of
$925
related to additional net operating loss carryforwards. The total net increase in the Company's valuation allowance was
$1,304
for the year ended
December 31, 2018
. The carrying value of the Company’s deferred tax assets, liabilities, and the corresponding valuation allowances for the years ended
December 31, 2018
, and
December 31, 2017
, reflect the completed accounting concerning the Tax Act.
As of
December 31, 2017
, the Company’s total valuation allowance of
$148
related to net operating loss carryforwards in states in which the Company is not "more likely than not" to create enough state taxable income to fully utilize the carryforwards before expiration of the carryforward periods. Due to capital gains estimated to be realized as part of the sale of the Company’s equity ownership interest in ICP during 2017, the Company was able to utilize all of its federal capital loss carryforwards in 2017, and reduce its valuation allowance and corresponding deferred tax asset by
$690
. The remainder of the change in the valuation allowance was an increase of
$112
for additional net operating loss carryforwards for a net reduction of the Company's valuation allowance of
$578
.
As of
December 31, 2018
, the Company had
$21,575
in gross state net operating loss carryforwards. As of
December 31, 2017
, the Company had
$19,979
in state net operating loss carryforwards. Due to varying state carryforward periods, the state net operating loss carryforwards will expire in varying years between calendar years 2019 and 2038. The Company has gross state tax credit carryforwards of
$4,107
as of
December 31, 2018
and
$4,416
as of
December 31, 2017
. State credits, if not used to offset income tax expense in their respective jurisdictions, will expire in varying years between 2020 and 2034.
The Company treats accrued interest and penalties related to tax liabilities, if any, as a component of income tax expense. During
2018
,
2017
, and
2016
, the Company’s activity in accrued interest and penalties was not significant.
The following is a reconciliation of the total amount of unrecognized tax benefits (excluding interest and penalties) for
2018
,
2017
, and
2016
:
|
Year Ended December 31,
|
|||||||||||
|
|
2018
|
2017
|
2016
|
||||||||
|
Beginning of year balance
|
$
|
185
|
|
$
|
43
|
|
$
|
613
|
|
||
|
Additions based on prior year tax positions
|
2
|
|
130
|
|
2
|
|
|||||
|
Additions based on current year tax positions
|
11
|
|
12
|
|
21
|
|
|||||
|
Reduction for prior year tax positions
|
(5
|
)
|
—
|
|
(48
|
)
|
|||||
|
Reductions for settlements
|
—
|
|
—
|
|
(545
|
)
|
|||||
|
End of year balance
|
$
|
193
|
|
$
|
185
|
|
|
$
|
43
|
|
|
For each period presented, substantially all of the amount of unrecognized benefits (excluding interest and penalties) would impact the effective tax rate, if recognized. The Company reasonably expects that the amount of unrecognized tax benefit will not decrease by a significant amount in the next 12 months.
50
The Company is currently under federal income tax audit for tax year 2016, and by the state of Michigan related to Corporate Income Tax for tax years 2013 through 2016. The Company does not expect either audit to result in a significant adjustment. The Company has been audited for United States income tax purposes through tax year 2013, resulting in no significant adjustments. All tax years after 2014 remain open to adjustment due to use of net operating loss and credit carryforwards in tax years through 2015. The Company is subject to examination for its state tax returns for years 2014 and forward, with the exception of certain net operating losses and credit carryforwards originating in years prior to 2014 that remain subject to adjustment.
|
NOTE 7:
|
EQUITY AND EPS
|
Capital Stock.
Common Stockholders are entitled to elect
four
of the
nine
members of the Board of Directors, while Preferred Stockholders are entitled to elect the remaining
five
members. All directors are elected annually for a
one
year term. Any vacancies on the Board are to be filled only by the shareholders and not by the Board. Shareholders who own
10 percent
or more of the outstanding Common or Preferred Stock have the right to call a special meeting of stockholders. Common Stockholders are not entitled to vote with respect to a merger, dissolution, lease, exchange or sale of substantially all of the Company’s assets, or on an amendment to the Articles of Incorporation, unless such action would increase or decrease the authorized shares or par value of the Common or Preferred Stock, or change the powers, preferences or special rights of the Common or Preferred Stock so as to affect the Common Stockholders adversely. Generally, Common Stockholders and Preferred Stockholders vote as separate classes on all other matters requiring shareholder approval.
EPS.
The computations of basic and diluted EPS:
|
|
Year Ended December 31,
|
||||||||||
|
|
2018
|
2017
|
2016
|
||||||||
|
Operations:
|
|
|
|||||||||
|
Net income
(a)
|
$
|
37,284
|
|
$
|
41,823
|
|
$
|
31,184
|
|
||
|
Less: Income attributable to participating securities (unvested shares and units)
(b)
|
708
|
|
996
|
|
954
|
|
|||||
|
Net income attributable to common shareholders
|
$
|
36,576
|
|
$
|
40,827
|
|
$
|
30,230
|
|
||
|
|
|||||||||||
|
Share information:
|
|||||||||||
|
Basic and diluted weighted average common shares
(c)
|
16,866,176
|
|
16,746,731
|
|
16,643,811
|
|
|||||
|
|
|||||||||||
|
Basic and diluted EPS
|
$
|
2.17
|
|
|
$
|
2.44
|
|
$
|
1.82
|
|
|
|
(a)
|
Net income attributable to all shareholders.
|
|
(b)
|
Participating securities included RSUs of
326,375
,
368,492
, and
527,486
for the years ended
December 31, 2018
,
2017
, and
2016
, respectively.
|
|
(c)
|
Under the two class method, basic weighted average common shares exclude outstanding unvested participating securities.
|
51
|
NOTE 8:
|
COMMITMENTS AND CONTINGENCIES
|
Commitments.
The Company leases railcars and other assets under various operating leases. For railcar leases, which are the majority, the Company is generally required to pay all service costs associated with the railcars. Rental payments include minimum rentals plus contingent amounts based on mileage. Rental expenses under railcar operating leases with terms longer than one month were
$2,081
,
$2,372
, and
$2,561
for the years ended
December 31, 2018
,
2017
, and
2016
, respectively.
The Company's future minimum rental payments are
$2,224
;
$1,858
;
$1,357
;
$977
; and
$481
for the years ending December 31, 2019, 2020, 2021, 2022, and 2023, respectively.
As of October 2018, the Company carries
$10,000
in industrial revenue bonds with the City of Williamstown, Kentucky (the "City") that mature in 2047, and leases back facilities owned by the City that the Company recorded as property, plant, and equipment, net, on its Consolidated Balance Sheet under a capital lease. The lease payment on the facilities is sufficient to pay principal and interest on the bonds. Because the Company owns all of the outstanding bonds, has a legal right to set-off, and intends to set-off the corresponding lease and interest payment, the Company netted the capital lease obligation with the bond asset and, in turn, reflected
no
amount for the obligation or the corresponding asset on its Consolidated Balance Sheet at
December 31, 2018
.
Contingencies.
There are various legal and regulatory proceedings involving the Company and its subsidiaries. The Company accrues estimated costs for a contingency when management believes that a loss is probable and can be reasonably estimated.
A chemical release occurred at the Company's Atchison facility on October 21, 2016, which resulted in emissions venting into the air ("the Atchison Chemical Release"). The Company reported the event to the Environmental Protection Agency ("EPA"), the Occupational, Safety, and Health Administration ("OSHA"), and to Kansas and local authorities on that date, and is cooperating fully to investigate and ensure that all appropriate response actions are taken. The Company has also engaged outside experts to assist the investigation and response. The Company believes it is probable that a fine or penalty may be imposed by regulatory authorities, but it is currently unable to reasonably estimate the amount thereof since some investigations are not complete and could take several months up to a few years to complete. Private plaintiffs have initiated, and additional private plaintiffs may initiate, legal proceedings for damages resulting from the emission, but the Company is currently unable to reasonably estimate the amount of any such damages that might result. The Company's insurance is expected to provide coverage of any damages to private plaintiffs, subject to a deductible of
$250
, but certain regulatory fines or penalties may not be covered and there can be no assurance to the amount or timing of possible insurance recoveries if ultimately claimed by the Company. There was no significant damage to the Company's Atchison plant as a result of this incident. No other MGP facilities, including the distillery in Lawrenceburg, Indiana, were affected by this incident.
OSHA completed its investigation of the Atchison Chemical Release and, on April 19, 2017, issued its penalty to the Company in the amount of
$138
. Management settled this assessment with OSHA in full for
$75
, which was paid on May 16, 2017. A portion, or all, of the penalty amount may be covered by insurance.
The EPA informed the Company on August 1, 2017, that it intends to seek civil penalties of approximately
$250
in connection with its investigation of the Atchison Chemical Release, while offering the Company the opportunity to settle the matter prior to the EPA proceeding with a formal enforcement action. The Company is seeking a negotiated settlement with the EPA, but negotiations have paused pending resolution of the EPA's criminal investigation. Since the Company expects a negotiated resolution of the EPA civil case and EPA-proposed civil penalties are not material to the year ended
December 31, 2018
, the Company has not included an accrual in its results. A portion, or all, of the settled penalty amount may be covered by insurance.
|
NOTE 9:
|
EMPLOYEE BENEFIT PLANS
|
401(k) Plans.
The Company has established 401(k) plans covering all employees after certain eligibility requirements are met. Amounts charged to operations for employer contributions related to the plans totaled
$1,488
,
$1,299
, and
$1,097
for
2018
,
2017
, and
2016
, respectively.
52
Post-Employment Benefits.
The Company sponsors life insurance coverage as well as medical benefits, including prescription drug coverage, to certain retired employees and their spouses. In 2014, the Company made a change to the plan to terminate post-employment health care and life insurance benefits for all union employees except for a specified grandfathered group. At
December 31, 2018
the plan covered
181
participants, both active and retired. The post-employment health care benefit is contributory for spouses under certain circumstances. Otherwise, participant contribution premiums are not required. The health care plan contains fixed deductibles, co-pays, coinsurance, and out-of-pocket limitations. The life insurance segment of the plan is noncontributory and is available to retirees only.
The Company funds the post-employment benefit on a pay-as-you-go basis, and there are no assets that have been segregated and restricted to provide for post-employment benefits. Benefit eligibility for the current remaining grandfathered active group (
25
employees) is age
62
and
five years
of service. The Company pays claims and premiums as they are submitted. The Company provides varied levels of benefits to participants depending upon the date of retirement and the location in which the employee worked. An older group of grandfathered retirees receives lifetime health care coverage. All other retirees receive coverage to age
65
through continuation of the Company group medical plan and a lump sum advance premium to the MediGap carrier of the retiree’s choice. Life insurance is available over the lifetime of the retiree in all cases.
The Company bases its post-employment plan valuation on The Society of Actuaries RPH-2014 Adjusted to 2006 Total Dataset Headcount-weighted Mortality with Scale MP-2018 Full Generational Improvement ("MP-2018 scale"). Based on the 2018 update, the MP-2018 scale reflects a lower level of improvement resulting in shorter assumed life spans. The impact of this change in assumed mortality on post-employment benefits liability was included in the Company's post-employment plan valuation for 2018, and using previous year scales, for
2017
, and
2016
.
The Company’s measurement date is December 31. The Company expects to contribute approximately
$484
, net
$17
for Medicare Part D subsidy receipts, resulting in a net contribution of
$467
to the plan in
2019
.
The status of the Company’s plan at
December 31, 2018
,
2017
, and
2016
:
|
|
Post-Employment Benefit Plan
|
||||||||||||
|
|
December 31,
|
||||||||||||
|
|
2018
|
2017
|
2016
|
||||||||||
|
Change in benefit obligation:
|
|
||||||||||||
|
Beginning of year
|
$
|
3,604
|
|
$
|
4,106
|
|
$
|
4,681
|
|
||||
|
Service cost
|
22
|
|
25
|
|
36
|
|
|||||||
|
Interest cost
|
100
|
|
122
|
|
142
|
|
|||||||
|
Actuarial gain
|
(196
|
)
|
(261
|
)
|
(297
|
)
|
|||||||
|
Benefits paid
|
(421
|
)
|
(388
|
)
|
(456
|
)
|
|||||||
|
Other
|
(47
|
)
|
—
|
|
—
|
|
|||||||
|
Benefit obligation at end of year
|
$
|
3,062
|
|
$
|
3,604
|
|
|
$
|
4,106
|
|
|||
53
Assumptions used to determine accumulated benefit obligations as of year end:
|
|
Post-Employment Benefit Plan
|
||||
|
Year Ended December 31,
|
|||||
|
|
2018
|
2017
|
|||
|
Discount rate
|
3.67%
|
2.96%
|
|||
|
Measurement date
|
December 31,
2018 |
December 31,
2017 |
|||
Assumptions used to determine net benefit cost (credit) for
2018
,
2017
, and
2016
:
|
|
Post-Employment Benefit Plan
|
|||||||||
|
Year Ended December 31,
|
||||||||||
|
|
2018
|
2017
|
2016
|
|||||||
|
Discount rate
|
2.96
|
%
|
3.15
|
%
|
3.20
|
%
|
||||
|
Average compensation increase
|
N/A
|
|
N/A
|
|
N/A
|
|
||||
The discount rate refers to the interest rate used to discount the estimated future benefit payments to their present value, referred to as the benefit obligation. The Company determines the discount rate using a yield curve of high quality fixed income investments whose cash flows match the timing and amount of the Company’s expected benefit payments.
Components of net benefit cost (credit):
|
|
Post-Employment Benefit Plan
|
||||||||||||
|
Year Ended December 31,
|
|||||||||||||
|
|
2018
|
2017
|
2016
|
||||||||||
|
Service cost
|
$
|
22
|
|
$
|
25
|
|
$
|
36
|
|
||||
|
Interest cost
|
100
|
|
122
|
|
142
|
|
|||||||
|
Amortization of unrecognized prior service cost
|
(37
|
)
|
(339
|
)
|
(338
|
)
|
|||||||
|
Amortization of unrecognized net actuarial loss
|
92
|
|
184
|
|
269
|
|
|||||||
|
Net benefit cost (credit)
|
$
|
177
|
|
$
|
(8
|
)
|
|
$
|
109
|
|
|||
54
Changes in plan assets and benefit obligations recognized in accumulated other comprehensive loss in the Consolidated Balance Sheets:
|
|
Post-Employment Benefit Plan
|
||||||||||||
|
Year Ended December 31,
|
|||||||||||||
|
|
2018
|
2017
|
2016
|
||||||||||
|
Net actuarial gain
|
$
|
196
|
|
$
|
261
|
|
$
|
293
|
|
||||
|
Amortization of unrecognized net actuarial loss
|
92
|
|
184
|
|
269
|
|
|||||||
|
Amortization of unrecognized prior service cost
|
(37
|
)
|
(339
|
)
|
(338
|
)
|
|||||||
|
Stranded tax effects from the Tax Act and Other
|
(78
|
)
|
—
|
|
—
|
|
|||||||
|
Other
|
47
|
|
—
|
|
—
|
|
|||||||
|
Total other comprehensive income, pre-tax
|
220
|
|
106
|
|
|
224
|
|
||||||
|
Income tax expense
|
73
|
|
40
|
|
90
|
|
|||||||
|
Total other comprehensive income, net of tax
|
|
$
|
147
|
|
$
|
66
|
|
|
$
|
134
|
|
||
Benefit obligation recognized in the Consolidated Balance Sheets:
|
|
Post-Employment Benefit Plan
|
||||||||
|
As of December 31,
|
|||||||||
|
Benefit obligation
|
2018
|
2017
|
|||||||
|
Current
|
$
|
(467
|
)
|
$
|
(471
|
)
|
|||
|
Non-Current
|
(2,595
|
)
|
(3,133
|
)
|
|||||
|
Net amount recognized
|
$
|
(3,062
|
)
|
$
|
(3,604
|
)
|
|||
The estimated amount that will be recognized from accumulated other comprehensive income (loss) into net periodic benefit cost during
2019
:
|
|
Post-Employment Benefit Plan
|
|||
|
Actuarial net loss
|
$
|
(23
|
)
|
|
|
Net prior service credits
|
15
|
|
||
|
Net amount recognized
|
$
|
(8
|
)
|
|
The assumed average annual rate of increase in the per capita cost of covered benefits (health care cost trend rate):
|
|
Post-Employment Benefit Plan
|
|||||||||||||||||
|
Year Ended December 31,
|
||||||||||||||||||
|
2018
|
2017
|
|||||||||||||||||
|
Group Plan
|
Lifetime Prescription Cost
|
Medicare Supplement
|
Group Plan
|
Lifetime Prescription Cost
|
Medicare Supplement
|
|||||||||||||
|
Health care cost trend rate
|
7.00
|
%
|
9.00
|
%
|
4.50
|
%
|
7.00
|
%
|
9.00
|
%
|
4.50
|
%
|
||||||
|
Ultimate trend rate
|
5.00
|
%
|
5.00
|
%
|
4.50
|
%
|
5.00
|
%
|
5.00
|
%
|
4.50
|
%
|
||||||
|
Year rate reaches ultimate trend rate
|
2025
|
|
2027
|
|
2019
|
|
2025
|
|
2027
|
|
2018
|
|
||||||
55
A
one
percentage point increase (decrease) in the assumed health care cost trend rate would have increased (decreased) the accumulated benefit obligation by
$69
($104)
at
December 31, 2018
and the service and interest cost would have increased (decreased) by
$4
($3)
for the year ended
December 31, 2018
.
As of
December 31, 2018
, the following expected benefit payments (net of Medicare Part D subsidiary for Post-Employment Benefit Plan Payments) and the related expected subsidy receipts that reflect expected future service, as appropriate, are expected to be paid to plan participants:
|
|
Post-Employment Benefit Plan
|
|||||||
|
|
Expected Benefit
Payments
|
Expected Subsidy
Receipts
|
||||||
|
2019
|
$
|
484
|
|
$
|
17
|
|
||
|
2020
|
468
|
|
15
|
|
||||
|
2021
|
438
|
|
14
|
|
||||
|
2022
|
426
|
|
13
|
|
||||
|
2023
|
376
|
|
11
|
|
||||
|
2024-2028
|
961
|
|
34
|
|
||||
|
Total
|
$
|
3,153
|
|
$
|
104
|
|
||
Share-Based Compensation Plans.
As of
December 31, 2018
, the Company was authorized to issue
40,000,000
shares of Common Stock and had a treasury share balance of
1,259,551
at
December 31, 2018
.
The Company currently has
two
active share-based compensation plans: the Employee Equity Incentive Plan of 2014 (the "2014 Plan") and the Non-Employee Director Equity Incentive Plan (the "Directors' Plan"). The plans were approved by shareholders at the Company's annual meeting in May 2014. The 2014 Plan replaced the 2004 Plan. Detail of activities in both plans follows below.
The Company’s share-based compensation plans provide for the awarding of stock options, stock appreciation rights, and shares of restricted stock and RSUs for senior executives and salaried employees, as well as for outside directors. Compensation expense related to restricted stock awards is based on the market price of the stock on the date the Board of Directors communicates the approved award and is amortized over the vesting period of the restricted stock award. The Consolidated Statements of Income for
2018
,
2017
, and
2016
reflect total share-based compensation costs and director fees for awarded grants of
$2,612
,
$2,245
,
$2,402
, respectively, related to these plans.
For long-term incentive awards to be granted in the form of RSUs in 2019 based on 2018 results, the Human Resources and Compensation Committee ("HRCC") determined that the grants would have performance conditions that would be based on the same performance metrics as the Short-Term Incentive Plan (the "STI Plan"). The performance metrics are operating income, earnings before interest, taxes, depreciation, and amortization ("EBITDA"), and EPS. Because management determined at the beginning of 2018 that the performance metrics would most likely be met, amortization of the estimated dollar pool of RSUs to be awarded based on 2018 results was started in the first quarter over an estimated
48
month period, including
12 months
to the grant date and an additional
36 months
to the vesting date. The Consolidated Statements of Income for
2018
,
2017
, and
2016
reflects share-based compensation costs for grants to be awarded of
$821
,
$491
, and
$317
, respectively.
At the Company's annual meeting in May 2014, shareholders approved a new Employee Stock Purchase Plan (the "ESPP Plan") with
300,000
shares registered for employee purchase. The ESPP Plan is not active at this time. The Company's former employee stock purchase plan continued in use until its termination during 2017.
2014 Plan
The 2014 Plan, with
1,500,000
shares registered for future grants, provides that vesting occurs pursuant to the time period specified in the particular award agreement approved for that issuance of RSUs, which is to be not less than
three years
unless vesting is accelerated due to the occurrence of certain events. As of
December 31, 2018
,
321,131
RSUs had been granted of the
1,500,000
shares approved for under the 2014 Plan.
56
Directors' Plan
The Director's Plan, with
300,000
shares registered for future grants, provides that vesting occurs pursuant to the time period specified in the particular award agreement approved for that issuance of equity. As of
December 31, 2018
,
69,900
shares were granted of the
300,000
shares approved for grants under the Directors' Plan and all
69,900
shares were vested.
2004 Plan
Under the 2004 Plan, as amended, the Company granted incentives (including stock options and restricted stock awards) for up to
2,680,000
shares of the Company’s Common Stock to salaried, full time employees, including executive officers. The term of each award generally was determined by the committee of the Board of Directors charged with administering the 2004 Plan. Under the terms of the 2004 Plan, any options granted were non-qualified stock options, exercisable within
ten
years and had an exercise price of not less than the fair value of the Company’s Common Stock on the date of the grant. As of
December 31, 2018
,
no
stock options and
no
unvested restricted stock shares (net of forfeitures) remained outstanding under the 2004 Plan.
No
future grants can be made under the 2004 Plan.
In connection with the Reorganization, the 2004 Plan was amended to provide for grants in the form of RSUs. The awards entitle participants to receive shares of stock following the end of a
five
year vesting period. Participants have no voting of dividend rights under the awards that were granted; however, the awards provide for payment of dividend equivalents when dividends are paid to stockholders. As of
December 31, 2018
,
145,000
unvested RSUs remained under the 2004 Plan that will vest in January 2019. As of
December 31, 2018
,
no
RSU awards were available for future grants under the 2004 Plan.
RSUs.
Summary of unvested RSUs under the Company’s share-based compensation plans for
2018
,
2017
, and
2016
:
|
Year Ended December 31,
|
|||||||||||||||||||||
|
|
2018
|
2017
|
2016
|
||||||||||||||||||
|
|
Units
|
Weighted Average
Grant-Date Fair Value |
Units
|
Weighted Average
Grant-Date Fair Value |
Units
|
Weighted Average
Grant-Date Fair Value |
|||||||||||||||
|
Unvested balance at beginning of year
|
368,492
|
|
$
|
17.20
|
|
527,486
|
|
$
|
10.17
|
|
437,946
|
|
$
|
7.09
|
|
||||||
|
Granted
|
42,136
|
|
78.37
|
|
47,514
|
|
42.93
|
|
100,892
|
|
23.15
|
|
|||||||||
|
Forfeited
|
(1,080
|
)
|
28.30
|
|
(3,508
|
)
|
25.74
|
|
(11,352
|
)
|
11.55
|
|
|||||||||
|
Vested
|
(80,343
|
)
|
15.42
|
|
(203,000
|
)
|
4.82
|
|
—
|
|
—
|
|
|||||||||
|
Unvested balance at end of year
|
329,205
|
|
$
|
25.42
|
|
368,492
|
|
$
|
17.20
|
|
527,486
|
|
$
|
10.17
|
|
||||||
During
2018
,
2017
, and
2016
, the total grant date fair value of RSU awards vested was
$1,239
,
$979
, and
$0
, respectively. As of
December 31, 2018
there was
$2,779
of total estimated unrecognized compensation costs (net of estimated forfeitures) related to granted RSU awards. These costs are expected to be recognized over a weighted average period of approximately
1.8 years
.
Upon their vesting, the Company purchased restricted stock and RSUs from employees to cover associated withholding taxes. Total treasury stock purchases added
27,214
shares for
$2,324
in 2018;
74,132
shares for
$4,663
in 2017; and
40,870
shares for
$1,518
in 2016.
Annual Cash Incentive Plan.
The STI Plan, effective January 1, 2014, is designed to motivate and retain the Company's officers and employees and tie short-term incentive compensation to achievement of certain profitability goals by the Company. Pursuant to the STI Plan, short-term incentive compensation is dependent on the achievement of certain performance metrics by the Company, established by the Board of Directors. Each performance metric is calculated in accordance with the rules approved by the HRCC, which may adjust the results to eliminate unusual items. For
2018
,
2017
, and
2016
, the performance metrics were operating income, EBITDA, and EPS. Operating income for the performance metric was defined as reported GAAP operating income adjusted for certain discretionary items as determined by the Company's management, if applicable ("adjusted operating income"). The HRCC determines the officers and employees eligible to participate under the STI Plan for the plan year as well as the target annual incentive compensation for each participant for each plan year.
Amounts expensed under the STI Plan totaled
$5,581
,
$5,150
, and
$3,394
for
2018
,
2017
, and
2016
, respectively.
57
Deferred Compensation Plan.
The Company established an unfunded Executive Deferred Compensation Plan effective as of June 30, 2018, with a purpose to attract and retain highly-compensated key employees by providing participants with an opportunity to defer receipt of a portion of their salary, bonus, and other specified compensation. The Company's obligations under this plan will change in conjunction with the performance of the participants' investments, along with contributions to and withdrawals from the plan. For 2018, participants were only able to direct the deferral of the receipt of a portion of their 2018 STI Plan amounts that are to be paid in early 2019 (see detail above). At the time of payment in 2019, the amounts elected for deferral will be deposited into the plan by the Company and allocated by participants among Company-determined investment options.
The current portion of deferred compensation plan deferrals is comprised of estimated amounts to be paid within one year depending on timing of planned disbursements. At
December 31, 2018
, all
$1,176
of participant 2018 STI Plan deferrals were expensed currently in the year earned. Based on expected planned disbursements, all were considered non-current and were included in Other noncurrent liabilities on the Company's 2018 Consolidated Balance Sheet.
|
NOTE 10:
|
CONCENTRATIONS
|
Significant customers.
For
2018
,
2017
, and
2016
, the Company had
no
sales to an individual customer that accounted for more than
10 percent
of consolidated net sales. During the years
2018
,
2017
, and
2016
, the Company’s
ten
largest customers accounted for approximately
40 percent
,
39 percent
, and
36 percent
of consolidated net sales, respectively.
Significant suppliers.
For
2018
, the Company had purchases from
two
grain suppliers that approximated
29 percent
of consolidated purchases. The Company also purchased food grade alcohol from Pacific Ethanol of approximately
12 percent
of consolidated purchases. In addition, the Company's
10
largest suppliers, including these
three
suppliers, accounted for approximately
68 percent
of consolidated purchases.
For
2017
, the Company had purchases from
two
grain suppliers that approximated
29 percent
of consolidated purchases. In addition, the Company's
10
largest suppliers accounted for approximately
65 percent
of consolidated purchases.
For
2016
, the Company had purchases from
two
grain suppliers that approximated
31 percent
of consolidated purchases. In addition, the Company’s
10
largest suppliers accounted for approximately
63 percent
of consolidated purchases.
|
NOTE 11:
|
OPERATING SEGMENTS
|
At
December 31, 2018
and
2017
, the Company had
two
segments: distillery products and ingredient solutions. The distillery products segment consists of food grade alcohol and distillery co-products, such as distillers feed (commonly called dried distillers grain in the industry) and fuel grade alcohol. The distillery products segment also includes warehouse services, including barrel put away, barrel storage, and barrel retrieval services. Ingredient solutions consists of specialty starches and proteins and commodity starches and proteins.
Operating profit for each segment is based on net sales less identifiable operating expenses. Non-direct SG&A, interest expense, earnings from the Company's equity method investments until sold on July 3, 2017, other special charges, and other general miscellaneous expenses are excluded from segment operations and are classified as Corporate. Receivables, inventories, and equipment have been identified with the segments to which they relate. All other assets are considered as Corporate.
58
|
|
Year Ended December 31,
|
||||||||||
|
|
2018
|
2017
|
2016
|
||||||||
|
Net sales to customers:
|
|
||||||||||
|
Distillery products
|
$
|
314,055
|
|
$
|
291,008
|
|
$
|
265,243
|
|
||
|
Ingredient solutions
|
62,034
|
|
56,440
|
|
53,020
|
|
|||||
|
Total
(a)
|
$
|
376,089
|
|
$
|
347,448
|
|
$
|
318,263
|
|
||
|
|
|||||||||||
|
Gross profit:
|
|||||||||||
|
Distillery products
|
$
|
71,793
|
|
$
|
66,817
|
|
$
|
56,836
|
|
||
|
Ingredient solutions
|
11,806
|
|
9,199
|
|
8,447
|
|
|||||
|
Total
|
$
|
83,599
|
|
$
|
76,016
|
|
$
|
65,283
|
|
||
|
Depreciation and amortization:
|
|||||||||||
|
Distillery products
|
$
|
8,739
|
|
$
|
8,490
|
|
$
|
8,371
|
|
||
|
Ingredient solutions
|
1,567
|
|
1,660
|
|
1,655
|
|
|||||
|
Corporate
|
1,056
|
|
1,158
|
|
1,227
|
|
|||||
|
Total
|
$
|
11,362
|
|
$
|
11,308
|
|
$
|
11,253
|
|
||
|
|
|||||||||||
|
Income (loss) before income taxes:
|
|||||||||||
|
Distillery products
|
$
|
64,791
|
|
$
|
60,424
|
|
$
|
53,583
|
|
||
|
Ingredient solutions
|
9,336
|
|
6,613
|
|
5,836
|
|
|||||
|
Corporate
|
(25,147
|
)
|
(14,279
|
)
|
(14,702
|
)
|
|||||
|
Total
|
$
|
48,980
|
|
$
|
52,758
|
|
$
|
44,717
|
|
||
|
(a)
|
Net sales revenue from foreign sources totaled
$19,782
,
$22,870
,
and
$22,422
for
2018
,
2017
, and
2016
, respectively, and is largely derived from Japan, Thailand, and Canada. The balance of total net sales revenue is from domestic sources.
|
|
|
December 31,
|
|||||||
|
|
2018
|
2017
|
||||||
|
Identifiable Assets
|
|
|||||||
|
Distillery products
|
$
|
223,890
|
|
$
|
191,321
|
|
||
|
Ingredient solutions
|
35,147
|
|
28,950
|
|
||||
|
Corporate
|
18,855
|
|
20,057
|
|
||||
|
Total
(a)
|
$
|
277,892
|
|
|
$
|
240,328
|
|
|
|
(a)
|
The Company has no assets located in foreign countries.
|
|
NOTE 12:
|
SUPPLEMENTAL CASH FLOW INFORMATION
|
|
Year Ended December 31,
|
|||||||||||
|
|
2018
|
2017
|
2016
|
||||||||
|
Non-cash investing and financing activities:
|
|||||||||||
|
Purchase of property, plant, and equipment in accounts payable
|
$
|
2,389
|
|
$
|
4,522
|
|
$
|
4,364
|
|
||
|
Additional cash payment information:
|
|||||||||||
|
Interest paid
|
1,578
|
|
1,489
|
|
1,467
|
|
|||||
|
Income taxes paid
|
8,818
|
|
13,526
|
|
16,409
|
|
|||||
59
|
NOTE 13:
|
DERIVATIVE INSTRUMENTS
|
Certain commodities the Company uses in its production process, or input costs, exposes it to market price risk due to volatility in the prices for those commodities. Through the Company's grain supply contracts for its Atchison and Lawrenceburg facilities, its wheat flour supply contract for the Atchison facility, and its natural gas contracts for both facilities, it purchases grain, wheat flour, and natural gas, respectively, for delivery from
one
to
24
months into the future at negotiated prices. The Company has determined that the firm commitments to purchase grain, wheat flour, and natural gas under the terms of its supply contracts meets the normal purchases and sales exception as defined under ASC 815,
Derivatives and Hedging
, because the quantities involved are for amounts to be consumed within the normal expected production process.
|
NOTE 14:
|
RELATED PARTY TRANSACTIONS
|
In 2018, Pacific Ethanol (formerly ICP) was not a related party of the Company (Note 4). During
2017
and
2016
, related party purchases by the Company from ICP were approximately
$18,425
and
$29,596
, respectively, that were included in cost of sales on the Company's Consolidated Statements of Income.
In June 2017, the Company received cash dividend distributions from ICP totaling
$7,430
, which reduced its investment in ICP (Note 4).
On February 26, 2016, the Company received a cash dividend distribution from ICP of
$3,300
, which was its
30 percent
ownership share of the total distribution.
60
|
NOTE 15:
|
QUARTERLY FINANCIAL DATA (UNAUDITED)
|
|
|
Year Ended December 31, 2018
|
||||||||||||||
|
|
Fourth
Quarter
|
Third
Quarter
|
Second
Quarter
|
First
Quarter
|
|||||||||||
|
Net sales
|
$
|
104,850
|
|
$
|
95,031
|
|
$
|
88,252
|
|
$
|
87,956
|
|
|||
|
Cost of sales
|
79,242
|
|
75,432
|
|
68,811
|
|
69,005
|
|
|||||||
|
Gross profit
|
25,608
|
|
19,599
|
|
19,441
|
|
18,951
|
|
|||||||
|
SG&A expenses
|
8,996
|
|
7,584
|
|
8,309
|
|
8,562
|
|
|||||||
|
Operating income
|
16,612
|
|
12,015
|
|
11,132
|
|
10,389
|
|
|||||||
|
Interest expense, net
|
(338
|
)
|
(334
|
)
|
(289
|
)
|
(207
|
)
|
|||||||
|
Income before income taxes
|
16,274
|
|
11,681
|
|
10,843
|
|
10,182
|
|
|||||||
|
Income tax expense (Note 6)
|
4,452
|
|
2,673
|
|
3,316
|
|
1,255
|
|
|||||||
|
Net income
|
$
|
11,822
|
|
$
|
9,008
|
|
$
|
7,527
|
|
$
|
8,927
|
|
|||
|
Basic and diluted EPS data
|
$
|
0.69
|
|
$
|
0.52
|
|
$
|
0.44
|
|
$
|
0.52
|
|
|||
|
Dividends and dividend equivalents per common share and per unit
|
$
|
0.08
|
|
$
|
0.08
|
|
$
|
0.08
|
|
$
|
0.08
|
|
|||
|
|
Year Ended December 31, 2017
|
||||||||||||||
|
|
Fourth
Quarter
|
Third
Quarter
|
Second
Quarter
|
First
Quarter
|
|||||||||||
|
Net sales
|
$
|
88,193
|
|
$
|
86,333
|
|
$
|
85,753
|
|
$
|
87,169
|
|
|||
|
Cost of sales
|
68,668
|
|
67,708
|
|
66,928
|
|
68,128
|
|
|||||||
|
Gross profit
|
19,525
|
|
18,625
|
|
18,825
|
|
19,041
|
|
|||||||
|
SG&A expenses
|
8,993
|
|
8,154
|
|
8,311
|
|
7,649
|
|
|||||||
|
Operating income
|
10,532
|
|
10,471
|
|
10,514
|
|
11,392
|
|
|||||||
|
Gain on sale of equity method investment (Note 4)
(a)
|
—
|
|
11,381
|
|
—
|
|
—
|
|
|||||||
|
Equity method investment earnings (loss) (Note 4)
|
—
|
|
—
|
|
(819
|
)
|
471
|
|
|||||||
|
Interest expense, net
|
(250
|
)
|
(224
|
)
|
(379
|
)
|
(331
|
)
|
|||||||
|
Income before income taxes
|
10,282
|
|
21,628
|
|
9,316
|
|
11,532
|
|
|||||||
|
Income tax expense (benefit) (Note 6)
(b)
|
(2,357
|
)
|
7,491
|
|
2,947
|
|
2,854
|
|
|||||||
|
Net income
|
$
|
12,639
|
|
$
|
14,137
|
|
$
|
6,369
|
|
$
|
8,678
|
|
|||
|
Basic and diluted EPS data
(c)
|
$
|
0.74
|
|
$
|
0.82
|
|
$
|
0.37
|
|
$
|
0.50
|
|
|||
|
Dividends and dividend equivalents per common share and per unit
|
$
|
0.04
|
|
$
|
0.89
|
|
$
|
0.04
|
|
$
|
0.04
|
|
|||
|
(a)
|
Net income was positively impacted during the third quarter of 2017 by a gain on sale of equity method investment of
$11,381
related to the sale of the Company's equity ownership interest in ICP to Pacific Ethanol on July 3, 2017 (Note 4).
|
|
(b)
|
Net income was positively impacted during the fourth quarter of 2017 by a provisional income tax benefit of
$3,343
related to the Tax Act enacted on December 22, 2017 (Note 6).
|
|
(c)
|
Quarterly EPS amounts may not add to amounts for the year because quarterly and annual EPS calculations are performed separately.
|
61
|
NOTE 16:
|
SUBSEQUENT EVENTS
|
Share Repurchase
On February 25, 2019, the Board of Directors approved a
$25,000
share repurchase authorization commencing February 27, 2019 through February 27, 2022. Under the share repurchase program, the company can repurchase stock from time to time for cash in open market purchases, block transactions, and privately negotiated transactions in accordance with applicable federal securities laws. This share repurchase program may be modified, suspended, or terminated by the company at any time without prior notice.
Dividend Declaration
On February 25, 2019, the Board of Directors declared a quarterly dividend payable to stockholders of record as of March 13, 2019, of our Common Stock and a dividend equivalent payable to holders of certain RSUs as of March 13, 2019, of
$0.10
per share and per unit. The dividend payment and dividend equivalent payment will occur on March 29, 2019.
ITEM 9. CHANGES IN AND DISAGREEMENTS WITH ACCOUNTANTS ON ACCOUNTING AND FINANCIAL DISCLOSURE
Not applicable.
ITEM 9A. CONTROLS AND PROCEDURES
EVALUATION OF DISCLOSURE CONTROLS AND PROCEDURES
As of the end of the fiscal year, our Chief Executive Officer and Chief Financial Officer have each reviewed and evaluated the effectiveness of our disclosure controls and procedures (as defined in Rules 13a-15(e) and 15d-15(e) under the Exchange Act). Based on that evaluation, the Chief Executive Officer and Chief Financial Officer have each concluded that our current disclosure controls and procedures are effective to ensure that information required to be disclosed by the Company in reports that it files or submits under the Exchange Act is recorded, processed, summarized and reported within the time periods specified in the SEC rules and forms, and include controls and procedures designed to ensure that information required to be disclosed by the Company in such reports is accumulated and communicated to the Company’s management, including the Chief Executive Officer and Chief Financial Officer, as appropriate, to allow timely decisions regarding required disclosure.
REPORT ON INTERNAL CONTROLS
Management’s Annual Report on Internal Control Over Financial Reporting and our independent registered public accounting firm’s attestation report on our internal control over financial reporting can be found under
Item 8. Financial Statements and Supplementary Data
.
CHANGES IN INTERNAL CONTROLS
There has been no change in the Company’s internal control over financial reporting required by Exchange Act Rule 13a-15 that occurred during
2018
that has materially affected, or is reasonably likely to materially affect MGP Ingredients, Inc.’s internal control over financial reporting.
ITEM 9B. OTHER INFORMATION
None.
62
PART III
ITEM 10. DIRECTORS, EXECUTIVE OFFICERS AND CORPORATE GOVERNANCE
Incorporated by reference to the information under
Election of Directors,
Corporate Governance and Committee Reports - The Board; Standing Committees; Meetings; Independence,
Corporate Governance and Committee Reports - Audit Committee,
and
Section 16(a) Beneficial Ownership Reporting Compliance
of the Proxy Statement.
The Company has adopted a code of conduct (ethics) that applies to all its employees, including the principal executive officer, principal financial officer, principal accounting officer or controller or persons performing similar functions. A current copy is filed on the Company's website at www.mgpingredients.com. The Company intends to disclose any changes in, or waivers from, this code of conduct by posting such information on the same website or by filing a Current Report on Form 8-K, in each case to the extent such disclosure is required by applicable rules.
ITEM 11. EXECUTIVE COMPENSATION
Incorporated by reference to the information in
Executive Compensation and Other Information, Corporate Governance and Committee Reports - The Board; Standing Committees; Meetings; Independence
and
Corporate Governance and Committee Reports - Compensation Committee Interlocks and Insider Participation
of the Proxy Statement.
ITEM 12. SECURITY OWNERSHIP OF CERTAIN BENEFICIAL OWNERS AND MANAGEMENT AND RELATED STOCKHOLDER MATTERS
Incorporated by reference to the information under
Principal Stockholders
of the Proxy Statement.
The following is a summary of securities authorized for issuance under equity compensation plans as of
December 31, 2018
:
|
|
(1) Number of shares to be issued upon exercise of outstanding options, warrants, and rights
|
(2) Weighted average of exercise price of outstanding options, warrants, and rights
|
(3) Number of securities remaining available for future issuance under equity compensation plans (excluding securities reflected in column
(1))
|
||||||
|
Equity compensation plans approved by security holders
|
329,205
|
|
$
|
25.42
|
|
1,408,969
|
|
||
|
Equity compensation plans not approved by security holders
|
—
|
|
—
|
|
—
|
|
|||
|
Total
|
329,205
|
|
$
|
25.42
|
|
1,408,969
|
|
||
63
ITEM 13. CERTAIN RELATIONSHIPS AND RELATED TRANSACTIONS, AND DIRECTOR INDEPENDENCE
Incorporated by reference to the information under
Corporate Governance and Committee Reports – The Board; Standing Committees; Meetings; Independence
and to the information under
Related Transactions
of the Proxy Statement.
ITEM 14. PRINCIPAL ACCOUNTANT FEES AND SERVICES
Incorporated by reference to the information under
Audit and Certain Other Fees Paid Accountants
of the Proxy Statement.
64
PART IV
ITEM 15. EXHIBITS AND FINANCIAL STATEMENT SCHEDULES
(a) The following financial statements are filed as part of this report:
|
•
|
Management's Report on Internal Control over Financial Reporting.
|
|
▪
|
Report of Independent Registered Public Accounting Firm on the Consolidated Financial Statements and Internal Control over Financial Reporting.
|
|
▪
|
Consolidated Statements of Income – Years Ended
December 31, 2018
,
2017
, and
2016
.
|
Consolidated Statements of Comprehensive Income – Years Ended
December 31, 2018
,
2017
, and
2016
.
|
•
|
Consolidated Balance Sheets -
December 31, 2018
and
2017
.
|
|
•
|
Consolidated Statements of Cash Flows – Years Ended
December 31, 2018
,
2017
, and
2016
.
|
|
▪
|
Consolidated Statements of Changes in Stockholders’ Equity – Years Ended
December 31, 2018
,
2017
, and
2016
.
|
|
▪
|
Notes to Consolidated Financial Statements - Years Ended
December 31, 2018
,
2017
, and
2016
.
|
(b) Financial Statement Schedules:
We have omitted all other schedules for which provision is made in the applicable accounting regulations of the SEC either because they are not required under the related instructions, because the information required is included in the consolidated financial statements and notes thereto, or because they do not apply.
(c) The exhibits required by Item 601 of Regulation S-K are set forth in the Exhibit Index below.
65
EXHIBIT LIST
|
2.1
|
|
|
2.2
|
|
|
2.3
|
|
|
3.1.1
|
|
|
3.1.2
|
|
|
3.1.3
|
|
|
3.2
|
|
|
4.1
|
|
|
4.1.1
|
|
|
4.1.2
|
|
|
4.2
|
|
|
4.3
|
|
|
4.4
|
|
|
10.1*
|
|
|
10.2.1*
|
|
|
10.3.2*
|
|
|
10.4*
|
|
|
10.5*
|
|
66
|
10.6*
|
|
|
10.7*
|
|
|
10.8*
|
|
|
10.9*
|
|
|
10.10*
|
|
|
10.11*
|
|
|
10.12*
|
|
|
10.13*
|
|
|
10.14* **
|
|
|
21**
|
|
|
23.1**
|
|
|
24
|
|
|
31.1**
|
|
|
31.2**
|
|
|
32.1**
|
|
|
32.2**
|
|
|
101**
|
|
* Management contract or compensatory plan or arrangement ** Filed herewith
ITEM 16. FORM 10-K SUMMARY
None.
67
SIGNATURES
Pursuant to requirements of Section 13 or 15(d) of the Securities Exchange Act of 1934, the Registrant has duly caused this report to be signed on its behalf by the undersigned, thereunto duly authorized, in the city of Atchison, State of Kansas, on this
27th
day of
February
, 2019.
|
|
MGP INGREDIENTS, INC.
|
|
|
|
|
|
|
By
|
/s/ Augustus C. Griffin
|
|
|
Augustus C. Griffin, President and Chief Executive Officer (Principal Executive Officer)
|
||
|
|
|
|
|
|
By
|
/s/ Thomas K. Pigott
|
|
|
Thomas K. Pigott, Vice President, Finance and Chief Financial Officer (Principal Financial Officer and Principal Accounting Officer)
|
|
68
POWER OF ATTORNEY
KNOW ALL MEN BY THESE PRESENTS, that each person whose signature appears below constitutes and appoints Augustus C. Griffin and Thomas K. Pigott each of them, his true and lawful attorneys-in-fact and agents, with full power of substitution and re-substitution, for him and in his name, place and stead, in any, and all, capacities, and to sign any, and all, reports of the Registrant on Form 10-K and to sign any, and all, amendments to such reports and to file the same with all exhibits thereto, and other documents in connection therewith, with the Securities & Exchange Commission, granting unto said attorneys-in-fact and agents, and each of them, full power and authority to do and perform each and every act and thing requisite or necessary to be done in and about the premises, as fully to all intents and purposes as he might or could do in person, hereby ratifying and confirming all that said attorneys-in-fact and agents or any of them, or their or his substitute or substitutes, may lawfully do or cause to be done by virtue hereof.
Pursuant to the requirements of the Securities Exchange Act of 1934, this report has been signed below by the following persons on behalf of the Registrant in the capacities indicated on the dates indicated.
|
Name
|
Title
|
Date
|
|
/s/Augustus C. Griffin
|
||
|
Augustus C. Griffin
|
President and Chief Executive Officer (Principal Executive Officer) and Director
|
February 27, 2019
|
|
/s/ Thomas K. Pigott
|
||
|
Thomas K. Pigott
|
Vice President, Finance and Chief Financial Officer (Principal Financial Officer and Principal Accounting Officer)
|
February 27, 2019
|
|
/s/ James L. Bareuther
|
||
|
James L. Bareuther
|
Director
|
February 27, 2019
|
|
/s/ David J. Colo
|
||
|
David J. Colo
|
Director
|
February 27, 2019
|
|
/s/ Terrence P. Dunn
|
||
|
Terrence P. Dunn
|
Director
|
February 27, 2019
|
|
/s/ Anthony P. Foglio
|
||
|
Anthony P. Foglio
|
Director
|
February 27, 2019
|
|
/s/ George W. Page, Jr.
|
||
|
George W. Page, Jr.
|
Director
|
February 27, 2019
|
|
/s/ Karen Seaberg
|
||
|
Karen Seaberg
|
Director
|
February 27, 2019
|
|
/s/ M. Jeannine Strandjord
|
||
|
M. Jeannine Strandjord
|
Director
|
February 27, 2019
|
|
/s/ Lynn Jenkins
|
||
|
Lynn Jenkins
|
Director
|
February 27, 2019
|
69
TABLE OF CONTENTS
Part IItem 1. BusinessItem 1A. Risk FactorsItem 1B. Unresolved Staff CommentsItem 2. PropertiesItem 1. Business - Transportation and Item 1. Business - EnergyItem 3. Legal ProceedingsItem 4. Mine Safety DisclosuresPart IIItem 5. Market For Registrant S Common Equity, Related Stockholders Matters, and Issuer Purchases Of Equity SecuritiesPart OfItem 6. Selected Financial DataItem 7. Management S Discussion and Analysis Of Financial Condition and Results Of OperationsItem Is Net Of Tax Based on The Effective Tax Rate For The TransactionItem 7A. Quantitative and Qualitative Disclosures About Market RiskItem 8. Financial Statements and Supplementary DataNote 1:nature Of Operations and Summary Of Significant Accounting PoliciesNote 2:other Balance Sheet CaptionsNote 3:revenueNote 4:equity Method InvestmentsNote 5:corporate BorrowingsNote 6:income TaxesNote 7:equity and EpsNote 8:commitments and ContingenciesNote 9:employee Benefit PlansNote 10:concentrationsNote 11:operating SegmentsNote 12:supplemental Cash Flow InformationNote 13:derivative InstrumentsNote 14:related Party TransactionsNote 15:quarterly Financial Data (unaudited)Note 16:subsequent EventsItem 9. Changes in and Disagreements with Accountants on Accounting and Financial DisclosureItem 9A. Controls and ProceduresItem 9B. Other InformationPart IIIItem 10. Directors, Executive Officers and Corporate GovernanceItem 11. Executive CompensationItem 12. Security Ownership Of Certain Beneficial Owners and Management and Related Stockholder MattersItem 13. Certain Relationships and Related Transactions, and Director IndependenceItem 14. Principal Accountant Fees and ServicesPart IVItem 15. Exhibits and Financial Statement SchedulesItem 16. Form 10-k Summary