M/I HOMES, INC.
10-Ks and 10-Qs
|
|
|
|
|
|
|
|
|
|
|
|
|
|
|
|
|
|
|
|
|
|
|
|
|
|
|
|
|
|
|
|
|
|
|
|
|
|
|
|
|
|
|
|
|
|
|
|
|
|
|
|
|
|
|
|
|
|
|
UNITED STATES
SECURITIES AND EXCHANGE COMMISSION
Washington, D.C. 20549
FORM 10-K
|
x
|
ANNUAL REPORT PURSUANT TO SECTION 13 OR 15(d) OF THE SECURITIES EXCHANGE ACT OF 1934
|
For the Fiscal Year Ended
December 31, 2018
|
o
|
TRANSITION REPORT PURSUANT TO SECTION 13 OR 15(d) OF THE SECURITIES EXCHANGE ACT OF 1934
|
For the transition period from ________ to ________
Commission File Number 1-12434
M/I HOMES, INC
.
(Exact name of registrant as specified in it charter)
|
Ohio
|
31-1210837
|
|||
|
(State or other jurisdiction of incorporation or organization)
|
(I.R.S. Employer Identification No.)
|
|||
|
3 Easton Oval, Suite 500, Columbus, Ohio 43219
|
|
(Address of principal executive offices) (Zip Code)
|
|
(614) 418-8000
|
|
(Registrant's telephone number, including area code)
|
|
Title of each class
|
|
Name of each exchange on which registered
|
|
Common Shares, par value $.01
|
|
New York Stock Exchange
|
Securities registered pursuant to Section 12(g) of the Act: None.
Indicate by check mark if the registrant is a well-known seasoned issuer, as defined in Rule 405 of the Securities Act.
|
Yes
|
X
|
No
|
||
Indicate by check mark if the registrant is not required to file reports pursuant to Section 13 or Section 15(d) of the Act.
|
Yes
|
No
|
X
|
||
Indicate by check mark whether the registrant (1) has filed all reports required to be filed by Section 13 or 15(d) of the Securities Exchange Act of 1934 during the preceding 12 months (or for such shorter period that the registrant was required to file such reports), and (2) has been subject to such filing requirements for the past 90 days.
|
Yes
|
X
|
No
|
||
Indicate by check mark whether the registrant has submitted electronically every Interactive Data File required to be submitted pursuant to Rule 405 of Regulation S-T (§232.405 of this chapter) during the preceding 12 months (or for such shorter period that the registrant was required to submit such files).
|
Yes
|
X
|
No
|
||
Indicate by check mark if disclosure of delinquent filers pursuant to Item 405 of Regulation S-K (§229.405 of this chapter) is not contained herein, and will not be contained, to the best of registrant’s knowledge, in definitive proxy or information statements incorporated by reference in Part III of this Form 10-K or any amendment to this Form 10-K. [ X ]
Indicate by check mark whether the registrant is a large accelerated filer, an accelerated filer, a non-accelerated filer, a smaller reporting company or an emerging growth company. See the definitions of “large accelerated filer,” “accelerated filer,” “smaller reporting company,” and “emerging growth company” in Rule 12b-2 of the Exchange Act.
|
Large accelerated filer
|
X
|
Accelerated filer
|
||||
|
Non-accelerated filer
|
Smaller reporting company
|
|||||
|
Emerging growth company
|
||||||
|
If an emerging growth company, indicate by check mark if the registrant has elected not to use the extended transition period for complying with any new or revised financial accounting standards provided pursuant to Section 13(a) of the Exchange Act.
q
|
||||||
Indicate by check mark whether the registrant is a shell company (as defined in Rule 12b-2 of the Exchange Act).
|
Yes
|
No
|
X
|
||
As of
June 30, 2018
, the last business day of the registrant’s most recently completed second fiscal quarter, the aggregate market value of the registrant's common shares (its only class of common equity) held by non-affiliates (
27,909,420
shares) was approximately
$739.0 million
. The number of common shares of the registrant outstanding as of
February 20, 2019
was
27,521,304
.
DOCUMENT INCORPORATED BY REFERENCE
Portions of the registrant’s definitive proxy statement for the
2019
Annual Meeting of Shareholders to be filed pursuant to Regulation 14A under the Securities Exchange Act of 1934, as amended, are incorporated by reference into Part III of this Annual Report on Form 10-K.
|
TABLE OF CONTENTS
|
|||
|
PAGE
NUMBER
|
|||
2
PART I
Special Note of Caution Regarding Forward-Looking Statements
Certain information included in this report or in other materials we have filed or will file with the Securities and Exchange Commission (the “SEC”) (as well as information included in oral statements or other written statements made or to be made by us) contains or may contain forward-looking statements, including, but not limited to, statements regarding our future financial performance and financial condition. Words such as “expects,” “anticipates,” “envisions,” “targets,” “goals,” “projects,” “intends,” “plans,” “believes,” “seeks,” “estimates,” variations of such words and similar expressions are intended to identify such forward-looking statements. These statements involve a number of risks and uncertainties. Any forward-looking statements that we make herein and in future reports and statements are not guarantees of future performance, and actual results may differ materially from those in such forward-looking statements as a result of various risk factors. Please see “Item 1A. Risk Factors” in Part I of this Annual Report on Form 10-K for more information regarding those risk factors.
Any forward-looking statement speaks only as of the date made. Except as required by applicable law, we undertake no obligation to publicly update any forward-looking statements, whether as a result of new information, future events or otherwise. However, any further disclosures made on related subjects in our subsequent reports on Forms 10-K, 10-Q and 8-K should be consulted. This discussion is provided as permitted by the Private Securities Litigation Reform Act of 1995, and all of our forward-looking statements are expressly qualified in their entirety by the cautionary statements contained or referenced in this section.
Item 1. BUSINESS
General
M/I Homes, Inc. and subsidiaries (the “Company,” “we,” “us” or “our”) is one of the nation’s leading builders of single-family homes. The Company was incorporated, through predecessor entities, in 1973 and commenced homebuilding activities in 1976. Since that time, the Company has sold over
111,400
homes.
The Company consists of two distinct operations: homebuilding and financial services. Our homebuilding operations are aggregated for reporting purposes into three reporting segments - the Midwest, Mid-Atlantic and Southern regions. Our financial services operations support our homebuilding operations by providing mortgage loans and title services to the customers of our homebuilding operations and are reported as an independent segment. Please see
Note 15
to our Consolidated Financial Statements for additional information related to the financial and operating results for each of our reporting segments.
Our homebuilding operations comprise the most significant portion of our business, representing
98%
of consolidated revenue in
2018
and
97%
in
2017
. We design, market, construct and sell single-family homes and attached townhomes to first-time, millennial, move-up, empty-nester and luxury buyers. In addition to home sales, our homebuilding operations generate revenue from the sale of land and lots. We use the term “home” to refer to a single-family residence, whether it is a single-family home or other type of residential property, and we use the term “community” to refer to a single development in which we construct homes. We primarily construct homes in planned development communities and mixed-use communities. We are currently offering homes for sale in
209
communities within
16
markets located in
ten
states. Our average sales price of homes delivered during
2018
was
$384,000
, and the average sales price of our homes in backlog at
December 31, 2018
was
$409,000
. We offer homes ranging from a base sales price of approximately
$180,000
to
$1,110,000
and believe that this range of price points allows us to appeal to and attract a wide range of buyers. We believe that we distinguish ourselves from competitors by offering homes in select areas with a high level of design and construction quality, providing superior customer service and offering mortgage and title services in order to fully serve our customers. In our experience, our product offerings and customer service make the homebuying process more efficient for our customers.
Our financial services operations generate revenue primarily from originating and selling mortgages and collecting fees for title insurance and closing services. We offer mortgage banking services to our homebuyers through our 100%-owned subsidiary, M/I Financial, LLC (“M/I Financial”). We offer title services through subsidiaries that are either 100% or majority owned by the Company. Our financial services operations accounted for
2%
of our consolidated revenues in
2018
and
3%
in
2017
. See the “Financial Services” section below for additional information regarding our financial services operations.
Our principal executive offices are located at 3 Easton Oval, Suite 500, Columbus, Ohio 43219. The telephone number of our corporate headquarters is (614) 418-8000 and our website address is www.mihomes.com. Information on our website is not a part of and shall not be deemed incorporated by reference in this Form 10-K.
3
Markets
For reporting purposes, our
16
homebuilding divisions are aggregated into the following three segments:
|
Region
|
Market/Division
|
Year Operations Commenced
|
|
Midwest
|
Columbus, Ohio
|
1976
|
|
Midwest
|
Cincinnati, Ohio
|
1988
|
|
Midwest
|
Indianapolis, Indiana
|
1988
|
|
Midwest
|
Chicago, Illinois
|
2007
|
|
Midwest
|
Minneapolis/St. Paul, Minnesota
|
2015
|
|
Midwest
|
Detroit, Michigan
|
2018
|
|
Southern
|
Tampa, Florida
|
1981
|
|
Southern
|
Orlando, Florida
|
1984
|
|
Southern
|
Sarasota, Florida
|
2016
|
|
Southern
|
Houston, Texas
|
2010
|
|
Southern
|
San Antonio, Texas
|
2011
|
|
Southern
|
Austin, Texas
|
2012
|
|
Southern
|
Dallas/Fort Worth, Texas
|
2013
|
|
Mid-Atlantic
|
Charlotte, North Carolina
|
1985
|
|
Mid-Atlantic
|
Raleigh, North Carolina
|
1986
|
|
Mid-Atlantic
|
Washington, D.C.
|
1991
|
We believe we have experienced management teams in each of our divisions with local market expertise. Our business requires in-depth knowledge of local markets to acquire land in desirable locations and on favorable terms, engage subcontractors, plan communities that meet local demand, anticipate consumer tastes in specific markets, and assess local regulatory environments. Although we centralize certain functions (such as accounting, human resources, legal, land purchase approval, and risk management) to benefit from economies of scale, our local management, generally under the direction of an Area President and supervised by a Region President, exercises considerable autonomy in identifying land acquisition opportunities, developing and implementing product and sales strategies, and controlling costs.
Industry Overview and Current Market Conditions
Housing market conditions continued to be favorable through the first half of 2018, as evidenced by our strong spring selling season. However, beginning in second half of 2018, the homebuilding industry experienced a softening in demand, after adjusting for normal seasonality, that we believe was a result of the rise in mortgage interest rates in 2018 and higher home prices which created affordability challenges for some prospective buyers. Despite this softening in demand in the second half of 2018, we also believe that many of the fundamentals supporting continued growth in demand remain favorable, including high consumer confidence, growth in employment, wage increases, and a limited supply of new and existing homes. Company-wide, our absorption pace of sales per community for 2018 remained at a pace consistent with
2017
.
Business Strategy
Although higher prices and rising interest rates began to adversely impact new home sales in the second half of 2018, we believe that other fundamentals underlying housing demand, linked to low unemployment and higher wages, remain favorable. We remain focused on increasing our profitability by generating additional revenue and improving overhead operating leverage, continuing to expand our market share, shifting product mix to include more affordable designs, investing in attractive land opportunities and increasing our number of average active communities. Consistent with our focus on improving long-term financial results, we expect to emphasize the following strategic business objectives in
2019
:
|
•
|
profitably growing our presence in our existing markets, including opening new communities;
|
|
•
|
expanding the availability of our more affordable Smart Series homes
;
|
|
•
|
reviewing new markets for additional investment opportunities;
|
|
•
|
maintaining a strong balance sheet; and
|
|
•
|
emphasizing customer service, product quality and design, and premier locations.
|
However, we can provide no assurance that the positive trends reflected in our financial and operating metrics in
2017
and
2018
will continue in
2019
.
4
Sales and Marketing
During
2018
, we continued to focus our marketing efforts on first-time and move-up homebuyers, including home designs targeted to first-time, millennial and empty-nester homebuyers. We market and sell our homes primarily under the M/I Homes and Showcase Collection (exclusively by M/I Homes) brands. In addition, the Hans Hagen brand is used in older communities in our Minneapolis/St. Paul market, and following our acquisition of the homebuilding assets and operations of Pinnacle Homes, a privately-held homebuilder in the Detroit, Michigan market in March 2018, the Pinnacle Homes brand is used in that market in connection with the sale of homes in active communities as of the date of the acquisition. Our marketing efforts are directed at driving interest in and preference for the M/I Homes brands over other homebuilders or the resale market.
We provide our homebuyers with the following products, programs and services which we believe differentiate our brand: (1) homes with high quality construction located in attractive areas and desirable communities that are supported by our industry leading 15-year transferable structural warranty in all of our markets other than Texas and a 10-year transferable structural warranty in our Texas markets; (2) our Whole Home Building Standards which are designed to deliver features and benefits that satisfy the buyer’s expectation for a better-built home, including a more eco-friendly and energy efficient home that we believe will generally save our customers up to 30% on their energy costs compared to a home that is built to minimum code requirements; (3) our Design Studios and Design Consultants that assist our homebuyers in selecting product and design options; (4) fully furnished model homes and highly-trained sales consultants to build the buyer’s confidence and enhance the quality of the homebuying experience; (5) our mortgage financing programs that we offer through M/I Financial, including competitive fixed-rate and adjustable-rate loans; (6) our Ready Now Homes program which offers homebuyers the opportunity to close on certain new homes in 60 days or less; and (7) our unwavering focus on customer care and customer satisfaction.
By offering Whole Home Energy-Efficient Homes to our customers, we enable our homebuyers to save on their energy costs (the second largest cost of home ownership) compared to a home that is built to minimum code requirements. We use independent RESNET-Certified Raters and the HERS (Home Energy Rating System) Index, the national standard for energy efficiency, to measure the performance of our homes, including insulation, ventilation, air tightness, and the heating and cooling system. Our divisions’ average scores are generally lower (and, therefore, better) than the Environmental Protection Agency’s Energy Star target standard of 72-75 or the average score for a resale home (130 or higher).
To further enhance the homebuying process, we operate Design Studios in a majority of our markets. Our Design Studios allow our homebuyers to select from thousands of product and design options that are available for purchase as part of the original construction of their homes. Our centers are staffed with Design Consultants who help our homebuyers select the right combination of options to meet their budget, lifestyle and design sensibilities. In most of our markets, we offer our homebuyers the option to consider and make design planning decisions using our Envision online design tool. We believe this tool is helpful for prospective buyers to use during the planning phase and makes their actual visit to our design centers more productive and efficient as our consultants are able to view the buyer’s preliminary design selections and pull samples in advance of the buyer’s visit.
We also invest in designing and decorating fully-furnished and distinctive model homes intended to create an atmosphere reflecting how people live today and help our customers imagine the possibilities for a “home of their own, just the way they dreamed it.” We carefully select the interior decorating and design of our model homes to reflect the lifestyles of our prospective buyers. We believe these models showcase our homes at their maximum livability and potential and provide ideas and inspiration for our customers to incorporate valuable design options into their new home.
Our company-employed sales consultants are trained and prepared to meet the buyer’s expectations and build the buyer’s confidence by fully explaining the features and benefits of our homes, helping each buyer determine which home best suits the buyer’s needs, explaining the construction process, and assisting the buyer in choosing the best financing option. Significant attention is given to the ongoing training of all sales personnel to assure a high level of professionalism and product knowledge. As of
December 31, 2018
, we employed
235
home sales consultants.
We also offer specialized mortgage financing programs through M/I Financial to assist our homebuyers. We offer conventional financing options along with programs offered by the Federal Housing Authority (“FHA”), U.S. Veterans Administration (“VA”), United States Department of Agriculture (“USDA”) and state housing bond agencies. M/I Financial offers our homebuyers “one-stop” shopping by providing mortgage and title services for the purchase of their home, which we believe saves our customers both time and money. By working with many of the major mortgage providers in the country, we seek to offer our homebuyers unique programs with below-market financing options that are more competitive than what homebuyers could obtain on their own. With respect to title services, the Company’s title subsidiaries work closely with our homebuilding divisions so that we are able to provide an organized and efficient home delivery process.
We also build inventory homes in most of our communities to offer homebuyers the opportunity to close on certain new homes in 60 days or less. These homes enhance our marketing and sales efforts to prospective homebuyers who require a home delivery
5
within a short time frame and allow us to compete effectively with existing homes available in the market. We determine our inventory homes strategy in each market based on local market factors, such as job growth, the number of job relocations, housing demand and supply, seasonality and our past experience in the market. We maintain a level of inventory homes in each community based on our current and planned sales pace, and we monitor and adjust inventory homes on an ongoing basis as conditions warrant.
We seek to keep our homebuyers actively involved in the construction of their new home, providing them with continued communication throughout the design and construction process. Our goal is to put the buyer first and enhance the total homebuying experience. We believe prompt and courteous responses to homebuyers’ needs throughout the homebuying process reduce post-delivery repair costs, enhance our reputation for quality and service, and encourage repeat and referral business from homebuyers and the real estate community.
Finally, we believe our ultimate differentiator comes from the principles our company was founded upon -- integrity and delivering superior customer service and a quality product. Our customer satisfaction scores are measured by an independent third-party company at both 30 days and 6 months after delivery to hold us accountable for building a home of the highest quality.
We market our homes using traditional media such as newspapers, direct mail, billboards, radio and television. The particular media used differs from market to market based on area demographics and other competitive factors. In 2018, we significantly increased the reach of our website through enhanced search engine optimization, search engine marketing, and display advertising. We have reinforced our presence on referral sites, such as Zillow.com and NewHomeSource.com, to drive sales leads to our internet sales associates. We also use email marketing to maintain communication with existing prospects and customers. We use our social media presence to communicate to potential homebuyers the experiences of customers who have purchased our homes and to provide content about our homes and design features.
Product Lines, Design and Construction
Our residential communities are generally located in suburban areas that are easily accessible through public and personal transportation. Our communities are designed as neighborhoods that fit existing land characteristics. We strive to achieve diversity among architectural styles within a community by offering a variety of house models and several exterior design options for each model. We also preserve existing trees and foliage whenever practicable. Normally, homes of the same type or color may not be built next to each other. We believe our communities have attractive entrances with distinctive signage and landscaping and that our attention to community detail avoids a “development” appearance and gives each community a diversified neighborhood appearance.
We offer homes ranging from a base sales price of approximately
$180,000
to $
1,110,000
and from approximately
1,200
to
5,500
square feet. In addition to single-family detached homes, we also offer attached townhomes in some of our markets. By offering a wide range of homes, we are able to attract first-time, millennial, move-up, empty-nester and luxury homebuyers. It is our goal to sell more than one home to our buyers, and we believe we have had success in this strategy.
We devote significant resources to the research, design and development of our homes to meet the demands of our buyers and evolving market requirements. Across all of our divisions, we currently offer over
750
different floor plans designed to reflect current lifestyles and design trends. Our Showcase Collection is designed for our move-up and luxury homebuyers and offers more design options, larger floor plans, and a higher-end product line of homes in upscale communities. In addition, we are developing new floor plans and communities specifically for the growing empty-nester market. These plans (primarily ranch and main floor master bedroom type plans) focus on move-down buyers, are smaller in size, and feature outdoor living potential, fewer bedrooms, and better community amenities. Our homebuilding divisions share successful plans with other divisions, when appropriate.
We are continuing to implement our “Smart Series” floor plans of smaller square footage to target a more affordable sales price in several of our markets. Our “Smart Series” is intended to offer buyers excellent value, great locations, and pre-selected packages of upgraded finishes and appliances. Our “Smart Series” targets entry-level and move-down buyers and focuses significant attention on current trends, livability and offering design flexibility to our customers. We are actively selling “Smart Series” floor plans in the majority of our markets and they have become an important and successful part of our overall product lineup.
Our new “City Collection” floor plans offer a unique and upscale urban lifestyle by utilizing narrow lots, detached rear garages and thoughtfully designed interiors. Our “City Collection” enables us to participate in new infill development opportunities that extend beyond our traditional suburban markets.
We design all of our product lines to reduce production costs and construction cycle times while adhering to our quality standards and using materials and construction techniques that reflect our commitment to more environmentally conscious homebuilding methods. All of our homes are constructed according to proprietary designs that meet the applicable FHA and VA requirements
6
and all local building codes. We attempt to maintain efficient operations by utilizing standardized materials. Our raw materials consist primarily of lumber, concrete and similar construction materials, and while these materials are generally available from a variety of sources, we have reduced construction and administrative costs by executing national purchasing contracts with select vendors. Our homes are constructed according to standardized prototypes which are designed and engineered to provide innovative product design while attempting to minimize costs of construction and control product consistency and availability. We generally employ subcontractors for the installation of site improvements and the construction of homes. The construction of each home is supervised by a Personal Construction Supervisor who reports to a Production Manager, both of whom are employees of the Company. Our Personal Construction Supervisors manage the scheduling and construction process. Subcontractor work is performed pursuant to written agreements that require our subcontractors to comply with all applicable laws and labor practices, follow local building codes and permits, and meet performance, warranty, and insurance requirements. The agreements generally specify a fixed price for labor and materials, and are structured to provide price protection for a majority of the higher-cost phases of construction for homes in our backlog.
We begin construction on a majority of our homes after we have obtained a sales contract and preliminary oral confirmation from the buyer’s lender that financing should be approved. In certain markets, contracts may be accepted contingent upon the sale of an existing home, and construction may be authorized through a certain phase prior to satisfaction of that contingency. The construction of our homes typically takes approximately four to six months from the start of construction to completion of the home, depending on the size and complexity of the particular home being built, weather conditions, and the availability of labor, materials, and supplies. We also construct inventory homes (i.e., homes started in the absence of an executed contract) to facilitate delivery of homes on an immediate-need basis under our Ready Now Homes program and to provide presentation of new products. For some prospective buyers, selling their existing home has become a less predictable process and, as a result, when they sell their home, they often need to find, buy and move into a new home in 60 days or less. Other buyers simply prefer the certainty provided by being able to fully visualize a home before purchasing it. Of the total number of homes closed in
2018
and
2017
,
45%
and
47%
, respectively, were inventory homes which include both homes started as inventory homes and homes that started under a contract that were later cancelled and became inventory homes as a result.
Backlog
We sell our homes under standard purchase contracts, which generally require a homebuyer deposit at the time of signing the contract. The amount of the deposit varies among markets and communities. We also generally require homebuyers to pay additional deposits when they select options or upgrades for their homes. Most of our home purchase contracts stipulate that if a homebuyer cancels a contract with us, we have the right to retain the homebuyer’s deposits. However, we generally permit our homebuyers to cancel their obligations and obtain refunds of all or a portion of their deposits (unless home construction has started) in the event mortgage financing cannot be obtained within the period specified in their contract to maintain goodwill with the potential buyer.
Backlog consists of homes that are under contract but have not yet been delivered. Ending backlog represents the number of homes in backlog from the previous period plus the number of net new contracts (new contracts for homes less cancellations) generated during the current period minus the number of homes delivered during the current period. The backlog at any given time will be affected by cancellations. Due to the seasonality of the homebuilding industry, the number of homes delivered has historically increased from the first to the fourth quarter in any year.
As of
December 31, 2018
, we had a total of
2,194
homes, with
$896.7 million
aggregate sales value, in backlog in various stages of completion, including homes that are under contract but for which construction had not yet begun. As of
December 31, 2017
, we had a total of
2,014
homes, with
$791.3 million
aggregate sales value, in backlog. Homes included in year-end backlog are typically included in homes delivered in the subsequent year.
Warranty
We provide certain warranties in connection with our homes and also perform inspections with the buyer of each home immediately prior to delivery and as needed after a home is delivered. The Company offers both a limited warranty program (“Home Builder’s Limited Warranty”) and a transferable structural limited warranty. The Home Builder’s Limited Warranty covers construction defects for a statutory period based on geographic market and state law (currently ranging from five to ten years for the states in which the Company operates) and includes a mandatory arbitration clause. The structural warranty is for 10 or 15 years for homes sold after December 1, 2015 and 10 or 30 years for homes sold after April 25, 1998 and on or before December 1, 2015. We also pass along to our homebuyers all warranties provided by the manufacturers or suppliers of components installed in each home. Although our subcontractors are generally required to repair and replace any product or labor defects during their respective warranty periods, we are ultimately responsible to the homeowner for making such repairs during our applicable warranty period. Accordingly, we have estimated and established reserves for both our Home Builder’s Limited Warranty and potential future
7
structural warranty costs based on the number of home deliveries and historical data trends for our communities. In the case of the structural warranty, we also employ an actuary to assist in the determination of our future costs on an annual basis. Our warranty expense (excluding stucco-related repair costs in certain of our Florida communities in
2018
,
2017
and 2016 (as more fully discussed in
Note 8
to our Consolidated Financial Statements)) was approximately
0.8%
of total housing revenue in each of
2018
and
2017
and
0.9%
of total housing revenue in 2016.
Land Acquisition and Development
We continuously evaluate land acquisition opportunities in the normal course of our homebuilding business, and we focus on both replenishing our lot positions and adding to our lot positions in key submarkets to expand our market share. Our goal is to maintain an approximate three to five-year supply of lots, including lots controlled under option contracts and purchase agreements, which we believe provides an appropriate horizon for addressing regulatory matters and land development and the subsequent build-out of the homes in each community, and allows us to manage our business plan for future home deliveries.
We seek to meet our need for lots by obtaining advantageous land positions in desirable locations in a cost effective manner that is responsive to market conditions and maintains our financial strength and liquidity. Before acquiring land, we complete extensive comparative studies and analyses, which assist us in evaluating the economic feasibility of the land acquisition. We consider a number of factors, including projected rates of return, estimated gross margins, and projected pace of absorption and sales prices of the homes to be built, all of which are impacted by our evaluation of population and employment growth patterns, demographic trends and competing new home subdivisions and resales in the relevant sub-market.
We attempt to acquire land with a minimum cash investment and negotiate takedown options when available from sellers. We also restrict the use of guarantees or commitments in our land contracts to limit our financial exposure to the amounts invested in the property and pre-development costs during the life of the community we are developing. We believe this approach significantly reduces our risk. In addition, we generally obtain necessary development approvals before we acquire land. We acquire land primarily through contingent purchase agreements, which typically condition our obligation to purchase land upon approval of zoning, utilities, soil and subsurface conditions, environmental and wetland conditions, market analysis, development costs, title matters and other property-related criteria. All land and lot purchase agreements and the funding of land purchases require the approval of our corporate land acquisition committee, which is comprised of our senior management team and key operating and financial executives. Further details relating to our land option agreements are included in
Note 1
to our Consolidated Financial Statements.
In
2018
, we continued to increase our investments in land acquisition, land development and housing inventory to meet demand and expand our operations in certain markets. In
2018
and
2017
, we developed over
74%
and
72%
, respectively, of our lots internally, primarily due to a lack of availability of developed lots in desirable locations in the market. Raw land that requires development generally remains more available. In order to minimize our investment and risk of large exposure in a single location, we have periodically partnered with other land developers or homebuilders to share in the cost of land investment and development through joint ownership and development agreements, joint ventures, and other similar arrangements. For joint venture arrangements where a special purpose entity is established to own the property, we enter into limited liability company or similar arrangements (“LLCs”) with the other partners. Further details relating to our joint venture arrangements are included in
Note 1
to our Consolidated Financial Statements.
During the development of lots, we are required by some municipalities and other governmental authorities to provide completion bonds or letters of credit for sewer, streets and other improvements. The development agreements under which we are required to provide completion bonds or letters of credit are generally not subject to a required completion date and only require that the improvements are in place in phases as homes are built and sold. In locations where development has progressed, the amount of development work remaining to be completed is typically less than the remaining amount of bonds or letters of credit due to timing delays in obtaining release of the bonds or letters of credit.
Our ability to continue development activities over the long-term will depend upon, among other things, a suitable economic environment and our continued ability to locate suitable parcels of land, enter into options or agreements to purchase such land, obtain governmental approvals for such land, and consummate the acquisition and development of such land.
8
In the normal course of our homebuilding business, we balance the economic risk of owning lots and land with the necessity of having lots available for construction of our homes. The following table sets forth our land position in lots (including lots held in joint venture arrangements) at
December 31, 2018
:
|
|
Lots Owned
|
|
|
|||||||||
|
Region
|
Developed Lots
|
Lots Under Development
|
Undeveloped Lots
(a)
|
Total Lots Owned
|
Lots Under Contract
|
Total
|
||||||
|
Midwest
|
3,119
|
|
420
|
|
2,105
|
|
5,644
|
|
6,460
|
|
12,104
|
|
|
Southern
|
2,171
|
|
1,441
|
|
2,895
|
|
6,507
|
|
5,636
|
|
12,143
|
|
|
Mid-Atlantic
|
721
|
|
552
|
|
639
|
|
1,912
|
|
2,564
|
|
4,476
|
|
|
Total
|
6,011
|
|
2,413
|
|
5,639
|
|
14,063
|
|
14,660
|
|
28,723
|
|
|
(a)
|
Includes our interest in raw land held by joint venture arrangements expected to be developed into
1,159
lots.
|
Financial Services
We sell our homes to customers who generally finance their purchases through mortgages. M/I Financial provides our customers with competitive financing and coordinates and expedites the loan origination transaction through the steps of loan application, loan approval, and closing and title services. M/I Financial provides financing services in all of our housing markets. We believe that our ability to offer financing to customers on competitive terms as a part of the sales process is an important factor in completing sales.
M/I Financial has been approved by the U.S. Department of Housing and Urban Development, FHA, VA and USDA to originate mortgages that are insured and/or guaranteed by these entities. In addition, M/I Financial has been approved by the Federal Home Loan Mortgage Corporation (“Freddie Mac”) and the Federal National Mortgage Association (“Fannie Mae”) as a seller and servicer of mortgages and as a Government National Mortgage Association (“Ginnie Mae”) issuer. Our agency approvals, along with a sub-servicing relationship, allow us to sell loans on either a servicing released or servicing retained basis. This option provides flexibility and additional financing options to our customers.
We also provide title and closing services to purchasers of our homes through our 100%-owned subsidiaries, TransOhio Residential Title Agency Ltd., M/I Title Agency Ltd., and M/I Title LLC, and our majority-owned subsidiary, Washington/Metro Residential Title Agency, LLC. Through these entities, we serve as a title insurance agent by providing title insurance policies and examination and closing services to purchasers of our homes in the Columbus, Cincinnati, Minneapolis/St. Paul, Tampa, Orlando, Sarasota, San Antonio, Houston, Dallas/Fort Worth, Austin, and Washington, D.C. markets. In addition, TransOhio Residential Title Agency Ltd. provides examination and title insurance services to our housing markets in the Raleigh, Charlotte, Chicago and Indianapolis markets. We assume no underwriting risk associated with the title policies.
Corporate Operations
Our corporate operations and home office are located in Columbus, Ohio, where we perform the following functions at a centralized level:
|
•
|
establish strategy, goals and operating policies;
|
|
•
|
ensure brand integrity and consistency across all local and regional communications;
|
|
•
|
monitor and manage the performance of our operations;
|
|
•
|
allocate capital resources;
|
|
•
|
provide financing and perform all cash management functions for the Company, and maintain our relationship with lenders;
|
|
•
|
maintain centralized information and communication systems; and
|
|
•
|
maintain centralized financial reporting, internal audit functions, and risk management.
|
Competition
The homebuilding industry is fragmented and highly competitive. We operate as a top ten builder in the majority of our markets. We compete with numerous national, regional, and local homebuilders in each of the geographic areas in which we operate. Our competition ranges from small local builders to larger regional builders to publicly-owned builders and developers, some of which have greater financial, marketing, land acquisition, and sales resources than us. Previously owned homes and the availability of rental housing provide additional competition. We compete primarily on the basis of price, location, design, quality, service, and reputation. Our financial services operations compete with other mortgage lenders to arrange financings for homebuyers. Principal competitive factors include interest rates and other features of mortgage loan products available to the consumer.
9
Government Regulation and Environmental Matters
Our homebuilding and financial services operations are subject to compliance with numerous laws and regulations. Our homebuilding operations are subject to various local, state and federal statutes, ordinances, rules and regulations concerning the protection of health and the environment, including storm water and surface water management, soil, groundwater and wetlands protection, subsurface conditions and air quality protection and enhancement. Environmental laws and existing conditions may result in delays, cause us to incur substantial compliance and other costs and prohibit or severely restrict homebuilding activity in environmentally sensitive regions or areas.
Our homebuilding operations are also subject to various local, state and federal statutes, ordinances, rules and regulations concerning zoning, building, design, construction, sales, and similar matters. These regulations increase the cost to produce and market our products, and in some instances, delay our developers’ ability to deliver finished lots to us. Counties and cities in which we build homes have at times declared moratoriums on the issuance of building permits and imposed other restrictions in the areas in which sewage treatment facilities and other public facilities do not reach minimum standards. In addition, our homebuilding operations are regulated in certain areas by restrictive zoning and density requirements that limit the number of homes that can be built within the boundaries of a particular area. We may also experience extended timelines for receiving required approvals from municipalities or other government agencies that can delay our anticipated development and construction activities in our communities.
Our mortgage company and title insurance agencies are subject to various local, state and federal statutes, ordinances, rules and regulations (including requirements for participation in programs offered by FHA, VA, USDA, Ginnie Mae, Fannie Mae and Freddie Mac). These regulations restrict certain activities of our financial services operations as further described in our description of “Risk Factors” below in Item 1A. In addition, our financial services operations are subject to regulation at the state and federal level, including regulations issued by the Consumer Financial Protection Bureau (the “CFPB”), with respect to specific origination, selling and servicing practices.
Seasonality
Our homebuilding operations experience significant seasonality and quarter-to-quarter variability in homebuilding activity levels. In general, homes delivered increase substantially in the second half of the year. We believe that this seasonality reflects the tendency of homebuyers to shop for a new home in the spring with the goal of closing in the fall or winter, as well as the scheduling of construction to accommodate seasonal weather conditions. Our financial services operations also experience seasonality because their loan originations correspond with the delivery of homes in our homebuilding operations.
Employees
At
December 31, 2018
, we employed
1,359
people (including part-time employees), of which
1,085
were employed in homebuilding operations,
178
were employed in financial services and
97
were employed in management and administrative services. No employees are represented by a collective bargaining agreement.
Available Information
We are subject to the reporting requirements of the Securities Exchange Act of 1934, as amended (“Exchange Act”), and file annual, quarterly and current reports, proxy statements and other information with the Securities and Exchange Commission (“SEC”). These filings are available to the public on the SEC’s website at www.sec.gov.
Our website address is www.mihomes.com. We make available, free of charge, on or through our website, our annual reports on Form 10-K, quarterly reports on Form 10-Q, current reports on Form 8-K, and amendments to those reports filed or furnished pursuant to Section 13(a) of the Exchange Act as soon as reasonably practicable after we electronically file such material with, or furnish it to, the SEC. Our website also includes printable versions of our Corporate Governance Guidelines, our Code of Business Conduct and Ethics, and the charters for each of our Audit, Compensation, and Nominating and Corporate Governance Committees. The contents of our website are not incorporated by reference in, or otherwise made a part of, this Annual Report on Form 10-K.
10
Item 1A. RISK FACTORS
Our future results of operations, financial condition and liquidity and the market price for our securities are subject to numerous risks, many of which are driven by factors that we cannot control. The following cautionary discussion of risks, uncertainties and assumptions relevant to our business includes factors we believe could cause our actual results to differ materially from expected and historical results. Other factors beyond those listed below, including factors unknown to us and factors known to us which we have not currently determined to be material, could also adversely affect our business, results of operations, financial condition, prospects and cash flows. Also see “Special Note of Caution Regarding Forward-Looking Statements” above.
Homebuilding Market and Economic Risks
The homebuilding industry is cyclical and affected by changes in general economic, real estate and other business conditions that could adversely affect our results of operations, financial condition and cash flows.
Certain economic, real estate and other business conditions that have significant effects on the homebuilding industry include:
|
•
|
employment levels and job and personal income growth;
|
|
•
|
availability and pricing of financing for homebuyers;
|
|
•
|
short and long-term interest rates;
|
|
•
|
overall consumer confidence and the confidence of potential homebuyers in particular;
|
|
•
|
demographic trends;
|
|
•
|
changes in energy prices;
|
|
•
|
housing demand from population growth, household formation and other demographic changes, among other factors;
|
|
•
|
U.S. and global financial system and credit market stability;
|
|
•
|
private party and governmental residential consumer mortgage loan programs, and federal and state regulation of lending and appraisal practices;
|
|
•
|
federal and state personal income tax rates and provisions, including provisions for the deduction of residential consumer mortgage loan interest payments and other expenses;
|
|
•
|
the supply of and prices for available new or existing homes (including lender-owned homes acquired through foreclosures and short sales) and other housing alternatives, such as apartments and other residential rental property;
|
|
•
|
homebuyer interest in our current or new product designs and community locations, and general consumer interest in purchasing a home compared to choosing other housing alternatives; and
|
|
•
|
real estate taxes.
|
These above conditions, among others, are complex and interrelated. Adverse changes in such business conditions may have a significant negative impact on our business. The negative impact may be national in scope but may also negatively affect some of the regions or markets in which we operate more than others. When such adverse conditions affect any of our larger markets, those conditions could have a proportionately greater impact on us than on some other homebuilding companies. We cannot predict their occurrence or severity, nor can we provide assurance that our strategic responses to their impacts would be successful.
Potential customers may be less willing or able to buy our homes if any of these conditions have a negative impact on the homebuilding industry. In the future, our pricing strategies may be limited by market conditions. We may be unable to change the mix of our home offerings, reduce the costs of the homes we build or offer more affordable homes to maintain our gross margins or satisfactorily address changing market conditions in other ways. In addition, cancellations of home sales contracts in backlog may increase .
During the second half of 2018, demand for new homes slowed, which we believe was a result of higher interest rates and higher home prices. While the absorption pace of our new contracts per community remained relatively stable in 2018, a further decline in sales activity could adversely affect our results of operations, financial condition and cash flows.
Our financial services business is closely related to our homebuilding business, as it originates mortgage loans principally on behalf of purchasers of the homes we build. A decrease in the demand for our homes because of the existence of any of the foregoing conditions could also adversely affect the financial results of this segment of our business.
Increased competition levels in the homebuilding and mortgage lending industries could result in a reduction in our new contracts and homes delivered, along with decreases in the average sales prices of sold and delivered homes and/or decreased mortgage originations, which would have a negative impact on our results of operations.
The homebuilding industry is fragmented and highly competitive. We compete with numerous public and private homebuilders, including some that are substantially larger than us and may have greater financial resources than we do. We also compete with
11
community developers and land development companies, some of which are also homebuilders or affiliates of homebuilders. Homebuilders compete for customers, land, building materials, subcontractor labor and financing. Competition for home orders primarily is based upon home sales price, location of property, home style, financing available to prospective homebuyers, quality of homes built, customer service and general reputation in the community, and may vary by market, sub-market and even by community. Additionally, competition within the homebuilding industry can be impacted by an excess supply of new and existing homes available for sale resulting from a number of factors including, among other things, increases in unsold started homes available for sale and increases in home foreclosures. Increased competition may cause us to decrease our home sales prices and/or increase home sales incentives in an effort to generate new home sales and maintain homes in backlog until they close. Increased competition can also result in us selling fewer homes or experiencing a higher number of cancellations by homebuyers. These competitive pressures may negatively impact our future financial and operating results.
Through our financial services operations, we also compete with numerous banks and other mortgage bankers and brokers, some of which are larger than us and may have greater financial resources than we do. Competitive factors that affect our consumer services operations include pricing, mortgage loan terms, underwriting criteria and customer service. To the extent that we are unable to adequately compete with other companies that originate mortgage loans, the results of operations from our mortgage operations may be negatively impacted.
A reduction in the availability of mortgage financing or a significant increase in mortgage interest rates or down payment requirements could adversely affect our business.
Any reduction in the availability of the financing provided by Fannie Mae and Freddie Mac could adversely affect interest rates, mortgage availability and our sales of new homes and origination of mortgage loans.
FHA and VA mortgage financing support continues to be an important factor in marketing our homes. Any increases in down payment requirements, lower maximum loan amounts, or limitations or restrictions on the availability of FHA and VA financing support could adversely affect interest rates, mortgage availability and our sales of new homes and origination of mortgage loans.
Even if potential customers do not need financing, changes in the availability of mortgage products may make it harder for them to sell their current homes to potential buyers who need financing, which may lead to lower demand for new homes.
Mortgage interest rates remained near historical lows for the last several years. However, the Federal Reserve raised its benchmark rate several times during 2017 and 2018, and indicated that additional increases in interest rates in 2019 are possible. Increases in interest rates increase the costs of owning a home and could reduce the demand for our homes.
Many of our homebuyers obtain financing for their home purchases from M/I Financial. If, due to the factors discussed above, M/I Financial is limited from making or unable to make loan products available to our homebuyers, our home sales and our homebuilding and financial services results of operations may be adversely affected.
If land is not available at reasonable prices or terms, our homes sales revenue and results of operations could be negatively impacted and/or we could be required to scale back our operations in a given market.
Our operations depend on our ability to obtain land for the development of our communities at reasonable prices and with terms that meet our underwriting criteria. Our ability to obtain land for new communities may be adversely affected by changes in the general availability of land, the willingness of land sellers to sell land at reasonable prices, competition for available land, availability of financing to acquire land, zoning, regulations that limit housing density and other market conditions. If the supply of land, and especially developed lots, appropriate for development of communities is limited because of these factors, or for any other reason, the number of homes that we build and sell may decline. To the extent that we are unable to timely purchase land or enter into new contracts for the purchase of land at reasonable prices, due to the lag between the time we acquire land and the time we begin selling homes, our revenue and results of operations could be negatively impacted and/or we could be required to scale back our operations in a given market.
Our land investment exposes us to significant risks, including potential impairment charges, that could negatively impact our profits if the market value of our inventory declines.
We must anticipate demand for new homes several years prior to homes being sold to homeowners. There are significant risks inherent in controlling or purchasing land, especially as the demand for new homes fluctuates and land purchases become more competitive, as has recently been the case, which can increase the costs of land. There is often a significant lag time between when we acquire land for development and when we sell homes in neighborhoods we have planned, developed and constructed. The value of undeveloped land, building lots and housing inventories can fluctuate significantly as a result of changing market conditions. In addition, inventory carrying costs can be significant, and fluctuations in value can reduce profits. Economic
12
conditions could require that we sell homes or land at a loss, or hold land in inventory longer than planned, which could significantly impact our financial condition, results of operations, cash flows and stock performance. Additionally, if conditions in the homebuilding industry decline in the future, we may be required to evaluate our inventory for potential impairment, which may result in additional valuation adjustments, which could be significant and could negatively impact our financial results and condition. We cannot make any assurances that the measures we employ to manage inventory risks and costs will be successful.
Supply shortages and risks related to the demand for skilled labor and building materials could increase costs and delay deliveries.
The residential construction industry experiences labor and material shortages and risks from time to time, including: work stoppages; labor disputes; shortages in qualified subcontractors and construction personnel; lack of availability of adequate utility infrastructure and services; our need to rely on local subcontractors who may not be adequately capitalized or insured; and delays in availability, or fluctuations in prices, of building materials. These labor and material shortages and risks can be more severe during periods of strong demand for housing or during periods in which the markets where we operate experience natural disasters that have a significant impact on existing residential and commercial structures. Any of these circumstances could delay the start or completion of our communities, increase the cost of developing one or more of our communities and increase the construction cost of our homes. To the extent that market conditions prevent the recovery of increased costs, including, among other things, subcontracted labor, developed lots, building materials, and other resources, through higher sales prices, our gross margins from home sales and results of operations could be adversely affected.
Increased costs of lumber, framing, concrete, steel and other building materials could increase our construction costs. We generally are unable to pass on increases in construction costs to customers who have already entered into sales contracts, as those sales contracts generally fix the price of the homes at the time the contracts are signed, which may occur before construction begins. During 2018, we experienced increases in the costs of labor and materials. The increased labor costs were primarily the result of shortages of skilled labor in many parts of the country. The increased material costs were due to inflationary pressures and, during the middle part of the year, tariffs on Canadian lumber and other imported building materials. Increases in construction costs that exceeded our increase in home pricing eroded our gross margins from home sales during 2018 and may continue to reduce our gross margins, particularly if pricing competition restricts our ability to pass on any additional costs of materials or labor, thereby decreasing our gross margins from home sales.
We depend on the continued availability of and satisfactory performance of subcontracted labor for the construction of our homes and to provide related materials. We have experienced, and may continue to experience, modest skilled labor and material shortages in certain of our markets as supply adjusts to demand. The cost of labor may also be adversely affected by shortages of qualified subcontractors and construction personnel, changes in laws and regulations relating to union activity and changes in immigration laws and trends in labor migration. We cannot provide any assurance that there will be a sufficient supply of materials or a sufficient supply of, or satisfactory performance by, these unaffiliated third-party subcontractors, which could have a material adverse effect on our business.
Tax law changes could make home ownership more expensive and/or less attractive.
Prior to the enactment of the Tax Cuts and Jobs Act of 2017 (the “2017 Tax Act”), which was signed into law in December 2017, significant expenses of owning a home, including residential consumer mortgage loan interest costs and real estate taxes, generally were deductible expenses for the purpose of calculating an individual’s federal, and in some cases state, taxable income, subject to various limitations. The 2017 Tax Act established new limits on the federal tax deductions individual taxpayers may take on mortgage loan interest payments and on state and local taxes, including real estate taxes. Through the end of 2025, under the 2017 Tax Act, the annual deduction for real estate taxes and state and local income or sales taxes generally is limited to $10,000. Furthermore, through the end of 2025, the deduction for mortgage interest is only available with respect to acquisition indebtedness that does not exceed $750,000. The 2017 Tax Act also raised the standard deduction to help fully or partially offset these new limits. These changes could, however, reduce the actual or perceived affordability of homeownership, and therefore the demand for homes, and/or have a moderating impact on home sales prices, especially in areas with relatively high housing prices and/or high state and local income taxes and real estate taxes. In addition, if the federal government further changes, or a state government changes, its income tax laws by eliminating or substantially reducing the income tax benefits associated with homeownership, the after-tax cost of owning a home could measurably increase. Any increases in personal income tax rates and/or tax deduction limits or restrictions enacted at the federal or state levels, including those enacted under the 2017 Tax Act, could adversely impact demand for and/or selling prices of new homes, including our homes, and the effect on our consolidated financial statements could be adverse and material.
13
We may not be able to offset the impact of inflation through price increases.
Inflation can have a long-term impact on us because if the costs of land, materials and labor increase, we would need to increase the sale prices of our homes to maintain satisfactory margins. In a highly inflationary environment, we may not be able to raise home prices enough to keep pace with the increased costs of land and house construction, which could reduce our profit margins. In addition, significant inflation is often accompanied by higher interest rates, which have a negative impact on demand for our homes, and would likely also increase our cost of capital. Although the overall rate of inflation has been low for the last several years, we have experienced increases in the prices of labor and materials that in some cases have exceeded our ability to raise the sales prices on our homes, which put downward pressure on our margins in 2018, and such pressures may continue.
Our limited geographic diversification could adversely affect us if the demand for new homes in our markets declines.
We have operations in Ohio, Indiana, Illinois, Michigan, Minnesota, Maryland, Virginia, North Carolina, Florida and Texas. Our limited geographic diversification could adversely impact us if the demand for new homes or the level of homebuilding activity in our current markets declines, since there may not be a balancing opportunity in a stronger market in other geographic regions.
Changes in energy prices may have an adverse effect on the economies in certain markets we operate in and our cost of building homes.
The economies of some of the markets in which we operate are impacted by the health of the energy industry. To the extent that energy prices decline, the economies of certain of our markets may be negatively impacted which could have a material adverse effect on our business. Furthermore, the pricing offered by our suppliers and subcontractors can be adversely affected by increases in various energy costs resulting in a negative impact on our financial condition, results of operations and cash flows.
Operational Risks
We may not be successful in integrating acquisitions or implementing our growth strategies or in achieving the benefits we expect from such acquisitions and strategies.
We may in the future consider growth or expansion of our operations in our current markets or in other areas of the country, whether through strategic acquisitions of homebuilding companies or otherwise. The magnitude, timing and nature of any future expansion will depend on a number of factors, including our ability to identify suitable additional markets and/or acquisition candidates, the negotiation of acceptable terms, our financial capabilities and general economic and business conditions. Our expansion into new or existing markets, whether through acquisition or otherwise, could have a material adverse effect on our liquidity and/or profitability, and any future acquisitions could result in the dilution of existing shareholders if we issue our common shares as consideration. Acquisitions also involve numerous risks, including difficulties in the assimilation of the acquired company’s operations, the incurrence of unanticipated liabilities or expenses, the risk of impairing inventory and other assets related to the acquisition, the diversion of management’s attention and resources from other business concerns, risks associated with entering markets in which we have limited or no direct experience and the potential loss of key employees of the acquired company. In addition, we may not be able to improve our earnings as a result of acquisitions, and our failure to successfully identify and manage future acquisitions could have an adverse impact on our operating results.
We may write-off intangible assets, such as goodwill.
We recorded goodwill in connection with our acquisition of the assets and operations of Pinnacle Homes. On an ongoing basis, we will evaluate whether facts and circumstances indicate any impairment of the value of intangible assets. As circumstances change, we cannot provide any assurance that we will realize the value of these intangible assets. If we determine that a significant impairment has occurred, we will be required to write-off the impaired portion of intangible assets, which could have a material adverse effect on our results of operations in the period in which the write-off occurs.
We have financial needs that we meet through the capital markets, including the debt and secondary mortgage markets, and disruptions in these markets could have an adverse impact on our results of operations, financial position and/or cash flows.
We have financial needs that we meet through the capital markets, including the debt and secondary mortgage markets. Our requirements for additional capital, whether to finance operations or to service or refinance our existing indebtedness, fluctuate as market conditions and our financial performance and operations change. We cannot provide assurances that we will maintain cash reserves and generate cash flow from operations in an amount sufficient to enable us to service our debt or to fund other liquidity needs.
14
The availability of additional capital, whether from private capital sources or the public capital markets, fluctuates as our financial condition and general market conditions change. There may be times when the private capital markets and the public debt or equity markets lack sufficient liquidity or when our securities cannot be sold at attractive prices, in which case we would not be able to access capital from these sources. In addition, a weakening of our financial condition or deterioration in our credit ratings could adversely affect our ability to obtain necessary funds. Even if financing is available, it could be costly or have other adverse consequences.
There are a limited number of third-party purchasers of mortgage loans originated by our financial services operations. The exit of third-party purchasers of mortgage loans from the business, reduced investor demand for mortgage loans and mortgage-backed securities in the secondary mortgage markets and increased investor yield requirements for those loans and securities may have an adverse impact on our results of operations, financial position and/or cash flows.
The mortgage warehousing agreement of our financial services segment will expire in June 2019.
M/I Financial is party to a
$125 million
secured mortgage warehousing agreement, as amended, among M/I Financial, the lenders party thereto and the administrative agent (the “MIF Mortgage Warehousing Agreement”). M/I Financial uses the MIF Mortgage Warehousing Agreement to finance eligible residential mortgage loans originated by M/I Financial. The MIF Mortgage Warehousing Agreement will expire on
June 21, 2019
. If we are unable to renew or replace the MIF Mortgage Warehousing Agreement when it matures, the activities of our financial services segment could be seriously impeded and our home sales and our homebuilding and financial services results of operations may be adversely affected.
Reduced numbers of home sales may force us to absorb additional carrying costs.
We incur many costs even before we begin to build homes in a community. These include costs of preparing land and installing roads, sewage and other utilities, as well as taxes and other costs related to ownership of the land on which we plan to build homes. Reducing the rate at which we build homes extends the length of time it takes us to recover these additional costs. Also, we frequently enter into contracts to purchase land and make deposits that may be forfeited if we do not fulfill our purchase obligation within specified periods.
If our ability to resell mortgages to investors is impaired, we may be required to broker loans.
M/I Financial sells a portion of the loans originated on a servicing released, non-recourse basis, although M/I Financial remains liable for certain limited representations and warranties related to loan sales and for repurchase obligations in certain limited circumstances. If M/I Financial is unable to sell to viable purchasers in the marketplace, our ability to originate and sell mortgage loans at competitive prices could be limited which would negatively affect our operations and our profitability. Additionally, if there is a significant decline in the secondary mortgage market, our ability to sell mortgages could be adversely impacted and we would be required to make arrangements with banks or other financial institutions to fund our buyers’ closings. If we became unable to sell loans into the secondary mortgage market or directly to Fannie Mae and Freddie Mac or issue Ginnie Mae securities, we would have to modify our origination model, which, among other things, could significantly reduce our ability to sell homes.
Mortgage investors could seek to have us buy back loans or compensate them for losses incurred on mortgages we have sold based on claims that we breached our limited representations or warranties.
M/I Financial originates mortgages, primarily for our homebuilding customers. A portion of the mortgage loans originated are sold on a servicing released, non-recourse basis, although we remain liable for certain limited representations, such as fraud, and warranties related to loan sales. Accordingly, mortgage investors have in the past and could in the future seek to have us buy back loans or compensate them for losses incurred on mortgages we have sold based on claims that we breached our limited representations or warranties. There can be no assurance that we will not have significant liabilities in respect of such claims in the future, which could exceed our reserves, or that the impact of such claims on our results of operations will not be material.
15
Our results of operations, financial condition and cash flows could be adversely affected if pending or future legal claims against us are not resolved in our favor.
In addition to the legal proceedings related to stucco discussed below, the Company and certain of its subsidiaries have been named as defendants in certain other legal proceedings which are incidental to our business. While management currently believes that the ultimate resolution of these other legal proceedings, individually and in the aggregate, will not have a material adverse effect on the Company’s results of operations, financial condition, and cash flows, such legal proceedings are subject to inherent uncertainties. The Company has recorded a liability to provide for the anticipated costs, including legal defense costs, associated with the resolution of these other legal proceedings. However, the possibility exists that the costs to resolve these legal proceedings could differ from the recorded estimates and, therefore, have a material adverse effect on the Company’s results of operations, financial condition, and cash flows.
Similarly, if additional legal proceedings are filed against us in the future, including with respect to stucco installation in our Florida communities, the negative outcome of one or more of such legal proceedings could have a material adverse effect on our results of operations, financial condition and cash flows.
The terms of our indebtedness may restrict our ability to operate and, if our financial performance declines, we may be unable to maintain compliance with the covenants in the documents governing our indebtedness.
Our
$500 million
unsecured revolving credit facility dated July 18, 2013, as amended, with M/I Homes, Inc. as borrower and guaranteed by the Company's wholly-owned homebuilding subsidiaries (the “Credit Facility”), the indenture governing our 5.625% Senior Notes due 2025 (the “2025 Senior Notes”) and the indenture governing our 6.75% Senior Notes due 2021 (the “2021 Senior Notes”) impose restrictions on our operations and activities. These restrictions and/or our failure to comply with the terms of our indebtedness could have a material adverse effect on our results of operations, financial condition and ability to operate our business.
Under the terms of the Credit Facility, we are required, among other things, to maintain compliance with various covenants, including financial covenants relating to a minimum consolidated tangible net worth requirement, a minimum interest coverage ratio or liquidity requirement, and a maximum leverage ratio. Failure to comply with these covenants or any of the other restrictions of the Credit Facility, whether because of a decline in our operating performance or otherwise, could result in a default under the Credit Facility. If a default occurs, the affected lenders could elect to declare the indebtedness, together with accrued interest and other fees, to be immediately due and payable, which in turn could cause a default under the documents governing any of our other indebtedness that is then outstanding if we are not able to repay such indebtedness from other sources. If this happens and we are unable to obtain waivers from the required lenders, the lenders could exercise their rights under such documents, including forcing us into bankruptcy or liquidation.
The indenture governing the 2025 Senior Notes and the indenture governing the 2021 Senior Notes also contain covenants that may restrict our ability to operate our business and may prohibit or limit our ability to enhance our operations or take advantage of potential business opportunities as they arise. Failure to comply with these covenants or any of the other restrictions or covenants contained in the indenture governing the 2025 Senior Notes and/or the indenture governing the 2021 Senior Notes could result in a default under the applicable indenture, in which case holders of the 2025 Senior Notes and/or the 2021 Senior Notes may be entitled to cause the sums evidenced by such notes to become due immediately. This acceleration of our obligations under the 2025 Senior Notes and the 2021 Senior Notes could force us into bankruptcy or liquidation and we may be unable to repay those amounts without selling substantial assets, which might be at prices well below the long-term fair values and carrying values of the assets. Our ability to comply with the foregoing restrictions and covenants may be affected by events beyond our control, including prevailing economic, financial and industry conditions.
Our indebtedness could adversely affect our financial condition, and we and our subsidiaries may incur additional indebtedness, which could increase the risks created by our indebtedness.
As of
December 31, 2018
, we had approximately
$667.8 million
of indebtedness (net of debt issuance costs), excluding issuances of letters of credit, the MIF Mortgage Warehousing Agreement and our
$50 million
mortgage repurchase agreement, as amended, dated October 30, 2017, with M/I Financial as borrower (the “MIF Mortgage Repurchase Facility”), and we had
$329.9 million
of remaining availability for borrowings under the Credit Facility. In addition, under the terms of the Credit Facility, the indentures governing the 2025 Senior Notes and the 2021 Senior Notes and the documents governing our other indebtedness, we have the ability, subject to applicable debt covenants, to incur additional indebtedness. The incurrence of additional indebtedness could magnify other risks related to us and our business. Our indebtedness and any future indebtedness we may incur could have a significant adverse effect on our future financial condition.
16
For example:
|
•
|
a significant portion of our cash flow may be required to pay principal and interest on our indebtedness, which could reduce the funds available for working capital, capital expenditures, acquisitions or other purposes;
|
|
•
|
borrowings under the Credit Facility bear, and borrowings under any new facility could bear, interest at floating rates, which could result in higher interest expense in the event of an increase in interest rates. In 2018, short-term rates increased due to actions taken by the Federal Reserve and, therefore, borrowing costs increased in 2018, and may increase further in 2019, based on statements made by the Federal Reserve;
|
|
•
|
the terms of our indebtedness could limit our ability to borrow additional funds or sell assets to raise funds, if needed, for working capital, capital expenditures, acquisitions or other purposes;
|
|
•
|
our debt level and the various covenants contained in the Credit Facility, the indentures governing our 2025 Senior Notes and 2021 Senior Notes and the documents governing our other indebtedness could place us at a relative competitive disadvantage as compared to some of our competitors; and
|
|
•
|
the terms of our indebtedness could prevent us from raising the funds necessary to repurchase all of the 2025 Senior Notes and the 2021 Senior Notes tendered to us upon the occurrence of a change of control, which, in each case, would constitute a default under the applicable indenture, which in turn could trigger a default under the Credit Facility and the documents governing our other indebtedness.
|
In the ordinary course of business, we are required to obtain performance bonds from surety companies, the unavailability of which could adversely affect our results of operations and/or cash flows.
As is customary in the homebuilding industry, we are often required to provide surety bonds to secure our performance under construction contracts, development agreements and other arrangements. Our ability to obtain surety bonds primarily depends upon our credit rating, capitalization, working capital, past performance, management expertise and certain external factors, including the overall capacity of the surety market and the underwriting practices of surety bond issuers. The ability to obtain surety bonds also can be impacted by the willingness of insurance companies and sureties to issue performance bonds. If we were unable to obtain surety bonds when required, our results of operations and/or cash flows could be adversely impacted.
We can be injured by failures of persons who act on our behalf to comply with applicable regulations and guidelines.
There are instances in which subcontractors or others through whom we do business engage in practices that do not comply with applicable regulations or guidelines. When we learn of practices relating to homes we build or financing we provide that do not comply with applicable laws, rules or regulations, we actively move to stop the non-complying practices as soon as possible. However, regardless of the steps we take after we learn of practices that do not comply with applicable laws, rules or regulations, we can in some instances be subject to fines or other governmental penalties, and our reputation can be injured, due to the practices having taken place.
We could be adversely affected by efforts to impose joint employer liability on us for labor law violations committed by our subcontractors.
Our homes are constructed by employees of subcontractors and other parties. We have limited ability to control what these parties pay their employees or the rules they impose on their employees. However, various governmental agencies may seek to hold parties like us responsible for violations of wage and hour laws and other labor laws by subcontractors. A ruling by the National Labor Relations Board (“NLRB”) that a company, under some circumstances, could be held responsible for labor violations by its contractors was withdrawn, and the NLRB is currently considering a rule that would make it less likely that we could be deemed to be a joint employer of our subcontractors’ employees. However, future rulings by the NLRB or other courts or governmental agencies could make us responsible for labor violations committed by our subcontractors. Governmental rulings that hold us responsible for labor practices by our subcontractors could create substantial exposures for us under our subcontractor relationships.
Because of the seasonal nature of our business, our quarterly operating results can fluctuate.
We experience noticeable seasonality and quarter-to-quarter variability in homebuilding activity levels. In general, the number of homes delivered and associated home sales revenue increase during the third and fourth quarters, compared with the first and second quarters. We believe that this type of seasonality reflects the historical tendency of homebuyers to purchase new homes in the spring and summer with deliveries scheduled in the fall or winter, as well as the scheduling of construction to accommodate seasonal weather conditions in certain markets. There can be no assurance that this seasonality pattern will continue to exist in future reporting periods. In addition, as a result of such variability, our historical performance may not be a meaningful indicator of future results.
17
Homebuilding is subject to construction defect, product liability and warranty claims that can be significant and costly.
As a homebuilder, we are subject to construction defect, product liability and warranty claims in the ordinary course of business. These claims are common in the homebuilding industry and can be significant and costly. We and many of our subcontractors have general liability, property, workers compensation and other business insurance. This insurance is intended to protect us against a portion of our risk of loss from claims, subject to certain self-insured retentions, deductibles and other coverage limits. The availability of insurance for construction defects, and the scope of the coverage, are currently limited and the policies that can be obtained are costly and often include exclusions. There can be no assurance that coverage will not be further restricted or become more costly. Also, at times we have waived certain provisions of our customary subcontractor insurance requirements, which increases our and our insurers’ exposure to claims and increases the possibility that our insurance will not be adequate to protect us for all the costs we incur.
We record warranty and other reserves for the homes we sell based on a number of factors, including historical experience in our markets, insurance and actuarial assumptions and our judgment with respect to the qualitative risks associated with the types of homes we build. Because of the high degree of judgment required in determining these liability reserves, our actual future liability could differ significantly from our reserves. Given the inherent uncertainties, we cannot provide assurance that our insurance coverage, our subcontractor arrangements and our reserves will be adequate to address all of our construction defect, product liability and warranty claims. If the costs to resolve these claims exceed our estimates, our results of operations, financial condition and cash flows could be adversely affected.
We have received claims related to stucco installation from homeowners in certain of our communities in our Tampa and Orlando, Florida markets and have been named as a defendant in legal proceedings initiated by certain of such homeowners. While we have estimated our overall future stucco repair costs, our review of the stucco-related issues in our Florida communities is ongoing. Our estimate of our overall stucco repair costs is based on our judgment, various assumptions and internal data. Given the inherent uncertainties, we cannot provide assurance that the final costs to resolve these claims will not exceed our accrual and adversely affect our results of operations, financial condition and cash flows. Please see
Note 1
and
Note 8
to the Company’s Consolidated Financial Statements for further information regarding these stucco claims and our warranty reserves.
Our subcontractors can expose us to warranty and other risks.
We rely on subcontractors to construct our homes, and in many cases, to select and obtain building materials. Despite our detailed specifications and quality control procedures, in some cases, it may be determined that subcontractors used improper construction processes or defective materials in the construction of our homes. Although our subcontractors have principal responsibility for defects in the work they do, we have ultimate responsibility to the homebuyers. When we find these issues, we repair them in accordance with our warranty obligations. Improper construction processes and defective products widely used in the homebuilding industry can result in the need to perform extensive repairs to large numbers of homes. The cost of complying with our warranty obligations may be significant if we are unable to recover the cost of repairs from subcontractors, materials suppliers and insurers.
We also can suffer damage to our reputation, and may be exposed to possible liability, if subcontractors fail to comply with applicable laws, including laws involving things that are not within our control. When we learn about potentially improper practices by subcontractors, we try to cause the subcontractors to discontinue them. However, we may not always be able to cause our subcontractors to discontinue potentially improper practices, and even when we can, we may not be able to avoid claims against us relating to prior actions of our subcontractors.
18
Damage to our corporate reputation or brands from negative publicity could adversely affect our business, financial results and/or stock price.
Adverse publicity related to our company, industry, personnel, operations or business performance may cause damage to our corporate reputation or brands and may generate negative sentiment, potentially affecting the performance of our business or our stock price, regardless of its accuracy. Negative publicity can be disseminated rapidly through digital platforms, including social media, websites, blogs and newsletters. Customers and other interested parties value readily available information and often act on such information without further investigation and without regard to its accuracy. The harm may be immediate without affording us an opportunity for redress or correction, and our success in preserving our brand image depends on our ability to recognize, respond to and effectively manage negative publicity in a rapidly changing environment. Adverse publicity or unfavorable commentary from any source could damage our reputation, reduce the demand for our homes or negatively impact the morale and performance of our employees, which could adversely affect our business.
Natural disasters and severe weather conditions could delay deliveries, increase costs and decrease demand for homes in affected areas.
Several of our markets, specifically our operations in Florida, North Carolina, Washington, D.C. and Texas, are situated in geographical areas that are regularly impacted by severe storms, including hurricanes, flooding and tornadoes. In addition, our operations in the Midwest can be impacted by severe storms, including tornadoes. The occurrence of these or other natural disasters can cause delays in the completion of, or increase the cost of, developing one or more of our communities, and as a result could materially and adversely impact our results of operations.
We are subject to extensive government regulations, which could restrict our business and cause us to incur significant expense.
The homebuilding industry is subject to numerous local, state, and federal statutes, ordinances, rules, and regulations concerning building, zoning, sales, consumer protection, the environment, and similar matters. This regulation affects construction activities as well as sales activities, mortgage lending activities, land availability and other dealings with home buyers. These statutes, ordinances, rules, and regulations, and any failure to comply therewith, could give rise to additional liabilities or expenditures and have an adverse effect on our results of operations, financial condition or business.
We must also obtain licenses, permits and approvals from various governmental authorities in connection with our development activities, and these governmental authorities often have broad discretion in exercising their approval authority. Municipalities may also restrict or place moratoriums on the availability of utilities, such as water and sewer taps. In some areas, municipalities may enact growth control initiatives, which will restrict the number of building permits available in a given year. In addition, we may be required to apply for additional approvals or modify our existing approvals because of changes in local circumstances or applicable law. If municipalities in which we operate take actions like these, it could have an adverse effect on our business by causing delays, increasing our costs, or limiting our ability to operate in those municipalities.
We incur substantial costs related to compliance with legal and regulatory requirements. Any increase in legal and regulatory requirements may cause us to incur substantial additional costs or, in some cases, cause us to determine that certain property is not feasible for development.
Information technology failures and data security breaches could harm our business.
We use information technology, digital communications and other computer resources to carry out important operational and marketing activities and to maintain our business records. We have implemented systems and processes intended to address ongoing and evolving cyber-security risks, secure our information technology, applications and computer systems, and prevent unauthorized access to or loss of sensitive, confidential and personal data. We also provide regular personnel awareness training regarding potential cyber-security threats, including the use of internal tips, reminders and phishing assessments, to help ensure employees remain diligent in identifying potential risks. In addition, we have deployed monitoring capabilities to support early detection, internal and external escalation, and effective responses to potential anomalies. Many of our information technology and other computer resources are provided to us and/or maintained on our behalf by third-party service providers pursuant to agreements that specify to varying degrees certain security and service level standards. We also rely upon our third-party service providers to maintain effective cyber-security measures to keep our information secure and to carry cyber insurance. Although we and our service providers employ what we believe are adequate security, disaster recovery and other preventative and corrective measures, our security measures, taken as a whole, may not be sufficient for all possible situations and may be vulnerable to, among other things, hacking, employee error, system error and faulty password management.
Our ability to conduct our business may be impaired if these informational technology and computer resources, including our website, are compromised, degraded, damaged or fail, whether due to a virus or other harmful circumstance, intentional penetration
19
or disruption of our information technology resources by a third party, natural disaster, hardware or software corruption or failure or error (including a failure of security controls incorporated into or applied to such hardware or software), telecommunications system failure, service provider error or failure or intentional or unintentional personnel actions (including the failure to follow our security protocols), or lost connectivity to our networked resources. A significant disruption in the functioning of these resources, or breach thereof, including our website, could damage our reputation and cause us to lose customers, sales and revenue.
In addition, breaches of our information technology systems or data security systems, including cyber-attacks, could result in the unintended and/or unauthorized public disclosure or the misappropriation of proprietary, personal identifying and confidential information (including information we collect and retain in connection with our business about our homebuyers, business partners and employees), and require us to incur significant expense (that we may not be able to recover in whole or in part from our service providers or responsible parties, or their or our insurers) to address and remediate or otherwise resolve. The unintended and/or unauthorized public disclosure or the misappropriation of proprietary, personal identifying or confidential information may also lead to litigation or other proceedings against us by affected individuals and/or business partners and/or by regulators, and the outcome of such proceedings, which could include losses, penalties, fines, injunctions, expenses and charges recorded against our earnings, could have a material and adverse effect on our financial position, results of operations and cash flows and harm our reputation. In addition, the costs of maintaining adequate protection against such threats, based on considerations of their evolution, increasing sophistication, pervasiveness and frequency and/or increasingly demanding government-mandated standards or obligations regarding information security and privacy, could be material to our consolidated financial statements in a particular period or over various periods.
We are dependent on the services of certain key employees, and the loss of their services could hurt our business.
Our future success depends, in part, on our ability to attract, train and retain skilled personnel. If we are unable to retain our key employees or attract, train and retain other skilled personnel in the future, this could materially and adversely impact our operations and result in additional expenses for identifying and training new personnel.
|
Item 1B.
|
UNRESOLVED STAFF COMMENTS
|
None.
|
Item 2.
|
PROPERTIES
|
We own and operate an approximately 85,000 square foot office building for our home office in Columbus, Ohio and lease all of our other offices. As of September 30, 2018, we reclassified this building as an asset held for sale. For further discussion, please see
Note 1
to our Consolidated Financial Statements in Item 8 of this Form 10-K.
Due to the nature of our business, a substantial amount of property is held as inventory in the ordinary course of business. See “Item 1. BUSINESS – Land Acquisition and Development” and “Item 1. BUSINESS – Backlog.”
|
Item 3.
|
LEGAL PROCEEDINGS
|
The Company and certain of its subsidiaries have received claims from homeowners in certain of our communities in our Tampa and Orlando, Florida markets (and been named as a defendant in legal proceedings initiated by certain of such homeowners) related to stucco on their homes. Please refer to
Note 8
to the Company’s Consolidated Financial Statements for further information regarding these stucco claims.
The Company and certain of its subsidiaries have been named as defendants in certain other legal proceedings which are incidental to our business. While management currently believes that the ultimate resolution of these other legal proceedings, individually and in the aggregate, will not have a material effect on the Company’s financial position, results of operations and cash flows, such legal proceedings are subject to inherent uncertainties. The Company has recorded a liability to provide for the anticipated costs, including legal defense costs, associated with the resolution of these other legal proceedings. However, the possibility exists that the costs to resolve these legal proceedings could differ from the recorded estimates and, therefore, have a material effect on the Company’s net income for the periods in which they are resolved.
Item 4. MINE SAFETY DISCLOSURES
None.
20
PART II
|
Item 5.
|
MARKET FOR REGISTRANT’S COMMON EQUITY, RELATED SHAREHOLDER MATTERS AND ISSUER PURCHASES OF EQUITY SECURITIES
|
Market for Common Shares and Dividends
The Company’s common shares are traded on the New York Stock Exchange under the symbol “MHO.” As of
February 20, 2019
, there were approximately
444
record holders of the Company’s common shares. At that date, there were
30,137,141
common shares issued and
27,521,304
common shares outstanding.
21
Performance Graph
The following graph illustrates the Company’s performance in the form of cumulative total return to holders of our common shares for the last five calendar years through
December 31, 2018
, assuming a hypothetical investment of $100 and reinvestment of all dividends paid on such investment, compared to the cumulative total return of the same hypothetical investment in both the Standard and Poor’s 500 Stock Index and the Standard & Poor’s 500 Homebuilding Index.
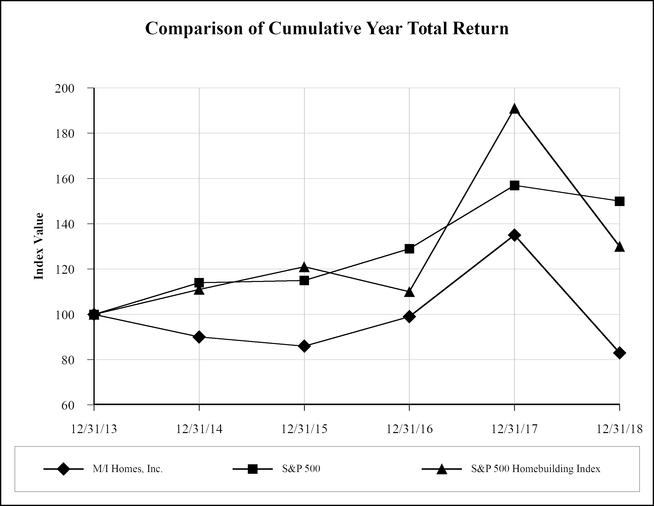
|
|
Period Ending
|
|||||||||||||||||
|
Index
|
12/31/2013
|
12/31/2014
|
12/31/2015
|
12/31/2016
|
12/31/2017
|
12/31/2018
|
||||||||||||
|
M/I Homes, Inc.
|
$
|
100.00
|
|
$
|
90.22
|
|
$
|
86.13
|
|
$
|
98.94
|
|
$
|
135.17
|
|
$
|
82.59
|
|
|
S&P 500
|
100.00
|
|
113.69
|
|
115.26
|
|
129.05
|
|
157.22
|
|
150.33
|
|
||||||
|
S&P 500 Homebuilding Index
|
100.00
|
|
111.43
|
|
120.95
|
|
110.32
|
|
191.24
|
|
129.56
|
|
||||||
22
Share Repurchases
Common shares purchased during each month during the fourth quarter ended
December 31, 2018
were as follows:
|
Period
|
Total Number of Shares Purchased
|
Average Price Paid per Share
|
Total Number of Shares Purchased as Part of Publicly Announced Plans or Programs
(1)
|
Approximate Dollar Value of Shares that May Yet be Purchased Under the Plans or Programs (1)
|
||||||||
|
October 1, 2018 - October 31, 2018
|
254,427
|
|
$
|
23.16
|
|
254,427
|
|
33,021,709
|
|
|||
|
November 1, 2018 - November 30, 2018
|
228,883
|
|
$
|
23.63
|
|
228,883
|
|
27,613,196
|
|
|||
|
December 1, 2018 - December 31, 2018
|
148,243
|
|
$
|
22.41
|
|
148,243
|
|
24,290,682
|
|
|||
|
Quarter ended December 31, 2018
|
631,553
|
|
$
|
23.16
|
|
631,553
|
|
24,290,682
|
|
|||
|
(1)
|
On August 14, 2018, the Company announced that its Board of Directors authorized a share repurchase program (the “2018 Share Repurchase Program”) pursuant to which the Company may purchase up to
$50 million
of its outstanding common shares through open market transactions, privately negotiated transactions or otherwise in accordance with all applicable laws, including pursuant to any trading plan that may be adopted in accordance with Rule 10b5-1 of the Securities Exchange Act of 1934. The 2018 Share Repurchase Program does not have an expiration date and may be modified, suspended or discontinued at any time. Please see
Note 18
to our Consolidated Financial Statements for additional information.
|
Please see
Note 11
to our Consolidated Financial Statements for more information regarding the limit imposed by the indenture governing our 2025 Senior Notes and the indenture governing our 2021 Senior Notes on our ability to pay dividends on, and repurchase, our common shares to the amount of the positive balance in our “restricted payments basket,” as defined in the indentures.
23
ITEM 6. SELECTED FINANCIAL DATA
The following table sets forth our selected consolidated financial data as of the dates and for the periods indicated. This table should be read together with “Item 7. Management’s Discussion and Analysis of Financial Condition and Results of Operations” and our Consolidated Financial Statements, including the Notes thereto, contained in this Annual Report on Form 10-K. These historical results may not be indicative of future results.
|
(In thousands, except per share amounts)
|
2018
|
2017
|
2016
|
2015
|
2014
|
||||||||||
|
Income Statement (Year Ended December 31):
|
|
|
|
|
|||||||||||
|
Revenue
|
$
|
2,286,282
|
|
$
|
1,961,971
|
|
$
|
1,691,327
|
|
$
|
1,418,395
|
|
$
|
1,215,180
|
|
|
Gross margin
(a)
|
$
|
443,769
|
|
$
|
393,268
|
|
$
|
329,152
|
|
$
|
300,094
|
|
$
|
252,732
|
|
|
Income before income taxes
(a) (b) (c)
|
$
|
141,289
|
|
$
|
120,324
|
|
$
|
91,785
|
|
$
|
86,929
|
|
$
|
69,736
|
|
|
Net income
(a) (b) (c) (d) (e)
|
$
|
107,663
|
|
$
|
72,081
|
|
$
|
56,609
|
|
$
|
51,763
|
|
$
|
50,789
|
|
|
Preferred dividends
|
$
|
—
|
|
$
|
3,656
|
|
$
|
4,875
|
|
$
|
4,875
|
|
$
|
4,875
|
|
|
Excess of fair value over book value of preferred shares redeemed
|
$
|
—
|
|
$
|
2,257
|
|
$
|
—
|
|
$
|
—
|
|
$
|
—
|
|
|
Net income to common shareholders
|
$
|
107,663
|
|
$
|
66,168
|
|
$
|
51,734
|
|
$
|
46,888
|
|
$
|
45,914
|
|
|
Earnings per share to common shareholders:
|
|
|
|
|
|
|
|
|
|
|
|||||
|
Basic:
|
$
|
3.81
|
|
$
|
2.57
|
|
$
|
2.10
|
|
$
|
1.91
|
|
$
|
1.88
|
|
|
Diluted:
|
$
|
3.70
|
|
$
|
2.26
|
|
$
|
1.84
|
|
$
|
1.68
|
|
$
|
1.65
|
|
|
Weighted average shares outstanding:
|
|
|
|
|
|
|
|
|
|
|
|||||
|
Basic
|
28,234
|
|
25,769
|
|
24,666
|
|
24,575
|
|
24,463
|
|
|||||
|
Diluted
|
29,178
|
|
30,688
|
|
30,116
|
|
30,047
|
|
29,912
|
|
|||||
|
Balance Sheet (December 31):
|
|
|
|
|
|
|
|
|
|
|
|||||
|
Inventory
|
$
|
1,674,460
|
|
$
|
1,414,574
|
|
$
|
1,215,934
|
|
$
|
1,112,042
|
|
$
|
918,589
|
|
|
Total assets
|
$
|
2,021,581
|
|
$
|
1,864,771
|
|
$
|
1,548,511
|
|
$
|
1,415,554
|
|
$
|
1,205,239
|
|
|
Notes payable banks – homebuilding operations
|
$
|
117,400
|
|
$
|
—
|
|
$
|
40,300
|
|
$
|
43,800
|
|
$
|
30,000
|
|
|
Notes payable banks – financial services operations
|
$
|
153,168
|
|
$
|
168,195
|
|
$
|
152,895
|
|
$
|
123,648
|
|
$
|
85,379
|
|
|
Notes payable - other
|
$
|
5,938
|
|
$
|
10,576
|
|
$
|
6,415
|
|
$
|
8,441
|
|
$
|
9,518
|
|
|
Convertible senior subordinated notes due 2017 - net
|
$
|
—
|
|
$
|
—
|
|
$
|
57,093
|
|
$
|
56,518
|
|
$
|
55,943
|
|
|
Convertible senior subordinated notes due 2018 - net
|
$
|
—
|
|
$
|
86,132
|
|
$
|
85,423
|
|
$
|
84,714
|
|
$
|
84,006
|
|
|
Senior notes - net
|
$
|
544,455
|
|
$
|
542,831
|
|
$
|
295,677
|
|
$
|
294,727
|
|
$
|
226,099
|
|
|
Shareholders’ equity
|
$
|
855,303
|
|
$
|
747,298
|
|
$
|
654,174
|
|
$
|
596,566
|
|
$
|
544,295
|
|
|
(a)
|
Includes
$5.1 million
($0.13 per diluted share) of charges related to purchase accounting adjustments taken during
2018
as a result of our acquisition of Pinnacle Homes in Detroit, Michigan on March 1, 2018, pre-tax charges of
$8.5 million
($0.18 per diluted share) and
$19.4 million
($0.40 per diluted share) for stucco-related repair costs in certain of our Florida communities (as more fully discussed in
Note 8
to our Consolidated Financial Statements) taken during the years ended December 31, 2017 and 2016, respectively, and
$5.8 million
($0.15 per diluted share),
$7.7 million
($0.16 per diluted share),
$4.0 million
($0.08 per diluted share),
$3.6 million
($0.08 per diluted share), and
$3.5 million
($0.07 per diluted share) related to pre-tax impairment charges taken during the years ended December 31, 2018, 2017, 2016, 2015 and 2014, respectively.
|
|
(b)
|
Includes $1.7 million ($0.05 per diluted share) of charges related to acquisition and integration costs taken during
2018
as a result of our acquisition of Pinnacle Homes.
|
|
(c)
|
Includes a pre-tax charge of $7.8 million ($0.16 per diluted share) for the loss on early extinguishment of debt taken during the year ended December 31, 2015.
|
|
(d)
|
Includes $9.3 million ($0.31 per diluted share) related to the accounting benefit from income taxes associated with the reversal of our deferred tax asset valuation allowance for the year ended December 31, 2014.
|
|
(e)
|
Includes a non-cash provisional tax expense of approximately $6.5 million ($0.21 per diluted share) related to the re-measurement of our deferred tax assets as a result of the 2017 Tax Act enacted in December 2017 for the year ended December 31, 2017.
|
24
ITEM 7: MANAGEMENT’S DISCUSSION AND ANALYSIS OF FINANCIAL CONDITION AND RESULTS
OF OPERATIONS
OVERVIEW
M/I Homes, Inc. and subsidiaries (the “Company” or “we”) is one of the nation’s leading builders of single-family homes, having sold over
111,400
homes since we commenced homebuilding activities in 1976. The Company’s homes are marketed and sold primarily under the M/I Homes brand (M/I Homes and Showcase Collection (exclusively by M/I)). In addition, the Hans Hagen brand is used in older communities in our Minneapolis/St. Paul, Minnesota market, and, following our acquisition of the homebuilding assets and operations of Pinnacle Homes, a privately-held homebuilder in the Detroit, Michigan market (“Pinnacle Homes”), in March 2018, the Pinnacle Homes brand is used in that market in connection with the sale of homes in active communities as of the date of the acquisition. The Company has homebuilding operations in Columbus and Cincinnati, Ohio; Indianapolis, Indiana; Chicago, Illinois; Minneapolis/St. Paul, Minnesota; Detroit, Michigan; Tampa, Sarasota and Orlando, Florida; Austin, Dallas/Fort Worth, Houston and San Antonio, Texas; Charlotte and Raleigh, North Carolina; and the Virginia and Maryland suburbs of Washington, D.C.
Included in this Management’s Discussion and Analysis of Financial Condition and Results of Operations are the following topics relevant to the Company’s performance and financial condition:
|
•
|
Application of Critical Accounting Estimates and Policies;
|
|
•
|
Results of Operations;
|
|
•
|
Discussion of Our Liquidity and Capital Resources;
|
|
•
|
Summary of Our Contractual Obligations;
|
|
•
|
Off-Balance Sheet Arrangements; and
|
|
•
|
Impact of Interest Rates and Inflation.
|
APPLICATION OF CRITICAL ACCOUNTING ESTIMATES AND POLICIES
The preparation of financial statements in conformity with accounting principles generally accepted in the United States of America (“GAAP”) requires management to make estimates and assumptions that affect the reported amounts of assets and liabilities and the disclosure of contingent assets and liabilities at the date of the consolidated financial statements and the reported amounts of revenue and expenses during the reporting period. Management bases its estimates and assumptions on historical experience and various other factors that it believes are reasonable under the circumstances, the results of which form the basis for making judgments about the carrying value of assets and liabilities that are not readily apparent from other sources. On an ongoing basis, management evaluates such estimates and assumptions and makes adjustments as deemed necessary. Actual results could differ from these estimates using different estimates and assumptions, or if conditions are significantly different in the future. See “Forward - Looking Statements” above in Part I.
Listed below are those estimates and policies that we believe are critical and require the use of complex judgment in their application. Our critical accounting estimates should be read in conjunction with the Notes to our Consolidated Financial Statements.
Revenue Recognition.
On January 1, 2018, we adopted Financial Accounting Standards Board (“FASB”) Accounting Standards Codification (“ASC”) 606,
Revenue from Contracts from Customers
(“ASC 606”),
using the modified retrospective transition method, which includes a cumulative catch-up in retained earnings on the initial date of adoption for existing contracts (those contracts under which obligations have not been completed) as of, and new contracts after, January 1, 2018. Results for reporting periods beginning after January 1, 2018 are presented under ASC 606, while prior period amounts are not adjusted and continue to be reported in accordance with our historic accounting under ASC 605,
Revenue Recognition
(“ASC 605”)
.
We did not have any material adjustments to our 2018 results under ASC 606.
Revenue from the sale of a home and revenue from the sale of land to third parties are recognized in the financial statements on the date of closing (point in time) if delivery has occurred, title has passed, all performance obligations have been met (see definition of performance obligations below), and control of the home or land is transferred to the buyer in an amount that reflects the consideration we expect to be entitled to in exchange for the home or land.
We recognize the majority of the revenue associated with our mortgage loan operations when the mortgage loans are sold and/or related servicing rights are sold to third party investors or retained and managed under a third party subservice arrangement. The revenue recognized is reduced by the fair value of the related guarantee provided to the investor. The fair value of the guarantee is recognized in revenue when the Company is released from its obligation under the guarantee (note that guarantees are excluded from the scope of ASC 606). We recognize financial services revenue associated with our title operations as homes are delivered,
25
closing services are rendered, and title policies are issued, all of which generally occur simultaneously as each home is delivered. All of the underwriting risk associated with title insurance policies is transferred to third-party insurers.
A performance obligation is a promise in a contract to transfer a distinct good or service to the customer. A contract’s transaction price is allocated to each distinct performance obligation and recognized as revenue when, or as, the performance obligation is satisfied. All of our contracts to sell homes have a single performance obligation as the promise to transfer the home is not separately identifiable from other promises in the contract and, therefore, not distinct. Our third party land contracts may include multiple performance obligations; however, revenue expected to be recognized in any future year related to remaining performance obligations, excluding revenue pertaining to contracts that have an original expected duration of one year or less, is not material.
We generally expense sales commissions when incurred because the amortization period would have been one year or less. These costs are recorded within general, selling and administrative expenses as part of our sales and marketing expenses. We do not disclose the value of unsatisfied performance obligations for contracts with an original expected length of one year or less.
Please see
Note 1
to our Consolidated Financial Statements for additional information related to our revenues disaggregated by geography and revenue source.
Home Cost of Sales.
All associated homebuilding costs are charged to cost of sales in the period when the revenues from home deliveries are recognized. Homebuilding costs include: land and land development costs; home construction costs (including an estimate of the costs to complete construction); previously capitalized interest; real estate taxes; indirect costs; and estimated warranty costs. All other costs are expensed as incurred. Sales incentives, including pricing discounts and financing costs paid by the Company, are recorded as a reduction of revenue in the Company’s Consolidated Statements of Income. Sales incentives in the form of options or upgrades are recorded in homebuilding costs.
Inventory.
Inventory includes the costs of land acquisition, land development and home construction, capitalized interest, real estate taxes, direct overhead costs incurred during development and home construction, and common costs that benefit the entire community, less impairments, if any. Land acquisition, land development and common costs (both incurred and estimated to be incurred) are typically allocated to individual lots based on the total number of lots expected to be closed in each community or phase, or based on the relative fair value, the relative sales value or the front footage method of each lot. Any changes to the estimated total development costs of a community or phase are allocated proportionately to the homes remaining in the community or phase and homes previously closed. The cost of individual lots is transferred to homes under construction when home construction begins. Home construction costs are accumulated on a specific identification basis. Costs of home deliveries include the specific construction cost of the home and the allocated lot costs. Such costs are charged to cost of sales simultaneously with revenue recognition, as discussed above. When a home is closed, we typically have not yet paid all incurred costs necessary to complete the home. As homes close, we compare the home construction budget to actual recorded costs to date to estimate the additional costs to be incurred from our subcontractors related to the home. We record a liability and a corresponding charge to cost of sales for the amount we estimate will ultimately be paid related to that home. We monitor the accuracy of such estimates by comparing actual costs incurred in subsequent months to the estimate. Although actual costs to complete a home in the future could differ from our estimates, our method has historically produced consistently accurate estimates of actual costs to complete closed homes.
Inventory is recorded at cost, unless events and circumstances indicate that the carrying value of the land is impaired, at which point the inventory is written down to fair value as required by ASC 360-10,
Property, Plant and Equipment
(“ASC 360”). The Company assesses inventory for recoverability on a quarterly basis if events or changes in local or national economic conditions indicate that the carrying amount of an asset may not be recoverable. In conducting our quarterly review for indicators of impairment on a community level, we evaluate, among other things, margins on sales contracts in backlog, the margins on homes that have been delivered, expected changes in margins with regard to future home sales over the life of the community, expected changes in margins with regard to future land sales, the value of the land itself as well as any results from third-party appraisals. From the review of all of these factors, we identify communities whose carrying values may exceed their estimated undiscounted future cash flows and run a test for recoverability. For those communities whose carrying values exceed the estimated undiscounted future cash flows and which are deemed to be impaired, the impairment recognized is measured by the amount by which the carrying amount of the communities exceeds the estimated fair value. Due to the fact that the Company’s cash flow models and estimates of fair values are based upon management estimates and assumptions, unexpected changes in market conditions and/or changes in management’s intentions with respect to the inventory may lead the Company to incur additional impairment charges in the future. Because each inventory asset is unique, there are numerous inputs and assumptions used in our valuation techniques, including estimated average selling price, construction and development costs, absorption pace (reflecting any product mix change strategies implemented or to be implemented), selling strategies, alternative land uses (including disposition of all or a portion of the land owned), or discount rates, which could materially impact future cash flow and fair value estimates.
26
As of
December 31, 2018
, our projections generally assume a gradual improvement in market conditions. If communities are not recoverable based on estimated future undiscounted cash flows, the impairment to be recognized is measured as the amount by which the carrying amount of the assets exceeds the estimated fair value of the assets. The fair value of a community is estimated by discounting management’s cash flow projections using an appropriate risk-adjusted interest rate. As of
December 31, 2018
, we utilized discount rates ranging from
13%
to
16%
in our valuations. The discount rate used in determining each asset’s estimated fair value reflects the inherent risks associated with the related estimated cash flow stream, as well as current risk-free rates available in the market and estimated market risk premiums.
Our quarterly assessments reflect management’s best estimates. Due to the inherent uncertainties in management’s estimates and uncertainties related to our operations and our industry as a whole as further discussed in “Item 1A. Risk Factors” in Part I of this Annual Report on Form 10-K, we are unable to determine at this time if and to what extent continuing future impairments will occur. Additionally, due to the volume of possible outcomes that can be generated from changes in the various model inputs for each community, we do not believe it is possible to create a sensitivity analysis that can provide meaningful information for the users of our financial statements.
Goodwill.
Goodwill represents the excess of the purchase price paid over the fair value of the net assets acquired and liabilities assumed in business combinations. As a result of the Company’s acquisition of the homebuilding assets and operations of Pinnacle Homes in Detroit, Michigan on March 1, 2018, the Company recorded goodwill of
$16.4 million
as of
December 31, 2018
, which is included as goodwill in our Consolidated Balance Sheets. This amount was based on the estimated fair values of the acquired assets and assumed liabilities at the date of the acquisition in accordance with ASC 350,
Intangibles, Goodwill and Other
(“ASC 350”). Please see
Note 12
to the Company’s Consolidated Financial Statements for further discussion.
In January 2017, the FASB issued ASU 2017-04,
Simplifying the Test for Goodwill Impairment
(“ASU 2017-04”), which eliminates Step 2 from the goodwill impairment test in order to simplify the subsequent measurement of goodwill. Step 2 measures a goodwill impairment loss by comparing the implied fair value of a reporting unit’s goodwill with the carrying amount of that goodwill. As a result of ASU 2017-04, the Company will apply a one-step quantitative test and record the amount of goodwill impairment as the excess of a reporting unit’s carrying amount over its fair value, not to exceed the total amount of goodwill allocated to the reporting unit. ASU 2017-04 is effective beginning January 1, 2020, with early adoption permitted, and applied prospectively. The Company elected to early adopt this ASU effective for the fiscal year ended December 31, 2018 in its impairment testing and analyses. The adoption of ASU 2017-04 on January 1, 2018 did not have an impact on the Company’s consolidated financial statements and disclosures. The Company performed its annual goodwill impairment analysis during the fourth quarter of 2018, and as no indicators for impairment existed at
December 31, 2018
, no impairment was recorded.
In accordance with ASC 350, the Company analyzes goodwill for impairment on an annual basis (or more often if indicators of impairment exist). The Company performs a qualitative assessment to determine whether the existence of events or circumstances leads to a determination that it is more-likely-than-not that the fair value of a reporting unit is less than its carrying amount. When performing a qualitative assessment, the Company evaluates qualitative factors such as: (1) macroeconomic conditions, such as a deterioration in general economic conditions; (2) industry and market considerations, such as deterioration in the environment in which the entity operates; (3) cost factors, such as increases in raw materials and labor costs; and (4) overall financial performance, such as negative or declining cash flows or a decline in actual or planned revenue or earnings, to determine if it is more-likely-than-not that the fair value of the reporting unit is less than its carrying amount. If the qualitative assessment indicates that it is more-likely-than-not that the fair value of the reporting unit is less than its carrying amount, then a quantitative assessment is performed to determine the reporting unit’s fair value. If the reporting unit’s carrying value exceeds its fair value, then an impairment loss is recognized for the amount of the excess of the carrying amount over the reporting unit’s fair value.
The evaluation of goodwill for possible impairment includes estimating fair value using one or a combination of valuation techniques, such as discounted cash flows. These valuations require the Company to make estimates and assumptions regarding future operating results, cash flows, changes in capital expenditures, selling prices, profitability, and the cost of capital. Although the Company believes its assumptions and estimates are reasonable, deviations from the assumptions and estimates could produce a materially different result.
Land Option or Purchase Agreements.
In accordance with ASC 810-10,
Consolidation
(“ASC 810”), we analyze our land option or purchase agreements to determine whether the corresponding land seller is a variable interest entity (“VIE”) and, if so, whether we are the primary beneficiary (using an analysis similar to that described in
Note 1
to our Consolidated Financial Statements within the description of our significant accounting policy for VIEs). Although we do not have legal title to the optioned land, ASC 810 requires a company to consolidate a VIE if the company is determined to be the primary beneficiary. In cases where we are the primary beneficiary, even though we do not have title to such land, we are required to consolidate these purchase/option agreements and reflect such assets and liabilities as Consolidated Inventory Not Owned on our Consolidated Balance Sheets. At
27
both
December 31, 2018 and 2017
, we have concluded that we were not the primary beneficiary of any VIEs from which we are purchasing under land option or purchase agreements.
In addition, we evaluate our land option or purchase agreements to determine for each contract if (1) a portion or all of the purchase price is a specific performance requirement, or (2) the amount of deposits and prepaid acquisition and development costs have exceeded certain thresholds relative to the remaining purchase price of the lots. If either is the case, then the remaining purchase price of the lots (or the specific performance amount, if applicable) is recorded as an asset and liability in Consolidated Inventory Not Owned on our Consolidated Balance Sheets.
Please see
Note 1
to our Consolidated Financial Statements and the “Off-Balance Sheet Arrangements” section below for additional information related to our off-balance-sheet arrangements.
Warranty Reserves.
We record warranty reserves to cover our exposure to the costs for materials and labor not expected to be covered by our subcontractors to the extent they relate to warranty-type claims. Warranty reserves are established by charging cost of sales and crediting a warranty reserve for each home delivered. The warranty reserves for the Company’s Home Builder’s Limited Warranty (“HBLW”) are established as a percentage of average sales price and adjusted based on historical payment patterns determined, generally, by geographic area and recent trends. Factors that are given consideration in determining the HBLW reserves include: (1) the historical range of amounts paid per average sales price on a home; (2) type and mix of amenity packages added to the home; (3) any warranty expenditures not considered to be normal and recurring; (4) timing of payments; (5) improvements in quality of construction expected to impact future warranty expenditures; and (6) conditions that may affect certain projects and require a different percentage of average sales price for those specific projects. Changes in estimates for warranties occur due to changes in the historical payment experience and differences between the actual payment pattern experienced during the period and the historical payment pattern used in our evaluation of the warranty reserve balance at the end of each quarter. Actual future warranty costs could differ from our current estimated amount.
Our warranty reserves for our 30-year (offered on all homes sold after April 25, 1998 and on or before December 1, 2015 in all of our markets except our Texas markets), 15-year (offered on all homes sold after December 1, 2015 in all of our markets except our Texas markets) and 10-year (offered on all homes sold in our Texas markets) transferable structural warranty programs are established on a per-unit basis. While the structural warranty reserve is recorded as each house is delivered, the sufficiency of the structural warranty per unit charge and total reserve is reevaluated on an annual basis, with the assistance of an actuary, using our own historical data and trends, as well as industry-wide historical data and trends, and other project specific factors. The reserves are also evaluated quarterly and adjusted if we encounter activity that is not consistent with the historical experience used in the annual analysis. These reserves are subject to variability due to uncertainties regarding structural defect claims for products we build, the markets in which we build, claim settlement history, insurance and legal interpretations, among other factors.
While we believe that our warranty reserves are sufficient to cover our projected costs, there can be no assurances that historical data and trends will accurately predict our actual warranty costs. Our warranty reserves were adversely affected by stucco-related repairs in certain of our Florida communities in each of 2018, 2017 and 2016. Please see
Note 1
and
Note 8
to our Consolidated Financial Statements for additional information related to our warranty reserves.
Self-insurance Reserves.
Self-insurance reserves are made for estimated liabilities associated with employee health care, workers’ compensation, and general liability insurance. The reserves related to employee health care and workers’ compensation are based on historical experience and open case reserves. Our workers’ compensation claims and our general liability claims are insured by a third party, except for workers compensation claims made in the State of Ohio where the Company is self-insured. The Company records a reserve for general liability claims falling below the Company’s deductible. The reserve estimate is based on an actuarial evaluation of our past history of general liability claims, other industry specific factors and specific event analysis. Because of the high degree of judgment required in determining these estimated accrual amounts, actual future costs could differ from our current estimated amounts. Please see
Note 1
to our Consolidated Financial Statements for additional information related to our self-insurance reserves.
Stock-Based Compensation.
We measure and recognize compensation expense associated with our grant of equity-based awards in accordance with ASC 718,
Compensation-Stock Compensation
(“ASC 718”), which generally requires that companies measure and recognize stock-based compensation expense in an amount equal to the fair value of share-based awards granted under compensation arrangements over the related vesting period. As discussed further in Notes
1
and
2
to our Consolidated Financial Statements, we have granted share-based awards to certain of our employees and directors in the form of stock options, director stock units and performance share units (“PSU’s”).
Determining the fair value of share-based awards requires judgment to identify the appropriate valuation model and develop the assumptions. The grant date fair value for stock option awards and PSU’s with a market condition (as defined in ASC 718) is estimated using the Black-Scholes option pricing model and the Monte Carlo simulation methodology, respectively. The grant
28
date fair value for the director stock units and PSU’s with a performance condition (as defined in ASC 718) is based upon the closing price of our common shares on the date of grant. We recognize stock-based compensation expense for our stock option awards and PSU’s with a market condition over the requisite service period of the award while stock-based compensation expense for our director stock units, which vest immediately, is fully recognized in the period of the award. For the portion of the PSU’s awarded subject to the satisfaction of a performance condition, we recognize compensation expense on a straight-line basis over the performance period based on the probable outcome of the related performance condition. If satisfaction of the performance condition is not probable, compensation expense recognition is deferred until probability is attained and a cumulative stock-based compensation expense adjustment is recorded and recognized ratably over the remaining service period. The Company reevaluates the probability of the satisfaction of the performance condition on a quarterly basis, and stock-based compensation expense is adjusted based on the portion of the requisite service period that has passed. If actual results differ significantly from these estimates, stock-based compensation expense could be higher and have a material impact on our consolidated financial statements. Please see
Note 2
to our Consolidated Financial Statements for more information regarding our stock-based compensation.
Valuation of Deferred Tax Assets.
The Company records income taxes under the asset and liability method, under which deferred tax assets and liabilities are recognized based on future tax consequences attributable to (1) temporary differences between the financial statement carrying amounts of existing assets and liabilities and their respective tax bases and (2) operating loss and tax credit carryforwards, if applicable. Deferred tax assets and liabilities are measured using enacted tax rates in effect in the years in which those temporary differences are expected to reverse. The effect on deferred tax assets and liabilities of a change in tax rates is recognized in earnings in the period when the change is enacted. Please see
Note 14
to our Consolidated Financial Statements for further discussion.
In accordance with ASC 740-10,
Income Taxes
(“ASC 740”)
,
we evaluate the realizability of our deferred tax assets, including the benefit from net operating losses (“NOLs”) and tax credit carryforwards, to determine if a valuation allowance is required based on whether it is more likely than not (a likelihood of more than 50%) that all or any portion of the deferred tax assets will not be realized. The ultimate realization of deferred tax assets is primarily dependent upon the generation of future taxable income. In determining the future tax consequences of events that have been recognized in the financial statements or tax returns, judgment is required. Please see
Note 1
to our Consolidated Financial Statements for additional information related to our valuation of deferred tax assets. We have no valuation allowance on our deferred tax assets and state NOL carryforwards at December 31, 2018.
Segment Reporting.
The application of segment reporting requires significant judgment in determining our operating segments. Operating segments are defined as a component of an enterprise for which discrete financial information is available and is reviewed regularly by the Company’s chief operating decision makers to evaluate performance, make operating decisions and determine how to allocate resources. The Company’s chief operating decision makers evaluate the Company’s performance in various ways, including: (1) the results of our
16
individual homebuilding operating segments and the results of our financial services operations; (2) the results of our three homebuilding reportable segments; and (3) our consolidated financial results.
In accordance with ASC 280,
Segment Reporting
(“ASC 280”), we have identified each homebuilding division as an operating segment as each homebuilding division engages in business activities from which it earns revenue, primarily from the sale and construction of single-family attached and detached homes, acquisition and development of land, and the occasional sale of lots to third parties. Our financial services operations generate revenue primarily from the origination, sale and servicing of mortgage loans and title services primarily for purchasers of the Company’s homes and are included in our financial services reportable segment. Corporate is a non-operating segment that develops and implements strategic initiatives and supports our operating segments by centralizing key administrative functions such as accounting, finance, treasury, information technology, insurance and risk management, legal, marketing and human resources.
In accordance with the aggregation criteria defined in ASC 280, we have determined our reportable segments are as follows: Midwest homebuilding, Southern homebuilding, Mid-Atlantic homebuilding and financial services operations. The homebuilding operating segments included in each reportable segment have been aggregated because they share similar aggregation characteristics as prescribed in ASC 280 in the following regards: (1) long-term economic characteristics; (2) historical and expected future long-term gross margin percentages; (3) housing products, production processes and methods of distribution; and (4) geographical proximity. We may, however, be required to reclassify our reportable segments if markets that currently are being aggregated do not continue to share these aggregation characteristics which are evaluated annually.
29
The homebuilding operating segments that comprise each of our reportable segments are as follows:
|
Midwest
|
Southern
|
Mid-Atlantic
|
|
Chicago, Illinois
|
Orlando, Florida
|
Charlotte, North Carolina
|
|
Cincinnati, Ohio
|
Sarasota, Florida
|
Raleigh, North Carolina
|
|
Columbus, Ohio
|
Tampa, Florida
|
Washington, D.C.
|
|
Indianapolis, Indiana
|
Austin, Texas
|
|
|
Minneapolis/St. Paul, Minnesota
|
Dallas/Fort Worth, Texas
|
|
|
Detroit, Michigan
|
Houston, Texas
|
|
|
San Antonio, Texas
|
||
RESULTS OF OPERATIONS
Overview
For the year ended
December 31, 2018
, we achieved record levels of new contracts, homes delivered, revenue and net income. Additionally, our complementary financial services business also achieved record revenue and a record number of loans originated in
2018
. Housing market conditions continued to be favorable through the first half of 2018, as evidenced by our strong spring selling season. However, beginning in the second half of 2018, the homebuilding industry experienced a softening in demand, after adjusting for normal seasonality, that we believe was a result of the rise in mortgage interest rates that occurred in 2018 and higher home prices which created affordability challenges for some prospective buyers. Despite this softening in demand in the second half of 2018, we also believe that many of the fundamentals supporting continued growth in demand remain favorable, including high consumer confidence, growth in employment, wage increases, and a limited supply of available new and existing homes. Company-wide, our absorption pace of sales per community for
2018
remained at a pace consistent with
2017
.
Due to the continued execution of our strategic business initiatives and the overall level of housing demand in 2018, we were able to achieve the following improved results in
2018
in comparison to the
year ended December 31, 2017
:
|
•
|
New contracts
increased
10%
to
5,845
- a record high for our Company
|
|
•
|
Homes delivered
increased
14%
to
5,778
- a record high for our Company
|
|
•
|
Average sales price of homes delivered
increased
4%
to
$384,000
|
|
•
|
Number of homes in backlog
increased
9%
, and our total sales value in backlog
increased
13%
to
$897 million
|
|
•
|
Average sales price of homes in backlog
increased
4%
to
$409,000
- a record high for our Company
|
|
•
|
Revenue
increased
17%
to
$2.29 billion
- a record high for our Company
|
|
•
|
Number of active communities at
December 31, 2018
increased
11%
to
209
|
Summary of Company Financial Results in
2018
The calculations of adjusted income before income taxes, adjusted net income available to common shareholders, and adjusted housing gross margin, which we believe provide a clearer measure of the ongoing performance of our business, are described and reconciled to income before income taxes, net income available to common shareholders, and housing gross margin, the financial measures that are calculated using our GAAP results, below under “Non-GAAP Financial Measures.”
Income before income taxes for the twelve months ended
December 31, 2018
increased
17%
from
$120.3 million
for the
year ended December 31, 2017
to
$141.3 million
for the
year ended December 31, 2018
. Income before income taxes for
2018
was unfavorably impacted by
$5.1 million
of charges for the amortization of inventory profit write-up related to purchase accounting adjustments on Detroit homes that were delivered during 2018 incurred as a result of our acquisition of Pinnacle Homes in March 2018 (as more fully discussed below and in
Note 12
to our Consolidated Financial Statements),
$1.7 million
of acquisition and integration costs related to our acquisition of Pinnacle Homes, and asset impairment charges of
$5.8 million
. Income before income taxes for
2017
was unfavorably impacted by an
$8.5 million
charge for stucco-related repair costs in certain of our Florida communities (as more fully discussed below and in
Note 8
to our Consolidated Financial Statements) and asset impairment charges of
$7.7 million
. Excluding these acquisition-related and impairment charges in
2018
, and the stucco-related and impairment charges in
2017
, adjusted income before income taxes
increased
13%
from
$136.5 million
in
2017
to
$153.9 million
in
2018
.
In
2018
, we achieved net
income
available to common shareholders of
$107.7 million
, or
$3.70
per diluted share, which includes the after-tax impact of the acquisition-related (which includes both the purchase accounting adjustment and acquisition and integration costs noted above) and asset impairment charges noted above. This compares to net
income
available to common shareholders of
$66.2 million
, or
$2.26
per diluted share in
2017
, which includes the after-tax impact of the stucco-related and asset impairment charges noted above as well as a non-cash tax expense of approximately
$6.5 million
related to the re-measurement of our deferred tax assets as a result of the Tax Cuts and Jobs Act of 2017 (the “2017 Tax Act”), a
$2.3 million
non-cash equity
30
charge resulting from the excess of fair value over carrying value of our Series A Preferred Shares that were called for redemption in the third quarter of 2017, and
$3.7 million
in dividend payments made to holders of our then outstanding Series A Preferred Shares. Excluding the after-tax impact of the acquisition-related and asset impairment charges in
2018
(as discussed above), and the deferred tax asset re-measurement and the equity adjustment related to the redemption of our Series A Preferred Shares in
2017
, and the after-tax impact of asset impairment and stucco-related charges taken in
2017
(as discussed above), adjusted net income available to common shareholders increased
37%
from
$85.3 million
in
2017
to
$117.3 million
in
2018
.
In
2018
, we recorded record total revenue of
$2.29 billion
, of which
$2.22 billion
was from homes delivered,
$16.9 million
was from land sales, and
$52.2 million
was from our financial services operations. Revenue from homes delivered
increased
18%
from
2017
driven primarily by the
689
additional homes delivered in
2018
(a
14%
increase
) and the
4%
increase
in the average sales price of homes delivered in
2018
(
$15,000
per home delivered) compared to
2017
. Revenue from land sales
decreased
$16.8 million
from
2017
due primarily to fewer land sales in our Mid-Atlantic region in the current year compared to the prior year. Revenue from our financial services segment
increased
5%
to
$52.2 million
in
2018
as a result of
increase
s in the number of loan originations,
increase
s in the average loan amount, the sale of a portion of our servicing portfolio, and a higher volume of loans sold, partially offset by lower margins on loans sold during the period than we experienced in
2017
.
Total gross margin (total revenue less total land and housing costs)
increased
$50.5 million
in
2018
compared to
2017
as a result of a
$48.0 million
improvement in the gross margin of our homebuilding operations and a
$2.5 million
improvement in the gross margin of our financial services operations. With respect to our homebuilding gross margin, our gross margin on homes delivered (housing gross margin)
improved
$48.8 million
, due to the
14%
increase
in the number of homes delivered, the
4%
increase
in the average sales price of homes delivered, the absence of
$8.5 million
in stucco-related repair charges taken in
2017
and a decline of
$1.9 million
in asset impairment charges. Our housing gross margin percentage
declined
50
basis points from
18.1%
in the prior year to
17.6%
in
2018
. Exclusive of the purchase accounting adjustments and asset impairment charges in
2018
and the stucco-related and asset impairment charges in
2017
discussed above, our adjusted housing gross margin percentage declined
90
basis points in
2018
to
18.1%
from
19.0%
in
2017
, largely as a result of higher construction and lot costs in
2018
compared to
2017
as well as the mix of homes delivered during
2018
compared to
2017
. Our gross margin on land sales (land gross margin)
declined
$0.8 million
in
2018
compared to
2017
as a result of fewer land sales in the current year compared to the prior year. The gross margin of our financial services operations increased
$2.5 million
in
2018
compared to
2017
as a result of
increase
s in the number of loan originations, the average loan amount and the volume of loans sold.
We believe the
increased
sales volume and
higher
sales prices on homes delivered in
2018
compared to
2017
were driven primarily by the opening of new communities which increased our average number of locations selling homes, along with the continued strong economic conditions described above (particularly during the first half of 2018), constrained supply/demand conditions, better pricing leverage in select locations and submarkets, and shifts in both product and community mix. We opened
67
new communities during
2018
. We sell a variety of home types in various communities and markets, each of which yields a different gross margin. The timing of the openings of new replacement communities as well as underlying lot costs varies from year to year. As a result, our new contracts and housing gross margin may fluctuate up or down from year to year depending on the mix of communities delivering homes. The improvements described above were partially offset by higher average lot and construction costs related to homebuilding industry conditions and normal supply and demand dynamics. In
2018
, we were able to pass a portion of the higher construction and lot costs to our homebuyers in the form of higher sales prices. However, we cannot provide any assurance that we will be able to continue to raise prices.
For
2018
, selling, general and administrative expense
increased
$26.0 million
, which partially offset the increase in our gross margin discussed above, but declined as a percentage of revenue to
12.3%
in
2018
compared to
13.0%
in
2017
. Selling expense
increased
$14.5 million
from
2017
but declined as a percentage of revenue to
6.2%
in
2018
compared to
6.5%
for
2017
. Variable selling expense for sales commissions contributed
$12.6 million
to the
increase
(
$2.5 million
of which related to incremental costs associated with our new Detroit division) due to the
higher
average sales price of homes delivered and the higher number of homes delivered. The increase in selling expense was also attributable to a
$1.9 million
increase
in non-variable selling expense primarily related to incremental costs associated with our additional sales offices and models in our new Detroit division. General and administrative expense
increased
$11.5 million
compared to
2017
but declined as a percentage of revenue from
6.4%
in
2017
to
6.0%
in
2018
. The dollar
increase
in general and administrative expense was primarily due to a
$3.7 million
increase related to incremental costs associated with our Detroit division, a
$3.1 million
increase
in compensation-related expenses primarily due to an increase in employee count, a
$1.9 million
increase in professional fees, a
$1.6 million
increase
in costs associated with new information systems, a
$1.0 million
increase in rent, and a
$0.2 million
increase
in other miscellaneous expenses.
Outlook
Although higher home prices and rising interest rates began to adversely impact new home sales in the second half of 2018, we believe that other fundamentals underlying housing demand, linked to low unemployment and higher wages, remain favorable.
31
We remain focused on increasing our profitability by generating additional revenue and improving overhead operating leverage, continuing to expand our market share, shifting our product mix to include more affordable designs, investing in attractive land opportunities and increasing our number of average active communities.
We expect to emphasize the following strategic business objectives in
2019
:
|
•
|
profitably growing our presence in our existing markets, including opening new communities;
|
|
•
|
expanding the availability of our more affordable Smart Series homes;
|
|
•
|
reviewing new markets for additional investment opportunities;
|
|
•
|
maintaining a strong balance sheet; and
|
|
•
|
emphasizing customer service, product quality and design, and premier locations.
|
Consistent with these objectives, we took a number of steps in
2018
for continued improvement in our financial and operating results in
2019
and beyond, including investing
$330.5 million
in land acquisitions and
$221.9 million
in land development in
2018
to help grow our presence in our existing markets. We currently estimate that we will spend approximately
$575 million
to
$600 million
on land purchases and land development in
2019
. However, land transactions are subject to a number of factors, including our financial condition and market conditions, as well as satisfaction of various conditions related to specific properties. We will continue to monitor market conditions and our ongoing pace of home sales and deliveries, and we will adjust our land spending accordingly.
We ended
2018
with more than
28,700
lots under control, which represents a
5.0
year supply of lots based on
2018
homes delivered, including certain lots that we anticipate selling to third parties. This represents a
1%
increase from our approximately
28,500
lots under control at the end of
2017
. We also opened
67
communities and closed
56
communities in
2018
, ending the year with a total of
209
communities. Of our total communities, 19 offered our more affordable Smart Series designs, which are primarily designed for first-time homebuyers. We estimate that our average community count in 2019 will increase by
approximately 5%
from our average community count of
205
communities in
2018
.
Going forward, we believe our abilities to leverage our fixed costs, obtain land at desired rates of return, and open and grow our active communities provide our best opportunities for continuing to improve our financial results. However, we can provide no assurance that the positive trends reflected in our financial and operating metrics will continue in the future.
32
The following table shows, by segment: revenue; gross margin; selling, general and administrative expense; operating income (loss); interest expense; and depreciation and amortization for the
years ended December 31, 2018, 2017 and 2016
:
|
Year Ended
|
|||||||||||
|
(In thousands)
|
2018
|
2017
|
2016
|
||||||||
|
Revenue:
|
|||||||||||
|
Midwest homebuilding
|
$
|
933,119
|
|
$
|
742,577
|
|
$
|
637,894
|
|
||
|
Southern homebuilding
|
925,404
|
|
730,482
|
|
602,273
|
|
|||||
|
Mid-Atlantic homebuilding
|
375,563
|
|
439,219
|
|
409,149
|
|
|||||
|
Financial services
(a)
|
52,196
|
|
49,693
|
|
42,011
|
|
|||||
|
Total revenue
|
$
|
2,286,282
|
|
$
|
1,961,971
|
|
$
|
1,691,327
|
|
||
|
Gross margin:
|
|||||||||||
|
Midwest homebuilding
(b)
|
$
|
165,187
|
|
$
|
149,080
|
|
$
|
126,675
|
|
||
|
Southern homebuilding
(c)
|
168,504
|
|
119,719
|
|
87,815
|
|
|||||
|
Mid-Atlantic homebuilding
|
57,882
|
|
74,776
|
|
72,651
|
|
|||||
|
Financial services
(a)
|
52,196
|
|
49,693
|
|
42,011
|
|
|||||
|
Total gross margin
(b)
(c) (d)
|
$
|
443,769
|
|
$
|
393,268
|
|
$
|
329,152
|
|
||
|
Selling, general and administrative expense:
|
|||||||||||
|
Midwest homebuilding
|
$
|
79,056
|
|
$
|
67,558
|
|
$
|
56,229
|
|
||
|
Southern homebuilding
|
95,904
|
|
82,921
|
|
67,417
|
|
|||||
|
Mid-Atlantic homebuilding
|
34,570
|
|
39,178
|
|
39,201
|
|
|||||
|
Financial services
(a)
|
24,714
|
|
22,405
|
|
18,749
|
|
|||||
|
Corporate
|
46,364
|
|
42,547
|
|
38,813
|
|
|||||
|
Total selling, general and administrative expense
|
$
|
280,608
|
|
$
|
254,609
|
|
$
|
220,409
|
|
||
|
Operating income (loss):
|
|||||||||||
|
Midwest homebuilding
(b)
|
$
|
86,131
|
|
$
|
81,522
|
|
$
|
70,446
|
|
||
|
Southern homebuilding
(c)
|
72,600
|
|
36,798
|
|
20,398
|
|
|||||
|
Mid-Atlantic homebuilding
|
23,312
|
|
35,598
|
|
33,450
|
|
|||||
|
Financial services
(a)
|
27,482
|
|
27,288
|
|
23,262
|
|
|||||
|
Less: Corporate selling, general and administrative expense
|
(46,364
|
)
|
(42,547
|
)
|
(38,813
|
)
|
|||||
|
Total operating income
(b) (c) (d)
|
$
|
163,161
|
|
$
|
138,659
|
|
$
|
108,743
|
|
||
|
Interest expense:
|
|||||||||||
|
Midwest homebuilding
|
$
|
7,142
|
|
$
|
5,010
|
|
$
|
3,754
|
|
||
|
Southern homebuilding
|
7,362
|
|
8,508
|
|
8,039
|
|
|||||
|
Mid-Atlantic homebuilding
|
2,711
|
|
2,599
|
|
3,693
|
|
|||||
|
Financial services
(a)
|
3,269
|
|
2,757
|
|
2,112
|
|
|||||
|
Total interest expense
|
$
|
20,484
|
|
$
|
18,874
|
|
$
|
17,598
|
|
||
|
Equity in income from joint venture arrangements
|
$
|
(312
|
)
|
$
|
(539
|
)
|
$
|
(640
|
)
|
||
|
Acquisition and integration costs
(e)
|
1,700
|
|
—
|
|
—
|
|
|||||
|
Income before income taxes
|
$
|
141,289
|
|
$
|
120,324
|
|
$
|
91,785
|
|
||
|
Depreciation and amortization:
|
|
|
|
|
|
|
|||||
|
Midwest homebuilding
|
$
|
2,448
|
|
$
|
2,069
|
|
$
|
1,752
|
|
||
|
Southern homebuilding
|
3,210
|
|
3,014
|
|
2,525
|
|
|||||
|
Mid-Atlantic homebuilding
|
1,262
|
|
1,565
|
|
1,645
|
|
|||||
|
Financial services
|
1,281
|
|
1,503
|
|
1,948
|
|
|||||
|
Corporate
|
6,330
|
|
6,023
|
|
5,736
|
|
|||||
|
Total depreciation and amortization
|
$
|
14,531
|
|
$
|
14,174
|
|
$
|
13,606
|
|
||
|
(a)
|
Our financial services operational results should be viewed in connection with our homebuilding business as its operations originate loans and provide title services primarily for our homebuying customers, with the exception of a small amount of mortgage refinancing.
|
|
(b)
|
Includes
$5.1 million
of charges related to purchase accounting adjustments taken during
2018
as a result of our acquisition of Pinnacle Homes in Detroit, Michigan on March 1, 2018.
|
|
(c)
|
The years ended December 31, 2017 and 2016 include an
$8.5 million
and a
$19.4 million
charge, respectively, for stucco-related repair costs in certain of our Florida communities (as more fully discussed below and in
Note 8
to our Consolidated Financial Statements).
|
|
(d)
|
For the
years ended December 31, 2018, 2017 and 2016
, total gross margin and total operating income were reduced by
$5.8 million
,
$7.7 million
and
$4.0 million
, respectively, related to asset impairment charges taken during the period.
|
|
(e)
|
Represents costs which include, but are not limited to, legal fees and expenses, travel and communication expenses, cost of appraisals, accounting fees and expenses, and miscellaneous expenses related to our acquisition of Pinnacle Homes. As these costs are not eligible for capitalization as initial direct costs, such amounts are expensed as incurred.
|
33
The following tables show total assets by segment at
December 31, 2018, 2017 and 2016
:
|
At December 31, 2018
|
|||||||||||||||||||
|
(In thousands)
|
Midwest
|
Southern
|
Mid-Atlantic
|
Corporate, Financial Services and Unallocated
|
Total
|
||||||||||||||
|
Deposits on real estate under option or contract
|
$
|
5,725
|
|
$
|
21,758
|
|
$
|
6,179
|
|
$
|
—
|
|
$
|
33,662
|
|
||||
|
Inventory
(a)
|
696,057
|
|
717,248
|
|
227,493
|
|
—
|
|
1,640,798
|
|
|||||||||
|
Investments in joint venture arrangements
|
1,562
|
|
14,263
|
|
20,045
|
|
—
|
|
35,870
|
|
|||||||||
|
Other assets
|
19,524
|
|
32,161
|
|
(b)
|
10,925
|
|
248,641
|
|
(c)
|
311,251
|
|
|||||||
|
Total assets
|
$
|
722,868
|
|
$
|
785,430
|
|
$
|
264,642
|
|
$
|
248,641
|
|
$
|
2,021,581
|
|
||||
|
At December 31, 2017
|
|||||||||||||||||||
|
(In thousands)
|
Midwest
|
Southern
|
Mid-Atlantic
|
Corporate, Financial Services and Unallocated
|
Total
|
||||||||||||||
|
Deposits on real estate under option or contract
|
$
|
4,933
|
|
$
|
20,719
|
|
$
|
6,904
|
|
$
|
—
|
|
$
|
32,556
|
|
||||
|
Inventory
(a)
|
500,671
|
|
636,019
|
|
245,328
|
|
—
|
|
1,382,018
|
|
|||||||||
|
Investments in joint venture arrangements
|
4,410
|
|
9,677
|
|
6,438
|
|
—
|
|
20,525
|
|
|||||||||
|
Other assets
|
13,573
|
|
38,784
|
|
(b)
|
13,311
|
|
364,004
|
|
(d)
|
429,672
|
|
|||||||
|
Total assets
|
$
|
523,587
|
|
$
|
705,199
|
|
$
|
271,981
|
|
$
|
364,004
|
|
$
|
1,864,771
|
|
||||
|
At December 31, 2016
|
|||||||||||||||||||
|
(In thousands)
|
Midwest
|
Southern
|
Mid-Atlantic
|
Corporate, Financial Services and Unallocated
|
Total
|
||||||||||||||
|
Deposits on real estate under option or contract
|
$
|
3,989
|
|
$
|
22,607
|
|
$
|
3,260
|
|
$
|
—
|
|
$
|
29,856
|
|
||||
|
Inventory
(a)
|
399,814
|
|
484,038
|
|
302,226
|
|
—
|
|
1,186,078
|
|
|||||||||
|
Investments in unconsolidated joint ventures
|
10,155
|
|
10,630
|
|
7,231
|
|
—
|
|
28,016
|
|
|||||||||
|
Other assets
|
25,747
|
|
35,622
|
|
(b)
|
13,912
|
|
229,280
|
|
(e)
|
304,561
|
|
|||||||
|
Total assets
|
$
|
439,705
|
|
$
|
552,897
|
|
$
|
326,629
|
|
$
|
229,280
|
|
$
|
1,548,511
|
|
||||
|
(a)
|
Inventory includes: single-family lots, land and land development costs; land held for sale; homes under construction; model homes and furnishings; community development district infrastructure; and consolidated inventory not owned.
|
|
(b)
|
Includes development reimbursements from local municipalities.
|
|
(c)
|
Includes asset held for sale for
$5.6 million
.
|
|
(d)
|
The increase in Corporate, Financial Services, and Unallocated other assets from prior year is related to an increase in cash on hand at the end of 2017 due primarily to the issuance of our $250.0 million in aggregate principal amount of 2025 Senior Notes during the year ended December 31, 2017.
|
|
(e)
|
During the first quarter of 2016, the Company purchased an airplane for
$9.9 million
. The asset is included within Property and Equipment - Net in our Consolidated Balance Sheets.
|
34
Reportable Segments
The following table presents, by reportable segment, selected operating and financial information as of and for the
years ended December 31, 2018, 2017 and 2016
:
|
Year Ended December 31,
|
|||||||||||
|
(Dollars in thousands)
|
2018
|
2017
|
2016
|
||||||||
|
Midwest Region
|
|||||||||||
|
Homes delivered
|
2,317
|
|
1,907
|
|
1,690
|
|
|||||
|
New contracts, net
|
2,306
|
|
1,978
|
|
1,775
|
|
|||||
|
Backlog at end of period
|
930
|
|
828
|
|
757
|
|
|||||
|
Average sales price of homes delivered
|
$
|
402
|
|
$
|
387
|
|
$
|
374
|
|
||
|
Average sales price of homes in backlog
|
$
|
441
|
|
$
|
415
|
|
$
|
403
|
|
||
|
Aggregate sales value of homes in backlog
|
$
|
410,434
|
|
$
|
343,660
|
|
$
|
304,826
|
|
||
|
Housing revenue
|
$
|
932,248
|
|
$
|
738,743
|
|
$
|
631,772
|
|
||
|
Land sale revenue
|
$
|
871
|
|
$
|
3,834
|
|
$
|
6,122
|
|
||
|
Operating income homes
(a) (b)
|
$
|
85,747
|
|
$
|
80,762
|
|
$
|
68,891
|
|
||
|
Operating income land
|
$
|
384
|
|
$
|
760
|
|
$
|
1,555
|
|
||
|
Number of average active communities
|
84
|
|
64
|
|
66
|
|
|||||
|
Number of active communities, end of period
|
90
|
|
69
|
|
61
|
|
|||||
|
Southern Region
|
|||||||||||
|
Homes delivered
|
2,579
|
|
2,108
|
|
1,708
|
|
|||||
|
New contracts, net
|
2,697
|
|
2,342
|
|
1,822
|
|
|||||
|
Backlog at end of period
|
1,026
|
|
908
|
|
674
|
|
|||||
|
Average sales price of homes delivered
|
$
|
355
|
|
$
|
342
|
|
$
|
342
|
|
||
|
Average sales price of homes in backlog
|
$
|
373
|
|
$
|
365
|
|
$
|
355
|
|
||
|
Aggregate sales value of homes in backlog
|
$
|
382,217
|
|
$
|
331,837
|
|
$
|
239,067
|
|
||
|
Housing revenue
|
$
|
915,945
|
|
$
|
720,704
|
|
$
|
583,817
|
|
||
|
Land sale revenue
|
$
|
9,459
|
|
$
|
9,778
|
|
$
|
18,456
|
|
||
|
Operating income homes
(a) (c)
|
$
|
71,130
|
|
$
|
35,198
|
|
$
|
18,086
|
|
||
|
Operating income land
|
$
|
1,470
|
|
$
|
1,600
|
|
$
|
2,312
|
|
||
|
Number of average active communities
|
92
|
|
85
|
|
71
|
|
|||||
|
Number of active communities, end of period
|
90
|
|
87
|
|
79
|
|
|||||
|
Mid-Atlantic Region
|
|||||||||||
|
Homes delivered
|
882
|
|
1,074
|
|
1,084
|
|
|||||
|
New contracts, net
|
842
|
|
979
|
|
1,158
|
|
|||||
|
Backlog at end of period
|
238
|
|
278
|
|
373
|
|
|||||
|
Average sales price of homes delivered
|
$
|
418
|
|
$
|
390
|
|
$
|
364
|
|
||
|
Average sales price of homes in backlog
|
$
|
437
|
|
$
|
416
|
|
$
|
380
|
|
||
|
Aggregate sales value of homes in backlog
|
$
|
104,063
|
|
$
|
115,756
|
|
$
|
141,564
|
|
||
|
Housing revenue
|
$
|
369,004
|
|
$
|
419,125
|
|
$
|
394,907
|
|
||
|
Land sale revenue
|
$
|
6,559
|
|
$
|
20,094
|
|
$
|
14,242
|
|
||
|
Operating income homes
(a)
|
$
|
23,121
|
|
$
|
35,109
|
|
$
|
33,183
|
|
||
|
Operating income land
|
$
|
191
|
|
$
|
489
|
|
$
|
267
|
|
||
|
Number of average active communities
|
29
|
|
34
|
|
39
|
|
|||||
|
Number of active communities, end of period
|
29
|
|
32
|
|
38
|
|
|||||
|
Total Homebuilding Regions
|
|||||||||||
|
Homes delivered
|
5,778
|
|
5,089
|
|
4,482
|
|
|||||
|
New contracts, net
|
5,845
|
|
5,299
|
|
4,755
|
|
|||||
|
Backlog at end of period
|
2,194
|
|
2,014
|
|
1,804
|
|
|||||
|
Average sales price of homes delivered
|
$
|
384
|
|
$
|
369
|
|
$
|
359
|
|
||
|
Average sales price of homes in backlog
|
$
|
409
|
|
$
|
393
|
|
$
|
380
|
|
||
|
Aggregate sales value of homes in backlog
|
$
|
896,714
|
|
$
|
791,253
|
|
$
|
685,457
|
|
||
|
Housing revenue
|
$
|
2,217,197
|
|
$
|
1,878,572
|
|
$
|
1,610,496
|
|
||
|
Land sale revenue
|
$
|
16,889
|
|
$
|
33,706
|
|
$
|
38,820
|
|
||
|
Operating income homes
(a) (b) (c) (d)
|
$
|
179,998
|
|
$
|
151,069
|
|
$
|
120,160
|
|
||
|
Operating income land
|
$
|
2,045
|
|
$
|
2,849
|
|
$
|
4,134
|
|
||
|
Number of average active communities
|
205
|
|
183
|
|
176
|
|
|||||
|
Number of active communities, end of period
|
209
|
|
188
|
|
178
|
|
|||||
|
(a)
|
Includes the effect of total homebuilding selling, general and administrative expense for the region as disclosed in the first table set forth in this “Outlook” section.
|
|
(b)
|
Includes
$5.1 million
of charges related to purchase accounting adjustments taken during
2018
as a result of our acquisition of Pinnacle Homes in Detroit, Michigan on March 1, 2018.
|
|
(c)
|
Includes an
$8.5 million
and a
$19.4 million
charge for stucco-related repair costs in certain of our Florida communities (as more fully discussed below and in
Note 8
to our Consolidated Financial Statements) taken during
2017
and 2016, respectively.
|
|
(d)
|
Includes
$5.8 million
,
$7.7 million
and
$4.0 million
of asset impairment charges taken during the
years ended December 31, 2018, 2017 and 2016
, respectively.
|
35
|
Year Ended December 31,
|
|||||||||||
|
(Dollars in thousands)
|
2018
|
2017
|
2016
|
||||||||
|
Financial Services
|
|||||||||||
|
Number of loans originated
|
3,964
|
|
3,632
|
|
3,286
|
|
|||||
|
Value of loans originated
|
$
|
1,200,474
|
|
$
|
1,078,520
|
|
$
|
969,690
|
|
||
|
Revenue
|
$
|
52,196
|
|
$
|
49,693
|
|
$
|
42,011
|
|
||
|
Less: Selling, general and administrative expenses
|
24,714
|
|
22,405
|
|
18,749
|
|
|||||
|
Less: Interest expense
|
3,269
|
|
2,757
|
|
2,112
|
|
|||||
|
Income before income taxes
|
$
|
24,213
|
|
$
|
24,531
|
|
$
|
21,150
|
|
||
A home is included in “new contracts” when our standard sales contract is executed. “Homes delivered” represents homes for which the closing of the sale has occurred. “Backlog” represents homes for which the standard sales contract has been executed, but which are not included in homes delivered because closings for these homes have not yet occurred as of the end of the period specified.
The composition of our homes delivered, new contracts, net and backlog is constantly changing and may be based on a dissimilar mix of communities between periods as new communities open and existing communities wind down. Further, home types and individual homes within a community can range significantly in price due to differing square footage, option selections, lot sizes and quality and location of lots. These variations may result in a lack of meaningful comparability between homes delivered, new contracts, net and backlog due to the changing mix between periods.
Cancellation Rates
The following table sets forth the cancellation rates for each of our homebuilding segments for the
years ended December 31, 2018, 2017 and 2016
:
|
Year Ended December 31,
|
||||||||
|
2018
|
2017
|
2016
|
||||||
|
Midwest
|
13.6
|
%
|
12.0
|
%
|
13.0
|
%
|
||
|
Southern
|
16.8
|
%
|
16.5
|
%
|
17.7
|
%
|
||
|
Mid-Atlantic
|
9.9
|
%
|
10.5
|
%
|
11.0
|
%
|
||
|
Total cancellation rate
|
14.6
|
%
|
13.8
|
%
|
14.4
|
%
|
||
36
Non-GAAP Financial Measures
This report contains information about our adjusted housing gross margin, adjusted income before income taxes, and adjusted net income available to common shareholders, each of which constitutes a non-GAAP financial measure. Because adjusted housing gross margin, adjusted income before income taxes, and adjusted net income available to common shareholders are not calculated in accordance with GAAP, these financial measures may not be completely comparable to similarly-titled measures used by other companies in the homebuilding industry and, therefore, should not be considered in isolation or as an alternative to operating performance and/or financial measures prescribed by GAAP. Rather, these non-GAAP financial measures should be used to supplement our GAAP results in order to provide a greater understanding of the factors and trends affecting our operations.
Adjusted housing gross margin, adjusted income before income taxes, and adjusted net income available to common shareholders are calculated as follows:
|
Year Ended December 31,
|
||||||||||||
|
(Dollars in thousands)
|
2018
|
2017
|
2016
|
|||||||||
|
Housing revenue
|
$
|
2,217,197
|
|
$
|
1,878,572
|
|
$
|
1,610,496
|
|
|||
|
Housing cost of sales
|
1,827,669
|
|
1,537,846
|
|
1,327,489
|
|
||||||
|
Housing gross margin
|
389,528
|
|
340,726
|
|
283,007
|
|
||||||
|
Add: Stucco-related charges
(a)
|
—
|
|
8,500
|
|
19,409
|
|
||||||
|
Add: Impairment
(b)
|
5,809
|
|
7,681
|
|
3,992
|
|
||||||
|
Add: Purchase accounting adjustments
(c)
|
5,147
|
|
—
|
|
—
|
|
||||||
|
Adjusted housing gross margin
|
$
|
400,484
|
|
$
|
356,907
|
|
$
|
306,408
|
|
|||
|
Housing gross margin percentage
|
17.6
|
%
|
18.1
|
%
|
17.6
|
%
|
||||||
|
Adjusted housing gross margin percentage
|
17.8
|
%
|
19.0
|
%
|
19.0
|
%
|
||||||
|
Income before income taxes
|
$
|
141,289
|
|
$
|
120,324
|
|
$
|
91,785
|
|
|||
|
Add: Stucco-related charges
(a)
|
—
|
|
8,500
|
|
19,409
|
|
||||||
|
Add: Impairment
(b)
|
5,809
|
|
7,681
|
|
3,992
|
|
||||||
|
Add: Purchase accounting adjustments
(c)
|
5,147
|
|
—
|
|
—
|
|
||||||
|
Add: Acquisition and integration costs
(d)
|
1,700
|
|
—
|
|
—
|
|
||||||
|
Adjusted income before income taxes
|
$
|
153,945
|
|
$
|
136,505
|
|
$
|
115,186
|
|
|||
|
Net income available to common shareholders
|
$
|
107,663
|
|
$
|
66,168
|
|
$
|
51,734
|
|
|||
|
Add: Stucco-related charges - net of tax
(a)
|
—
|
|
5,440
|
|
12,034
|
|
||||||
|
Add: Impairment - net of tax
(b)
|
4,415
|
|
4,916
|
|
2,475
|
|
||||||
|
Add: Purchase accounting adjustments - net of tax
(c)
|
3,912
|
|
—
|
|
—
|
|
||||||
|
Add: Acquisition and integration costs - net of tax
(d)
|
1,292
|
|
—
|
|
—
|
|
||||||
|
Add: Excess of fair value over book value of preferred shares redeemed
(e)
|
—
|
|
2,257
|
|
—
|
|
||||||
|
Add: Deferred tax asset re-measurement as a result of 2017 Tax Act
(f)
|
—
|
|
6,520
|
|
—
|
|
||||||
|
Adjusted net income available to common shareholders
|
$
|
117,282
|
|
$
|
85,301
|
|
$
|
66,243
|
|
|||
|
(a)
|
Represents warranty charges for stucco-related repair costs in certain of our Florida communities (as more fully discussed in
Note 8
to our Consolidated Financial Statements).
|
|
(b)
|
Represents asset impairment charges taken during the respective periods.
|
|
(c)
|
Represents purchase accounting adjustments related to our acquisition of Pinnacle Homes in Detroit, Michigan on March 1, 2018 (as more fully discussed in
Note 12
to our Consolidated Financial Statements).
|
|
(d)
|
Represents costs which include, but are not limited to, legal fees and expenses, travel and communication expenses, cost of appraisals, accounting fees and expenses, and miscellaneous expenses related to our acquisition of Pinnacle Homes. As these costs are not eligible for capitalization as initial direct costs, such amounts are expensed as incurred.
|
|
(e)
|
Represents the equity charge related to the excess of fair value over carrying value related to the original issuance costs that were paid in 2007 on our Series A Preferred Shares that were redeemed during the fourth quarter of 2017 (as more fully discussed in
Note 13
to our Consolidated Financial Statements).
|
|
(f)
|
Represents the impact of the deferred tax asset re-measurement as a result of the 2017 Tax Act passed during the fourth quarter of 2017.
|
We believe adjusted housing gross margin, adjusted income before income taxes, and adjusted net income available to common shareholders are each relevant and useful financial measures to investors in evaluating our operating performance as they measure the gross profit, income before income taxes, and net income available to common shareholders we generated specifically on our operations during a given period. These non-GAAP financial measures isolate the impact that the purchase accounting adjustments, stucco-related charges and impairment charges have on housing gross margins; the impact that the purchase accounting adjustments,
37
acquisition and integration costs, stucco-related charges and impairment charges have on income before income taxes; and that the purchase accounting adjustments, acquisition and integration costs, stucco-related charges, impairment charges, equity adjustment, and deferred tax asset re-measurement charge have on net income available to common shareholders, and allow investors to make comparisons with our competitors that adjust housing gross margins, income before income taxes, and net income available to common shareholders in a similar manner. We also believe investors will find these adjusted financial measures relevant and useful because they represent a profitability measure that may be compared to a prior period without regard to variability of the charges noted above. These financial measures assist us in making strategic decisions regarding community location and product mix, product pricing and construction pace.
Year Over Year Comparisons
Year Ended December 31, 2018
Compared to
Year Ended December 31, 2017
The calculation of adjusted housing gross margin (referred to below), which we believe provides a clearer measure of the ongoing performance of our business, is described and reconciled to housing gross margin, the financial measure that is calculated using our GAAP results, below under “Segment Non-GAAP Financial Measures.”
Midwest Region.
During the
twelve months ended December 31, 2018
, homebuilding revenue in our Midwest region
increased
$190.5 million
, from
$742.6 million
in
2017
to
$933.1 million
in
2018
. This
26%
increase
in homebuilding revenue was the result of a
21%
increase
in the number of homes delivered (
410
units, which benefited from our new Detroit division) and a
4%
increase
in the average sales price of homes delivered (
$15,000
per home delivered), offset partially by a
$3.0 million
decrease in land sale revenue. Operating income in our Midwest region
increased
$4.6 million
, from
$81.5 million
in
2017
to
$86.1 million
in
2018
. The increase in operating income was primarily the result of a
$16.1 million
increase
in our gross margin, offset, in part, by an
$11.5 million
increase
in selling, general, and administrative expense. With respect to our homebuilding gross margin, our housing gross margin improved
$16.5 million
, due to the
21%
increase
in the number of homes delivered and the
4%
increase
in the average sales price of homes delivered noted above. Our housing gross margin percentage
declined
240
basis points from
20.1%
in
2017
to
17.7%
in
2018
. Our housing gross margin in
2018
was unfavorably impacted by a
$5.1 million
charge for purchase accounting adjustments related to our acquisition of Pinnacle Homes in Detroit, Michigan on March 1, 2018 and
$0.3 million
in asset impairment charges. Exclusive of these charges in 2018, our adjusted housing gross margin percentage in
2018
declined
180
basis points from
2017
(during which we experienced no comparable charges) from
20.1%
in
2017
to
18.3%
in
2018
primarily due to increased lot and construction costs as well as a change in product type and market mix of homes delivered compared to the prior year. Our land sale gross margin
declined
$0.4 million
in the
twelve months ended December 31, 2018
compared to the same period in
2017
as a result of fewer strategic land sales made in the current year compared to the prior year.
Selling, general and administrative expense
increased
$11.5 million
, from
$67.6 million
in
2017
to
$79.1 million
in
2018
, and declined as a percentage of revenue to
8.5%
in
2018
compared to
9.1%
in
2017
. The
increase
in selling, general and administrative expense was attributable, in part, to an
$8.1 million
increase
in selling expense, due to (1) a
$6.3 million
increase
in variable selling expenses resulting from increases in sales commissions produced by the
higher
average sales price of homes delivered and increased number of homes delivered,
$2.5 million
of which was associated with our new Detroit division, and (2) a
$1.8 million
increase
in non-variable selling expenses primarily related to costs associated with our additional sales offices and models used by our new Detroit division. The increase in selling, general and administrative expense was also attributable to a
$3.4 million
increase
in general and administrative expense, which was primarily related to incremental costs from our Detroit acquisition.
During
2018
, we experienced an
17%
increase
in new contracts in our Midwest region, from
1,978
in
2017
to
2,306
in
2018
, and a
12%
increase in backlog from
828
homes at
December 31, 2017
to
930
homes at
December 31, 2018
. The increases in new contracts and backlog were attributable to (1) improving demand in our newer communities compared to prior year, (2) an increase in our average number of communities during the period, and (3) the addition of homes from our recent acquisition of Pinnacle Homes in Detroit, Michigan on March 1, 2018. Average sales price in backlog increased to
$441,000
at
December 31, 2018
compared to
$415,000
at
December 31, 2017
which was primarily due to product type and market mix in
2018
compared to prior year. During the
twelve months ended December 31, 2018
, we opened
26
new communities in our Midwest region (excluding the 10 communities added as part of our acquisition in Detroit) compared to
27
during
2017
. Our monthly absorption rate in our Midwest region declined to
2.3
per community in
2018
, compared to
2.6
per community in
2017
, due primarily to the slowing in demand during the second half of 2018.
Southern Region.
For the
twelve months ended December 31, 2018
, homebuilding revenue in our Southern region
increased
$194.9 million
, from
$730.5 million
in
2017
to
$925.4 million
in
2018
. This
27%
increase
in homebuilding revenue was primarily the result of a
22%
increase
in the number of homes delivered (
471
units) and a
4%
increase
in the average sales price of homes delivered (
$13,000
per home delivered), partially offset by a
$0.3 million
decrease
in land sale revenue. Operating income in our Southern region
increased
$35.8 million
from
$36.8 million
in
2017
to
$72.6 million
in
2018
. This
increase
in operating
income
38
was the result of a
$48.8 million
improvement
in our gross margin, offset, in part, by a
$13.0 million
increase
in selling, general, and administrative expense. With respect to our homebuilding gross margin, our gross margin on homes delivered
improved
$48.9 million
, due primarily to the
22%
increase
in the number of homes delivered, the
4%
increase in the average sales price of homes delivered, the absence of
$8.5 million
in charges for stucco-related repair costs in certain of our Florida communities taken during
2017
(as more fully discussed in
Note 8
), and the
$3.2 million
decline
in pre-tax impairment charges recorded in
2018
compared to prior year. Our housing gross margin percentage
improved
180
basis points from
16.4%
in prior year's
twelve month period
to
18.2%
for the same period in
2018
. Exclusive of the impairment charges in both
2018
and
2017
and the stucco-related charges in
2017
, our adjusted housing gross margin percentage
improved
10
basis points from
18.6%
in
2017
to
18.7%
in the
twelve months ended December 31, 2018
largely due to the mix of communities delivering homes and a more favorable product mix, offset, in part, by rising lot and construction costs. Our land sale gross margin declined
$0.1 million
as a result of fewer strategic land sales in the
twelve months ended December 31, 2018
compared to the same period in
2017
.
Selling, general and administrative expense
increased
$13.0 million
from
$82.9 million
in
2017
to
$95.9 million
in
2018
but
declined
as a percentage of revenue to
10.4%
in
2018
from
11.4%
in
2017
. The increase in selling, general and administrative expense was attributable, in part, to a
$10.0 million
increase
in selling expense due to (1) an
$8.9 million
increase
in variable selling expenses resulting from increases in sales commissions produced by the higher number of homes delivered and the higher average sales price of homes delivered, and (2) a
$1.1 million
increase
in non-variable selling expenses primarily related to costs associated with our sales offices and models as a result of our increased community count. The increase in selling, general and administrative expense was also attributable to a
$3.0 million
increase
in general and administrative expense, which was primarily related to a
$1.9 million
increase in compensation expense due to an increase in employee count as well as higher incentive compensation due to improved operating results, a
$0.9 million
increase in professional fees, and a
$0.2 million
increase in other miscellaneous expenses.
During
2018
, we experienced a
15%
increase
in new contracts in our Southern region, from
2,342
in
2017
to
2,697
in
2018
, and a
13%
increase in backlog from
908
homes at
December 31, 2017
to 1,026 homes at
December 31, 2018
. The increases in new contracts and backlog were primarily due to an increase in our average number of communities during the period, along with improvement in demand across our Southern markets compared to prior year. Average sales price in backlog
increased
to
$373,000
at
December 31, 2018
from
$365,000
at
December 31, 2017
primarily due to a change in product type and market mix. During
2018
, we opened
32
communities in our Southern region compared to
31
in
2017
. Our monthly absorption rate in our Southern region
improved
to
2.5
per community in
2018
from
2.3
per community in
2017
.
Mid-Atlantic Region.
For the
twelve months ended December 31, 2018
, homebuilding revenue in our Mid-Atlantic region
decreased
$63.6 million
from
$439.2 million
in
2017
to
$375.6 million
in
2018
. This
14%
decrease
in homebuilding revenue was the result of an
18%
decrease
in the number of homes delivered (
192
units), primarily due to a
decrease
in the average number of communities during the period compared to prior year as a result of delayed new replacement community openings due, in part, to two hurricanes and unusually heavy rainfall during 2018 that temporarily disrupted operations, and a
$13.5 million
decrease
in land sale revenue compared to prior year, partially offset by a
7%
increase
in the average sales price of homes delivered (
$28,000
per home delivered). Operating
income
in our Mid-Atlantic region
decreased
$12.3 million
, from
$35.6 million
in
2017
to
$23.3 million
in
2018
. This
decrease
in operating income was primarily the result of a
$16.9 million
decrease
in our gross margin, partially offset by a
$4.6 million
decrease in selling, general and administrative expense. With respect to our homebuilding gross margin, our housing gross margin
declined
$16.6 million
due primarily to the
18%
decrease
in the number of homes delivered and a decline in housing gross margin percentage, partially attributable to delayed openings of new replacement communities. Our housing gross margin percentage
declined
by
210
basis points from
17.7%
in
2017
to
15.6%
in
2018
. We had
$1.0 million
in asset impairment charges in
2018
and
no
asset impairment charges in
2017
. Exclusive of these charges in 2018, our adjusted housing gross margin percentage declined
180
basis points from
17.7%
in
2017
to
15.9%
in
2018
as a result of increased construction and lot costs as well as the mix of homes delivered by type and by market. Our land sale gross margin
declined
$0.3 million
in the
twelve months ended December 31, 2018
compared to the same period in
2017
due to fewer strategic land sales in the current year compared to the prior year.
Selling, general and administrative expense declined
$4.6 million
from
$39.2 million
in
2017
to
$34.6 million
in
2018
, but increased as a percentage of revenue to
9.2%
in
2018
from
8.9%
in
2017
. Selling expense
decrease
d
$3.4 million
due to a
$2.6 million
decrease in variable selling expenses resulting from reduced sales commissions as a result of the lower number of homes delivered during the period compared to prior year, as well as an
$0.8 million
decrease in non-variable selling expenses resulting from the reduction in costs associated with our sales offices and models as a result of the decline in community count. General and administrative expense
decrease
d
$1.2 million
primarily related to a decrease in compensation and incentive-based compensation expense as a result of a decline in headcount and declining operating results.
During the
twelve months ended December 31, 2018
, we experienced a
14%
decrease
in new contracts in our Mid-Atlantic region, from
979
in
2017
to
842
in
2018
, and a
14%
decrease
in the number of homes in backlog from
278
homes at
December 31, 2017
39
to
238
homes at
December 31, 2018
. The decreases in new contracts and backlog were primarily due to a decrease in the average number of active communities during the period compared to the prior year, and partly as a result of delays in replacement community openings in the period compared to the prior year. Average sales price of homes in backlog
increased
, however, from
$416,000
at
December 31, 2017
to
$437,000
at
December 31, 2018
primarily due to a change in product type and market mix. We opened
nine
communities in our Mid-Atlantic region during the
twelve months ended December 31, 2018
, the same number as we opened during
2017
. Our monthly absorption rate in our Mid-Atlantic region remained flat at
2.4
per community in both
2018
and
2017
.
Financial Services.
Revenue from our mortgage and title operations
increased
$2.5 million
, or
5%
, from
$49.7 million
for the
twelve months ended December 31, 2017
to a record
$52.2 million
for the
twelve months ended December 31, 2018
as a result of a
9%
increase
in the number of loan originations, from
3,632
in
2017
to
3,964
in
2018
, and an
increase
in the average loan amount from
$297,000
in
2017
to
$303,000
in
2018
. In addition, we experienced an increase in the volume of loans sold and a gain from the sale of a portion of our servicing portfolio during
2018
, but experienced lower margins on loans sold in
2018
than we experienced in prior year due to increased competitive pressures.
Our financial service operations ended
2018
with a
$0.2 million
increase
in operating income compared to
2017
, which was primarily due to the increase in our revenue discussed above, offset, in part, by a
$2.3 million
increase
in selling, general and administrative expense compared to
2017
, which was attributable to an increase in compensation expense related to our increase in employee headcount along with costs associated with opening new mortgage and title offices in certain markets.
At
December 31, 2018
, M/I Financial provided financing services in all of our markets. Approximately
80%
of our homes delivered during
2018
were financed through M/I Financial, compared to
81%
during
2017
. Capture rate is influenced by financing availability and can fluctuate from quarter to quarter.
Corporate Selling, General and Administrative Expenses.
Corporate selling, general and administrative expense
increased
$3.9 million
, from
$42.5 million
in
2017
to
$46.4 million
in
2018
. The increase was primarily due to a
$1.4 million
increase
related to costs associated with new information systems, a
$0.7 million
increase in professional fees, a
$0.6 million
increase
in compensation expense, and a
$1.2 million
increase
in other miscellaneous expenses.
Acquisition and Integration Costs.
During
2018
, the Company incurred
$1.7 million
in acquisition and integration related costs related to our acquisition of Pinnacle Homes in Detroit, Michigan on March 1, 2018. These costs include, but are not limited to, legal fees and expenses, travel and communication expenses, cost of appraisals, accounting fees and expenses, and miscellaneous expenses. As these costs are not eligible for capitalization as initial direct costs under GAAP, such amounts are expensed as incurred.
Earnings from Joint Venture Arrangements.
Earnings from joint venture arrangements represents our portion of pre-tax earnings from our joint ownership and development agreements, joint ventures and other similar arrangements. In
2018
and
2017
, the Company earned
$0.3 million
and
$0.5 million
, respectively, in equity income from joint venture arrangements.
Interest Expense - Net.
Interest expense for the Company
increased
$1.6 million
from
$18.9 million
in the
twelve months ended December 31, 2017
to
$20.5 million
in the
twelve months ended December 31, 2018
. This increase was primarily the result of an
increase
in our weighted average borrowings from
$678.2 million
in
2017
to
$801.0 million
in
2018
, in addition to an increase in our weighted average borrowing rate from
5.99%
in
2017
to
6.22%
in the
2018
. The increase in our weighted average borrowings and our weighted average borrowing rate primarily related to the issuance of our $250.0 million in aggregate principal amount of 5.625% Senior Notes due 2025 (the “2025 Senior Notes”) during the third quarter of 2017 in addition to increased borrowings under our Credit Facility (as defined below) during 2018 compared to 2017, partially offset by the maturity of our 3.25% Convertible Senior Subordinated Notes due 2017 (the “2017 Convertible Senior Subordinated Notes”) in September 2017 and our 3.0% Convertible Senior Subordinated Notes due 2018 (the “2018 Convertible Senior Subordinated Notes”) in March 2018 as well as higher capitalized interest related to our increased land development and home construction during 2018 compared to prior year.
Income Taxes.
Our overall effective tax rate was
23.8%
for the year ended
December 31, 2018
and
40.1%
for the year ended
December 31, 2017
. The decline in the effective rate for the
twelve months ended December 31, 2018
was primarily attributable to the decrease in the corporate income tax rate from 35% to 21% partially offset by the repeal of the domestic production activity deduction, both of which are the result of the enactment of the 2017 Tax Act during the fourth quarter of 2017. In addition, during the quarter ended June 30, 2018, we recorded a $3.0 million tax benefit primarily related to the retroactive reinstatement of energy efficient homes tax credits to 2017 for which we obtained certifications in
2018
(please see
Note 14
to our financial statements for more information).
40
Segment Non-GAAP Financial Measures.
This report contains information about our adjusted housing gross margin, which constitutes a non-GAAP financial measure. Because adjusted housing gross margin is not calculated in accordance with GAAP, this financial measure may not be completely comparable to similarly-titled measures used by other companies in the homebuilding industry and, therefore, should not be considered in isolation or as an alternative to operating performance and/or financial measures prescribed by GAAP. Rather, this non-GAAP financial measure should be used to supplement our GAAP results in order to provide a greater understanding of the factors and trends affecting our operations.
Adjusted housing gross margin for each of our reportable segments is calculated as follows:
|
Year Ended December 31,
|
|||||||||||
|
(Dollars in thousands)
|
2018
|
2017
|
2016
|
||||||||
|
Midwest region:
|
|||||||||||
|
Housing revenue
|
$
|
932,248
|
|
$
|
738,743
|
|
$
|
631,772
|
|
||
|
Housing cost of sales
|
767,445
|
|
590,423
|
|
506,652
|
|
|||||
|
Housing gross margin
|
164,803
|
|
148,320
|
|
125,120
|
|
|||||
|
Add: Impairment
(a)
|
273
|
|
—
|
|
253
|
|
|||||
|
Add: Purchase accounting adjustments
(b)
|
5,147
|
|
—
|
|
1,081
|
|
|||||
|
Adjusted housing gross margin
|
$
|
170,223
|
|
$
|
148,320
|
|
$
|
126,454
|
|
||
|
Housing gross margin percentage
|
17.7
|
%
|
20.1
|
%
|
19.8
|
%
|
|||||
|
Adjusted housing gross margin percentage
|
18.3
|
%
|
20.1
|
%
|
20.0
|
%
|
|||||
|
Southern region:
|
|||||||||||
|
Housing revenue
|
$
|
915,945
|
|
$
|
720,704
|
|
$
|
583,817
|
|
||
|
Housing cost of sales
|
748,911
|
|
602,585
|
|
498,314
|
|
|||||
|
Housing gross margin
|
167,034
|
|
118,119
|
|
85,503
|
|
|||||
|
Add: Impairment
(a)
|
4,513
|
|
7,681
|
|
2,578
|
|
|||||
|
Add: Stucco-related charges
(c)
|
—
|
|
8,500
|
|
19,409
|
|
|||||
|
Adjusted housing gross margin
|
$
|
171,547
|
|
$
|
134,300
|
|
$
|
107,490
|
|
||
|
Housing gross margin percentage
|
18.2
|
%
|
16.4
|
%
|
14.6
|
%
|
|||||
|
Adjusted housing gross margin percentage
|
18.7
|
%
|
18.6
|
%
|
18.4
|
%
|
|||||
|
Mid-Atlantic region:
|
|||||||||||
|
Housing revenue
|
$
|
369,004
|
|
$
|
419,125
|
|
$
|
394,907
|
|
||
|
Housing cost of sales
|
311,313
|
|
344,838
|
|
322,523
|
|
|||||
|
Housing gross margin
|
57,691
|
|
74,287
|
|
72,384
|
|
|||||
|
Add: Impairment
(a)
|
1,023
|
|
—
|
|
1,161
|
|
|||||
|
Adjusted housing gross margin
|
$
|
58,714
|
|
$
|
74,287
|
|
$
|
73,545
|
|
||
|
Housing gross margin percentage
|
15.6
|
%
|
17.7
|
%
|
18.3
|
%
|
|||||
|
Adjusted housing gross margin percentage
|
15.9
|
%
|
17.7
|
%
|
18.6
|
%
|
|||||
|
(a)
|
Represents asset impairment charges taken during the respective periods.
|
|
(b)
|
Represents purchase accounting adjustments from our acquisition of Pinnacle Homes in Detroit, Michigan on March 1, 2018 and our 2015 Minneapolis/St. Paul acquisition.
|
|
(c)
|
Represents warranty charges for stucco-related repair costs in certain of our Florida communities taken during 2017 and 2016. With respect to this matter, during 2018, we identified
165
additional homes in need of repair and completed repairs on
218
homes, and at
December 31, 2018
, we have
159
homes in various stages of repair. Please see
Note 8
to our Consolidated Financial Statements for further information.
|
Year Ended December 31, 2017
Compared to
Year Ended December 31, 2016
Midwest Region.
During the twelve months ended December 31, 2017, homebuilding revenue in our Midwest region increased $104.7 million, from $637.9 million in 2016 to $742.6 million in 2017. This 16% increase in homebuilding revenue was the result of a 13% increase in the number of homes delivered (217 units) and a 3% increase in the average sales price of homes delivered ($13,000 per home delivered). Operating income in our Midwest region increased $11.1 million, from $70.4 million in 2016 to $81.5 million in 2017. The increase in operating income was primarily the result of a $22.4 million increase in our gross margin, offset, in part, by an $11.4 million increase in selling, general, and administrative expense. With respect to our homebuilding gross margin, our housing gross margin improved $23.2 million, due to the 13% increase in the number of homes delivered and the 3% increase in the average sales price of homes delivered noted above. Our housing gross margin percentage improved 30 basis points from 19.8% in 2016 to 20.1% in 2017. Housing gross margin in 2016 was unfavorably impacted by a $1.1 million charge for
41
purchase accounting adjustments from our 2015 Minneapolis/St. Paul acquisition and $0.3 million in asset impairment charges. Exclusive of these prior year charges, our adjusted housing gross margin percentage in 2017 improved 10 basis points from 2016. Our land gross margin declined $0.8 million in the twelve months ended December 31, 2017 compared to the same period in 2016 as a result of fewer strategic land sales made in the current year compared to the prior year.
Selling, general and administrative expense increased $11.4 million, from $56.2 million in 2016 to $67.6 million in 2017, and increased as a percentage of revenue to 9.1% in 2017 from 8.8% in 2016. The increase in selling, general and administrative expense was attributable, in part, to an $8.5 million increase in selling expense, due to (1) a $4.9 million increase in variable selling expenses resulting from increases in sales commissions produced by the higher average sales price of homes delivered and higher number of homes delivered, and (2) a $3.6 million increase in non-variable selling expenses associated with our sales offices and models, including a $1.2 million increase in advertising expense related primarily to new communities and a new marketing campaign. The increase in selling, general and administrative expense was also attributable to a $2.9 million increase in general and administrative expense, which was primarily related to a $1.4 million increase in compensation expense, a $0.6 million increase in land-related expenses, a $0.4 million increase in professional fees, and a $0.5 million increase in other miscellaneous expenses.
During 2017, we experienced an 11% increase in new contracts in our Midwest region, from 1,775 in 2016 to 1,978 in 2017, and a 9% increase in backlog from 757 homes at December 31, 2016 to 828 homes at December 31, 2017. The increases in new contracts and backlog were partially due to contributions from the growth in our Minneapolis/St. Paul, Minnesota division compared to prior year levels, together with improving demand in our newer communities. Average sales price in backlog increased to $415,000 at December 31, 2017 compared to $403,000 at December 31, 2016 which was primarily due to product type and market mix. During the twelve months ended December 31, 2017, we opened 27 new communities in our Midwest region compared to 13 during 2016. Our monthly absorption rate in our Midwest region increased to 2.6 per community in 2017, compared to 2.2 in 2016.
Southern Region.
For the twelve months ended December 31, 2017, homebuilding revenue in our Southern region increased $128.2 million, from $602.3 million in 2016 to $730.5 million in 2017. This 21% increase in homebuilding revenue was primarily the result of a 23% increase in the number of homes delivered (400), partially offset by an $8.7 million decrease in land sale revenue. Operating income in our Southern region increased $16.4 million from $20.4 million in 2016 to $36.8 million in 2017. This increase in operating income was the result of a $31.9 million improvement in our gross margin, offset, in part, by a $15.5 million increase in selling, general, and administrative expense. With respect to our homebuilding gross margin, our housing gross margin improved $32.6 million, due to the 23% increase in the number of homes delivered noted above, as well as the $10.9 million reduction in stucco-related repair charges, partially offset by a $5.1 million increase in pre-tax impairment charges recorded in 2017 compared to prior year. Our housing gross margin percentage improved from 14.6% in prior year's twelve month period to 16.4% for the same period in 2017. Exclusive of the stucco-related and impairment charges in both periods, our adjusted housing gross margin percentage improved 20 basis points from 18.4% in 2016 to 18.6% in the twelve months ended December 31, 2017 largely due to the mix of communities delivering homes and a more favorable product mix. Our land gross margin declined $0.7 million as a result of fewer strategic land sales in the twelve months ended December 31, 2017 compared to the same period in 2016.
Selling, general and administrative expense increased $15.5 million from $67.4 million in 2016 to $82.9 million in 2017 and increased as a percentage of revenue to 11.4% in 2017 from 11.2% in 2016. The increase in selling, general and administrative expense was attributable, in part, to a $10.6 million increase in selling expense due to (1) a $6.0 million increase in variable selling expenses resulting from increases in sales commissions from the higher number of homes delivered, and (2) a $4.6 million increase in non-variable selling expenses primarily related to costs associated with our sales offices and models as a result of our increased community count. The increase in selling, general and administrative expense was also attributable to a $4.9 million increase in general and administrative expense, which was primarily related to a $3.3 million increase in land related expenses and a $1.4 million increase related to start-up costs associated with our new Sarasota division, in addition to increases in other miscellaneous expenses.
During 2017, we experienced a 29% increase in new contracts in our Southern region, from 1,822 in 2016 to 2,342 in 2017, and a 35% increase in backlog from 674 homes at December 31, 2016 to 908 homes at December 31, 2017. The increases in new contracts and backlog were primarily due to an increase in our average number of communities during the period, along with a modest improvement in demand in our Florida markets as well as continued growth in our Texas operations. Despite these improvements, we believe our new contract volume was negatively impacted by the separate hurricanes that occurred in Florida and Texas during the third quarter of 2017, which we believe resulted in approximately $0.8 million of community and model home repair costs. Average sales price in backlog increased to $365,000 at December 31, 2017 from $355,000 at December 31, 2016 primarily due to a change in product type and market mix. During 2017, we opened 31 communities in our Southern region compared to 28 in 2016. Our monthly absorption rate in our Southern region improved to 2.3 per community in 2017 from 2.1 per community in 2016.
42
Mid-Atlantic Region.
For the twelve months ended December 31, 2017, homebuilding revenue in our Mid-Atlantic region increased $30.1 million from $409.1 million in 2016 to $439.2 million in 2017. This 7% increase in homebuilding revenue was the result of a 7% increase in the average sales price of homes delivered ($26,000 per home delivered) and a $5.9 million increase in land sale revenue compared to prior year. Operating income in our Mid-Atlantic region increased $2.1 million, from $33.5 million in 2016 to $35.6 million in 2017. This increase in operating income was primarily the result of a $2.1 million increase in our gross margin. With respect to our homebuilding gross margin, our housing gross margin improved $1.9 million, due to the 7% increase in the average sales price of homes delivered noted above. Our housing gross margin percentage declined by 60 basis points, however, from 18.3% in 2016 to 17.7% in 2017. We had $1.2 million in asset impairment charges in 2016. Exclusive of these prior year charges, our adjusted housing gross margin percentage declined 90 basis points from 18.6% in 2016 to 17.7% in 2017 due primarily to the mix of homes delivered by type and by market. Our land gross margin improved $0.2 million in the twelve months ended December 31, 2017 compared to the same period in 2016 due to increased strategic land sales in the current year compared to the prior year.
Selling, general and administrative expense remained flat at $39.2 million in both 2017 and 2016 but declined as a percentage of revenue to 8.9% compared to 9.6% in 2016. Selling expense increased $0.2 million due to an increase in variable selling expenses resulting from increases in sales commissions produced by higher average sales price of homes delivered. General and administrative expense decreased $0.3 million primarily related to a decrease in land related expenses.
During the twelve months ended December 31, 2017, we experienced a 15% decrease in new contracts in our Mid-Atlantic region, from 1,158 in 2016 to 979 in 2017, and a 25% decrease in the number of homes in backlog from 373 homes at December 31, 2016 to 278 homes at December 31, 2017. The decreases in new contracts and backlog were primarily due to a decrease in the average number of active communities during the period compared to the prior year, and partly as a result of delays in planned new community openings in the period compared to the prior year. Average sales price of homes in backlog increased, however, from $380,000 at December 31, 2016 to $416,000 at December 31, 2017. We opened nine communities in our Mid-Atlantic region during the twelve months ended December 31, 2017 compared to 11 during the same period in 2016. Our monthly absorption rate in our Mid-Atlantic region declined slightly to 2.4 per community in 2017 from 2.5 per community in 2016.
Financial Services.
Revenue from our mortgage and title operations increased $7.7 million (18%) from $42.0 million for the twelve months ended December 31, 2016 to a record $49.7 million for the twelve months ended December 31, 2017 as a result of an 11% increase in the number of loan originations, from 3,286 in 2016 to 3,632 in 2017, and a slight increase in the average loan amount from $295,000 in 2016 to $297,000 in 2017. In addition, we experienced an increase in the volume of loans sold, a gain from the sale of a portion of our servicing portfolio during the first quarter of 2017, and higher margins on loans sold in the first half of the year than we experienced in the prior year.
Our financial service operations ended 2017 with a $4.0 million increase in operating income compared to the same period in 2016, which was primarily due to the increase in our revenue discussed above, offset, in part, by a $3.7 million increase in selling, general and administrative expense compared to 2016, which was primarily attributable to a $2.1 million increase in compensation expense, a $0.6 million increase in computer costs related to our investment in new information systems and increases in other miscellaneous expenses.
At December 31, 2017, M/I Financial provided financing services in all of our markets. Approximately 81% of our homes delivered during 2017 were financed through M/I Financial, compared to 84% during 2016. Capture rate is influenced by financing availability and can fluctuate from quarter to quarter.
Corporate Selling, General and Administrative Expenses.
Corporate selling, general and administrative expense increased $3.7 million, from $38.8 million in 2016 to $42.5 million in 2017. The increase was primarily due to a $2.3 million increase in compensation expense, a $0.5 million increase in charitable contributions, a $0.4 million increase related to costs associated with new information systems, and a $0.5 million increase in other miscellaneous expenses.
Interest Expense - Net.
Interest expense for the Company increased by $1.3 million, from $17.6 million in the twelve months ended December 31, 2016 to $18.9 million in the twelve months ended December 31, 2017. This increase was primarily the result of an increase in our weighted average borrowings from $612.5 million in 2016 to $678.2 million in 2017. The increase in our weighted average borrowings primarily related to the issuance of $250.0 million in aggregate principal amount of our 2025 Senior Notes during the third quarter of 2017, partially offset by the conversion of all of the then outstanding $57.5 million in aggregate principal amount of our 2017 Convertible Senior Subordinated Notes into common shares in September 2017 and by a decrease in borrowings under our Credit Facility (as defined below) during 2017 compared to 2016. Our weighted average borrowing rate also increased from 5.77% in the twelve months ended December 31, 2016 to 5.99% for the twelve months ended December 31, 2017, which was primarily due to our newly issued 2025 Senior Notes.
43
Earnings from Joint Venture Arrangements.
Earnings from joint venture arrangements represents our portion of pre-tax earnings from our joint ownership and development agreements, joint ventures and other similar arrangements. In 2017 and 2016, the Company earned $0.5 million and $0.6 million, respectively, in equity income from joint venture arrangements.
Income Taxes.
Our overall effective tax rate was 40.1% for the year ended December 31, 2017 and 38.3% for the year ended December 31, 2016. The increase in the effective rate for the twelve months ended December 31, 2017 was primarily attributable to the impact of the non-cash provisional tax expense of approximately $6.5 million related to the re-measurement of our deferred tax assets as a result of the decrease in the corporate income tax rate from 35% to 21% under the Tax Act enacted during the fourth quarter of 2017.
LIQUIDITY AND CAPITAL RESOURCES
Overview of Capital Resources and Liquidity
At
December 31, 2018
, we had
$21.5 million
of cash, cash equivalents and restricted cash, with
$20.9 million
of this amount comprised of unrestricted cash and cash equivalents, which represents a
$129.9 million
decrease
in unrestricted cash and cash equivalents from
December 31, 2017
. Our principal uses of cash during
2018
were investment in land and land development, the acquisition of Pinnacle Homes in Detroit, Michigan on March 1, 2018 (please see
Note 12
to our financial statements for more information), construction of homes, mortgage loan originations, investment in joint ventures, operating expenses, short-term working capital, debt service requirements, including the repayment of amounts outstanding under our credit facilities, the repayment of approximately $65.9 million in aggregate principal amount of our 3.0% Convertible Senior Subordinated Notes due 2018 (the “2018 Convertible Senior Subordinated Notes”), and the repurchase of
$25.7 million
of our outstanding common shares under our 2018 Share Repurchase Program (as defined below). In order to fund these uses of cash, we used proceeds from home deliveries, the sale of mortgage loans and the sale of mortgage servicing rights, as well as excess cash balances, borrowings under our credit facilities, and other sources of liquidity.
We are actively acquiring and developing lots in our markets to replenish and grow our lot supply and active community count. We expect to continue to expand our business based on the anticipated level of demand for new homes in our markets. Accordingly, we expect that our cash outlays for land purchases, land development, home construction and operating expenses will exceed our cash generated by operations during some periods in
2019
, and we expect to continue to utilize our Credit Facility (as defined below) in
2019
.
During the year ended
December 31, 2018
, we delivered
5,778
homes, started
6,229
homes, and spent
$330.5 million
on land purchases and
$221.9 million
on land development. Based upon our business activity levels, market conditions, and opportunities for land in our markets, we currently estimate that we will spend approximately
$575 million
to
$600 million
on land purchases and land development during
2019
.
We also continue to enter into land option agreements, taking into consideration current and projected market conditions, to secure land for the construction of homes in the future. Pursuant to such land option agreements, as of
December 31, 2018
, we had a total of
14,660
lots under contract, with an aggregate purchase price of approximately
$636.4 million
, to be acquired during the period from
2019
through 2028.
Land transactions are subject to a number of factors, including our financial condition and market conditions, as well as satisfaction of various conditions related to specific properties. We will continue to monitor market conditions and our ongoing pace of home deliveries and adjust our land spending accordingly. The planned increase in our land spending in
2019
compared to
2018
is driven primarily by the growth of our business.
Operating Cash Flow Activities
.
During
2018
, we used
$2.6 million
of cash in operating activities, compared to
$53.2 million
of cash
used
in operating activities in
2017
. The cash
used in
operating activities in
2018
was primarily a result of a
$157.6 million
increase in inventory, offset partially by net income and the non-cash impact of changes in deferred tax expense totaling
$112.6 million
and an increase in accounts payable, accrued compensation, other liabilities, other assets, and customer deposits totaling
$20.2 million
. During
2017
, we
used
$53.2 million
of cash in operating activities. The cash used in operating activities in
2017
was primarily a result of a
$168.6 million
increase in inventory, offset partially by net income and the non-cash impact of changes in deferred tax expense totaling
$84.5 million
and an increase in accounts payable, accrued compensation, other liabilities and customer deposits totaling
$27.0 million
.
Investing Cash Flow Activities.
During
2018
, we
used
$134.0 million
of cash in investing activities, compared to
$9.2 million
of cash used in investing activities during
2017
. This
$124.8 million
increase
in cash usage was primarily due to our acquisition of Pinnacle Homes, a privately held homebuilder in Detroit, Michigan, during the first quarter of 2018 for
$101.0 million
, in addition to a
$31.9 million
increase in investment in joint venture arrangements.
44
Financing Cash Flow Activities.
During
2018
, we
generated
$6.4 million
of cash from our financing activities, compared to
generating
$179.6 million
of cash from our financing activities during
2017
. The
$173.2 million
decrease in cash
generated
from financing activities was primarily due to the issuance of
$250.0 million
in aggregate principal amount of our 2025 Senior Notes during the third quarter of 2017, repayment during the first quarter of 2018 of that portion of our 2018 Convertible Senior Subordinated Notes that were not converted into common shares by the holders thereof ($65.9 million), the repurchase of
$25.7 million
of our common shares under our 2018 Share Repurchase Program (as defined below) during
2018
and increased repayments under our M/I Financial credit facilities during
2018
, offset, in part, by the redemption of all 2,000 of our outstanding Series A Preferred Shares for
$50.4 million
during the fourth quarter of 2017, as well as increased borrowings under our Credit Facility (as defined below) during 2018.
On August 14, 2018, the Company announced that its Board of Directors authorized a share repurchase program (the “2018 Share Repurchase Program”) pursuant to which the Company may purchase up to
$50 million
of its outstanding common shares (see
Note 18
to our financial statements). During
2018
, the Company repurchased
1.1 million
common shares with an aggregate purchase price of
$25.7 million
which was funded with cash on hand and borrowings under our Credit Facility. As of
December 31, 2018
, the Company is authorized to repurchase an additional
$24.3 million
of outstanding common shares under the 2018 Share Repurchase Program.
At
December 31, 2018
and
December 31, 2017
, our ratio of homebuilding debt to capital was
44%
and
46%
, respectively, calculated as the carrying value of our outstanding homebuilding debt divided by the sum of the carrying value of our outstanding homebuilding debt plus shareholders' equity. This decrease compared to
December 31, 2017
was due to lower homebuilding debt levels compared to
December 31, 2017
in addition to an increase in shareholders’ equity at
December 31, 2018
. We believe that this ratio provides useful information for understanding our financial position and the leverage employed in our operations, and for comparing us with other homebuilders.
We fund our operations with cash flows from operating activities, including proceeds from home deliveries, land sales and the sale of mortgage loans. We believe that these sources of cash, along with our balance of unrestricted cash and borrowings available under our credit facilities, will be sufficient to fund our currently anticipated working capital needs, investment in land and land development, construction of homes, operating expenses, planned capital spending, and debt service requirements for at least the next twelve months. In addition, we routinely monitor current operational and debt service requirements, financial market conditions, and credit relationships and we may choose to seek additional capital by issuing new debt and/or equity securities to strengthen our liquidity or our long-term capital structure. The financing needs of our homebuilding and financial services operations depend on anticipated sales volume in the current year as well as future years, inventory levels and related turnover, forecasted land and lot purchases, debt maturity dates, and other factors. If we seek such additional capital, there can be no assurance that we would be able to obtain such additional capital on terms acceptable to us, if at all, and such additional equity or debt financing could dilute the interests of our existing shareholders and/or increase our interest costs.
The Company is a party to three primary credit agreements: (1) a
$500 million
unsecured revolving credit facility dated July 18, 2013, as amended, with M/I Homes, Inc. as borrower and guaranteed by the Company's wholly owned homebuilding subsidiaries (the “Credit Facility”); (2) a
$125 million
secured mortgage warehousing agreement, (which increases to
$160 million
during certain periods), dated
June 24, 2016
, as amended, with M/I Financial as borrower (the “MIF Mortgage Warehousing Agreement”); and (3) a
$50 million
mortgage repurchase agreement (which increases to
$65 million
during certain periods), dated October 30, 2017, as amended, with M/I Financial as borrower (the “MIF Mortgage Repurchase Facility”).
Included in the table below is a summary of our available sources of cash from the Credit Facility, the MIF Mortgage Warehousing Agreement and the MIF Mortgage Repurchase Facility as of
December 31, 2018
:
|
(In thousands)
|
Expiration
Date
|
Outstanding
Balance
|
Available
Amount
|
||||
|
Notes payable – homebuilding
(a)
|
7/18/2021
|
$
|
117,400
|
|
$
|
329,904
|
|
|
Notes payable – financial services
(b)
|
(b)
|
$
|
153,168
|
|
$
|
11,581
|
|
|
(a)
|
The available amount under the Credit Facility is computed in accordance with the borrowing base calculation under the Credit Facility, which applies various advance rates for different categories of inventory and totaled
$587.1 million
of availability for additional senior debt at
December 31, 2018
. As a result, the full
$500 million
commitment amount of the facility was available, less any borrowings and letters of credit outstanding. There were
$117.4 million
borrowings outstanding and
$52.7 million
of letters of credit outstanding at
December 31, 2018
, leaving
$329.9 million
available. The Credit Facility has an expiration date of
July 18, 2021
.
|
|
(b)
|
The available amount is computed in accordance with the borrowing base calculations under the MIF Mortgage Warehousing Agreement and the MIF Mortgage Repurchase Facility, each of which may be increased by pledging additional mortgage collateral. The maximum aggregate commitment amount of M/I Financial's warehousing agreements as of
December 31, 2018
was
$225 million
, which included temporary increases for each facility (as further described below) which were applicable through
February 1, 2019
at which time the maximum aggregate commitment amount under the two agreements reverted to
$175 million
. The MIF Mortgage Warehousing Agreement has an expiration date of
June 21, 2019
and the MIF Mortgage Repurchase Facility has an expiration date of
October 28, 2019
.
|
45
Notes Payable - Homebuilding.
Homebuilding Credit Facility
.
The Credit Facility provides for an aggregate commitment amount of
$500 million
, including a
$125 million
sub-facility for letters of credit. The Credit Facility matures on
July 18, 2021
. Interest on amounts borrowed under the Credit Facility is payable at a rate which is adjusted daily and is equal to the sum of the one month LIBOR rate plus a margin of
250
basis points. The margin is subject to adjustment in subsequent quarterly periods based on the Company’s leverage ratio.
Borrowings under the Credit Facility constitute senior, unsecured indebtedness and availability is subject to, among other things, a borrowing base calculated using various advance rates for different categories of inventory. The Credit Facility contains various representations, warranties and covenants which require, among other things, that the Company maintain (1) a minimum level of Consolidated Tangible Net Worth of
$531.7 million
(subject to increase over time based on earnings and proceeds from equity offerings), (2) a leverage ratio not in excess of
60%
, and (3) either a minimum Interest Coverage Ratio of
1.5 to 1.0
or a minimum amount of available liquidity. In addition, the Credit Facility contains covenants that limit the Company’s number of unsold housing units and model homes, as well as the amount of Investments in Unrestricted Subsidiaries and Joint Ventures.
The Company’s obligations under the Credit Facility are guaranteed by all of the Company’s subsidiaries, with the exception of subsidiaries that are primarily engaged in the business of mortgage financing, title insurance or similar financial businesses relating to the homebuilding and home sales business, certain subsidiaries that are not 100%-owned by the Company or another subsidiary, and other subsidiaries designated by the Company as Unrestricted Subsidiaries (as defined in
Note 16
to our Consolidated Financial Statements), subject to limitations on the aggregate amount invested in such Unrestricted Subsidiaries. The guarantors for the Credit Facility are the same subsidiaries that guarantee our 2025 Senior Notes and our
$300.0 million
aggregate principal amount of
6.75%
Senior Notes due 2021 (the “2021 Senior Notes”).
As of
December 31, 2018
, the Company was in compliance with all covenants of the Credit Facility, including financial covenants. The following table summarizes the most significant restrictive covenant thresholds under the Credit Facility and our compliance with such covenants as of
December 31, 2018
:
|
Financial Covenant
|
Covenant Requirement
|
Actual
|
||||||
|
(Dollars in millions)
|
||||||||
|
Consolidated Tangible Net Worth
|
≥
|
$
|
531.7
|
|
$
|
812.9
|
|
|
|
Leverage Ratio
|
≤
|
0.60
|
|
0.46
|
|
|||
|
Interest Coverage Ratio
|
≥
|
1.5 to 1.0
|
|
4.5 to 1.0
|
|
|||
|
Investments in Unrestricted Subsidiaries and Joint Ventures
|
≤
|
$
|
243.9
|
|
$
|
2.9
|
|
|
|
Unsold Housing Units and Model Homes
|
≤
|
2,273
|
|
1,358
|
|
|||
Homebuilding Letter of Credit Facility.
During 2018, the Company was a party to a secured credit agreement (the “Letter of Credit Facility”) which allowed for the issuance of letters of credit up to a total of
$1.0 million
secured by cash collateral. The Company elected not to extend the maturity of its Letter of Credit Facility, which expired on September 30, 2018. There were no letters of credit remaining outstanding at the time of maturity.
Notes Payable - Financial Services.
MIF Mortgage Warehousing Agreement.
The MIF Mortgage Warehousing Agreement is used to finance eligible residential mortgage loans originated by M/I Financial. The MIF Mortgage Warehousing Agreement provides a maximum borrowing availability of
$125 million
, which increased to
$160 million
from September 25, 2018 to October 15, 2018 and also from November 15, 2018 to February 4, 2019 (periods of expected increases in the volume of mortgage originations). The MIF Mortgage Warehousing Agreement expires on
June 21, 2019
. Interest on amounts borrowed under the MIF Mortgage Warehousing Agreement is payable at a per annum rate equal to the floating LIBOR rate plus a spread of
200
basis points.
As is typical for similar credit facilities in the mortgage origination industry, at closing, the expiration of the MIF Mortgage Warehousing Agreement was set at approximately one year and is under consideration for extension annually by the participating lenders. We expect to extend the MIF Mortgage Warehousing Agreement on or prior to the current expiration date of
June 21, 2019
, but we cannot provide any assurance that we will be able to obtain such an extension.
The MIF Mortgage Warehousing Agreement is secured by certain mortgage loans originated by M/I Financial that are being “warehoused” prior to their sale to investors. The MIF Mortgage Warehousing Agreement provides for limits with respect to certain loan types that can secure outstanding borrowings. There are currently no guarantors of the MIF Mortgage Warehousing Agreement.
46
As of
December 31, 2018
, there was
$113.0 million
outstanding under the MIF Mortgage Warehousing Agreement and M/I Financial was in compliance with all covenants thereunder. The financial covenants, as more fully described and defined in the MIF Mortgage Warehousing Agreement, are summarized in the following table, which also sets forth M/I Financial’s compliance with such covenants as of
December 31, 2018
:
|
Financial Covenant
|
Covenant Requirement
|
Actual
|
||||||
|
(Dollars in millions)
|
||||||||
|
Leverage Ratio
|
≤
|
10.0 to 1.0
|
|
6.3 to 1.0
|
|
|||
|
Liquidity
|
≥
|
$
|
6.3
|
|
$
|
17.3
|
|
|
|
Adjusted Net Income
|
>
|
$
|
0.0
|
|
$
|
13.9
|
|
|
|
Tangible Net Worth
|
≥
|
$
|
12.5
|
|
$
|
26.5
|
|
|
MIF Mortgage Repurchase Facility.
The MIF Mortgage Repurchase Facility is used to finance eligible residential mortgage loans originated by M/I Financial and is structured as a mortgage repurchase facility. The MIF Mortgage Repurchase Facility provides for a maximum borrowing availability of
$50 million
, which increased to
$65 million
from
November 15, 2018
through
February 1, 2019
(a period of expected increases in the volume of mortgage originations). The MIF Mortgage Repurchase Facility expires on
October 28, 2019
. As is typical for similar credit facilities in the mortgage origination industry, at closing, the expiration of the MIF Mortgage Repurchase Facility was set at approximately one year and is under consideration for extension annually by the lender.
M/I Financial pays interest on each advance under the MIF Mortgage Repurchase Facility at a per annum rate equal to the floating LIBOR rate plus
200
or
225
basis points depending on the loan type. The covenants in the MIF Mortgage Repurchase Facility are substantially similar to the covenants in the MIF Mortgage Warehousing Agreement. The MIF Mortgage Repurchase Facility provides for limits with respect to certain loan types that can secure outstanding borrowings, which are substantially similar to the restrictions in the MIF Mortgage Warehousing Agreement. There are no guarantors of the MIF Mortgage Repurchase Facility. As of
December 31, 2018
, there was
$40.2 million
outstanding under the MIF Mortgage Repurchase Facility. M/I Financial was in compliance with all financial covenants under the MIF Mortgage Repurchase Facility as of
December 31, 2018
.
Senior Notes.
5.625% Senior Notes.
In August 2017, the Company issued
$250 million
aggregate principal amount of
5.625%
Senior Notes due 2025. The 2025 Senior Notes contain certain covenants, as more fully described and defined in the indenture governing the 2025 Senior Notes, which limit the ability of the Company and the restricted subsidiaries to, among other things: incur additional indebtedness; make certain payments, including dividends, or repurchase any shares, in an aggregate amount exceeding our “restricted payments basket”; make certain investments; and create or incur certain liens, consolidate or merge with or into other companies, or liquidate or sell or transfer all or substantially all of our assets. These covenants are subject to a number of exceptions and qualifications as described in the indenture governing the 2025 Senior Notes. As of
December 31, 2018
, the Company was in compliance with all terms, conditions, and covenants under the indenture. Please see
Note 7
to our Consolidated Financial Statements for more information regarding the 2025 Senior Notes.
6.75% Senior Notes.
In December 2015, the Company issued
$300 million
aggregate principal amount of
6.75%
Senior Notes due 2021. The 2021 Senior Notes contain certain covenants, as more fully described and defined in the indenture governing the 2021 Senior Notes, which limit the ability of the Company and the restricted subsidiaries to, among other things: incur additional indebtedness; make certain payments, including dividends, or repurchase any shares, in an aggregate amount exceeding our “restricted payments basket”; make certain investments; and create or incur certain liens, consolidate or merge with or into other companies, or liquidate or sell or transfer all or substantially all of our assets. These covenants are subject to a number of exceptions and qualifications as described in the indenture governing the 2021 Senior Notes. As of
December 31, 2018
, the Company was in compliance with all terms, conditions, and covenants under the indenture. Please see
Note 11
to our Consolidated Financial Statements for more information regarding the 2021 Senior Notes.
Weighted Average Borrowings.
In
2018
and
2017
, our weighted average borrowings outstanding were
$801.0 million
and
$678.2 million
, respectively, with a weighted average interest rate of
6.22%
and
5.99%
, respectively. The
increase
in our weighted average borrowings primarily related to the issuance of our 2025 Senior Notes during the third quarter of 2017 in addition to increased borrowings under our Credit Facility on a weighted average basis in
2018
compared to
2017
, partially offset by the maturity of our 2017 Convertible Senior Subordinated Notes in September 2017 and our 2018 Convertible Senior Subordinated Notes in March 2018. Our weighted average interest rate increased as a result of the issuance of the 2025 Senior Notes in the third quarter of 2017, which have a higher interest rate than the interest rates applicable to the 2018 Convertible Senior Subordinated Notes and the 2017 Convertible Senior Subordinated Notes, which were both outstanding during 2017.
47
At
December 31, 2018
, we had
$117.4 million
borrowings of outstanding under the Credit Facility, an increase from having no outstanding borrowings at December 31, 2017. During the twelve months ended
December 31, 2018
, we used the Credit Facility to fund our acquisition of Pinnacle Homes, a privately-held homebuilder in Detroit, Michigan, and repay the $65.9 million portion of our 2018 Convertible Senior Subordinated Notes that were not converted into common shares, in addition to investments in land and land development, construction of homes, mortgage loan originations, operating expenses, working capital requirements and share repurchases under our 2018 Share Repurchase Program. During the twelve months ended
December 31, 2018
, the average daily amount outstanding under the Credit Facility was
$164.5 million
and the maximum amount outstanding under the Credit Facility was
$262.2 million
. Based on our currently anticipated spending on home construction, land acquisition and development in
2019
, offset by expected cash receipts from home deliveries, we expect to continue to borrow under the Credit Facility during
2019
, with an estimated peak amount outstanding not expected to exceed
$300 million
. The actual amount borrowed in
2019
(and the estimated peak amount outstanding) and related timing are subject to numerous factors, including the timing and amount of land and house construction expenditures, payroll and other general and administrative expenses, cash receipts from home deliveries, other cash receipts and payments, any capital markets transactions or other additional financings by the Company, any repayments or redemptions of outstanding debt, any additional share repurchases under the 2018 Share Repurchase Program and any other extraordinary events or transactions. The Company may experience significant variation in cash and Credit Facility balances from week to week due to the timing of such receipts and payments.
There were
$52.7 million
of letters of credit issued and outstanding under the Credit Facility at
December 31, 2018
. During
2018
, the average daily amount of letters of credit outstanding under the Credit Facility was
$46.6 million
and the maximum amount of letters of credit outstanding under the Credit Facility was
$52.7 million
.
At
December 31, 2018
, M/I Financial had
$113.0 million
outstanding under the MIF Mortgage Warehousing Agreement. During
2018
, the average daily amount outstanding under the MIF Mortgage Warehousing Agreement was
$48.0 million
and the maximum amount outstanding was
$113.0 million
, which occurred during December, while the temporary increase provision was in effect and the maximum borrowing availability was
$160.0 million
.
At
December 31, 2018
, M/I Financial had
$40.2 million
outstanding under the MIF Mortgage Repurchase Facility. During
2018
, the average daily amount outstanding under the MIF Mortgage Repurchase Facility was
$21.6 million
and the maximum amount outstanding was
$40.2 million
, which occurred during December, while the temporary increase provision was in effect and the maximum borrowing availability was
$65.0 million
.
Universal Shelf Registration.
In October 2016, the Company filed a
$400 million
universal shelf registration statement with the SEC, which registration statement became effective on November 9, 2016 and will expire in November 2019. Pursuant to the registration statement, the Company may, from time to time, offer debt securities, common shares, preferred shares, depositary shares, warrants to purchase debt securities, common shares, preferred shares, depositary shares or units of two or more of those securities, rights to purchase debt securities, common shares, preferred shares or depositary shares, stock purchase contracts and units. The timing and amount of offerings, if any, will depend on market and general business conditions.
48
CONTRACTUAL OBLIGATIONS
Included in the table below is a summary, as of
December 31, 2018
, of future cash requirements under the Company’s contractual obligations:
|
|
Payments due by period
|
||||||||||||||
|
|
|
Less Than
|
1 - 3
|
3 - 5
|
More than
|
||||||||||
|
(In thousands)
|
Total
|
1 year
|
Years
|
Years
|
5 years
|
||||||||||
|
Notes payable bank – homebuilding operations
(a)
|
$
|
118,215
|
|
$
|
815
|
|
$
|
117,400
|
|
$
|
—
|
|
$
|
—
|
|
|
Notes payable bank – financial services
(b)
|
153,440
|
|
153,440
|
|
—
|
|
—
|
|
—
|
|
|||||
|
Notes payable – other (including interest)
|
6,836
|
|
1,764
|
|
3,134
|
|
1,938
|
|
—
|
|
|||||
|
Senior notes (including interest)
|
696,531
|
|
34,312
|
|
355,969
|
|
28,125
|
|
278,125
|
|
|||||
|
Obligation for consolidated inventory not owned
(c)
|
19,308
|
|
19,308
|
|
—
|
|
—
|
|
—
|
|
|||||
|
Operating leases
|
22,504
|
|
5,452
|
|
8,541
|
|
6,574
|
|
1,937
|
|
|||||
|
Total
|
$
|
1,016,834
|
|
$
|
215,091
|
|
$
|
485,044
|
|
$
|
36,637
|
|
$
|
280,062
|
|
|
(a)
|
At
December 31, 2018
, there were
$117.4 million
of borrowings outstanding under the Credit Facility. Interest on amounts borrowed under the Credit Facility is payable at a rate which is adjusted daily and is equal to the sum of the one month LIBOR rate plus a margin of
250
basis points. The margin is subject to adjustment in subsequent quarterly periods based on the Company’s leverage ratio. Borrowings outstanding at
December 31, 2018
had a weighted average interest rate of
5.8%
. Interest payments by period will be based upon the outstanding borrowings and the applicable interest rate(s) in effect. See
Note 9
to our Consolidated Financial Statements for additional information.
|
|
(b)
|
Borrowings under the MIF Mortgage Warehousing Agreement are at the floating LIBOR rate plus a spread of
200
basis points. Borrowings under the MIF Mortgage Repurchase Facility are at the floating LIBOR rate plus
200
or
225
basis points, depending on the loan type. Total borrowings outstanding under both agreements at
December 31, 2018
had a weighted average interest rate of
4.5%
. Interest payments by period will be based upon the outstanding borrowings and the applicable interest rate(s) in effect.
|
|
(c)
|
The Company is party to certain land purchase agreements in which the Company has specific performance requirements. The future amounts payable related to these land purchase agreements is the number of lots the Company is obligated to purchase at the lot price set forth in the agreement. In addition, the amount of deposits and prepaid acquisition and development costs on certain land purchase agreements have exceeded thresholds relative to the remaining purchase price of the lots for those agreements, such that the remaining purchase price of the lots is recorded as an Obligation for consolidated inventory not owned on our Consolidated Balance Sheets. In each case, the time period in which these payments will be made is the Company’s best estimate of when these lots will be purchased.
|
OFF-BALANCE SHEET ARRANGEMENTS
Reference is made to Notes
1
,
6
,
7
, and
8
in the accompanying Notes to the Consolidated Financial Statements included in this Annual Report on Form 10-K. These Notes discuss our off-balance sheet arrangements with respect to land acquisition contracts and option agreements, and land development joint ventures, including the nature and amounts of financial obligations relating to these items. In addition, these Notes discuss the nature and amounts of certain types of commitments that arise in the ordinary course of our land development and homebuilding operations, including commitments of land development joint ventures for which we might be obligated.
Our off-balance sheet arrangements relating to our homebuilding operations include joint venture arrangements, land option agreements, guarantees and indemnifications associated with acquiring and developing land, and the issuance of letters of credit and completion bonds. Our use of these arrangements is for the purpose of securing the most desirable lots on which to build homes for our homebuyers in a manner that we believe reduces the overall risk to the Company. Additionally, in the ordinary course of its business, M/I Financial issues guarantees and indemnities relating to the sale of loans to third parties.
INTEREST RATES AND INFLATION
Our business is significantly affected by general economic conditions within the United States and, particularly, by the impact of interest rates and inflation. Inflation can have a long-term impact on us because increasing costs of land, materials and labor can result in a need to increase the sales prices of homes. In addition, inflation is often accompanied by higher interest rates, which can have a negative impact on housing demand and the costs of financing land development activities and housing construction. Higher interest rates also may decrease our potential market by making it more difficult for homebuyers to qualify for mortgages or to obtain mortgages at interest rates that are acceptable to them. The impact of increased rates can be offset, in part, by offering variable rate loans with lower interest rates. In conjunction with our mortgage financing services, hedging methods are used to reduce our exposure to interest rate fluctuations between the commitment date of the loan and the time the loan closes. Rising interest rates, as well as increased materials and labor costs, may reduce gross margins. An increase in material and labor costs is particularly a problem during a period of declining home prices. Conversely, deflation can impact the value of real estate and make it difficult for us to recover our land costs. Therefore, either inflation or deflation could adversely impact our future results of operations.
49
Seasonality and Variability in Quarterly Results
Typically, our homebuilding operations experience significant seasonality and quarter-to-quarter variability in homebuilding activity levels. In general, homes delivered increase substantially in the second half of the year compared to the first half of the year. We believe that this seasonality reflects the tendency of homebuyers to shop for a new home in the spring with the goal of closing in the fall or winter, as well as the scheduling of construction to accommodate seasonal weather conditions. Our financial services operations also experience seasonality because loan originations correspond with the delivery of homes in our homebuilding operations.
|
|
Three Months Ended
|
|||||||||||
|
|
March 31, 2018
|
June 30,
2018 |
September 30, 2018
|
December 31, 2018
|
||||||||
|
(Dollars in thousands)
|
||||||||||||
|
Revenue
|
$
|
437,857
|
|
$
|
558,098
|
|
$
|
567,842
|
|
$
|
722,485
|
|
|
Unit data:
|
|
|
|
|
|
|
|
|
||||
|
New contracts
|
1,739
|
|
1,631
|
|
1,302
|
|
1,173
|
|
||||
|
Homes delivered
|
1,122
|
|
1,409
|
|
1,422
|
|
1,825
|
|
||||
|
Backlog at end of period
|
2,744
|
|
2,966
|
|
2,846
|
|
2,194
|
|
||||
|
|
Three Months Ended
|
|||||||||||
|
|
March 31, 2017
|
June 30,
2017 |
September 30, 2017
|
December 31, 2017
|
||||||||
|
(Dollars in thousands)
|
||||||||||||
|
Revenue
|
$
|
406,980
|
|
$
|
456,866
|
|
$
|
476,423
|
|
$
|
621,702
|
|
|
Unit data:
|
|
|
|
|
|
|
|
|
||||
|
New contracts
|
1,454
|
|
1,400
|
|
1,225
|
|
1,220
|
|
||||
|
Homes delivered
|
1,038
|
|
1,211
|
|
1,256
|
|
1,584
|
|
||||
|
Backlog at end of period
|
2,220
|
|
2,409
|
|
2,378
|
|
2,014
|
|
||||
50
ITEM 7A. QUANTITATIVE AND QUALITATIVE DISCLOSURES ABOUT MARKET RISK
Our primary market risk results from fluctuations in interest rates. We are exposed to interest rate risk through borrowings under our revolving credit facilities, consisting of the Credit Facility, the MIF Mortgage Warehousing Agreement, and the MIF Mortgage Repurchase Facility which permitted borrowings of up to
$725 million
at
December 31, 2018
, subject to availability constraints. Additionally, M/I Financial is exposed to interest rate risk associated with its mortgage loan origination services.
Interest Rate Lock Commitments:
Interest rate lock commitments (“IRLCs”) are extended to certain homebuying customers who have applied for a mortgage loan and meet certain defined credit and underwriting criteria. Typically, the IRLCs will have a duration of less than six months; however, in certain markets, the duration could extend to nine months.
Some IRLCs are committed to a specific third party investor through the use of whole loan delivery commitments matching the exact terms of the IRLC loan. Uncommitted IRLCs are considered derivative instruments and are fair value adjusted, with the resulting gain or loss recorded in current earnings.
Forward Sales of Mortgage-Backed Securities:
Forward sales of mortgage-backed securities (“FMBSs”) are used to protect uncommitted IRLC loans against the risk of changes in interest rates between the lock date and the funding date. FMBSs related to uncommitted IRLCs are classified and accounted for as non-designated derivative instruments and are recorded at fair value, with gains and losses recorded in current earnings.
Mortgage Loans Held for Sale
:
Mortgage loans held for sale consist primarily of single-family residential loans collateralized by the underlying property. During the period between when a loan is closed and when it is sold to an investor, the interest rate risk is covered through the use of a whole loan contract or by FMBSs. The FMBSs are classified and accounted for as non-designated derivative instruments, with gains and losses recorded in current earnings.
The table below shows the notional amounts of our financial instruments at
December 31, 2018 and 2017
:
|
December 31,
|
|||||||
|
Description of Financial Instrument (in thousands)
|
2018
|
2017
|
|||||
|
Whole loan contracts and related committed IRLCs
|
$
|
5,823
|
|
$
|
2,182
|
|
|
|
Uncommitted IRLCs
|
76,117
|
|
50,746
|
|
|||
|
FMBSs related to uncommitted IRLCs
|
83,000
|
|
53,000
|
|
|||
|
Whole loan contracts and related mortgage loans held for sale
|
14,285
|
|
80,956
|
|
|||
|
FMBSs related to mortgage loans held for sale
|
150,000
|
|
91,000
|
|
|||
|
Mortgage loans held for sale covered by FMBSs
|
149,980
|
|
90,781
|
|
|||
The table below shows the measurement of assets and liabilities at
December 31, 2018 and 2017
:
|
December 31,
|
|||||||
|
Description of Financial Instrument (in thousands)
|
2018
|
2017
|
|||||
|
Mortgage loans held for sale
|
$
|
169,651
|
|
$
|
171,580
|
|
|
|
Forward sales of mortgage-backed securities
|
(3,305
|
)
|
177
|
|
|||
|
Interest rate lock commitments
|
989
|
|
271
|
|
|||
|
Whole loan contracts
|
(154
|
)
|
12
|
|
|||
|
Total
|
$
|
167,181
|
|
$
|
172,040
|
|
|
The following table sets forth the amount of gain (loss) recognized on assets and liabilities for the
years ended December 31, 2018, 2017 and 2016
:
|
Year Ended December 31,
|
|||||||||||
|
Description (in thousands)
|
2018
|
2017
|
2016
|
||||||||
|
Mortgage loans held for sale
|
$
|
3,763
|
|
$
|
3,675
|
|
$
|
(3,591
|
)
|
||
|
Forward sales of mortgage-backed securities
|
(3,482
|
)
|
(53
|
)
|
323
|
|
|||||
|
Interest rate lock commitments
|
783
|
|
21
|
|
(71
|
)
|
|||||
|
Whole loan contracts
|
(231
|
)
|
102
|
|
116
|
|
|||||
|
Total gain (loss) recognized
|
$
|
833
|
|
$
|
3,745
|
|
$
|
(3,223
|
)
|
||
51
The following table provides the expected future cash flows and current fair values of borrowings under our credit facilities and mortgage loan origination services that are subject to market risk as interest rates fluctuate, as of
December 31, 2018
. Because the MIF Mortgage Warehousing Agreement and MIF Mortgage Repurchase Facility are effectively secured by certain mortgage loans held for sale which are typically sold within 30 to 45 days, their outstanding balances are included in the most current period presented. The interest rates for our variable rate debt represent the weighted average interest rates in effect at
December 31, 2018
. For fixed-rate debt, changes in interest rates generally affect the fair market value of the debt instrument, but not our earnings or cash flow. Conversely, for variable-rate debt, changes in interest rates generally do not affect the fair market value of the debt instrument, but do affect our earnings and cash flow. We do not have the obligation to prepay fixed-rate debt prior to maturity, and, as a result, interest rate risk and changes in fair market value should not have a significant impact on our fixed-rate debt until we are required or elect to refinance it.
|
Expected Cash Flows by Period
|
Fair Value
|
||||||||||||||
|
(Dollars in thousands)
|
2019
|
2020
|
2021
|
2022
|
2023
|
Thereafter
|
Total
|
12/31/2018
|
|||||||
|
ASSETS:
|
|||||||||||||||
|
Mortgage loans held for sale:
|
|||||||||||||||
|
Fixed rate
|
$166,580
|
—
|
—
|
—
|
—
|
—
|
$166,580
|
$164,110
|
|||||||
|
Weighted average interest rate
|
4.82%
|
—
|
—
|
—
|
—
|
—
|
4.82%
|
||||||||
|
Variable rate
|
$5,527
|
—
|
—
|
—
|
—
|
—
|
$5,527
|
$5,541
|
|||||||
|
Weighted average interest rate
|
4.44%
|
—
|
—
|
—
|
—
|
—
|
4.44%
|
||||||||
|
LIABILITIES:
|
|||||||||||||||
|
Long-term debt — fixed rate
|
$200
|
$1,213
|
$301,493
|
$1,150
|
$650
|
$250,000
|
$554,706
|
$531,197
|
|||||||
|
Weighted average interest rate
|
5.37%
|
5.37%
|
6.73%
|
5.63%
|
5.63%
|
5.63%
|
6.23%
|
||||||||
|
Short-term debt — variable rate
|
$270,568
|
—
|
—
|
—
|
—
|
—
|
$270,568
|
$270,568
|
|||||||
|
Weighted average interest rate
|
4.72%
|
—
|
—
|
—
|
—
|
—
|
4.72%
|
||||||||
52
|
Item 8.
|
FINANCIAL STATEMENTS AND SUPPLEMENTARY DATA
|
REPORT OF INDEPENDENT REGISTERED PUBLIC ACCOUNTING FIRM
To the shareholders and Board of Directors of M/I Homes, Inc.
Opinion on the Consolidated Financial Statements
We have audited the accompanying consolidated balance sheets of M/I Homes, Inc. and subsidiaries (the “Company”) as of
December 31, 2018 and 2017
, the related consolidated statements of income, shareholders’ equity, and cash flows for each of the three years in the period ended
December 31, 2018
, and the related notes (collectively referred to as the “consolidated financial statements”). In our opinion, the consolidated financial statements present fairly, in all material respects, the financial position of the Company as of
December 31, 2018 and 2017
, and the results of its operations and its cash flows for each of the three years in the period ended
December 31, 2018
, in conformity with accounting principles generally accepted in the United States of America.
We have also audited, in accordance with the standards of the Public Company Accounting Oversight Board (United States) (PCAOB), the Company’s internal control over financial reporting as of
December 31, 2018
, based on criteria established in
Internal Control - Integrated Framework (2013)
issued by the Committee of Sponsoring Organizations of the Treadway Commission and our report dated
February 22, 2019
, expressed an unqualified opinion on the Company’s internal control over financial reporting.
Basis for Opinion
These consolidated financial statements are the responsibility of the Company’s management. Our responsibility is to express an opinion on the Company’s consolidated financial statements based on our audits. We are a public accounting firm registered with the PCAOB and are required to be independent with respect to the Company in accordance with the U.S. federal securities laws and the applicable rules and regulations of the Securities and Exchange Commission and the PCAOB.
We conducted our audits in accordance with the standards of the PCAOB. Those standards require that we plan and perform the audit to obtain reasonable assurance about whether the consolidated financial statements are free of material misstatement, whether due to error or fraud. Our audits included performing procedures to assess the risks of material misstatement of the consolidated financial statements, whether due to error or fraud, and performing procedures that respond to those risks. Such procedures included examining, on a test basis, evidence regarding the amounts and disclosures in the consolidated financial statements. Our audits also included evaluating the accounting principles used and significant estimates made by management, as well as evaluating the overall presentation of the consolidated financial statements. We believe that our audits provide a reasonable basis for our opinion.
/s/ Deloitte & Touche LLP
Columbus, Ohio
February 22, 2019
We have served as the Company’s auditor since 1976.
53
M/I HOMES, INC. AND SUBSIDIARIES
CONSOLIDATED STATEMENTS OF INCOME
|
Year Ended
|
|||||||||||
|
(In thousands, except per share amounts)
|
2018
|
2017
|
2016
|
||||||||
|
Revenue
|
$
|
2,286,282
|
|
$
|
1,961,971
|
|
$
|
1,691,327
|
|
||
|
Costs and expenses:
|
|||||||||||
|
Land and housing
|
1,836,704
|
|
1,561,022
|
|
1,358,183
|
|
|||||
|
Impairment of inventory and investment in joint venture arrangements
|
5,809
|
|
7,681
|
|
3,992
|
|
|||||
|
General and administrative
|
137,779
|
|
126,282
|
|
111,600
|
|
|||||
|
Selling
|
142,829
|
|
128,327
|
|
108,809
|
|
|||||
|
Acquisition and integration costs
|
1,700
|
|
—
|
|
—
|
|
|||||
|
Equity in income from joint venture arrangements
|
(312
|
)
|
(539
|
)
|
(640
|
)
|
|||||
|
Interest
|
20,484
|
|
18,874
|
|
17,598
|
|
|||||
|
Total costs and expenses
|
$
|
2,144,993
|
|
$
|
1,841,647
|
|
$
|
1,599,542
|
|
||
|
Income before income taxes
|
141,289
|
|
120,324
|
|
91,785
|
|
|||||
|
Provision for income taxes
|
33,626
|
|
48,243
|
|
35,176
|
|
|||||
|
Net income
|
$
|
107,663
|
|
$
|
72,081
|
|
$
|
56,609
|
|
||
|
Preferred dividends
|
—
|
|
3,656
|
|
4,875
|
|
|||||
|
Excess of fair value over book value of preferred shares redeemed
|
—
|
|
2,257
|
|
—
|
|
|||||
|
Net income available to common shareholders
|
$
|
107,663
|
|
$
|
66,168
|
|
$
|
51,734
|
|
||
|
Earnings per common share:
|
|||||||||||
|
Basic
|
$
|
3.81
|
|
$
|
2.57
|
|
$
|
2.10
|
|
||
|
Diluted
|
$
|
3.70
|
|
$
|
2.26
|
|
$
|
1.84
|
|
||
|
Weighted average shares outstanding:
|
|||||||||||
|
Basic
|
28,234
|
|
25,769
|
|
24,666
|
|
|||||
|
Diluted
|
29,178
|
|
30,688
|
|
30,116
|
|
|||||
See Notes to Consolidated Financial Statements.
54
M/I HOMES, INC. AND SUBSIDIARIES
CONSOLIDATED BALANCE SHEETS
|
December 31,
|
||||||||
|
(Dollars in thousands, except par values)
|
2018
|
2017
|
||||||
|
ASSETS:
|
||||||||
|
Cash, cash equivalents and restricted cash
|
$
|
21,529
|
|
$
|
151,703
|
|
||
|
Mortgage loans held for sale
|
169,651
|
|
171,580
|
|
||||
|
Inventory
|
1,674,460
|
|
1,414,574
|
|
||||
|
Property and equipment - net
|
29,395
|
|
26,816
|
|
||||
|
Investment in joint venture arrangements
|
35,870
|
|
20,525
|
|
||||
|
Deferred income tax asset
|
13,482
|
|
18,438
|
|
||||
|
Goodwill
|
16,400
|
|
—
|
|
||||
|
Other assets
|
60,794
|
|
61,135
|
|
||||
|
TOTAL ASSETS
|
$
|
2,021,581
|
|
$
|
1,864,771
|
|
||
|
LIABILITIES AND SHAREHOLDERS’ EQUITY
|
||||||||
|
LIABILITIES:
|
||||||||
|
Accounts payable
|
$
|
131,511
|
|
$
|
117,233
|
|
||
|
Customer deposits
|
32,055
|
|
26,378
|
|
||||
|
Other liabilities
|
150,051
|
|
131,534
|
|
||||
|
Community development district obligations
|
12,392
|
|
13,049
|
|
||||
|
Obligation for consolidated inventory not owned
|
19,308
|
|
21,545
|
|
||||
|
Notes payable bank - homebuilding operations
|
117,400
|
|
—
|
|
||||
|
Notes payable bank - financial services operations
|
153,168
|
|
168,195
|
|
||||
|
Notes payable - other
|
5,938
|
|
10,576
|
|
||||
|
Convertible senior subordinated notes due 2018 - net
|
—
|
|
86,132
|
|
||||
|
Senior notes due 2021 - net
|
297,884
|
|
296,780
|
|
||||
|
Senior notes due 2025 - net
|
246,571
|
|
246,051
|
|
||||
|
TOTAL LIABILITIES
|
$
|
1,166,278
|
|
$
|
1,117,473
|
|
||
|
Commitments and contingencies (
Note 8
)
|
—
|
|
—
|
|
||||
|
SHAREHOLDERS’ EQUITY:
|
||||||||
|
Common shares - $.01 par value; authorized 58,000,000 shares at both December 31, 2018 and 2017; issued 30,137,141 and 29,508,626 shares at December 31, 2018 and 2017
|
301
|
|
295
|
|
||||
|
Additional paid-in capital
|
330,517
|
|
306,483
|
|
||||
|
Retained earnings
|
580,992
|
|
473,329
|
|
||||
|
Treasury shares - at cost - 2,620,923 and 1,651,874 shares at December 31, 2018 and 2017, respectively
|
(56,507
|
)
|
(32,809
|
)
|
||||
|
TOTAL SHAREHOLDERS’ EQUITY
|
$
|
855,303
|
|
$
|
747,298
|
|
||
|
TOTAL LIABILITIES AND SHAREHOLDERS’ EQUITY
|
$
|
2,021,581
|
|
$
|
1,864,771
|
|
||
See Notes to Consolidated Financial Statements.
55
M/I HOMES, INC. AND SUBSIDIARIES
CONSOLIDATED STATEMENT OF SHAREHOLDERS’ EQUITY
|
Preferred Shares
|
Common Shares
|
||||||||||||||||||||||||||||
|
Shares Outstanding
|
Shares Outstanding
|
Additional Paid-in Capital
|
Retained Earnings
|
Treasury Shares
|
Total Shareholders’ Equity
|
||||||||||||||||||||||||
|
(Dollars in thousands)
|
Amount
|
Amount
|
|||||||||||||||||||||||||||
|
Balance at December 31, 2015
|
2,000
|
|
$
|
48,163
|
|
24,649,044
|
|
$
|
271
|
|
$
|
241,239
|
|
$
|
355,427
|
|
$
|
(48,534
|
)
|
$
|
596,566
|
|
|||||||
|
Net income
|
—
|
|
—
|
|
—
|
|
—
|
|
—
|
|
56,609
|
|
—
|
|
56,609
|
|
|||||||||||||
|
Dividends declared to preferred shareholders
|
—
|
|
—
|
|
—
|
|
—
|
|
—
|
|
(4,875
|
)
|
—
|
|
(4,875
|
)
|
|||||||||||||
|
Stock options exercised
|
—
|
|
—
|
|
14,600
|
|
—
|
|
(108
|
)
|
—
|
|
290
|
|
182
|
|
|||||||||||||
|
Reversal of deferred tax asset related to stock options and executive deferred compensation distributions
|
—
|
|
—
|
|
—
|
|
—
|
|
269
|
|
—
|
|
—
|
|
269
|
|
|||||||||||||
|
Stock-based compensation expense
|
—
|
|
—
|
|
—
|
|
—
|
|
5,315
|
|
—
|
|
—
|
|
5,315
|
|
|||||||||||||
|
Deferral of executive and director compensation
|
—
|
|
—
|
|
—
|
|
—
|
|
108
|
|
—
|
|
—
|
|
108
|
|
|||||||||||||
|
Executive and director deferred compensation distributions
|
—
|
|
—
|
|
13,789
|
|
—
|
|
(274
|
)
|
—
|
|
274
|
|
—
|
|
|||||||||||||
|
Balance at December 31, 2016
|
2,000
|
|
$
|
48,163
|
|
24,677,433
|
|
$
|
271
|
|
$
|
246,549
|
|
$
|
407,161
|
|
$
|
(47,970
|
)
|
$
|
654,174
|
|
|||||||
|
Net income
|
—
|
|
—
|
|
—
|
|
—
|
|
—
|
|
72,081
|
|
—
|
|
72,081
|
|
|||||||||||||
|
Fair value over carrying value of preferred shares redeemed
|
—
|
|
2,257
|
|
—
|
|
—
|
|
—
|
|
(2,257
|
)
|
—
|
|
—
|
|
|||||||||||||
|
Dividends declared to preferred shareholders
|
—
|
|
—
|
|
—
|
|
—
|
|
—
|
|
(3,656
|
)
|
—
|
|
(3,656
|
)
|
|||||||||||||
|
Common share issuance
|
—
|
|
—
|
|
2,415,903
|
|
24
|
|
57,476
|
|
—
|
|
—
|
|
57,500
|
|
|||||||||||||
|
Preferred shares redeemed
|
(2,000
|
)
|
(50,420
|
)
|
—
|
|
—
|
|
—
|
|
—
|
|
—
|
|
(50,420
|
)
|
|||||||||||||
|
Stock options exercised
|
—
|
|
—
|
|
678,781
|
|
—
|
|
(2,255
|
)
|
—
|
|
13,480
|
|
11,225
|
|
|||||||||||||
|
Stock-based compensation expense
|
—
|
|
—
|
|
—
|
|
—
|
|
6,044
|
|
—
|
|
—
|
|
6,044
|
|
|||||||||||||
|
Deferral of executive and director compensation
|
—
|
|
—
|
|
—
|
|
—
|
|
350
|
|
—
|
|
—
|
|
350
|
|
|||||||||||||
|
Executive and director deferred compensation distributions
|
—
|
|
—
|
|
84,635
|
|
—
|
|
(1,681
|
)
|
—
|
|
1,681
|
|
—
|
|
|||||||||||||
|
Balance at December 31, 2017
|
—
|
|
$
|
—
|
|
27,856,752
|
|
$
|
295
|
|
$
|
306,483
|
|
$
|
473,329
|
|
$
|
(32,809
|
)
|
$
|
747,298
|
|
|||||||
|
Net income
|
—
|
|
—
|
|
—
|
|
—
|
|
—
|
|
107,663
|
|
—
|
|
107,663
|
|
|||||||||||||
|
Common share issuance for conversion of convertible notes
|
—
|
|
—
|
|
628,515
|
|
6
|
|
20,303
|
|
—
|
|
—
|
|
20,309
|
|
|||||||||||||
|
Repurchase of common shares
|
(1,069,043
|
)
|
—
|
|
—
|
|
(25,709
|
)
|
(25,709
|
)
|
|||||||||||||||||||
|
Stock options exercised
|
—
|
|
—
|
|
38,628
|
|
—
|
|
(254
|
)
|
—
|
|
792
|
|
538
|
|
|||||||||||||
|
Stock-based compensation expense
|
—
|
|
—
|
|
—
|
|
—
|
|
5,974
|
|
—
|
|
—
|
|
5,974
|
|
|||||||||||||
|
Deferral of executive and director compensation
|
—
|
|
—
|
|
—
|
|
—
|
|
185
|
|
—
|
|
—
|
|
185
|
|
|||||||||||||
|
Executive and director deferred compensation distributions
|
—
|
|
—
|
|
61,366
|
|
—
|
|
(2,174
|
)
|
—
|
|
1,219
|
|
(955
|
)
|
|||||||||||||
|
Balance at December 31, 2018
|
—
|
|
$
|
—
|
|
27,516,218
|
|
$
|
301
|
|
$
|
330,517
|
|
$
|
580,992
|
|
$
|
(56,507
|
)
|
$
|
855,303
|
|
|||||||
See Notes to Consolidated Financial Statements.
56
M/I HOMES, INC. AND SUBSIDIARIES
CONSOLIDATED STATEMENTS OF CASH FLOWS
|
Year Ended December 31,
|
|||||||||||
|
(Dollars in thousands)
|
2018
|
2017
|
2016
|
||||||||
|
OPERATING ACTIVITIES:
|
|||||||||||
|
Net income
|
$
|
107,663
|
|
$
|
72,081
|
|
$
|
56,609
|
|
||
|
Adjustments to reconcile net income to net cash (used in) provided by operating activities:
|
|||||||||||
|
Inventory valuation adjustments and abandoned land transaction write-offs
|
5,809
|
|
7,681
|
|
3,992
|
|
|||||
|
Equity in income from joint venture arrangements
|
(312
|
)
|
(539
|
)
|
(640
|
)
|
|||||
|
Mortgage loan originations
|
(1,200,474
|
)
|
(1,078,520
|
)
|
(969,690
|
)
|
|||||
|
Proceeds from the sale of mortgage loans
|
1,206,167
|
|
1,064,635
|
|
939,080
|
|
|||||
|
Fair value adjustment of mortgage loans held for sale
|
(3,764
|
)
|
(3,675
|
)
|
3,591
|
|
|||||
|
Capitalization of originated mortgage servicing rights
|
(4,550
|
)
|
(5,005
|
)
|
(5,569
|
)
|
|||||
|
Amortization of mortgage servicing rights
|
784
|
|
1,069
|
|
1,652
|
|
|||||
|
Gain on sale of mortgage servicing rights
|
(1,224
|
)
|
(654
|
)
|
—
|
|
|||||
|
Depreciation
|
10,956
|
|
9,630
|
|
8,552
|
|
|||||
|
Amortization of debt discount and debt issue costs
|
2,791
|
|
3,475
|
|
3,402
|
|
|||||
|
Stock-based compensation expense
|
5,974
|
|
6,044
|
|
5,315
|
|
|||||
|
Deferred income tax expense
|
4,957
|
|
12,437
|
|
31,311
|
|
|||||
|
Change in assets and liabilities:
|
|||||||||||
|
Inventory
|
(157,573
|
)
|
(168,622
|
)
|
(83,775
|
)
|
|||||
|
Other assets
|
2,044
|
|
(186
|
)
|
(13,643
|
)
|
|||||
|
Accounts payable
|
3,750
|
|
14,021
|
|
16,334
|
|
|||||
|
Customer deposits
|
1,521
|
|
4,222
|
|
2,589
|
|
|||||
|
Accrued compensation
|
3,486
|
|
2,338
|
|
4,853
|
|
|||||
|
Other liabilities
|
9,403
|
|
6,384
|
|
30,234
|
|
|||||
|
Net cash (used in) provided by operating activities
|
(2,592
|
)
|
(53,184
|
)
|
34,197
|
|
|||||
|
INVESTING ACTIVITIES:
|
|||||||||||
|
Purchase of property and equipment
|
(8,141
|
)
|
(8,799
|
)
|
(13,106
|
)
|
|||||
|
Acquisition
|
(100,960
|
)
|
—
|
|
—
|
|
|||||
|
Return of capital from joint venture arrangements
|
676
|
|
3,518
|
|
3,207
|
|
|||||
|
Investment in joint venture arrangements
|
(31,867
|
)
|
(12,088
|
)
|
(21,746
|
)
|
|||||
|
Proceeds from sale of mortgage servicing rights
|
6,335
|
|
8,212
|
|
—
|
|
|||||
|
Net cash used in investing activities
|
(133,957
|
)
|
(9,157
|
)
|
(31,645
|
)
|
|||||
|
FINANCING ACTIVITIES:
|
|||||||||||
|
Net proceeds from issuance of senior notes
|
—
|
|
250,000
|
|
—
|
|
|||||
|
Repayment of convertible senior subordinated notes
|
(65,941
|
)
|
—
|
|
—
|
|
|||||
|
Proceeds from bank borrowings - homebuilding operations
|
666,600
|
|
398,300
|
|
351,500
|
|
|||||
|
Repayment of bank borrowings - homebuilding operations
|
(549,200
|
)
|
(438,600
|
)
|
(355,000
|
)
|
|||||
|
(Net repayment of) net proceeds from bank borrowings - financial services operations
|
(15,027
|
)
|
15,300
|
|
29,247
|
|
|||||
|
(Principal repayment of) proceeds from notes payable-other and community development
district bond obligations
|
(4,638
|
)
|
4,161
|
|
(2,026
|
)
|
|||||
|
Redemption of preferred shares
|
—
|
|
(50,420
|
)
|
—
|
|
|||||
|
Dividends paid on preferred shares
|
—
|
|
(3,656
|
)
|
(4,875
|
)
|
|||||
|
Repurchase of common shares
|
(25,709
|
)
|
—
|
|
—
|
|
|||||
|
Debt issue costs
|
(248
|
)
|
(6,707
|
)
|
(240
|
)
|
|||||
|
Proceeds from exercise of stock options
|
538
|
|
11,225
|
|
182
|
|
|||||
|
Net cash provided by financing activities
|
6,375
|
|
179,603
|
|
18,788
|
|
|||||
|
Net (decrease) increase in cash, cash equivalents and restricted cash
|
(130,174
|
)
|
117,262
|
|
21,340
|
|
|||||
|
Cash, cash equivalents and restricted cash balance at beginning of period
|
151,703
|
|
34,441
|
|
13,101
|
|
|||||
|
Cash, cash equivalents and restricted cash balance at end of period
|
$
|
21,529
|
|
$
|
151,703
|
|
$
|
34,441
|
|
||
|
SUPPLEMENTAL DISCLOSURE OF CASH FLOW INFORMATION:
|
|||||||||||
|
Cash paid during the year for:
|
|||||||||||
|
Interest — net of amount capitalized
|
$
|
17,793
|
|
$
|
10,168
|
|
$
|
6,597
|
|
||
|
Income taxes
|
$
|
25,279
|
|
$
|
36,802
|
|
$
|
2,271
|
|
||
|
NON-CASH TRANSACTIONS DURING THE PERIOD:
|
|||||||||||
|
Community development district infrastructure
|
$
|
(657
|
)
|
$
|
12,573
|
|
$
|
(542
|
)
|
||
|
Consolidated inventory not owned
|
$
|
(2,237
|
)
|
$
|
14,017
|
|
$
|
1,521
|
|
||
|
Distribution of single-family lots from joint venture arrangements
|
$
|
16,158
|
|
$
|
16,600
|
|
$
|
28,130
|
|
||
|
Common stock issued for conversion of convertible notes
|
$
|
20,309
|
|
$
|
57,500
|
|
$
|
—
|
|
||
See Notes to Consolidated Financial Statements.
57
M/I HOMES, INC. AND SUBSIDIARIES
NOTES TO CONSOLIDATED FINANCIAL STATEMENTS
NOTE 1. Summary of Significant Accounting Policies
Business.
M/I Homes, Inc. and its subsidiaries (the “Company” or “we”) is engaged primarily in the construction and sale of single-family residential homes in Columbus and Cincinnati, Ohio; Indianapolis, Indiana; Chicago, Illinois; Minneapolis/St. Paul, Minnesota; Detroit, Michigan; Tampa, Orlando and Sarasota, Florida; Austin, Dallas/Fort Worth, Houston and San Antonio, Texas; Charlotte and Raleigh, North Carolina; and the Virginia and Maryland suburbs of Washington, D.C. The Company designs, sells and builds single-family homes on developed lots, which it develops or purchases ready for home construction. The Company also purchases undeveloped land to develop into developed lots for future construction of single-family homes and, on a limited basis, for sale to others. Our homebuilding operations operate across three geographic regions in the United States. Within these regions, our operations have similar economic characteristics; therefore, they have been aggregated into three reportable homebuilding segments: Midwest homebuilding, Southern homebuilding and Mid-Atlantic homebuilding.
The Company conducts mortgage financing activities through its 100%-owned subsidiary, M/I Financial, LLC (“M/I Financial”), which originates mortgage loans primarily for purchasers of the Company’s homes. The loans and the servicing rights are generally sold to outside mortgage lenders. The Company and M/I Financial also operate 100% and majority-owned subsidiaries that provide title services to purchasers of the Company’s homes. Our mortgage banking and title service activities have similar economic characteristics; therefore, they have been aggregated into one reportable segment, the financial services segment.
Basis of Presentation.
The accompanying consolidated financial statements have been prepared in accordance with accounting principles generally accepted in the United States (“GAAP”) and include the accounts of M/I Homes, Inc. and those of our consolidated subsidiaries, partnerships and other entities in which we have a controlling financial interest, and of variable interest entities in which we are deemed the primary beneficiary. Intercompany balances and transactions have been eliminated in consolidation. The preparation of financial statements in conformity with GAAP requires management to make estimates and assumptions that affect the reported amounts of assets and liabilities and disclosure of contingent assets and liabilities at the date of the consolidated financial statements and the reported amounts of revenues and expenses during the reporting period. Actual results could differ from those estimates.
Cash, Cash Equivalents and Restricted Cash.
Cash and cash equivalents are liquid investments with an initial maturity of three months or less. Amounts in transit from title companies for homes delivered are included in this balance at
December 31, 2018 and 2017
, respectively.
Restricted cash consists of amounts held in restricted accounts as collateral for letters of credit as well as cash held in escrow. Cash, Cash Equivalents and Restricted Cash includes restricted cash balances of
$0.7 million
and
$1.0 million
at
December 31, 2018 and 2017
, respectively.
Mortgage Loans Held for Sale.
Mortgage loans held for sale consists primarily of single-family residential loans collateralized by the underlying property. Generally, all of the mortgage loans and related servicing rights are sold to third-party investors shortly after origination. Refer to the Revenue Recognition policy described below for additional discussion.
Inventory.
Inventory includes the costs of land acquisition, land development and home construction, capitalized interest, real estate taxes, direct overhead costs incurred during development and home construction, and common costs that benefit the entire community, less impairments, if any. Land acquisition, land development and common costs (both incurred and estimated to be incurred) are typically allocated to individual lots based on the total number of lots expected to be closed in each community or phase, or based on the relative fair value, the relative sales value or the front footage method of each lot. Any changes to the estimated total development costs of a community or phase are allocated proportionately to homes remaining in the community or phase and homes previously closed. The cost of individual lots is transferred to homes under construction when home construction begins. Home construction costs are accumulated on a specific identification basis. Costs of home deliveries include the specific construction cost of the home and the allocated lot costs. Such costs are charged to cost of sales simultaneously with revenue recognition, as discussed above. When a home is closed, we typically have not yet paid all incurred costs necessary to complete the home. As homes close, we compare the home construction budget to actual recorded costs to date to estimate the additional costs to be incurred from our subcontractors related to the home. We record a liability and a corresponding charge to cost of sales for the amount we estimate will ultimately be paid related to that home. We monitor the accuracy of such estimates by comparing actual costs incurred in subsequent months to the estimate, although actual costs to complete a home in the future could differ from our estimates.
Inventory is recorded at cost, unless events and circumstances indicate that the carrying value of the land is impaired, at which point the inventory is written down to fair value as required by the Financial Accounting Standards Board (“FASB”) Accounting
58
Standards Codification (“ASC”) 360-10,
Property, Plant and Equipment
(“ASC 360”). The Company assesses inventory for recoverability on a quarterly basis to determine if events or changes in local or national economic conditions indicate that the carrying amount of an asset may not be recoverable. In conducting our quarterly review for indicators of impairment on a community level, we evaluate, among other things, margins on sales contracts in backlog, the margins on homes that have been delivered, expected changes in margins with regard to future home sales over the life of the community, expected changes in margins with regard to future land sales, the value of the land itself as well as any results from third party appraisals. We pay particular attention to communities in which inventory is moving at a slower than anticipated absorption pace, and communities whose average sales price and/or margins are trending downward and are anticipated to continue to trend downward. We also evaluate communities where management intends to lower the sales price or offer incentives in order to improve absorptions even if the community’s historical results do not indicate a potential for impairment. From the review of all of these factors, we identify communities whose carrying values may exceed their estimated undiscounted future cash flows and run a test for recoverability. For those communities whose carrying values exceed the estimated undiscounted future cash flows and which are deemed to be impaired, the impairment recognized is measured by the amount by which the carrying amount of the communities exceeds the estimated fair value. Due to the fact that the Company’s cash flow models and estimates of fair values are based upon management estimates and assumptions, unexpected changes in market conditions and/or changes in management’s intentions with respect to the inventory may lead the Company to incur additional impairment charges in the future.
Our determination of fair value is based on projections and estimates, which are Level 3 measurement inputs. Because each inventory asset is unique, there are numerous inputs and assumptions used in our valuation techniques, including estimated average selling price, construction and development costs, absorption pace (reflecting any product mix change strategies implemented or to be implemented), selling strategies, alternative land uses (including disposition of all or a portion of the land owned), or discount rates, which could materially impact future cash flow and fair value estimates.
As of
December 31, 2018
, our projections generally assume a gradual improvement in market conditions over time. If communities are not recoverable based on estimated future undiscounted cash flows, the impairment to be recognized is measured as the amount by which the carrying amount of the assets exceeds the estimated fair value of the assets. The fair value of a community is estimated by discounting management’s cash flow projections using an appropriate risk-adjusted interest rate. As of both
December 31, 2018
and
December 31, 2017
, we utilized discount rates ranging from
13%
to
16%
in our valuations. The discount rate used in determining each asset’s estimated fair value reflects the inherent risks associated with the related estimated cash flow stream, as well as current risk-free rates available in the market and estimated market risk premiums. For example, construction in progress inventory, which is closer to completion, will generally require a lower discount rate than land under development in communities consisting of multiple phases spanning several years of development.
Our quarterly assessments reflect management’s best estimates. Due to the inherent uncertainties in management’s estimates and uncertainties related to our operations and our industry as a whole, we are unable to determine at this time if and to what extent continuing future impairments will occur. Additionally, due to the volume of possible outcomes that can be generated from changes in the various model inputs for each community, we do not believe it is possible to create a sensitivity analysis that can provide meaningful information for the users of our consolidated financial statements. Further details relating to our assessment of inventory for recoverability are included in
Note 3
to our Consolidated Financial Statements.
Capitalized Interest.
The Company capitalizes interest during land development and home construction. Capitalized interest is charged to cost of sales as the related inventory is delivered to a third party. The summary of capitalized interest for the
years ended December 31, 2018, 2017 and 2016
is as follows:
|
Year Ended December 31,
|
|||||||||||
|
(In thousands)
|
2018
|
2017
|
2016
|
||||||||
|
Capitalized interest, beginning of period
|
$
|
17,169
|
|
$
|
16,012
|
|
$
|
16,740
|
|
||
|
Interest capitalized to inventory
|
29,053
|
|
21,484
|
|
17,685
|
|
|||||
|
Capitalized interest charged to cost of sales
|
(25,457
|
)
|
(20,327
|
)
|
(18,413
|
)
|
|||||
|
Capitalized interest, end of year
|
$
|
20,765
|
|
$
|
17,169
|
|
$
|
16,012
|
|
||
|
Interest incurred
|
$
|
49,537
|
|
$
|
40,358
|
|
$
|
35,283
|
|
||
Investment in Joint Venture Arrangements.
In order to minimize our investment and risk of land exposure in a single location, we have periodically partnered with other land developers or homebuilders to share in the land investment and development of a property through joint ownership and development agreements, joint ventures, and other similar arrangements. During
2018
, we increased our total investment in such joint venture arrangements by
$15.4 million
from
$20.5 million
at
December 31, 2017
to
$35.9 million
at
December 31, 2018
, which was driven primarily by our cash contributions to our joint venture arrangements during
2018
of
$31.9 million
, offset, in part, by our lot distributions from our joint venture arrangements during
2018
of
$16.2 million
.
59
We believe that the Company’s maximum exposure related to its investment in these joint venture arrangements as of
December 31, 2018
is the amount invested of
$35.9 million
, which is reported as Investment in Joint Venture Arrangements on our Consolidated Balance Sheets, although we expect to invest further amounts in these joint venture arrangements as development of the properties progresses. Further details relating to our joint venture arrangements are included in
Note 6
to our Consolidated Financial Statements.
We use the equity method of accounting for investments in joint venture arrangements over which we exercise significant influence but do not have a controlling interest. Under the equity method, our share of the joint venture arrangements’ earnings or loss, if any, is included in our Consolidated Statements of Income. The Company assesses its investments in joint venture arrangements for recoverability on a quarterly basis in accordance with ASC 323,
Investments - Equity Method and Joint Ventures
(“ASC 323”)
as described below.
If the fair value of the investment is less than the investment’s carrying value, and the Company has determined that the decline in value is other than temporary, the Company would write down the value of the investment to its estimated fair value. The determination of whether an investment’s fair value is less than the carrying value requires management to make certain assumptions regarding the amount and timing of future contributions to the joint venture arrangements, the timing of distribution of lots to the Company from the joint venture arrangements, the projected fair value of the lots at the time of distribution to the Company, and the estimated proceeds from, and timing of, the sale of land or lots to third parties. In determining the fair value of investments in joint venture arrangements, the Company evaluates the projected cash flows associated with each joint venture arrangement.
As of both
December 31, 2018
and
December 31, 2017
, the Company used a discount rate of
16%
in determining the fair value of investments in joint venture arrangements. In addition to the assumptions management must make to determine if the investment’s fair value is less than the carrying value, management must also use judgment in determining whether the impairment is other than temporary. The factors management considers are: (1) the length of time and the extent to which the market value has been less than cost; (2) the financial condition and near-term prospects of the joint venture arrangement; and (3) the intent and ability of the Company to retain its investment in the joint venture arrangements for a period of time sufficient to allow for any anticipated recovery in market value. Due to uncertainties in the estimation process and the significant volatility in demand for new housing, actual results could differ significantly from such estimates.
For joint venture arrangements where a special purpose entity is established to own the property, we generally enter into limited liability company or similar arrangements (“LLCs”) with the other partners. The Company’s ownership in these LLCs as of both
December 31, 2018
and
December 31, 2017
ranged from
25%
to
97%
. These entities typically engage in land development activities for the purpose of distributing or selling developed lots to the Company and its partners in the LLC.
Variable Interest Entities.
With respect to our investments in LLCs, we are required, under ASC 810-10,
Consolidation
(“ASC 810”), to evaluate whether or not such entities should be consolidated into our consolidated financial statements. We initially perform these evaluations when each new entity is created and upon any events that require reconsideration of the entity. In order to determine if we should consolidate an LLC, we determine (1) if the LLC is a variable interest entity (“VIE”) and (2) if we are the primary beneficiary of the entity. To determine whether we are the primary beneficiary of an entity, we consider whether we have the ability to control the activities of the VIE that most significantly impact its economic performance. This analysis considers, among other things, whether we have: the ability to determine the budget and scope of land development work, if any; the ability to control financing decisions for the VIE; the ability to acquire additional land into the VIE or dispose of land in the VIE not under contract with M/I Homes; and the ability to change or amend the existing option contract with the VIE. If we determine that we are not able to control such activities, we are not considered the primary beneficiary of the VIE. As of December 31, 2018 and December 31, 2017, we have determined that no LLC in which we have an interest met the requirements of a VIE.
Land Option Agreements.
In the ordinary course of business, the Company enters into land option or purchase agreements for which we generally pay non-refundable deposits. Pursuant to these land option agreements, the Company provides a deposit to the seller as consideration for the right to purchase land at different times in the future, usually at predetermined prices. In accordance with ASC 810, we analyze our land option or purchase agreements to determine whether the corresponding land sellers are VIEs and, if so, whether we are the primary beneficiary, using an analysis similar to that described above. Although we do not have legal title to the optioned land, ASC 810 requires a company to consolidate a VIE if the company is determined to be the primary beneficiary. In cases where we are the primary beneficiary, even though we do not have title to such land, we are required to consolidate these purchase/option agreements and reflect such assets and liabilities as Consolidated Inventory not Owned in our Consolidated Balance Sheets. At both
December 31, 2018 and 2017
, we have concluded that we were not the primary beneficiary of any VIEs from which we are purchasing land under option or purchase agreements.
In addition, we evaluate our land option or purchase agreements to determine for each contract if (1) a portion or all of the purchase price is a specific performance requirement, or (2) the amount of deposits and prepaid acquisition and development costs exceed
60
certain thresholds relative to the remaining purchase price of the lots. If either is the case, then the remaining purchase price of the lots (or the specific performance amount, if applicable) is recorded as an asset and liability in Consolidated Inventory Not Owned (as further described below) on our Consolidated Balance Sheets.
Other than as described below in “Consolidated Inventory Not Owned,” the Company currently believes that its maximum exposure as of
December 31, 2018
related to our land option agreements is equal to the amount of the Company’s outstanding deposits and prepaid acquisition costs, which totaled
$55.0 million
, including cash deposits of
$33.7 million
, prepaid acquisition costs of
$7.9 million
, letters of credit of
$9.9 million
and
$3.5 million
of other non-cash deposits.
Consolidated Inventory Not Owned and Related Obligation
.
At
December 31, 2018
and
December 31, 2017
, Consolidated Inventory Not Owned was
$19.3 million
and
$21.5 million
, respectively. At
December 31, 2018 and 2017
, the corresponding liability of
$19.3 million
and
$21.5 million
, respectively, has been classified as Obligation for Consolidated Inventory Not Owned on the Consolidated Balance Sheets. The decrease in this balance from
December 31, 2017
is related primarily to a decrease in the number of land purchase agreements that had deposits and prepaid acquisition and development costs that exceeded certain thresholds resulting in the remaining purchase price of the lots to be recorded in inventory not owned, partially offset by an increase in the aggregate purchase amount of land contracts with specific performance requirements.
Property and Equipment-net.
The Company records property and equipment at cost and subsequently depreciates the assets using both straight-line and accelerated methods. Following are the major classes of depreciable assets and their estimated useful lives:
|
|
Year Ended December 31,
|
||||||
|
(In thousands)
|
2018
|
2017
|
|||||
|
Land, building and improvements
|
$
|
11,824
|
|
(a)
|
$
|
11,823
|
|
|
Office furnishings, leasehold improvements, computer equipment and computer software
|
29,920
|
|
30,409
|
|
|||
|
Transportation and construction equipment
|
10,064
|
|
10,067
|
|
|||
|
Property and equipment
|
51,808
|
|
52,299
|
|
|||
|
Accumulated depreciation
|
(22,413
|
)
|
(25,483
|
)
|
|||
|
Property and equipment, net
|
$
|
29,395
|
|
$
|
26,816
|
|
|
|
(a)
|
Includes the Company’s home office building in Columbus, Ohio that met the sale classification criteria for the period ended September 30, 2018 as it was being actively marketed. The carrying value of the building as of
December 31, 2018
was
$5.6 million
. The Company measures assets held for sale at fair value on a nonrecurring basis and records impairment charges when the assets are deemed to be impaired. Assets held for sale are reported at the lower of cost or fair value. Costs to sell are accrued separately. The Company estimated the fair value of the building using the market values for similar properties, and the building was considered a Level 2 asset as defined in ASC 820, “Fair Value Measurements.” During the twelve months ended
December 31, 2018
, the Company did not record any impairment charges on its asset held for sale.
|
|
|
Estimated Useful Lives
|
|
Building and improvements
|
35 years
|
|
Office furnishings, leasehold improvements, computer equipment and computer software
|
3-7 years
|
|
Transportation and construction equipment
|
5-25 years
|
Depreciation expense was
$5.6 million
,
$4.1 million
and
$3.6 million
in
2018, 2017 and 2016
, respectively.
Goodwill.
Goodwill represents the excess of the purchase price paid over the fair value of the net assets acquired and liabilities assumed in business combinations. As a result of the Company’s acquisition of the homebuilding assets and operations of Pinnacle Homes in Detroit, Michigan on March 1, 2018, the Company recorded goodwill of
$16.4 million
as of
December 31, 2018
, which is included as Goodwill in our Consolidated Balance Sheets. This amount was based on the estimated fair values of the acquired assets and assumed liabilities at the date of the acquisition in accordance with ASC 350,
Intangibles, Goodwill and Other
(“ASC 350”). Please see
Note 12
to the Company’s Consolidated Financial Statements for further discussion.
In January 2017, the FASB issued ASU 2017-04,
Simplifying the Test for Goodwill Impairment
(“ASU 2017-04”), which eliminates Step 2 from the goodwill impairment test in order to simplify the subsequent measurement of goodwill. Step 2 measures a goodwill impairment loss by comparing the implied fair value of a reporting unit’s goodwill with the carrying amount of that goodwill. As a result of ASU 2017-04, the Company will apply a one-step quantitative test and record the amount of goodwill impairment as the excess of a reporting unit’s carrying amount over its fair value, not to exceed the total amount of goodwill allocated to the reporting unit. ASU 2017-04 is effective beginning January 1, 2020, with early adoption permitted, and applied prospectively. The Company elected to early adopt this ASU effective for the fiscal year ended December 31, 2018 in its impairment testing and analyses. The adoption of ASU 2017-04 on January 1, 2018 did not have an impact on the Company’s consolidated financial statements and disclosures. The Company performed its annual goodwill impairment analysis during the fourth quarter of 2018, and as no indicators for impairment existed at
December 31, 2018
, no impairment was recorded.
61
In accordance with ASC 350, the Company analyzes goodwill for impairment on an annual basis (or more often if indicators of impairment exist). The Company performs a qualitative assessment to determine whether the existence of events or circumstances leads to a determination that it is more-likely-than-not that the fair value of a reporting unit is less than its carrying amount. When performing a qualitative assessment, the Company evaluates qualitative factors such as (1) macroeconomic conditions, such as a deterioration in general economic conditions; (2) industry and market considerations, such as deterioration in the environment in which the entity operates; (3) cost factors, such as increases in raw materials and labor costs; and (4) overall financial performance, such as negative or declining cash flows or a decline in actual or planned revenue or earnings, to determine if it is more-likely-than-not that the fair value of the reporting unit is less than its carrying amount. If the qualitative assessment indicates that it is more-likely-than-not that the fair value of the reporting unit is less than its carrying amount, then a quantitative assessment is performed to determine the reporting unit’s fair value. If the reporting unit’s carrying value exceeds its fair value, then an impairment loss is recognized for the amount of the excess of the carrying amount over the reporting unit’s fair value.
The evaluation of goodwill for possible impairment includes estimating fair value using one or a combination of valuation techniques, such as discounted cash flows. These valuations require the Company to make estimates and assumptions regarding future operating results, cash flows, changes in capital expenditures, selling prices, profitability, and the cost of capital. Although the Company believes its assumptions and estimates are reasonable, deviations from the assumptions and estimates could produce a materially different result.
Other Assets.
Other assets at
December 31, 2018 and 2017
consisted of the following:.
|
|
Year Ended December 31,
|
||||||
|
(In thousands)
|
2018
|
2017
|
|||||
|
Development reimbursement receivable from local municipalities
|
$
|
13,632
|
|
$
|
14,981
|
|
|
|
Mortgage servicing rights
|
6,477
|
|
7,821
|
|
|||
|
Prepaid expenses
|
8,605
|
|
9,022
|
|
|||
|
Prepaid acquisition costs
|
7,873
|
|
5,634
|
|
|||
|
Other
|
24,207
|
|
23,677
|
|
|||
|
Total other assets
|
$
|
60,794
|
|
$
|
61,135
|
|
|
Warranty Reserves.
We use subcontractors for nearly all aspects of home construction. Although our subcontractors are generally required to repair and replace any product or labor defects, we are, during applicable warranty periods, ultimately responsible to the homeowner for making such repairs. As such, we record warranty reserves to cover our exposure to the costs for materials and labor not expected to be covered by our subcontractors to the extent they relate to warranty-type claims. Warranty reserves are established by charging cost of sales and crediting a warranty reserve for each home delivered. The amounts charged are estimated by management to be adequate to cover expected warranty-related costs (as described further in
Note 8
to our Consolidated Financial Statements) under the Company’s warranty programs. Warranty reserves are recorded for warranties under our Home Builder’s Limited Warranty (“HBLW”) and our 30-year (offered on all homes sold after April 25, 1998 and on or before December 1, 2015 in all of our markets except our Texas markets), 15-year (offered on all homes sold after December 1, 2015 in all of our markets except our Texas markets) and 10-year (offered on all homes sold in our Texas markets) transferable structural warranty.
The warranty reserves for the HBLW are established as a percentage of average sales price and adjusted based on historical payment patterns determined, generally, by geographic area and recent trends. Factors that are given consideration in determining the HBLW reserves include: (1) the historical range of amounts paid per average sales price on a home; (2) type and mix of amenity packages added to the home; (3) any warranty expenditures not considered to be normal and recurring; (4) timing of payments; (5) improvements in quality of construction expected to impact future warranty expenditures; and (6) conditions that may affect certain projects and require a different percentage of average sales price for those specific projects. Changes in estimates for warranties occur due to changes in the historical payment experience and differences between the actual payment pattern experienced during the period and the historical payment pattern used in our evaluation of the warranty reserve balance at the end of each quarter. Actual future warranty costs could differ from our current estimated amount.
Our warranty reserves for our transferable structural warranty programs are established on a per-unit basis. While the structural warranty reserve is recorded as each home is delivered, the sufficiency of the structural warranty per unit charge and total reserve is re-evaluated on an annual basis, with the assistance of an actuary, using our own historical data and trends, industry-wide historical data and trends, and other project specific factors. The reserves are also evaluated quarterly and adjusted if we encounter activity that is inconsistent with the historical experience used in the annual analysis. These reserves are subject to variability due to uncertainties regarding structural defect claims for products we build, the markets in which we build, claim settlement history, insurance and legal interpretations, among other factors.
62
Our warranty reserve amounts are based upon historical experience and geographic location. While we believe that our warranty reserves are sufficient to cover our projected costs, there can be no assurances that historical data and trends will accurately predict our actual warranty costs. At
December 31, 2018 and 2017
, warranty reserves of
$26.5 million
and
$26.1 million
, respectively, are included in Other Liabilities on the Consolidated Balance Sheets. Please see
Note 8
to our Consolidated Financial Statements for additional information related to our warranty reserves, including reserves related to stucco-related repairs in certain of our Florida communities.
Self-insurance Reserves.
Self-insurance reserves are made for estimated liabilities associated with employee health care, workers’ compensation, and general liability insurance. For
2018
, our self-insurance limit for employee health care was
$250,000
per covered person per contract period, with stop loss insurance covering amounts in excess of
$250,000
. In 2019, our stop loss insurance will now cover amounts in excess of
$275,000
. Our workers’ compensation claims are insured by a third party and carry a deductible of
$250,000
per claim, except for workers compensation claims made in the State of Ohio where the Company is self-insured. Our self-insurance limit for Ohio workers’ compensation is
$500,000
per claim, with stop loss insurance covering all amounts in excess of this limit. The reserves related to employee health care and workers’ compensation are based on historical experience and open case reserves. Our general liability claims are insured by a third party, subject to a deductible. Effective for home closings occurring on or after July 1, 2017, the Company renewed its general liability insurance coverage which, among other things, changed the structure of our completed operations/construction defect deductible to
$10.0 million
for the Company (for closings prior to July 1, 2017, our completed operations/construction defect deductible was
$7.5 million
for each of our regions) and decreased our third party bodily injury and property damage claims deductible to
$250,000
(a decrease from
$500,000
for closings prior to July 1, 2017). The Company records a reserve for general liability claims falling below the Company’s deductible. The reserve estimate is based on an actuarial evaluation of our past history of general liability claims, other industry specific factors and specific event analysis. At
December 31, 2018 and 2017
, self-insurance reserves of
$2.7 million
and
$2.4 million
, respectively, are included in Other Liabilities on the Consolidated Balance Sheets. The Company recorded expenses totaling
$9.2 million
,
$8.9 million
and
$6.5 million
for all self-insured and general liability claims during the
years ended December 31, 2018, 2017 and 2016
, respectively.
Guarantees and Indemnities.
Guarantee and indemnity liabilities are established by charging the applicable income statement or balance sheet line, depending on the nature of the guarantee or indemnity, and crediting a liability. M/I Financial provides a limited-life guarantee on loans sold to certain third parties and estimates its actual liability related to the guarantee and any indemnities subsequently provided to the purchaser of the loans in lieu of loan repurchase based on historical loss experience. Actual future costs associated with loans guaranteed or indemnified could differ materially from our current estimated amounts. The Company has also provided certain other guarantees and indemnities in connection with the purchase and development of land, including environmental indemnities, and guarantees of the completion of land development. The Company estimates these liabilities based on the estimated cost of insurance coverage or estimated cost of acquiring a bond in the amount of the exposure. Actual future costs associated with these guarantees and indemnities could differ materially from our current estimated amounts. At
December 31, 2018 and 2017
, guarantees and indemnities of
$0.7 million
and
$1.0 million
, respectively, are included in Other Liabilities on the Consolidated Balance Sheets.
Other Liabilities.
Other liabilities at
December 31, 2018 and 2017
consisted of the following:
|
|
Year Ended December 31,
|
||||||
|
(In thousands)
|
2018
|
2017
|
|||||
|
Accruals related to land development
|
$
|
46,073
|
|
$
|
37,180
|
|
|
|
Warranty
|
26,459
|
|
26,133
|
|
|||
|
Payroll and other benefits
|
31,428
|
|
28,128
|
|
|||
|
Other
|
46,091
|
|
40,093
|
|
|||
|
Total other liabilities
|
$
|
150,051
|
|
$
|
131,534
|
|
|
Segment Reporting.
The application of segment reporting requires significant judgment in determining our operating segments. Operating segments are defined as a component of an enterprise for which discrete financial information is available and is reviewed regularly by the Company’s chief operating decision makers to evaluate performance, make operating decisions and determine how to allocate resources. The Company’s chief operating decision makers evaluate the Company’s performance in various ways, including: (1) the results of our
16
individual homebuilding operating segments and the results of our financial services operations; (2) the results of our three homebuilding regions; and (3) our consolidated financial results.
In accordance with ASC 280,
Segment Reporting
(“ASC 280”), we have identified each homebuilding division as an operating segment because each homebuilding division engages in business activities from which it earns revenue, primarily from the sale and construction of single-family attached and detached homes, acquisition and development of land, and the occasional sale of lots to third parties. Our financial services operations generate revenue primarily from the origination, sale and servicing of mortgage loans and title services primarily for purchasers of the Company’s homes and are included in our financial services
63
reportable segment. Corporate is a non-operating segment that develops and implements strategic initiatives and supports our operating segments by centralizing key administrative functions such as accounting, finance, treasury, information technology, insurance and risk management, litigation, marketing and human resources.
In accordance with the aggregation criteria defined in ASC 280, we have determined our reportable segments as follows: Midwest homebuilding, Southern homebuilding, Mid-Atlantic homebuilding and financial services operations. The homebuilding operating segments included in each reportable segment have been aggregated because they share similar aggregation characteristics as prescribed in ASC 280 in the following regards: (1) long-term economic characteristics; (2) historical and expected future long-term gross margin percentages; (3) housing products, production processes and methods of distribution; and (4) geographical proximity. We may, however, be required to reclassify our reportable segments if markets that currently are being aggregated do not continue to share these aggregation characteristics.
Revenue Recognition.
On January 1, 2018, we adopted ASC 606,
Revenue from Contracts from Customers
(“ASC 606”),
using the modified retrospective transition method, which includes a cumulative catch-up in retained earnings on the initial date of adoption for existing contracts (those contracts under which obligations have not been completed) as of, and new contracts after, January 1, 2018. Results for reporting periods beginning after January 1, 2018 are presented under ASC 606, while prior period amounts are not adjusted and continue to be reported in accordance with our historic accounting under ASC 605,
Revenue Recognition
(“ASC 605”)
.
We did not have any material adjustments to our 2018 results under ASC 606.
Revenue from the sale of a home and revenue from the sale of land to third parties are recognized in the financial statements on the date of closing (point in time) if delivery has occurred, title has passed, all performance obligations have been met (see definition of performance obligations below), and control of the home or land is transferred to the buyer in an amount that reflects the consideration we expect to be entitled to in exchange for the home or land.
We recognize the majority of the revenue associated with our mortgage loan operations when the mortgage loans are sold and/or related servicing rights are sold to third party investors or retained and managed under a third party subservice arrangement. The revenue recognized is reduced by the fair value of the related guarantee provided to the investor. The fair value of the guarantee is recognized in revenue when the Company is released from its obligation under the guarantee (note that guarantees are excluded from the scope of ASC 606). As of
December 31, 2018 and 2017
, we retained mortgage servicing rights of
2,282
and
3,094
loans, respectively, for a total value of
$6.5 million
and
$7.8 million
, respectively. We recognize financial services revenue associated with our title operations as homes are delivered, closing services are rendered, and title policies are issued, all of which generally occur simultaneously as each home is delivered. All of the underwriting risk associated with title insurance policies is transferred to third-party insurers.
A performance obligation is a promise in a contract to transfer a distinct good or service to the customer. A contract’s transaction price is allocated to each distinct performance obligation and recognized as revenue when, or as, the performance obligation is satisfied. All of our contracts to sell homes have a single performance obligation as the promise to transfer the home is not separately identifiable from other promises in the contract and, therefore, not distinct. Our third party land contracts may include multiple performance obligations; however, revenue expected to be recognized in any future year related to remaining performance obligations, excluding revenue pertaining to contracts that have an original expected duration of one year or less, is not material.
We generally expense sales commissions when incurred because the amortization period would have been one year or less. These costs are recorded within general, selling and administrative expenses as part of our sales and marketing expenses. We do not disclose the value of unsatisfied performance obligations for contracts with an original expected length of one year or less.
The following table presents our revenues disaggregated by geography:
|
Year Ended December 31,
|
|||||||||||
|
(In thousands)
|
2018
|
2017
(a)
|
2016
(a)
|
||||||||
|
Midwest homebuilding
|
$
|
933,119
|
|
$
|
742,577
|
|
$
|
637,894
|
|
||
|
Southern homebuilding
|
925,404
|
|
730,482
|
|
602,273
|
|
|||||
|
Mid-Atlantic homebuilding
|
375,563
|
|
439,219
|
|
409,149
|
|
|||||
|
Financial services
(b)
|
52,196
|
|
49,693
|
|
42,011
|
|
|||||
|
Total revenue
|
$
|
2,286,282
|
|
$
|
1,961,971
|
|
$
|
1,691,327
|
|
||
|
(a)
|
As noted above, prior period amounts have not been adjusted under the cumulative catch-up transition method.
|
|
(b)
|
Revenues include
$3.6 million
and
$0.7 million
of hedging gains and
$3.0 million
related to hedging losses for the years ended December 31,
2018
,
2017
and
2016
, respectively. Hedging gains (losses) do not represent revenues recognized from contracts with customers.
|
64
The following table presents our revenues disaggregated by revenue source:
|
Year Ended December 31,
|
|||||||||||
|
(Dollars in thousands)
|
2018
|
2017
(a)
|
2016
(a)
|
||||||||
|
Housing
|
$
|
2,217,197
|
|
$
|
1,878,572
|
|
$
|
1,610,496
|
|
||
|
Land sales
|
16,889
|
|
33,706
|
|
38,820
|
|
|||||
|
Financial services
(b)
|
52,196
|
|
49,693
|
|
42,011
|
|
|||||
|
Total revenue
|
$
|
2,286,282
|
|
$
|
1,961,971
|
|
$
|
1,691,327
|
|
||
|
(a)
|
As noted above, prior period amounts have not been adjusted under the cumulative catch-up transition method.
|
|
(b)
|
Revenues include
$3.6 million
and
$0.7 million
of hedging gains and
$3.0 million
related to hedging losses for the years ended December 31,
2018
,
2017
and
2016
, respectively. Hedging gains (losses) do not represent revenues recognized from contracts with customers.
|
Land and Housing Cost of Sales.
All associated homebuilding costs are charged to cost of sales in the period when the revenues from home deliveries are recognized. Homebuilding costs include: land and land development costs; home construction costs (including an estimate of the costs to complete construction); previously capitalized interest; real estate taxes; indirect costs; and estimated warranty costs. All other costs are expensed as incurred. Sales incentives, including pricing discounts and financing costs paid by the Company, are recorded as a reduction of revenue in the Company’s Consolidated Statements of Income. Sales incentives in the form of options or upgrades are recorded in homebuilding costs.
Income Taxes.
The Company records income taxes under the asset and liability method. Under this method, deferred tax assets and liabilities are recognized based on future tax consequences attributable to (1) temporary differences between the financial statement carrying amounts of existing assets and liabilities and their respective tax bases and (2) operating loss and tax credit carryforwards, if any. Deferred tax assets and liabilities are measured using enacted tax rates in effect in the years in which those temporary differences are expected to reverse. The effect on deferred tax assets and liabilities of a change in tax rates is recognized in earnings in the period when the change is enacted. During the fourth quarter of 2017, the Tax Cuts and Jobs Act of 2017 (the “2017 Tax Act”) was enacted which, among other things, reduced the corporate income tax rate from 35% to 21%. Please see
Note 14
to our Consolidated Financial Statements for further discussion.
In accordance with ASC 740-10,
Income Taxes
(“ASC 740”)
,
we evaluate the realizability of our deferred tax assets, including the benefit from net operating losses (“NOLs”) and tax credit carryforwards, if any, to determine if a valuation allowance is required based on whether it is more likely than not (a likelihood of more than 50%) that all or any portion of the deferred tax assets will not be realized. The ultimate realization of deferred tax assets is primarily dependent upon the generation of future taxable income. In determining the future tax consequences of events that have been recognized in the consolidated financial statements or tax returns, judgment is required. This assessment gives appropriate consideration to all positive and negative evidence related to the realization of the deferred tax assets and considers, among other matters, the nature, frequency and severity of current and cumulative losses, forecasts of future profitability, the length of statutory carryforward periods, our experience with operating losses and our experience of utilizing tax credit carryforwards and tax planning alternatives. Please see
Note 14
to our Consolidated Financial Statements for more information regarding our deferred tax assets.
Earnings Per Share.
The Company computes earnings per share in accordance with ASC 260,
Earnings per Share
, (“ASC 260”). Basic earnings per share is calculated by dividing income attributable to common shareholders by the weighted average number of common shares outstanding during each year. Diluted earnings per share gives effect to the potential dilution that could occur if securities or contracts to issue our common shares that are dilutive were exercised or converted into common shares or resulted in the issuance of common shares that then shared our earnings. In periods of net losses, no dilution is computed. Please see
Note 13
to our Consolidated Financial Statements for more information regarding our earnings per share calculation.
Stock-Based Compensation.
We measure and recognize compensation expense associated with our grant of equity-based awards in accordance with ASC 718,
Compensation-Stock Compensation
(“ASC 718”), which generally requires that companies measure and recognize stock-based compensation expense in an amount equal to the fair value of share-based awards granted under compensation arrangements over the related vesting period. We have granted share-based awards to certain of our employees and directors in the form of stock options, director stock units and performance share units (“PSU’s”). Each PSU represents a contingent right to receive one common share of the Company if vesting is satisfied at the end of the performance period based on the related performance conditions and markets conditions.
Determining the fair value of share-based awards requires judgment to identify the appropriate valuation model and develop the assumptions. The grant date fair value for stock option awards and PSU’s with a market condition (as defined in ASC 718) is estimated using the Black-Scholes option pricing model and the Monte Carlo simulation methodology, respectively. The grant date fair value for the director stock units and PSU’s with a performance condition (as defined in ASC 718) is based upon the closing price of our common shares on the date of grant. We recognize stock-based compensation expense for our stock option awards and PSU’s with a market condition over the requisite service period of the award while stock-based compensation expense
65
for our director stock units, which vest immediately, is fully recognized in the period of the award. For the portion of the PSU’s awarded subject to the satisfaction of a performance condition, we recognize stock-based compensation expense on a straight-line basis over the performance period based on the probable outcome of the related performance condition. If satisfaction of the performance condition is not probable, stock-based compensation expense recognition is deferred until probability is attained and a cumulative compensation expense adjustment is recorded and recognized ratably over the remaining service period. The Company reevaluates the probability of the satisfaction of the performance condition on a quarterly basis, and stock-based compensation expense is adjusted based on the portion of the requisite service period that has passed. If actual results differ significantly from these estimates, stock-based compensation expense could be higher and have a material impact on our consolidated financial statements. Please see
Note 2
to our Consolidated Financial Statements for more information regarding our stock-based compensation.
Letters of Credit and Completion Bonds.
The Company provides standby letters of credit and completion bonds for development work in progress, deposits on land and lot purchase agreements and miscellaneous deposits. As of
December 31, 2018
, the Company had outstanding
$215.0 million
of completion bonds and standby letters of credit, some of which were issued to various local governmental entities, that expire at various times through
September 2026
. Included in this total are: (1)
$155.4 million
of performance and maintenance bonds and
$42.4 million
of performance letters of credit that serve as completion bonds for land development work in progress; (2)
$10.3 million
of financial letters of credit; and (3)
$6.9 million
of financial bonds. The development agreements under which we are required to provide completion bonds or letters of credit are generally not subject to a required completion date and only require that the improvements are in place in phases as houses are built and sold. In locations where development has progressed, the amount of development work remaining to be completed is typically less than the remaining amount of bonds or letters of credit due to timing delays in obtaining release of the bonds or letters of credit.
Recently Adopted Accounting Standards.
In May 2014, the Financial Accounting Standards Board (“FASB”) issued Accounting Standards Update (“ASU”) No. 2014-09,
Revenue from Contracts with Customers
(“ASU 2014-09”), which provides guidance for revenue recognition. ASU 2014-09 affects any entity that either enters into contracts with customers to transfer goods or services or enters into contracts for the transfer of nonfinancial assets. ASU 2014-09 supersedes the revenue recognition requirements in ASC 605 and most industry-specific guidance as well as some cost guidance included in Subtopic 605-35, “Revenue Recognition-Construction-Type and Production-Type Contracts.” ASU 2014-09’s core principle is that a company will recognize revenue when it transfers promised goods or services to customers in an amount that reflects the consideration to which a company expects to be entitled in exchange for those goods or services. In doing so, companies will need to use more judgment and make more estimates than under today’s guidance, including identifying performance obligations in the contract, estimating the amount of variable consideration to include in the transaction price and allocating the transaction price to each separate performance obligation. In August 2015, the FASB issued ASU No. 2015-14,
Revenue from Contracts with Customers: Deferral of the Effective Date
, which delayed the effective date of ASU 2014-09 by one year. ASU 2014-09, as amended, is effective for public companies for annual reporting periods beginning after December 15, 2017, including interim reporting periods within that reporting period.
Subsequent to the issuance of ASU 2014-09, the FASB has issued several ASUs, such as ASU 2016-08,
Revenue from Contracts with Customers: Principal versus Agent Considerations (Reporting Revenue Gross versus Net)
, ASU 2016-10,
Revenue from Contracts with Customers: Identifying Performance Obligations and Licensing
, and ASU 2016-12,
Revenue from Contracts with Customers: Narrow-Scope Improvements and Practical Expedients
. These ASUs do not change the core principle of the guidance stated in ASU 2014-09. Instead, these amendments are intended to clarify and improve the operability of certain topics addressed by ASU 2014-09. These additional ASUs have the same effective date and transition requirements as ASU 2014-09, as amended.
We adopted the standard, and the subsequently issued standards mentioned above, on January 1, 2018 using the modified retrospective transition method, which includes a cumulative catch-up in retained earnings on the initial date of adoption for existing contracts (those that are not completed) as of, and new contracts after, January 1, 2018. The adoption did not have a material impact on our consolidated financial statements. The amount and timing of our housing and land revenue remained substantially unchanged, and we did not have significant changes to our business processes, systems, or internal controls as a result of adopting the standard. The Company has developed the additional expanded disclosures required (please see our Significant Accounting Policies section above); however, the adoption did not have a material impact on its consolidated results of operations, financial position and cash flows.
In February 2017, the FASB issued ASU 2017-05,
Other Income - Gains and Losses from the Derecognition of Nonfinancial Assets (Subtopic 610-20): Clarifying the Scope of Asset Derecognition Guidance and Accounting for Partial Sales of Nonfinancial Assets
(“ASU 2017-05”). ASU 2017-05 is intended to clarify the scope of the original guidance within Subtopic 610-20 that was issued in connection with ASU 2014-09, which provides guidance for recognizing gains and losses from the transfer of nonfinancial assets in contracts with noncustomers. ASU 2017-05 additionally added guidance for partial sales of nonfinancial assets. ASU 2017-05 is effective for fiscal years beginning after December 15, 2017, and interim periods within those fiscal years. We were
66
required to adopt ASU 2017-05 concurrent with the adoption of ASU 2014-09. The adoption of ASU 2017-05 did not have a material impact on the Company’s consolidated financial statements and disclosures.
In August 2016, the FASB issued ASU 2016-15,
Statement of Cash Flows (Topic 230): Classification of Certain Cash Receipts and Cash Payments
(“ASU 2016-15”). ASU 2016-15 provides guidance on how certain cash receipts and cash payments are to be presented and classified in the statement of cash flows. For public entities, ASU 2016-15 is effective for fiscal years beginning after December 15, 2017, and interim periods within those fiscal years. Early adoption is permitted. The Company adopted the standard on January 1, 2018. The adoption of ASU 2016-15 did not modify the Company's current disclosures within the condensed consolidated statement of cash flows and did not have any impact on the Company’s consolidated financial statements and disclosures.
In January 2017, the FASB issued ASU 2017-01,
Business Combinations (Topic 805): Clarifying the Definition of a Business
(“ASU 2017-01”), which provides a more robust framework for determining whether transactions should be accounted for as acquisitions (or dispositions) of assets or businesses. ASU 2017-01 is effective for fiscal years beginning after December 15, 2017, and interim periods within those fiscal years. The Company adopted the standard on January 1, 2018. The adoption of ASU 2017-01 did not have an impact on the Company’s consolidated financial statements and disclosures as the Company’s acquisition during the first quarter of 2018 met all requirements to be accounted for as a business acquisition.
In March 2018, the FASB issued ASU 2018-05, which amends Income Taxes (Topic 740) by incorporating Staff Accounting Bulletin 118 (“SAB 118”) issued by the Securities and Exchange Commission (“SEC”) on December 22, 2017. SAB 118 provides guidance on accounting for the effects of the 2017 Tax Act. We recognized the income tax effects of the 2017 Tax Act in our consolidated financial statements for the fiscal year ended December 31, 2017 in accordance with SAB 118.
Impact of New Accounting Standards.
In February 2016, the FASB issued ASU No. 2016-02,
Leases
(“ASU 2016-02”), which requires lessees to recognize leases on-balance sheet and disclose key information about leasing arrangements. ASU 2016-02 was subsequently amended by ASU No. 2018-01,
Land Easement Practical Expedient for Transition to Topic 842
; ASU No. 2018-10,
Codification Improvements to Topic 842, Leases
; and ASU No. 2018-11,
Targeted Improvements
(please see additional detail regarding these updates to Topic 842 below). The new standard establishes a right-of-use model (ROU) that requires a lessee to recognize a ROU asset and lease liability on the balance sheet for all leases with a term longer than 12 months. Leases will be classified as finance or operating, with classification affecting the pattern and classification of expense recognition in the income statement.
The new standard is effective for us on January 1, 2019, with early adoption permitted. We adopted the new standard on its effective date. A modified retrospective transition approach is required, applying the new standard to all leases existing at the date of initial application. An entity may choose to use either (1) its effective date or (2) the beginning of the earliest comparative period presented in the financial statements as its date of initial application. We adopted the new standard on January 1, 2019 and used the effective date as our date of initial application. Consequently, financial information will not be updated and the disclosures required under the new standard will not be provided for dates and periods before January 1, 2019.
The new standard provides a number of optional practical expedients in transition. We expect to elect the ‘package of practical expedients’, which permits us not to reassess under the new standard our prior conclusions about lease identification, lease classification and initial direct costs. We do not expect to elect the use-of-hindsight with respect to determining the lease term (i.e., considering the actual outcome and updated expectations of lease renewals, termination option and purchase options). We also do not expect to elect the use of the practical expedient pertaining to land easements as our land easements, undertaken for the purpose of construction and development of inventory, are excluded by 842-10-15-1(d).
We expect that this standard will have a material effect on our financial statements. While we continue to assess all of the effects of adoption, we currently believe the most significant effects relate to (1) the recognition of new ROU assets and lease liabilities on our balance sheet for our office and model sale-leaseback operating leases; and (2) providing significant new disclosures about our leasing activities. We do not expect a significant change in our leasing activities between now and adoption.
On adoption, we currently expect to recognize additional operating liabilities ranging from
$18.0 million
to
$23.0 million
, with corresponding ROU assets of the same amount based on the present value of the remaining minimum rental payments under current leasing standards for existing operating leases.
The new standard also provides practical expedients for an entity’s ongoing accounting. We currently expect to elect the short-term lease recognition exemption for all leases that qualify. This means, for those leases that qualify, we will not recognize ROU assets or lease liabilities, and this includes not recognizing ROU assets or lease liabilities for existing short-term leases of those assets in transition. We also currently expect to elect the practical expedient to not separate lease and non-lease components for all of our leases.
67
In January 2018, the FASB issued ASU 2018-01,
Land Easement Practical Expedient for Transition to Topic 842
(“ASU 2018-01”), which provides an optional transition practical expedient to not evaluate under Topic 842 existing or expired land easements that were not previously accounted for as leases under the current lease guidance in Topic 840. An entity that elects this practical expedient should evaluate new or modified land easements under Topic 842 beginning at the date the entity adopts Topic 842; otherwise, an entity should evaluate all existing or expired land easements in connection with the adoption of the new lease requirements in Topic 842 to assess whether they meet the definition of a lease. The effective date and transition requirements for the amendments are the same as the effective date and transition requirements in ASU 2016-02. This ASU is not expected to have a significant impact on the Company's expected impact of the adoption of ASU 2016-02 (discussed above) or its consolidated financial statements and disclosures.
In July 2018, the FASB issued ASU 2018-09,
Codification Improvements
(“ASU 2018-09”). ASU 2018-09 amends a variety of topics in the FASB’s Accounting Standards Codification. The transition and effective date of the guidance are based on the facts and circumstances of each amendment. Some of the amendments in ASU 2018-09 do not require transition guidance and were effective upon issuance of ASU 2018-09. However, many of the amendments include transition guidance with effective dates for annual periods beginning after December 15, 2018. The Company does not believe the adoption of ASU 2018-09 will have a material impact on the Company’s consolidated financial statements and disclosures.
In July 2018, the FASB issued ASU 2018-10,
Codification Improvements to Topic 842, Leases
(“ASU 2018-10”)
.
ASU 2018-10 includes certain clarifications to address potential narrow-scope implementation issues which we are incorporating into our assessment and adoption of ASU 2016-02. The amendments in this ASU are effective in the same time-frame as ASU 2016-02 as discussed above.
In July 2018, the FASB issued ASU 2018-11,
Leases (Topic 842): Targeted Improvements
(“ASU 2018-11”)
.
ASU 2018-11 allows entities to not recast comparative periods in transition to ASC 842 and instead report the comparative periods presented in the period of adoption under ASC 840. ASU 2018-11 also includes a practical expedient for lessors to not separate the lease and non-lease components of a contract. The amendments in ASU 2018-11 are effective in the same time-frame as ASU 2016-02 as discussed above. We are incorporating this ASU into our assessment and adoption of ASU 2016-02.
In August 2018, the FASB issued ASU 2018-13,
Fair Value Measurement (Topic 820): Disclosure Framework – Changes to the Disclosure Requirements for Fair Value Measurement
(“ASU 2018-13”)
.
ASU 2018-13 modifies the disclosure requirements for fair value measurements and removes the requirement to disclose (1) the amount of and reasons for transfers between Level 1 and Level 2 of the fair value hierarchy, (2) the policy for timing of transfers between levels, and (3) the valuation processes for Level 3 fair value measurements. ASU 2018-13 requires disclosure of changes in unrealized gains and losses for the period included in other comprehensive income (loss) for recurring Level 3 fair value measurements held at the end of the reporting period and the range and weighted average of significant unobservable inputs used to develop Level 3 fair value measurements. For all entities, ASU 2018-13 is effective for fiscal years beginning after December 15, 2019, and interim periods within those fiscal years. We are currently evaluating the effect that this guidance will have on our consolidated financial statements and disclosures.
In August 2018, the FASB issued ASU 2018-15,
Intangibles - Goodwill and Other - Internal-Use Software (Subtopic 350-40): Customer's Accounting for Implementation Costs Incurred in a Cloud Computing Arrangement That Is a Service Contract (a consensus of the FASB Emerging Issues Task Force)
(“ASU 2018-15”)
.
ASU 2018-15 requires entities that are customers in cloud computing arrangements to defer implementation costs if they would be capitalized by the entity in software licensing arrangements under the internal-use software guidance. The guidance may be applied retrospectively or prospectively to implementation costs incurred after the date of adoption. For public entities, ASU 2018-15 is effective for fiscal years beginning after December 15, 2019, and interim periods within those fiscal years. We are currently evaluating the effect that this guidance will have on our consolidated financial statements and disclosures.
In October 2018, the FASB issued ASU 2018-16,
Inclusion of the Secured Overnight Financing Rate (SOFR) Overnight Index Swap (OIS) Rate as a Benchmark Interest Rate for Hedge Accounting Purposes
(“ASU 2018-16”), which amends ASC 815, Derivatives and Hedging. The amendments in ASU 2018-16 permit use of the Overnight Index Swap Rate (OIS) rate based on Secured Overnight Financing Rate (SOFR) as a U.S. benchmark interest rate for hedge accounting purposes under Topic 815 in addition to the UST, the LIBOR swap rate, the OIS rate based on the Fed Funds Effective Rate, and the SIFMA Municipal Swap Rate. For entities that have not already adopted ASU 2017-12, the amendments in ASU 2018-16 are required to be adopted concurrently with the amendments in ASU 2017-12. The Company intends to adopt ASU 2017-12 and ASU 2018-16 on January 1, 2019. We are currently evaluating the effect that this guidance will have on our consolidated financial statements and disclosures.
68
NOTE 2. Stock-Based and Deferred Compensation
Stock Incentive Plans
At our 2018 Annual Meeting of Shareholders, our shareholders approved the M/I Homes, Inc. 2018 Long-Term Incentive Plan (the “2018 LTIP”), an equity compensation plan administered by the Compensation Committee of our Board of Directors. Under the 2018 LTIP, the Company is permitted to grant (1) nonqualified stock options to purchase common shares, (2) incentive stock options to purchase common shares, (3) stock appreciation rights, (4) restricted common shares, (5) other stock-based awards – awards that are valued in whole or in part by reference to, or otherwise based on, the fair market value of our common shares, and (6) cash-based awards to its officers, employees, non-employee directors and other eligible participants. Subject to certain adjustments, the plan authorizes awards to officers, employees, non-employee directors and other eligible participants for up to
2,250,000
common shares, of which
2,221,500
remain available for grant at
December 31, 2018
.
The 2018 LTIP replaced the M/I Homes, Inc. 2009 Long-Term Incentive Plan (the “2009 LTIP”), which plan was terminated immediately following our 2018 Annual Meeting of Shareholders. The 2009 LTIP replaced the 1993 Stock Incentive Plan as Amended (the “1993 Plan”), which expired by its terms on April 22, 2009. Awards outstanding under the 2009 LTIP and the 1993 Plan remain in effect in accordance with their respective terms.
Stock Options
Stock options are granted at the market price of the Company’s common shares at the close of business on the date of grant. Options awarded generally vest 20% annually over five years and expire after ten years. Under the 2018 LTIP and the 2009 LTIP, in the case of termination due to death, disability or retirement, all options will become immediately exercisable. Shares issued upon option exercise may consist of treasury shares, authorized but unissued common shares or common shares purchased by or on behalf of the Company in the open market.
Following is a summary of stock option activity for the year ended
December 31, 2018
, relating to the stock options awarded under the 2018 LTIP, the 2009 LTIP and the 1993 Plan:
|
|
Shares
|
Weighted
Average
Exercise
Price
|
Weighted Average Remaining Contractual Term (Years)
|
Aggregate Intrinsic Value
(a)
(In thousands)
|
||||||||
|
Options outstanding at December 31, 2017
|
1,822,818
|
|
$
|
20.48
|
|
6.88
|
$
|
25,376
|
|
|||
|
Granted
|
438,500
|
|
31.89
|
|
||||||||
|
Exercised
|
(38,628
|
)
|
13.92
|
|
||||||||
|
Forfeited
|
(10,000
|
)
|
28.49
|
|
||||||||
|
Options outstanding at December 31, 2018
|
2,212,690
|
|
$
|
22.82
|
|
6.58
|
$
|
3,123
|
|
|||
|
Options vested or expected to vest at December 31, 2018
|
2,151,750
|
|
$
|
22.74
|
|
6.53
|
$
|
3,073
|
|
|||
|
Options exercisable at December 31, 2018
|
1,400,490
|
|
$
|
21.22
|
|
5.65
|
$
|
2,486
|
|
|||
(a)
Intrinsic value is defined as the amount by which the fair value of the underlying common shares exceeds the exercise price of the option.
The aggregate intrinsic value of options exercised during the
years ended December 31, 2018, 2017 and 2016
was
$0.6 million
,
$9.3 million
and
$0.1 million
, respectively.
The fair value of our five-year service-based stock options granted during the
years ended December 31, 2018, 2017 and 2016
was established at the date of grant using the Black-Scholes pricing model, with the weighted average assumptions as follows:
|
|
Year Ended December 31,
|
||||||||||
|
|
2018
|
2017
|
2016
|
||||||||
|
Risk-free interest rate
|
2.72
|
%
|
1.96
|
%
|
1.34
|
%
|
|||||
|
Expected volatility
|
32.01
|
%
|
39.49
|
%
|
47.20
|
%
|
|||||
|
Expected term (in years)
|
5.7
|
|
5.9
|
|
5.7
|
|
|||||
|
Weighted average grant date fair value of options granted during the period
|
$
|
11.31
|
|
$
|
9.45
|
|
$
|
7.57
|
|
||
The risk-free interest rate is based upon the U.S. Treasury constant maturity rate at the date of the grant. Expected volatility is based on an average of (1) historical volatility of the Company’s stock and (2) implied volatility from traded options on the Company’s stock. The risk-free rate for periods within the contractual life of the stock option award is based on the yield curve of a zero-coupon U.S. Treasury bond on the date the stock option award is granted, with a maturity equal to the expected term of the stock option award granted. The Company uses historical data to estimate stock option exercises and forfeitures within its valuation model. The expected life of stock option awards granted is derived from historical exercise experience under the
69
Company’s share-based payment plans, and represents the period of time that stock option awards granted are expected to be outstanding.
Total stock-based compensation expense related to stock option awards that has been charged against income relating to the 2018 LTIP, the 2009 LTIP and the 1993 Plan was
$3.9 million
,
$3.7 million
, and
$3.3 million
for the
years ended December 31, 2018, 2017 and 2016
, respectively. As of
December 31, 2018
, there was a total of
$7.7 million
of unrecognized compensation expense related to unvested stock option awards that will be recognized as stock-based compensation expense as the awards vest over a weighted average period of
2.1
years for the service awards.
Director Stock Units
The Company awarded its non-employee directors a total of
21,000
stock units under the 2018 LTIP during the year ended
December 31, 2018
and a total of
18,000
and
15,000
stock units under the 2009 LTIP during the years ended December 31,
2017
and
2016
, respectively. Each stock unit is the equivalent of one common share, vests immediately and will be converted into a common share upon termination of service as a director. The Company recognized the full stock-based compensation expense related to the awards of
$0.7 million
,
$0.5 million
and
$0.3 million
in
2018
,
2017
and
2016
, respectively, due to the immediate vesting provisions of the award.
On May 5, 2009, the Company’s board of directors terminated the M/I Homes, Inc. 2006 Director Equity Incentive Plan (the “Director Equity Plan”). Awards outstanding under the Director Equity Plan remain in effect in accordance with their respective terms.
At December 31, 2018
, there were
8,059
stock units outstanding under the Director Equity Plan with a value of
$0.2 million
.
Performance Share Unit Awards
On
February 15, 2018
,
February 8, 2017
and
February 16, 2016
, the Company awarded its executive officers (in the aggregate) a target number of performance share units (“PSU’s”) under the 2009 LTIP equal to
46,444
,
57,110
and
79,108
PSU’s, respectively. Each PSU represents a contingent right to receive one common share of the Company if vesting is satisfied at the end of a three-year performance period (the “Performance Period”). The ultimate number of PSU’s that will vest and be earned, if any, after the completion of the Performance Period, is based on (1) (a) the Company’s cumulative annual pre-tax income from operations, excluding extraordinary items as defined in the underlying award agreements with the executive officers, over the Performance Period (weighted
80%
) (the “Performance Condition”), and (b) the Company’s relative total shareholder return over the Performance Period compared to the total shareholder return of a peer group of other publicly-traded homebuilders (weighted
20%
) (the “Market Condition”) and (2) the participant’s continued employment through the end of the Performance Period, except in the case of termination due to death, disability or retirement or involuntary termination without cause by the Company. The number of PSU’s that vest may increase by up to 50% from the target number based on levels of achievement of the above criteria as set forth in the applicable award agreements and decrease to zero if the Company fails to meet the minimum performance levels for both of the above criteria. If the Company achieves the minimum performance levels for both of the above criteria, 50% of the target number of PSU’s will vest and be earned. Any portion of PSU’s that does not vest at the end of the Performance Period will be forfeited. Additionally, the PSU’s have no dividend or voting rights during the Performance Period.
The grant date fair value of the portion of the PSU’s subject to the Performance Condition and the Market Condition component was
$31.93
and
$33.57
, respectively, for the 2018 PSU’s,
$23.34
and
$19.69
, respectively, for the 2017 PSU’s, and
$16.85
and
$15.75
, respectively, for the 2016 PSU’s. In accordance with ASC 718, for the portion of the PSU’s subject to a Market Condition, stock-based compensation expense is derived using the Monte Carlo simulation methodology and is recognized ratably over the service period regardless of whether or not the attainment of the Market Condition is probable. Therefore, the Company recognized
$0.1 million
in stock-based compensation expense during 2018 related to the Market Condition portion of the 2018, 2017 and 2016 PSU awards. There was a total of
$0.1 million
of unrecognized stock-based compensation expense related to the Market Condition portion of the 2018 and 2017 PSU awards as of
December 31, 2018
. At
December 31, 2018
, the Market Condition for the 2016 PSU awards was met, and the company recorded
$0.1 million
of stock-based compensation expense. Based on these results and board approval,
12,024
PSU’s vested during the first quarter of 2019 with respect to the portion of the 2016 PSU’s subject to the Market Condition.
For the portion of the PSU’s subject to a Performance Condition, we recognize stock-based compensation expense on a straight-line basis over the Performance Period based on the probable outcome of the related Performance Condition. Otherwise, stock-based compensation expense recognition is deferred until probability is attained and a cumulative stock-based compensation expense adjustment is recorded and recognized ratably over the remaining service period. The Company reassesses the probability of the satisfaction of the Performance Condition on a quarterly basis, and stock-based compensation expense is adjusted based on the portion of the requisite service period that has passed. As of
December 31, 2018
, the Company had not recognized any stock-based compensation expense related to the Performance Condition portion of the 2018 PSU awards. If the Company achieves the minimum performance levels for the Performance Condition to be met for the 2018 awards, the Company would record unrecognized
70
stock-based compensation expense of
$0.6 million
as of
December 31, 2018
, for which
$0.2 million
would be immediately recognized as if attainment been probable at
December 31, 2018
. The Company recognized
$0.4 million
of stock-based compensation expense related to the Performance Condition portion of the 2017 PSU awards during 2018 based on the probability of attaining the Performance Condition. The Company has
$0.2 million
of unrecognized stock-based compensation expense related to the Performance Condition portion of the 2017 PSU awards at
December 31, 2018
. The Company recognized
$1.0 million
of stock-based compensation expense related to the Performance Condition portion of the 2016 PSU awards as of
December 31, 2018
based on the achievement of 106% of the target performance level. Based on these results and board approval,
80,023
PSU’s vested during the first quarter of 2019 with respect to the portion of the 2016 PSU awards subject to the Performance Condition.
Deferred Compensation Plans
The purpose of the Company’s Amended and Restated Executives’ Deferred Compensation Plan (the “Executive Plan”), a non-qualified deferred compensation plan, is to provide an opportunity for certain eligible employees of the Company to defer a portion of their compensation and to invest in the Company’s common shares. The purpose of the Company’s Amended and Restated Director Deferred Compensation Plan (the “Director Plan”) is to provide its directors with an opportunity to defer their director compensation and to invest in the Company’s common shares.
Compensation expense deferred into the Executive Plan and the Director Plan (together the “Plans”) totaled
$0.2 million
,
$0.4 million
and
$0.1 million
for the
years ended December 31, 2018, 2017 and 2016
, respectively. The portion of cash compensation deferred by employees and directors under the Plans is invested in fully-vested equity units in the Plans. One equity unit is the equivalent of one common share. Equity units and the related dividends (if any) will be converted and distributed to the employee or director in the form of common shares at the earlier of his or her elected distribution date or termination of service as an employee or director of the Company. Distributions from the Plans totaled
$0.2 million
during each of the years ended
December 31, 2018
, 2017 and 2016. As of
December 31, 2018
, there were a total of
48,781
equity units with a value of
$1.1 million
outstanding under the Plans. The aggregate fair market value of these units at
December 31, 2018
, based on the closing price of the underlying common shares, was approximately
$1.3 million
, and the associated deferred tax benefit the Company would recognize if the outstanding units were distributed was
$1.5 million
as of
December 31, 2018
. Common shares are issued from treasury shares upon distribution of equity units from the Plans.
Profit Sharing and Retirement Plan
The Company has a profit-sharing and retirement plan that covers substantially all Company employees and permits participants to make contributions to the plan on a pre-tax basis in accordance with the provisions of Section 401(k) of the Internal Revenue Code of 1986, as amended. Company contributions to the plan are also made at the discretion of the Company’s board of directors based on the Company’s profitability and resulted in a
$2.3 million
,
$1.8 million
and
$1.4 million
expense for the
years ended December 31, 2018, 2017 and 2016
, respectively.
NOTE 3. Fair Value Measurements
There are three measurement input levels for determining fair value: Level 1, Level 2, and Level 3. Fair values determined by Level 1 inputs utilize quoted prices in active markets for identical assets or liabilities that the Company has the ability to access. Fair values determined by Level 2 inputs utilize inputs other than quoted prices included in Level 1 that are observable for the asset or liability, either directly or indirectly. Level 2 inputs include quoted prices for similar assets and liabilities in active markets, and inputs other than quoted prices that are observable for the asset or liability, such as interest rates and yield curves that are observable at commonly quoted intervals. Level 3 inputs are unobservable inputs for the asset or liability, and include situations where there is little, if any, market activity for the asset or liability.
Assets Measured on a Recurring Basis
To meet financing needs of our home-buying customers, M/I Financial is party to interest rate lock commitments (“IRLCs”), which are extended to customers who have applied for a mortgage loan and meet certain defined credit and underwriting criteria.
These IRLCs are considered derivative financial instruments. M/I Financial manages interest rate risk related to its IRLCs and mortgage loans held for sale through the use of forward sales of mortgage-backed securities (“FMBSs”), the use of whole loan delivery commitments, and the occasional purchase of options on FMBSs in accordance with Company policy. These FMBSs, options on FMBSs, and IRLCs covered by FMBSs are considered non-designated derivatives. These amounts are either recorded in Other Assets or Other Liabilities on the Consolidated Balance Sheets (depending on the respective balance for that year ended December 31).
The Company measures both mortgage loans held for sale and IRLCs at fair value. Fair value measurement results in a better presentation of the changes in fair values of the loans and the derivative instruments used to economically hedge them.
71
In the normal course of business, our financial services segment enters into contractual commitments to extend credit to buyers of single-family homes with fixed expiration dates. The commitments become effective when the borrowers “lock-in” a specified interest rate within established time frames. Market risk arises if interest rates move adversely between the time of the “lock-in” of rates by the borrower and the sale date of the loan to an investor. To mitigate the effect of the interest rate risk inherent in providing rate lock commitments to borrowers, the Company enters into optional or mandatory delivery forward sale contracts to sell whole loans and mortgage-backed securities to broker/dealers. The forward sale contracts lock in an interest rate and price for the sale of loans similar to the specific rate lock commitments. The Company does not engage in speculative or trading derivative activities. Both the rate lock commitments to borrowers and the forward sale contracts to broker/dealers or investors are undesignated derivatives, and accordingly, are marked to fair value through earnings. Changes in fair value measurements are included in earnings in the accompanying Consolidated Statements of Income.
The fair value of mortgage loans held for sale is estimated based primarily on published prices for mortgage-backed securities with similar characteristics. To calculate the effects of interest rate movements, the Company utilizes applicable published mortgage-backed security prices, and multiplies the price movement between the rate lock date and the balance sheet date by the notional loan commitment amount. The Company sells loans on a servicing released or servicing retained basis, and receives servicing compensation. Thus, the value of the servicing rights included in the fair value measurement is based upon contractual terms with investors and depends on the loan type. The Company applies a fallout rate to IRLCs when measuring the fair value of rate lock commitments. Fallout is defined as locked loan commitments for which the Company does not close a mortgage loan and is based on management’s judgment and company experience.
The fair value of the Company’s forward sales contracts to broker/dealers solely considers the market price movement of the same type of security between the trade date and the balance sheet date. The market price changes are multiplied by the notional amount of the forward sales contracts to measure the fair value.
Interest Rate Lock Commitments.
IRLCs are extended to certain home-buying customers who have applied for a mortgage loan and meet certain defined credit and underwriting criteria. Typically, the IRLCs will have a term of less than six months; however, in certain markets, the term could extend to nine months.
Some IRLCs are committed to a specific third party investor through the use of whole loan delivery commitments matching the exact terms of the IRLC loan. Uncommitted IRLCs are considered derivative instruments and are fair value adjusted, with the resulting gain or loss recorded in current earnings.
Forward Sales of Mortgage-Backed Securities.
FMBSs are used to protect uncommitted IRLC loans against the risk of changes in interest rates between the lock date and the funding date. FMBSs related to uncommitted IRLCs are classified and accounted for as non-designated derivative instruments and are recorded at fair value, with gains and losses recorded in current earnings.
Mortgage Loans Held for Sale.
Mortgage loans held for sale consist primarily of single-family residential loans collateralized by the underlying property. During the period between when a loan is closed and when it is sold to an investor, the interest rate risk is covered through the use of a whole loan contract or by FMBSs.
The table below shows the notional amounts of our financial instruments at
December 31, 2018 and 2017
:
|
December 31,
|
|||||||
|
Description of Financial Instrument (in thousands)
|
2018
|
2017
|
|||||
|
Best efforts contracts and related committed IRLCs
|
$
|
5,823
|
|
$
|
2,182
|
|
|
|
Uncommitted IRLCs
|
76,117
|
|
50,746
|
|
|||
|
FMBSs related to uncommitted IRLCs
|
83,000
|
|
53,000
|
|
|||
|
Best efforts contracts and related mortgage loans held for sale
|
14,285
|
|
80,956
|
|
|||
|
FMBSs related to mortgage loans held for sale
|
150,000
|
|
91,000
|
|
|||
|
Mortgage loans held for sale covered by FMBSs
|
149,980
|
|
90,781
|
|
|||
72
The table below shows the level and measurement of assets and liabilities measured on a recurring basis at
December 31, 2018 and 2017
:
|
Description of Financial Instrument (in thousands)
|
Fair Value Measurements
December 31, 2018
|
Quoted Prices in Active Markets for Identical Assets
(Level 1)
|
Significant Other Observable Inputs
(Level 2)
|
Significant Unobservable Inputs
(Level 3)
|
|||||||||||
|
Mortgage loans held for sale
|
$
|
169,651
|
|
$
|
—
|
|
$
|
169,651
|
|
$
|
—
|
|
|||
|
Forward sales of mortgage-backed securities
|
(3,305
|
)
|
—
|
|
(3,305
|
)
|
—
|
|
|||||||
|
Interest rate lock commitments
|
989
|
|
—
|
|
989
|
|
—
|
|
|||||||
|
Whole loan contracts
|
(154
|
)
|
—
|
|
(154
|
)
|
—
|
|
|||||||
|
Total
|
$
|
167,181
|
|
$
|
—
|
|
$
|
167,181
|
|
$
|
—
|
|
|||
|
Description of Financial Instrument (in thousands)
|
Fair Value Measurements
December 31, 2017
|
Quoted Prices in Active Markets for Identical Assets
(Level 1)
|
Significant Other Observable Inputs
(Level 2)
|
Significant Unobservable Inputs
(Level 3)
|
|||||||||||
|
Mortgage loans held for sale
|
$
|
171,580
|
|
$
|
—
|
|
$
|
171,580
|
|
$
|
—
|
|
|||
|
Forward sales of mortgage-backed securities
|
177
|
|
—
|
|
177
|
|
—
|
|
|||||||
|
Interest rate lock commitments
|
271
|
|
—
|
|
271
|
|
—
|
|
|||||||
|
Whole loan contracts
|
12
|
|
—
|
|
12
|
|
—
|
|
|||||||
|
Total
|
$
|
172,040
|
|
$
|
—
|
|
$
|
172,040
|
|
$
|
—
|
|
|||
The following table sets forth the amount of gain (loss) recognized, within our revenue in the Consolidated Statements of Income, on assets and liabilities measured on a recurring basis for the
years ended December 31, 2018, 2017 and 2016
:
|
Year Ended December 31,
|
|||||||||||
|
Description (in thousands)
|
2018
|
2017
|
2016
|
||||||||
|
Mortgage loans held for sale
|
$
|
3,763
|
|
$
|
3,675
|
|
$
|
(3,591
|
)
|
||
|
Forward sales of mortgage-backed securities
|
(3,482
|
)
|
(53
|
)
|
323
|
|
|||||
|
Interest rate lock commitments
|
783
|
|
21
|
|
(71
|
)
|
|||||
|
Whole loan contracts
|
(231
|
)
|
102
|
|
116
|
|
|||||
|
Total gain (loss) recognized
|
$
|
833
|
|
$
|
3,745
|
|
$
|
(3,223
|
)
|
||
The following tables set forth the fair value of the Company’s derivative instruments and their location within the Consolidated Balance Sheets for the periods indicated (except for mortgage loans held for sale which is disclosed as a separate line item):
|
Asset Derivatives
|
Liability Derivatives
|
|||||||||||
|
December 31, 2018
|
December 31, 2018
|
|||||||||||
|
Description of Derivatives
|
Balance Sheet
Location
|
Fair Value
(in thousands)
|
Balance Sheet Location
|
Fair Value
(in thousands)
|
||||||||
|
Forward sales of mortgage-backed securities
|
Other assets
|
$
|
—
|
|
Other liabilities
|
$
|
3,305
|
|
||||
|
Interest rate lock commitments
|
Other assets
|
989
|
|
Other liabilities
|
—
|
|
||||||
|
Whole loan contracts
|
Other assets
|
—
|
|
Other liabilities
|
154
|
|
||||||
|
Total fair value measurements
|
$
|
989
|
|
$
|
3,459
|
|
||||||
|
Asset Derivatives
|
Liability Derivatives
|
|||||||||||
|
December 31, 2017
|
December 31, 2017
|
|||||||||||
|
Description of Derivatives
|
Balance Sheet
Location
|
Fair Value
(in thousands)
|
Balance Sheet Location
|
Fair Value
(in thousands)
|
||||||||
|
Forward sales of mortgage-backed securities
|
Other assets
|
$
|
177
|
|
Other liabilities
|
$
|
—
|
|
||||
|
Interest rate lock commitments
|
Other assets
|
271
|
|
Other liabilities
|
—
|
|
||||||
|
Whole loan contracts
|
Other assets
|
12
|
|
Other liabilities
|
—
|
|
||||||
|
Total fair value measurements
|
$
|
460
|
|
$
|
—
|
|
||||||
73
Assets Measured on a Non-Recurring Basis
The Company assesses inventory for recoverability on a quarterly basis if events or changes in local or national economic conditions indicate that the carrying amount of an asset may not be recoverable. Our determination of fair value is based on projections and estimates, which are Level 3 measurement inputs. For further explanation of the Company’s policy regarding our assessment of recoverability for assets measured on a non-recurring basis, please see
Note 1
to our Consolidated Financial Statements. The table below shows the level and measurement of assets measured on a non-recurring basis for the years ended December 31, 2018, 2017 and 2016:
|
Year Ended December 31,
|
||||||||||||
|
Description (in thousands)
|
Hierarchy
|
2018
|
2017
(2)
|
2016
(2)
|
||||||||
|
Adjusted basis of inventory
(1)
|
Level 3
|
$
|
14,515
|
|
$
|
3,823
|
|
$
|
12,921
|
|
||
|
Total losses
|
5,809
|
|
7,681
|
|
3,992
|
|
||||||
|
Initial basis of inventory
(3)
|
$
|
20,324
|
|
$
|
11,504
|
|
$
|
16,913
|
|
|||
|
(1)
|
The fair values in the table above represent only assets whose carrying values were adjusted in the respective period.
|
|
(2)
|
The carrying values for these assets may have subsequently increased or decreased from the fair value reported due to activities that have occurred since the measurement date.
|
|
(3)
|
This amount is inclusive of our investments in joint venture arrangements. There were
no
losses on our investments in joint venture arrangements for
2018
,
2017
and
2016
.
|
Financial Instruments
Counterparty Credit Risk.
To reduce the risk associated with losses that would be recognized if counterparties failed to perform as contracted, the Company limits the entities with whom management can enter into commitments. This risk of accounting loss is the difference between the market rate at the time of non-performance by the counterparty and the rate to which the Company committed.
The following table presents the carrying amounts and fair values of the Company’s financial instruments at
December 31, 2018 and 2017
. The objective of the fair value measurement is to estimate the price at which an orderly transaction to sell the asset or transfer the liability would take place between market participants at the measurement date under current market conditions.
|
December 31, 2018
|
December 31, 2017
|
|||||||||||||||
|
(In thousands)
|
Carrying Amount
|
Fair Value
|
Carrying Amount
|
Fair Value
|
||||||||||||
|
Assets:
|
||||||||||||||||
|
Cash, cash equivalents and restricted cash
|
$
|
21,529
|
|
$
|
21,529
|
|
$
|
151,703
|
|
$
|
151,703
|
|
||||
|
Mortgage loans held for sale
|
169,651
|
|
169,651
|
|
171,580
|
|
171,580
|
|
||||||||
|
Split dollar life insurance policies
|
206
|
|
206
|
|
209
|
|
209
|
|
||||||||
|
Commitments to extend real estate loans
|
989
|
|
989
|
|
271
|
|
271
|
|
||||||||
|
Whole loan contracts for committed IRLCs and mortgage loans held for sale
|
—
|
|
—
|
|
12
|
|
12
|
|
||||||||
|
Forward sales of mortgage-backed securities
|
—
|
|
—
|
|
177
|
|
177
|
|
||||||||
|
Liabilities:
|
||||||||||||||||
|
Notes payable - homebuilding operations
|
117,400
|
|
117,400
|
|
—
|
|
—
|
|
||||||||
|
Notes payable - financial services operations
|
153,168
|
|
153,168
|
|
168,195
|
|
168,195
|
|
||||||||
|
Notes payable - other
|
5,938
|
|
5,112
|
|
10,576
|
|
9,437
|
|
||||||||
|
Convertible senior subordinated notes due 2018
(a)
|
—
|
|
—
|
|
86,250
|
|
93,581
|
|
||||||||
|
Senior notes due 2021
(a)
|
300,000
|
|
298,500
|
|
300,000
|
|
310,875
|
|
||||||||
|
Senior notes due 2025
(a)
|
250,000
|
|
228,750
|
|
250,000
|
|
252,500
|
|
||||||||
|
Whole loan contracts for committed IRLCs and mortgage loans held for sale
|
154
|
|
154
|
|
—
|
|
—
|
|
||||||||
|
Forward sales of mortgage-backed securities
|
3,305
|
|
3,305
|
|
—
|
|
—
|
|
||||||||
|
Off-Balance Sheet Financial Instruments:
|
||||||||||||||||
|
Letters of credit
|
—
|
|
944
|
|
—
|
|
1,083
|
|
||||||||
|
(a)
|
Our senior notes and convertible senior subordinated notes are stated at the principal amount outstanding which does not include the impact of premiums, discounts, and debt issuance costs that are amortized to interest cost over the respective terms of the notes.
|
74
The following methods and assumptions were used by the Company in estimating its fair value disclosures of financial instruments at
December 31, 2018 and 2017
:
Cash, Cash Equivalents and Restricted Cash.
The carrying amounts of these items approximate fair value because they are short-term by nature.
Mortgage Loans Held for Sale, Forward Sales of Mortgage-Backed Securities, Commitments to Extend Real Estate Loans, Whole loan Contracts for Committed IRLCs and Mortgage Loans Held for Sale, Convertible Senior Subordinated Notes due 2018, Senior Notes due 2021 and Senior Notes due 2025.
The fair value of these financial instruments was determined based upon market quotes at
December 31, 2018 and 2017
. The market quotes used were quoted prices for similar assets or liabilities along with inputs taken from observable market data by correlation. The inputs were adjusted to account for the condition of the asset or liability.
Split Dollar Life Insurance Policy and Notes Receivable.
The estimated fair value was determined by calculating the present value of the amounts based on the estimated timing of receipts using discount rates that incorporate management’s estimate of risk associated with the corresponding note receivable.
Notes Payable - Homebuilding Operations.
The interest rate available to the Company during 2018 under the Company’s
$500 million
unsecured revolving credit facility, dated July 18, 2013, as amended (the “Credit Facility”), fluctuated daily with the one-month LIBOR rate plus a margin of
250
basis points, and thus the carrying value is a reasonable estimate of fair value. Please see
Note 11
to our Consolidated Financial Statements for additional information regarding the Credit Facility.
Notes Payable - Financial Services Operations.
M/I Financial is a party to two credit agreements: (1) a
$125 million
secured mortgage warehousing agreement (which increases to
$160 million
during certain periods), dated
June 24, 2016
, as amended (the “MIF Mortgage Warehousing Agreement”), and (2) a
$50 million
mortgage repurchase agreement (which increases to
$65 million
during certain periods), dated
October 30, 2017
, as amended (the “MIF Mortgage Repurchase Facility”). For each of these credit facilities, the interest rate is based on a variable rate index, and thus their carrying value is a reasonable estimate of fair value. The interest rate available to M/I Financial during 2018 fluctuated with LIBOR. Please see
Note 11
to our Consolidated Financial Statements for additional information regarding the MIF Mortgage Warehousing Agreement and the MIF Mortgage Repurchase Facility.
Notes Payable - Other.
The estimated fair value was determined by calculating the present value of the future cash flows using the Company’s current incremental borrowing rate.
Letters of Credit.
Letters of credit of
$52.7 million
and
$49.7 million
represent potential commitments at
December 31, 2018 and 2017
, respectively. The letters of credit generally expire within one or two years. The estimated fair value of letters of credit was determined using fees currently charged for similar agreements.
NOTE 4. Inventory
A summary of the Company’s inventory as of
December 31, 2018 and 2017
is as follows:
|
December 31,
|
|||||||
|
(In thousands)
|
2018
|
2017
|
|||||
|
Single-family lots, land and land development costs
|
$
|
778,943
|
|
$
|
687,260
|
|
|
|
Land held for sale
|
12,633
|
|
6,491
|
|
|||
|
Homes under construction
|
730,390
|
|
579,051
|
|
|||
|
Model homes and furnishings - at cost (less accumulated depreciation: December 31, 2018 - $13,441; December 31, 2017 - $12,715)
|
87,132
|
|
74,622
|
|
|||
|
Community development district infrastructure
|
12,392
|
|
13,049
|
|
|||
|
Land purchase deposits
|
33,662
|
|
32,556
|
|
|||
|
Consolidated inventory not owned
|
19,308
|
|
21,545
|
|
|||
|
Total inventory
|
$
|
1,674,460
|
|
$
|
1,414,574
|
|
|
Single-family lots, land and land development costs include raw land that the Company has purchased to develop into lots, costs incurred to develop the raw land into lots, and lots for which development has been completed, but which have not yet been used to start construction of a home.
Homes under construction include homes that are in various stages of construction. As of
December 31, 2018 and 2017
, we had
1,443
homes (with a carrying value of
$311.0 million
) and
1,134
homes (with a carrying value of
$242.7 million
), respectively, included in homes under construction that were not subject to a sales contract.
75
Model homes and furnishings include homes that are under construction or have been completed and are being used as sales models. The amount also includes the net book value of furnishings included in our model homes. Depreciation on model home furnishings is recorded using an accelerated method over the estimated useful life of the assets, which is typically three years.
The Company assesses inventory for recoverability on a quarterly basis. Please see Notes
1
and
3
to our Consolidated Financial Statements for additional details relating to our procedures for evaluating our inventories for impairment.
Land purchase deposits include both refundable and non-refundable amounts paid to third party sellers relating to the purchase of land. On an ongoing basis, the Company evaluates the land option agreements relating to the land purchase deposits. In the period during which the Company makes the decision not to proceed with the purchase of land under an agreement, the Company writes off any deposits and accumulated pre-acquisition costs relating to such agreement.
NOTE 5. Transactions with Related Parties
The Company made a contribution of
$0.5 million
in
2018
to the M/I Homes Foundation, a charitable organization having certain officers and directors of the Company on its Board of Trustees.
The Company had a receivable of
$0.2 million
at both
December 31, 2018 and 2017
due from an executive officer, relating to amounts owed to the Company for split-dollar life insurance policy premiums. The Company will collect the receivable either directly from the executive officer, if employment terminates other than by death, or from the executive officer’s beneficiary, if employment terminates due to death of the executive officer.
NOTE 6. Investment in Joint Venture Arrangements
The Company has periodically partnered with other land developers or homebuilders to share in the cost of land investment and development of a property through joint ownership and development agreements, joint ventures, and other similar arrangements. For such joint venture arrangements where a special purpose entity is established to own the property, we have determined that we do not have substantive control over any of these entities; therefore, the Company’s joint venture arrangements are recorded using the equity method of accounting. We believe the Company’s maximum exposure related to its investment in these joint venture arrangements as of
December 31, 2018
is the total amount invested of
$35.9 million
(reported as Investment in Joint Venture Arrangements on our Consolidated Balance Sheets), which amount may increase as a result of further investments that are expected as development of the properties progresses.
The Company evaluates its investment in joint venture arrangements for potential impairment on a quarterly basis. If the fair value of the investment (please see Notes
1
and
3
to our Consolidated Financial Statements) is less than the investment’s carrying value, and the Company determines the decline in value was other than temporary, the Company writes down the investment to fair value.
76
Summarized condensed combined financial information for the joint venture arrangements that are included in the homebuilding segments, and for which a special purpose entity was established, as of
December 31, 2018
and
2017
and for the years ended
December 31, 2018, 2017 and 2016
is as follows:
Summarized Condensed Combined Balance Sheets:
|
|
December 31,
|
|||||
|
(In thousands)
|
2018
|
2017
|
||||
|
Assets:
|
|
|
||||
|
Single-family lots, land and land development costs
(a) (b)
|
$
|
11,182
|
|
$
|
13,289
|
|
|
Other assets
|
938
|
|
5,143
|
|
||
|
Total assets
|
$
|
12,120
|
|
$
|
18,432
|
|
|
Liabilities and partners’ equity:
|
|
|
||||
|
Liabilities:
|
|
|
||||
|
Notes payable
|
$
|
2,318
|
|
$
|
261
|
|
|
Other liabilities
|
599
|
|
1,544
|
|
||
|
Total liabilities
|
2,917
|
|
1,805
|
|
||
|
Partners’ equity:
|
|
|
||||
|
Company’s equity
(a) (b)
|
$
|
2,525
|
|
$
|
8,328
|
|
|
Other equity
|
6,678
|
|
8,299
|
|
||
|
Total partners’ equity
|
$
|
9,203
|
|
$
|
16,627
|
|
|
Total liabilities and partners’ equity
|
$
|
12,120
|
|
$
|
18,432
|
|
|
(a)
|
For the
years ended December 31, 2018 and 2017
, impairment expenses and other miscellaneous adjustments totaling less than ($0.1 million) and
$1.7 million
, respectively, were excluded from the table above.
|
|
(b)
|
For the
years ended December 31, 2018 and 2017
, the table above excludes the Company’s investment in joint development arrangements for which a special purpose entity was not established, totaling
$33.3 million
and
$13.9 million
, respectively.
|
Summarized Condensed Combined Statements of Operations:
|
|
Year Ended December 31,
|
||||||||
|
(In thousands)
|
2018
|
2017
|
2016
|
||||||
|
Revenue
|
$
|
4,632
|
|
$
|
10,286
|
|
$
|
5,995
|
|
|
Costs and expenses
|
2,748
|
|
6,817
|
|
5,849
|
|
|||
|
Income
|
$
|
1,884
|
|
$
|
3,469
|
|
$
|
146
|
|
|
(a)
|
For the
years ended December 31, 2018 and 2017
, the table above excludes the Company’s investment in joint development arrangements for which a special purpose entity was not established.
|
The Company’s total equity in the income relating to the above homebuilding joint venture arrangements was
$0.3 million
for 2018 and
$0.5 million
for each of
2017
and
2016
.
NOTE 7. Guarantees and Indemnifications
In the ordinary course of business, M/I Financial enters into agreements that guarantee certain purchasers of its mortgage loans that M/I Financial will repurchase a loan if certain conditions occur, primarily if the mortgagor does not meet the terms of the loan within the first six months after the sale of the loan. Loans totaling approximately
$63.6 million
and
$46.8 million
were covered under these guarantees as of
December 31, 2018 and 2017
, respectively. The
increase
in loans covered by these guarantees from
December 31, 2017
is a result of a change in the mix of investors and their related purchase terms. A portion of the revenue paid to M/I Financial for providing the guarantees on these loans was deferred at
December 31, 2018
, and will be recognized in income as M/I Financial is released from its obligation under the guarantees. The risk associated with the guarantees above is offset by the value of the underlying assets.
M/I Financial has received inquiries concerning underwriting matters from purchasers of its loans regarding certain loans totaling approximately
$0.6 million
and
$1.2 million
at
December 31, 2018 and 2017
, respectively.
M/I Financial has also guaranteed the collectability of certain loans to third party insurers (U.S. Department of Housing and Urban Development and U.S. Veterans Administration) of those loans for periods ranging from five to thirty years. As of
December 31, 2018 and 2017
, the total of all loans indemnified to third party insurers relating to the above agreements was
$1.0 million
and
$1.3 million
, respectively. The maximum potential amount of future payments is equal to the outstanding loan value less the value of the underlying asset plus administrative costs incurred related to foreclosure on the loans, should this event occur.
77
The Company recorded a liability relating to the guarantees described above totaling
$0.6 million
and
$0.8 million
at
December 31, 2018 and 2017
, respectively, which is management’s best estimate of the Company’s liability with respect to such guarantees.
NOTE 8. Commitments and Contingencies
Warranty
Our warranty reserves are included in Other Liabilities in the Company’s Consolidated Balance Sheets, as further explained in
Note 1
to our Consolidated Financial Statements. A summary of warranty activity for the years ended
December 31, 2018, 2017 and 2016
is as follows:
|
Year Ended December 31,
|
|||||||||||
|
(In thousands)
|
2018
|
2017
|
2016
|
||||||||
|
Warranty reserves, beginning of period
|
$
|
26,133
|
|
$
|
27,732
|
|
$
|
14,282
|
|
||
|
Warranty expense on homes delivered during the period
|
13,456
|
|
11,677
|
|
10,452
|
|
|||||
|
Changes in estimates for pre-existing warranties
|
4,746
|
|
2,614
|
|
3,304
|
|
|||||
|
Charges related to stucco-related claims
(a)
|
—
|
|
8,500
|
|
19,409
|
|
|||||
|
Settlements made during the period
|
(17,876
|
)
|
(24,390
|
)
|
(19,715
|
)
|
|||||
|
Warranty reserves, end of period
|
$
|
26,459
|
|
$
|
26,133
|
|
$
|
27,732
|
|
||
|
(a)
|
These amounts represent charges for stucco-related repair costs net of recoveries from insurers during the period.
|
We have received claims related to stucco installation from homeowners in certain of our communities in our Tampa and Orlando, Florida markets and have been named as a defendant in legal proceedings initiated by certain of such homeowners. These claims primarily relate to homes built prior to 2014 which have second story elevations with frame construction.
During 2015, 2016 and 2017, we recorded an aggregate total of
$28.4 million
of warranty charges for stucco-related repair costs for (1) homes in our Florida communities that we had identified as needing repair but had not yet completed the repair and (2) estimated repair costs for homes in our Florida communities that we had not yet identified as needing repair but that may require repair in the future.
During the fourth quarter of 2018, as a result of our on-going review of stucco-related data described below, we incurred an additional stucco-related charge of
$1.0 million
. During the fourth quarter of 2018, we also received
$1.0 million
of recoveries from insurers for past stucco-related claims, resulting in a net charge of zero. Stucco-related insurance recoveries are recorded in the period the reimbursement is received.
The remaining reserve for both known repair costs and an estimate of future costs of stucco-related repairs at
December 31, 2018
included within our warranty reserve was
$6.3 million
. We believe that this amount is sufficient to cover both known and estimated future repair costs as of
December 31, 2018
. Our remaining stucco-related reserve is gross of any insurance recoveries.
Our review of the stucco-related issues in our Florida communities is ongoing. Our estimate of future costs of stucco-related repairs is based on our judgment, various assumptions and internal data. Due to the degree of judgment and the potential for variability in our underlying assumptions and data, as we obtain additional information, we may revise our estimate, including to reflect additional estimated future stucco-related repairs costs, which revision could be material.
We continue to investigate the extent to which we may be able to further recover a portion of our stucco repair and claims handling costs from other sources, including our direct insurers, the subcontractors involved with the construction of the homes and their insurers. As of
December 31, 2018
, we are unable to estimate any additional amount that we believe is probable of recovery from these sources and, as noted above, we have not recorded a receivable for recoveries nor included an estimated amount of recoveries in determining our stucco-related warranty reserve.
78
Performance Bonds and Letters of Credit
At
December 31, 2018
, the Company had outstanding approximately
$215.0 million
of completion bonds and standby letters of credit, some of which were issued to various local governmental entities that expire at various times through
September 2026
. Included in this total are: (1)
$155.4 million
of performance and maintenance bonds and
$42.4 million
of performance letters of credit that serve as completion bonds for land development work in progress; (2)
$10.3 million
of financial letters of credit, of which
$9.9 million
represent deposits on land and lot purchase agreements; and (3)
$6.9 million
of financial bonds.
Land Option Contracts and Other Similar Contracts
At
December 31, 2018
, the Company also had options and contingent purchase agreements to acquire land and developed lots with an aggregate purchase price of approximately
$636.4 million
. Purchase of properties under these agreements is contingent upon satisfaction of certain requirements by the Company and the sellers.
Legal Matters
In addition to the legal proceedings related to stucco, the Company and certain of its subsidiaries have been named as defendants in certain other legal proceedings which are incidental to our business. While management currently believes that the ultimate resolution of these other legal proceedings, individually and in the aggregate, will not have a material effect on the Company’s financial position, results of operations and cash flows, such legal proceedings are subject to inherent uncertainties. The Company has recorded a liability to provide for the anticipated costs, including legal defense costs, associated with the resolution of these other legal proceedings. However, the possibility exists that the costs to resolve these legal proceedings could differ from the recorded estimates and, therefore, have a material effect on the Company’s net income for the periods in which they are resolved. At both
December 31, 2018 and 2017
, we had
$0.4 million
reserved for legal expenses.
NOTE 9. Lease Commitments
Operating Leases.
The Company leases various office facilities, automobiles, model furnishings, and model homes under operating leases with remaining terms of one to nine years. The Company sells model homes to investors with the express purpose of leasing the homes back as sales models for a specified period of time. The Company records the sale of the home at the time of the home delivery, and defers profit on the sale, which is subsequently recognized over the lease term.
At
December 31, 2018
, the future minimum rental commitments totaled
$22.5 million
under non-cancelable operating leases with initial terms in excess of one year as follows:
2019
-
$5.5 million
;
2020
-
$4.4 million
;
2021
-
$4.1 million
;
2022
-
$3.8 million
;
2023
-
$2.8 million
; and
$1.9 million
thereafter. The Company’s total rental expense was
$8.2 million
,
$7.1 million
, and
$6.3 million
for
2018, 2017 and 2016
, respectively.
79
NOTE 10. Community Development District Infrastructure and Related Obligations
A Community Development District and/or Community Development Authority (“CDD”) is a unit of local government created under various state and/or local statutes to encourage planned community development and to allow for the construction and maintenance of long-term infrastructure through alternative financing sources, including the tax-exempt markets. A CDD is generally created through the approval of the local city or county in which the CDD is located and is controlled by a Board of Supervisors representing the landowners within the CDD. CDDs may utilize bond financing to fund construction or acquisition of certain on-site and off-site infrastructure improvements near or within these communities. CDDs are also granted the power to levy special assessments to impose ad valorem taxes, rates, fees and other charges for the use of the CDD project. An allocated share of the principal and interest on the bonds issued by the CDD is assigned to and constitutes a lien on each parcel within the community evidenced by an assessment (the “Assessment”). The owner of each such parcel is responsible for the payment of the Assessment on that parcel. If the owner of the parcel fails to pay the Assessment, the CDD may foreclose on the lien pursuant to powers conferred to the CDD under applicable state laws and/or foreclosure procedures. In connection with the development of certain of the Company’s communities, CDDs have been established and bonds have been issued to finance a portion of the related infrastructure. Following are details relating to such CDD bond obligations issued and outstanding as of
December 31, 2018
:
|
Issue Date
|
Maturity Date
|
Interest Rate
|
Principal Amount as of December 31, 2018
(in thousands)
|
Principal Amount as of December 31, 2017
(in thousands)
|
|||||
|
7/15/2004
|
12/1/2022
|
6.00%
|
$
|
—
|
|
$
|
2,922
|
|
|
|
7/15/2004
|
12/1/2036
|
6.25%
|
—
|
|
10,060
|
|
|||
|
7/22/2014
|
11/1/2045
|
5.28%
|
—
|
|
535
|
|
|||
|
12/23/2016
|
5/1/2047
|
6.20%
|
6,735
|
|
6,735
|
|
|||
|
12/22/2017
|
5/1/2048
|
5.13%
|
9,815
|
|
9,815
|
|
|||
|
9/24/2018
|
5/1/2049
|
5.09%
|
5,205
|
|
—
|
|
|||
|
Total CDD bond obligations issued and outstanding
|
$
|
21,755
|
|
$
|
30,067
|
|
|||
The Company records a liability for the estimated developer obligations that are probable and estimable and user fees that are required to be paid or transferred at the time the parcel or unit is sold to an end user. The Company reduces this liability by the corresponding Assessment assumed by property purchasers and the amounts paid by the Company at the time of closing and the transfer of the property. The Company recorded a
$12.4 million
and
$13.0 million
liability related to these CDD bond obligations as of
December 31, 2018
and
December 31, 2017
, respectively, along with the related inventory infrastructure.
NOTE 11. Debt
Notes Payable - Homebuilding
The Credit Facility provides an aggregate commitment amount of
$500 million
, including a
$125 million
sub-facility for letters of credit. The Credit Facility expires on
July 18, 2021
. Interest on amounts borrowed under the Credit Facility is payable at a rate which is adjusted daily and is equal to the sum of the one-month LIBOR rate plus a margin of
250
basis points. The margin is subject to adjustment in subsequent quarterly periods based on the Company’s leverage ratio.
The available amount under the Credit Facility is computed in accordance with a borrowing base, which is calculated by applying various advance rates for different categories of inventory, and totaled
$587.1 million
of availability for additional senior debt at
December 31, 2018
. As a result, the full
$500 million
commitment amount of the Credit Facility was available, less any borrowings and letters of credit outstanding. At
December 31, 2018
, there were
$117.4 million
borrowings outstanding and
$52.7 million
of letters of credit outstanding, leaving net remaining borrowing availability of
$329.9 million
.
The Company’s obligations under the Credit Facility are guaranteed by all of the Company’s subsidiaries, with the exception of subsidiaries that are primarily engaged in the business of mortgage financing, title insurance or similar financial businesses relating to the homebuilding and home sales business, certain subsidiaries that are not 100%-owned by the Company or another subsidiary, and other subsidiaries designated by the Company as Unrestricted Subsidiaries (as defined in
Note 16
to our Consolidated Financial Statements), subject to limitations on the aggregate amount invested in such Unrestricted Subsidiaries in accordance with the terms of the Credit Facility and the indentures for the Company’s
$250.0 million
aggregate principal amount of
5.625%
Senior Notes due 2025 (the “2025 Senior Notes”) and the Company’s
$300.0 million
aggregate principal amount of
6.75%
Senior Notes due 2021 (the “2021 Senior Notes”). The guarantors for the Credit Facility (the “Guarantor Subsidiaries”) are the same subsidiaries that guarantee the 2025 Senior Notes and the 2021 Senior Notes.
The Company’s obligations under the Credit Facility are general, unsecured senior obligations of the Company and the Guarantor Subsidiaries and rank equally in right of payment with all our and the Guarantor Subsidiaries’ existing and future unsecured senior
80
indebtedness. Our obligations under the Credit Facility are effectively subordinated to our and the Guarantor Subsidiaries’ existing and future secured indebtedness with respect to any assets comprising security or collateral for such indebtedness.
The Credit Facility contains various representations, warranties and covenants which require, among other things, that the Company maintain (1) a minimum level of Consolidated Tangible Net Worth of
$531.7 million
(subject to increase over time based on earnings and proceeds from equity offerings), (2) a leverage ratio not in excess of
60%
, and (3) either a minimum Interest Coverage Ratio of
1.5
to
1.0
or a minimum amount of available liquidity. In addition, the Credit Facility contains covenants that limit the Company's number of unsold housing units and model homes, as well as the amount of Investments in Unrestricted Subsidiaries and Joint Ventures. At
December 31, 2018
, the Company was in compliance with all financial covenants of the Credit Facility.
During
2018
, the Company was a party to a secured credit agreement (the “Letter of Credit Facility”) which allowed for the issuance of letters of credit up to a total of
$1.0 million
secured by cash collateral. The Company elected not to extend the maturity of its Letter of Credit Facility, which expired on September 30, 2018. There were
no
letters of credit remaining outstanding at the time of maturity. At December 31, 2017, there was
$0.6 million
of outstanding letters of credit in aggregate under the Letter of Credit Facility, which were collateralized with
$0.6 million
of the Company’s cash.
Notes Payable — Financial Services
The MIF Mortgage Warehousing Agreement is used to finance eligible residential mortgage loans originated by M/I Financial. The MIF Mortgage Warehousing Agreement provides for a maximum borrowing availability of
$125 million
which may be increased to
$160 million
during certain periods of expected increases in the volume of mortgage originations, specifically from September 25, 2018 to October 15, 2018 and from November 15, 2018 to February 4, 2019. The MIF Mortgage Warehousing Agreement expires on
June 21, 2019
. Interest on amounts borrowed under the MIF Mortgage Warehousing Agreement is payable at a per annum rate equal to the floating LIBOR rate plus a spread of
200
basis points. The MIF Mortgage Warehousing Agreement also contains certain financial covenants. At
December 31, 2018
, M/I Financial was in compliance with all financial covenants of the MIF Mortgage Warehousing Agreement.
The MIF Mortgage Repurchase Facility is used to finance eligible residential mortgage loans originated by M/I Financial. The MIF Mortgage Repurchase Facility provides for a mortgage repurchase facility with a maximum borrowing availability of
$50 million
, which may be increased to
$65 million
during certain periods of expected increases in the volume of mortgage originations, specifically from
November 15, 2018
through
February 1, 2019
. The MIF Mortgage Repurchase Facility expires on
October 28, 2019
. M/I Financial pays interest on each advance under the MIF Mortgage Repurchase Facility at a per annum rate equal to the floating LIBOR rate plus
200
or
225
basis points depending on the loan type. The MIF Mortgage Repurchase Facility also contains certain financial covenants. At
December 31, 2018
, M/I Financial was in compliance with all financial covenants of the MIF Mortgage Repurchase Facility.
At
December 31, 2018
and 2017, M/I Financial’s total combined maximum borrowing availability under the two credit facilities was
$225.0 million
, and
$200.0 million
, respectively. At
December 31, 2018
and
December 31, 2017
, M/I Financial had
$153.2 million
and
$168.2 million
outstanding on a combined basis under its credit facilities, respectively.
Senior Notes
As of both
December 31, 2018 and 2017
, we had
$250.0 million
of 2025 Senior Notes outstanding. The 2025 Senior Notes bear interest at a rate of
5.625%
per year, payable semiannually in arrears on February 1 and August 1 of each year, and mature on August 1, 2025. We may redeem all or any portion of the 2025 Senior Notes on or after August 1, 2020 at a stated redemption price, together with accrued and unpaid interest thereon. The redemption price will initially be
104.219%
of the principal amount outstanding, but will decline to
102.813%
of the principal amount outstanding if redeemed during the 12-month period beginning on August 1, 2021, will further decline to
101.406%
of the principal amount outstanding if redeemed during the 12-month period beginning on August 1, 2022 and will further decline to
100.000%
of the principal amount outstanding if redeemed on or after August 1, 2023, but prior to maturity.
As of both
December 31, 2018 and 2017
, we had
$300.0 million
of our 2021 Senior Notes outstanding. The 2021 Senior Notes bear interest at a rate of
6.75%
per year, payable semiannually in arrears on January 15 and July 15 of each year, and mature on January 15, 2021. As of January 15, 2019, we may redeem all or any portion of the 2021 Senior Notes at
101.688%
of the principal amount outstanding. This rate declines to
100.000%
of the principal amount outstanding if redeemed on or after January 15, 2020, but prior to maturity.
The 2025 Senior Notes and the 2021 Senior Notes contain certain covenants, as more fully described and defined in the indenture governing the 2025 Senior Notes and the indenture governing the 2021 Senior Notes, which limit the ability of the Company and the restricted subsidiaries to, among other things: incur additional indebtedness; make certain payments, including dividends, or
81
repurchase any shares, in an aggregate amount exceeding our “restricted payments basket”; make certain investments; and create or incur certain liens, consolidate or merge with or into other companies, or liquidate or sell or transfer all or substantially all of our assets. These covenants are subject to a number of exceptions and qualifications as described in the indenture governing the 2025 Senior Notes and the indenture governing the 2021 Senior Notes. As of
December 31, 2018
, the Company was in compliance with all terms, conditions, and covenants under the indentures.
The 2025 Senior Notes and the 2021 Senior Notes are fully and unconditionally guaranteed jointly and severally on a senior unsecured basis by the Guarantor Subsidiaries. The 2025 Senior Notes and the 2021 Senior Notes are general, unsecured senior obligations of the Company and the Guarantor Subsidiaries and rank equally in right of payment with all our and the Guarantor Subsidiaries’ existing and future unsecured senior indebtedness. The 2025 Senior Notes and the 2021 Senior Notes are effectively subordinated to our and the Guarantor Subsidiaries’ existing and future secured indebtedness with respect to any assets comprising security or collateral for such indebtedness.
The indenture governing our 2025 Senior Notes and the indenture governing our 2021 Senior Notes limit our ability to pay dividends on, and repurchase, our common shares and any of our preferred shares then outstanding to the amount of the positive balance in our “restricted payments basket,” as defined in the indentures. In each case, the “restricted payments basket” is equal to
$125.0 million
plus (1)
50%
of our aggregate consolidated net income (or minus
100%
of our aggregate consolidated net loss) from October 1, 2015, excluding income or loss from Unrestricted Subsidiaries, plus (2)
100%
of the net cash proceeds from either contributions to the common equity of the Company after December 1, 2015 or the sale of qualified equity interests after December 1, 2015, plus other items and subject to other exceptions. The positive balance in our restricted payments basket was
$215.2 million
and
$176.1 million
at
December 31, 2018 and 2017
, respectively. The determination to pay future dividends on, or make future repurchases of, our common shares will be at the discretion of our board of directors and will depend upon our results of operations, financial condition, capital requirements and compliance with debt covenants, and other factors deemed relevant by our board of directors.
Notes Payable - Other
The Company had other borrowings, which are reported in Notes Payable - Other in our Consolidated Balance Sheets, totaling
$5.9 million
and
$10.6 million
as of
December 31, 2018 and 2017
, respectively. The balance is made up of other notes payable acquired in the normal course of business. These other borrowings are included in the debt maturities schedule below.
Maturities over the next five years with respect to the Company’s debt as of
December 31, 2018
are as follows:
|
Year Ending December 31,
|
Debt Maturities (In thousands)
|
||
|
2019
|
$
|
154,600
|
|
|
2020
|
1,213
|
|
|
|
2021
|
418,893
|
|
|
|
2022
|
1,150
|
|
|
|
2023
|
650
|
|
|
|
Thereafter
|
250,000
|
|
|
|
Total
|
$
|
826,506
|
|
NOTE 12. Acquisition and Goodwill
Acquisition
In March 2018, we entered the Detroit, Michigan market through the acquisition of the homebuilding assets and operations of Pinnacle Homes for a purchase price of
$101.0 million
. The results of Pinnacle Homes’ operations have been included in our financial statements since March 1, 2018, the effective date of the acquisition. As a result of the transaction, we recorded
$16.4 million
of goodwill (all of which is tax deductible) which relates to expected synergies from establishing a market presence in Detroit, the experience and knowledge of the acquired workforce and the capital-efficient operating structure of the business acquired. The remaining basis of
$84.6 million
is almost entirely comprised of the fair value of the acquired inventory with an insignificant amount attributable to other assets and liabilities.
Goodwill
Goodwill represents the excess of the purchase price paid over the fair value of the net assets acquired and liabilities assumed in business combinations. In connection with the Company’s acquisition of the homebuilding assets and operations of Pinnacle Homes in Detroit, Michigan described above, the Company recorded goodwill of
$16.4 million
as of
December 31, 2018
, which
82
is included as Goodwill in our Consolidated Balance Sheets. This amount was based on the estimated fair values of the acquired assets and liabilities at the date of the acquisition in accordance with ASC 350.
In accordance with ASC 350, the Company analyzes goodwill for impairment on an annual basis (or more often if indicators of impairment exist). The Company performs a qualitative assessment to determine whether the existence of events or circumstances leads to a determination that it is more-likely-than-not that the fair value of a reporting unit is less than its carrying amount. If the qualitative assessment indicates that it is more-likely-than-not that the fair value of the reporting unit is less than its carrying amount, then a quantitative assessment is performed to determine the reporting unit’s fair value. If the reporting unit’s carrying value exceeds its fair value, then an impairment loss is recognized for the amount of the excess of the carrying amount over the reporting unit’s fair value. The Company performed its annual goodwill impairment analysis during the fourth quarter of 2018, and as no indicators for impairment existed at
December 31, 2018
, no impairment was recorded.
NOTE 13. Earnings Per Share
The table below presents a reconciliation between basic and diluted weighted average shares outstanding, net income available to common shareholders and basic and diluted income per share for the years ended
December 31, 2018, 2017 and 2016
:
|
Year Ended December 31,
|
|||||||||||
|
(In thousands, except per share amounts)
|
2018
|
2017
|
2016
|
||||||||
|
NUMERATOR
|
|||||||||||
|
Net income
|
$
|
107,663
|
|
$
|
72,081
|
|
$
|
56,609
|
|
||
|
Preferred stock dividends
(a)
|
—
|
|
(3,656
|
)
|
(4,875
|
)
|
|||||
|
Excess of fair value over book value of preferred shares redeemed
|
—
|
|
(2,257
|
)
|
—
|
|
|||||
|
Net income available to common shareholders
|
107,663
|
|
66,168
|
|
51,734
|
|
|||||
|
Interest on 3.25% convertible senior subordinated notes due 2017
(b)
|
—
|
|
1,106
|
|
1,520
|
|
|||||
|
Interest on 3.00% convertible senior subordinated notes due 2018
(c)
|
407
|
|
2,113
|
|
2,050
|
|
|||||
|
Diluted income available to common shareholders
|
$
|
108,070
|
|
$
|
69,387
|
|
$
|
55,304
|
|
||
|
DENOMINATOR
|
|||||||||||
|
Basic weighted average shares outstanding
|
28,234
|
|
25,769
|
|
24,666
|
|
|||||
|
Effect of dilutive securities:
|
|||||||||||
|
Stock option awards
|
295
|
|
342
|
|
216
|
|
|||||
|
Deferred compensation awards
|
219
|
|
221
|
|
149
|
|
|||||
|
3.25% convertible senior subordinated notes due 2017
(b)
|
—
|
|
1,687
|
|
2,416
|
|
|||||
|
3.00% convertible senior subordinated notes due 2018
(c)
|
430
|
|
2,669
|
|
2,669
|
|
|||||
|
Diluted weighted average shares outstanding - adjusted for assumed conversions
|
29,178
|
|
30,688
|
|
30,116
|
|
|||||
|
Earnings per common share
|
|||||||||||
|
Basic
|
$
|
3.81
|
|
$
|
2.57
|
|
$
|
2.10
|
|
||
|
Diluted
|
$
|
3.70
|
|
$
|
2.26
|
|
$
|
1.84
|
|
||
|
Anti-dilutive equity awards not included in the calculation of diluted earnings per common share
|
381
|
|
23
|
|
1,273
|
|
|||||
|
(a)
|
The Company’s Articles of Incorporation authorize the issuance of up to
2,000,000
preferred shares, par value
$.01
per share. On March 15, 2007, the Company issued
4,000,000
depositary shares, each representing 1/1000th of a
9.75%
Series A Preferred Share of the Company (the “Series A Preferred Shares”), or
4,000
Series A Preferred Shares in the aggregate. On April 10, 2013, the Company redeemed
2,000
of its Series A Preferred Shares (and the
2,000,000
related depositary shares) for an aggregate redemption price of approximately
$50.4 million
in cash. On October 16, 2017, the Company redeemed the remaining
2,000
outstanding Series A Preferred Shares (and the
2,000,000
related depositary shares) for an aggregate redemption price of approximately
$50.4 million
in cash. The Company declared and paid a quarterly cash dividend of
$609.375
per share on its then outstanding Series A Preferred Shares in each of the first three quarters of 2017 and in each quarter of 2016, for aggregate dividend payments on the Series A Preferred Shares of
$3.7 million
and
$4.9 million
for the years ended December 31, 2017 and 2016, respectively.
|
|
(b)
|
On September 11, 2012, the Company issued
$57.5 million
in aggregate principal amount of
3.25%
Convertible Senior Subordinated Notes due 2017 (the “2017 Convertible Senior Subordinated Notes”). The 2017 Convertible Senior Subordinated Notes were scheduled to mature on September 15, 2017 and the deadline for holders to convert the 2017 Convertible Senior Subordinated Notes was September 13, 2017. As a result of conversion elections made by holders of the 2017 Convertible Senior Subordinated Notes, all
$57.5 million
in aggregate principal amount of the 2017 Convertible Senior Subordinated Notes were converted and settled through the issuance of our common shares. In total, we issued approximately
2.4 million
common shares (at a conversion price per common share of
$23.80
).
|
|
(c)
|
On March 1, 2013, the Company issued
$86.3 million
in aggregate principal amount of
3.0%
Convertible Senior Subordinated Notes due 2018 (the “2018 Convertible Senior Subordinated Notes”). The 2018 Convertible Senior Subordinated Notes were scheduled to mature on March 1, 2018 and the deadline for holders to convert the 2018 Convertible Senior Subordinated Notes was February 27, 2018. As a result of conversion elections made by holders of the 2018 Convertible Senior Subordinated Notes, (1) approximately
$20.3 million
in aggregate principal amount of the 2018 Convertible Senior Subordinated Notes were converted and settled through the issuance of approximately
0.629 million
of our common shares (at a conversion price per common share of
$32.31
) and (2) the Company repaid in cash approximately
$65.9 million
in aggregate principal amount of the 2018 Convertible Senior Subordinated Notes at maturity.
|
For the
years ended December 31, 2018, 2017 and 2016
, the effect of our convertible debt outstanding was included in the diluted earnings per share calculations.
83
NOTE 14. Income Taxes
The Company records income taxes under the asset and liability method, whereby deferred tax assets and liabilities are recognized based on future tax consequences attributable to temporary differences between the financial statement carrying amounts of existing assets and liabilities and their respective tax bases and attributable to operating loss and tax credit carryforwards, if any. Deferred tax assets and liabilities are measured using enacted tax rates expected to apply in the years in which the temporary differences are expected to be recovered or paid.
During the fourth quarter of 2017, comprehensive federal tax legislation was enacted in the form of the 2017 Tax Act. The 2017 Tax Act makes broad and complex changes to the U.S. tax code, including, but not limited to, reducing the corporate income tax rate from 35% to 21%, eliminating the corporate alternative minimum tax, repealing the domestic production activity deduction, and limiting the deductibility of certain executive compensation.
The SEC staff issued SAB 118 in December 2017, which provides guidance on accounting for the tax effects of the 2017 Tax Act. SAB 118 provides that the measurement period for the tax effects of the 2017 Tax Act should not extend more than one year from the date the 2017 Tax Act was enacted. To the extent that a company's accounting for certain income tax effects of the 2017 Tax Act is incomplete but the company is able to determine a reasonable estimate, the company must record a provisional estimate in the financial statements. If a company cannot determine a provisional estimate to be included in the financial statements, it should continue to apply ASC 740 on the basis of the provisions of the tax laws that were in effect immediately before the 2017 Tax Act was enacted. As a result of the reduction in the corporate income tax rate, the Company revalued its deferred tax assets at December 31, 2017 and recognized a non-cash provisional tax expense of
$6.5 million
for the year ended December 31, 2017. We completed our accounting for the income tax effects of the 2017 Tax Act in 2018, and no material adjustments were required to the provisional amounts initially recorded.
In accordance with ASC 740
,
we evaluate our deferred tax assets, including the benefit from NOLs and tax credit carryforwards, if any, to determine if a valuation allowance is required. Companies must assess, using significant judgments, whether a valuation allowance should be established based on the consideration of all available evidence using a “more likely than not” standard with significant weight being given to evidence that can be objectively verified. This assessment gives appropriate consideration to all positive and negative evidence related to the realization of the deferred tax assets and considers, among other matters, the nature, frequency and severity of current and cumulative losses, forecasts of future profitability, the length of statutory carryforward periods, our experience with operating losses and our experience of utilizing tax credit carryforwards and tax planning alternatives. Based upon a review of all available evidence, we believe our deferred tax assets were fully realizable in all periods presented.
At
December 31, 2018
, the Company’s total deferred tax assets were
$20.2 million
which is offset by
$6.7 million
of total deferred tax liabilities for a
$13.5 million
net deferred tax asset which is reported on the Company’s Consolidated Balance Sheets.
The tax effects of the significant temporary differences that comprise the deferred tax assets and liabilities are as follows:
|
|
December 31,
|
|||||
|
(In thousands)
|
2018
|
2017
|
||||
|
Deferred tax assets:
|
|
|
||||
|
Warranty, insurance and other accruals
|
$
|
8,218
|
|
$
|
8,078
|
|
|
Equity-based compensation
|
4,096
|
|
3,250
|
|
||
|
Inventory
|
4,441
|
|
4,720
|
|
||
|
State taxes
|
185
|
|
160
|
|
||
|
Net operating loss carryforward
|
3,240
|
|
6,193
|
|
||
|
Deferred charges
|
—
|
|
506
|
|
||
|
Total deferred tax assets
|
$
|
20,180
|
|
$
|
22,907
|
|
|
Deferred tax liabilities:
|
|
|
||||
|
Federal effect of state deferred taxes
|
$
|
1,079
|
|
$
|
1,777
|
|
|
Depreciation
|
4,801
|
|
2,382
|
|
||
|
Prepaid expenses
|
285
|
|
310
|
|
||
|
Other
|
533
|
|
—
|
|
||
|
Total deferred tax liabilities
|
$
|
6,698
|
|
$
|
4,469
|
|
|
Net deferred tax asset
|
$
|
13,482
|
|
$
|
18,438
|
|
84
The provision from income taxes consists of the following:
|
|
Year Ended December 31,
|
||||||||
|
(In thousands)
|
2018
|
2017
|
2016
|
||||||
|
Current:
|
|||||||||
|
Federal
|
$
|
24,408
|
|
$
|
33,392
|
|
$
|
1,745
|
|
|
State
|
4,261
|
|
2,414
|
|
2,120
|
|
|||
|
$
|
28,669
|
|
$
|
35,806
|
|
$
|
3,865
|
|
|
|
|
Year Ended December 31,
|
||||||||
|
(In thousands)
|
2018
|
2017
|
2016
|
||||||
|
Deferred:
|
|||||||||
|
Federal
|
$
|
2,333
|
|
$
|
11,916
|
|
$
|
28,335
|
|
|
State
|
2,624
|
|
521
|
|
2,976
|
|
|||
|
$
|
4,957
|
|
$
|
12,437
|
|
$
|
31,311
|
|
|
|
Total
|
$
|
33,626
|
|
$
|
48,243
|
|
$
|
35,176
|
|
For
2018, 2017 and 2016
, the Company’s effective tax rate was
23.80%
,
40.09%
, and
38.32%
, respectively. The decrease in the effective tax rate was primarily attributable to the 2017 Tax Act which included the reduction of the corporate income tax rate from 35% to 21%, partially offset by the repeal of the domestic production activity deduction and other non-deductible costs. Also as a result of the 2017 Tax Act, the Company revalued its deferred tax assets and recognized a
$6.5 million
non-cash tax expense in 2017. Reconciliation of the differences between income taxes computed at the federal statutory tax rate and consolidated benefit from income taxes are as follows:
|
|
Year Ended December 31,
|
||||||||
|
(In thousands)
|
2018
|
2017
|
2016
|
||||||
|
Federal taxes at statutory rate
|
$
|
29,671
|
|
$
|
42,113
|
|
$
|
32,125
|
|
|
State and local taxes – net of federal tax benefit
|
5,636
|
|
3,420
|
|
3,652
|
|
|||
|
Change in state NOL deferred asset – net of federal tax benefit
|
—
|
|
—
|
|
729
|
|
|||
|
Deferred tax asset re-measurement as a result of 2017 Tax Act
|
—
|
|
6,520
|
|
—
|
|
|||
|
Equity Compensation
|
(254
|
)
|
(1,368
|
)
|
—
|
|
|||
|
Manufacturing deduction
|
—
|
|
(3,262
|
)
|
(1,298
|
)
|
|||
|
Federal tax credits
|
(2,817
|
)
|
—
|
|
—
|
|
|||
|
Other
|
1,390
|
|
820
|
|
(32
|
)
|
|||
|
Total
|
$
|
33,626
|
|
$
|
48,243
|
|
$
|
35,176
|
|
The Company files income tax returns in the U.S. federal jurisdiction, and various states. The Company is no longer subject to U.S. federal, state or local examinations by tax authorities for years before 2015. The Company is audited from time to time, and if any adjustments are made, they would be either immaterial or reserved.
The Company recognizes interest and penalties accrued related to unrecognized tax benefits in tax expense. At
December 31, 2018
,
2017
and
2016
, we had
no
unrecognized tax benefits due to the lapse of the statute of limitations and completion of audits in prior years. We believe that our current income tax filing positions and deductions will be sustained on audit and do not anticipate any adjustments that will result in a material change.
During 2016, the Company fully utilized its federal NOL carryforwards and federal credit carryforwards. The Company had
$2.6 million
of state NOL carryforwards, net of the federal benefit, at
December 31, 2018
. Our state NOLs may be carried forward from one to 15 years, depending on the tax jurisdiction, with
$0.9 million
expiring between 2022 and 2027 and
$1.7 million
expiring between 2028 and 2032, absent sufficient state taxable income.
NOTE 15. Business Segments
The Company’s chief operating decision makers evaluate the Company’s performance in various ways, including: (1) the results of our
16
individual homebuilding operating segments and the results of our financial services operations; (2) the results of our three homebuilding reportable segments; and (3) our consolidated financial results.
In accordance with ASC 280,
Segment Reporting
(“ASC 280”), we have identified each homebuilding division as an operating segment and have determined our reportable segments are as follows: Midwest homebuilding, Southern homebuilding, Mid-Atlantic homebuilding and financial services operations. The homebuilding operating segments that are included within each
85
reportable segment have been aggregated because they share similar aggregation characteristics as prescribed in ASC 280 in the following regards: (1) long-term economic characteristics; (2) historical and expected future long-term gross margin percentages; (3) housing products, production processes and methods of distribution; and (4) geographical proximity.
The homebuilding operating segments that comprise each of our reportable segments are as follows:
|
Midwest
|
Southern
|
Mid-Atlantic
|
|
Chicago, Illinois
|
Orlando, Florida
|
Charlotte, North Carolina
|
|
Cincinnati, Ohio
|
Sarasota, Florida
|
Raleigh, North Carolina
|
|
Columbus, Ohio
|
Tampa, Florida
|
Washington, D.C.
|
|
Indianapolis, Indiana
|
Austin, Texas
|
|
|
Minneapolis/St. Paul, Minnesota
|
Dallas/Fort Worth, Texas
|
|
|
Detroit, Michigan
|
Houston, Texas
|
|
|
San Antonio, Texas
|
||
The following table shows, by segment, revenue, operating income and interest expense for
2018, 2017 and 2016
, as well as the Company’s income before income taxes for such periods:
|
Year Ended December 31,
|
|||||||||||
|
(In thousands)
|
2018
|
2017
|
2016
|
||||||||
|
Revenue:
|
|||||||||||
|
Midwest homebuilding
|
$
|
933,119
|
|
$
|
742,577
|
|
$
|
637,894
|
|
||
|
Southern homebuilding
|
925,404
|
|
730,482
|
|
602,273
|
|
|||||
|
Mid-Atlantic homebuilding
|
375,563
|
|
439,219
|
|
409,149
|
|
|||||
|
Financial services
(a)
|
52,196
|
|
49,693
|
|
42,011
|
|
|||||
|
Total revenue
|
$
|
2,286,282
|
|
$
|
1,961,971
|
|
$
|
1,691,327
|
|
||
|
Operating income:
|
|||||||||||
|
Midwest homebuilding
(b)
|
$
|
86,131
|
|
$
|
81,522
|
|
$
|
70,446
|
|
||
|
Southern homebuilding
(c)
|
72,600
|
|
36,798
|
|
20,398
|
|
|||||
|
Mid-Atlantic homebuilding
|
23,312
|
|
35,598
|
|
33,450
|
|
|||||
|
Financial services
(a)
|
27,482
|
|
27,288
|
|
23,262
|
|
|||||
|
Less: Corporate selling, general and administrative expense
|
(46,364
|
)
|
(42,547
|
)
|
(38,813
|
)
|
|||||
|
Total operating income
(b) (c) (d)
|
$
|
163,161
|
|
$
|
138,659
|
|
$
|
108,743
|
|
||
|
Interest expense:
|
|||||||||||
|
Midwest homebuilding
|
$
|
7,142
|
|
$
|
5,010
|
|
$
|
3,754
|
|
||
|
Southern homebuilding
|
7,362
|
|
8,508
|
|
8,039
|
|
|||||
|
Mid-Atlantic homebuilding
|
2,711
|
|
2,599
|
|
3,693
|
|
|||||
|
Financial services
(a)
|
3,269
|
|
2,757
|
|
2,112
|
|
|||||
|
Total interest expense
|
$
|
20,484
|
|
$
|
18,874
|
|
$
|
17,598
|
|
||
|
Equity in income from joint venture arrangements
|
$
|
(312
|
)
|
$
|
(539
|
)
|
$
|
(640
|
)
|
||
|
Acquisition and integration costs
(e)
|
1,700
|
|
—
|
|
—
|
|
|||||
|
Income before income taxes
|
$
|
141,289
|
|
$
|
120,324
|
|
$
|
91,785
|
|
||
|
Depreciation and amortization:
|
|
|
|
||||||||
|
Midwest homebuilding
|
$
|
2,448
|
|
$
|
2,069
|
|
$
|
1,752
|
|
||
|
Southern homebuilding
|
3,210
|
|
3,014
|
|
2,525
|
|
|||||
|
Mid-Atlantic homebuilding
|
1,262
|
|
1,565
|
|
1,645
|
|
|||||
|
Financial services
|
1,281
|
|
1,503
|
|
1,948
|
|
|||||
|
Corporate
|
6,330
|
|
6,023
|
|
5,736
|
|
|||||
|
Total depreciation and amortization
|
$
|
14,531
|
|
$
|
14,174
|
|
$
|
13,606
|
|
||
|
(a)
|
Our financial services operational results should be viewed in connection with our homebuilding business as its operations originate loans and provide title services primarily for our homebuying customers, with the exception of an immaterial amount of mortgage refinancing.
|
|
(b)
|
Includes
$5.1 million
of charges related to purchase accounting adjustments taken during
2018
as a result of our acquisition of Pinnacle Homes in Detroit, Michigan on March 1, 2018.
|
|
(c)
|
Includes an
$8.5 million
and a
$19.4 million
charge for stucco-related repair costs in certain of our Florida communities (as more fully discussed in
Note 8
to our Consolidated Financial Statements) taken during
2017
and 2016, respectively.
|
|
(d)
|
For the
years ended December 31, 2018, 2017 and 2016
, total operating income was reduced by
$5.8 million
,
$7.7 million
and
$4.0 million
, respectively, related to asset impairment charges taken during the period.
|
|
(e)
|
Represents costs which include, but are not limited to, legal fees and expenses, travel and communication expenses, cost of appraisals, accounting fees and expenses, and miscellaneous expenses related to our acquisition of Pinnacle Homes. As these costs are not eligible for capitalization as initial direct costs, such amounts are expensed as incurred.
|
86
The following tables show total assets by segment at
December 31, 2018 and 2017
:
|
December 31, 2018
|
|||||||||||||||||||
|
(In thousands)
|
Midwest
|
Southern
|
Mid-Atlantic
|
Corporate, Financial Services and Unallocated
|
Total
|
||||||||||||||
|
Deposits on real estate under option or contract
|
$
|
5,725
|
|
$
|
21,758
|
|
$
|
6,179
|
|
$
|
—
|
|
$
|
33,662
|
|
||||
|
Inventory
(a)
|
696,057
|
|
717,248
|
|
227,493
|
|
—
|
|
1,640,798
|
|
|||||||||
|
Investments in joint venture arrangements
|
1,562
|
|
14,263
|
|
20,045
|
|
—
|
|
35,870
|
|
|||||||||
|
Other assets
|
19,524
|
|
32,161
|
|
(b)
|
10,925
|
|
248,641
|
|
(c)
|
311,251
|
|
|||||||
|
Total assets
|
$
|
722,868
|
|
$
|
785,430
|
|
$
|
264,642
|
|
$
|
248,641
|
|
$
|
2,021,581
|
|
||||
|
December 31, 2017
|
|||||||||||||||||||
|
(In thousands)
|
Midwest
|
Southern
|
Mid-Atlantic
|
Corporate, Financial Services and Unallocated
|
Total
|
||||||||||||||
|
Deposits on real estate under option or contract
|
$
|
4,933
|
|
$
|
20,719
|
|
$
|
6,904
|
|
$
|
—
|
|
$
|
32,556
|
|
||||
|
Inventory
(a)
|
500,671
|
|
636,019
|
|
245,328
|
|
—
|
|
1,382,018
|
|
|||||||||
|
Investments in joint venture arrangements
|
4,410
|
|
9,677
|
|
6,438
|
|
—
|
|
20,525
|
|
|||||||||
|
Other assets
|
13,573
|
|
38,784
|
|
(b)
|
13,311
|
|
364,004
|
|
(d)
|
429,672
|
|
|||||||
|
Total assets
|
$
|
523,587
|
|
$
|
705,199
|
|
$
|
271,981
|
|
$
|
364,004
|
|
$
|
1,864,771
|
|
||||
|
(a)
|
Inventory includes single-family lots, land and land development costs; land held for sale; homes under construction; model homes and furnishings; community development district infrastructure; and consolidated inventory not owned.
|
|
(b)
|
Includes development reimbursements from local municipalities.
|
|
(c)
|
Includes asset held for sale for
$5.6 million
.
|
|
(d)
|
The decrease in Corporate, Financial Services, and Unallocated other assets from prior year is related to a decline in in cash on hand from the end of 2017 .
|
NOTE 16. Supplemental Guarantor Information
The Company’s obligations under the 2025 Senior Notes and the 2021 Senior Notes are not guaranteed by all of the Company’s subsidiaries and therefore, the Company has disclosed condensed consolidating financial information in accordance with SEC Regulation S-X Rule 3-10,
Financial Statements of Guarantors and Issuers of Guaranteed Securities Registered or Being Registered.
The Guarantor Subsidiaries of the 2025 Senior Notes and the 2021 Senior Notes are the same.
The following condensed consolidating financial information includes balance sheets, statements of income and cash flow information for M/I Homes, Inc. (the parent company and the issuer of the aforementioned guaranteed notes), the Guarantor Subsidiaries, collectively, and for all other subsidiaries and joint ventures of the Company (the “Unrestricted Subsidiaries”), collectively. Each Guarantor Subsidiary is a direct or indirect 100%-owned subsidiary of M/I Homes, Inc. and has fully and unconditionally guaranteed the (1) 2025 Senior Notes, on a joint and several senior unsecured basis and (2) 2021 Senior Notes, on a joint and several senior unsecured basis.
There are no significant restrictions on the parent company’s ability to obtain funds from its Guarantor Subsidiaries in the form of a dividend, loan, or other means.
As of
December 31, 2018
, each of the Company’s subsidiaries is a Guarantor Subsidiary, with the exception of subsidiaries that are primarily engaged in the business of mortgage financing, title insurance or similar financial businesses relating to the homebuilding and home sales business, certain subsidiaries that are not 100%-owned by the Company or another subsidiary, and other subsidiaries designated by the Company as Unrestricted Subsidiaries, subject to limitations on the aggregate amount invested in such Unrestricted Subsidiaries in accordance with the terms of the Credit Facility and the indenture governing the 2025 Senior Notes and the indenture governing the 2021 Senior Notes.
In the condensed financial tables presented below, the parent company presents all of its 100%-owned subsidiaries as if they were accounted for under the equity method. All applicable corporate expenses have been allocated appropriately among the Guarantor Subsidiaries and Unrestricted Subsidiaries.
87
|
CONDENSED CONSOLIDATING STATEMENTS OF INCOME
|
||||||||||||||||
|
Year Ended December 31, 2018
|
||||||||||||||||
|
(In thousands)
|
M/I Homes, Inc.
|
Guarantor Subsidiaries
|
Unrestricted Subsidiaries
|
Eliminations
|
Consolidated
|
|||||||||||
|
Revenue
|
$
|
—
|
|
$
|
2,234,086
|
|
$
|
52,196
|
|
$
|
—
|
|
$
|
2,286,282
|
|
|
|
Costs and expenses:
|
||||||||||||||||
|
Land and housing
|
—
|
|
1,836,704
|
|
—
|
|
—
|
|
1,836,704
|
|
||||||
|
Impairment of inventory and investment in joint venture arrangements
|
—
|
|
5,809
|
|
—
|
|
—
|
|
5,809
|
|
||||||
|
Acquisition and integration costs
|
—
|
|
1,700
|
|
—
|
|
—
|
|
1,700
|
|
||||||
|
General and administrative
|
—
|
|
112,225
|
|
25,554
|
|
—
|
|
137,779
|
|
||||||
|
Selling
|
—
|
|
142,829
|
|
—
|
|
—
|
|
142,829
|
|
||||||
|
Equity in income from joint venture arrangements
|
—
|
|
—
|
|
(312
|
)
|
—
|
|
(312
|
)
|
||||||
|
Interest
|
—
|
|
17,215
|
|
3,269
|
|
—
|
|
20,484
|
|
||||||
|
Total costs and expenses
|
—
|
|
2,116,482
|
|
28,511
|
|
—
|
|
2,144,993
|
|
||||||
|
Income before income taxes
|
—
|
|
117,604
|
|
23,685
|
|
—
|
|
141,289
|
|
||||||
|
Provision for income taxes
|
—
|
|
28,545
|
|
5,081
|
|
—
|
|
33,626
|
|
||||||
|
Equity in subsidiaries
|
107,663
|
|
—
|
|
—
|
|
(107,663
|
)
|
—
|
|
||||||
|
Net income
|
$
|
107,663
|
|
$
|
89,059
|
|
$
|
18,604
|
|
$
|
(107,663
|
)
|
$
|
107,663
|
|
|
88
|
CONDENSED CONSOLIDATING STATEMENTS OF INCOME
|
||||||||||||||||
|
Year Ended December 31, 2017
|
||||||||||||||||
|
(In thousands)
|
M/I Homes, Inc.
|
Guarantor Subsidiaries
|
Unrestricted Subsidiaries
|
Eliminations
|
Consolidated
|
|||||||||||
|
Revenue
|
$
|
—
|
|
$
|
1,912,278
|
|
$
|
49,693
|
|
$
|
—
|
|
$
|
1,961,971
|
|
|
|
Costs and expenses:
|
||||||||||||||||
|
Land and housing
|
—
|
|
1,561,022
|
|
—
|
|
—
|
|
1,561,022
|
|
||||||
|
Impairment of inventory and investment in joint venture arrangements
|
—
|
|
7,681
|
|
—
|
|
—
|
|
7,681
|
|
||||||
|
General and administrative
|
—
|
|
103,094
|
|
23,188
|
|
—
|
|
126,282
|
|
||||||
|
Selling
|
—
|
|
128,327
|
|
—
|
|
—
|
|
128,327
|
|
||||||
|
Equity in income from joint venture arrangements
|
—
|
|
—
|
|
(539
|
)
|
—
|
|
(539
|
)
|
||||||
|
Interest
|
—
|
|
16,117
|
|
2,757
|
|
—
|
|
18,874
|
|
||||||
|
Total costs and expenses
|
—
|
|
1,816,241
|
|
25,406
|
|
—
|
|
1,841,647
|
|
||||||
|
Income before income taxes
|
—
|
|
96,037
|
|
24,287
|
|
—
|
|
120,324
|
|
||||||
|
Provision for income taxes
|
—
|
|
40,570
|
|
7,673
|
|
—
|
|
48,243
|
|
||||||
|
Equity in subsidiaries
|
72,081
|
|
—
|
|
—
|
|
(72,081
|
)
|
—
|
|
||||||
|
Net income
|
$
|
72,081
|
|
$
|
55,467
|
|
$
|
16,614
|
|
$
|
(72,081
|
)
|
$
|
72,081
|
|
|
|
Preferred dividends
|
3,656
|
|
—
|
|
—
|
|
—
|
|
3,656
|
|
||||||
|
Excess of fair value over book value of preferred shares redeemed
|
2,257
|
|
—
|
|
—
|
|
—
|
|
2,257
|
|
||||||
|
Net income available to common shareholders
|
$
|
66,168
|
|
$
|
55,467
|
|
$
|
16,614
|
|
$
|
(72,081
|
)
|
$
|
66,168
|
|
|
|
Year Ended December 31, 2016
|
||||||||||||||||
|
(In thousands)
|
M/I Homes, Inc.
|
Guarantor Subsidiaries
|
Unrestricted Subsidiaries
|
Eliminations
|
Consolidated
|
|||||||||||
|
Revenue
|
$
|
—
|
|
$
|
1,649,316
|
|
$
|
42,011
|
|
$
|
—
|
|
$
|
1,691,327
|
|
|
|
Costs and expenses:
|
||||||||||||||||
|
Land and housing
|
—
|
|
1,358,183
|
|
—
|
|
—
|
|
1,358,183
|
|
||||||
|
Impairment of inventory and investment in joint venture arrangements
|
—
|
|
3,992
|
|
—
|
|
—
|
|
3,992
|
|
||||||
|
General and administrative
|
—
|
|
92,135
|
|
19,465
|
|
—
|
|
111,600
|
|
||||||
|
Selling
|
—
|
|
108,809
|
|
—
|
|
—
|
|
108,809
|
|
||||||
|
Equity in income from joint venture arrangements
|
—
|
|
—
|
|
(640
|
)
|
—
|
|
(640
|
)
|
||||||
|
Interest
|
—
|
|
15,486
|
|
2,112
|
|
—
|
|
17,598
|
|
||||||
|
Total costs and expenses
|
—
|
|
1,578,605
|
|
20,937
|
|
—
|
|
1,599,542
|
|
||||||
|
Income before income taxes
|
—
|
|
70,711
|
|
21,074
|
|
—
|
|
91,785
|
|
||||||
|
Provision for income taxes
|
—
|
|
28,161
|
|
7,015
|
|
—
|
|
35,176
|
|
||||||
|
Equity in subsidiaries
|
56,609
|
|
—
|
|
—
|
|
(56,609
|
)
|
—
|
|
||||||
|
Net income
|
$
|
56,609
|
|
$
|
42,550
|
|
$
|
14,059
|
|
$
|
(56,609
|
)
|
$
|
56,609
|
|
|
|
Preferred dividends
|
4,875
|
|
—
|
|
—
|
|
—
|
|
4,875
|
|
||||||
|
Net income available to common shareholders
|
$
|
51,734
|
|
$
|
42,550
|
|
$
|
14,059
|
|
$
|
(56,609
|
)
|
$
|
51,734
|
|
|
89
|
CONDENSED CONSOLIDATING BALANCE SHEET
|
||||||||||||||||
|
December 31, 2018
|
||||||||||||||||
|
(In thousands)
|
M/I Homes, Inc.
|
Guarantor Subsidiaries
|
Unrestricted Subsidiaries
|
Eliminations
|
Consolidated
|
|||||||||||
|
ASSETS:
|
||||||||||||||||
|
Cash, cash equivalents and restricted cash
|
$
|
—
|
|
$
|
5,554
|
|
$
|
15,975
|
|
$
|
—
|
|
$
|
21,529
|
|
|
|
Mortgage loans held for sale
|
—
|
|
—
|
|
169,651
|
|
—
|
|
169,651
|
|
||||||
|
Inventory
|
—
|
|
1,674,460
|
|
—
|
|
—
|
|
1,674,460
|
|
||||||
|
Property and equipment - net
|
—
|
|
28,485
|
|
910
|
|
—
|
|
29,395
|
|
||||||
|
Investment in joint venture arrangements
|
—
|
|
33,297
|
|
2,573
|
|
—
|
|
35,870
|
|
||||||
|
Investment in subsidiaries
|
817,986
|
|
—
|
|
—
|
|
(817,986
|
)
|
—
|
|
||||||
|
Deferred income taxes, net of valuation allowances
|
—
|
|
13,482
|
|
—
|
|
—
|
|
13,482
|
|
||||||
|
Intercompany assets
|
579,447
|
|
—
|
|
—
|
|
(579,447
|
)
|
—
|
|
||||||
|
Goodwill
|
—
|
|
16,400
|
|
—
|
|
—
|
|
16,400
|
|
||||||
|
Other assets
|
2,325
|
|
47,738
|
|
10,731
|
|
—
|
|
60,794
|
|
||||||
|
TOTAL ASSETS
|
$
|
1,399,758
|
|
$
|
1,819,416
|
|
$
|
199,840
|
|
$
|
(1,397,433
|
)
|
$
|
2,021,581
|
|
|
|
|
||||||||||||||||
|
LIABILITIES AND SHAREHOLDERS’ EQUITY
|
|
|||||||||||||||
|
|
||||||||||||||||
|
LIABILITIES:
|
|
|||||||||||||||
|
Accounts payable
|
$
|
—
|
|
$
|
131,089
|
|
$
|
422
|
|
$
|
—
|
|
$
|
131,511
|
|
|
|
Customer deposits
|
—
|
|
32,055
|
|
—
|
|
—
|
|
32,055
|
|
||||||
|
Intercompany liabilities
|
—
|
|
578,498
|
|
949
|
|
(579,447
|
)
|
—
|
|
||||||
|
Other liabilities
|
—
|
|
140,860
|
|
9,191
|
|
—
|
|
150,051
|
|
||||||
|
Community development district obligations
|
—
|
|
12,392
|
|
—
|
|
—
|
|
12,392
|
|
||||||
|
Obligation for consolidated inventory not owned
|
—
|
|
19,308
|
|
—
|
|
—
|
|
19,308
|
|
||||||
|
Notes payable bank - homebuilding operations
|
—
|
|
117,400
|
|
—
|
|
—
|
|
117,400
|
|
||||||
|
Notes payable bank - financial services operations
|
—
|
|
—
|
|
153,168
|
|
—
|
|
153,168
|
|
||||||
|
Notes payable - other
|
—
|
|
5,938
|
|
—
|
|
—
|
|
5,938
|
|
||||||
|
Senior notes due 2021 - net
|
297,884
|
|
—
|
|
—
|
|
—
|
|
297,884
|
|
||||||
|
Senior notes due 2025 - net
|
246,571
|
|
—
|
|
—
|
|
—
|
|
246,571
|
|
||||||
|
TOTAL LIABILITIES
|
544,455
|
|
1,037,540
|
|
163,730
|
|
(579,447
|
)
|
1,166,278
|
|
||||||
|
Shareholders’ equity
|
855,303
|
|
781,876
|
|
36,110
|
|
(817,986
|
)
|
855,303
|
|
||||||
|
TOTAL LIABILITIES AND SHAREHOLDERS’ EQUITY
|
$
|
1,399,758
|
|
$
|
1,819,416
|
|
$
|
199,840
|
|
$
|
(1,397,433
|
)
|
$
|
2,021,581
|
|
|
90
|
CONDENSED CONSOLIDATING BALANCE SHEET
|
||||||||||||||||
|
December 31, 2017
|
||||||||||||||||
|
(In thousands)
|
M/I Homes, Inc.
|
Guarantor Subsidiaries
|
Unrestricted Subsidiaries
|
Eliminations
|
Consolidated
|
|||||||||||
|
ASSETS:
|
||||||||||||||||
|
Cash, cash equivalents and restricted cash
|
$
|
—
|
|
$
|
131,522
|
|
$
|
20,181
|
|
$
|
—
|
|
$
|
151,703
|
|
|
|
Mortgage loans held for sale
|
—
|
|
—
|
|
171,580
|
|
—
|
|
171,580
|
|
||||||
|
Inventory
|
—
|
|
1,414,574
|
|
—
|
|
—
|
|
1,414,574
|
|
||||||
|
Property and equipment - net
|
—
|
|
25,815
|
|
1,001
|
|
—
|
|
26,816
|
|
||||||
|
Investment in joint venture arrangements
|
—
|
|
13,930
|
|
6,595
|
|
—
|
|
20,525
|
|
||||||
|
Investment in subsidiaries
|
722,508
|
|
—
|
|
—
|
|
(722,508
|
)
|
—
|
|
||||||
|
Deferred income tax asset
|
—
|
|
18,438
|
|
—
|
|
—
|
|
18,438
|
|
||||||
|
Intercompany assets
|
650,599
|
|
—
|
|
—
|
|
(650,599
|
)
|
—
|
|
||||||
|
Other assets
|
3,154
|
|
48,430
|
|
9,551
|
|
—
|
|
61,135
|
|
||||||
|
TOTAL ASSETS
|
$
|
1,376,261
|
|
$
|
1,652,709
|
|
$
|
208,908
|
|
$
|
(1,373,107
|
)
|
$
|
1,864,771
|
|
|
|
|
||||||||||||||||
|
LIABILITIES AND SHAREHOLDERS’ EQUITY
|
|
|||||||||||||||
|
|
||||||||||||||||
|
LIABILITIES:
|
|
|||||||||||||||
|
Accounts payable
|
$
|
—
|
|
$
|
116,773
|
|
$
|
460
|
|
$
|
—
|
|
$
|
117,233
|
|
|
|
Customer deposits
|
—
|
|
26,378
|
|
—
|
|
—
|
|
26,378
|
|
||||||
|
Intercompany liabilities
|
—
|
|
645,048
|
|
5,551
|
|
(650,599
|
)
|
—
|
|
||||||
|
Other liabilities
|
—
|
|
126,522
|
|
5,012
|
|
—
|
|
131,534
|
|
||||||
|
Community development district obligations
|
—
|
|
13,049
|
|
—
|
|
—
|
|
13,049
|
|
||||||
|
Obligation for consolidated inventory not owned
|
—
|
|
21,545
|
|
—
|
|
—
|
|
21,545
|
|
||||||
|
Notes payable bank - financial services operations
|
—
|
|
—
|
|
168,195
|
|
—
|
|
168,195
|
|
||||||
|
Notes payable - other
|
—
|
|
10,576
|
|
—
|
|
—
|
|
10,576
|
|
||||||
|
Convertible senior subordinated notes due 2018 - net
|
86,132
|
|
—
|
|
—
|
|
—
|
|
86,132
|
|
||||||
|
Senior notes due 2021 - net
|
296,780
|
|
—
|
|
—
|
|
—
|
|
296,780
|
|
||||||
|
Senior notes due 2025 - net
|
246,051
|
|
—
|
|
—
|
|
—
|
|
246,051
|
|
||||||
|
TOTAL LIABILITIES
|
628,963
|
|
959,891
|
|
179,218
|
|
(650,599
|
)
|
1,117,473
|
|
||||||
|
Shareholders’ equity
|
747,298
|
|
692,818
|
|
29,690
|
|
(722,508
|
)
|
747,298
|
|
||||||
|
TOTAL LIABILITIES AND SHAREHOLDERS’ EQUITY
|
$
|
1,376,261
|
|
$
|
1,652,709
|
|
$
|
208,908
|
|
$
|
(1,373,107
|
)
|
$
|
1,864,771
|
|
|
91
|
CONDENSED CONSOLIDATING STATEMENTS OF CASH FLOWS
|
||||||||||||||||
|
Year Ended December 31, 2018
|
||||||||||||||||
|
(In thousands)
|
M/I Homes, Inc.
|
Guarantor Subsidiaries
|
Unrestricted Subsidiaries
|
Eliminations
|
Consolidated
|
|||||||||||
|
CASH FLOWS FROM OPERATING ACTIVITIES:
|
||||||||||||||||
|
Net cash provided by (used in) operating activities
|
$
|
12,185
|
|
$
|
(25,882
|
)
|
$
|
23,290
|
|
$
|
(12,185
|
)
|
$
|
(2,592
|
)
|
|
|
CASH FLOWS FROM INVESTING ACTIVITIES:
|
||||||||||||||||
|
Purchase of property and equipment
|
—
|
|
(7,896
|
)
|
(245
|
)
|
—
|
|
(8,141
|
)
|
||||||
|
Acquisition, net of cash acquired
|
—
|
|
(100,960
|
)
|
—
|
|
—
|
|
(100,960
|
)
|
||||||
|
Proceeds from the sale of mortgage servicing rights
|
—
|
|
—
|
|
6,335
|
|
—
|
|
6,335
|
|
||||||
|
Intercompany investing
|
12,986
|
|
—
|
|
—
|
|
(12,986
|
)
|
—
|
|
||||||
|
Investments in and advances to joint venture arrangements
|
—
|
|
(30,588
|
)
|
(1,279
|
)
|
—
|
|
(31,867
|
)
|
||||||
|
Return of capital from joint venture arrangements
|
—
|
|
—
|
|
676
|
|
—
|
|
676
|
|
||||||
|
Net cash provided by (used in) investing activities
|
12,986
|
|
(139,444
|
)
|
5,487
|
|
(12,986
|
)
|
(133,957
|
)
|
||||||
|
CASH FLOWS FROM FINANCING ACTIVITIES:
|
||||||||||||||||
|
Repayment of convertible senior subordinated notes
|
—
|
|
(65,941
|
)
|
—
|
|
—
|
|
(65,941
|
)
|
||||||
|
Proceeds from bank borrowings - homebuilding operations
|
—
|
|
666,600
|
|
—
|
|
—
|
|
666,600
|
|
||||||
|
Principal repayments of bank borrowings - homebuilding operations
|
—
|
|
(549,200
|
)
|
—
|
|
—
|
|
(549,200
|
)
|
||||||
|
Net repayments of bank borrowings - financial services operations
|
—
|
|
—
|
|
(15,027
|
)
|
—
|
|
(15,027
|
)
|
||||||
|
Proceeds from notes payable - other and CDD bond obligations
|
—
|
|
(4,638
|
)
|
—
|
|
—
|
|
(4,638
|
)
|
||||||
|
Dividends paid
|
—
|
|
—
|
|
(12,185
|
)
|
12,185
|
|
—
|
|
||||||
|
Repurchase of common shares
|
(25,709
|
)
|
—
|
|
—
|
|
—
|
|
(25,709
|
)
|
||||||
|
Intercompany financing
|
—
|
|
(7,388
|
)
|
(5,598
|
)
|
12,986
|
|
—
|
|
||||||
|
Debt issue costs
|
—
|
|
(75
|
)
|
(173
|
)
|
—
|
|
(248
|
)
|
||||||
|
Proceeds from exercise of stock options
|
538
|
|
—
|
|
—
|
|
—
|
|
538
|
|
||||||
|
Net cash (used in) provided by financing activities
|
(25,171
|
)
|
39,358
|
|
(32,983
|
)
|
25,171
|
|
6,375
|
|
||||||
|
Net decrease in cash, cash equivalents and restricted cash
|
—
|
|
(125,968
|
)
|
(4,206
|
)
|
—
|
|
(130,174
|
)
|
||||||
|
Cash, cash equivalents and restricted cash balance at beginning of period
|
—
|
|
131,522
|
|
20,181
|
|
—
|
|
151,703
|
|
||||||
|
Cash, cash equivalents and restricted cash balance at end of period
|
$
|
—
|
|
$
|
5,554
|
|
$
|
15,975
|
|
$
|
—
|
|
$
|
21,529
|
|
|
92
|
CONDENSED CONSOLIDATING STATEMENT OF CASH FLOWS
|
||||||||||||||||
|
Year Ended December 31, 2017
|
||||||||||||||||
|
(In thousands)
|
M/I Homes, Inc.
|
Guarantor Subsidiaries
|
Unrestricted Subsidiaries
|
Eliminations
|
Consolidated
|
|||||||||||
|
CASH FLOWS FROM OPERATING ACTIVITIES:
|
||||||||||||||||
|
Net cash provided by (used in) operating activities
|
$
|
15,581
|
|
$
|
(63,922
|
)
|
$
|
10,738
|
|
$
|
(15,581
|
)
|
$
|
(53,184
|
)
|
|
|
CASH FLOWS FROM INVESTING ACTIVITIES:
|
||||||||||||||||
|
Purchase of property and equipment
|
—
|
|
(8,535
|
)
|
(264
|
)
|
—
|
|
(8,799
|
)
|
||||||
|
Intercompany investing
|
27,270
|
|
—
|
|
—
|
|
(27,270
|
)
|
—
|
|
||||||
|
Investments in and advances to joint venture arrangements
|
—
|
|
(6,117
|
)
|
(5,971
|
)
|
—
|
|
(12,088
|
)
|
||||||
|
Return of capital from joint venture arrangements
|
—
|
|
—
|
|
3,518
|
|
—
|
|
3,518
|
|
||||||
|
Proceeds from the sale of mortgage servicing rights
|
—
|
|
—
|
|
8,212
|
|
—
|
|
8,212
|
|
||||||
|
Net cash provided by (used in) investing activities
|
27,270
|
|
(14,652
|
)
|
5,495
|
|
(27,270
|
)
|
(9,157
|
)
|
||||||
|
CASH FLOWS FROM FINANCING ACTIVITIES:
|
||||||||||||||||
|
Redemption of preferred shares
|
(50,420
|
)
|
—
|
|
—
|
|
—
|
|
(50,420
|
)
|
||||||
|
Proceeds from issuance of senior notes
|
—
|
|
250,000
|
|
—
|
|
—
|
|
250,000
|
|
||||||
|
Proceeds from bank borrowings - homebuilding operations
|
—
|
|
398,300
|
|
—
|
|
—
|
|
398,300
|
|
||||||
|
Principal repayments of bank borrowings - homebuilding operations
|
—
|
|
(438,600
|
)
|
—
|
|
—
|
|
(438,600
|
)
|
||||||
|
Net proceeds from bank borrowings - financial services operations
|
—
|
|
—
|
|
15,300
|
|
—
|
|
15,300
|
|
||||||
|
Principal repayments of notes payable - other and CDD bond obligations
|
—
|
|
4,161
|
|
—
|
|
—
|
|
4,161
|
|
||||||
|
Dividends paid
|
(3,656
|
)
|
—
|
|
(15,581
|
)
|
15,581
|
|
(3,656
|
)
|
||||||
|
Intercompany financing
|
—
|
|
(18,143
|
)
|
(9,127
|
)
|
27,270
|
|
—
|
|
||||||
|
Debt issue costs
|
—
|
|
(6,549
|
)
|
(158
|
)
|
—
|
|
(6,707
|
)
|
||||||
|
Proceeds from exercise of stock options
|
11,225
|
|
—
|
|
—
|
|
—
|
|
11,225
|
|
||||||
|
Net cash (used in) provided by financing activities
|
(42,851
|
)
|
189,169
|
|
(9,566
|
)
|
42,851
|
|
179,603
|
|
||||||
|
Net increase in cash, cash equivalents and restricted cash
|
—
|
|
110,595
|
|
6,667
|
|
—
|
|
117,262
|
|
||||||
|
Cash, cash equivalents and restricted cash balance at beginning of period
|
—
|
|
20,927
|
|
13,514
|
|
—
|
|
34,441
|
|
||||||
|
Cash, cash equivalents and restricted cash balance at end of period
|
$
|
—
|
|
$
|
131,522
|
|
$
|
20,181
|
|
$
|
—
|
|
$
|
151,703
|
|
|
93
|
CONDENSED CONSOLIDATING STATEMENT OF CASH FLOWS
|
||||||||||||||||
|
Year Ended December 31, 2016
|
||||||||||||||||
|
(In thousands)
|
M/I Homes, Inc.
|
Guarantor Subsidiaries
|
Unrestricted Subsidiaries
|
Eliminations
|
Consolidated
|
|||||||||||
|
CASH FLOWS FROM OPERATING ACTIVITIES:
|
||||||||||||||||
|
Net cash provided by (used in) operating activities
|
$
|
11,653
|
|
$
|
42,572
|
|
$
|
(8,375
|
)
|
$
|
(11,653
|
)
|
$
|
34,197
|
|
|
|
CASH FLOWS FROM INVESTING ACTIVITIES:
|
||||||||||||||||
|
Purchase of property and equipment
|
—
|
|
(12,505
|
)
|
(601
|
)
|
—
|
|
(13,106
|
)
|
||||||
|
Investments in and advances to joint venture arrangements
|
—
|
|
(13,764
|
)
|
(7,982
|
)
|
—
|
|
(21,746
|
)
|
||||||
|
Return of capital from joint venture arrangements
|
—
|
|
—
|
|
3,207
|
|
—
|
|
3,207
|
|
||||||
|
Intercompany investing
|
(6,960
|
)
|
—
|
|
—
|
|
6,960
|
|
—
|
|
||||||
|
Net cash (used in) provided by investing activities
|
(6,960
|
)
|
(26,269
|
)
|
(5,376
|
)
|
6,960
|
|
(31,645
|
)
|
||||||
|
CASH FLOWS FROM FINANCING ACTIVITIES:
|
||||||||||||||||
|
Proceeds from bank borrowings - homebuilding operations
|
—
|
|
351,500
|
|
—
|
|
—
|
|
351,500
|
|
||||||
|
Principal repayments of bank borrowings - homebuilding operations
|
—
|
|
(355,000
|
)
|
—
|
|
—
|
|
(355,000
|
)
|
||||||
|
Net proceeds from bank borrowings - financial services operations
|
—
|
|
—
|
|
29,247
|
|
—
|
|
29,247
|
|
||||||
|
Principal repayments of note payable - other and CDD bond obligations
|
—
|
|
(2,026
|
)
|
—
|
|
—
|
|
(2,026
|
)
|
||||||
|
Dividends paid
|
(4,875
|
)
|
—
|
|
(11,653
|
)
|
11,653
|
|
(4,875
|
)
|
||||||
|
Intercompany financing
|
—
|
|
7,407
|
|
(8,398
|
)
|
991
|
|
—
|
|
||||||
|
Debt issue costs
|
—
|
|
(153
|
)
|
(87
|
)
|
—
|
|
(240
|
)
|
||||||
|
Proceeds from exercise of stock options
|
182
|
|
—
|
|
—
|
|
—
|
|
182
|
|
||||||
|
Net cash (used in) provided by financing activities
|
(4,693
|
)
|
1,728
|
|
9,109
|
|
12,644
|
|
18,788
|
|
||||||
|
Net increase (decrease) in cash, cash equivalents and restricted cash
|
—
|
|
18,031
|
|
(4,642
|
)
|
7,951
|
|
21,340
|
|
||||||
|
Cash, cash equivalents and restricted cash balance at beginning of period
|
—
|
|
2,896
|
|
18,156
|
|
(7,951
|
)
|
13,101
|
|
||||||
|
Cash, cash equivalents and restricted cash balance at end of period
|
$
|
—
|
|
$
|
20,927
|
|
$
|
13,514
|
|
$
|
—
|
|
$
|
34,441
|
|
|
94
NOTE 17. Supplementary Financial Data
The following tables set forth our selected consolidated financial and operating data for the quarterly periods indicated.
|
|
March 31, 2018
|
June 30,
2018 |
September 30, 2018
|
December 31, 2018
|
||||||||
|
|
||||||||||||
|
(In thousands, except per share amounts)
|
(Unaudited)
|
(Unaudited)
|
(Unaudited)
|
(Unaudited)
|
||||||||
|
Revenue
|
$
|
437,857
|
|
$
|
558,098
|
|
$
|
567,842
|
|
$
|
722,485
|
|
|
Gross margin
(a)
|
$
|
89,155
|
|
$
|
108,762
|
|
$
|
115,813
|
|
$
|
130,039
|
|
|
Net income to common shareholders
(a)
|
$
|
18,063
|
|
$
|
27,911
|
|
$
|
29,282
|
|
$
|
32,407
|
|
|
Earnings per common share:
(c)
|
|
|
|
|
|
|
|
|
||||
|
Basic
|
$
|
0.64
|
|
$
|
0.98
|
|
$
|
1.03
|
|
$
|
1.17
|
|
|
Diluted
|
$
|
0.60
|
|
$
|
0.96
|
|
$
|
1.01
|
|
$
|
1.15
|
|
|
Weighted average common shares outstanding:
|
|
|
|
|
|
|
|
|
||||
|
Basic
|
28,124
|
|
28,571
|
|
28,469
|
|
27,774
|
|
||||
|
Diluted
|
30,544
|
|
29,101
|
|
28,906
|
|
28,181
|
|
||||
|
|
March 31,
2017 |
June 30,
2017 |
September 30, 2017
|
December 31, 2017
|
||||||||
|
|
||||||||||||
|
(In thousands, except per share amounts)
|
(Unaudited)
|
(Unaudited)
|
(Unaudited)
|
(Unaudited)
|
||||||||
|
Revenue
|
$
|
406,980
|
|
$
|
456,866
|
|
$
|
476,423
|
|
$
|
621,702
|
|
|
Gross margin
(b)
|
$
|
86,699
|
|
$
|
89,268
|
|
$
|
101,750
|
|
$
|
115,551
|
|
|
Net income to common shareholders
(b)
|
$
|
15,664
|
|
$
|
15,770
|
|
$
|
18,852
|
|
$
|
15,882
|
|
|
Earnings per common share:
(c)
|
|
|
|
|
|
|
|
|
||||
|
Basic
|
$
|
0.63
|
|
$
|
0.63
|
|
$
|
0.74
|
|
$
|
0.57
|
|
|
Diluted
|
$
|
0.55
|
|
$
|
0.55
|
|
$
|
0.64
|
|
$
|
0.53
|
|
|
Weighted average common shares outstanding:
|
|
|
|
|
|
|
|
|
||||
|
Basic
|
24,738
|
|
24,990
|
|
25,581
|
|
27,736
|
|
||||
|
Diluted
|
30,329
|
|
30,619
|
|
30,675
|
|
31,172
|
|
||||
|
(a)
|
Gross margin and net income to common shareholders include
$0.9 million
,
$3.0 million
,
$0.7 million
and
$0.6 million
of charges related to purchase accounting adjustments taken during
2018
as a result of our acquisition of Pinnacle Homes in Detroit, Michigan on March 1, 2018 (as more fully discussed in
Note 12
to our Consolidated Financial Statements) taken during the first, second, third and fourth quarters of 2018, respectively, and
$5.8 million
of impairment charges taken during the fourth quarter of 2018.
|
|
(b)
|
Gross margin and net income to common shareholders includes an
$8.5 million
pre-tax charge for stucco-related repair costs in certain of our Florida communities (as more fully discussed in
Note 8
to our Consolidated Financial Statements) taken during the second quarter of 2017, and
$7.7 million
of impairment charges taken during the fourth quarter of 2017.
|
|
(c)
|
Due to rounding, the sum of quarterly results may not equal the total for the year. Additionally, quarterly and year-to-date computations of per share amounts are made independently.
|
We typically experience significant seasonality and quarter-to-quarter variability in our operating results. In general, homes delivered increase substantially in the second half of the year compared to the first half of the year as we sell more homes during the first and second quarters which results in more homes being delivered in the third and fourth quarters.
NOTE 18. Share Repurchase Program
On August 14, 2018, the Company announced that its Board of Directors authorized a share repurchase program (the “2018 Share Repurchase Program”) pursuant to which the Company may purchase up to
$50 million
of its outstanding common shares through open market transactions, privately negotiated transactions or otherwise in accordance with all applicable laws. During the year ended
December 31, 2018
, the Company repurchased
1.1 million
outstanding common shares at an aggregate purchase price of
$25.7 million
under the 2018 Share Repurchase Program and
$24.3 million
remained available for repurchases under the 2018 Share Repurchase Program. The timing, amount and other terms and conditions of any additional repurchases under the 2018 Share Repurchase Program will be determined by the Company’s management at its discretion based on a variety of factors, including the market price of the Company’s common shares, corporate considerations, general market and economic conditions and legal requirements. The 2018 Share Repurchase Program does not have an expiration date and the Board may modify, discontinue or suspend it at any time.
|
Item 9.
|
CHANGES IN AND DISAGREEMENTS WITH ACCOUNTANTS ON ACCOUNTING AND FINANCIAL DISCLOSURE
|
None.
95
|
Item 9A.
|
CONTROLS AND PROCEDURES
|
Conclusion Regarding the Effectiveness of Disclosure Controls and Procedures
An evaluation of the effectiveness of the Company’s disclosure controls and procedures (as defined in Rule 13a-15(e) under the Exchange Act) was performed by the Company’s management, with the participation of the Company’s principal executive officer and principal financial officer, as required by Rule 13a-15(b) under the Exchange Act. Based on that evaluation, the Company’s principal executive officer and principal financial officer concluded that the Company’s disclosure controls and procedures were effective as of the end of the period covered by this Annual Report on Form 10-K.
Management’s Annual Report on Internal Control Over Financial Reporting
The management of the Company is responsible for establishing and maintaining adequate internal control over financial reporting (as defined in Rule 13a-15(f) under the Exchange Act). The Company’s internal control system was designed to provide reasonable assurance to the Company’s management and board of directors regarding the preparation and fair presentation of published financial statements.
All internal control systems, no matter how well designed, have inherent limitations. Therefore, even those systems determined to be effective can provide only reasonable assurance with respect to financial statement preparation and presentation.
The Company’s management, with the participation of the principal executive officer and the principal financial officer, assessed the effectiveness of the Company’s internal control over financial reporting as of
December 31, 2018
. In making this assessment, it used the criteria set forth by the Committee of Sponsoring Organizations of the Treadway Commission (COSO) in
Internal Control – Integrated Framework (2013)
. Based on this assessment, management believes that, as of
December 31, 2018
, the Company’s internal control over financial reporting was effective.
The effectiveness of our internal control over financial reporting as of
December 31, 2018
has been audited by Deloitte & Touche LLP, our independent registered public accounting firm, as stated in its attestation report included on page 93 of this Annual Report on Form 10-K.
Changes in Internal Control over Financial Reporting
There were no changes in our internal control over financial reporting during the quarter ended
December 31, 2018
that have materially affected, or are reasonably likely to materially affect, our internal control over financial reporting.
|
Item 9B.
|
OTHER INFORMATION
|
None.
96
REPORT OF INDEPENDENT REGISTERED PUBLIC ACCOUNTING FIRM
To the shareholders and Board of Directors of M/I Homes, Inc.:
Opinion on Internal Control over Financial Reporting
We have audited the internal control over financial reporting of M/I Homes, Inc. and subsidiaries (the “Company”) as of
December 31, 2018
, based on criteria established in
Internal Control - Integrated Framework
(2013)
issued by the Committee of Sponsoring Organizations of the Treadway Commission (COSO). In our opinion, the Company maintained, in all material respects, effective internal control over financial reporting as of
December 31, 2018
, based on criteria established in
Internal Control - Integrated Framework (2013)
issued by COSO.
We have also audited, in accordance with the standards of the Public Company Accounting Oversight Board (United States) (PCAOB), the consolidated financial statements as of and for the year ended
December 31, 2018
, of the Company and our report dated
February 22, 2019
, expressed an unqualified opinion on those consolidated financial statements.
Basis for Opinion
The Company’s management is responsible for maintaining effective internal control over financial reporting and for its assessment of the effectiveness of internal control over financial reporting, included in the accompanying Management’s Annual Report on Internal Control over Financial Reporting. Our responsibility is to express an opinion on the Company’s internal control over financial reporting based on our audit. We are a public accounting firm registered with the PCAOB and are required to be independent with respect to the Company in accordance with the U.S. federal securities laws and the applicable rules and regulations of the Securities and Exchange Commission and the PCAOB.
We conducted our audit in accordance with the standards of the PCAOB. Those standards require that we plan and perform the audit to obtain reasonable assurance about whether effective internal control over financial reporting was maintained in all material respects. Our audit included obtaining an understanding of internal control over financial reporting, assessing the risk that a material weakness exists, testing and evaluating the design and operating effectiveness of internal control based on the assessed risk, and performing such other procedures as we considered necessary in the circumstances. We believe that our audit provides a reasonable basis for our opinion.
Definition and Limitations of Internal Control over Financial Reporting
A company’s internal control over financial reporting is a process designed to provide reasonable assurance regarding the reliability of financial reporting and the preparation of consolidated financial statements for external purposes in accordance with generally accepted accounting principles. A company’s internal control over financial reporting includes those policies and procedures that (1) pertain to the maintenance of records that, in reasonable detail, accurately and fairly reflect the transactions and dispositions of the assets of the company; (2) provide reasonable assurance that transactions are recorded as necessary to permit preparation of consolidated financial statements in accordance with generally accepted accounting principles, and that receipts and expenditures of the company are being made only in accordance with authorizations of management and directors of the company; and (3) provide reasonable assurance regarding prevention or timely detection of unauthorized acquisition, use, or disposition of the company’s assets that could have a material effect on the consolidated financial statements.
Because of the inherent limitations, internal control over financial reporting may not prevent or detect misstatements. Also, projections of any evaluation of the effectiveness to future periods are subject to the risk that the controls may become inadequate because of changes in conditions, or that the degree of compliance with the policies or procedures may deteriorate.
/s/ Deloitte & Touche LLP
Columbus, Ohio
February 22, 2019
97
PART III
|
Item 10.
|
DIRECTORS, EXECUTIVE OFFICERS AND CORPORATE GOVERNANCE
|
The information required by this item is incorporated herein by reference to our definitive Proxy Statement relating to the
2019
Annual Meeting of Shareholders to be filed with the Securities and Exchange Commission pursuant to Regulation 14A under the Exchange Act.
We have adopted a Code of Business Conduct and Ethics that applies to our directors and all employees of the Company. The Code of Business Conduct and Ethics is posted on our website, www.mihomes.com. We intend to satisfy the requirements under Item 5.05 of Form 8-K regarding disclosure of amendments to, or waivers from, provisions of our Code of Business Conduct and Ethics that apply to our principal executive officer, principal financial officer, principal accounting officer or controller, or persons performing similar functions, by posting such information on our website. Copies of the Code of Business Conduct and Ethics will be provided free of charge upon written request directed to Investor Relations, M/I Homes, Inc., 3 Easton Oval, Suite 500, Columbus, OH 43219.
|
Item 11.
|
EXECUTIVE COMPENSATION
|
The information required by this item is incorporated herein by reference to our definitive Proxy Statement relating to the
2019
Annual Meeting of Shareholders.
98
|
Item 12.
|
SECURITY OWNERSHIP OF CERTAIN BENEFICIAL OWNERS AND MANAGEMENT AND RELATED SHAREHOLDER MATTERS
|
Equity Compensation Plan Information
The following table sets forth information as of
December 31, 2018
with respect to the common shares issuable under the Company's equity compensation plans:
|
Plan Category
|
Number of securities to be issued upon exercise of outstanding options, warrants and rights
(a)
|
Weighted-average exercise price of outstanding options, warrants and rights
(b)
|
Number of securities remaining available for future issuance under equity compensation plans (excluding securities reflected in column (a))
(c)
|
|||||||||||||
|
Equity compensation plans approved by shareholders
|
2,592,240
|
(1)
|
$
|
22.82
|
(2)
|
2,221,500
|
(3)
|
|||||||||
|
Equity compensation plans not approved by shareholders
|
62,414
|
(4)
|
—
|
—
|
||||||||||||
|
Total
|
2,654,654
|
$
|
22.82
|
2,221,500
|
||||||||||||
|
(1)
|
Consists of the 2018 Long-Term Incentive Plan (“2018 LTIP”) (
7,000
outstanding stock options and
21,000
outstanding director stock units), the 2009 Long-Term Incentive Plan (“2009 LTIP”) (
2,205,690
outstanding stock options,
76,500
outstanding director stock units and
273,991
outstanding performance share units (“PSU’s”) (assuming the maximum number of PSU’s will be earned)), which plan was terminated in May 2018, and the 2006 Director Equity Incentive Plan (“2006 Director Plan”) (
8,059
outstanding director stock units), which plan was terminated in May 2009.
|
|
(2)
|
The weighted average exercise price relates to the stock options granted under the 2018 LTIP and the 2009 LTIP. The weighted average exercise price does not take into account the director stock units granted under the 2018 LTIP, the 2009 LTIP and the 2006 Director Plan or the PSU’s granted under the 2009 LTIP because the director stock units and the PSU’s are full value awards and have no exercise price. The director stock units and the PSU’s (if earned) will be settled at a future date in common shares on a one-for-one basis without the payment of any exercise price.
|
|
(3)
|
Represents the aggregate number of common shares remaining available for issuance under the 2018 LTIP. Pursuant to the terms of the 2018 LTIP, and subject to certain adjustments provided therein, the aggregate number of common shares with respect to which awards may be granted under the 2018 LTIP is
2,250,000
common shares plus any common shares subject to outstanding awards under the 2009 LTIP as of May 8, 2018 that on or after May 8, 2018 cease for any reason to be subject to such awards other than by reason of exercise or settlement of the awards to the extent they are exercised for or settled in vested and non-forfeitable common shares. Pursuant to the terms of the 2018 LTIP, upon the grant of a full value award thereunder (including director stock units and PSU’s), we reduce the number of common shares available for issuance under the 2018 LTIP by an amount equal to the number of shares subject to the award multiplied by 1.50.
|
|
(4)
|
Consists of the Amended and Restated Director Deferred Compensation Plan and the Amended and Restated Executives' Deferred Compensation Plan. Pursuant to these plans, our directors and eligible employees may defer the payment of all or a portion of their director fees and annual cash bonuses, respectively, and the deferred amount is converted into that number of whole phantom stock units determined by dividing the deferred amount by the closing price of our common shares on the New York Stock Exchange on the date of such conversion (which is the same date the fees or bonus is paid) without any discount on the common share price or premium applied to the deferred amount. The phantom stock units are settled at a future date in common shares on a one-for-one basis. Neither the Director Deferred Compensation Plan nor the Executives' Deferred Compensation Plan provides for a specified limit on the number of common shares which may be attributable to participants' accounts relating to phantom stock units and issued under the terms of these plans.
|
The remaining information required by this item is incorporated herein by reference to our definitive Proxy Statement relating to the
2019
Annual Meeting of Shareholders.
|
Item 13.
|
CERTAIN RELATIONSHIPS AND RELATED TRANSACTIONS, AND DIRECTOR INDEPENDENCE
|
The information required by this item is incorporated herein by reference to our definitive Proxy Statement relating to the
2019
Annual Meeting of Shareholders.
|
Item 14.
|
PRINCIPAL ACCOUNTING FEES AND SERVICES
|
The information required by this item is incorporated herein by reference to our definitive Proxy Statement relating to the
2019
Annual Meeting of Shareholders.
99
PART IV
|
Item 15.
|
EXHIBITS, FINANCIAL STATEMENT SCHEDULES
|
|
(a)
Documents filed as part of this report
.
|
||||
|
|
(1) The following financial statements are contained in Item 8:
|
|||
|
|
|
|
Page in this report
|
|
|
|
|
|
||
|
|
|
Financial Statements
|
||
|
|
|
|
|
|
|
|
|
Report of Independent Registered Public Accounting Firm
|
||
|
|
|
Consolidated Statements of Income for the Years Ended December 31, 2018, 2017 and 2016
|
||
|
|
|
Consolidated Balance Sheets as of December 31, 2018 and 2017
|
||
|
|
|
Consolidated Statements of Shareholders’ Equity for the Years Ended December 31, 2018, 2017 and 2016
|
||
|
|
|
Consolidated Statements of Cash Flows for the Years Ended December 31, 2018, 2017 and 2016
|
||
|
|
|
Notes to Consolidated Financial Statements
|
||
|
|
|
|
||
|
|
(2) Financial Statement Schedules:
|
|||
|
|
|
|
|
|
|
|
|
None required.
|
|
|
|
|
|
|||
|
|
(3) Exhibits:
|
|
||
|
|
|
|||
The following exhibits required by Item 601 of Regulation S-K are filed as part of this report:
|
Exhibit
Number
|
|
Description
|
|
|
|
|
|
3.1
|
|
|
|
|
|
|
|
3.2
|
|
|
|
|
|
|
|
3.3
|
|
|
|
|
|
|
|
3.4
|
|
|
|
|
|
|
|
4.1
|
|
Specimen certificate representing M/I Homes, Inc.’s common shares, par value $.01 per share, incorporated herein by reference to Exhibit 4 to the Company’s Registration Statement on Form S-1 (File No. 33-68564) [filed in paper form with the SEC].
|
|
4.2
|
|
|
|
4.3
|
||
100
|
4.4
|
||
|
4.5
|
||
|
4.6
|
||
|
4.7
|
||
|
4.8
|
||
|
4.9
|
||
|
4.10
|
||
|
4.11
|
||
|
4.12
|
||
|
4.13
|
||
|
4.14
|
||
|
10.1*
|
|
|
|
|
|
|
|
10.2
|
||
|
10.3
|
||
|
10.4
|
||
|
10.5
|
||
101
|
10.6
|
||
|
10.7
|
||
|
10.8
|
||
|
10.9
|
||
|
10.10
|
||
|
10.11
|
||
|
10.12
|
||
|
10.13
|
||
|
10.14
|
||
|
10.15
|
||
|
10.16
|
||
|
10.17
|
||
|
10.18
|
||
|
10.19
|
||
102
|
10.20
|
||
|
10.21
|
||
|
10.22
|
||
|
10.23
|
|
|
|
|
||
|
10.24
|
||
|
10.25
|
||
|
10.26
|
||
|
10.27*
|
|
|
|
10.28*
|
|
|
|
10.29*
|
|
|
|
10.30*
|
|
|
|
10.31*
|
|
|
|
10.32*
|
||
|
10.33*
|
|
|
|
10.34*
|
|
|
103
|
10.35*
|
|
|
|
10.36*
|
||
|
10.37*
|
||
|
10.38*
|
||
|
10.39*
|
||
|
10.40*
|
||
|
10.41*
|
|
|
|
10.42*
|
|
|
|
10.43*
|
||
|
10.44*
|
||
|
10.45*
|
||
|
10.46*
|
||
|
10.47*
|
||
104
|
21
|
|
|
|
23
|
|
|
|
24
|
|
|
|
31.1
|
|
|
|
31.2
|
|
|
|
32.1
|
|
|
|
|
|
|
|
32.2
|
|
|
|
101.INS
|
XBRL Instance Document. (Furnished herewith.)
|
|
|
101.SCH
|
XBRL Taxonomy Extension Schema Document. (Furnished herewith.)
|
|
|
101.CAL
|
XBRL Taxonomy Extension Calculation Linkbase Document. (Furnished herewith.)
|
|
|
101.LAB
|
XBRL Taxonomy Extension Label Linkbase Document. (Furnished herewith.)
|
|
|
101.PRE
|
XBRL Taxonomy Extension Presentation Linkbase Document. (Furnished herewith.)
|
|
|
101.DEF
|
XBRL Taxonomy Extension Definition Linkbase Document. (Furnished herewith.)
|
|
* Management contract or compensatory plan or arrangement.
105
|
(b)
Exhibits
.
|
||
|
|
|
|
|
|
|
Reference is made to Item 15(a)(3) above for a complete list of exhibits that are filed with this report. The following is a list of exhibits, included in Item 15(a)(3) above, that are filed concurrently with this report.
|
|
Exhibit
Number
|
|
Description
|
|
21
|
|
|
|
|
|
|
|
23
|
|
|
|
|
|
|
|
24
|
|
|
|
|
|
|
|
31.1
|
|
|
|
|
|
|
|
31.2
|
|
|
|
|
|
|
|
32.1
|
|
|
|
|
|
|
|
32.2
|
|
|
|
101.INS
|
XBRL Instance Document. (Furnished herewith.)
|
|
|
101.SCH
|
XBRL Taxonomy Extension Schema Document. (Furnished herewith.)
|
|
|
101.CAL
|
XBRL Taxonomy Extension Calculation Linkbase Document. (Furnished herewith.)
|
|
|
101.LAB
|
XBRL Taxonomy Extension Label Linkbase Document. (Furnished herewith.)
|
|
|
101.PRE
|
XBRL Taxonomy Extension Presentation Linkbase Document. (Furnished herewith.)
|
|
|
101.DEF
|
XBRL Taxonomy Extension Definition Linkbase Document. (Furnished herewith.)
|
|
|
(c) Financial statement schedules
|
||
|
|
|
|
|
|
|
None required.
|
Item 16. FORM 10-K SUMMARY
None.
106
SIGNATURES
Pursuant to the requirements of Section 13 or 15(d) of the Securities Exchange Act of 1934, the registrant has duly caused this report to be signed on its behalf by the undersigned, thereunto duly authorized, on this 22nd day of February 2019.
|
M/I Homes, Inc.
|
|
|
(Registrant)
|
|
|
|
|
|
By:
|
/s/Robert H. Schottenstein
|
|
|
Robert H. Schottenstein
|
|
|
Chairman of the Board,
|
|
|
Chief Executive Officer and President
|
|
|
(Principal Executive Officer)
|
Pursuant to the requirements of the Securities Exchange Act of 1934, this report has been signed below by the following persons on behalf of the registrant and in the capacities indicated on the 22nd day of February 2019.
|
NAME AND TITLE
|
NAME AND TITLE
|
|
|
FRIEDRICH K. M. BÖHM*
|
/s/Robert H. Schottenstein
|
|
|
Friedrich K. M. Böhm
|
Robert H. Schottenstein
|
|
|
Director
|
Chairman of the Board,
|
|
|
Chief Executive Officer and President
|
||
|
WILLIAM H. CARTER*
|
(Principal Executive Officer)
|
|
|
William H. Carter
|
||
|
Director
|
/s/Phillip G. Creek
|
|
|
Phillip G. Creek
|
||
|
MICHAEL P. GLIMCHER*
|
Executive Vice President,
|
|
|
Michael P. Glimcher
|
Chief Financial Officer and Director
|
|
|
Director
|
(Principal Financial Officer)
|
|
|
ELIZABETH K. INGRAM*
|
/s/Ann Marie W. Hunker
|
|
|
Elizabeth K. Ingram
|
Ann Marie W. Hunker
|
|
|
Director
|
Vice President, Corporate Controller
|
|
|
(Principal Accounting Officer)
|
||
|
NANCY J. KRAMER*
|
||
|
Nancy J. Kramer
|
||
|
Director
|
||
|
J.THOMAS MASON*
|
||
|
J. Thomas Mason
|
||
|
Executive Vice President, Chief Legal
|
||
|
Officer, Secretary and Director
|
||
|
NORMAN L. TRAEGER*
|
||
|
Norman L. Traeger
|
||
|
Director
|
||
*The above-named directors of the registrant execute this report by Phillip G. Creek, their Attorney-in-Fact, pursuant to the powers of attorney executed by the above-named directors, which powers of attorney are filed as Exhibit 24 to this report.
|
By:
|
/s/Phillip G. Creek
|
|
Phillip G. Creek,
Attorney-In-Fact
|
|
107
TABLE OF CONTENTS
Part IItem 1. BusinessItem 1A. Risk FactorsItem 1B. Unresolved Staff CommentsItem 2. PropertiesItem 3. Legal ProceedingsItem 4. Mine Safety DisclosuresPart IIItem 5. Market For Registrant S Common Equity, Related Shareholder Matters and Issuer Purchases Of Equity SecuritiesItem 6. Selected Financial DataItem 7: Management S Discussion and Analysis Of Financial Condition and ResultsItem 7A. Quantitative and Qualitative Disclosures About Market RiskItem 8. Financial Statements and Supplementary DataNote 1. Summary Of Significant Accounting PoliciesNote 2. Stock-based and Deferred CompensationNote 3. Fair Value MeasurementsNote 4. InventoryNote 5. Transactions with Related PartiesNote 6. Investment in Joint Venture ArrangementsNote 7. Guarantees and IndemnificationsNote 8. Commitments and ContingenciesNote 9. Lease CommitmentsNote 10. Community Development District Infrastructure and Related ObligationsNote 11. DebtNote 12. Acquisition and GoodwillNote 13. Earnings Per ShareNote 14. Income TaxesNote 15. Business SegmentsNote 16. Supplemental Guarantor InformationNote 17. Supplementary Financial DataNote 18. Share Repurchase ProgramItem 9. Changes in and Disagreements with Accountants on Accounting and Financial DisclosureItem 9A. Controls and ProceduresItem 9B. Other InformationPart IIIItem 10. Directors, Executive Officers and Corporate GovernanceItem 11. Executive CompensationItem 12. Security Ownership Of Certain Beneficial Owners and Management and Related Shareholder MattersItem 13. Certain Relationships and Related Transactions, and Director IndependenceItem 14. Principal Accounting Fees and ServicesPart IVItem 15. Exhibits, Financial Statement SchedulesItem 16. Form 10-k Summary