MCCORMICK & CO INC
10-Ks and 10-Qs
|
|
|
|
|
|
|
|
|
|
|
|
|
|
|
|
|
|
|
|
|
|
|
|
|
|
|
|
|
|
|
|
|
|
|
|
|
|
|
|
|
|
|
|
|
|
|
|
|
|
|
|
|
|
|
|
|
|
|
UNITED STATES
SECURITIES AND EXCHANGE COMMISSION
Washington, D.C. 20549
FORM 10-K
(Mark One)
|
ý
|
ANNUAL REPORT PURSUANT TO SECTION 13 OR 15(d) OF THE SECURITIES EXCHANGE ACT OF 1934
|
For the fiscal year ended November 30,
2017
OR
|
¨
|
TRANSITION REPORT PURSUANT TO SECTION 13 OR 15(d) OF THE SECURITIES EXCHANGE ACT OF 1934
|
For the transition period from
to
Commission file number 001-14920
McCORMICK & COMPANY, INCORPORATED
(Exact name of registrant as specified in its charter)
|
Maryland
|
52-0408290
|
|
(State or other jurisdiction of
incorporation or organization)
|
(IRS Employer
Identification No.)
|
|
18 Loveton Circle, Sparks, Maryland
|
21152
|
|
(Address of principal executive offices)
|
(Zip Code)
|
Registrant’s telephone number, including area code: (410) 771-7301
Securities registered pursuant to Section 12(b) of the Act:
|
Ti
tle of Each Cl
ass
|
Name of Each Exchange on Which Registered
|
|
Common Stock, No Par Value
|
New York Stock Exchange
|
|
Common Stock Non-Voting, No Par Value
|
New York Stock Exchange
|
Securities registered pursuant to Section 12(g) of the Act: Not applicable.
Indicate by check mark if the registrant is a well-known seasoned issuer, as defined in Rule 405 of the Securities Act.
Yes
ý
No
¨
Indicate by check mark if the registrant is not required to file reports pursuant to Section 13 or Section 15(d) of the Act.
Yes
¨
No
ý
Indicate by check mark whether the registrant (1) has filed all reports required to be filed by Section 13 or 15(d) of the Securities Exchange Act of 1934 during the preceding 12 months (or for such shorter period that the registrant was required to file such reports), and (2) has been subject to such filing requirements for the past 90 days. Yes
ý
No
¨
Indicate by check mark whether the registrant has submitted electronically and posted on its corporate website, if any, every Interactive Data File required to be submitted and posted pursuant to Rule 405 of Regulation S-T during the preceding 12 months (or for such shorter period that the registrant was required to submit and post such files). Yes
ý
No
¨
Indicate by check mark if disclosure of delinquent filers pursuant to Item 405 of Regulation S-K is not contained herein, and will not be contained, to the best of registrant’s knowledge, in definitive proxy or information statements incorporated by reference in Part III of this Form 10-K or any amendment to this Form 10-K.
ý
Indicate by check mark whether the registrant is a large accelerated filer, an accelerated filer, a non-accelerated filer, or a smaller reporting company, or emerging growth company. See the definitions of “large accelerated filer,” “accelerated filer,” “smaller reporting company” and "emerging growth company" in Rule 12b-2 of the Exchange Act.
Check one:
|
Large accelerated filer
|
ý
|
Accelerated filer
|
¨
|
|
Non-accelerated filer
|
¨
(Do not check if a smaller reporting company)
|
Smaller reporting company
|
¨
|
|
|
|
Emerging growth company
|
¨
|
If an emerging growth company, indicate by check mark if the registrant has elected not to use the extended transition period for complying with any new or revised financial accounting standards provided pursuant to Section 13(a) of the Exchange Act.
¨
Indicate by check mark whether the registrant is a shell company (as defined in Rule 12b-2 of the Exchange Act).
Yes
¨
No
ý
State the aggregate market value of the voting and non-voting common equity held by non-affiliates computed by reference to the price at which the common equity was last sold, or the average bid and asked prices of such common equity, as of the last business day of the registrant’s most recently completed second fiscal quarter.
The aggregate market value of the Voting Common Stock held by non-affiliates at May 31, 2017: $1,157,886,402
The aggregate market value of the Non-Voting Common Stock held by non-affiliates at May 31, 2017: $11,809,126,501
Indicate the number of shares outstanding of each of the registrant’s classes of common stock, as of the latest practicable date.
|
Class
|
Number of Shares Outstanding
|
Date
|
|
|
Common Stock
|
10,008,182
|
|
December 29, 2017
|
|
Common Stock Non-Voting
|
121,097,928
|
|
December 29, 2017
|
DOCUMENTS INCORPORATED BY REFERENCE
|
Document
|
Part of 10-K into Which Incorporated
|
|
Proxy Statement for
McCormick’s March 28, 2018
Annual Meeting of Stockholders
(the “2018 Proxy Statement”)
|
Part III
|
|
|
As used herein, references to “McCormick,” “we,” “us” and “our” are to McCormick & Company, Incorporated and its consolidated subsidiaries or, as the context may require, McCormick & Company, Incorporated only.
McCormick is a global leader in flavor. The company manufactures, markets and distributes spices, seasoning mixes, condiments and other flavorful products to the entire food industry–retailers, food manufacturers and foodservice businesses. We also are partners in a number of joint ventures that are involved in the manufacture and sale of flavorful products, the most significant of which is McCormick de Mexico. Our major sales, distribution and production facilities are located in North America, Europe and China. Additional facilities are based in Australia, Mexico, India, Singapore, Central America, Thailand and South Africa. McCormick & Company, Incorporated was formed in 1915 under Maryland law as the successor to a business established in 1889.
On August 17, 2017, we completed the acquisition of Reckitt Benckiser's Food Division ("RB Foods") from Reckitt Benckiser Group plc. The purchase price was approximately $4.21 billion, net of acquired cash of $24.3 million, and included a preliminary working capital adjustment of $11.2 million. In December 2017, we paid an additional $4.2 million in connection with the final working capital adjustment. The acquisition was funded through our issuance of approximately 6.35 million shares of common stock non-voting (see note 13 of the financial statements) and through new borrowings comprised of senior unsecured notes and pre-payable term loans (see note 6 of the financial statements). The acquired market-leading brands of RB Foods include French’s
®
, Frank’s RedHot
®
and Cattlemen’s
®
, which are a natural strategic fit with our robust global branded flavor portfolio. We believe that these additions move us to a leading position in the attractive U.S. Condiments category and provide significant international growth opportunities for our consumer and industrial segments. At the time of the acquisition, annual sales of RB Foods were approximately $570 million. The transaction was accounted for under the acquisition method of accounting and, accordingly, the results of RB Foods’ operations have been included in our financial statements as a component of our consumer and industrial segments from the date of acquisition.
Business Segments
We operate in two business segments, consumer and industrial. Demand for flavor is growing globally, and across both segments we have the customer base and product breadth to participate in all types of eating occasions. Our products deliver flavor when cooking at home, dining out, purchasing a quick service meal or enjoying a snack. We offer our customers and consumers a range of products to meet the increasing demand for certain product attributes such as organic, reduced sodium, gluten-free and non-GMO (genetically modified organisms) and that extend from premium to value-priced.
Consistent with market conditions in each segment, our consumer segment has a higher overall profit margin than our industrial segment. In 2017, the consumer segment contributed approximately 61% of sales and 72% of operating income, and the industrial segment contributed approximately 39% of sales and 28% of operating income.
For financial information about our business segments, please refer to “Management’s Discussion and Analysis–Results of Operations” and note 16 of the financial statements.
For a discussion of our recent acquisition activity, please refer to “Management’s Discussion and Analysis–Acquisitions” and note 2 of the financial statements.
Consumer Segment.
From locations around the world, our brands reach consumers in approximately 150 countries and territories. Our leading brands in the Americas include McCormick
®
, French’s
®
, Frank’s RedHot
®
, Lawry’s
®
and Club House
®
, as well as niche brands such as Gourmet Garden
®
and OLD BAY
®
. We also market authentic regional and ethnic brands such as Zatarain’s
®
, Stubb's
®
, Thai Kitchen
®
and Simply Asia
®
. In the Europe, Middle East and Africa (EMEA) region, our major brands include the Ducros
®
, Schwartz
®
,
Kamis
®
and Drogheria & Alimentari
®
brands of spices, herbs and seasonings and an extensive line of Vahiné
®
brand dessert items. In the Asia/Pacific region, we market our products under the following brands. In China, we market our products under the McCormick and DaQiao
®
brands. In Australia, we market our spices and seasonings under the McCormick brand, our dessert products under the Aeroplane
®
brand, and packaged chilled herbs under the Gourmet Garden brand. In India, we market our spices and rice products under the Kohinoor
®
brand.
Our customers span a variety of retailers that include grocery, mass merchandise, warehouse clubs, discount and drug stores, and e-commerce retailers served directly and indirectly through distributors or wholesalers. In addition to marketing our branded products to these customers, we are also a leading supplier of private label items, also known as store brands.
Approximately half of our consumer segment sales are spices, herbs and seasonings. For these products, we are a category leader in our primary markets. There are numerous competitive brands of spices, herbs and seasonings in the U.S. and additional brands in international markets. Some are owned by large food manufacturers, while others are supplied by small privately owned companies. In this competitive environment, we are leading with innovation and brand marketing, and applying our analytical tools to help customers optimize the profitability of their spice and seasoning sales while simultaneously working to increase our sales and profit.
Industrial Segment.
In our industrial segment, we provide a wide range of products to multinational food manufacturers and foodservice customers. The foodservice customers are supplied with branded, packaged products both directly and indirectly through distributors. We supply food manufacturers and foodservice customers with customized flavor solutions, and many of these customer relationships have been active for decades. Our range of flavor solutions remains one of the broadest in the industry and includes seasoning blends, spices and herbs, condiments, coating systems and compound flavors. In addition to a broad range of flavor solutions, our long-standing customer relationships are evidence of our effectiveness in building customer intimacy. Our customers benefit from our expertise in many areas, including sensory testing, culinary research, food safety and flavor application.
Our industrial segment has a number of competitors. Some tend to specialize in a particular range of products and have a limited geographic reach. Other competitors include larger publicly held flavor companies that are more global in nature, but which also tend to specialize in a narrower range of flavor solutions than McCormick.
Raw Materials
The most significant raw materials used in our business are pepper, dairy products, garlic, vanilla, capsicums (red peppers and paprika), onion, wheat flour and rice. Pepper and other spices and herbs are generally sourced from countries other than the United States. Other raw materials, like dairy products and onion, are primarily sourced from within the U.S. and locally, for many of our international locations. Because the raw materials are agricultural products, they are subject to fluctuations in market price and availability caused by weather, growing and harvesting conditions, market conditions, and other factors beyond our control.
We respond to this volatility in a number of ways, including strategic raw material purchases, purchases of raw material for future delivery, customer price adjustments and cost savings from our Comprehensive Continuous Improvement (CCI) program.
Customers
Our products are sold directly to customers and also through brokers, wholesalers and distributors. In the consumer segment, products are then sold to consumers under a number of brands through a variety of retail channels, including grocery, mass merchandise, warehouse clubs, discount and drug stores, and e-commerce. In the industrial segment, products are used by food and beverage manufacturers as ingredients for their finished goods and by foodservice customers as ingredients for menu items to enhance the flavor of their foods. Customers for the industrial segment include food manufacturers and the foodservice industry supplied both directly and indirectly through distributors.
We have a large number of customers for our products. Sales to one of our consumer segment customers, Wal-Mart Stores, Inc., accounted for 11% of consolidated sales in 2017, 2016 and 2015. Sales to one of our industrial segment customers, PepsiCo, Inc., accounted for 11% of consolidated sales in 2017, 2016 and 2015. In 2017, 2016 and 2015 the top three customers in our industrial segment represented between 50% and 54% of our global industrial sales.
The dollar amount of backlog orders for our business is not material to an understanding of our business, taken as a whole. No material portion of our business is subject to renegotiation of profits or termination of contracts or subcontracts at the election of the U.S. government.
Trademarks, Licenses and Patents
We own a number of trademark registrations. Although in the aggregate these trademarks are material to our business, the loss of any one of those trademarks, with the exception of our “McCormick,” “French’s
,” “Frank’s RedHot,” “Lawry’s,” “Zatarain’s,” “Stubb's,” “Club House,” “Ducros,” “Schwartz,” “Vahiné,” "OLD BAY," "Simply Asia,"
"Thai Kitchen," "Kitchen Basics," “Kamis,” “Drogheria & Alimentari,” "DaQiao," “Kohinoor” and "Gourmet Garden" trademarks, would not have a material adverse effect on our business. The “Mc – McCormick” trademark is extensively used by us in connection with the sale of our food products in the U.S. and certain non-U.S. markets. The terms of the trademark registrations are as prescribed by law, and the registrations will be renewed for as long as we deem them to be useful.
We have entered into a number of license agreements authorizing the use of our trademarks by affiliated and non-affiliated entities. The loss of these license agreements would not have a material adverse effect on our business. The term of the license agreements is generally three to five years or until such time as either party terminates the agreement. Those agreements with specific terms are renewable upon agreement of the parties.
We also own various patents, none of which are individually material to our business.
Seasonality
Due to seasonal factors inherent in our business, our sales, income and cash from operations generally are lower in the first two quarters of the fiscal year, increase in the third quarter and are significantly higher in the fourth quarter due to the holiday season. This seasonality reflects customer and consumer buying patterns, primarily in the consumer segment.
Working Capital
In order to meet increased demand for our consumer products during our fourth quarter, we usually build our inventories during the third quarter of the fiscal year. We generally finance working capital items (inventory and receivables) through short-term borrowings, which include the use of lines of credit and the issuance of commercial paper. For a description of our liquidity and capital resources, see note 6 of the financial statements and the “Liquidity and Financial Condition” section of “Management’s Discussion and Analysis.”
Competition
Each segment operates in markets around the world that are highly competitive. In this competitive environment, our growth strategies include customer intimacy and product innovation based on consumer insights. Additionally, in the consumer segment, we are building brand recognition and loyalty through advertising and promotions.
Research and Development
Many of our products are prepared from confidential formulas developed by our research laboratories and product development teams, and, in some cases, from proprietary customer formulas. Expenditures for research and development were $66.1 million in
2017
, $61.0 million in
2016
, and $60.8 million in
2015
. The amount spent on customer-sponsored research activities is not material.
Governmental Regulation
We are subject to numerous laws and regulations around the world that apply to our global businesses. In the United States, the safety, production, transportation, distribution, advertising, labeling and sale of many of our products and their ingredients are subject to the Federal Food, Drug, and Cosmetic Act; the Food Safety Modernization Act; the Federal Trade Commission Act; state consumer protection laws; competition laws, anti-corruption laws, customs and trade laws; federal, state and local workplace health and safety laws; various federal, state and local environmental protection laws; and various other federal, state and local statutes and regulations. Outside the United States, our business is subject to numerous similar statutes, laws and regulatory requirements.
Environmental Regulations
The cost of compliance with federal, state and local provisions related to protection of the environment has had no material effect on our business. There were no material capital expenditures for environmental control facilities in fiscal year 2017, and there are no material expenditures planned for such purposes in fiscal year 2018.
Employees
We had approximately 11,700 full-time employees worldwide as of November 30,
2017
. Our operations have not been affected significantly by work stoppages and, in the opinion of management, employee relations are good. We have approximately 300 employees covered by a collective bargaining contract in the United States. At our foreign subsidiaries, approximately 2,600 employees are covered by collective bargaining agreements or similar arrangements.
Financial Information about Geographic Locations
For information on the net sales and long-lived assets of McCormick by geographic area, see note 16 of the financial statements.
Foreign Operations
We are subject in varying degrees to certain risks typically associated with a global business, such as local economic and market conditions, exchange rate fluctuations, and restrictions on investments, royalties and dividends. In fiscal year 2017, 41% of sales were from non-U.S. operations. For information on how we manage some of these risks, see the “Market Risk Sensitivity” section of “Management’s Discussion and Analysis.”
Forward-Looking Information
Certain statements contained in this report, including statements concerning expected performance such as those relating to net sales, earnings, cost savings, acquisitions, brand marketing support, and income tax expense are “forward-looking statements” within the meaning of Section 21E of the Securities Exchange Act of 1934. These statements may be identified by the use of words such as “may,” “will,” “expect,” "should," "anticipate," "intend," “believe” and “plan.” These statements may relate to: the expected results of operations of businesses acquired by the company, including the acquisition of RB Foods; the expected impact of raw material costs and pricing actions on the company's results of operations and gross margins; the expected impact of productivity improvements, including those associated with our Comprehensive Continuous Improvement (CCI) program and global enablement initiative; expected working capital improvements; expectations regarding growth potential in various geographies and markets, including the impact from customer, channel, category, and e-commerce expansion; expected trends in net sales and earnings performance and other financial measures; the expected impact of the U.S tax regulation passed in December 2017; the expectations of pension and postretirement plan contributions and anticipated charges associated with those plans; the holding period and market risks associated with financial instruments; the impact of foreign exchange fluctuations; the adequacy of internally generated funds and existing sources of liquidity, such as the availability of bank financing; the anticipated sufficiency of future cash flows to enable the payments of interest and repayment of short- and long-term debt as well as quarterly dividends and the ability to issue additional debt or equity securities; and expectations regarding purchasing shares of McCormick's common stock under the existing repurchase authorization.
These and other forward-looking statements are based on management’s current views and assumptions and involve risks and uncertainties that could significantly affect expected results. Results may be materially affected by factors such as: damage to the company's reputation or brand name; loss of brand relevance; increased private label use; product quality, labeling, or safety concerns; negative publicity about our products; business interruptions due to natural disasters or unexpected events; actions by, and the financial condition of, competitors and customers; the company's inability to achieve expected and/or needed cost savings or margin improvements; negative employee relations; the lack of successful acquisition and integration of new businesses, including the acquisition of RB Foods; difficulties or delays in the successful transition of RB Foods from the information technology systems of the seller to those of McCormick as well as risks associated with the integration and transition of the operations, systems and personnel of RB Foods, within the remaining term of the post-closing transition services agreement between McCormick and the seller in the first half of 2018; issues affecting the company's supply chain and raw materials, including fluctuations in the cost and availability of raw and packaging materials; government regulation, and changes in legal and regulatory requirements and enforcement practices; global economic and financial conditions generally, including the availability of financing, and interest and inflation rates; the effects of increased level of debt service following the RB Foods acquisition as well as the effects that such increased debt service may have on the company's ability to react to certain economic and industry conditions and ability to borrow or the cost of any such additional borrowing; the interpretations and assumptions we have made, and guidance that may be issued, regarding the U.S. tax legislation enacted on December 22, 2017; assumptions we have made regarding the investment return on retirement plan assets, and the costs associated with pension obligations; foreign currency fluctuations; the stability of credit and capital markets; risks associated with the company's information technology systems, including the threat of data breaches and cyber attacks; fundamental changes in tax laws; volatility in our effective tax rate; climate change; infringement of intellectual property rights, and those of customers; litigation, legal and administrative proceedings; and other risks described herein under Part I, Item 1A "Risk Factors."
Actual results could differ materially from those projected in the forward-looking statements. We undertake no obligation to update or revise publicly any forward-looking statements, whether as a result of new information, future events or otherwise, except as may be required by law.
Available Information
Our principal corporate internet website address is: www.mccormickcorporation.com. We make available free of charge through our website our Annual Report on Form 10-K, quarterly reports on Form 10-Q, current reports on Form 8-K, and amendments to those reports filed or furnished pursuant to Section 13(a) or 15(d) of the Securities Exchange Act of 1934 (the “Exchange Act”) as soon as reasonably practicable after such documents are
electronically filed with, or furnished to, the United States Securities and Exchange Commission (the “SEC”). The SEC maintains an internet website at www.sec.gov that contains reports, proxy and information statements, and other information regarding McCormick. Our website also includes our Corporate Governance Guidelines, Business Ethics Policy and charters of the Audit Committee, Compensation Committee, and Nominating/Corporate Governance Committee of our Board of Directors.
The following are certain risk factors that could affect our business, financial condition and results of operations. These risk factors should be considered in connection with evaluating the forward-looking statements contained in this Annual Report on Form 10-K because these factors could cause the actual results and conditions to differ materially from those projected in forward-looking statements. Before you buy our Common Stock or Common Stock Non-Voting, you should know that making such an investment involves risks, including the risks described below. Additional risks and uncertainties that are not presently known to us or are currently deemed to be immaterial also may materially adversely affect our business, financial condition, or results of operations in the future. If any of the risks actually occur, our business, financial condition or results of operations could be negatively affected. In that case, the trading price of our securities could decline, and you may lose part or all of your investment.
Damage to our reputation or brand name, loss of brand relevance, increase in use of private label or other competitive brands by customers or consumers, or product quality or safety concerns could negatively impact our business, financial condition or results of operations.
We have many iconic brands with long-standing consumer recognition. Our success depends on our ability to maintain our brand image for our existing products, extend our brands to new platforms, and expand our brand image with new product offerings.
We continually make efforts to maintain and improve relationships with our customers and consumers and to increase awareness and relevance of our brands through effective marketing and other measures. From time to time, our customers evaluate their mix of product offerings, and consumers have the option to purchase private label or other competitive products instead of our branded products. If a significant portion of our branded business was switched to private label or competitive products, it could have a material negative impact on our consumer segment.
Our reputation for manufacturing high-quality products is widely recognized. In order to safeguard that reputation, we have adopted rigorous quality assurance and quality control procedures which are designed to ensure the safety of our products. A serious breach of our quality assurance or quality control procedures, deterioration of our quality image, impairment of our customer or consumer relationships or failure to adequately protect the relevance of our brands may lead to litigation, customers purchasing from our competitors or consumers purchasing other brands or private label items that may or may not be manufactured by us, any of which could have a material negative impact on our business, financial condition or results of operations.
The food industry generally is subject to risks posed by food spoilage and contamination, product tampering, product recall, import alerts and consumer product liability claims. For instance, we may be required to recall certain of our products should they be mislabeled, contaminated or damaged, and certain of our raw materials could be blocked from entering the country if they were subject to import alerts. We also may become involved in lawsuits and legal proceedings if it is alleged that the consumption of any of our products could cause injury or illness, or that any of our products are mislabeled or fail to meet applicable legal requirements (even if the allegation is untrue). A product recall, import alert or an adverse result in any such litigation, or negative perceptions regarding food products and ingredients, could result in our having to pay fines or damages, incur additional costs or cause customers and consumers in our principal markets to lose confidence in the safety and quality of certain products or ingredients, any of which could have a negative effect on our business or financial results and, depending upon the significance of the affected product, that negative effect could be material to our business or financial results. Negative publicity about these concerns, whether or not valid, may discourage customers and consumers from buying our products or cause disruptions in production or distribution of our products and adversely affect our business, financial condition or results of operations.
The rising popularity of social networking and other consumer-oriented technologies has increased the speed and accessibility of information dissemination (whether or not accurate), and, as a result, negative, inaccurate, or misleading posts or comments on websites may generate adverse publicity that could damage our reputation or
brands.
Customer consolidation, and competitive, economic and other pressures facing our customers, may put pressure on our operating margins and profitability.
A number of our customers, such as supermarkets, warehouse clubs and food distributors, have consolidated in recent years and consolidation could continue. Such consolidation could present a challenge to margin growth and profitability in that it has produced large, sophisticated customers with increased buying power who are more capable of operating with reduced inventories; resisting price increases; demanding lower pricing, increased promotional programs and specifically tailored products; and shifting shelf space currently used for our products to private label and other competitive products. The economic and competitive landscape for our customers is constantly changing, such as the emergence of new sales channels like e-commerce, and our customers' responses to those changes could impact our business. Our industrial segment may be impacted if the reputation or perception of the customers of our industrial segment declines. These factors and others could have an adverse impact on our business, financial condition or results of operations.
The inability to maintain mutually beneficial relationships with large customers could adversely affect our business.
We have a number of major customers, including two large customers that, in the aggregate, constituted approximately 22% of our consolidated sales in
2017
. The loss of either of these large customers or a material negative change in our relationship with these large customers or other major customers could have an adverse effect on our business.
Disruption of our supply chain and issues regarding procurement of raw materials may negatively impact us.
Our purchases of raw materials are subject to fluctuations in market price and availability caused by weather, growing and harvesting conditions, market conditions, governmental actions and other factors beyond our control. The most significant raw materials used by us in our business are pepper, dairy products, garlic, vanilla, capsicums (red peppers and paprika), onion, wheat flour and rice. While future price movements of raw material costs are uncertain, we seek to mitigate the market price risk in a number of ways, including strategic raw material purchases, purchases of raw material for future delivery, customer price adjustments and cost savings from our CCI program. We generally have not used derivatives to manage the volatility related to this risk. To the extent that we have used derivatives for this purpose, it has not been material to our business. Any actions we take in response to market price fluctuations may not effectively limit or eliminate our exposure to changes in raw material prices. Therefore, we cannot provide assurance that future raw material price fluctuations will not have a negative impact on our business, financial condition or operating results.
In addition, we may have very little opportunity to mitigate the risk of availability of certain raw materials due to the effect of weather on crop yield, government actions, political unrest in producing countries, action or inaction by suppliers in response to laws and regulations, changes in agricultural programs and other factors beyond our control. Therefore, we cannot provide assurance that future raw material availability will not have a negative impact on our business, financial condition or operating results.
Political, socio-economic and cultural conditions, as well as disruptions caused by terrorist activities or otherwise, could also create additional risks for regulatory compliance. Although we have adopted rigorous quality assurance and quality control procedures which are designed to ensure the safety of our imported products, we cannot provide assurance that such events will not have a negative impact on our business, financial condition or operating results.
Our profitability may suffer as a result of competition in our markets.
The food industry is intensely competitive. Competition in our product categories is based on price, product innovation, product quality, brand recognition and loyalty, effectiveness of marketing and promotional activity, and the ability to identify and satisfy consumer preferences. From time to time, we may need to reduce the prices for some of our products to respond to competitive and customer pressures, which may adversely affect our profitability. Such pressures could reduce our ability to take appropriate remedial action to address commodity and other cost increases.
Laws and regulations could adversely affect our business.
Food products are extensively regulated in most of the countries in which we sell our products. We are subject to numerous laws and regulations relating to the growing, sourcing, manufacturing, storage, labeling, marketing,
advertising and distribution of food products, as well as laws and regulations relating to financial reporting requirements, the environment, competition, anti-corruption, privacy, relations with distributors and retailers, foreign supplier verification, the import and export of products and product ingredients, employment, health and safety, and trade practices. Enforcement of existing laws and regulations, changes in legal requirements, and/or evolving interpretations of existing regulatory requirements may result in increased compliance costs and create other obligations, financial or otherwise, that could adversely affect our business, financial condition or operating results. Increased regulatory scrutiny of, and increased litigation involving, product claims and concerns regarding the attributes of food products and ingredients may increase compliance costs and create other obligations that could adversely affect our business, financial condition or operating results. Governments may also impose requirements and restrictions that impact our business, such as labeling disclosures pertaining to ingredients. For example, "Proposition 65, the Safe Drinking Water and Toxic Enforcement Act of 1986," in California exposes all food companies to the possibility of having to provide warnings on their products in that state. If we were required to add warning labels to any of our products or place warnings in locations where our products are sold in order to comply with Proposition 65, the sales of those products and other products of our company could suffer, not only in those locations but elsewhere. These factors and others could have an adverse impact on our business, financial condition or results of operations.
Our operations may be impaired as a result of disasters, business interruptions or similar events.
We could have an interruption in our business, loss of inventory or data, or be rendered unable to accept and fulfill customer orders as a result of a natural disaster, catastrophic event, epidemic or computer system failure. Natural disasters could include an earthquake, fire, flood, tornado or severe storm. A catastrophic event could include a terrorist attack. An epidemic could affect our operations, major facilities or employees’ and consumers’ health. In addition, some of our inventory and production facilities are located in areas that are susceptible to harsh weather; a major storm, heavy snowfall or other similar event could prevent us from delivering products in a timely manner. Production of certain of our products is concentrated in a single manufacturing site.
We cannot provide assurance that our disaster recovery plan will address all of the issues we may encounter in the event of a disaster or other unanticipated issue, and our business interruption insurance may not adequately compensate us for losses that may occur from any of the foregoing. In the event that a natural disaster, terrorist attack or other catastrophic event were to destroy any part of our facilities or interrupt our operations for any extended period of time, or if harsh weather or health conditions prevent us from delivering products in a timely manner, our business, financial condition or operating results could be adversely affected.
We may not be able to successfully consummate and manage ongoing acquisition, joint venture and divestiture activities which could have an impact on our results.
From time to time, we may acquire other businesses and, based on an evaluation of our business portfolio, divest existing businesses. These acquisitions, joint ventures and divestitures may present financial, managerial and operational challenges, including diversion of management attention from existing businesses, difficulty with integrating or separating personnel and financial and other systems, increased expenses and raw material costs, assumption of unknown liabilities and indemnities, and potential disputes with the buyers or sellers. In addition, we may be required to incur asset impairment charges (including charges related to goodwill and other intangible assets) in connection with acquired businesses which may reduce our profitability. If we are unable to consummate such transactions, or successfully integrate and grow acquisitions and achieve contemplated revenue synergies and cost savings, our financial results could be adversely affected. Additionally, joint ventures inherently involve a lesser degree of control over business operations, thereby potentially increasing the financial, legal, operational, and/or compliance risks.
Our foreign and cross-border operations are subject to additional risks.
We operate our business and market our products internationally. In fiscal year
2017
, 41% of our sales were generated in foreign countries. Our foreign operations are subject to additional risks, including fluctuations in currency values, foreign currency exchange controls, discriminatory fiscal policies, compliance with U.S. and foreign laws, enforcement of remedies in foreign jurisdictions and other economic or political uncertainties. Several countries within the European Union continue to experience sovereign debt and credit issues which causes more volatility in the economic environment throughout the European Union and the United Kingdom (U.K.). Additionally, international sales, together with finished goods and raw materials imported into the U.S., are subject to risks related to fundamental changes to tax laws as well as the imposition of tariffs, quotas, trade barriers and other similar restrictions. All of these risks could result in increased costs or decreased revenues, which could adversely affect our profitability.
Fluctuations in foreign currency markets may negatively impact us.
We are exposed to fluctuations in foreign currency in the following main areas: cash flows related to raw material purchases; the translation of foreign currency earnings to U.S. dollars; the effects of foreign currency on loans between subsidiaries and unconsolidated affiliates and on cash flows related to repatriation of earnings of unconsolidated affiliates. Primary exposures include the U.S. dollar versus the Euro, British pound sterling, Canadian dollar, Polish zloty, Australian dollar, Mexican peso, Chinese renminbi, Indian rupee and Thai baht, as well as the Euro versus the British pound sterling, Australian dollar and Swiss franc. We routinely enter into foreign currency exchange contracts to facilitate managing certain of these foreign currency risks. However, these contracts may not effectively limit or eliminate our exposure to a decline in operating results due to foreign currency exchange changes. Therefore, we cannot provide assurance that future exchange rate fluctuations will not have a negative impact on our business, financial position or operating results.
The decision by British voters to exit the European Union may negatively impact our operations.
The June 2016 referendum by British voters to exit the European Union (“Brexit”) adversely impacted global markets and resulted in a sharp decline in the value of the British pound, as compared to the U.S. dollar and other currencies. As the U.K. negotiates its exit from the European Union, volatility in exchange rates and in U.K. interest rates may continue. In the near term, a weaker British pound compared to the U.S. dollar during a reporting period causes local currency results of our U.K. operations to be translated into fewer U.S. dollars; a weaker British pound compared to other currencies increases the cost of goods imported into our U.K. operations and may decrease the profitability of our U.K. operations; and a higher U.K. interest rate may have a dampening effect on the U.K. economy. In the longer term, any impact from Brexit on our U.K. operations will depend, in part, on the outcome of tariff, trade, regulatory and other negotiations.
Increases in interest rates or changes in our credit ratings may negatively impact us.
We had total outstanding short-term borrowings of $258 million at an average interest rate of approximately 2.3% on November 30,
2017
. We also had total outstanding variable rate long-term debt, including current maturities, of $1,243 million at an average interest rate of approximately 2.7% on November 30, 2017. The interest rates under our term loans and revolving credit facilities can vary based on our credit ratings. Our policy is to manage our interest rate risk by entering into both fixed and variable rate debt arrangements. We also use interest rate swaps to minimize worldwide financing cost and to achieve a desired mix of fixed and variable rate debt. We utilize derivative financial instruments to enhance our ability to manage risk, including interest rate exposures that exist as part of our ongoing business operations. We do not enter into contracts for trading purposes, nor are we a party to any leveraged derivative instruments. Our use of derivative financial instruments is monitored through regular communication with senior management and the utilization of written guidelines. However, our use of these instruments may not effectively limit or eliminate our exposure to changes in interest rates. Therefore, we cannot provide assurance that future credit rating or interest rate changes will not have a material negative impact on our business, financial position or operating results.
Our credit ratings impact the cost and availability of future borrowings and, accordingly, our cost of capital.
Our credit ratings reflect each rating organization's opinion of our financial strength, operating performance and ability to meet our debt obligations. Our credit ratings were downgraded following our financing of the acquisition of RB Foods in August 2017, and any reduction in our credit ratings may limit our ability to borrow at interest rates consistent with the interest rates that were available to us prior to that acquisition and the related financing transactions. If our credit ratings are further downgraded or put on watch for a potential downgrade, we may not be able to sell additional debt securities or borrow money in the amounts, at the times or interest rates or upon the more favorable terms and conditions that might be available if our current credit ratings were maintained.
We have incurred additional indebtedness to finance the acquisition of RB Foods and may not be able to meet our debt service requirements.
After financing our acquisition of RB Foods, we have a significant amount of indebtedness outstanding. As of November 30, 2017, the indebtedness of McCormick and its subsidiaries is approximately $5.0 billion. This substantial level of indebtedness could have important consequences to our business, including, but not limited to:
|
•
|
reducing the benefits that we expect to receive from the acquisition of RB Foods;
|
|
•
|
increasing our debt service obligations, making it more difficult for us to satisfy our obligations;
|
|
•
|
limiting our ability to borrow additional funds and increasing the cost of any such borrowing;
|
|
•
|
increasing our exposure to negative fluctuations in interest rates;
|
|
•
|
subjecting us to financial and other restrictive covenants, the non-compliance with which could result in an event of default;
|
|
•
|
increasing our vulnerability to, and reducing our flexibility to respond to, general adverse economic and industry conditions;
|
|
•
|
limiting our flexibility in planning for, or reacting to, changes in our business and the industry in which we operate;
|
|
•
|
placing us at a competitive disadvantage as compared to our competitors, to the extent that they are not as highly leveraged; and
|
|
•
|
restricting us from pursuing certain business opportunities, including other acquisitions.
|
The deterioration of credit and capital markets may adversely affect our access to sources of funding.
We rely on our revolving credit facilities, or borrowings backed by these facilities, to fund a portion of our seasonal working capital needs and other general corporate purposes. If any of the banks in the syndicates backing these facilities were unable to perform on its commitments, our liquidity could be impacted, which could adversely affect funding of seasonal working capital requirements. We engage in regular communication with all of the banks participating in our revolving credit facilities. During these communications, none of the banks have indicated that they may be unable to perform on their commitments. In addition, we periodically review our banking and financing relationships, considering the stability of the institutions, pricing we receive on services and other aspects of the relationships. Based on these communications and our monitoring activities, we believe the likelihood of one of our banks not performing on its commitment is remote.
In addition, global capital markets have experienced volatility in the past that has tightened access to capital markets and other sources of funding, and such volatility and tightened access could reoccur in the future. In the event that we need to access the capital markets or other sources of financing, there can be no assurance that we will be able to obtain financing on acceptable terms or within an acceptable time period. Our inability to obtain financing on acceptable terms or within an acceptable time period could have an adverse impact on our operations, financial condition and liquidity.
We face risks associated with certain pension assets and obligations.
We hold investments in equity and debt securities in our qualified defined benefit pension plans and in a rabbi trust for our U.S. non-qualified pension plan. Deterioration in the value of plan assets resulting from a general financial downturn or otherwise, or an increase in the actuarial valuation of the plans' liability due to a low interest rate environment, could cause (or increase) an underfunded status of our defined benefit pension plans, thereby increasing our obligation to make contributions to the plans. An obligation to make contributions to pension plans could reduce the cash available for working capital and other corporate uses, and may have an adverse impact on our operations, financial condition and liquidity.
Uncertain global economic conditions expose us to credit risks from customers and counterparties.
Consolidations in some of the industries in which our customers operate have created larger customers, some of which are highly leveraged. In addition, competition has increased with the growth in alternative channels through our customer base. These factors have caused some customers to be less profitable and increased our exposure to credit risk. Current credit markets are volatile, and some of our customers and counterparties are highly leveraged. A significant adverse change in the financial and/or credit position of a customer or counterparty could require us to assume greater credit risk relating to that customer or counterparty and could limit our ability to collect receivables. This could have an adverse impact on our financial condition and liquidity.
Our operations and reputation may be impaired if our information technology systems fail to perform adequately or if we are the subject of a data breach or cyber attack.
Our information technology systems are critically important to operating our business efficiently. We rely on our information technology systems to manage our business data, communications, supply chain, order entry and fulfillment, and other business processes. The failure of our information technology systems to perform as we anticipate could disrupt our business and could result in transaction errors, processing inefficiencies and the loss of sales and customers, causing our business and results of operations to suffer.
Furthermore, our information technology systems may be vulnerable to security breaches beyond our control, including those involving cyber attacks using viruses, worms or other destructive software, process breakdowns, or other malicious activities, or any combination of the foregoing. Such breaches could result in unauthorized access
to information including customer, consumer or other company confidential data. We invest in security technology and design our business processes to mitigate the risk of such breaches. While we believe that these measures are generally effective, there can be no assurance that security breaches will not occur. Moreover, the development and maintenance of these measures requires continuous monitoring as technologies change and efforts to overcome security measures evolve. We have experienced, and expect to continue to experience, cybersecurity threats and incidents, none of which has been material to us to date. However, a successful breach or attack could have a material, negative impact on our operations or business reputation and subject us to consequences such as litigation, regulatory enforcement proceedings and direct costs associated with incident response.
The global nature of our business and the resolution of tax disputes create volatility in our effective tax rate.
As a global business, our tax rate from period to period can be affected by many factors, including changes in tax
legislation, our global mix of earnings, the tax characteristics of our income, the timing and recognition of goodwill
impairments, acquisitions and dispositions, adjustments to our reserves related to uncertain tax positions, changes in valuation allowances and the portion of the income of foreign subsidiaries that we expect to remit to the U.S. and that will be taxable.
In addition, significant judgment is required in determining our effective tax rate and in evaluating our tax positions. We establish accruals for certain tax contingencies when, despite the belief that our tax return positions are appropriately supported, the positions are uncertain. The tax contingency accruals are adjusted in light of changing facts and circumstances, such as the progress of tax audits, case law and emerging legislation. Our effective tax rate includes the impact of tax contingency accruals and changes to those accruals, including related interest and penalties, as considered appropriate by management. When particular matters arise, a number of years may elapse before such matters are audited and finally resolved. Favorable resolution of such matters could be recognized as a reduction to our effective tax rate in the year of resolution. Unfavorable resolution of any particular issue could increase the effective tax rate and may require the use of cash in the year of resolution.
Climate change may negatively affect our business, financial condition and results of operations.
Unseasonable or unusual weather or long-term climate changes may negatively impact the price or availability of spices, herbs and other raw materials. There is concern that greenhouse gases in the atmosphere may have an adverse impact on global temperatures, weather patterns and the frequency and severity of extreme weather and natural disasters. In the event that such climate change has a negative effect on agricultural productivity or practices, we may be subject to decreased availability or less favorable pricing for certain commodities that are necessary for our products. In addition, such climate change may result in modifications to the eating preferences of the ultimate consumers of certain of our products, which may also unfavorably impact our sales and profitability.
Our intellectual property rights, and those of our customers, could be infringed, challenged or impaired, and reduce the value of our products and brands or our business with customers.
We possess intellectual property rights that are important to our business, and we are provided access by certain customers to particular intellectual property rights belonging to such customers. These intellectual property rights include ingredient formulas, trademarks, copyrights, patents, business processes and other trade secrets which are important to our business and relate to some of our products, our packaging, the processes for their production, and the design and operation of equipment used in our businesses. We protect our intellectual property rights, and those of certain customers, globally through a variety of means, including trademarks, copyrights, patents and trade secrets, third-party assignments and nondisclosure agreements, and monitoring of third-party misuses of intellectual property. If we fail to obtain or adequately protect our intellectual property (and the intellectual property of customers to which we have been given access), the value of our products and brands could be reduced and there could be an adverse impact on our business, financial condition and results of operations.
Litigation, legal or administrative proceedings could have an adverse impact on our business and financial condition or damage our reputation.
We are party to a variety of legal claims and proceedings in the ordinary course of business. Since litigation is inherently uncertain, there is no guarantee that we will be successful in defending ourselves against such claims or proceedings, or that management’s assessment of the materiality or immateriality of these matters, including any reserves taken in connection with such matters, will be consistent with the ultimate outcome of such claims or
proceedings. In the event that management’s assessment of the materiality or immateriality of current claims and proceedings proves inaccurate, or litigation that is material arises in the future, there may be a material adverse effect on our financial condition. Any adverse publicity resulting from allegations made in litigation claims or legal or administrative proceedings (even if untrue) may also adversely affect our reputation. These factors and others could have an adverse impact on our business and financial condition or damage our reputation.
Streamlining actions to reduce fixed costs, simplify or improve processes, and improve our competitiveness may have a negative effect on employee relations.
We regularly evaluate whether to implement changes to our organization structure to reduce fixed costs, simplify or improve processes, and improve our competitiveness, and we expect to continue to evaluate such actions in the future. From time to time, those changes are of such significance that we may transfer production from one manufacturing facility to another; transfer certain selling and administrative functions from one location to another; eliminate certain manufacturing, selling and administrative positions; and exit certain businesses or lines of business. These actions may result in a deterioration of employee relations at the impacted locations or elsewhere in McCormick.
If we are unable to fully realize the benefits from our CCI program, our financial results could be negatively affected.
Our future success depends in part on our ability to be an efficient producer in a highly competitive industry. Any failure by us to achieve our planned cost savings and efficiencies under our CCI program, or other similar programs, could have an adverse effect on our business, results of operations and financial position.
We have incurred significant transaction and integration expenses in connection with the acquisition of RB Foods that could adversely affect our results of operations.
We have incurred significant transaction expenses in connection with the RB Foods acquisition, including payment of certain fees and expenses incurred in connection with the acquisition and related financing transactions. We have also incurred significant integration expenses, and expect to continue to incur such expenses in 2018. Additional unanticipated expenses may be incurred in the integration process. These could adversely affect our results of operations in the period in which such expenses are recorded or our cash flow in the period in which any related costs are actually paid.
RB Foods may underperform relative to our expectations.
We may not be able to maintain the growth rate, levels of revenue, earnings or operating efficiency that we and RB Foods have achieved prior to the completion of that acquisition or might have achieved separately. The business and financial performance of RB Foods are subject to certain risks and uncertainties. The underperformance of RB Foods relative to our expectations could have a material adverse effect on our financial condition and results of operations.
We may fail to realize all of the anticipated benefits that we envisioned at the time of our acquisition of RB Foods or those benefits may take longer to realize than expected. We may also encounter significant difficulties in integrating RB Foods.
Our ability to realize the anticipated benefits of our acquisition of RB Foods will depend, to a large extent, on our ability to integrate RB Foods into the rest of our business, which is a complex, costly and time-consuming process. The nature of a carve-out acquisition, such as RB Foods, makes it inherently more difficult to assume operations upon closing of the acquisition and to integrate activities, as certain systems, processes and employees may not all be transferred with RB Foods to support such activities. As a result, we will be required to continue to devote significant management attention and resources to integrate the business practices and operations of McCormick and RB Foods. Future integration efforts may disrupt our business and, if implemented ineffectively, could restrict the realization of the full expected benefits. The failure to meet the challenges involved in the integration process and to realize the anticipated benefits of the RB Foods acquisition could cause an interruption of, or a loss of momentum in, our operations and could adversely affect our business, financial condition and results of operations.
In addition, the further integration of RB Foods may result in material unanticipated problems, expenses, liabilities, competitive responses, loss of customers and other business relationships, and diversion of management’s attention. Additional integration challenges include:
|
•
|
difficulties in achieving anticipated cost savings, synergies, business opportunities and growth prospects from the acquisition of RB Foods;
|
|
•
|
difficulties in the integration of operations and systems;
|
|
•
|
difficulties in conforming standards, controls, procedures and accounting and other policies, business cultures and compensation structures;
|
|
•
|
difficulties in the assimilation of employees;
|
|
•
|
managing the potential impact of competing or duplicative products;
|
|
•
|
difficulties in managing the expanded operations of a significantly larger and more complex company;
|
|
•
|
challenges in obtaining new customers;
|
|
•
|
challenges in attracting and retaining key personnel; and
|
|
•
|
the impact of potential liabilities we may be inheriting from RB Foods.
|
Many of these factors will be outside of our control and any one of them could result in increased costs, decreases in the amount of expected revenues and diversion of management’s time and energy, which could adversely affect our business, financial condition and results of operations and result in us becoming subject to litigation. In addition, even if RB Foods is integrated successfully, the full anticipated benefits of its acquisition may not be realized, including the synergies, cost savings or sales or growth opportunities that are anticipated. These benefits may not be achieved within the anticipated time frame, or at all. Further, additional unanticipated costs may be incurred in the integration process. Each of these factors could cause reductions in our earnings per share, decrease or delay the expected accretive effect of the acquisition and negatively impact the price of shares of our common stock. As a result, it cannot be assured that the acquisition of RB Foods will result in the realization of the full anticipated benefits.
We expect that, for a period of time following our acquisition of RB Foods on August 17, 2017, we will have significantly less cash on hand than prior to that date.
We expect to have, for a period of time following the August 17, 2017 acquisition of RB Foods, significantly less cash and cash equivalents on hand than the cash and cash equivalents that we had on hand prior to that date. Although we believe that we will have access to cash sufficient to meet our business objectives and capital needs, the lessened availability of cash and cash equivalents for a period of time following the acquisition of RB Foods could constrain our ability to grow our business. Our more leveraged financial position following the acquisition of RB Foods could also make us vulnerable to general economic downturns and industry conditions, and place us at a competitive disadvantage relative to our competitors that have more cash at their disposal. In the event that we do not have adequate capital to maintain or develop our business, additional capital may not be available to us on a timely basis, on favorable terms, or at all.
The acquisition of RB Foods has significantly increased our goodwill and other intangible assets.
We have a significant amount of goodwill and other intangible assets on our consolidated financial statements that are subject to impairment based upon future adverse changes in our business or prospects. The impairment of any goodwill and other intangible assets may have a negative impact on our consolidated results of operations.
Curtailment of our share repurchase program may not enhance shareholder value.
We have curtailed the repurchases of our shares under our share repurchase program. Upon the acquisition of RB Foods, we announced our intention to reduce our leverage ratio by curtailing our share repurchase program, but there can be no assurance that curtailment of the program will result in the reduction of our leverage ratio. Our board of directors reserves the right to expand or terminate the share repurchase program at any time. Curtailment of the share repurchase program may not have the intended effects and may have a negative impact on our stock price.
The declaration, payment and amount of dividends is made at the discretion of our board of directors and depends on a number of factors.
The declaration, payment and amount of any dividends is made pursuant to our dividend policy and is subject to final determination each quarter by our board of directors in its discretion based on a number of factors that it deems relevant, including our financial position, results of operations, available cash resources, cash requirements and alternative uses of cash that our board of directors may conclude would be in the best interest of the company and our shareholders. Our dividend payments are subject to solvency conditions established by the Maryland General Corporation Law. Accordingly, there can be no assurance that any future dividends will be equal or similar in amount to any dividends previously paid or that our board of directors will not decide to reduce, suspend or discontinue the payment of dividends at any time in the future.
None.
Our principal executive offices and primary research facilities are owned and are located in suburban Baltimore, Maryland.
The following is a list of our principal manufacturing properties, all of which are owned except for the facilities in Commerce, California; Lakewood, New Jersey; Melbourne, Australia; Florence, Italy and a portion of the facility in Littleborough, England, which are leased. The manufacturing facilities that we own in Guangzhou, Shanghai and Wuhan, China are each located on land subject to long-term leases:
United States:
Hunt Valley, Maryland–consumer and industrial
(3 principal plants)
Gretna, Louisiana–consumer and industrial
South Bend, Indiana–industrial and consumer
Atlanta, Georgia–industrial
Commerce, California–consumer
Irving, Texas–industrial
Lakewood, New Jersey–industrial
Springfield, Missouri–consumer and industrial
Canada:
London, Ontario–consumer and industrial
Mexico:
Cuautitlan de Romero Rubio–industrial
United Kingdom:
Haddenham, England–industrial and consumer
Littleborough, England–industrial
France:
Carpentras–consumer and industrial
Monteux–consumer and industrial
Poland:
Stefanowo–consumer
Italy:
Florence–consumer and industrial (3 principal plants)
China:
Guangzhou–consumer and industrial
Shanghai–consumer and industrial
Wuhan–consumer
Australia:
Melbourne–consumer and industrial
Palmwoods–consumer (2 principal plants)
India:
New Delhi–consumer
El Salvador:
San Salvador–consumer
Thailand:
Chonburi–consumer and industrial (under construction)
In addition to distribution facilities and warehouse space available at our manufacturing facilities, we lease regional distribution facilities as follows (i) in the U.S.: Belcamp and Aberdeen, Maryland; Salinas, California; Byhalia, Mississippi; Irving, Texas; Springfield, Missouri; (ii) in Canada: Mississauga and London, Ontario; (iii) in Heywood, United Kingdom and (iv) in Genvilliers, France. We also own distribution facilities in Belcamp, Maryland and Monteux, France. In addition, we own, lease or contract other properties used for manufacturing consumer and industrial products and for sales, warehousing, distribution and administrative functions.
We believe our plants are well maintained and suitable for their intended use. We further believe that these plants generally have adequate capacity or the ability to expand, and can accommodate seasonal demands, changing product mixes and additional growth.
There are no material pending legal proceedings in which we or any of our subsidiaries are a party or to which any of our or their property is the subject.
Not Applicable.
|
|
We have disclosed in note 18 of the financial statements the information relating to the market price and dividends declared and paid on our classes of common stock. The market price of our common stock at the close of business on December 29, 2017 was $100.50 per share for the Common Stock and $101.91 per share for the Common Stock Non-Voting.
Our Common Stock and Common Stock Non-Voting are listed and traded on the New York Stock Exchange (“NYSE”). The approximate number of holders of our common stock based on record ownership as of December 29, 2017 was as follows:
|
Title of class
|
Approximate
number
of record
holders
|
|
|
Common Stock, no par value
|
2,000
|
|
|
Common Stock Non-Voting, no par value
|
9,600
|
|
The following table summarizes our purchases of Common Stock (CS) and Common Stock Non-Voting (CSNV) during the fourth quarter of 2017:
ISSUER PURCHASES OF EQUITY SECURITIES
|
Period
|
Total number of
shares purchased
|
Average price
paid per share
|
Total number of shares purchased as part of publicly announced plans or programs
|
Approximate dollar value of shares that may yet be purchased under the plans or programs
|
|
September 1, 2017 to
September 30, 2017
|
CS-0
CSNV-0
|
-
- |
-
-
|
$191 million
|
|
October 1, 2017 to
October 31, 2017
|
CS-20,175
(1)
CSNV-0
|
$99.33
- |
20,175
- |
$189 million
|
|
November 1, 2017 to
November 30, 2017
|
CS-0
CSNV-0
|
-
- |
-
- |
$189 million
|
|
Total
|
CS-20,175
CSNV-0
|
$99.33
-
|
20,175
-
|
$189 million
|
|
(1)
|
On October 2, 2017 and October 27, 2017, we purchased 9,797 shares and 10,378 shares, respectively, of our CS from our U.S. defined contribution retirement plan to manage shares, based upon participant activity, in the plan's company stock fund. The prices paid per share of $99.80 and $98.88, respectively, represented the closing price of the CS on October 2, 2017 and October 27, 2017, respectively.
|
As of November 30, 2017, approximately $189 million remained of a $600 million share repurchase authorization approved by the Board of Directors in March 2015. The timing and amount of any shares repurchased is determined by our management based on its evaluation of market conditions and other factors. In connection with our August 2017 acquisition of RB Foods, we announced our intention to reduce our leverage ratio by curtailing the repurchases of shares under our share repurchase program.
In certain circumstances, we issue shares of CS in exchange for shares of CSNV, or issue shares of CSNV in exchange for shares of CS, in either case pursuant to the exemption from registration provided by Section 3(a)(9) of the Securities Act of 1933, as amended. Typically, these exchanges are made in connection with the administration of our employee benefit plans, executive compensation programs and dividend reinvestment/direct purchase plans. The number of shares issued in an exchange is generally equal to the number of shares received in the exchange, although the number may differ slightly to the extent necessary to comply with the requirements of the Employee Retirement Income Security Act of 1974. During fiscal 2017, we issued 1,776,381 shares of CSNV in exchange for shares of CS and issued 94,527 shares of CS in exchange for shares of CSNV.
HISTORICAL FINANCIAL SUMMARY
|
(millions except per share and percentage data)
|
2017
|
2016
|
2015
|
2014
|
2013
|
||||||||||
|
For the Year
|
|||||||||||||||
|
Net sales
|
$
|
4,834.1
|
|
$
|
4,411.5
|
|
$
|
4,296.3
|
|
$
|
4,243.2
|
|
$
|
4,123.4
|
|
|
Percent increase
|
9.6
|
%
|
2.7
|
%
|
1.3
|
%
|
2.9
|
%
|
2.7
|
%
|
|||||
|
Operating income
|
702.4
|
|
641.0
|
|
548.4
|
|
603.0
|
|
550.5
|
|
|||||
|
Income from unconsolidated operations
|
33.9
|
|
36.1
|
|
36.7
|
|
29.4
|
|
23.2
|
|
|||||
|
Net income
|
477.4
|
|
472.3
|
|
401.6
|
|
437.9
|
|
389.0
|
|
|||||
|
Per Common Share
|
|
|
|
|
|
||||||||||
|
Earnings per share–basic
|
$
|
3.77
|
|
$
|
3.73
|
|
$
|
3.14
|
|
$
|
3.37
|
|
$
|
2.94
|
|
|
Earnings per share–diluted
|
3.72
|
|
3.69
|
|
3.11
|
|
3.34
|
|
2.91
|
|
|||||
|
Common dividends declared
|
1.93
|
|
1.76
|
|
1.63
|
|
1.51
|
|
1.39
|
|
|||||
|
Closing price, non-voting shares–end of year
|
102.18
|
|
91.20
|
|
85.92
|
|
74.33
|
|
69.00
|
|
|||||
|
Book value per share
|
19.62
|
|
13.07
|
|
13.25
|
|
14.10
|
|
14.85
|
|
|||||
|
At Year-End
|
|
|
|
|
|
||||||||||
|
Total assets
(1)
|
$
|
10,385.8
|
|
$
|
4,635.9
|
|
$
|
4,472.6
|
|
$
|
4,382.3
|
|
$
|
4,416.0
|
|
|
Current debt
|
583.2
|
|
393.2
|
|
343.0
|
|
270.8
|
|
214.1
|
|
|||||
|
Long-term debt
(1)
|
4,443.9
|
|
1,054.0
|
|
1,051.4
|
|
1,013.1
|
|
1,017.8
|
|
|||||
|
Shareholders’ equity
|
2,570.9
|
|
1,638.1
|
|
1,686.9
|
|
1,809.4
|
|
1,947.7
|
|
|||||
|
Other Financial Measures
|
|
|
|
|
|
||||||||||
|
Percentage of net sales
|
|||||||||||||||
|
Gross profit
|
41.6
|
%
|
41.5
|
%
|
40.4
|
%
|
40.8
|
%
|
40.4
|
%
|
|||||
|
Operating income
|
14.5
|
%
|
14.5
|
%
|
12.8
|
%
|
14.2
|
%
|
13.4
|
%
|
|||||
|
Capital expenditures
|
$
|
182.4
|
|
$
|
153.8
|
|
$
|
128.4
|
|
$
|
132.7
|
|
$
|
99.9
|
|
|
Depreciation and amortization
|
125.2
|
|
108.7
|
|
105.9
|
|
102.7
|
|
106.0
|
|
|||||
|
Common share repurchases
|
137.8
|
|
242.7
|
|
145.8
|
|
244.3
|
|
177.4
|
|
|||||
|
Dividends paid
|
237.6
|
|
217.8
|
|
204.9
|
|
192.4
|
|
179.9
|
|
|||||
|
Average shares outstanding
|
|||||||||||||||
|
Basic
|
126.8
|
|
126.6
|
|
128.0
|
|
129.9
|
|
132.1
|
|
|||||
|
Diluted
|
128.4
|
|
128.0
|
|
129.2
|
|
131.0
|
|
133.6
|
|
|||||
|
(1)
|
Total assets and Long-term debt for fiscal year ended 2015, 2014 and 2013 reflect the provisions of Accounting Standards Updates 2015-03, related to the presentation of debt issuance costs, and 2015-17, related to the classification of deferred tax assets and liabilities, both of which we adopted as of November 30, 2016.
|
The historical financial summary includes the impact of certain items that affect the comparability of financial results year to year. In 2017, we recorded transaction and integration expenses related to our acquisition of RB Foods. In 2017, 2016, 2015, 2014 and 2013, we recorded special charges related to the completion of organization and streamlining actions. In addition, for 2016 and 2015, we recorded special charges related to the discontinuance of bulk-packaged and broken basmati rice product lines for our business in India. Lastly, in 2013, we recognized a loss on a voluntary pension settlement in the U.S. The net impact of these items is reflected in the following table:
|
(millions except per share data)
|
2017
|
2016
|
2015
|
2014
|
2013
|
||||||||||
|
Operating income
|
$
|
(83.9
|
)
|
$
|
(16.0
|
)
|
$
|
(65.5
|
)
|
$
|
(5.2
|
)
|
$
|
(40.3
|
)
|
|
Net income
|
(69.3
|
)
|
(11.1
|
)
|
(47.9
|
)
|
(3.7
|
)
|
(29.2
|
)
|
|||||
|
Earnings per share–diluted
|
(0.54
|
)
|
(0.09
|
)
|
(0.37
|
)
|
(0.03
|
)
|
(0.22
|
)
|
|||||
Overview
The following Management’s Discussion and Analysis of Financial Condition and Results of Operations (MD&A) is intended to help the reader understand McCormick & Company, Incorporated, our operations and our present business environment. MD&A is provided as a supplement to, and should be read in conjunction with, our financial statements and the accompanying notes thereto contained in Item 8 of this report. We use certain non-GAAP information that we believe is important for purposes of comparison to prior periods and development of future projections and earnings growth prospects. This information is also used by management to measure the profitability of our ongoing operations and analyze our business performance and trends. The dollar and share information in the charts and tables in the MD&A are in millions, except per share data.
McCormick is a global leader in flavor. The company manufactures, markets and distributes spices, seasoning mixes, condiments and other flavorful products to the entire food industry–retailers, food manufacturers and foodservice businesses. We manage our business in two operating segments, consumer and industrial, as described in Item 1 of this report.
Our long-term annual growth objectives in constant currency are to increase sales 4% to 6%, increase adjusted operating income 7% to 9% and increase adjusted earnings per share 9% to 11%.
Sales growth
: Over time, we expect to grow sales with similar contributions from: 1) our base business-driven by brand marketing support, customer intimacy, expanded distribution and category growth; 2) new products; and 3) acquisitions.
Base business
–In 2017, we increased our investment in brand marketing by 39% over the 2012 level and we plan a further increase in 2018. We measure the return on our brand marketing investment and have identified digital marketing as one of our highest return investments in brand marketing support. Through digital marketing, we are connecting with consumers in a personalized way to deliver recipes, provide cooking advice and discover new products.
New Products
–For our consumer segment, we believe that scalable and differentiated innovation continues to be one of the best ways to distinguish our brands from our competition, including private label. We are introducing products for every type of cooking occasion, from gourmet, premium items to convenient and value-priced flavors.
For industrial customers, we are developing seasonings for snacks and other food products, as well as flavors for new menu items. We have a solid pipeline of flavor solutions aligned with our customers’ new product launch plans, many of which include “better-for-you” innovation. With over 20 product innovation centers around the world, we are supporting the growth of our brands and those of our industrial customers with products that appeal to local consumers.
Acquisitions
–Acquisitions are expected to approximate one-third of our sales growth. Since the beginning of 2015, we have completed seven acquisitions, which are driving sales in both our consumer and industrial segments. We focus on acquisition opportunities that meet the growing demand for flavor and health. Geographically, our focus is on acquisitions that build scale where we currently have presence in both developed and emerging markets. In addition to bolt-on opportunities, we were seeking larger acquisitions.
On August 17, 2017, we completed the acquisition of Reckitt Benckiser's Food Division ("RB Foods") from Reckitt Benckiser Group plc. The purchase price was approximately $4.2 billion, net of acquired cash. The acquisition was funded through our issuance of approximately 6.35 million shares of common stock non-voting (see note 13 of the financial statements) and through new borrowings comprised of senior unsecured notes and pre-payable term loans (see note 6 of the financial statements). The acquired market-leading brands of RB Foods include French’s®, Frank’s RedHot® and Cattlemen’s®, which are a natural strategic fit with our robust global branded flavor portfolio. We believe that these additions move us to a leading position in the attractive U.S. condiments category and provide significant international growth opportunities for our consumer and industrial segments.
The RB Foods acquisition resulted in acquisitions contributing more than one-third of our sales growth in 2017 and is expected to result in acquisitions contributing more than one-third of our sales growth in 2018.
Cost savings
: We are fueling our investment in growth with cost savings from our CCI program, an ongoing initiative to improve productivity and reduce costs throughout the organization, as well as savings from the organization and streamlining actions described in note 3 of the financial statements. In addition to funding brand marketing support, product innovation and other growth initiatives, our CCI program helps offset higher material costs and is contributing to higher operating income and earnings per share.
Cash flow
: We continue to generate strong cash flow. Net cash provided by operating activities reached $815.3 million in 2017, an increase from $658.1 million in 2016. In 2017, we continued to have a balanced use of cash for debt repayment, capital expenditures and the return of cash to shareholders through dividends and share repurchases. We are using our cash to fund shareholder dividends, with annual increases in each of the past 32 years, and to fund capital expenditures, acquisitions and share repurchases. In 2017, the return of cash to our shareholders through dividends and share repurchase was $375.4 million. Due to our increased level of indebtedness because of the RB Foods acquisition, we expect to curtail our acquisition and share repurchase activity for a period of time in order to enable a return to our pre-acquisition credit profile.
On a long-term basis, we expect a combination of acquisitions and share repurchases to add about 2% to earnings per share growth.
In 2017, we achieved further growth of our business although sales and earnings reported in U.S. dollars were unfavorably impacted by the strength of the U.S. dollar and the resultant unfavorable effects of foreign currency exchange, as compared to 2016. Net sales rose 9.6% over the 2016 level, because of the following factors:
|
•
|
We grew volume and product mix, with increases in both our consumer and industrial segments. This added 1.7% of sales growth. The increases were driven by product innovation, brand marketing and expanded distribution including new retail channels.
|
|
•
|
Pricing actions to offset a mid-single digit increase in material cost inflation contributed 2.1% of the increase in net sales.
|
|
•
|
The incremental impact of acquisitions completed in 2017 and 2016 contributed 6.5% of the increase in net sales.
|
|
•
|
These increases were partially offset by unfavorable currency rates. This impact reduced the net sales growth rate by 0.7%. Excluding this impact, we grew sales 10.3% on a constant currency basis.
|
Operating income was $702.4 million in 2017 and $641.0 million in 2016. We recorded $22.2 million and $16.0 million of special charges in 2017 and 2016, respectively, related to organization and streamlining actions. In 2017, we also recorded $61.7 million of transaction and integration expenses relating to our acquisition of RB Foods that reduced operating income. In 2017 compared to the year-ago period, the favorable impact of higher sales, including the effects of acquisitions, and $117.0 million of cost savings from our CCI program and organization and streamlining actions more than offset higher special charges, transaction and integration expenses, material costs and a $24.1 million increase in brand marketing. Excluding special charges and, in 2017, transaction and integration expenses related to our acquisition of RB Foods, adjusted operating income was $786.3 million, an increase of 19.7% compared to $657.0 million in the year-ago period. In constant currency, adjusted operating income rose 20.5%. For further details and a reconciliation of non-GAAP to reported amounts, see Non-GAAP Financial Measures.
Diluted earnings per share was $3.72 in 2017 and $3.69 in 2016. The year-on-year increase in earnings per share was driven mainly by higher operating income, as described above, which was nearly offset by higher interest expense and higher shares outstanding. Special charges lowered earnings per share by $0.12 and $0.09 in 2017 and 2016, respectively. Transaction and integration expenses, including $15.4 million reflected as other debt costs, lowered earnings per share by $0.42 in 2017. Excluding the effect of those special charges and transaction and integration expenses, adjusted diluted earnings per share was $4.26 in 2017 and $3.78 in 2016, or an increase of 12.7%.
2018 Outlook
We project another year of strong financial performance in 2018 and, including the results of RB Foods from its acquisition date of August 17, 2017, we expect our constant currency growth rate in sales, operating income and adjusted earnings per share to exceed our long-term financial growth objectives.
In 2018, we expect to grow sales 12% to 14%, including an estimated 1% favorable impact from currency rates, or 11% to 13% on a constant currency basis. The incremental impact of the RB Foods acquisition is projected to contribute approximately 8% of that sales growth. We expect further increases in volume and product mix in our base business to drive the remaining sales growth anticipated in 2018 as, with material cost inflation projected in the low single digits, we do not expect significant pricing impact in 2018 other than the incremental impact of actions taken in 2017.
In 2018, we expect gross profit margin to be approximately 150 to 200 basis points higher than 2017, due to a projected low single digit increase in material costs that is more than offset by the effects of favorable business mix, CCI-led cost savings and the lack of $20.9 million of transaction and integration expenses reflected in cost of goods sold in 2017 related to the RB Foods acquisition.
Led by CCI, we expect to reach cost savings of approximately $100 million in 2018, with a large portion impacting our cost of goods sold. Material cost inflation is expected to be in the mid-single digit range and we expect to offset most of this incremental impact with our 2017 pricing actions.
In 2018, we expect a significant increase in operating income, in part, due to the effects of the RB Foods acquisition including the lower amount of transaction and integration expenses. We expect 2018’s adjusted operating income to increase 23% to 25%, which includes the incremental impact of the RB Foods acquisition and a 1% favorable impact from currency rates. For 2018, we plan to increase brand marketing at a rate above our sales growth.
On December 22, 2017, President Trump signed into law H.R. 1, “An Act to provide for reconciliation pursuant to titles II and V of the concurrent resolution on the budget for fiscal year 2018” (this legislation was formerly called the “Tax Cuts and Jobs Act” and is referred to herein as the “U.S. Tax Act”). The U.S. Tax Act provides for significant changes in the U.S. Internal Revenue Code of 1986, as amended. The U.S. Tax Act contains provisions with separate effective dates but is generally effective for taxable years beginning after December 31, 2017. Certain provisions of the U.S. Tax Act will be effective during our fiscal year ending November 30, 2018 with all provisions of the U.S. Tax Act effective as of the beginning of our fiscal year ending November 30, 2019
.
We expect that U.S. Tax Act will have the following effects on our income tax expense for the fiscal year ending November 30, 2018:
|
•
|
The U.S. Tax Act imposes a tax on post-1986 earnings of non-U.S. affiliates that have not been repatriated for purposes of US federal income tax, with those earnings taxed at rates of 15.5% for earnings reflected by cash and cash equivalent items and 8% for other assets. We estimate this tax to be in the range of $70 million to $90 million, which we will recognize as a component of income tax expense in our first quarter of fiscal 2018. The cash tax effects of this deemed repatriation can be remitted in installments over an eight-year period as follows: (i) for each of the initial five years, 8% of the net tax liability is required to be remitted on an annual basis; (ii) in the sixth year, 15% of the net tax liability is required to be remitted; (iii) in the seventh year, 20% of the net tax liability is required to be remitted; and (iv) in the eighth year, the remaining 25% of the net tax liability is required to be remitted. We anticipate that we will pay this tax in installments over the eight-year period and anticipate cash payments of the deemed repatriation tax to approximate $6 million to $7 million in each of the next five years.
|
|
•
|
Under Financial Accounting Standards Board Accounting Standards Codification (ASC) Topic 740, Income Taxes (“ASC 740”), we are required to revalue any deferred tax assets or liabilities in the period of enactment of change in tax rates. The U.S. Tax Act lowers the corporate income tax rate from 35% to 21%. We estimate that the revaluation of our U.S. deferred tax assets and liabilities will reduce our net U.S. deferred income tax liability by approximately $400 million and will be reflected as a reduction in our income tax expense in our results for the quarter ending February 28, 2018.
|
|
•
|
The U.S. Tax Act is generally effective for tax years beginning after December 31, 2017. As such, the reduction in the corporate income tax rate from 35% to 21% will be effective for the final eleven months of our fiscal year ending November 30, 2018, with our U.S. earnings for the month of December 2017 taxed at a 35% rate. We estimate that our consolidated effective tax rate in fiscal year 2018, excluding the effects of
|
the repatriation tax and the revaluation of our deferred tax assets and liabilities as described above and other discrete items, will approximate 24%.
|
•
|
We estimate that our effective tax rate for fiscal 2018 will be negative because of the combined impact of the repatriation tax, the revaluation of our U.S. deferred tax assets and liabilities, and the lower U.S. corporate tax rate.
|
As previously noted, the U.S. Tax Act will fully affect us in fiscal year 2019 as certain other of its provisions related to the taxation of non-U.S. activity on a current basis will impact our results, particularly the “global intangible low-taxed income” tax that imposes a tax on earnings that are not subject to tax by non-U.S. jurisdictions above a certain minimum rate. Consequently, we estimate that our consolidated effective tax rate, excluding the effects of discrete tax items, will approximate 25% to 26% in fiscal 2019.
The Securities and Exchange Commission issued Staff Accounting Bulletin No. 118 (“SAB 118”) on December 23, 2017. SAB 118 provides a one-year measurement period from a registrant’s reporting period that includes the U.S. Tax Act’s enactment date to allow the registrant sufficient time to obtain, prepare and analyze information to complete the accounting required under ASC 740.
The ultimate impact of the U.S. Tax Act on our reported results in fiscal 2018 and beyond may differ from the estimates provided herein, possibly materially, due to, among other things, changes in interpretations and assumptions we have made, guidance that may be issued, and other actions we may take as a result of the U.S. Tax Act different from that presently contemplated.
Diluted earnings per share was $3.72 in 2017. Diluted earnings per share for 2018 are projected to range from $6.89 to $7.14. Excluding the per share impact of special charges of $0.12 and transaction and integration expenses related to the RB Foods acquisition (including the effect of the amortization of the acquisition-date fair value adjustments of inventories included in cost of goods sold, the bridge commitment fee included in other debt costs, and other transaction and integration expenses) of $0.42 in 2017, adjusted diluted earnings per share was $4.26 in 2017. Adjusted diluted earnings per share (excluding an estimated $2.33 to $2.48 per share non-recurring benefit from U.S. Tax Act changes, an estimated $0.11 per share impact from special charges and an estimated $0.13 per share impact from integration expenses related to the RB Foods acquisition) are projected to be $4.80 to $4.90 in 2018. We expect adjusted diluted earnings per share in 2018 to grow 13% to 15%, which includes a 1% favorable impact from currency rates, over adjusted diluted earnings per share of $4.26 in 2017. We expect this growth rate to be mainly driven by increased adjusted operating income and a lower effective tax rate which will more than offset the effects of higher interest expense and higher diluted shares.
RESULTS OF OPERATIONS—2017 COMPARED TO 2016
|
2017
|
2016
|
|||||
|
Net sales
|
$
|
4,834.1
|
|
$
|
4,411.5
|
|
|
Percent growth
|
9.6
|
%
|
2.7
|
%
|
||
|
Components of percent growth in net sales
–
increase (decrease):
|
||||||
|
Volume and product mix
|
1.7
|
%
|
1.7
|
%
|
||
|
Pricing actions
|
2.1
|
%
|
1.5
|
%
|
||
|
Acquisitions
|
6.5
|
%
|
2.3
|
%
|
||
|
Foreign exchange
|
(0.7
|
)%
|
(2.8
|
)%
|
||
Sales for 2017 increased by 9.6% from 2016 and by 10.3% on a constant currency basis (that is, excluding the impact of foreign currency exchange as more fully described under the caption, Non-GAAP Financial Measures). Both the consumer and industrial segments drove higher volume and product mix that added 1.7% to sales. This was driven by product innovation, brand marketing and expanded distribution. Pricing actions, taken in response to increased material costs, added 2.1% to sales. The incremental impact of acquisitions completed in 2017 (both RB Foods and Giotti) and in 2016 (principally, Gourmet Garden) added 6.5% to sales. These factors offset an unfavorable impact from foreign currency exchange that reduced sales by 0.7% compared to 2016 and is excluded from our measure of sales growth of 10.3% on a constant currency basis.
|
2017
|
2016
|
|||||
|
Gross profit
|
$
|
2,010.2
|
|
$
|
1,831.7
|
|
|
Gross profit margin
|
41.6
|
%
|
41.5
|
%
|
||
In 2017, gross profit rose 10 basis points to 41.6% from 41.5% in 2016, as the favorable impact of pricing actions, CCI-led cost savings and more favorable business mix more than offset the unfavorable material cost inflation, including unfavorable foreign currency effects. In addition, our gross profit for 2017 was burdened by $20.9 million of transaction and integration expenses, representing the amortization of the fair value adjustment to the acquired inventories of RB Foods, that depressed our fiscal 2017 gross profit margin of 41.6% by 40 basis points. Excluding those transaction and integration expenses, adjusted gross profit margin rose 50 basis points from 41.5% in 2016 to 42.0% in 2017.
|
|
2017
|
2016
|
||||
|
Selling, general & administrative expense (SG&A)
|
$
|
1,244.8
|
|
$
|
1,175.0
|
|
|
Percent of net sales
|
25.8
|
%
|
26.6
|
%
|
||
Selling, general and administrative expense was $1,244.8 million in 2017 compared to $1,175.0 million in 2016, an increase of $69.8 million. That increase in SG&A expense was driven by the impact of acquisitions, together with increased brand marketing and higher freight costs, partially offset by lower acquisition-related costs related to both completed and uncompleted acquisitions, all as compared to the 2016 levels. The lower acquisition-related costs in the 2017 period were primarily the result of costs associated with our investigation in 2016 of a large potential acquisition in the U.K. that we ultimately declined to pursue. In addition, acquisition-related costs attributable to RB Foods in 2017 are not included in SG&A expense but are instead included in transaction and integration expenses in our income statement (and are further discussed below). SG&A expense as a percentage of net sales was 25.8%, an 80-basis point improvement from 2016. Driving this reduction in SG&A expense as a percentage of net sales, in addition to the items described above were lower employee benefit expense, including lower pension and other postretirement benefit expense, together with benefits from the organization and streamlining actions described in note 3 of the financial statements.
|
|
2017
|
2016
|
||||
|
Special charges included in cost of goods sold
|
$
|
—
|
|
$
|
0.3
|
|
|
Other special charges in the income statement
|
22.2
|
|
15.7
|
|
||
|
Total
|
$
|
22.2
|
|
$
|
16.0
|
|
We regularly evaluate whether to implement changes to our organization structure to reduce fixed costs, simplify or improve processes, and improve our competitiveness, and we expect to continue to evaluate such actions in the future. From time to time, those changes are of such significance in terms of both up-front costs and organizational/ structural impact that we obtain advance approval from our Management Committee and classify expenses related to those changes as special charges in our financial statements. Special charges of $22.2 million were recorded in 2017 and $16.0 million in 2016 to enable us to implement these changes.
During 2017, we recorded $22.2 million of special charges, consisting primarily of $12.7 million related to third party expenses incurred as part of our evaluation of changes relating to our global enablement initiative, $2.8 million related to employee severance benefits and other costs associated with the relocation of one of our Chinese manufacturing facilities, $2.5 million for severance and other exit costs associated with the closure of our manufacturing plant in Portugal, and $1.7 million related to employee severance benefits and other costs associated with actions related to the transfer of certain manufacturing operations to a new facility under construction in Thailand. See note 3 of the financial statements for more details on these charges and our basis for classifying amounts as special charges.
Of the $16.0 million of special charges recorded in 2016, $0.3 million were recorded in cost of goods sold. The 2016 special charges principally consist of $5.7 million related to our EMEA reorganization, which began in 2015, $2.8 million related to our exit from a consolidated joint venture in South Africa, $1.9 million for other exit costs related to the discontinuance of non-profitable product lines of our Kohinoor business in India initiated in 2015, $1.8 million associated with actions in connection with our planned exit of two leased manufacturing facilities in Singapore and Thailand, and $1.7 million for employee severance actions related to our North American effectiveness initiative begun in 2015.
|
2017
|
2016
|
|||||
|
Transaction expenses included in cost of goods sold
|
$
|
20.9
|
|
$
|
—
|
|
|
Transaction expenses included in other debt costs
|
15.4
|
|
—
|
|
||
|
Other transaction and integration expenses
|
40.8
|
|
—
|
|
||
|
Total
|
$
|
77.1
|
|
$
|
—
|
|
Total transaction and integration expenses related to the RB Foods acquisition are anticipated to approximate $100 million, of which approximately $60 million represent transaction expenses and the remainder represent estimated integration expenses. These costs are anticipated to be incurred through 2018 and primarily consist of amortization of the acquisition-date fair value adjustment of inventories of $20.9 million that is included in cost of goods sold; outside advisory, service and consulting costs; employee-related costs; and other costs related to the acquisition, including the costs related to the Bridge financing commitment of $15.4 million that is included in other debt costs. Of the total anticipated transaction and integration expenses, we incurred $77.1 million in 2017 and expect to incur the balance in 2018.
|
2017
|
2016
|
|||||
|
Interest expense
|
$
|
95.7
|
|
$
|
56.0
|
|
|
Other income, net
|
3.5
|
|
4.2
|
|
||
Interest expense for 2017 was sharply higher than the prior year, primarily due to higher average borrowings related to our incurrence of $3.7 billion in debt in August to finance the acquisition of RB Foods (see note 6 of the financial statements). Other income, net, for 2017 was $0.7 million lower than the 2016 level, primarily due to a gain on the 2016 sale of a non-operating asset.
|
2017
|
2016
|
|||||
|
Income from consolidated operations before income taxes
|
$
|
594.8
|
|
$
|
589.2
|
|
|
Income taxes
|
151.3
|
|
153.0
|
|
||
|
Effective tax rate
|
25.4
|
%
|
26.0
|
%
|
||
The effective tax rate decreased 60 basis points to 25.4% in 2017, from 26.0% in 2016, primarily because of an increase in net discrete tax benefits. Net discrete tax benefits increased by $3.1 million, from $21.1 million in 2016 to $24.2 million in 2017. In 2017, discrete items include $10.7 million of excess tax benefits associated with share-based payments to employees due to our adoption of ASU No. 2016-09
Stock Compensation (Topic 718): Improvements to Employee Share-Based Payment Accounting
on a prospective basis as of the beginning of our 2017 fiscal year (see note 1 of the financial statements for further details with respect to our adoption of this accounting standard). Both 2017 and 2016 included discrete tax benefits for the reversal of reserves for unrecognized tax benefits, net of additional taxes provided, for the expiration of statutes of limitation and, in 2017, settlements with taxing authorities in several tax jurisdictions. Discrete tax expense in 2017 included expense associated with the establishment of valuation allowances on non-U.S. deferred tax assets due to a change in our assessment of the recoverability of those deferred tax assets. Discrete tax items in 2016 included benefits associated with the reversal of valuation allowances on non-U.S. deferred tax assets due to a change in our assessment of the recoverability of those deferred tax assets. See note 12 of the financial statements for a reconciliation of the U.S. federal tax rate with the effective tax rate.
As the U.S. Tax Act was enacted after our year end of November 30, 2017, it had no impact on our fiscal 2017 financial results.
|
2017
|
2016
|
|||||
|
Income from unconsolidated operations
|
$
|
33.9
|
|
$
|
36.1
|
|
Income from unconsolidated operations decreased $2.2 million in 2017 from the prior year. This decrease was mainly attributable to the impact of eliminating earnings associated with our minority interests in 2017 as compared to a loss in 2016 and lower earnings from our largest joint venture, McCormick de Mexico, for which the unfavorable impact of foreign exchange rates more than offset the favorable impact, in local currency, of higher sales and net income. We own 50% of most of our unconsolidated joint ventures, including McCormick de Mexico which represented 57% of the sales and 74% of the income of our unconsolidated operations in 2017.
We reported diluted earnings per share of $3.72 in 2017, compared to $3.69 in 2016. The table below outlines the major components of the change in diluted earnings per share from 2016 to 2017. The increase in operating income in the table below includes the impact from unfavorable currency exchange rates in 2017.
|
2016 Earnings per share—diluted
|
$
|
3.69
|
|
|
Increase in operating income
|
0.75
|
|
|
|
Increase in special charges
|
(0.02
|
)
|
|
|
Transaction and integration expenses (including other debt costs) attributable to RB Foods acquisition
|
(0.42
|
)
|
|
|
Increase in interest expense
|
(0.23
|
)
|
|
|
Impact of income taxes
|
(0.02
|
)
|
|
|
Decrease in income from unconsolidated operations
|
(0.02
|
)
|
|
|
Impact of higher shares
|
(0.01
|
)
|
|
|
2017 Earnings per share—diluted
|
$
|
3.72
|
|
We measure the performance of our business segments based on operating income, excluding special charges and, beginning in 2017, excluding transaction and integration expenses related to our RB Foods acquisition. See note 16 of the financial statements for additional information on our segment measures as well as for a reconciliation by segment of operating income, excluding special charges as well as transaction and integration expenses related to our RB Foods acquisition, to consolidated operating income. In the following discussion, we refer to our previously described measure of segment profit as segment operating income.
Consumer Segment
|
2017
|
2016
|
|||||
|
Net sales
|
$
|
2,970.1
|
|
$
|
2,753.2
|
|
|
Percent growth
|
7.9
|
%
|
4.5
|
%
|
||
|
Components of percent growth in net sales
–
increase (decrease):
|
||||||
|
Volume and product mix
|
0.3
|
%
|
1.7
|
%
|
||
|
Pricing actions
|
2.2
|
%
|
1.2
|
%
|
||
|
Acquisitions
|
5.5
|
%
|
3.5
|
%
|
||
|
Foreign exchange
|
(0.1
|
)%
|
(1.9
|
)%
|
||
|
Segment operating income
|
$
|
564.2
|
|
$
|
490.8
|
|
|
Segment operating income margin
|
19.0
|
%
|
17.8
|
%
|
||
Sales of our consumer segment grew by 7.9% as compared to 2016 and grew by 8.0% on a constant currency basis. Higher volume and product mix added 0.3% to sales, and pricing actions, taken in response to increased material costs, added 2.2%. The incremental impact of acquisitions – mainly RB Foods and Gourmet Garden, completed in 2017 and 2016, respectively – added 5.5% to sales. These factors offset an unfavorable impact from foreign currency rates that reduced consumer segment sales by 0.1% compared to 2016 and is excluded from our measure of sales growth of 8.0% on a constant currency basis.
In the Americas, consumer sales rose 11.2% in 2017 as compared to 2016 and rose by 11.1% on a constant currency basis. Higher volume and product mix added 0.5% to sales, pricing actions added 2.8% to sales, and the incremental impact of acquisitions – mainly RB Foods and Gourmet Garden – added 7.8% to sales. The favorable impact of foreign currency increased sales by 0.1% compared to 2016 and is excluded from our measure of sales growth of 11.1% on a constant currency basis.
In the EMEA region, consumer sales declined 1.6% in 2017 as compared to 2016 and declined 2.3% on a constant currency basis. Volume and product mix lowered sales by 3.3%, with weakness in Poland, the U.K. and France. The sales weakness in Poland was driven by competitive conditions, while weakness in the U.K. related to a difficult retail environment, including the effects of a reduction of Schwartz brand products by a large U.K. retailer. Pricing added 0.5% to sales and the incremental impact of the RB Foods and Gourmet Garden acquisitions added 0.5% to sales. The favorable impact of foreign currency increased sales by 0.7% compared to 2016 and is excluded from our measure of sales decline of 2.3% on a constant currency basis.
In the Asia/Pacific region, consumer sales increased 6.4% as compared to 2016 and increased 8.9% on a constant currency basis. Higher volume and product mix added 5.1% to sales, with strong results in China that offset a volume and product mix decline in India in 2017, due in part to India's discontinuation of lower-margin product lines that occurred in 2016. Pricing added 1.7% to sales and the incremental impact of the Gourmet Garden acquisition
added 2.1% to sales. These factors offset an unfavorable impact from foreign currency exchange rates that decreased sales by 2.5% compared to 2016 and is excluded from our measure of sales growth of 8.9% on a constant currency basis.
We grew segment operating income for our consumer segment by $73.4 million, or 15.0%, in 2017 compared to 2016. The favorable impact of greater sales and cost savings more than offset the unfavorable impact of higher material costs and an increase in brand marketing. On a constant currency basis, segment operating income for our consumer segment rose 14.9%. Segment operating income margin for our consumer segment rose by 120 basis points to 19.0% in 2017 from 17.8% in 2016.
Industrial Segment
|
2017
|
2016
|
|||||
|
Net sales
|
$
|
1,864.0
|
|
$
|
1,658.3
|
|
|
Percent growth (decline)
|
12.4
|
%
|
(0.2
|
)%
|
||
|
Components of percent growth in net sales
–
increase (decrease):
|
||||||
|
Volume and product mix
|
4.0
|
%
|
1.5
|
%
|
||
|
Pricing actions
|
2.0
|
%
|
2.0
|
%
|
||
|
Acquisitions
|
8.0
|
%
|
0.4
|
%
|
||
|
Foreign exchange
|
(1.6
|
)%
|
(4.1
|
)%
|
||
|
Segment operating income
|
$
|
222.1
|
|
$
|
166.2
|
|
|
Segment operating income margin
|
11.9
|
%
|
10.0
|
%
|
||
Sales of our industrial segment increased 12.4% as compared to 2016 and increased by 14.0% on a constant currency basis. Higher volume and product mix added 4.0% to sales and pricing actions, taken in response to increased material costs, added 2.0%. The incremental impact on 2017 industrial sales of the RB Foods and Giotti acquisitions completed in 2017 added 8.0% to sales. These factors partially offset an unfavorable impact from foreign currency rates that reduced industrial segment sales by 1.6% compared to 2016 and is excluded from our measure of sales growth of 14.0% on a constant currency basis.
In the Americas, industrial sales rose 10.8% in 2017 as compared to 2016 and rose 11.2% on a constant currency basis. Higher volume and product mix added 3.4% to sales and included growth in sales of branded foodservice products in the U.S. and snack seasonings in the U.S. and Mexico. Pricing actions added 2.1% to sales and the incremental impact of the RB Foods and Gourmet Garden acquisitions added 5.7% to sales. These factors offset an unfavorable impact from foreign currency rates that reduced sales by 0.4% compared to 2016 and is excluded from our measure of sales growth of 11.2% on a constant currency basis.
In the EMEA region, industrial sales increased 20.5% in 2017 as compared to 2016 and increased 26.9% on a constant currency basis. Higher volume and product mix added 2.7% to sales and included growth in sales to leading quick service restaurants in this region. Pricing actions added 3.1% to sales and the incremental impact of the Giotti and, to a lesser extent, RB Foods acquisitions added 21.1% to sales. These factors partially offset an unfavorable impact from foreign currency exchange rates that decreased sales by 6.4% compared to 2016 and is excluded from our measure of sales growth of 26.9% on a constant currency basis.
In the Asia/Pacific region, industrial sales increased 9.0% in 2017 as compared to 2016 and increased 10.1% on a constant currency basis. Higher volume and product mix added 9.6% to sales and included growth in sales to leading quick service restaurants supplied from our facilities in both China and Southeast Asia. Pricing actions added 0.1% to sales and the incremental impact of the Gourmet Garden acquisition added 0.4% to sales. These factors partially offset an unfavorable impact from foreign currency exchange rates that reduced sales by 1.1% compared to 2016 and is excluded from our measure of sales growth of 10.1% on a constant currency basis.
We grew segment operating income for our industrial segment by $55.9 million, or 33.6%, in 2017 compared to 2016. The favorable impact of greater sales and cost savings more than offset the unfavorable impact of higher material costs. On a constant currency basis, segment operating income for our industrial segment rose 37.1%. Segment operating income margin for our industrial segment rose by 190 basis points to 11.9% in 2017 from 10.0% in 2016 and reflected the impact of our efforts to shift our business mix to more value-added products through innovation and acquisitions.
RESULTS OF OPERATIONS—2016 COMPARED TO 2015
|
2016
|
2015
|
|||||
|
Net sales
|
$
|
4,411.5
|
|
$
|
4,296.3
|
|
|
Percent growth
|
2.7
|
%
|
1.3
|
%
|
||
|
Components of percent growth in net sales
–
increase (decrease):
|
||||||
|
Volume and product mix
|
1.7
|
%
|
3.9
|
%
|
||
|
Pricing actions
|
1.5
|
%
|
1.1
|
%
|
||
|
Acquisitions
|
2.3
|
%
|
1.4
|
%
|
||
|
Foreign exchange
|
(2.8
|
)%
|
(5.1
|
)%
|
||
Sales for 2016 increased 2.7% from 2015 and increased by 5.5% on a constant currency basis, with growth in both the consumer and industrial segments that drove higher volume and product mix, and added 1.7% to sales. This was driven by product innovation, brand marketing and expanded distribution. Pricing actions, taken in response to increased material costs, added 1.5% to sales. The incremental impact of acquisitions completed in 2016 – mainly Gourmet Garden – and three acquisitions completed in 2015 – Brand Aromatics, Drogheria & Alimentari (D&A) and Stubb’s – added 2.3% to sales. These factors offset an unfavorable impact from foreign currency exchange that reduced sales by 2.8% compared to 2015 and is excluded from our measure of sales growth of 5.5% on a constant currency basis.
|
2016
|
2015
|
|||||
|
Gross profit
|
$
|
1,831.7
|
|
$
|
1,737.3
|
|
|
Gross profit margin
|
41.5
|
%
|
40.4
|
%
|
||
In 2016, gross profit rose 110 basis points to 41.5% from 40.4% in 2015, as the favorable impact of pricing actions, CCI-led cost savings and more favorable business mix more than offset the unfavorable impact of higher material costs.
|
2016
|
2015
|
|||||
|
Selling, general & administrative expense (SG&A)
|
$
|
1,175.0
|
|
$
|
1,127.4
|
|
|
Percent of net sales
|
26.6
|
%
|
26.2
|
%
|
||
Selling, general and administrative expense was $1,175.0 million in 2016 compared to $1,127.4 million in 2015, an increase of $47.6 million. SG&A as a percentage of net sales was 26.6%, a 40-basis point increase from 2015. Driving this increase in SG&A as a percentage of net sales were higher employee related expenses, an $11.6 million increase in our brand marketing from the 2015 level to $252.2 million in 2016 and a $6.5 million increase in transaction costs, related to both completed and uncompleted acquisitions, from the 2015 level to $13.4 million in 2016. Partially offsetting these increases were cost savings from CCI and from the organization and streamlining actions described in note 3 of the financial statements.
|
2016
|
2015
|
|||||
|
Special charges included in cost of goods sold
|
$
|
0.3
|
|
$
|
4.0
|
|
|
Other special charges in the income statement
|
15.7
|
|
61.5
|
|
||
|
Total
|
$
|
16.0
|
|
$
|
65.5
|
|
Special charges of $16.0 million were recorded in 2016 and $65.5 million in 2015. Of the $16.0 million of special charges recorded in 2016, $0.3 million were recorded in cost of goods sold. The 2016 special charges principally consist of $5.7 million related to our EMEA reorganization, which began in 2015, $2.8 million related to our exit from a consolidated joint venture in South Africa, $1.9 million for other exit costs related to the discontinuance of non-profitable product lines of our Kohinoor business in India initiated in 2015, $1.8 million associated with actions in connection with our planned exit of two leased manufacturing facilities in Singapore and Thailand, and $1.7 million for employee severance actions related to our North American effectiveness initiative begun in 2015. See note 3 of the financial statements for more details on these charges.
In 2015, we recorded special charges of $65.5 million, of which $29.2 million related to employee severance and related costs associated with our North American effectiveness initiative and $24.4 million related to a reorganization of our EMEA business. An additional $14.2 million, including a non-cash brand impairment charge of $9.6 million, related to the discontinuance by our Kohinoor consumer business in India of sales of non-profitable bulk-packaged and broken basmati rice product lines. Partially offsetting these charges was a credit of $2.3 million for the 2015 reversal of reserves previously accrued as part of special charges in 2014 and 2013.
|
2016
|
2015
|
|||||
|
Interest expense
|
$
|
56.0
|
|
$
|
53.3
|
|
|
Other income, net
|
4.2
|
|
1.1
|
|
||
Interest expense for 2016 was higher than the prior year, primarily due to higher average borrowings. Other income, net, for 2016 rose by $3.1 million over the 2015 level, primarily due to higher interest income and lower non-operating foreign currency losses, both as compared to 2015, as well as to a gain on the 2016 sale of a non-operating asset.
|
2016
|
2015
|
|||||
|
Income from consolidated operations before income taxes
|
$
|
589.2
|
|
$
|
496.2
|
|
|
Income taxes
|
153.0
|
|
131.3
|
|
||
|
Effective tax rate
|
26.0
|
%
|
26.5
|
%
|
||
The effective tax rate decreased 50 basis points to 26.0% in 2016, from 26.5% in 2015, primarily as a result of the following factors. Net discrete tax benefits increased by $2.0 million, from $19.1 million in 2015 to $21.1 million in 2016. Both 2016 and 2015 included discrete tax benefits for (i) the reversal of reserves for unrecognized tax benefits, net of additional taxes provided, for the expiration of statutes of limitation in several tax jurisdictions, (ii) the reversal of valuation allowances on non-U.S. deferred tax assets due to a change in our assessment of the recoverability of those deferred tax assets, and (iii) prior year adjustments for the research tax credit related to legislation enacted subsequent to the reporting dates. A portion of the 2015 discrete tax benefit was offset by a discrete tax detriment for the revaluation of deferred tax assets in the U.K. resulting from legislation enacted in 2015 reducing the statutory tax rate for future periods.
|
2016
|
2015
|
|||||
|
Income from unconsolidated operations
|
$
|
36.1
|
|
$
|
36.7
|
|
Income from unconsolidated operations decreased $0.6 million in 2016 from the prior year. This decrease was mainly attributable to our largest joint venture, McCormick de Mexico, for which the unfavorable impact of foreign exchange rates more than offset the favorable impact, in local currency, of higher sales and net income. In 2016, our 50% interest in the McCormick de Mexico joint venture represented 57% of the sales and 83% of the income of our unconsolidated operations. We own 50% of most of our other unconsolidated joint ventures.
We reported diluted earnings per share of $3.69 in 2016, compared to $3.11 in 2015. The table below outlines the major components of the change in diluted earnings per share from 2015 to 2016. The increase in adjusted operating income in the table below includes the impact from unfavorable currency exchange rates in 2016.
|
2015 Earnings per share—diluted
|
$
|
3.11
|
|
|
Impact of decrease in special charges
|
0.28
|
|
|
|
Increase in adjusted operating income
|
0.25
|
|
|
|
Impact of lower shares outstanding
|
0.03
|
|
|
|
Increase other income
|
0.02
|
|
|
|
Impact of change in effective income tax rate, excluding taxes on special charges
|
0.02
|
|
|
|
Higher interest expense
|
(0.02
|
)
|
|
|
2016 Earnings per share—diluted
|
$
|
3.69
|
|
Consumer Segment
|
2016
|
2015
|
|||||
|
Net sales
|
$
|
2,753.2
|
|
$
|
2,635.2
|
|
|
Percent growth
|
4.5
|
%
|
0.4
|
%
|
||
|
Components of percent growth in net sales
–
increase (decrease):
|
||||||
|
Volume and product mix
|
1.7
|
%
|
3.8
|
%
|
||
|
Pricing actions
|
1.2
|
%
|
0.1
|
%
|
||
|
Acquisitions
|
3.5
|
%
|
1.4
|
%
|
||
|
Foreign exchange
|
(1.9
|
)%
|
(4.9
|
)%
|
||
|
Segment operating income
|
$
|
490.8
|
|
$
|
456.1
|
|
|
Segment operating income margin
|
17.8
|
%
|
17.3
|
%
|
||
Sales of our consumer segment grew by 4.5% in 2016 as compared to 2015 and grew by 6.4% on a constant currency basis. Higher volume and product mix added 1.7% to sales, and pricing actions, taken in response to increased material costs, added 1.2%. The incremental impact in 2016 of acquisitions completed in that year – mainly Gourmet Garden – and two acquisitions completed in 2015 – D&A and Stubb’s – added 3.5% to sales. These factors offset an unfavorable impact from foreign currency rates that reduced consumer segment sales by 1.9% compared to 2015 and is excluded from our measure of sales growth of 6.4% on a constant currency basis.
In the Americas, consumer sales rose 5.8% in 2016 as compared to 2015 and rose by 6.3% on a constant currency basis. Higher volume and product mix added 2.2% to sales, led by U.S. sales growth in spices and seasonings and recipe mixes and driven by product innovation, brand marketing, particularly in digital, and working with retailers on in-store product assortment, pricing and promotion. Pricing actions added 1.4% to sales and the incremental impact of acquisitions – mainly Gourmet Garden and Stubb's – added 2.7% to sales. These factors offset an unfavorable impact of foreign currency that reduced sales by 0.5% compared to 2015 and is excluded from our measure of sales growth of 6.3% on a constant currency basis.
In the EMEA region, consumer sales rose 2.4% in 2016 as compared to 2015 and rose 6.9% on a constant currency basis. Volume and product mix lowered sales by 0.4%, with growth in Poland and France offset by weakness in the U.K. The sales growth in Poland and France was driven by product innovation, brand marketing and expanded distribution, while weakness in the U.K. related to a difficult retail environment. Pricing added 1.5% to sales and the incremental impact of acquisitions – mainly D&A – added 5.8% to sales. An unfavorable impact from foreign currency exchange rates reduced sales by 4.5% compared to 2015 and is excluded from our measure of sales growth of 6.9% on a constant currency basis.
In the Asia/Pacific region, consumer sales increased 1.5% as compared to 2015 and increased 6.3% on a constant currency basis. Higher volume and product mix added 2.2% to sales, with strong results in both China and Australia. Volume and product mix in India declined in 2016 compared to 2015, due in part to the discontinuation of lower-margin bulk-packaged and broken rice product lines. Pricing added 0.3% to sales and the incremental impact of the Gourmet Garden acquisition added 3.8% to sales. These factors offset an unfavorable impact from foreign currency exchange rates that decreased sales by 4.8% compared to 2015 and is excluded from our measure of sales growth of 6.3% on a constant currency basis.
We grew segment operating income for our consumer segment by $34.7 million, or 7.6%, in 2016 compared to 2015. The favorable impact of sales growth and cost savings more than offset the unfavorable impact of higher material costs and an increase in brand marketing. On a constant currency basis, segment operating income for our consumer segment rose 8.7%. Segment operating income margin for the consumer segment rose 50 basis points to 17.8% in 2016 from 17.3% in 2015.
Industrial Segment
|
2016
|
2015
|
|||||
|
Net sales
|
$
|
1,658.3
|
|
$
|
1,661.1
|
|
|
Percent (decline) growth
|
(0.2
|
)%
|
2.7
|
%
|
||
|
Components of percent change in net sales
–
increase (decrease):
|
||||||
|
Volume and product mix
|
1.5
|
%
|
4.3
|
%
|
||
|
Pricing actions
|
2.0
|
%
|
2.6
|
%
|
||
|
Acquisitions
|
0.4
|
%
|
1.3
|
%
|
||
|
Foreign exchange
|
(4.1
|
)%
|
(5.5
|
)%
|
||
|
Segment operating income
|
$
|
166.2
|
|
$
|
157.8
|
|
|
Segment operating income margin
|
10.0
|
%
|
9.5
|
%
|
||
Sales of our industrial segment declined 0.2% in 2016 as compared to 2015 but increased by 3.9% on a constant currency basis. Higher volume and product mix added 1.5% to sales and pricing actions, taken in response to increased material costs, added 2.0%. The incremental impact on 2016 industrial sales of the Brand Aromatics acquisition completed in 2015 added 0.4% to sales. These factors partially offset an unfavorable impact from foreign currency rates that reduced industrial segment sales by 4.1% compared to 2015 and is excluded from our measure of sales growth of 3.9% on a constant currency basis.
In the Americas, industrial sales rose 1.7% in 2016 as compared to 2015 and rose 3.7% on a constant currency basis. Higher volume and product mix added 1.4% to sales and included growth in sales of branded foodservice products in the U.S. and snack seasonings in the U.S. and Mexico. Pricing actions added 1.7% to sales and the incremental impact of the Brand Aromatics acquisition added 0.6% to sales. These factors offset an unfavorable impact from foreign currency rates that reduced sales by 2.0% compared to 2015 and is excluded from our measure of sales growth of 3.7% on a constant currency basis.
In the EMEA region, industrial sales declined 6.4% in 2016 as compared to 2015, but increased 4.8% on a constant currency basis. Higher volume and product mix added 1.1% to sales and included growth in sales to leading quick service restaurants in this region. Pricing actions added 3.7% to sales. These factors partially offset an unfavorable impact from foreign currency exchange rates that decreased sales by 11.2% compared to 2015 and is excluded from our measure of sales growth of 4.8% on a constant currency basis.
In the Asia/Pacific region, industrial sales declined 0.1% in 2016 as compared to 2015, but increased by 3.8% on a constant currency basis. Higher volume and product mix added 3.0% to sales and included growth in sales to leading quick service restaurants supplied from our facilities in both Australia and Southeast Asia that offset weakness in China that resulted, in large part, from a decision by a large customer to add a secondary supply source. Pricing actions added 0.8% to sales. These factors partially offset an unfavorable impact from foreign currency exchange rates that reduced sales by 3.9% compared to 2015 and is excluded from our measure of sales growth of 3.8% on a constant currency basis.
We grew segment operating income for our industrial segment by $8.4 million, or 5.3%, in 2016 compared to 2015. The favorable impact of sales growth and cost savings more than offset the unfavorable impact of higher material costs. On a constant currency basis, segment operating income for our industrial segment rose 11.6%. Segment operating income margin for the industrial segment rose by 50 basis points to 10.0% in 2016 from 9.5% in 2015 and included the impact of our efforts to shift our business mix to more value-added products through innovation and acquisitions.
NON-GAAP FINANCIAL MEASURES
The following tables include financial measures of adjusted gross profit, adjusted gross profit margin, adjusted operating income, adjusted operating income margin, adjusted income from unconsolidated operations, adjusted net income and adjusted diluted earnings per share. These financial measures also exclude, for 2018, and the comparison of our expected results for 2018 to 2017, the net estimated impact of the effects of the deemed repatriation tax and remeasurement of our U.S. deferred tax assets and liabilities as a result of the recent U.S. tax legislation as these items will significantly impact comparability between years. These represent non-GAAP financial measures which are prepared as a complement to our financial results prepared in accordance with United
States generally accepted accounting principles. These financial measures exclude the impact, as applicable, of the following:
|
•
|
Special charges – Special charges consist of expenses associated with certain actions undertaken by the company to reduce fixed costs, simplify or improve processes, and improve our competitiveness and are of such significance in terms of both up-front costs and organizational/structural impact to require advance approval by our Management Committee, comprised of our Chairman, President and Chief Executive Officer; Executive Vice President and Chief Financial Officer; President, Global Industrial Segment and McCormick International; President, Global Consumer Segment and Americas; Senior Vice President, Human Relations; and Senior Vice President, Strategy and Global Enablement. Upon presentation of any such proposed action (including details with respect to estimated costs, which generally consist principally of employee severance and related benefits, together with ancillary costs associated with the action that may include a non-cash component or a component which relates to inventory adjustments that are included in cost of goods sold; impacted employees or operations; expected timing; and expected savings) to the Management Committee and the Committee’s advance approval, expenses associated with the approved action are classified as special charges upon recognition and monitored on an ongoing basis through completion.
|
|
•
|
Transaction and integration expenses associated with the RB Foods acquisition – Beginning in 2017, we revised our non-GAAP measures to exclude certain costs associated with our acquisition of RB Foods in August of 2017 and its subsequent integration into the company. We made this change because of the significance of the RB Foods acquisition and, therefore, the impact on the comparability of our results of the costs associated with the acquisition and subsequent integration. Such costs, which we refer to as “transaction and integration expenses” include the impact of the acquisition-date fair value adjustment for inventory, transaction costs associated with the acquisition, integration costs following the acquisition, and the bridge financing costs. In our income statement, we include the impact of the fair value adjustment for inventory in cost of goods sold, the bridge financing cost in other debt costs, and present all other transaction and integration costs associated with the RB Foods acquisition in our income statement on the line, "Transaction and integration expenses (related to RB Foods acquisition)." The size of this acquisition and related costs distinguishes it from our past, recent and smaller acquisitions, the costs of which have not been excluded from our non-GAAP financial measures.
|
Details with respect to the composition of special charges, as well as transaction and integration expenses (including other debt costs) recorded for the periods and in the amounts set forth below are included in notes 2 and 3, respectively, of the financial statements.
We believe that these non-GAAP financial measures are important. The exclusion of the items noted above provides additional information that enables enhanced comparisons to prior periods and, accordingly, facilitates the development of future projections and earnings growth prospects. This information is also used by management to measure the profitability of our ongoing operations and analyze our business performance and trends.
These non-GAAP financial measures may be considered in addition to results prepared in accordance with GAAP, but they should not be considered a substitute for, or superior to, GAAP results. In addition, these non-GAAP financial measures may not be comparable to similarly titled measures of other companies because other companies may not calculate them in the same manner that we do. We intend to continue to provide these non-GAAP financial measures as part of our future earnings discussions and, therefore, the inclusion of these non-GAAP financial measures will provide consistency in our financial reporting.
A reconciliation of these non-GAAP measures to GAAP financial results is provided below (in millions, except per share data):
|
2017
|
2016
|
2015
|
|||||||
|
Gross profit
|
$
|
2,010.2
|
|
$
|
1,831.7
|
|
$
|
1,737.3
|
|
|
Impact of special charges, transaction and integration expenses included in cost of goods sold
(1)
|
20.9
|
|
0.3
|
|
4.0
|
|
|||
|
Adjusted gross profit
|
$
|
2,031.1
|
|
$
|
1,832.0
|
|
$
|
1,741.3
|
|
|
Adjusted gross profit margin
(2)
|
42.0
|
%
|
41.5
|
%
|
40.5
|
%
|
|||
|
Operating income
|
$
|
702.4
|
|
$
|
641.0
|
|
$
|
548.4
|
|
|
Impact of special charges, transaction and integration expenses included in cost of goods sold
(1)
|
20.9
|
|
0.3
|
|
4.0
|
|
|||
|
Impact of other transaction and integration expenses
(1)
|
40.8
|
|
—
|
|
—
|
|
|||
|
Impact of other special charges
(3)
|
22.2
|
|
15.7
|
|
61.5
|
|
|||
|
Adjusted operating income
|
$
|
786.3
|
|
$
|
657.0
|
|
$
|
613.9
|
|
|
% increase versus prior year
|
19.7
|
%
|
7.0
|
%
|
0.9
|
%
|
|||
|
Adjusted operating income margin
(2)
|
16.3
|
%
|
14.9
|
%
|
14.3
|
%
|
|||
|
Income from unconsolidated operations
|
$
|
33.9
|
|
$
|
36.1
|
|
$
|
36.7
|
|
|
Impact of special charges attributable to non-controlling interests
(4)
|
—
|
|
(1.9
|
)
|
(2.0
|
)
|
|||
|
Adjusted income from unconsolidated operations
|
$
|
33.9
|
|
$
|
34.2
|
|
$
|
34.7
|
|
|
% (decrease) increase versus prior year
|
(0.9
|
)%
|
(1.4
|
)%
|
18.0
|
%
|
|||
|
Net income
|
$
|
477.4
|
|
$
|
472.3
|
|
$
|
401.6
|
|
|
Impact of total transaction and integration expenses
(1)
|
53.5
|
|
—
|
|
—
|
|
|||
|
Impact of total special charges
(3)
|
15.8
|
|
13.0
|
|
49.9
|
|
|||
|
Impact of special charges attributable to non-controlling interests
(4)
|
—
|
|
(1.9
|
)
|
(2.0
|
)
|
|||
|
Adjusted net income
|
$
|
546.7
|
|
$
|
483.4
|
|
$
|
449.5
|
|
|
% increase versus prior year
|
13.1
|
%
|
7.5
|
%
|
1.8
|
%
|
|||
|
Earnings per share—diluted
|
$
|
3.72
|
|
$
|
3.69
|
|
$
|
3.11
|
|
|
Impact of total transactions and integration expenses
(1)
|
0.42
|
|
—
|
|
—
|
|
|||
|
Impact of total special charges
(3)
|
0.12
|
|
0.10
|
|
0.38
|
|
|||
|
Impact of special charges attributable to non-controlling interests
(4)
|
—
|
|
(0.01
|
)
|
(0.01
|
)
|
|||
|
Adjusted earnings per share—diluted
|
$
|
4.26
|
|
$
|
3.78
|
|
$
|
3.48
|
|
|
% increase versus prior year
|
12.7
|
%
|
8.6
|
%
|
3.3
|
%
|
|||
|
(1)
|
As more fully described in note 2 of the financial statements, transaction and integration expenses related to the acquisition of RB Foods are recorded in our consolidated income statement as follows for the year ended November 30, 2017 (in millions, except per share amounts):
|
|||
|
Transaction and integration expenses included in cost of goods sold
|
$
|
20.9
|
|
|
|
Reflected in transaction and integration expenses
|
40.8
|
|
||
|
Transaction and integration expenses included in operating income
|
61.7
|
|
||
|
Transaction and integration expenses included in other debt costs
|
15.4
|
|
||
|
Total pre-tax transaction and integration expenses
|
77.1
|
|
||
|
Less: Tax effect
|
(23.6
|
)
|
||
|
Total after-tax transaction and integration expenses
|
$
|
53.5
|
|
|
|
(2)
|
Adjusted gross profit margin is calculated as adjusted gross profit as a percentage of net sales for each period presented. Adjusted operating income margin is calculated as adjusted operating income as a percentage of net sales for each period presented.
|
|||
|
(3)
|
Total special charges of $22.2 million for 2017, $16.0 million for 2016 and $65.5 million for 2015 are net of taxes of $6.4 million, $3.0 million and $15.6 million, respectively.
|
|||
|
(4)
|
In 2016, represents the portion of the total special charge of $2.8 million, net of tax of $0.9 million, associated with our exit of a consolidated joint venture in South Africa, attributable to our former joint venture partner. In 2015, represents the portion of the Kohinoor total special charge of $14.2 million attributable to Kohinoor's 15% minority stakeholder.
|
|||
|
Estimate for the year ending November 30, 2017
|
||
|
Earnings per share – diluted
|
$6.89 to $7.14
|
|
|
Impact of special charges and transaction and integration expenses
|
0.24
|
|
|
Estimated non-recurring benefit, net of the U.S. Tax Act
|
(2.33) to (2.48)
|
|
|
Adjusted earnings per share – diluted
|
$4.80 to $4.90
|
|
Because we are a multi-national company, we are subject to variability of our reported U.S. dollar results due to changes in foreign currency exchange rates. Those changes have been volatile over the past several years. The exclusion of the effects of foreign currency exchange, or what we refer to as amounts expressed “on a constant currency basis,” is a non-GAAP measure. We believe that this non-GAAP measure provides additional information that enables enhanced comparison to prior periods excluding the translation effects of changes in rates of foreign currency exchange and provides additional insight into the underlying performance of our operations located outside of the U.S. It should be noted that our presentation herein of amounts and percentage changes on a constant currency basis does not exclude the impact of foreign currency transaction gains and losses (that is, the impact of transactions denominated in other than the local currency of any of our subsidiaries in their local currency reported results).
Percentage changes in sales and adjusted operating income expressed on a constant currency basis are presented excluding the impact of foreign currency exchange. To present this information for historical periods, current year results for entities reporting in currencies other than the U.S. dollar are translated into U.S. dollars at the average exchange rates in effect during the prior fiscal year, rather than at the actual average exchange rates in effect during the current fiscal year. As a result, the foreign currency impact is equal to the current year results in local currencies multiplied by the change in the average foreign currency exchange rate between the current year and the prior fiscal year. The tables set forth below present our growth in net sales and adjusted operating income on a constant currency basis as follows: (1) to present our growth in net sales and adjusted operating income for 2017 on a constant currency basis, net sales and adjusted operating income for 2017 for entities reporting in currencies other than the U.S. dollar have been translated using the average foreign exchange rates in effect for 2016 and compared to the reported results for 2016; and (2) to present our growth in net sales and adjusted operating income for 2016 on a constant currency basis, net sales and operating income for 2016 for entities reporting in currencies other than the U.S. dollar have been translated using the average foreign exchange rates in effect for 2015 and compared to the reported results for 2015.
|
For the year ended November 30, 2017
|
||||||
|
Percentage change as reported
|
Impact of foreign currency exchange
|
Percentage change on constant currency basis
|
||||
|
Net sales:
|
||||||
|
Consumer segment:
|
||||||
|
Americas
|
11.2
|
%
|
0.1
|
%
|
11.1
|
%
|
|
EMEA
|
(1.6
|
)%
|
0.7
|
%
|
(2.3
|
)%
|
|
Asia/Pacific
|
6.4
|
%
|
(2.5
|
)%
|
8.9
|
%
|
|
Total Consumer
|
7.9
|
%
|
(0.1
|
)%
|
8.0
|
%
|
|
Industrial segment:
|
||||||
|
Americas
|
10.8
|
%
|
(0.4
|
)%
|
11.2
|
%
|
|
EMEA
|
20.5
|
%
|
(6.4
|
)%
|
26.9
|
%
|
|
Asia/Pacific
|
9.0
|
%
|
(1.1
|
)%
|
10.1
|
%
|
|
Total Industrial
|
12.4
|
%
|
(1.6
|
)%
|
14.0
|
%
|
|
Total net sales
|
9.6
|
%
|
(0.7
|
)%
|
10.3
|
%
|
|
Adjusted operating income:
|
||||||
|
Consumer segment
|
15.0
|
%
|
0.1
|
%
|
14.9
|
%
|
|
Industrial segment
|
33.6
|
%
|
(3.5
|
)%
|
37.1
|
%
|
|
Total adjusted operating income
|
19.7
|
%
|
(0.8
|
)%
|
20.5
|
%
|
|
For the year ended November 30, 2016
|
||||||
|
Percentage change as reported
|
Impact of foreign currency exchange
|
Percentage change on constant currency basis
|
||||
|
Net sales:
|
||||||
|
Consumer segment:
|
||||||
|
Americas
|
5.8
|
%
|
(0.5
|
)%
|
6.3
|
%
|
|
EMEA
|
2.4
|
%
|
(4.5
|
)%
|
6.9
|
%
|
|
Asia/Pacific
|
1.5
|
%
|
(4.8
|
)%
|
6.3
|
%
|
|
Total Consumer
|
4.5
|
%
|
(1.9
|
)%
|
6.4
|
%
|
|
Industrial segment:
|
||||||
|
Americas
|
1.7
|
%
|
(2.0
|
)%
|
3.7
|
%
|
|
EMEA
|
(6.4
|
)%
|
(11.2
|
)%
|
4.8
|
%
|
|
Asia/Pacific
|
(0.1
|
)%
|
(3.9
|
)%
|
3.8
|
%
|
|
Total Industrial
|
(0.2
|
)%
|
(4.1
|
)%
|
3.9
|
%
|
|
Total net sales
|
2.7
|
%
|
(2.8
|
)%
|
5.5
|
%
|
|
Adjusted operating income:
|
||||||
|
Consumer segment
|
7.6
|
%
|
(1.1
|
)%
|
8.7
|
%
|
|
Industrial segment
|
5.3
|
%
|
(6.3
|
)%
|
11.6
|
%
|
|
Total adjusted operating income
|
7.0
|
%
|
(2.4
|
)%
|
9.4
|
%
|
To present information for the fiscal year 2018 projection on a constant currency basis, projected sales for entities reporting in currencies other than the U.S. dollar are translated into U.S. dollars at the company's budgeted exchange rates for 2018 and are compared to the 2017 results, translated into U.S. dollars using the same 2018 budgeted exchange rates, rather than at the average actual exchange rates in effect during fiscal year 2017.
|
Estimate for the year ending November 30, 2018
|
||
|
Percentage change in net sales
|
12% to 14%
|
|
|
Impact of favorable foreign currency exchange rates
|
(1)%
|
|
|
Percentage change in net sales on a constant currency basis
|
11% to 13%
|
|
In addition to the above non-GAAP financial measures, we use a leverage ratio which is determined using non-GAAP measures. A leverage ratio is a widely-used measure of ability to repay outstanding debt obligations and is a meaningful metric to investors in evaluating financial leverage. We believe that our leverage ratio is a meaningful metric to investors in evaluating our financial leverage and may be different than the method used by other companies to calculate such a leverage ratio. We determine our leverage ratio as net debt (which we define as total debt, net of cash in excess of $75.0 million) to adjusted earnings before interest, tax, depreciation and amortization (Adjusted EBITDA). We define Adjusted EBITDA as net income plus expenses for interest, income taxes, depreciation and amortization, less interest income and as further adjusted for cash and non-cash acquisition-related transaction and integration expenses (which may include the effect of the fair value adjustment of acquired inventory on cost of goods sold), special charges and stock-based compensation expenses. Adjusted EBITDA and our leverage ratio are both non-GAAP financial measures. Our determination of the leverage ratio is consistent with the terms of our $1.0 billion revolving credit facility and our term loans which require us to maintain our leverage ratio below certain levels. Under those agreements, the applicable leverage ratio is reduced annually commencing on November 30, 2018. As of November 30, 2017, our capacity under the revolving credit facility is not affected by these covenants. We do not expect that these covenants would limit our access to our revolving credit facility for the foreseeable future; however, the leverage ratio could restrict our ability to utilize this facility. We expect to comply with this financial covenant for the foreseeable future.
The following table reconciles our net income to Adjusted EBITDA for the years ended November 30, 2017, 2016 and 2015:
|
2017
|
2016
|
2015
|
|||||||
|
Net income
|
$
|
477.4
|
|
$
|
472.3
|
|
$
|
401.6
|
|
|
Depreciation and amortization
|
125.2
|
|
108.7
|
|
105.9
|
|
|||
|
Interest expense
|
95.7
|
|
56.0
|
|
53.3
|
|
|||
|
Income tax expense
|
151.3
|
|
153.0
|
|
131.3
|
|
|||
|
EBITDA
|
849.6
|
|
790.0
|
|
692.1
|
|
|||
|
Adjustments to EBITDA
(1), (2)
|
117.4
|
|
36.1
|
|
77.8
|
|
|||
|
Adjusted EBITDA
|
$
|
967.0
|
|
$
|
826.1
|
|
$
|
769.9
|
|
|
Net debt
(3)
|
$
|
4,915.3
|
|
$
|
1,403.8
|
|
$
|
1,356.8
|
|
|
Leverage ratio (Net debt/Adjusted EBITDA)
|
5.1
|
|
1.7
|
|
1.8
|
|
|||
|
(1)
|
Adjustments to EBITDA are determined under the leverage ratio covenant in our $1.0 billion revolving credit facility and term loan agreements and includes special charges, stock-based compensation expense and, for the trailing twelve-month period ended November 30, 2017, transaction and integration expenses (related to RB Foods acquisition), including other debt costs.
|
|
|
(2)
|
The leverage ratio covenant in our $1.0 billion revolving credit facility and the term loan agreements provide that Adjusted EBITDA also includes the pro forma impact of acquisitions. As of November 30, 2017, our leverage ratio under the terms of those agreements is 4.5.
|
|
|
(3)
|
The leverage ratio covenant in our $1.0 billion revolving credit facility and the term loan agreements define net debt as the sum of short-term borrowings, current portion of long-term debt, and long-term debt, less the amount of cash and cash equivalents that exceeds $75.0 million.
|
|
Our long-term target for our leverage ratio is 1.5 to 1.8. Our leverage ratio can be temporarily impacted by our acquisition activity.
LIQUIDITY AND FINANCIAL CONDITION
|
2017
|
2016
|
2015
|
|||||||
|
Net cash provided by operating activities
|
$
|
815.3
|
|
$
|
658.1
|
|
$
|
590.0
|
|
|
Net cash used in investing activities
|
(4,508.3
|
)
|
(267.1
|
)
|
(338.9
|
)
|
|||
|
Net cash provided by (used in) financing activities
|
3,756.0
|
|
(371.5
|
)
|
(199.6
|
)
|
|||
We generate strong cash flow from operations which enables us to fund operating projects and investments that are designed to meet our growth objectives, service our debt, increase our dividend, fund capital projects and make share repurchases when appropriate. Due to the cyclical nature of a portion of our business, we generate much of our cash flow in the fourth quarter of the fiscal year.
In the cash flow statement, the changes in operating assets and liabilities are presented excluding the effects of changes in foreign currency exchange rates, as these do not reflect actual cash flows. Accordingly, the amounts in the cash flow statement do not agree with changes in the operating assets and liabilities that are presented in the balance sheet.
The reported values of our assets and liabilities held in our non-U.S. subsidiaries and affiliates can be significantly affected by fluctuations in foreign exchange rates between periods. At November 30, 2017, the exchange rates for the Euro, the British pound sterling, Canadian dollar, Australian dollar, Polish zloty and Chinese renminbi were higher versus the U.S. dollar than at November 30, 2016.
Operating Cash Flow
–
Operating cash flow was $815.3 million in 2017, $658.1 million in 2016 and $590.0 million in 2015. The improvement in cash flow from operations in 2017 compared to 2016 is primarily attributable to improvements in cash flow generated from inventories and accounts payable and a higher level of non-cash items that impacted net income, which was partially offset by the timing of employee benefit payments. The improvement in cash flow from operations in 2016 compared to 2015 is predominantly due to higher net income, resulting principally from higher sales and gross profit, a decrease in cash payments related to special charges and the impact of higher income tax and employee benefit accruals.
Our working capital management
–
principally related to inventory, trade accounts receivable, and accounts payable
–
impacts our operating cash flow. The change in inventory had a significant impact on the variability in cash flow from operations. It was a significant source of cash in 2017, a significant use of cash in 2016 and a less significant use of cash in 2015, when compared to 2016. The change in trade accounts receivable has varied in the last three years, as it was a use of cash in 2017 and 2016 and a source of cash in 2015. The change in accounts payable was a significant source of cash in all three years, but more so in 2017 compared to 2016 and 2015. Dividends received from unconsolidated affiliates, which were lower in 2017 as compared to 2016 and higher in 2016 as compared to 2015, also impacted our cash flow from operations.
In addition to operating cash flow, we also use cash conversion cycle (CCC) to measure our working capital management. This metric is different than operating cash flow in that it uses average balances instead of specific point in time measures. CCC is a calculation of the number of days, on average, that it takes us to convert a cash outlay for resources, such as raw materials, to a cash inflow from collection of accounts receivable. Our goal is to lower our CCC over time. We calculate CCC as follows:
Days sales outstanding (average trade accounts receivable divided by average daily net sales) plus days in inventory (average inventory divided by average daily cost of goods sold) less days payable outstanding (average trade accounts payable divided by average daily cost of goods sold plus the average daily change in inventory).
The following table outlines our cash conversion cycle (in days) over the last three years:
|
2017
|
2016
|
2015
|
||||
|
Cash Conversion Cycle
|
76.6
|
|
88.5
|
|
90.2
|
|
The decrease in CCC in 2017 from 2016 is due to an increase in our days payable outstanding as a result of extending our payment terms to suppliers and, to a lesser extent, a decrease in our days in inventory. The decrease in CCC in 2016 from 2015 is mainly due to an increase in our days payable outstanding as a result of extending our payment terms to suppliers.
Investing Cash Flow
–
Net cash used in investing activities was $4,508.3 million in 2017, $267.1 million in 2016 and $338.9 million in 2015. The variability between years is principally a result of cash usage related to our acquisitions of businesses, which amounted to $4,327.4 million in 2017, $120.6 million in 2016 and $210.9 million in 2015. See note 2 of the financial statements for further details related to these acquisitions. Capital expenditures were $182.4 million in 2017, $153.8 million in 2016 and $128.4 million in 2015. We expect 2018 capital expenditures to approximate $200 million to support our planned growth.
Financing Cash Flow
–
Net cash provided by financing activities was $3,756.0 million in 2017, as compared to a cash usage of $371.5 million in 2016 and $199.6 million in 2015. The variability between years is principally a result of changes in our net borrowings, share repurchase activity and dividends, both as described below. In 2017, 2016 and 2015, our net borrowing activity provided cash of $3,574.6 million, $55.7 million and $118.0 million, respectively. In 2017, we issued $4,000.0 million of long-term debt, including $2,500.0 million of notes and $1,500.0 million of term loans (see note 6 of the financial statements for additional information with respect to this long-term debt). The net proceeds from the issuance of this long-term debt were $3,977.6 million. We also paid $7.7 million of costs associated with the issuance of debt and our $1.0 billion revolving credit facility. In 2017, we repaid $272.7 million of long-term debt, including $268.8 million of our $1,500.0 million term loans issued in August 2017.
In 2016, net proceeds from short-term borrowings of $251.7 million were used to pay off $200 million of 5.20% notes that matured in December 2015 and for general corporate purposes. In 2015, we received net cash proceeds of $246.5 million from our issuance of $250.0 million of 3.25% notes due 2025. The net proceeds from this offering were used to pay down short-term borrowings and for general corporate purposes in 2015.
In 2017 and 2015, we repaid $134.6 million and $127.4 million, respectively, of short-term borrowings.
The following table outlines the activity in our share repurchase programs:
|
2017
|
2016
|
2015
|
|||||||
|
Number of shares of common stock
|
1.4
|
|
2.6
|
|
1.9
|
|
|||
|
Dollar amount
|
$
|
137.8
|
|
$
|
242.7
|
|
$
|
145.8
|
|
As of November 30, 2017, $189 million remained of a $600 million share repurchase program that was authorized by our Board of Directors in March 2015. The timing and amount of any shares repurchased is determined by our management based on its evaluation of market conditions and other factors. In connection with our August 2017 acquisition of RB Foods, we announced our intention to reduce our leverage ratio by curtailing the repurchases of shares under our share repurchase program.
During 2017, we issued approximately 6.35 million shares of our Common Stock Non-Voting to fund our acquisition of RB Foods (see notes 2 and 13 of the financial statements), which included approximately 0.8 million shares from the exercise of the underwriters' option to purchase additional shares. The net proceeds from this issuance, after the underwriting discount and related expenses, was $554.0 million. In addition, we also issued $29.5 million of common stock related to our stock compensation plans in 2017. All of the common stock issued in 2016 and 2015 relates to our stock compensation plans, including the effects of the related excess tax benefits.
Our dividend history over the past three years is as follows:
|
2017
|
2016
|
2015
|
|||||||
|
Total dividends paid
|
$
|
237.6
|
|
$
|
217.8
|
|
$
|
204.9
|
|
|
Dividends paid per share
|
1.88
|
|
1.72
|
|
1.60
|
|
|||
|
Percentage increase per share
|
9.3
|
%
|
7.5
|
%
|
8.1
|
%
|
|||
In November 2017, the Board of Directors approved a 10.6% increase in the quarterly dividend from $0.47 to $0.52 per share.
The following table presents our leverage ratios for the trailing twelve month periods ended November 30, 2017, 2016 and 2015:
|
2017
|
2016
|
2015
|
||||
|
Leverage ratio
|
5.1
|
|
1.7
|
|
1.8
|
|
Our leverage ratio was 5.1 as of November 30, 2017, as compared to the ratios of 1.7 and 1.8 as of November 30, 2016 and 2015, respectively. The increase in the ratio from 1.7 as of November 30, 2016 to 5.1 as of November 30, 2017 is principally due to an increase in total debt associated with the funding, net of cash flow from operations for 2017, of our acquisitions of RB Foods and Giotti, repurchases of common stock and payment of dividends.
The leverage ratio covenant in our $1.0 billion revolving credit facility and the term loan agreements, both outstanding at November 30, 2017, provide that Adjusted EBITDA under that covenant also include the pro forma impact of acquisitions. As of November 30, 2017, our leverage ratio under the terms of those agreements is 4.5.
Most of our cash is in our foreign subsidiaries. We manage our worldwide cash requirements by considering available funds among the many subsidiaries through which we conduct our business and the cost effectiveness with which those funds can be accessed. Prior to the enactment of the U.S. Tax Act on December 22, 2017, the permanent repatriation of cash balances from certain of our subsidiaries could have had adverse tax consequences; however, those balances are generally available without legal restrictions to fund ordinary business operations, capital projects and future acquisitions. At November 30, 2017, we temporarily used $43.4 million of cash from our foreign subsidiaries to pay down short-term debt in the U.S. The average short-term borrowings outstanding for the years ended November 30, 2017 and 2016 were $630.6 million and $603.8 million, respectively. The total average debt outstanding for the years ended November 30, 2017 and 2016 was $2,996.6 million and $1,658.8 million, respectively.
See notes 6 and 7 of the financial statements for further details of these transactions.
Credit and Capital Markets
– The following summarizes the more significant impacts of credit and capital markets on our business:
CREDIT FACILITIES
– Cash flows from operating activities are our primary source of liquidity for funding growth, share repurchases, dividends and capital expenditures. We also rely on our revolving credit facility, or borrowings backed by this facility, to fund seasonal working capital needs and other general corporate requirements.
In August 2017, we entered into a five-year $1.0 billion revolving credit facility, which will expire in August 2022. The current pricing for the credit facility, on a fully drawn basis, is LIBOR plus 1.25%. The pricing of the credit facility is based on a credit rating grid that contains a fully drawn maximum pricing of the credit facility equal to LIBOR plus 1.75%. This facility replaces our prior facilities: (i) a five-year $750 million revolving credit facility that was due to expire in June 2020 and (ii) a 364-day $250 million revolving facility, which we entered into in the second quarter of 2017 and that was due to expire in March 2018. We generally use this facility to support our issuance of commercial paper. If the commercial paper market is not available or viable, we could borrow directly under our revolving credit facility. The facility is made available by a syndicate of banks, with various commitments per bank. If any of the banks in this syndicate are unable to perform on their commitments, our liquidity could be impacted, which could reduce our ability to grow through funding of seasonal working capital. In addition to our committed revolving credit facility, we have uncommitted credit facilities for $233.1 million as of November 30, 2017 that will expire in 2018. We engage in regular communication with all banks participating in our credit facilities. During these communications, none of the banks have indicated that they may be unable to perform on their commitments. In addition, we periodically review our banking and financing relationships, considering the stability of the institutions and other aspects of the relationships. Based on these communications and our monitoring activities, we believe our banks will perform on their commitments. See note 6 of the financial statements for more details on our financing arrangements. We believe that our internally generated funds and the existing sources of liquidity under our credit facilities are sufficient to fund ongoing operations.
PENSION ASSETS AND OTHER INVESTMENTS
– We hold investments in equity and debt securities in both our qualified defined benefit pension plans and through a rabbi trust for our nonqualified defined benefit pension plan. Cash payments to pension plans, including unfunded plans, were $18.7 million in 2017, $25.1 million in 2016 and $15.7 million in 2015. It is expected that the 2018 total pension plan contributions will be approximately $5 million primarily for international plans. Future increases or decreases in pension liabilities and required cash contributions are highly dependent on changes in interest rates and the actual return on plan assets. We base our investment of plan assets, in part, on the duration of each plan’s liabilities. Across all of our qualified defined benefit pension plans, approximately 64% of assets are invested in equities, 26% in fixed income investments and 10% in other investments. Assets in the rabbi trust are primarily invested in corporate-owned life insurance, the value of which approximates an investment mix of 50% in equities and 50% in fixed income investments. See note 10 of the financial statements, which provides details on our pension funding.
CUSTOMERS AND COUNTERPARTIES
– See the subsequent section of this discussion under Market Risk Sensitivity–Credit Risk.
ACQUISITIONS
Acquisitions are part of our strategy to increase sales and profits.
In fiscal 2017, we made the following acquisitions:
|
•
|
On December 15, 2016, we purchased 100% of the shares of Enrico Giotti SpA (Giotti), a leading European flavor manufacturer located in Italy, for a cash payment of $123.8 million, net of cash acquired of $1.2 million. The acquisition was funded with cash and short-term borrowings. Giotti is well known in the industry for its innovative beverage, sweet, savory and dairy flavor applications. Our acquisition of Giotti in fiscal 2017 expanded the breadth of value-added products for McCormick's industrial segment, including additional expertise in flavoring health and nutrition products.
|
|
•
|
On August 17, 2017, we completed the acquisition of RB Foods. The purchase price was approximately $4.21 billion, net of acquired cash of $24.3 million, and included a preliminary working capital adjustment of $11.2 million. In December 2017, we paid an additional $4.2 million associated with the final working capital adjustment. The acquisition was funded through our issuance of approximately 6.35 million shares of common stock non-voting (see note 13 of the financial statements) and through new borrowings comprised of senior unsecured notes and pre-payable term loans (see note 6 of the financial statements). The acquired market-leading brands of RB Foods include French’s,
Frank’s RedHot and Cattlemen’s, which are a natural strategic fit with our robust global branded flavor portfolio. We believe that these additions move us to a leading position in the attractive U.S. condiments category and provide significant international growth opportunities for our consumer and industrial segments. The operations of RB Foods have been included as a component of our consumer and industrial segments from the date of acquisition.
|
In fiscal 2016, we made the following acquisitions:
|
•
|
On April 19, 2016, we completed the purchase of 100% of the shares of Botanical Food Company, Pty Ltd, owner of the Gourmet Garden brand of packaged herbs (Gourmet Garden), a privately held company based in Australia. Gourmet Garden is a global market leader in chilled convenient packaged herbs. Gourmet Garden's products complement our existing branded herb portfolio with the addition of chilled convenient herbs located in the perimeter of the grocery store. We plan to drive sales of the Gourmet Garden brand by expanding global distribution and building awareness with increased brand investment. The purchase price was $116.2 million, net of cash acquired of $3.3 million, and was financed with a combination of cash and short-term borrowings. Gourmet Garden has been included in our consumer segment since its acquisition. While this business has an industrial component, the industrial component is not currently material to its overall business.
|
|
•
|
On September 1, 2016, we acquired the Cajun Injector business for $4.4 million. Cajun Injector has been included in our consumer segment since its acquisition.
|
In fiscal 2015, we made the following acquisitions:
|
•
|
We purchased 100% of the shares of Brand Aromatics, a privately held company located in the U.S. Brand Aromatics is a supplier of natural savory flavors, marinades, and broth and stock concentrates to the packaged food industry. Its addition expanded the breadth of value-added products in our industrial segment. The purchase price for Brand Aromatics was $62.4 million, net of post-closing adjustments and was financed with a combination of cash and short-term borrowings. Brand Aromatics has been included in our industrial segment since its acquisition.
|
|
•
|
We purchased 100% of the shares of D&A, a privately held company based in Italy, and a leader of the spice and seasoning category in Italy that supplies both branded and private label products to consumers. The purchase price for D&A consisted of a cash payment of $49.0 million, net of cash acquired of $2.8 million, subject to certain closing adjustments, and was financed with a combination of cash and short-term borrowings. In 2017, the contingent consideration liability specified in the purchase agreement was settled in advance of its contractual term for approximately $29.3 million (€26.1 million), with $19.7 million (€17.6 million) paid in 2017. That €17.6 million was in addition to the €5.0 million prepayment of the contingent consideration that we made as of the acquisition date, with the remaining €3.5 million expected to be paid in 2018. D&A has been included in our consumer segment since its acquisition.
|
|
•
|
We purchased 100% of the shares of One World Foods, Inc., owner of the Stubb's brand of barbeque products (Stubb's), a privately held company located in Austin, Texas. Stubb's is a leading premium barbeque sauce brand in the U.S. In addition to sauces, Stubb's products include marinades, rubs and skillet sauces. Its addition expanded the breadth of value-added products in our consumer segment. The purchase price for Stubb's was $99.4 million, subject to certain closing adjustments, and was financed with a combination of cash and short-term borrowings. Stubb's has been included in our consumer segment since its acquisition.
|
See note 2 of the financial statements for further details regarding these acquisitions.
PERFORMANCE GRAPH—SHAREHOLDER RETURN
The following line graph compares the yearly change in McCormick’s cumulative total shareholder return (stock price appreciation plus reinvestment of dividends) on McCormick’s Non-Voting Common Stock with (1) the cumulative total return of the Standard & Poor’s 500 Stock Price Index, assuming reinvestment of dividends, and (2) the cumulative total return of the Standard & Poor’s Packaged Foods & Meats Index, assuming reinvestment of dividends.
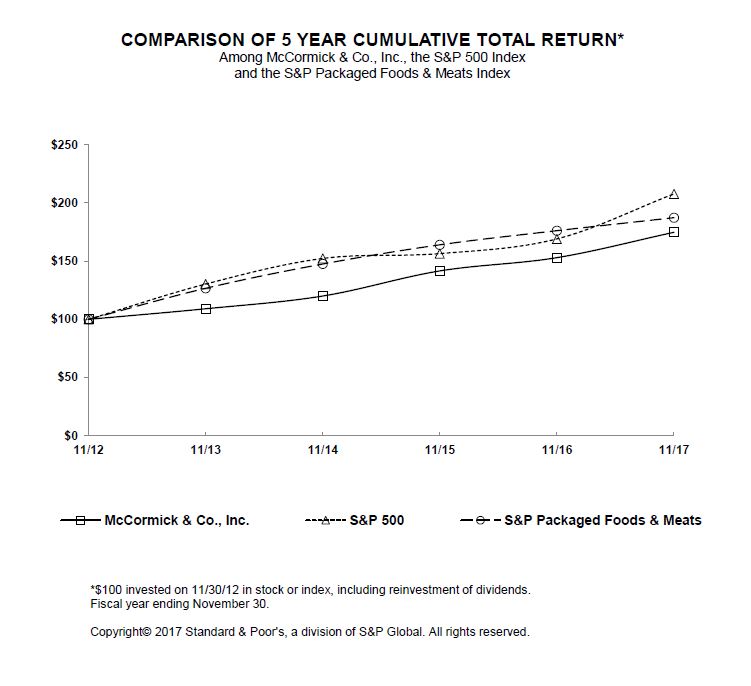
MARKET RISK SENSITIVITY
We utilize derivative financial instruments to enhance our ability to manage risk, including foreign exchange and interest rate exposures, which exist as part of our ongoing business operations. We do not enter into contracts for trading purposes, nor are we a party to any leveraged derivative instrument. The use of derivative financial instruments is monitored through regular communication with senior management and the utilization of written guidelines. The information presented below should be read in conjunction with notes 6 and 7 of the financial statements.
Foreign Exchange Risk
–
We are exposed to fluctuations in foreign currency in the following main areas: cash flows related to raw material purchases; the translation of foreign currency earnings to U.S. dollars; the effects of foreign currency on loans between subsidiaries and unconsolidated affiliates and on cash flows related to repatriation of earnings of unconsolidated affiliates. Primary exposures include the U.S. dollar versus the Euro, British pound sterling, Canadian dollar, Polish zloty, Australian dollar, Mexican peso, Chinese renminbi, Indian rupee and Thai baht, as well as the Euro versus the British pound sterling, Australian dollar and Swiss franc. We routinely enter into foreign currency exchange contracts to manage certain of these foreign currency risks.
During 2017, the foreign currency translation component in other comprehensive income was principally related to the impact of exchange rate fluctuations on our net investments in our subsidiaries with a functional currency of the British pound sterling, Euro, Polish zloty, Chinese yuan and Australian dollar. We did not hedge our net investments in subsidiaries and unconsolidated affiliates.
The following table summarizes the foreign currency exchange contracts held at November 30, 2017. All contracts are valued in U.S. dollars using year-end 2017 exchange rates and have been designated as hedges of foreign currency transactional exposures, firm commitments or anticipated transactions.
FOREIGN CURRENCY EXCHANGE CONTRACTS AT NOVEMBER 30, 2017
|
Currency sold
|
Currency received
|
Notional
value
|
Average
contractual
exchange
rate
|
Fair
value
|
|||||
|
Euro
|
U.S. dollar
|
$
|
11.0
|
|
1.14
|
|
$
|
(0.6
|
)
|
|
British pound sterling
|
U.S. dollar
|
30.0
|
|
1.29
|
|
(1.6
|
)
|
||
|
Canadian dollar
|
U.S. dollar
|
174.0
|
|
0.78
|
|
1.5
|
|
||
|
U.S. dollar
|
Australian dollar
|
17.8
|
|
0.78
|
|
(0.4
|
)
|
||
|
Polish zloty
|
U.S. dollar
|
17.9
|
|
3.78
|
|
(1.3
|
)
|
||
|
Australian dollar
|
Euro
|
46.4
|
|
1.50
|
|
2.7
|
|
||
|
Swiss franc
|
Euro
|
67.3
|
|
1.08
|
|
5.6
|
|
||
|
Canadian dollar
|
British pound sterling
|
30.4
|
|
1.65
|
|
1.9
|
|
||
We had a number of smaller contracts at November 30, 2017 with an aggregate notional value of $11.1 million to purchase or sell other currencies, such as the Swiss franc and the Romanian leu. The aggregate fair value of these contracts was $0.2 million at November 30, 2017.
At November 30, 2016, we had foreign currency exchange contracts for the Euro, British pound sterling, Canadian dollar, Australian dollar and Polish zloty with a notional value of $449.2 million, all of which matured in 2017. The aggregate fair value of these contracts was $(0.5) million at November 30, 2016.
Interest Rate Risk
–
Our policy is to manage interest rate risk by entering into both fixed and variable rate debt arrangements. We also use interest rate swaps to minimize worldwide financing costs and to achieve a desired mix of fixed and variable rate debt. The table that follows provides principal cash flows and related interest rates, excluding the effect of interest rate swaps and the amortization of any discounts or fees, by fiscal year of maturity at November 30, 2017. For foreign currency-denominated debt, the information is presented in U.S. dollar equivalents. Variable interest rates are based on the weighted-average rates of the portfolio at the end of the year presented.
YEARS OF MATURITY AT NOVEMBER 30, 2017
|
2018
|
2019
|
2020
|
2021
|
Thereafter
|
Total
|
Fair value
|
|||||||||||||||
|
Debt
|
|||||||||||||||||||||
|
Fixed rate
|
$
|
250.6
|
|
$
|
0.5
|
|
$
|
0.2
|
|
$
|
250.2
|
|
$
|
3,061.1
|
|
$
|
3,562.6
|
|
$
|
3,615.2
|
|
|
Average interest rate
|
5.75
|
%
|
7.10
|
%
|
11.94
|
%
|
3.91
|
%
|
3.33
|
%
|
—
|
|
—
|
|
|||||||
|
Variable rate
|
$
|
332.6
|
|
$
|
76.6
|
|
$
|
576.6
|
|
$
|
76.6
|
|
$
|
438.5
|
|
$
|
1,500.9
|
|
$
|
1,500.9
|
|
|
Average interest rate
|
2.39
|
%
|
2.72
|
%
|
2.57
|
%
|
2.72
|
%
|
2.74
|
%
|
—
|
|
—
|
|
|||||||
The table above displays the debt by the terms of the original debt instrument without consideration of fair value, interest rate swaps and any loan discounts or origination fees. Interest rate swaps have the following effects:
|
•
|
We issued $250 million of 5.75% notes due in December 2017 in December 2007. Forward treasury lock agreements settled upon issuance of these notes effectively set the interest rate on these notes at a weighted-average fixed rate of 6.25%.
|
|
•
|
We issued $250 million of 3.90% notes due in 2021 in July 2011. Forward treasury lock agreements settled upon issuance of these notes effectively set the interest rate on these notes at a weighted-average fixed rate of 4.01%.
|
|
•
|
We issued $250 million of 3.50% notes due in 2023 in August 2013. Forward treasury lock agreements settled upon issuance of these notes effectively set the interest rate on these notes at a weighted-average fixed rate of 3.30%.
|
|
•
|
We issued $250 million of 3.25% notes due in 2025 in November 2015. Forward treasury lock agreements settled upon issuance of these notes effectively set the interest rate on these notes at a weighted-average fixed rate of 3.45%. The fixed interest rate on $100 million of the 3.25% notes due in December 2025 was effectively converted to a variable rate by interest rate swaps through 2025. Net interest payments are based on 3 month LIBOR plus 1.22% during this period.
|
|
•
|
We issued an aggregate amount of $2.5 billion of senior unsecured notes in August 2017. These notes are due as follows: $750 million due August 15, 2022, $700 million due August 15, 2024, $750 million due August 15, 2027 and $300 million due August 15, 2047 with stated fixed interest rates of 2.70%, 3.15%, 3.40% and 4.20%, respectively. Forward treasury lock agreements settled upon issuance of the $750 million notes due August 15, 2027 effectively set the interest rate on these $750 million notes at a weighted-average fixed rate of 3.44%.
|
Commodity Risk
– We purchase certain raw materials which are subject to price volatility caused by weather, market conditions, growing and harvesting conditions, governmental actions and other factors beyond our control. In 2017, our most significant raw materials were pepper, dairy products, garlic, vanilla, capsicums (red peppers and paprika), onion, wheat flour and rice. While future movements of raw material costs are uncertain, we respond to this volatility in a number of ways, including strategic raw material purchases, purchases of raw material for future
delivery and customer price adjustments. We generally have not used derivatives to manage the volatility related to this risk. To the extent that we have used derivatives for this purpose, it has not been material to our business.
Credit Risk
– The customers of our consumer segment are predominantly food retailers and food wholesalers. Consolidations in these industries have created larger customers. In addition, competition has increased with the growth in alternative channels including mass merchandisers, dollar stores, warehouse clubs, discount chains and e-commerce. This has caused some customers to be less profitable and increased our exposure to credit risk. Some of our customers and counterparties are highly leveraged. We continue to closely monitor the credit worthiness of our customers and counterparties. We feel that the allowance for doubtful accounts properly recognizes trade receivables at realizable value. We consider nonperformance credit risk for other financial instruments to be insignificant.
CONTRACTUAL OBLIGATIONS AND COMMERCIAL COMMITMENTS
The following table reflects a summary of our contractual obligations and commercial commitments as of November 30, 2017:
CONTRACTUAL CASH OBLIGATIONS DUE BY YEAR
|
Total
|
Less than
1 year
|
1–3
years
|
3–5
years
|
More than
5 years
|
|||||||||||
|
Short-term borrowings
|
$
|
257.6
|
|
$
|
257.6
|
|
$
|
—
|
|
$
|
—
|
|
$
|
—
|
|
|
Long-term debt
|
4,805.9
|
|
325.6
|
|
653.9
|
|
1,509.4
|
|
2,317.0
|
|
|||||
|
Operating leases
|
172.0
|
|
41.7
|
|
59.6
|
|
37.0
|
|
33.7
|
|
|||||
|
Interest payments
|
1,187.5
|
|
150.0
|
|
276.0
|
|
232.9
|
|
528.6
|
|
|||||
|
Raw material purchase obligations
(a)
|
469.4
|
|
469.4
|
|
—
|
|
—
|
|
—
|
|
|||||
|
Other purchase obligations
(b)
|
17.8
|
|
14.4
|
|
3.4
|
|
—
|
|
—
|
|
|||||
|
Total contractual cash obligations
|
$
|
6,910.2
|
|
$
|
1,258.7
|
|
$
|
992.9
|
|
$
|
1,779.3
|
|
$
|
2,879.3
|
|
|
(a)
|
Raw material purchase obligations outstanding as of year end may not be indicative of outstanding obligations throughout the year due to our response to varying raw material cycles.
|
|
(b)
|
Other purchase obligations consist of advertising media commitments and utility contracts.
|
The contractual cash obligations table above does not reflect any estimated lease payment obligation with respect to a 15-year lease for a headquarters building in Hunt Valley, Maryland, which we entered into in July 2016. The lease, which is expected to commence upon completion of building construction and fit-out, currently scheduled for the second half of 2018, will require monthly lease payments of approximately $0.9 million beginning six months after lease commencement. That monthly lease payment is subject to adjustment after an initial 60-month period and thereafter on an annual basis as specified in the lease agreement. In addition, the initial $0.9 million monthly lease payment is subject to an increase in the event of agreed-upon changes to specifications related to the headquarters building. See note 6 of the financial statements for additional details.
Pension and postretirement funding can vary significantly each year due to changes in legislation, our significant assumptions and investment return on plan assets. As a result, we have not presented pension and postretirement funding in the table above.
COMMERCIAL COMMITMENTS EXPIRATION BY YEAR
|
Total
|
Less than
1 year
|
1–3
years
|
3–5
years
|
More than
5 years
|
|||||||||||
|
Guarantees
|
$
|
0.6
|
|
$
|
0.6
|
|
$
|
—
|
|
$
|
—
|
|
$
|
—
|
|
|
Standby letters of credit
|
7.3
|
|
7.3
|
|
—
|
|
—
|
|
—
|
|
|||||
|
Total commercial commitments
|
$
|
7.9
|
|
$
|
7.9
|
|
$
|
—
|
|
$
|
—
|
|
$
|
—
|
|
OFF-BALANCE SHEET ARRANGEMENTS
We had no off-balance sheet arrangements as of November 30, 2017 and 2016.
RECENTLY ISSUED ACCOUNTING PRONOUNCEMENTS
New accounting pronouncements are issued periodically that affect our current and future operations. See note 1 of the financial statements for further details of these impacts.
CRITICAL ACCOUNTING ESTIMATES AND ASSUMPTIONS
In preparing the financial statements, we are required to make estimates and assumptions that have an impact on the assets, liabilities, revenue and expenses reported. These estimates can also affect supplemental information disclosed by us, including information about contingencies, risk and financial condition. We believe, given current facts and circumstances, our estimates and assumptions are reasonable, adhere to U.S. GAAP and are consistently applied. Inherent in the nature of an estimate or assumption is the fact that actual results may differ from estimates, and estimates may vary as new facts and circumstances arise. In preparing the financial statements, we make routine estimates and judgments in determining the net realizable value of accounts receivable, inventory, fixed assets and prepaid allowances. Our most critical accounting estimates and assumptions are in the following areas:
Customer Contracts
In several of our major geographic markets, the consumer segment sells our products by entering into annual or multi-year customer contracts. These contracts include provisions for items such as sales discounts, marketing allowances and performance incentives. These items are recognized based on certain estimated criteria such as sales volume of indirect customers, customers reaching anticipated volume thresholds and marketing spending. We routinely review these criteria and make adjustments as facts and circumstances change.
Goodwill and Intangible Asset Valuation
We review the carrying value of goodwill and non-amortizable intangible assets and conduct tests of impairment on an annual basis as described below. We also test for impairment if events or circumstances indicate it is more likely than not that the fair value of a reporting unit is below its carrying amount. We test indefinite-lived intangible assets for impairment if events or changes in circumstances indicate that the asset might be impaired.
Determining the fair value of a reporting unit or an indefinite-lived purchased intangible asset is judgmental in nature and involves the use of significant estimates and assumptions. These estimates and assumptions include revenue growth rates and operating margins used to calculate projected future cash flows, risk-adjusted discount rates, assumed royalty rates, future economic and market conditions, and determination of appropriate market comparables. We base our fair value estimates on assumptions we believe to be reasonable but that are inherently uncertain. Actual future results may differ from those estimates.
Goodwill Impairment
Our reporting units are the same as our operating segments. We calculate fair value of a reporting unit by using a discounted cash flow model. Our discounted cash flow model calculates fair value by present valuing future expected cash flows of our reporting units using our internal cost of capital as the discount rate. We then compare this fair value to the carrying amount of the reporting unit, including intangible assets and goodwill. If the carrying amount of the reporting unit exceeds the calculated fair value, then we would determine the implied fair value of the reporting unit’s goodwill. An impairment charge would be recognized to the extent the carrying amount of goodwill exceeds the implied fair value. As of November 30, 2017, we had $4,490.1 million of goodwill recorded in our balance sheet ($3,385.4 million in the consumer segment and $1,104.7 million in the industrial segment).
Included in those amounts are $2,546.3 million ($1,697.5 million in the consumer segment and $848.8 million in the industrial segment) of goodwill related to our acquisition of RB Foods that, as of November 30, 2017, was determined on a preliminary basis. The final valuation of the acquired net assets of RB Foods, and the related goodwill balance by segment, will be completed in 2018. Our fiscal year 2017 testing indicates that the current fair values of our reporting units are significantly in excess of carrying values. Accordingly, we believe that only significant changes in the cash flow assumptions would result in an impairment of goodwill.
Indefinite-lived Intangible Asset Impairment
Our indefinite-lived intangible assets consist of brand names and trademarks. We calculate fair value by using a relief-from-royalty method or discounted cash flow model and then compare that to the carrying amount of the indefinite-lived intangible asset.
As of November 30, 2017, we had $2,808.5 million of brand name assets and trademarks recorded in our balance sheet, and none of the balances exceeded their calculated fair values. Excluding (i) the brand names associated with the 2017 RB Foods acquisition, which were based upon a preliminary valuation of the acquired net assets, (ii) the brand names associated with other acquisitions in 2017, 2016 and 2015, including Giotti, Gourmet Garden, Brand Aromatics, D&A and Stubbs, (iii) the Kohinoor brand name that was written down to its estimated fair value in
2015, and (iv) the Kamis brand name as discussed below, the percentage excess of estimated fair value over book values for our major brand names and trademarks is 40% or more as of November 30, 2017.
The following table outlines the book value of our major brand names and trademarks as of November 30, 2017:
|
RB Foods (French's, Frank's RedHot, and Cattlemen's)
(a)
|
$
|
2,475.0
|
|
|
Zatarain's
|
106.4
|
|
|
|
Lawry’s
|
48.0
|
|
|
|
Kamis
|
35.7
|
|
|
|
Stubb's
|
27.1
|
|
|
|
DaQiao/ChuShiLe
|
26.4
|
|
|
|
Gourmet Garden
|
27.3
|
|
|
|
Simply Asia/Thai Kitchen
|
18.6
|
|
|
|
Drogheria & Alimentari
|
13.6
|
|
|
|
Kohinoor
|
8.6
|
|
|
|
Giotti
|
5.4
|
|
|
|
Brand Aromatics
|
4.2
|
|
|
|
Other
|
12.2
|
|
|
|
Total
|
$
|
2,808.5
|
|
(a) Book value for the French's, Frank's RedHot, and Cattlemen's brand names as of November 30, 2017 is based on a preliminary valuation of the acquired net assets of RB Foods and will be adjusted upon finalization of this valuation in 2018.
The percentage excess of calculated fair value over book value for the Kamis brand name as of November 30, 2017, was approximately 14%. A change in assumptions with respect to future performance of the Kamis business could result in impairment losses in the future.
The brand names and trademarks related to recent acquisitions (in particular, our most recent – and most significant – acquisition, RB Foods) may be more susceptible to future impairment as their carrying values represent recently determined fair values. A change in assumptions with respect to future performance of these recently acquired businesses, or a change in other assumptions, could result in impairment losses in the future.
Income Taxes
We estimate income taxes and file tax returns in each of the taxing jurisdictions in which we operate and are required to file a tax return. At the end of each year, an estimate for income taxes is recorded in the financial statements. Tax returns are generally filed in the third or fourth quarter of the subsequent year. A reconciliation of the estimate to the final tax return is done at that time which will result in changes to the original estimate. We believe that our tax return positions are appropriately supported, but tax authorities may challenge certain positions. We evaluate our uncertain tax positions in accordance with the U.S. GAAP guidance for uncertainty in income taxes. We believe that our reserve for uncertain tax positions, including related interest, is adequate. The amounts ultimately paid upon resolution of audits could be materially different from the amounts previously included in our income tax expense and, therefore, could have a material impact on our tax provision, net income and cash flows. We have recorded valuation allowances to reduce our deferred tax assets to the amount that is more likely than not to be realized. In doing so, we have considered future taxable income and tax planning strategies in assessing the need for a valuation allowance. Both future taxable income and tax planning strategies include a number of estimates.
Pension and Postretirement Benefits
Pension and other postretirement plans’ costs require the use of assumptions for discount rates, investment returns, projected salary increases, mortality rates and health care cost trend rates. The actuarial assumptions used in our pension and postretirement benefit reporting are reviewed annually and compared with external benchmarks to ensure that they appropriately account for our future pension and postretirement benefit obligations. While we believe that the assumptions used are appropriate, differences between assumed and actual experience may affect our operating results. A 1% increase or decrease in the actuarial assumption for the discount rate would impact 2018 pension and postretirement benefit expense by approximately $10 million. A 1% increase or decrease in the expected return on plan assets would impact 2018 pension expense by approximately $9 million.
We will continue to evaluate the appropriateness of mortality and other assumptions used in the measurement of our pension and other postretirement benefit obligations. In addition, see note 10 of the financial statements for a discussion of these assumptions and the effects on the financial statements.
Stock-Based Compensation
We estimate the fair value of our stock-based compensation using fair value pricing models which require the use of significant assumptions for expected volatility of stock, dividend yield and risk-free interest rate. Our valuation methodology and significant assumptions used are disclosed in note 11 of the financial statements.
This information is set forth in the “Market Risk Sensitivity” section of “Management’s Discussion and Analysis” and in note 7 of the financial statements.
REPORT OF MANAGEMENT
We are responsible for the preparation and integrity of the consolidated financial statements appearing in our Annual Report. The consolidated financial statements were prepared in conformity with United States generally accepted accounting principles and include amounts based on our estimates and judgments. All other financial information in this report has been presented on a basis consistent with the information included in the financial statements.
We are also responsible for establishing and maintaining adequate internal control over financial reporting. We maintain a system of internal control that is designed to provide reasonable assurance as to the fair and reliable preparation and presentation of the consolidated financial statements, as well as to safeguard assets from unauthorized use or disposition.
Our control environment is the foundation for our system of internal control over financial reporting and is embodied in our Business Ethics Policy. It sets the tone of our organization and includes factors such as integrity and ethical values. Our internal control over financial reporting is supported by formal policies and procedures which are reviewed, modified and improved as changes occur in business conditions and operations.
The Audit Committee of the Board of Directors, which is composed solely of independent directors, meets periodically with members of management, the internal auditors and the independent registered public accounting firm to review and discuss internal control over financial reporting and accounting and financial reporting matters. The independent registered public accounting firm and internal auditors report to the Audit Committee and accordingly have full and free access to the Audit Committee at any time.
We conducted an assessment of the effectiveness of our internal control over financial reporting based on the framework in
Internal Control - Integrated Framework
issued by the Committee of Sponsoring Organizations of the Treadway Commission (2013 framework). This assessment included review of the documentation of controls, evaluation of the design effectiveness of controls, testing of the operating effectiveness of controls and a conclusion on this assessment. Our assessment of the effectiveness of our internal control over financial reporting as of November 30, 2017 did not include an assessment of the effectiveness of internal control over financial reporting of RB Foods, which we acquired on August 17, 2017. The operating results of RB Foods are included in our consolidated financial statements from the period subsequent to the acquisition date and, excluding goodwill and intangible assets, include $164 million of assets as of November 30, 2017, and $190 million in net sales for the year then ended. We will include RB Foods in our 2018 annual assessment of internal control over financial reporting. Although there are inherent limitations in the effectiveness of any system of internal control over financial reporting, based on our assessment, we have concluded with reasonable assurance that our internal control over financial reporting was effective as of November 30, 2017.
Our internal control over financial reporting as of November 30, 2017 has been audited by Ernst & Young LLP.

|
Lawrence E. Kurzius
|
|
Chairman, President &
Chief Executive Officer
|

|
Michael R. Smith
|
|
Executive Vice President &
Chief Financial Officer
|

|
Christina M. McMullen
|
|
Vice President & Controller
Chief Accounting Officer
|
REPORT OF INDEPENDENT REGISTERED PUBLIC ACCOUNTING FIRM
Internal Control Over Financial Reporting
The Board of Directors and Shareholders of
McCormick & Company, Incorporated
We have audited McCormick & Company, Incorporated’s internal control over financial reporting as of November 30, 2017, based on criteria established in
Internal Control - Integrated Framework
issued by the Committee of Sponsoring Organizations of the Treadway Commission (2013 framework) (the COSO criteria). McCormick & Company, Incorporated’s management is responsible for maintaining effective internal control over financial reporting, and for its assessment of the effectiveness of internal control over financial reporting included in the accompanying Report of Management. Our responsibility is to express an opinion on the company’s internal control over financial reporting based on our audit.
We conducted our audit in accordance with the standards of the Public Company Accounting Oversight Board (United States). Those standards require that we plan and perform the audit to obtain reasonable assurance about whether effective internal control over financial reporting was maintained in all material respects. Our audit included obtaining an understanding of internal control over financial reporting, assessing the risk that a material weakness exists, testing and evaluating the design and operating effectiveness of internal control based on the assessed risk, and performing such other procedures as we considered necessary in the circumstances. We believe that our audit provides a reasonable basis for our opinion.
A company’s internal control over financial reporting is a process designed to provide reasonable assurance regarding the reliability of financial reporting and the preparation of financial statements for external purposes in accordance with generally accepted accounting principles. A company’s internal control over financial reporting includes those policies and procedures that (1) pertain to the maintenance of records that, in reasonable detail, accurately and fairly reflect the transactions and dispositions of the assets of the company; (2) provide reasonable assurance that transactions are recorded as necessary to permit preparation of financial statements in accordance with generally accepted accounting principles, and that receipts and expenditures of the company are being made only in accordance with authorizations of management and directors of the company; and (3) provide reasonable assurance regarding prevention or timely detection of unauthorized acquisition, use, or disposition of the company’s assets that could have a material effect on the financial statements.
Because of its inherent limitations, internal control over financial reporting may not prevent or detect misstatements. Also, projections of any evaluation of effectiveness to future periods are subject to the risk that controls may become inadequate because of changes in conditions, or that the degree of compliance with the policies or procedures may deteriorate.
As indicated in the accompanying Report of Management, management's assessment of and conclusion on the effectiveness of internal control over financial reporting did not include the internal controls of Reckitt Benckiser's Food Division ("RB Foods") acquired on August 17, 2017, which is included in the 2017 consolidated financial statements of McCormick & Company, Incorporated and constituted $164 million of assets, excluding goodwill and intangible assets, as of November 30, 2017 and $190 million of net sales for the year then ended. Our audit of internal control over financial reporting of McCormick & Company, Incorporated also did not include an evaluation of the internal control over financial reporting of RB Foods.
In our opinion, McCormick & Company, Incorporated maintained, in all material respects, effective internal control over financial reporting as of November 30, 2017, based on the COSO criteria.
We also have audited, in accordance with the standards of the Public Company Accounting Oversight Board (United States), the consolidated balance sheets of McCormick & Company, Incorporated as of November 30, 2017 and 2016, and the related consolidated income statements, statements of comprehensive income, statements of shareholders’ equity and cash flow statements for each of the three years in the period ended November 30, 2017 and our report dated January 25, 2018 expressed an unqualified opinion thereon.
Baltimore, Maryland
January 25, 2018
REPORT OF INDEPENDENT REGISTERED PUBLIC ACCOUNTING FIRM
Consolidated Financial Statements
The Board of Directors and Shareholders of
McCormick & Company, Incorporated
We have audited the accompanying consolidated balance sheets of McCormick & Company, Incorporated as of November 30, 2017 and 2016, and the related consolidated income statements, statements of comprehensive income, statements of shareholders’ equity and cash flow statements for each of the three years in the period ended November 30, 2017. Our audits also included the financial statement schedule listed in the Index at Item 15(2). These financial statements and schedule are the responsibility of the Company’s management. Our responsibility is to express an opinion on these financial statements and schedule based on our audits.
We conducted our audits in accordance with the standards of the Public Company Accounting Oversight Board (United States). Those standards require that we plan and perform the audit to obtain reasonable assurance about whether the financial statements are free of material misstatement. An audit includes examining, on a test basis, evidence supporting the amounts and disclosures in the financial statements. An audit also includes assessing the accounting principles used and significant estimates made by management, as well as evaluating the overall financial statement presentation. We believe that our audits provide a reasonable basis for our opinion.
In our opinion, the financial statements referred to above present fairly, in all material respects, the consolidated financial position of McCormick & Company, Incorporated at November 30, 2017 and 2016, and the consolidated results of its operations and its cash flows for each of the three years in the period ended November 30, 2017, in conformity with U.S. generally accepted accounting principles. Also, in our opinion, the related financial statement schedule, when considered in relation to the basic financial statements taken as a whole, presents fairly in all material respects the information set forth therein.
We also have audited, in accordance with the standards of the Public Company Accounting Oversight Board (United States), McCormick & Company, Incorporated’s internal control over financial reporting as of November 30, 2017, based on criteria established in Internal Control - Integrated Framework issued by the Committee of Sponsoring Organizations of the Treadway Commission (2013 framework) and our report dated January 25, 2018 expressed an unqualified opinion thereon.
Baltimore, Maryland
January 25, 2018
CONSOLIDATED INCOME STATEMENTS
|
for the year ended November 30 (millions except per share data)
|
2017
|
2016
|
2015
|
||||||
|
Net sales
|
$
|
4,834.1
|
|
$
|
4,411.5
|
|
$
|
4,296.3
|
|
|
Cost of goods sold
|
2,823.9
|
|
2,579.8
|
|
2,559.0
|
|
|||
|
Gross profit
|
2,010.2
|
|
1,831.7
|
|
1,737.3
|
|
|||
|
Selling, general and administrative expense
|
1,244.8
|
|
1,175.0
|
|
1,127.4
|
|
|||
|
Transaction and integration expenses (related to RB Foods acquisition)
|
40.8
|
|
—
|
|
—
|
|
|||
|
Special charges
|
22.2
|
|
15.7
|
|
61.5
|
|
|||
|
Operating income
|
702.4
|
|
641.0
|
|
548.4
|
|
|||
|
Interest expense
|
95.7
|
|
56.0
|
|
53.3
|
|
|||
|
Other debt costs
|
15.4
|
|
—
|
|
—
|
|
|||
|
Other income, net
|
3.5
|
|
4.2
|
|
1.1
|
|
|||
|
Income from consolidated operations before income taxes
|
594.8
|
|
589.2
|
|
496.2
|
|
|||
|
Income taxes
|
151.3
|
|
153.0
|
|
131.3
|
|
|||
|
Net income from consolidated operations
|
443.5
|
|
436.2
|
|
364.9
|
|
|||
|
Income from unconsolidated operations
|
33.9
|
|
36.1
|
|
36.7
|
|
|||
|
Net income
|
$
|
477.4
|
|
$
|
472.3
|
|
$
|
401.6
|
|
|
Earnings per share–basic
|
$
|
3.77
|
|
$
|
3.73
|
|
$
|
3.14
|
|
|
Earnings per share–diluted
|
$
|
3.72
|
|
$
|
3.69
|
|
$
|
3.11
|
|
See Notes to Consolidated Financial Statements.
|
for the year ended November 30 (millions)
|
2017
|
2016
|
2015
|
||||||
|
Net income
|
$
|
477.4
|
|
$
|
472.3
|
|
$
|
401.6
|
|
|
Net income (loss) attributable to non-controlling interest
|
1.6
|
|
(1.3
|
)
|
0.5
|
|
|||
|
Other comprehensive income (loss):
|
|||||||||
|
Unrealized components of pension and other postretirement plans (including curtailment gains of $76.7 for 2017)
|
103.2
|
|
(28.5
|
)
|
27.4
|
|
|||
|
Currency translation adjustments
|
174.6
|
|
(94.6
|
)
|
(239.8
|
)
|
|||
|
Change in derivative financial instruments
|
(12.5
|
)
|
4.1
|
|
(3.4
|
)
|
|||
|
Deferred taxes
|
(30.8
|
)
|
8.9
|
|
(5.3
|
)
|
|||
|
Total other comprehensive income (loss)
|
234.5
|
|
(110.1
|
)
|
(221.1
|
)
|
|||
|
Comprehensive income
|
$
|
713.5
|
|
$
|
360.9
|
|
$
|
181.0
|
|
See Notes to Consolidated Financial Statements.
|
at November 30 (millions)
|
2017
|
2016
|
||||
|
Assets
|
||||||
|
Cash and cash equivalents
|
$
|
186.8
|
|
$
|
118.4
|
|
|
Trade accounts receivable, less allowances of $6.6 for 2017 and $4.2 for 2016
|
555.1
|
|
465.2
|
|
||
|
Inventories
|
793.3
|
|
756.3
|
|
||
|
Prepaid expenses and other current assets
|
81.8
|
|
81.9
|
|
||
|
Total current assets
|
1,617.0
|
|
1,421.8
|
|
||
|
Property, plant and equipment, net
|
809.1
|
|
669.4
|
|
||
|
Goodwill
|
4,490.1
|
|
1,771.4
|
|
||
|
Intangible assets, net
|
3,071.1
|
|
424.9
|
|
||
|
Investments and other assets
|
398.5
|
|
348.4
|
|
||
|
Total assets
|
$
|
10,385.8
|
|
$
|
4,635.9
|
|
|
Liabilities
|
||||||
|
Short-term borrowings
|
$
|
257.6
|
|
$
|
390.3
|
|
|
Current portion of long-term debt
|
325.6
|
|
2.9
|
|
||
|
Trade accounts payable
|
639.9
|
|
450.8
|
|
||
|
Other accrued liabilities
|
724.2
|
|
578.7
|
|
||
|
Total current liabilities
|
1,947.3
|
|
1,422.7
|
|
||
|
Long-term debt
|
4,443.9
|
|
1,054.0
|
|
||
|
Deferred taxes
|
1,094.5
|
|
79.9
|
|
||
|
Other long-term liabilities
|
329.2
|
|
441.2
|
|
||
|
Total liabilities
|
7,814.9
|
|
2,997.8
|
|
||
|
Shareholders’ equity
|
||||||
|
Common stock, no par value; authorized 320.0 shares; issued and outstanding:
2017–10.0 shares, 2016–11.4 shares
|
378.2
|
|
409.7
|
|
||
|
Common stock non-voting, no par value; authorized 320.0 shares; issued and outstanding: 2017–121.0 shares, 2016–113.9 shares
|
1,294.7
|
|
674.5
|
|
||
|
Retained earnings
|
1,166.5
|
|
1,056.8
|
|
||
|
Accumulated other comprehensive loss
|
(279.5
|
)
|
(514.4
|
)
|
||
|
Non-controlling interests
|
11.0
|
|
11.5
|
|
||
|
Total shareholders’ equity
|
2,570.9
|
|
1,638.1
|
|
||
|
Total liabilities and shareholders’ equity
|
$
|
10,385.8
|
|
$
|
4,635.9
|
|
See Notes to Consolidated Financial Statements.
CONSOLIDATED CASH FLOW STATEMENTS
|
for the year ended November 30 (millions)
|
2017
|
2016
|
2015
|
||||||
|
Operating activities
|
|||||||||
|
Net income
|
$
|
477.4
|
|
$
|
472.3
|
|
$
|
401.6
|
|
|
Adjustments to reconcile net income to net cash provided by operating activities:
|
|||||||||
|
Depreciation and amortization
|
125.2
|
|
108.7
|
|
105.9
|
|
|||
|
Stock-based compensation
|
23.9
|
|
25.6
|
|
18.7
|
|
|||
|
Brand name impairment included in special charges
|
—
|
|
—
|
|
9.6
|
|
|||
|
Special charges and transaction and integration expenses
|
19.1
|
|
7.2
|
|
22.8
|
|
|||
|
Amortization of inventory fair value adjustment associated with acquisition of RB Foods
|
20.9
|
|
—
|
|
—
|
|
|||
|
Loss on sale of assets
|
1.3
|
|
1.5
|
|
0.6
|
|
|||
|
Deferred income tax expense (benefit)
|
24.1
|
|
(40.0
|
)
|
1.0
|
|
|||
|
Income from unconsolidated operations
|
(33.9
|
)
|
(36.1
|
)
|
(36.7
|
)
|
|||
|
Settlement of forward-starting interest rate swaps
|
(2.9
|
)
|
—
|
|
—
|
|
|||
|
Changes in operating assets and liabilities (net of effect of businesses acquired):
|
|||||||||
|
Trade accounts receivable
|
(13.0
|
)
|
(21.0
|
)
|
15.6
|
|
|||
|
Inventories
|
44.6
|
|
(39.0
|
)
|
(18.0
|
)
|
|||
|
Trade accounts payable
|
98.2
|
|
47.0
|
|
40.4
|
|
|||
|
Other assets and liabilities
|
6.8
|
|
94.5
|
|
(2.4
|
)
|
|||
|
Dividends received from unconsolidated affiliates
|
23.6
|
|
37.4
|
|
30.9
|
|
|||
|
Net cash provided by operating activities
|
815.3
|
|
658.1
|
|
590.0
|
|
|||
|
Investing activities
|
|||||||||
|
Acquisitions of businesses (net of cash acquired)
|
(4,327.4
|
)
|
(120.6
|
)
|
(210.9
|
)
|
|||
|
Proceeds from exit of consolidated joint venture (net of cash paid of $0.9)
|
—
|
|
4.2
|
|
—
|
|
|||
|
Capital expenditures
|
(182.4
|
)
|
(153.8
|
)
|
(128.4
|
)
|
|||
|
Proceeds from sale of property, plant and equipment
|
1.1
|
|
1.7
|
|
0.4
|
|
|||
|
Proceeds from insurance
|
0.4
|
|
1.4
|
|
—
|
|
|||
|
Net cash used in investing activities
|
(4,508.3
|
)
|
(267.1
|
)
|
(338.9
|
)
|
|||
|
Financing activities
|
|||||||||
|
Short-term borrowings, net
|
(134.6
|
)
|
251.7
|
|
(127.4
|
)
|
|||
|
Long-term debt borrowings
|
3,989.6
|
|
6.0
|
|
247.0
|
|
|||
|
Payment of debt issuance costs
|
(7.7
|
)
|
—
|
|
—
|
|
|||
|
Long-term debt repayments
|
(272.7
|
)
|
(202.0
|
)
|
(1.6
|
)
|
|||
|
Proceeds from exercised stock options
|
29.5
|
|
36.8
|
|
38.4
|
|
|||
|
Taxes withheld and paid on employee stock awards
|
(5.8
|
)
|
(3.5
|
)
|
(5.3
|
)
|
|||
|
Payment of contingent consideration
|
(19.7
|
)
|
—
|
|
—
|
|
|||
|
Purchase of minority interest
|
(1.2
|
)
|
—
|
|
—
|
|
|||
|
Issuance of common stock non-voting (net of issuance costs of $0.9)
|
554.0
|
|
—
|
|
—
|
|
|||
|
Common stock acquired by purchase
|
(137.8
|
)
|
(242.7
|
)
|
(145.8
|
)
|
|||
|
Dividends paid
|
(237.6
|
)
|
(217.8
|
)
|
(204.9
|
)
|
|||
|
Net cash provided by (used in) financing activities
|
3,756.0
|
|
(371.5
|
)
|
(199.6
|
)
|
|||
|
Effect of exchange rate changes on cash and cash equivalents
|
5.4
|
|
(13.7
|
)
|
(16.2
|
)
|
|||
|
Increase in cash and cash equivalents
|
68.4
|
|
5.8
|
|
35.3
|
|
|||
|
Cash and cash equivalents at beginning of year
|
118.4
|
|
112.6
|
|
77.3
|
|
|||
|
Cash and cash equivalents at end of year
|
$
|
186.8
|
|
$
|
118.4
|
|
$
|
112.6
|
|
See Notes to Consolidated Financial Statements.
CONSOLIDATED STATEMENTS OF SHAREHOLDERS’ EQUITY
|
(millions)
|
Common Stock Shares
|
Common Stock
Non-Voting Shares
|
Common Stock Amount
|
Retained Earnings
|
Accumulated Other Comprehensive (Loss) Income
|
Non-controlling Interests
|
Total Shareholders’ Equity
|
||||||||||||
|
Balance, November 30, 2014
|
12.0
|
|
116.4
|
|
$
|
995.6
|
|
$
|
982.6
|
|
$
|
(186.0
|
)
|
$
|
17.2
|
|
$
|
1,809.4
|
|
|
Net income
|
—
|
|
401.6
|
|
—
|
|
—
|
|
401.6
|
|
|||||||||
|
Net income attributable to non-controlling interest
|
—
|
|
—
|
|
—
|
|
0.5
|
|
0.5
|
|
|||||||||
|
Other comprehensive income (loss), net of tax
|
—
|
|
—
|
|
(220.1
|
)
|
(1.0
|
)
|
(221.1
|
)
|
|||||||||
|
Dividends
|
—
|
|
(208.2
|
)
|
—
|
|
—
|
|
(208.2
|
)
|
|||||||||
|
Stock-based compensation
|
18.7
|
|
—
|
|
—
|
|
—
|
|
18.7
|
|
|||||||||
|
Shares purchased and retired
|
(0.2
|
)
|
(1.8
|
)
|
(16.2
|
)
|
(139.3
|
)
|
—
|
|
—
|
|
(155.5
|
)
|
|||||
|
Shares issued, including tax benefit of $5.5
|
0.8
|
|
0.1
|
|
41.5
|
|
—
|
|
—
|
|
—
|
|
41.5
|
|
|||||
|
Equal exchange
|
(0.9
|
)
|
0.9
|
|
—
|
|
—
|
|
—
|
|
—
|
|
—
|
|
|||||
|
Balance, November 30, 2015
|
11.7
|
|
115.6
|
|
$
|
1,039.6
|
|
$
|
1,036.7
|
|
$
|
(406.1
|
)
|
$
|
16.7
|
|
$
|
1,686.9
|
|
|
Net income
|
—
|
|
472.3
|
|
—
|
|
—
|
|
472.3
|
|
|||||||||
|
Net income attributable to non-controlling interest
|
—
|
|
—
|
|
—
|
|
(1.3
|
)
|
(1.3
|
)
|
|||||||||
|
Other comprehensive income (loss), net of tax
|
—
|
|
—
|
|
(108.3
|
)
|
(1.8
|
)
|
(110.1
|
)
|
|||||||||
|
Dividends
|
—
|
|
(222.0
|
)
|
—
|
|
—
|
|
(222.0
|
)
|
|||||||||
|
Dividends attributable to non-controlling interest
|
—
|
|
—
|
|
—
|
|
(0.6
|
)
|
(0.6
|
)
|
|||||||||
|
Exit from consolidated joint venture
|
—
|
|
—
|
|
—
|
|
(1.5
|
)
|
(1.5
|
)
|
|||||||||
|
Stock-based compensation
|
25.6
|
|
—
|
|
—
|
|
—
|
|
25.6
|
|
|||||||||
|
Shares purchased and retired
|
(0.2
|
)
|
(2.5
|
)
|
(19.9
|
)
|
(230.2
|
)
|
—
|
|
—
|
|
(250.1
|
)
|
|||||
|
Shares issued, including tax benefit of $8.1
|
0.6
|
|
0.1
|
|
38.9
|
|
—
|
|
—
|
|
—
|
|
38.9
|
|
|||||
|
Equal exchange
|
(0.7
|
)
|
0.7
|
|
—
|
|
—
|
|
—
|
|
—
|
|
—
|
|
|||||
|
(millions)
|
Common Stock Shares
|
Common Stock
Non-Voting Shares
|
Common Stock Amount
|
Retained Earnings
|
Accumulated Other Comprehensive (Loss) Income
|
Non-controlling Interests
|
Total Shareholders’ Equity
|
||||||||||||
|
Balance, November 30, 2016
|
11.4
|
|
113.9
|
|
$
|
1,084.2
|
|
$
|
1,056.8
|
|
$
|
(514.4
|
)
|
$
|
11.5
|
|
$
|
1,638.1
|
|
|
Net income
|
—
|
|
477.4
|
|
—
|
|
—
|
|
477.4
|
|
|||||||||
|
Net income attributable to non-controlling interest
|
—
|
|
—
|
|
—
|
|
1.6
|
|
1.6
|
|
|||||||||
|
Other comprehensive income (loss), net of tax
|
—
|
|
—
|
|
234.9
|
|
(0.4
|
)
|
234.5
|
|
|||||||||
|
Dividends
|
—
|
|
(247.0
|
)
|
—
|
|
—
|
|
(247.0
|
)
|
|||||||||
|
Buyout of minority interest
|
—
|
|
0.6
|
|
—
|
|
(1.7
|
)
|
(1.1
|
)
|
|||||||||
|
Stock-based compensation
|
23.9
|
|
—
|
|
—
|
|
—
|
|
23.9
|
|
|||||||||
|
Shares issued in connection with RB Foods acquisition
|
—
|
|
6.4
|
|
554.0
|
|
—
|
|
—
|
|
—
|
|
554.0
|
|
|||||
|
Shares purchased and retired
|
(0.4
|
)
|
(1.1
|
)
|
(23.8
|
)
|
(121.3
|
)
|
—
|
|
—
|
|
(145.1
|
)
|
|||||
|
Other shares issued
|
0.7
|
|
0.1
|
|
34.6
|
|
—
|
|
—
|
|
—
|
|
34.6
|
|
|||||
|
Equal exchange
|
(1.7
|
)
|
1.7
|
|
—
|
|
—
|
|
—
|
|
—
|
|
—
|
|
|||||
|
Balance, November 30, 2017
|
10.0
|
|
121.0
|
|
$
|
1,672.9
|
|
$
|
1,166.5
|
|
$
|
(279.5
|
)
|
$
|
11.0
|
|
$
|
2,570.9
|
|
NOTES TO CONSOLIDATED FINANCIAL STATEMENTS
1. SUMMARY OF SIGNIFICANT ACCOUNTING POLICIES
Consolidation
The financial statements include the accounts of our majority-owned or controlled subsidiaries and affiliates. Intercompany transactions have been eliminated. Investments in unconsolidated affiliates, over which we exercise significant influence, but not control, are accounted for by the equity method. Accordingly, our share of net income or loss of unconsolidated affiliates is included in net income.
Foreign Currency Translation
For majority-owned or controlled subsidiaries and affiliates, if located outside of the U.S., with functional currencies other than the U.S. dollar, asset and liability accounts are translated at the rates of exchange at the balance sheet date and the resultant translation adjustments are included in accumulated other comprehensive income (loss), a separate component of shareholders’ equity. Income and expense items are translated at average monthly rates of exchange. Gains and losses from foreign currency transactions of these majority-owned or controlled subsidiaries and affiliates
—
that is, transactions denominated in other than their functional currency
—
are included in net earnings.
Our unconsolidated affiliates located outside the U.S. generally use their local currencies as their functional currencies. The asset and liability accounts of those unconsolidated affiliates are translated at the rates of exchange at the balance sheet date, with the resultant translation adjustments included in accumulated other comprehensive income (loss) of those affiliates. Income and expense items of those affiliates are translated at average monthly rates of exchange. We record our ownership share of the net assets and accumulated other comprehensive income (loss) of our unconsolidated affiliates in our consolidated balance sheet on the lines entitled “Investments and other assets” and “Accumulated other comprehensive loss,” respectively. We record our ownership share of the net income of our unconsolidated affiliates in our consolidated income statement on the line entitled “Income from unconsolidated operations.”
Use of Estimates
Preparation of financial statements that follow accounting principles generally accepted in the U.S. requires us to make estimates and assumptions that affect the amounts reported in the financial statements and notes. Actual amounts could differ from these estimates.
Cash and Cash Equivalents
All highly liquid investments purchased with an original maturity of three months or less are classified as cash equivalents.
Inventories
Inventories are stated at the lower of cost or market. Cost is determined using standard or average costs which approximate the first-in, first-out costing method.
Property, Plant and Equipment
Property, plant and equipment is stated at historical cost and depreciated over its estimated useful life using the straight-line method for financial reporting and both accelerated and straight-line methods for tax reporting. The estimated useful lives range from
20
to
50
years for buildings and
3
to
12
years for machinery, equipment and computer software. Repairs and maintenance costs are expensed as incurred.
We also capitalize costs of software developed or obtained for internal use. Capitalized software development costs include only (1) direct costs paid to others for materials and services to develop or buy the software, (2) payroll and payroll-related costs for employees who work directly on the software development project and (3) interest costs while developing the software. Capitalization of these costs stops when the project is substantially complete and ready for use. Software is amortized using the straight-line method over a range of
3
to
8
years, but not exceeding the expected life of the product. We capitalized
$12.8 million
,
$21.8 million
and
$9.4 million
of software development costs during 2017, 2016 and 2015, respectively.
Goodwill and Other Intangible Assets
We review the carrying value of goodwill and indefinite-lived intangible assets and conduct tests of impairment on an annual basis as described below. We also test goodwill for impairment if events or circumstances indicate it is more likely than not that the fair value of a reporting unit is below its carrying amount and test indefinite-lived intangible assets for impairment if events or changes in circumstances indicate that the asset might be impaired. Separable intangible assets that have finite useful lives are amortized over those lives.
Determining the fair value of a reporting unit or an indefinite-lived purchased intangible asset is judgmental in nature and involves the use of significant estimates and assumptions. These estimates and assumptions include revenue growth rates and operating margins used to calculate projected future cash flows, risk-adjusted discount rates, assumed royalty rates, future economic and market conditions and determination of appropriate market comparables. We base our fair value estimates on assumptions we believe to be reasonable but that are unpredictable and inherently uncertain. Actual future results may differ from these estimates.
Goodwill Impairment
Our reporting units used to assess potential goodwill impairment are the same as our business segments. We calculate fair value of a reporting unit by using a discounted cash flow model and then compare that to the carrying amount of the reporting unit, including intangible assets and goodwill. If the carrying amount of the reporting unit exceeds the calculated fair value, then we would determine the implied fair value of the reporting unit’s goodwill. An impairment charge would be recognized to the extent the carrying amount of goodwill exceeds the implied fair value.
Indefinite-lived Intangible Asset Impairment
Our indefinite-lived intangible assets consist of brand names and trademarks. We calculate fair value by using a relief-from-royalty method or discounted cash flow model and then compare that to the carrying amount of the indefinite-lived intangible asset. If the carrying amount of the indefinite-lived intangible asset exceeds its fair value, an impairment charge would be recorded to the extent the recorded indefinite-lived intangible asset exceeds the fair value.
Long-lived Asset Impairment
Fixed assets and amortizable intangible assets are reviewed for impairment as events or changes in circumstances occur indicating that the carrying value of the asset may not be recoverable. Undiscounted cash flow analyses are used to determine if an impairment exists. If an impairment is determined to exist, the loss is calculated based on estimated fair value.
Revenue Recognition
We recognize revenue when we have an agreement with the customer
—
upon either shipment or delivery, depending upon contractual terms
—
and when the sales price is fixed or determinable and collectability is reasonably assured. We reduce revenue for estimated product returns, allowances and price discounts based on historical experience and contractual terms.
Trade allowances, consisting primarily of customer pricing allowances and rebates, merchandising funds and consumer coupons, are offered through various programs to customers and consumers. Revenue is recorded net of trade allowances.
Trade accounts receivable are amounts billed and currently due from customers. We have an allowance for doubtful accounts to reduce our receivables to their net realizable value. We estimate the allowance for doubtful accounts based on the aging of our receivables and our history of collections.
Shipping and Handling
Shipping and handling costs on our products sold to customers are included in selling, general and administrative expense in the income statement. Shipping and handling expense was
$115.4 million
,
$97.2 million
and
$95.8 million
for
2017
,
2016
and
2015
, respectively.
Research and Development
Research and development costs are expensed as incurred and are included in selling, general and administrative expense in the income statement. Research and development expense was
$66.1 million
,
$61.0 million
and
$60.8 million
for
2017
,
2016
and
2015
, respectively.
Brand Marketing Support
Total brand marketing support costs, which are included in selling, general and administrative expense in the income statement, were
$276.3 million
,
$252.2 million
and
$240.6 million
for
2017
,
2016
and
2015
, respectively. Brand marketing support costs include advertising, promotions and customer trade funds used for cooperative advertising. Promotion costs include public relations, shopper marketing, social marketing activities, general consumer promotion activities and depreciation on assets used in these promotional activities. Advertising costs include the development, production and communication of advertisements through television, digital, print and radio. Development and production costs are expensed in the period in which the advertisement is first run. All other
costs of advertisement are expensed as incurred. Advertising expense was
$117.8 million
,
$102.9 million
and
$106.8 million
for
2017
,
2016
and
2015
, respectively.
Employee Benefit and Retirement Plans
We sponsor defined benefit pension plans in the U.S. and certain foreign locations. In addition, we sponsor defined contribution plans in the U.S. We contribute to defined contribution plans in locations outside the U.S., including government-sponsored retirement plans. We also currently provide postretirement medical and life insurance benefits to certain U.S. employees and retirees.
We recognize the overfunded or underfunded status of our defined benefit pension plans as an asset or a liability in the balance sheet, with changes in the funded status recorded through other comprehensive income in the year in which those changes occur.
The expected return on plan assets is determined using the expected rate of return and a calculated value of plan assets referred to as the market-related value of plan assets. Differences between assumed and actual returns are amortized to the market-related value of assets on a straight-line basis over
five
years.
We use the corridor approach in the valuation of defined benefit pension and postretirement benefit plans. The corridor approach defers all actuarial gains and losses resulting from variances between actual results and actuarial assumptions. Those unrecognized gains and losses are amortized when the net gains and losses exceed
10%
of the greater of the market-related value of plan assets or the projected benefit obligation at the beginning of the year. The amount in excess of the corridor is amortized over the average remaining service period to retirement date of active plan participants.
Accounting Pronouncements Adopted in 2017
In March 2016, the Financial Accounting Standards Board (FASB) issued ASU No. 2016-09
Compensation
—
Stock Compensation (Topic 718): Improvements to Employee Share-Based Payment Accounting,
which changes the accounting for certain aspects of share-based payments to employees. The new guidance requires, among its other provisions, that excess tax benefits (which represent the excess of actual tax benefits received at the date of vesting or settlement over the benefits recognized over the vesting period or upon issuance of share-based payments) and tax deficiencies (which represent the amount by which actual tax benefits received at the date of vesting or settlement is lower than the benefits recognized over the vesting period or upon issuance of share-based payments) be recorded in the income statement as an increase or decrease in income taxes when the awards vest or are settled. This is in comparison to the prior requirement that these excess tax benefits be recognized in additional paid-in capital and these tax deficiencies be recognized either as an offset to accumulated excess tax benefits, if any, or in the income statement. The new guidance also requires excess tax benefits to be classified, together with other income tax cash flows, as an operating activity in the cash flow statement rather than, as previously required, a financing activity. The new guidance is effective for the first quarter of our fiscal year ending November 30, 2018, with early adoption permitted.
We have elected to early adopt ASU No. 2016-09 effective December 1, 2016 on a prospective basis, where permitted by the new standard. As a result of this adoption:
|
•
|
We recognized discrete tax benefits of
$10.7 million
in the income taxes line item of our consolidated income statement for the year ended November 30, 2017 related to excess tax benefits upon vesting or settlement in that period.
|
|
•
|
We elected to adopt the cash flow presentation of the excess tax benefits prospectively, commencing with our cash flow statements for periods beginning after November 30, 2016, where these benefits are classified, together with other income tax cash flows, as an operating activity.
|
|
•
|
We have elected to continue to estimate the number of stock-based awards expected to vest, rather than electing to account for forfeitures as they occur to determine the amount of compensation cost to be recognized in each period.
|
|
•
|
At this time, we have not changed our policy on statutory withholding requirements and will continue to allow an employee to withhold at the minimum statutory withholding rate. Amounts paid by us to taxing authorities when directly withholding shares associated with employees’ income tax withholding obligations are classified as a financing activity in our cash flow statement for 2017. ASU No. 2016-09 requires that this cash flow presentation be made retrospectively and our cash flow statements for 2016 and 2015 have been restated accordingly.
|
|
•
|
We excluded the excess tax benefits from the assumed proceeds available to repurchase shares in the computation of our diluted earnings per share for 2017.
|
Recently Issued Accounting Pronouncements — Pending Adoption
In August 2017, the FASB issued ASU No. 2017-12
Derivatives and Hedging (Topic 815)
—
Targeted Improvements to Accounting for Hedging Activities.
This guidance eliminates the requirement to separately measure and report hedge ineffectiveness and generally requires, for qualifying hedges, the entire change in the fair value of a hedging instrument to be presented in the same income statement line as the hedged item. The guidance also modifies the accounting for components excluded from the assessment of hedge effectiveness, eases documentation and assessment requirements and modifies certain disclosure requirements. The new standard will be effective for the first quarter of our fiscal year ending November 30, 2020. Early adoption is permitted in any interim period or fiscal year before the effective date for all entities. If the guidance is early adopted in an interim period, any adjustments would be reflected as of the beginning of the fiscal year that includes that interim period. We have not yet determined the impact from adoption of this new accounting pronouncement on our financial statements.
In March 2017, the FASB issued ASU No. 2017-07
Compensation-Retirement Benefits (Topic 715)
—
Improving the Presentation of Net Periodic Pension Cost and Net Periodic Postretirement Benefit Cost.
This guidance revises how employers that sponsor defined benefit pension and other postretirement plans present the net periodic benefit cost in their income statement. Under the new standard, the service cost component of net periodic benefit cost will continue to be presented in the same income statement line items as other employee compensation costs from services rendered during the period. The other components of the net periodic benefit cost must be presented separately from the line items that include the service cost and outside of any subtotal of operating income in the income statement. Of the components of net periodic benefit cost, only the service cost component will be eligible for asset capitalization. The new standard will be effective for the first quarter of our fiscal year ending November 30, 2019. The changes in presentation will be applied retrospectively when adopted, while the change related to amounts capitalized in assets will be applied prospectively. We have not yet determined the impact from adoption of this new accounting pronouncement on our financial statements.
In January 2017, the FASB issued ASU No. 2017-04
Intangibles
—
Goodwill and Other Topics (Topic 350)
—
Simplifying the Test for Goodwill Impairment.
This guidance eliminates the requirement to calculate the implied fair value of goodwill of a reporting unit to measure a goodwill impairment charge. Instead, a company will record an impairment charge based on the excess of a reporting unit's carrying amount over its fair value. The new standard will be effective for the first quarter of our fiscal year ending November 30, 2021. Early adoption is permitted for all entities for annual and interim goodwill impairment testing dates after January 1, 2017. We have not yet determined the impact from adoption of this new accounting pronouncement on our financial statements.
In January 2017, the FASB issued ASU No. 2017-01
Business Combinations (Topic 805)
—
Clarifying the Definition of a Business.
This guidance changes the definition of a business to assist entities in evaluating when a set of transferred assets and activities constitutes a business. The guidance requires an entity to evaluate if substantially all of the fair value of the gross assets acquired is concentrated in a single identifiable asset or a group of similar identifiable assets; if so, the set of transferred assets and activities is not a business. The guidance also requires a business to include at least one substantive process and narrows the definition of outputs by more closely aligning it with how outputs are described in Accounting Standards Codification (ASC 606)
Revenue from Contracts with Customers.
The new standard will be effective for the first quarter of our fiscal year ending November 30, 2019. Early adoption is permitted for all entities. We have not yet determined the impact from adoption of this new accounting pronouncement on our financial statements.
In February 2016, the FASB issued ASU No. 2016-02
Leases (Topic 842).
This guidance revises existing practice related to accounting for leases under Accounting Standards Codification Topic 840
Leases
(ASC 840) for both lessees and lessors. Our leases principally relate to: (i) certain real estate, including that related to a number of administrative, distribution and manufacturing locations; (ii) certain machinery and equipment, including a corporate airplane and automobiles; and (iii) certain software. In addition, in 2016, we entered into a 15-year lease for a headquarters building, which is expected to commence upon completion of building construction and fit-out, currently scheduled for the second half of 2018. The new guidance in ASU No. 2016-02 requires lessees to recognize a right-of-use asset and a lease liability for virtually all of their leases (other than leases that meet the definition of a short-term lease). The lease liability will be equal to the present value of lease payments and the right-of-use asset will be based on the lease liability, subject to adjustment such as for initial direct costs. For income statement purposes, the new standard retains a dual model similar to ASC 840, requiring leases to be classified as either operating or finance. For lessees, operating leases will result in straight-line expense (similar to
current accounting by lessees for operating leases under ASC 840) while finance leases will result in a front-loaded expense pattern (similar to current accounting by lessees for capital leases under ASC 840). The new standard will be effective for the first quarter of our fiscal year ending November 30, 2020. Early adoption is permitted for all entities. We have not yet determined the impact from adoption of this new accounting pronouncement on our financial statements.
In July 2015, the FASB issued Accounting Standards Update No. 2015-11
Simplifying the Measurement of Inventory (Topic 330).
This guidance is intended to simplify the subsequent measurement of inventories by replacing the current lower of cost or market test with a lower of cost and net realizable value test. It will be effective for the first quarter of our fiscal year ending November 30, 2018. We do not expect the adoption of this new accounting pronouncement to have a material impact on our financial statements.
In May 2014, the FASB issued ASU No. 2014-09
Revenue from Contracts with Customers (Topic 606)
. This guidance is intended to improve
—
and converge with international standards
—
the financial reporting requirements for revenue from contracts with customers. The new standard will be effective for the first quarter of our fiscal year ending November 30, 2019. Early adoption is permitted for all entities, but not before the original effective date for public business entities (that is, annual reporting periods beginning after December 15, 2016 or our fiscal year ending November 30, 2018). We do not expect to early adopt this new accounting pronouncement. In preparation for our adoption of the new standard in our fiscal year ending November 30, 2019, we have obtained representative samples of contracts and other forms of agreements with our customers in the U.S. and international locations and are evaluating the provisions contained therein in light of the five-step model specified by the new guidance. That five-step model includes: (1) determination of whether a contract
—
an agreement between two or more parties that creates legally enforceable rights and obligations
—
exists; (2) identification of the performance obligations in the contract; (3) determination of the transaction price; (4) allocation of the transaction price to the performance obligations in the contract; and (5) recognition of revenue when (or as) the performance obligation is satisfied. We are also evaluating the impact of the new standard on certain common practices currently employed by us and by other manufacturers of consumer products, such as slotting fees, co-operative advertising, rebates and other pricing allowances, merchandising funds and consumer coupons. We have not yet determined the impact of the new standard on our financial statements or whether we will adopt on a prospective or retrospective basis in the first quarter of our fiscal year ending November 30, 2019.
2. ACQUISITIONS
Acquisitions are part of our strategy to increase sales and profits.
Acquisition of RB Foods
On August 17, 2017, we completed the acquisition of Reckitt Benckiser's Food Division ("RB Foods") from Reckitt Benckiser Group plc. The purchase price was approximately
$4.21 billion
, is net of acquired cash of
$24.3 million
, and included a preliminary working capital adjustment of
$11.2 million
. In December 2017, we paid an additional
$4.2 million
associated with the final working capital adjustment. The acquisition was funded through our issuance of approximately
6.35 million
shares of common stock non-voting (see note 13) and through new borrowings comprised of senior unsecured notes and pre-payable term loans (see note 6). The acquired market-leading brands of RB Foods include French’s
®
,
Frank’s RedHot
®
and Cattlemen’s
®
, which are a natural strategic fit with our robust global branded flavor portfolio. We believe that these additions move us to a leading position in the attractive U.S. Condiments category and provide significant international growth opportunities for our consumer and industrial segments. At the time of the acquisition, annual sales of RB Foods were approximately
$570 million
. The transaction was accounted for under the acquisition method of accounting and, accordingly, the results of RB Foods’ operations are included in our consolidated financial statements as a component of our consumer and industrial segments from the date of acquisition.
The purchase price of RB Foods was preliminarily allocated to the underlying assets acquired and liabilities assumed based upon their estimated fair values at the date of acquisition. We estimated the fair values based on in-process independent valuations, discounted cash flow analyses, quoted market prices, and estimates made by management, a number of which are subject to finalization. The allocation of the purchase price will be finalized within the allowable measurement period. The preliminary allocation, net of cash acquired, of the fair value of the RB Foods acquisition is summarized in the table below (in millions):
|
Trade accounts receivable
|
$
|
36.9
|
|
|
Inventories
|
68.8
|
|
|
|
Property, plant and equipment
|
33.1
|
|
|
|
Goodwill
|
2,546.3
|
|
|
|
Intangible assets
|
2,595.0
|
|
|
|
Other assets
|
4.4
|
|
|
|
Trade accounts payable
|
(65.5
|
)
|
|
|
Other accrued liabilities
|
(35.4
|
)
|
|
|
Deferred taxes
|
(954.8
|
)
|
|
|
Other long-term liabilities
|
(23.1
|
)
|
|
|
Total
|
$
|
4,205.7
|
|
The preliminary fair value of intangible assets was determined using income methodologies. We valued trademarks using the relief from royalty method, an income approach. For customer relationships, we used the distributor method, a variation of the excess earnings method that uses distributor-based inputs for margins and contributory asset charges. Some of the more significant assumptions inherent in developing the preliminary valuations included the estimated annual net cash flows for each indefinite-lived or definite-lived intangible asset (including net sales, cost of products sold, selling and marketing costs, and working capital/contributory asset charges), the discount rate that appropriately reflects the risk inherent in each future cash flow stream, the assessment of each asset’s life cycle, and competitive trends, as well as other factors. We determined the assumptions used in the financial forecasts using historical data, supplemented by current and anticipated market conditions, estimated product category growth rates, management plans, and market comparables.
We valued finished goods and work-in-process inventory using a net realizable value approach, which resulted in a step-up of
$20.9 million
that was recognized in cost of goods sold in 2017 as the related inventory was sold. Raw materials and packaging inventory was valued using the replacement cost approach.
The preliminary fair value of property, plant and equipment was determined using a combination of the income approach, the market approach and the cost approach, which is based on current replacement and/or reproduction cost of the asset as new, less depreciation attributable to physical, functional, and economic factors.
Deferred income tax assets and liabilities represent the expected future tax consequences of temporary differences between the fair values of the assets acquired and liabilities assumed and their tax bases.
We used carrying values to value trade receivables and payables, as well as certain other current and non-current assets and liabilities, as we determined that they represented the fair value of those items.
The preliminary valuation of the acquired net assets of RB Foods includes
$2,475.0 million
allocated to indefinite-lived brand assets and
$120.0 million
allocated to definite-lived intangible assets with a weighted-average life of
15 years
. As a result of the acquisition, we recognized a total of
$2,546.3 million
of goodwill. That goodwill, which is not deductible for tax purposes, primarily represents the intangible assets that do not qualify for separate recognition, such as the value of leveraging our brand building expertise, our insights in demand from consumer and industrial customers for value-added flavor solutions, and our supply chain capabilities, as well as expected synergies from the combined operations and assembled workforce. The final allocation of the fair value of the RB Foods acquisition, including the allocation of goodwill to our reporting units, which are the consumer and industrial segments, was not complete as of November 30, 2017, but will be finalized within the allowable measurement period. The results of RB Foods’ operations have been included in our consumer and industrial segments since its acquisition.
Total transaction and integration expenses related to the RB Foods acquisition are anticipated to approximate
$100 million
, of which approximately
$60 million
represent transaction expenses and the remainder represent estimated integration expenses. These costs are anticipated to be incurred through fiscal 2018 and primarily consist of the amortization of the acquisition-date fair value adjustment of inventories in the amount of
$20.9 million
that is included in cost of goods sold for 2017; outside advisory, service and consulting costs; employee-related costs; and other costs related to the acquisition, including the costs of
$15.4 million
related to the Bridge financing commitment that is included in other debt costs for 2017. Of the total anticipated transaction and integration expenses, we
incurred
$77.1 million
in 2017 and expect to incur the balance in fiscal 2018. The following are the transaction and integration expenses that we have recorded in 2017 related to the RB Foods acquisition (in millions):
|
Transaction expenses included in cost of goods sold
|
$
|
20.9
|
|
|
Transaction expenses included in other debt costs
|
15.4
|
|
|
|
Other transaction expenses
|
23.2
|
|
|
|
Integration expenses
|
17.6
|
|
|
|
Total
|
$
|
77.1
|
|
RB Foods added
$190.1 million
to our sales for 2017. The impact of RB Foods on our 2017 consolidated income before taxes, including the effect of the transaction and integration expenses previously noted, and financing costs was a loss of approximately
$42 million
.
The following unaudited pro forma information presents consolidated financial information as if RB Foods had been acquired at the beginning of fiscal 2016. Interest expense has been adjusted to reflect the debt issued to finance the acquisition as though that debt had been outstanding at December 1, 2015. The pro forma results reflect amortization expense of approximately
$8.0 million
for each period presented, relating to definite-lived intangible assets recorded based upon preliminary third party valuations. The pro forma results for 2016 also include transaction and integration costs of
$40.8 million
,
$20.9 million
of amortization of the acquisition-date fair value adjustment of inventories, and
$15.4 million
associated with the Bridge financing commitment, all assuming that the acquisition had occurred as of December 1, 2015. The pro forma results for 2017 exclude the previously noted items, as they have been included, on a pro forma basis, in the results for 2016. The pro forma adjustments previously noted have been adjusted for the applicable income tax impact. Basic and diluted shares outstanding have been adjusted to reflect the issuance of
6.35 million
shares of our common stock non-voting to partially finance the acquisition.
|
(in millions, except per share data)
|
Year ended November 30,
|
||||||
|
|
2017
|
2016
|
|||||
|
(Unaudited)
|
|||||||
|
Net sales
|
$
|
5,209.0
|
|
$
|
4,969.3
|
|
|
|
Net income
|
548.7
|
|
465.5
|
|
|||
|
Earnings per share – basic
|
$
|
4.19
|
|
$
|
3.50
|
|
|
|
Earnings per share – diluted
|
4.14
|
|
3.46
|
|
|||
These unaudited pro forma consolidated results are not adjusted for changes in the business that will take place subsequent to our acquisition, including, but not limited to, additional transaction and integration costs that may be incurred. Accordingly, the above unaudited pro forma results are not necessarily indicative of the results that actually would have occurred if the acquisition had been completed as of December 1, 2015, nor are they indicative of future consolidated results.
Other Acquisitions
On May 5, 2017, we purchased the remaining
15%
ownership interest in our joint venture, Kohinoor Specialty Foods India Private Limited (Kohinoor) in India for a cash payment of
$1.6 million
, of which
$1.2 million
was paid in 2017 and the balance is expected to be paid in the fourth quarter of 2018. In September 2011, when we originally entered this joint venture, we invested
$113.0 million
for an 85% interest in Kohinoor. In conjunction with our purchase of the
15%
minority interest in 2017, we have eliminated the minority interest in Kohinoor and recorded an adjustment of
$0.6 million
in retained earnings of our shareholders' equity section of our consolidated balance sheet. The
$1.2 million
payment is reflected in the financing activities section of our consolidated cash flow statement for 2017.
On December 15, 2016, we purchased 100% of the shares of Enrico Giotti SpA (Giotti), a leading European flavor manufacturer located in Italy, for a purchase price of
$123.8 million
(net of cash acquired of
$1.2 million
), including the effect of a
$0.2 million
favorable net working capital adjustment. The acquisition was funded with cash and short-term borrowings. Giotti is well known in the industry for its innovative beverage, sweet, savory and dairy flavor applications. At the time of the acquisition, annual sales of Giotti were approximately
€53 million
. Our acquisition of
Giotti in fiscal 2017 expands the breadth of value-added products for McCormick's industrial segment, including additional expertise in flavoring health and nutrition products. During 2017, we completed the final valuation of the acquired net assets of Giotti that resulted in
$7.0 million
allocated to net tangible assets acquired,
$4.8 million
allocated to indefinite lived brand asset,
$31.5 million
allocated to definite-lived intangible assets with a weighted-average life of
11.9 years
and
$80.5 million
allocated to goodwill. Goodwill related to the Giotti acquisition, which is not deductible for tax purposes, primarily represents the intangible assets that do not qualify for separate recognition, such as the value of leveraging the customer intimacy and value-added flavor solutions we provide to our industrial customers to Giotti’s relationships with industrial customers of their flavors solutions and extracts, as well as from expected synergies from the combined operations and assembled workforces, and the future development initiatives of the assembled workforces. Giotti has been included in our industrial segment since its acquisition.
On September 1, 2016, we acquired a small niche business for
$4.4 million
. That business, Cajun Injector, whose annual sales were approximately
$5 million
at the time of acquisition, sells injectable marinades, along with seasonings and fry mixes that feature New Orleans flavors. Cajun Injector, which has been included in our consumer segment since its acquisition, complements our Zatarain’s brand.
On April 19, 2016, we completed the purchase of 100% of the shares of Botanical Food Company, Pty Ltd, owner of the Gourmet Garden brand of packaged herbs (Gourmet Garden), a privately held company based in Australia. Gourmet Garden is a global market leader in chilled convenient packaged herbs. Gourmet Garden's products complement our existing branded herb portfolio with the addition of chilled convenient herbs located in the perimeter of the grocery store. We plan to drive sales of the Gourmet Garden brand by expanding global distribution and building awareness with increased brand investment. At the time of acquisition, annual sales of Gourmet Garden were approximately
70 million
Australian dollars. The purchase price was
$116.2 million
, net of cash acquired of
$3.3 million
and after closing adjustments, and was financed with a combination of cash and short-term borrowings. That purchase price reflects a
$1.9 million
favorable net working capital adjustment that was received in the third quarter of 2016. During 2017, we completed the final valuation of the Gourmet Garden acquisition which resulted in the following changes from the preliminary valuation to the acquired assets and liabilities: (i) the indefinite-lived brand asset increased by
$7.3 million
to
$27.6 million
; (ii) definite-lived intangible assets increased by
$4.7 million
to
$18.9 million
(with a weighted-average life of
14.2 years
); (iii) net tangible assets (net of liabilities assumed, including the deferred tax liabilities associated with identified intangible assets) acquired decreased by
$4.4 million
to
$16.0 million
; (iv) goodwill decreased by
$7.6 million
to
$53.7 million
. There was no material change to amortization expense as a result of these changes in the final valuation. Goodwill related to the Gourmet Garden acquisition, which is not deductible for tax purposes, primarily represents the intangible assets that do not qualify for separate recognition, such as the value of leveraging our brand-building expertise, our insights in demand from consumers for herbs, and our supply chain capabilities, as well as expected synergies from the combined operations and assembled workforce. Gourmet Garden has been included in our consumer segment since its acquisition. While this business has an industrial component, the industrial component was not material to its overall business in 2016. Beginning in 2017, the industrial component of Gourmet Garden is being reflected as a component of our industrial segment.
On August 20, 2015, we completed the purchase of 100% of the shares of One World Foods, Inc., owner of the Stubb's brand of barbeque products (Stubb's), a privately held company located in Austin, Texas. Stubb's is a leading premium barbeque sauce brand in the U.S. In addition to sauces, Stubb's products include marinades, rubs and skillet sauces. Its addition expanded the breadth of value-added products in our consumer segment. At the time of acquisition, annual sales of Stubb's were approximately
$30 million
. The purchase price for Stubb's was
$99.4 million
, net of cash acquired of
$0.8 million
, and was financed with a combination of cash and short-term borrowings. During 2016, we completed the final valuation of the Stubb's acquisition, which resulted in the following changes from the preliminary valuation to the acquired assets and liabilities: (i) the indefinite-lived brand asset increased by
$13.8 million
to
$27.1 million
; (ii) definite-lived intangible assets increased by
$11.9 million
to
$24.4 million
(with a weighted-average life of
13.9 years
); (iii) tangible assets acquired increased by
$0.3 million
to
$5.7 million
; (iv) liabilities assumed (including the deferred tax liabilities associated with identified intangible assets) increased by
$7.0 million
to
$19.4 million
; and (v) goodwill decreased by
$19.0 million
to
$61.6 million
. As a result of these changes in the final valuation, additional amortization expense for definite-lived intangible assets of
$0.9 million
was recorded for the year ended November 30, 2016. Goodwill related to the Stubb's acquisition, which is not deductible for tax purposes, primarily represents the intangible assets that do not qualify for separate recognition, such as the value of leveraging our brand building expertise, our insights in demand from consumers for unique and authentic barbeque and grilling flavors, and our supply chain capabilities, as well as expected synergies from the combined operations and assembled workforce.
On May 29, 2015, we completed the purchase of 100% of the shares of Drogheria & Alimentari (D&A), a privately held company based in Italy, and a leader of the spice and seasoning category in Italy that supplies both branded and private label products to consumers. This acquisition complemented our strong brands and expanded our current spice and seasoning leadership in Europe with a sizable footprint in Italy. The purchase price for D&A consisted of a cash payment of
$49.0 million
, net of cash acquired of
$2.8 million
, and was financed with a combination of cash and short-term borrowings. In addition, the purchase agreement called for a potential earn out payment in 2018 of up to
€35 million
, based upon the performance of the acquired business in 2017. This potential earn-out payment had an acquisition-date fair value of
$27.7 million
(or approximately
€25 million
), based on estimates of projected performance in 2017 and discounted using a probability-weighted approach. During 2017, we reached agreement with the sellers to settle the contingent consideration liability prior to its contractual term for approximately
$29.3 million
(
€26.1 million
), with
$19.7 million
(
€17.6 million
) paid in 2017. We previously prepaid
€5.0 million
at the date of acquisition. The balance of the liability is expected to be paid early in 2018. Accordingly, during 2017, we recognized a
$1.6 million
gain on settlement in selling, general and administrative expense in our consolidated income statement. At the time of the acquisition, annual sales of D&A were approximately
€50 million
. D&A has been included in our consumer segment since its acquisition.
On March 9, 2015, we acquired 100% of the shares of Brand Aromatics, a privately held company located in the U.S. Brand Aromatics is a supplier of natural savory flavors, marinades, and broth and stock concentrates to the packaged food industry. Its addition expanded the breadth of value-added products in our industrial segment. The purchase price for Brand Aromatics was
$62.4 million
, net of post-closing adjustments and was financed with a combination of cash and short-term borrowings. At the time of acquisition, annual sales of Brand Aromatics were approximately
$30 million
. Brand Aromatics has been included in our industrial segment since its acquisition.
Transaction-related expenses include third party expenses related to commercial and legal due diligence for unconsummated and completed acquisitions as well as third party expenses related to accounting, legal and financing activities with respect to completed acquisitions. Transaction-related expenses associated with the above acquisitions, excluding amounts related to the RB Foods acquisition that are separately classified in our consolidated income statement, are included in selling, general and administrative expense in our consolidated income statement and totaled
$2.9 million
,
$5.5 million
and
$3.6 million
for 2017, 2016 and 2015, respectively.
In 2017, Giotti added
$66.5 million
and Gourmet Garden added
$27.3 million
to our sales for the year and first four months of fiscal 2017, respectively. Due to financing, acquisition and integration costs, the aggregate incremental operating income contributed by Giotti and Gourmet Garden was not significant to our overall results for 2017. Pro forma financial information for our other acquisitions has not been presented because the financial impact is not material.
3. SPECIAL CHARGES
In our consolidated income statement, we include a separate line item captioned “special charges” in arriving at our consolidated operating income. Special charges consist of expenses, including related impairment charges, associated with certain actions undertaken to reduce fixed costs, simplify or improve processes, and improve our competitiveness and are of such significance in terms of both up-front costs and organizational/structural impact to require advance approval by our Management Committee, comprised of our senior management, including our Chairman, President and Chief Executive Officer. Upon presentation of any such proposed action (generally including details with respect to estimated costs, which typically consist principally of employee severance and related benefits, together with ancillary costs associated with the action that may include a non-cash component, such as an asset impairment, or a component which relates to inventory adjustments that are included in cost of goods sold; impacted employees or operations; expected timing; and expected savings) to the Management Committee and the Committee’s advance approval, expenses associated with the approved action are classified as special charges upon recognition and monitored on an on-going basis through completion. Certain ancillary expenses related to these actions approved by our Management Committee do not qualify for accrual upon approval but are included as special charges as incurred during the course of the actions.
The following is a summary of special charges recognized in 2017, 2016 and 2015 (in millions):
|
|
2017
|
2016
|
2015
|
||||||||
|
Special charges included in cost of goods sold
|
$
|
—
|
|
$
|
0.3
|
|
$
|
4.0
|
|
||
|
Other special charges in the income statement
(1)
|
22.2
|
|
15.7
|
|
61.5
|
|
|||||
|
Total special charges
|
$
|
22.2
|
|
$
|
16.0
|
|
$
|
65.5
|
|
||
|
(1)
|
Included in special charges for 2017 is a non-cash fixed asset impairment charge of
$0.5 million
. Included in special charges for 2016 is a non-cash goodwill impairment charge of
$2.6 million
recognized upon the exit of a consolidated joint venture. Included in special charges for 2015 are non-cash brand impairment charges of
$9.6 million
and non-cash fixed asset impairment charges of
$1.1 million
.
|
The following is a summary of special charges by business segments in 2017, 2016 and 2015 (in millions):
|
|
2017
|
2016
|
2015
|
||||||||
|
Consumer segment
|
$
|
15.3
|
|
$
|
9.2
|
|
$
|
52.8
|
|
||
|
Industrial segment
|
6.9
|
|
6.8
|
|
12.7
|
|
|||||
|
Total special charges
|
$
|
22.2
|
|
$
|
16.0
|
|
$
|
65.5
|
|
||
We continue to evaluate changes to our organization structure to reduce fixed costs, simplify or improve processes, and improve our competitiveness.
During 2017, we recorded
$22.2 million
of special charges, consisting primarily of (i)
$12.7 million
related to third party expenses incurred associated with our evaluation of changes relating to our global enablement initiative, which is described below; (ii)
$2.8 million
related to employee severance benefits and other costs directly associated with the relocation of one of our Chinese manufacturing facilities; (iii)
$2.5 million
for severance and other exit costs associated with our Europe, Middle East, and Africa (EMEA) region’s closure of its manufacturing plant in Portugal in mid-2017; and (iv)
$1.7 million
related to employee severance benefits and other costs associated with action related to the transfer of certain manufacturing operations in our Asia/Pacific region to a new facility under construction in Thailand (which began in 2016).
Of the
$22.2 million
in special charges recorded during 2017, approximately
$19.0 million
were paid in cash and
$0.5 million
represented a non-cash asset impairment, with the remaining accrual expected to be paid in early 2018.
During 2017, our Management Committee approved a three-year initiative during which we expect to execute significant changes to our global processes, capabilities and operating model to provide a scalable platform for future growth. We expect this initiative to enable us to accelerate our ability to work globally and cross-functionally by aligning and simplifying processes throughout McCormick, in part building upon our current shared services foundation and expanding the end-to-end processes presently under that foundation. We expect this initiative, which we refer to as Global Enablement (GE), to enable this scalable platform for future growth while reducing costs, enabling faster decision making, increasing agility and creating capacity within our organization.
While we are continuing to fully develop the details of our GE operating model, we expect the cost of the GE initiative—to be recognized as “Special charges” in our consolidated income statement over its expected three-year course—to range from approximately
$55 million
to
$65 million
. Of that
$55 million
to
$65 million
, we estimate that two-thirds will be attributable to employee severance and related benefit payments and one-third will be attributable to cash payments associated with related costs of GE implementation and transition, including outside consulting and other costs directly related to the initiative. The GE initiative is expected to generate annual savings, ranging from approximately
$30 million
to
$40 million
, once all actions are implemented.
During 2016, we recorded
$16.0 million
of special charges, principally consisting of: (i)
$5.7 million
related to additional organization and streamlining actions associated with our EMEA region, which began in 2015; (ii)
$2.8 million
associated with the exit from our consolidated joint venture in South Africa, which is described below; (iii)
$1.9 million
for employee severance actions and other exit costs related to the discontinuance of non-profitable product lines of our Kohinoor business in India, which began in 2015 and is further described below; (iv)
$1.8 million
associated with actions in connection with our planned exit of
two
leased manufacturing facilities in Singapore and Thailand, which are described below; and (v)
$1.7 million
for employee severance actions and related costs associated with our North American effectiveness initiative, which began in 2015. The remainder principally relates
to other streamlining actions in 2016, as approved by our Management Committee, in our operations in North America, EMEA and Asia/Pacific.
In 2016, we exited our consolidated joint venture in South Africa and recognized special charges of
$2.8 million
, principally related to the write-off of
$2.6 million
of goodwill upon the receipt of regulatory approval to terminate the joint venture in the fourth quarter of 2016. As part of the negotiated agreement related to the exit, our former joint venture partner paid the joint venture
$5.1 million
for inventory and fixed assets and the joint venture paid
$0.9 million
to the former partner to settle their joint venture interest.
In 2016, our Management Committee approved a plan to construct a new manufacturing facility in Thailand for our Asia/Pacific region, with anticipated completion in 2018. Upon completion of construction, we will exit two leased manufacturing facilities in Singapore and Thailand. We have recorded
$1.7 million
and
$1.8 million
of special charges in 2017 and 2016, respectively, principally related to severance and other related costs associated with employees located at the existing leased facility in Singapore. We expect to record additional special charges related to this action of approximately
$1.3 million
in 2018 associated with other exit costs.
Of the
$65.5 million
of special charges recognized in 2015,
$29.2 million
related to our North American effectiveness initiative,
$24.4 million
related to streamlining actions in our EMEA region, and
$14.2 million
related to our Kohinoor business in India as more fully described below. Partially offsetting these charges was a reduction of
$2.3 million
associated with the 2015 reversal of reserves previously accrued as part of actions undertaken in 2013 and 2014.
In 2015, we offered a voluntary retirement plan, which included enhanced separation benefits but did not include supplementary pension benefits, to certain U.S. employees aged 55 years or older with at least ten years of service to the company. Upon our receipt of notification from participants that they accepted this plan, which closed early in 2015, we accrued special charges of
$23.9 million
, consisting of employee severance and related benefits that were largely paid in 2015 as substantially all of the affected employees had left the company in 2015. The voluntary retirement plan is part of our North American effectiveness initiative. In addition to the cost of the voluntary retirement plan, we recognized an additional
$5.3 million
of special charges in 2015 as part of our North American effectiveness initiative, of which
$3.0 million
represented additional employee severance and related benefits and
$2.3 million
represented other related expenses. In 2016, we recorded an additional
$1.7 million
associated with employee severance and related expenses as part of our North American effectiveness initiative.
Our North American effectiveness initiative generated cost savings of approximately
$15 million
in 2015 and full year annual cost savings of approximately
$27 million
in 2016. As of November 30, 2016, our North American effectiveness initiative was effectively completed.
In 2015, we recorded special charges of
$24.4 million
, principally consisting of severance and related costs, to enhance organization efficiency and streamline processes in EMEA in order to support our competitiveness and long-term growth. These initiatives center on actions intended to reduce fixed costs and improve business processes, as well as continue to drive simplification across the business and supply chain. These actions include the transfer of certain additional activities to our shared services center in Poland. In 2017 and 2016, we recorded
$0.9 million
and
$5.7 million
of special charges, respectively, principally consisting of other related costs, for EMEA reorganization and streamlining activities that began in 2015.
The following table outlines the major components of accrual balances and activity relating to the special charges associated with the EMEA reorganization plans initiated in 2015 (in millions):
|
Employee severance and related benefits
|
Other related costs
|
Total
|
|||||||||
|
Special charges
|
$
|
21.5
|
|
$
|
2.9
|
|
$
|
24.4
|
|
||
|
Cash paid
|
(4.5
|
)
|
(1.3
|
)
|
(5.8
|
)
|
|||||
|
Impairment of fixed assets recorded
|
—
|
|
(1.1
|
)
|
(1.1
|
)
|
|||||
|
Impact of foreign exchange
|
(0.8
|
)
|
0.1
|
|
(0.7
|
)
|
|||||
|
Balance as of November 30, 2015
|
16.2
|
|
0.6
|
|
16.8
|
|
|||||
|
Special charges
|
1.2
|
|
4.5
|
|
5.7
|
|
|||||
|
Cash paid
|
(6.8
|
)
|
(4.6
|
)
|
(11.4
|
)
|
|||||
|
Impact of foreign exchange
|
(0.1
|
)
|
—
|
|
(0.1
|
)
|
|||||
|
Balance as of November 30, 2016
|
10.5
|
|
0.5
|
|
11.0
|
|
|||||
|
Special charges
|
—
|
|
0.9
|
|
0.9
|
|
|||||
|
Cash paid
|
(4.2
|
)
|
(1.2
|
)
|
(5.4
|
)
|
|||||
|
Impact of foreign exchange
|
1.1
|
|
0.2
|
|
1.3
|
|
|||||
|
Balance as of November 30, 2017
|
$
|
7.4
|
|
$
|
0.4
|
|
$
|
7.8
|
|
||
Also in 2015, we recorded a total of
$14.2 million
of special charges related to initiatives to improve the profitability of our Kohinoor consumer business in India. This action principally relates to the discontinuance of Kohinoor's non-profitable bulk-packaged and broken basmati rice product lines and other ancillary activities to enable the business to focus on both its existing consumer-packaged basmati rice product lines and the launch of consumer-packaged herbs and spices under the Kohinoor brand name.
Due to the anticipated sales reduction associated with Kohinoor's discontinuance of its bulk-packaged and broken basmati rice product lines, only partially offset by the launch of consumer-packaged herbs and spices, we determined that an impairment of the Kohinoor brand name had occurred in 2015. Using a relief from royalty method (and a discount rate associated with the risk of the launch of consumer-packaged herbs and spices), a Level 3 fair value measurement, we recorded a non-cash impairment charge of
$9.6 million
in 2015. The remaining carrying value of our Kohinoor brand name as of November 30, 2017 is
$8.6 million
. In addition, as a result of the Kohinoor product line discontinuance in 2015, we recognized a
$4.0 million
charge in cost of goods sold, which represents a provision for the excess of the carrying value of inventories of bulk and broken basmati rice, determined on a lower of cost or market basis, over the estimated net realizable value of such discontinued inventories. We also recorded
$0.6 million
of other exit costs associated with this plan of which
$0.4 million
were paid in 2015 and the balance of
$0.2 million
paid in 2016. In addition to the
$14.2 million
of special charges outlined above and recorded in 2015, we recorded and paid
$1.9 million
of special charges in 2016 consisting of costs associated with exiting certain contractual arrangements to improve Kohinoor's profitability and other severance and related costs directly associated with the plan.
As of November 30, 2017, reserves associated with special charges are included in other accrued liabilities in our consolidated balance sheet.
4. GOODWILL AND INTANGIBLE ASSETS
The following table displays intangible assets as of November 30:
|
|
2017
|
2016
|
||||||||||
|
(millions)
|
Gross
carrying
amount
|
Accumulated
amortization
|
Gross
carrying
amount
|
Accumulated
amortization
|
||||||||
|
Definite-lived intangible assets
|
$
|
329.1
|
|
$
|
66.5
|
|
$
|
161.1
|
|
$
|
48.4
|
|
|
Indefinite-lived intangible assets:
|
||||||||||||
|
Goodwill
|
4,490.1
|
|
—
|
|
1,771.4
|
|
—
|
|
||||
|
Brand names and trademarks
|
2,808.5
|
|
—
|
|
312.2
|
|
—
|
|
||||
|
|
7,298.6
|
|
—
|
|
2,083.6
|
|
—
|
|
||||
|
Total goodwill and intangible assets
|
$
|
7,627.7
|
|
$
|
66.5
|
|
$
|
2,244.7
|
|
$
|
48.4
|
|
We acquired RB Foods in August 2017 (see note 2). A preliminary valuation of the acquired net assets of RB Foods resulted in the allocation of
$2,475.0 million
to indefinite lived brand assets and
$120.0 million
to definite-lived intangible assets. We expect to finalize the valuation of the acquired net assets of RB Foods, including the related goodwill and intangible assets, within the one-year measurement period from the date of acquisition.
Intangible asset amortization expense was
$16.3 million
,
$11.3 million
and
$7.3 million
for
2017
,
2016
and
2015
, respectively. At
November 30, 2017
, definite-lived intangible assets had a weighted-average remaining life of approximately
12
years.
The changes in the carrying amount of goodwill by segment for the years ended
November 30, 2017
and
2016
were as follows:
|
|
2017
|
2016
|
||||||||||
|
(millions)
|
Consumer
|
|
Industrial
|
Consumer
|
|
Industrial
|
||||||
|
Beginning of year
|
$
|
1,608.3
|
|
$
|
163.1
|
|
$
|
1,587.7
|
|
$
|
171.6
|
|
|
Changes in preliminary purchase price allocation
|
(7.1
|
)
|
—
|
|
(23.2
|
)
|
—
|
|
||||
|
Increases in goodwill from acquisitions
|
1,697.5
|
|
929.3
|
|
62.2
|
|
—
|
|
||||
|
Decreases in goodwill from exit of consolidated joint venture
|
—
|
|
—
|
|
—
|
|
(2.6
|
)
|
||||
|
Foreign currency fluctuations
|
86.7
|
|
12.3
|
|
(18.4
|
)
|
(5.9
|
)
|
||||
|
End of year
|
$
|
3,385.4
|
|
$
|
1,104.7
|
|
$
|
1,608.3
|
|
$
|
163.1
|
|
A preliminary valuation of the acquired net assets of RB Foods resulted in the allocation of
$1,697.5 million
and
$848.8 million
of goodwill to the consumer segment and industrial segment, respectively. We acquired Giotti in December 2016 (see note 2). We completed the final valuation of the acquired net assets of Giotti during the fourth quarter of 2017 which resulted in the allocation of
$80.5 million
of goodwill to the industrial segment. During fiscal 2017, we also finalized the purchase accounting for our 2016 acquisitions of Gourmet Garden and Cajun Injector, which resulted in a
$7.1 million
reduction in our consumer segment's goodwill.
5. INVESTMENTS IN AFFILIATES
Summarized annual and year-end information from the financial statements of unconsolidated affiliates representing
100%
of the businesses follows:
|
(millions)
|
2017
|
2016
|
2015
|
||||||
|
Net sales
|
$
|
775.4
|
|
$
|
767.6
|
|
$
|
777.3
|
|
|
Gross profit
|
278.5
|
|
245.6
|
|
286.1
|
|
|||
|
Net income
|
75.5
|
|
66.4
|
|
76.6
|
|
|||
|
Current assets
|
$
|
315.4
|
|
$
|
315.6
|
|
$
|
326.0
|
|
|
Noncurrent assets
|
127.6
|
|
113.0
|
|
114.6
|
|
|||
|
Current liabilities
|
146.9
|
|
146.2
|
|
161.5
|
|
|||
|
Noncurrent liabilities
|
13.6
|
|
9.1
|
|
8.1
|
|
|||
Our share of undistributed earnings of unconsolidated affiliates was
$126.3 million
at
November 30, 2017
. Royalty income from unconsolidated affiliates was
$17.5 million
,
$16.1 million
and
$17.8 million
for
2017
,
2016
and
2015
, respectively.
Our principal earnings from unconsolidated affiliates is from our
50%
interest in McCormick de Mexico, S.A. de C.V. Profit from this joint venture represented
74%
of income from unconsolidated operations in 2017,
83%
in 2016 and
89%
in 2015.
As of November 30, 2017,
$114.0 million
of our consolidated retained earnings represents undistributed earnings of investments in unconsolidated affiliates for which we have not provided deferred income tax liabilities.
6. FINANCING ARRANGEMENTS
Our outstanding debt was as follows at November 30:
|
(millions)
|
2017
|
2016
|
||||
|
Short-term borrowings
|
|
|
||||
|
Commercial paper
|
$
|
219.4
|
|
$
|
356.9
|
|
|
Other
|
38.2
|
|
33.4
|
|
||
|
|
$
|
257.6
|
|
$
|
390.3
|
|
|
Weighted-average interest rate of short-term borrowings at year-end
|
2.3
|
%
|
1.4
|
%
|
||
|
Long-term debt
|
||||||
|
5.75% notes due 12/15/2017
(1)
|
$
|
250.0
|
|
$
|
250.0
|
|
|
Term loan due 8/17/2020
(2)
|
500.0
|
|
—
|
|
||
|
3.90% notes due 7/8/2021
(3)
|
250.0
|
|
250.0
|
|
||
|
2.70% notes due 8/15/2022
|
750.0
|
|
—
|
|
||
|
Term loan due 8/17/2022
(2)
|
731.3
|
|
—
|
|
||
|
3.50% notes due 8/19/2023
(4)
|
250.0
|
|
250.0
|
|
||
|
3.15% notes due 8/15/2024
|
700.0
|
|
—
|
|
||
|
3.25% notes due 11/15/2025
(5)
|
250.0
|
|
250.0
|
|
||
|
3.40% notes due 8/15/2027
(6)
|
750.0
|
|
—
|
|
||
|
4.20% notes due 8/15/2047
|
300.0
|
|
—
|
|
||
|
7.63%–8.12% notes due 2024
|
55.0
|
|
55.0
|
|
||
|
Other
|
19.6
|
|
11.1
|
|
||
|
Unamortized discounts, premiums, debt issuance costs and fair value adjustments
|
(36.4
|
)
|
(9.2
|
)
|
||
|
4,769.5
|
|
1,056.9
|
|
|||
|
Less current portion
|
325.6
|
|
2.9
|
|
||
|
|
$
|
4,443.9
|
|
$
|
1,054.0
|
|
|
(1)
|
Interest rate swaps, settled upon the issuance of these notes in 2007, effectively set the interest rate on the
$250 million
notes at a weighted-average fixed rate of
6.25%
.
|
|
(2)
|
As more fully described below, the term loans are prepayable in whole or in-part. Also, the term loan due in 2022 requires quarterly principal payments of
2.5%
of the initial principal amount.
|
|
(3)
|
Interest rate swaps, settled upon the issuance of these notes in 2011, effectively set the interest rate on the
$250 million
notes at a weighted-average fixed rate of
4.01%
.
|
|
(4)
|
Interest rate swaps, settled upon the issuance of these notes in 2013, effectively set the interest rate on the
$250 million
notes at a weighted-average fixed rate of
3.30%
.
|
|
(5)
|
Interest rate swaps, settled upon the issuance of these notes in 2015, effectively set the interest rate on the
$250 million
notes at a weighted-average fixed rate of
3.45%
.
The fixed interest rate on
$100 million
of the
3.25%
notes due in 2025 is effectively converted to a variable rate by interest rate swaps through 2025. Net interest payments are based on 3 month LIBOR plus
1.22%
during this period (our effective rate as of November 30, 2017 was
2.64%
).
|
|
(6)
|
Interest rate swaps, settled upon the issuance of these notes in 2017, effectively set the interest rate on the
$750 million
notes at a weighted-average fixed rate of
3.44%
.
|
Maturities of long-term debt during the fiscal years subsequent to November 30, 2018 are as follows (in millions):
|
2019
|
$
|
77.1
|
|
|
2020
|
576.8
|
|
|
|
2021
|
326.8
|
|
|
|
2022
|
1,182.6
|
|
|
|
Thereafter
|
2,317.0
|
|
|
The consideration for our acquisition of RB Foods on August 17, 2017 totaled approximately
$4.2 billion
in cash (see note 2) and was funded with (a) borrowings under McCormick’s
$1.5 billion
Term Loan Agreement described below; (b) amounts received from the offering of
$2.5 billion
aggregate principal amount of McCormick’s senior unsecured notes described below; and (c) amounts received from the offering of McCormick’s common stock non-voting, which closed on August 11, 2017 (see note 13).
In connection with our entry into the agreement to acquire RB Foods, we entered into a commitment letter, dated July 18, 2017 (the “Commitment Letter”), under which certain banks agreed to provide a senior unsecured 364-day bridge loan facility (the “Bridge Facility”) of up to
$4.2 billion
in the aggregate. On August 7, 2017, we entered into a Senior Unsecured Bridge Credit Agreement with certain financial institutions under which those financial institutions agreed to provide a senior unsecured 364-day bridge loan facility (the “Bridge Facility”) for the purpose of providing the financing necessary to fund all or a portion of the consideration to be paid pursuant to the terms of the agreement related to the acquisition of RB Foods and related fees and expenses (the “Bridge Loan Commitment”). The Bridge Facility provided that the Bridge Loan Commitment would be reduced in equivalent amounts upon any incurrence by McCormick of, among other things, term loans and/or the issuance of equity or notes in a public offering or private placement prior to the consummation of the transaction, subject to certain exceptions set forth in the Bridge Facility. McCormick secured its permanent financing for the RB Foods acquisition, as described above, prior to the August 17, 2017 acquisition date. As a result, the Bridge Loan Commitment was reduced to zero without us ever drawing under the Bridge Facility. Other debt costs of
$15.4 million
for the year ended November 30, 2017 represents the Bridge Loan Commitment financing fees.
As previously noted, in connection with our acquisition of RB Foods, we entered into a Term Loan Agreement (“Term Loan”) in August 2017. The Term Loan provides for
three
-year and
five
-year senior unsecured term loans, each for
$750 million
. The net proceeds received from the issuance of the Term Loan was
$1,498.3 million
. The
three
-year loan is payable at maturity. The
five
-year loan is payable in equal quarterly installments in an amount of
2.5%
of the initial principal amount, with the remaining unpaid balance due at maturity. The
three
-year and
five
-year loans are each prepayable in whole or in-part. During the fourth quarter of 2017, we repaid
$250 million
of the three-year loan. The
three
-year and
five
-year loans currently bear interest at LIBOR plus
1.125%
and LIBOR plus
1.25%
, respectively. The interest rates are based on our credit rating with the maximum potential interest rates of LIBOR plus
1.625%
and LIBOR plus
1.75%
for the
three
-year loan and
five
-year loan, respectively.
The provisions of our outstanding
$1.0 billion
revolving credit facility and the Term Loan restrict subsidiary indebtedness and require us to maintain certain minimum and maximum financial ratios for interest expense coverage and our leverage ratio. The applicable leverage ratio is reduced annually commencing on November 30, 2018. As of November 30, 2017, our capacity under the revolving credit facility is not affected by these covenants. We do not expect that these covenants would limit our access to our revolving credit facility for the foreseeable future; however, the leverage ratio could restrict our ability to utilize this facility.
In August 2017, we issued an aggregate amount of
$2.5 billion
of senior unsecured notes. These notes are due as follows:
$750.0 million
due August 15, 2022,
$700.0 million
due August 15, 2024,
$750.0 million
due August 15, 2027 and
$300.0 million
due August 15, 2047 with stated fixed interest rates of
2.70%
,
3.15%
,
3.40%
and
4.20%
, respectively. Interest is payable semiannually in arrears in August and February of each year. The net proceeds received from the issuance of these notes were
$2,479.3 million
. The net proceeds from this issuance were used to partially fund our acquisition of RB Foods. In addition, we used a portion of these proceeds, which in the interim were used to repay commercial paper borrowings, to repay our
$250 million
,
5.75%
notes that matured on December 15, 2017.
In November 2015, we issued
$250 million
of
3.25%
notes due 2025, with net cash proceeds received of
$246.5 million
. Interest is payable semiannually in arrears in May and November of each year. Of these notes,
$100 million
were subject to cash flow hedges and
$100 million
to fair value hedges as further disclosed in note 7. The net proceeds from this issuance were used to pay down short-term borrowings and for general corporate purposes. In
December of 2015, proceeds from short-term borrowings were used to pay off
$200 million
of
5.20%
notes that matured in that month.
We have available credit facilities with domestic and foreign banks for various purposes. Some of these lines are committed lines and others are uncommitted lines and could be withdrawn at various times. In August 2017, we entered into a
five
-year
$1.0 billion
revolving credit facility, which will expire in August 2022. The current pricing for the credit facility, on a fully drawn basis, is LIBOR plus
1.25%
. The pricing of the credit facility is based on a credit rating grid that contains a fully drawn maximum pricing of the credit facility equal to LIBOR plus
1.75%
. This credit facility supports our commercial paper program and, after
$219.4 million
was used to support issued commercial paper, we have
$780.6 million
of capacity at November 30, 2017. This facility replaces our prior facilities: (i) a five-year
$750 million
revolving credit facility that was due to expire in June 2020 and (ii) a 364-day
$250 million
revolving facility, which we entered into in March 2017 and that was due to expire in March 2018. The pricing for the 364-day credit facility, on a fully drawn basis, was LIBOR plus
0.75%
. In addition, we have several uncommitted lines totaling
$233.1 million
, which have a total unused capacity at
November 30, 2017
of
$184.1 million
. These lines by their nature can be withdrawn based on the lenders’ discretion. Committed credit facilities require a fee, and commitment fees were
$0.8 million
and
$0.5 million
for 2017 and 2016, respectively.
Rental expense under operating leases (primarily buildings and equipment) was
$46.5 million
in
2017
,
$41.6 million
in
2016
and
$39.0 million
in
2015
. Future annual fixed rental payments
(1)
for the years ending November 30 are as follows (in millions):
|
2018
|
$
|
41.7
|
|
|
2019
|
33.4
|
|
|
|
2020
|
26.2
|
|
|
|
2021
|
20.4
|
|
|
|
2022
|
16.6
|
|
|
|
Thereafter
|
33.7
|
|
|
(1)
In July 2016, we entered into a
15
-year lease for a headquarters building in Hunt Valley, Maryland. The lease, which is expected to commence upon completion of building construction and fit-out, currently scheduled for the second half of 2018, requires monthly lease payments of approximately
$0.9 million
beginning six months after lease commencement. The
$0.9 million
monthly lease payment is subject to adjustment after an initial
60
-month period and thereafter on an annual basis as specified in the lease agreement. In addition, the initial
$0.9 million
monthly lease payment is subject to increase in the event of agreed-upon changes to specifications related to the headquarters building. We expect to consolidate our Corporate staff and certain non-manufacturing U.S. employees, currently housed in four locations in the suburban Baltimore, Maryland area, to the new headquarters building. Due to uncertainty as to the exact date when the lease will commence, these lease payments are not reflected in the preceding table of annual fixed rental payments for the years ending November 30, 2018 through 2022 and thereafter.
At
November 30, 2017
, we had guarantees outstanding of
$0.6 million
with terms of one year or less. At
November 30, 2017
and
2016
, we had outstanding letters of credit of
$7.3 million
and
$7.2 million
, respectively. These letters of credit typically act as a guarantee of payment to certain third parties in accordance with specified terms and conditions. The unused portion of our letter of credit facility was
$13.7 million
at
November 30, 2017
.
7. FINANCIAL INSTRUMENTS
We use derivative financial instruments to enhance our ability to manage risk, including foreign currency and interest rate exposures, which exist as part of our ongoing business operations. We do not enter into contracts for trading purposes, nor are we a party to any leveraged derivative instrument and all derivatives are designated as hedges. We are not a party to master netting arrangements, and we do not offset the fair value of derivative contracts with the same counterparty in our financial statement disclosures. The use of derivative financial instruments is monitored through regular communication with senior management and the use of written guidelines.
Foreign Currency
We are potentially exposed to foreign currency fluctuations affecting net investments, transactions and earnings denominated in foreign currencies. We selectively hedge the potential effect of these foreign currency fluctuations by entering into foreign currency exchange contracts with highly-rated financial institutions.
Contracts which are designated as hedges of anticipated purchases denominated in a foreign currency (generally purchases of raw materials in U.S. dollars by operating units outside the U.S.) are considered cash flow hedges. The gains and losses on these contracts are deferred in accumulated other comprehensive income until the hedged
item is recognized in cost of goods sold, at which time the net amount deferred in accumulated other comprehensive income is also recognized in cost of goods sold. Gains and losses from contracts which are designated as hedges of assets, liabilities or firm commitments are recognized through income, offsetting the change in fair value of the hedged item.
From time to time, we enter into fair value foreign currency exchange contracts to manage exposure to currency fluctuations in certain intercompany loans between subsidiaries. The notional value of these contracts was
$281.9 million
and
$109.9 million
at November 30, 2017 and 2016, respectively. During fiscal years 2017 and 2016, we recognized a
$12.8 million
gain and a
$3.5 million
loss, respectively, on the change in fair value of these contracts, which was offset by a
$14.1 million
loss and a
$3.1 million
gain, respectively, on the change in the currency component of the underlying loans. All of the losses and the gains for both fiscal years were recognized in our consolidated income statement as other income, net.
At November 30, 2017, we had foreign currency exchange contracts to purchase or sell
$405.9 million
of foreign currencies versus
$449.2 million
at November 30, 2016. All of these contracts were designated as hedges of anticipated purchases denominated in a foreign currency or hedges of foreign currency denominated assets or liabilities. Hedge ineffectiveness was not material. At November 30, 2017, the notional contracts that have durations of less than
seven
days that are used to hedge short-term cash flow funding was nominal.
At November 30, 2016, we had
$189.4 million
of notional contracts that have durations of less than seven days that are used to hedge short-term cash flow funding. The remaining contracts have durations of one to
twelve
months.
Interest Rates
We finance a portion of our operations with both fixed and variable rate debt instruments, primarily commercial paper, notes and bank loans. We utilize interest rate swap agreements to minimize worldwide financing costs and to achieve a desired mix of variable and fixed rate debt.
During fiscal 2017, we entered into a total of
$150 million
of forward starting interest rate swap agreements to manage our interest rate risk associated with the anticipated issuance of at least
$150 million
of fixed rate notes by December 2017. The weighted average fixed rate of these agreements was
2.45%
and was based upon the applicable U.S. LIBOR swap rate at the inception of each agreement. We cash settled these agreements upon issuance of the
3.40%
fixed rate notes issued in August 2017 and made a one-time cash payment to the counterparties of
$2.9 million
. We designated these forward starting interest rate swap agreements as cash flow hedges. Upon settlement, the loss realized was deferred in other comprehensive income and will be amortized over the life of the
3.40%
fixed rate notes due August 15, 2027 as a component of interest expense. Ineffectiveness associated with these hedges was not material.
During fiscal 2015, we entered into a total of
$100 million
of forward starting interest rate swap agreements to manage our interest rate risk associated with the anticipated issuance of fixed rate notes in November 2015. We cash settled all of these agreements, which were designated as cash flow hedges, for a loss of
$1.2 million
simultaneous with the issuance of the notes at an all-in effective fixed rate of
3.45%
on the full
$250 million
of debt. The loss on these agreements was deferred in accumulated other comprehensive income and is being amortized to increase interest expense over the life of the notes. Hedge ineffectiveness of these agreements was not material.
In November 2015, we entered into interest rate swap contracts for a notional amount of
$100 million
to receive interest at
3.25%
and pay a variable rate of interest based on three-month LIBOR plus
1.22%
. We designated these swaps, which expire in November 2025, as fair value hedges of the changes in fair value of
$100 million
of the
$250 million
3.25%
medium-term notes due 2025 that we issued in November 2015. Any unrealized gain or loss on these swaps was offset by a corresponding increase or decrease in the value of the hedged debt. Hedge ineffectiveness was not material.
The following tables disclose the derivative instruments on our balance sheet, all of which are all recorded at fair value:
|
As of
November 30, 2017:
|
||||||||||||||
|
(millions)
|
Asset Derivatives
|
Liability Derivatives
|
||||||||||||
|
Derivatives
|
Balance sheet
location
|
Notional amount
|
Fair value
|
Balance sheet
location
|
Notional amount
|
Fair value
|
||||||||
|
Interest rate contracts
|
Other current
assets
|
$
|
—
|
|
$
|
—
|
|
Other accrued liabilities
|
$
|
100.0
|
|
$
|
2.5
|
|
|
Foreign exchange contracts
|
Other current assets
|
326.3
|
|
12.7
|
|
Other accrued liabilities
|
79.6
|
|
4.7
|
|
||||
|
Total
|
|
|
$
|
12.7
|
|
|
|
$
|
7.2
|
|
||||
|
As of
November 30, 2016:
|
|
|
|
|
|
|
||||||||
|
(millions)
|
Asset Derivatives
|
Liability Derivatives
|
||||||||||||
|
Derivatives
|
Balance sheet
location
|
Notional amount
|
Fair value
|
Balance sheet
location
|
Notional amount
|
Fair value
|
||||||||
|
Interest rate contracts
|
Other current
assets
|
$
|
—
|
|
$
|
—
|
|
Other accrued liabilities
|
$
|
100.0
|
|
$
|
1.2
|
|
|
Foreign exchange contracts
|
Other current assets
|
204.3
|
|
4.9
|
|
Other accrued liabilities
|
244.9
|
|
5.4
|
|
||||
|
Total
|
|
|
$
|
4.9
|
|
|
|
$
|
6.6
|
|
||||
The following tables disclose the impact of derivative instruments on other comprehensive income (OCI), accumulated other comprehensive income (AOCI) and our income statement for the years ended
November 30, 2017
,
2016
and
2015
:
|
Fair value hedges (millions)
|
||||||||||
|
|
Income statement
location
|
Income (expense)
|
||||||||
|
Derivative
|
2017
|
2016
|
2015
|
|||||||
|
Interest rate contracts
|
Interest expense
|
$
|
0.9
|
|
$
|
1.6
|
|
$
|
5.1
|
|
|
|
Income statement location
|
Gain (loss) recognized in income
|
Income statement location
|
Gain (loss) recognized in income
|
|||||||||||
|
Derivative
|
2017
|
2016
|
Hedged Item
|
2017
|
2016
|
||||||||||
|
Foreign exchange contracts
|
Other income, net
|
$
|
12.8
|
|
$
|
(3.5
|
)
|
Intercompany loans
|
Other income, net
|
$
|
(14.1
|
)
|
$
|
3.1
|
|
|
Cash flow hedges (millions)
|
|||||||||||||||||||
|
|
Gain (loss)
recognized in OCI
|
Income statement location
|
Gain (loss)
reclassified from AOCI
|
||||||||||||||||
|
Derivative
|
2017
|
2016
|
2015
|
2017
|
2016
|
2015
|
|||||||||||||
|
Interest rate contracts
|
$
|
(2.9
|
)
|
$
|
—
|
|
$
|
(1.2
|
)
|
Interest expense
|
$
|
(0.4
|
)
|
$
|
(0.3
|
)
|
$
|
(0.2
|
)
|
|
Foreign exchange contracts
|
(7.3
|
)
|
4.4
|
|
6.2
|
|
Cost of goods sold
|
1.2
|
|
3.7
|
|
7.1
|
|
||||||
|
Total
|
$
|
(10.2
|
)
|
$
|
4.4
|
|
$
|
5.0
|
|
|
$
|
0.8
|
|
$
|
3.4
|
|
$
|
6.9
|
|
The amount of gain or loss recognized in income on the ineffective portion of derivative instruments is not material. The net amount of accumulated other comprehensive income expected to be reclassified into income related to these contracts in the next twelve months is a
$3.7 million
decrease to earnings.
Fair Value of Financial Instruments
The carrying amount and fair value of financial instruments at
November 30, 2017
and
2016
were as follows:
|
|
2017
|
2016
|
||||||||||
|
(millions)
|
Carrying
amount
|
Fair
value
|
Carrying
amount
|
Fair
value
|
||||||||
|
Long-term investments
|
$
|
127.0
|
|
$
|
127.0
|
|
$
|
116.2
|
|
$
|
116.2
|
|
|
Long-term debt (including current portion)
|
4,769.5
|
|
4,858.5
|
|
1,056.9
|
|
1,118.3
|
|
||||
|
Derivatives related to:
|
||||||||||||
|
Interest rates (liabilities)
|
2.5
|
|
2.5
|
|
1.2
|
|
1.2
|
|
||||
|
Foreign currency (assets)
|
12.7
|
|
12.7
|
|
4.9
|
|
4.9
|
|
||||
|
Foreign currency (liabilities)
|
4.7
|
|
4.7
|
|
5.4
|
|
5.4
|
|
||||
Because of their short-term nature, the amounts reported in the balance sheet for cash and cash equivalents, receivables, short-term borrowings and trade accounts payable approximate fair value.
At November 30, 2017, the fair value of long-term debt includes
$3,615.2 million
and
$1,243.3 million
determined using Level 1 and Level 2 valuation techniques, respectively. At November 30, 2016, the fair value of long-term debt was determined using Level 1 valuation techniques. The fair value for Level 2 long-term debt is determined by using quoted prices for similar debt instruments.
Investments in affiliates are not readily marketable, and it is not practicable to estimate their fair value. Long-term investments are comprised of fixed income and equity securities held on behalf of employees in certain employee benefit plans and are stated at fair value on the balance sheet. The cost of these investments was
$78.4 million
and
$80.6 million
at
November 30, 2017
and
2016
, respectively.
Concentrations of Credit Risk
We are potentially exposed to concentrations of credit risk with trade accounts receivable and financial instruments. The customers of our consumer segment are predominantly food retailers and food wholesalers. Consolidations in these industries have created larger customers. In addition, competition has increased with the growth in alternative channels including mass merchandisers, dollar stores, warehouse clubs, discount chains and e-commerce. This has caused some customers to be less profitable and increased our exposure to credit risk. We have a large and diverse customer base and, other than with respect to the two customers disclosed in note 16, each of which accounted for greater than 10% of our consolidated sales, there was no material concentration of credit risk in these accounts at November 30, 2017. At November 30, 2017, amounts due from those two customers aggregated approximately
16%
of consolidated trade accounts receivable. Current credit markets are highly volatile and some of our customers and counterparties are highly leveraged. We continue to closely monitor the credit worthiness of our customers and counterparties and generally do not require collateral. We believe that the allowance for doubtful accounts properly recognized trade receivables at realizable value. We consider nonperformance credit risk for other financial instruments to be insignificant.
8. FAIR VALUE MEASUREMENTS
Fair value can be measured using valuation techniques, such as the market approach (comparable market prices), the income approach (present value of future income or cash flow) and the cost approach (cost to replace the service capacity of an asset or replacement cost). Accounting standards utilize a fair value hierarchy that prioritizes the inputs to valuation techniques used to measure fair value into three broad levels. The following is a brief description of those three levels:
|
•
|
Level 1:
Observable inputs such as quoted prices (unadjusted) in active markets for identical assets or liabilities.
|
|
•
|
Level 2:
Inputs other than quoted prices that are observable for the asset or liability, either directly or indirectly. These include quoted prices for similar assets or liabilities in active markets and quoted prices for identical or similar assets or liabilities in markets that are not active.
|
|
•
|
Level 3:
Unobservable inputs that reflect management’s own assumptions.
|
Our population of assets and liabilities subject to fair value measurements on a recurring basis are as follows:
|
|
|
Fair value measurements using fair
value hierarchy as of November 30, 2017
|
||||||||||
|
(millions)
|
Fair value
|
Level 1
|
Level 2
|
Level 3
|
||||||||
|
Assets
|
||||||||||||
|
Cash and cash equivalents
|
$
|
186.8
|
|
$
|
186.8
|
|
$
|
—
|
|
$
|
—
|
|
|
Insurance contracts
|
119.5
|
|
—
|
|
119.5
|
|
—
|
|
||||
|
Bonds and other long-term investments
|
7.5
|
|
7.5
|
|
—
|
|
—
|
|
||||
|
Foreign currency derivatives
|
12.7
|
|
—
|
|
12.7
|
|
—
|
|
||||
|
Total
|
$
|
326.5
|
|
$
|
194.3
|
|
$
|
132.2
|
|
$
|
—
|
|
|
Liabilities
|
||||||||||||
|
Interest rate derivatives
|
$
|
2.5
|
|
$
|
—
|
|
$
|
2.5
|
|
$
|
—
|
|
|
Foreign currency derivatives
|
4.7
|
|
—
|
|
4.7
|
|
—
|
|
||||
|
Total
|
$
|
7.2
|
|
$
|
—
|
|
$
|
7.2
|
|
$
|
—
|
|
|
|
|
Fair value measurements using fair
value hierarchy as of November 30, 2016
|
||||||||||
|
(millions)
|
Fair value
|
Level 1
|
Level 2
|
Level 3
|
||||||||
|
Assets
|
||||||||||||
|
Cash and cash equivalents
|
$
|
118.4
|
|
$
|
118.4
|
|
$
|
—
|
|
$
|
—
|
|
|
Insurance contracts
|
106.0
|
|
—
|
|
106.0
|
|
—
|
|
||||
|
Bonds and other long-term investments
|
10.2
|
|
10.2
|
|
—
|
|
—
|
|
||||
|
Foreign currency derivatives
|
4.9
|
|
—
|
|
4.9
|
|
—
|
|
||||
|
Total
|
$
|
239.5
|
|
$
|
128.6
|
|
$
|
110.9
|
|
$
|
—
|
|
|
Liabilities
|
||||||||||||
|
Interest rate derivatives
|
$
|
1.2
|
|
$
|
—
|
|
$
|
1.2
|
|
$
|
—
|
|
|
Foreign currency derivatives
|
5.4
|
|
—
|
|
5.4
|
|
—
|
|
||||
|
Contingent consideration related to acquisition
|
28.9
|
|
—
|
|
—
|
|
28.9
|
|
||||
|
Total
|
$
|
35.5
|
|
$
|
—
|
|
$
|
6.6
|
|
$
|
28.9
|
|
The fair values of insurance contracts are based upon the underlying values of the securities in which they are invested and are from quoted market prices from various stock and bond exchanges for similar type assets. The fair values of bonds and other long-term investments are based on quoted market prices from various stock and bond exchanges. The fair values for interest rate and foreign currency derivatives are based on values for similar instruments using models with market based inputs.
The acquisition-date fair value of the liability for contingent consideration related to our acquisition of Drogheria & Alimentari (D&A) in May 2015 was approximately
$27.7 million
(
€25.2 million
). The fair value of the liability both at acquisition and as of each reporting period prior to our agreement to settle the obligation in the second quarter of 2017, was estimated using a discounted cash flow technique applied to the expected payout with significant inputs that are not observable in the market and thus represents a Level 3 fair value measurement as defined in the FASB's Accounting Standards Codification (ASC) 820,
Fair Value Measurements and Disclosures.
The significant inputs in the Level 3 measurement not supported by market activity included our probability assessments of expected future cash flows related to our acquisition of D&A during the calendar 2017 earn-out period, adjusted for expectations of the amounts and ultimate resolution of likely disputes to be raised by the seller and by us as provided in the purchase agreement, discounted considering the uncertainties associated with the obligation, and calculated in accordance with the terms of the purchase agreement. Changes in the fair value of the liability for contingent consideration, excluding the impact of foreign currency, have been recognized in income on a quarterly basis as of each reporting period prior to our agreement to settle the obligation in the second quarter of 2017. We reached agreement with the sellers to settle the contingent consideration liability prior to its contractual term for approximately
$29.3 million
(
€26.1 million
), with
$19.7 million
(
€17.6 million
) paid during 2017. We previously prepaid
€5.0 million
at the date of acquisition. The balance of the liability is expected to be paid in the first quarter of 2018. Accordingly, during 2017, we recognized a
$1.6 million
gain on settlement in selling, general and administrative expense in our consolidated income statement.
The change in fair value of our Level 3 liabilities, which relates solely to the contingent consideration related to our acquisition of D&A, for 2017 and 2016 is summarized as follows (in millions):
|
Beginning of year
|
Changes in fair value including accretion
|
Impact of foreign currency
|
Effect of agreed upon settlement
|
Balance as of end of year
|
|||||||||||||||
|
Year ended November 30, 2017
|
28.9
|
|
0.3
|
|
1.7
|
|
(30.9
|
)
|
—
|
|
|||||||||
|
Year ended November 30, 2016
|
$
|
27.1
|
|
$
|
1.8
|
|
$
|
—
|
|
$
|
—
|
|
$
|
28.9
|
|
||||
9. ACCUMULATED OTHER COMPREHENSIVE LOSS
The following table sets forth the components of accumulated other comprehensive loss, net of tax where applicable (in millions):
|
2017
|
2016
|
|||||
|
Accumulated other comprehensive loss, net of tax where applicable
|
||||||
|
Foreign currency translation adjustment
|
$
|
(124.4
|
)
|
$
|
(299.4
|
)
|
|
Unrealized (loss) gain on foreign currency exchange contracts
|
(3.6
|
)
|
3.9
|
|
||
|
Unamortized value of settled interest rate swaps
|
0.8
|
|
2.4
|
|
||
|
Pension and other postretirement costs
|
(152.3
|
)
|
(221.3
|
)
|
||
|
|
$
|
(279.5
|
)
|
$
|
(514.4
|
)
|
The following table sets forth the amounts reclassified from accumulated other comprehensive income (loss) and into consolidated net income for the years ended
November 30, 2017
,
2016
and
2015
:
|
(millions)
|
Affected line items in the consolidated income statement
|
||||||||||||||
|
Accumulated other comprehensive income (loss) components
|
2017
|
2016
|
2015
|
||||||||||||
|
(Gains)/losses on cash flow hedges:
|
|||||||||||||||
|
Interest rate derivatives
|
$
|
0.4
|
|
$
|
0.3
|
|
$
|
0.2
|
|
Interest expense
|
|||||
|
Foreign exchange contracts
|
(1.2
|
)
|
(3.7
|
)
|
(7.1
|
)
|
Cost of goods sold
|
||||||||
|
Total before taxes
|
(0.8
|
)
|
(3.4
|
)
|
(6.9
|
)
|
|||||||||
|
Tax effect
|
0.2
|
|
0.9
|
|
1.8
|
|
Income taxes
|
||||||||
|
Net, after tax
|
$
|
(0.6
|
)
|
$
|
(2.5
|
)
|
$
|
(5.1
|
)
|
||||||
|
Amortization of pension and postretirement benefit adjustments:
|
|||||||||||||||
|
Amortization of prior service (credits) costs
(1)
|
$
|
(1.6
|
)
|
$
|
0.3
|
|
$
|
0.3
|
|
SG&A expense/ Cost of goods sold
|
|||||
|
Amortization of net actuarial losses
(1)
|
9.7
|
|
16.7
|
|
22.8
|
|
SG&A expense/ Cost of goods sold
|
||||||||
|
Total before taxes
|
8.1
|
|
17.0
|
|
23.1
|
|
|||||||||
|
Tax effect
|
(2.8
|
)
|
(5.8
|
)
|
(7.9
|
)
|
Income taxes
|
||||||||
|
Net, after tax
|
$
|
5.3
|
|
$
|
11.2
|
|
$
|
15.2
|
|
||||||
(1)
This accumulated other comprehensive income (loss) component is included in the computation of total pension expense and total other postretirement expense (refer to note 10 for additional details).
10. EMPLOYEE BENEFIT AND RETIREMENT PLANS
We sponsor defined benefit pension plans in the U.S. and certain foreign locations. In addition, we sponsor defined contribution plans in the U.S. We contribute to defined contribution plans in locations outside the U.S., including government-sponsored retirement plans. We also currently provide postretirement medical and life insurance benefits to certain U.S. employees and retirees.
During fiscal year 2017, we made the following significant changes to our employee benefit and retirement plans:
|
•
|
On December 1, 2016, our Management Committee approved the freezing of benefits under the McCormick U.K. Pension and Life Assurance Scheme (the U.K. plan). The effective date of this freeze was December 31, 2016. Although the U.K. plan has been frozen, employees who are participants in that plan retained benefits accumulated up to the date of the freeze, based on credited service and eligible earnings, in accordance with the terms of the plan.
|
|
•
|
On January 3, 2017, our Management Committee approved the freezing of benefits under the McCormick Pension Plan, the defined benefit pension plan available to U.S. employees hired on or prior to December 31, 2011. The effective date of this freeze is November 30, 2018. Although the U.S. Pension plan will be frozen, employees who are participants in that plan will retain benefits accumulated up to the date of the freeze, based on credited service and eligible earnings, in accordance with the terms of the plan.
|
|
•
|
On January 3, 2017, the Compensation Committee of our Board of Directors approved the freezing of benefits under the McCormick Supplemental Executive Retirement Plan (the “SERP”). The effective date of this freeze was January 31, 2017. Although the SERP has been frozen, executives who are participants in the SERP as of the date of the freeze, including certain named executive officers, retained benefits accumulated up to that date, based on credited service and eligible earnings, in accordance with the SERP’s terms.
|
As a result of these changes, we remeasured pension assets and benefit obligations as of the dates of the approvals indicated above and reduced the U.S. and U.K. plan benefit obligations by
$69.9 million
and
$7.8 million
, respectively. These remeasurements resulted in non-cash, pre-tax net actuarial gains of
$77.7 million
, which principally consist of curtailment gains of
$76.7 million
, and are included in our consolidated statement of comprehensive income for 2017, as a component of Other comprehensive income (loss) on the line entitled Unrealized components of pension plans. Deferred taxes associated with these actuarial gains, together with other unrealized components of pension plans recognized during 2017, are also included in that statement as a component of Other comprehensive income (loss).
Included in accumulated other comprehensive loss at
November 30, 2017
was
$225.8 million
(
$152.3 million
net of tax) related to net unrecognized actuarial losses of
$249.7 million
and unrecognized prior service cost credits of
$23.9 million
that have not yet been recognized in net periodic pension or postretirement benefit cost. We expect to recognize
$4.1 million
(
$3.0 million
net of tax) in net periodic pension and postretirement benefit expense during 2018 related to the amortization of actuarial losses of
$12.7 million
and the amortization of prior service cost credits of
$(8.6) million
.
Defined Benefit Pension Plans
The significant assumptions used to determine benefit obligations are as follows as of November 30:
|
|
United States
|
International
|
||||||
|
|
2017
|
2016
|
2017
|
2016
|
||||
|
Discount rate—funded plan
|
4.0
|
%
|
4.6
|
%
|
3.0
|
%
|
3.2
|
%
|
|
Discount rate—unfunded plan
|
3.9
|
%
|
4.5
|
%
|
—
|
|
—
|
|
|
Salary scale
|
3.8
|
%
|
3.8
|
%
|
3.0-3.5%
|
|
3.0-3.5%
|
|
The significant assumptions used to determine pension expense are as follows:
|
|
United States
|
International
|
||||||||||
|
|
2017
|
2016
|
2015
|
2017
|
2016
|
2015
|
||||||
|
Discount rate—funded plan
|
4.6
|
%
|
4.7
|
%
|
4.4
|
%
|
3.2
|
%
|
3.9
|
%
|
3.8
|
%
|
|
Discount rate—unfunded plan
|
4.5
|
%
|
4.7
|
%
|
4.3
|
%
|
—
|
|
—
|
|
—
|
|
|
Salary scale
|
3.8
|
%
|
3.8
|
%
|
3.8
|
%
|
3.4
|
%
|
3.5
|
%
|
3.5
|
%
|
|
Expected return on plan assets
|
7.3
|
%
|
7.5
|
%
|
7.8
|
%
|
5.5
|
%
|
6.0
|
%
|
6.3
|
%
|
Annually, we undertake a process, with the assistance of our external investment consultants, to evaluate the appropriate projected rates of return to use for our pension plans’ assumptions. We engage our investment consultants' research teams to develop capital market assumptions for each asset category in our plans to project investment returns into the future. The specific methods used to develop expected return assumptions vary by asset category. We adjust the outcomes for the fact that plan assets are invested with actively managed funds and subject to tactical asset reallocation.
Our pension expense was as follows:
|
|
United States
|
International
|
||||||||||||||||
|
(millions)
|
2017
|
2016
|
2015
|
2017
|
2016
|
2015
|
||||||||||||
|
Service cost
|
$
|
14.8
|
|
$
|
21.5
|
|
$
|
23.6
|
|
$
|
6.2
|
|
$
|
7.1
|
|
$
|
8.2
|
|
|
Interest costs
|
31.7
|
|
33.3
|
|
31.6
|
|
10.4
|
|
11.3
|
|
12.0
|
|
||||||
|
Expected return on plan assets
|
(41.4
|
)
|
(40.8
|
)
|
(40.2
|
)
|
(15.3
|
)
|
(16.2
|
)
|
(17.2
|
)
|
||||||
|
Amortization of prior service costs
|
—
|
|
—
|
|
—
|
|
0.7
|
|
0.3
|
|
0.3
|
|
||||||
|
Amortization of net actuarial loss
|
5.8
|
|
12.6
|
|
16.8
|
|
4.1
|
|
4.1
|
|
6.0
|
|
||||||
|
Settlement loss
|
—
|
|
—
|
|
—
|
|
0.6
|
|
—
|
|
—
|
|
||||||
|
|
$
|
10.9
|
|
$
|
26.6
|
|
$
|
31.8
|
|
$
|
6.7
|
|
$
|
6.6
|
|
$
|
9.3
|
|
A rollforward of the benefit obligation, fair value of plan assets and a reconciliation of the pension plans’ funded status as of November 30, the measurement date, follows:
|
|
United States
|
International
|
||||||||||
|
(millions)
|
2017
|
2016
|
2017
|
2016
|
||||||||
|
Change in benefit obligation:
|
||||||||||||
|
Benefit obligation at beginning of year
|
$
|
757.0
|
|
$
|
722.0
|
|
$
|
324.9
|
|
$
|
308.1
|
|
|
Service cost
|
14.8
|
|
21.5
|
|
6.2
|
|
7.1
|
|
||||
|
Interest costs
|
31.7
|
|
33.3
|
|
10.4
|
|
11.3
|
|
||||
|
Employee contributions
|
—
|
|
—
|
|
0.7
|
|
1.1
|
|
||||
|
Plan amendments
|
—
|
|
—
|
|
0.3
|
|
—
|
|
||||
|
Plan curtailments
|
(68.9
|
)
|
—
|
|
(7.8
|
)
|
—
|
|
||||
|
Plan settlements
|
—
|
|
—
|
|
(3.1
|
)
|
—
|
|
||||
|
Actuarial loss
|
65.6
|
|
10.6
|
|
3.3
|
|
47.5
|
|
||||
|
Benefits paid
|
(35.2
|
)
|
(30.4
|
)
|
(15.3
|
)
|
(14.9
|
)
|
||||
|
Business combinations
|
48.7
|
|
—
|
|
—
|
|
—
|
|
||||
|
Expenses paid
|
—
|
|
—
|
|
(0.4
|
)
|
(0.5
|
)
|
||||
|
Foreign currency impact
|
—
|
|
—
|
|
22.3
|
|
(34.8
|
)
|
||||
|
Benefit obligation at end of year
|
$
|
813.7
|
|
$
|
757.0
|
|
$
|
341.5
|
|
$
|
324.9
|
|
|
Change in fair value of plan assets:
|
|
|
|
|||||||||
|
Fair value of plan assets at beginning of year
|
$
|
558.9
|
|
$
|
548.6
|
|
$
|
289.1
|
|
$
|
288.3
|
|
|
Actual return on plan assets
|
90.9
|
|
25.3
|
|
31.5
|
|
38.3
|
|
||||
|
Employer contributions
|
11.4
|
|
15.4
|
|
7.3
|
|
9.7
|
|
||||
|
Employee contributions
|
—
|
|
—
|
|
0.7
|
|
1.1
|
|
||||
|
Plan settlements
|
—
|
|
—
|
|
(3.1
|
)
|
—
|
|
||||
|
Benefits paid
|
(35.2
|
)
|
(30.4
|
)
|
(15.3
|
)
|
(14.9
|
)
|
||||
|
Business combinations
|
28.2
|
|
—
|
|
—
|
|
—
|
|
||||
|
Expenses paid
|
—
|
|
—
|
|
(0.4
|
)
|
(0.5
|
)
|
||||
|
Foreign currency impact
|
—
|
|
—
|
|
21.5
|
|
(32.9
|
)
|
||||
|
Fair value of plan assets at end of year
|
$
|
654.2
|
|
$
|
558.9
|
|
$
|
331.3
|
|
$
|
289.1
|
|
|
Funded status
|
$
|
(159.5
|
)
|
$
|
(198.1
|
)
|
$
|
(10.2
|
)
|
$
|
(35.8
|
)
|
|
Pension plans in which accumulated benefit obligation exceeded plan assets
|
||||||||||||
|
Projected benefit obligation
|
$
|
813.7
|
|
$
|
757.0
|
|
$
|
20.9
|
|
$
|
218.8
|
|
|
Accumulated benefit obligation
|
797.6
|
|
674.9
|
|
16.7
|
|
208.8
|
|
||||
|
Fair value of plan assets
|
654.2
|
|
558.9
|
|
1.6
|
|
191.9
|
|
||||
Included in the U.S. in the preceding table is a benefit obligation of
$105.4 million
and
$95.5 million
for
2017
and
2016
, respectively, related to the SERP. The accumulated benefit obligation related to this plan was
$105.4 million
and
$91.8 million
as of
November 30, 2017
and
2016
, respectively. The assets related to this plan, which totaled
$89.2 million
and
$80.6 million
as of
November 30, 2017
and
2016
, respectively, are held in a rabbi trust and accordingly have not been included in the preceding table.
As part of our acquisition of RB Foods in August 2017, we assumed a defined benefit pension plan that covers eligible union employees of the Reckitt Benckiser food business (the "RB Foods Union Pension Plan"). The related plan assets and benefit obligation of the RB Foods Union Pension Plan are included in the U.S. in the preceding table. As noted in the preceding table, at acquisition date, the funded status of that plan was
$(20.5) million
, representing a benefit obligation of
$48.7 million
less the fair value of plan assets of
$28.2 million
. Plan assets consist of a mix of equities, fixed income funds and real estate funds. At the date of acquisition, based upon a preliminary valuation, the accumulated benefit obligation was
$40.9 million
. During 2017, we made a
$5.0 million
contribution to the RB Foods Union Pension Plan.
Amounts recorded in the balance sheet for all defined benefit pension plans consist of the following:
|
|
United States
|
International
|
||||||||||
|
(millions)
|
2017
|
2016
|
2017
|
2016
|
||||||||
|
Non-current pension asset
|
$
|
—
|
|
$
|
—
|
|
$
|
22.5
|
|
$
|
1.5
|
|
|
Accrued pension liability
|
159.5
|
|
198.1
|
|
32.7
|
|
37.3
|
|
||||
|
Deferred income tax assets
|
69.4
|
|
90.9
|
|
14.2
|
|
16.9
|
|
||||
|
Accumulated other comprehensive loss
|
112.1
|
|
149.2
|
|
57.4
|
|
76.0
|
|
||||
The accumulated benefit obligation is the present value of pension benefits (whether vested or unvested) attributed to employee service rendered before the measurement date and based on employee service and compensation prior to that date. The accumulated benefit obligation differs from the projected benefit obligation in that it includes no assumption about future compensation or service levels. The accumulated benefit obligation for the U.S. pension plans was
$797.6 million
and
$674.9 million
as of
November 30, 2017
and
2016
, respectively. The accumulated benefit obligation for the international pension plans was
$317.2 million
and
$296.9 million
as of
November 30, 2017
and
2016
, respectively.
The investment objectives of the defined benefit pension plans are to provide assets to meet the current and future obligations of the plans at a reasonable cost to us. The goal is to optimize the long-term return across the portfolio of investments at a moderate level of risk. Higher-returning assets include mutual, co-mingled and other funds comprised of equity securities, utilizing both active and passive investment styles. These more volatile assets are balanced with less volatile assets, primarily mutual, co-mingled and other funds comprised of fixed income securities. Professional investment firms are engaged to provide advice on the selection and monitoring of investment funds, and to provide advice on the allocation of plan assets across the various fund managers. This advice is based in part on the duration of each plan’s liability. The investment return performances are evaluated quarterly against specific benchmark indices and against a peer group of funds of the same asset classification.
The allocations of U.S. pension plan assets as of November 30, by asset category, were as follows:
|
|
Actual
|
2017
|
||||
|
Asset Category
|
2017
|
2016
|
Target
|
|||
|
Equity securities
|
68.8
|
%
|
69.0
|
%
|
61.0
|
%
|
|
Fixed income securities
|
16.7
|
%
|
16.7
|
%
|
17.0
|
%
|
|
Other
|
14.5
|
%
|
14.3
|
%
|
22.0
|
%
|
|
Total
|
100.0
|
%
|
100.0
|
%
|
100.0
|
%
|
The allocations of the international pension plans’ assets as of November 30, by asset category, were as follows:
|
|
Actual
|
2017
|
||||
|
Asset Category
|
2017
|
2016
|
Target
|
|||
|
Equity securities
|
53.8
|
%
|
55.7
|
%
|
53.0
|
%
|
|
Fixed income securities
|
46.1
|
%
|
44.2
|
%
|
40.5
|
%
|
|
Other
|
0.1
|
%
|
0.1
|
%
|
6.5
|
%
|
|
Total
|
100.0
|
%
|
100.0
|
%
|
100.0
|
%
|
The following tables set forth by level, within the fair value hierarchy as described in note 8, pension plan assets at their fair value as of
November 30, 2017
and
2016
for the United States and international plans:
|
As of November 30, 2017
|
United States
|
||||||||
|
(millions)
|
Total
fair
value
|
Level 1
|
Level 2
|
||||||
|
Cash and cash equivalents
|
$
|
6.4
|
|
$
|
6.4
|
|
$
|
—
|
|
|
Equity securities:
|
|||||||||
|
U.S. equity securities
(a)
|
305.1
|
|
144.2
|
|
160.9
|
|
|||
|
International equity securities
(b)
|
144.8
|
|
144.8
|
|
—
|
|
|||
|
Fixed income securities:
|
|||||||||
|
U.S. government/corporate bonds
(c)
|
45.3
|
|
45.3
|
|
—
|
|
|||
|
High yield bonds
(d)
|
35.6
|
|
—
|
|
35.6
|
|
|||
|
International/government/corporate bonds
(e)
|
27.1
|
|
27.1
|
|
—
|
|
|||
|
Insurance contracts
(f)
|
1.1
|
|
—
|
|
1.1
|
|
|||
|
Other types of investments:
|
|||||||||
|
Real estate
(g)
|
19.8
|
|
18.3
|
|
1.5
|
|
|||
|
Natural resources
(h)
|
11.4
|
|
—
|
|
11.4
|
|
|||
|
Total
|
$
|
596.6
|
|
$
|
386.1
|
|
$
|
210.5
|
|
|
Investments measured at net asset value
(i)
|
|||||||||
|
Hedge funds
(j)
|
41.5
|
|
|||||||
|
Private equity funds
(k)
|
3.2
|
|
|||||||
|
Private debt funds
(l)
|
12.9
|
|
|||||||
|
Total investments
|
$
|
654.2
|
|
||||||
|
As of November 30, 2017
|
International
|
||||||||
|
(millions)
|
Total
fair
value
|
Level 1
|
Level 2
|
||||||
|
Cash and cash equivalents
|
$
|
0.3
|
|
$
|
0.3
|
|
$
|
—
|
|
|
International equity securities
(b)
|
178.2
|
|
—
|
|
178.2
|
|
|||
|
Fixed income securities:
|
|||||||||
|
U.S./government/ corporate bonds
(c)
|
131.6
|
|
—
|
|
131.6
|
|
|||
|
Insurance contracts
(f)
|
21.2
|
|
—
|
|
21.2
|
|
|||
|
Total investments
|
$
|
331.3
|
|
$
|
0.3
|
|
$
|
331.0
|
|
|
As of November 30, 2016
|
United States
|
||||||||
|
(millions)
|
Total
fair
value
|
Level 1
|
Level 2
|
||||||
|
Cash and cash equivalents
|
$
|
5.9
|
|
$
|
5.9
|
|
$
|
—
|
|
|
Equity securities:
|
|||||||||
|
U.S. equity securities
(a)
|
273.0
|
|
134.0
|
|
139.0
|
|
|||
|
International equity securities
(b)
|
112.6
|
|
112.6
|
|
—
|
|
|||
|
Fixed income securities:
|
|||||||||
|
U.S./government/ corporate bonds
(c)
|
33.5
|
|
33.5
|
|
—
|
|
|||
|
High yield bonds
(d)
|
33.6
|
|
—
|
|
33.6
|
|
|||
|
International/government/ corporate bonds
(e)
|
25.2
|
|
25.2
|
|
—
|
|
|||
|
Insurance contracts
(f)
|
1.1
|
|
—
|
|
1.1
|
|
|||
|
Other types of investments:
|
|||||||||
|
Real estate
(g)
|
16.8
|
|
16.8
|
|
—
|
|
|||
|
Natural resources
(h)
|
12.4
|
|
—
|
|
12.4
|
|
|||
|
Total
|
$
|
514.1
|
|
$
|
328.0
|
|
$
|
186.1
|
|
|
Investments measured at net asset value
(i)
|
|||||||||
|
Hedge funds
(j)
|
40.7
|
|
|||||||
|
Private equity funds
(k)
|
4.1
|
|
|||||||
|
Total investments
|
$
|
558.9
|
|
||||||
|
As of November 30, 2016
|
International
|
||||||||
|
(millions)
|
Total
fair
value
|
Level 1
|
Level 2
|
||||||
|
Cash and cash equivalents
|
$
|
0.1
|
|
$
|
0.1
|
|
$
|
—
|
|
|
International equity securities
(b)
|
161.1
|
|
—
|
|
161.1
|
|
|||
|
Fixed income securities:
|
|||||||||
|
U.S./government/ corporate bonds
(c)
|
107.8
|
|
—
|
|
107.8
|
|
|||
|
Insurance contracts
(f)
|
20.1
|
|
—
|
|
20.1
|
|
|||
|
Total investments
|
$
|
289.1
|
|
$
|
0.1
|
|
$
|
289.0
|
|
|
(a)
|
This category comprises equity funds and collective equity trust funds that most closely track the S&P index and other equity indices.
|
|
(b)
|
This category comprises international equity funds with varying benchmark indices.
|
|
(c)
|
This category comprises funds consisting of U.S. government and U.S. corporate bonds and other fixed income securities. An appropriate benchmark is the Barclays Capital Aggregate Bond Index.
|
|
(d)
|
This category comprises funds consisting of real estate related debt securities with an appropriate benchmark of the Barclays Investment Grade CMBS Index.
|
|
(e)
|
This category comprises funds consisting of international government/corporate bonds and other fixed income securities with varying benchmark indices.
|
|
(f)
|
This category comprises insurance contracts, the majority of which have a guaranteed investment return.
|
|
(g)
|
This category comprises funds investing in real estate investment trusts (REIT). An appropriate benchmark is the MSCI U.S. REIT Index.
|
|
(h)
|
This category comprises funds investing in natural resources. An appropriate benchmark is the Alerian master limited partnership (MLP) Index.
|
|
(i)
|
Certain investments that are valued using the net asset value per share (or its equivalent) as a practical expedient have not been classified in the fair value hierarchy. These are included to permit reconciliation of the fair value hierarchy to the aggregate pension plan assets.
|
|
(j)
|
This category comprises hedge funds investing in strategies represented in various HFRI Fund Indices. The net asset value is generally based on the valuation of the underlying investment. Limitations exist on the timing from notice by the plan of its intent to redeem and actual redemptions of these funds and generally range from a minimum of one month to several months.
|
|
(k)
|
This category comprises private equity, venture capital and limited partnerships. The net asset is based on valuation models of the underlying securities as determined by the general partner or general partner's designee. These valuation models include unobservable inputs that cannot be corroborated using verifiable observable market data. These funds typically have redemption periods of approximately 10 years.
|
|
(l)
|
This category comprises limited partnerships funds investing in senior loans, mezzanine and distressed debt. The net asset is based on valuation models of the underlying securities as determined by the general partner or general partner's designee. These valuation models include unobservable inputs that cannot be corroborated using verifiable observable market data. These funds typically have redemption periods of approximately 10 years.
|
For the plans’ hedge funds, private equity funds and private debt funds, we engage an independent advisor to compare the funds’ returns to other funds with similar strategies. Each fund is required to have an annual audit by an independent accountant, which is provided to the independent advisor. This provides a basis of comparability relative to similar assets.
Equity securities in the U.S. plan included McCormick stock with a fair value of
$39.0 million
(
0.4 million
shares and
6.0%
of total U.S. pension plan assets) and
$35.3 million
(
0.4 million
shares and
6.3%
of total U.S. pension plan assets) at
November 30, 2017
and
2016
, respectively. Dividends paid on these shares were
$0.7 million
in
2017
and in
2016
.
Pension benefit payments in our most significant plans are made from assets of the pension plans. It is anticipated that future benefit payments for the U.S. and International plans for the next 10 fiscal years will be as follows:
|
(millions)
|
United States
|
International
|
||||
|
2018
|
$
|
40.5
|
|
$
|
15.3
|
|
|
2019
|
38.5
|
|
15.9
|
|
||
|
2020
|
39.0
|
|
16.0
|
|
||
|
2021
|
42.1
|
|
16.9
|
|
||
|
2022
|
43.8
|
|
17.0
|
|
||
|
2023-2027
|
237.0
|
|
94.3
|
|
||
U.S. Defined Contribution Retirement Plans
For the U.S. defined contribution retirement plan, we match
100%
of a participant’s contribution up to the first
3%
of the participant’s salary, and
50%
of the next
2%
of the participant’s salary. In addition, we make contributions of
3%
of the participant's salary for U.S. employees not covered by the defined benefit plan. Some of our smaller U.S. subsidiaries sponsor separate 401(k) retirement plans. Our contributions charged to expense under all 401(k) retirement plans were
$12.2 million
,
$10.4 million
and
$9.5 million
in
2017
,
2016
and
2015
, respectively.
At the participant’s election, 401(k) retirement plans held
1.9 million
shares of McCormick stock, with a fair value of
$196.6 million
, at
November 30, 2017
. Dividends paid on these shares in
2017
were
$3.8 million
.
Postretirement Benefits Other Than Pensions
We currently provide postretirement medical and life insurance benefits to certain U.S. employees who were covered under the active employees’ plan and retire after age
55
with at least
five
years of service. The subsidy provided under these plans is based primarily on age at date of retirement. These benefits are not pre-funded but paid as incurred. Employees hired after December 31, 2008 are not eligible for a company subsidy. They are eligible for coverage on an access-only basis.
During 2017, we made the following changes to our postretirement medical and life insurance benefits impacting certain U.S. employees:
|
•
|
On August 23, 2017, our Management Committee approved changes to our postretirement medical benefits plan for eligible U.S. employees and retirees (employees hired after December 31, 2008 are not eligible for the subsidy). These changes included consolidating benefits providers and simplifying and reducing our subsidy for postretirement medical benefits. The effective date of the change in our subsidy is January 1, 2018.
|
|
•
|
On August 23, 2017, our Management Committee approved the elimination of life insurance benefits under our other postretirement benefit plan to eligible U.S. active employees (that life insurance benefit was available to U.S. employees hired on or prior to December 31, 2008). The effective date of this plan amendment is January 1, 2018, unless an employee commits to their retirement date by December 31, 2017 and retires on or before December 31, 2018.
|
As a result of these changes, we remeasured the other postretirement benefit obligation as of August 23, 2017, resulting in a reduction of the other postretirement benefit obligation of
$27.1 million
. These remeasurements resulted in an aggregate non-cash, pre-tax net prior service cost credit of
$27.1 million
, which is included in our consolidated statement of comprehensive income for 2017, as a component of Other comprehensive income (loss) on the line entitled Unrealized components of pension and other postretirement plans. Deferred taxes associated with these aggregate prior service cost credits, together with other unrealized components of pension plans recognized during 2017, are also included in that statement as a component of Other comprehensive income (loss).
Our other postretirement benefit expense follows:
|
(millions)
|
2017
|
2016
|
2015
|
||||||
|
Service cost
|
$
|
2.6
|
|
$
|
2.7
|
|
$
|
3.1
|
|
|
Interest costs
|
3.3
|
|
3.8
|
|
3.7
|
|
|||
|
Amortization of prior service credits
|
(2.3
|
)
|
—
|
|
—
|
|
|||
|
Amortization of actuarial gains
|
(0.2
|
)
|
—
|
|
—
|
|
|||
|
Postretirement benefit expense
|
$
|
3.4
|
|
$
|
6.5
|
|
$
|
6.8
|
|
Rollforwards of the benefit obligation, fair value of plan assets and a reconciliation of the plans’ funded status at November 30, the measurement date, follow:
|
(millions)
|
2017
|
2016
|
||||
|
Change in benefit obligation:
|
||||||
|
Benefit obligation at beginning of year
|
$
|
95.5
|
|
$
|
92.4
|
|
|
Service cost
|
2.6
|
|
2.7
|
|
||
|
Interest costs
|
3.3
|
|
3.8
|
|
||
|
Employee contributions
|
3.2
|
|
3.6
|
|
||
|
Plan amendments
|
(27.1
|
)
|
—
|
|
||
|
Demographic assumptions change
|
2.4
|
|
(0.2
|
)
|
||
|
Other plan assumptions
|
—
|
|
(0.1
|
)
|
||
|
Discount rate change
|
3.7
|
|
0.8
|
|
||
|
Actuarial (gain) loss
|
(3.5
|
)
|
2.0
|
|
||
|
Benefits paid
|
(9.2
|
)
|
(9.5
|
)
|
||
|
Benefit obligation at end of year
|
$
|
70.9
|
|
$
|
95.5
|
|
|
Change in fair value of plan assets:
|
||||||
|
Fair value of plan assets at beginning of year
|
$
|
—
|
|
$
|
—
|
|
|
Employer contributions
|
6.0
|
|
5.9
|
|
||
|
Employee contributions
|
3.2
|
|
3.6
|
|
||
|
Benefits paid
|
(9.2
|
)
|
(9.5
|
)
|
||
|
Fair value of plan assets at end of year
|
$
|
—
|
|
$
|
—
|
|
|
Other postretirement benefit liability
|
$
|
70.9
|
|
$
|
95.5
|
|
Estimated future benefit payments (net of employee contributions) for the next 10 fiscal years are as follows:
|
(millions)
|
Retiree
medical
|
Retiree life
insurance
|
Total
|
||||||
|
2018
|
$
|
4.4
|
|
$
|
1.3
|
|
$
|
5.7
|
|
|
2019
|
4.3
|
|
1.3
|
|
5.6
|
|
|||
|
2020
|
4.2
|
|
1.3
|
|
5.5
|
|
|||
|
2021
|
4.2
|
|
1.3
|
|
5.5
|
|
|||
|
2022
|
4.2
|
|
1.3
|
|
5.5
|
|
|||
|
2023-2027
|
20.3
|
|
6.5
|
|
26.8
|
|
|||
The assumed discount rate in determining the benefit obligation was
3.6%
and
4.1%
for
2017
and
2016
, respectively.
For 2017, the assumed annual rate of increase in the cost of covered health care benefits is
8.0%
(
7.6%
last year). It is assumed to decrease gradually to
4.5%
in the year
2027
(
4.5%
in
2028
last year) and remain at that level thereafter. A one percentage point increase or decrease in the assumed health care cost trend rate would have had an immaterial effect on the benefit obligation and the total of service and interest cost components for 2017.
11. STOCK-BASED COMPENSATION
We have
three
types of stock-based compensation awards: restricted stock units (RSUs), stock options and company stock awarded as part of our long-term performance plan (LTPP). Total stock-based compensation expense for
2017
,
2016
and
2015
was
$23.9 million
,
$25.6 million
and
$18.7 million
, respectively. Total unrecognized stock-based compensation expense related to our RSUs and stock options at
November 30, 2017
was
$16.2 million
and the weighted-average period over which this will be recognized is
1.3 years
. Total unrecognized stock-based compensation expense related to our LTPP is variable in nature and is dependent on the company's execution against established performance metrics under performance cycles related to this plan. As of
November 30, 2017, we have
4.0 million
shares remaining available for future issuance under our RSUs, stock option and LTPP award programs.
For all awards, forfeiture rates are considered in the calculation of compensation expense.
The following summarizes the key terms and the methods of valuation and expense recognition for each of our stock-based compensation awards.
RSUs
RSUs are valued at the market price of the underlying stock, discounted by foregone dividends, on the date of grant. Substantially all of the RSUs granted vest over a
three
-year term or upon retirement. Compensation expense is recorded in the income statement ratably over the shorter of the period until vested or the employee's retirement eligibility date.
A summary of our RSU activity for the years ended November 30 follows:
|
(shares in thousands)
|
2017
|
2016
|
2015
|
||||||||||||
|
|
Shares
|
Weighted-
average
price
|
Shares
|
Weighted-
average
price
|
Shares
|
Weighted-
average
price
|
|||||||||
|
Beginning of year
|
267
|
|
$
|
80.08
|
|
270
|
|
$
|
71.03
|
|
239
|
|
$
|
67.60
|
|
|
Granted
|
131
|
|
94.63
|
|
105
|
|
96.59
|
|
135
|
|
76.06
|
|
|||
|
Vested
|
(118
|
)
|
80.62
|
|
(94
|
)
|
72.21
|
|
(90
|
)
|
69.12
|
|
|||
|
Forfeited
|
(13
|
)
|
90.85
|
|
(14
|
)
|
82.10
|
|
(14
|
)
|
73.22
|
|
|||
|
Outstanding—end of year
|
267
|
|
$
|
86.47
|
|
267
|
|
$
|
80.08
|
|
270
|
|
$
|
71.03
|
|
Stock Options
Stock options are granted with an exercise price equal to the market price of the stock on the date of grant. Substantially all of the options vest ratably over a
three
-year period or upon retirement and are exercisable over a
10
-year period. Upon exercise of the option, shares are issued from our authorized and unissued shares.
The fair value of the options is estimated with a lattice option pricing model which uses the assumptions in the following table. We believe the lattice model provides an appropriate estimate of fair value of our options as it allows for a range of possible outcomes over an option term and can be adjusted for changes in certain assumptions over time. Expected volatilities are based primarily on the historical performance of our stock. We also use historical data to estimate the timing and amount of option exercises and forfeitures within the valuation model. The expected term of the options is an output of the option pricing model and estimates the period of time that options are expected to remain unexercised. The risk-free interest rate is based on the U.S. Treasury yield curve in effect at the time of grant. Compensation expense is calculated based on the fair value of the options on the date of grant. This compensation is recorded in the income statement ratably over the shorter of the period until vested or the employee's retirement eligibility date.
The per share weighted-average fair value for all options granted was
$17.61
,
$17.50
and
$12.52
in
2017
,
2016
and
2015
, respectively. These fair values were computed using the following range of assumptions for our various stock compensation plans for the years ended November 30:
|
2017
|
2016
|
2015
|
||||
|
Risk-free interest rates
|
0.9 - 2.4%
|
|
0.5 - 1.9%
|
|
0.1 - 2.0%
|
|
|
Dividend yield
|
1.9
|
%
|
1.7
|
%
|
2.1
|
%
|
|
Expected volatility
|
18.7%
|
|
18.7%
|
|
18.8%
|
|
|
Expected lives
|
7.6 years
|
|
7.6 years
|
|
7.7 years
|
|
Under our stock option plans, we may issue shares on a net basis at the request of the option holder. This occurs by netting the option cost in shares from the shares exercised.
A summary of our stock option activity for the years ended November 30 follows:
|
(shares in millions)
|
2017
|
2016
|
2015
|
||||||||||||
|
|
Shares
|
Weighted-
average
exercise
price
|
Shares
|
Weighted-
average
exercise
price
|
Shares
|
Weighted-
average
exercise
price
|
|||||||||
|
Beginning of year
|
4.9
|
|
$
|
66.00
|
|
4.8
|
|
$
|
59.20
|
|
4.8
|
|
$
|
54.17
|
|
|
Granted
|
0.6
|
|
98.07
|
|
0.7
|
|
99.92
|
|
0.8
|
|
76.32
|
|
|||
|
Exercised
|
(0.7
|
)
|
50.63
|
|
(0.6
|
)
|
51.26
|
|
(0.7
|
)
|
45.22
|
|
|||
|
Forfeited
|
—
|
|
—
|
|
—
|
|
—
|
|
(0.1
|
)
|
69.67
|
|
|||
|
Outstanding—end of year
|
4.8
|
|
71.91
|
|
4.9
|
|
66.00
|
|
4.8
|
|
59.20
|
|
|||
|
Exercisable—end of year
|
3.8
|
|
$
|
65.34
|
|
3.4
|
|
$
|
56.97
|
|
3.1
|
|
$
|
51.99
|
|
As of
November 30, 2017
, the intrinsic value (the difference between the exercise price and the market price) for all options currently outstanding was
$146.4 million
and for options currently exercisable was
$139.5 million
. At November 30, 2017, the differences between options outstanding and options expected to vest and their related weighted-average exercise prices, aggregate intrinsic values and weighted-average remaining lives were not material. The total intrinsic value of all options exercised during the years ended
November 30, 2017
,
2016
and
2015
was
$31.4 million
,
$25.4 million
and
$25.7 million
, respectively. A summary of our stock options outstanding and exercisable at
November 30, 2017
follows:
|
(shares in millions)
|
Options outstanding
|
Options exercisable
|
||||||||||
|
Range of
exercise price
|
Shares
|
Weighted-
average
remaining
life (yrs.)
|
Weighted-
average
exercise
price
|
Shares
|
Weighted-
average
remaining
life (yrs.)
|
Weighted-
average
exercise
price
|
||||||
|
$29.50 - $54.00
|
1.0
|
|
2.7
|
$
|
42.54
|
|
1.0
|
|
2.7
|
$
|
42.54
|
|
|
$54.01 - $78.50
|
2.5
|
|
6.0
|
69.12
|
|
2.4
|
|
5.9
|
68.69
|
|
||
|
$78.51 - $103.00
|
1.3
|
|
8.8
|
98.92
|
|
0.4
|
|
8.3
|
99.38
|
|
||
|
|
4.8
|
|
5.3
|
$
|
71.91
|
|
3.8
|
|
4.4
|
$
|
65.34
|
|
LTPP
Our LTPP delivers awards in a combination of cash and company stock. The stock compensation portion of the LTPP awards shares of company stock if certain company performance objectives are met at the end of a three-year period. These awards are valued at the market price of the underlying stock on the date of grant. Compensation expense is recorded in the income statement ratably over the
three
-year period of the program based on the number of shares ultimately expected to be awarded using our estimate of the most likely outcome of achieving the performance objectives.
A summary of the LTPP award activity for the years ended November 30 follows:
|
(shares in thousands)
|
2017
|
2016
|
2015
|
||||||||||||
|
|
Shares
|
Weighted-
average
price
|
Shares
|
Weighted-
average
price
|
Shares
|
Weighted-
average price |
|||||||||
|
Beginning of year
|
201
|
|
$
|
78.10
|
|
192
|
|
$
|
70.94
|
|
231
|
|
$
|
61.94
|
|
|
Granted
|
78
|
|
89.96
|
|
108
|
|
86.40
|
|
96
|
|
74.02
|
|
|||
|
Vested
|
(43
|
)
|
69.04
|
|
(18
|
)
|
64.74
|
|
(65
|
)
|
48.78
|
|
|||
|
Performance adjustment
|
(16
|
)
|
74.02
|
|
(41
|
)
|
69.04
|
|
(56
|
)
|
64.74
|
|
|||
|
Forfeited
|
—
|
|
—
|
|
(40
|
)
|
81.78
|
|
(14
|
)
|
70.92
|
|
|||
|
Outstanding—end of year
|
220
|
|
$
|
84.31
|
|
201
|
|
$
|
78.10
|
|
192
|
|
$
|
70.94
|
|
12. INCOME TAXES
The provision for income taxes consists of the following:
|
(millions)
|
2017
|
2016
|
2015
|
||||||
|
Income taxes
|
|||||||||
|
Current
|
|||||||||
|
Federal
|
$
|
67.1
|
|
$
|
127.7
|
|
$
|
78.8
|
|
|
State
|
6.2
|
|
15.1
|
|
9.1
|
|
|||
|
International
|
53.9
|
|
50.2
|
|
42.4
|
|
|||
|
|
127.2
|
|
193.0
|
|
130.3
|
|
|||
|
Deferred
|
|||||||||
|
Federal
|
23.8
|
|
(29.6
|
)
|
9.3
|
|
|||
|
State
|
0.9
|
|
(2.4
|
)
|
0.4
|
|
|||
|
International
|
(0.6
|
)
|
(8.0
|
)
|
(8.7
|
)
|
|||
|
|
24.1
|
|
(40.0
|
)
|
1.0
|
|
|||
|
Total income taxes
|
$
|
151.3
|
|
$
|
153.0
|
|
$
|
131.3
|
|
In 2017, current federal income tax expense decreased by
$60.6 million
from
$127.7 million
in 2016 to
$67.1 million
in 2017. That change was largely offset by a net increase in deferred federal tax expense of
$53.4 million
, from a deferred benefit of
$29.6 million
in 2016 to a deferred expense of
$23.8 million
in 2017. These changes principally are the result of a decrease in deductible temporary differences in 2017, with a resultant decrease in deferred tax assets.
In 2016, current federal income tax expense increased by
$48.9 million
from
$78.8 million
in 2015 to
$127.7 million
in 2016. That change was largely offset by a net increase in deferred federal tax benefit of
$38.9 million
, from a deferred expense of
$9.3 million
in 2015 to a deferred benefit of
$29.6 million
in 2016. These changes principally stemmed from higher pretax income in the U.S. in 2016 compared to the prior year as well as to an increase in deductible temporary differences in 2016, with a resultant increase in deferred tax assets, in order to maximize certain available tax credits.
The components of income from consolidated operations before income taxes follow:
|
(millions)
|
2017
|
2016
|
2015
|
||||||
|
Pretax income
|
|||||||||
|
United States
|
$
|
382.1
|
|
$
|
383.3
|
|
$
|
308.3
|
|
|
International
|
212.7
|
|
205.9
|
|
187.9
|
|
|||
|
|
$
|
594.8
|
|
$
|
589.2
|
|
$
|
496.2
|
|
A reconciliation of the U.S. federal statutory rate with the effective tax rate follows:
|
2017
|
2016
|
2015
|
||||
|
Federal statutory tax rate
|
35.0
|
%
|
35.0
|
%
|
35.0
|
%
|
|
State income taxes, net of federal benefits
|
0.8
|
|
1.4
|
|
1.2
|
|
|
International tax at different effective rates
|
(4.8
|
)
|
(6.7
|
)
|
(7.6
|
)
|
|
U.S. tax on remitted and unremitted earnings
|
0.4
|
|
0.4
|
|
1.1
|
|
|
Stock compensation expense
|
(1.6
|
)
|
—
|
|
—
|
|
|
U.S. manufacturing deduction
|
(1.8
|
)
|
(2.2
|
)
|
(1.9
|
)
|
|
Changes in prior year tax contingencies
|
(2.1
|
)
|
(1.8
|
)
|
(2.1
|
)
|
|
Other, net
|
(0.5
|
)
|
(0.1
|
)
|
0.8
|
|
|
Total
|
25.4
|
%
|
26.0
|
%
|
26.5
|
%
|
Deferred tax assets and liabilities are comprised of the following:
|
(millions)
|
2017
|
2016
|
||||
|
Deferred tax assets
|
||||||
|
Employee benefit liabilities
|
$
|
146.8
|
|
$
|
184.5
|
|
|
Other accrued liabilities
|
51.7
|
|
42.2
|
|
||
|
Inventory
|
12.4
|
|
5.5
|
|
||
|
Tax loss and credit carryforwards
|
50.2
|
|
39.3
|
|
||
|
Other
|
18.7
|
|
15.1
|
|
||
|
Valuation allowance
|
(26.0
|
)
|
(10.5
|
)
|
||
|
|
253.8
|
|
276.1
|
|
||
|
Deferred tax liabilities
|
||||||
|
Depreciation
|
52.3
|
|
38.1
|
|
||
|
Intangible assets
|
1,246.0
|
|
262.5
|
|
||
|
Other
|
6.1
|
|
6.1
|
|
||
|
|
1,304.4
|
|
306.7
|
|
||
|
Net deferred tax liability
|
$
|
(1,050.6
|
)
|
$
|
(30.6
|
)
|
At
November 30, 2017
, our non-U.S. subsidiaries have tax loss carryforwards of
$194.2 million
. Of these carryforwards,
$7.6 million
expire in 2018,
$7.6 million
from 2019 through 2020,
$49.5 million
from 2021 through 2028 and
$129.5 million
may be carried forward indefinitely.
At
November 30, 2017
, we have tax credit carryforwards of
$12.3 million
, all of which expire in
2022
.
A valuation allowance has been provided to record deferred tax assets at their net realizable value based on a more likely than not criteria. The
$15.5 million
net increase in the valuation allowance from 2016 was mainly due to subsidiaries' net operating losses which may not be realized in future periods.
U.S. income taxes are not provided for unremitted earnings of international subsidiaries and affiliates where our intention is to reinvest these earnings permanently. Unremitted earnings of such entities were
$1.8 billion
at
November 30, 2017
. Upon distribution of these earnings, we could be subject to both U.S. income taxes and withholding taxes. Determination of the unrecognized deferred income tax liability is not practical because of the complexities involved with this hypothetical calculation. See note 19.
The total amount of unrecognized tax benefits as of
November 30, 2017
and
November 30, 2016
were
$39.1 million
and
$58.3 million
, respectively. If recognized,
$26.6 million
of these tax benefits as of November 30, 2017 would affect the effective tax rate.
The following table summarizes the activity related to our gross unrecognized tax benefits for the years ended November 30:
|
(millions)
|
2017
|
2016
|
2015
|
||||||
|
Balance at beginning of year
|
$
|
58.3
|
|
$
|
56.5
|
|
$
|
55.7
|
|
|
Additions for current year tax positions
|
7.3
|
|
10.3
|
|
8.9
|
|
|||
|
Additions for prior year tax positions
|
0.9
|
|
2.4
|
|
3.2
|
|
|||
|
Reductions for prior year tax positions
|
(8.4
|
)
|
—
|
|
(0.8
|
)
|
|||
|
Settlements
|
(18.1
|
)
|
—
|
|
(0.1
|
)
|
|||
|
Statute expirations
|
(2.1
|
)
|
(10.0
|
)
|
(8.1
|
)
|
|||
|
Foreign currency translation
|
1.2
|
|
(0.9
|
)
|
(2.3
|
)
|
|||
|
Balance at November 30
|
$
|
39.1
|
|
$
|
58.3
|
|
$
|
56.5
|
|
We record interest and penalties on income taxes in income tax expense. We recognized interest and penalty expense (income) of
$0.4 million
,
$1.2 million
and
$(0.1) million
in 2017, 2016 and 2015, respectively. As of
November 30, 2017
and
2016
, we had accrued
$5.3 million
and
$5.7 million
, respectively, of interest and penalties related to unrecognized tax benefits.
Tax settlements or statute of limitation expirations could result in a change to our uncertain tax positions. We believe that the reasonably possible total amount of unrecognized tax benefits as of November 30, 2017 that could decrease in the next 12 months as a result of various statute expirations, audit closures and/or tax settlements would not be material.
We file income tax returns in the U.S. federal jurisdiction and various state and non-U.S. jurisdictions. The open years subject to tax audits vary depending on the tax jurisdictions. In major jurisdictions, we are no longer subject to income tax audits by taxing authorities for years before 2010.
We are under normal recurring tax audits in the U.S. and in several jurisdictions outside the U.S. While it is often difficult to predict the final outcome or the timing of resolution of any particular uncertain tax position, we believe that our reserves for uncertain tax positions are adequate to cover existing risks and exposures.
13. EARNINGS PER SHARE AND STOCK ISSUANCE
During 2017, we issued approximately
6.35 million
shares of our common stock non-voting in connection with our acquisition of RB Foods (see note 2), which included approximately
0.8 million
shares from the exercise of the underwriters' option to purchase additional shares. The net proceeds from this issuance, after the underwriting discount and related expenses, was
$554.0 million
.
The reconciliation of shares outstanding used in the calculation of basic and diluted earnings per share for the years ended November 30 follows:
|
(millions)
|
2017
|
2016
|
2015
|
|||
|
Average shares outstanding—basic
|
126.8
|
|
126.6
|
|
128.0
|
|
|
Effect of dilutive securities:
|
||||||
|
Stock options/RSUs/LTPP
|
1.6
|
|
1.4
|
|
1.2
|
|
|
Average shares outstanding—diluted
|
128.4
|
|
128.0
|
|
129.2
|
|
The following table sets forth the stock options and RSUs for the years ended November 30 which were not considered in our earnings per share calculation since they were antidilutive:
|
(millions)
|
2017
|
2016
|
2015
|
|||
|
Antidilutive securities
|
1.1
|
|
0.5
|
|
0.4
|
|
14. CAPITAL STOCK
Holders of Common Stock have full voting rights except that (1) the voting rights of persons who are deemed to own beneficially 10% or more of the outstanding shares of Common Stock are limited to
10%
of the votes entitled to be cast by all holders of shares of Common Stock regardless of how many shares in excess of 10% are held by such person; (2) we have the right to redeem any or all shares of stock owned by such person unless such person acquires more than
90%
of the outstanding shares of each class of our common stock; and (3) at such time as such person controls more than
50%
of the vote entitled to be cast by the holders of outstanding shares of Common Stock, automatically, on a share-for-share basis, all shares of Common Stock Non-Voting will convert into shares of Common Stock.
Holders of Common Stock Non-Voting will vote as a separate class on all matters on which they are entitled to vote. Holders of Common Stock Non-Voting are entitled to vote on reverse mergers and statutory share exchanges where our capital stock is converted into other securities or property, dissolution of the company and the sale of substantially all of our assets, as well as forward mergers and consolidation of the company.
15. COMMITMENTS AND CONTINGENCIES
During the normal course of our business, we are occasionally involved with various claims and litigation. Reserves are established in connection with such matters when a loss is probable and the amount of such loss can be reasonably estimated. At
November 30, 2017
and
2016
, no material reserves were recorded. The determination of probability and the estimation of the actual amount of any such loss are inherently unpredictable, and it is therefore possible that the eventual outcome of such claims and litigation could exceed the estimated reserves, if any. However, we believe that the likelihood that any such excess might have a material adverse effect on our financial statements is remote.
16. BUSINESS SEGMENTS AND GEOGRAPHIC AREAS
Business Segments
We operate in two business segments: consumer and industrial. The consumer and industrial segments manufacture, market and distribute spices, seasoning mixes, condiments and other flavorful products throughout the world. Our consumer segment sells to retail channels, including grocery, mass merchandise, warehouse clubs, discount and drug stores, and e-commerce under the “McCormick” brand and a variety of brands around the world, including “French's,” “Frank's RedHot,” “Lawry’s,” “Zatarain’s,” “Simply Asia,” “Thai Kitchen,” “Ducros,” “Vahiné,” “Schwartz,” “Club House,” “Kamis,” “Kohinoor,” "DaQiao," "Drogheria & Alimentari," "Stubb's" and "Gourmet Garden." Our industrial segment sells to food manufacturers and the foodservice industry both directly and indirectly through distributors.
In each of our segments, we produce and sell many individual products which are similar in composition and nature. With their primary attribute being flavor, we regard the products within each of our segments to be fairly homogenous. It is impracticable to segregate and identify sales and profits for each of these individual product lines.
Historically we have measured segment performance based on operating income excluding special charges as this activity is managed separately from the business segments. Beginning in 2017, we also are excluding transaction and integration expenses related to our acquisition of RB Foods from our measure of segment performance as these expenses are similarly managed separately from the business segments. These transaction and integration expenses excluded from our segment performance measure include the amortization of the acquisition-date fair value adjustment of inventories that is included in cost of goods sold, costs directly associated with that acquisition and costs associated with integrating the RB Foods business. Although the segments are managed separately due to their distinct distribution channels and marketing strategies, manufacturing and warehousing are often integrated to maximize cost efficiencies. We do not segregate jointly utilized assets by individual segment for internal reporting, evaluating performance or allocating capital. Because of manufacturing integration for certain products within the segments, products are not sold from one segment to another but rather inventory is transferred at cost. Intersegment sales are not material.
We have a large number of customers for our products. Sales to one of our consumer segment customers, Wal-Mart Stores, Inc., accounted for
11%
of consolidated sales in
2017
,
2016
and
2015
. Sales to one of our industrial segment customers, PepsiCo, Inc., accounted for
11%
of consolidated sales in
2017
,
2016
and
2015
.
Accounting policies for measuring segment operating income and assets are consistent with those described in note 1. Because of integrated manufacturing for certain products within the segments, products are not sold from one segment to another but rather inventory is transferred at cost. Inter-segment sales are not material. Corporate assets include cash, deferred taxes, investments and certain fixed assets.
Business Segment Results
|
(millions)
|
Consumer
|
Industrial
|
Total
segments
|
Corporate
& other
|
Total
|
||||||||||
|
2017
|
|||||||||||||||
|
Net sales
|
$
|
2,970.1
|
|
$
|
1,864.0
|
|
$
|
4,834.1
|
|
$
|
—
|
|
$
|
4,834.1
|
|
|
Operating income excluding special charges and transaction and integration expenses
|
564.2
|
|
222.1
|
|
786.3
|
|
—
|
|
786.3
|
|
|||||
|
Income from unconsolidated operations
|
28.9
|
|
5.0
|
|
33.9
|
|
—
|
|
33.9
|
|
|||||
|
Assets
|
—
|
|
—
|
|
10,036.7
|
|
349.1
|
|
10,385.8
|
|
|||||
|
Capital expenditures
|
—
|
|
—
|
|
153.6
|
|
28.8
|
|
182.4
|
|
|||||
|
Depreciation and amortization
|
—
|
|
—
|
|
99.8
|
|
25.4
|
|
125.2
|
|
|||||
|
2016
|
|||||||||||||||
|
Net sales
|
$
|
2,753.2
|
|
$
|
1,658.3
|
|
$
|
4,411.5
|
|
$
|
—
|
|
$
|
4,411.5
|
|
|
Operating income excluding special charges
|
490.8
|
|
166.2
|
|
657.0
|
|
—
|
|
657.0
|
|
|||||
|
Income from unconsolidated operations
|
30.7
|
|
5.4
|
|
36.1
|
|
—
|
|
36.1
|
|
|||||
|
Assets
|
—
|
|
—
|
|
4,387.8
|
|
248.1
|
|
4,635.9
|
|
|||||
|
Capital expenditures
|
—
|
|
—
|
|
120.1
|
|
33.7
|
|
153.8
|
|
|||||
|
Depreciation and amortization
|
—
|
|
—
|
|
71.7
|
|
37.0
|
|
108.7
|
|
|||||
|
2015
|
|||||||||||||||
|
Net sales
|
$
|
2,635.2
|
|
$
|
1,661.1
|
|
$
|
4,296.3
|
|
$
|
—
|
|
$
|
4,296.3
|
|
|
Operating income excluding special charges
|
456.1
|
|
157.8
|
|
613.9
|
|
—
|
|
613.9
|
|
|||||
|
Income from unconsolidated operations
|
36.0
|
|
0.7
|
|
36.7
|
|
—
|
|
36.7
|
|
|||||
|
Assets
|
—
|
|
—
|
|
4,225.4
|
|
247.2
|
|
4,472.6
|
|
|||||
|
Capital expenditures
|
—
|
|
—
|
|
102.8
|
|
25.6
|
|
128.4
|
|
|||||
|
Depreciation and amortization
|
—
|
|
—
|
|
71.8
|
|
34.1
|
|
105.9
|
|
|||||
A reconciliation of operating income excluding special charges, and for 2017, transaction and integration expenses, to operating income for 2017, 2016 and 2015 is as follows:
|
(millions)
|
Consumer
|
Industrial
|
Total
|
||||||||
|
2017
|
|||||||||||
|
Operating income excluding special charges and transaction and integration expenses
|
$
|
564.2
|
|
$
|
222.1
|
|
$
|
786.3
|
|
||
|
Less: Special charges
|
15.3
|
|
6.9
|
|
22.2
|
|
|||||
|
Less: Transaction and integration expenses included in cost of goods sold
|
13.6
|
|
7.3
|
|
20.9
|
|
|||||
|
Less: Other transaction and integration expenses
|
27.1
|
|
13.7
|
|
40.8
|
|
|||||
|
Operating income
|
$
|
508.2
|
|
$
|
194.2
|
|
$
|
702.4
|
|
||
|
|
|||||||||||
|
2016
|
|||||||||||
|
Operating income excluding special charges
|
$
|
490.8
|
|
$
|
166.2
|
|
$
|
657.0
|
|
||
|
Less: Special charges included in cost of goods sold
|
0.3
|
|
—
|
|
0.3
|
|
|||||
|
Less: Other special charges
|
8.9
|
|
6.8
|
|
15.7
|
|
|||||
|
Operating income
|
$
|
481.6
|
|
$
|
159.4
|
|
$
|
641.0
|
|
||
|
2015
|
|||||||||||
|
Operating income excluding special charges
|
$
|
456.1
|
|
$
|
157.8
|
|
$
|
613.9
|
|
||
|
Less: Special charges included in cost of goods sold
|
4.0
|
|
—
|
|
4.0
|
|
|||||
|
Less: Other special charges
|
48.8
|
|
12.7
|
|
61.5
|
|
|||||
|
Operating income
|
$
|
403.3
|
|
$
|
145.1
|
|
$
|
548.4
|
|
||
Geographic Areas
We have net sales and long-lived assets in the following geographic areas:
|
(millions)
|
United
States
|
EMEA
|
Other
countries
|
Total
|
||||||||
|
2017
|
|
|||||||||||
|
Net sales
|
$
|
2,859.6
|
|
$
|
951.6
|
|
$
|
1,022.9
|
|
$
|
4,834.1
|
|
|
Long-lived assets
|
6,357.9
|
|
1,129.1
|
|
883.3
|
|
8,370.3
|
|
||||
|
2016
|
||||||||||||
|
Net sales
|
$
|
2,565.3
|
|
$
|
896.0
|
|
$
|
950.2
|
|
$
|
4,411.5
|
|
|
Long-lived assets
|
1,499.9
|
|
846.5
|
|
519.3
|
|
2,865.7
|
|
||||
|
2015
|
||||||||||||
|
Net sales
|
$
|
2,438.1
|
|
$
|
903.7
|
|
$
|
954.5
|
|
$
|
4,296.3
|
|
|
Long-lived assets
|
1,462.2
|
|
871.9
|
|
415.7
|
|
2,749.8
|
|
||||
Long-lived assets include property, plant and equipment, goodwill and intangible assets, net of accumulated depreciation and amortization.
17. SUPPLEMENTAL FINANCIAL STATEMENT DATA
Supplemental income statement, balance sheet and cash flow information follows:
|
(millions)
|
2017
|
2016
|
||||
|
Inventories
|
||||||
|
Finished products
|
$
|
398.1
|
|
$
|
336.3
|
|
|
Raw materials and work-in-process
|
395.2
|
|
420.0
|
|
||
|
|
$
|
793.3
|
|
$
|
756.3
|
|
|
Prepaid expenses
|
$
|
32.4
|
|
$
|
23.6
|
|
|
Other current assets
|
49.4
|
|
58.3
|
|
||
|
|
$
|
81.8
|
|
$
|
81.9
|
|
|
Property, plant and equipment
|
||||||
|
Land and improvements
|
$
|
63.2
|
|
$
|
62.4
|
|
|
Buildings
|
488.3
|
|
402.9
|
|
||
|
Machinery and equipment
|
882.0
|
|
730.1
|
|
||
|
Software
|
332.5
|
|
317.8
|
|
||
|
Construction-in-progress
|
99.9
|
|
117.0
|
|
||
|
Accumulated depreciation
|
(1,056.8
|
)
|
(960.8
|
)
|
||
|
|
$
|
809.1
|
|
$
|
669.4
|
|
|
Investments and other assets
|
||||||
|
Investments in affiliates
|
$
|
163.6
|
|
$
|
134.6
|
|
|
Long-term investments
|
127.0
|
|
116.2
|
|
||
|
Other assets
|
107.9
|
|
97.6
|
|
||
|
|
$
|
398.5
|
|
$
|
348.4
|
|
|
Other accrued liabilities
|
||||||
|
Payroll and employee benefits
|
$
|
181.3
|
|
$
|
161.5
|
|
|
Sales allowances
|
146.6
|
|
125.0
|
|
||
|
Other
|
396.3
|
|
292.2
|
|
||
|
|
$
|
724.2
|
|
$
|
578.7
|
|
|
Other long-term liabilities
|
||||||
|
Pension
|
$
|
169.5
|
|
$
|
231.1
|
|
|
Postretirement benefits
|
65.8
|
|
88.4
|
|
||
|
Unrecognized tax benefits
|
28.9
|
|
49.7
|
|
||
|
Other
|
65.0
|
|
72.0
|
|
||
|
|
$
|
329.2
|
|
$
|
441.2
|
|
|
(millions)
|
2017
|
2016
|
2015
|
||||||
|
Depreciation
|
$
|
85.2
|
|
$
|
71.2
|
|
$
|
71.5
|
|
|
Software amortization
|
14.5
|
|
17.1
|
|
18.1
|
|
|||
|
Interest paid
|
72.1
|
|
57.5
|
|
52.2
|
|
|||
|
Income taxes paid
|
155.6
|
|
151.0
|
|
111.5
|
|
|||
Dividends paid per share were
$1.88
in
2017
,
$1.72
in
2016
and
$1.60
in
2015
. Dividends declared per share were
$1.93
in 2017,
$1.76
in 2016, and
$1.63
in 2015.
18. SELECTED QUARTERLY DATA (UNAUDITED)
|
(millions except per share data)
|
First
|
Second
|
Third
|
Fourth
|
||||||||
|
2017
|
||||||||||||
|
Net sales
|
$
|
1,043.7
|
|
$
|
1,114.3
|
|
$
|
1,185.2
|
|
$
|
1,490.9
|
|
|
Gross profit
|
413.0
|
|
444.6
|
|
484.4
|
|
668.2
|
|
||||
|
Operating income
|
134.2
|
|
132.6
|
|
168.7
|
|
266.9
|
|
||||
|
Net income
|
93.5
|
|
100.0
|
|
108.2
|
|
175.7
|
|
||||
|
Basic earnings per share
|
0.75
|
|
0.80
|
|
0.86
|
|
1.34
|
|
||||
|
Diluted earnings per share
|
0.74
|
|
0.79
|
|
0.85
|
|
1.32
|
|
||||
|
Dividends paid per share—
|
||||||||||||
|
Common Stock and Common Stock Non-Voting
|
0.47
|
|
0.47
|
|
0.47
|
|
0.47
|
|
||||
|
Dividends declared per share—
|
||||||||||||
|
Common Stock and Common Stock Non-Voting
|
—
|
|
0.47
|
|
0.47
|
|
0.99
|
|
||||
|
Market price—Common Stock
|
||||||||||||
|
High
|
98.90
|
|
104.26
|
|
105.64
|
|
102.72
|
|
||||
|
Low
|
89.23
|
|
97.33
|
|
92.15
|
|
93.70
|
|
||||
|
Market price—Common Stock Non-Voting
|
||||||||||||
|
High
|
99.33
|
|
104.48
|
|
105.92
|
|
102.64
|
|
||||
|
Low
|
88.78
|
|
97.53
|
|
92.07
|
|
93.99
|
|
||||
|
2016
|
||||||||||||
|
Net sales
|
$
|
1,030.2
|
|
$
|
1,063.3
|
|
$
|
1,091.0
|
|
$
|
1,227.0
|
|
|
Gross profit
|
405.0
|
|
432.8
|
|
453.9
|
|
540.0
|
|
||||
|
Operating income
|
129.1
|
|
125.0
|
|
167.8
|
|
219.1
|
|
||||
|
Net income
|
93.4
|
|
93.8
|
|
127.7
|
|
157.4
|
|
||||
|
Basic earnings per share
|
0.73
|
|
0.74
|
|
1.01
|
|
1.25
|
|
||||
|
Diluted earnings per share
|
0.73
|
|
0.73
|
|
1.00
|
|
1.24
|
|
||||
|
Dividends paid per share—
|
||||||||||||
|
Common Stock and Common Stock Non-Voting
|
0.43
|
|
0.43
|
|
0.43
|
|
0.43
|
|
||||
|
Dividends declared per share—
|
||||||||||||
|
Common Stock and Common Stock Non-Voting
|
—
|
|
0.43
|
|
0.43
|
|
0.90
|
|
||||
|
Market price—Common Stock
|
||||||||||||
|
High
|
94.10
|
|
100.06
|
|
107.05
|
|
102.01
|
|
||||
|
Low
|
79.53
|
|
91.32
|
|
96.92
|
|
91.06
|
|
||||
|
Market price—Common Stock Non-Voting
|
||||||||||||
|
High
|
94.10
|
|
100.71
|
|
107.07
|
|
101.98
|
|
||||
|
Low
|
79.78
|
|
91.39
|
|
97.18
|
|
91.08
|
|
||||
Operating income for the first quarter of 2017 included
$3.6 million
of special charges, with an after-tax impact of
$2.5 million
and a per share impact of
$0.02
for both basic and diluted earnings per share. Operating income for the second quarter of 2017 included
$4.7 million
of special charges, with an after-tax impact of
$3.4 million
and a per share impact of
$0.03
for both basic and diluted earnings per share. Operating income for the third quarter of 2017 included
$4.7 million
of special charges, with an after-tax impact of
$3.2 million
and a per share impact of
$0.03
for both basic and diluted earnings per share. Operating income for the third quarter of 2017 included
$30.4 million
of transaction and integration expenses, including
$5.9 million
reflected in gross profit. Net income for the third quarter of 2017 also included a pre-tax charge of
$15.4 million
reflected in other debt costs. For the third quarter of 2017, the after-tax impact of transaction and integration expenses and other debt costs was
$31.1 million
and a per share
impact of
$0.25
and
$0.24
for basic and diluted earnings per share, respectively. Operating income for the fourth quarter of 2017 included
$9.2 million
of special charges, with an after-tax impact of
$6.7 million
and a per share impact of
$0.05
for both basic and diluted earnings per share. Operating income for the fourth quarter of 2017 included
$31.3 million
of transaction and integration expenses, including
$15.0 million
reflected in gross profit, with an after-tax impact of
$22.4 million
and a per share impact of
$0.17
for both basic and diluted earnings per share.
Operating income for the first quarter of 2016 included
$1.6 million
of special charges, with an after-tax impact of
$1.3 million
and a per share impact of
$0.01
for both basic and diluted earnings per share. Operating income for the second quarter of 2016 included
$3.9 million
of special charges, with an after-tax impact of
$2.7 million
and a per share impact of
$0.02
for both basic and diluted earnings per share. Operating income for the third quarter of 2016 included
$4.3 million
of special charges, with an after-tax impact of
$3.4 million
and a per share impact of
$0.03
for both basic and diluted earnings per share. Operating income for the fourth quarter of 2016 included
$6.2 million
of special charges, including
$0.3 million
reflected in gross profit, with an after-tax impact of
$3.7 million
and a per share impact of
$0.03
for both basic and diluted earnings per share.
See notes 2 and 3 for details with respect to the transaction and integration expenses and actions undertaken in connection with these special charges, respectively.
Earnings per share are computed independently for each of the quarters presented. Therefore, the sum of the quarters may not be equal to the full year earnings per share.
19. SUBSEQUENT EVENTS (UNAUDITED)
On December 22, 2017, President Trump signed into law H.R. 1, “An Act to provide for reconciliation pursuant to titles II and V of the concurrent resolution on the budget for fiscal year 2018” (this legislation was formerly called the “Tax Cuts and Jobs Act” and is referred to herein as the “U.S. Tax Act”). The U.S. Tax Act provides for significant changes in the U.S. Internal Revenue Code of 1986, as amended. Certain provisions of the U.S. Tax Act will be effective during our fiscal year ending November 30, 2018 with all provisions of the U.S. Tax Act effective as of the beginning of our fiscal year ending November 30, 2019. As the U.S. Tax Act was enacted after our year end of November 30, 2017, it had no impact on our fiscal 2017 financial results. The U.S. Tax Act contains provisions with separate effective dates but is generally effective for taxable years beginning after December 31, 2017.
Beginning on January 1, 2018, the U.S. Tax Act lowers the U.S. corporate income tax rate from
35%
to
21%
on our U.S. earnings from that date and beyond. We estimate that the revaluation of our U.S. deferred tax assets and liabilities to the
21%
corporate tax rate will reduce our net U.S. deferred income tax liability by approximately
$400 million
and will be reflected as a reduction in our income tax expense in our results for the quarter ending February 28, 2018.
The U.S. Tax Act imposes a tax on post-1986 earnings of non-U.S. affiliates that have not been repatriated for purposes of U.S. federal income tax, with those earnings taxed at rates of 15.5% for earnings reflected by cash and cash equivalent items and 8% for other assets. We estimate this tax to be in the range of
$70 million
to
$90 million
, which we will recognize as a component of income tax expense in our results for the quarter ending February 28, 2018. The cash tax effects of this deemed repatriation can be remitted in installments over an eight-year period and we intend to do so. In addition to the previously described deemed repatriation tax, ranging from
$70 million
to
$90 million
, we would also be subject to additional foreign withholding taxes were those related underlying earnings of non-U.S. affiliates subsequently to be repatriated to the U.S.
The ultimate impact of the U.S. Tax Act on our reported results in 2018 may differ from the estimates provided herein, possibly materially, due to, among other things, changes in interpretations and assumptions we have made, guidance that may be issued, and other actions we may take as a result of the U.S. Tax Act different from that presently contemplated.
None.
Disclosure Controls and Procedures
Our management, with the participation of our Chief Executive Officer and Chief Financial Officer, has evaluated the effectiveness of our disclosure controls and procedures, as defined in Rule 13a-15(e) of the Securities Exchange Act of 1934, as of the end of the period covered by this report. Based on that evaluation, our Chief Executive Officer and Chief Financial Officer concluded that, as of the end of the period covered by this report, our disclosure controls and procedures were effective.
Internal Control over Financial Reporting
Management’s report on our internal control over financial reporting and the report of our Independent Registered Public Accounting Firm on internal control over financial reporting are included in our 2017 financial statements in Item 8 of this Report under the captions entitled “Report of Management” and Report of Independent Registered Public Accounting Firm.” As noted in those reports, our assessment of the effectiveness of our internal control over financial reporting as of November 30, 2017 (and the related assessment of our Independent Registered Public Accounting Firm) did not include an assessment of the effectiveness of internal control over financial reporting of RB Foods, which was acquired on August 17, 2017. The operating results of RB Foods are included in our consolidated financial statements from the period subsequent to the acquisition date and, excluding goodwill and intangible assets, include $164 million of assets as of November 30, 2017, and $190 million in net sales for the year then ended. We will include RB Foods in our 2018 annual assessment of internal control over financial reporting.
No change occurred in our “internal control over financial reporting” (as defined in Rule 13a-15(f)) during our last fiscal quarter which has materially affected or is reasonably likely to materially affect, our internal control over financial reporting.
None.
|
|
Information responsive to this item is set forth in the sections titled “Corporate Governance,” “Election of Directors” and “Section 16(a) Beneficial Ownership Reporting Compliance” in our 2018 Proxy Statement, incorporated by reference herein, to be filed within 120 days after the end of our fiscal year.
In addition to the executive officers described in the 2018 Proxy Statement incorporated by reference in this Item 10 of this Report, the following individuals are also executive officers of McCormick: Lisa B. Manzone and Nneka L. Rimmer.
Ms. Manzone is 53 years old and, during the last five years, has held the following positions with McCormick: June 2015 to present–Senior Vice President, Human Relations; January 2015 to June 2015–Vice President Global Human Relations; January 2013 to January 2015–Vice President Compensation and Benefits; October 2010 to January 2013–Vice President, Human Relations U.S. Consumer Products Division.
Ms. Rimmer is 46 years old and joined McCormick in April 2015 as Senior Vice President, Corporate Strategy and Development. In August 2017, Ms. Rimmer became Senior Vice President, Strategy and Global Enablement. Before joining McCormick, Ms. Rimmer was Partner and Managing Director with the Boston Consulting Group where she had 13 years of experience designing, executing and leveraging successful large-scale transformational initiatives, working with large global consumer goods corporations.
We have adopted a code of ethics that applies to all employees, including our principal executive officer, principal financial officer, principal accounting officer, and our Board of Directors. A copy of the code of ethics is available on our internet website at www.mccormickcorporation.com. We will satisfy the disclosure requirement under Item 5.05 of Form 8-K regarding any material amendment to our code of ethics, and any waiver from a provision of our code
of ethics that applies to our principal executive officer, principal financial officer, principal accounting officer, or persons performing similar functions, by posting such information on our website at the internet website address set forth above.
Information responsive to this item is incorporated herein by reference to the sections titled “Compensation of Directors,” “Compensation Discussion and Analysis,” “Compensation Committee Report,” “Summary Compensation Table,” “Grants of Plan-Based Awards,” “Narrative to the Summary Compensation Table,” “Outstanding Equity Awards at Fiscal Year-End,” “Option Exercises and Stock Vested in Last Fiscal Year,” “Retirement Benefits,” “Non-Qualified Deferred Compensation,” “Potential Payments Upon Termination or Change in Control,” “Compensation Committee Interlocks and Insider Participation” and “Equity Compensation Plan Information” in the 2018 Proxy Statement.
Information responsive to this item is incorporated herein by reference to the sections titled “Principal Stockholders,” “Election of Directors” and “Equity Compensation Plan Information” in the 2018 Proxy Statement.
Information responsive to this item is incorporated herein by reference to the section entitled “Corporate Governance” in the 2018 Proxy Statement.
Information responsive to this item is incorporated herein by reference to the section titled “Report of Audit Committee and Fees of Independent Registered Public Accounting Firm” in the 2018 Proxy Statement.
|
|
List of documents filed as part of this Report.
1. Consolidated Financial Statements
The Consolidated Financial Statements for McCormick & Company, Incorporated and related notes, together with the Report of Management, and the Reports of Ernst & Young LLP dated January 25, 2018, are included herein in Part II, Item 8.
2. Consolidated Financial Statement Schedule
Supplemental Financial Schedule:
II–Valuation and Qualifying Accounts
Schedules other than that listed above are omitted because of the absence of the conditions under which they are required or because the information called for is included in the consolidated financial statements or notes thereto.
3. Exhibits required to be filed by Item 601 of Regulation S-K
The information called for by this item is incorporated herein by reference from the Exhibit Index included in this Report.
EXHIBIT INDEX
The Stock Purchase Agreement (Exhibit 2(i)) has been filed to provide investors and security holders with information regarding its terms. It is not intended to provide any other information about the Acquired Business, sellers or McCormick. The Agreement contains representations, warranties and covenants of the parties thereto made to and solely for the benefit of each other, and such representations, warranties and covenants may be subject to materiality and other qualifiers applicable to the contracting parties that differ from those that may be viewed as material to investors. The assertions embodied in those representations, warranties and covenants are qualified by information in confidential disclosure schedules that the sellers delivered in connection with the execution of the Agreement and were made only as of the date of the Agreement. Accordingly, investors and security holders should not rely on the representations, warranties and covenants as characterizations of the actual state of facts. Moreover, information concerning the subject matter of the representations, warranties and covenants may change after the date of the Agreement, which subsequent information may or may not be fully reflected in McCormick’s public disclosures.
The following exhibits are attached or incorporated herein by reference:
|
|
|
Exhibit Number
|
Description
|
|
|
(2
|
)
|
Plan of Acquisition, Reorganization, Arrangement, Liquidation or Succession
|
||
|
(3
|
)
|
(i)
|
Articles of Incorporation and By-Laws
|
|
|
Restatement of Charter of McCormick & Company, Incorporated dated April 16, 1990
|
Incorporated by reference from Exhibit 4 of Registration Form S-8, Registration No. 33-39582 as filed with the Securities and Exchange Commission on March 25, 1991.
|
|||
|
|
|
Exhibit Number
|
Description
|
|
|
Articles of Amendment to Charter of McCormick & Company, Incorporated dated April 1, 1992
|
Incorporated by reference from Exhibit 4 of Registration Form S-8, Registration Statement No. 33-59842 as filed with the Securities and Exchange Commission on March 19, 1993.
|
|||
|
(ii)
|
By-Laws
|
|||
|
(4
|
)
|
Instruments defining the rights of security holders, including indentures
|
||
|
(i)
|
See Exhibit 3 (Restatement of Charter and By-Laws)
|
|||
|
(ii)
|
||||
|
(iii)
|
||||
|
(iv)
|
||||
|
(v)
|
||||
|
(vi)
|
||||
|
(vii)
|
||||
|
(viii)
|
||||
|
(ix)
|
||||
|
(x)
|
||||
|
(xi)
|
||||
|
(10
|
)
|
Material contracts
|
||
|
|
|
Exhibit Number
|
Description
|
|
|
(xiii)
|
||||
|
(xiv)
|
||||
|
(21
|
)
|
Filed herewith
|
||
|
(23
|
)
|
Filed herewith
|
||
|
(31
|
)
|
Rule 13a-14(a)/15d-14(a) Certifications
|
Filed herewith
|
|
|
(i)
|
||||
|
|
||||
|
(ii)
|
||||
|
(32
|
)
|
Section 1350 Certifications
|
Filed herewith
|
|
|
(i)
|
||||
|
(ii)
|
||||
|
(101)
|
|
The following financial information from the Annual Report on Form 10-K of McCormick for the year ended November 30, 2017, filed electronically herewith, and formatted in XBRL (Extensible Business Reporting Language): (i) Consolidated Balance Sheets; (ii) Consolidated Income Statements; (iii) Consolidated Statements of Comprehensive Income; (iv) Consolidated Statements of Shareholders’ Equity; (v) Consolidated Cash Flow Statements; and (vi) Notes to Consolidated Financial Statements.
|
||
|
*
|
Management contract or compensatory plan or arrangement.
|
|||
|
McCormick hereby undertakes to furnish to the Securities and Exchange Commission, upon its request, copies of additional instruments of McCormick with respect to long-term debt that involve an amount of securities that do not exceed 10% of the total assets of McCormick and its subsidiaries on a consolidated basis, pursuant to Regulation S-K, Item 601(b)(4)(iii)(A) .
|
||||
SIGNATURES
Pursuant to the requirements of Section 13 or 15(d) of the Securities Exchange Act of 1934, McCormick has duly caused this report on Form 10-K to be signed on its behalf by the undersigned, thereunto duly authorized.
McCORMICK & COMPANY, INCORPORATED
|
By:
|
/s/ L
AWRENCE
E. K
URZIUS
|
Chairman, President &
|
January 25, 2018
|
|
Lawrence E. Kurzius
|
Chief Executive Officer
|
||
|
Pursuant to the requirements of the Securities Exchange Act of 1934, this report has been signed below by the following persons on behalf of McCormick and in the capacities and on the dates indicated.
|
|||
|
Principal Executive Officer:
|
|||
|
By:
|
/s/ L
AWRENCE
E. K
URZIUS
|
Chairman, President &
|
January 25, 2018
|
|
Lawrence E. Kurzius
|
Chief Executive Officer
|
||
|
Principal Financial Officer:
|
|||
|
By:
|
/s/ M
ICHAEL
R. S
MITH
|
Executive Vice President & Chief
|
January 25, 2018
|
|
Michael R. Smith
|
Financial Officer
|
||
|
Principal Accounting Officer:
|
|||
|
By:
|
/s/ C
HRISTINA
M. M
C
M
ULLEN
|
Vice President & Controller
|
January 25, 2018
|
|
Christina M. McMullen
|
Chief Accounting Officer
|
||
SIGNATURES
Pursuant to the requirements of the Securities Exchange Act of 1934, this report has been signed below by the following persons, being a majority of the Board of Directors of McCormick & Company, Incorporated, on the date indicated:
|
THE BOARD OF DIRECTORS:
|
|
DATE:
|
|
/s/ M
ICHAEL
A. C
ONWAY
|
January 25, 2018
|
|
|
Michael A. Conway
|
||
|
/s/ J. M
ICHAEL
F
ITZPATRICK
|
January 25, 2018
|
|
|
J. Michael Fitzpatrick
|
||
|
/s/ F
REEMAN
A. H
RABOWSKI
, III
|
January 25, 2018
|
|
|
Freeman A. Hrabowski, III
|
||
|
/s/ L
AWRENCE
E. K
URZIUS
|
January 25, 2018
|
|
|
Lawrence E. Kurzius
|
||
|
/s/ P
ATRICIA
L
ITTLE
|
January 25, 2018
|
|
|
Patricia Little
|
||
|
/s/ M
ICHAEL
D. M
ANGAN
|
January 25, 2018
|
|
|
Michael D. Mangan
|
||
|
/s/ M
ARITZA
G
.
M
ONTIEL
|
January 25, 2018
|
|
|
Maritza G. Montiel
|
||
|
/s/ M
ARGARET
M.V. P
RESTON
|
January 25, 2018
|
|
|
Margaret M.V. Preston
|
||
|
/s/ G
ARY
M. R
ODKIN
|
January 25, 2018
|
|
|
Gary M. Rodkin
|
||
|
/s/ W. A
NTHONY
V
ERNON
|
January 25, 2018
|
|
|
W. Anthony Vernon
|
||
|
/s/ J
ACQUES
T
APIERO
|
January 25, 2018
|
|
|
Jacques Tapiero
|
||
|
/s/ A
LAN
D. W
ILSON
|
January 25, 2018
|
|
|
Alan D. Wilson
|
||
Supplemental Financial Schedule II Consolidated
McCORMICK & COMPANY, INCORPORATED
VALUATION AND QUALIFYING ACCOUNTS
(IN MILLIONS)
|
Column A
|
Column B
|
Column C Additions
|
Column D
|
Column E
|
|||||||||||
|
Description
|
Balance at
beginning of
period
|
Charged to
costs and
expenses
|
Charged to
other
accounts
|
Deductions
|
Balance at
end of period
|
||||||||||
|
Deducted from asset accounts:
|
|||||||||||||||
|
Year ended November 30, 2017:
|
|||||||||||||||
|
Allowance for doubtful receivables
|
$
|
4.2
|
|
$
|
2.6
|
|
$
|
0.3
|
|
$
|
(0.5
|
)
|
$
|
6.6
|
|
|
Valuation allowance on net deferred tax assets
|
10.5
|
|
15.1
|
|
1.8
|
|
(1.4
|
)
|
26.0
|
|
|||||
|
|
$
|
14.7
|
|
$
|
17.7
|
|
$
|
2.1
|
|
$
|
(1.9
|
)
|
$
|
32.6
|
|
|
Deducted from asset accounts:
|
|||||||||||||||
|
Year ended November 30, 2016:
|
|||||||||||||||
|
Allowance for doubtful receivables
|
$
|
8.0
|
|
$
|
0.7
|
|
$
|
—
|
|
$
|
(4.5
|
)
|
$
|
4.2
|
|
|
Valuation allowance on net deferred tax assets
|
14.6
|
|
3.5
|
|
—
|
|
(7.6
|
)
|
10.5
|
|
|||||
|
|
$
|
22.6
|
|
$
|
4.2
|
|
$
|
—
|
|
$
|
(12.1
|
)
|
$
|
14.7
|
|
|
Deducted from asset accounts:
|
|||||||||||||||
|
Year ended November 30, 2015:
|
|||||||||||||||
|
Allowance for doubtful receivables
|
$
|
4.0
|
|
$
|
4.9
|
|
$
|
(0.1
|
)
|
$
|
(0.8
|
)
|
$
|
8.0
|
|
|
Valuation allowance on net deferred tax assets
|
21.8
|
|
5.7
|
|
(3.2
|
)
|
(9.7
|
)
|
14.6
|
|
|||||
|
|
$
|
25.8
|
|
$
|
10.6
|
|
$
|
(3.3
|
)
|
$
|
(10.5
|
)
|
$
|
22.6
|
|
TABLE OF CONTENTS
Part IItem 1. BusinessItem 1A. Risk FactorsItem 1B. Unresolved Staff CommentsItem 2. PropertiesItem 3. Legal ProceedingsItem 4. Mine Safety DisclosuresPart IIItem 5. Market For Registrant S Common Equity, Related Stockholder Matters and Issuer Purchases Of Equity SecuritiesItem 6. Selected Financial DataItem 7. Management S Discussion and Analysis Of Financial Condition and Results Of OperationsItem 7A. Quantitative and Qualitative Disclosures About Market RiskItem 8. Financial Statements and Supplementary DataItem 9. Changes in and Disagreements with Accountants on Accounting and Financial DisclosureItem 9A. Controls and ProceduresItem 9B. Other InformationPart IIIItem 10. Directors, Executive Officers and Corporate GovernanceItem 11. Executive CompensationItem 12. Security Ownership Of Certain Beneficial Owners and Management and Related Stockholder MattersItem 13. Certain Relationships and Related Transactions, and Director IndependenceItem 14. Principal Accountant Fees and ServicesPart IVItem 15. Exhibits, Financial Statement Schedules