MARKEL CORP
10-Ks and 10-Qs
|
|
|
|
|
|
|
|
|
|
|
|
|
|
|
|
|
|
|
|
|
|
|
|
|
|
|
|
|
|
|
|
|
|
|
|
|
|
|
|
|
|
|
|
|
|
|
|
|
|
|
|
|
|
|
|
UNITED STATES
SECURITIES AND EXCHANGE COMMISSION
Washington, D.C. 20549
FORM 10-K
Annual report pursuant to Section 13 or 15(d) of the
Securities Exchange Act of 1934 for the fiscal year ended
December 31, 2013
Commission File Number 001-15811
MARKEL CORPORATION
(Exact name of registrant as specified in its charter)
A Virginia Corporation
IRS Employer Identification No. 54-1959284
4521 Highwoods Parkway, Glen Allen, Virginia 23060-6148
(Address of principal executive offices) (Zip code)
Registrant's telephone number, including area code: (804) 747-0136
Securities registered pursuant to Section 12(b) of the Act:
Common Stock, no par value
New York Stock Exchange, Inc.
(title of each class and name of the exchange on which registered)
Securities registered pursuant to Section 12(g) of the Act: None
Indicate by check mark if the registrant is a well-known seasoned issuer, as defined in Rule 405 of the Securities Act. Yes
x
No
¨
Indicate by check mark if the registrant is not required to file reports pursuant to Section 13 or Section 15(d) of the Act. Yes
¨
No
x
Indicate by check mark whether the registrant (1) has filed all reports required to be filed by Section 13 or 15(d) of the Securities Exchange Act of 1934 during the preceding 12 months (or for such shorter period that the registrant was required to file such reports), and (2) has been subject to such filing requirements for the past 90 days. Yes
x
No
¨
Indicate by check mark whether the registrant has submitted electronically and posted on its corporate Website, if any, every Interactive Data File required to be submitted and posted pursuant to Rule 405 of Regulation S-T during the preceding 12 months (or for such shorter period that the registrant was required to submit and post such files). Yes
x
No
¨
Indicate by check mark if disclosure of delinquent filers pursuant to Item 405 of Regulation S-K is not contained herein, and will not be contained, to the best of registrant's knowledge, in definitive proxy or information statements incorporated by reference in Part III of this Form 10-K or any amendment to this Form 10-K.
¨
Indicate by check mark whether the registrant is a large accelerated filer, an accelerated filer, a non-accelerated filer or a smaller reporting company. See the definitions of "large accelerated filer," "accelerated filer" and "smaller reporting company" in Rule 12b-2 of the Exchange Act.
Large accelerated filer
x
Accelerated filer
¨
Non-accelerated filer
¨
Smaller reporting company
¨
Indicate by check mark whether the registrant is a shell company (as defined in Rule 12b-2 of the Act). Yes
¨
No
x
The aggregate market value of the shares of the registrant's Common Stock held by non-affiliates as of
June 30, 2013
was approximately
$7,085,000,000
.
The number of shares of the registrant's Common Stock outstanding at
February 10, 2014
:
13,985,396
.
Documents Incorporated By Reference
The portions of the registrant's Proxy Statement for the Annual Meeting of Shareholders scheduled to be held on May 12, 2014, referred to in Part III.
Index and Cross References-Form 10-K Annual Report
|
Item No.
|
Page
|
||||
|
|
|||||
|
1.
|
Business
|
2-25, 127-128
|
|
||
|
1A.
|
Risk Factors
|
21-25
|
|
||
|
1B.
|
Unresolved Staff Comments
|
NONE
|
|
||
|
2.
|
Properties (note 6)
|
49
|
|
||
|
3.
|
Legal Proceedings (note 17)
|
68-69
|
|
||
|
4.
|
Mine Safety Disclosures
|
NONE
|
|
||
|
|
|||||
|
5.
|
Market for Registrant's Common Equity, Related Stockholder Matters and Issuer Purchases of Equity Securities
|
84, 127
|
|
||
|
6.
|
Selected Financial Data
|
26-27
|
|
||
|
7.
|
Management's Discussion and Analysis of Financial Condition and Results of Operations
|
88-126
|
|
||
|
7A.
|
Quantitative and Qualitative Disclosures About Market Risk
|
120-124
|
|
||
|
8.
|
Financial Statements and Supplementary Data
The response to this item is submitted in Item 15 and on page 84.
|
||||
|
9.
|
Changes in and Disagreements With Accountants on Accounting and Financial Disclosure
|
NONE
|
|
||
|
9A.
|
Controls and Procedures
|
86-87, 124
|
|
||
|
9B.
|
Other Information
|
NONE
|
|
||
|
|
|||||
|
10.
|
Directors, Executive Officers and Corporate Governance*
|
129
|
|
||
|
Code of Conduct
|
128
|
|
|||
|
11.
|
Executive Compensation*
|
||||
|
12.
|
Security Ownership of Certain Beneficial Owners and Management and Related Stockholder Matters*
|
||||
|
13.
|
Certain Relationships and Related Transactions, and Director Independence*
|
||||
|
14.
|
Principal Accounting Fees and Services*
|
||||
|
*Portions of Item 10 and Items 11, 12, 13 and 14 will be incorporated by reference from the Registrant's 2014 Proxy Statement pursuant to instructions G(1) and G(3) of the General Instructions to Form 10-K.
|
|||||
|
|
|||||
|
15.
|
Exhibits, Financial Statement Schedules
|
||||
|
a.
|
Documents filed as part of this Form 10-K
|
||||
|
(1)
|
Financial Statements
|
||||
|
Consolidated Balance Sheets
|
28
|
|
|||
|
Consolidated Statements of Income and Comprehensive Income
|
29
|
|
|||
|
Consolidated Statements of Changes in Equity
|
30
|
|
|||
|
Consolidated Statements of Cash Flows
|
31
|
|
|||
|
Notes to Consolidated Financial Statements
|
32-84
|
|
|||
|
Reports of Independent Registered Public Accounting Firm
|
85-86
|
|
|||
|
(2)
|
Schedules have been omitted since they either are not required or are not applicable, or the information called for is shown in the Consolidated Financial Statements and Notes thereto.
|
||||
|
(3)
|
See Index to Exhibits for a list of Exhibits filed as part of this report
|
||||
|
b.
|
See Index to Exhibits and Item 15a(3)
|
||||
|
c.
|
See Index to Financial Statements and Item 15a(2)
|
||||
BUSINESS OVERVIEW
We are a diverse financial holding company serving a variety of niche markets. Our principal business markets and underwrites specialty insurance products. We believe that our specialty product focus and niche market strategy enable us to develop expertise and specialized market knowledge. We seek to differentiate ourselves from competitors by our expertise, service, continuity and other value-based considerations. We also own interests in various industrial and service businesses that operate outside of the specialty insurance marketplace. Our financial goals are to earn consistent underwriting and operating profits and superior investment returns to build shareholder value.
On May 1, 2013, we completed the acquisition of Alterra Capital Holdings Limited (Alterra), a Bermuda-headquartered global enterprise providing diversified specialty property and casualty insurance and reinsurance products to corporations, public entities and other property and casualty insurers. Total purchase consideration was $3.3 billion. The acquisition of Alterra creates additional size and scale, providing us with additional insurance and investment opportunities.
Specialty Insurance and Reinsurance
The specialty insurance market differs significantly from the standard market. In the standard market, insurance rates and forms are highly regulated, products and coverages are largely uniform with relatively predictable exposures and companies tend to compete for customers on the basis of price. In contrast, the specialty market provides coverage for hard-to-place risks that generally do not fit the underwriting criteria of standard carriers.
Competition in the specialty insurance market tends to focus less on price than in the standard insurance market and more on other value-based considerations, such as availability, service and expertise. While specialty market exposures may have higher perceived insurance risks than their standard market counterparts, we seek to manage these risks to achieve higher financial returns. To reach our financial and operational goals, we must have extensive knowledge and expertise in our chosen markets. Many of our accounts are considered on an individual basis where customized forms and tailored solutions are employed.
By focusing on the distinctive risk characteristics of our insureds, we have been able to identify a variety of niche markets where we can add value with our specialty product offerings. Examples of niche insurance markets that we have targeted include wind and earthquake-exposed commercial properties, liability coverage for highly specialized professionals, equine-related risks, workers' compensation insurance for small businesses, classic cars and marine, energy and environmental-related activities. Our market strategy in each of these areas of specialization is tailored to the unique nature of the loss exposure, coverage and services required by insureds. In each of our niche markets, we assign teams of experienced underwriters and claims specialists who provide a full range of insurance services.
We also participate in the reinsurance market in certain classes of reinsurance product offerings, which were expanded in 2013 through the acquisition of Alterra. In the reinsurance market, our clients are other insurance companies, or cedents. We typically write our reinsurance products in the form of treaty reinsurance contracts, which are contractual arrangements that provide for automatic reinsuring of a type or category of risk underwritten by cedents. Generally, we participate on reinsurance treaties with a number of other reinsurers, each with an allocated portion of the treaty, with the terms and conditions of the treaty being substantially the same for each participating reinsurer. With treaty reinsurance contracts, we do not separately evaluate each of the individual risks assumed under the contracts and are largely dependent on the individual underwriting decisions made by the cedent. Accordingly, we review and analyze the cedent's risk management and underwriting practices in deciding whether to provide treaty reinsurance and in pricing of treaty reinsurance contracts.
Our reinsurance products are written on both a quota share and excess of loss basis. Quota share contracts require us to share the losses and expenses in an agreed proportion with the cedent. Excess of loss contracts require us to indemnify the cedent against all or a specified portion of losses and expenses in excess of a specified dollar or percentage amount. In both types of contracts, we may provide a ceding commission to the cedent.
We distinguish ourselves in the reinsurance market by the expertise of our underwriting teams, our access to global reinsurance markets, our ability to offer large lines and our ability to customize reinsurance solutions to fit our client's needs. Our specialty reinsurance product offerings include coverage for property, professional liability, automobile, general casualty and credit and surety risks.
2
Markets
In the United States, we write business in the excess and surplus lines (E&S) and specialty admitted insurance and reinsurance markets. In 2012, the E&S market represented approximately $35 billion, or 7%, of the approximately $523 billion United States property and casualty industry.
(1)
In 2012, our legacy Markel operations were the eighth largest E&S writer in the United States as measured by direct premium writings and Alterra's legacy operations were the twenty-ninth.
(1)
Our E&S insurance operations are conducted through Essex Insurance Company (Essex), domiciled in Delaware, and Evanston Insurance Company (Evanston), domiciled in Illinois. The majority of our specialty admitted insurance operations are conducted through Markel Insurance Company (MIC), domiciled in Illinois; Markel American Insurance Company (MAIC), domiciled in Virginia; FirstComp Insurance Company (FCIC), domiciled in Nebraska; and Essentia Insurance Company (Essentia), domiciled in Missouri.
As a result of the acquisition of Alterra, we have expanded our United States insurance and reinsurance operations, effective May 1, 2013. Our E&S insurance operations include Alterra Excess & Surplus Insurance Company (AESIC) and our specialty admitted operations include Alterra America Insurance Company (AAIC), both domiciled in Delaware. Our United States reinsurance operations are conducted through Alterra Reinsurance USA Inc. (Alterra Re USA), a Connecticut-domiciled reinsurance company.
In Europe, we participate in the London insurance market through Markel International, which includes Markel Capital Limited (Markel Capital) and Markel International Insurance Company Limited (MIICL). Markel Capital is the corporate capital provider for Markel Syndicate 3000, through which our Lloyd's of London (Lloyd's) operations are conducted. Markel Syndicate 3000 is managed by Markel Syndicate Management Limited (MSM). As a result of the acquisition of Alterra, our Lloyd's operations also include Alterra Corporate Capital 2 Limited and Alterra Corporate Capital 3 Limited, corporate capital providers to Lloyd's Syndicate 1400. Since October 1, 2013, MSM has also managed Lloyd's Syndicate 1400. Markel International is headquartered in London, England. In addition to regional offices in the United Kingdom, Markel International has offices in Canada, Spain, Germany, Sweden, Switzerland, the Netherlands, Hong Kong, China, Malaysia and Singapore. The London insurance market, which produced approximately $69 billion of gross written premium in 2012,
(2)
is the largest insurance market in Europe and third largest in the world.
(3)
In 2012, gross premium written through Lloyd's syndicates generated approximately half of the London market's international insurance business,
(2)
making Lloyd's the world's largest commercial surplus lines insurer
(1)
and fourth largest reinsurer.
(4)
Corporate capital providers often provide a majority of a syndicate's capacity and also generally own or control the syndicate's managing agent. This structure permits the capital provider to exert greater influence on, and demand greater accountability for, underwriting results. In 2012, corporate capital providers accounted for approximately 89% of total underwriting capacity in Lloyd's.
(5)
Our other European operations acquired through Alterra are conducted through Markel Europe plc (Markel Europe), which is headquartered in Dublin, Ireland. Markel Europe also operates branches in London, England and Zurich, Switzerland.
We also added insurance and reinsurance operations in Bermuda and Latin America through the acquisition of Alterra. In Bermuda, we conduct our insurance and reinsurance operations through Markel Bermuda Limited (Markel Bermuda), which is registered as a Class 4 insurer and a Class C long term insurer under the insurance laws of Bermuda. In Latin America, we provide reinsurance through MSM in Rio de Janeiro, Brazil, using Lloyd's admitted status, through Markel Europe using a representative office in Bogota, Colombia and a service company in Buenos Aires, Argentina, and through Markel Resseguradora do Brasil S.A. (Markel Brazil), a reinsurance company in Rio de Janeiro. Additionally, MIICL, Markel Syndicate 3000 and Lloyd's Syndicate 1400 are able to offer reinsurance in a number of other Latin American countries from their offices outside of Latin America.
|
(1)
U.S. Surplus Lines Segment Review Special Report
, A.M. Best
(September 23, 2013)
.
|
|
(2)
London Company Market Statistics Report
, International Underwriting Association
(October 2013)
.
|
|
(3)
UK Insurance Key Facts
, Association of British Insurers (
September 2013
).
|
|
(4)
Global Reinsurance Segment Review Special Report,
A.M. Best
(August 26, 2013).
|
|
(5)
Lloyd's Annual Report 2012
.
|
3
In
2013
,
25%
of consolidated gross premium writings related to foreign risks (i.e., coverage for risks located outside of the United States), of which
25%
were from the United Kingdom and
13%
were from Canada. In
2012
,
30%
of our premium writings related to foreign risks, of which
20%
were from the United Kingdom and
16%
were from Canada. In
2011
,
31%
of our premium writings related to foreign risks, of which
20%
were from the United Kingdom and
18%
were from Canada. In each of these years, there were no other individual foreign countries from which premium writings were material. Premium writings are attributed to individual countries based upon location of risk.
Most of our business is placed through insurance and reinsurance brokers. Some of our insurance business is also placed through managing general agents. We seek to develop and capitalize on relationships with insurance and reinsurance brokers, insurance and reinsurance companies, large global corporations and financial intermediaries to develop and underwrite business. As a result of the acquisition of Alterra, a significant volume of premium for the property and casualty insurance and reinsurance industry is produced through a small number of large insurance and reinsurance brokers. During the year ended December 31, 2013, the top three independent brokers accounted for approximately
19%
of our gross premiums written.
Competition
We compete with numerous domestic and international insurance companies and reinsurers, Lloyd's syndicates, risk retention groups, insurance buying groups, risk securitization programs and alternative self-insurance mechanisms. Competition may take the form of lower prices, broader coverages, greater product flexibility, higher quality services or higher ratings by independent rating agencies. In all of our markets, we compete by developing specialty products to satisfy well-defined market needs and by maintaining relationships with agents, brokers and insureds who rely on our expertise. This expertise is our principal means of competing. We offer a diverse portfolio of products, each with its own distinct competitive environment, which enables us to be responsive to changes in market conditions for individual product lines. With each of our products, we seek to compete with innovative ideas, appropriate pricing, expense control and quality service to policyholders, agents and brokers.
Few barriers exist to prevent insurers and reinsurers from entering our markets of the property and casualty industry. Market conditions and capital capacity influence the degree of competition at any point in time. Periods of intense competition, which typically include broader coverage terms, lower prices and excess underwriting capacity, are referred to as a "soft market." A favorable insurance market is commonly referred to as a "hard market" and is characterized by stricter coverage terms, higher prices and lower underwriting capacity. During soft markets, unfavorable conditions exist due in part to what many perceive as excessive amounts of capital in the industry. In an attempt to use their capital, many insurance companies seek to write additional premiums without appropriate regard for ultimate profitability, and standard insurance companies are more willing to write specialty coverages. The opposite is typically true during hard markets. Historically, the performance of the property and casualty reinsurance and insurance industries has tended to fluctuate in cyclical periods of price competition and excess underwriting capacity, followed by periods of high premium rates and shortages of underwriting capacity. This cyclical market pattern can be more pronounced in the specialty insurance and reinsurance markets in which we compete than the standard insurance market.
We have experienced soft insurance market conditions including price deterioration in virtually all of our product lines since the mid-2000s. During 2011, unfavorable pricing trends continued for some of our product lines; however, price declines stabilized for most of our product lines, and we achieved moderate price increases in several lines. During 2012 and 2013, we have generally seen low to mid-single digit favorable rate changes in many of our product lines as market conditions improved and revenues, gross receipts and payrolls of our insureds were favorably impacted by improving economic conditions; however, during the fourth quarter of 2013, we began to experience softening prices on our catastrophe exposed property product lines and in our reinsurance book. Despite stabilization of prices on certain product lines during the most recent three years, we still consider the overall property and casualty insurance market to be soft. We routinely review the pricing of our major product lines and will continue to pursue price increases for most product lines in 2014, when possible. However, when we believe the prevailing market price will not support our underwriting profit targets, the business is not written. As a result of our underwriting discipline, gross premium volume may vary when we alter our product offerings to maintain or improve underwriting profitability.
4
Underwriting Philosophy
By focusing on market niches where we have underwriting expertise, we seek to earn consistent underwriting profits, which are a key component of our strategy. We believe that the ability to achieve consistent underwriting profits demonstrates knowledge and expertise, commitment to superior customer service and the ability to manage insurance risk. We use underwriting profit or loss as a basis for evaluating our underwriting performance. To facilitate this strategy, we have a product line leadership group that has primary responsibility for both developing and maintaining underwriting and pricing guidelines on our existing products and new product development. The product line leadership group is under the direction of our Chief Underwriting Officer.
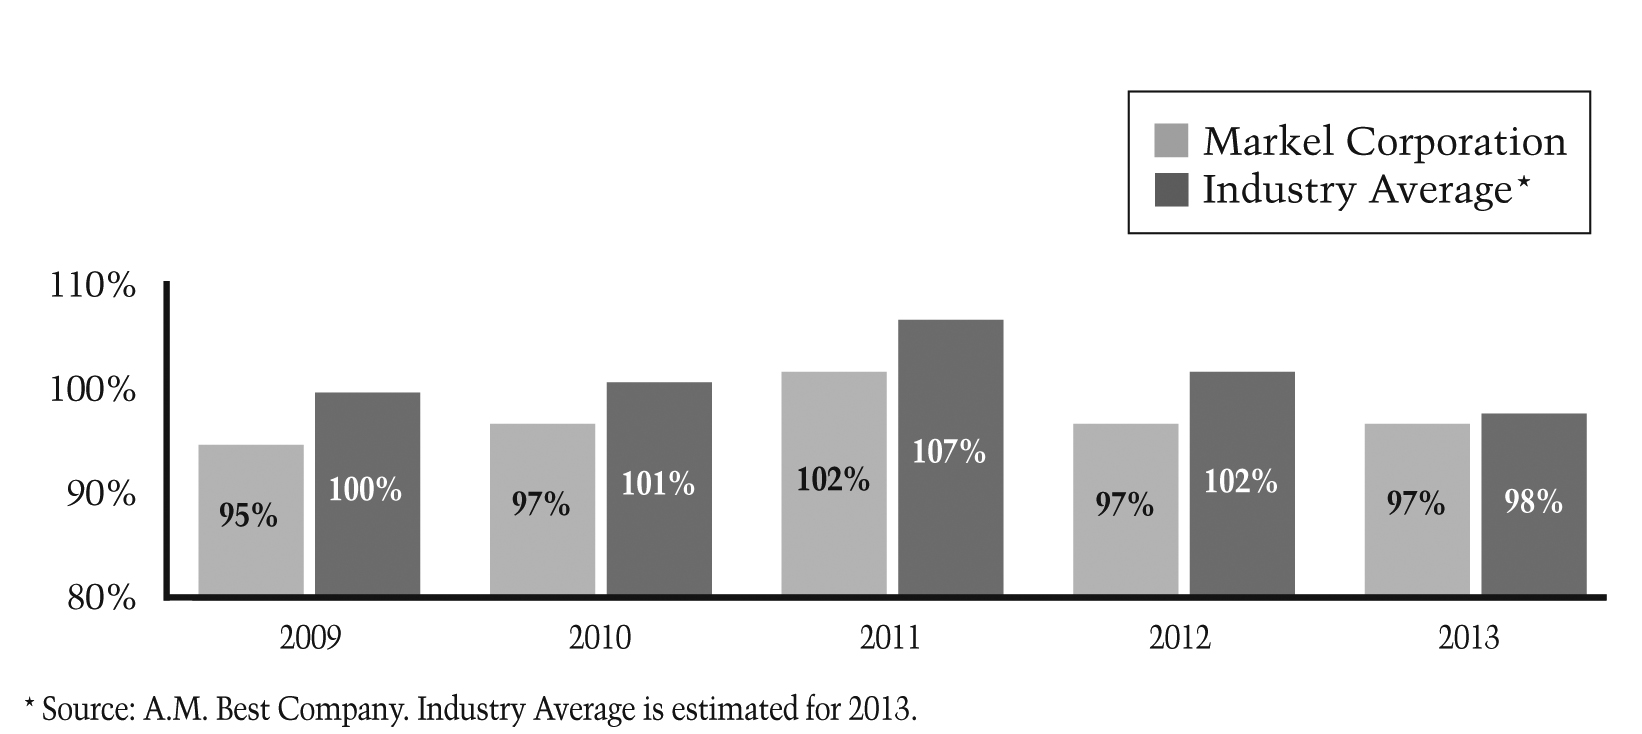
The combined ratio is a measure of underwriting performance and represents the relationship of incurred losses, loss adjustment expenses and underwriting, acquisition and insurance expenses to earned premiums. A combined ratio less than 100% indicates an underwriting profit, while a combined ratio greater than 100% reflects an underwriting loss. In
2013
, our combined ratio was
97%
. See Management's Discussion & Analysis of Financial Condition and Results of Operations for further discussion of our underwriting results.
The following graph compares our combined ratio to the property and casualty industry's combined ratio for the past five years.
Combined Ratios
Underwriting Segments
We historically defined our underwriting segments based on the areas of the specialty insurance market in which we compete: the E&S, specialty admitted and London markets. As a result of the acquisition of Alterra, we formed a new operating segment, effective May 1, 2013. During 2013, results attributable to Alterra were being separately evaluated by management. The Alterra segment is comprised of all of the active property and casualty underwriting operations of the former Alterra companies.
For purposes of segment reporting, our Other Insurance (Discontinued Lines) segment includes lines of business that have been discontinued prior to, or in conjunction with, acquisitions. The lines were discontinued because we believed some aspect of the product, such as risk profile or competitive environment, would not allow us to earn consistent underwriting profits. Alterra previously offered life and annuity reinsurance products. In 2010, Alterra ceased writing life and annuity reinsurance contracts and placed this business into run-off. Results attributable to the run-off of life and annuity reinsurance business are included in our Other Insurance (Discontinued Lines) segment.
Beginning in 2014, we will monitor and report our ongoing underwriting operations in the following three segments: U.S. Insurance, International Insurance and Global Reinsurance. The U.S. Insurance segment will include all direct business and facultative placements written by our insurance subsidiaries domiciled in the United States. The International Insurance segment will include all direct business and facultative placements written by our insurance subsidiaries domiciled outside of the United States, including our syndicates at Lloyd's. The Global Reinsurance segment will include all treaty reinsurance written across the Company. Results for lines of business discontinued prior to, or in conjunction with, acquisitions will continue to be reported as the Other Insurance (Discontinued Lines) segment.
5
See note 20 of the notes to consolidated financial statements for additional segment reporting disclosures.
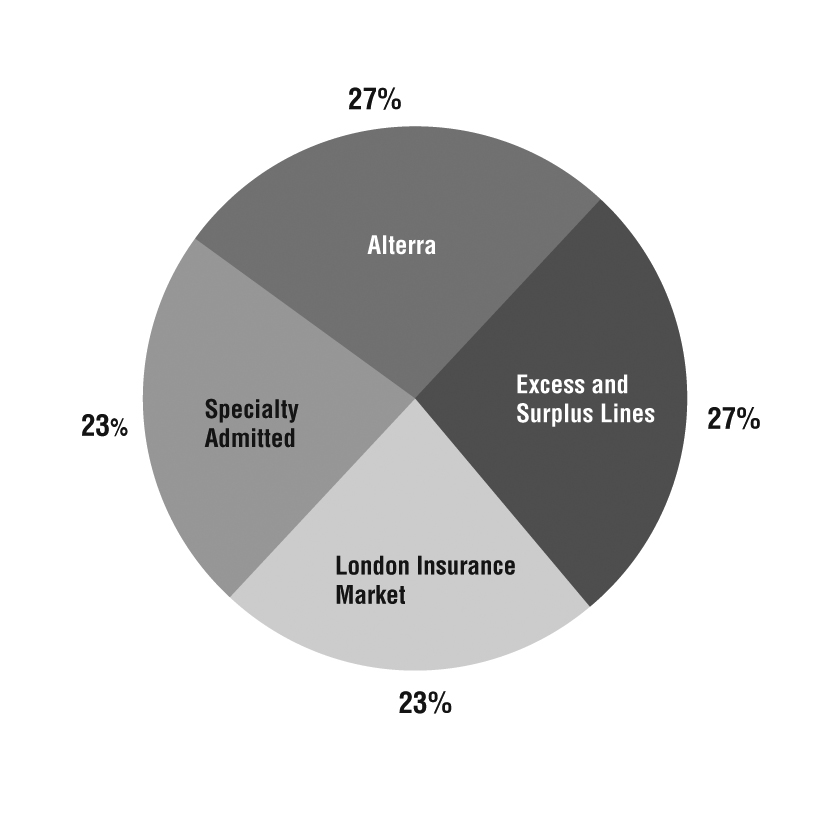
Markel Corporation
2013
Consolidated Gross Premium Volume (
$3.9 billion
)
Excess and Surplus Lines Segment
The E&S market focuses on hard-to-place risks and loss exposures that generally cannot be written in the standard market. United States insurance regulations generally require an E&S account to be declined by admitted carriers before an E&S company may write the business. E&S eligibility allows our insurance subsidiaries to underwrite unique loss exposures with more flexible policy forms and unregulated premium rates. This typically results in coverages that are more restrictive and more expensive than coverages in the standard market.
Business in the Excess and Surplus Lines segment is written through two distribution channels, professional surplus lines general agents who have limited quoting and binding authority and wholesale brokers. The majority of the business produced by this segment is written on a surplus lines basis through either Essex or Evanston.
Our Excess and Surplus Lines segment reported gross premium volume of
$1.1 billion
, earned premiums of
$856.6 million
and an underwriting profit of
$171.5 million
in
2013
.
6
Excess and Surplus Lines Segment
2013
Gross Premium Volume (
$1.1 billion
)
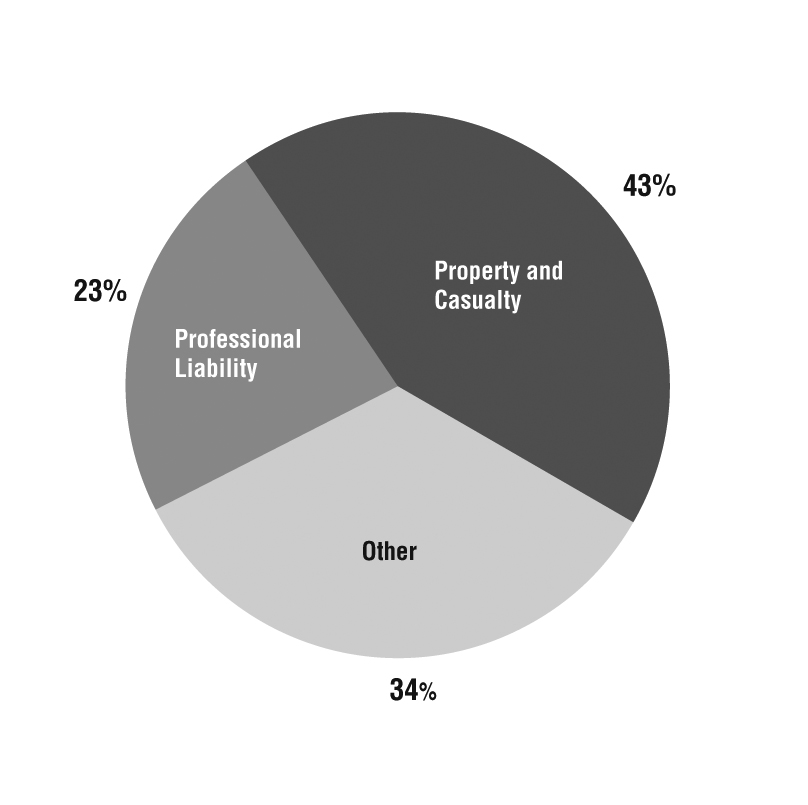
Product offerings within the Excess and Surplus Lines segment fall within the following major product groupings:
|
•
|
Property and Casualty
|
|
•
|
Professional Liability
|
|
•
|
Other Product Lines
|
Property coverages consist principally of fire, allied lines (including windstorm, hail and water damage) and other specialized property coverages, including catastrophe-exposed property risks such as earthquake and wind on both a primary and excess basis. Catastrophe-exposed property risks are typically larger and are lower frequency and higher severity in nature than more standard property risks. Our property risks range from small, single-location accounts to large, multi-state, multi-location accounts. Casualty product offerings include a variety of primary liability coverages targeting apartments and office buildings, retail stores, contractors and recreational and hospitality businesses. We also offer products liability coverages on either an occurrence or claims-made basis to manufacturers, distributors, importers and re-packagers of manufactured products.
Professional liability coverages include unique solutions for highly specialized professions, including architects and engineers, lawyers, agents and brokers, service technicians and computer consultants. We offer claims-made medical malpractice coverage for doctors, dentists and podiatrists; claims-made professional liability coverage to individual healthcare providers such as therapists, pharmacists, physician assistants and nurse anesthetists; and coverages for medical facilities and other allied healthcare risks such as clinics, laboratories, medical spas, home health agencies, small hospitals, pharmacies and nursing homes. This product line also includes for-profit and not-for profit management liability coverage which can be bundled or written mono-line and include employment practices liability, directors' and officers' liability and fiduciary liability coverages. Additionally, we offer a data privacy and security product, which provides coverage for data breach and privacy liability, data breach loss to insureds and electronic media coverage.
Other product lines within the Excess and Surplus Lines segment include:
|
•
|
excess and umbrella products, which provide coverage over approved underlying insurance carriers on either an occurrence or claims-made basis;
|
|
•
|
environmental products, which include environmental consultants' professional liability, contractors' pollution liability and site-specific environmental impairment liability coverages;
|
|
•
|
transportation-related products, which provide auto physical damage coverage for high-value automobiles as well as all types of specialty commercial vehicles, dealers' open lot and garagekeeper legal liability coverages, vehicular liability and physical damage coverages for local and intermediate haul commercial trucks and liability coverage to operators of non-emergency ambulances and multi-line specialty products designed for the unique characteristics of the garage industry;
|
7
|
•
|
inland marine products, which provide a number of specialty coverages for risks such as motor truck cargo coverage for damage to third party cargo while in transit, warehouseman's legal liability coverage for damage to third party goods in storage, contractor's equipment coverage for first party property damage and builder's risk coverage;
|
|
•
|
ocean marine products, which provide general liability, professional liability, property and cargo coverages for marine artisan contractors, boat dealers and marina owners including hull physical damage, protection and indemnity and third party property coverages for ocean cargo;
|
|
•
|
casualty facultative reinsurance written for individual casualty risks focusing on general liability, products liability, automobile liability and certain classes of miscellaneous professional liability and targeting classes which include low frequency, high severity, short-tail general liability risks;
|
|
•
|
railroad-related products, which provide first party coverages for short-line and regional railroads, scenic and tourist railroads, commuter and light rail trains and railroad equipment; and
|
|
•
|
public entity insurance and reinsurance programs, which provide coverage for government entities including counties, municipalities, schools and community colleges.
|
Specialty Admitted Segment
Our Specialty Admitted segment writes risks that, although unique and hard-to-place in the standard market, must remain with an admitted insurance company for marketing and regulatory reasons. Hard-to-place risks written in the specialty admitted market cover insureds engaged in similar, but highly specialized activities who require a total insurance program not otherwise available from standard insurers or insurance products that are overlooked by large admitted carriers. The specialty admitted market is subject to more state regulation than the E&S market, particularly with regard to rate and form filing requirements, restrictions on the ability to exit lines of business, premium tax payments and membership in various state associations, such as state guaranty funds and assigned risk plans.
The majority of the business in the Specialty Admitted segment is written by retail insurance agents who have very limited underwriting authority. Agents are carefully selected and agency business is controlled through regular audits and pre- approvals. Certain products and programs are marketed directly to consumers or distributed through wholesale producers. Personal lines coverages included in this segment are marketed directly to the consumer using direct mail, internet and telephone promotions, as well as relationships with various motorcycle and boat manufacturers, dealers and associations.
The majority of the business produced by this segment is written on an admitted basis either through MIC, MAIC, FCIC or Essentia. MIC, MAIC and Essentia are licensed to write property and casualty insurance in all 50 states and the District of Columbia. MAIC is also licensed to write property and casualty insurance in Puerto Rico. Essentia is also licensed in the U.S. Virgin Islands and specializes in coverage for classic cars and boats. FCIC is currently licensed in 28 states and specializes in workers' compensation coverage.
Our Specialty Admitted segment reported gross premium volume of
$900.0 million
, earned premiums of
$745.0 million
and an underwriting profit of
$21.4 million
in
2013
.
8
Specialty Admitted Segment
2013
Gross Premium Volume (
$900 million
)
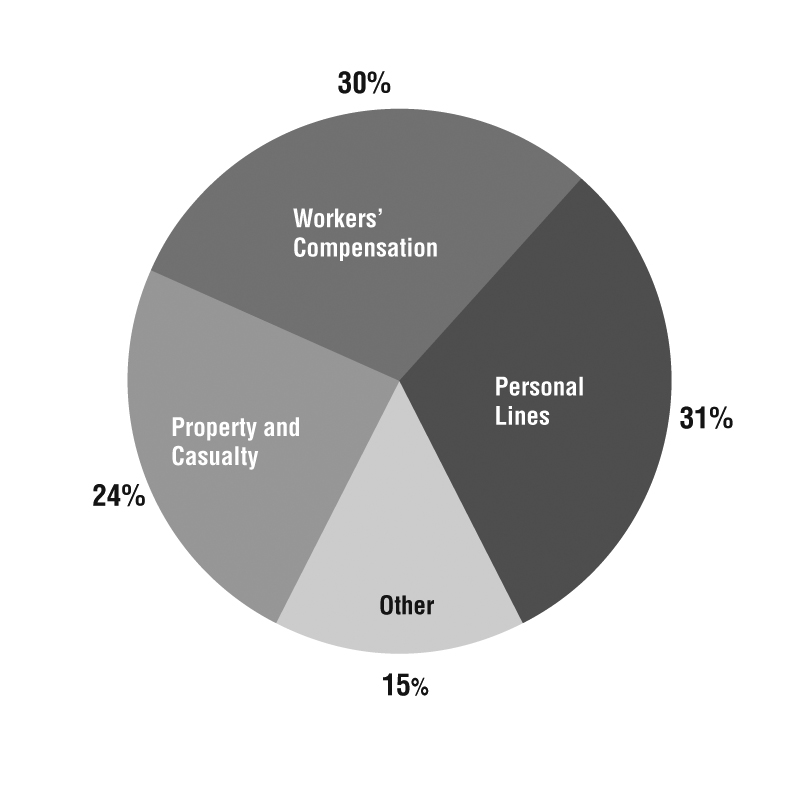
Product offerings within the Specialty Admitted segment fall within the following major product groupings:
|
•
|
Workers' Compensation
|
|
•
|
Property and Casualty
|
|
•
|
Personal Lines
|
|
•
|
Other Product Lines
|
Workers' compensation products provide wage replacement and medical benefits to employees injured in the course of employment and target main-street, service and artisan contractor businesses, retail stores and restaurants.
Property and casualty products included in this segment are offered on a monoline or package basis and generally target specialized commercial markets and customer groups. Targeted groups include youth and recreation oriented organizations, social service organizations, museums and historic homes, performing arts organizations, senior living facilities and wineries.
Personal lines products provide first and third party coverages for a variety of personal watercrafts including vintage boats, high performance boats and yachts and recreational vehicles, including motorcycles, snowmobiles and ATVs. Additionally, property coverages are offered for mobile homes, dwellings and homeowners that do not qualify for standard homeowner's coverage. Other products offered include special event protection, supplemental natural disaster coverage, renters' protection coverage, excess flood coverage. In January 2013, we expanded our personal lines products through the acquisition of Essentia, which underwrites insurance exclusively for Hagerty Insurance Agency and Hagerty Classic Marine Insurance Agency (collectively, Hagerty) throughout the United States. Hagerty offers insurance for classic cars, vintage boats, motorcycles and related automotive collectibles.
Other product lines within the Specialty Admitted segment include:
|
•
|
coverages for equine-related risks, such as horse mortality, theft, infertility, transit and specified perils, as well as property and liability coverages for farms and boarding, breeding and training facilities;
|
|
•
|
general agent programs that use managing general agents to offer single source admitted and non-admitted programs for a specific class or line of business;
|
|
•
|
first and third party coverages for small fishing ventures, charters, utility boats and boat rentals;
|
|
•
|
professional liability coverages that we design and administer on behalf of other insurance carriers and ultimately assume on a reinsurance basis; and
|
|
•
|
accident and health products offer liability and accident insurance for amateur sports organizations, monoline accident and medical coverage for various niche markets and short-term medical insurance.
|
9
London Insurance Market Segment
The London insurance market is known for its ability to provide innovative, tailored coverage and capacity for unique and hard-to-place risks. Hard-to-place risks in the London market are generally distinguishable from standard risks due to the complexity or significant size of the risk. It is primarily a broker market, which means that insurance brokers bring most of the business to the market. The London market is also largely a subscription market, which means that loss exposures brought into the market are typically insured by more than one insurance company or Lloyd's syndicate, often due to the high limits of insurance coverage required. We write business on both a direct and subscription basis in the London market. When we write business in the subscription market, we prefer to participate as lead underwriter in order to control underwriting terms, policy conditions and claims handling.
In this segment, we participate in the London market through Markel International. Markel International writes specialty property, casualty, professional liability, equine, marine, energy and trade credit insurance on a direct and reinsurance basis. Business is written worldwide through either MIICL or Markel Syndicate 3000.
Our London Insurance Market segment reported gross premium volume of
$914.5 million
, earned premiums of
$781.6 million
and an underwriting profit of
$95.5 million
in
2013
.
In 2013, 82% of gross premium written in the London Insurance Market segment related to foreign risks, of which 25% was from the United Kingdom and 16% was from Canada. In 2012, 84% of gross premium written in the London Insurance Market segment related to foreign risks, of which 20% was from the United Kingdom and 16% was from Canada. In 2011, 85% of gross premium written in the London Insurance Market segment related to foreign risks, of which 20% was from the United Kingdom and 18% was from Canada. In each of these years, there were no other individual foreign countries from which premium writings were material.
London Insurance Market Segment
2013
Gross Premium Volume (
$914 million
)
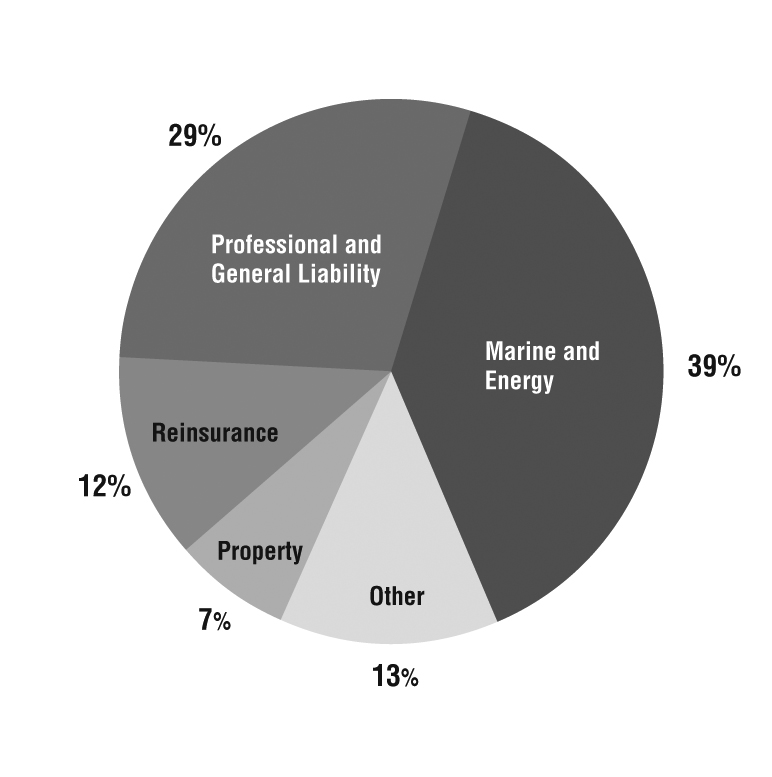
Product offerings within the London Insurance Market segment fall within the following major product groupings:
|
•
|
Marine and Energy
|
|
•
|
Professional and General Liability
|
|
•
|
Reinsurance
|
|
•
|
Property
|
|
•
|
Other Product Lines
|
10
Marine and energy products include a portfolio of coverages for cargo, energy, hull, liability, war, terrorism and specie risks. The cargo account is an international transit-based book covering many types of cargo. Energy coverage includes all aspects of oil and gas activities. The hull account covers physical damage to ocean-going tonnage, yachts and mortgagee's interest. Liability coverage provides for a broad range of energy liabilities, as well as traditional marine exposures including charterers, terminal operators and ship repairers. The war account covers the hulls of ships and aircraft, and other related interests, against war and associated perils. Terrorism coverage provides for property damage and business interruption related to political violence including war and civil war. The specie account includes coverage for fine art on exhibition and in private collections, securities, bullion, precious metals, cash in transit and jewelry.
Professional and general liability products include professional indemnity, directors' and officers' liability, intellectual property, some miscellaneous defense costs, incidental commercial crime, general and products liability coverages targeting consultants, construction professionals, financial service professionals, professional practices, social welfare organizations and medical products. Professional and general liability products are written on a worldwide basis, limiting exposure in the United States.
Reinsurance products include property and casualty treaty reinsurance. Property treaty products are offered on an excess of loss and proportional basis for per risk and catastrophe exposures. A significant portion of the excess of loss catastrophe and per risk property treaty business comes from the United States with the remainder coming from international property treaties. Casualty treaty reinsurance is offered on an excess of loss basis and primarily targets specialist writers of motor products in the United Kingdom and Europe. Excess of loss casualty treaty reinsurance also is offered for select writers of employers' and products liability coverages.
Property products target a wide range of insureds, providing coverage ranging from fire to catastrophe perils such as earthquake and windstorm. Business is written primarily on an open market basis for direct and facultative risks targeting Fortune 1000 companies on a worldwide basis by our underwriters to London brokers, with each risk being considered on its own merits. We also provide property coverage for small to medium-sized commercial risks on both a stand-alone and package basis through our branch offices.
Other product lines within the London Insurance Market segment include:
|
•
|
crime coverage primarily targeting financial institutions and providing protection for bankers' blanket bond, computer crime and commercial fidelity;
|
|
•
|
contingency coverage including event cancellation, non-appearance and prize indemnity;
|
|
•
|
accident and health coverage targeting affinity groups and schemes, high value and high risks accounts and sports groups;
|
|
•
|
coverage for equine-related risks such as horse mortality, theft, infertility, transit and specified perils;
|
|
•
|
specialty coverages include mortality risks for farms, zoos, animal theme parks and safari parks;
|
|
•
|
short-term trade credit coverage for commercial risks, including insolvency and protracted default as well as political risks coverage in conjunction with commercial risks for currency inconvertibility, government action, import and export license cancellation, public buyer default and war; and
|
|
•
|
products liability, excess and umbrella and environmental liability coverages targeted at Canadian domiciled insureds.
|
Alterra Segment
The Alterra segment provides diversified specialty insurance and reinsurance products to corporations, public entities and other property and casualty insurers through offices in the United States, the United Kingdom, Ireland, Switzerland, Bermuda and Latin America.
The Alterra segment reported gross premium volume of
$1.0 billion
, earned premiums of
$848.3 million
and an underwriting loss of
$154.9 million
in 2013. In 2013, 23% of gross premium written in the Alterra segment related to foreign risks, of which 24% was from the United Kingdom. In 2013, there were no other individual foreign countries from which premium writings were material. In 2013, the top three independent brokers accounted for approximately 40% of gross premiums written in the Alterra segment.
11
Alterra Segment
2013
Gross Premium Volume (
$1.0 billion
)
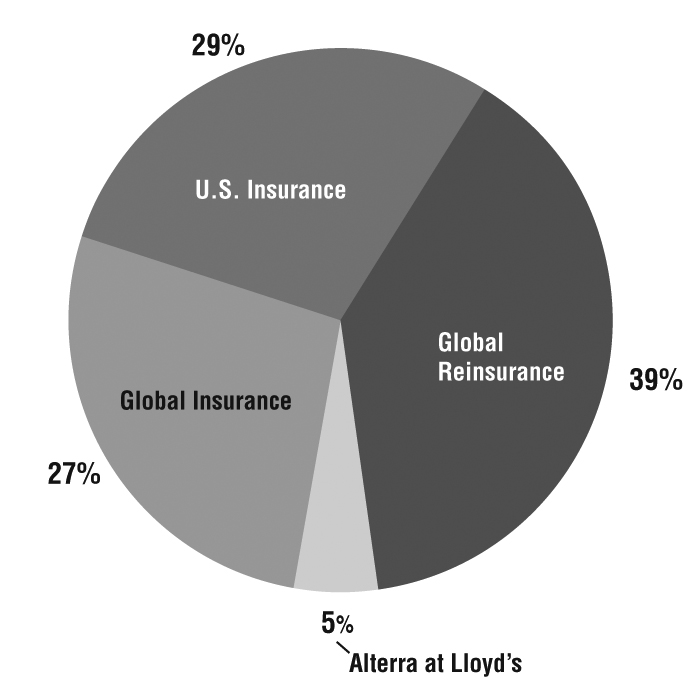
The Alterra segment is comprised of the following underwriting units:
|
•
|
U.S. Insurance
|
|
•
|
Global Insurance
|
|
•
|
Alterra at Lloyd's
|
|
•
|
Global Reinsurance
|
The U.S. Insurance unit offers property and casualty insurance coverage from offices in the United States. The Alterra segment participates in the excess and surplus lines market through AESIC and in the admitted insurance market through AAIC. AESIC is authorized to write business in 49 states and the District of Columbia, Puerto Rico and the U.S. Virgin Islands. AAIC is licensed to write business in all 50 states and the District of Columbia. Products offered within the U.S. Insurance unit include excess liability, marine, professional liability and property.
The Global Insurance unit offers property and casualty excess of loss insurance through Markel Bermuda and Markel Europe from offices in Bermuda, Dublin, London and Zurich to Fortune 1000 companies. Products offered within the Global Insurance unit include excess liability, professional liability and property. Professional liability products include errors and omissions insurance, employment practices liability insurance and directors and officers insurance. Excess liability products include excess umbrella liability insurance, excess product liability insurance, excess medical malpractice insurance and excess product recall insurance. These products are underwritten on an individual risk basis.
Alterra at Lloyd's offers property and casualty quota share and excess of loss insurance and reinsurance through its Lloyd's Syndicate 1400 from its offices in London and Zurich, primarily to medium- to large-sized international clients. Products offered within the Lloyd's group include accident & health, agriculture, financial institutions, international casualty, marine, professional liability and property.
The Alterra segment's Global Reinsurance unit offers property and casualty quota share and excess of loss reinsurance through Alterra Re USA, Alterra at Lloyd's, Markel Europe, Markel Bermuda and Markel Brazil to insurance and reinsurance companies worldwide. Alterra Re USA is licensed or accredited to provide reinsurance in all 50 states and the District of Columbia. We typically write our reinsurance products in the Alterra segment in the form of treaty reinsurance contracts, on both a quota share and excess of loss basis. Our reinsurance products may include features such as contractual provisions that require our cedent to share in a portion of losses resulting from ceded risks, may require payment of additional premium amounts if we incur greater losses than those projected at the time of the execution of the contract, may require reinstatement premium to restore the coverage after there has been a loss occurrence or may provide for experience refunds if the losses we incur are less than those projected at the time the contract is executed. Reinsurance products offered include agriculture, auto, credit and surety, general casualty, marine and energy, professional liability, property and workers' compensation.
12
Ceded Reinsurance
We purchase reinsurance and retrocessional reinsurance to manage our net retention on individual risks and overall exposure to losses, while providing us with the ability to offer policies with sufficient limits to meet policyholder needs. In a reinsurance transaction, an insurance company transfers, or cedes, all or part of its exposure in return for a portion of the premium. In a retrocession transaction, a reinsurer transfers, or cedes, all or part of its exposure in return for a portion of the premium. As part of our underwriting philosophy, we have historically sought to offer products with limits that did not require significant reinsurance. Following the acquisition of Alterra, we now have certain insurance and reinsurance products that have typically required higher levels of reinsurance. We purchase catastrophe reinsurance coverage for our catastrophe-exposed policies, and we seek to manage our exposures under this coverage so that no exposure to any one reinsurer is material to our ongoing business. Net retention of gross premium volume was
83%
in
2013
and
88%
in
2012
. We do not purchase or sell finite reinsurance products or use other structures that would have the effect of discounting loss reserves.
Our ceded reinsurance and retrocessional contracts do not legally discharge us from our primary liability for the full amount of the policies, and we will be required to pay the loss and bear collection risk if the reinsurer fails to meet its obligations under the reinsurance agreement. We attempt to minimize credit exposure to reinsurers through adherence to internal ceded reinsurance guidelines. To participate in our reinsurance program, prospective companies generally must: (i) maintain an A.M. Best Company (Best) or Standard & Poor's (S&P) rating of "A" (excellent) or better; (ii) maintain minimum capital and surplus of $500 million and (iii) provide collateral for recoverables in excess of an individually established amount. In addition, certain foreign reinsurers for our United States insurance operations must provide collateral equal to 100% of recoverables, with the exception of reinsurers who have been granted authorized status by an insurance company's state of domicile. Lloyd's syndicates generally must have a minimum of a "B" rating from Moody's Investors Service (Moody's) to be our reinsurers. Over time, we will attempt to bring the reinsurance programs used within the Alterra segment into compliance with our internal ceded reinsurance guidelines.
When appropriate, we pursue reinsurance commutations that involve the termination of ceded reinsurance and retrocessional contracts. Our commutation strategy related to ceded reinsurance and retrocessional contracts is to reduce credit exposure and eliminate administrative expenses associated with the run-off of ceded reinsurance placed with certain reinsurers.
The following table displays balances recoverable from our ten largest reinsurers by group at
December 31, 2013
. The contractual obligations under reinsurance and retrocessional contracts are typically with individual subsidiaries of the group or syndicates at Lloyd's and are not typically guaranteed by other group members or syndicates at Lloyd's. These ten reinsurance groups represent approximately 62% of our $2.0 billion reinsurance recoverable balance before considering allowances for bad debts.
|
Reinsurers
|
A.M. Best
Rating
|
Reinsurance
Recoverable
|
|||
|
|
(dollars in
thousands)
|
||||
|
Fairfax Financial Group
|
A
|
$
|
212,591
|
|
|
|
Munich Re Group
|
A+
|
186,457
|
|
||
|
Lloyd's of London
|
A
|
159,342
|
|
||
|
AXIS Capital Holdings Limited
|
A
|
143,949
|
|
||
|
Alleghany Corporation
|
A
|
117,729
|
|
||
|
Platinum Underwriters Holdings Ltd
|
A
|
106,397
|
|
||
|
Partner Re Group
|
A+
|
105,627
|
|
||
|
Swiss Re Group
|
A+
|
83,562
|
|
||
|
XL Capital Group
|
A
|
81,844
|
|
||
|
Arch Insurance Group
|
A+
|
72,320
|
|
||
|
Reinsurance recoverable on paid and unpaid losses for ten largest reinsurers
|
1,269,818
|
|
|||
|
Total reinsurance recoverable on paid and unpaid losses
|
$
|
2,032,626
|
|
||
Reinsurance recoverable balances in the preceding table are shown before consideration of balances owed to reinsurers and any potential rights of offset, any collateral held by us and allowances for bad debts.
13
Reinsurance and retrocessional treaties are generally purchased on an annual basis and are subject to yearly renegotiations. In most circumstances, the reinsurer remains responsible for all business produced before termination. Treaties typically contain provisions concerning ceding commissions, required reports to reinsurers, responsibility for taxes, arbitration in the event of a dispute and provisions that allow us to demand that a reinsurer post letters of credit or assets as security if a reinsurer becomes an unauthorized reinsurer under applicable regulations or if its rating falls below an acceptable level.
See note 16 of the notes to consolidated financial statements and Management's Discussion & Analysis of Financial Condition and Results of Operations for additional information about our ceded reinsurance programs and exposures.
Investments
Our business strategy recognizes the importance of both consistent underwriting and operating profits and superior investment returns to build shareholder value. We rely on sound underwriting practices to produce investable funds while minimizing underwriting risk. The majority of our investable assets come from premiums paid by policyholders. Policyholder funds are invested predominantly in high-quality corporate, government and municipal bonds with relatively short durations. The balance, comprised of shareholder funds, is available to be invested in equity securities, which over the long run, have produced higher returns relative to fixed maturity investments. When purchasing equity securities, we seek to invest in profitable companies, with honest and talented management, that exhibit reinvestment opportunities and capital discipline, at reasonable prices. We intend to hold these investments over the long term. The investment portfolio is managed by company employees.
The investment portfolio acquired through the Alterra acquisition was previously managed by third-party investment managers. After the acquisition, we transitioned the investment management function to our employees. Alterra's investment portfolio was comprised of hedge funds, equity method investments and fixed maturities that were generally longer duration than our historical fixed maturity portfolio. We are in the process of realigning the acquired investment portfolio with Markel's investment philosophy and target investment portfolio allocations by increasing our holdings in equity securities and liquidating the hedge fund portfolio.
We evaluate our investment performance by analyzing taxable equivalent total investment return. Taxable equivalent total investment return includes items that impact net income, such as coupon interest on fixed maturities, dividends on equity securities and realized investment gains or losses, as well as changes in unrealized gains or losses, which do not impact net income. Certain items that are included in net investment income have been excluded from the calculation of taxable equivalent total investment return, such as amortization and accretion of premiums and discounts on our fixed maturity portfolio, to provide a comparable basis for measuring our investment return against industry investment returns. The calculation of taxable equivalent total investment return also includes the current tax benefit associated with income on certain investments that is either taxed at a lower rate than the statutory income tax rate or is not fully included in federal taxable income. We believe the taxable equivalent total investment return is a better reflection of the economics of our decision to invest in certain asset classes. See "Investing Results" in Management's Discussion & Analysis of Financial Condition and Results of Operations for further detail regarding the components of taxable equivalent total investment return. In
2013
, net investment income was
$317.4 million
and net realized investment gains were
$63.2 million
. During the year ended
December 31, 2013
, net unrealized gains on investments increased by
$262.0 million
. We do not lower the quality of our investment portfolio in order to enhance or maintain yields. We focus on long-term total investment return, understanding that the level of realized and unrealized investment gains or losses may vary from one period to the next.
We believe our investment performance is best analyzed from the review of taxable equivalent total investment return over several years. The following table presents taxable equivalent total investment return before and after the effects of foreign currency movements.
14
Annual Taxable Equivalent Total Investment Returns
|
Weighted
Average
Five-Year
Annual
Return
|
Weighted
Average
Ten-Year
Annual
Return
|
||||||||||||||||||||||||
|
|
Years Ended December 31,
|
||||||||||||||||||||||||
|
|
2013
|
2012
|
2011
|
2010
|
2009
|
||||||||||||||||||||
|
Equities
|
33.3
|
%
|
19.6
|
%
|
3.8
|
%
|
20.8
|
%
|
25.7
|
%
|
21.6
|
%
|
12.4
|
%
|
|||||||||||
|
Fixed maturities
|
0.0
|
%
|
5.1
|
%
|
7.6
|
%
|
5.4
|
%
|
9.8
|
%
|
4.9
|
%
|
4.4
|
%
|
|||||||||||
|
Total portfolio, before foreign currency effect
|
6.9
|
%
|
8.6
|
%
|
6.7
|
%
|
8.1
|
%
|
11.7
|
%
|
8.2
|
%
|
6.0
|
%
|
|||||||||||
|
Total portfolio
|
6.8
|
%
|
9.0
|
%
|
6.5
|
%
|
7.9
|
%
|
13.2
|
%
|
8.4
|
%
|
6.0
|
%
|
|||||||||||
|
Invested assets, end of year (in millions)
|
$
|
17,612
|
|
$
|
9,333
|
|
$
|
8,728
|
|
$
|
8,224
|
|
$
|
7,849
|
|
||||||||||
We monitor our investment portfolio to ensure that credit risk does not exceed prudent levels. S&P and Moody's provide corporate and municipal debt ratings based on their assessments of the credit quality of an obligor with respect to a specific obligation. S&P's ratings range from "AAA" (capacity to pay interest and repay principal is extremely strong) to "D" (debt is in payment default). Securities with ratings of "BBB" or higher are referred to as investment grade securities. Debt rated "BB" and below is regarded by S&P as having predominantly speculative characteristics with respect to capacity to pay interest and repay principal. Moody's ratings range from "Aaa" to "C" with ratings of "Baa" or higher considered investment grade.
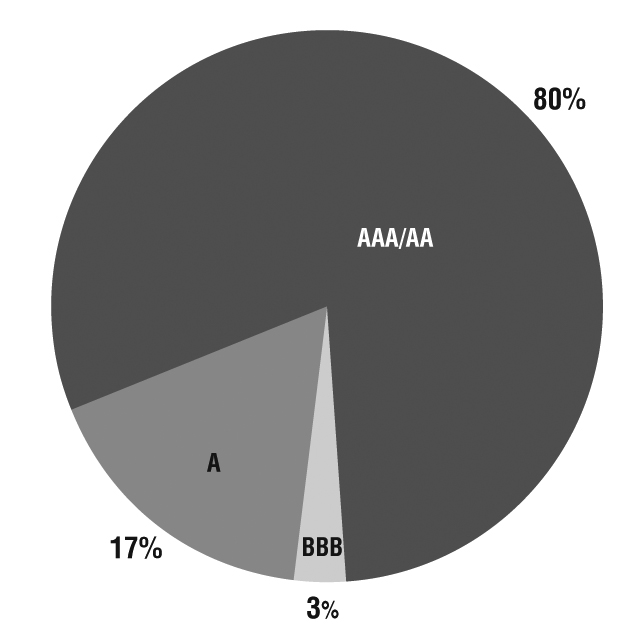
Our fixed maturity portfolio has an average rating of "AA," with approximately 97% rated "A" or better by at least one nationally recognized rating organization. Our policy is to invest in investment grade securities and to minimize investments in fixed maturities that are unrated or rated below investment grade. At
December 31, 2013
, less than 1% of our fixed maturity portfolio was unrated or rated below investment grade. Our fixed maturity portfolio includes securities issued with financial guaranty insurance. We purchase fixed maturities based on our assessment of the credit quality of the underlying assets without regard to insurance.
At
December 31, 2013
, we held fixed maturities of $45.7 million, or less than 1% of invested assets, from sovereign and non-sovereign issuers domiciled in Portugal, Ireland, Italy, Greece or Spain and $2.0 billion, or 12% of invested assets, from sovereign and non-sovereign issuers domiciled in other European countries including supranationals. At
December 31, 2012
, we held fixed maturities of $38.9 million, or less than 1% of invested assets, from sovereign and non-sovereign issuers domiciled in Portugal, Ireland, Italy, Greece or Spain and $630.3 million, or 7% of invested assets, from sovereign and non-sovereign issuers domiciled in other European countries including supranationals. The increase in invested assets from other European sovereign and non-sovereign issuers in 2013 was attributable to the investment portfolio acquired through the Alterra acquisition.
The following chart presents our fixed maturity portfolio, at estimated fair value, by rating category at
December 31, 2013
.
2013
Credit Quality of Fixed Maturity Portfolio (
$10.1 billion
)
15
See "Market Risk Disclosures" in Management's Discussion & Analysis of Financial Condition and Results of Operations for additional information about investments.
Markel Ventures
Through our wholly-owned subsidiary Markel Ventures, Inc. (Markel Ventures), we own interests in various industrial and service businesses that operate outside of the specialty insurance marketplace. These businesses are viewed by management as separate and distinct from our insurance operations. Local management teams oversee the day-to-day operations of these companies, while strategic decisions are made in conjunction with members of our executive management team, principally our President and Chief Investment Officer. The financial results of those companies in which we own controlling interests have been consolidated in our financial statements. The financial results of those companies in which we hold a noncontrolling interest are accounted for under the equity method of accounting.
Our strategy in making these private equity investments is similar to our strategy for purchasing equity securities. We seek to invest in profitable companies, with honest and talented management, that exhibit reinvestment opportunities and capital discipline, at reasonable prices. We intend to own the businesses acquired for a long period of time.
Our Markel Ventures operations are comprised of a diverse portfolio of industrial and service companies from various industries, including manufacturers of dredging equipment, high-speed bakery equipment, laminated furniture products and food processing equipment, an owner and operator of manufactured housing communities, a real estate investment fund manager, a residential homebuilder, a retail intelligence services company, a manager of behavioral health programs, a provider of concierge medical and executive health services, a manufacturer and lessor of trailer tubes used by industrial, chemical and distribution companies to transport gas and liquids and a manufacturer of laminated oak and composite wood flooring used in the assembly of truck trailers, intermodal containers and truck bodies. While each of these companies are operated independently from one another, we aggregate their financial results into two industry groups: manufacturing and non-manufacturing.
In
2013
, our Markel Ventures operations reported revenues of
$686.4 million
and net income to shareholders of
$23.8 million
.
See note 21 of the notes to consolidated financial statements and Management's Discussion & Analysis of Financial Condition and Results of Operations for additional information about our Markel Ventures operations.
Shareholder Value
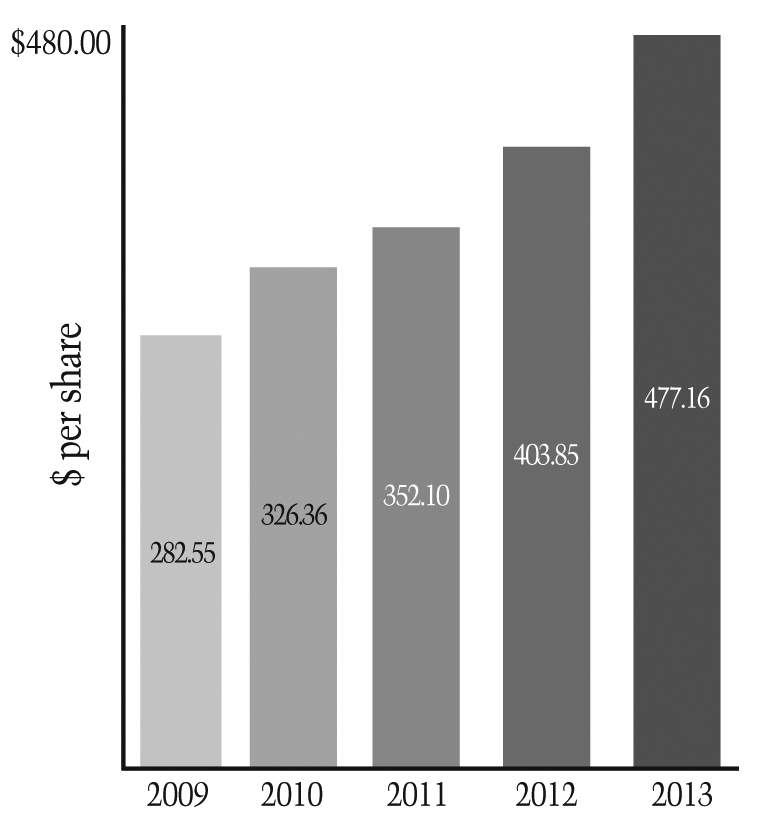
Our financial goals are to earn consistent underwriting and operating profits and superior investment returns to build shareholder value. More specifically, we measure financial success by our ability to compound growth in book value per share at a high rate of return over a long period of time. To mitigate the effects of short-term volatility, we generally use five-year time periods to measure ourselves. We believe that growth in book value per share is the most comprehensive measure of our success because it includes all underwriting, operating and investing results. For the year ended
December 31, 2013
, book value per share increased
18%
primarily due to equity issued in connection with the acquisition of Alterra, which was accretive to book value, net income to shareholders of
$281.0 million
and a
$184.6 million
increase in net unrealized gains on investments, net of taxes. For the year ended
December 31, 2012
, book value per share increased 15% primarily due to net income to shareholders of
$253.4 million
and a
$242.2 million
increase in net unrealized gains on investments, net of taxes. Over the past five years, we have grown book value per share at a compound annual rate of
17%
to
$477.16
per share.
16
The following graph presents book value per share for the past five years as of December 31.
Book Value Per Share
Regulatory Environment
Our insurance subsidiaries are subject to regulation and supervision by the insurance regulatory authorities of the various jurisdictions in which they conduct business. This regulation is intended for the benefit of policyholders rather than shareholders or holders of debt securities. The jurisdictions of our principal insurance subsidiaries are the United States, the United Kingdom and Bermuda.
United States Insurance Regulation
Overview.
Our U.S. insurance subsidiaries are subject to varying degrees of regulation and supervision in the jurisdictions in which they do business. Each state has its own regulatory authority for insurance that is generally responsible for the direct regulation of the business of insurance conducted in that state. In addition, the National Association of Insurance Commissioners (NAIC), comprised of the insurance commissioners of each U.S. jurisdiction, develops or amends model statutes and regulations that in turn most states adopt. While the U.S. federal government and its regulatory agencies generally do not directly regulate the business of insurance, there have been recent federal initiatives that impact the business of insurance.
State Insurance Regulation.
In the United States, authority for the regulation, supervisory and administration of the business of insurance in each state is generally delegated to a state commissioner heading a regulatory body responsible for the business of insurance. Through this authority, state regulatory authorities have broad regulatory, supervisory and administrative powers relating to solvency standards; the licensing of insurers and their agents; the approval of forms and policies used; the nature of, and limitations on, insurers' investments; the form and content of annual statements and other reports on the financial condition of insurers; and the establishment of loss reserves. Our U.S. insurance subsidiaries that operate on an admitted basis are typically subject to regulatory rate and form review, while our U.S. excess and surplus lines insurance subsidiaries generally operate free of rate and form regulation.
17
Holding Company Statutes
. In addition to regulatory supervision of our domestic insurance subsidiaries, we are subject to state statutes governing insurance holding company systems. Typically, such statutes require that we periodically file information with the appropriate state insurance commissioner, including information concerning our capital structure, ownership, financial condition, material transactions and general business operations. In addition, these statutes also require approval of changes in control of an insurer or an insurance holding company. Generally, control for these purposes is defined as ownership or voting power of 10% or more of a company's shares. Additional requirements include group-level reporting, submission of an annual enterprise risk report by a regulated insurance company's ultimate controlling person and information regarding an insurer's non-insurer's affiliates.
Risk Based Capital Requirements
. The NAIC uses a risk based capital formula that is designed to measure the capital of an insurer taking into account the company's investments and products. These requirements provide a formula which, for property and casualty insurance companies, establishes capital thresholds for four categories of risk: asset risk, insurance risk, interest rate risk and business risk. At December 31, 2013, the capital and surplus of each of our United States insurance subsidiaries was above the minimum regulatory thresholds.
Excess and Surplus Lines
. The regulation of our U.S. insurance subsidiaries' excess and surplus lines insurance business differs significantly from the regulation of our admitted business. Our surplus lines subsidiaries are subject to the surplus lines regulation and reporting requirements of the jurisdictions in which they are eligible to write surplus lines insurance. Although the surplus lines business is generally less regulated than admitted business, regulations apply to surplus lines placements under the laws of every state.
Dividends.
The laws of the domicile states of our U.S. insurance subsidiaries govern the amount of dividends that may be paid to our holding company, Markel Corporation. Generally, statutes in the domicile states of our insurance subsidiaries require prior approval for payment of extraordinary, as opposed to ordinary, dividends. At
December 31, 2013
, our United States insurance subsidiaries could pay up to
$296.9 million
during the following 12 months under the ordinary dividend regulations.
Trade Practices
. State insurance laws and regulations include numerous provisions governing trade practices and the marketplace activities of insurers, including provisions governing marketing and sales practices, policyholder services, claims management and complaint handling. State regulatory authorities generally enforce these provisions through periodic market conduct examinations.
Investment Regulation.
Investments by our domestic insurance companies must comply with applicable laws and regulations that prescribe the kind, quality and concentration of investments. In general, these laws and regulations permit investments in federal, state and municipal obligations, corporate bonds, preferred and common equity securities, mortgage loans, real estate and certain other investments, subject to specified limits and certain other qualifications.
The Terrorism Risk Insurance Act.
The Terrorism Risk Insurance Act of 2002, as amended (TRIA), has established a federal program that provides for a system of shared public and private compensation for insured losses resulting from acts of terrorism. The program is currently scheduled to expire on December 31, 2014. TRIA is applicable to almost all commercial lines of property and casualty insurance but excludes commercial auto, burglary and theft, surety, professional liability and farm owners' multi-peril insurance. Insurers with direct commercial property and casualty insurance exposure in the United States are required to participate in the program and make available coverage for certified acts of terrorism. Federal participation will be triggered under TRIA when the Secretary of Treasury certifies an act of terrorism.
Federal Regulation.
Although the federal government and its regulatory agencies generally do not directly regulate the business of insurance, federal initiatives could have an impact on our business in a variety of ways. The Dodd Frank Wall Street Reform and Consumer Protection Act (Dodd-Frank Act) was enacted in 2010 and effected sweeping changes to financial services regulation in the United States. The Dodd-Frank Act created two new federal government bodies, the Federal Insurance Office (FIO) and the Financial Stability Oversight Council (FSOC), which may impact the regulation of insurance. Although the FIO is prohibited from directly regulating the business of insurance, it has authority to represent the United States in international insurance matters and has limited powers to preempt certain types of state insurance laws. The FIO also can recommend to the FSOC that it designate an insurer as an entity posing risks to the United States financial stability in the event of the insurer's material financial distress or failure. We have not been so designated.
18
United Kingdom Insurance Regulation
Under the Financial Services and Markets Act 2000 (FSMA), it is unlawful to carry on insurance business in the United Kingdom without permission to do so from the relevant regulators. Before April 1, 2013, the Financial Services Authority (FSA) was responsible for supervising all securities, banking and insurance business in the United Kingdom. With the enactment of the Financial Services Act 2012 (which amended FSMA), the FSA was replaced by two regulators: the Prudential Regulation Authority (PRA) and the Financial Conduct Authority (FCA). An independent Financial Policy Committee (FPC) at the Bank of England supervises the financial services sector at a macro level, responding to sectoral issues that could threaten economic and financial stability.
Since April 1, 2013, when regulatory responsibility for the insurance firms in the United Kingdom was given to the PRA and the FCA, MIICL and our Lloyd's operations have been "dual regulated firms"; each firm is authorized by the PRA and regulated by both the PRA and the FCA. The PRA is a subsidiary of the Bank of England and is responsible for the prudential regulation and supervision of banks, building societies, credit unions, major investment firms and insurers, including the Society of Lloyd's and managing agents that participate in the Lloyd's market. The two statutory objectives of the PRA are to promote the safety and soundness of the firms it regulates and, specific to insurers, to contribute to securing an appropriate degree of protection for those who are, or may become, policyholders. The FCA, which is separate from the Bank of England, is accountable to HM Treasury and ultimately the United Kingdom Parliament. The FCA supervises the day-to-day conduct of insurance firms and other authorized firms operating in the United Kingdom, including those participating in the Lloyd's market and UK insurance intermediaries. The overarching strategic objective of the FCA is to ensure that the relevant markets function well. The FCA also has three operational objectives: securing an appropriate degree of protection for customers, protecting and enhancing the integrity of the UK financial system, and promoting effective competition in the interests of consumers.
The PRA oversees compliance with established periodic auditing and reporting requirements, minimum solvency margins and individual capital assessment requirements and dividend restrictions, while both the PRA and the FCA oversee compliance with risk assessment reviews, restrictions governing the appointment of key officers, restrictions governing controlling ownership interests and various other requirements. In addition, both the PRA and FCA have arrangements with Lloyd's for cooperation on supervision and enforcement of the Lloyd's market. We are required to provide 14 days advance notice to the PRA for any dividends from MIICL. In addition, our United Kingdom insurance subsidiaries must comply with the United Kingdom Companies Act of 2006, which provides that dividends may only be paid out of profits available for that purpose. MIICL must also provide 14 days advance written notice to the PRA of any transaction or proposed transaction with a connected or related person.
Bermuda Insurance Regulation
The insurance and reinsurance industry in Bermuda is regulated by the Bermuda Monetary Authority (BMA). Markel Bermuda is regulated by the BMA under the Insurance Act 1978 of Bermuda and its related regulations (Bermuda Insurance Act). The Bermuda Insurance Act imposes solvency and liquidity standards and auditing and reporting requirements on Markel Bermuda and grants to the BMA powers to supervise, investigate and intervene in the affairs of Bermuda insurance and reinsurance companies.
Markel Bermuda is subject to enhanced capital requirements in addition to minimum solvency and liquidity requirements. The enhanced capital requirement is determined by reference to a risk-based capital model that determines a control threshold for statutory capital and surplus by taking into account the risk characteristics of different aspects of the insurer's business. At December 31, 2013, Markel Bermuda satisfied both the enhanced capital requirements and the minimum solvency and liquidity requirements.
19
Under the Bermuda Insurance Act, Markel Bermuda is prohibited from paying or declaring dividends during a fiscal year if it is in breach of its enhanced capital requirement, solvency margin or minimum liquidity ratio or if the declaration or payment of the dividend would cause a breach. If an insurer fails to meet its solvency margin or minimum liquidity ratio on the last day of any financial year, it is prohibited from declaring or paying any dividends during the next financial year without the approval of the BMA. Further, Markel Bermuda is prohibited from declaring or paying in any financial year dividends of more than 25% of its total statutory capital and surplus as set forth in its previous year's statutory balance sheet unless it files with the BMA an affidavit stating that it will continue to meet its solvency margin and minimum liquidity ratio. Markel Bermuda must obtain the BMA's prior approval for a reduction by 15% or more of the total statutory capital as set forth in its previous year's financial statements. In addition, as a long-term insurer, Markel Bermuda may not declare or pay a dividend to any person other than a policyholder unless the value of the assets in its long-term business fund exceeds the liabilities of its long-term business by the amount of the dividend and at least the prescribed minimum solvency margin. At December 31, 2013, Markel Bermuda could pay up to
$375.8 million
during the following 12 months without making any additional filings with the BMA.
Other Insurance Jurisdictions
A major regulatory initiative currently under way in the European Union (E.U.) is the Solvency II Directive (Solvency II), a new set of capital adequacy and risk management regulations that will directly impact our European based subsidiaries. Solvency II will replace existing insurance directives to create a pan-European, risk based solvency regime and affects all insurers and reinsurers throughout the E.U. and is scheduled to enter into force on January 1, 2016. The Solvency II regime is based on three pillars: financial requirements; governance and risk management requirements; and disclosure requirements. The European Commission is developing detailed rules that will complement the high-level principles of the Solvency II directive. Rules must be implemented into national legislation of the E.U. member states by March 31, 2015. It is possible that Solvency II may affect the U.S. parents of European subsidiaries, depending partly on whether U.S. insurance regulations are deemed equivalent to Solvency II.
In addition, as a global provider of specialty insurance and reinsurance, our insurance subsidiaries must comply with various regulatory requirements in jurisdictions where they conduct business in addition to the jurisdictions in which they are domiciled. For example, our Lloyd's operations must comply with applicable Latin America regulatory requirements in connection with our Latin American reinsurance operations. In addition to the regulatory requirements imposed by the jurisdictions in which an insurer or reinsurer is licensed, a reinsurer's business operations are affected by regulatory requirements governing credit for reinsurance in other jurisdictions in which its ceding companies are located. In general, a ceding company that obtains reinsurance from a reinsurer that is licensed, accredited or approved by the jurisdiction in which the ceding company files statutory financial statements is permitted to reflect in its statutory financial statements a credit in an aggregate amount equal to the liability for unearned premiums and loss reserves and loss expense reserves ceded to the reinsurer. Many jurisdictions also permit ceding companies to take credit on their statutory financial statements for reinsurance obtained from unlicensed or non-admitted reinsurers if certain prescribed security arrangements are made. As an example, Markel Bermuda is not licensed, accredited or approved in any jurisdiction other than Bermuda. As a result, many of our reinsurance customers require Markel Bermuda to provide a letter of credit or enter into other security arrangements.
Other Regulation
In connection with our acquisition of Abbey Protection plc in January 2014, we became the owner of Abbey Legal Services which employs approximately 80 lawyers who provide legal services to small and medium-sized enterprises in the United Kingdom. The legal services of Abbey Legal Services are authorized and regulated by the Solicitors Regulation Authority, an independent regulatory body of the Law Society of England and Wales.
Ratings
Financial stability and strength are important purchase considerations of policyholders, cedents and insurance agents and brokers. Because an insurance premium paid today purchases coverage for losses that might not be paid for many years, the financial viability of the insurer is of critical concern. Various independent rating agencies provide information and assign ratings to assist buyers in their search for financially sound insurers. Rating agencies periodically re-evaluate assigned ratings based upon changes in the insurer's operating results, financial condition or other significant factors influencing the insurer's business. Changes in assigned ratings could have an adverse impact on an insurer's ability to write new business.
20
Best assigns financial strength ratings (FSRs) to property and casualty insurance companies based on quantitative criteria such as profitability, leverage and liquidity, as well as qualitative assessments such as the spread of risk, the adequacy and soundness of ceded reinsurance, the quality and estimated market value of assets, the adequacy of loss reserves and surplus and the competence, experience and integrity of management. Best's FSRs range from "A++" (superior) to "F" (in liquidation).
Fourteen of our fifteen insurance subsidiaries are rated by Best. Twelve of our insurance subsidiaries rated by Best have been assigned an FSR of "A" (excellent), one is rated "A-" (excellent) and one is rated "B++" (good). Our Lloyd's syndicates are part of a group rating for the Lloyd's overall market, which has been assigned an FSR of "A" (excellent) by Best.
Fourteen of our fifteen insurance subsidiaries are rated by S&P. Thirteen of our fourteen insurance subsidiaries rated by S&P have been assigned an FSR of "A" (strong) and one is rated "A-" (strong). Our Lloyd's syndicates are part of a group rating for the Lloyd's overall market, which has been assigned an FSR of "A+" (strong) by S&P.
Thirteen of our fifteen insurance subsidiaries are rated by Fitch Ratings (Fitch). All thirteen of our insurance subsidiaries rated by Fitch have been assigned an FSR of "A" (strong). Our Lloyd's syndicates are part of a group rating for the Lloyd's overall market, which has been assigned an FSR of "A+" (strong) by Fitch.
Six of our fifteen insurance subsidiaries are rated by Moody's Corporation (Moody's). Five of our six insurance subsidiaries rated by Moody's have been assigned an FSR of "A2" (good) and one is rated "A3" (good).
The various rating agencies typically charge companies fees for the rating and other services they provide. During
2013
, we paid rating agencies, including Best, S&P, Fitch and Moody's, $2.2 million for their services.
Risk Factors
A wide range of factors could materially affect our future prospects and performance. The matters addressed under "Safe Harbor and Cautionary Statements," "Critical Accounting Estimates" and "Market Risk Disclosures" in Management's Discussion and Analysis of Financial Condition and Results of Operations and other information included or incorporated in this report describe many of the significant risks that could affect our operations and financial results. We are also subject to the following risks.
We may experience losses from catastrophes.
As a property and casualty insurance company, we may experience losses from man-made or natural catastrophes. Catastrophes may have a material adverse effect on operations. Catastrophes include, but are not limited to, windstorms, hurricanes, earthquakes, tornadoes, hail, severe winter weather and fires and may include events related to terrorism and political unrest. While we employ catastrophe modeling tools in our underwriting process, we cannot predict how severe a particular catastrophe will be before it occurs. The extent of losses from catastrophes is a function of the total amount of losses incurred, the number of insureds affected, the frequency and severity of the events, the effectiveness of our catastrophe risk management program and the adequacy of our reinsurance coverage. Most catastrophes occur over a small geographic area; however, some catastrophes may produce significant damage in large, heavily populated areas. If, as many forecast, climate change results in an increase in the frequency and severity of weather-related catastrophes, we may experience additional catastrophe-related losses, which may be material.
Our results may be affected because actual insured or reinsured losses differ from our loss reserves.
Significant periods of time often elapse between the occurrence of an insured or reinsured loss, the reporting of the loss to us and our payment of that loss. To recognize liabilities for unpaid losses, we establish reserves as balance sheet liabilities representing estimates of amounts needed to pay reported and unreported losses and the related loss adjustment expenses. The process of estimating loss reserves is a difficult and complex exercise involving many variables and subjective judgments. This process may become more difficult if we experience a period of rising inflation. As part of the reserving process, we review historical data and consider the impact of such factors as:
|
•
|
trends in claim frequency and severity,
|
|
•
|
changes in operations,
|
|
•
|
emerging economic and social trends,
|
|
•
|
uncertainties relating to asbestos and environmental exposures,
|
|
•
|
inflation or deflation, and
|
|
•
|
changes in the regulatory and litigation environments.
|
21
This process assumes that past experience, adjusted for the effects of current developments and anticipated trends, is an appropriate basis for predicting future events. There is no precise method, however, for evaluating the impact of any specific factor on the adequacy of reserves, and actual results will differ from original estimates. As part of the reserving process, we regularly review our loss reserves and make adjustments as necessary. Future increases in loss reserves will result in additional charges to earnings, which may be material.
In addition, reinsurance reserves are subject to greater uncertainty than insurance reserves primarily because a reinsurer relies on the original underwriting decisions made by ceding companies. As a result, we are subject to the risk that our ceding companies may not have adequately evaluated the risks reinsured by us and the premiums ceded may not adequately compensate us for the risks we assume. In addition, reinsurance reserves may be less reliable than insurance reserves because there is generally a longer lapse of time from the occurrence of the event to the reporting of the loss or benefit to the reinsurer and ultimate resolution or settlement of the loss.
Changes in the assumptions and estimates used in establishing reserves for our life and annuity reinsurance book could result in material increases in our estimated loss reserves for such business.
As part of the acquisition of Alterra, we acquired a life and annuity reinsurance book, which has been in run-off since 2010. The life and annuity reinsurance contracts expose us to mortality risk, which is the risk that the level of death claims may differ from that which we assumed in establishing the reserves for our life and annuity reinsurance contracts. Some of our life and annuity reinsurance contracts expose us to longevity risk, which is the risk that an insured person will live longer than expected when the reserves were established, or morbidity risk, which is the risk that an insured person will become critically ill or disabled. Our reserving process for the life and annuity reinsurance book is designed with the objective of establishing appropriate reserves for the risks we assumed. Among other things, these processes rely heavily on analysis of mortality, longevity and morbidity trends, lapse rates, interest rates and expenses. As of
December 31, 2013
, our reserves for life and annuity benefits totaled
$1.5 billion
.
We expect mortality, morbidity, longevity, and lapse experience to fluctuate somewhat from period to period, but believe they should remain reasonably predictable over a period of many years. Mortality, longevity, morbidity or lapse experience that is less favorable than the mortality, longevity, morbidity or lapse rates that we used in establishing the reserves for a reinsurance agreement will negatively affect our net income because the reserves we originally set for the risks we assumed may not be sufficient to cover the future claims and expense payments. Furthermore, even if the total benefits paid over the life of the contract do not exceed the expected amount, unexpected increases in the incidence of deaths or illness can cause us to pay more benefits in a given reporting period than expected, adversely affecting our net income in any particular reporting period. Fluctuations in interest rates will impact the performance of our investments. If there are changes to any of the above factors to the point where a reserve deficiency exists, a charge to earnings will be recorded, which may have a material adverse impact on our results of operations and financial condition.
We are subject to regulation by insurance regulatory authorities that may affect our ability to implement and achieve our business objectives.
Our insurance subsidiaries are subject to supervision and regulation by the insurance regulatory authorities in the various jurisdictions in which they conduct business. This regulation is intended for the benefit of policyholders rather than shareholders or holders of debt securities. Insurance regulatory authorities have broad regulatory, supervisory and administrative powers relating to solvency standards, licensing, coverage requirements, policy rates and forms and the form and content of financial reports. In light of recent economic conditions, regulatory and legislative authorities are implementing enhanced or new regulatory requirements intended to prevent future financial crises or otherwise assure the stability of financial institutions. Regulatory authorities also may seek to exercise their supervisory or enforcement authority in new or more aggressive ways, such as imposing increased capital requirements. Any such actions, if they occur, could affect the competitive market and the way we conduct our business and manage our capital. As a result, such actions could materially affect our results of operations, financial condition and liquidity.
Our ability to make payments on debt or other obligations depends on the receipt of funds from our subsidiaries.
We are a holding company, and substantially all of our insurance operations are conducted through our regulated insurance subsidiaries. As a result, our cash flow and our ability to service our debt are dependent upon the earnings of our subsidiaries and on the distribution of earnings, loans or other payments by our subsidiaries to us. In addition, payment of dividends by our insurance subsidiaries may require prior regulatory notice or approval.
Our investment results may be impacted by changes in interest rates, U.S. and international monetary and fiscal policies as well as broader economic conditions.
We receive premiums from customers for insuring their risks. We invest these funds until they are needed to pay policyholder claims or until they are recognized as profits. Fluctuations in the value of our investment portfolio can occur as a result of changes in interest rates and U.S. and international monetary and fiscal policies as well as broader economic conditions (including, for example, equity market conditions and significant inflation or deflation). Our investment results may be materially impacted by one or more of these factors.
22
Competition in the property and casualty insurance industry could adversely affect our ability to improve or maintain underwriting margins or to grow or maintain premium volume.
The insurance and reinsurance markets have historically been cyclical, characterized by periods of intense price competition due to excessive underwriting capacity as well as periods when shortages of capacity permitted more favorable rate levels. Among our competitive strengths have been our specialty product focus and our niche market strategy. These strengths also make us vulnerable in periods of intense competition to actions by other insurance companies who seek to write additional premiums without appropriate regard for underwriting profitability. During soft markets, it is very difficult for us to grow or maintain premium volume levels without sacrificing underwriting profits. If we are not successful in maintaining rates or achieving rate increases, it may be difficult for us to improve or maintain underwriting margins or to grow or maintain premium volume levels.
We invest a significant portion of our invested assets in equity securities, which may result in significant variability in our investment results and may adversely impact shareholders' equity. Additionally, our equity investment portfolio is concentrated, and declines in the value of these significant investments could adversely affect our financial results.
Equity securities were
49%
and
62%
of our shareholders' equity at
December 31, 2013
and
2012
, respectively. Equity securities have historically produced higher returns than fixed maturities; however, investing in equity securities may result in significant variability in investment returns from one period to the next. In volatile financial markets, we could experience significant declines in the fair value of our equity investment portfolio, which would result in a material decrease in shareholders' equity. Our equity portfolio is concentrated in particular issuers and industries and, as a result, a decline in the fair value of these concentrated investments also could result in a material decrease in shareholders' equity. A material decrease in shareholders' equity may adversely impact our ability to carry out our business plans.
Deterioration in financial markets could lead to investment losses and adverse effects on our business.
The severe downturn in the public debt and equity markets beginning in 2008, reflecting uncertainties associated with the mortgage and credit crises, worsening economic conditions, widening of credit spreads, bankruptcies and government intervention in large financial institutions, resulted in significant realized and unrealized losses in our investment portfolio. In the event of another major financial crisis (for example, a crisis precipitated by one or more of the following: the failure to adequately address U.S. government deficit spending and tax revenue generation, downgrades or defaults in U.S. or foreign sovereign debt obligations, the collapse of the Eurozone or material changes to the monetary policies of the U.S. Federal Reserve), we could incur substantial realized and unrealized investment losses in future periods, which would have an adverse impact on our results of operations, financial condition, debt and financial strength ratings, insurance subsidiaries' capital and ability to access capital markets.
We rely on the purchase of reinsurance and bear collection risk if the reinsurer fails to meet its obligations under the reinsurance agreement.
We purchase reinsurance and retrocessional reinsurance to manage our net retention on individual risks and overall exposure to losses, while providing us with the ability to offer policies with sufficient limits to meet policyholder needs. The ceding of insurance does not legally discharge us from our primary liability for the full amount of the policies. Reliance on reinsurance may create credit risk as a result of the reinsurer's inability or unwillingness to pay reinsurance claims when due. Deterioration in the credit quality of existing reinsurers or disputes over the terms of reinsurance could result in charges to earnings, which may have a material adverse impact on our results of operations and financial condition. The availability and cost of reinsurance are determined by market conditions beyond our control. There is no guarantee that our desired amounts of reinsurance or retrocessional reinsurance will be available in the marketplace in the future.
Our information technology systems could fail or suffer a security breach, which could adversely affect our business or reputation.
Our business is dependent upon the successful functioning and security of our computer systems. Among other things, we rely on these systems to interact with producers and insureds, to perform actuarial and other modeling functions, to underwrite business, to prepare policies and process premiums, to process claims and make claims payments, and to prepare internal and external financial statements and information. A significant failure of these systems, whether because of a breakdown, natural disaster or an attack on our systems, could have a material adverse effect on our business. In addition, a security breach of our computer systems could damage our reputation or result in material liabilities.
23
The integration of acquired companies may not be as successful as we anticipate.
We have recently engaged in a number of acquisitions in an effort to achieve profitable growth in our insurance operations (the most significant of which was our 2013 acquisition of Alterra) and to create additional value on a diversified basis in our Markel Ventures operations. Acquisitions present operational, strategic and financial risks, as well as risks associated with liabilities arising from the previous operations of the acquired companies. All of these risks are magnified in the case of an acquisition as large as the Alterra acquisition. Assimilation of the operations and personnel of acquired companies may prove more difficult than anticipated, which may result in failure to achieve financial objectives associated with the acquisition or diversion of management attention. In addition, integration of formerly privately-held companies into the management and internal control and financial reporting systems of a publicly-held company presents additional risks.
Since the May 2013 acquisition of Alterra, we have made substantial progress in the integration of Alterra's business; however, we are still working to integrate information technology, accounting and operating systems. Although we expect that the realization of efficiencies related to the integration of the Alterra business will offset incremental transaction, integration and restructuring costs over time, we cannot give any assurance that this net benefit will be achieved in the near term, if at all. In addition, the success of the integration will depend upon our ability to retain key employees. If, despite retention efforts, key employees depart, our business could be adversely impacted.
The failure of any of the loss limitation methods we employ could have a material adverse effect on our financial condition or on our results of operations.
We seek to limit our loss exposure in a variety of ways, including adhering to maximum limitations on policies written in defined geographical zones, limiting program size for each client, establishing per risk and per occurrence limitations for each event, employing coverage restrictions and following prudent underwriting guidelines for each program written. We also seek to limit our loss exposure through geographic diversification. Underwriting is a matter of judgment, involving assumptions about matters that are inherently unpredictable and beyond our control, and for which historical experience and probability analysis may not provide sufficient guidance. One or more future events could result in claims that substantially exceed our expectations, which could have a material adverse effect on our financial condition and our results of operations, possibly to the extent of eliminating our shareholders' equity. In addition, we seek to limit loss exposures by policy terms, exclusion from coverage and choice of legal forum. Disputes relating to coverage and choice of legal forum also arise. As a result, various provisions of our policies, such as choice of forum, limitations or exclusions from coverage may not be enforceable in the manner we intend and some or all of our loss limitation methods may prove ineffective.
The effects of emerging claim and coverage issues on our business are uncertain.
As industry practices and legal, judicial, social and other environmental conditions change, unexpected and unintended issues related to claims and coverage may emerge. These issues may adversely affect our business by either broadening coverage beyond our underwriting intent or by increasing the number or size of claims. In some instances, these changes may not become apparent until some time after we have issued insurance or reinsurance contracts that are affected by the changes. As a result, the full extent of liability under our insurance or reinsurance contracts may not be known for many years after a contract is issued.
We could be adversely affected by the loss of one or more key executives or by an inability to attract and retain qualified personnel.
Our success depends on our ability to retain the services of our existing key executives and to attract and retain additional qualified personnel in the future. The loss of the services of any of our key executives or the inability to hire and retain other highly qualified personnel in the future could adversely affect our ability to conduct or grow our business. Over the near term, the risks may be greater as we continue with the integration of the Alterra acquisition.
Our expanding international operations expose us to increased investment, political and economic risks, including foreign currency and credit risk.
Our expanding international operations in the United Kingdom, Europe, Asia and South America expose us to increased investment, political and economic risks, including foreign currency and credit risk. Changes in the value of the U.S. dollar relative to other currencies could have an adverse effect on our results of operations and financial condition. Our investments in non-U.S.-denominated securities are subject to fluctuations in non-U.S. securities and currency markets, and those markets can be volatile.
24
We are rated by Best, S&P, Fitch and Moody's, and a decline in these ratings could affect our standing in the insurance industry and cause our sales and earnings to decrease.
Ratings are an important factor in establishing the competitive position of insurance and reinsurance companies. Certain of our insurance and reinsurance company subsidiaries are rated by Best, S&P, Fitch or Moody's. Our ratings are subject to periodic review, and we cannot be sure that we will be able to retain our current or any future ratings. If our ratings are reduced from their current levels by the rating agencies, our competitive position in our target markets within the insurance industry could suffer and it would be more difficult for us to market our products. A ratings downgrade could also adversely limit our access to capital markets, which may increase the cost of debt. A significant downgrade could result in a substantial loss of business as policyholders move to other companies with higher claims-paying and financial strength ratings.
We depend on a few brokers for a large portion of our revenues and the loss of business provided by any one of them could adversely affect us.
We market our insurance and reinsurance worldwide through insurance and reinsurance brokers. In the year ended December 31, 2013, our top three independent brokers represented approximately
19%
of our gross premiums written. Loss of all or a substantial portion of the business provided by one or more of these brokers could have a material adverse effect on our business.
Employee error and misconduct may be difficult to detect and prevent and may result in significant losses.
There have been a number of cases involving misconduct by employees in the financial services industry in recent years and we run the risk that employee misconduct could occur. Instances of fraud, illegal acts, errors, failure to document transactions properly or to obtain proper internal authorization, or failure to comply with regulatory requirements or our internal policies may result in losses. It is not always possible to deter or prevent employee errors or misconduct, and the controls that we have in place to prevent and detect this activity may not be effective in all cases.
Associates
At
December 31, 2013
, we had approximately 7,200 employees, of whom approximately 3,300 were employed within our insurance operations and approximately 3,900 were employed within our Markel Ventures operations.
25
SELECTED FINANCIAL DATA
(dollars in millions, except per share data)
(1), (2)
|
2013
|
2012
|
2011
|
|||||||||
|
Results of Operations
|
|||||||||||
|
Earned premiums
|
$
|
3,232
|
|
$
|
2,147
|
|
$
|
1,979
|
|
||
|
Net investment income
|
317
|
|
282
|
|
264
|
|
|||||
|
Total operating revenues
|
4,323
|
|
3,000
|
|
2,630
|
|
|||||
|
Net income (loss) to shareholders
|
281
|
|
253
|
|
142
|
|
|||||
|
Comprehensive income (loss) to shareholders
|
459
|
|
504
|
|
252
|
|
|||||
|
Diluted net income (loss) per share
|
$
|
22.48
|
|
$
|
25.89
|
|
$
|
14.60
|
|
||
|
Financial Position
|
|||||||||||
|
Total investments, cash and cash equivalents and restricted cash and cash equivalents (invested assets)
|
$
|
17,612
|
|
$
|
9,333
|
|
$
|
8,728
|
|
||
|
Total assets
|
23,956
|
|
12,557
|
|
11,532
|
|
|||||
|
Unpaid losses and loss adjustment expenses
|
10,262
|
|
5,371
|
|
5,399
|
|
|||||
|
Senior long-term debt and other debt
|
2,256
|
|
1,493
|
|
1,294
|
|
|||||
|
Shareholders' equity
|
6,674
|
|
3,889
|
|
3,388
|
|
|||||
|
Common shares outstanding (at year end, in thousands)
|
13,986
|
|
9,629
|
|
9,621
|
|
|||||
|
OPERATING PERFORMANCE MEASURES
(1, 2, 3)
|
|||||||||||
|
Operating Data
|
|||||||||||
|
Book value per common share outstanding
|
$
|
477.16
|
|
$
|
403.85
|
|
$
|
352.10
|
|
||
|
Growth (decline) in book value per share
|
18
|
%
|
15
|
%
|
8
|
%
|
|||||
|
5-Year CAGR in book value per share
(4)
|
17
|
%
|
9
|
%
|
9
|
%
|
|||||
|
Closing stock price
|
$
|
580.35
|
|
$
|
433.42
|
|
$
|
414.67
|
|
||
|
Ratio Analysis
|
|||||||||||
|
U.S. GAAP combined ratio
(5)
|
97
|
%
|
97
|
%
|
102
|
%
|
|||||
|
Investment yield
(6)
|
3
|
%
|
4
|
%
|
4
|
%
|
|||||
|
Taxable equivalent total investment return
(7)
|
7
|
%
|
9
|
%
|
7
|
%
|
|||||
|
Investment leverage
(8)
|
2.6
|
|
2.4
|
|
2.6
|
|
|||||
|
Debt to capital
|
25
|
%
|
28
|
%
|
28
|
%
|
|||||
|
(1)
|
Reflects the acquisition of Alterra Capital Holdings Limited effective May 1, 2013, which included the issuance of equity totaling $2.3 billion.
|
|
(2)
|
Effective January 1, 2012, we prospectively adopted Financial Accounting Standards Board Accounting Standards Update No. 2010-26,
Accounting for Costs Associated with Acquiring or Renewing Insurance Contracts.
|
|
(3)
|
Operating Performance Measures provide a basis for management to evaluate our performance. The method we use to compute these measures may differ from the methods used by other companies. See further discussion of management's evaluation of these measures in Management's Discussion & Analysis of Financial Condition and Results of Operations.
|
|
(4)
|
CAGR—compound annual growth rate.
|
|
(5)
|
The U.S. GAAP combined ratio measures the relationship of incurred losses, loss adjustment expenses and underwriting, acquisition and insurance expenses to earned premiums.
|
|
(6)
|
Investment yield reflects net investment income as a percentage of monthly average invested assets at amortized cost.
|
|
(7)
|
See "Investing Results" in Management's Discussion & Analysis of Financial Condition and Results of Operations for detail regarding the calculation of taxable equivalent total investment return.
|
|
(8)
|
Investment leverage represents total invested assets divided by shareholders' equity.
|
26
|
2010
|
2009
|
2008
|
2007
|
2006
|
2005
|
2004
|
5-Year CAGR
(3)
|
10-Year CAGR
(3)
|
||||||||||||||||||||||||
|
$
|
1,731
|
|
$
|
1,816
|
|
$
|
2,022
|
|
$
|
2,117
|
|
$
|
2,184
|
|
$
|
1,938
|
|
$
|
2,054
|
|
10
|
%
|
6
|
%
|
||||||||
|
273
|
|
260
|
|
282
|
|
305
|
|
269
|
|
242
|
|
204
|
|
2
|
%
|
6
|
%
|
|||||||||||||||
|
2,225
|
|
2,069
|
|
1,977
|
|
2,551
|
|
2,576
|
|
2,200
|
|
2,262
|
|
17
|
%
|
8
|
%
|
|||||||||||||||
|
267
|
|
202
|
|
(59
|
)
|
406
|
|
393
|
|
148
|
|
165
|
|
—
|
|
—
|
|
|||||||||||||||
|
431
|
|
591
|
|
(403
|
)
|
337
|
|
551
|
|
64
|
|
273
|
|
—
|
|
—
|
|
|||||||||||||||
|
$
|
27.27
|
|
$
|
20.52
|
|
$
|
(5.95
|
)
|
$
|
40.64
|
|
$
|
39.40
|
|
$
|
14.80
|
|
$
|
16.41
|
|
—
|
|
—
|
|
||||||||
|
$
|
8,224
|
|
$
|
7,849
|
|
$
|
6,893
|
|
$
|
7,775
|
|
$
|
7,524
|
|
$
|
6,588
|
|
$
|
6,317
|
|
21
|
%
|
13
|
%
|
||||||||
|
10,826
|
|
10,242
|
|
9,512
|
|
10,164
|
|
10,117
|
|
9,814
|
|
9,398
|
|
20
|
%
|
11
|
%
|
|||||||||||||||
|
5,398
|
|
5,427
|
|
5,492
|
|
5,526
|
|
5,584
|
|
5,864
|
|
5,482
|
|
13
|
%
|
8
|
%
|
|||||||||||||||
|
1,016
|
|
964
|
|
694
|
|
691
|
|
866
|
|
849
|
|
855
|
|
—
|
|
—
|
|
|||||||||||||||
|
3,172
|
|
2,774
|
|
2,181
|
|
2,641
|
|
2,296
|
|
1,705
|
|
1,657
|
|
25
|
%
|
17
|
%
|
|||||||||||||||
|
9,718
|
|
9,819
|
|
9,814
|
|
9,957
|
|
9,994
|
|
9,799
|
|
9,847
|
|
—
|
|
—
|
|
|||||||||||||||
|
$
|
326.36
|
|
$
|
282.55
|
|
$
|
222.20
|
|
$
|
265.26
|
|
$
|
229.78
|
|
$
|
174.04
|
|
$
|
168.22
|
|
17
|
%
|
13
|
%
|
||||||||
|
16
|
%
|
27
|
%
|
(16
|
)%
|
15
|
%
|
32
|
%
|
3
|
%
|
20
|
%
|
—
|
|
—
|
|
|||||||||||||||
|
13
|
%
|
11
|
%
|
10
|
%
|
18
|
%
|
16
|
%
|
11
|
%
|
20
|
%
|
—
|
|
—
|
|
|||||||||||||||
|
$
|
378.13
|
|
$
|
340.00
|
|
$
|
299.00
|
|
$
|
491.10
|
|
$
|
480.10
|
|
$
|
317.05
|
|
$
|
364.00
|
|
—
|
|
—
|
|
||||||||
|
97
|
%
|
95
|
%
|
99
|
%
|
88
|
%
|
87
|
%
|
101
|
%
|
96
|
%
|
—
|
|
—
|
|
|||||||||||||||
|
4
|
%
|
4
|
%
|
4
|
%
|
4
|
%
|
4
|
%
|
4
|
%
|
4
|
%
|
—
|
|
—
|
|
|||||||||||||||
|
8
|
%
|
13
|
%
|
(10
|
)%
|
5
|
%
|
11
|
%
|
2
|
%
|
8
|
%
|
—
|
|
—
|
|
|||||||||||||||
|
2.6
|
|
2.8
|
|
3.2
|
|
2.9
|
|
3.3
|
|
3.9
|
|
3.8
|
|
—
|
|
—
|
|
|||||||||||||||
|
24
|
%
|
26
|
%
|
24
|
%
|
21
|
%
|
27
|
%
|
33
|
%
|
34
|
%
|
—
|
|
—
|
|
|||||||||||||||
27
MARKEL CORPORATION AND SUBSIDIARIES
|
December 31,
|
|||||||
|
2013
|
2012
|
||||||
|
(dollars in thousands)
|
|||||||
|
ASSETS
|
|||||||
|
Investments, available-for-sale, at estimated fair value:
|
|||||||
|
Fixed maturities (amortized cost of $10,129,141 in 2013 and $4,562,278 in 2012)
|
$
|
10,142,536
|
|
$
|
4,979,283
|
|
|
|
Equity securities (cost of $1,566,553 in 2013 and $1,387,305 in 2012)
|
3,251,798
|
|
2,406,951
|
|
|||
|
Short-term investments (estimated fair value approximates cost)
|
1,452,288
|
|
973,330
|
|
|||
|
Total Investments
|
14,846,622
|
|
8,359,564
|
|
|||
|
Cash and cash equivalents
|
1,978,526
|
|
863,766
|
|
|||
|
Restricted cash and cash equivalents
|
786,926
|
|
109,415
|
|
|||
|
Receivables
|
1,141,773
|
|
413,883
|
|
|||
|
Reinsurance recoverable on unpaid losses
|
1,854,414
|
|
778,774
|
|
|||
|
Reinsurance recoverable on paid losses
|
102,002
|
|
51,145
|
|
|||
|
Deferred policy acquisition costs
|
260,967
|
|
157,465
|
|
|||
|
Prepaid reinsurance premiums
|
383,559
|
|
110,332
|
|
|||
|
Goodwill
|
967,717
|
|
674,930
|
|
|||
|
Intangible assets
|
565,083
|
|
374,295
|
|
|||
|
Other assets
|
1,067,922
|
|
663,019
|
|
|||
|
Total Assets
|
$
|
23,955,511
|
|
$
|
12,556,588
|
|
|
|
LIABILITIES AND EQUITY
|
|||||||
|
Unpaid losses and loss adjustment expenses
|
$
|
10,262,056
|
|
$
|
5,371,426
|
|
|
|
Life and annuity benefits
|
1,486,574
|
|
—
|
|
|||
|
Unearned premiums
|
2,127,115
|
|
1,000,261
|
|
|||
|
Payables to insurance and reinsurance companies
|
295,496
|
|
103,212
|
|
|||
|
Senior long-term debt and other debt (estimated fair value of $2,372,000 in 2013 and $1,688,000 in 2012)
|
2,256,227
|
|
1,492,550
|
|
|||
|
Other liabilities
|
777,850
|
|
613,897
|
|
|||
|
Total Liabilities
|
17,205,318
|
|
8,581,346
|
|
|||
|
Redeemable noncontrolling interests
|
72,183
|
|
86,225
|
|
|||
|
Commitments and contingencies
|
|
|
|||||
|
Shareholders' equity:
|
|||||||
|
Common stock
|
3,288,863
|
|
908,980
|
|
|||
|
Retained earnings
|
2,294,909
|
|
2,068,340
|
|
|||
|
Accumulated other comprehensive income
|
1,089,805
|
|
911,337
|
|
|||
|
Total Shareholders' Equity
|
6,673,577
|
|
3,888,657
|
|
|||
|
Noncontrolling interests
|
4,433
|
|
360
|
|
|||
|
Total Equity
|
6,678,010
|
|
3,889,017
|
|
|||
|
Total Liabilities and Equity
|
$
|
23,955,511
|
|
$
|
12,556,588
|
|
|
See accompanying notes to consolidated financial statements.
28
MARKEL CORPORATION AND SUBSIDIARIES
|
Years Ended December 31,
|
|||||||||||
|
2013
|
2012
|
2011
|
|||||||||
|
(dollars in thousands, except per share data)
|
|||||||||||
|
OPERATING REVENUES
|
|||||||||||
|
Earned premiums
|
$
|
3,231,616
|
|
$
|
2,147,128
|
|
$
|
1,979,340
|
|
||
|
Net investment income
|
317,373
|
|
282,107
|
|
263,676
|
|
|||||
|
Net realized investment gains:
|
|||||||||||
|
Other-than-temporary impairment losses
|
(4,706
|
)
|
(12,078
|
)
|
(14,250
|
)
|
|||||
|
Other-than-temporary impairment losses recognized in other comprehensive income
|
—
|
|
—
|
|
(5,946
|
)
|
|||||
|
Other-than-temporary impairment losses recognized in net income
|
(4,706
|
)
|
(12,078
|
)
|
(20,196
|
)
|
|||||
|
Net realized investment gains, excluding other-than-temporary impairment losses
|
67,858
|
|
43,671
|
|
56,053
|
|
|||||
|
Net realized investment gains
|
63,152
|
|
31,593
|
|
35,857
|
|
|||||
|
Other revenues
|
710,942
|
|
539,284
|
|
351,077
|
|
|||||
|
Total Operating Revenues
|
4,323,083
|
|
3,000,112
|
|
2,629,950
|
|
|||||
|
OPERATING EXPENSES
|
|||||||||||
|
Losses and loss adjustment expenses
|
1,816,273
|
|
1,154,068
|
|
1,209,986
|
|
|||||
|
Underwriting, acquisition and insurance expenses
|
1,312,312
|
|
929,472
|
|
810,179
|
|
|||||
|
Amortization of intangible assets
|
55,223
|
|
33,512
|
|
24,291
|
|
|||||
|
Other expenses
|
663,528
|
|
478,248
|
|
309,046
|
|
|||||
|
Total Operating Expenses
|
3,847,336
|
|
2,595,300
|
|
2,353,502
|
|
|||||
|
Operating Income
|
475,747
|
|
404,812
|
|
276,448
|
|
|||||
|
Interest expense
|
114,004
|
|
92,762
|
|
86,252
|
|
|||||
|
Income Before Income Taxes
|
361,743
|
|
312,050
|
|
190,196
|
|
|||||
|
Income tax expense
|
77,898
|
|
53,802
|
|
41,710
|
|
|||||
|
Net Income
|
283,845
|
|
258,248
|
|
148,486
|
|
|||||
|
Net income attributable to noncontrolling interests
|
2,824
|
|
4,863
|
|
6,460
|
|
|||||
|
Net Income to Shareholders
|
$
|
281,021
|
|
$
|
253,385
|
|
$
|
142,026
|
|
||
|
OTHER COMPREHENSIVE INCOME
|
|||||||||||
|
Change in net unrealized gains on investments, net of taxes:
|
|||||||||||
|
Net holding gains arising during the period
|
$
|
225,545
|
|
$
|
266,425
|
|
$
|
141,839
|
|
||
|
Change in unrealized other-than-temporary impairment losses on fixed maturities arising during the period
|
(141
|
)
|
(160
|
)
|
3,943
|
|
|||||
|
Reclassification adjustments for net gains included in net income
|
(40,830
|
)
|
(24,051
|
)
|
(22,341
|
)
|
|||||
|
Change in net unrealized gains on investments, net of taxes
|
184,574
|
|
242,214
|
|
123,441
|
|
|||||
|
Change in foreign currency translation adjustments, net of taxes
|
(10,143
|
)
|
1,534
|
|
(4,191
|
)
|
|||||
|
Change in net actuarial pension loss, net of taxes
|
4,065
|
|
6,664
|
|
(9,459
|
)
|
|||||
|
Total Other Comprehensive Income
|
178,496
|
|
250,412
|
|
109,791
|
|
|||||
|
Comprehensive Income
|
462,341
|
|
508,660
|
|
258,277
|
|
|||||
|
Comprehensive income attributable to noncontrolling interests
|
2,852
|
|
4,858
|
|
6,424
|
|
|||||
|
Comprehensive Income to Shareholders
|
$
|
459,489
|
|
$
|
503,802
|
|
$
|
251,853
|
|
||
|
NET INCOME PER SHARE
|
|||||||||||
|
Basic
|
$
|
22.57
|
|
$
|
25.96
|
|
$
|
14.66
|
|
||
|
Diluted
|
$
|
22.48
|
|
$
|
25.89
|
|
$
|
14.60
|
|
||
See accompanying notes to consolidated financial statements.
29
MARKEL CORPORATION AND SUBSIDIARIES
CONSOLIDATED STATEMENTS OF CHANGES IN EQUITY
|
(in thousands)
|
Common
Shares
|
Common
Stock
|
Retained
Earnings
|
Accumulated
Other
Comprehensive
Income
|
Total
Shareholders'
Equity
|
Noncontrolling
Interests
|
Total Equity
|
Redeemable Noncontrolling Interests
|
||||||||||||||||||||||
|
December 31, 2010
|
9,718
|
|
$
|
884,457
|
|
$
|
1,735,973
|
|
$
|
551,093
|
|
$
|
3,171,523
|
|
$
|
871
|
|
$
|
3,172,394
|
|
$
|
15,298
|
|
|||||||
|
Net income (loss)
|
142,026
|
|
—
|
|
142,026
|
|
(190
|
)
|
141,836
|
|
6,650
|
|
||||||||||||||||||
|
Other comprehensive income (loss)
|
—
|
|
109,827
|
|
109,827
|
|
—
|
|
109,827
|
|
(36
|
)
|
||||||||||||||||||
|
Comprehensive Income (Loss)
|
251,853
|
|
(190
|
)
|
251,663
|
|
6,614
|
|
||||||||||||||||||||||
|
Issuance of common stock
|
16
|
|
1,182
|
|
—
|
|
—
|
|
1,182
|
|
—
|
|
1,182
|
|
—
|
|
||||||||||||||
|
Repurchase of common stock
|
(113
|
)
|
—
|
|
(42,913
|
)
|
—
|
|
(42,913
|
)
|
—
|
|
(42,913
|
)
|
—
|
|
||||||||||||||
|
Restricted stock awards expensed
|
—
|
|
5,818
|
|
—
|
|
—
|
|
5,818
|
|
—
|
|
5,818
|
|
—
|
|
||||||||||||||
|
Acquisitions
|
—
|
|
—
|
|
—
|
|
—
|
|
—
|
|
—
|
|
—
|
|
62,189
|
|
||||||||||||||
|
Other
|
—
|
|
50
|
|
—
|
|
—
|
|
50
|
|
(79
|
)
|
(29
|
)
|
(9,870
|
)
|
||||||||||||||
|
December 31, 2011
|
9,621
|
|
891,507
|
|
1,835,086
|
|
660,920
|
|
3,387,513
|
|
602
|
|
3,388,115
|
|
74,231
|
|
||||||||||||||
|
Net income (loss)
|
253,385
|
|
—
|
|
253,385
|
|
(262
|
)
|
253,123
|
|
5,125
|
|
||||||||||||||||||
|
Other comprehensive income (loss)
|
—
|
|
250,417
|
|
250,417
|
|
—
|
|
250,417
|
|
(5
|
)
|
||||||||||||||||||
|
Comprehensive Income (Loss)
|
503,802
|
|
(262
|
)
|
503,540
|
|
5,120
|
|
||||||||||||||||||||||
|
Issuance of common stock
|
47
|
|
9,145
|
|
—
|
|
—
|
|
9,145
|
|
—
|
|
9,145
|
|
—
|
|
||||||||||||||
|
Repurchase of common stock
|
(39
|
)
|
—
|
|
(16,873
|
)
|
—
|
|
(16,873
|
)
|
—
|
|
(16,873
|
)
|
—
|
|
||||||||||||||
|
Restricted stock awards expensed
|
—
|
|
6,462
|
|
—
|
|
—
|
|
6,462
|
|
—
|
|
6,462
|
|
—
|
|
||||||||||||||
|
Acquisitions
|
—
|
|
—
|
|
—
|
|
—
|
|
—
|
|
—
|
|
—
|
|
15,055
|
|
||||||||||||||
|
Adjustment of redeemable noncontrolling interests
|
—
|
|
—
|
|
(3,101
|
)
|
—
|
|
(3,101
|
)
|
—
|
|
(3,101
|
)
|
3,101
|
|
||||||||||||||
|
Purchase of noncontrolling interest
|
—
|
|
1,430
|
|
—
|
|
—
|
|
1,430
|
|
—
|
|
1,430
|
|
(3,573
|
)
|
||||||||||||||
|
Other
|
—
|
|
436
|
|
(157
|
)
|
—
|
|
279
|
|
20
|
|
299
|
|
(7,709
|
)
|
||||||||||||||
|
December 31, 2012
|
9,629
|
|
908,980
|
|
2,068,340
|
|
911,337
|
|
3,888,657
|
|
360
|
|
3,889,017
|
|
86,225
|
|
||||||||||||||
|
Net income (loss)
|
281,021
|
|
—
|
|
281,021
|
|
(958
|
)
|
280,063
|
|
3,782
|
|
||||||||||||||||||
|
Other comprehensive income
|
—
|
|
178,468
|
|
178,468
|
|
—
|
|
178,468
|
|
28
|
|
||||||||||||||||||
|
Comprehensive Income (Loss)
|
459,489
|
|
(958
|
)
|
458,531
|
|
3,810
|
|
||||||||||||||||||||||
|
Issuance of common stock
|
71
|
|
24,518
|
|
—
|
|
—
|
|
24,518
|
|
—
|
|
24,518
|
|
—
|
|
||||||||||||||
|
Repurchase of common stock
|
(109
|
)
|
—
|
|
(57,388
|
)
|
—
|
|
(57,388
|
)
|
—
|
|
(57,388
|
)
|
—
|
|
||||||||||||||
|
Restricted stock awards expensed
|
(3
|
)
|
25,239
|
|
—
|
|
—
|
|
25,239
|
|
—
|
|
25,239
|
|
—
|
|
||||||||||||||
|
Acquisition of Alterra
|
4,398
|
|
2,330,199
|
|
—
|
|
—
|
|
2,330,199
|
|
—
|
|
2,330,199
|
|
—
|
|
||||||||||||||
|
Adjustment of redeemable noncontrolling interests
|
—
|
|
—
|
|
1,963
|
|
—
|
|
1,963
|
|
—
|
|
1,963
|
|
(1,963
|
)
|
||||||||||||||
|
Purchase of noncontrolling interest
|
—
|
|
(136
|
)
|
—
|
|
—
|
|
(136
|
)
|
—
|
|
(136
|
)
|
(11,716
|
)
|
||||||||||||||
|
Other
|
—
|
|
63
|
|
973
|
|
—
|
|
1,036
|
|
5,031
|
|
6,067
|
|
(4,173
|
)
|
||||||||||||||
|
December 31, 2013
|
13,986
|
|
$
|
3,288,863
|
|
$
|
2,294,909
|
|
$
|
1,089,805
|
|
$
|
6,673,577
|
|
$
|
4,433
|
|
$
|
6,678,010
|
|
$
|
72,183
|
|
|||||||
See accompanying notes to consolidated financial statements.
30
MARKEL CORPORATION AND SUBSIDIARIES
|
Years Ended December 31,
|
|||||||||||
|
2013
|
2012
|
2011
|
|||||||||
|
(dollars in thousands)
|
|||||||||||
|
OPERATING ACTIVITIES
|
|||||||||||
|
Net income
|
$
|
283,845
|
|
$
|
258,248
|
|
$
|
148,486
|
|
||
|
Adjustments to reconcile net income to net cash provided by operating activities:
|
|||||||||||
|
Deferred income tax expense
|
4,050
|
|
37,648
|
|
5,649
|
|
|||||
|
Depreciation and amortization
|
190,066
|
|
87,326
|
|
70,572
|
|
|||||
|
Net realized investment gains
|
(63,152
|
)
|
(31,593
|
)
|
(35,857
|
)
|
|||||
|
Decrease (increase) in receivables
|
142,065
|
|
(36,590
|
)
|
(10,745
|
)
|
|||||
|
Decrease (increase) in deferred policy acquisition costs
|
(103,704
|
)
|
37,209
|
|
(5,891
|
)
|
|||||
|
Increase (decrease) in unpaid losses and loss adjustment expenses, net
|
290,130
|
|
(28,052
|
)
|
57,000
|
|
|||||
|
Decrease in life and annuity benefits
|
(40,235
|
)
|
—
|
|
—
|
|
|||||
|
Increase in unearned premiums, net
|
97,249
|
|
71,073
|
|
59,612
|
|
|||||
|
Increase (decrease) in payables to insurance and reinsurance companies
|
(150,764
|
)
|
19,190
|
|
(3,665
|
)
|
|||||
|
Increase (decrease) in income taxes payable
|
81,995
|
|
(9,909
|
)
|
28,036
|
|
|||||
|
Other
|
13,976
|
|
(12,017
|
)
|
(1,879
|
)
|
|||||
|
Net Cash Provided By Operating Activities
|
745,521
|
|
392,533
|
|
311,318
|
|
|||||
|
INVESTING ACTIVITIES
|
|||||||||||
|
Proceeds from sales of fixed maturities and equity securities
|
879,564
|
|
336,548
|
|
288,046
|
|
|||||
|
Proceeds from maturities, calls and prepayments of fixed maturities
|
1,475,938
|
|
510,697
|
|
343,502
|
|
|||||
|
Cost of fixed maturities and equity securities purchased
|
(1,651,397
|
)
|
(426,439
|
)
|
(713,102
|
)
|
|||||
|
Net change in short-term investments
|
(470,423
|
)
|
(428,292
|
)
|
(216,972
|
)
|
|||||
|
Proceeds from sales of equity method investments
|
313,557
|
|
—
|
|
—
|
|
|||||
|
Cost of equity method investments
|
(38,018
|
)
|
(40,650
|
)
|
(9,880
|
)
|
|||||
|
Change in restricted cash and cash equivalents
|
(263,014
|
)
|
(37,642
|
)
|
(16,795
|
)
|
|||||
|
Additions to property and equipment
|
(47,725
|
)
|
(45,519
|
)
|
(60,132
|
)
|
|||||
|
Acquisitions, net of cash acquired
|
(12,198
|
)
|
(243,675
|
)
|
(120,102
|
)
|
|||||
|
Other
|
1,103
|
|
(2,158
|
)
|
14,329
|
|
|||||
|
Net Cash Provided (Used) By Investing Activities
|
187,387
|
|
(377,130
|
)
|
(491,106
|
)
|
|||||
|
FINANCING ACTIVITIES
|
|||||||||||
|
Additions to senior long-term debt and other debt
|
547,214
|
|
492,792
|
|
336,181
|
|
|||||
|
Repayment and retirement of senior long-term debt and other debt
|
(321,978
|
)
|
(313,790
|
)
|
(90,557
|
)
|
|||||
|
Repurchases of common stock
|
(57,388
|
)
|
(16,873
|
)
|
(42,913
|
)
|
|||||
|
Issuance of common stock
|
24,518
|
|
9,145
|
|
1,182
|
|
|||||
|
Purchase of redeemable noncontrolling interests
|
(11,852
|
)
|
(2,143
|
)
|
—
|
|
|||||
|
Distributions to noncontrolling interests
|
(5,124
|
)
|
(7,684
|
)
|
(9,259
|
)
|
|||||
|
Other
|
(23
|
)
|
(19,485
|
)
|
(45
|
)
|
|||||
|
Net Cash Provided By Financing Activities
|
175,367
|
|
141,962
|
|
194,589
|
|
|||||
|
Effect of foreign currency rate changes on cash and cash equivalents
|
6,485
|
|
3,142
|
|
(1,823
|
)
|
|||||
|
Increase in cash and cash equivalents
|
1,114,760
|
|
160,507
|
|
12,978
|
|
|||||
|
Cash and cash equivalents at beginning of year
|
863,766
|
|
703,259
|
|
690,281
|
|
|||||
|
CASH AND CASH EQUIVALENTS AT END OF YEAR
|
$
|
1,978,526
|
|
$
|
863,766
|
|
$
|
703,259
|
|
||
See accompanying notes to consolidated financial statements.
31
NOTES TO CONSOLIDATED FINANCIAL STATEMENTS
1. Summary of Significant Accounting Policies
Markel Corporation is a diverse financial holding company serving a variety of niche markets. Markel Corporation's principal business markets and underwrites specialty insurance products. Through its wholly-owned subsidiary, Markel Ventures, Inc. (Markel Ventures), Markel Corporation also owns interests in various industrial and service businesses that operate outside of the specialty insurance marketplace.
On May 1, 2013 (the Acquisition Date), Markel Corporation completed the acquisition of
100%
of the issued and outstanding common stock of Alterra Capital Holdings Limited (Alterra) pursuant to an agreement dated December 18, 2012 which provided for the merger of Alterra with one of Markel Corporation's subsidiaries. Total purchase consideration was
$3.3 billion
. Alterra was a Bermuda-headquartered global enterprise providing diversified specialty insurance and reinsurance products to corporations, public entities and other property and casualty insurers.
a)
Basis of Presentation.
The accompanying consolidated financial statements have been prepared in accordance with U.S. generally accepted accounting principles (U.S. GAAP) and include the accounts of Markel Corporation and its subsidiaries (the Company). All significant intercompany balances and transactions have been eliminated in consolidation. The consolidated financial statements include the results of operations and cash flows of Alterra from the Acquisition Date to December 31, 2013 and not in any prior periods, except with respect to the Supplemental Pro Forma Information included in note 2. The Company consolidates the results of its Markel Ventures subsidiaries on a one-month lag. Certain prior year amounts have been reclassified to conform to the current presentation, including the separate presentation of restricted cash and cash equivalents on the consolidated balance sheets and corresponding change in cash flows from investing activities on the consolidated statements of cash flows.
b)
Use of Estimates.
The preparation of financial statements in accordance with U.S. GAAP requires management to make estimates and assumptions that affect the reported amounts of assets, liabilities, revenues and expenses and the disclosure of contingent assets and liabilities. Management periodically reviews its estimates and assumptions. Quarterly reviews include evaluating the adequacy of reserves for unpaid losses and loss adjustment expenses, life and annuity reinsurance benefit reserves, litigation contingencies, the reinsurance allowance for doubtful accounts and income tax liabilities, as well as analyzing the recoverability of deferred tax assets, estimating reinsurance premiums written and earned and evaluating the investment portfolio for other-than-temporary declines in estimated fair value. Estimates and assumptions for goodwill and intangible assets are reviewed in conjunction with an acquisition and goodwill and indefinite-lived intangible assets are reassessed at least annually for impairment. Actual results may differ materially from the estimates and assumptions used in preparing the consolidated financial statements.
c)
Investments.
Available-for-sale investments are recorded at estimated fair value. Unrealized gains and losses on investments, net of deferred income taxes, are included in accumulated other comprehensive income in shareholders' equity. The Company completes a detailed analysis each quarter to assess whether the decline in the fair value of any investment below its cost basis is deemed other-than-temporary.
Premiums and discounts are amortized or accreted over the lives of the related fixed maturities as an adjustment to the yield using the effective interest method. Dividend and interest income are recognized when earned. Realized investment gains or losses are included in earnings. Realized gains or losses from sales of investments are derived using the first-in, first-out method.
Investments accounted for under the equity method of accounting are recorded at cost within other assets on the consolidated balance sheets and subsequently increased or decreased by the Company's proportionate share of the net income or loss of the investee. The Company records its proportionate share of net income or loss of the investee in net investment income. The Company records its proportionate share of other comprehensive income or loss of the investee as a component of other comprehensive income. Dividends or other equity distributions are recorded as a reduction of the investment. The Company reviews equity method investments for impairment when events or circumstances indicate that a decline in the fair value of the investment below its carrying value is other-than-temporary.
d)
Cash and Cash Equivalents.
The Company considers all investments with original maturities of
90 days
or less to be cash equivalents. The carrying value of the Company's cash and cash equivalents and restricted cash and cash equivalents approximates fair value.
32
e)
Receivables.
Receivables include amounts receivable from agents, brokers and insureds, which represent premiums that are both currently due and amounts not yet due on insurance and reinsurance policies. Premiums for insurance policies are generally due at inception. Premiums for reinsurance policies generally become due over the period of coverage based on the policy terms. The Company monitors the credit risk associated with premiums receivable, taking into consideration the fact that in certain instances credit risk may be reduced by the Company's right to offset loss obligations or unearned premiums against premiums receivable. Amounts deemed uncollectible are charged to net income in the period they are determined. Changes in the estimate of reinsurance premiums written will result in an adjustment to premiums receivable in the period they are determined.
f)
Reinsurance Recoverables.
Amounts recoverable from reinsurers are estimated in a manner consistent with the claim liability associated with the reinsured business. Allowances are established for amounts deemed uncollectible and reinsurance recoverables are recorded net of these allowances. The Company evaluates the financial condition of its reinsurers and monitors concentration risk to minimize its exposure to significant losses from individual reinsurers.
g)
Deferred Policy Acquisition Costs.
Costs directly related to the acquisition of insurance premiums are deferred and amortized over the related policy period, generally
one year
. Concurrent with the adoption of Financial Accounting Standards Board (FASB) Accounting Standards Update (ASU) No. 2010-26,
Accounting for Costs Associated with Acquiring or Renewing Insurance Contracts,
effective January 1, 2012, the Company only defers acquisition costs incurred that are related directly to the successful acquisition of new or renewal insurance contracts, including commissions to agents and brokers and premium taxes. Commissions received related to reinsurance premiums ceded are netted against broker commissions in determining acquisition costs eligible for deferral. To the extent that future policy revenues on existing policies are not adequate to cover related costs and expenses, deferred policy acquisition costs are charged to earnings. The Company does not consider anticipated investment income in determining whether a premium deficiency exists.
h)
Goodwill and Intangible Assets.
Goodwill and intangible assets are recorded as a result of business acquisitions. Goodwill represents the excess of the amount paid to acquire a business over the net fair value of assets acquired and liabilities assumed at the date of acquisition. Indefinite-lived and other intangible assets are recorded at fair value as of the acquisition date. The determination of the fair value of certain assets acquired and liabilities assumed involves significant judgment and the use of valuation models and other estimates, which require assumptions that are inherently subjective. Goodwill and indefinite-lived intangible assets are tested for impairment at least annually. The Company completes an annual test during the fourth quarter of each year based upon the results of operations through September 30. Intangible assets with definite lives are amortized using the straight-line method over their estimated useful lives, generally
five
to
20 years
, and are reviewed for impairment when events or circumstances indicate that their carrying value may not be recoverable.
i)
Property and Equipment.
Property and equipment are stated at cost less accumulated depreciation and amortization. Depreciation and amortization of property and equipment are calculated using the straight-line method over the estimated useful lives (generally, the life of the lease for leasehold improvements,
ten
to
40 years
for buildings,
seven
to
40 years
for land improvements,
three
to
ten years
for furniture and equipment and
three
to
25 years
for other property and equipment).
j)
Redeemable Noncontrolling Interests.
The Company owns controlling interests in various companies through its Markel Ventures operations. Under the terms of certain of the acquisition and related agreements, the Company has the option to acquire the remaining equity interests and the remaining equity interests have the option to sell their interests to the Company in the future. The redemption value of the remaining equity interests is generally based on the respective company's earnings in specified periods preceding the redemption date. The redeemable noncontrolling interests generally become redeemable through 2018.
The Company recognizes changes in the redemption value that exceed the carrying value of redeemable noncontrolling interests to retained earnings as if the balance sheet date were also the redemption date. Changes in the redemption value also result in an adjustment to net income to shareholders in the calculation of basic and diluted net income per share. The adjustment recorded to retained earnings during
2013
and
2012
was a decrease of
$2.0 million
and an increase of
$3.1 million
, respectively. There were
no
adjustments recorded to retained earnings in 2011 because the redemption values of the redeemable noncontrolling interests were less than or approximated their carrying values.
33
k)
Income Taxes.
The Company records deferred income taxes to reflect the net tax effect of temporary differences between the carrying amounts of assets and liabilities for financial reporting purposes and their tax bases. Deferred tax assets are reduced by a valuation allowance when management believes it is more likely than not that some, or all, of the deferred tax assets will not be realized. The Company recognizes the tax benefit from an uncertain tax position taken or expected to be taken in income tax returns only if it is more likely than not that the tax position will be sustained upon examination by tax authorities, based on the technical merits of the position. Tax positions that meet the more likely than not threshold are then measured using a probability weighted approach, whereby the largest amount of tax benefit that is greater than
50%
likely of being realized upon ultimate settlement is recognized. The Company recognizes interest and penalties related to uncertain tax positions in income tax expense.
l)
Unpaid Losses and Loss Adjustment Expenses.
Unpaid losses and loss adjustment expenses on our property and casualty insurance business are based on evaluations of reported claims and estimates for losses and loss adjustment expenses incurred but not reported. Estimates for losses and loss adjustment expenses incurred but not reported are based on reserve development studies, among other things. The Company does not discount reserves for losses and loss adjustment expenses to reflect estimated present value, except for reserves assumed in connection with an acquisition, which are recorded at fair value at the acquisition date. Recorded reserves are estimates, and the ultimate liability may be greater or less than the estimates.
m)
Life and Annuity Benefits.
Prior to its acquisition by the Company, Alterra entered into long duration reinsurance contracts for life and annuity benefits which subject the Company to mortality, longevity and morbidity risks. The assumptions used to determine policy benefit reserves were determined at the Acquisition Date and are generally locked-in for the life of the contract unless an unlocking event occurs. To the extent existing policy reserves, together with the present value of future gross premiums and expected investment income earned thereon, are not adequate to cover the present value of future benefits, settlement and maintenance costs, the locked-in assumptions are revised to current best estimate assumptions and a charge to earnings for life and annuity benefits is recognized at that time. Because of the assumptions and estimates used in establishing reserves for life and annuity benefit obligations and the long-term nature of these reinsurance contracts, the ultimate liability may be greater or less than the estimates.
Results attributable to the run-off of life and annuity reinsurance business are included in other revenues and other expenses in the Company's consolidated statements of income and comprehensive income and as part of the Company's Other Insurance (Discontinued Lines) segment.
n)
Revenue Recognition.
Property and Casualty Premiums
Insurance premiums are generally earned on a pro rata basis over the policy period, typically
one year
. The cost of reinsurance ceded is initially recorded as prepaid reinsurance premiums and is amortized over the reinsurance contract period in proportion to the amount of insurance protection provided. Premiums ceded are netted against premiums written.
Assumed reinsurance premiums are recorded at the inception of each contract based upon contract terms and information received from cedents and brokers and are earned on a pro rata basis over the coverage period, or for multi-year contracts, in proportion with the underlying risk exposure to the extent there is variability in the exposure through the coverage period. Changes in reinsurance premium estimates are expected and may result in significant adjustments in any period. These estimates change over time as additional information regarding changes in underlying exposures is obtained. Any subsequent differences arising on such estimates are recorded as premiums written in the period they are determined. The Company uses the periodic method to account for assumed reinsurance from foreign reinsurers. The Company's foreign reinsurers provide sufficient information to record foreign assumed business in the same manner as the Company records assumed business from United States reinsurers.
Certain contracts that the Company writes provide for reinstatement of coverage. Reinstatement premiums are the premiums for the restoration of the insurance or reinsurance limit of a contract to its full amount after a loss occurrence by the insured or reinsured. The Company accrues for reinstatement premiums resulting from losses recorded. Such accruals are based upon contractual terms and management judgment is involved with respect to the amount of losses recorded. Changes in estimates of losses recorded on contracts with reinstatement premium features will result in changes in reinstatement premiums based on contractual terms. Reinstatement premiums are recognized at the time losses are recorded and are earned on a pro-rata basis over the coverage period.
34
Other Revenues
Other revenues primarily relate to the Company's Markel Ventures operations and consist of revenues from the sale of manufactured products and service revenues. Revenues from manufactured products are generally recognized at the time title transfers to the customer, which occurs at the point of shipment or delivery to the customer, depending on the terms of the sales arrangement. Revenues from services are generally recognized as the services are performed. Services provided pursuant to a contract are recognized either over the contract period or upon completion of the elements specified in the contract, depending on the terms of the contract.
o)
Stock-based Compensation.
Stock-based compensation expense is recognized as part of underwriting, acquisition and insurance expenses over the requisite service period. Stock-based compensation expense, net of taxes, was
$18.4 million
in
2013
,
$4.4 million
in
2012
and
$4.0 million
in
2011
. See note 12.
p)
Foreign Currency Translation.
The functional currencies of the Company's foreign operations are the currencies in which the majority of their business is transacted. Assets and liabilities of foreign operations are translated into the United States Dollar using the exchange rates in effect at the balance sheet date. Revenues and expenses of foreign operations are translated using the average exchange rate for the period. Gains or losses from translating the financial statements of foreign operations are included, net of taxes, in shareholders' equity as a component of accumulated other comprehensive income. Gains and losses arising from transactions denominated in a foreign currency, other than a functional currency, are included in net income.
The Company manages its exposure to foreign currency risk primarily by matching assets and liabilities denominated in the same currency. To the extent that assets and liabilities in foreign currencies are not matched, the Company is exposed to foreign currency risk. For functional currencies, the related exchange rate fluctuations are reflected in other comprehensive income. The cumulative foreign currency translation adjustment, net of taxes, was a loss of
$11.2 million
and
$1.1 million
at
December 31, 2013
and
2012
, respectively.
q)
Derivative Financial Instruments.
Derivative instruments, including derivative instruments resulting from hedging activities, are measured at fair value and recognized as either assets or liabilities on the consolidated balance sheets. The changes in fair value of derivatives are recognized in earnings unless the derivative is designated as a hedge and qualifies for hedge accounting.
The Company's foreign currency forward contracts are generally designated and qualified as hedges of a net investment in a foreign operation. The effective portion of the change in fair value resulting from these hedges is reported in currency translation adjustments as part of other comprehensive income. The ineffective portion of the change in fair value is recognized in earnings.
r)
Comprehensive Income.
Comprehensive income represents all changes in equity that result from recognized transactions and other economic events during the period. Other comprehensive income refers to revenues, expenses, gains and losses that under U.S. GAAP are included in comprehensive income but excluded from net income, such as unrealized gains or losses on investments, foreign currency translation adjustments and changes in net actuarial pension loss.
s)
Net Income Per Share.
Basic net income per share is computed by dividing adjusted net income to shareholders by the weighted average number of common shares outstanding during the year. Unvested share-based compensation awards that contain non-forfeitable rights to dividends or dividend equivalents (whether paid or unpaid) are considered participating awards and are included in the computation of net income per share. Non-participating unvested share-based compensation awards are excluded from the computation of net income per share. Diluted net income per share is computed by dividing adjusted net income to shareholders by the weighted average number of common shares and dilutive potential common shares outstanding during the year. See note 12(b).
35
t)
Recent Accounting Pronouncements.
Effective January 1, 2013, the Company adopted FASB ASU No. 2013-02,
Reporting Amounts Reclassified Out of Accumulated Other Comprehensive Income
, which amends FASB Accounting Standards Codification (ASC) 220,
Comprehensive Income
, to improve the reporting of reclassifications out of accumulated other comprehensive income. ASU No. 2013-02 requires information about reclassifications out of accumulated other comprehensive income to be reported in one place, by component. The guidance also requires disclosure of the effect of significant reclassifications out of accumulated other comprehensive income on the respective line items in net income if the amount being reclassified is required under U.S. GAAP to be reclassified in its entirety to net income. For other amounts that are not required to be reclassified in their entirety to net income, an entity is required to cross-reference to other disclosures required under U.S. GAAP that provide additional detail about those amounts. The adoption of this guidance did not have an impact on the Company's financial position, results of operations or cash flows. The Company has included the additional disclosures required by ASU No. 2013-02 in note 13.
In July 2013, the FASB issued ASU No. 2013-11,
Presentation of an Unrecognized Tax Benefit When a Net Operating Loss Carryforward, a Similar Tax Loss, or a Tax Credit Carryforward Exists.
ASU No. 2013-11 requires that a liability related to an unrecognized tax benefit be offset against a deferred tax asset for a net operating loss carryforward, a similar tax loss or a tax credit carryforward if such settlement is required or expected in the event the uncertain tax position is disallowed. In that case, the liability associated with the unrecognized tax benefit is presented in the financial statements as a reduction to the related deferred tax asset for a net operating loss carryforward, a similar tax loss or a tax credit carryforward. Otherwise, the unrecognized tax benefit should be presented in the financial statements as a liability and should not be combined with deferred tax assets. ASU No. 2013-11 becomes effective for the Company during the first quarter of 2014. The adoption of this ASU is not expected to impact the Company's financial position, results of operations or cash flows.
2. Acquisitions
Acquisition of Alterra
a)
Overview.
On May 1, 2013, the Company completed the acquisition of
100%
of the the issued and outstanding common stock of Alterra pursuant to an agreement dated December 18, 2012 (the Merger Agreement) which provided for the merger of Alterra with one of the Company's subsidiaries. Alterra was a Bermuda-headquartered global enterprise providing diversified specialty property and casualty insurance and reinsurance products to corporations, public entities and other property and casualty insurers. The acquisition of Alterra creates additional size and scale, providing additional insurance and investment opportunities for the Company. As a result of the acquisition of Alterra, the Company formed a new operating segment, the Alterra segment. Results attributable to Alterra's property and casualty insurance and reinsurance business are included in the Alterra segment. Alterra also offered life and annuity reinsurance products. In 2010, Alterra ceased writing life and annuity reinsurance contracts and placed this business into run-off. Results attributable to the run-off of life and annuity reinsurance business are included in the Company's Other Insurance (Discontinued Lines) segment. See note 20 for further discussion of the Company's operating segments.
Pursuant to the terms of the Merger Agreement, on the Acquisition Date, equity holders of Alterra received, in exchange for each share of Alterra common stock held (other than restricted shares that did not vest in connection with the transaction), (1)
0.04315
shares of the Company's common stock and (2)
$10.00
in cash. Equity holders of Alterra received total consideration of
$3.3 billion
, consisting of cash consideration of
$964.3 million
and stock consideration of
4.3 million
shares of the Company's common stock.
Following the acquisition, the Company's board of directors consists of all
ten
members from its pre-acquisition board of directors and
two
additional members who were designated by Alterra and approved by the Company's Nominating/Corporate Governance Committee.
36
b)
Purchase Price.
The Company's total purchase price for Alterra as of the Acquisition Date was calculated as follows:
|
(in thousands, except per share amounts)
|
|||
|
Shares of Alterra common stock outstanding as of the Acquisition Date
|
96,433
|
|
|
|
Exchange ratio per the Merger Agreement
|
0.04315
|
|
|
|
Markel share issuance to Alterra shareholders
|
4,161
|
|
|
|
Shares of Alterra restricted stock outstanding as of the Acquisition Date
|
2,239
|
|
|
|
Incentive award ratio per the Merger Agreement
|
0.06252
|
|
|
|
Markel restricted stock issuance to Alterra restricted stock holders
|
140
|
|
|
|
Multiplied by Markel's weighted average stock price on April 30, 2013
(1)
|
$
|
529.59
|
|
|
Markel share and restricted stock issuance consideration, net of taxes
|
$
|
2,267,648
|
|
|
Alterra common shares outstanding as of the Acquisition Date that received cash consideration
|
96,433
|
|
|
|
Multiplied by cash price per share component per the Merger Agreement
|
$
|
10.00
|
|
|
Markel cash consideration
|
$
|
964,330
|
|
|
Fair value of Markel warrant issuance to Alterra warrant holders as of the Acquisition Date
|
$
|
73,685
|
|
|
Fair value of Markel stock option issuance to Alterra stock option holders as of the Acquisition Date, net of taxes
|
$
|
12,335
|
|
|
Fair value of partially vested Markel restricted stock unit issuance as of the Acquisition Date, net of taxes
|
$
|
6,867
|
|
|
Unrecognized compensation on unvested restricted stock and restricted stock units
|
$
|
(20,572
|
)
|
|
Total acquisition consideration
|
$
|
3,304,293
|
|
|
(1)
|
The fair value of the shares issued by the Company was calculated as the weighted average price of the Company's stock on April 30, 2013, the day preceding the Acquisition Date.
|
As part of the consideration, the Company issued replacement warrants, options and restricted stock awards to holders of Alterra warrants, options and restricted stock awards. The acquisition consideration related to the options, restricted stock and restricted stock units issued was net of income taxes of
$1.9 million
,
$10.1 million
and
$0.7 million
, respectively. See note 12 for additional information about the equity awards issued in connection with the acquisition.
c)
Fair Value of Net Assets Acquired and Liabilities Assumed.
The purchase price was allocated to the acquired assets and liabilities of Alterra based on estimated fair values at the Acquisition Date. The Company recognized goodwill of
$295.7 million
, all of which was recorded within the Alterra segment and is primarily attributable to Alterra's assembled workforce and synergies that are expected to result upon integration of Alterra into the Company's insurance operations and investing activities.
None
of the goodwill that was recorded is deductible for income tax purposes. The Company also recognized indefinite lived intangible assets of
$37.5 million
and other intangible assets of
$170.0 million
, which will be amortized over a weighted average period of
17 years
.
37
The following table summarizes the fair values of the assets acquired and liabilities assumed at the Acquisition Date.
|
(dollars in thousands)
|
|||
|
ASSETS
|
|||
|
Investments
|
$
|
6,407,841
|
|
|
Cash and cash equivalents
|
1,036,274
|
|
|
|
Restricted cash and cash equivalents
|
414,497
|
|
|
|
Receivables
|
866,388
|
|
|
|
Reinsurance recoverable on unpaid losses
|
1,169,084
|
|
|
|
Reinsurance recoverable on paid losses
|
80,672
|
|
|
|
Prepaid reinsurance premiums
|
317,445
|
|
|
|
Other assets
|
859,884
|
|
|
|
LIABILITIES
|
|||
|
Unpaid losses and loss adjustment expenses
|
4,719,461
|
|
|
|
Life and annuity benefits
|
1,477,482
|
|
|
|
Unearned premiums
|
1,075,610
|
|
|
|
Payables to insurance and reinsurance companies
|
342,858
|
|
|
|
Senior long-term debt
|
512,463
|
|
|
|
Other liabilities
|
223,108
|
|
|
|
Net assets
|
2,801,103
|
|
|
|
Goodwill
|
295,690
|
|
|
|
Intangible assets
|
207,500
|
|
|
|
Acquisition date fair value
|
$
|
3,304,293
|
|
An explanation of the significant adjustments for fair value and the related impact on amortization is as follows:
|
•
|
Investments
- Fixed maturity investments acquired include a net increase of
$223.1 million
to adjust the historical carrying amount of Alterra's investments to their estimated fair value as of the Acquisition Date. The difference in the historical amortized cost of the fixed maturity investments acquired and their estimated fair value as of the Acquisition Date,
$495.5 million
, represents incremental premium that will be amortized to net investment income over the term of the underlying securities. The amount of the unamortized incremental premium as of December 31, 2013 was
$398.1 million
, which will be amortized over a weighted average remaining term of approximately
five years
. The decrease in the unamortized incremental premium is due to amortization expense of
$58.3 million
and sales of securities.
|
|
•
|
Intangible assets -
Establish the estimated fair value of intangible assets related to Alterra (see below for further detail).
|
|
•
|
Unearned Premiums -
Unearned premiums acquired include a decrease of
$176.3 million
to adjust the carrying value of Alterra's historical unearned premiums to fair value as of the Acquisition Date. The adjustment consists of the present value of the expected underwriting profit within the unearned premiums liability less costs to service the related policies and a risk premium. This adjustment will be amortized to underwriting, acquisition and insurance expenses over a weighted average period of approximately
one year
, as the contracts for business in-force as of the Acquisition Date expire.
|
|
•
|
Unpaid losses and loss adjustment expenses -
Unpaid losses and loss adjustment expenses acquired include an increase of
$120.8 million
to adjust the carrying value of Alterra's historical unpaid losses and loss adjustment expenses, net of related reinsurance recoverable, to fair value as of the Acquisition Date. The estimated fair value consists of the present value of the expected net loss and loss adjustment expense payments plus a risk premium. This adjustment, plus the
$26.5 million
unamortized fair value adjustment included in Alterra's historical unpaid losses and loss adjustment expenses, will be amortized to losses and loss adjustment expenses over a weighted average period of approximately
five years
, based on the estimated payout pattern of net reserves as of the Acquisition Date. As of December 31, 2013, the unamortized fair value adjustment included in unpaid losses and loss adjustment expenses was
$136.5 million
, which will be amortized over a weighted average remaining period of approximately
four years
.
|
38
|
•
|
Life and Annuity Benefits
- Life and annuity benefits acquired include an increase of
$329.6 million
to adjust the carrying value of Alterra's historical life and annuity benefits to fair value as of the Acquisition Date. The estimated fair value consists of the present value of the expected net life and annuity benefit payments plus a risk premium. See note 10 for detail regarding accounting for life and annuity benefits.
|
|
•
|
Senior long-term debt -
Senior long-term debt acquired includes an increase of
$71.9 million
to adjust the carrying value of Alterra's senior long-term debt to its estimated fair value based on prevailing interest rates and other factors as of the Acquisition Date. This adjustment will be amortized to interest expense over the term of the notes. See note 11. As of December 31, 2013, the unamortized premium on the acquired senior long-term debt was
$66.1 million
.
|
The following table summarizes the intangible assets recorded in connection with the acquisition, and as of
December 31, 2013
.
|
(dollars in thousands)
|
Amount
|
Economic
Useful Life
|
|||
|
Customer relationships
|
$
|
132,000
|
|
18 years
|
|
|
Broker relationships
|
19,000
|
|
18 years
|
||
|
Technology
|
18,000
|
|
Ten years
|
||
|
Trade names
|
1,000
|
|
One year
|
||
|
Lloyd's syndicate capacity
|
12,000
|
|
Indefinite
|
||
|
Insurance licenses
|
25,500
|
|
Indefinite
|
||
|
Intangible assets, before amortization, as of the Acquisition Date
|
207,500
|
|
|||
|
Amortization (from the Acquisition Date through December 31, 2013)
|
7,785
|
|
|||
|
Net intangible assets as of December 31, 2013
|
$
|
199,715
|
|
||
Customer relationships represent policyholder relationships and the network of insurance companies through which Alterra conducted its operations. The fair value of customer relationships and broker relationships was estimated using the income approach. Critical inputs into the valuation model for customer relationships and broker relationships include estimates of expected premium and attrition rates, and discounting at a weighted average cost of capital. Technology represents the intangible asset related to Alterra's internally developed software and was valued using the income approach.
The fair value of Lloyd's syndicate capacity and insurance licenses was estimated using the market approach. Lloyd's syndicate capacity represents Alterra's authorized premium income limit to write insurance business in the Lloyd's of London (Lloyd's) insurance market. The Lloyd's capacity is renewed annually at no cost to the Company or may be freely purchased or sold, subject to Lloyd's approval. The ability to write insurance business within the syndicate capacity is indefinite with the premium income limit being set annually by the Company, subject to Lloyd's approval.
d)
Income Taxes.
As a result of the acquisition, Alterra and its non-U.S. subsidiaries became controlled foreign corporations subject to U.S. income tax at a statutory rate of
35%
. The acquisition was taxable to U.S. shareholders of Alterra, and Markel has elected to treat it as an asset acquisition under section 338(g) of the U.S. Internal Revenue Code of 1986 (IRC), as amended.
Effective May 1, 2013, the Company made an IRC section 953(d) election with respect to Markel Bermuda Limited (Markel Bermuda, formerly known as Alterra Bermuda Limited), a wholly-owned subsidiary of Alterra. As a result of the 953(d) election, Markel Bermuda is treated as a domestic corporation for U.S. tax purposes and, accordingly, is required to record deferred taxes at the
35%
statutory U.S. rate.
As part of the allocation of the purchase price, the Company recorded net deferred tax assets of
$310.1 million
. Of this amount,
$343.9 million
represents deferred tax assets related to accrued losses and loss adjustment expenses and life and annuity benefits, which were partially offset by deferred tax liabilities of
$64.6 million
related to the estimated fair value of the intangible assets recorded. Other net deferred tax assets recorded primarily relate to differences between financial reporting and tax bases of the acquired assets and liabilities as of the Acquisition Date. At
December 31, 2013
, earnings of Alterra's foreign subsidiaries are considered reinvested indefinitely, consistent with the Company's other foreign subsidiaries, and
no
provision for deferred U.S. income tax has been recorded. As of December 31, 2013, the allocation of the purchase price reflects an increase of
$54.3 million
in the amount recorded for net deferred tax assets from the allocation initially reported at June 30, 2013 and a corresponding reduction in the amount recorded for goodwill.
39
e)
Transaction and Acquisition-Related Costs.
The following table summarizes transaction and acquisition-related costs incurred by the Company in connection with the acquisition, all of which were included in underwriting, acquisition and insurance expenses in the consolidated statements of income and comprehensive income.
|
(dollars in thousands)
|
Year Ended
December 31, 2013
|
||
|
Transaction costs
|
$
|
15,981
|
|
|
Acquisition-related costs:
|
|||
|
Severance costs
|
31,734
|
|
|
|
Stay bonuses
|
14,804
|
|
|
|
Acceleration of Alterra long-term incentive compensation awards and restricted stock awards
|
12,621
|
|
|
|
Total transaction and acquisition-related costs
|
$
|
75,140
|
|
Transaction costs primarily consist of due diligence, legal and investment banking costs. Per the terms of the Merger Agreement, transaction costs attributable to Alterra were recorded and paid by Alterra prior to the Acquisition Date (
$23.0 million
) and are not included within the Company's consolidated statements of income and comprehensive income.
In connection with the acquisition, Alterra instituted a retention plan for certain employees under which Alterra committed to the payment of stay bonuses to such employees one year from the Acquisition Date, provided they remain employed with the Company through that date. Payments may be accelerated for certain qualifying employment terminations.
Prior to its acquisition by the Company, Alterra granted long term incentive awards to certain employees to be paid in the form of cash on March 1, 2016, provided they remain employed with the Company on that date. Payments may be accelerated prior to March 1, 2016 for certain qualifying employment terminations. Additionally, as part of the purchase consideration, the Company issued replacement restricted stock awards to holders of Alterra restricted stock awards. As a result of separations made in connection with the acquisition, the Company recognized expense totaling
$12.6 million
related to the acceleration of certain of these awards during the year ended
December 31, 2013
.
f)
Financial Results.
The following table summarizes the results of Alterra since the Acquisition Date that have been included within the Company's consolidated statements of income and comprehensive income.
|
(dollars in thousands)
|
Year Ended
December 31, 2013
|
||
|
Operating revenues
|
$
|
912,387
|
|
|
Net loss to shareholders
|
$
|
(93,074
|
)
|
g)
Supplemental Pro Forma Information (unaudited).
Alterra's results have been included in the Company's Consolidated Financial Statements from the Acquisition Date to
December 31, 2013
. The following table presents unaudited pro forma consolidated information for the years ended
December 31, 2013
and 2012 and assumes the Company's acquisition of Alterra occurred on January 1, 2012. The pro forma financial information is presented for informational purposes only and does not necessarily reflect the results that would have occurred had the acquisition taken place on January 1, 2012, nor is it necessarily indicative of future results. Significant adjustments used to determine pro forma results include amortization of intangible assets and amortization of fair value adjustments discussed in c) above, and the corresponding income tax effects. The Company also excluded certain charges from the pro forma results, including transaction costs incurred by the Company (
$16.0 million
) and Alterra (
$23.0 million
) totaling
$39.0 million
for the year ended
December 31, 2013
, severance costs attributable to the acquisition totaling
$31.7 million
for the year ended December 31, 2013, and stay bonuses of
$14.8 million
for the year ended
December 31, 2013
. The acceleration of compensation expense during the year ended
December 31, 2013
related to Alterra's long-term incentive compensation awards and restricted stock awards was attributable to the acquisition; however, the incremental expense recognized during the period only represents a timing difference in the recognition of expense. Therefore, it was not excluded from the pro forma underwriting results.
40
|
Unaudited
|
|||||||
|
Consolidated Pro Forma
|
|||||||
|
Years Ended December 31,
|
|||||||
|
(in thousands, except per share amounts)
|
2013
|
2012
|
|||||
|
Earned premiums
|
$
|
3,680,220
|
|
$
|
3,509,834
|
|
|
|
Operating revenues
|
4,899,628
|
|
4,561,107
|
|
|||
|
Net income to shareholders
|
422,829
|
|
308,496
|
|
|||
|
U.S. GAAP combined ratio
(1)
|
95
|
%
|
99
|
%
|
|||
|
Basic net income per share
|
$
|
30.33
|
|
$
|
21.79
|
|
|
|
Diluted net income per share
|
$
|
30.19
|
|
$
|
21.71
|
|
|
|
Weighted average common shares outstanding:
|
|||||||
|
Basic
|
14,007
|
|
14,014
|
|
|||
|
Diluted
|
14,069
|
|
14,065
|
|
|||
|
(1)
|
The U.S. GAAP combined ratio is a measure of underwriting performance and represents the relationship of incurred losses, loss adjustment expenses and underwriting, acquisition and insurance expenses to earned premiums.
|
Acquisition of Essentia
On January 1, 2013, the Company completed its acquisition of
100%
of the outstanding shares of Essentia Insurance Company (Essentia), a company that underwrites insurance exclusively for Hagerty Insurance Agency and Hagerty Classic Marine Insurance Agency (collectively, Hagerty) throughout the United States. Hagerty offers insurance for classic cars, vintage boats, motorcycles and related automotive collectibles. The Company recognized intangible assets of
$35.4 million
associated with this acquisition, which includes
$25.0 million
of customer relationships to be amortized over a weighted average period of
six years
. Results attributable to this acquisition are included in the Specialty Admitted segment.
On January 1, 2014, Hagerty exercised its option to purchase
9.9%
of the outstanding shares of Essentia, which reduced the Company's ownership interest in Essentia to
90.1%
.
Acquisition of Abbey Protection
On January 17, 2014, the Company completed its acquisition of
100%
of the issued and to be issued share capital of Abbey Protection plc (Abbey), an integrated specialty insurance and consultancy group headquartered in London. Abbey's business is focused on the underwriting and sale of insurance products to small and medium-sized enterprises and affinity groups in the United Kingdom providing protection against legal expenses and professional fees incurred as a result of legal actions or investigations by tax authorities, as well as providing a range of complementary legal, professional and reinsurance services.
Total consideration for this acquisition was
$190.0 million
, all of which was cash consideration. The purchase price allocation for Abbey will be completed in the first quarter of 2014.
41
3. Investments
a)
The following tables summarize the Company's available-for-sale investments.
|
December 31, 2013
|
|||||||||||||||||||
|
(dollars in thousands)
|
Amortized
Cost
|
Gross
Unrealized
Holding
Gains
|
Gross
Unrealized
Holding
Losses
|
Unrealized Other-
Than-Temporary
Impairment Losses
|
Estimated
Fair
Value
|
||||||||||||||
|
Fixed maturities:
|
|||||||||||||||||||
|
U.S. Treasury securities and obligations of U.S. government agencies
|
$
|
1,215,522
|
|
$
|
9,051
|
|
$
|
(30,342
|
)
|
$
|
—
|
|
$
|
1,194,231
|
|
||||
|
Obligations of states, municipalities and political subdivisions
|
2,986,758
|
|
116,341
|
|
(27,384
|
)
|
—
|
|
3,075,715
|
|
|||||||||
|
Foreign governments
|
1,484,818
|
|
30,647
|
|
(54,411
|
)
|
—
|
|
1,461,054
|
|
|||||||||
|
Commercial mortgage-backed securities
|
379,555
|
|
62
|
|
(11,796
|
)
|
—
|
|
367,821
|
|
|||||||||
|
Residential mortgage-backed securities
|
875,902
|
|
13,046
|
|
(16,442
|
)
|
(2,258
|
)
|
870,248
|
|
|||||||||
|
Asset-backed securities
|
189,646
|
|
257
|
|
(1,614
|
)
|
—
|
|
188,289
|
|
|||||||||
|
Corporate bonds
|
2,996,940
|
|
54,777
|
|
(61,650
|
)
|
(4,889
|
)
|
2,985,178
|
|
|||||||||
|
Total fixed maturities
|
10,129,141
|
|
224,181
|
|
(203,639
|
)
|
(7,147
|
)
|
10,142,536
|
|
|||||||||
|
Equity securities:
|
|||||||||||||||||||
|
Insurance, banks and other financial institutions
|
422,975
|
|
592,112
|
|
(4
|
)
|
—
|
|
1,015,083
|
|
|||||||||
|
Industrial, consumer and all other
|
1,143,578
|
|
1,094,251
|
|
(1,114
|
)
|
—
|
|
2,236,715
|
|
|||||||||
|
Total equity securities
|
1,566,553
|
|
1,686,363
|
|
(1,118
|
)
|
—
|
|
3,251,798
|
|
|||||||||
|
Short-term investments
|
1,452,270
|
|
18
|
|
—
|
|
—
|
|
1,452,288
|
|
|||||||||
|
Investments, available-for-sale
|
$
|
13,147,964
|
|
$
|
1,910,562
|
|
$
|
(204,757
|
)
|
$
|
(7,147
|
)
|
$
|
14,846,622
|
|
||||
|
December 31, 2012
|
|||||||||||||||||||
|
(dollars in thousands)
|
Amortized
Cost
|
Gross
Unrealized
Holding
Gains
|
Gross
Unrealized
Holding
Losses
|
Unrealized Other-
Than-Temporary
Impairment Losses
|
Estimated
Fair
Value
|
||||||||||||||
|
Fixed maturities:
|
|||||||||||||||||||
|
U.S. Treasury securities and obligations of U.S. government agencies
|
$
|
297,663
|
|
$
|
19,844
|
|
$
|
—
|
|
$
|
—
|
|
$
|
317,507
|
|
||||
|
Obligations of states, municipalities and political subdivisions
|
2,586,867
|
|
245,057
|
|
(362
|
)
|
—
|
|
2,831,562
|
|
|||||||||
|
Foreign governments
|
503,844
|
|
52,764
|
|
—
|
|
—
|
|
556,608
|
|
|||||||||
|
Residential mortgage-backed securities
|
202,644
|
|
14,996
|
|
(5
|
)
|
(2,258
|
)
|
215,377
|
|
|||||||||
|
Asset-backed securities
|
13,828
|
|
517
|
|
—
|
|
—
|
|
14,345
|
|
|||||||||
|
Corporate bonds
|
957,432
|
|
93,395
|
|
(121
|
)
|
(6,822
|
)
|
1,043,884
|
|
|||||||||
|
Total fixed maturities
|
4,562,278
|
|
426,573
|
|
(488
|
)
|
(9,080
|
)
|
4,979,283
|
|
|||||||||
|
Equity securities:
|
|||||||||||||||||||
|
Insurance, banks and other financial institutions
|
508,771
|
|
389,434
|
|
(138
|
)
|
—
|
|
898,067
|
|
|||||||||
|
Industrial, consumer and all other
|
878,534
|
|
637,783
|
|
(7,433
|
)
|
—
|
|
1,508,884
|
|
|||||||||
|
Total equity securities
|
1,387,305
|
|
1,027,217
|
|
(7,571
|
)
|
—
|
|
2,406,951
|
|
|||||||||
|
Short-term investments
|
973,318
|
|
26
|
|
(14
|
)
|
—
|
|
973,330
|
|
|||||||||
|
Investments, available-for-sale
|
$
|
6,922,901
|
|
$
|
1,453,816
|
|
$
|
(8,073
|
)
|
$
|
(9,080
|
)
|
$
|
8,359,564
|
|
||||
42
b)
The following tables summarize gross unrealized investment losses by the length of time that securities have continuously been in an unrealized loss position.
|
December 31, 2013
|
|||||||||||||||||||||||
|
Less than 12 months
|
12 months or longer
|
Total
|
|||||||||||||||||||||
|
(dollars in thousands)
|
Estimated
Fair
Value
|
Gross
Unrealized
Holding and
Other-Than-
Temporary
Impairment
Losses
|
Estimated
Fair
Value
|
Gross
Unrealized
Holding and
Other-Than-
Temporary
Impairment
Losses
|
Estimated
Fair
Value
|
Gross
Unrealized
Holding and
Other-Than-
Temporary
Impairment
Losses
|
|||||||||||||||||
|
Fixed maturities:
|
|||||||||||||||||||||||
|
U.S. Treasury securities and obligations of U.S. government agencies
|
$
|
587,929
|
|
$
|
(30,342
|
)
|
$
|
—
|
|
$
|
—
|
|
$
|
587,929
|
|
$
|
(30,342
|
)
|
|||||
|
Obligations of states, municipalities and political subdivisions
|
513,608
|
|
(27,238
|
)
|
3,512
|
|
(146
|
)
|
517,120
|
|
(27,384
|
)
|
|||||||||||
|
Foreign governments
|
950,040
|
|
(54,411
|
)
|
—
|
|
—
|
|
950,040
|
|
(54,411
|
)
|
|||||||||||
|
Commercial mortgage-backed securities
|
357,737
|
|
(11,796
|
)
|
—
|
|
—
|
|
357,737
|
|
(11,796
|
)
|
|||||||||||
|
Residential mortgage-backed securities
|
437,675
|
|
(18,700
|
)
|
—
|
|
—
|
|
437,675
|
|
(18,700
|
)
|
|||||||||||
|
Asset-backed securities
|
142,011
|
|
(1,614
|
)
|
—
|
|
—
|
|
142,011
|
|
(1,614
|
)
|
|||||||||||
|
Corporate bonds
|
1,817,737
|
|
(66,539
|
)
|
—
|
|
—
|
|
1,817,737
|
|
(66,539
|
)
|
|||||||||||
|
Total fixed maturities
|
4,806,737
|
|
(210,640
|
)
|
3,512
|
|
(146
|
)
|
4,810,249
|
|
(210,786
|
)
|
|||||||||||
|
Equity securities:
|
|||||||||||||||||||||||
|
Insurance, banks and other financial institutions
|
144
|
|
(4
|
)
|
—
|
|
—
|
|
144
|
|
(4
|
)
|
|||||||||||
|
Industrial, consumer and all other
|
20,943
|
|
(714
|
)
|
27,735
|
|
(400
|
)
|
48,678
|
|
(1,114
|
)
|
|||||||||||
|
Total equity securities
|
21,087
|
|
(718
|
)
|
27,735
|
|
(400
|
)
|
48,822
|
|
(1,118
|
)
|
|||||||||||
|
Total
|
$
|
4,827,824
|
|
$
|
(211,358
|
)
|
$
|
31,247
|
|
$
|
(546
|
)
|
$
|
4,859,071
|
|
$
|
(211,904
|
)
|
|||||
At
December 31, 2013
, the Company held
1,364
securities with a total estimated fair value of
$4.9 billion
and gross unrealized losses of
$211.9 million
. Of these
1,364
securities,
nine
securities had been in a continuous unrealized loss position for one year or longer and had a total estimated fair value of
$31.2 million
and gross unrealized losses of
$0.5 million
. Of these securities,
eight
securities were fixed maturities and
one
was an equity security. The Company does not intend to sell or believe it will be required to sell these fixed maturities before recovery of their amortized cost. The Company has the ability and intent to hold the equity security for a period of time sufficient to allow for the anticipated recovery of its fair value.
43
|
December 31, 2012
|
|||||||||||||||||||||||
|
Less than 12 months
|
12 months or longer
|
Total
|
|||||||||||||||||||||
|
(dollars in thousands)
|
Estimated
Fair
Value
|
Gross
Unrealized
Holding and
Other-Than-
Temporary
Impairment
Losses
|
Estimated
Fair
Value
|
Gross
Unrealized
Holding and
Other-Than-
Temporary
Impairment
Losses
|
Estimated
Fair
Value
|
Gross
Unrealized
Holding and
Other-Than-
Temporary
Impairment
Losses
|
|||||||||||||||||
|
Fixed maturities:
|
|||||||||||||||||||||||
|
Obligations of states, municipalities and political subdivisions
|
$
|
2,833
|
|
$
|
(46
|
)
|
$
|
3,616
|
|
$
|
(316
|
)
|
$
|
6,449
|
|
$
|
(362
|
)
|
|||||
|
Residential mortgage-backed securities
|
364
|
|
(2,260
|
)
|
201
|
|
(3
|
)
|
565
|
|
(2,263
|
)
|
|||||||||||
|
Corporate bonds
|
—
|
|
(6,822
|
)
|
3,860
|
|
(121
|
)
|
3,860
|
|
(6,943
|
)
|
|||||||||||
|
Total fixed maturities
|
3,197
|
|
(9,128
|
)
|
7,677
|
|
(440
|
)
|
10,874
|
|
(9,568
|
)
|
|||||||||||
|
Equity securities:
|
|||||||||||||||||||||||
|
Insurance, banks and other financial institutions
|
2,431
|
|
(138
|
)
|
—
|
|
—
|
|
2,431
|
|
(138
|
)
|
|||||||||||
|
Industrial, consumer and all other
|
82,109
|
|
(7,310
|
)
|
1,983
|
|
(123
|
)
|
84,092
|
|
(7,433
|
)
|
|||||||||||
|
Total equity securities
|
84,540
|
|
(7,448
|
)
|
1,983
|
|
(123
|
)
|
86,523
|
|
(7,571
|
)
|
|||||||||||
|
Short-term investments
|
228,820
|
|
(14
|
)
|
—
|
|
—
|
|
228,820
|
|
(14
|
)
|
|||||||||||
|
Total
|
$
|
316,557
|
|
$
|
(16,590
|
)
|
$
|
9,660
|
|
$
|
(563
|
)
|
$
|
326,217
|
|
$
|
(17,153
|
)
|
|||||
At
December 31, 2012
, the Company held
35
securities with a total estimated fair value of
$326.2 million
and gross unrealized losses of
$17.2 million
. Of these
35
securities,
ten
securities had been in a continuous unrealized loss position for one year or longer and had a total estimated fair value of
$9.7 million
and gross unrealized losses of
$0.6 million
. Of these securities,
eight
securities were fixed maturities and
two
were equity securities.
The Company completes a detailed analysis each quarter to assess whether the decline in the fair value of any investment below its cost basis is deemed other-than-temporary. All securities with unrealized losses are reviewed. The Company considers many factors in completing its quarterly review of securities with unrealized losses for other-than-temporary impairment, including the length of time and the extent to which fair value has been below cost and the financial condition and near-term prospects of the issuer. For equity securities, the ability and intent to hold the security for a period of time sufficient to allow for anticipated recovery is considered. For fixed maturities, the Company considers whether it intends to sell the security or if it is more likely than not that it will be required to sell the security before recovery, the implied yield-to-maturity, the credit quality of the issuer and the ability to recover all amounts outstanding when contractually due.
For equity securities, a decline in fair value that is considered to be other-than-temporary is recognized in net income based on the fair value of the security at the time of assessment, resulting in a new cost basis for the security. For fixed maturities where the Company intends to sell the security or it is more likely than not that the Company will be required to sell the security before recovery of its amortized cost, a decline in fair value is considered to be other-than-temporary and is recognized in net income based on the fair value of the security at the time of assessment, resulting in a new cost basis for the security. If the decline in fair value of a fixed maturity below its amortized cost is considered to be other-than-temporary based upon other considerations, the Company compares the estimated present value of the cash flows expected to be collected to the amortized cost of the security. The extent to which the estimated present value of the cash flows expected to be collected is less than the amortized cost of the security represents the credit-related portion of the other-than-temporary impairment, which is recognized in net income, resulting in a new cost basis for the security. Any remaining decline in fair value represents the non-credit portion of the other-than-temporary impairment, which is recognized in other comprehensive income. The discount rate used to calculate the estimated present value of the cash flows expected to be collected is the effective interest rate implicit for the security at the date of purchase.
44
When assessing whether it intends to sell a fixed maturity or if it is likely to be required to sell a fixed maturity before recovery of its amortized cost, the Company evaluates facts and circumstances including decisions to reposition the investment portfolio, potential sales of investments to meet cash flow needs and, ultimately, current market prices. Additional information on the methodology and significant inputs, by security type, that the Company used to determine the amount of credit loss recognized on fixed maturities with declines in fair value below amortized cost that were considered to be other-than-temporary is provided below.
Residential / Commercial mortgage-backed securities.
For mortgage-backed securities, credit impairment is assessed by estimating future cash flows from the underlying mortgage loans and interest payments. The cash flow estimate incorporates actual cash flows from the mortgage-backed securities through the current period and then projects the remaining cash flows using a number of assumptions, including prepayment rates, default rates, recovery rates on foreclosed properties and loss severity assumptions. Management develops specific assumptions using market data and internal estimates, as well as estimates from rating agencies and other third party sources. Default rates are estimated by considering current underlying mortgage loan performance and expectations of future performance. Estimates of future cash flows are discounted to present value. If the present value of expected cash flows is less than the amortized cost, the Company recognizes the estimated credit loss in net income.
Corporate bonds and obligations of states, municipalities and political subdivisions.
For corporate bonds and obligations of states, municipalities and political subdivisions, credit impairment is assessed by evaluating the underlying issuer. As part of this assessment, the Company analyzes various factors, including the following:
|
•
|
fundamentals of the issuer, including current and projected operating results, current liquidity position and ability to raise capital;
|
|
•
|
fundamentals of the industry in which the issuer operates;
|
|
•
|
expectations of defaults and recovery rates;
|
|
•
|
changes in ratings by rating agencies;
|
|
•
|
other relevant market considerations; and
|
|
•
|
receipt of interest payments.
|
Default probabilities and recovery rates from rating agencies are key factors used in calculating the credit loss. Additional research of the industry and issuer is completed to determine if there is any current information that may affect the fixed maturity or its issuer in a negative manner and require an adjustment to the cash flow assumptions.
c)
The amortized cost and estimated fair value of fixed maturities at
December 31, 2013
are shown below by contractual maturity.
|
(dollars in thousands)
|
Amortized
Cost
|
Estimated
Fair Value
|
|||||
|
Due in one year or less
|
$
|
885,726
|
|
$
|
891,654
|
|
|
|
Due after one year through five years
|
2,891,314
|
|
2,947,173
|
|
|||
|
Due after five years through ten years
|
2,217,759
|
|
2,254,169
|
|
|||
|
Due after ten years
|
2,689,239
|
|
2,623,182
|
|
|||
|
8,684,038
|
|
8,716,178
|
|
||||
|
Commercial mortgage-backed securities
|
379,555
|
|
367,821
|
|
|||
|
Residential mortgage-backed securities
|
875,902
|
|
870,248
|
|
|||
|
Asset-backed securities
|
189,646
|
|
188,289
|
|
|||
|
Total fixed maturities
|
$
|
10,129,141
|
|
$
|
10,142,536
|
|
|
Expected maturities may differ from contractual maturities because borrowers may have the right to call or prepay obligations with or without call or prepayment penalties, and the lenders may have the right to put the securities back to the borrower. Based on expected maturities, the estimated average duration of fixed maturities was
4.8
years.
45
d)
The following table presents the components of net investment income.
|
Years Ended December 31,
|
|||||||||||
|
(dollars in thousands)
|
2013
|
2012
|
2011
|
||||||||
|
Interest:
|
|||||||||||
|
Municipal bonds (tax-exempt)
|
$
|
82,308
|
|
$
|
90,316
|
|
$
|
94,457
|
|
||
|
Municipal bonds (taxable)
|
28,041
|
|
22,663
|
|
23,277
|
|
|||||
|
Other taxable bonds
|
134,377
|
|
107,270
|
|
117,242
|
|
|||||
|
Short-term investments, including overnight deposits
|
3,573
|
|
2,755
|
|
2,484
|
|
|||||
|
Dividends on equity securities
|
48,641
|
|
50,416
|
|
35,996
|
|
|||||
|
Change in fair value of credit default swap
|
10,460
|
|
16,641
|
|
(4,103
|
)
|
|||||
|
Income from equity method investments
|
21,898
|
|
1,961
|
|
584
|
|
|||||
|
Other
|
355
|
|
(41
|
)
|
1,551
|
|
|||||
|
329,653
|
|
291,981
|
|
271,488
|
|
||||||
|
Investment expenses
|
(12,280
|
)
|
(9,874
|
)
|
(7,812
|
)
|
|||||
|
Net investment income
|
$
|
317,373
|
|
$
|
282,107
|
|
$
|
263,676
|
|
||
e)
The following table summarizes the activity for credit losses recognized in net income on fixed maturities where other-than-temporary impairment was identified and a portion of the other-than-temporary impairment was included in other comprehensive income.
|
Years Ended December 31,
|
|||||||||||
|
(dollars in thousands)
|
2013
|
2012
|
2011
|
||||||||
|
Cumulative credit loss, beginning of year
|
$
|
21,370
|
|
$
|
21,370
|
|
$
|
10,307
|
|
||
|
Additions:
|
|||||||||||
|
Other-than-temporary impairment losses not previously recognized
|
—
|
|
—
|
|
875
|
|
|||||
|
Increases related to other-than-temporary impairment losses previously recognized
|
—
|
|
—
|
|
10,203
|
|
|||||
|
Total additions
|
—
|
|
—
|
|
11,078
|
|
|||||
|
Reductions:
|
|||||||||||
|
Sales or maturities of fixed maturities on which credit losses were recognized
|
(8,622
|
)
|
—
|
|
(15
|
)
|
|||||
|
Cumulative credit loss, end of year
|
$
|
12,748
|
|
$
|
21,370
|
|
$
|
21,370
|
|
||
46
f)
The following table presents net realized investment gains and the change in net unrealized gains on investments.
|
Years Ended December 31,
|
|||||||||||
|
(dollars in thousands)
|
2013
|
2012
|
2011
|
||||||||
|
Realized gains:
|
|||||||||||
|
Sales of fixed maturities
|
$
|
13,772
|
|
$
|
18,337
|
|
$
|
17,035
|
|
||
|
Sales of equity securities
|
73,592
|
|
29,578
|
|
36,863
|
|
|||||
|
Other
|
5,940
|
|
749
|
|
2,626
|
|
|||||
|
Total realized gains
|
93,304
|
|
48,664
|
|
56,524
|
|
|||||
|
Realized losses:
|
|||||||||||
|
Sales of fixed maturities
|
(25,168
|
)
|
(563
|
)
|
(410
|
)
|
|||||
|
Sales of equity securities
|
(278
|
)
|
(342
|
)
|
(61
|
)
|
|||||
|
Other-than-temporary impairments
|
(4,706
|
)
|
(12,078
|
)
|
(20,196
|
)
|
|||||
|
Other
|
—
|
|
(4,088
|
)
|
—
|
|
|||||
|
Total realized losses
|
(30,152
|
)
|
(17,071
|
)
|
(20,667
|
)
|
|||||
|
Net realized investment gains
|
$
|
63,152
|
|
$
|
31,593
|
|
$
|
35,857
|
|
||
|
Change in net unrealized gains on investments:
|
|||||||||||
|
Fixed maturities
|
$
|
(403,610
|
)
|
$
|
51,783
|
|
$
|
190,976
|
|
||
|
Equity securities
|
665,599
|
|
302,013
|
|
(8,250
|
)
|
|||||
|
Short-term investments
|
6
|
|
12
|
|
(4
|
)
|
|||||
|
Net increase
|
$
|
261,995
|
|
$
|
353,808
|
|
$
|
182,722
|
|
||
g)
The following table presents other-than-temporary impairment losses recognized in net income and included in net realized investment gains by investment type.
|
Years Ended December 31,
|
|||||||||||
|
(dollars in thousands)
|
2013
|
2012
|
2011
|
||||||||
|
Fixed maturities:
|
|||||||||||
|
Obligations of states, municipalities and political subdivisions
|
$
|
(1,242
|
)
|
$
|
—
|
|
$
|
—
|
|
||
|
Residential mortgage-backed securities
|
(640
|
)
|
—
|
|
(11,078
|
)
|
|||||
|
Total fixed maturities
|
(1,882
|
)
|
—
|
|
(11,078
|
)
|
|||||
|
Equity securities:
|
|||||||||||
|
Insurance, banks and other financial institutions
|
—
|
|
(10,336
|
)
|
(4,251
|
)
|
|||||
|
Industrial, consumer and all other
|
(2,824
|
)
|
(1,742
|
)
|
(4,867
|
)
|
|||||
|
Total equity securities
|
(2,824
|
)
|
(12,078
|
)
|
(9,118
|
)
|
|||||
|
Total
|
$
|
(4,706
|
)
|
$
|
(12,078
|
)
|
$
|
(20,196
|
)
|
||
h)
As of
December 31, 2013
and
December 31, 2012
, the Company had restricted assets totaling
$6.1 billion
and
$1.4 billion
, respectively. Restricted assets held in trust or on deposit for the benefit of policyholders or ceding companies or to support underwriting activities were
$5.2 billion
and
$1.3 billion
as of
December 31, 2013
and
December 31, 2012
, respectively, of which
$3.7 billion
at
December 31, 2013
was attributable to Alterra. Additionally, the Company has pledged investments and cash and cash equivalents totaling
$695.1 million
and
$23.2 million
as of
December 31, 2013
and
December 31, 2012
, respectively, as security for letters of credit that have been issued by various banks on behalf of the Company, of which
$645.4 million
at
December 31, 2013
was attributable to Alterra.
47
Total restricted assets are included on the Company's consolidated balance sheets as follows.
|
(dollars in thousands)
|
December 31, 2013
|
December 31, 2012
|
|||||
|
Investments, available-for-sale
|
$
|
5,225,701
|
|
$
|
1,262,755
|
|
|
|
Restricted cash and cash equivalents
|
786,926
|
|
109,415
|
|
|||
|
Other assets
|
76,752
|
|
—
|
|
|||
|
Total
|
$
|
6,089,379
|
|
$
|
1,372,170
|
|
|
i)
At
December 31, 2013
and
December 31, 2012
, investments in U.S. Treasury securities and obligations of U.S. government agencies were the only investments in any one issuer that exceeded
10%
of shareholders' equity.
At
December 31, 2013
, the Company's ten largest equity holdings represented
$1.5 billion
, or
46%
, of the equity portfolio. Investments in the property and casualty insurance industry represented
$568.3 million
, or
17%
, of the equity portfolio at
December 31, 2013
. Investments in the property and casualty insurance industry included a
$371.1 million
investment in the common stock of Berkshire Hathaway Inc.
4. Receivables
The following table presents the components of receivables.
|
December 31,
|
|||||||
|
(dollars in thousands)
|
2013
|
2012
|
|||||
|
Amounts receivable from agents, brokers and insureds
|
$
|
1,058,021
|
|
$
|
332,570
|
|
|
|
Trade accounts receivable
|
85,203
|
|
73,512
|
|
|||
|
Employee stock loans receivable (see note 12(c))
|
12,822
|
|
11,413
|
|
|||
|
Other
|
5,420
|
|
12,982
|
|
|||
|
1,161,466
|
|
430,477
|
|
||||
|
Allowance for doubtful receivables
|
(19,693
|
)
|
(16,594
|
)
|
|||
|
Receivables
|
$
|
1,141,773
|
|
$
|
413,883
|
|
|
5. Deferred Policy Acquisition Costs
The following table presents the amounts of policy acquisition costs deferred and amortized.
|
Years Ended December 31,
|
|||||||||||
|
(dollars in thousands)
|
2013
|
2012
|
2011
|
||||||||
|
Balance, beginning of year
|
$
|
157,465
|
|
$
|
194,674
|
|
$
|
188,783
|
|
||
|
Policy acquisition costs deferred
|
575,417
|
|
390,900
|
|
485,345
|
|
|||||
|
Amortization of policy acquisition costs
|
(471,915
|
)
|
(428,109
|
)
|
(479,454
|
)
|
|||||
|
Deferred policy acquisition costs
|
$
|
260,967
|
|
$
|
157,465
|
|
$
|
194,674
|
|
||
48
The following table presents the components of underwriting, acquisition and insurance expenses.
|
Years Ended December 31,
|
|||||||||||
|
(dollars in thousands)
|
2013
|
2012
|
2011
|
||||||||
|
Transaction costs and other acquisition-related expenses
(1)
|
$
|
75,140
|
|
$
|
—
|
|
$
|
—
|
|
||
|
Prospective adoption of FASB ASU No. 2010-26
(2)
|
—
|
|
43,093
|
|
—
|
|
|||||
|
Other amortization of policy acquisition costs
|
471,915
|
|
385,016
|
|
479,454
|
|
|||||
|
Other operating expenses
|
765,257
|
|
501,363
|
|
330,725
|
|
|||||
|
Underwriting, acquisition and insurance expenses
|
$
|
1,312,312
|
|
$
|
929,472
|
|
$
|
810,179
|
|
||
|
(1)
|
In connection with the acquisition of Alterra, the Company incurred transaction costs of
$16.0 million
for the year ended December 31, 2013, which primarily consist of due diligence, legal and investment banking costs. Additionally, the Company incurred severance costs of
$31.7 million
, stay bonuses of
$14.8 million
and other compensation costs totaling
$12.6 million
related to the acceleration of certain long-term incentive compensation awards and restricted stock awards that were granted by Alterra prior to the acquisition.
|
|
(2)
|
Effective January 1, 2012, the Company prospectively adopted FASB ASU No. 2010-26,
Accounting for Costs Associated with Acquiring or Renewing Insurance Contracts
. At December 31, 2011, deferred policy acquisition costs included
$43.1 million
of costs that no longer met the criteria for deferral as of January 1, 2012 and were recognized into income during 2012, consistent with policy terms.
|
6. Property and Equipment
The following table presents the components of property and equipment, which are included in other assets on the consolidated balance sheets.
|
December 31,
|
|||||||
|
(dollars in thousands)
|
2013
|
2012
|
|||||
|
Land
|
$
|
48,036
|
|
$
|
45,199
|
|
|
|
Buildings
|
59,307
|
|
53,767
|
|
|||
|
Leasehold improvements
|
68,363
|
|
55,626
|
|
|||
|
Land improvements
|
57,673
|
|
51,512
|
|
|||
|
Furniture and equipment
|
217,528
|
|
211,354
|
|
|||
|
Other
|
104,690
|
|
85,714
|
|
|||
|
555,597
|
|
503,172
|
|
||||
|
Accumulated depreciation and amortization
|
(207,688
|
)
|
(172,943
|
)
|
|||
|
Property and equipment
|
$
|
347,909
|
|
$
|
330,229
|
|
|
Depreciation and amortization expense of property and equipment was
$51.5 million
,
$36.0 million
and
$24.2 million
for the years ended
December 31, 2013
,
2012
and
2011
, respectively.
The Company does not own any material properties. The Company leases substantially all of the facilities used by its insurance operations and certain furniture and equipment under operating leases. The Company's Markel Ventures operations own certain of their facilities and lease others.
49
7. Goodwill and Intangible Assets
The following table presents the components of goodwill.
|
(dollars in thousands)
|
Excess and
Surplus Lines
Segment
|
Specialty
Admitted
Segment
|
London
Insurance
Market
Segment
|
Alterra
Segment
|
Other
(1)
|
Total
|
|||||||||||||||||
|
January 1, 2012
|
$
|
81,770
|
|
$
|
64,914
|
|
$
|
309,064
|
|
$
|
—
|
|
$
|
151,813
|
|
$
|
607,561
|
|
|||||
|
Acquisitions
|
—
|
|
26,140
|
|
—
|
|
—
|
|
40,888
|
|
67,028
|
|
|||||||||||
|
Foreign currency movements and other adjustments
|
—
|
|
—
|
|
596
|
|
—
|
|
(255
|
)
|
341
|
|
|||||||||||
|
December 31, 2012
|
$
|
81,770
|
|
$
|
91,054
|
|
$
|
309,660
|
|
$
|
—
|
|
$
|
192,446
|
|
$
|
674,930
|
|
|||||
|
Acquisitions (see note 2)
|
—
|
|
—
|
|
—
|
|
295,690
|
|
1,185
|
|
296,875
|
|
|||||||||||
|
Foreign currency movements and other adjustments
|
—
|
|
—
|
|
(2,088
|
)
|
—
|
|
(2,000
|
)
|
(4,088
|
)
|
|||||||||||
|
December 31, 2013
|
$
|
81,770
|
|
$
|
91,054
|
|
$
|
307,572
|
|
$
|
295,690
|
|
$
|
191,631
|
|
$
|
967,717
|
|
|||||
|
(1)
|
Amounts included in Other above are related to the Company's Markel Ventures operations.
|
Goodwill and indefinite-lived intangible assets are tested for impairment at least annually. The Company completes an annual test during the fourth quarter of each year based upon the results of operations through September 30. There were
no
impairment losses recognized during
2013
or
2012
.
The following table presents the components of intangible assets with a net carrying amount.
|
December 31,
|
|||||||||||||||
|
2013
|
2012
|
||||||||||||||
|
(dollars in thousands)
|
Gross
Carrying
Amount
|
Accumulated
Amortization
|
Gross
Carrying
Amount
|
Accumulated
Amortization
|
|||||||||||
|
Customer relationships
|
$
|
298,886
|
|
$
|
(43,286
|
)
|
$
|
171,591
|
|
$
|
(29,955
|
)
|
|||
|
Broker relationships
|
178,693
|
|
(23,255
|
)
|
135,867
|
|
(12,317
|
)
|
|||||||
|
Trade names
|
65,880
|
|
(12,666
|
)
|
75,781
|
|
(9,075
|
)
|
|||||||
|
Technology
|
56,429
|
|
(16,222
|
)
|
40,109
|
|
(11,785
|
)
|
|||||||
|
Insurance licenses
|
40,185
|
|
(133
|
)
|
4,300
|
|
(67
|
)
|
|||||||
|
Lloyd's syndicate capacity
|
12,000
|
|
—
|
|
—
|
|
—
|
|
|||||||
|
Other
|
14,197
|
|
(5,625
|
)
|
14,558
|
|
(4,712
|
)
|
|||||||
|
Total
|
$
|
666,270
|
|
$
|
(101,187
|
)
|
$
|
442,206
|
|
$
|
(67,911
|
)
|
|||
Amortization of intangible assets was
$55.2 million
,
$33.5 million
and
$24.3 million
for the years ended
December 31, 2013
,
2012
and
2011
, respectively. Amortization of intangible assets is estimated to be
$45.7 million
for
2014
,
$44.7 million
for
2015
,
$41.8 million
for
2016
,
$40.4 million
for
2017
and
$40.2 million
for
2018
. Indefinite-lived intangible assets were
$58.0 million
at
December 31, 2013
and
$10.1 million
at
December 31, 2012
.
In
2013
, the Company acquired
$247.0 million
of intangible assets. The definite-lived intangible assets acquired are expected to be amortized over a weighted average period of
15.5
years. The definite-lived intangible assets acquired during
2013
include customer relationships, broker relationships, trade names and technology, which are expected to be amortized over a weighted average period of
18.0
,
11.2
,
4.5
and
10.0
years, respectively.
50
8. Income Taxes
Income before income taxes includes the following components.
|
Years Ended December 31,
|
|||||||||||
|
(dollars in thousands)
|
2013
|
2012
|
2011
|
||||||||
|
Domestic operations
|
$
|
325,133
|
|
$
|
126,466
|
|
$
|
200,446
|
|
||
|
Foreign operations
|
36,610
|
|
185,584
|
|
(10,250
|
)
|
|||||
|
Income before income taxes
|
$
|
361,743
|
|
$
|
312,050
|
|
$
|
190,196
|
|
||
Income tax expense includes the following components.
|
Years Ended December 31,
|
|||||||||||
|
(dollars in thousands)
|
2013
|
2012
|
2011
|
||||||||
|
Current:
|
|||||||||||
|
Domestic
|
$
|
50,683
|
|
$
|
14,340
|
|
$
|
35,721
|
|
||
|
Foreign
|
23,165
|
|
1,814
|
|
340
|
|
|||||
|
Total current tax expense
|
73,848
|
|
16,154
|
|
36,061
|
|
|||||
|
Deferred:
|
|||||||||||
|
Domestic
|
23,906
|
|
(3,734
|
)
|
436
|
|
|||||
|
Foreign
|
(19,856
|
)
|
41,382
|
|
5,213
|
|
|||||
|
Total deferred tax expense
|
4,050
|
|
37,648
|
|
5,649
|
|
|||||
|
Income tax expense
|
$
|
77,898
|
|
$
|
53,802
|
|
$
|
41,710
|
|
||
Foreign income tax expense (benefit) includes United States tax expense (benefit) on foreign operations.
State income tax expense is not material to the consolidated financial statements.
The Company made income tax payments of
$35.7 million
,
$30.0 million
and
$35.0 million
in
2013
,
2012
and
2011
, respectively. Current income taxes payable were
$84.2 million
and
$2.2 million
at
December 31, 2013
and
2012
, respectively, and were included in other liabilities on the consolidated balance sheets.
Reconciliations of the United States corporate income tax rate to the effective tax rate on income before income taxes are presented in the following table.
|
Years Ended December 31,
|
||||||||
|
2013
|
2012
|
2011
|
||||||
|
United States corporate tax rate
|
35
|
%
|
35
|
%
|
35
|
%
|
||
|
Tax-exempt investment income
|
(9
|
)
|
(12
|
)
|
(18
|
)
|
||
|
Uncertain tax positions
|
—
|
|
—
|
|
(2
|
)
|
||
|
Foreign operations
|
(4
|
)
|
(5
|
)
|
6
|
|
||
|
Other
|
—
|
|
(1
|
)
|
1
|
|
||
|
Effective tax rate
|
22
|
%
|
17
|
%
|
22
|
%
|
||
51
The following table presents the components of domestic and foreign deferred tax assets and liabilities.
|
December 31,
|
|||||||
|
(dollars in thousands)
|
2013
|
2012
|
|||||
|
Assets:
|
|||||||
|
Differences between financial reporting and tax bases
|
$
|
139,357
|
|
$
|
81,305
|
|
|
|
Unpaid losses and loss adjustment expenses
|
283,365
|
|
122,217
|
|
|||
|
Life and annuity benefits
|
161,209
|
|
—
|
|
|||
|
Unearned premiums recognized for income tax purposes
|
76,862
|
|
42,938
|
|
|||
|
Other-than-temporary impairments not yet deductible for income tax purposes
|
34,978
|
|
40,450
|
|
|||
|
Net operating loss carryforwards
|
43,010
|
|
7,388
|
|
|||
|
Tax credit carryforwards
|
33,773
|
|
41,387
|
|
|||
|
Total gross deferred tax assets
|
772,554
|
|
335,685
|
|
|||
|
Liabilities:
|
|||||||
|
Differences between financial reporting and tax bases
|
46,699
|
|
33,323
|
|
|||
|
Deferred policy acquisition costs
|
65,543
|
|
36,039
|
|
|||
|
Net unrealized gains on investments
|
459,015
|
|
406,295
|
|
|||
|
Amortization of goodwill and other intangible assets
|
97,580
|
|
28,931
|
|
|||
|
Total gross deferred tax liabilities
|
668,837
|
|
504,588
|
|
|||
|
Net deferred tax asset (liability)
|
$
|
103,717
|
|
$
|
(168,903
|
)
|
|
The net deferred tax asset at
December 31, 2013
was included in other assets on the consolidated balance sheet. The net deferred tax liability at
December 31, 2012
was included in other liabilities on the consolidated balance sheet.
At
December 31, 2013
, the Company had tax credit carryforwards of
$33.8 million
. The earliest any of these credits will expire is
2019
.
At
December 31, 2013
, the Company had net operating losses of
$73.1 million
that can be used to offset future income that is taxable in the United States from Markel Capital Limited, a wholly owned United Kingdom subsidiary. The Company's ability to use these losses in the United States expires between the years
2021
and
2032
. At December 31, 2013, the Company had net operating losses of
$81.6 million
that can be used to offset future income that is taxable in the United States. The Company's ability to use these losses in the United States expires between the years
2027
and
2033
.
The Company estimates that it will realize
$668.8 million
of the gross deferred tax assets, including net operating losses, recorded at
December 31, 2013
through the reversal of existing temporary differences attributable to the gross deferred tax liabilities. The Company believes that it is more likely than not that it will realize
$103.7 million
of gross deferred tax assets by generating future taxable income and by using prudent and feasible tax planning strategies if future taxable income is not sufficient.
At
December 31, 2013
, the Company had unrecognized tax benefits of
$18.2 million
. If recognized,
$15.9 million
of these tax benefits would decrease the annual effective tax rate. The Company does not currently anticipate any significant changes in unrecognized tax benefits during
2014
.
52
The following table presents a reconciliation of unrecognized tax benefits.
|
Years Ended December 31,
|
|||||||
|
(dollars in thousands)
|
2013
|
2012
|
|||||
|
Unrecognized tax benefits, beginning of year
|
$
|
18,870
|
|
$
|
19,586
|
|
|
|
Increases based upon tax positions taken during the current year
|
—
|
|
888
|
|
|||
|
Increases for tax positions taken in prior years
|
—
|
|
218
|
|
|||
|
Decreases for tax positions taken in prior years
|
—
|
|
(764
|
)
|
|||
|
Lapse of statute of limitations
|
(651
|
)
|
(1,058
|
)
|
|||
|
Unrecognized tax benefits, end of year
|
$
|
18,219
|
|
$
|
18,870
|
|
|
At
December 31, 2013
, earnings of the Company's foreign subsidiaries, with the exception of our Bermuda subsidiaries, are considered reinvested indefinitely and
no
provision for deferred United States income taxes has been recorded. It is not practicable to determine the amount of unrecorded deferred tax liabilities associated with such earnings due to the complexity of this calculation.
The Company is subject to income tax in the United States and in foreign jurisdictions. With few exceptions, the Company is no longer subject to income tax examination by tax authorities for years ended before January 1, 2010.
9. Unpaid Losses and Loss Adjustment Expenses
a)
The following table presents a reconciliation of consolidated beginning and ending reserves for losses and loss adjustment expenses.
|
Years Ended December 31,
|
|||||||||||
|
(dollars in thousands)
|
2013
|
2012
|
2011
|
||||||||
|
Net reserves for losses and loss adjustment expenses, beginning of year
|
$
|
4,592,652
|
|
$
|
4,607,767
|
|
$
|
4,600,316
|
|
||
|
Foreign currency movements, commutations and other
|
(780
|
)
|
30,359
|
|
(7,496
|
)
|
|||||
|
Adjusted net reserves for losses and loss adjustment expenses, beginning of year
|
4,591,872
|
|
4,638,126
|
|
4,592,820
|
|
|||||
|
Incurred losses and loss adjustment expenses:
|
|||||||||||
|
Current year
|
2,227,402
|
|
1,553,070
|
|
1,563,993
|
|
|||||
|
Prior years
|
(411,129
|
)
|
(399,002
|
)
|
(354,007
|
)
|
|||||
|
Total incurred losses and loss adjustment expenses
|
1,816,273
|
|
1,154,068
|
|
1,209,986
|
|
|||||
|
Payments:
|
|||||||||||
|
Current year
|
670,928
|
|
268,745
|
|
291,837
|
|
|||||
|
Prior years
|
906,302
|
|
931,955
|
|
898,318
|
|
|||||
|
Total payments
|
1,577,230
|
|
1,200,700
|
|
1,190,155
|
|
|||||
|
Effect of foreign currency rate changes
|
(7,915
|
)
|
1,158
|
|
(4,884
|
)
|
|||||
|
Net reserves for losses and loss adjustment expenses of acquired insurance companies
|
3,584,642
|
|
—
|
|
—
|
|
|||||
|
Net reserves for losses and loss adjustment expenses, end of year
|
8,407,642
|
|
4,592,652
|
|
4,607,767
|
|
|||||
|
Reinsurance recoverable on unpaid losses
|
1,854,414
|
|
778,774
|
|
791,102
|
|
|||||
|
Gross reserves for losses and loss adjustment expenses, end of year
|
$
|
10,262,056
|
|
$
|
5,371,426
|
|
$
|
5,398,869
|
|
||
Beginning of year net reserves for losses and loss adjustment expenses are adjusted, when applicable, for the impact of changes in foreign currency rates, commutations and other items. In
2013
, beginning of year net reserves for losses and loss adjustment expenses were increased by a movement of
$0.7 million
in foreign currency rates of exchange, which was more than offset by commutations. In
2012
, beginning of year net reserves for losses and loss adjustment expenses were increased by a movement of
$23.4 million
in foreign currency rates of exchange. In
2011
, beginning of year net reserves for losses and loss adjustment expenses were decreased by a movement of
$14.1 million
in foreign currency rates of exchange, which was offset in part by increases for other items including commutations.
53
As a result of the acquisition of Alterra, the Company recorded net reserves for losses and loss adjustment expenses of
$3.6 billion
as of the Acquisition Date. These reserves were recorded at fair value as part of the Company's purchase accounting. See note 2 for a discussion of the Company's acquisition of Alterra.
In
2013
, incurred losses and loss adjustment expenses included
$411.1 million
of favorable development on prior years' loss reserves, which was primarily due to
$293.9 million
of loss reserve redundancies experienced in the London Insurance Market segment and on the professional and products liability and casualty programs within the Excess and Surplus Lines segment as actual claims reporting patterns on prior accident years have been more favorable than the Company's actuarial analyses initially anticipated. The favorable development on prior years' loss reserves in
2013
was partially offset by
$30.1 million
of adverse development in prior years' loss reserves on asbestos and environmental (A&E) exposures.
During the third quarter of each of the past three years, the Company completed an in-depth, actuarial review of its A&E exposures. Over the past few years, the number of A&E claims reported each year across the property and casualty industry has been on the decline. However, at the same time, the likelihood of making an indemnity payment has risen, thus increasing the average cost per reported claim. During our 2012 annual review, we reduced our estimate of the ultimate claims count, while increasing our estimate of the number of claims that would ultimately be closed with an indemnity payment. During our 2013 annual review, our expectation of the severity of the outcome of known claims increased. As a result, prior years' loss reserves for A&E exposures were increased by
$28.4 million
in 2013 and
$31.1 million
in 2012. During the
2011
review, the Company determined that
no
adjustment to loss reserves was necessary.
Current year incurred losses and loss adjustment expenses for 2012 included
$99.6 million
of estimated net losses related to Hurricane Sandy. Current year incurred losses and loss adjustment expenses for 2011 included
$150.9 million
of estimated net losses related to the Thai floods, Hurricane Irene, U.S. tornadoes, Japanese earthquake and tsunami, Australian floods and New Zealand earthquakes. The estimated net losses on these natural catastrophes in 2012 and 2011 were net of estimated reinsurance recoverables of
$77.6 million
and
$36.3 million
, respectively.
In
2012
, incurred losses and loss adjustment expenses included
$399.0 million
of favorable development on prior years' loss reserves, which was primarily due to
$336.7 million
of loss reserve redundancies experienced in the London Insurance Market segment and on the professional and products liability and casualty programs within the Excess and Surplus Lines segment as actual claims reporting patterns on prior accident years have been more favorable than the Company's actuarial analyses initially anticipated. The favorable development on prior years' loss reserves in 2012 was partially offset by
$38.2 million
of adverse development in prior years' loss reserves on A&E exposures.
In
2011
, incurred losses and loss adjustment expenses included
$354.0 million
of favorable development on prior years' loss reserves, which was primarily due to
$265.8 million
of loss reserve redundancies experienced in the London Insurance Market segment and on the professional and products liability programs within the Excess and Surplus Lines segment as actual claims reporting patterns on prior accident years have been more favorable than the Company's actuarial analyses initially anticipated.
Inherent in the Company's reserving practices is the desire to establish loss reserves that are more likely redundant than deficient. As such, the Company seeks to establish loss reserves that will ultimately prove to be adequate. As part of the Company's acquisition of insurance operations, to the extent the reserving philosophy of the acquired business differs from the Company's reserving philosophy, the post-acquisition loss reserves will be built until total loss reserves are consistent with the Company's target level of confidence. Furthermore, the Company's philosophy is to price its insurance products to make an underwriting profit. Management continually attempts to improve its loss estimation process by refining its ability to analyze loss development patterns, claim payments and other information, but uncertainty remains regarding the potential for adverse development of estimated ultimate liabilities.
54
The Company uses a variety of techniques to establish the liabilities for unpaid losses and loss adjustment expenses, all of which involve significant judgments and assumptions. These techniques include detailed statistical analysis of past claim reporting, settlement activity, claim frequency and severity, policyholder loss experience, industry loss experience and changes in market conditions, policy forms and exposures. Greater judgment may be required when new product lines are introduced or when there have been changes in claims handling practices, as the statistical data available may be insufficient. The Company's estimates reflect implicit and explicit assumptions regarding the potential effects of external factors, including economic and social inflation, judicial decisions, changes in law, general economic conditions and recent trends in these factors. In some of the Company's markets, and where the Company acts as a reinsurer, the timing and amount of information reported about underlying claims are in the control of third parties. There is often a time lag between cedents establishing case reserves and re-estimating their reserves, and notifying the Company of the new or revised case reserves. This can also affect estimates and require re-estimation as new information becomes available.
The Company believes the process of evaluating past experience, adjusted for the effects of current developments and anticipated trends, is an appropriate basis for predicting future events. Management currently believes the Company's gross and net reserves, including the reserves for A&E exposures, are adequate. However, there is no precise method for evaluating the impact of any significant factor on the adequacy of reserves, and actual results will differ from original estimates.
b)
The Company's exposure to A&E claims results from policies written by acquired insurance operations before their acquisitions by the Company. The Company's exposure to A&E claims originated from umbrella, excess and commercial general liability (CGL) insurance policies and assumed reinsurance contracts that were written on an occurrence basis from the 1970s to mid-1980s. Exposure also originated from claims-made policies that were designed to cover environmental risks provided that all other terms and conditions of the policy were met.
A&E claims include property damage and clean-up costs related to pollution, as well as personal injury allegedly arising from exposure to hazardous materials. After 1986, the Company began underwriting CGL coverage with pollution exclusions, and in some lines of business the Company began using a claims-made form. These changes significantly reduced the Company's exposure to future A&E claims on post-1986 business.
The following table provides a reconciliation of beginning and ending A&E reserves for losses and loss adjustment expenses, which are a component of consolidated unpaid losses and loss adjustment expenses. Amounts included in the following table are presented before consideration of reinsurance allowances.
|
Years Ended December 31,
|
|||||||||||
|
(dollars in thousands)
|
2013
|
2012
|
2011
|
||||||||
|
Net reserves for A&E losses and loss adjustment expenses, beginning of year
|
$
|
260,791
|
|
$
|
244,772
|
|
$
|
216,034
|
|
||
|
Commutations and other
|
(5,067
|
)
|
(897
|
)
|
36,271
|
|
|||||
|
Adjusted net reserves for A&E losses and loss adjustment expenses, beginning of year
|
255,724
|
|
243,875
|
|
252,305
|
|
|||||
|
Incurred losses and loss adjustment expenses
|
30,128
|
|
38,179
|
|
(134
|
)
|
|||||
|
Payments
|
(13,658
|
)
|
(21,263
|
)
|
(7,399
|
)
|
|||||
|
Net reserves for A&E losses and loss adjustment expenses, end of year
|
272,194
|
|
260,791
|
|
244,772
|
|
|||||
|
Reinsurance recoverable on unpaid losses
|
100,784
|
|
100,063
|
|
89,391
|
|
|||||
|
Gross reserves for A&E losses and loss adjustment expenses, end of year
|
$
|
372,978
|
|
$
|
360,854
|
|
$
|
334,163
|
|
||
Commutations and other for the year ended December 31, 2011 included a
$40.0 million
adjustment related to commutations completed by Markel International, which involved the termination of ceded reinsurance contracts. The adjustment was made with respect to commuted recoverables where the amount of the balance due from reinsurers was offset in full by a provision within the reinsurance allowance. The adjustment reduced the reinsurance recoverable on unpaid losses with a corresponding reduction to the reinsurance allowance for doubtful accounts. Accordingly, there was no impact on the reinsurance recoverable on unpaid losses or on net reserves for A&E losses and loss adjustment expenses, net of the reinsurance allowance, for any period presented. See note 16 for further discussion of the corresponding reduction to the reinsurance allowance.
55
At
December 31, 2013
, asbestos-related reserves were
$284.3 million
and
$206.6 million
on a gross and net basis, respectively. Net reserves for reported claims and net incurred but not reported reserves for A&E exposures were
$165.3 million
and
$106.9 million
, respectively, at
December 31, 2013
. Inception-to-date net paid losses and loss adjustment expenses for A&E related exposures totaled
$398.0 million
at
December 31, 2013
, which includes
$79.1 million
of litigation-related expense.
The Company's reserves for losses and loss adjustment expenses related to A&E exposures represent management's best estimate of ultimate settlement values. A&E reserves are monitored by management, and the Company's statistical analysis of these reserves is reviewed by the Company's independent actuaries. A&E exposures are subject to significant uncertainty due to potential loss severity and frequency resulting from the uncertain and unfavorable legal climate. A&E reserves could be subject to increases in the future; however, management believes the Company's gross and net A&E reserves at
December 31, 2013
are adequate.
10. Life and Annuity Benefits
The following table presents life and annuity benefits as of
December 31, 2013
:
|
(dollars in thousands)
|
|||
|
Life
|
$
|
190,765
|
|
|
Annuities
|
1,194,558
|
|
|
|
Accident and health
|
101,251
|
|
|
|
$
|
1,486,574
|
|
|
Life and annuity benefits are compiled on a reinsurance contract-by-contract basis and are discounted using standard actuarial techniques and cash flow models. Since the development of the life and annuity reinsurance reserves is based upon cash flow projection models, the Company must make estimates and assumptions based on cedent experience, industry mortality tables, and expense and investment experience, including a provision for adverse deviation. The assumptions used to determine policy benefit reserves were determined at the Acquisition Date and are generally locked-in for the life of the contract unless an unlocking event occurs. To the extent existing policy reserves, together with the present value of future gross premiums and expected investment income earned thereon, are not adequate to cover the present value of future benefits, settlement and maintenance costs, the locked-in assumptions are revised to current best estimate assumptions and a charge to earnings for life and annuity benefits is recognized at that time.
Because of the assumptions and estimates used in establishing the Company's reserves for life and annuity benefit obligations and the long-term nature of these reinsurance contracts, the ultimate liability may be greater or less than the estimates. The average discount rate for the life and annuity benefit reserves was
2.3%
as of
December 31, 2013
.
As of
December 31, 2013
, the largest life and annuity benefits reserve for a single contract was
34.8%
of the total.
No
annuities included in life and annuity benefits in the consolidated balance sheet are subject to discretionary withdrawal.
56
The following table summarizes the Company's senior long-term debt and other debt.
|
December 31,
|
|||||||
|
(dollars in thousands)
|
2013
|
2012
|
|||||
|
6.80% unsecured senior notes, due February 15, 2013, interest payable semi-annually, net of unamortized discount of $45 in 2012
|
$
|
—
|
|
$
|
246,619
|
|
|
|
7.20% unsecured senior notes, due April 14, 2017, interest payable semi-annually, net of unamortized premium of $4,822 in 2013
|
95,451
|
|
—
|
|
|||
|
7.125% unsecured senior notes, due September 30, 2019, interest payable semi-annually, net of unamortized discount of $1,626 in 2013 and $1,909 in 2012
|
348,374
|
|
348,091
|
|
|||
|
6.25% unsecured senior notes, due September 30, 2020, interest payable semi-annually, net of unamortized premium of $61,273 in 2013
|
411,273
|
|
—
|
|
|||
|
5.35% unsecured senior notes, due June 1, 2021, interest payable semi-annually, net of unamortized discount of $1,531 in 2013 and $1,738 in 2012
|
248,469
|
|
248,262
|
|
|||
|
4.90% unsecured senior notes, due July 1, 2022, interest payable semi-annually, net of unamortized discount of $2,374 in 2013 and $2,653 in 2012
|
347,626
|
|
347,347
|
|
|||
|
3.625% unsecured senior notes, due March 30, 2023, interest payable semi-annually, net of unamortized discount of $1,860 in 2013
|
248,140
|
|
—
|
|
|||
|
7.35% unsecured senior notes, due August 15, 2034, interest payable semi-annually, net of unamortized discount of $2,185 in 2013 and $2,291 in 2012
|
197,815
|
|
197,710
|
|
|||
|
5.0% unsecured senior notes, due March 30, 2043, interest payable semi-annually, net of unamortized discount of $6,551 in 2013
|
243,449
|
|
—
|
|
|||
|
Other debt, at various interest rates ranging from 2.5% to 6.5%
|
115,630
|
|
104,521
|
|
|||
|
Senior long-term debt and other debt
|
$
|
2,256,227
|
|
$
|
1,492,550
|
|
|
On July 2, 2012, the Company issued
$350 million
of
4.90%
unsecured senior notes due July 1, 2022. Net proceeds to the Company were
$347.2 million
. On August 1, 2012, the Company used a portion of these proceeds to redeem its
7.50%
unsecured senior debentures due August 22, 2046 at a redemption price equal to
100%
of their principal amount, or
$150 million
. This redemption resulted in a loss of
$4.1 million
, which is reflected in net realized investment gains. The proceeds from the July 2012 issuance were also used to pre-fund the repayment of the Company's
6.80%
unsecured senior notes due February 15, 2013.
On February 15, 2013, the Company repaid its
6.80%
unsecured senior notes (
$246.7 million
principal amount outstanding at December 31, 2012).
On March 8, 2013, the Company issued
$250 million
of
3.625%
unsecured senior notes due March 30, 2023 and
$250 million
of
5.0%
unsecured senior notes due March 30, 2043. Net proceeds to the Company were approximately
$491.2 million
, to be used for general corporate purposes.
On April 16, 2007, Alterra USA Holdings Limited (Alterra USA), a wholly-owned indirect subsidiary of Alterra, privately issued
$100 million
of
7.20%
unsecured senior notes due April 14, 2017 (the
7.20%
unsecured senior notes). The
7.20%
unsecured senior notes are Alterra USA's senior unsecured obligations and rank equally in right of payment with all existing and future senior unsecured indebtedness of Alterra USA. The
7.20%
unsecured senior notes are fully and unconditionally guaranteed by Alterra. The principal amount of the
7.20%
unsecured senior notes outstanding as of the Acquisition Date was
$90.6 million
. As of the Acquisition Date, the
7.20%
unsecured senior notes were recorded at their estimated fair value of
$95.8 million
.
57
On September 27, 2010, Alterra Finance LLC, a wholly-owned indirect subsidiary of Alterra, issued
$350 million
of
6.25%
unsecured senior notes due September 30, 2020 (the
6.25%
unsecured senior notes). The
6.25%
unsecured senior notes are Alterra Finance LLC's senior unsecured obligations and rank equally in right of payment with all of Alterra Finance LLC's future unsecured and unsubordinated indebtedness and rank senior to all of Alterra Finance LLC's future subordinated indebtedness. The
6.25%
unsecured senior notes are fully and unconditionally guaranteed by Alterra on a senior unsecured basis. The guarantee ranks equally with all of Alterra's existing and future unsecured and unsubordinated indebtedness and ranks senior to all of Alterra's future subordinated indebtedness. As of the Acquisition Date, the
6.25%
unsecured senior notes were recorded at their estimated fair value of
$416.6 million
.
Alterra Finance LLC is a finance subsidiary and has no independent activities, assets or operations other than in connection with the
6.25%
unsecured senior notes.
The Company's
7.35%
unsecured senior notes due August 15, 2034 are not redeemable. The Company's other unsecured senior notes are redeemable by the Company at any time, subject to payment of a make-whole premium to the noteholders. None of the Company's senior long-term debt is subject to any sinking fund requirements.
The Company's other debt is primarily associated with its Markel Ventures operations and is non-recourse to the holding company. The debt of the Company's Markel Ventures subsidiaries generally is secured by the assets of those subsidiaries. ParkLand Ventures, Inc. (ParkLand), a subsidiary of the Company, has formed subsidiaries for the purpose of acquiring and financing real estate (the real estate subsidiaries). The assets of the real estate subsidiaries, which are not material to the Company, are consolidated in accordance with U.S. GAAP but are not available to satisfy the debt and other obligations of the Company or any affiliates other than the real estate subsidiaries.
The estimated fair value based on quoted market prices of the Company's senior long-term debt and other debt was
$2.4 billion
and
$1.7 billion
at
December 31, 2013
and
2012
, respectively.
The following table summarizes the future principal payments due at maturity on senior long-term debt and other debt as of
December 31, 2013
.
|
Years Ending December 31,
|
(dollars in
thousands)
|
||
|
2014
|
$
|
28,795
|
|
|
2015
|
6,102
|
|
|
|
2016
|
11,822
|
|
|
|
2017
|
105,987
|
|
|
|
2018
|
2,278
|
|
|
|
2019 and thereafter
|
2,051,275
|
|
|
|
Total principal payments
|
$
|
2,206,259
|
|
|
Net unamortized premium
|
49,968
|
|
|
|
Senior long-term debt and other debt
|
$
|
2,256,227
|
|
The Company also maintains a revolving credit facility for working capital and other general corporate purposes that expires September 2015. Effective July 12, 2013, the capacity of the Company's revolving credit facility was increased from
$150 million
to
$300 million
, as previously provided for by the terms of the revolving credit facility. The Company may select from
two
interest rate options for balances outstanding under the revolving credit facility and pays a commitment fee (
0.25%
at
December 31, 2013
) on the unused portion of the facility based on the Company's debt to equity leverage ratio as calculated under the agreement. At
December 31, 2013
and
2012
, the Company had
no
borrowings outstanding under the revolving credit facility.
58
Alterra and Markel Bermuda are party to a
$900 million
secured credit facility (the senior credit facility), which expires on December 15, 2015. The senior credit facility provides for secured letters of credit to be issued for the account of Alterra, Markel Bermuda and certain other subsidiaries of Alterra and for loans to Alterra and Markel Bermuda. Loans under the senior credit facility are subject to a sublimit of
$250 million
. Subject to certain conditions and at the request of Alterra, the aggregate commitments of the lenders under the senior credit facility may be increased up to a total of
$1.4 billion
. The Company pays a fee of
0.40%
for outstanding letters of credit under the senior credit facility and a commitment fee of
0.125%
on the total unused portion of the senior credit facility. At
December 31, 2013
, the Company had
no
borrowings outstanding under the senior credit facility. At
December 31, 2013
,
$472.3 million
of letters of credit were issued and outstanding under the senior credit facility.
At
December 31, 2013
, the Company was in compliance with all covenants contained in its revolving credit facility and senior credit facility. To the extent that the Company is not in compliance with its covenants, the Company's access to these credit facilities could be restricted.
The Company paid
$114.5 million
,
$92.9 million
and
$84.1 million
in interest on its senior long-term debt and other debt during the years ended
December 31, 2013
,
2012
and
2011
, respectively.
12. Shareholders' Equity
a)
The Company had
50,000,000
shares of no par value common stock authorized of which
13,985,620
shares and
9,629,160
shares were issued and outstanding at
December 31, 2013
and
2012
, respectively. The Company also has
10,000,000
shares of no par value preferred stock authorized, none of which was issued or outstanding at
December 31, 2013
or
2012
.
During 2013, the Company repurchased
77,693
shares of common stock at a cost of
$40.9 million
under a share repurchase program that was approved by the Company's Board of Directors in November 2010 (the 2010 Program). As of
December 31, 2013
, the Company had repurchased
232,535
shares of common stock at a cost of
$101.4 million
under the 2010 Program. In November 2013, the Board of Directors approved a new share repurchase program that provides for the repurchase of up to
$300 million
of common stock (the 2013 Program) to replace the 2010 Program. The 2013 Program has no expiration date but may be terminated by the Board of Directors at any time. As of
December 31, 2013
, the Company had not repurchased any shares of common stock under the 2013 Program.
b)
Net income per share was determined by dividing adjusted net income to shareholders by the applicable weighted average shares outstanding. Unvested share-based compensation awards that contain non-forfeitable rights to dividends or dividend equivalents (whether paid or unpaid) are considered participating awards and are included in the computation of net income per share. Non-participating unvested share-based compensation awards are excluded from the computation of net income per share. Diluted net income per share is computed by dividing adjusted net income to shareholders by the weighted average number of common shares and dilutive potential common shares outstanding during the year. Average closing common stock market prices are used to calculate the dilutive effect attributable to restricted stock.
|
Years Ended December 31,
|
|||||||||||
|
(in thousands, except per share amounts)
|
2013
|
2012
|
2011
|
||||||||
|
Net income to shareholders
|
$
|
281,021
|
|
$
|
253,385
|
|
$
|
142,026
|
|
||
|
Adjustment of redeemable noncontrolling interests
|
1,963
|
|
(3,101
|
)
|
—
|
|
|||||
|
Adjusted net income to shareholders
|
$
|
282,984
|
|
$
|
250,284
|
|
$
|
142,026
|
|
||
|
Basic common shares outstanding
|
12,538
|
|
9,640
|
|
9,686
|
|
|||||
|
Dilutive potential common shares from conversion of options
|
12
|
|
6
|
|
20
|
|
|||||
|
Dilutive potential common shares from conversion of non-participating restricted stock
|
36
|
|
20
|
|
20
|
|
|||||
|
Diluted shares outstanding
|
12,586
|
|
9,666
|
|
9,726
|
|
|||||
|
Basic net income per share
|
$
|
22.57
|
|
$
|
25.96
|
|
$
|
14.66
|
|
||
|
Diluted net income per share
|
$
|
22.48
|
|
$
|
25.89
|
|
$
|
14.60
|
|
||
59
c)
The Company's Employee Stock Purchase and Bonus Plan provides a method for employees and directors to purchase shares of the Company's common stock on the open market. The plan encourages share ownership by providing for the award of bonus shares to participants equal to
10%
of the net increase in the number of shares owned under the plan in a given year, excluding shares acquired through the plan's loan program component. Under the loan program, the Company offers subsidized unsecured loans so participants may purchase shares and awards bonus shares equal to
5%
of the shares purchased with a loan. The Company has authorized
100,000
shares for purchase under this plan, of which
33,454
and
46,889
shares were available for purchase at
December 31, 2013
and
2012
, respectively. At
December 31, 2013
and
2012
, loans outstanding under the plan, which are included in receivables on the consolidated balance sheets, totaled
$12.8 million
and
$11.4 million
, respectively.
d)
In April 2012, the Company adopted the 2012 Equity Incentive Compensation Plan (2012 Compensation Plan), which replaced the Markel Corporation Omnibus Incentive Plan (Omnibus Incentive Plan). The 2012 Compensation Plan provides for grants and awards of restricted stock, restricted stock units, performance grants, and other stock based awards to employees and directors and is administered by the Compensation Committee of the Company's Board of Directors (Compensation Committee). At December 31, 2013, there were
146,768
shares reserved for issuance under the 2012 Compensation Plan.
Restricted stock units are awarded to certain associates and executive officers based upon meeting performance conditions determined by the Compensation Committee. These awards generally vest at the end of the fifth year following the year for which the Compensation Committee determines performance conditions have been met. At the end of the vesting period, recipients are entitled to receive
one
share of the Company's common stock for each vested restricted stock unit. During
2013
, the Company awarded
13,648
restricted stock units to associates and executive officers based on performance conditions being met.
Restricted stock units also are awarded to associates and executive officers to assist the Company in securing or retaining the services of key employees. In May 2013, the Compensation Committee awarded
31,669
restricted stock units to certain associates and executive officers to assist the Company in retaining the services of key employees. The restricted stock units had a grant-date fair value of
$16.6 million
. The awards vest over a
three
year period and entitle the recipient to receive
one
share of the Company's common stock for each vested restricted stock unit. Also during
2013
, the Company awarded
1,833
restricted stock units to associates and executive officers as a hiring or retention incentive. These awards generally vest over a
three
-year period and entitle the recipient to receive
one
share of the Company's common stock for each vested restricted stock unit.
During
2013
, the Company awarded
1,710
shares of restricted stock to its non-employee directors. The shares awarded to non-employee directors will vest in
2014
.
The following table summarizes nonvested share-based awards.
|
Number
of Awards
|
Weighted Average
Grant-Date
Fair Value
|
|||||
|
Nonvested awards at January 1, 2013
|
55,580
|
|
$
|
388.58
|
|
|
|
Granted
|
48,860
|
|
517.24
|
|
||
|
Vested
|
(5,729
|
)
|
428.78
|
|
||
|
Nonvested awards at December 31, 2013
|
98,711
|
|
$
|
449.93
|
|
|
The fair value of the Company's share-based awards issued under the Omnibus Incentive Plan was determined based on the average price of the Company's common shares on the grant date. The fair value of the Company's share-based awards granted under the 2012 Compensation Plan is determined based on the closing price of the Company's common shares on the grant date. The weighted average grant-date fair value of the Company's share-based awards granted in
2013
,
2012
and
2011
was
$517.24
,
$412.04
and
$408.60
, respectively. As of
December 31, 2013
, unrecognized compensation cost related to nonvested share-based awards was
$25.3 million
, which is expected to be recognized over a weighted average period of
2.5 years
. The fair value of the Company's share-based awards that vested during
2013
,
2012
and
2011
was
$2.5 million
,
$4.7 million
and
$5.3 million
, respectively.
60
e)
In connection with the acquisition of Aspen Holdings, Inc. in October 2010, the Company provided for the conversion of options issued under the Aspen Holdings, Inc. 2008 Stock Option Plan and the Aspen Holdings, Inc. 2008 Stock Option Plan for Non-Employee Directors (the Aspen Option Plans) into options to purchase
58,116
of the Company's common shares. No further options are available for issuance under the Aspen Option Plans. The options issued were fully vested and exercisable upon conversion and expire
ten
years from the original date of issue or sooner upon the recipient's termination of employment or death. The options issued had a weighted average exercise price of
$225.94
and a grant-date fair value of
$157.15
.
The following table summarizes additional information with respect to these options.
|
Number
of
Shares
|
Weighted
Average
Exercise Price
|
Weighted Average
Remaining
Contractual Term
(years)
|
Intrinsic Value
(in millions)
|
|||||||||
|
Outstanding and exercisable, January 1, 2013
|
5,678
|
|
$
|
225.83
|
|
|||||||
|
Exercised
|
957
|
|
$
|
204.83
|
|
|||||||
|
Outstanding and exercisable, December 31, 2013
|
4,721
|
|
$
|
230.08
|
|
4.4
|
$
|
1.7
|
|
|||
During
2013
,
957
options were exercised under the Aspen Option Plans, resulting in cash proceeds of
$0.2 million
and a current tax benefit of
$0.1 million
. The intrinsic value of options exercised in
2013
was
$0.3 million
. During
2012
,
39,183
options were exercised under the Aspen Option Plans, resulting in cash proceeds of
$9.1 million
and a current tax benefit of
$2.5 million
. The intrinsic value of options exercised in
2012
was
$7.1 million
. During
2011
,
5,660
options were exercised under the Aspen Option Plans, resulting in cash proceeds of
$1.2 million
and a current tax benefit of
$0.4 million
. The intrinsic value of options exercised in
2011
was
$1.1 million
.
f)
In May 2013, in connection with the acquisition of Alterra, the Company issued
101,875
replacement options and
154,103
restricted stock awards to holders of Alterra options and restricted stock awards. The replacement options and restricted stock awards were issued under the terms and conditions of the Alterra Capital Holdings Limited 2008 Stock Incentive Plan, the Alterra Capital Holdings Limited 2006 Equity Incentive Plan and the Alterra Capital Holdings Limited 2000 Stock Incentive Plan (collectively, the Alterra Equity Award Plans). No further options or restricted stock awards are available for issuance under the Alterra Equity Award Plans.
The replacement options issued were fully vested and exercisable as of the Acquisition Date and had a weighted average exercise price of
$398.96
and a grant-date fair value of
$140.08
, which was included in the acquisition consideration. The fair value of the options was estimated on the grant date using the Black-Scholes option pricing model. Assumptions used in the pricing model included an expected annual volatility of
19.04%
, a risk-free rate of approximately
0.20%
and an expected term of approximately
two years
. The expected annual volatility was based on the historical volatility of the Company's stock and other factors. The risk-free rate was based on the U.S. Treasury yield curve, with a remaining term equal to the expected term assumption at the grant date. The expected term of the options granted represents the period of time that the options were expected to be outstanding at the grant date.
The following table summarizes additional information with respect to these options.
|
Number
of
Shares
|
Weighted
Average
Exercise Price
|
Weighted Average
Remaining
Contractual Term
(years)
|
Intrinsic Value
(in millions)
|
|||||||||
|
Outstanding and exercisable, May 1, 2013
|
101,875
|
|
$
|
398.96
|
|
|||||||
|
Exercised
|
65,934
|
|
$
|
391.64
|
|
|||||||
|
Outstanding and exercisable, December 31, 2013
|
35,941
|
|
$
|
412.39
|
|
2.6
|
$
|
6.0
|
|
|||
From the Acquisition Date through December 31, 2013,
65,934
options were exercised under the Alterra Equity Award Plans, resulting in cash proceeds of
$24.3 million
and a current tax benefit of
$0.8 million
. The intrinsic value of options exercised in 2013 was
$9.4 million
.
61
The replacement restricted stock awards issued by the Company had a grant date fair value of
$81.6 million
, or
$529.59
per share. The awards were partially vested as of the Acquisition Date and had a weighted average remaining service period of approximately
one year
. As a result,
$61.0 million
was recognized as part of the Acquisition Consideration and
$20.6 million
will be recognized as compensation expense over the remaining service period of the awards. The fair value of the replacement restricted stock awards was determined based on the weighted average price of the Company's stock on April 30, 2013, the day preceding the Acquisition Date. The following table summarizes activity related to these nonvested restricted stock awards.
|
Number
of Awards
|
Weighted Average
Grant-Date
Fair Value
|
|||||
|
Nonvested awards issued on May 1, 2013
|
154,103
|
|
$
|
529.59
|
|
|
|
Vested
|
(77,941
|
)
|
529.59
|
|
||
|
Forfeited
|
(7,751
|
)
|
529.59
|
|
||
|
Nonvested awards at December 31, 2013
|
68,411
|
|
$
|
529.59
|
|
|
The Company recognized compensation expense totaling
$12.7 million
during the year ended December 31, 2013 related to these restricted stock awards. As of December 31, 2013, unrecognized compensation cost related to the nonvested restricted stock awards was
$4.6 million
, which is expected to be recognized over a weighted average period of less than
one year
. The fair value of the restricted stock awards that vested during 2013 was
$41.3 million
.
g)
In accordance with the terms of the Merger Agreement, the Company also assumed outstanding warrants to purchase Alterra common stock. Holders of the warrants had the option to surrender them for consideration specified in the Merger Agreement, which included cash and registered shares of the Company's common stock, or to have them remain outstanding as "Company Converted Warrants," in which case the holders would be entitled to a combination of cash and unregistered shares of the Company's common stock upon exercise of the warrants. The warrants of all warrant holders who elected to exercise in conjunction with the Acquisition Date were considered to have been exercised on May 1, 2013. The Company issued
225,529
Company Converted Warrants with a fair value of
$73.7 million
to Alterra warrant holders who elected not to surrender their warrants in connection with the merger.
Three
holders who elected to have their warrants remain outstanding subsequently exercised a total of
225,499
warrants and received a total of
100,115
shares of the Company's common stock under the cashless exercise provision of the warrants. As of December 31, 2013, the Company had outstanding warrants to purchase
30
shares of its common stock.
13. Other Comprehensive Income
Other comprehensive income includes net holding gains arising during the period, changes in unrealized other-than-temporary impairment losses on fixed maturities arising during the period and reclassification adjustments for net gains included in net income. Other comprehensive income also includes changes in foreign currency translation adjustments and changes in net actuarial pension loss.
62
The following table presents the change in accumulated other comprehensive income by component, net of taxes and noncontrolling interests.
|
(dollars in thousands)
|
Unrealized
Holding Gains
on Available-for-
Sale Securities
|
Foreign
Currency
|
Net Actuarial
Pension Loss
|
Total
|
|||||||||||
|
December 31, 2010
|
$
|
581,278
|
|
$
|
1,541
|
|
$
|
(31,726
|
)
|
$
|
551,093
|
|
|||
|
Other comprehensive income (loss) before reclassifications
|
145,782
|
|
(4,155
|
)
|
(10,890
|
)
|
130,737
|
|
|||||||
|
Amounts reclassified from accumulated other comprehensive income
|
(22,341
|
)
|
—
|
|
1,431
|
|
(20,910
|
)
|
|||||||
|
Total other comprehensive income (loss)
|
123,441
|
|
(4,155
|
)
|
(9,459
|
)
|
109,827
|
|
|||||||
|
December 31, 2011
|
$
|
704,719
|
|
$
|
(2,614
|
)
|
$
|
(41,185
|
)
|
$
|
660,920
|
|
|||
|
Other comprehensive income before reclassifications
|
266,265
|
|
1,539
|
|
4,670
|
|
272,474
|
|
|||||||
|
Amounts reclassified from accumulated other comprehensive income
|
(24,051
|
)
|
—
|
|
1,994
|
|
(22,057
|
)
|
|||||||
|
Total other comprehensive income
|
242,214
|
|
1,539
|
|
6,664
|
|
250,417
|
|
|||||||
|
December 31, 2012
|
$
|
946,933
|
|
$
|
(1,075
|
)
|
$
|
(34,521
|
)
|
$
|
911,337
|
|
|||
|
Other comprehensive income (loss) before reclassifications
|
225,404
|
|
(10,171
|
)
|
2,517
|
|
217,750
|
|
|||||||
|
Amounts reclassified from accumulated other comprehensive income
|
(40,830
|
)
|
—
|
|
1,548
|
|
(39,282
|
)
|
|||||||
|
Total other comprehensive income (loss)
|
184,574
|
|
(10,171
|
)
|
4,065
|
|
178,468
|
|
|||||||
|
December 31, 2013
|
$
|
1,131,507
|
|
$
|
(11,246
|
)
|
$
|
(30,456
|
)
|
$
|
1,089,805
|
|
|||
The following table summarizes the tax expense (benefit) associated with each component of other comprehensive income.
|
Years Ended December 31,
|
|||||||||||
|
(dollars in thousands)
|
2013
|
2012
|
2011
|
||||||||
|
Change in net unrealized gains on investments:
|
|||||||||||
|
Net holding gains arising during the period
|
$
|
93,837
|
|
$
|
122,524
|
|
$
|
68,064
|
|
||
|
Change in unrealized other-than-temporary impairment losses on fixed maturities arising during the period
|
(34
|
)
|
(49
|
)
|
2,107
|
|
|||||
|
Reclassification adjustments for net gains included in net income
|
(16,382
|
)
|
(10,881
|
)
|
(10,890
|
)
|
|||||
|
Change in net unrealized gains on investments
|
77,421
|
|
111,594
|
|
59,281
|
|
|||||
|
Change in foreign currency translation adjustments
|
(1,619
|
)
|
(446
|
)
|
250
|
|
|||||
|
Change in net actuarial pension loss
|
1,015
|
|
1,991
|
|
(3,153
|
)
|
|||||
|
Total
|
$
|
76,817
|
|
$
|
113,139
|
|
$
|
56,378
|
|
||
63
The following table presents the details of amounts reclassified from accumulated other comprehensive income into income, by component.
|
Years Ended December 31,
|
|||||||||||
|
(dollars in thousands)
|
2013
|
2012
|
2011
|
||||||||
|
Unrealized holding gains on available-for-sale securities:
|
|||||||||||
|
Other-than-temporary impairment losses
|
$
|
(4,706
|
)
|
$
|
(12,078
|
)
|
$
|
(20,196
|
)
|
||
|
Net realized investment gains, excluding other-than-temporary impairment losses
|
61,918
|
|
47,010
|
|
53,427
|
|
|||||
|
Total before taxes
|
57,212
|
|
34,932
|
|
33,231
|
|
|||||
|
Income taxes
|
(16,382
|
)
|
(10,881
|
)
|
(10,890
|
)
|
|||||
|
Reclassification of unrealized holding gains, net of taxes
|
$
|
40,830
|
|
$
|
24,051
|
|
$
|
22,341
|
|
||
|
Net actuarial pension loss:
|
|||||||||||
|
Underwriting, acquisition and insurance expenses
|
$
|
(1,934
|
)
|
$
|
(2,590
|
)
|
$
|
(1,908
|
)
|
||
|
Income taxes
|
386
|
|
596
|
|
477
|
|
|||||
|
Reclassification of net actuarial pension loss, net of taxes
|
$
|
(1,548
|
)
|
$
|
(1,994
|
)
|
$
|
(1,431
|
)
|
||
14. Derivatives
The Company is a party to a credit default swap agreement, under which third party credit risk is transferred from a counterparty to the Company. The Company entered into the credit default swap agreement for investment purposes. At both
December 31, 2013
and
2012
, the notional amount of the credit default swap was
$33.1 million
, which represented the Company's aggregate exposure to losses if specified credit events involving third party reference entities occur. These third party reference entities are specified under the terms of the agreement and represent a portfolio of names upon which the Company has assumed credit risk from the counterparty. The Company's exposure to loss from any one reference entity is limited to
$20.0 million
. The credit default swap has a scheduled termination date of December 2014.
The credit default swap is accounted for as a derivative instrument and is recorded at fair value with any changes in fair value recorded in net investment income. At
December 31, 2013
and
2012
, the credit default swap had a fair value of
$2.2 million
and
$12.7 million
, respectively. The fair value of the credit default swap is included in other liabilities on the consolidated balance sheets. Net investment income in
2013
and
2012
included favorable changes in the fair value of the credit default swap of
$10.5 million
and
$16.6 million
, respectively. Net investment income in
2011
included an adverse change in the fair value of the credit default swap of
$4.1 million
.
Since entering into the credit default swap agreement, the Company has paid
$16.9 million
to settle its obligations related to credit events. These payments reduced the Company's liability related to its credit default swap.
The fair value of the credit default swap is determined by the Company using a Gaussian copula valuation model, a market standard model for valuing credit default swaps. The fair value is dependent upon several inputs, including changes in interest rates, credit spreads, expected default rates, changes in credit quality, future expected recovery rates and other market factors. The significant unobservable inputs used in the fair value measurement of the credit default swap are expected default rates and future expected recovery rates. The Company determines these unobservable inputs based upon default rates and recovery rates used to price similar credit default swap indices. A significant increase in expected default rates in isolation results in a significantly higher fair value measurement, while a significant decrease in expected default rates results in a significantly lower fair value measurement. A significant increase in future expected recovery rates in isolation results in a significantly lower fair value measurement, while a significant decrease in future expected recovery rates results in a significantly higher fair value measurement. Generally, a change in the assumption used for expected default rates is accompanied by a directionally opposite change in future expected recovery rates. The fair value measurement of the credit default swap at
December 31, 2013
included expected default rates ranging between
less than 1%
and
4%
, with a weighted-average expected default rate of
less than 1%
, and future expected recovery rates ranging between
20%
and
40%
, with a weighted-average future expected recovery rate of
39%
. The fair value measurement of the credit default swap at
December 31, 2012
included expected default rates ranging between
1%
and
43%
, with a weighted-average expected default rate of
3%
, and future expected recovery rates ranging between
20%
and
40%
, with a weighted-average future expected recovery rate of
39%
.
64
The Company's valuation policies and procedures for the credit default swap are determined by an internal investment manager with oversight provided by the Company's Chief Financial Officer and Chief Investment Officer. Fair value measurements are analyzed quarterly to ensure the change in fair value from prior periods is reasonable relative to recent market trends. Additionally, the reported fair value of the credit default swap is compared to results from similar valuation models.
See note 15 for further discussion of the Company's credit default swap.
The Company had no other material derivative instruments at
December 31, 2013
.
15. Fair Value Measurements
FASB ASC 820-10,
Fair Value Measurements and Disclosures,
establishes a three-level hierarchy that prioritizes the inputs to valuation techniques used to measure fair value. The fair value hierarchy gives the highest priority to quoted prices in active markets for identical assets or liabilities (Level 1) and the lowest priority to unobservable inputs (Level 3). If the inputs used to measure the assets or liabilities fall within different levels of the hierarchy, the classification is based on the lowest level input that is significant to the fair value measurement of the asset or liability.
Classification of assets and liabilities within the hierarchy considers the markets in which the assets and liabilities are traded and the reliability and transparency of the assumptions used to determine fair value. The hierarchy requires the use of observable market data when available. The levels of the hierarchy are defined as follows:
Level 1 - Inputs to the valuation methodology are quoted prices (unadjusted) for identical assets or liabilities traded in active markets.
Level 2 - Inputs to the valuation methodology include quoted prices for similar assets or liabilities in active markets, quoted prices for identical or similar assets or liabilities in markets that are not active, inputs other than quoted prices that are observable for the asset or liability and market-corroborated inputs.
Level 3 - Inputs to the valuation methodology are unobservable for the asset or liability and are significant to the fair value measurement.
In accordance with FASB ASC 820, the Company determines fair value based on the price that would be received to sell an asset or paid to transfer a liability in an orderly transaction between market participants at the measurement date. In determining fair value, the Company uses various methods, including the market, income and cost approaches. The Company uses valuation techniques that maximize the use of observable inputs and minimize the use of unobservable inputs. The following section describes the valuation methodologies used by the Company to measure assets and liabilities at fair value, including an indication of the level within the fair value hierarchy in which each asset or liability is generally classified.
Investments available-for-sale.
Investments available-for-sale are recorded at fair value on a recurring basis and include fixed maturities, equity securities and short-term investments. Short-term investments include certificates of deposit, commercial paper, discount notes and treasury bills with original maturities of
one
year or less. Fair value for investments available-for-sale is determined by the Company after considering various sources of information, including information provided by a third party pricing service. The pricing service provides prices for substantially all of the Company's fixed maturities and equity securities. In determining fair value, the Company generally does not adjust the prices obtained from the pricing service. The Company obtains an understanding of the pricing service's valuation methodologies and related inputs, which include, but are not limited to, reported trades, benchmark yields, issuer spreads, bids, offers, duration, credit ratings, estimated cash flows and prepayment speeds. The Company validates prices provided by the pricing service by reviewing prices from other pricing sources and analyzing pricing data in certain instances.
The Company has evaluated the various types of securities in its investment portfolio to determine an appropriate fair value hierarchy level based upon trading activity and the observability of market inputs. Level 1 investments include those traded on an active exchange, such as the New York Stock Exchange. Level 2 investments include U.S. Treasury securities and obligations of U.S. government agencies, municipal bonds, foreign government bonds, commercial mortgage-backed securities, residential mortgage-backed securities, asset-backed securities and corporate debt securities.
65
Fair value for investments available-for-sale is measured based upon quoted prices in active markets, if available. Due to variations in trading volumes and the lack of quoted market prices, fixed maturities are classified as Level 2 investments. The fair value of fixed maturities is normally derived through recent reported trades for identical or similar securities, making adjustments through the reporting date based upon available market observable data described above. If there are no recent reported trades, the fair value of fixed maturities may be derived through the use of matrix pricing or model processes, where future cash flow expectations are developed based upon collateral performance and discounted at an estimated market rate. Significant inputs used to determine the fair value of obligations of states, municipalities and political subdivisions, corporate bonds and obligations of foreign governments include reported trades, benchmark yields, issuer spreads, bids, offers, credit information and estimated cash flows. Significant inputs used to determine the fair value of commercial mortgage-backed securities, residential mortgage-backed securities and asset-backed securities include the type of underlying assets, benchmark yields, prepayment speeds, collateral information, tranche type and volatility, estimated cash flows, credit information, default rates, recovery rates, issuer spreads and the year of issue.
Derivatives.
Derivatives are recorded at fair value on a recurring basis and include a credit default swap. The fair value of the credit default swap is measured by the Company using an external valuation model. See note 14 for a discussion of the valuation model for the credit default swap, including the key inputs and assumptions used in the model and a description of the valuation processes used by the Company. Due to the significance of unobservable inputs required in measuring the fair value of the credit default swap, the credit default swap has been classified as Level 3 within the fair value hierarchy.
Senior long-term debt and other debt.
Senior long-term debt and other debt is carried at amortized cost with the estimated fair value disclosed on the consolidated balance sheets. Senior long-term debt and other debt is classified as Level 2 within the fair value hierarchy due to variations in trading volumes and the lack of quoted market prices. Fair value for senior long-term debt and other debt is generally derived through recent reported trades for identical securities, making adjustments through the reporting date, if necessary, based upon available market observable data including U.S. Treasury securities and implied credit spreads. Significant inputs used to determine the fair value of senior long-term debt and other debt include reported trades, benchmark yields, issuer spreads, bids and offers.
The following tables present the balances of assets and liabilities measured at fair value on a recurring basis by level within the fair value hierarchy.
|
December 31, 2013
|
|||||||||||||||
|
(dollars in thousands)
|
Level 1
|
Level 2
|
Level 3
|
Total
|
|||||||||||
|
Assets:
|
|||||||||||||||
|
Investments available-for-sale:
|
|||||||||||||||
|
Fixed maturities:
|
|||||||||||||||
|
U.S. Treasury securities and obligations of U.S. government agencies
|
$
|
—
|
|
$
|
1,194,231
|
|
$
|
—
|
|
$
|
1,194,231
|
|
|||
|
Obligations of states, municipalities and political subdivisions
|
—
|
|
3,075,715
|
|
—
|
|
3,075,715
|
|
|||||||
|
Foreign governments
|
—
|
|
1,461,054
|
|
—
|
|
1,461,054
|
|
|||||||
|
Commercial mortgage-backed securities
|
—
|
|
367,821
|
|
—
|
|
367,821
|
|
|||||||
|
Residential mortgage-backed securities
|
—
|
|
870,248
|
|
—
|
|
870,248
|
|
|||||||
|
Asset-backed securities
|
—
|
|
188,289
|
|
—
|
|
188,289
|
|
|||||||
|
Corporate bonds
|
—
|
|
2,985,178
|
|
—
|
|
2,985,178
|
|
|||||||
|
Total fixed maturities
|
—
|
|
10,142,536
|
|
—
|
|
10,142,536
|
|
|||||||
|
Equity securities:
|
|||||||||||||||
|
Insurance, banks and other financial institutions
|
1,015,083
|
|
—
|
|
—
|
|
1,015,083
|
|
|||||||
|
Industrial, consumer and all other
|
2,236,715
|
|
—
|
|
—
|
|
2,236,715
|
|
|||||||
|
Total equity securities
|
3,251,798
|
|
—
|
|
—
|
|
3,251,798
|
|
|||||||
|
Short-term investments
|
1,312,561
|
|
139,727
|
|
—
|
|
1,452,288
|
|
|||||||
|
Total investments available-for-sale
|
$
|
4,564,359
|
|
$
|
10,282,263
|
|
$
|
—
|
|
$
|
14,846,622
|
|
|||
|
Liabilities:
|
|||||||||||||||
|
Derivative contracts
|
$
|
—
|
|
$
|
—
|
|
$
|
2,230
|
|
$
|
2,230
|
|
|||
66
|
December 31, 2012
|
|||||||||||||||
|
(dollars in thousands)
|
Level 1
|
Level 2
|
Level 3
|
Total
|
|||||||||||
|
Assets:
|
|||||||||||||||
|
Investments available-for-sale:
|
|||||||||||||||
|
Fixed maturities:
|
|||||||||||||||
|
U.S. Treasury securities and obligations of U.S. government agencies
|
$
|
—
|
|
$
|
317,507
|
|
$
|
—
|
|
$
|
317,507
|
|
|||
|
Obligations of states, municipalities and political subdivisions
|
—
|
|
2,831,562
|
|
—
|
|
2,831,562
|
|
|||||||
|
Foreign governments
|
—
|
|
556,608
|
|
—
|
|
556,608
|
|
|||||||
|
Residential mortgage-backed securities
|
—
|
|
215,377
|
|
—
|
|
215,377
|
|
|||||||
|
Asset-backed securities
|
—
|
|
14,345
|
|
—
|
|
14,345
|
|
|||||||
|
Corporate bonds
|
—
|
|
1,043,884
|
|
—
|
|
1,043,884
|
|
|||||||
|
Total fixed maturities
|
—
|
|
4,979,283
|
|
—
|
|
4,979,283
|
|
|||||||
|
Equity securities:
|
|||||||||||||||
|
Insurance, banks and other financial institutions
|
898,067
|
|
—
|
|
—
|
|
898,067
|
|
|||||||
|
Industrial, consumer and all other
|
1,508,884
|
|
—
|
|
—
|
|
1,508,884
|
|
|||||||
|
Total equity securities
|
2,406,951
|
|
—
|
|
—
|
|
2,406,951
|
|
|||||||
|
Short-term investments
|
888,758
|
|
84,572
|
|
—
|
|
973,330
|
|
|||||||
|
Total investments available-for-sale
|
$
|
3,295,709
|
|
$
|
5,063,855
|
|
$
|
—
|
|
$
|
8,359,564
|
|
|||
|
Liabilities:
|
|||||||||||||||
|
Derivative contracts
|
$
|
—
|
|
$
|
—
|
|
$
|
12,690
|
|
$
|
12,690
|
|
|||
The following table summarizes changes in Level 3 liabilities measured at fair value on a recurring basis.
|
(dollars in thousands)
|
2013
|
2012
|
|||||
|
Derivatives, beginning of period
|
$
|
12,690
|
|
$
|
29,331
|
|
|
|
Total gains included in:
|
|||||||
|
Net income
|
(10,460
|
)
|
(16,641
|
)
|
|||
|
Other comprehensive income
|
—
|
|
—
|
|
|||
|
Transfers into Level 3
|
—
|
|
—
|
|
|||
|
Transfers out of Level 3
|
—
|
|
—
|
|
|||
|
Derivatives, end of period
|
$
|
2,230
|
|
$
|
12,690
|
|
|
|
Net unrealized gains included in net income relating to liabilities held at December 31, 2013 and 2012
(1)
|
$
|
10,460
|
|
$
|
16,641
|
|
|
|
(1)
|
Included in net investment income in the consolidated statements of income and comprehensive income.
|
There were no transfers into or out of Level 1 and Level 2 during
2013
or
2012
. Except as disclosed in note 2, the Company did not have any assets or liabilities measured at fair value on a non-recurring basis during the years ended
December 31, 2013
and
2012
.
16. Reinsurance
The Company uses reinsurance and retrocessional reinsurance to manage its net retention on individual risks and overall exposure to losses while providing it with the ability to offer policies with sufficient limits to meet policyholder needs. As part of the Company's underwriting philosophy, the Company has historically sought to offer products with limits that did not require significant reinsurance. Following the acquisition of Alterra, the Company now has certain insurance and reinsurance products that have typically required higher levels of reinsurance. In a reinsurance transaction, an insurance company transfers, or cedes, all or part of its exposure in return for a portion of the premium. In a retrocessional reinsurance transaction, a reinsurance company transfers, or cedes, all or part of its exposure in return for a portion of the premium. The ceding of insurance does not legally discharge the Company from its primary liability for the full amount of the policies, and the Company will be required to pay the loss and bear collection risk if the reinsurer fails to meet its obligations under the reinsurance or retrocessional agreement.
67
A credit risk exists with ceded reinsurance to the extent that any reinsurer is unable to meet the obligations assumed under the reinsurance or retrocessional contracts. Allowances are established for amounts deemed uncollectible. The Company evaluates the financial condition of its reinsurers and monitors concentration of credit risk arising from its exposure to individual reinsurers. At
December 31, 2013
and
2012
, balances recoverable from the Company's
ten
largest reinsurers, by group, represented approximately
62%
and
74%
, respectively, of the reinsurance recoverable on paid and unpaid losses, before considering reinsurance allowances. At
December 31, 2013
, the Company's largest reinsurance balance was due from the Fairfax Financial Group and represented
10%
of the reinsurance recoverable on paid and unpaid losses, before considering reinsurance allowances.
To further reduce credit exposure to reinsurance recoverable balances, the Company has received collateral, including letters of credit and trust accounts, from certain reinsurers. Collateral related to these reinsurance agreements is available, without restriction, when the Company pays losses covered by the reinsurance agreements.
The following table summarizes the Company's reinsurance allowance for doubtful accounts.
|
Years Ended December 31,
|
|||||||||||
|
(dollars in thousands)
|
2013
|
2012
|
2011
|
||||||||
|
Reinsurance allowance, beginning of year
|
$
|
71,148
|
|
$
|
69,067
|
|
$
|
155,190
|
|
||
|
Additions
|
13,621
|
|
24,179
|
|
8,504
|
|
|||||
|
Deductions
|
(8,559
|
)
|
(22,098
|
)
|
(94,627
|
)
|
|||||
|
Reinsurance allowance, end of year
|
$
|
76,210
|
|
$
|
71,148
|
|
$
|
69,067
|
|
||
Deductions for the year ended December 31, 2011 included a
$78.5 million
adjustment related to commutations completed by Markel International, which involved the termination of ceded reinsurance contracts. Of the total adjustment,
$40.0 million
related to reinsurance recoverables on losses and loss adjustment expenses for A&E related exposures. The adjustment had no impact on the reinsurance recoverable on unpaid losses, net of the reinsurance allowance, for any period presented.
Management believes the Company's reinsurance allowance for doubtful accounts is adequate at
December 31, 2013
; however, the deterioration in the credit quality of existing reinsurers or disputes over reinsurance and retrocessional contracts could result in additional charges.
The following table summarizes the effect of reinsurance and retrocessional reinsurance on premiums written and earned.
|
Years Ended December 31,
|
|||||||||||||||||||||||
|
2013
|
2012
|
2011
|
|||||||||||||||||||||
|
(dollars in thousands)
|
Written
|
Earned
|
Written
|
Earned
|
Written
|
Earned
|
|||||||||||||||||
|
Direct
|
$
|
3,143,957
|
|
$
|
2,947,812
|
|
$
|
2,115,353
|
|
$
|
2,057,735
|
|
$
|
1,957,397
|
|
$
|
1,873,512
|
|
|||||
|
Assumed
|
776,269
|
|
1,016,853
|
|
398,328
|
|
376,186
|
|
333,854
|
|
338,183
|
|
|||||||||||
|
Ceded
|
(683,543
|
)
|
(733,049
|
)
|
(299,555
|
)
|
(286,793
|
)
|
(249,413
|
)
|
(232,355
|
)
|
|||||||||||
|
Net premiums
|
$
|
3,236,683
|
|
$
|
3,231,616
|
|
$
|
2,214,126
|
|
$
|
2,147,128
|
|
$
|
2,041,838
|
|
$
|
1,979,340
|
|
|||||
Incurred losses and loss adjustment expenses were net of reinsurance recoverables (ceded incurred losses and loss adjustment expenses) of
$269.4 million
,
$165.8 million
and
$159.8 million
for the years ended
December 31, 2013
,
2012
and
2011
, respectively.
The percentage of ceded earned premiums to gross earned premiums was
18%
,
12%
and
11%
for the years ended
December 31, 2013
,
2012
and
2011
, respectively.
17. Commitments and Contingencies
a)
The Company leases substantially all of its facilities and certain furniture and equipment under noncancelable operating leases with remaining terms up to
21
years.
68
The following table summarizes the Company's minimum annual rental commitments, excluding taxes, insurance and other operating costs payable directly by the Company, for noncancelable operating leases at
December 31, 2013
.
|
Years Ending December 31,
|
(dollars in
thousands)
|
||
|
2014
|
$
|
32,783
|
|
|
2015
|
29,114
|
|
|
|
2016
|
22,977
|
|
|
|
2017
|
27,955
|
|
|
|
2018
|
26,440
|
|
|
|
2019 and thereafter
|
160,454
|
|
|
|
Total
|
$
|
299,723
|
|
Rental expense was
$35.3 million
,
$28.1 million
and
$25.8 million
for the years ended
December 31, 2013
,
2012
and
2011
, respectively.
b)
On August 8, 2013, the Company, through its wholly-owned subsidiary, Alterra Holdings Limited, and several other third-party investors, executed a subscription agreement with New Point VI Limited (New Point VI) to purchase common shares of New Point VI. New Point VI is the holding company of New Point Re VI Limited, a Bermuda-domiciled reinsurance company that offers fully-collateralized retrocessional reinsurance to the property reinsurance catastrophe market, incepting between January 1, 2014 and December 31, 2014. Following execution of the subscription agreement and subsequent issuance of common shares, the Company holds approximately
34%
of the issued and outstanding common shares of New Point VI. The Company's initial commitment under the subscription agreement with New Point VI was
$75.0 million
. As of December 31, 2013, the Company's total capital contributions to New Point VI totaled
$7.8 million
, which reduced its commitment under the subscription agreement to
$67.2 million
. During February 2014, the Company invested an additional
$6.5 million
under the subscription agreement.
c)
Contingencies arise in the normal course of the Company's operations and are not expected to have a material impact on the Company's financial condition or results of operations.
18. Related Party Transactions
The Company engages in certain related party transactions in the normal course of business. These transactions are at arm's length and are not material to the Company's consolidated financial statements.
19. Statutory Financial Information
a)
Statutory capital and surplus and statutory net income (loss) for the Company's wholly-owned insurance and reinsurance subsidiaries as of
December 31, 2013
and
2012
and for the years ended
December 31, 2013
,
2012
and
2011
, respectively, is summarized below.
|
Statutory Capital and Surplus
|
|||||||
|
(dollars in thousands)
|
2013
|
2012
|
|||||
|
United States
|
$
|
2,399,356
|
|
$
|
1,455,077
|
|
|
|
United Kingdom
|
$
|
517,571
|
|
$
|
485,043
|
|
|
|
Bermuda
|
$
|
1,503,004
|
|
N/A
|
|
||
|
Other
|
$
|
171,410
|
|
N/A
|
|
||
As of
December 31, 2013
, the amount of statutory capital and surplus necessary to satisfy regulatory requirements is not significant in relation to actual statutory capital and surplus.
69
|
Statutory Net Income (Loss)
|
|||||||||||
|
Years Ended December 31,
|
|||||||||||
|
(dollars in thousands)
|
2013
|
2012
|
2011
|
||||||||
|
United States
|
$
|
235,009
|
|
$
|
127,179
|
|
$
|
180,744
|
|
||
|
United Kingdom
|
$
|
117,020
|
|
$
|
82,573
|
|
$
|
18,386
|
|
||
|
Bermuda
|
$
|
93,953
|
|
N/A
|
|
N/A
|
|
||||
|
Other
|
$
|
(12,617
|
)
|
N/A
|
|
N/A
|
|
||||
United States
The laws of the domicile states of the Company's domestic insurance and reinsurance subsidiaries govern the amount of dividends that may be paid to the Company. Generally, statutes in the domicile states of the Company's domestic insurance and reinsurance subsidiaries require prior approval for payment of extraordinary as opposed to ordinary dividends. At
December 31, 2013
, the Company's domestic insurance and reinsurance subsidiaries could pay up to
$296.9 million
during the following 12 months under the ordinary dividend regulations.
In converting from U.S. statutory accounting principles to U.S. GAAP, typical adjustments include deferral of policy acquisition costs, differences in the calculation of deferred income taxes and the inclusion of net unrealized gains or losses relating to fixed maturities in shareholders' equity. The Company does not use any permitted statutory accounting practices that are different from prescribed statutory accounting practices which impact statutory capital and surplus.
United Kingdom
The Company's United Kingdom insurance subsidiaries are authorized by the Prudential Regulation Authority (PRA) and regulated by both the PRA and the Financial Conduct Authority (FCA). The PRA oversees compliance with established periodic auditing and reporting requirements, minimum solvency margins and individual capital assessment requirements and dividend restrictions, while both the PRA and the FCA oversee compliance with risk assessment reviews and various other requirements. The ability of Markel International Insurance Company Limited to pay dividends is limited by applicable PRA requirements, which require
14 days
advance notice to the PRA of the intention to declare and pay a dividend. Markel Syndicate Management Limited, the manager of the Company's syndicates at Lloyd's, is required to satisfy the solvency requirements of Lloyd's. In addition, the Company's United Kingdom subsidiaries must comply with the United Kingdom Companies Act of 2006, which provides that dividends may only be paid out of profits available for that purpose. As of
December 31, 2013
, earnings of the Company's United Kingdom subsidiaries are considered reinvested indefinitely for U.S. income tax purposes and will not be made available for distributions to the holding company.
Bermuda
Markel Bermuda is subject to enhanced capital requirements in addition to minimum solvency and liquidity requirements. The enhanced capital requirement is determined by reference to a risk-based capital model that determines a control threshold for statutory capital and surplus by taking into account the risk characteristics of different aspects of the insurer's business. At December 31, 2013, Markel Bermuda satisfied both the enhanced capital requirements and the minimum solvency and liquidity requirements.
Under the Bermuda Insurance Act, Markel Bermuda is prohibited from paying or declaring dividends during a fiscal year if it is in breach of its enhanced capital requirement, solvency margin or minimum liquidity ratio or if the declaration or payment of the dividend would cause a breach. If an insurer fails to meet its solvency margin or minimum liquidity ratio on the last day of any financial year, it is prohibited from declaring or paying any dividends during the next financial year without the approval of the Bermuda Monetary Authority (BMA). Further, Markel Bermuda is prohibited from declaring or paying in any financial year dividends of more than 25% of its total statutory capital and surplus as set forth in its previous year's statutory balance sheet unless it files with the BMA an affidavit stating that it will continue to meet its solvency margin and minimum liquidity ratio. Markel Bermuda must obtain the BMA's prior approval for a reduction by 15% or more of the total statutory capital as set forth in its previous year's financial statements. In addition, as a long-term insurer, Markel Bermuda may not declare or pay a dividend to any person other than a policyholder unless the value of the assets in its long-term business fund exceeds the liabilities of its long-term business by the amount of the dividend and at least the prescribed minimum solvency margin. As of
December 31, 2013
, Markel Bermuda could pay up to
$375.8 million
during the following 12 months without making any additional filings with the BMA.
70
Other Jurisdictions
The Company's other foreign subsidiaries are subject to capital and solvency requirements in their respective jurisdictions of domicile that govern their ability to declare and pay dividends. As of
December 31, 2013
, earnings of our foreign subsidiaries are considered reinvested indefinitely for U.S. income tax purposes and will not be made available for distributions to the holding company.
b)
Lloyd's sets the corporate members' required capital annually based on each syndicates' business plans, rating environment, reserving environment and input arising from Lloyd's discussions with, inter alia, regulatory and rating agencies. Such required capital is referred to as Funds at Lloyd's (FAL), and comprises cash and investments. The amount of cash and investments held as FAL as of
December 31, 2013
was
$972.5 million
. The amount which the Company provides as FAL is not available for distribution to the holding company. The Company's corporate members may also be required to maintain funds under the control of Lloyd's in excess of their capital requirements and such funds also may not be available for distribution to the holding company.
20. Segment Reporting Disclosures
The Company historically operated in
three
segments of the specialty insurance marketplace: the Excess and Surplus Lines, the Specialty Admitted and the London Insurance Market segments. The Company considers many factors, including the nature of its insurance products, production sources, distribution strategies and regulatory environment in determining how to aggregate operating segments.
As a result of the acquisition of Alterra, the Company formed a new operating segment, effective May 1, 2013. The Alterra segment is comprised of all of the active property and casualty operations of the former Alterra companies, which provide specialty insurance and reinsurance products worldwide. During 2013, results attributable to Alterra were separately evaluated by management.
For purposes of segment reporting, the Other Insurance (Discontinued Lines) segment includes lines of business that have been discontinued prior to, or in conjunction with, acquisitions. Alterra previously offered life and annuity reinsurance products. In 2010, Alterra ceased writing life and annuity reinsurance contracts and placed this business into run-off. Results attributable to the run-off of life and annuity reinsurance business are included in the Company's Other Insurance (Discontinued Lines) segment.
All investing activities related to the Company's insurance operations are included in the Investing segment.
The Company's Markel Ventures operations primarily consist of controlling interests in various industrial and service businesses. For purposes of segment reporting, the Company's Markel Ventures operations are not considered to be a reportable operating segment.
The following table summarizes the Company's gross written premiums by country. Gross written premiums are attributed to individual countries based upon location of risk.
|
Years Ended December 31,
|
||||||||||||||||||||
|
(dollars in thousands)
|
2013
|
% of
Total
|
2012
|
% of
Total
|
2011
|
% of
Total
|
||||||||||||||
|
United States
|
$
|
2,934,868
|
|
75
|
%
|
$
|
1,768,011
|
|
70
|
%
|
$
|
1,590,238
|
|
69
|
%
|
|||||
|
United Kingdom
|
245,143
|
|
6
|
|
147,891
|
|
6
|
|
139,349
|
|
6
|
|
||||||||
|
Canada
|
128,420
|
|
3
|
|
120,542
|
|
5
|
|
126,434
|
|
6
|
|
||||||||
|
Other countries
|
611,795
|
|
16
|
|
477,237
|
|
19
|
|
435,230
|
|
19
|
|
||||||||
|
Total
|
$
|
3,920,226
|
|
100
|
%
|
$
|
2,513,681
|
|
100
|
%
|
$
|
2,291,251
|
|
100
|
%
|
|||||
Most of the Company's gross written premiums are placed through insurance and reinsurance brokers. The top three independent brokers accounted for approximately
19%
of consolidated gross premiums written for the year ended December 31, 2013 and approximately
40%
of gross premiums written in the Alterra segment.
71
Segment profit for the Investing segment is measured by net investment income and net realized investment gains or losses. Segment profit or loss for each of the Company's operating segments is measured by underwriting profit or loss. The property and casualty insurance industry commonly defines underwriting profit or loss as earned premiums net of losses and loss adjustment expenses and underwriting, acquisition and insurance expenses. Underwriting profit or loss does not replace operating income or net income computed in accordance with U.S. GAAP as a measure of profitability. Underwriting profit or loss provides a basis for management to evaluate the Company's underwriting performance. Segment profit or loss for the Company's operating segments also includes other revenues and other expenses, primarily related to the run-off of managing general agent operations that were discontinued in conjunction with acquisitions. Other revenues and other expenses in the Other Insurance (Discontinued Lines) segment are comprised of the results attributable to the run-off of life and annuity reinsurance business.
For management reporting purposes, the Company allocates assets to its underwriting, investing and Markel Ventures operations. Underwriting assets are all assets not specifically allocated to the Investing segment or to the Company's Markel Ventures operations. Underwriting and investing assets are not allocated to the Excess and Surplus Lines, Specialty Admitted, London Insurance Market, Alterra or Other Insurance (Discontinued Lines) segments since the Company does not manage its assets by operating segment. The Company does not allocate capital expenditures for long-lived assets to any of its operating segments for management reporting purposes.
72
|
a)
|
The following tables summarize the Company's segment disclosures.
|
|
Year Ended December 31, 2013
|
|||||||||||||||||||||||||||
|
(dollars in thousands)
|
Excess and
Surplus
Lines
|
Specialty
Admitted
|
London
Insurance
Market
|
Alterra
|
Other
Insurance
(Discontinued
Lines)
|
Investing
|
Consolidated
|
||||||||||||||||||||
|
Gross premium volume
|
$
|
1,070,520
|
|
$
|
899,996
|
|
$
|
914,480
|
|
$
|
1,035,190
|
|
$
|
40
|
|
$
|
—
|
|
$
|
3,920,226
|
|
||||||
|
Net written premiums
|
911,870
|
|
855,381
|
|
792,158
|
|
677,233
|
|
41
|
|
—
|
|
3,236,683
|
|
|||||||||||||
|
Earned premiums
|
856,629
|
|
744,993
|
|
781,637
|
|
848,317
|
|
40
|
|
—
|
|
3,231,616
|
|
|||||||||||||
|
Losses and loss adjustment expenses
|
(341,661
|
)
|
(410,068
|
)
|
(386,416
|
)
|
(647,546
|
)
|
(30,582
|
)
|
—
|
|
(1,816,273
|
)
|
|||||||||||||
|
Transaction costs and other acquisition-related expenses
(1)
|
—
|
|
—
|
|
—
|
|
(75,140
|
)
|
—
|
|
—
|
|
(75,140
|
)
|
|||||||||||||
|
Amortization of policy acquisition costs
|
(147,996
|
)
|
(137,181
|
)
|
(149,191
|
)
|
(37,547
|
)
|
—
|
|
—
|
|
(471,915
|
)
|
|||||||||||||
|
Other operating expenses
|
(195,464
|
)
|
(176,346
|
)
|
(150,537
|
)
|
(243,022
|
)
|
112
|
|
—
|
|
(765,257
|
)
|
|||||||||||||
|
Underwriting profit (loss)
|
171,508
|
|
21,398
|
|
95,493
|
|
(154,938
|
)
|
(30,430
|
)
|
—
|
|
103,031
|
|
|||||||||||||
|
Net investment income
|
—
|
|
—
|
|
—
|
|
—
|
|
—
|
|
317,373
|
|
317,373
|
|
|||||||||||||
|
Net realized investment gains
|
—
|
|
—
|
|
—
|
|
—
|
|
—
|
|
63,152
|
|
63,152
|
|
|||||||||||||
|
Other revenues (insurance)
|
—
|
|
13,648
|
|
5,002
|
|
4,714
|
|
1,130
|
|
—
|
|
24,494
|
|
|||||||||||||
|
Other expenses (insurance)
|
—
|
|
(17,087
|
)
|
(5,065
|
)
|
—
|
|
(28,126
|
)
|
—
|
|
(50,278
|
)
|
|||||||||||||
|
Segment profit (loss)
|
$
|
171,508
|
|
$
|
17,959
|
|
$
|
95,430
|
|
$
|
(150,224
|
)
|
$
|
(57,426
|
)
|
$
|
380,525
|
|
$
|
457,772
|
|
||||||
|
Other revenues (Markel Ventures)
|
686,448
|
|
|||||||||||||||||||||||||
|
Other expenses (Markel Ventures)
|
(613,250
|
)
|
|||||||||||||||||||||||||
|
Amortization of intangible assets
|
(55,223
|
)
|
|||||||||||||||||||||||||
|
Interest expense
|
(114,004
|
)
|
|||||||||||||||||||||||||
|
Income before income taxes
|
$
|
361,743
|
|
||||||||||||||||||||||||
|
U.S. GAAP combined ratio
(2)
|
80
|
%
|
97
|
%
|
88
|
%
|
118
|
%
|
NM
|
|
(3)
|
97
|
%
|
||||||||||||||
|
(1)
|
In connection with the acquisition of Alterra, the Company incurred transaction costs of
$16.0 million
for the year ended
December 31, 2013
, which primarily consist of due diligence, legal and investment banking costs. Additionally, the Company incurred severance costs of
$31.7 million
, stay bonuses of
$14.8 million
and other compensation costs totaling
$12.6 million
related to the acceleration of certain long-term incentive compensation awards and restricted stock awards that were granted by Alterra prior to the acquisition.
|
|
(2)
|
The U.S. GAAP combined ratio is a measure of underwriting performance and represents the relationship of incurred losses, loss adjustment expenses and underwriting, acquisition and insurance expenses to earned premiums.
|
|
(3)
|
NM — Ratio is not meaningful.
|
73
|
Year Ended December 31, 2012
|
|||||||||||||||||||||||
|
(dollars in thousands)
|
Excess and
Surplus
Lines
|
Specialty
Admitted
|
London
Insurance
Market
|
Other
Insurance
(Discontinued
Lines)
|
Investing
|
Consolidated
|
|||||||||||||||||
|
Gross premium volume
|
$
|
956,273
|
|
$
|
669,692
|
|
$
|
887,720
|
|
$
|
(4
|
)
|
$
|
—
|
|
$
|
2,513,681
|
|
|||||
|
Net written premiums
|
811,601
|
|
628,147
|
|
774,383
|
|
(5
|
)
|
—
|
|
2,214,126
|
|
|||||||||||
|
Earned premiums
|
793,159
|
|
588,758
|
|
765,216
|
|
(5
|
)
|
—
|
|
2,147,128
|
|
|||||||||||
|
Losses and loss adjustment expenses
|
(388,793
|
)
|
(381,870
|
)
|
(362,330
|
)
|
(21,075
|
)
|
—
|
|
(1,154,068
|
)
|
|||||||||||
|
Prospective adoption of FASB ASU No. 2010-26
(1)
|
(17,456
|
)
|
(13,577
|
)
|
(12,060
|
)
|
—
|
|
—
|
|
(43,093
|
)
|
|||||||||||
|
Other amortization of policy acquisition costs
|
(135,573
|
)
|
(96,770
|
)
|
(152,673
|
)
|
—
|
|
—
|
|
(385,016
|
)
|
|||||||||||
|
Other operating expenses
|
(201,196
|
)
|
(143,377
|
)
|
(156,587
|
)
|
(203
|
)
|
—
|
|
(501,363
|
)
|
|||||||||||
|
Underwriting profit (loss)
|
50,141
|
|
(46,836
|
)
|
81,566
|
|
(21,283
|
)
|
—
|
|
63,588
|
|
|||||||||||
|
Net investment income
|
—
|
|
—
|
|
—
|
|
—
|
|
282,107
|
|
282,107
|
|
|||||||||||
|
Net realized investment gains
|
—
|
|
—
|
|
—
|
|
—
|
|
31,593
|
|
31,593
|
|
|||||||||||
|
Other revenues (insurance)
|
—
|
|
44,968
|
|
4,964
|
|
—
|
|
—
|
|
49,932
|
|
|||||||||||
|
Other expenses (insurance)
|
—
|
|
(41,425
|
)
|
(3,867
|
)
|
—
|
|
—
|
|
(45,292
|
)
|
|||||||||||
|
Segment profit (loss)
|
$
|
50,141
|
|
$
|
(43,293
|
)
|
$
|
82,663
|
|
$
|
(21,283
|
)
|
$
|
313,700
|
|
$
|
381,928
|
|
|||||
|
Other revenues (Markel Ventures)
|
489,352
|
|
|||||||||||||||||||||
|
Other expenses (Markel Ventures)
|
(432,956
|
)
|
|||||||||||||||||||||
|
Amortization of intangible assets
|
(33,512
|
)
|
|||||||||||||||||||||
|
Interest expense
|
(92,762
|
)
|
|||||||||||||||||||||
|
Income before income taxes
|
$
|
312,050
|
|
||||||||||||||||||||
|
U.S. GAAP combined ratio
(2)
|
94
|
%
|
108
|
%
|
89
|
%
|
NM
|
|
(3)
|
97
|
%
|
||||||||||||
|
(1)
|
Effective January 1, 2012, the Company prospectively adopted FASB ASU No. 2010-26,
Accounting for Costs Associated with Acquiring or Renewing Insurance Contracts
. At December 31, 2011, deferred policy acquisition costs included
$43.1 million
of costs that no longer met the criteria for deferral as of January 1, 2012 and were recognized into income during 2012, consistent with policy terms.
|
|
(2)
|
The U.S. GAAP combined ratio is a measure of underwriting performance and represents the relationship of incurred losses, loss adjustment expenses and underwriting, acquisition and insurance expenses to earned premiums.
|
|
(3)
|
NM — Ratio is not meaningful.
|
74
|
Year Ended December 31, 2011
|
|||||||||||||||||||||||
|
(dollars in thousands)
|
Excess and
Surplus
Lines
|
Specialty
Admitted
|
London
Insurance
Market
|
Other
Insurance
(Discontinued
Lines)
|
Investing
|
Consolidated
|
|||||||||||||||||
|
Gross premium volume
|
$
|
893,427
|
|
$
|
572,392
|
|
$
|
825,301
|
|
$
|
131
|
|
$
|
—
|
|
$
|
2,291,251
|
|
|||||
|
Net written premiums
|
772,279
|
|
543,213
|
|
726,359
|
|
(13
|
)
|
—
|
|
2,041,838
|
|
|||||||||||
|
Earned premiums
|
756,306
|
|
527,293
|
|
695,753
|
|
(12
|
)
|
—
|
|
1,979,340
|
|
|||||||||||
|
Losses and loss adjustment expenses
|
(318,583
|
)
|
(364,144
|
)
|
(531,625
|
)
|
4,366
|
|
—
|
|
(1,209,986
|
)
|
|||||||||||
|
Amortization of policy acquisition costs
|
(172,269
|
)
|
(129,731
|
)
|
(177,454
|
)
|
—
|
|
—
|
|
(479,454
|
)
|
|||||||||||
|
Other operating expenses
|
(156,419
|
)
|
(78,509
|
)
|
(96,149
|
)
|
352
|
|
—
|
|
(330,725
|
)
|
|||||||||||
|
Underwriting profit (loss)
|
109,035
|
|
(45,091
|
)
|
(109,475
|
)
|
4,706
|
|
—
|
|
(40,825
|
)
|
|||||||||||
|
Net investment income
|
—
|
|
—
|
|
—
|
|
—
|
|
263,676
|
|
263,676
|
|
|||||||||||
|
Net realized investment gains
|
—
|
|
—
|
|
—
|
|
—
|
|
35,857
|
|
35,857
|
|
|||||||||||
|
Other revenues (insurance)
|
—
|
|
33,545
|
|
—
|
|
—
|
|
—
|
|
33,545
|
|
|||||||||||
|
Other expenses (insurance)
|
—
|
|
(33,722
|
)
|
—
|
|
—
|
|
—
|
|
(33,722
|
)
|
|||||||||||
|
Segment profit (loss)
|
$
|
109,035
|
|
$
|
(45,268
|
)
|
$
|
(109,475
|
)
|
$
|
4,706
|
|
$
|
299,533
|
|
$
|
258,531
|
|
|||||
|
Other revenues (Markel Ventures)
|
317,532
|
|
|||||||||||||||||||||
|
Other expenses (Markel Ventures)
|
(275,324
|
)
|
|||||||||||||||||||||
|
Amortization of intangible assets
|
(24,291
|
)
|
|||||||||||||||||||||
|
Interest expense
|
(86,252
|
)
|
|||||||||||||||||||||
|
Income before income taxes
|
$
|
190,196
|
|
||||||||||||||||||||
|
U.S. GAAP combined ratio
(1)
|
86
|
%
|
109
|
%
|
116
|
%
|
NM
|
|
(2)
|
102
|
%
|
||||||||||||
|
(1)
|
The U.S. GAAP combined ratio is a measure of underwriting performance and represents the relationship of incurred losses, loss adjustment expenses and underwriting, acquisition and insurance expenses to earned premiums.
|
|
(2)
|
NM — Ratio is not meaningful.
|
75
b)
The following table summarizes deferred policy acquisition costs, unearned premiums and unpaid losses and loss adjustment expenses by segment.
|
(dollars in thousands)
|
Deferred Policy
Acquisition Costs
|
Unearned
Premiums
|
Unpaid Losses and
Loss Adjustment Expenses
|
||||||||
|
December 31, 2013
|
|||||||||||
|
Excess and Surplus Lines
|
$
|
69,849
|
|
$
|
469,148
|
|
$
|
1,998,359
|
|
||
|
Specialty Admitted
|
77,118
|
|
391,606
|
|
878,564
|
|
|||||
|
London Insurance Market
|
53,420
|
|
321,383
|
|
1,909,612
|
|
|||||
|
Alterra
|
60,580
|
|
944,978
|
|
4,996,722
|
|
|||||
|
Other Insurance (Discontinued Lines)
|
—
|
|
—
|
|
478,799
|
|
|||||
|
Total
|
$
|
260,967
|
|
$
|
2,127,115
|
|
$
|
10,262,056
|
|
||
|
December 31, 2012
|
|||||||||||
|
Excess and Surplus Lines
|
$
|
59,158
|
|
$
|
410,731
|
|
$
|
2,152,253
|
|
||
|
Specialty Admitted
|
43,810
|
|
280,811
|
|
796,093
|
|
|||||
|
London Insurance Market
|
54,497
|
|
308,719
|
|
1,958,249
|
|
|||||
|
Other Insurance (Discontinued Lines)
|
—
|
|
—
|
|
464,831
|
|
|||||
|
Total
|
$
|
157,465
|
|
$
|
1,000,261
|
|
$
|
5,371,426
|
|
||
c)
The following table summarizes segment earned premiums by major product grouping.
|
(dollars in thousands)
|
Property
|
Casualty
|
Professional
Liability
|
Workers'
Compensation
|
Other
|
Consolidated
|
|||||||||||||||||
|
Year Ended December 31, 2013
|
|||||||||||||||||||||||
|
Excess and Surplus Lines
|
$
|
115,773
|
|
$
|
253,195
|
|
$
|
208,732
|
|
$
|
—
|
|
$
|
278,929
|
|
$
|
856,629
|
|
|||||
|
Specialty Admitted
|
230,068
|
|
232,868
|
|
—
|
|
253,347
|
|
28,710
|
|
744,993
|
|
|||||||||||
|
London Insurance Market
|
230,278
|
|
124,843
|
|
176,302
|
|
—
|
|
250,214
|
|
781,637
|
|
|||||||||||
|
Alterra
|
215,488
|
|
172,736
|
|
165,934
|
|
31,347
|
|
262,812
|
|
848,317
|
|
|||||||||||
|
Other Insurance (Discontinued Lines)
|
—
|
|
—
|
|
—
|
|
—
|
|
40
|
|
40
|
|
|||||||||||
|
Earned premiums
|
$
|
791,607
|
|
$
|
783,642
|
|
$
|
550,968
|
|
$
|
284,694
|
|
$
|
820,705
|
|
$
|
3,231,616
|
|
|||||
|
Year Ended December 31, 2012
|
|||||||||||||||||||||||
|
Excess and Surplus Lines
|
$
|
109,607
|
|
$
|
227,880
|
|
$
|
189,199
|
|
$
|
—
|
|
$
|
266,473
|
|
$
|
793,159
|
|
|||||
|
Specialty Admitted
|
148,311
|
|
163,955
|
|
—
|
|
242,021
|
|
34,471
|
|
588,758
|
|
|||||||||||
|
London Insurance Market
|
259,571
|
|
126,441
|
|
162,554
|
|
—
|
|
216,650
|
|
765,216
|
|
|||||||||||
|
Other Insurance (Discontinued Lines)
|
—
|
|
—
|
|
—
|
|
—
|
|
(5
|
)
|
(5
|
)
|
|||||||||||
|
Earned premiums
|
$
|
517,489
|
|
$
|
518,276
|
|
$
|
351,753
|
|
$
|
242,021
|
|
$
|
517,589
|
|
$
|
2,147,128
|
|
|||||
|
Year Ended December 31, 2011
|
|||||||||||||||||||||||
|
Excess and Surplus Lines
|
$
|
103,406
|
|
$
|
214,565
|
|
$
|
197,131
|
|
$
|
—
|
|
$
|
241,204
|
|
$
|
756,306
|
|
|||||
|
Specialty Admitted
|
135,077
|
|
140,805
|
|
—
|
|
200,797
|
|
50,614
|
|
527,293
|
|
|||||||||||
|
London Insurance Market
|
231,798
|
|
117,062
|
|
173,101
|
|
—
|
|
173,792
|
|
695,753
|
|
|||||||||||
|
Other Insurance (Discontinued Lines)
|
—
|
|
—
|
|
—
|
|
—
|
|
(12
|
)
|
(12
|
)
|
|||||||||||
|
Earned premiums
|
$
|
470,281
|
|
$
|
472,432
|
|
$
|
370,232
|
|
$
|
200,797
|
|
$
|
465,598
|
|
$
|
1,979,340
|
|
|||||
The Company does not manage products at this level of aggregation. The Company offers a diverse portfolio of products and manages these products in logical groupings within each operating segment.
76
d)
The following table reconciles segment assets to the Company's consolidated balance sheets.
|
December 31,
|
|||||||||||
|
(dollars in thousands)
|
2013
|
2012
|
2011
|
||||||||
|
Segment assets:
|
|||||||||||
|
Investing
|
$
|
17,550,332
|
|
$
|
9,277,697
|
|
$
|
8,692,391
|
|
||
|
Underwriting
|
5,468,731
|
|
2,387,305
|
|
2,209,431
|
|
|||||
|
Total segment assets
|
23,019,063
|
|
11,665,002
|
|
10,901,822
|
|
|||||
|
Markel Ventures operations
|
936,448
|
|
891,586
|
|
630,281
|
|
|||||
|
Total assets
|
$
|
23,955,511
|
|
$
|
12,556,588
|
|
$
|
11,532,103
|
|
||
e)
Beginning in 2014, the Company will monitor and report its ongoing underwriting operations in the following
three
segments: U.S. Insurance, International Insurance and Global Reinsurance. The U.S. Insurance segment will include all direct business and facultative placements written by the Company's insurance subsidiaries domiciled in the United States. The International Insurance segment will include all direct business and facultative placements written by the Company's insurance subsidiaries domiciled outside of the United States, including the Company's syndicates at Lloyd's. The Global Reinsurance segment will include all treaty reinsurance written across the Company. Results for lines of business discontinued prior to, or in conjunction with, acquisitions will continue to be reported as the Other Insurance (Discontinued Lines) segment.
21. Other Revenues and Other Expenses
The following table summarizes the components of other revenues and other expenses.
|
Years Ended December 31,
|
|||||||||||||||||||||||
|
2013
|
2012
|
2011
|
|||||||||||||||||||||
|
(dollars in thousands)
|
Other
Revenues
|
Other
Expenses
|
Other
Revenues
|
Other
Expenses
|
Other
Revenues
|
Other
Expenses
|
|||||||||||||||||
|
Insurance:
|
|||||||||||||||||||||||
|
Managing general agent operations
|
$
|
17,399
|
|
$
|
20,382
|
|
$
|
48,056
|
|
$
|
43,069
|
|
$
|
31,136
|
|
$
|
30,728
|
|
|||||
|
Life and annuity
|
1,130
|
|
28,126
|
|
—
|
|
—
|
|
—
|
|
—
|
|
|||||||||||
|
Other
|
5,965
|
|
1,770
|
|
1,876
|
|
2,223
|
|
2,409
|
|
2,994
|
|
|||||||||||
|
24,494
|
|
50,278
|
|
49,932
|
|
45,292
|
|
33,545
|
|
33,722
|
|
||||||||||||
|
Markel Ventures:
|
|||||||||||||||||||||||
|
Manufacturing
|
495,138
|
|
437,712
|
|
366,886
|
|
328,484
|
|
214,668
|
|
192,503
|
|
|||||||||||
|
Non-Manufacturing
|
191,310
|
|
175,538
|
|
122,466
|
|
104,472
|
|
102,864
|
|
82,821
|
|
|||||||||||
|
686,448
|
|
613,250
|
|
489,352
|
|
432,956
|
|
317,532
|
|
275,324
|
|
||||||||||||
|
Total
|
$
|
710,942
|
|
$
|
663,528
|
|
$
|
539,284
|
|
$
|
478,248
|
|
$
|
351,077
|
|
$
|
309,046
|
|
|||||
The Company's Markel Ventures operations primarily consist of controlling interests in various industrial and service businesses and are viewed by management as separate and distinct from the Company's insurance operations. While each of the companies is operated independently from one another, management aggregates financial results into two industry groups: manufacturing and non-manufacturing.
The financial results of the companies in which the Company owns controlling interests have been consolidated in our financial statements. The financial results of those companies in which the Company owns a noncontrolling interest are accounted for under the equity method of accounting.
The increase in other revenues and other expenses attributable to Markel Ventures in each of the years presented was primarily due to acquisitions.
77
22. Employee Benefit Plans
a)
The Company maintains defined contribution plans for employees of its United States insurance operations in accordance with Section 401(k) of the IRC. Employees of the Company's Markel Ventures subsidiaries are provided post-retirement benefits under separate plans. The Company also provides various defined contribution plans for employees of its international insurance operations, which are in line with local market terms and conditions of employment. Expenses relating to the Company's defined contribution plans, including the defined contribution plans of Alterra effective May 1, 2013, were
$24.3 million
,
$19.1 million
and
$17.8 million
in
2013
,
2012
and
2011
, respectively.
b)
The Terra Nova Pension Plan is a defined benefit plan which covers Markel International employees who meet the eligibility conditions set out in the plan. The plan has been closed to new participants since 2001. The cost of providing pensions for employees is charged to earnings over the average working life of employees according to actuarial recommendations. Final benefits are based on the employee's years of credited service and the higher of pensionable compensation received in the calendar year preceding retirement or the best average pensionable compensation received in any
three
consecutive years in the
ten years
preceding retirement. Effective April 1, 2012, employees are no longer accruing benefits for future service in the Terra Nova Pension Plan. The Company uses December 31 as the measurement date for the Terra Nova Pension Plan.
The following table summarizes the funded status of the Terra Nova Pension Plan and the amounts recognized on the accompanying consolidated balance sheets of the Company.
|
Years Ended December 31,
|
|||||||
|
(dollars in thousands)
|
2013
|
2012
|
|||||
|
Change in projected benefit obligation:
|
|||||||
|
Projected benefit obligation at beginning of period
|
$
|
151,327
|
|
$
|
141,163
|
|
|
|
Service cost
|
—
|
|
361
|
|
|||
|
Interest cost
|
6,533
|
|
6,815
|
|
|||
|
Participant contributions
|
—
|
|
81
|
|
|||
|
Benefits paid
|
(3,542
|
)
|
(2,938
|
)
|
|||
|
Actuarial loss (gain)
|
5,459
|
|
(601
|
)
|
|||
|
Effect of foreign currency rate changes
|
3,233
|
|
6,446
|
|
|||
|
Projected benefit obligation at end of year
|
$
|
163,010
|
|
$
|
151,327
|
|
|
|
Change in plan assets:
|
|||||||
|
Fair value of plan assets at beginning of period
|
$
|
164,090
|
|
$
|
139,325
|
|
|
|
Actual gain on plan assets
|
19,430
|
|
15,251
|
|
|||
|
Employer contributions
|
5,338
|
|
5,737
|
|
|||
|
Participant contributions
|
—
|
|
81
|
|
|||
|
Benefits paid
|
(3,542
|
)
|
(2,938
|
)
|
|||
|
Effect of foreign currency rate changes
|
4,121
|
|
6,634
|
|
|||
|
Fair value of plan assets at end of year
|
$
|
189,437
|
|
$
|
164,090
|
|
|
|
Funded status of the plan
|
$
|
26,427
|
|
$
|
12,763
|
|
|
|
Net actuarial pension loss
|
42,941
|
|
48,021
|
|
|||
|
Total
|
$
|
69,368
|
|
$
|
60,784
|
|
|
Net actuarial pension loss is recognized as a component of accumulated other comprehensive income, net of a tax benefit of
$12.4 million
and
$13.5 million
in
2013
and
2012
, respectively. The asset for pension benefits, also referred to as the funded status of the plan, at
December 31, 2013
and
December 31, 2012
was included in other assets on the consolidated balance sheet.
78
The following table summarizes the components of net periodic benefit cost (income) and the weighted average assumptions for the Terra Nova Pension Plan.
|
Years Ended December 31,
|
|||||||||||
|
(dollars in thousands)
|
2013
|
2012
|
2011
|
||||||||
|
Components of net periodic benefit cost (income):
|
|||||||||||
|
Service cost
|
$
|
—
|
|
$
|
361
|
|
$
|
1,357
|
|
||
|
Interest cost
|
6,533
|
|
6,815
|
|
7,115
|
|
|||||
|
Expected return on plan assets
|
(10,825
|
)
|
(9,788
|
)
|
(9,834
|
)
|
|||||
|
Amortization of net actuarial pension loss
|
1,934
|
|
2,590
|
|
1,908
|
|
|||||
|
Net periodic benefit cost (income)
|
$
|
(2,358
|
)
|
$
|
(22
|
)
|
$
|
546
|
|
||
|
Weighted average assumptions as of December 31:
|
|||||||||||
|
Discount rate
|
4.7
|
%
|
4.5
|
%
|
4.8
|
%
|
|||||
|
Expected return on plan assets
|
6.6
|
%
|
6.6
|
%
|
6.6
|
%
|
|||||
|
Rate of compensation increase
|
3.2
|
%
|
3.1
|
%
|
3.2
|
%
|
|||||
The projected benefit obligation and the net periodic benefit cost (income) are determined by independent actuaries using assumptions provided by the Company. In determining the discount rate, the Company uses the current yield on high-quality, fixed-income investments that have maturities corresponding to the anticipated timing of estimated defined benefit payments. The Company's discount rate approximates a bond yield from a published index that includes "AA" rated corporate bonds with maturities of
15 years
or more. The expected return on plan assets is estimated based upon the anticipated average yield on plan assets and reflects expected changes in the allocation of plan assets. Asset returns reflect management's belief that
4.5%
is a reasonable rate of return to anticipate for fixed maturities given current market conditions and future expectations. In addition, the expected return on plan assets includes an assumption that equity securities will outperform fixed maturities by approximately
3.5%
over the long term. The rate of compensation increase is based upon historical experience and management's expectation of future compensation.
Management's discount rate and rate of compensation increase assumptions at
December 31, 2013
were used to calculate the Company's projected benefit obligation. Management's discount rate, expected return on plan assets and rate of compensation increase assumptions at
December 31, 2012
were used to calculate the net periodic benefit income for
2013
. The Company estimates that net periodic benefit income in
2014
will include an expense of
$1.6 million
resulting from the amortization of the net actuarial pension loss included as a component of accumulated other comprehensive income at
December 31, 2013
.
The fair values of each of the plan's assets are measured using quoted prices in active markets for identical assets, which represent Level 1 inputs within the fair value hierarchy established in FASB ASC 820-10. The following table summarizes the fair value of plan assets as of
December 31, 2013
and
2012
.
|
December 31,
|
|||||||
|
(dollars in thousands)
|
2013
|
2012
|
|||||
|
Plan assets:
|
|||||||
|
Fixed maturity index funds
|
$
|
70,997
|
|
$
|
64,357
|
|
|
|
Equity security index funds
|
118,431
|
|
99,727
|
|
|||
|
Cash and cash equivalents
|
9
|
|
6
|
|
|||
|
Total
|
$
|
189,437
|
|
$
|
164,090
|
|
|
The Company's target asset allocation for the plan is
54%
equity securities and
46%
fixed maturities. At
December 31, 2013
, the actual allocation of assets in the plan was
63%
equity securities and
37%
fixed maturities. At
December 31, 2012
, the actual allocation of plan assets was
61%
equity securities and
39%
fixed maturities.
79
Investments are managed by a third-party investment manager. Equity securities are invested in
two
index funds that are allocated
25%
to shares of United Kingdom companies and
75%
to companies in other markets. The primary objective of investing in these funds is to earn rates of return that are consistently in excess of inflation. Investing in equity securities, historically, has provided rates of return that are higher than investments in fixed maturities. As the Company's obligations under this pension plan are expected to be paid out over a period in excess of
30
years, the Company primarily invests in equity securities. Fixed maturity investments are allocated between
five
index funds,
two
that include United Kingdom government securities,
one
that includes securities issued by other foreign governments and
two
that include United Kingdom corporate securities. The assets in these funds are invested to meet the Company's obligations for current pensioners and those individuals nearing retirement. The plan does not invest in the Company's common shares.
At
December 31, 2013
and
2012
, the fair value of plan assets exceeded the plan's accumulated benefit obligation of
$146.0 million
and
$133.5 million
, respectively. The Company expects to make plan contributions of
$5.6 million
in
2014
.
The benefits expected to be paid in each year from 2014 to 2018 are
$3.8 million
,
$3.9 million
,
$4.0 million
,
$4.1 million
and
$4.2 million
, respectively. The aggregate benefits expected to be paid in the five years from 2019 to 2023 are
$22.5 million
. The expected benefits to be paid are based on the same assumptions used to measure the Company's projected benefit obligation at
December 31, 2013
and include estimated future employee service.
c)
AMF Bakery Systems (AMF), one of the Company's Markel Ventures subsidiaries, participated in a multiemployer defined benefit pension plan, Regime de retraite patronal-syndical (Quebec) de l'A.I.M. (Quebec pension plan no. 26467). The multiemployer plan covered approximately
90
union employees within the Canadian operations of AMF. In December 2011, AMF gave notice to the trustees of the multiemployer plan of its intent to withdraw. As a result, AMF established a liability of
$2.0 million
for its obligations under the multiemployer plan. During the year ended December 31, 2012, a
$2.4 million
payment, which represented approximately
95%
of AMF's determined deficit payment, was remitted to the plan. The withdrawal report was approved by the Regie des rentes du Quebec in December 2013, and AMF paid
$0.1 million
to settle its remaining obligations under the multiemployer plan.
80
23. Markel Corporation (Parent Company Only) Financial Information
The following parent company only condensed financial information reflects the financial position, results of operations and cash flows of Markel Corporation.
CONDENSED BALANCE SHEETS
|
December 31,
|
|||||||
|
2013
|
2012
|
||||||
|
(dollars in thousands)
|
|||||||
|
ASSETS
|
|||||||
|
Investments, available-for-sale, at estimated fair value:
|
|||||||
|
Fixed maturities (amortized cost of $66,154 in 2013 and $80,631 in 2012)
|
$
|
67,363
|
|
$
|
84,158
|
|
|
|
Equity securities (cost of $197,549 in 2013 and $270,157 in 2012)
|
392,123
|
|
426,409
|
|
|||
|
Short-term investments (estimated fair value approximates cost)
|
654,971
|
|
664,986
|
|
|||
|
Total Investments
|
1,114,457
|
|
1,175,553
|
|
|||
|
Cash and cash equivalents
|
207,352
|
|
237,816
|
|
|||
|
Restricted cash and cash equivalents
|
1,010
|
|
662
|
|
|||
|
Receivables
|
14,326
|
|
13,994
|
|
|||
|
Investments in consolidated subsidiaries
|
6,826,790
|
|
3,656,577
|
|
|||
|
Notes receivable from subsidiaries
|
168,611
|
|
173,913
|
|
|||
|
Income taxes receivable
|
5,320
|
|
6,623
|
|
|||
|
Net deferred tax asset
|
—
|
|
6,595
|
|
|||
|
Other assets
|
102,193
|
|
99,107
|
|
|||
|
Total Assets
|
$
|
8,440,059
|
|
$
|
5,370,840
|
|
|
|
LIABILITIES AND SHAREHOLDERS' EQUITY
|
|||||||
|
Senior long-term debt
|
$
|
1,633,873
|
|
$
|
1,388,029
|
|
|
|
Net deferred tax liability
|
40,443
|
|
—
|
|
|||
|
Other liabilities
|
92,166
|
|
94,154
|
|
|||
|
Total Liabilities
|
1,766,482
|
|
1,482,183
|
|
|||
|
Total Shareholders' Equity
|
6,673,577
|
|
3,888,657
|
|
|||
|
Total Liabilities and Shareholders' Equity
|
$
|
8,440,059
|
|
$
|
5,370,840
|
|
|
81
CONDENSED STATEMENTS OF INCOME AND COMPREHENSIVE INCOME
|
Years Ended December 31,
|
|||||||||||
|
2013
|
2012
|
2011
|
|||||||||
|
(dollars in thousands)
|
|||||||||||
|
REVENUES
|
|||||||||||
|
Net investment income
|
$
|
21,946
|
|
$
|
30,619
|
|
$
|
12,629
|
|
||
|
Dividends on common stock of consolidated subsidiaries
|
806,233
|
|
337,585
|
|
330,462
|
|
|||||
|
Net realized investment gains (losses):
|
|||||||||||
|
Other-than-temporary impairment losses
|
(15
|
)
|
(38
|
)
|
(7,676
|
)
|
|||||
|
Net realized investment gains, excluding other-than-temporary impairment losses
|
67,232
|
|
14,926
|
|
7,417
|
|
|||||
|
Net realized investment gains (losses)
|
67,217
|
|
14,888
|
|
(259
|
)
|
|||||
|
Other
|
1
|
|
3
|
|
13
|
|
|||||
|
Total Revenues
|
895,397
|
|
383,095
|
|
342,845
|
|
|||||
|
EXPENSES
|
|||||||||||
|
Interest expense
|
92,743
|
|
87,391
|
|
78,830
|
|
|||||
|
Other expenses
|
2,617
|
|
1,166
|
|
4,572
|
|
|||||
|
Total Expenses
|
95,360
|
|
88,557
|
|
83,402
|
|
|||||
|
Income Before Equity in Undistributed Earnings of Consolidated Subsidiaries and Income Taxes
|
800,037
|
|
294,538
|
|
259,443
|
|
|||||
|
Equity in undistributed earnings of consolidated subsidiaries
|
(520,323
|
)
|
(61,663
|
)
|
(144,348
|
)
|
|||||
|
Income tax benefit
|
(1,307
|
)
|
(20,510
|
)
|
(26,931
|
)
|
|||||
|
Net Income to Shareholders
|
$
|
281,021
|
|
$
|
253,385
|
|
$
|
142,026
|
|
||
|
OTHER COMPREHENSIVE INCOME TO SHAREHOLDERS
|
|||||||||||
|
Change in net unrealized gains on investments, net of taxes:
|
|||||||||||
|
Net holding gains arising during the period
|
$
|
66,623
|
|
$
|
10,897
|
|
$
|
675
|
|
||
|
Consolidated subsidiaries' net holding gains arising during the period
|
158,922
|
|
255,528
|
|
141,164
|
|
|||||
|
Consolidated subsidiaries' change in unrealized other-than-temporary impairment losses on fixed maturities arising during the period
|
(141
|
)
|
(160
|
)
|
3,943
|
|
|||||
|
Reclassification adjustments for net gains (losses) included in net income to shareholders
|
(43,220
|
)
|
11,847
|
|
735
|
|
|||||
|
Consolidated subsidiaries' reclassification adjustments for net gains (losses) included in net income to shareholders
|
2,390
|
|
(35,898
|
)
|
(23,076
|
)
|
|||||
|
Change in net unrealized gains on investments, net of taxes
|
184,574
|
|
242,214
|
|
123,441
|
|
|||||
|
Change in foreign currency translation adjustments, net of taxes
|
(2,670
|
)
|
(242
|
)
|
314
|
|
|||||
|
Consolidated subsidiaries' change in foreign currency translation adjustments, net of taxes
|
(7,501
|
)
|
1,781
|
|
(4,469
|
)
|
|||||
|
Consolidated subsidiaries' change in net actuarial pension loss, net of taxes
|
4,065
|
|
6,664
|
|
(9,459
|
)
|
|||||
|
Total Other Comprehensive Income to Shareholders
|
178,468
|
|
250,417
|
|
109,827
|
|
|||||
|
Comprehensive Income to Shareholders
|
$
|
459,489
|
|
$
|
503,802
|
|
$
|
251,853
|
|
||
82
CONDENSED STATEMENTS OF CASH FLOWS
|
Years Ended December 31,
|
|||||||||||
|
2013
|
2012
|
2011
|
|||||||||
|
(dollars in thousands)
|
|||||||||||
|
OPERATING ACTIVITIES
|
|||||||||||
|
Net income to shareholders
|
$
|
281,021
|
|
$
|
253,385
|
|
$
|
142,026
|
|
||
|
Adjustments to reconcile net income to shareholders to net cash provided by operating activities
|
186,574
|
|
(153,773
|
)
|
102,714
|
|
|||||
|
Net Cash Provided By Operating Activities
|
467,595
|
|
99,612
|
|
244,740
|
|
|||||
|
INVESTING ACTIVITIES
|
|||||||||||
|
Proceeds from sales of fixed maturities and equity securities
|
142,259
|
|
149,314
|
|
50,322
|
|
|||||
|
Proceeds from maturities, calls and prepayments of fixed maturities
|
2,819
|
|
64,340
|
|
46,522
|
|
|||||
|
Cost of fixed maturities and equity securities purchased
|
(23,412
|
)
|
(89,569
|
)
|
(92,287
|
)
|
|||||
|
Net change in short-term investments
|
260,247
|
|
(214,820
|
)
|
(179,823
|
)
|
|||||
|
Decrease in notes receivable due from subsidiaries
|
5,302
|
|
116,797
|
|
7,401
|
|
|||||
|
Capital contributions to subsidiaries
|
(67,878
|
)
|
(198,349
|
)
|
(179,403
|
)
|
|||||
|
Acquisitions
|
(1,017,988
|
)
|
(100,409
|
)
|
—
|
|
|||||
|
Cost of equity method investments
|
(5,291
|
)
|
(38,250
|
)
|
—
|
|
|||||
|
Change in restricted cash and cash equivalents
|
(348
|
)
|
(204
|
)
|
(326
|
)
|
|||||
|
Additions to property and equipment
|
(3,653
|
)
|
(9,437
|
)
|
(16,927
|
)
|
|||||
|
Other
|
3,207
|
|
(4,369
|
)
|
12,175
|
|
|||||
|
Net Cash Used By Investing Activities
|
(704,736
|
)
|
(324,956
|
)
|
(352,346
|
)
|
|||||
|
FINANCING ACTIVITIES
|
|||||||||||
|
Additions to senior long-term debt
|
491,235
|
|
347,207
|
|
247,935
|
|
|||||
|
Repayment and retirement of senior long-term debt
|
(246,665
|
)
|
(157,359
|
)
|
—
|
|
|||||
|
Repurchases of common stock
|
(57,388
|
)
|
(16,873
|
)
|
(42,913
|
)
|
|||||
|
Issuance of common stock
|
24,518
|
|
9,145
|
|
1,182
|
|
|||||
|
Other
|
(5,023
|
)
|
436
|
|
50
|
|
|||||
|
Net Cash Provided By Financing Activities
|
206,677
|
|
182,556
|
|
206,254
|
|
|||||
|
Increase (decrease) in cash and cash equivalents
|
(30,464
|
)
|
(42,788
|
)
|
98,648
|
|
|||||
|
Cash and cash equivalents at beginning of year
|
237,816
|
|
280,604
|
|
181,956
|
|
|||||
|
CASH AND CASH EQUIVALENTS AT END OF YEAR
|
$
|
207,352
|
|
$
|
237,816
|
|
$
|
280,604
|
|
||
83
24. Quarterly Financial Information (unaudited)
The following table presents the unaudited quarterly results of consolidated operations for
2013
,
2012
and
2011
.
|
Quarters Ended
|
|||||||||||||||
|
(dollars in thousands, except per share amounts)
|
Mar. 31
|
June 30
|
Sept. 30
|
Dec. 31
|
|||||||||||
|
2013
|
|||||||||||||||
|
Operating revenues
|
$
|
819,864
|
|
$
|
1,031,769
|
|
$
|
1,191,665
|
|
$
|
1,279,785
|
|
|||
|
Net income
|
89,263
|
|
28,676
|
|
66,967
|
|
98,939
|
|
|||||||
|
Net income to shareholders
|
88,902
|
|
27,756
|
|
65,599
|
|
98,764
|
|
|||||||
|
Comprehensive income (loss) to shareholders
|
257,684
|
|
(149,054
|
)
|
144,409
|
|
206,450
|
|
|||||||
|
Net income per share:
|
|||||||||||||||
|
Basic
|
$
|
9.53
|
|
$
|
2.24
|
|
$
|
4.69
|
|
$
|
6.98
|
|
|||
|
Diluted
|
9.50
|
|
2.24
|
|
4.67
|
|
6.95
|
|
|||||||
|
Common stock price ranges:
|
|||||||||||||||
|
High
|
$
|
510.05
|
|
$
|
546.94
|
|
$
|
549.09
|
|
$
|
582.59
|
|
|||
|
Low
|
434.98
|
|
501.76
|
|
506.64
|
|
511.06
|
|
|||||||
|
2012
|
|||||||||||||||
|
Operating revenues
|
$
|
733,135
|
|
$
|
693,247
|
|
$
|
765,775
|
|
$
|
807,955
|
|
|||
|
Net income
|
57,713
|
|
90,768
|
|
51,674
|
|
58,093
|
|
|||||||
|
Net income to shareholders
|
57,253
|
|
89,687
|
|
49,653
|
|
56,792
|
|
|||||||
|
Comprehensive income to shareholders
|
205,945
|
|
73,416
|
|
147,454
|
|
76,987
|
|
|||||||
|
Net income per share:
|
|||||||||||||||
|
Basic
|
$
|
5.94
|
|
$
|
8.44
|
|
$
|
5.33
|
|
$
|
6.25
|
|
|||
|
Diluted
|
5.92
|
|
8.42
|
|
5.32
|
|
6.23
|
|
|||||||
|
Common stock price ranges:
|
|||||||||||||||
|
High
|
$
|
451.90
|
|
$
|
453.50
|
|
$
|
459.90
|
|
$
|
502.20
|
|
|||
|
Low
|
398.65
|
|
421.00
|
|
420.00
|
|
425.17
|
|
|||||||
|
2011
|
|||||||||||||||
|
Operating revenues
|
$
|
621,594
|
|
$
|
647,168
|
|
$
|
676,088
|
|
$
|
685,100
|
|
|||
|
Net income
|
9,861
|
|
31,649
|
|
54,669
|
|
52,307
|
|
|||||||
|
Net income to shareholders
|
8,272
|
|
30,314
|
|
53,264
|
|
50,176
|
|
|||||||
|
Comprehensive income (loss) to shareholders
|
24,738
|
|
96,045
|
|
(52,626
|
)
|
183,696
|
|
|||||||
|
Net income per share:
|
|||||||||||||||
|
Basic
|
$
|
0.85
|
|
$
|
3.12
|
|
$
|
5.50
|
|
$
|
5.21
|
|
|||
|
Diluted
|
0.85
|
|
3.11
|
|
5.48
|
|
5.19
|
|
|||||||
|
Common stock price ranges:
|
|||||||||||||||
|
High
|
$
|
422.83
|
|
$
|
430.26
|
|
$
|
403.21
|
|
$
|
419.10
|
|
|||
|
Low
|
379.44
|
|
386.81
|
|
346.15
|
|
337.50
|
|
|||||||
84
REPORT OF INDEPENDENT REGISTERED PUBLIC ACCOUNTING FIRM

The Board of Directors and Shareholders
Markel Corporation:
We have audited the accompanying consolidated balance sheets of Markel Corporation and subsidiaries (the Company) as of
December 31, 2013
and
2012
, and the related consolidated statements of income and comprehensive income, changes in equity, and cash flows for each of the years in the three-year period ended
December 31, 2013
. These consolidated financial statements are the responsibility of the Company's management. Our responsibility is to express an opinion on these consolidated financial statements based on our audits.
We conducted our audits in accordance with the standards of the Public Company Accounting Oversight Board (United States). Those standards require that we plan and perform the audit to obtain reasonable assurance about whether the financial statements are free of material misstatement. An audit includes examining, on a test basis, evidence supporting the amounts and disclosures in the financial statements. An audit also includes assessing the accounting principles used and significant estimates made by management, as well as evaluating the overall financial statement presentation. We believe that our audits provide a reasonable basis for our opinion.
In our opinion, the consolidated financial statements referred to above present fairly, in all material respects, the financial position of Markel Corporation and subsidiaries as of
December 31, 2013
and
2012
, and the results of their operations and their cash flows for each of the years in the three-year period ended
December 31, 2013
, in conformity with U.S. generally accepted accounting principles.
The Company prospectively adopted Financial Accounting Standards Board Accounting Standards Update 2010-26 related to the deferral of insurance policy acquisition costs incurred on new or renewal insurance contracts on January 1, 2012.
We also have audited, in accordance with the standards of the Public Company Accounting Oversight Board (United States), Markel Corporation's internal control over financial reporting as of
December 31, 2013
, based on criteria established in
Internal Control—Integrated Framework (1992)
issued by the Committee of Sponsoring Organizations of the Treadway Commission (COSO), and our report dated
February 28, 2014
expressed an unqualified opinion on the effectiveness of the Company's internal control over financial reporting.

Richmond, Virginia
February 28, 2014
85
REPORT OF INDEPENDENT REGISTERED PUBLIC ACCOUNTING FIRM
The Board of Directors and Shareholders
Markel Corporation:
We have audited Markel Corporation's (the Company) internal control over financial reporting as of
December 31, 2013
, based on criteria established in
Internal Control—Integrated Framework (1992)
issued by the Committee of Sponsoring Organizations of the Treadway Commission (COSO). The Company's management is responsible for maintaining effective internal control over financial reporting and for its assessment of the effectiveness of internal control over financial reporting, included in the accompanying
Management's Report on Internal Control over Financial Reporting.
Our responsibility is to express an opinion on the Company's internal control over financial reporting based on our audit.
We conducted our audit in accordance with the standards of the Public Company Accounting Oversight Board (United States). Those standards require that we plan and perform the audit to obtain reasonable assurance about whether effective internal control over financial reporting was maintained in all material respects. Our audit included obtaining an understanding of internal control over financial reporting, assessing the risk that a material weakness exists, and testing and evaluating the design and operating effectiveness of internal control based on the assessed risk. Our audit also included performing such other procedures as we considered necessary in the circumstances. We believe that our audit provides a reasonable basis for our opinion.
A company's internal control over financial reporting is a process designed to provide reasonable assurance regarding the reliability of financial reporting and the preparation of financial statements for external purposes in accordance with generally accepted accounting principles. A company's internal control over financial reporting includes those policies and procedures that (1) pertain to the maintenance of records that, in reasonable detail, accurately and fairly reflect the transactions and dispositions of the assets of the company; (2) provide reasonable assurance that transactions are recorded as necessary to permit preparation of financial statements in accordance with generally accepted accounting principles, and that receipts and expenditures of the company are being made only in accordance with authorizations of management and directors of the company; and (3) provide reasonable assurance regarding prevention or timely detection of unauthorized acquisition, use, or disposition of the company's assets that could have a material effect on the financial statements.
Because of its inherent limitations, internal control over financial reporting may not prevent or detect misstatements. Also, projections of any evaluation of effectiveness to future periods are subject to the risk that controls may become inadequate because of changes in conditions, or that the degree of compliance with the policies or procedures may deteriorate.
In our opinion, Markel Corporation maintained, in all material respects, effective internal control over financial reporting as of
December 31, 2013
, based on criteria established in
Internal Control—Integrated Framework (1992)
issued by the Committee of Sponsoring Organizations of the Treadway Commission (COSO).
We also have audited, in accordance with the standards of the Public Company Accounting Oversight Board (United States), the consolidated balance sheets of Markel Corporation and subsidiaries as of
December 31, 2013
and
2012
, and the related consolidated statements of income and comprehensive income, changes in equity, and cash flows for each of the years in the three-year period ended
December 31, 2013
, and our report dated
February 28, 2014
expressed an unqualified opinion on those consolidated financial statements.
Richmond, Virginia
February 28, 2014
86
MANAGEMENT'S REPORT ON INTERNAL CONTROL OVER FINANCIAL REPORTING

Management is responsible for establishing and maintaining adequate internal control over financial reporting, as defined in Rule 13a-15(f) under the Securities Exchange Act of 1934. Our internal control over financial reporting is a process designed to provide reasonable assurance regarding the reliability of financial reporting and the preparation of financial statements for external purposes in accordance with generally accepted accounting principles.
Management does not expect that its internal control over financial reporting will prevent all error and all fraud. A control system, no matter how well conceived and operated, can provide only reasonable, not absolute, assurance that the objectives of the control system are met. Internal control over financial reporting is a process that involves human diligence and compliance and is subject to lapses in judgment and breakdowns resulting from human failures. Because of the inherent limitations in all control systems, no evaluation of controls can provide absolute assurance that all control issues and instances of fraud, if any, have been detected. The design of any system of internal control over financial reporting also is based in part upon certain assumptions about the likelihood of future events, and there can be no assurance that any design will succeed in achieving its stated goals under all potential future conditions.
Under the supervision and with the participation of management, including the Chief Executive Officer and the Chief Financial Officer, we evaluated the effectiveness of our internal control over financial reporting as of
December 31, 2013
, based on criteria established in
Internal Control—Integrated Framework (1992)
issued by the Committee of Sponsoring Organizations of the Treadway Commission. Based on our evaluation, we have concluded that we maintained effective internal control over financial reporting as of
December 31, 2013
.
KPMG LLP, our independent registered public accounting firm, has issued an attestation report on the effectiveness of the Company's internal control over financial reporting, which is included herein.

|

|
|||
|
Alan I. Kirshner
|
Anne G. Waleski
|
|||
|
Chief Executive Officer
|
Chief Financial Officer
|
|||
|
February 28, 2014
|
||||
87
MANAGEMENT'S DISCUSSION & ANALYSIS OF FINANCIAL CONDITION AND RESULTS OF OPERATIONS
Critical Accounting Estimates
The accompanying consolidated financial statements and related notes have been prepared in accordance with U.S. generally accepted accounting principles (U.S. GAAP) and include the accounts of Markel Corporation and its subsidiaries. For a discussion of our significant accounting policies, see note 1 of the notes to consolidated financial statements.
Critical accounting estimates are those estimates that both are important to the portrayal of our financial condition and results of operations and require us to exercise significant judgment. The preparation of financial statements in accordance with U.S. GAAP requires us to make estimates and assumptions that affect the reported amounts of assets, liabilities, revenues and expenses and the disclosure of material contingent assets and liabilities, including litigation contingencies. These estimates, by necessity, are based on assumptions about numerous factors.
We review the following critical accounting estimates and assumptions quarterly: evaluating the adequacy of reserves for unpaid losses and loss adjustment expenses, life and annuity reinsurance benefit reserves, the reinsurance allowance for doubtful accounts and income tax liabilities, as well as analyzing the recoverability of deferred tax assets, estimating reinsurance premiums written and earned and evaluating the investment portfolio for other-than-temporary declines in estimated fair value. Critical accounting estimates and assumptions for goodwill and intangible assets are reviewed in conjunction with an acquisition and goodwill and indefinite-lived intangible assets are reassessed at least annually for impairment. Actual results may differ materially from the estimates and assumptions used in preparing the consolidated financial statements.
Unpaid Losses and Loss Adjustment Expenses
Our consolidated balance sheet included estimated unpaid losses and loss adjustment expenses of
$10.3 billion
and reinsurance recoverable on unpaid losses of
$1.9 billion
at
December 31, 2013
compared to
$5.4 billion
and
$778.8 million
, respectively, at
December 31, 2012
. We do not discount our reserves for losses and loss adjustment expenses to reflect estimated present value, except for reserves assumed in connection with an acquisition, which are recorded at fair value at the acquisition date.
We accrue liabilities for unpaid losses and loss adjustment expenses based upon estimates of the ultimate amounts payable. We maintain reserves for specific claims incurred and reported (case reserves) and reserves for claims incurred but not reported (IBNR reserves).
Reported claims are in various stages of the settlement process, and the corresponding reserves for reported claims are based upon all information available to us. Case reserves consider our estimate of the ultimate cost to settle the claims, including investigation and defense of lawsuits resulting from the claims, and may be subject to adjustment for differences between costs originally estimated and costs subsequently re-estimated or incurred. Claims are settled based upon their merits, and some claims may take years to settle, especially if legal action is involved.
For our insurance operations, we are generally notified of insured losses by our insureds or their brokers. Based on this information, we establish case reserves by estimating the expected ultimate losses from the claim (including any administrative costs associated with settling the claim). Our claims personnel use their knowledge of the specific claim along with internal and external experts, including underwriters, actuaries and legal counsel, to estimate the expected ultimate losses.
For our reinsurance operations, case reserves are generally established based on reports received from ceding companies or their brokers. For excess of loss contracts, we are typically notified of insurance losses on specific contracts and record a case reserve for the estimated expected ultimate losses from the claim. For proportional contracts, we typically receive aggregated claims information and record a case reserve based on that information. As with insurance business, we evaluate this information and estimate the expected ultimate losses.
As of any balance sheet date, all claims have not yet been reported, and some claims may not be reported for many years. As a result, the liability for unpaid losses and loss adjustment expenses includes significant estimates for incurred but not reported claims.
88
There is normally a time lag between when a loss event occurs and when it is actually reported to us. The actuarial methods that we use to estimate losses have been designed to address the lag in loss reporting as well as the delay in obtaining information that would allow us to more accurately estimate future payments. There is also often a time lag between cedents establishing case reserves and re-estimating their reserves, and notifying us of the new or revised case reserves. As a result, the reporting lag is more pronounced in our reinsurance contracts than in our insurance contracts due to the reliance on insurers to report their claims to us. On reinsurance transactions, the reporting lag will generally be 60 to 90 days after the end of a reporting period, but can be longer in some cases. Based on the experience of our actuaries and management, we select loss development factors and trending techniques to mitigate the problems caused by reporting lags. We regularly evaluate and update our loss development and trending factor selections using cedent specific and industry data.
U.S. GAAP requires that IBNR reserves be based on the estimated ultimate cost of settling claims, including the effects of inflation and other social and economic factors, using past experience adjusted for current trends and any other factors that would modify past experience. IBNR reserves are generally calculated by subtracting paid losses and case reserves from estimated ultimate losses. IBNR reserves were 64% of total unpaid losses and loss adjustment expenses at
December 31, 2013
compared to 61% at
December 31, 2012
.
Our liabilities for unpaid losses and loss adjustment expenses can generally be categorized into two distinct groups, short-tail business and long-tail business. Short-tail business refers to lines of business, such as property, accident and health, automobile, watercraft and marine hull exposures for which losses are usually known and paid shortly after the loss actually occurs. Long-tail business describes lines of business for which specific losses may not be known and reported for some period and losses take much longer to emerge. Given the time frame over which long-tail exposures are ultimately settled, there is greater uncertainty and volatility in these lines than in short-tail lines of business. Our long-tail coverages consist of most casualty lines, including professional liability, directors' and officers' liability, products liability, general and excess liability and excess and umbrella exposures, as well as workers' compensation insurance. Some factors that contribute to the uncertainty and volatility of long-tail casualty programs, and thus require a significant degree of judgment in the reserving process, include the inherent uncertainty as to the length of reporting and payment development patterns, the possibility of judicial interpretations or legislative changes, including changes in workers' compensation benefit laws, that might impact future loss experience relative to prior loss experience and the potential lack of comparability of the underlying data used in performing loss reserve analyses.
Our ultimate liability may be greater or less than current reserves. Changes in our estimated ultimate liability for loss reserves generally occur as a result of the emergence of unanticipated loss activity, the completion of specific actuarial or claims studies or changes in internal or external factors. We closely monitor new information on reported claims and use statistical analyses prepared by our actuaries to evaluate the adequacy of our recorded reserves. We are required to exercise considerable judgment when assessing the relative credibility of loss development trends. Our philosophy is to establish loss reserves that are more likely redundant than deficient. This means that we seek to establish loss reserves that will ultimately prove to be adequate. As a result, if new information or trends indicate an increase in frequency or severity of claims in excess of what we initially anticipated, we generally respond quickly and increase loss reserves. If, however, frequency or severity trends are more favorable than initially anticipated, we often wait to reduce our loss reserves until we can evaluate experience in additional periods to confirm the credibility of the trend. In addition, for long-tail lines of business, trends develop over longer periods of time, and as a result, we give credibility to these trends more slowly than for short-tail or less volatile lines of business.
Each quarter, our actuaries prepare estimates of the ultimate liability for unpaid losses and loss adjustment expenses based on established actuarial methods. Management reviews these estimates, supplements the actuarial analyses with information provided by claims, underwriting and other operational personnel and determines its best estimate of loss reserves, which is recorded in our financial statements. Our procedures for determining the adequacy of loss reserves at the end of the year are substantially similar to the procedures applied at the end of each interim period.
Additionally, once a year, generally during the third quarter, we conduct a detailed review of our liability for unpaid losses and loss adjustment expenses for asbestos and environmental (A&E) claims. If there is significant development on A&E claims in advance of the annual review, such development is considered by our actuaries and by management as part of our quarterly review process. We consider a detailed annual review appropriate because A&E claims develop slowly, are typically reported and paid many years after the loss event occurs and, historically, have exhibited a high degree of variability.
Any adjustments resulting from our interim or year-end reviews, including changes in estimates, are recorded as a component of losses and loss adjustment expenses in the period of the change. Reserve changes that increase previous estimates of ultimate claims cost are referred to as unfavorable or adverse development, deficiencies or reserve strengthening. Reserve changes that decrease previous estimates of ultimate claims cost are referred to as favorable development or redundancies.
89
In establishing our liabilities for unpaid losses and loss adjustment expenses, our actuaries estimate an ultimate loss ratio, by accident year, for each of our product lines with input from our underwriting and claims associates. In estimating an ultimate loss ratio for a particular line of business, our actuaries may use one or more actuarial reserving methods and select from these a single point estimate. To varying degrees, these methods include detailed statistical analysis of past claim reporting, settlement activity, claim frequency and severity, policyholder loss experience, industry loss experience and changes in market conditions, policy forms and exposures. The actuarial methods we use include:
Initial Expected Loss Ratio Method –
This method multiplies earned premiums by an expected loss ratio. The expected loss ratio is selected utilizing industry data, our historical data, frequency-severity and rate level forecasts and professional judgment.
Paid Loss Development –
This method uses historical loss payment patterns to estimate future loss payment patterns. Our actuaries use the historical loss patterns to develop factors that are applied to current paid loss amounts to calculate expected ultimate losses.
Incurred Loss Development –
This method uses historical loss reporting patterns to estimate future loss reporting patterns. Our actuaries use the historical loss patterns to develop factors that are applied to current reported losses to calculate expected ultimate losses.
Bornhuetter-Ferguson Paid Loss Development –
This method divides the projection of ultimate losses into the portion that has already been paid and the portion that has yet to be paid. The portion that has yet to be paid is estimated as the product of three amounts: the premium earned for the exposure period, the expected loss ratio and the percentage of ultimate losses that are still unpaid. The expected loss ratio is selected by considering historical loss ratios, adjusted for any known changes in pricing, loss trends, adequacy of case reserves, changes in administrative practices and other relevant factors.
Bornhuetter-Ferguson Incurred Loss Development –
This method is identical to the Bornhuetter-Ferguson paid loss development method, except that it uses the percentage of ultimate losses that are still unreported, instead of the percentage of ultimate losses that are still unpaid.
Frequency/Severity –
Under this method, expected ultimate losses are equal to the product of the expected ultimate number of claims and the expected ultimate average cost per claim. Our actuaries use historical reporting patterns and severity patterns to develop factors that are applied to the current reported amounts to calculate expected ultimate losses.
Outstanding to IBNR Ratio Method –
Under this method, IBNR is based on a detailed review of remaining open claims. This method assumes that the estimated future loss development is indicated by the current level of case reserves.
Each actuarial method has its own set of assumptions and its own strengths and limitations, with no one method being better than the others in all situations. Our actuaries select the reserving methods that they believe will produce the most reliable estimate for the class of business being evaluated. Greater judgment may be required when we introduce new product lines or when there have been changes in claims handling practices, as the statistical data available may be insufficient. In these instances, we may rely upon assumptions applied to similar lines of business, rely more heavily on industry experience, take into account changes in underwriting guidelines and risk selection or review the impact of changes in claims reserving practices with claims personnel.
For example, in January 2013, we acquired Essentia Insurance Company, a company that underwrites insurance exclusively for Hagerty Insurance Agency and Hagerty Classic Marine Insurance Agency (collectively, Hagerty). Hagerty offers liability and physical damage insurance for classic cars, vintage boats, motorcycles and related automotive collectibles. Because Markel had limited exposure to such risks in the past, it was necessary that we supplement our limited data and loss experience with third-party data. Working with Hagerty, we were able to obtain loss development triangles for the business Hagerty had underwritten with their previous carriers. Markel now aggregates that data with our own data for use in the pricing of and reserving for the Hagerty portfolio of business.
90
A key assumption in most actuarial analyses is that past development patterns will repeat themselves in the future, absent a significant change in internal or external factors that influence the ultimate cost of our unpaid losses and loss adjustment expenses. Our estimates reflect implicit and explicit assumptions regarding the potential effects of external factors, including economic and social inflation, judicial decisions, changes in law, general economic conditions and recent trends in these factors. Our actuarial analyses are based on statistical analysis but also consist of reviewing internal factors that are difficult to analyze statistically, including underwriting and claims handling changes. In some of our markets, and where we act as a reinsurer, the timing and amount of information reported about underlying claims are in the control of third parties. This can also affect estimates and require re-estimation as new information becomes available.
As indicated above, we may use one or more actuarial reserving methods, which incorporate numerous underlying judgments and assumptions, to establish our estimate of ultimate loss reserves. While we use our best judgment in establishing our estimate for loss reserves, applying different assumptions and variables could lead to significantly different loss reserve estimates.
Loss frequency and loss severity are two key measures of loss activity that often result in adjustments to actuarial assumptions relative to ultimate loss reserve estimates. Loss frequency measures the number of claims per unit of insured exposure. When the number of newly reported claims is higher than anticipated, generally speaking, loss reserves are increased. Conversely, loss reserves are generally decreased when fewer claims are reported than expected. Loss severity measures the average size of a claim. When the average severity of reported claims is higher than originally estimated, loss reserves are typically increased. When the average claim size is lower than anticipated, loss reserves are typically decreased. For example, in each of the past three years, we have experienced redundancies on prior years' loss reserves in our professional and products liability lines as a result of decreases in loss severity, while over the past two years we have experienced deficiencies on prior years' loss reserves related to our A&E exposures as a result of increases in loss severity.
Changes in prior years' loss reserves, including the trends and factors that impacted loss reserve development, as well as the likelihood that such trends and factors could result in future loss reserve development, are discussed in further detail under "Results of Operations."
Loss reserves are established at management's best estimate, which is generally higher than the corresponding actuarially calculated point estimate. The actuarial point estimate represents our actuaries' estimate of the most likely amount that will ultimately be paid to settle the loss reserves we have recorded at a particular point in time; however, there is inherent uncertainty in the point estimate as it is the expected value in a range of possible reserve estimates. In some cases, actuarial analyses, which are based on statistical analysis, cannot fully incorporate all of the subjective factors that affect development of losses. In other cases, management's perspective of these more subjective factors may differ from the actuarial perspective. Subjective factors where management's perspective may differ from that of the actuaries include: the credibility and timeliness of claims information received from third parties, economic and social inflation, judicial decisions, changes in law, changes in underwriting or claims handling practices, general economic conditions, the risk of moral hazard and other current and developing trends within the insurance and reinsurance markets, including the effects of competition. As a result, the actuarially calculated point estimates for each of our lines of business represent starting points for management's quarterly review of loss reserves.
In management's opinion, the actuarially calculated point estimate generally underestimates both the ultimate favorable impact of a hard insurance market and the ultimate adverse impact of a soft insurance market. Therefore, the percentage by which management's best estimate exceeds the actuarial point estimate will generally be higher during a soft market than during a hard market. Management's best estimate of net reserves for unpaid losses and loss adjustment expenses exceeded the actuarially calculated point estimate by $591 million, or 7.7%, at
December 31, 2013
, compared to $368 million, or 8.7%, at
December 31, 2012
. The decrease in the percentage of management's best estimate over the actuarially calculated point estimate is attributable to net reserves for unpaid losses and loss adjustment expenses held by the Alterra segment. The percentage by which management's best estimate exceeded the actuarially calculated point estimate was lower for loss reserves held by the Alterra segment than our historical carried reserves. Although we believe the loss reserves recorded in connection with the acquisition of Alterra Capital Holdings Limited (Alterra) were adequate, we will build the post-acquisition loss reserves until total reserves are consistent with our target level of confidence.
91
The difference between management's best estimate and the actuarially calculated point estimate in both 2013 and 2012 is primarily associated with our long-tail business, which includes a significant portion of the business acquired as part of the Alterra acquisition in May 2013. Actuarial estimates can underestimate the adverse effects of a soft insurance market because the impact of changes in risk selection and terms and conditions can be difficult to quantify. In addition, the frequency of claims may increase in a recessionary environment. Similarly, the risk an insured will intentionally cause or be indifferent to loss may increase during an economic downturn, and the attention to loss prevention measures may decrease. These subjective factors affect the development of losses and represent instances where management's perspectives may differ from those of our actuaries. As a result, management has attributed less credibility than our actuaries to favorable trends experienced on our long-tail business from the earlier soft
market period and has not incorporated these favorable trends into its best estimate to the same extent as the actuaries.
Management also considers the range, or variability, of reasonably possible losses determined by our actuaries when establishing its best estimate for loss reserves. The actuarial ranges represent our actuaries' estimate of a likely lowest amount and highest amount that will ultimately be paid to settle the loss reserves we have recorded at a particular point in time. The range determinations are based on estimates and actuarial judgments and are intended to encompass reasonably likely changes in one or more of the factors that were used to determine the point estimates. Using statistical models, our actuaries establish high and low ends of a range of reasonable reserve estimates for each of our operating segments.
The following table summarizes our reserves for net unpaid losses and loss adjustment expenses and the actuarially established high and low ends of a range of reasonable reserve estimates, by segment, at
December 31, 2013
.
|
(dollars in millions)
|
Net Loss
Reserves Held
|
Low End of
Actuarial
Range
(1)
|
High End of
Actuarial
Range
(1)
|
||||||||
|
Excess and Surplus Lines
|
$
|
1,747.8
|
|
$
|
1,456.1
|
|
$
|
1,929.2
|
|
||
|
Specialty Admitted
|
811.4
|
|
703.0
|
|
854.8
|
|
|||||
|
London Insurance Market
|
1,629.7
|
|
1,288.7
|
|
1,755.1
|
|
|||||
|
Alterra
(2)
|
3,688.4
|
|
2,776.0
|
|
4,560.4
|
|
|||||
|
Other Insurance (Discontinued Lines)
|
393.9
|
|
209.5
|
|
1,043.4
|
|
|||||
|
(1)
|
Due to the actuarial methods used to determine the separate ranges for each segment of our business, it is not appropriate to aggregate the high or low ends of the separate ranges to determine the high and low ends of the actuarial range on a consolidated basis.
|
|
(2)
|
As described in note 2 of the notes to consolidated financial statements, unpaid losses and loss adjustment expenses attributable to Alterra were recorded at fair value as of May 1, 2013 (the Acquisition Date), which consists of the present value of the expected net loss and loss adjustment expense payments plus a risk premium. The net loss reserves held in the Alterra segment as presented in this table represent our estimated future payments for losses and loss adjustment expenses, whereas the reserves for unpaid losses and loss adjustment expenses included in the consolidated balance sheet include the unamortized portion of the fair value adjustment recorded at the Acquisition Date.
|
Undue reliance should not be placed on these ranges of estimates as they are only one of many points of reference used by management to determine its best estimate of ultimate losses. Further, actuarial ranges may not be a true reflection of the potential variability between loss reserves estimated at the balance sheet date and the ultimate cost of settling claims. Actuarial ranges are developed based on known events as of the valuation date, while ultimate losses are subject to events and circumstances that are unknown as of the valuation date.
We place less reliance on the range established for our Other Insurance (Discontinued Lines) segment than on the ranges established for our other operating segments. The range established for our Other Insurance (Discontinued Lines) segment includes exposures related to acquired lines of business, many of which are no longer being written, that were not subject to our underwriting discipline and controls. Additionally, A&E exposures, which are subject to an uncertain and unfavorable legal environment, account for approximately 70% of the loss reserves considered in the range established for our Other Insurance (Discontinued Lines) segment.
Our exposure to A&E claims results from policies written by acquired insurance operations before their acquisitions. The exposure to A&E claims originated from umbrella, excess and commercial general liability (CGL) insurance policies and assumed reinsurance contracts that were written on an occurrence basis from the 1970s to mid-1980s. Exposure also originated from claims-made policies that were designed to cover environmental risks provided that all other terms and conditions of the policy were met. A&E claims include property damage and clean-up costs related to pollution, as well as personal injury allegedly arising from exposure to hazardous materials. After 1986, we began underwriting CGL coverage with pollution exclusions, and in some lines of business we began using a claims-made form. These changes significantly reduced our exposure to future A&E claims on post-1986 business.
92
There is significant judgment required in estimating the amount of our potential exposure from A&E claims due to the limited and variable historical data on A&E losses as compared to other types of claims, the potential significant reporting delays of claims from insureds to insurance companies and the continuing evolution of laws and judicial interpretations of those laws relative to A&E exposures. Due to these unique aspects of A&E exposures, the ultimate value of loss reserves for A&E claims cannot be estimated using traditional methods and is subject to greater uncertainty than other types of claims. Other factors contributing to the significant uncertainty in estimating A&E reserves include: uncertainty as to the number and identity of insureds with potential exposure; uncertainty as to the number of claims filed by exposed, but not ill, individuals; uncertainty as to the settlement values to be paid; difficulty in properly allocating responsibility and liability for the loss, especially if the claim involves multiple insurance providers or multiple policy periods; growth in the number and significance of bankruptcies of asbestos defendants; uncertainty as to the financial status of companies that insured or reinsured all or part of A&E claims; and inconsistent court decisions and interpretations with respect to underlying policy intent and coverage.
Due to these uncertainties, it is not possible to estimate our ultimate liability for A&E exposures with the same degree of reliability as with other types of exposures. Future development will be affected by the factors mentioned above and could have a material effect on our results of operations, cash flows and financial position. As of
December 31, 2013
, our consolidated balance sheet included estimated net reserves for A&E losses and loss adjustment expenses of
$272.2 million
. We seek to establish appropriate reserve levels for A&E exposures; however, these reserves could increase in the future. These reserves are not discounted to present value and are forecasted to pay out over the next 40 to 50 years.
Life and Annuity Benefits
Prior to its acquisition, Alterra entered into life and annuity reinsurance contracts which subject us to mortality, longevity and morbidity risks. The related reserves are compiled by our actuaries on a reinsurance contract-by-contract basis and are computed on a discounted basis using standard actuarial techniques and cash flow models. Since the development of our life and annuity reinsurance reserves is based upon cash flow projection models, we must make estimates and assumptions based on cedent experience, industry mortality tables, and expense and investment experience, including a provision for adverse deviation. The assumptions used to determine policy benefit reserves were determined as of the Acquisition Date and are generally locked-in for the life of the contract unless an unlocking event occurs. To the extent existing policy reserves, together with the present value of future gross premiums and expected investment income earned thereon, are not adequate to cover the present value of future benefits, settlement and maintenance costs, the locked-in assumptions are revised to current best estimate assumptions and a charge to earnings for life and annuity benefits is recognized at that time.
Because of the assumptions and estimates used in establishing reserves for life and annuity benefit obligations and the long-term nature of these reinsurance contracts, the ultimate liability may be greater or less than the estimates. The average discount rate for the life and annuity benefit reserves was
2.3%
as of
December 31, 2013
.
Reinsurance Premiums
Our assumed reinsurance premiums are recorded at the inception of each contract based upon contract terms and information received from cedents and brokers. For excess of loss contracts, the amount of minimum or deposit premium is usually contractually documented at inception, and variances between this premium and final premium are generally small. An adjustment is made to the minimum or deposit premium, when notified, if there are changes in underlying exposures insured. For quota share or proportional reinsurance contracts, gross premiums written are normally estimated at inception based on information provided by cedents or brokers. We generally record such premiums using the cedent's initial estimates, and then adjust them as more current information becomes available, with such adjustments recorded as premiums written in the period they are determined. We believe that the cedent's estimate of the volume of business they expect to cede to us usually represents the best estimate of gross premium written at the beginning of the contract. As the contract progresses, we monitor actual premium received in conjunction with correspondence from the cedent in order to refine our estimate. Variances from original premium estimates are normally greater for quota share contracts than excess of loss contracts. Premiums are earned on a pro rata basis over the coverage period, or for multi-year contracts, in proportion with the underlying risk exposure to the extent there is variability in the exposure throughout the coverage period. The impact of premium adjustments to net income may be mitigated by related acquisition costs and losses.
93
Certain contracts we write, particularly property catastrophe reinsurance contracts, provide for reinstatements of coverage. Reinstatement premiums are the premiums for the restoration of the reinsurance limit of a contract to its full amount after a loss occurrence by the reinsured. The purpose of optional and required reinstatements is to permit the reinsured to reinstate the reinsurance coverage at a pre-determined price level once a loss event has penetrated the reinsurance layer. In addition, required reinstatement premiums permit the reinsurer to obtain additional premiums to cover the additional loss limits provided.
We accrue for reinstatement premiums resulting from losses recorded. Such accruals are based upon contractual terms and the only element of management judgment involved is with respect to the amount of losses recorded. Changes in estimates of losses recorded on contracts with reinstatement premium features will result in changes in reinstatement premiums based on contractual terms. Reinstatement premiums are recognized at the time we record losses and are earned on a pro-rata basis over the coverage period.
Ceded Reinsurance Allowance for Doubtful Accounts
We evaluate and adjust reserves for uncollectible ceded reinsurance based upon our collection experience, the financial condition of our reinsurers, collateral held and the development of our gross loss reserves. Our consolidated balance sheets at
December 31, 2013
and
2012
included a reinsurance allowance for doubtful accounts of
$76.2 million
and
$71.1 million
, respectively.
Reinsurance recoverables recorded on insurance losses ceded under reinsurance contracts are subject to judgments and uncertainties similar to those involved in estimating gross loss reserves. In addition to these uncertainties, our reinsurance recoverables may prove uncollectible if the reinsurers are unable or unwilling to perform under the reinsurance contracts. In establishing our reinsurance allowance for amounts deemed uncollectible, we evaluate the financial condition of our reinsurers and monitor concentration of credit risk arising from our exposure to individual reinsurers. To determine if an allowance is necessary, we consider, among other factors, published financial information, reports from rating agencies, payment history, collateral held and our legal right to offset balances recoverable against balances we may owe. Our ceded reinsurance allowance for doubtful accounts is subject to uncertainty and volatility due to the time lag involved in collecting amounts recoverable from reinsurers. Over the period of time that losses occur, reinsurers are billed and amounts are ultimately collected, economic conditions, as well as the operational and financial performance of particular reinsurers, may change and these changes may affect the reinsurers' willingness and ability to meet their contractual obligation to us. It is also difficult to fully evaluate the impact of major catastrophic events on the financial stability of reinsurers, as well as the access to capital that reinsurers may have when such events occur. The ceding of insurance does not legally discharge us from our primary liability for the full amount of the policies, and we will be required to pay the loss and bear collection risk if the reinsurers fail to meet their obligations under the reinsurance contracts.
Income Taxes and Uncertain Tax Positions
The preparation of our consolidated income tax provision, including the evaluation of tax positions we have taken or expect to take on our income tax returns, requires significant judgment. In evaluating our tax positions, we recognize the tax benefit from an uncertain tax position only if, based on the technical merits of the position, it is more likely than not that the tax position will be sustained upon examination by the taxing authorities. Tax positions that meet the more likely than not threshold are then measured using a probability weighted approach, whereby the largest amount of tax benefit that is greater than 50% likely of being realized upon ultimate settlement is recognized. The tax positions that we have taken or expect to take are based upon the application of tax laws and regulations, which are subject to interpretation, judgment and uncertainty. As a result, our actual liability for income taxes may differ significantly from our estimates.
We record deferred income taxes as assets or liabilities on our consolidated balance sheets to reflect the net tax effect of the temporary differences between the carrying amounts of assets and liabilities for financial reporting purposes and their respective tax bases. At
December 31, 2013
our net deferred tax asset was
$103.7 million
compared to a net deferred tax liability of
$168.9 million
at
December 31, 2012
. The change in net deferred taxes in 2013 was largely due to a net deferred tax asset of
$310.1 million
recorded for Alterra as part of the initial purchase price allocation, partially offset by an increase in the deferred tax liability related to accumulated other comprehensive income resulting from an increase in net unrealized gains on investments. See note 2 of the notes to consolidated financial statements for a discussion of deferred taxes related to acquisition of Alterra.
94
Deferred tax assets are reduced by a valuation allowance when management believes it is more likely than not that some, or all, of the deferred tax assets will not be realized. We did not have a valuation allowance on our deferred tax assets at
December 31, 2013
or
2012
. In evaluating our ability to realize our deferred tax assets and assessing the need for a valuation allowance at
December 31, 2013
and
2012
, we made estimates regarding the future taxable income of our foreign subsidiaries and judgments about our ability to pursue prudent and feasible tax planning strategies. A change in any of these estimates and judgments could result in the need to record a valuation allowance through a charge to earnings. See note 8 of the notes to consolidated financial statements for further discussion of our consolidated income tax provision, uncertain tax positions and net operating losses.
Goodwill and Intangible Assets
Our consolidated balance sheet as of
December 31, 2013
included goodwill and intangible assets of approximately
$1.5 billion
. Goodwill and intangible assets are recorded as a result of business acquisitions. Goodwill represents the excess of the amount paid to acquire a business over the net fair value of assets acquired and liabilities assumed at the date of acquisition. Indefinite-lived and other intangible assets are recorded at fair value as of the acquisition date. The determination of the fair value of certain assets acquired and liabilities assumed involves significant judgment and the use of valuation models and other estimates, which require assumptions that are inherently subjective. Goodwill and indefinite-lived intangible assets are tested for impairment at least annually. Intangible assets with definite lives are reviewed for impairment when events or circumstances indicate that their carrying value may not be recoverable. We completed our annual test for impairment during the fourth quarter of
2013
based upon results of operations through September 30,
2013
. There were no impairment losses recorded during
2013
.
For some reporting units, we elected to assess qualitative factors (commonly referred to as "Step 0") to determine whether it is more likely than not that the fair value of a reporting unit is less than its carrying amount. This assessment serves as a basis for determining whether it is necessary to perform the two-step goodwill impairment test. For other reporting units, we elected to bypass Step 0 and perform Step 1 of the goodwill impairment test, which includes determining whether the carrying amount of a reporting unit, including goodwill, exceeds its estimated fair value. If the carrying amount exceeds its fair value, then Step 2 of the goodwill impairment test is performed by estimating the fair value of individual assets (including identifiable intangible assets) and liabilities of the reporting unit. The excess of the estimated fair value of the reporting unit over the estimated fair value of net assets would establish the implied value of goodwill. The excess of the recorded amount of goodwill over the implied value is charged to net income as an impairment loss.
A significant amount of judgment is required in performing goodwill impairment tests. When using the qualitative approach, we considered macroeconomic factors such as industry and market conditions. We also considered reporting unit-specific events, actual financial performance versus expectations and management's future business expectations. As part of our Step 0 evaluation of reporting units with material goodwill, we considered the fact that many of the businesses had been recently acquired in orderly transactions between market participants, and our purchase price represented fair value at acquisition. There were no events since acquisition which had a significant impact on the fair value of these reporting units. For reporting units which we tested quantitatively, we estimated fair value primarily using an income approach based on a discounted cash flow model. The cash flow projections used in the discounted cash flow model included management's best estimate of future growth and margins. The discount rates used to determine the fair value estimates were developed based on the capital asset pricing model using market-based inputs as well as an assessment of the inherent risk in projected future cash flows.
With the exception of the Markel Ventures Diamond Healthcare reporting unit, we believe the fair value of each of our reporting units exceeded their respective carrying amounts as of October 1,
2013
and December 31,
2013
. Additionally, we do not believe we are at risk of failing Step 1 at any of our reporting units with the result being a material impairment of goodwill.
However, as of October 1,
2013
and December 31,
2013
, we believe that the carrying value of the Diamond Healthcare reporting unit approximates fair value and we believe we are at risk of failing Step 1 at our Diamond Healthcare reporting unit in future periods. At December 31, 2013, goodwill associated with this reporting unit was approximately $29 million.
The Diamond Healthcare reporting unit provides for the planning, development and operation of behavioral health services in partnership with healthcare organizations. Our assessment of the risks associated with the Diamond Healthcare reporting unit includes general market conditions as well as uncertainties surrounding the impact of the Patient Protection and Affordable Care Act (the Act), particularly with regard to reimbursements from the Medicare and Medicaid programs, as well as the impact of the Act on the decision of healthcare providers to continue to offer behavioral healthcare services. We believe changes to these items could have an adverse impact on Diamond Healthcare's results of operations in future periods.
95
Investments
We complete a detailed analysis each quarter to assess whether the decline in the fair value of any investment below its cost basis is deemed other-than-temporary. All securities with unrealized losses are reviewed. For equity securities, a decline in fair value that is considered to be other-than-temporary is recognized in net income based on the fair value of the security at the time of assessment, resulting in a new cost basis for the security. For fixed maturities where we intend to sell the security or it is more likely than not that we will be required to sell the security before recovery of its amortized cost, a decline in fair value is considered to be other-than-temporary and is recognized in net income based on the fair value of the security at the time of assessment, resulting in a new cost basis for the security. If the decline in fair value of a fixed maturity below its amortized cost is considered to be other-than-temporary based upon other considerations, we compare the estimated present value of the cash flows expected to be collected to the amortized cost of the security. The extent to which the estimated present value of the cash flows expected to be collected is less than the amortized cost of the security represents the credit-related portion of the other-than-temporary impairment, which is recognized in net income, resulting in a new cost basis for the security. Any remaining decline in fair value represents the non-credit portion of the other-than-temporary impairment, which is recognized in other comprehensive income. The discount rate used to calculate the estimated present value of the cash flows expected to be collected is the effective interest rate implicit for the security at the date of purchase.
We consider many factors in completing our quarterly review of securities with unrealized losses for other-than-temporary impairment, including the length of time and the extent to which fair value has been below cost and the financial condition and near-term prospects of the issuer. For equity securities, the ability and intent to hold the security for a period of time sufficient to allow for any anticipated recovery is considered. For fixed maturities, we consider whether we intend to sell the security or if it is more likely than not that we will be required to sell the security before recovery, the implied yield-to-maturity, the credit quality of the issuer and the ability to recover all amounts outstanding when contractually due. When assessing whether we intend to sell a fixed maturity or if it is likely that we will be required to sell a fixed maturity before recovery of its amortized cost, we evaluate facts and circumstances including, but not limited to, decisions to reposition the investment portfolio, potential sales of investments to meet cash flow needs and potential sales of investments to capitalize on favorable pricing.
Risks and uncertainties are inherent in our other-than-temporary decline in fair value assessment methodology. The risks and uncertainties include, but are not limited to, incorrect or overly optimistic assumptions about the financial condition, liquidity or near-term prospects of an issuer, inadequacy of any underlying collateral, unfavorable changes in economic or social conditions and unfavorable changes in interest rates or credit ratings. Changes in any of these assumptions could result in charges to earnings in future periods.
Losses from write downs for other-than-temporary declines in the estimated fair value of investments, while potentially significant to net income, do not have an impact on our financial position. Since our investment securities are considered available-for-sale and are recorded at estimated fair value, unrealized losses on investments are already included in accumulated other comprehensive income. See note 3(b) of the notes to consolidated financial statements for further discussion of our assessment methodology for other-than-temporary declines in the estimated fair value of investments.
Our Business
The following discussion and analysis should be read in conjunction with Selected Financial Data, the consolidated financial statements and related notes and the discussion under Risk Factors, "Critical Accounting Estimates" and "Safe Harbor and Cautionary Statement."
We are a diverse financial holding company serving a variety of niche markets. Our principal business markets and underwrites specialty insurance products. We believe that our specialty product focus and niche market strategy enable us to develop expertise and specialized market knowledge. We seek to differentiate ourselves from competitors by our expertise, service, continuity and other value-based considerations. We historically competed in three segments of the specialty insurance marketplace: the Excess and Surplus Lines, the Specialty Admitted and the London Insurance Market segments. As a result of the acquisition of Alterra, we formed a new operating segment during the second quarter of 2013. The Alterra segment comprises all of the active property and casualty underwriting operations of the former Alterra companies. We also own interests in various industrial and service businesses that operate outside of the specialty insurance marketplace. Our financial goals are to earn consistent underwriting and operating profits and superior investment returns to build shareholder value.
96
Our Excess and Surplus Lines segment writes hard-to-place risks outside of the standard market, including catastrophe-exposed property, professional liability, products liability, general liability, commercial umbrella and other coverages tailored for unique exposures. Our Excess and Surplus Lines segment is comprised of five regions, and each regional office is responsible for serving the wholesale producers located in its region. Our regional teams focus on customer service and marketing, underwriting and distributing our insurance solutions and provide customers easy access to our products.
Our Specialty Admitted segment writes risks that, although unique and hard-to-place in the standard market, must remain with an admitted insurance company for marketing and regulatory reasons. Our underwriting units in this segment write specialty program insurance for well-defined niche markets, personal property and liability coverages and workers' compensation insurance. Our Specialty Admitted segment is comprised of three underwriting units: Specialty Programs, Personal Lines and Workers' Compensation. In January 2013, we acquired Essentia Insurance Company, a company that underwrites insurance exclusively for Hagerty throughout the United States. In January 2012, we acquired Thompson Insurance Enterprises, LLC (Thomco), a privately held program administrator that underwrites multi-line, industry-focused insurance programs that complement the Markel Specialty product offerings. Examples include social service organizations, senior living, childcare and fitness centers.
Our London Insurance Market segment writes specialty property, casualty, professional liability, equine, marine, energy and trade credit insurance and reinsurance on a worldwide basis. We participate in the London market in part through Markel International, which includes Markel Capital Limited and Markel International Insurance Company Limited (MIICL), wholly-owned subsidiaries. Markel Capital Limited is the corporate capital provider for Markel Syndicate 3000 at Lloyd's of London (Lloyd's), which is managed by Markel Syndicate Management Limited, a wholly-owned subsidiary.
Our Alterra segment writes specialty insurance and reinsurance from offices worldwide. The Alterra segment's Lloyd's operations are conducted by Markel Syndicate Management through Lloyd's Syndicate 1400. Business written by the Alterra segment includes a wide range of commercial insurance and reinsurance products, including general and excess liability, property, accident and health, agriculture, auto, credit and surety, marine and energy, medical malpractice, professional liability and workers compensation coverages.
For purposes of segment reporting, the Other Insurance (Discontinued Lines) segment includes lines of business that have been discontinued prior to, or in conjunction with, acquisitions. The lines were discontinued because we believed some aspect of the product, such as risk profile or competitive environment, would not allow us to earn consistent underwriting profits. Alterra previously offered life and annuity reinsurance products. In 2010, Alterra ceased writing life and annuity reinsurance contracts and placed this business into run-off. Results attributable to the run-off of life and annuity reinsurance business are included in the Other Insurance (Discontinued Lines) segment. This segment also includes development on A&E loss reserves, none of which are related to the acquisition of Alterra.
A favorable insurance market is commonly referred to as a "hard market" within the insurance industry and is characterized by stricter coverage terms, higher prices and lower underwriting capacity. Periods of intense competition, which typically include broader coverage terms, lower prices and excess underwriting capacity, are referred to as a "soft market." We have experienced soft insurance market conditions including price deterioration in virtually all of our product lines since the mid-2000s. During 2011, unfavorable pricing trends continued for some of our product lines; however, price declines stabilized for most of our product lines, and we achieved moderate price increases in several lines. During 2012 and 2013, we have generally seen low to mid-single digit favorable rate changes in many of our product lines as market conditions improved and revenues, gross receipts and payrolls of our insureds were favorably impacted by improving economic conditions; however, during the fourth quarter of 2013, we began to experience softening prices on our catastrophe exposed property product lines and in our reinsurance book. Despite stabilization of prices on certain product lines during the most recent three years, we still consider the overall property and casualty market to be soft. We will continue to pursue price increases in 2014 when possible; however, when we believe the prevailing market price will not support our underwriting profit targets, the business is not written. As a result of our underwriting discipline, gross premium volume may vary when we alter our product offerings to maintain or improve underwriting profitability.
Through our wholly-owned subsidiary Markel Ventures, Inc. (Markel Ventures), we own interests in various industrial and service businesses that operate outside of the specialty insurance marketplace. These businesses are viewed by management as separate and distinct from our insurance operations and are comprised of a diverse portfolio of companies from different industries, including manufacturing, healthcare and business and financial services. Local management teams oversee the day-to-day operations of these companies, while strategic decisions are made in conjunction with members of our executive management team, principally our President and Chief Investment Officer. The financial results of those companies in which we own controlling interests have been consolidated in our financial statements. The financial results of those companies in which we hold a noncontrolling interest are accounted for under the equity method of accounting.
97
Our strategy in making these private equity investments is similar to our strategy for purchasing equity securities. We seek to invest in profitable companies, with honest and talented management, that exhibit reinvestment opportunities and capital discipline, at reasonable prices. We intend to own the businesses acquired for a long period of time.
On January 17, 2014, we completed the acquisition of
100%
of the issued and to be issued share capital of Abbey Protection plc (Abbey), an integrated specialty insurance and consultancy group headquartered in London. Abbey's business is focused on the underwriting and sale of insurance products to small and medium-sized enterprises and affinity groups in the United Kingdom providing protection against legal expenses and professional fees incurred as a result of legal actions or investigations by tax authorities, as well as providing a range of complementary legal, professional and reinsurance services.
Total consideration for this acquisition was
$190.0 million
. The purchase price allocation for Abbey will be completed in the first quarter of 2014.
Beginning in 2014, we will monitor and report our ongoing underwriting operations in the following three segments: U.S. Insurance, International Insurance and Global Reinsurance. The U.S. Insurance segment will include all direct business and facultative placements written by our insurance subsidiaries domiciled in the United States. The International Insurance segment will include all direct business and facultative placements written by our insurance subsidiaries domiciled outside of the United States, including our syndicates at Lloyd's. The Global Reinsurance segment will include all treaty reinsurance written across the Company. Results for lines of business discontinued prior to, or in conjunction with, acquisitions will continue to be reported as the Other Insurance (Discontinued Lines) segment.
For further discussion of our lines of business, principal products offered, distribution channels, competition, underwriting philosophy and our Markel Ventures operations, see the discussion under Business Overview.
Key Performance Indicators
We measure financial success by our ability to compound growth in book value per share at a high rate of return over a long period of time. To mitigate the effects of short-term volatility, we measure ourselves over a five-year period. We believe that growth in book value per share is the most comprehensive measure of our success because it includes all underwriting and investing results. We measure underwriting results by our underwriting profit or loss and combined ratio. We measure investing results by our taxable equivalent total investment return. These measures are discussed in greater detail under "Results of Operations."
Results of Operations
The following table presents the components of net income to shareholders.
|
Years Ended December 31,
|
|||||||||||
|
(dollars in thousands)
|
2013
|
2012
|
2011
|
||||||||
|
Underwriting profit (loss)
|
$
|
103,031
|
|
$
|
63,588
|
|
$
|
(40,825
|
)
|
||
|
Net investment income
|
317,373
|
|
282,107
|
|
263,676
|
|
|||||
|
Net realized investment gains
|
63,152
|
|
31,593
|
|
35,857
|
|
|||||
|
Other revenues
|
710,942
|
|
539,284
|
|
351,077
|
|
|||||
|
Amortization of intangible assets
|
(55,223
|
)
|
(33,512
|
)
|
(24,291
|
)
|
|||||
|
Other expenses
|
(663,528
|
)
|
(478,248
|
)
|
(309,046
|
)
|
|||||
|
Interest expense
|
(114,004
|
)
|
(92,762
|
)
|
(86,252
|
)
|
|||||
|
Income tax expense
|
(77,898
|
)
|
(53,802
|
)
|
(41,710
|
)
|
|||||
|
Net income attributable to noncontrolling interests
|
(2,824
|
)
|
(4,863
|
)
|
(6,460
|
)
|
|||||
|
Net income to shareholders
|
$
|
281,021
|
|
$
|
253,385
|
|
$
|
142,026
|
|
||
98
Net income to shareholders increased 11% from
2012
to
2013
due to more favorable underwriting results and higher investment income in 2013, partially offset by higher income tax expense compared to 2012. Net income to shareholders
increased 78% from
2011
to
2012
primarily due to unfavorable underwriting results in 2011, which were driven by higher losses from natural catastrophes in 2011 compared to 2012. The components of net income to shareholders are discussed in further detail under "Underwriting Results," "Investing Results," "Markel Ventures Operations" and "Interest Expense and Income Taxes."
Underwriting Results
Underwriting profits are a key component of our strategy to grow book value per share. We believe that the ability to achieve consistent underwriting profits demonstrates knowledge and expertise, commitment to superior customer service and the ability to manage insurance risk. The property and casualty insurance industry commonly defines underwriting profit or loss as earned premiums net of losses and loss adjustment expenses and underwriting, acquisition and insurance expenses. We use underwriting profit or loss as a basis for evaluating our underwriting performance.
The following table presents selected data from our underwriting operations.
|
Years Ended December 31,
|
||||||||||||
|
(dollars in thousands)
|
2013
|
2012
|
2011
|
|||||||||
|
Gross premium volume
|
$
|
3,920,226
|
|
$
|
2,513,681
|
|
$
|
2,291,251
|
|
|||
|
Net written premiums
|
$
|
3,236,683
|
|
$
|
2,214,126
|
|
$
|
2,041,838
|
|
|||
|
Net retention
|
83
|
%
|
88
|
%
|
89
|
%
|
||||||
|
Earned premiums
|
$
|
3,231,616
|
|
$
|
2,147,128
|
|
$
|
1,979,340
|
|
|||
|
Losses and loss adjustment expenses
|
$
|
1,816,273
|
|
$
|
1,154,068
|
|
$
|
1,209,986
|
|
|||
|
Underwriting, acquisition and insurance expenses
|
$
|
1,312,312
|
|
$
|
929,472
|
|
$
|
810,179
|
|
|||
|
Underwriting profit (loss)
|
$
|
103,031
|
|
$
|
63,588
|
|
$
|
(40,825
|
)
|
|||
|
U.S. GAAP Combined Ratios
(1)
|
||||||||||||
|
Excess and Surplus Lines
|
80
|
%
|
94
|
%
|
86
|
%
|
||||||
|
Specialty Admitted
|
97
|
%
|
108
|
%
|
109
|
%
|
||||||
|
London Insurance Market
|
88
|
%
|
89
|
%
|
116
|
%
|
||||||
|
Alterra
|
118
|
%
|
—
|
%
|
—
|
%
|
||||||
|
Other Insurance (Discontinued Lines)
|
NM
|
|
(2)
|
NM
|
|
(2)
|
NM
|
|
(2)
|
|||
|
Markel Corporation (Consolidated)
|
97
|
%
|
97
|
%
|
102
|
%
|
||||||
|
(1)
|
The U.S. GAAP combined ratio is a measure of underwriting performance and represents the relationship of incurred losses, loss adjustment expenses and underwriting, acquisition and insurance expenses to earned premiums. A combined ratio less than 100% indicates an underwriting profit, while a combined ratio greater than 100% reflects an underwriting loss.
|
|
(2)
|
NM—Ratio is not meaningful. Further discussion of Other Insurance (Discontinued Lines) underwriting loss follows.
|
The consolidated combined ratio was flat from 2012 to 2013, as a lower current accident year loss ratio and lower expense ratio were offset by a less favorable prior accident years' loss ratio compared to 2012.
The decrease in the consolidated current accident year loss ratio in 2013 was due in part to the impact of catastrophes in 2012 and improved underwriting results within our Specialty Admitted segment in 2013 compared to 2012, partially offset by an unfavorable impact from the Alterra segment's current year losses. The 2012 combined ratio included $107.4 million, or five points, of underwriting loss from Hurricane Sandy which occurred during October 2012.
99
The decrease in the consolidated expense ratio in 2013 reflected higher earned premiums in our Excess and Surplus Lines, Specialty Admitted and London Insurance Market segments in 2013 compared to 2012. The impact of transaction and other acquisition-related costs incurred by the Alterra segment in 2013 was offset by the impact of prospective adoption of Financial Accounting Standards Board Accounting Standards Update No. 2010-26,
Accounting for Costs Associated with Acquiring or Renewing Insurance Contracts
(ASU No. 2010-26), in 2012. Underwriting, acquisition and insurance expenses included transaction and other acquisition-related costs of $75.1 million in 2013, or two points on the combined ratio. These costs include transaction costs totaling
$16.0 million
, which primarily consist of due diligence, legal and investment banking costs, severance costs of
$31.7 million
, stay bonuses of
$14.8 million
, and other compensation costs totaling
$12.6 million
, related to the acceleration of certain long-term incentive compensation awards and restricted stock awards that were granted by Alterra prior to the acquisition. Excluding transaction and other acquisition-related costs incurred in 2013, the inclusion of the results of operations of Alterra had a favorable impact on the expense ratio, as the Alterra segment has a lower expense ratio than we historically have had. The prospective adoption of ASU No. 2010-26 increased our underwriting, acquisition and insurance expenses by $43.1 million in 2012, or two points on the combined ratio. Likewise, the 2012 combined ratios of the Excess and Surplus Lines, Specialty Admitted and London Insurance Market segments each included two points of underwriting, acquisition and insurance expenses related to the prospective adoption of ASU No. 2010-26.
The 2012 combined ratio decreased from 2011 due to a lower current accident year loss ratio and more favorable development of prior years' loss reserves, partially offset by a higher expense ratio compared to 2011. The 2011 combined ratio included $152.4 million, or eight points, of underwriting loss related to natural catastrophes, including the Thai floods, Hurricane Irene, U.S. tornadoes, Japanese earthquake and tsunami, Australian floods and New Zealand earthquakes. Also contributing to the improvement in the current accident year loss ratio in 2012 were lower attritional losses primarily in the Excess and Surplus Lines and London Insurance Market segments.
The 2013 combined ratio included $411.1 million of favorable development on prior years' loss reserves compared to
$399.0 million
in
2012
and
$354.0 million
in
2011
. Favorable development on prior years' loss reserves in 2013 included $20.8 million of favorable development on Hurricane Sandy. The benefit of the favorable development on prior years' loss reserves had less of an impact on the combined ratio in 2013 compared to 2012 due to higher earned premium volume in 2013. The favorable development on prior years' loss reserves during 2013 and 2012 was primarily due to loss reserve redundancies in the London Insurance Market segment and on the professional and products liability and casualty programs within the Excess and Surplus Lines segment. Favorable development on prior years' loss reserves during 2011 was primarily due to loss reserve redundancies in the London Insurance Market segment and on our professional and products liability programs within the Excess and Surplus Lines segment. Loss reserve redundancies in the London Insurance Market segment were $141.6 million, $192.0 million and $94.8 million in
2013
,
2012
and
2011
, respectively. Loss reserve redundancies on our professional and products liability programs within the Excess and Surplus Lines segment were $36.5 million, $65.9 million and $87.3 million in
2013
,
2012
and
2011
, respectively. Loss reserve redundancies on various long-tail casualty lines within the Excess and Surplus Lines segment in
2013
and 2012 were $115.8 million and $78.8 million, respectively.
Over the past three years, we have experienced significant redundancies in prior years' loss reserves. The positive trend in prior years' loss reserves over the past three years was due in part to the adverse impact of softening insurance market conditions and poor economic conditions experienced in recent years not being as significant as initially anticipated. Since 2005, we have generally been in a soft insurance market. In 2008 and 2009, we experienced a significant economic slowdown from the recessionary environment. Given the volatile nature of our long-tail books of business, the ultimate adverse impact of the soft insurance market and unfavorable economic environment could not be quantified when we initially established loss reserves for these years. In each of the past three years, actual claims reporting patterns have been more favorable than we initially anticipated.
In connection with our quarterly reviews of loss reserves, the actuarial methods we used have exhibited a favorable trend for the 2007 to
2012
accident years. This trend was observed using statistical analysis of actual loss experience for those years, particularly with regard to our long-tail books of business within the Excess and Surplus Lines and London Insurance Market segments, which developed more favorably than we had expected based upon our historical experience. As actual losses experienced on these accident years have continued to be lower than anticipated, it has become more likely that the underwriting results will prove to be better than originally estimated. Additionally, as most actuarial methods rely upon historical reporting patterns, the favorable trends experienced on earlier accident years have resulted in a re-estimation of our ultimate incurred losses on more recent accident years. When we experience loss frequency or loss severity trends that are more favorable than we initially anticipated, we often evaluate the loss experience over a period of several years in order to assess the relative credibility of loss development trends. In each of the past three years, based upon our evaluations of claims development patterns in our long-tail, and often volatile, lines of business, we gave greater credibility to the favorable trend. As a result, our actuaries reduced their estimates of ultimate losses, and management incorporated this favorable trend into its best estimate and reduced prior years' loss reserves accordingly.
100
While we believe it is possible that there will be additional redundancies on prior years' loss reserves in
2014
, we caution readers not to place undue reliance on this favorable trend. Since 2005, competition has been strong, which resulted in deterioration in pricing through 2010. Further, the ultimate impact that the financial crisis and related economic recession of 2008 and 2009 will have on our underwriting results is difficult to quantify. Similar to the impact of the hardening of the insurance market that began in 2000 and continued through 2004, the impact on our underwriting results from the soft insurance market and adverse economic conditions cannot be fully quantified in advance.
The following discussion provides more detail by segment of the underwriting results described above. Following this segment-based discussion is a summary table of prior years' loss reserve development.
Excess and Surplus Lines Segment
The Excess and Surplus Lines segment's combined ratio for
2013
was
80%
compared to
94%
in
2012
(including five points of underwriting loss related to Hurricane Sandy) and
86%
in
2011
(including three points of underwriting loss related to natural catastrophes). The decrease in the 2013 combined ratio was due to a lower current accident year loss ratio, more favorable development of prior years' loss reserves and a lower expense ratio compared to 2012. The improvement in the current accident year loss ratio in 2013 reflected the impact of losses related to Hurricane Sandy in 2012. The improvement in the expense ratio in 2013 was due to the impact of the prospective adoption of ASU No. 2010-26 in 2012 and higher premium volume and lower general expenses in 2013 compared to 2012. The combined ratio increased in 2012 compared to 2011 due to less favorable development on prior years' loss reserves, partially offset by a lower current accident year loss ratio. Excluding the impact of natural catastrophes in both periods, the improvement in the current accident year loss ratio in 2012 was due in part to lower attritional property losses compared to 2011.
In 2013, the Excess and Surplus Lines segment's results included $229.9 million of favorable development on prior years' loss reserves compared to $181.4 million in 2012 and $227.5 million in 2011. In all three periods, the redundancies on prior years' loss reserves experienced within the Excess and Surplus Lines segment were primarily on our professional and products liability programs and on our casualty programs. As the average loss severity or claim frequency estimates on these long-tail books of business have decreased, our actuarial estimates of the ultimate liability for unpaid losses and loss adjustment expenses were reduced, and management reduced prior years' loss reserves accordingly. The increase in favorable development in 2013 was due in part to the impact of Hurricane Sandy, which occurred during the fourth quarter of 2012, being less than initially anticipated. Additionally, during the fourth quarter of 2013, we reduced prior years' loss reserves by $27.3 million related to resolution of claims under expired commercial general liability policies. The reduction in favorable development on prior years' loss reserves in 2012 was primarily due to the effect of soft market conditions on the underlying profitability of more recent accident years.
The favorable development of prior years' loss reserves during 2013 included $36.5 million of redundancies on our professional and products liability programs, of which $34.3 million was on the 2010 to 2012 accident years. The favorable development of prior years' loss reserves during 2012 included $65.9 million of redundancies on our professional and products liability programs, of which $61.1 million was on the 2007 to 2011 accident years. The favorable development of prior years' loss reserves during 2011 included $87.3 million of redundancies on our professional and products liability programs, of which $78.9 million was on the 2006 to 2010 accident years. The favorable development experienced in 2013, 2012 and 2011 on our long-tail professional and products liability books of business was primarily the result of lower loss severity than was originally anticipated. In 2013, the product lines that produced the majority of the redundancy were the specified medical and products liability programs. In 2012 and 2011, the product lines that produced the majority of the redundancy were the specified medical, medical malpractice and products liability programs. In 2013, the average claim severity estimate on the 2010 to 2012 accident years for the specified medical and products liability product lines declined by 24% compared to their comparable levels in 2012. In 2012, the average claim severity estimate on the 2007 to 2011 accident years for the specified medical, medical malpractice and products liability programs product lines declined by 4% compared to 2011. As a result of these decreases in severity, our actuarial estimates of the ultimate liability for unpaid losses and loss adjustment expenses were reduced, and management reduced prior years' loss reserves accordingly.
101
In 2013, we experienced $115.8 million of redundancies on various long-tail casualty lines, which included $27.3 million of redundancies related to resolution of claims under expired commercial general liability policies. The remaining redundancies on our long-tail casualty lines in 2013 were spread across several accident years, due in part to lower claim frequencies than originally anticipated. In 2012, we experienced $78.8 million of redundancies on various long-tail casualty lines, primarily on the 2003 to 2009 accident years, due in part to lower claim frequencies than originally anticipated. In 2011, we experienced $83.7 million of redundancies on various long-tail casualty lines, primarily on the 2003 to 2009 accident years, primarily due to lower loss severity than originally anticipated. In 2003, as a result of previous adverse loss experience, we took significant corrective actions within our brokerage casualty operations, including the re-underwriting and re-pricing of the ongoing business. Our brokerage casualty business includes product lines that are long-tail and volatile in nature. During 2013, actual incurred losses and loss adjustment expenses on reported claims for various long-tail casualty lines across all prior accident years were $57.6 million less than we anticipated in our actuarial analyses. During 2012 and 2011 actual incurred losses and loss adjustment expenses on reported claims for various long-tail casualty lines on the 2003 to 2009 accident years were $41.9 million and $29.6 million, respectively, less than we anticipated in our actuarial analyses. As a result, our actuaries reduced their estimates of ultimate losses in 2013, 2012 and 2011, and management assigned greater credibility to this favorable experience and reduced prior years' loss reserves accordingly.
Specialty Admitted Segment
The Specialty Admitted segment's combined ratio for
2013
was
97%
compared to
108%
in
2012
(including three points of underwriting loss related to Hurricane Sandy) and
109%
in
2011
(including two points of underwriting loss related to natural catastrophes). The decrease in the combined ratio in 2013 was primarily due to a lower current accident year loss ratio compared to 2012. The lower current accident year loss ratio in 2013 reflected more favorable rates on our workers' compensation business and a higher proportion of non-California workers' compensation business (which carries a lower loss ratio than California workers' compensation business) during 2013 compared to 2012. Also contributing to the lower current accident year loss ratio in 2013 was the contribution of premium from the Hagerty business, which carries a lower loss ratio than the rest of the Specialty Admitted segment, and improved underwriting performance within our Specialty Programs unit across several product lines. The 2013 expense ratio for the Specialty Admitted segment was impacted by commission expense on the Hagerty business, which has a higher overall commission rate than the rest of the Specialty Admitted segment. The impact of the Hagerty commission expense on the 2013 expense ratio was offset by the impact of the prospective adoption of ASU No. 2010-26 on the 2012 expense ratio. The combined ratio decreased in 2012 compared to 2011 due to more favorable development of prior years' loss reserves and a lower current accident year loss ratio, partially offset by a higher expense ratio compared to 2011. The improvement in the current accident year loss ratio in 2012 was due in part to improved underwriting performance for two programs within our accident and health liability class. The increase in the 2012 expense ratio was driven by higher underwriting, acquisition and insurance expenses related to the Company's prospective adoption of ASU No. 2010-26, higher profit sharing costs and the write-off of previously capitalized software development costs.
The Specialty Admitted segment's results included $70.1 million, $46.7 million and $27.4 million of favorable development on prior years' loss reserves in
2013
,
2012
and
2011
respectively. The favorable development in 2013 included $32.8 million of redundancies of prior years' loss reserves at our Workers' Compensation unit, primarily on the 2011 and 2012 accident years, as both paid and incurred losses were significantly lower in 2013 than had previously been anticipated. Favorable development in 2013 also included $27.9 million of redundancies of prior years' loss reserves at the Specialty Programs unit, primarily on the 2012 and 2007 through 2009 accident years, due in part to more favorable than expected experience on our general liability product lines. Additionally, ultimate loss estimates related to Hurricane Sandy were reduced during 2013. The favorable development in 2012 included $31.2 million of redundancies of prior years' loss reserves at the Markel Specialty unit, most notably on the 2006 to 2011 accident years across several product lines. The favorable development in 2012 was most significant on our accident and medical and general liability product lines. During 2012, these product lines had incurred loss development which was less than we anticipated in our actuarial analyses. As a result, our actuaries reduced their estimates of the ultimate liability for unpaid losses and loss adjustment expenses, and management reduced prior years' loss reserves accordingly. The favorable development in 2011 included $18.2 million of redundancies of prior years' loss reserves at the Markel Specialty unit, primarily on the 2006 to 2009 accident years. In 2011, the favorable development at the Markel Specialty unit was due in part to lower loss severity than was originally anticipated on various property lines of business and lower loss frequency than was originally anticipated on various casualty programs.
102
London Insurance Market Segment
The London Insurance Market segment's combined ratio for
2013
was
88%
compared to
89%
in
2012
(including six points of underwriting loss related to Hurricane Sandy) and
116%
in
2011
(including 18 points of underwriting loss related to natural catastrophes). The impact of Hurricane Sandy on the 2012 combined ratio was offset by less favorable development of prior years' loss reserves in 2013 compared to 2012. In 2012, the combined ratio decreased compared to 2011 due to the impact of fewer natural catastrophes, more favorable development of prior years' loss reserves and lower attritional losses on the current accident year, primarily on our property lines in the Specialty unit within the London Insurance Market segment.
The London Insurance Market segment's 2013 combined ratio included $141.6 million of favorable development on prior years' loss reserves, of which $94.0 million was on the 2010 and 2011 accident years. The redundancies on prior years' loss reserves experienced in 2013 occurred in a variety of programs across each of our units, most notably driven by lower than expected claims activity on our Marine, Specialty and Elliott Special Risks units. The favorable development of prior years' loss reserves experienced in 2013 also included $20.0 million of redundancies on the 2001 and prior accident years due to savings on commutations and favorable incurred claims developments on the 1993 to 2001 accident years.
The London Insurance Market segment's 2012 combined ratio included $192.0 million of favorable development on prior years' loss reserves, of which $117.0 million was on the 2008 and 2009 accident years. The redundancies on prior years' loss reserves experienced in 2012 occurred in a variety of programs across each of our units driven by lower than expected claims activity. Consistent with the favorable development experienced in 2011, favorable development in 2012 was due in part to the adverse impact of the disruptions in the financial markets during 2008 and 2009 not being as significant as initially anticipated. The favorable development of prior years' loss reserves experienced in 2012 also included $39.1 million of redundancies on the 2001 and prior accident years, due to continued favorable development on casualty lines and legacy syndicate business and a reduction in the allowance for reinsurance bad debt related to such liabilities.
The London Insurance Market segment's 2011 combined ratio included $94.8 million of favorable development on prior years' loss reserves, of which $43.4 million was on the 2008 and 2009 accident years. This favorable development of prior years' loss reserves occurred in a variety of programs across each of our units and was due in part to the adverse impact of the disruptions in the financial markets during 2008 and 2009 not being as significant as initially anticipated. The favorable development of prior years' loss reserves experienced in 2011 included $18.8 million of redundancies on the 2001 and prior accident years. As we continued to experience better than expected case loss activity on the remaining open claims, we reduced prior years' loss reserves accordingly.
The underwriting performance for this segment may vary to a greater degree than our other segments due to Markel International's current mix of business, which includes a high percentage of catastrophe-exposed business and higher average policy limits.
Alterra Segment
Following the completion of the acquisition of Alterra on May 1, 2013, we have included the underwriting results of Alterra in the Alterra segment. As a result, a comparison of current and prior year periods is not meaningful. For this reason, we have included certain financial information for the Alterra segment on a pro forma basis as if the acquisition of Alterra had occurred on January 1, 2012. The pro forma financial information discussed herein is for informational purposes only and does not necessarily reflect the results that would have occurred had the acquisition taken place on January 1, 2012, nor is it necessarily indicative of future results. Adjustments used to determine pro forma results include amortization of the fair value adjustment recorded for the difference between the fair value and historical carrying amount of Alterra's unpaid losses and loss adjustment expenses. We have also excluded certain charges from the pro forma results, including transaction costs incurred by us ($16.0 million) and Alterra ($23.0 million) totaling $39.0 million for the year ended December 31, 2013, severance costs attributable to the acquisition totaling $31.7 million for the year ended December 31, 2013, and stay bonuses of $14.8 million for the year ended December 31, 2013. The acceleration of compensation expense during the year ended December 31, 2013 related to Alterra's long-term incentive compensation awards and restricted stock awards was attributable to the acquisition; however, the incremental expense recognized during 2013 only represents a timing difference in the recognition of expense. Therefore, it was not excluded from the pro forma underwriting results.
103
The following table presents the underwriting results for the Alterra segment for the period from May 1, 2013 to December 31, 2013, which are included in the consolidated statements of income and comprehensive income for the year ended December 31, 2013.
|
May 1, 2013 to
|
|||
|
(dollars in thousands)
|
December 31, 2013
|
||
|
Earned premiums
|
$
|
848,317
|
|
|
Losses and loss adjustment expenses
|
(647,546
|
)
|
|
|
Underwriting, acquisition and insurance expenses:
|
|||
|
Transaction and other acquisition-related expenses
(1)
|
(75,140
|
)
|
|
|
Other operating expenses
|
(280,569
|
)
|
|
|
Underwriting loss
|
$
|
(154,938
|
)
|
|
U.S. GAAP combined ratio
(2)
|
118
|
%
|
|
|
(1)
|
In connection with the acquisition of Alterra, we incurred transaction and other acquisition-related costs of
$75.1 million
for the year ended December 31, 2013. For the year ended December 31, 2013, these costs include transaction costs totaling
$16.0 million
, which primarily consist of due diligence, legal and investment banking costs. The year ended December 31, 2013 also include severance costs of
$31.7 million
, stay bonuses of
$14.8 million
, and other compensation costs totaling
$12.6 million
, related to the acceleration of certain long-term incentive compensation awards and restricted stock awards that were granted by Alterra prior to the acquisition. The acceleration of compensation expense during the year ended December 31, 2013 was attributable to the acquisition; however, the incremental expense recognized during 2013 only represents a timing difference in the recognition of expense. Therefore, it was not excluded from the pro forma underwriting results.
|
|
(2)
|
The U.S. GAAP combined ratio is a measure of underwriting performance and represents the relationship of incurred losses, loss adjustment expenses and underwriting, acquisition and insurance expenses to earned premiums.
|
The combined ratio for the Alterra segment was 118% for the period from May 1, 2013 to December 31, 2013. The combined ratio for the Alterra segment included transaction and other acquisition-related costs of $75.1 million, or nine points on the combined ratio. The loss ratio for the Alterra segment included $25.5 million, or three points, of underwriting loss related to catastrophes that occurred during 2013 and was unfavorably impacted by applying our more conservative loss reserving philosophy to Alterra's current year loss reserves.
The following table presents the pro forma underwriting results for the Alterra segment for 2013 and 2012.
|
Pro Forma
|
|||||||
|
Years Ended December 31,
|
|||||||
|
(dollars in thousands)
|
2013
|
2012
|
|||||
|
Earned premiums
|
$
|
1,296,921
|
|
$
|
1,362,706
|
|
|
|
Losses and loss adjustment expenses
|
(913,324
|
)
|
(928,333
|
)
|
|||
|
Underwriting, acquisition and insurance expenses:
|
|||||||
|
Transaction and other acquisition-related expenses
(1)
|
(12,621
|
)
|
—
|
|
|||
|
Other operating expenses
|
(436,724
|
)
|
(476,864
|
)
|
|||
|
Underwriting loss
|
$
|
(65,748
|
)
|
$
|
(42,491
|
)
|
|
|
U.S. GAAP combined ratio
(2)
|
105
|
%
|
103
|
%
|
|||
|
(1)
|
In connection with the acquisition of Alterra, we incurred compensation costs totaling
$12.6 million
, related to the acceleration of certain long-term incentive compensation awards and restricted stock awards that were granted by Alterra prior to the acquisition. The acceleration of compensation expense during the year ended December 31, 2013 was attributable to the acquisition; however, the incremental expense recognized during 2013 only represents a timing difference in the recognition of expense. Therefore, it was not excluded from the pro forma underwriting results.
|
|
(2)
|
The U.S. GAAP combined ratio is a measure of underwriting performance and represents the relationship of incurred losses, loss adjustment expenses and underwriting, acquisition and insurance expenses to earned premiums.
|
104
The increase in the Alterra segment's pro forma loss ratio was driven by less favorable development on prior years' loss reserves and the impact of applying our more conservative loss reserving philosophy to Alterra's current year loss reserves beginning May 1, 2013, partially offset by lower catastrophe losses compared to 2012. The 2013 pro forma loss ratio included $25.5 million, or two points, of losses and loss adjustment expenses related to catastrophes that occurred during 2013 compared to $124.5 million, or nine points, in 2012. The Alterra segment's 2013 pro forma loss ratio also included $31.2 million, or two points, of favorable development on prior years' loss reserves, primarily in the global reinsurance unit, compared to $90.8 million, or seven points, of favorable development in 2012, primarily in the global insurance and global reinsurance units. For financial reporting purposes, favorable development on pre-acquisition accident years' loss reserves is included in current year losses and loss adjustment expenses.
The Alterra segment's pro forma expense ratio for 2013 reflects lower compensation and executive costs compared to 2012. The impact of lower compensation and executive costs was offset by $12.6 million of compensation costs associated with the acceleration of certain long-term incentive compensation awards and restricted stock awards that were granted by Alterra prior to the acquisition.
Other Insurance (Discontinued Lines) Segment
The majority of the losses and loss adjustment expenses and the underwriting, acquisition and insurance expenses for the Other Insurance (Discontinued Lines) segment are associated with A&E exposures or discontinued Markel International programs, most of which were discontinued upon acquisition, or shortly thereafter. Given the insignificant amount of premium earned in the Other Insurance (Discontinued Lines) segment, we evaluate this segment's underwriting performance in terms of dollars of underwriting profit or loss instead of its combined ratio.
The Other Insurance (Discontinued Lines) segment produced an underwriting loss of
$30.4 million
in
2013
compared to an underwriting loss of
$21.3 million
in
2012
and an underwriting profit of
$4.7 million
in
2011
. The underwriting loss in 2013 included $30.1 million of adverse loss reserve development on A&E exposures.
We complete an annual review of our A&E exposures during the third quarter of the year unless circumstances suggest an earlier review is appropriate. Over the past few years, the number of A&E claims reported each year across the property and casualty industry has been on the decline. However, at the same time, the likelihood of making an indemnity payment has risen, thus increasing the average cost per reported claim. During our 2012 annual review, we reduced our estimate of the ultimate claims count, while increasing our estimate of the number of claims that would ultimately be closed with an indemnity payment. During our 2013 annual review, our expectation of the severity of the outcome of known claims increased. As a result, prior years' loss reserves for A&E exposures were increased by $28.4 million in 2013 and $31.1 million in 2012. Adverse development of A&E reserves in 2012 was partially offset by favorable movements in prior years' loss reserves and allowances for reinsurance bad debt related to discontinued lines of business originally written by Markel International. During our 2011 review, we determined that no adjustment to loss reserves was required.
A&E loss reserves are subject to significant uncertainty due to potential loss severity and frequency resulting from an uncertain and unfavorable legal climate. Our A&E reserves are not discounted to present value and are forecasted to pay out over the next 40 to 50 years. We seek to establish appropriate reserve levels for A&E exposures; however, these reserves could be subject to increases in the future. See note 9(b) of the notes to consolidated financial statements for further discussion of our exposures to A&E claims.
105
The following tables summarize the increases (decreases) in prior years' loss reserves by segment, as discussed above.
|
Year Ended December 31, 2013
|
|||||||||||||||||||||||
|
(dollars in millions)
|
Excess &
Surplus
Lines
|
Specialty
Admitted
|
London
Insurance
Market
|
Alterra
|
Other
Insurance
(Discontinued
Lines)
|
Total
|
|||||||||||||||||
|
Professional/Products liability
|
$
|
(36.5
|
)
|
$
|
—
|
|
$
|
—
|
|
$
|
—
|
|
$
|
—
|
|
$
|
(36.5
|
)
|
|||||
|
Casualty
|
(115.8
|
)
|
—
|
|
—
|
|
—
|
|
—
|
|
(115.8
|
)
|
|||||||||||
|
Markel International: 2002 & post
|
—
|
|
—
|
|
(121.6
|
)
|
—
|
|
—
|
|
(121.6
|
)
|
|||||||||||
|
Markel International: 2001 & prior
|
—
|
|
—
|
|
(20.0
|
)
|
—
|
|
—
|
|
(20.0
|
)
|
|||||||||||
|
Workers' Compensation
|
—
|
|
(32.8
|
)
|
—
|
|
—
|
|
—
|
|
(32.8
|
)
|
|||||||||||
|
Specialty Programs
|
—
|
|
(27.9
|
)
|
—
|
|
—
|
|
—
|
|
(27.9
|
)
|
|||||||||||
|
A&E exposures
|
—
|
|
—
|
|
—
|
|
—
|
|
30.1
|
|
30.1
|
|
|||||||||||
|
Net other prior years' redundancy
|
(77.6
|
)
|
(9.4
|
)
|
—
|
|
—
|
|
0.4
|
|
(86.6
|
)
|
|||||||||||
|
Increase (decrease)
|
$
|
(229.9
|
)
|
$
|
(70.1
|
)
|
$
|
(141.6
|
)
|
$
|
—
|
|
$
|
30.5
|
|
$
|
(411.1
|
)
|
|||||
|
Year Ended December 31, 2012
|
|||||||||||||||||||
|
(dollars in millions)
|
Excess &
Surplus
Lines
|
Specialty
Admitted
|
London
Insurance
Market
|
Other
Insurance
(Discontinued
Lines)
|
Total
|
||||||||||||||
|
Professional/Products liability
|
$
|
(65.9
|
)
|
$
|
—
|
|
$
|
—
|
|
$
|
—
|
|
$
|
(65.9
|
)
|
||||
|
Casualty
|
(78.8
|
)
|
—
|
|
—
|
|
—
|
|
(78.8
|
)
|
|||||||||
|
Markel International: 2002 & post
|
—
|
|
—
|
|
(152.9
|
)
|
—
|
|
(152.9
|
)
|
|||||||||
|
Markel International: 2001 & prior
|
—
|
|
—
|
|
(39.1
|
)
|
—
|
|
(39.1
|
)
|
|||||||||
|
Markel Specialty
|
—
|
|
(31.2
|
)
|
—
|
|
—
|
|
(31.2
|
)
|
|||||||||
|
A&E exposures
|
—
|
|
—
|
|
—
|
|
38.2
|
|
38.2
|
|
|||||||||
|
Net other prior years' redundancy
|
(36.7
|
)
|
(15.5
|
)
|
—
|
|
(17.1
|
)
|
(69.3
|
)
|
|||||||||
|
Increase (decrease)
|
$
|
(181.4
|
)
|
$
|
(46.7
|
)
|
$
|
(192.0
|
)
|
$
|
21.1
|
|
$
|
(399.0
|
)
|
||||
|
Year Ended December 31, 2011
|
|||||||||||||||||||
|
(dollars in millions)
|
Excess &
Surplus
Lines
|
Specialty
Admitted
|
London
Insurance
Market
|
Other
Insurance
(Discontinued
Lines)
|
Total
|
||||||||||||||
|
Professional/Products liability
|
$
|
(87.3
|
)
|
$
|
—
|
|
$
|
—
|
|
$
|
—
|
|
$
|
(87.3
|
)
|
||||
|
Casualty
|
(83.7
|
)
|
—
|
|
—
|
|
—
|
|
(83.7
|
)
|
|||||||||
|
Mortgage-related programs
|
(16.1
|
)
|
—
|
|
—
|
|
—
|
|
(16.1
|
)
|
|||||||||
|
Markel International: 2002 & post
|
—
|
|
—
|
|
(76.0
|
)
|
—
|
|
(76.0
|
)
|
|||||||||
|
Markel International: 2001 & prior
|
—
|
|
—
|
|
(18.8
|
)
|
—
|
|
(18.8
|
)
|
|||||||||
|
Markel Specialty
|
—
|
|
(18.2
|
)
|
—
|
|
—
|
|
(18.2
|
)
|
|||||||||
|
Net other prior years' redundancy
|
(40.4
|
)
|
(9.2
|
)
|
—
|
|
(4.3
|
)
|
(53.9
|
)
|
|||||||||
|
Decrease
|
$
|
(227.5
|
)
|
$
|
(27.4
|
)
|
$
|
(94.8
|
)
|
$
|
(4.3
|
)
|
$
|
(354.0
|
)
|
||||
Over the past three years, we have experienced favorable development on prior years' loss reserves ranging from 8% to 9% of beginning of year net loss reserves. In
2013
, we experienced favorable development of
$411.1 million
or 9% of beginning of year net loss reserves, compared to
$399.0 million
, or 9% of beginning of year net loss reserves, in
2012
and
$354.0 million
, or 8% of beginning of year net loss reserves, in
2011
.
106
It is difficult for management to predict the duration and magnitude of an existing trend and, on a relative basis, it is even more difficult to predict the emergence of factors or trends that are unknown today but may have a material impact on loss reserve development. In assessing the likelihood of whether the above favorable trends will continue and whether other trends may develop, we believe that a reasonably likely movement in prior years' loss reserves during
2014
would range from a deficiency of less than 1%, or $50 million, to a redundancy of approximately 4%, or $350 million, of
December 31, 2013
net loss reserves.
Premiums
The following table summarizes gross premium volume by segment.
|
Gross Premium Volume
|
|||||||||||
|
Years Ended December 31,
|
|||||||||||
|
(dollars in thousands)
|
2013
|
2012
|
2011
|
||||||||
|
Excess and Surplus Lines
|
$
|
1,070,520
|
|
$
|
956,273
|
|
$
|
893,427
|
|
||
|
Specialty Admitted
|
899,996
|
|
669,692
|
|
572,392
|
|
|||||
|
London Insurance Market
|
914,480
|
|
887,720
|
|
825,301
|
|
|||||
|
Alterra
|
1,035,190
|
|
—
|
|
—
|
|
|||||
|
Other Insurance (Discontinued Lines)
|
40
|
|
(4
|
)
|
131
|
|
|||||
|
Total
|
$
|
3,920,226
|
|
$
|
2,513,681
|
|
$
|
2,291,251
|
|
||
The Excess and Surplus Lines segment gross premium volume increased
12%
in
2013
compared to
2012
. The increase in
2013
was due in part to more favorable rates, primarily on our casualty lines, and improving economic conditions. Excess and Surplus Lines segment gross premium volume increased
7%
in
2012
compared to
2011
. The increase in
2012
was due to more favorable rates, primarily on our excess and umbrella and property lines.
The Specialty Admitted segment gross premium volume increased
34%
in
2013
compared to
2012
and increased
17%
in
2012
compared to
2011
. The Specialty Admitted segment included $194.7 million of gross written premiums from Hagerty in 2013, which we began writing in the first quarter of 2013. In 2012, the Specialty Admitted segment included $79.2 million of gross written premiums from Thomco, which was acquired in the first quarter of 2012.
The London Insurance Market segment gross premium volume increased
3%
in
2013
compared to
2012
and
8%
in
2012
compared to
2011
. The increase in 2012 was due in part to more favorable rates, primarily in our Marine and Energy unit. Foreign currency exchange rate movements did not have a significant impact on gross premium volume in
2013
or
2012
.
On a pro forma basis, gross premiums written for the Alterra segment decreased 3% from $2.0 billion in 2012 to $1.9 billion in 2013.
The following table summarizes net written premiums by segment.
|
Net Written Premiums
|
|||||||||||
|
Years Ended December 31,
|
|||||||||||
|
(dollars in thousands)
|
2013
|
2012
|
2011
|
||||||||
|
Excess and Surplus Lines
|
$
|
911,870
|
|
$
|
811,601
|
|
$
|
772,279
|
|
||
|
Specialty Admitted
|
855,381
|
|
628,147
|
|
543,213
|
|
|||||
|
London Insurance Market
|
792,158
|
|
774,383
|
|
726,359
|
|
|||||
|
Alterra
|
677,233
|
|
—
|
|
—
|
|
|||||
|
Other Insurance (Discontinued Lines)
|
41
|
|
(5
|
)
|
(13
|
)
|
|||||
|
Total
|
$
|
3,236,683
|
|
$
|
2,214,126
|
|
$
|
2,041,838
|
|
||
107
Net retention of gross premium volume was
83%
in
2013
compared to
88%
in
2012
and
89%
in
2011
. As part of our underwriting philosophy, we have historically sought to offer products with limits that did not require significant reinsurance. Following the acquisition of Alterra, we now have certain insurance and reinsurance products that have typically used higher levels of reinsurance. We purchase reinsurance and retrocessional reinsurance in order to manage our net retention on individual risks and enable us to write policies with sufficient limits to meet policyholder needs. Excluding premiums written by the Alterra segment, our consolidated net retention of gross premium volume in 2013 would have been 89%, which is comparable with 2012 and 2011.
On a pro forma basis, net retention of gross premium volume in the Alterra segment was 67% in both 2013 and 2012.
The following table summarizes earned premiums by segment.
|
Earned Premiums
|
|||||||||||
|
Years Ended December 31,
|
|||||||||||
|
(dollars in thousands)
|
2013
|
2012
|
2011
|
||||||||
|
Excess and Surplus Lines
|
$
|
856,629
|
|
$
|
793,159
|
|
$
|
756,306
|
|
||
|
Specialty Admitted
|
744,993
|
|
588,758
|
|
527,293
|
|
|||||
|
London Insurance Market
|
781,637
|
|
765,216
|
|
695,753
|
|
|||||
|
Alterra
|
848,317
|
|
—
|
|
—
|
|
|||||
|
Other Insurance (Discontinued Lines)
|
40
|
|
(5
|
)
|
(12
|
)
|
|||||
|
Total
|
$
|
3,231,616
|
|
$
|
2,147,128
|
|
$
|
1,979,340
|
|
||
The Excess and Surplus Lines segment earned premiums increased
8%
in
2013
compared to
2012
and increased
5%
in
2012
compared to
2011
. The change in both periods was a result of the change in gross premium volume.
The Specialty Admitted segment earned premiums increased
27%
in
2013
compared to
2012
and increased
12%
in
2012
compared to
2011
. In 2013, the Specialty Admitted segment included $97.8 million of earned premiums from Hagerty. The Specialty Admitted segment also experienced continued growth in 2013 as a result of our acquisition of Thomco in early 2012. The increase in 2012 compared to 2011 was attributable to higher earned premiums in our Workers' Compensation unit, which we acquired in late 2010, and earned premiums from Thomco.
The London Insurance Market segment earned premiums increased
2%
in
2013
compared to
2012
and increased
10%
in
2012
compared to
2011
. The increase in both periods was primarily a result of higher gross premium volume. Foreign currency exchange rate movements did not have a significant impact on earned premiums in
2013
or
2012
.
On a pro forma basis, earned premiums for the Alterra segment decreased 5% from
$1.4 billion
in 2012 to
$1.3 billion
in 2013. The decrease in earned premiums was driven by a decrease in reinsurance premiums assumed.
Life and Annuity Benefits
The Other Insurance (Discontinued Lines) segment also included other revenues of $1.1 million and other expenses of $28.1 million for the year ended December 31, 2013 related to the life and annuity reinsurance business which was assumed through the acquisition of Alterra on May 1, 2013. This business is in run-off and we are not writing any new life and annuity reinsurance contracts. The life and annuity benefit reserves are recorded on a discounted present value basis using assumptions that were determined at the Acquisition Date. The accretion of this discount is recognized in the statement of income and comprehensive income as other expenses. Other revenues attributable to the life and annuity business included in the Other Insurance (Discontinued Lines) segment represent ongoing premium adjustments on existing contracts.
108
Investing Results
Our business strategy recognizes the importance of both consistent underwriting and operating profits and superior investment returns to build shareholder value. We rely on sound underwriting practices to produce investable funds while minimizing underwriting risk. We evaluate our investment performance by analyzing taxable equivalent total investment return. Taxable equivalent total investment return includes items that impact net income, such as coupon interest on fixed maturities, dividends on equity securities and realized investment gains or losses, as well as changes in unrealized gains or losses, which do not impact net income. Certain items that are included in net investment income have been excluded from the calculation of taxable equivalent total investment return, such as amortization and accretion of premiums and discounts on our fixed maturity portfolio, to provide a comparable basis for measuring our investment return against industry investment returns. The calculation of taxable equivalent total investment return also includes the current tax benefit associated with income on certain investments that is either taxed at a lower rate than the statutory income tax rate or is not fully included in federal taxable income. We believe the taxable equivalent total investment return is a better reflection of the economics of our decision to invest in certain asset classes. We focus on our long-term investment return, understanding that the level of realized and unrealized investment gains or losses may vary from one period to the next.
The following table summarizes our investment performance.
|
Years Ended December 31,
|
|||||||||||
|
(dollars in thousands)
|
2013
|
2012
|
2011
|
||||||||
|
Net investment income
|
$
|
317,373
|
|
$
|
282,107
|
|
$
|
263,676
|
|
||
|
Net realized investment gains
|
$
|
63,152
|
|
$
|
31,593
|
|
$
|
35,857
|
|
||
|
Change in net unrealized gains on investments
|
$
|
261,995
|
|
$
|
353,808
|
|
$
|
182,722
|
|
||
|
Investment yield
(1)
|
2.6
|
%
|
3.7
|
%
|
3.6
|
%
|
|||||
|
Taxable equivalent total investment return, before foreign currency effect
|
6.9
|
%
|
8.6
|
%
|
6.7
|
%
|
|||||
|
Taxable equivalent total investment return
|
6.8
|
%
|
9.0
|
%
|
6.5
|
%
|
|||||
|
Invested assets, end of year
|
$
|
17,612,074
|
|
$
|
9,332,745
|
|
$
|
8,728,147
|
|
||
|
(1)
|
Investment yield reflects net investment income as a percentage of monthly average invested assets at amortized cost.
|
The following table reconciles investment yield to taxable equivalent total investment return.
|
Years Ended December 31,
|
||||||||
|
(dollars in thousands)
|
2013
|
2012
|
2011
|
|||||
|
Investment yield
(1)
|
2.6
|
%
|
3.7
|
%
|
3.6
|
%
|
||
|
Adjustment of investment yield from book value to market value
|
(0.3
|
)%
|
(0.5
|
)%
|
(0.5
|
)%
|
||
|
Net amortization of net premium on fixed maturity securities
|
0.7
|
%
|
0.2
|
%
|
0.2
|
%
|
||
|
Net realized investment gains and change in net unrealized gains on investments
|
2.3
|
%
|
4.3
|
%
|
2.6
|
%
|
||
|
Taxable equivalent effect for interest and dividends
(2)
|
0.4
|
%
|
0.6
|
%
|
0.7
|
%
|
||
|
Other
(3)
|
1.1
|
%
|
0.7
|
%
|
(0.1
|
)%
|
||
|
Taxable equivalent total investment return
|
6.8
|
%
|
9.0
|
%
|
6.5
|
%
|
||
|
(1)
|
Investment yield reflects net investment income as a percentage of monthly average invested assets at amortized cost.
|
|
(2)
|
Adjustment to tax-exempt interest and dividend income to reflect a taxable equivalent basis.
|
|
(3)
|
Adjustment to reflect the impact of time-weighting the inputs to the calculation of taxable equivalent total investment return.
|
Investments, cash and cash equivalents and restricted cash and cash equivalents (invested assets) increased
89%
in
2013
. The increase in the investment portfolio in
2013
was attributable to the investment portfolio acquired through the Alterra acquisition, as well as an increase in net unrealized gains on investments of
$262.0 million
and cash flows from operations of
$745.5 million
. Invested assets increased
7%
in
2012
. The increase in the investment portfolio in
2012
was primarily due to an increase in net unrealized gains on investments of
$353.8 million
and cash flows from operations of
$392.5 million
.
109
Following a period of considerable dislocation in the global financial markets that began in 2008, our investment portfolio experienced significant recoveries beginning in the latter half of 2009 and continuing into 2010. Given the improvement in the financial markets in 2010, we increased our purchases of fixed maturities and equity securities and gradually shifted our investment portfolio's allocation from short-term investments and cash and cash equivalents to higher yielding investment securities. During 2011 and 2012, we increased our holdings of equity securities to capitalize on opportunities in the equity markets. Also during this time, we increased our holdings of cash and cash equivalents and short-term investments and reduced our holdings of fixed maturities. During 2013, we have continued to limit our allocation of funds for purchases of fixed maturities. Due to the current low interest rate environment, we have chosen to take a more defensive posture, earning lower investment yields in order to maintain a high level of liquidity and have flexibility in how we allocate capital. We began repositioning the investment portfolio acquired through the Alterra acquisition to be more consistent with our historical investment portfolio allocation by replacing fixed maturity corporate and mortgage-backed securities with fixed maturity tax-exempt municipal securities and equity securities. At
December 31, 2013
, equity securities represented
18%
of our invested assets compared to
26%
at
December 31, 2012
. At
December 31, 2013
, short-term investments, cash and cash equivalents and restricted cash and cash equivalents represented
24%
of our invested assets compared to
21%
at
December 31, 2012
.
Net investment income increased
13%
in
2013
, driven by $74.3 million of net investment income attributable to the investment portfolio acquired through the Alterra acquisition, which was net of $58.3 million of amortization as a result of establishing a new amortized cost for Alterra's fixed maturity securities as of the Acquisition Date. Net investment income attributable to the investment portfolio acquired through the Alterra acquisition was partially offset by lower investment income on fixed maturities, as we decreased our holdings in fixed maturities and increased our holdings in cash and cash equivalents during 2013. Net investment income increased
7%
in
2012
, which was primarily due to a favorable change in the fair value of our credit default swap. Excluding the change in the fair value of our credit default swap, net investment income in 2012 was flat compared to 2011 as lower investment income on our fixed income portfolio, due to lower invested assets, was offset by increased dividend income on our equity portfolio due to special dividend payments during 2012.
Net investment income in
2013
and
2012
included favorable changes in the fair value of our credit default swap of
$10.5 million
and
$16.6 million
, respectively. Net investment income in
2011
included an adverse change in the fair value of our credit default swap of
$4.1 million
. The fair value of the credit default swap was a liability of
$2.2 million
and
$12.7 million
at
December 31, 2013
and
December 31, 2012
, respectively.
Net realized investment gains were
$63.2 million
,
$31.6 million
and
$35.9 million
in
2013
,
2012
and
2011
, respectively. Net realized investment gains include both gains and losses from sales of securities and losses from write downs for other-than-temporary declines in the estimated fair value of investments. In
2013
, net realized investment gains included
$4.7 million
of write downs for other-than-temporary declines in the estimated fair value of investments compared to
$12.1 million
and
$20.2 million
in
2012
and
2011
, respectively. In
2013
,
2012
and 2011, net realized investment gains were related to equity securities and fixed maturities that were sold because of our decision to reallocate capital to other equity securities or fixed maturities with greater potential for long-term investment returns.
Net realized investment gains in
2013
,
2012
and
2011
included $25.4 million, $0.9 million and $0.5 million, respectively, of realized losses from sales of fixed maturities and equity securities. Proceeds received on securities sold at a loss were $545.3 million in
2013
, $11.9 million in
2012
and $18.5 million in
2011
. During 2013 we began repositioning the investment portfolio acquired through the Alterra acquisition to be more consistent with our target portfolio allocation.
Approximately
95%
of the gross realized losses in
2013
related to securities that had been in a continuous unrealized loss position for less than one year. Gross realized losses in
2013
included
$4.7 million
of write downs for other-than-temporary declines in the estimated fair value of investments. These write downs were made with respect to
six
equity securities and four fixed maturities.
Approximately
99%
of the gross realized losses in
2012
related to securities that had been in a continuous unrealized loss position for less than one year. Gross realized losses in
2012
included
$12.1 million
of write downs for other-than-temporary declines in the estimated fair value of investments. These write downs were made with respect to
five
equity securities.
Approximately
87%
of the gross realized losses in
2011
related to securities that had been in a continuous unrealized loss position for less than one year. Gross realized losses in
2011
included
$20.2 million
of write downs for other-than-temporary declines in the estimated fair value of investments. These write downs were made with respect to
18
equity securities and
five
fixed maturities.
110
In
2013
, net unrealized gains on investments increased
$262.0 million
primarily due to an increase in the estimated fair value of our equity portfolio as a result of strong overall equity market performance, partially offset by a decline in the estimated fair value of fixed income securities as interest rates increased during 2013. The decline in the fair value of the fixed income portfolio was more significant for fixed income securities in the investment portfolio acquired through the Alterra acquisition, as their fixed income securities have a longer weighted average effective duration than our historical fixed income portfolio. In
2012
, net unrealized gains on investments increased
$353.8 million
due to increases in the estimated fair value of our equity portfolio as a result of continued improvement in financial market conditions during 2012. In
2011
, net unrealized gains on investments increased
$182.7 million
, due to an increase in the estimated fair value of our fixed maturity portfolio as a result of a decline in interest rates during 2011.
We complete a detailed analysis each quarter to assess whether the decline in the fair value of any investment below its cost basis is deemed other-than-temporary. At
December 31, 2013
, we held securities with gross unrealized losses of
$211.9 million
, or approximately 1% of invested assets. All securities with unrealized losses were reviewed, and we believe that there were no other securities with indications of declines in estimated fair value that were other-than-temporary at
December 31, 2013
. However, given the volatility in the debt and equity markets, we caution readers that further declines in fair value could be significant and may result in additional other-than-temporary impairment charges in future periods. Variability in the timing of realized and unrealized gains and losses is to be expected. See note 3(b) of the notes to consolidated financial statements for further discussion of unrealized losses.
Markel Ventures Operations
Our Markel Ventures operations are comprised of a diverse portfolio of industrial and service businesses that operate outside of the specialty insurance marketplace. These businesses are viewed by management as separate and distinct from our insurance operations. While each of these companies are operated independently from one another, we aggregate their financial results into two industry groups: manufacturing and non-manufacturing.
We consolidate our Markel Ventures operations on a one-month lag. Operating revenues and expenses associated with our Markel Ventures operations are included in other revenues and other expenses in the consolidated statements of income and comprehensive income. See note 21 of the notes to consolidated financial statements for the components of other revenues and other expenses associated with Markel Ventures.
111
The following tables summarize the amounts recognized in the consolidated balance sheets and consolidated statements of income related to Markel Ventures.
|
December 31,
|
|||||||
|
(dollars in thousands)
|
2013
|
2012
|
|||||
|
ASSETS
|
|||||||
|
Cash and cash equivalents
|
$
|
61,742
|
|
$
|
55,048
|
|
|
|
Receivables
|
78,764
|
|
71,565
|
|
|||
|
Goodwill
|
191,629
|
|
192,444
|
|
|||
|
Intangible assets
|
182,599
|
|
199,307
|
|
|||
|
Other assets
|
421,714
|
|
373,222
|
|
|||
|
Total Assets
|
$
|
936,448
|
|
$
|
891,586
|
|
|
|
LIABILITIES AND EQUITY
|
|||||||
|
Senior long-term debt and other debt
(1)
|
$
|
217,119
|
|
$
|
211,147
|
|
|
|
Other liabilities
|
146,343
|
|
149,819
|
|
|||
|
Total Liabilities
|
363,462
|
|
360,966
|
|
|||
|
Redeemable noncontrolling interests
|
72,183
|
|
86,225
|
|
|||
|
Shareholders' equity
(2)
|
501,370
|
|
444,035
|
|
|||
|
Noncontrolling interests
|
(567
|
)
|
360
|
|
|||
|
Total Equity
|
500,803
|
|
444,395
|
|
|||
|
Total Liabilities and Equity
|
$
|
936,448
|
|
$
|
891,586
|
|
|
|
(1)
|
Senior long-term debt and other debt as of
December 31, 2013
and
2012
included $116.4 million and $121.7 million, respectively, of debt due to other subsidiaries of Markel Corporation, which is eliminated in consolidation.
|
|
(2)
|
Shareholders' equity includes $444.1 million and $415.6 million as of December 31, 2013 and 2012, respectively, which represents Markel Corporation's investment in Markel Ventures and is eliminated in consolidation.
|
|
Years ended December 31,
|
|||||||||||
|
(dollars in thousands)
|
2013
|
2012
|
2011
|
||||||||
|
OPERATING REVENUES
|
|||||||||||
|
Net investment income
|
$
|
4
|
|
$
|
4
|
|
$
|
—
|
|
||
|
Other revenues
|
686,448
|
|
489,352
|
|
317,532
|
|
|||||
|
Total Operating Revenues
|
686,452
|
|
489,356
|
|
317,532
|
|
|||||
|
OPERATING EXPENSES
|
|||||||||||
|
Amortization of intangible assets
|
20,674
|
|
18,684
|
|
11,702
|
|
|||||
|
Other expenses
|
613,250
|
|
432,956
|
|
275,324
|
|
|||||
|
Total Operating Expenses
|
633,924
|
|
451,640
|
|
287,026
|
|
|||||
|
Operating Income
|
52,528
|
|
37,716
|
|
30,506
|
|
|||||
|
Interest expense
(1)
|
11,230
|
|
11,269
|
|
11,853
|
|
|||||
|
Income Before Income Taxes
|
41,298
|
|
26,447
|
|
18,653
|
|
|||||
|
Income tax expense
|
14,654
|
|
8,109
|
|
4,447
|
|
|||||
|
Net Income
|
26,644
|
|
18,338
|
|
14,206
|
|
|||||
|
Net income attributable to noncontrolling interests
|
2,824
|
|
4,863
|
|
6,460
|
|
|||||
|
Net Income to Shareholders
|
$
|
23,820
|
|
$
|
13,475
|
|
$
|
7,746
|
|
||
|
(1)
|
Interest expense for the years ended
December 31, 2013
,
2012
and
2011
includes intercompany interest expense of $6.4 million, $6.4 million and $6.0 million, respectively, which is eliminated in consolidation.
|
Revenues and net income to shareholders from our Markel Ventures operations increased in
2013
compared to
2012
primarily due to our acquisition of Eagle Construction of VA LLC (Eagle) in August 2013, Reading Bakery Systems (Reading) in September 2012 and Havco WP LLC (Havco) in April 2012 and more favorable results at AMF Bakery Systems (AMF). Revenues and net income to shareholders from our Markel Ventures operations increased in
2012
compared to
2011
primarily due to our acquisition of Havco and more favorable results at AMF. Revenues also increased in
2012
due to our acquisition of WI Holdings Inc. (Weldship) in late 2011.
112
The following table summarizes the cash flows attributable to Markel Ventures for the years ended December 31, 2013, 2012 and 2011.
|
Years ended December 31,
|
|||||||||||
|
(dollars in thousands)
|
2013
|
2012
|
2011
|
||||||||
|
Cash and cash equivalents, beginning of year
|
$
|
55,048
|
|
$
|
35,756
|
|
$
|
25,395
|
|
||
|
Net cash provided by operating activities
|
75,926
|
|
47,020
|
|
17,457
|
|
|||||
|
Net cash used by investing activities
|
(60,533
|
)
|
(190,060
|
)
|
(128,298
|
)
|
|||||
|
Net cash provided (used) by financing activities
(1,2)
|
(8,699
|
)
|
162,332
|
|
121,202
|
|
|||||
|
Increase in cash and cash equivalents
|
6,694
|
|
19,292
|
|
10,361
|
|
|||||
|
Cash and cash equivalents, end of year
|
$
|
61,742
|
|
$
|
55,048
|
|
$
|
35,756
|
|
||
|
(1)
|
Net cash provided (used) by financing activities for the years ended
December 31, 2013
,
2012
and
2011
includes capital contributions from our holding company of $28.7 million, $193.4 million and $97.9 million, respectively, which are eliminated in consolidation.
|
|
(2)
|
Net cash used by financing activities for the year ended
December 31, 2013
includes repayments of debt totaling $5.3 million which are eliminated in consolidation. Net cash provided by financing activities for the years ended
December 31, 2012
and
2011
includes additions to debt of $8.8 million and $15.4 million, respectively, which are eliminated in consolidation.
|
Markel Ventures earnings before interest, income taxes, depreciation and amortization (EBITDA) is a non-GAAP financial measure. We use Markel Ventures EBITDA as an operating performance measure in conjunction with U.S. GAAP measures, including revenues and net income, to monitor and evaluate the performance of our Markel Ventures operations. Because EBITDA excludes interest, income taxes, depreciation and amortization, it provides an indicator of economic performance that is useful to both management and investors in evaluating our Markel Ventures businesses as it is not affected by levels of debt, interest rates, effective tax rates or levels of depreciation and amortization resulting from purchase accounting. The following table reconciles EBITDA of Markel Ventures, net of noncontrolling interests, to consolidated net income to shareholders.
|
Years Ended December 31,
|
|||||||||||
|
(dollars in thousands)
|
2013
|
2012
|
2011
|
||||||||
|
Markel Ventures EBITDA - Manufacturing
|
$
|
64,415
|
|
$
|
44,963
|
|
$
|
21,915
|
|
||
|
Markel Ventures EBITDA - Non-Manufacturing
|
19,372
|
|
15,398
|
|
15,410
|
|
|||||
|
Markel Ventures EBITDA - Total
|
83,787
|
|
60,361
|
|
37,325
|
|
|||||
|
Interest expense
(1)
|
(9,283
|
)
|
(9,782
|
)
|
(10,871
|
)
|
|||||
|
Income tax expense
|
(13,988
|
)
|
(7,868
|
)
|
(4,335
|
)
|
|||||
|
Depreciation expense
|
(19,313
|
)
|
(14,205
|
)
|
(5,106
|
)
|
|||||
|
Amortization of intangible assets
|
(17,383
|
)
|
(15,031
|
)
|
(9,267
|
)
|
|||||
|
Markel Ventures net income to shareholders
|
23,820
|
|
13,475
|
|
7,746
|
|
|||||
|
Net income from other Markel operations
|
257,201
|
|
239,910
|
|
134,280
|
|
|||||
|
Net income to shareholders
|
$
|
281,021
|
|
$
|
253,385
|
|
$
|
142,026
|
|
||
|
(1)
|
Interest expense for the years ended
December 31, 2013
,
2012
and
2011
includes intercompany interest expense of $6.4 million, $6.4 million and $6.0 million, respectively.
|
EBITDA from our Markel Ventures manufacturing operations increased in
2013
compared to
2012
primarily due to our acquisition of Reading and more favorable results at AMF. EBITDA from our Markel Ventures manufacturing operations increased in
2012
compared to
2011
primarily due to our acquisitions of Weldship and Havco. EBITDA from our Markel Ventures non-manufacturing operations increased in
2013
compared to
2012
primarily due to our acquisition of Eagle.
113
Interest Expense and Income Taxes
Interest expense was
$114.0 million
in
2013
compared to
$92.8 million
in
2012
and
$86.3 million
in
2011
. The increase in interest expense in
2013
compared to
2012
was due in part to $13.2 million of interest expense associated with our 6.25% unsecured senior notes and 7.20% unsecured senior notes which were assumed in connection with the acquisition of Alterra. Interest expense in 2013 also increased due to our $500 million combined issuance in March 2013 of 3.625% unsecured senior notes and 5.0% unsecured senior notes, partially offset by the repayment of our $250 million 6.80% unsecured notes in February 2013. In 2013, increased interest expense associated with our first full year of interest from our $350 million issuance in July 2012 of 4.90% unsecured senior notes was offset by the redemption of our $150 million 7.50% unsecured senior debentures in August 2012. The increase in interest expense in
2012
compared to
2011
was due in part to our issuance of 4.90% unsecured senior notes in July 2012.
The effective tax rate was
22%
in
2013
compared to
17%
in
2012
and
22%
in
2011
. In all three periods, the effective tax rate differs from the statutory tax rate of 35% primarily as a result of tax-exempt investment income. The increase in the effective tax rate in 2013 was driven by higher earnings taxed at a 35% tax rate and a smaller tax benefit related to tax-exempt investment income, which resulted from having higher income before income taxes in 2013 compared to 2012. The decrease in the effective tax rate in 2012 compared to 2011 was driven by higher earnings from our foreign operations, which were taxed at a lower rate in both 2012 and 2011.
With few exceptions, we are no longer subject to income tax examination by tax authorities for years ended before January 1, 2010. See note 8 of the notes to consolidated financial statements for a discussion of factors affecting the realization of our gross deferred tax assets and unrecognized tax benefits resulting from uncertain tax positions taken or expected to be taken in our income tax returns.
Comprehensiv
e Income to Shareholders
Comprehensive income to shareholders was
$459.5 million
,
$503.8 million
and
$251.9 million
in
2013
,
2012
and
2011
, respectively. Comprehens
ive income to shareholders for
2013
included net income to shareholders of
$281.0 million
and an increase in net unrealized gains on investments, net of taxes, of
$184.6 million
. Co
mprehensive income to shareholders for
2012
included net income to shareholders of
$253.4 million
and an increase in net unrealized gains on investments, net of taxes, of
$242.2 million
. Comprehensive income to shareholders for
2011
included net income to shareholders of
$142.0 million
and an increase in net unrealized gains on investments, net of taxes, of
$123.4 million
.
Claims and Reserves
We maintain reserves for specific claims incurred and reported, reserves for claims incurred but not reported and reserves for uncollectible reinsurance. Our ultimate liability may be greater or less than current reserves. In the insurance industry, there is always the risk that reserves may prove inadequate. We continually monitor reserves using new information on reported claims and a variety of statistical techniques. Anticipated inflation is reflected implicitly in the reserving process through analysis of cost trends and the review of historical development. We do not discount our reserves for losses and loss adjustment expenses to reflect estimated present value, except for reserves assumed in connection with an acquisition, which are recorded at fair value at the acquisition date.
The first line of the following table shows our net reserves for losses and loss adjustment expenses adjusted for commutations, foreign currency movements and other items. This adjustment is accomplished by revising the reserves for losses and loss adjustment expenses as originally estimated at the end of each year and all prior years for reserves either reassumed from reinsurers or ceded back to cedents through reinsurance commutation agreements. Adjustments also are made for the effects of changes in foreign currency rates since the reserves for losses and loss adjustment expenses were originally estimated. Net reserves for losses and loss adjustment expenses of acquired insurance companies are included in the year of acquisition.
The upper portion of the table shows the cumulative amount paid with respect to the previously recorded reserves as of the end of each succeeding year. The lower portion of the table shows the re-estimated amount of the previously recorded reserves based on experience as of the end of each succeeding year, including cumulative payments made since the end of the respective year. For example, the liability for losses and loss adjustment expenses at the end of
2008
for
2008
and all prior years, adjusted for commutations, foreign currency movements and other items, was originally estimated to be
$4,562.0 million
. Five years later, as of
December 31, 2013
, this amount was re-estimated to be
$3,475.1 million
, of which
$2,350.9 million
had been paid, leaving a reserve of $1,124.2 million for losses and loss adjustment expenses for
2008
and prior years remaining unpaid as of
December 31, 2013
.
114
The following table represents the development of reserves for losses and loss adjustment expenses for the period
2003
through
2013
.
|
(dollars in millions)
|
2003
|
2004
|
2005
|
2006
|
2007
|
2008
|
2009
|
2010
|
2011
|
2012
|
2013
|
||||||||||||||||||||||
|
Net reserves, end of year, adjusted for commutations, foreign currency movements and other
|
$
|
3,423.4
|
|
3,834.9
|
|
4,193.3
|
|
4,294.0
|
|
4,343.9
|
|
4,562.0
|
|
4,547.9
|
|
4,613.8
|
|
4,636.6
|
|
4,591.9
|
|
8,407.6
|
|
||||||||||
|
Paid (cumulative) as of:
|
|||||||||||||||||||||||||||||||||
|
One year later
|
679.6
|
|
717.2
|
|
799.5
|
|
783.8
|
|
727.6
|
|
759.5
|
|
796.1
|
|
898.3
|
|
932.0
|
|
906.3
|
|
|||||||||||||
|
Two years later
|
1,194.1
|
|
1,256.5
|
|
1,375.4
|
|
1,312.1
|
|
1,270.8
|
|
1,364.8
|
|
1,417.0
|
|
1,531.0
|
|
1,548.7
|
|
|||||||||||||||
|
Three years later
|
1,597.8
|
|
1,667.4
|
|
1,752.4
|
|
1,689.6
|
|
1,686.3
|
|
1,841.0
|
|
1,881.5
|
|
1,918.5
|
|
|||||||||||||||||
|
Four years later
|
1,914.7
|
|
1,932.9
|
|
2,018.2
|
|
1,994.1
|
|
1,983.9
|
|
2,189.7
|
|
2,118.7
|
|
|||||||||||||||||||
|
Five years later
|
2,105.6
|
|
2,114.0
|
|
2,243.3
|
|
2,201.5
|
|
2,245.4
|
|
2,350.9
|
|
|||||||||||||||||||||
|
Six years later
|
2,235.8
|
|
2,293.2
|
|
2,406.5
|
|
2,396.8
|
|
2,353.7
|
|
|||||||||||||||||||||||
|
Seven years later
|
2,382.1
|
|
2,418.4
|
|
2,581.1
|
|
2,473.2
|
|
|||||||||||||||||||||||||
|
Eight years later
|
2,487.4
|
|
2,545.1
|
|
2,642.7
|
|
|||||||||||||||||||||||||||
|
Nine years later
|
2,604.5
|
|
2,587.0
|
|
|||||||||||||||||||||||||||||
|
Ten years later
|
2,635.0
|
|
|||||||||||||||||||||||||||||||
|
Reserves re-estimated as of:
|
|||||||||||||||||||||||||||||||||
|
One year later
|
3,457.4
|
|
3,784.3
|
|
4,061.0
|
|
4,096.6
|
|
4,180.2
|
|
4,326.6
|
|
4,269.8
|
|
4,260.0
|
|
4,237.6
|
|
4,180.8
|
|
|||||||||||||
|
Two years later
|
3,477.9
|
|
3,629.6
|
|
3,910.6
|
|
3,957.6
|
|
3,944.7
|
|
4,089.8
|
|
3,926.6
|
|
3,884.8
|
|
3,895.5
|
|
|||||||||||||||
|
Three years later
|
3,413.4
|
|
3,545.1
|
|
3,806.7
|
|
3,770.3
|
|
3,730.4
|
|
3,825.0
|
|
3,634.1
|
|
3,629.9
|
|
|||||||||||||||||
|
Four years later
|
3,409.7
|
|
3,517.1
|
|
3,697.1
|
|
3,609.7
|
|
3,529.1
|
|
3,628.8
|
|
3,436.7
|
|
|||||||||||||||||||
|
Five years later
|
3,430.0
|
|
3,470.8
|
|
3,585.2
|
|
3,455.3
|
|
3,380.2
|
|
3,475.1
|
|
|||||||||||||||||||||
|
Six years later
|
3,405.8
|
|
3,388.7
|
|
3,470.7
|
|
3,357.0
|
|
3,266.3
|
|
|||||||||||||||||||||||
|
Seven years later
|
3,349.9
|
|
3,305.5
|
|
3,405.2
|
|
3,285.9
|
|
|||||||||||||||||||||||||
|
Eight years later
|
3,296.6
|
|
3,258.6
|
|
3,355.7
|
|
|||||||||||||||||||||||||||
|
Nine years later
|
3,263.3
|
|
3,224.6
|
|
|||||||||||||||||||||||||||||
|
Ten years later
|
3,239.4
|
|
|||||||||||||||||||||||||||||||
|
Net cumulative redundancy
|
$
|
184.0
|
|
610.3
|
|
837.6
|
|
1,008.1
|
|
1,077.6
|
|
1,086.9
|
|
1,111.2
|
|
983.9
|
|
741.1
|
|
411.1
|
|
||||||||||||
|
Cumulative %
|
5
|
%
|
16
|
%
|
20
|
%
|
23
|
%
|
25
|
%
|
24
|
%
|
24
|
%
|
21
|
%
|
16
|
%
|
9
|
%
|
|||||||||||||
|
Gross reserves, end of year, adjusted for commutations, foreign currency movements and other
|
$
|
4,780.8
|
|
5,206.9
|
|
5,971.7
|
|
5,405.5
|
|
5,294.5
|
|
5,537.7
|
|
5,378.0
|
|
5,383.6
|
|
5,410.8
|
|
5,359.6
|
|
10,262.1
|
|
||||||||||
|
Reinsurance recoverable, adjusted for commutations, foreign currency movements and other
|
1,357.4
|
|
1,372.0
|
|
1,778.4
|
|
1,111.5
|
|
950.6
|
|
975.7
|
|
830.1
|
|
769.8
|
|
774.2
|
|
767.7
|
|
1,854.4
|
|
|||||||||||
|
Net reserves, end of year, adjusted for commutations, foreign currency movements and other
|
$
|
3,423.4
|
|
3,834.9
|
|
4,193.3
|
|
4,294.0
|
|
4,343.9
|
|
4,562.0
|
|
4,547.9
|
|
4,613.8
|
|
4,636.6
|
|
4,591.9
|
|
8,407.6
|
|
||||||||||
|
Gross re-estimated reserves
|
4,562.5
|
|
4,438.6
|
|
4,939.7
|
|
4,235.0
|
|
4,060.5
|
|
4,272.1
|
|
4,135.7
|
|
4,308.9
|
|
4,612.7
|
|
4,886.8
|
|
|||||||||||||
|
Re-estimated recoverable
|
1,323.1
|
|
1,214.0
|
|
1,584.0
|
|
949.1
|
|
794.2
|
|
797.0
|
|
699.0
|
|
679.0
|
|
717.2
|
|
706.0
|
|
|||||||||||||
|
Net re-estimated reserves
|
$
|
3,239.4
|
|
3,224.6
|
|
3,355.7
|
|
3,285.9
|
|
3,266.3
|
|
3,475.1
|
|
3,436.7
|
|
3,629.9
|
|
3,895.5
|
|
4,180.8
|
|
||||||||||||
|
Gross cumulative redundancy
|
$
|
218.3
|
|
768.3
|
|
1,032.0
|
|
1,170.5
|
|
1,234.0
|
|
1,265.6
|
|
1,242.3
|
|
1,074.7
|
|
798.1
|
|
472.8
|
|
||||||||||||
115
Net cumulative redundancy represents the change in the estimate from the original balance sheet date to the date of the current estimate. For example, the liability for losses and loss adjustment expenses developed a
$1,086.9 million
redundancy from
December 31, 2008
to
December 31, 2013
. Conditions and trends that have affected the development of loss reserves in the past may not necessarily occur in the future. Accordingly, it may not be appropriate to extrapolate future redundancies or deficiencies based on the table. Gross cumulative redundancy is presented before deductions for reinsurance. Gross deficiencies and redundancies may be significantly more or less than net deficiencies and redundancies due to the nature and extent of applicable reinsurance. The net and gross cumulative redundancies as of
December 31, 2013
for
2012
and prior years were primarily due to redundancies that developed during
2013
in the Excess and Surplus Lines and London Insurance Market segments on the 2007 to 2012 accident years. See "Underwriting Results" for further discussion of changes in prior years' loss reserves.
See note 9 of the notes to consolidated financial statements and the discussion under "Critical Accounting Estimates" for a discussion of estimates and assumptions related to the reserves for losses and loss adjustment expenses.
Liquidity and Capital Resources
We seek to maintain prudent levels of liquidity and financial leverage for the protection of our policyholders, creditors and shareholders. Our target capital structure includes approximately 30% debt. Our debt to capital ratio was
25%
at
December 31, 2013
and
28%
at
December 31, 2012
. From time to time, our debt to capital ratio may increase due to business opportunities that may be financed in the short term with debt. Alternatively, our debt to capital ratio may fall below our target capital structure, which provides us with additional borrowing capacity to respond when future opportunities arise.
At
December 31, 2013
, our holding company (Markel Corporation) held
$1.3 billion
of invested assets, which approximated 14 times annual interest expense of the holding company, compared to
$1.4 billion
of invested assets at
December 31, 2012
. The decrease in invested assets is primarily the result of cash paid for the Alterra acquisition of approximately $1.0 billion, the repayment of our $250 million 6.80% unsecured senior notes in February 2013 and cash paid for interest and income taxes, partially offset by dividends received from our subsidiaries of $791.0 million and our $500 million combined issuance in March 2013 of 3.625% and 5.0% unsecured senior notes. In order to maintain prudent levels of liquidity, we seek to maintain invested assets at Markel Corporation of at least two times annual interest expense. The excess liquidity at Markel Corporation is available to increase capital at our insurance subsidiaries, complete acquisitions, repurchase shares of our common stock or retire debt.
Under the terms of the agreements in which we acquired controlling interests in certain Markel Ventures subsidiaries, the remaining equity interests have the option to sell their interests to us in the future. These redeemable noncontrolling interests generally become redeemable through 2018; however, the occurrence, timing and redemption value of these transactions is uncertain. As of
December 31, 2013
, redeemable noncontrolling interests totaled
$72.2 million
.
In October 2010, we completed our acquisition of Aspen Holdings, Inc. (Aspen). As part of the consideration for this acquisition, Aspen shareholders received contingent value rights that may result in the payment of additional cash consideration depending, among other things, upon the development of pre-acquisition loss reserves and loss sensitive profit commissions over time. Based on current expectations, we do not believe contingent consideration payments, if any, related to these contingent value rights would have a material impact on our liquidity.
During 2013, we repurchased 77,693 shares of common stock at a cost of $40.9 million under a share repurchase program that was approved by our Board of Directors in November 2010 (the 2010 Program). As of
December 31, 2013
, we had repurchased
232,535
shares of common stock at a cost of
$101.4 million
under the 2010 Program. In November 2013, our Board of Directors approved a new share repurchase program that provides for the repurchase of up to
$300 million
of common stock (the 2013 Program) to replace the 2010 Program. The 2013 Program has no expiration date but may be terminated by the Board of Directors at any time. As of
December 31, 2013
, we had not repurchased any shares of common stock under the 2013 Program.
Our insurance operations collect premiums and pay claims, reinsurance costs and operating expenses. Premiums collected and positive cash flows from the insurance operations are invested primarily in short-term investments and long-term fixed maturities. Short-term investments held by our insurance subsidiaries provide liquidity for projected claims, reinsurance costs and operating expenses. As a holding company, Markel Corporation receives cash from its subsidiaries as reimbursement for operating and other administrative expenses it incurs. The reimbursements are made within the guidelines of various management agreements between the holding company and its subsidiaries.
116
The holding company has historically relied upon dividends from its domestic subsidiaries to meet debt service obligations. Under the insurance laws of the various states in which our domestic insurance subsidiaries are incorporated, an insurer is restricted in the amount of dividends it may pay without prior approval of regulatory authorities. At
December 31, 2013
, our domestic insurance subsidiaries and Markel Bermuda could pay ordinary dividends of
$672.7 million
during the following twelve months under these laws.
There are also regulatory restrictions on the amount of dividends that our foreign insurance subsidiaries may pay based on applicable laws in Ireland and the United Kingdom. At
December 31, 2013
, earnings of our foreign subsidiaries are considered reinvested indefinitely for U.S. income tax purposes. At
December 31, 2013
, cash and cash equivalents, restricted cash and cash equivalents and short-term investments of $1.3 billion were held by our foreign subsidiaries. We do not expect the amount of cash and cash equivalents, restricted cash and cash equivalents and short-term investments that are attributable to earnings that are considered reinvested indefinitely, and not available for distributions to the holding company, to have a material effect on our liquidity or capital resources.
Net cash provided by operating activities was
$745.5 million
,
$392.5 million
and
$311.3 million
in
2013
,
2012
and
2011
, respectively. The increase in
2013
compared to
2012
was due to higher cash flows from underwriting and investing activities, primarily as a result of the acquisition of Alterra. The increase in cash flows from underwriting activities was also driven by higher premium volume, primarily in our Specialty Admitted and Excess and Surplus Lines segments. The increase in
2012
compared to
2011
was due to higher cash flows from underwriting activities, as a result of higher premium volume in in our Excess and Surplus Lines, Specialty Admitted and London Insurance Market segments, and higher cash flows from our Markel Ventures operations, primarily due to recent acquisitions.
Net cash provided by investing activities was
$187.4 million
in
2013
compared to net cash used by investing activities of
$377.1 million
and
$491.1 million
in
2012
and
2011
, respectively. During 2013, we used net cash of $12.2 million for acquisitions. The acquisition of Alterra resulted in net cash received as a result of Alterra's cash balance exceeding cash paid for the acquisition by $49.5 million. Net cash used by investing activities in 2012 and 2011 included
$243.7 million
and
$120.1 million
of cash, net of cash acquired, used to complete acquisitions in
2012
and
2011
, respectively. See note 2 of the notes to consolidated financial statements for a discussion of acquisitions. We received cash of $236.9 million during 2013 for redemptions from our hedge fund portfolio acquired through the Alterra acquisition, which is included in other assets on the consolidated balance sheet. During 2011 and 2012, we increased our holdings of equity securities to capitalize on opportunities in the equity markets. Also during this time, we increased our holdings of cash and cash equivalents and short-term investments and reduced our holdings of fixed maturities. During 2013, we have continued to limit our allocation of funds for purchases of fixed maturities. Due to the current low interest rate environment, we have chosen to take a more defensive posture, earning lower investment yields in order to maintain a high level of liquidity and have flexibility in how we allocate capital. We began repositioning the investment portfolio acquired through the Alterra acquisition to be more consistent with our target investment portfolio allocation by replacing fixed maturity corporate and mortgage-backed securities with fixed maturity tax-exempt municipal securities and equity securities. Cash flow from investing activities is affected by various factors such as anticipated payment of claims, financing activity, acquisition opportunities and individual buy and sell decisions made in the normal course of our investment portfolio management.
Invested assets increased to
$17.6 billion
at
December 31, 2013
from
$9.3 billion
at
December 31, 2012
, primarily due to the acquisition of Alterra. Net unrealized gains on investments, net of taxes, were $1.1 billion at
December 31, 2013
compared to $946.9 million at
December 31, 2012
. The increase in net unrealized gains on investments, net of taxes, in 2013 was primarily due to an increase in the estimated fair value of our equity portfolio as a result of improving market conditions during 2013. Equity securities were
$3.3 billion
, or
18%
of invested assets, at
December 31, 2013
compared to
$2.4 billion
, or
26%
of invested assets, at
December 31, 2012
. See note 3(h) of the notes to consolidated financial statements for a discussion of restricted assets.
117
Net cash provided by financing activities was
$175.4 million
,
$142.0 million
and
$194.6 million
in
2013
,
2012
and
2011
respectively. During 2013, we received net proceeds of $491.2 million associated with the issuance of $250 million of 3.625% unsecured senior notes due March 30, 2023 and $250 million of 5.0% unsecured senior notes due March 30, 2043. On February 15, 2013, we repaid our 6.80% unsecured senior notes, which had an outstanding principal balance of $246.7 million. During 2012, we received net proceeds of $347.2 million associated with the issuance of $350 million of 4.90% unsecured senior notes due July 1, 2022. We used a portion of these proceeds to redeem our 7.50% unsecured debentures due August 22, 2046 at a redemption price equal to 100% of their principal amount, or $150 million. Proceeds were also used to pre-fund the repayment of our 6.80% unsecured senior notes due February 15, 2013 at their maturity ($246.7 million principal amount outstanding at December 31, 2012). During 2011, we received net proceeds of $247.9 million associated with the issuance of $250 million of 5.35% unsecured senior notes due June 1, 2021. During 2013, 2012 and 2011, cash of $57.4 million, $16.9 million and $42.9 million, respectively, was used to repurchase shares of our common stock.
In recent years, we have completed numerous reinsurance commutations, which involve the termination of ceded or assumed reinsurance contracts. Our commutation strategy related to ceded reinsurance contracts is to reduce credit exposure and eliminate administrative expenses associated with the run-off of reinsurance placed with certain reinsurers. Our commutation strategy related to assumed reinsurance contracts is to reduce our loss exposure to long-tailed liabilities assumed under reinsurance agreements entered into prior to our acquisition of Markel International. We will continue to pursue commutations when we believe they meet our objectives.
We have credit risk to the extent any of our reinsurers are unwilling or unable to meet their obligations under our ceded reinsurance agreements. We attempt to minimize credit exposure to reinsurers through adherence to internal reinsurance guidelines. We monitor changes in the financial conditions of our reinsurers, and we assess our concentration of credit risk on a regular basis. At
December 31, 2013
, our reinsurance recoverable balance for the ten largest reinsurers was $1.3 billion, representing 62% of our consolidated balance, before considering allowances for bad debts. All of our ten largest reinsurers were rated "A" or better by A.M. Best. We are the beneficiary of letters of credit, trust accounts and funds withheld in the aggregate amount of $123.1 million at
December 31, 2013
, collateralizing reinsurance recoverable balances due from our ten largest reinsurers. See note 16 of the notes to consolidated financial statements for further discussion of reinsurance recoverables and exposures. While we believe that net reinsurance recoverable balances are collectible, deterioration in reinsurers' ability to pay or collection disputes could adversely affect our operating cash flows, financial position and results of operations.
The following table reconciles case reserves and IBNR reserves, by segment, to unpaid losses and loss adjustment expenses. As described in note 2 to consolidated financial statements, unpaid losses and loss adjustment expenses attributable to Alterra were recorded at fair value as of the Acquisition Date, which consists of the present value of the expected net loss and loss adjustment expense payments plus a risk premium. Unpaid losses and loss adjustment expenses included in the consolidated balance sheet include the unamortized portion of the fair value adjustment recorded at the Acquisition Date; however, as this amount does not represent case or IBNR reserves, it is excluded from the table below.
|
(dollars in thousands)
|
Excess &
Surplus
Lines
|
Specialty
Admitted
|
London
Insurance
Market
|
Alterra
|
Other
Insurance
(Discontinued
Lines)
|
Consolidated
|
|||||||||||||||||
|
December 31, 2013
|
|||||||||||||||||||||||
|
Case reserves
|
$
|
529,391
|
|
$
|
295,988
|
|
$
|
889,425
|
|
$
|
1,605,947
|
|
$
|
278,383
|
|
$
|
3,599,134
|
|
|||||
|
IBNR reserves
|
1,468,968
|
|
582,576
|
|
1,020,187
|
|
3,254,311
|
|
200,416
|
|
6,526,458
|
|
|||||||||||
|
Total
|
$
|
1,998,359
|
|
$
|
878,564
|
|
$
|
1,909,612
|
|
$
|
4,860,258
|
|
$
|
478,799
|
|
$
|
10,125,592
|
|
|||||
|
December 31, 2012
|
|||||||||||||||||||||||
|
Case reserves
|
$
|
600,002
|
|
$
|
269,163
|
|
$
|
933,992
|
|
$
|
—
|
|
$
|
273,354
|
|
$
|
2,076,511
|
|
|||||
|
IBNR reserves
|
1,552,251
|
|
526,930
|
|
1,024,257
|
|
—
|
|
191,477
|
|
3,294,915
|
|
|||||||||||
|
Total
|
$
|
2,152,253
|
|
$
|
796,093
|
|
$
|
1,958,249
|
|
$
|
—
|
|
$
|
464,831
|
|
$
|
5,371,426
|
|
|||||
118
Unpaid losses and loss adjustment expenses were
$10.3 billion
and
$5.4 billion
at December 31, 2013 and 2012, respectively. The decrease in the Excess and Surplus Lines segment's loss reserves in
2013
was due in part to a decrease in IBNR reserves, primarily as a result of a decrease in the severity and frequency of losses on our professional and products liability and casualty programs, as actual claims reporting patterns on prior accident years have been more favorable than we initially anticipated. The increase in the Specialty Admitted segment's loss reserves in
2013
was primarily due to increased premium volume in 2013 compared to 2012. See note 9 of the notes to consolidated financial statements and "Critical Accounting Estimates" for a discussion of estimates and assumptions related to unpaid losses and loss adjustment expenses.
The following table summarizes our contractual cash payment obligations at
December 31, 2013
.
|
Payments Due by Period
(1)
|
|||||||||||||||||||
|
(dollars in thousands)
|
Total
|
Less than 1
year
|
1-3 years
|
4-5 years
|
More than
5 years
|
||||||||||||||
|
Senior long-term debt and other debt
(2)
|
$
|
3,560,302
|
|
$
|
157,186
|
|
$
|
271,886
|
|
$
|
348,073
|
|
$
|
2,783,157
|
|
||||
|
Operating leases
|
299,723
|
|
32,783
|
|
52,091
|
|
54,395
|
|
160,454
|
|
|||||||||
|
Abbey acquisition commitment
|
190,000
|
|
190,000
|
|
—
|
|
—
|
|
—
|
|
|||||||||
|
Unpaid losses and loss adjustment expenses (estimated)
|
10,125,592
|
|
2,104,431
|
|
3,163,505
|
|
1,763,568
|
|
3,094,088
|
|
|||||||||
|
Life and annuity benefits (estimated)
|
2,072,013
|
|
105,971
|
|
201,227
|
|
187,320
|
|
1,577,495
|
|
|||||||||
|
Total
|
$
|
16,247,630
|
|
$
|
2,590,371
|
|
$
|
3,688,709
|
|
$
|
2,353,356
|
|
$
|
7,615,194
|
|
||||
|
(1)
|
See notes 2, 9, 10, 11 and 17 of the notes to consolidated financial statements for further discussion of these obligations.
|
|
(2)
|
Amounts include interest.
|
Senior long-term debt and other debt, excluding unamortized discount, was
$2.3 billion
and
$1.5 billion
at
December 31, 2013
and
2012
, respectively. Effective July 12, 2013, the capacity of our revolving credit facility was increased from $150 million to
$300 million
. As of
December 31, 2013
and
2012
, there were no amounts outstanding under our revolving credit facility. As of
December 31, 2013
, there were no borrowings outstanding under our
$900 million
senior credit facility and there were
$472.3 million
of letters of credit that were issued and outstanding.
We were in compliance with all covenants contained in our revolving and senior credit facilities at
December 31, 2013
. To the extent that we are not in compliance with our covenants, our access to the credit facilities could be restricted. While we believe this to be unlikely, the inability to access the credit facility could adversely affect our liquidity. See note 11 of the notes to consolidated financial statements for further discussion of our revolving and senior credit facilities.
On October 9, 2013, we made an offer to purchase the entire issued and to be issued share capital of Abbey, an integrated specialty insurance and consultancy group. We completed the acquisition on January 17, 2014 for a total cash purchase price of
$190.0 million
.
Reserves for unpaid losses and loss adjustment expenses represent future contractual obligations associated with property and casualty insurance and reinsurance contracts issued to our policyholders or other insurance companies. Information presented in the table of contractual cash payment obligations is an estimate of our future payment of claims as of
December 31, 2013
. Payment patterns for losses and loss adjustment expenses were generally based upon historical claims patterns. Each claim is settled individually based upon its merits and certain claims may take years to settle, especially if legal action is involved. The actual cash payments for settled claims will vary, possibly significantly, from the estimates shown in the preceding table. The unpaid losses and loss adjustment expenses in the table above are our gross estimates of known liabilities as of December 31, 2013. The expected payments by period are the estimated payments at a future time, whereas the reserves for unpaid losses and loss adjustment expenses included in the consolidated balance sheet include the unamortized portion of the fair value adjustment recorded at the Acquisition Date for unpaid losses and loss adjustment expenses assumed in the Alterra acquisition.
119
Reserves for life and annuity benefits represent future contractual obligations associated with reinsurance contracts issued to other insurance companies. Information presented in the table of contractual cash payment obligations is an estimate of our future payment of benefits as of
December 31, 2013
. The assumptions used in estimating the likely payments due by period are based on cedent experience, industry mortality tables, and our expense experience. Due to the inherent uncertainty in the process of estimating the timing of such payments, there is a risk that the amounts paid in any such period can be significantly different from the estimates shown in the preceding table. The life and annuity benefits in the above table are our gross estimates of known obligations as of
December 31, 2013
. These obligations are computed on a net present value basis in the consolidated balance sheet as of December 31, 2013, whereas the expected payments by period in the table above are the estimated payments at a future time and do not reflect a discount of the amount payable.
At
December 31, 2013
, we had unrecognized tax benefits of
$18.2 million
related to uncertain tax positions. Due to the high degree of uncertainty regarding the timing of potential future cash flows associated with our unrecognized tax benefits, we are unable to make a reasonably reliable estimate of the amount and period in which any liabilities might be paid. See note 8 of the notes to consolidated financial statements for further discussion of our expectations regarding changes in unrecognized tax benefits during
2014
.
At
December 31, 2013
, we had
$5.2 billion
of invested assets or other assets held in trust or on deposit for the benefit of policyholders or ceding companies or to support underwriting activities. Additionally, we have pledged investments and cash and cash equivalents totaling
$695.1 million
at
December 31, 2013
as security for letters of credit that have been issued by various banks on our behalf. These invested assets and the related liabilities are included on our consolidated balance sheet. See note 3(h) of the notes to consolidated financial statements for further discussion of restrictions over our invested assets.
Our insurance operations require capital to support premium writings, and we remain committed to maintaining adequate capital and surplus at each of our insurance subsidiaries. The National Association of Insurance Commissioners (NAIC) developed a model law and risk-based capital formula designed to help regulators identify domestic property and casualty insurers that may be inadequately capitalized. Under the NAIC's requirements, a domestic insurer must maintain total capital and surplus above a calculated threshold or face varying levels of regulatory action. Capital adequacy of our foreign insurance subsidiaries is regulated by applicable laws of the United Kingdom, Bermuda and other jurisdictions. At
December 31, 2013
, the capital and surplus of each of our insurance subsidiaries significantly exceeded the amount of statutory capital and surplus necessary to satisfy regulatory requirements.
We have access to various capital sources, including dividends from certain of our insurance subsidiaries, holding company invested assets, undrawn capacity under our revolving and senior credit facilities and access to the debt and equity capital markets. We believe that we have sufficient liquidity to meet our capital needs.
Market Risk Disclosures
Market risk is the risk of economic losses due to adverse changes in the estimated fair value of a financial instrument as the result of changes in equity prices, interest rates, foreign currency exchange rates and commodity prices. Our consolidated balance sheets include assets and liabilities with estimated fair values that are subject to market risk. Our primary market risks have been equity price risk associated with investments in equity securities, interest rate risk associated with investments in fixed maturities and foreign currency exchange rate risk associated with our international operations. Various companies within our Markel Ventures operations are subject to commodity risk; however, this risk is not material to the Company.
Credit risk is the potential loss resulting from adverse changes in an issuer's ability to repay its debt obligations. General concern exists about the number of municipalities experiencing financial difficulties in light of the adverse economic conditions experienced over the past several years. We manage the exposure to credit risk in our municipal bond portfolio by investing in high quality securities and by diversifying our holdings, which are typically either general obligation or revenue bonds related to essential products and services.
We monitor our investment portfolio to ensure that credit risk does not exceed prudent levels. We have consistently invested in high credit quality, investment grade securities. Our fixed maturity portfolio has an average rating of "AA," with approximately 97% rated "A" or better by at least one nationally recognized rating organization. Our policy is to invest in investment grade securities and to minimize investments in fixed maturities that are unrated or rated below investment grade. At
December 31, 2013
, less than 1% of our fixed maturity portfolio was unrated or rated below investment grade. Our fixed maturity portfolio includes securities issued with financial guaranty insurance. We purchase fixed maturities based on our assessment of the credit quality of the underlying assets without regard to insurance.
120
Our fixed maturity portfolio includes securities issued by foreign governments. General concern exists about the financial difficulties facing certain European countries in light of the adverse economic conditions experienced over the past several years. We monitor developments in foreign countries, currencies and issuers that could pose risks to our fixed maturity portfolio, including ratings downgrades, political and financial changes and the widening of credit spreads. We believe that our fixed maturity portfolio is highly diversified and is comprised of high quality securities.
We obtain information from news services, rating agencies and various financial market participants to assess potential negative impacts on a country or company's financial risk profile. We analyze concentrations within our fixed maturity portfolio by country, currency and issuer, which allows us to assess our level of diversification with respect to these exposures, reduce troubled exposures should they occur and mitigate any future financial distress that these exposures could cause. The following tables present the estimated fair values of foreign exposures included in our fixed maturity portfolio.
|
December 31, 2013
|
|||||||||||||||
|
(dollars in thousands)
|
Sovereign
|
Non-Sovereign
Financial
Institutions
|
Non-Sovereign
Non-Financial
Institutions
|
Total
|
|||||||||||
|
European exposures:
|
|||||||||||||||
|
Portugal, Ireland, Italy, Greece and Spain
|
$
|
—
|
|
$
|
42,966
|
|
$
|
2,684
|
|
$
|
45,650
|
|
|||
|
Eurozone (excluding Portugal, Ireland, Italy, Greece and Spain)
|
888,653
|
|
319,343
|
|
159,509
|
|
1,367,505
|
|
|||||||
|
Supranationals
|
—
|
|
226,462
|
|
—
|
|
226,462
|
|
|||||||
|
Other
|
85,478
|
|
184,681
|
|
183,646
|
|
453,805
|
|
|||||||
|
Total European exposures
|
974,131
|
|
773,452
|
|
345,839
|
|
2,093,422
|
|
|||||||
|
All other foreign (non-European) exposures
|
486,923
|
|
138,960
|
|
141,601
|
|
767,484
|
|
|||||||
|
Total foreign exposures
|
$
|
1,461,054
|
|
$
|
912,412
|
|
$
|
487,440
|
|
$
|
2,860,906
|
|
|||
|
December 31, 2012
|
|||||||||||||||
|
(dollars in thousands)
|
Sovereign
|
Non-Sovereign
Financial
Institutions
|
Non-Sovereign
Non-Financial
Institutions
|
Total
|
|||||||||||
|
European exposures:
|
|||||||||||||||
|
Portugal, Ireland, Italy, Greece and Spain
|
$
|
—
|
|
$
|
36,233
|
|
$
|
2,641
|
|
$
|
38,874
|
|
|||
|
Eurozone (excluding Portugal, Ireland, Italy, Greece and Spain)
|
146,173
|
|
170,758
|
|
102,952
|
|
419,883
|
|
|||||||
|
Supranationals
|
—
|
|
113,025
|
|
—
|
|
113,025
|
|
|||||||
|
Other
|
6,442
|
|
19,803
|
|
71,132
|
|
97,377
|
|
|||||||
|
Total European exposures
|
152,615
|
|
339,819
|
|
176,725
|
|
669,159
|
|
|||||||
|
All other foreign (non-European) exposures
|
403,993
|
|
73,019
|
|
54,420
|
|
531,432
|
|
|||||||
|
Total foreign exposures
|
$
|
556,608
|
|
$
|
412,838
|
|
$
|
231,145
|
|
$
|
1,200,591
|
|
|||
The estimated fair value of our investment portfolio at
December 31, 2013
was
$17.6 billion
,
82%
of which was invested in fixed maturities, short-term investments, cash and cash equivalents and restricted cash and cash equivalents and
18%
of which was invested in equity securities. At
December 31, 2012
, the estimated fair value of our investment portfolio was
$9.3 billion
,
74%
of which was invested in fixed maturities, short-term investments, cash and cash equivalents and restricted cash and cash equivalents and
26%
of which was invested in equity securities.
121
Our fixed maturities, equity securities and short-term investments are recorded at fair value, which is measured based upon quoted prices in active markets, if available. We determine fair value for these investments after considering various sources of information, including information provided by a third party pricing service. The pricing service provides prices for substantially all of our fixed maturities and equity securities. In determining fair value, we generally do not adjust the prices obtained from the pricing service. We obtain an understanding of the pricing service's valuation methodologies and related inputs, which include, but are not limited to, reported trades, benchmark yields, issuer spreads, bids, offers, duration, credit ratings, estimated cash flows and prepayment speeds. We validate prices provided by the pricing service by reviewing prices from other pricing sources and analyzing pricing data in certain instances.
Equity Price Risk
We invest a portion of shareholder funds in equity securities, which have historically produced higher long-term returns relative to fixed maturities. We seek to invest in profitable companies, with honest and talented management, that exhibit reinvestment opportunities and capital discipline, at reasonable prices. We intend to hold these investments over the long term and focus on long-term total investment return, understanding that the level of unrealized gains or losses on investments may vary from one period to the next. The changes in the estimated fair value of the equity portfolio are presented as a component of shareholders' equity in accumulated other comprehensive income, net of taxes. See note 3(a) of the notes to consolidated financial statements for disclosure of gross unrealized gains and losses by investment category.
At
December 31, 2013
, our equity portfolio was concentrated in terms of the number of issuers and industries. Such concentrations can lead to higher levels of price volatility. At
December 31, 2013
, our ten largest equity holdings represented
$1.5 billion
, or
46%
, of the equity portfolio. Investments in the property and casualty insurance industry represented
$568.3 million
, or
17%
, of our equity portfolio at
December 31, 2013
. Our investments in the property and casualty insurance industry included a
$371.1 million
investment in the common stock of Berkshire Hathaway Inc., a company whose subsidiaries engage in a number of diverse business activities in addition to insurance. We have investment guidelines that set limits on the equity holdings of our insurance subsidiaries.
The following table summarizes our equity price risk and shows the effect of a hypothetical 35% increase or decrease in market prices as of
December 31, 2013
and
2012
. The selected hypothetical changes do not indicate what could be the potential best or worst case scenarios.
|
(dollars in millions)
|
Estimated
Fair Value
|
Hypothetical
Price Change
|
Estimated
Fair Value after
Hypothetical
Change in Prices
|
Estimated
Hypothetical
Percentage Increase
(Decrease) in
Shareholders' Equity
|
||||||||
|
As of December 31, 2013
|
||||||||||||
|
Equity securities
|
$
|
3,252
|
|
35% increase
|
$
|
4,390
|
|
11.4
|
%
|
|||
|
35% decrease
|
2,114
|
|
(11.4
|
)%
|
||||||||
|
As of December 31, 2012
|
||||||||||||
|
Equity securities
|
$
|
2,407
|
|
35% increase
|
$
|
3,249
|
|
14.7
|
%
|
|||
|
35% decrease
|
1,565
|
|
(14.7
|
)%
|
||||||||
Interest Rate Risk
Our fixed maturity investments and borrowings are subject to interest rate risk. Increases and decreases in interest rates typically result in decreases and increases, respectively, in the fair value of these financial instruments.
The majority of our investable assets come from premiums paid by policyholders. These funds are invested predominantly in high quality corporate, government and municipal bonds with relatively short durations. The fixed maturity portfolio, including short-term investments and cash and cash equivalents, has an average duration of 3.4 years and an average rating of "AA." See note 3(c) of the notes to consolidated financial statements for disclosure of contractual maturity dates of our fixed maturity portfolio. The changes in the estimated fair value of the fixed maturity portfolio are presented as a component of shareholders' equity in accumulated other comprehensive income, net of taxes.
We work to manage the impact of interest rate fluctuations on our fixed maturity portfolio. The effective duration of the fixed maturity portfolio is managed with consideration given to the estimated duration of our liabilities. We have investment guidelines that limit the maximum duration and maturity of the fixed maturity portfolio.
122
We use a commercially available model to estimate the effect of interest rate risk on the fair values of our fixed maturity portfolio and borrowings. The model estimates the impact of interest rate changes on a wide range of factors including duration, prepayment, put options and call options. Fair values are estimated based on the net present value of cash flows, using a representative set of possible future interest rate scenarios. The model requires that numerous assumptions be made about the future. To the extent that any of the assumptions are invalid, incorrect estimates could result. The usefulness of a single point-in-time model is limited, as it is unable to accurately incorporate the full complexity of market interactions.
The following table summarizes our interest rate risk and shows the effect of hypothetical changes in interest rates as of
December 31, 2013
and
2012
. The selected hypothetical changes do not indicate what could be the potential best or worst case scenarios.
|
(dollars in millions)
|
Estimated
Fair Value
|
Hypothetical
Change in
Interest Rates
(bp=basis points)
|
Estimated
Fair Value after
Hypothetical Change
in Interest Rates
|
Hypothetical Percentage
Increase (Decrease) in
|
|||||||||||
|
Fair Value of
Fixed Maturities
|
Shareholders'
Equity
|
||||||||||||||
|
Fixed Maturity Investments
|
|||||||||||||||
|
As of December 31, 2013
|
|||||||||||||||
|
Total fixed maturity investments
|
$
|
10,143
|
|
200 bp decrease
|
$
|
11,231
|
|
10.7
|
%
|
10.9
|
%
|
||||
|
100 bp decrease
|
10,661
|
|
5.1
|
%
|
5.2
|
%
|
|||||||||
|
100 bp increase
|
9,636
|
|
(5.0
|
)%
|
(5.1
|
)%
|
|||||||||
|
200 bp increase
|
9,163
|
|
(9.7
|
)%
|
(9.8
|
)%
|
|||||||||
|
As of December 31, 2012
|
|||||||||||||||
|
Total fixed maturity investments
|
$
|
4,979
|
|
200 bp decrease
|
$
|
5,376
|
|
8.0
|
%
|
7.1
|
%
|
||||
|
100 bp decrease
|
5,175
|
|
3.9
|
%
|
3.5
|
%
|
|||||||||
|
100 bp increase
|
4,777
|
|
(4.1
|
)%
|
(3.6
|
)%
|
|||||||||
|
200 bp increase
|
4,560
|
|
(8.4
|
)%
|
(7.4
|
)%
|
|||||||||
|
Liabilities
(1)
|
|||||||||||||||
|
As of December 31, 2013
|
|||||||||||||||
|
Borrowings
|
$
|
2,372
|
|
200 bp decrease
|
$
|
2,752
|
|
||||||||
|
100 bp decrease
|
2,550
|
|
|||||||||||||
|
100 bp increase
|
2,213
|
|
|||||||||||||
|
200 bp increase
|
2,072
|
|
|||||||||||||
|
As of December 31, 2012
|
|||||||||||||||
|
Borrowings
|
$
|
1,688
|
|
200 bp decrease
|
$
|
1,916
|
|
||||||||
|
100 bp decrease
|
1,796
|
|
|||||||||||||
|
100 bp increase
|
1,591
|
|
|||||||||||||
|
200 bp increase
|
1,503
|
|
|||||||||||||
|
(1)
|
Changes in estimated fair value have no impact on shareholders' equity.
|
Foreign Currency Exchange Rate Risk
We have foreign currency exchange rate risk associated with our assets and liabilities. We manage this risk primarily by matching assets and liabilities in each foreign currency, other than goodwill and intangible assets, as closely as possible. To assist with the matching of assets and liabilities in foreign currencies, we periodically purchase foreign currency forward contracts and we purchase or sell foreign currencies in the open market. Our forward contracts are generally designated as specific hedges for financial reporting purposes. As such, realized and unrealized gains and losses on these hedges are recorded as currency translation adjustments and are part of other comprehensive income. Our contracts generally have maturities of three months. As of
December 31, 2013
and
2012
, the carrying value of goodwill and intangible assets denominated in a foreign currency, which is not matched or hedged, was $86.3 million and $91.7 million, respectively.
123
At
December 31, 2013
and
2012
, approximately 83% and 88%, respectively, of our invested assets were denominated in United States Dollars. At those dates, the largest foreign currency exposure within our invested assets was United Kingdom Sterling. At
December 31, 2013
and
2012
, substantially all of our assets and liabilities denominated in foreign currencies were either matched or hedged, and therefore, we have no material foreign currency exposure.
Impact of Inflation
Property and casualty insurance premiums are established before the amount of losses and loss adjustment expenses, or the extent to which inflation may affect such expenses, is known. Consequently, in establishing premiums, we attempt to anticipate the potential impact of inflation. We also consider inflation in the determination and review of reserves for losses and loss adjustment expenses and life and annuity benefits since portions of these reserves are expected to be paid over extended periods of time. This is especially true for our long-tailed lines of business. Alterra previously offered life and annuity reinsurance products. Although this business is in run-off, we must monitor the effects inflation and changing interest rates have on the related reserves. We regularly complete loss recognition testing to ensure that held reserves are sufficient to meet our future claim obligations in the current investment environment.
Controls and Procedures
As of
December 31, 2013
, we carried out an evaluation of the effectiveness of the design and operation of our disclosure controls and procedures pursuant to Securities Exchange Act Rule 13a-15 (Disclosure Controls). This evaluation was conducted under the supervision and with the participation of our management, including the Chief Executive Officer (CEO) and the Chief Financial Officer (CFO).
Our management, including the CEO and CFO, does not expect that our Disclosure Controls will prevent all error and all fraud. A control system, no matter how well conceived and operated, can provide only reasonable, not absolute, assurance that the objectives of the control system are met. Further, the design of a control system must reflect the fact that there are resource constraints, and the benefits of controls must be considered relative to their costs. Because of the inherent limitations in all control systems, no evaluation of controls can provide absolute assurance that all control issues and instances of fraud, if any, have been detected. These inherent limitations include the realities that judgments in decision making can be faulty, and that breakdowns can occur because of simple error or mistake. The design of any system of controls also is based in part upon certain assumptions about the likelihood of future events, and there can be no assurance that any design will succeed in achieving its stated goals under all potential future conditions.
Based upon our controls evaluation, the CEO and CFO concluded that effective Disclosure Controls were in place to ensure that the information required to be disclosed in reports we file or submit under the Securities Exchange Act of 1934 is recorded, processed, summarized and reported within the time periods specified in the Securities and Exchange Commission's rules and forms.
Pursuant to Section 404 of the Sarbanes-Oxley Act of 2002, we carried out an evaluation, under the supervision and with the participation of our management, including the CEO and the CFO, of the effectiveness of our internal control over financial reporting as of
December 31, 2013
. See Management's Report on Internal Control over Financial Reporting and our independent registered public accounting firm's attestation report on the effectiveness of our internal control over financial reporting.
During the fourth quarter of 2013, we implemented the Hyperion Financial Management financial consolidation software application for Markel Ventures. This application allows us to more efficiently perform the financial consolidation of the Markel Ventures affiliates and associated financial reporting. Application based security provides an enhanced control environment related to Markel Ventures financial reporting.
Th
ere w
ere no other changes in ou
r internal control over financial reporting during the fourth quarter of
2013
that materially affected, or are reasonably likely to materially affect, our internal control over financial reporting.
124
Safe Harbor and Cautionary Statement
This report contains statements concerning or incorporating our expectations, assumptions, plans, objectives, future financial or operating performance and other statements that are not historical facts. These statements are "forward-looking statements" within the meaning of the Private Securities Litigation Reform Act of 1995. Such statements may use words such as "anticipate," "believe," "estimate," "expect," "intend," "predict," "project" and similar expressions as they relate to us or our management.
There are risks and uncertainties that may cause actual results to differ materially from predicted results in forward-looking statements. Factors that may cause actual results to differ are often presented with the forward-looking statements themselves. Additional factors that could cause actual results to differ from those predicted are set forth under "Risk Factors" or are included in the items listed below:
|
•
|
our anticipated premium volume is based on current knowledge and assumes no significant man-made or natural catastrophes, no significant changes in products or personnel and no adverse changes in market conditions;
|
|
•
|
the effect of cyclical trends, including demand and pricing in the insurance and reinsurance markets;
|
|
•
|
actions by competitors, including consolidation, and the effect of competition on market trends and pricing;
|
|
•
|
we offer insurance and reinsurance coverage against terrorist acts in connection with some of our programs, and in other instances we are legally required to offer terrorism insurance; in both circumstances, we actively manage our exposure, but if there is a covered terrorist attack, we could sustain material losses;
|
|
•
|
the frequency and severity of man-made and natural catastrophes (including earthquakes and weather-related catastrophes) may exceed expectations, are unpredictable and, in the case of weather-related catastrophes, may be exacerbated if, as many forecast, conditions in the oceans and atmosphere result in increased hurricane or other adverse weather-related activity;
|
|
•
|
emerging claim and coverage issues, changing legal and social trends, and inherent uncertainties (including but not limited to those uncertainties associated with our A&E reserves) in the loss estimation process can adversely impact the adequacy of loss reserves and the allowance for reinsurance recoverables;
|
|
•
|
reinsurance reserves are subject to greater uncertainty than insurance reserves primarily because of reliance upon the original underwriting decisions made by ceding companies and the longer lapse of time from the occurrence of loss events to their reporting to the reinsurer for ultimate resolution;
|
|
•
|
changes in the assumptions and estimates used in establishing reserves for our life and annuity reinsurance book (which is in runoff), for example, mortality, longevity, morbidity and interest rates, could result in material increases in our estimated loss reserves for such business;
|
|
•
|
adverse developments in insurance coverage litigation or other legal or administrative proceedings could result in material increases in our estimates of loss reserves;
|
|
•
|
the failure of any loss limitation methods employed;
|
|
•
|
changes in the availability, costs and quality of reinsurance coverage which may impact our ability to write certain lines of business;
|
|
•
|
industry and economic conditions can affect the ability or willingness of reinsurers to pay balances due;
|
|
•
|
after the commutation of ceded reinsurance contracts, any subsequent adverse development in the re-assumed loss reserves will result in a charge to earnings;
|
|
•
|
regulatory actions can impede our ability to charge adequate rates and efficiently allocate capital;
|
|
•
|
economic conditions, actual or potential defaults in sovereign debt obligations, volatility in interest and foreign currency exchange rates and changes in market value of concentrated investments can have a significant impact on the fair value of fixed maturities and equity securities, as well as the carrying value of other assets and liabilities, and this impact may be heightened by market volatility;
|
|
•
|
economic conditions; changes in government support for education, healthcare and infrastructure projects; changes in capital spending levels; changes in the housing market; and volatility in interest and foreign currency exchange rates, among other factors, may adversely affect the markets served by our Markel Ventures operations and negatively impact their revenues and profitability;
|
125
|
•
|
economic conditions may adversely affect access to capital and credit markets;
|
|
•
|
we have substantial investments in municipal bonds (approximately
$3.1 billion
at
December 31, 2013
) and, although no more than 10% of our municipal bond portfolio is tied to any one state, widespread defaults could adversely affect our results of operations and financial condition;
|
|
•
|
we cannot predict the extent and duration of the current period of slow economic growth; the continuing effects of government intervention into the markets to address the financial crisis of 2008 and 2009 (including, among other things, the effects of the Dodd-Frank Wall Street Reform and Consumer Protection Act and regulations adopted thereunder); the outcome of economic and currency concerns in the Eurozone; material changes to the monetary policies of the U.S. Federal Reserve; and their combined impact on our industry, business and investment portfolio;
|
|
•
|
we cannot predict the impact of the implementation of U.S. health care reform legislation and regulations under that legislation on our business;
|
|
•
|
our business is dependent upon the successful functioning and security of our computer systems; if our information technology systems fail or suffer a security breach, our business or reputation could be adversely impacted;
|
|
•
|
we have recently completed a number of acquisitions, the most significant of which was our 2013 acquisition of Alterra, and may engage in additional acquisition activity in the future, which may increase operational and control risks for a period of time;
|
|
•
|
the amount of the costs and charges related to our acquisition and integration of Alterra and related restructuring may exceed our expectations;
|
|
•
|
we may not realize the contemplated benefits, including cost savings and synergies, of our acquisitions, including those anticipated from the acquisition of Alterra and related restructuring;
|
|
•
|
any determination requiring the write-off of a significant portion of our goodwill and intangible assets, including
$295.7 million
and
$207.5 million
, respectively, recorded in connection with the acquisition of Alterra;
|
|
•
|
loss of services of any executive officers or other key personnel could impact our operations;
|
|
•
|
our expanding international operations expose us to increased investment, political and economic risks, including foreign currency and credit risk; and
|
|
•
|
adverse changes in our assigned financial strength or debt ratings could impact our ability to attract and retain business or obtain capital.
|
Our premium volume, underwriting and investment results and results from our non-insurance operations have been and will continue to be potentially materially affected by these factors. By making forward-looking statements, we do not intend to become obligated to publicly update or revise any such statements whether as a result of new information, future events or other changes. Readers are cautioned not to place undue reliance on any forward-looking statements which speak only as at their dates.
126
OTHER INFORMATION
Performance Graph
The following graph compares the cumulative total return (based on share price) on our common stock with the cumulative total return of companies included in the S&P 500 Index and the Dow Jones Property & Casualty Insurance Companies Index. This information is not necessarily indicative of future results.
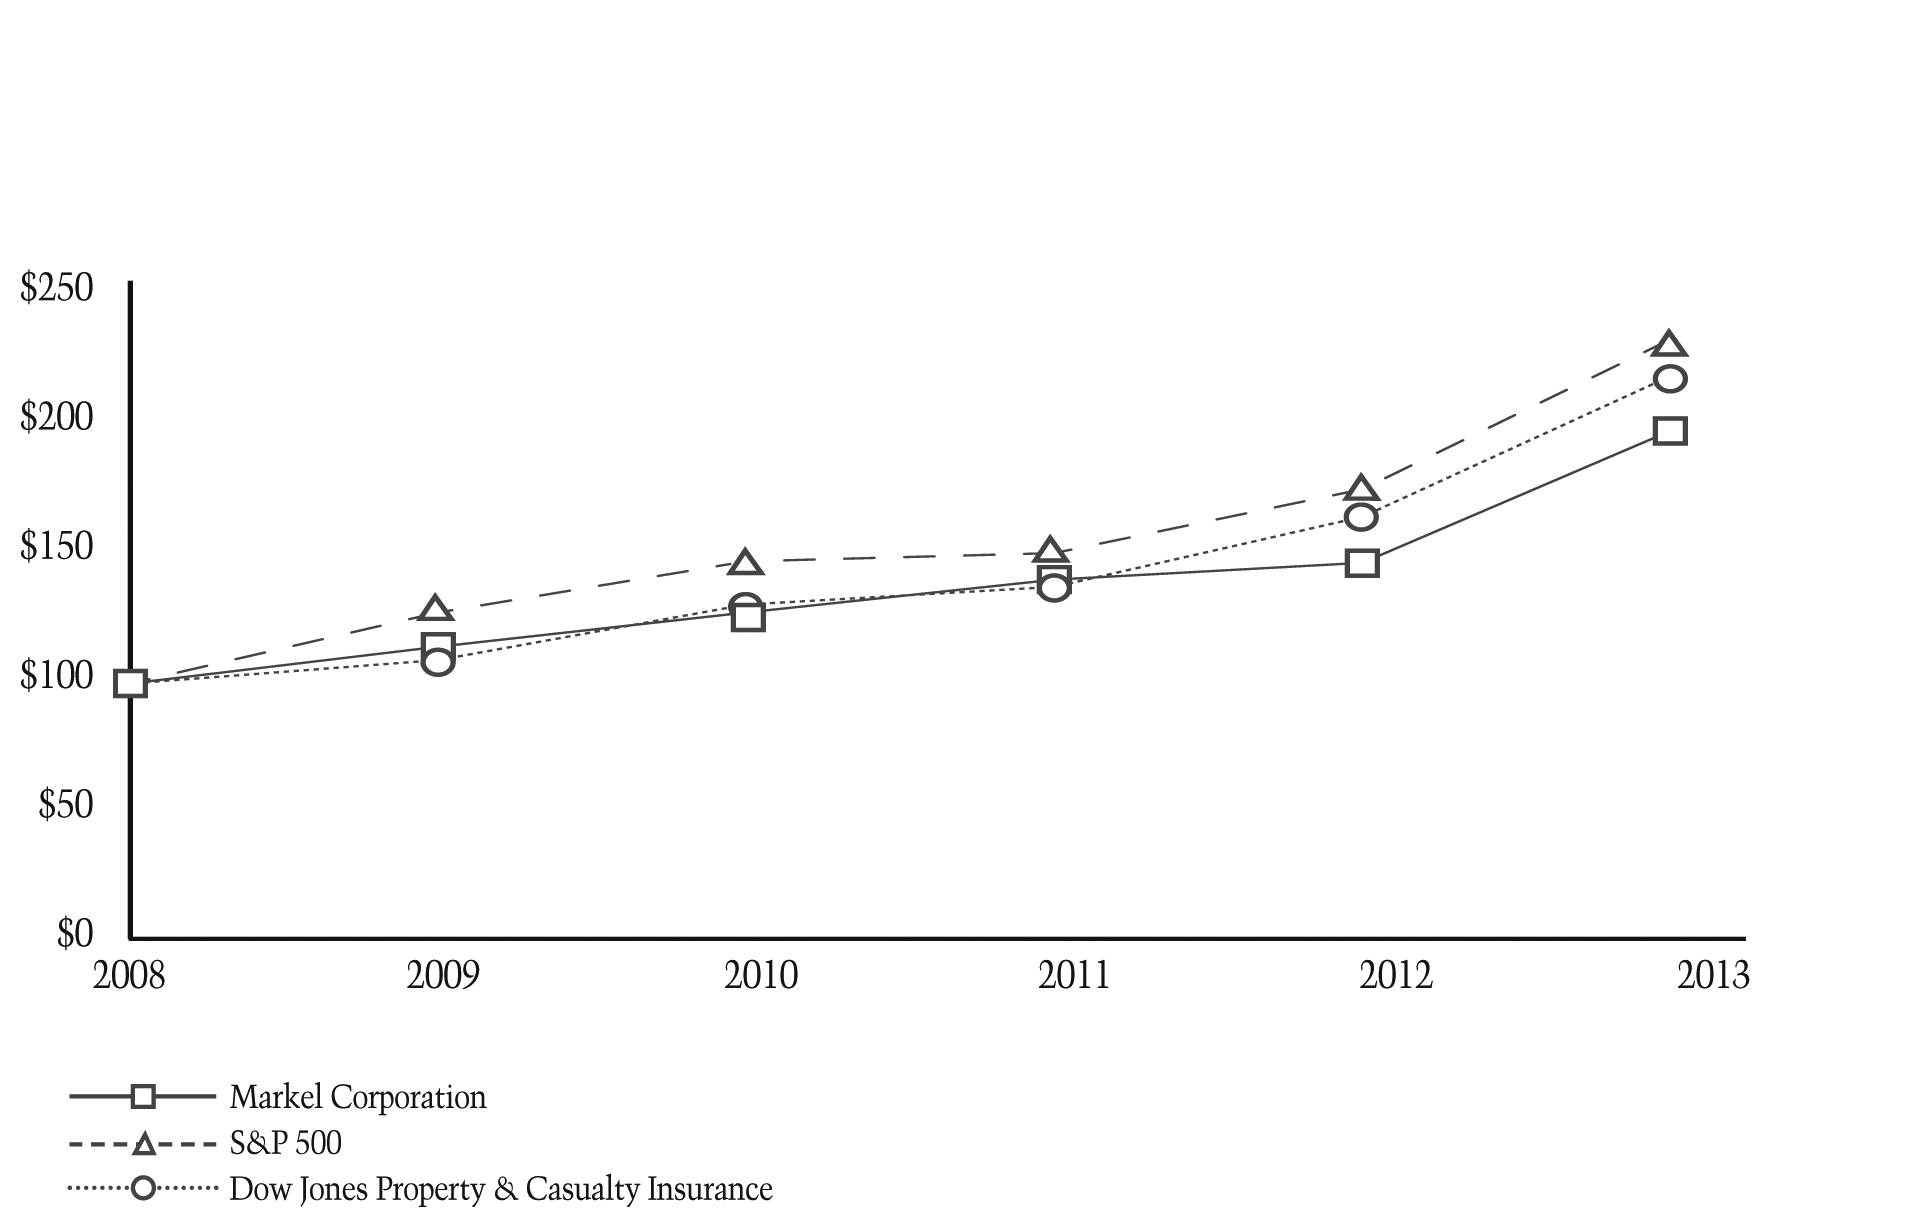
|
|
Years Ended December 31,
|
||||||||||||||||||||||
|
|
2008
(1)
|
2009
|
2010
|
2011
|
2012
|
2013
|
|||||||||||||||||
|
Markel Corporation
|
$
|
100
|
|
$
|
114
|
|
$
|
126
|
|
$
|
139
|
|
$
|
145
|
|
$
|
194
|
|
|||||
|
S&P 500
|
100
|
|
126
|
|
146
|
|
149
|
|
172
|
|
228
|
|
|||||||||||
|
Dow Jones Property & Casualty Insurance
|
100
|
|
109
|
|
129
|
|
136
|
|
162
|
|
215
|
|
|||||||||||
|
(1)
|
$100 invested on
December 31, 2008
in our common stock or the listed index. Includes reinvestment of dividends.
|
Market and Dividend Information
Our common stock trades on the New York Stock Exchange under the symbol MKL. The number of shareholders of record as of
February 10, 2014
was approximately 400. The total number of shareholders, including those holding shares in street name or in brokerage accounts, is estimated to b
e in excess of 80,000. Our cur
rent strategy is to retain earnings and, consequently, we have not paid and do not expect to pay a cash dividend on our common stock.
High and low common stock prices as reported on the New York Stock Exchange composite tape for
2013
were $582.59 and $434.98, respectively. See note 24 of the notes to consolidated financial statements for additional common stock price information.
127
Available Information and Shareholder Relations
This document represents Markel Corporation's Annual Report and Form 10-K, which is filed with the Securities and Exchange Commission.
Information about Markel Corporation, including exhibits filed as part of this Form 10-K, may be obtained by writing Mr. Bruce Kay, Investor Relations, at the address of the corporate offices listed below, or by calling (800) 446-6671.
We make available free of charge on or through our website our annual reports on Form 10-K, quarterly reports on Form 10-Q, current reports on Form 8-K and all amendments to those reports as soon as reasonably practicable after such material is electronically filed with or furnished to the Securities and Exchange Commission. Our website address is www.markelcorp.com.
Transfer Agent
American Stock Transfer & Trust Co., LLC, Operations Center, 6201 15th Avenue, Brooklyn, NY 11219
(800) 937-5449 (718) 921-8124
Code of Conduct
We have adopted a code of business conduct and ethics (Code of Conduct) which is applicable to all directors and associates, including executive officers. We have posted the Code of Conduct on our website at www.markelcorp.com. We intend to satisfy applicable disclosure requirements regarding amendments to, or waivers from, provisions of our Code of Conduct by posting such information on our website. Shareholders may obtain printed copies of the Code of Conduct by writing Mr. Bruce Kay, Investor Relations, at the address of the corporate offices listed below, or by calling (800) 446-6671.
Annual Shareholders' Meeting
Shareholders of Markel Corporation are invited to attend the Annual Meeting to be held a
t Richmond CenterStage, 600 East Grace Street, Richmond, Virginia at 4:30 p.m., May 12, 2014.
Corporate Offices
Markel Corporation, 4521 Highwoods Parkway, Glen Allen, Virginia 23060-6148
(804) 747-0136 (800) 446-6671
128
Executive Officers
Alan I. Kirshner
Chairman of the Board and Chief Executive Officer since 1986. Director since 1978. Age 78.
Anthony F. Markel
Vice Chairman since May 2008. President and Chief Operating Officer from March 1992 to May 2008. Director since 1978. Age 72.
Steven A. Markel
Vice Chairman since March 1992. Director since 1978. Age 65.
F. Michael Crowley
President and Co-Chief Operating Officer since May 2010. President, Markel Specialty from February 2009 to May 2010. President of Willis HRH North America from October 2008 to January 2009. President of Hilb Rogal
&
Hobbs Company from September 2005 to October 2008. Age 62.
Thomas S. Gayner
President and Chief Investment Officer since May 2010. Chief Investment Officer since January 2001. President, Markel-Gayner Asset Management Corporation, a subsidiary, since December 1990. Director from 1998 to 2004. Age 52.
Richard R. Whitt, III
President and Co-Chief Operating Officer since May 2010. Senior Vice President and Chief Financial Officer from May 2005 to May 2010. Age 50.
Gerard Albanese, Jr.
Executive Vice President and Chief Underwriting Officer since May 2010. Chief Underwriting Officer since January 2009. President and Chief Operating Officer, Markel International Limited, a subsidiary, from September 2003 to August 2008. Age 61.
Britton L. Glisson
Chief Administrative Officer since February 2009. President, Markel Insurance Company, a subsidiary, from October 1996 to March 2009. Age 57.
Bradley J. Kiscaden
Executive Vice President and Chief Actuarial Officer since July 2012. Chief Actuarial Officer since March 1999. Age 51.
Anne G. Waleski
Vice President and Chief Financial Officer since May 2010. Treasurer from August 2003 to November 2011. Age 47.
129
EXHIBIT INDEX
|
Exhibit No.
|
Document Description
|
|
|
2.1
|
Agreement and Plan of Merger, dated as of December 18, 2012, by and among Alterra Capital Holdings Limited, Markel Corporation and Commonwealth Merger Subsidiary Limited (2.1)
a
|
|
|
3(i)
|
Amended and Restated Articles of Incorporation (3.1)
b
|
|
|
3(ii)
|
Bylaws, as amended (3.1)
c
|
|
|
4.1
|
Form of Amended and Restated Credit Agreement dated as of September 23, 2011 among Markel Corporation, the lenders party thereto and SunTrust Bank, as Administrative Agent (4.1)
d
|
|
|
4.2
|
Form of Consent dated as of June 25, 2012 regarding Amended and Restated Credit Agreement dated as of September 23, 2011 among Markel Corporation, the lenders party thereto and SunTrust Bank, as Administrative Agent (4.2)
e
|
|
|
4.3
|
Form of First Amendment to the Amended and Restated Credit Agreement dated as of February 28, 2013 among Markel Corporation, the lenders party thereto and SunTrust Bank, as Administrative Agent (4.3)
f
|
|
|
4.4
|
Form of Second Amendment to the Amended and Restated Credit Agreement dated as of July 12, 2013 among Markel Corporation, the lenders party thereto and SunTrust Bank, as Administrative Agent (10.2)
g
|
|
|
4.5
|
Credit agreement, dated as of December 16, 2011, among Alterra Capital Holdings Limited, Alterra Bermuda Limited (n/k/a Markel Bermuda Limited), the lenders parties thereto and Bank of America, N.A., as Administrative Agent (4.5)
h
|
|
|
4.6
|
Amendment No.1 dated as of February 7, 2013, to the Credit Agreement among Alterra Capital Holdings Limited, Alterra Bermuda Limited (n/k/a Markel Bermuda Limited), the lenders parties thereto and Bank of America, N.A., as Administrative Agent (4.6)
h
|
|
|
4.7
|
Indenture dated as of June 5, 2001 between Markel Corporation and The Chase Manhattan Bank, as Trustee (4.1)
i
|
|
|
4.8
|
Form of Third Supplemental Indenture dated as of August 13, 2004 between Markel Corporation and JPMorgan Chase Bank (formerly known as The Chase Manhattan Bank), as Trustee, including form of the securities as Exhibit A (4.2)
j
|
|
|
4.9
|
Form of Fifth Supplemental Indenture dated as of September 22, 2009 between Markel Corporation and The Bank of New York Mellon (as successor to The Chase Manhattan Bank), as Trustee, including form of the securities as Exhibit A (4.2)
k
|
|
|
4.10
|
Form of Sixth Supplemental Indenture dated as of June 1, 2011 between Markel Corporation and The Bank of New York Mellon (as successor to The Chase Manhattan Bank), as Trustee, including form of the securities as Exhibit A (4.2)
l
|
|
|
4.11
|
Form of Seventh Supplemental Indenture dated as of July 2, 2012 between Markel Corporation and The Bank of New York Mellon (as successor to The Chase Manhattan Bank), as Trustee, including form of the securities as Exhibit A (4.2)
m
|
|
|
4.12
|
Form of Eighth Supplemental Indenture dated as of March 8, 2013 between Markel Corporation and The Bank of New York Mellon (as successor to The Chase Manhattan Bank), as Trustee, including form of the securities as Exhibit A (4.2)
n
|
|
|
4.13
|
Form of Ninth Supplemental Indenture dated as of March 8, 2013 between Markel Corporation and The Bank of New York Mellon (as successor to The Chase Manhattan Bank), as Trustee, including form of the securities as Exhibit A (4.3)
n
|
|
|
4.14
|
Indenture dated as of September 1, 2010, among Alterra Finance LLC, Alterra Capital Holdings Limited and The Bank of New York Mellon, as Trustee (4.14)
h
|
|
|
4.15
|
Form of First Supplemental Indenture, dated as of September 27, 2010 between Alterra Finance LLC, Alterra Capital Holdings Limited and The Bank of New York Mellon, as Trustee, including the form of the securities as Exhibit A (4.15)
h
|
|
The registrant hereby agrees to furnish to the Securities and Exchange Commission a copy of all instruments defining the rights of holders of long-term debt of the registrant's subsidiaries shown on the Consolidated Balance Sheet of the registrant at
December 31, 2013
, and the respective Notes thereto, included in this Annual Report on Form 10-K.
130
|
Exhibit No.
|
Document Description
|
|
|
10.1
|
Markel Corporation 2012 Equity Incentive Compensation Plan (Appendix A)
o
|
|
|
10.2
|
Form of Amended and Restated Employment Agreement with Alan I. Kirshner (10.2)
p
|
|
|
10.3
|
Form of Amended and Restated Employment Agreement with Steven A. Markel (10.3)
p
|
|
|
10.4
|
Form of Amended and Restated Employment Agreement with Anthony F. Markel (10.4)
p
|
|
|
10.5
|
Form of Executive Employment Agreement with F. Michael Crowley, Thomas S. Gayner, Richard R. Whitt, III, Gerard Albanese, Jr., Britton L. Glisson, Anne G. Waleski and Bradley J. Kiscaden (10.5)
p
|
|
|
10.6
|
Schedule of Base Annual Salaries for Executive Officers effective May 1, 2013 and Restricted Stock Units awarded on May 13, 2013 (10.1)
h
|
|
|
10.7
|
Markel Corporation Executive Bonus Plan (10.3)
q
|
|
|
10.8
|
Description of Awards Under Executive Bonus Plan and 2012 Equity Incentive Compensation Plan for 2013 (10.1)
f
|
|
|
10.9
|
Employee Stock Purchase and Bonus Plan (10.9)
p
|
|
|
10.10
|
Markel Corporation Omnibus Incentive Plan (Appendix B)
r
|
|
|
10.11
|
Form of Restricted Stock Award Agreement for Outside Directors (10.2)
s
|
|
|
10.12
|
Form of Restricted Stock Unit Award Agreement for Executive Officers under the Markel Corporation Omnibus Incentive Plan(10.1)
t
|
|
|
10.13
|
Form of Restricted Stock Unit Award Agreement for Executive Officers under the Markel Corporation 2012 Equity Incentive Compensation Plan (10.1)
u
|
|
|
10.14
|
Form of 2009 Restricted Stock Unit Award Agreement for Executive Officers (10.2)
v
|
|
|
10.15
|
Form of Restricted Stock Unit Award Agreement for Executive Officers (revised 2010) (10.2)
w
|
|
|
10.16
|
Form of Amended and Restated May 2010 Restricted Stock Unit Award Agreement for Executive Officers (10.1)
x
|
|
|
10.17
|
May 2010 Restricted Stock Units Deferral Election Form (10.2)
x
|
|
|
10.18
|
Description of Permitted Acceleration of Vesting Date of Restricted Stock Units by Up to Thirty Days (10.2)
y
|
|
|
10.19
|
Form of May 2011 Restricted Stock Unit Award Agreement for Anne Waleski (10.1)
b
|
|
|
10.20
|
Description of Non-Employee Director Compensation
z
|
|
|
10.21
|
Aspen Holdings, Inc. Amended and Restated 2008 Stock Option Plan (99.1)
aa
|
|
|
10.22
|
Form of Time Based Restricted Stock Unit Award Agreement for Executive Officers for the 2012 Equity Incentive Compensation Plan (10.22)
ab
|
|
|
10.23
|
Form of Performance Based Restricted Stock Unit Award Agreement for Executive Officers for the 2012 Equity Incentive Compensation Plan (10.23)
ab
|
|
|
10.24
|
Restricted Stock Units Deferral Election Form for the 2012 Equity Incentive Compensation Plan (10.24)
ab
|
|
|
10.25
|
Alterra Capital Holdings Limited 2008 Stock Incentive Plan (99.1)
ac
|
|
|
10.26
|
Alterra Capital Holdings Limited 2006 Equity Incentive Plan (99.2)
ac
|
|
|
10.27
|
Alterra Capital Holdings Limited 2000 Stock Incentive Plan (99.3)
ac
|
|
|
10.28
|
Joinder Agreement, dated July 12, 2013, by and among Markel Corporation, JPMorgan Chase Bank, N.A. and SunTrust Bank, as Administrative Agent (10.1)
g
|
|
|
21
|
Certain Subsidiaries of Markel Corporation**
|
|
|
23
|
Consent of KPMG LLP**
|
|
|
31.1
|
Certification of Principal Executive Officer Pursuant to Rule 13a-14(a)/ 15d-14(a)**
|
|
131
|
31.2
|
Certification of Principal Financial Officer Pursuant to Rule 13a-14(a)/ 15d-14(a)**
|
|
|
32.1
|
Certification of Principal Executive Officer furnished Pursuant to 18 U.S.C. Section 1350**
|
|
|
32.2
|
Certification of Principal Financial Officer furnished Pursuant to 18 U.S.C. Section 1350**
|
|
|
101
|
The following consolidated financial statements from Markel Corporation's Annual Report on Form 10-K for the year ended December 31, 2013, filed on February 28, 2014, formatted in XBRL: (i) Consolidated Balance Sheets, (ii) Consolidated Statements of Income and Comprehensive Income, (iii) Consolidated Statements of Changes in Equity, (iv) Consolidated Statements of Cash Flows and (v) Notes to Consolidated Financial Statements.**
|
|
# Markel agrees to furnish supplementally a copy of any omitted exhibits or schedules to the SEC upon request.
** Filed with this report
|
a.
|
Incorporated by reference from the Exhibit shown in parentheses filed with the Commission in the Registrant's report on Form 8-K filed on December 19, 2012.
|
|
b.
|
Incorporated by reference from the Exhibit shown in parentheses filed with the Commission in the Registrant's report on Form 8-K filed on May 13, 2011.
|
|
c.
|
Incorporated by reference from the Exhibit shown in parentheses filed with the Commission in the Registrant's report on Form 8-K filed on November 18, 2011.
|
|
d.
|
Incorporated by reference from the Exhibit shown in parentheses filed with the Commission in the Registrant's report on Form 10-Q for the quarter ended September 30, 2011.
|
|
e.
|
Incorporated by reference from the Exhibit shown in parentheses filed with the Commission in the Registrant's report on Form 10-Q for the quarter ended June 30, 2012.
|
|
f.
|
Incorporated by reference from the Exhibit shown in parentheses filed with the Commission in the Registrant's report on Form 10-Q for the quarter ended March 31, 2013.
|
|
g.
|
Incorporated by reference from the Exhibit shown in parentheses filed with the Commission in the Registrant's report on Form 8-K filed on July 15, 2013.
|
|
h.
|
Incorporated by reference from the Exhibit shown in parentheses filed with the Commission in the Registrant's report on Form 10-Q for the quarter ended June 30, 2013.
|
|
i.
|
Incorporated by reference from the Exhibit shown in parentheses filed with the Commission in the Registrant's report on Form 8-K filed on June 5, 2001.
|
|
j.
|
Incorporated by reference from the Exhibit shown in parentheses filed with the Commission in the Registrant's report on Form 8-K filed on August 11, 2004.
|
|
k.
|
Incorporated by reference from the Exhibit shown in parentheses filed with the Commission in the Registrant's report on Form 8-K filed on September 21, 2009.
|
|
l.
|
Incorporated by reference from the Exhibit shown in parentheses filed with the Commission in the Registrant's report on Form 8-K filed on May 31, 2011.
|
|
m.
|
Incorporated by reference from the Exhibit shown in parentheses filed with the Commission in the Registrant's report on Form 8-K filed on June 29, 2012.
|
|
n.
|
Incorporated by reference from the Exhibit shown in parentheses filed with the Commission in the Registrant's report on Form 8-K filed on March 7, 2013.
|
|
o.
|
Incorporated by reference from the Appendix shown in parentheses filed with the Commission in the Registrant's Proxy Statement and Definitive 14A filed March 16, 2012.
|
|
p.
|
Incorporated by reference from the Exhibit shown in parentheses filed with the Commission in the Registrant's report on Form 10-K for the year ended December 31, 2008.
|
|
q.
|
Incorporated by reference from the Exhibit shown in parentheses filed with the Commission in the Registrant's report on Form 8-K filed on May 27, 2005.
|
|
r.
|
Incorporated by reference from the Appendix shown in parentheses filed with the Commission in the Registrant's Proxy Statement and Definitive 14A filed April 2, 2003.
|
|
s.
|
Incorporated by reference from the Exhibit shown in parentheses filed with the Commission in the Registrant's report on Form 10-Q for the quarter ended June 30, 2012.
|
|
t.
|
Incorporated by reference from the Exhibit shown in parentheses filed with the Commission in the Registrant's report on Form 8-K filed on March 3, 2008.
|
|
u.
|
Incorporated by reference from the Exhibit shown in parentheses filed with the Commission in the Registrant's report on Form 8-K filed on May 17, 2013.
|
|
v.
|
Incorporated by reference from the Exhibit shown in parentheses filed with the Commission in the Registrant's report on Form 10-Q for the quarter ended March 31, 2009.
|
132
|
w.
|
Incorporated by reference from the Exhibit shown in parentheses filed with the Commission in the Registrant's report on Form 10-Q for the quarter ended March 31, 2010.
|
|
x.
|
Incorporated by reference from the Exhibit shown in parentheses filed with the Commission in the Registrant's report on Form 10-Q for the quarter ended June 30, 2010.
|
|
y.
|
Incorporated by reference from the Exhibit shown in parentheses filed with the Commission in the Registrant's report on Form 10-Q for the quarter ended September 30, 2008.
|
|
z.
|
Incorporated by reference from Item 5.02 filed with the Commission in the Registrant's report on Form 8-K filed on May 17, 2013.
|
|
aa.
|
Incorporated by reference from the Exhibit shown in parentheses filed with the Commission in the Registrant's Registration Statement on Form S-8 (Reg. No. 333-170047).
|
|
ab.
|
Incorporated by reference from the Exhibit shown in parentheses filed with the Commission in the Registrant's report on Form 10-K for the year ended December 31, 2012.
|
|
ac.
|
Incorporated by reference from the Exhibit shown in parentheses filed with the Commission in the Registrant's Registration Statement on Form S-8 (Reg. No. 333-188294).
|
133
SIGNATURES
Pursuant to the requirements of Section 13 or 15(d) of the Securities Exchange Act of 1934, the registrant has duly caused this report to be signed on its behalf by the undersigned, thereunto duly authorized.
|
MARKEL CORPORATION
|
|||
|
By:
|
/s/ Steven A. Markel
|
||
|
Steven A. Markel
|
|||
|
Vice Chairman
|
|||
|
February 28, 2014
|
|||
Pursuant to the requirements of the Securities Exchange Act of 1934, this report has been signed below by the following persons on behalf of the registrant and in the capacities and on the dates indicated.
|
Signatures
|
Title
|
Date
|
|
|
/s/ Alan I. Kirshner
|
Chairman of the Board of Directors and
|
February 28, 2014
|
|
|
Alan I. Kirshner
|
Chief Executive Officer
|
||
|
/s/ Anthony F. Markel
|
Director
|
February 28, 2014
|
|
|
Anthony F. Markel
|
|||
|
/s/ Steven A. Markel
|
Director
|
February 28, 2014
|
|
|
Steven A. Markel
|
|||
|
/s/ Anne G. Waleski
|
Vice President and Chief Financial Officer
|
February 28, 2014
|
|
|
Anne G. Waleski
|
(Principal Financial Officer)
|
||
|
/s/ Nora N. Crouch
|
Controller and Chief Accounting Officer
|
February 28, 2014
|
|
|
Nora N. Crouch
|
(Principal Accounting Officer)
|
||
|
/s/ J. Alfred Broaddus, Jr.
|
Director
|
February 28, 2014
|
|
|
J. Alfred Broaddus, Jr.
|
|||
|
/s/ K. Bruce Connell
|
Director
|
February 28, 2014
|
|
|
K. Bruce Connell
|
|||
|
/s/ Douglas C. Eby
|
Director
|
February 28, 2014
|
|
|
Douglas C. Eby
|
|||
|
/s/ Stewart M. Kasen
|
Director
|
February 28, 2014
|
|
|
Stewart M. Kasen
|
|||
|
/s/ Lemuel E. Lewis
|
Director
|
February 28, 2014
|
|
|
Lemuel E. Lewis
|
|||
|
/s/ Darrell D. Martin
|
Director
|
February 28, 2014
|
|
|
Darrell D. Martin
|
|||
|
/s/ Michael O'Reilly
|
Director
|
February 28, 2014
|
|
|
Michael O'Reilly
|
|||
|
/s/ Jay M. Weinberg
|
Director
|
February 28, 2014
|
|
|
Jay M. Weinberg
|
|||
|
/s/ Debora J. Wilson
|
Director
|
February 28, 2014
|
|
|
Debora J. Wilson
|
|||
134
TABLE OF CONTENTS