HERMAN MILLER INC
10-Ks and 10-Qs
|
|
|
|
|
|
|
|
|
|
|
|
|
|
|
|
|
|
|
|
|
|
|
|
|
|
|
|
|
|
|
|
|
|
|
|
|
|
|
|
|
|
|
|
|
|
|
|
|
|
|
|
|
|
|
|
UNITED STATES
SECURITIES AND EXCHANGE COMMISSION
Washington, DC 20549
FORM 10-K
|
[ X ]
|
ANNUAL REPORT UNDER SECTION 13 OR 15(d) OF THE SECURITIES EXCHANGE ACT OF 1934
|
|
[__]
|
TRANSITION REPORT PURSUANT TO SECTION 13 OR 15(d) OF THE SECURITIES EXCHANGE ACT OF 1934
|
|
For Fiscal Year Ended May 28, 2016
|
Commission File No. 001-15141
|
Herman Miller, Inc.
(Exact name of registrant as specified in its charter)
|
Michigan
|
38-0837640
|
|||
|
(State or other jurisdiction of incorporation or organization)
|
(I.R.S. Employer Identification No.)
|
|||
|
855 East Main Avenue
|
||||
|
PO Box 302
|
||||
|
Zeeland, Michigan
|
49464-0302
|
|||
|
(Address of principal
executive offices)
|
(Zip Code)
|
|||
|
Registrant's telephone number, including area code: (616) 654 3000
|
|
|
Securities registered pursuant to Section 12(b) of the Act: None
|
|
|
Securities registered pursuant to Section 12(g) of the Act:
|
Common Stock, $.20 Par Value
(Title of Class)
|
|
Indicate by check mark if the registrant is a well-known seasoned issuer, as defined in Rule 405 of the Securities Act.
|
|
|
Yes [ X ] No [__]
|
|
|
Indicate by check mark if the registrant is not required to file reports pursuant to Section 13 or Section 15(d) of the Act.
|
|
|
Yes [__] No [ X ]
|
|
|
Indicate by check mark whether the registrant (1) has filed all reports required to be filed by Section 13 or 15(d) of the Securities Exchange Act of 1934 during the preceding 12 months (or for such shorter period that the registrant was required to file such reports), and (2) has been subject to such filing requirements for the past 90 days.
|
|
|
Yes [ X ] No [__]
|
|
|
Indicate by check mark whether the registrant has submitted electronically and posted on its corporate Web site, if any, every Interactive Data File required to be submitted and posted pursuant to Rule 405 of Regulation S-T (§ 229.405 of this chapter) during the preceding 12 months (or for such shorter period that the registrant was required to submit and post such files).
|
|
|
Yes [ X ] No [__]
|
|
Indicate by check mark if disclosure of delinquent filers pursuant to Item 405 of Regulation S-K is not contained herein, and will not be contained, to the best of registrant's knowledge, in definitive proxy or information statements incorporated by reference in Part III of this Form 10-K or any amendment to this Form 10-K. [ X ]
Indicate by check mark whether the registrant is a large accelerated filer, an accelerated filer, a non-accelerated filer or a smaller reporting company. See definition of “accelerated filer,” “large accelerated filer,” and “smaller reporting company” in Rule 12b-2 of the Exchange Act.
Large accelerated filer [ X ] Accelerated filer [__] Non-accelerated filer [__] Smaller reporting company [__]
|
Indicate by check mark whether the registrant is a shell company (as defined in Rule 12b-2 of the Exchange Act).
|
|
|
Yes [__] No [ X ]
|
|
The aggregate market value of the voting stock held by “nonaffiliates” of the registrant (for this purpose only, the affiliates of the registrant have been assumed to be the executive officers and directors of the registrant and their associates) as of
November 28, 2015
, was $
1,907,720,297
(based on
$32.14
per share which was the closing sale price as reported by NASDAQ).
The number of shares outstanding of the registrant's common stock, as of
July 21, 2016
: Common stock, $.20 par value -
60,024,981
shares outstanding.
DOCUMENTS INCORPORATED BY REFERENCE
Certain portions of the Registrant's Proxy Statement for the Annual Meeting of Stockholders to be held on October 10, 2016, are incorporated into Part III of this report.
This page intentionally left blank.
Herman Miller, Inc. Form 10-K
Table of Contents
|
Page No.
|
|
|
Part I
|
|
|
Item 1 Business
|
|
|
Item 1A Risk Factors
|
|
|
Item 1B Unresolved Staff Comments
|
|
|
Item 2 Properties
|
|
|
Item 3 Legal Proceedings
|
|
|
Additional Item: Executive Officers of the Registrant
|
|
|
Item 4 Mine Safety Disclosures
|
|
|
Part II
|
|
|
Item 5 Market for the Registrant's Common Equity, Related Stockholder Matters, and
|
|
|
Issuer Purchases of Equity Securities
|
|
|
Item 6 Selected Financial Data
|
|
|
Item 7 Management's Discussion and Analysis of Financial Condition and Results of Operations
|
|
|
Item 7A Quantitative and Qualitative Disclosures about Market Risk
|
|
|
Item 8 Financial Statements and Supplementary Data
|
|
|
Item 9 Changes in and Disagreements with Accountants on Accounting and Financial Disclosures
|
|
|
Item 9A Controls and Procedures
|
|
|
Item 9B Other Information
|
|
|
Part III
|
|
|
Item 10 Directors, Executive Officers, and Corporate Governance
|
|
|
Item 11 Executive Compensation
|
|
|
Item 12 Security Ownership of Certain Beneficial Owners and Management and Related
|
|
|
Stockholder Matters
|
|
|
Item 13 Certain Relationships and Related Transactions, and Director Independence
|
|
|
Item 14 Principal Accountant Fees and Services
|
|
|
Part IV
|
|
|
Item 15 Exhibits and Financial Statement Schedule
|
|
|
Signatures
|
|
|
Report of Independent Registered Public Accounting Firm on Financial Statement Schedule
|
|
|
Schedule II Valuation and Qualifying Accounts
|
|
|
Exhibit Index
|
|
General Development of Business
Herman Miller's mission statement is
Inspiring Designs to Help People Do Great Things
. To this end, the company researches, designs, manufactures, and distributes interior furnishings for use in various environments including office, healthcare, educational, and residential settings, and provides related services that support organizations and individuals all over the world. Through research, the company seeks to define and clarify customer needs and problems existing in its markets and to design, through innovation where appropriate and feasible, products, systems, and services that serve as compelling solutions to such problems. The company's products are sold primarily through the following channels: Owned and independent contract furniture dealers, direct customer sales, owned and independent retailers, direct-mail catalogs, and the company's online stores.
Herman Miller, Inc. was incorporated in Michigan in 1905. One of the company's major plants and its corporate offices are located at 855 East Main Avenue, PO Box 302, Zeeland, Michigan, 49464-0302, and its telephone number is (616) 654-3000. Unless otherwise noted or indicated by the context, the term “company” includes Herman Miller, Inc., its predecessors, and majority-owned subsidiaries. Further information relating to principles of consolidation is provided in Note 1 to the Consolidated Financial Statements included in Item 8 of this report.
Financial Information about Segments
Information relating to segments is provided in Note 14 to t
he Consolidated Financial Statements included in Item 8 of this report.
Narrative Description of Business
The company's principal business consists of the research, design, manufacture, selling, and distribution of office furniture systems, seating products, other freestanding furniture elements, textiles, home furnishings and related services. Most of these systems and products are designed to be used together.
The company's ingenuity and design excellence create award-winning products and services, which has made us a leader in design and development of furniture, furniture systems, and textiles. This leadership is exemplified by the innovative concepts introduced by the company in its modular systems (including Canvas Office Landscape™®, Locale®, Metaform Portfolio™®, Public Office Landscape™®, Layout Studio®, Action Office®, Ethospace®, Arras®, and Resolve®). The company also offers a broad array of seating (including Embody®, Aeron®, Mirra2™, Setu®, Sayl®, Celle®, Equa®, and Ergon® office chairs), storage (including Meridian® and Tu™® products), wooden casegoods (including Geiger® products), freestanding furniture products (including Abak™®, Intent®, Sense™ and Envelop®), healthcare products (including Palisade™, Compass™®, Nala®, and other Nemschoff® products) the Thrive portfolio of ergonomic solutions, and the textiles of Maharam Fabric Corporation (Maharam).
The company also offers products for residential settings, including Eames®, Eames (lounge chair configuration)®, Eames (management chair configuration)®, Eames Soft Pad™, Nelson™ basic cabinet series, Nelson™ end table, Nelson™ lanterns, Nelson™ marshmallow sofa, Nelson™ miniature chests, Nelson™ platform bench, Nelson™ swag leg group, Nelson™ tray table, Bubble Lamps®, Airia™, Ardea®, Bumper™, Burdick Group™, Everywhere™ tables, Claw™, Caper®, Distil™, Envelope™, Formwork®, Full Round™, H Frame™, I Beam™, Landmark™, Logic Mini™, Logic Power Access Solutions™, Renew™, Rolled Arm™, Scissor™, Sled™, Soft Pad™, Swoop™, Tone™, Twist™, Ward Bennett™ and Wireframe™.
The company's products are marketed worldwide by its own sales staff, independent dealers and retailers, its owned dealer network, via its e-commerce website and through its owned retail studios.
Salespeople work with dealers, the architecture and design community, and directly with end-users. Independent dealerships concentrate on the sale of Herman Miller products and some complementary product lines of other manufacturers. It is estimated that approximately 74 percent of the company's sales in the fiscal year ended
May 28, 2016
, were made to or through independent dealers. The remaining sales were made directly to end-users, including federal, state, and local governments, and several business organizations by the company's own sales staff, its owned dealer network, Design Within Reach ("DWR") retail studios or independent retailers.
The company is a recognized leader within its industry for the use, development, and integration of customer-centered technologies that enhance the reliability, speed, and efficiency of our customers' operations. This includes proprietary sales tools, interior design and product specification software; order entry and manufacturing scheduling and production systems; and direct connectivity to the company's suppliers.
The company's furniture systems, seating, freestanding furniture, storage, casegood and textile products, and related services are used in (1) institutional environments including offices and related conference, lobby, and lounge areas, and general public areas including transportation terminals; (2) health/science environments including hospitals, clinics, and other healthcare facilities; (3) industrial and educational settings; and (4) residential and other environments.
-
3
-
Raw Materials
The company's manufacturing materials are available from a significant number of sources within the United States, Canada, Europe, and Asia. To date, the company has not experienced any difficulties in obtaining its raw materials. The costs of certain direct materials used in the company's manufacturing and assembly operations are sensitive to shifts in commodity market prices. In particular, the costs of steel, plastic, aluminum components, and particleboard are sensitive to the market prices of commodities such as raw steel, aluminum, crude oil, lumber, and resins. Increases in the market prices for these commodities can have an adverse impact on the company's profitability. Further information regarding the impact of direct material costs on the company's financial results is provided in Management's Discussion and Analysis in Item 7 of this report.
Patents, Trademarks, Licenses, Etc.
The company has active utility patents on various components used in its products and active design patents. Many of the inventions covered by these patents also have been patented in a number of foreign countries. Various trademarks, including the name and stylized “Herman Miller” and the “Herman Miller Circled Symbolic M” trademark are registered in the United States and many foreign countries. The company does not believe that any material part of its business depends on the continued availability of any one or all of its patents or trademarks, or that its business would be materially adversely affected by the loss of any thereof, except fort the following trademarks: Herman Miller®, Herman Miller Circled Symbolic M®, Maharam®, Geiger®, Design Within Reach®, DWR®, Nemschoff®, Action Office®, Ethospace®, Aeron®, Mirra®, Embody®, Setu®, Sayl®, Eames®, PostureFit®, Meridian®, and Canvas Office Landscape®. It is estimated that the average remaining life of the company's patents and trademarks is approximately
5.5 years
.
Working Capital Practices
Information concerning the company's inventory levels relative to its sales volume can be found under the
Executive Overview
section in Item 7 of this report. Beyond this discussion, the company does not believe that it or the industry in general has any special practices or special conditions affecting working capital items that are significant for understanding the company's business.
Customer Base
The company estimates that no single dealer accounted for more than
5 percent
of the company's net sales in the fiscal year ended
May 28, 2016
. The company estimates that the largest single end-user customer, the U.S. federal government, accounted for
$88 million
,
$97 million
, and
$102 million
of the company's net sales in fiscal
2016
,
2015
, and
2014
, respectively. This represents approximately
4 percent
,
5 percent
and
5 percent
of the company's net sales in fiscal
2016
,
2015
, and
2014
, respectively. The company's 10 largest customers accounted for approximately
18 percent
,
20 percent
, and
23 percent
of net sales in fiscal
2016
,
2015
, and
2014
, respectively.
Backlog of Unfilled Orders
As of
May 28, 2016
, the company's backlog of unfilled orders was
$323.5 million
. At
May 30, 2015
, the company's backlog totaled
$322.2 million
. The ending backlog of
$323.5 million
as of the end of fiscal 2016 included a decrease of approximately $14.0 million related to the divestiture of a dealership in Australia. It is expected that substantially all the orders forming the backlog at
May 28, 2016
, will be filled during the next fiscal year. Many orders received by the company are reflected in the backlog for only a short period while other orders specify delayed shipments and are carried in the backlog for up to one year. Accordingly, the amount of the backlog at any particular time does not necessarily indicate the level of net sales for a particular succeeding period.
Government Contracts
Other than standard provisions contained in contracts with the United States Government, the company does not believe that any significant portion of its business is subject to material renegotiation of profits or termination of contracts or subcontracts at the election of various government entities. The company sells to the U.S. Government both through a General Services Administration ("GSA") Multiple Award Schedule Contract and through competitive bids. The GSA Multiple Award Schedule Contract pricing is principally based upon the company's commercial price list in effect when the contract is initiated, rather than being determined on a cost-plus-basis. The company is required to receive GSA approval to apply list price increases during the term of the Multiple Award Schedule Contract period.
Competition
All aspects of the company's business are highly competitive. From an office furniture perspective, the company competes largely on design, product and service quality, speed of delivery, and product pricing. Although the company is one of the largest office furniture manufacturers in the world, it competes with manufacturers that have significant resources and sales as well as many smaller companies. In the United States, the company's most significant competitors are Haworth, HNI Corporation, Kimball International, Knoll, and Steelcase.
The company also competes in the home furnishings industry, primarily against regional and national independent home furnishings retailers who market high-craft furniture to the interior design community. Similar to our office furniture product offerings, the company competes primarily on design, product and service quality, speed of delivery, and product pricing in this consumer market.
Research, Design, and Development
-
4
-
The company draws great competitive strength from its research, design, and development programs. Accordingly, the company believes that its research and design activities are of significant importance. Through research, the company seeks to define and clarify customers and the problems they are trying to solve. The company designs innovative products and services that address customer needs and solve their problems. The company uses both internal and independent research resources and independent design resources. Exclusive of royalty payments, the company spent approximately
$62.4 million
,
$56.7 million
, and
$53.9 million
on research and development activities in fiscal
2016
,
2015
, and
2014
, respectively. Generally, royalties are paid to designers of the company's products as the products are sold and are included in the Design and research line item within the Consolidated Statements of Comprehensive Income.
Environmental Matters
For over 50 years, respecting the environment has been more than good business practice for us — it is the right thing to do. Our 10-year sustainability strategy — Earthright — begins with three principles: positive transparency, products as living things, and becoming greener together. Our goals are focused around the smart use of resources, eco-inspired design, and becoming community driven. Based on current facts known to management, the company does not believe that existing environmental laws and regulations have had or will have any material effect upon the capital expenditures, earnings, or competitive position of the company. However, there can be no assurance that environmental legislation and technology in this area will not result in or require material capital expenditures or additional costs to our manufacturing process.
Human Resources
The company considers its employees to be another of its major competitive strengths. The company stresses individual employee participation and incentives, believing that this emphasis has helped attract and retain a competent and motivated workforce. The company's human resources group provides employee recruitment, education and development, as well as compensation planning and counseling. Additionally, there have been no work stoppages or labor disputes in
the company's history
. Approximately
15.6 percent
of the company's employees are covered by collective bargaining agreements, most of whom are employees of its Nemschoff, Herman Miller Ningbo, and Herman Miller Dongguan subsidiaries.
As of
May 28, 2016
, the company had
7,607
employees, representing a
1.3 percent
increase as compared with
May 30, 2015
. The increase in employees was driven principally by an increase in workforce within our West Michigan manufacturing facilities. In addition to its employee workforce, the company uses temporary labor to meet uneven demand in its manufacturing operations.
Information about International Operations
The company's sales in international markets are made primarily to office/institutional customers. Foreign sales consist mostly of office furniture products such as Abak®, Aeron®, Mirra®, Celle®, Sayl®, Layout Studio®, Arras™, and other seating and storage products (including POSH products). The company conducts business in the following major international markets: Europe, Canada, the Middle East, Latin America, South America, and the Asia/Pacific region.
The company's products currently sold in international markets are manufactured by wholly owned subsidiaries in the United States, the United Kingdom, China and India. Sales are made through wholly owned subsidiaries or branches in Canada, France, Germany, Italy, Japan, Mexico, Australia, Singapore, China (including Hong Kong), India, Brazil and the Netherlands. The company's products are offered in the Middle East, Europe, South America, Africa, and Asia through dealers.
Additional information with respect to operations by geographic area appears i
n Note 14 of
the Consolidated Financial Statements included in Item 8 of this report. Fluctuating exchange rates and factors beyond the control of the company, such as tariff and foreign economic policies, may affect future results of international operations. Refer to Item 7A,
Quantitative and Qualitative Disclosures about Market Risk
, for further discussion regarding the company's foreign exchange risk.
Available Information
The company's annual report on Form 10-K, quarterly reports on Form 10-Q, current reports on Form 8-K, and all amendments to those reports are made available free of charge through the “Investors” section of the company's internet website at
www.hermanmiller.com
, as soon as practicable after such material is electronically filed with or furnished to the Securities and Exchange Commission (SEC). The company's filings with the SEC are also available for the public to read via the SEC's internet website at
www.sec.gov
.
-
5
-
The following risk factors and other information included in this Annual Report on Form 10-K should be carefully considered. The risks and uncertainties described below are not the only ones we face; others, either unforeseen or currently deemed less significant, may also have a negative impact on our company. If any of the following actually occurs, our business, operating results, cash flows, and financial condition could be materially adversely affected.
Sustained downturn in the economy could adversely impact our access to capital.
The recent disruptions in the global economic and financial markets adversely impacted the broader financial and credit markets, at times reducing the availability of debt and equity capital for the market as a whole. Conditions such as these could re-emerge in the future. Accordingly, our ability to access the capital markets could be restricted at a time when we would like, or need, to access those markets, which could have an impact on our flexibility to react to changing economic and business conditions. The resulting lack of available credit, increased volatility in the financial markets and reduced business activity could materially and adversely affect our business, financial condition, results of operations, our ability to take advantage of market opportunities and our ability to obtain and manage our liquidity. In addition, the cost of debt financing and the proceeds of equity financing may be materially and adversely impacted by these market conditions. The extent of any impact would depend on several factors, including our operating cash flows, the duration of tight credit conditions and volatile equity markets, our credit capacity, the cost of financing, and other general economic and business conditions. Our credit agreements contain performance covenants, such as a limit on the ratio of debt to earnings before interest, taxes, depreciation and amortization, and limits on subsidiary debt and incurrence of liens. Although we believe none of these covenants are currently restrictive to our operations, our ability to meet the financial covenants can be affected by events beyond our control.
We may not be successful in implementing and managing our growth strategy.
We have established a growth strategy for the business based on a changing and evolving world. Through this strategy we are positioning the company to take advantage of existing markets, explore growth opportunities in new markets with supportive demographics, increase demand by addressing unmet needs, and expanding into areas that yield higher prospects for margins and profitability.
We ultimately aspire to create a lifestyle brand, and we intend to grow in certain targeted ways. First, we will invest in areas that increase our addressable markets across focused customer segments (such as healthcare, education, small and medium business, textiles, and consumer). Second, we will expand into emerging geographic markets that offer growth potential based upon their supportive demographics. Third, we will continue to invest in innovative products, which has been a hallmark of our success for many years. And finally, we will grow through targeted acquisitions.
While we have confidence that our strategic plan reflects opportunities that are appropriate and achievable and that we have anticipated and will manage the associated risks, there is the possibility that the strategy may not deliver the projected results due to inadequate execution, incorrect assumptions, sub-optimal resource allocation, or changing customer requirements.
There is no assurance that our current product and service offering will allow us to meet these goals. Accordingly, we believe we will be required to continually invest in the research, design, and development of new products and services. There is no assurance that such investments will have commercially successful results.
Certain growth opportunities may require us to invest in acquisitions, alliances, and the startup of new business ventures. These investments may not perform according to plan and may involve the assumption of business, operational, or other risks that are new to our business.
Future efforts to expand our business within developing economies, particularly within China and India, may expose us to the effects of political and economic instability. Such instability may impact our ability to compete for business. It may also put the availability and/or value of our capital investments within these regions at risk. These expansion efforts expose us to operating environments with complex, changing, and in some cases, inconsistently-applied legal and regulatory requirements. Developing knowledge and understanding of these requirements poses a significant challenge and failure to remain compliant with them could limit our ability to continue doing business in these locations.
Pursuing our strategic plan in new and adjacent markets, as well as within developing economies, will require us to find effective new channels of distribution. There is no assurance that we can develop or otherwise identify these channels of distribution.
The markets in which we operate are highly competitive and we may not be successful in winning new business.
We are one of several companies competing for new business within the furniture industry. Many of our competitors offer similar categories of products, including office seating, systems and freestanding office furniture, casegoods, storage, and residential and healthcare furniture solutions. We believe that our innovative product design, functionality, quality, depth of knowledge, and strong network of distribution partners differentiate us in the marketplace. However, increased market pricing pressure could make it difficult for us to win new business with certain customers and within certain market segments at acceptable profit margins.
-
6
-
The retail furnishings market is highly competitive. We compete with national and regional furniture retailers and department stores. In addition, we compete with mail order catalogs and online retailers focused on home furnishings. We compete with these and other retailers for customers, suitable retail locations, vendors, qualified employees, and management personnel. Some of our competitors have significantly greater financial, marketing and other resources than we possess. This may result in our competitors being quicker at the following: adapting to changes, devoting greater resources to the marketing and sale of their products, generating greater national brand recognition, or adopting more aggressive pricing and promotional policies. In addition, increased catalog mailings by our competitors may adversely affect response rates to our own catalog mailings. As a result, increased competition may adversely affect our future financial performance.
Adverse economic and industry conditions could have a negative impact on our business, results of operations, and financial condition.
Customer demand within the contract office furniture industry is affected by various macro-economic factors; general corporate profitability, white-collar employment levels, new office construction rates, and existing office vacancy rates are among the most influential factors. History has shown that declines in these measures can have an adverse effect on overall office furniture demand. Additionally, factors and changes specific to our industry, such as developments in technology, governmental standards and regulations, and health and safety issues can influence demand. There are current and future economic and industry conditions that could adversely affect our business, operating results, or financial condition.
Other macroeconomic developments, such as the United Kingdom referendum on European Union membership, recent recessions in Europe, the debt crisis in certain countries in the European Union, and the economic slow down in Asia could negatively affect the company's ability to conduct business in those geographies. The current political and economic uncertainty in the United Kingdom surrounding European Union membership and ongoing debt pressures in certain European countries could cause the value of the British Pound and/or the Euro to deteriorate, reducing the purchasing power of customers in these regions and potentially undermining the financial health of the company's suppliers and customers in other parts of the world. Financial difficulties experienced by the company's suppliers and customers, including distributors, could result in product delays and inventory issues; risks to accounts receivable could result in delays in collection and greater bad debt expense.
Our business presence outside the United States exposes us to certain risks that could negatively affect our results of operations and financial condition.
We have significant manufacturing and sales operations in the United Kingdom, which represents our largest marketplace outside the United States. We also have manufacturing operations in China and India. Additionally, our products are sold internationally through wholly-owned subsidiaries or branches in various countries including Canada, Mexico, Brazil, France, Germany, Italy, Netherlands, Japan, Australia, Singapore, China, Hong Kong, and India. In certain other regions of the world, our products are offered primarily through independent dealerships.
Doing business internationally exposes us to certain risks, many of which are beyond our control and could potentially impact our ability to design, develop, manufacture, or sell products in certain countries. These factors could include, but would not necessarily be limited to:
|
•
|
Political, social, and economic conditions
|
|
•
|
Legal and regulatory requirements
|
|
•
|
Labor and employment practices
|
|
•
|
Cultural practices and norms
|
|
•
|
Natural disasters
|
|
•
|
Security and health concerns
|
|
•
|
Protection of intellectual property
|
|
•
|
Changes in foreign currency exchange rates
|
In some countries, the currencies in which we import and export products can differ. Fluctuations in the rate of exchange between these currencies could negatively impact our business and our financial performance. Additionally, tariff and import regulations, international tax policies and rates, and changes in U.S. and international monetary policies may have an adverse impact on results of operations and financial condition.
Risks and Costs Associated with Protecting the Integrity and Security of Our Systems and Confidential Information
We collect certain customer-specific data, including credit card information, in connection with orders placed through our e-commerce websites, direct-mail catalog marketing program, and DWR retail studios. For these sales channels to function and develop successfully, we and other parties involved in processing customer transactions must be able to transmit confidential information, including credit card information and other personal information regarding our customers, securely over public and private networks. Third parties may have or develop the technology or knowledge to breach, disable, disrupt or interfere with our systems or processes or those of our vendors. Although we take the security of our systems and the privacy of our customers’ confidential information seriously and we believe we take reasonable steps to protect the security and confidentiality of the information we collect, we cannot guarantee that our security measures will effectively prevent others from obtaining unauthorized access to our information and our customers’ information. The techniques used to obtain unauthorized access to systems change frequently and are not often recognized until after they have been launched.
-
7
-
Any person who circumvents our security measures could destroy or steal valuable information or disrupt our operations. Any security breach could cause consumers to lose confidence in the security of our information systems, including our e-commerce websites or stores and choose not to purchase from us. Any security breach could also expose us to risks of data loss, litigation, regulatory investigations, and other significant liabilities. Such a breach could also seriously disrupt, slow or hinder our operations and harm our reputation and customer relationships, any of which could harm our business.
A security breach includes a third party wrongfully gaining unauthorized access to our systems for the purpose of misappropriating assets or sensitive information, loading corrupting data, or causing operational disruption. These actions may lead to a significant disruption of the Company’s IT systems and/or cause the loss of business and business information resulting in an adverse business impact, including: (1) future financial results due to theft, destruction, loss misappropriation, or release of confidential data or intellectual property; (2) operational or business delays resulting from the disruption of IT systems, and subsequent clean-up and mitigation activities; and (3) negative publicity resulting in reputation or brand damage with customers, partners or industry peers.
In addition, states and the federal government are increasingly enacting laws and regulations to protect consumers against identity theft. Also, as our business expands globally, we are subject to data privacy and other similar laws in various foreign jurisdictions. If we are the target of a cybersecurity attack resulting in unauthorized disclosure of our customer data, we may be required to undertake costly notification procedures. Compliance with these laws will likely increase the costs of doing business. If we fail to implement appropriate safeguards or to detect and provide prompt notice of unauthorized access as required by some of these laws, we could be subject to potential claims for damages and other remedies, which could harm our business.
Disruptions in the supply of raw and component materials could adversely affect our manufacturing and assembly operations.
We rely on outside suppliers to provide on-time shipments of the various raw materials and component parts used in our manufacturing and assembly processes. The timeliness of these deliveries is critical to our ability to meet customer demand. Any disruptions in this flow of delivery could have a negative impact on our business, results of operations, and financial condition.
Increases in the market prices of manufacturing materials may negatively affect our profitability.
The costs of certain manufacturing materials used in our operations are sensitive to shifts in commodity market prices. In particular, the costs of steel, plastic, aluminum components, and particleboard are sensitive to the market prices of commodities such as raw steel, aluminum, crude oil, lumber, and resins. Increases in the market prices of these commodities, such as what we began to experience toward the end of fiscal 2016 for steel, may have an adverse impact on our profitability if we are unable to offset them with strategic sourcing, continuous improvement initiatives or increased prices to our customers.
Disruptions within our dealer network could adversely affect our business.
Our ability to manage existing relationships within our network of independent dealers is crucial to our ongoing success. Although the loss of any single dealer would not have a material adverse effect on the overall business, our business within a given market could be negatively affected by disruptions in our dealer network caused by the termination of commercial working relationships, ownership transitions, or dealer financial difficulties.
If dealers go out of business or restructure, we may suffer losses because they may not be able to pay for products already delivered to them. Also, dealers may experience financial difficulties, creating the need for outside financial support, which may not be easily obtained. In the past, we have, on occasion, agreed to provide direct financial assistance through term loans, lines of credit, and/or loan guarantees to certain dealers. Those activities increase our financial exposure.
We are unable to control many of the factors affecting consumer spending, and declines in consumer spending on furnishings could reduce demand for our products.
The operations of our Consumer segment are sensitive to a number of factors that influence consumer spending, including general economic conditions, consumer disposable income, unemployment, inclement weather, availability of consumer credit, consumer debt levels, conditions in the housing market, interest rates, sales tax rates and rate increases, inflation, and consumer confidence in future economic conditions. Adverse changes in these factors may reduce consumer demand for our products, resulting in reduced sales and profitability.
A number of factors that affect our ability to successfully implement our retail studio strategy, including opening new locations and closing existing studios, are beyond our control. These factors may harm our ability to increase the sales and profitability of our retail operations.
Approximately 60% of the sales within our Consumer segment are transacted within our DWR retail studios. Additionally, we believe our retail studios have a direct influence on the volume of business transacted through other channels, including our consumer e-commerce and direct-mail catalog platforms, as many customers utilize these physical spaces to view and experience products prior to placing an order online or through the catalog call center. Our ability to open additional studios or close existing studios successfully will depend upon a number of factors beyond our control, including:
-
8
-
|
•
|
General economic conditions
|
|
•
|
Identification and availability of suitable studio locations
|
|
•
|
Success in negotiating new leases and amending or terminating existing leases on acceptable terms
|
|
•
|
The success of other retailers in and around our retail locations
|
|
•
|
Ability to secure required governmental permits and approvals
|
|
•
|
Hiring and training skilled studio operating personnel
|
|
•
|
Landlord financial stability
|
Increasing competition for highly skilled and talented workers could adversely affect our business.
The successful implementation of our business strategy depends, in part, on our ability to attract and retain a skilled workforce. The increasing competition for highly skilled and talented employees could result in higher compensation costs, difficulties in maintaining a capable workforce, and leadership succession planning challenges.
Costs related to product defects could adversely affect our profitability.
We incur various expenses related to product defects, including product warranty costs, product recall and retrofit costs, and product liability costs. These expenses relative to product sales vary and could increase. We maintain reserves for product defect-related costs based on estimates and our knowledge of circumstances that indicate the need for such reserves. We cannot, however, be certain that these reserves will be adequate to cover actual product defect-related claims in the future. Any significant increase in the rate of our product defect expenses could have a material adverse effect on operations.
We are subject to risks associated with self-insurance related to health benefits.
We are self-insured for our health benefits and maintain per employee stop loss coverage; however, we retain the insurable risk at an aggregate level. Therefore unforeseen or catastrophic losses in excess of our insured limits could have a material adverse effect on the company’s financial condition and operating results. See Note 1 of the Consolidated Financial Statements for information regarding the company’s retention level.
Government and other regulations could adversely affect our business.
Government and other regulations apply to the manufacture and sale of many of our products. Failure to comply with these regulations or failure to obtain approval of products from certifying agencies could adversely affect the sales of these products and have a material negative impact on operating results.
None
-
9
-
The company owns or leases facilities located throughout the United States and several foreign countries. The location, square footage, and use of the most significant facilities at
May 28, 2016
were as follows:
|
Owned Locations
|
Square
Footage
|
|
Use
|
|
|
Zeeland, Michigan
|
750,800
|
|
Manufacturing, Warehouse, Office
|
|
|
Spring Lake, Michigan
|
582,700
|
|
Manufacturing, Warehouse, Office
|
|
|
Holland, Michigan
|
357,400
|
|
Distribution
|
|
|
Holland, Michigan
|
293,100
|
|
Manufacturing, Office
|
|
|
Holland, Michigan
|
238,200
|
|
Office, Design
|
|
|
Dongguan, China
|
180,800
|
|
Manufacturing, Office
|
|
|
Sheboygan, Wisconsin
|
207,700
|
|
Manufacturing, Warehouse, Office
|
|
|
Melksham, United Kingdom
|
170,000
|
|
Manufacturing, Warehouse, Office
|
|
|
Hildebran, North Carolina
|
93,000
|
|
Manufacturing, Office
|
|
|
Leased Locations
|
Square
Footage
|
|
Use
|
|
|
Hebron, Kentucky
|
316,800
|
|
Warehouse
|
|
|
Atlanta, Georgia
|
176,700
|
|
Manufacturing, Warehouse, Office
|
|
|
Bangalore, India
|
104,950
|
|
Manufacturing, Warehouse
|
|
|
Ningbo, China
|
94,700
|
|
Manufacturing, Warehouse, Office
|
|
|
Yaphank, New York
|
92,000
|
|
Warehouse, Office
|
|
|
New York City, New York
|
59,000
|
|
Office, Retail
|
|
|
Hong Kong, China
|
54,400
|
|
Warehouse
|
|
|
Bangalore, India
|
43,560
|
|
Warehouse, Distribution
|
|
|
Brooklyn, New York
|
39,400
|
|
Warehouse, Retail
|
|
|
Stamford, Connecticut
|
35,300
|
|
Office, Retail
|
|
As of
May 28, 2016
, the company leased 29 DWR retail studios that totaled approximately 250,000 square feet of selling space. The company also maintains administrative and sales offices and showrooms in various other locations throughout North America, Europe, Asia/Pacific, and Latin America. The company considers its existing facilities to be in good condition and adequate for its design, production, distribution, and selling requirements.
-
10
-
The company is involved in legal proceedings and litigation arising in the ordinary course of business. In the opinion of management, the outcome of such proceedings and litigation currently pending will not materially affect the company’s consolidated operations, cash flows and financial condition.
Additional Item: Executive Officers of the Registrant
Certain information relating to Executive Officers of the company is as follows.
|
Name
|
Age
|
Year Elected an Executive Officer
|
Position with the Company
|
|
Brian C. Walker
|
54
|
1996
|
President and Chief Executive Officer
|
|
Andrew J. Lock
|
62
|
2003
|
Executive Vice President, President, International
|
|
Donald D. Goeman
|
59
|
2005
|
Executive Vice President, Research, Design & Development
|
|
Gregory J. Bylsma
|
51
|
2009
|
Executive Vice President, Chief Operating Officer Herman Miller North America (Work and Learning)
|
|
Steven C. Gane
|
61
|
2009
|
Senior Vice President, President, Geiger & Specialty/Consumer
|
|
Jeffrey M. Stutz
|
45
|
2009
|
Executive Vice President, Chief Financial Officer
|
|
B. Ben Watson
|
51
|
2010
|
Executive Creative Director
|
|
Michael F. Ramirez
|
51
|
2011
|
Senior Vice President, People, Places and Administration
|
|
Louise McDonald
|
61
|
2013
|
Executive Vice President, President, Healthcare
|
|
H. Timothy Lopez
|
45
|
2014
|
Senior Vice President, Legal Services, General Counsel and Secretary
|
|
Jeffrey L. Kurburski
|
50
|
2014
|
Vice President, Information Technology
|
|
John Edelman
|
49
|
2015
|
Executive Vice President and Chief Executive Officer, Design Within Reach, Inc.
|
|
John McPhee
|
53
|
2015
|
Executive Vice President and President, Design Within Reach, Inc.
|
|
Kevin Veltman
|
41
|
2015
|
Vice President, Investor Relations and Treasurer
|
|
Malisa Bryant
|
49
|
2015
|
Senior Vice President of Sales and Distribution, Herman Miller North America (Work and Learning)
|
Except as discussed below, each of the named officers has served the company in an executive capacity for more than five years.
Ms. Bryant joined the Company in 2013 as Vice President and General Manager of Focused Market Segments and most recently served as Vice President of North America Sales. Prior to joining the Company, she held several leadership roles within the industry, including Vice President of Customer Support, Vice President and General Manager of Strategic Accounts, and Vice President of Sales for Allsteel, in each case at HNI.
Mr. Edelman joined Herman Miller, Inc. in 2015 subsequent to the company's acquisition of DWR. Prior to joining DWR as President and Chief Executive Office in 2010 he served as President and CEO of Edelman Leather and Sam & Libby, Inc., where he was responsible for its U.S. business.
Mr. McPhee joined Herman Miller, Inc. in 2015 subsequent to the company's acquisition of DWR. Prior to that he served in various roles at DWR including Chief Operating Officer and President. Mr. McPhee previously held senior management positions with Edelman Leather, Candie's, Inc. and Sam & Libby, Inc.
Mr. Veltman joined Herman Miller in 2014 and serves as Vice President - Investor Relations and Treasurer. Previously he worked for BISSELL, Inc, most recently as Vice President – Finance, for 8 years and Ernst & Young, LLP for 10 years.
Mr. Kurburski joined Herman Miller in 1990. He served as Director of IT, Herman Miller Casegoods from 1998 to 2003, Director of IT Infrastructure from 2003 to 2007, and has served in his current capacity of Vice President of Information Technology since 2007.
Mr. Lopez joined Herman Miller in 2012 and serves as Senior Vice President of Legal Services, General Counsel and Secretary. Prior to this he was an Associate General Counsel with A. O. Smith Corporation from 2008 to 2012 and Senior Staff Attorney to Kohler Co. from 2002 to 2008.
-
11
-
Ms. McDonald joined Herman Miller in 2013 as President of Healthcare, and prior to this she worked for Welch Allyn for 31 years serving mostly as an Executive Vice President.
There are no family relationships between or among the above-named executive officers. There are no arrangements or understandings between any of the above-named officers pursuant to which any of them was named an officer.
-
12
-
Share Price, Earnings, and Dividends Summary
Herman Miller, Inc. common stock is traded on the NASDAQ-Global Select Market System (Symbol: MLHR). As of July 21, 2016, there were approximately 20,000 record holders, including individual participants in security position listings, of the company's common stock.
|
Per Share and Unaudited
|
Market
Price
High
(at close)
|
|
Market
Price
Low
(at close)
|
|
Market
Price
Close
|
|
Earnings
Per Share-
Diluted
|
|
Dividends
Declared Per
Share
|
|
|||||||||
|
Year ended May 28, 2016:
|
|
|
|
|
|||||||||||||||
|
First quarter
|
$
|
30.50
|
|
$
|
26.75
|
|
$
|
26.99
|
|
|
$
|
0.56
|
|
|
$
|
0.1475
|
|
||
|
Second quarter
|
32.69
|
|
26.28
|
|
32.14
|
|
|
0.57
|
|
|
0.1475
|
|
|||||||
|
Third quarter
|
32.11
|
|
22.92
|
|
26.29
|
|
|
0.46
|
|
0.1475
|
|
||||||||
|
Fourth quarter
|
31.64
|
|
26.09
|
|
31.64
|
|
|
0.67
|
|
|
0.1475
|
|
|||||||
|
Year
|
$
|
32.69
|
|
$
|
22.92
|
|
$
|
31.64
|
|
|
$
|
2.26
|
|
|
$
|
0.5900
|
|
||
|
Year ended May 30, 2015:
|
|||||||||||||||||||
|
First quarter
|
$
|
32.26
|
|
|
$
|
28.69
|
|
|
$
|
29.72
|
|
|
$
|
0.42
|
|
|
$
|
0.1400
|
|
|
Second quarter
|
32.12
|
|
|
28.44
|
|
|
30.39
|
|
|
0.46
|
|
|
0.1400
|
|
|||||
|
Third quarter
|
31.89
|
|
|
27.69
|
|
|
30.97
|
|
|
0.35
|
|
0.1400
|
|
||||||
|
Fourth quarter
|
31.20
|
|
|
27.12
|
|
|
27.70
|
|
|
0.39
|
|
|
0.1400
|
|
|||||
|
Year
|
$
|
32.26
|
|
|
$
|
27.12
|
|
$
|
27.70
|
|
|
$
|
1.62
|
|
|
$
|
0.5600
|
|
|
Dividends were declared and paid quarterly during
fiscal 2016
and
2015
as approved by the Board of Directors. While it is anticipated that the company will continue to pay quarterly cash dividends, the amount and timing of such dividends is subject to the discretion of the Board depending on the company's future results of operations, financial condition, capital requirements, and other relevant factors.
Issuer Purchases of Equity Securities
The following is a summary of share repurchase activity during the fourth quarter ended
May 28, 2016
.
|
Period
|
(a) Total Number of
Shares (or Units) Purchased
|
|
(b) Average Price Paid
per Share or Unit
|
|
(c) Total Number of
Shares (or Units)
Purchased as Part of
Publicly Announced
Plans or Programs
|
|
(d) Maximum Number (or
Approximate Dollar
Value) of Shares (or
Units) that May Yet be
Purchased Under the
Plans or Programs
(1)
|
|
||||
|
2/28/16 - 3/26/16
|
2,513
|
|
26.29
|
|
2,513
|
|
$
|
137,792,871
|
|
|||
|
3/27/16 - 4/23/16
|
92,747
|
|
30.74
|
|
92,747
|
|
$
|
134,941,923
|
|
|||
|
4/24/16 - 5/28/16
|
85,088
|
|
30.51
|
|
85,088
|
|
$
|
132,346,007
|
|
|||
|
Total
|
180,348
|
|
|
|
180,348
|
|
|
|||||
(1) Amounts are as of the end of the period indicated
-
13
-
The company has a share repurchase plan authorized by the Board of Directors on September 28, 2007, which provided share repurchase authorization of $300,000,000 with no specified expiration date.
No repurchase plans expired or were terminated during the fourth quarter of
fiscal 2016
.
During the period covered by this report, the company did not sell any shares of common stock that were not registered under the Securities Act of 1933.
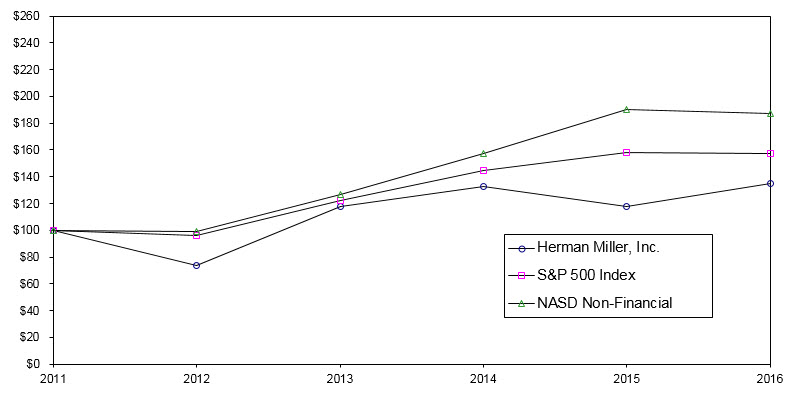
Stockholder Return Performance Graph
Set forth below is a line graph comparing the yearly percentage change in the cumulative total stockholder return on the company's common stock with that of the cumulative total return of the Standard & Poor's 500 Stock Index and the NASD Non-Financial Index for the five-year period ended
May 28, 2016
. The graph assumes an investment of $100 on May 28, 2011 in the company's common stock, the Standard & Poor's 500 Stock Index and the NASD Non-Financial Index, with dividends reinvested.
|
2011
|
|
2012
|
|
2013
|
|
2014
|
|
2015
|
2016
|
||||||||||||||
|
Herman Miller, Inc.
|
$
|
100
|
|
|
$
|
74
|
|
|
$
|
118
|
|
|
$
|
132
|
|
|
$
|
118
|
|
$
|
135
|
|
|
|
S&P 500 Index
|
$
|
100
|
|
|
$
|
96
|
|
|
$
|
123
|
|
|
$
|
145
|
|
|
$
|
158
|
|
$
|
158
|
|
|
|
NASD Non-Financial
|
$
|
100
|
|
|
$
|
99
|
|
|
$
|
127
|
|
|
$
|
157
|
|
|
$
|
190
|
|
$
|
188
|
|
|
Information required by this item is also contained in Item 12 of this report.
-
14
-
|
Review of Operations
|
||||||||||||||||||||
|
(In millions, except key ratios and per share data)
|
2016
|
2015
|
2014
|
2013
|
2012
|
|||||||||||||||
|
Operating Results
|
||||||||||||||||||||
|
Net sales
|
$
|
2,264.9
|
|
$
|
2,142.2
|
|
$
|
1,882.0
|
|
$
|
1,774.9
|
|
$
|
1,724.1
|
|
|||||
|
Gross margin
|
874.2
|
|
791.4
|
|
631.0
|
|
605.2
|
|
590.6
|
|
||||||||||
|
Selling, general, and administrative
(8)
|
585.6
|
|
556.6
|
|
590.8
|
|
430.4
|
|
400.3
|
|
||||||||||
|
Design and research
|
77.1
|
|
71.4
|
|
65.9
|
|
59.9
|
|
52.7
|
|
||||||||||
|
Operating earnings (loss)
|
211.5
|
|
163.4
|
|
(25.7
|
)
|
114.9
|
|
137.6
|
|
||||||||||
|
Earnings (loss) before income taxes
|
196.6
|
|
145.2
|
|
(43.4
|
)
|
97.2
|
|
119.5
|
|
||||||||||
|
Net earnings (loss)
|
137.5
|
|
98.1
|
|
(22.1
|
)
|
68.2
|
|
75.2
|
|
||||||||||
|
Cash flow from operating activities
|
210.4
|
|
167.7
|
|
90.1
|
|
136.5
|
|
90.1
|
|
||||||||||
|
Cash flow used in investing activities
|
(80.8
|
)
|
(213.6
|
)
|
(48.2
|
)
|
(209.7
|
)
|
(58.4
|
)
|
||||||||||
|
Cash flow (used in) provided by financing activities
|
(106.5
|
)
|
6.8
|
|
(22.4
|
)
|
(16.0
|
)
|
(1.6
|
)
|
||||||||||
|
Depreciation and amortization
|
53.0
|
|
49.8
|
|
42.4
|
|
37.5
|
|
37.2
|
|
||||||||||
|
Capital expenditures
|
85.1
|
|
63.6
|
|
40.8
|
|
50.2
|
|
28.5
|
|
||||||||||
|
Common stock repurchased plus cash dividends paid
|
49.0
|
|
37.0
|
|
43.0
|
|
22.7
|
|
7.9
|
|
||||||||||
|
|
||||||||||||||||||||
|
Key Ratios
|
||||||||||||||||||||
|
Sales growth
|
5.7
|
%
|
13.8
|
%
|
6.0
|
%
|
2.9
|
%
|
4.5
|
%
|
||||||||||
|
Gross margin
(1)
|
38.6
|
|
36.9
|
|
33.5
|
|
34.1
|
|
34.3
|
|
||||||||||
|
Selling, general, and administrative
(1) (8)
|
25.9
|
|
26.0
|
|
31.4
|
|
24.3
|
|
23.2
|
|
||||||||||
|
Design and research
(1)
|
3.4
|
|
3.3
|
|
3.5
|
|
3.4
|
|
3.1
|
|
||||||||||
|
Operating earnings
(1)
|
9.3
|
|
7.6
|
|
(1.4
|
)
|
6.5
|
|
8.0
|
|
||||||||||
|
Net earnings growth (decline)
|
40.2
|
|
543.9
|
|
(132.4
|
)
|
(9.3
|
)
|
6.2
|
|
||||||||||
|
After-tax return on net sales
(4)
|
6.1
|
|
4.6
|
|
(1.2
|
)
|
3.8
|
|
4.4
|
|
||||||||||
|
After-tax return on average assets
(5) (9)
|
11.3
|
|
9.0
|
|
(2.3
|
)
|
7.6
|
|
9.0
|
|
||||||||||
|
After-tax return on average equity
(6) (9)
|
29.1
|
%
|
25.0
|
%
|
(6.5
|
)%
|
24.7
|
%
|
34.4
|
%
|
||||||||||
|
|
||||||||||||||||||||
|
Share and Per Share Data
|
||||||||||||||||||||
|
Earnings (loss) per share-diluted
|
$
|
2.26
|
|
$
|
1.62
|
|
$
|
(0.37
|
)
|
$
|
1.16
|
|
$
|
1.29
|
|
|||||
|
Cash dividends declared per share
|
0.59
|
|
0.56
|
|
0.53
|
|
0.43
|
|
0.09
|
|
||||||||||
|
Book value per share at year end
(9) (10)
|
8.76
|
|
7.04
|
|
6.14
|
|
5.31
|
|
4.13
|
|
||||||||||
|
Market price per share at year end
|
31.64
|
|
27.70
|
|
31.27
|
|
28.11
|
|
17.87
|
|
||||||||||
|
Weighted average shares outstanding-diluted
|
60.5
|
|
60.1
|
|
59.0
|
|
58.8
|
|
58.5
|
|
||||||||||
|
|
||||||||||||||||||||
|
Financial Condition
|
||||||||||||||||||||
|
Total assets
(9)
|
$
|
1,235.2
|
|
$
|
1,192.7
|
|
$
|
995.6
|
|
$
|
951.2
|
|
$
|
843.8
|
|
|||||
|
Working capital
(3) (9)
|
90.5
|
|
110.1
|
|
83.2
|
|
96.8
|
|
189.1
|
|
||||||||||
|
Current ratio
(2) (9)
|
1.2
|
|
1.3
|
|
1.2
|
|
1.3
|
|
1.7
|
|
||||||||||
|
Interest-bearing debt and related swap agreements
(11)
|
221.9
|
|
290.0
|
|
250.0
|
|
250.0
|
|
250.0
|
|
||||||||||
|
Stockholders' equity
(9)
|
524.7
|
|
420.3
|
|
364.3
|
|
311.7
|
|
240.5
|
|
||||||||||
|
Total capital
(7) (9)
|
746.6
|
|
710.3
|
|
614.3
|
|
561.7
|
|
490.5
|
|
||||||||||
(1) Shown as a percent of net sales.
(2) Calculated using current assets divided by current liabilities.
(3) Calculated using current assets less non-interest bearing current liabilities.
(4) Calculated as net earnings (loss) divided by net sales.
(5) Calculated as net earnings (loss) divided by average assets.
(6) Calculated as net earnings (loss) divided by average equity.
(7) Calculated as interest-bearing debt plus stockholders' equity.
(8) Selling, general, and administrative expenses includes restructuring and impairment expenses in years that are applicable.
(9) Due to an immaterial correction related to the accrual for product warranties, historical figures may have changed. Refer to Note 1 to the Consolidated Financial Statements for additional information regarding this change.
(10) Calculated as total stockholders' equity divided by common shares of stock outstanding.
(11) Amounts shown include the fair market value of the company’s interest rate swap arrangement(s). The net fair value of this/these arrangement(s) was/were $1.2 million at May 29, 2010, $2.4 million at May 30, 2009, $0.5 million at May 31, 2008, and $(1.8) million at June 2, 2007.
-
15
-
|
Review of Operations
|
|||||||||||||||||||
|
(In millions, except key ratios and per share data)
|
2011
|
2010
|
2009
|
2008
|
2007
|
||||||||||||||
|
Operating Results
|
|||||||||||||||||||
|
Net sales
|
$
|
1,649.2
|
|
$
|
1,318.8
|
|
$
|
1,630.0
|
|
$
|
2,012.1
|
|
$
|
1,918.9
|
|
||||
|
Gross margin
|
538.1
|
|
428.5
|
|
527.7
|
|
698.7
|
|
645.9
|
|
|||||||||
|
Selling, general, and administrative
(8)
|
369.0
|
|
334.4
|
|
359.2
|
|
400.9
|
|
395.8
|
|
|||||||||
|
Design and research
|
45.8
|
|
40.5
|
|
45.7
|
|
51.2
|
|
52.0
|
|
|||||||||
|
Operating earnings
|
123.3
|
|
53.6
|
|
122.8
|
|
246.6
|
|
198.1
|
|
|||||||||
|
Earnings before income taxes
|
102.5
|
|
34.8
|
|
98.9
|
|
230.4
|
|
187.0
|
|
|||||||||
|
Net earnings
|
70.8
|
|
28.3
|
|
68.0
|
|
152.3
|
|
129.1
|
|
|||||||||
|
Cash flow from operating activities
|
89.0
|
|
98.7
|
|
91.7
|
|
213.6
|
|
137.7
|
|
|||||||||
|
Cash flow used in investing activities
|
(31.4
|
)
|
(77.6
|
)
|
(29.5
|
)
|
(51.0
|
)
|
(37.4
|
)
|
|||||||||
|
Cash flow used in financing activities
|
(50.2
|
)
|
(78.9
|
)
|
(16.5
|
)
|
(86.5
|
)
|
(131.5
|
)
|
|||||||||
|
Depreciation and amortization
|
39.1
|
|
42.6
|
|
41.7
|
|
43.2
|
|
41.2
|
|
|||||||||
|
Capital expenditures
|
30.5
|
|
22.3
|
|
25.3
|
|
40.5
|
|
41.3
|
|
|||||||||
|
Common stock repurchased plus cash dividends paid
|
6.0
|
|
5.7
|
|
19.5
|
|
287.9
|
|
185.6
|
|
|||||||||
|
|
|||||||||||||||||||
|
Key Ratios
|
|||||||||||||||||||
|
Sales growth (decline)
|
25.1
|
%
|
(19.1
|
)%
|
(19.0
|
)%
|
4.9
|
%
|
10.5
|
%
|
|||||||||
|
Gross margin
(1)
|
32.6
|
|
32.5
|
|
32.4
|
|
34.7
|
|
33.7
|
|
|||||||||
|
Selling, general, and administrative
(1) (8)
|
22.4
|
|
25.4
|
|
22.0
|
|
19.9
|
|
20.6
|
|
|||||||||
|
Design and research
(1)
|
2.8
|
|
3.1
|
|
2.8
|
|
2.5
|
|
2.7
|
|
|||||||||
|
Operating earnings
(1)
|
7.5
|
|
4.1
|
|
7.5
|
|
12.3
|
|
10.3
|
|
|||||||||
|
Net earnings growth (decline)
|
150.2
|
|
(58.4
|
)
|
(55.4
|
)
|
18.0
|
|
30.1
|
|
|||||||||
|
After-tax return on net sales
(4)
|
4.3
|
|
2.1
|
|
4.2
|
|
7.6
|
|
6.7
|
|
|||||||||
|
After-tax return on average assets
(5) (9)
|
8.9
|
|
3.7
|
|
8.7
|
|
20.9
|
|
19.2
|
|
|||||||||
|
After-tax return on average equity
(6) (9)
|
52.5
|
%
|
78.1
|
%
|
860.8
|
%
|
186.4
|
%
|
92.7
|
%
|
|||||||||
|
|
|||||||||||||||||||
|
Share and Per Share Data
|
|||||||||||||||||||
|
Earnings per share-diluted
|
$
|
1.06
|
|
$
|
0.43
|
|
$
|
1.25
|
|
$
|
2.56
|
|
$
|
1.98
|
|
||||
|
Cash dividends declared per share
|
0.09
|
|
0.09
|
|
0.29
|
|
0.35
|
|
0.33
|
|
|||||||||
|
Book value per share at year end
(9) (10)
|
3.42
|
|
1.27
|
|
—
|
|
0.28
|
|
2.35
|
|
|||||||||
|
Market price per share at year end
|
24.56
|
|
19.23
|
|
14.23
|
|
24.80
|
|
36.53
|
|
|||||||||
|
Weighted average shares outstanding-diluted
|
57.7
|
|
57.5
|
|
54.5
|
|
59.6
|
|
65.1
|
|
|||||||||
|
|
|||||||||||||||||||
|
Financial Condition
|
|||||||||||||||||||
|
Total assets
(9)
|
$
|
819.1
|
|
$
|
775.3
|
|
$
|
772.0
|
|
$
|
787.9
|
|
$
|
670.9
|
|
||||
|
Working capital
(3) (9)
|
193.4
|
|
69.2
|
|
155.2
|
|
170.2
|
|
87.7
|
|
|||||||||
|
Current ratio
(2) (9)
|
1.7
|
|
1.2
|
|
1.5
|
|
1.5
|
|
1.3
|
|
|||||||||
|
Interest-bearing debt and related swap agreements
(11)
|
250.0
|
|
301.2
|
|
377.4
|
|
375.5
|
|
176.2
|
|
|||||||||
|
Stockholders' equity
(9)
|
197.2
|
|
72.3
|
|
0.2
|
|
15.6
|
|
147.8
|
|
|||||||||
|
Total capital
(7) (9)
|
447.2
|
|
373.5
|
|
377.6
|
|
391.1
|
|
324.0
|
|
|||||||||
-
16
-
You should read the issues discussed in Management's Discussion and Analysis in conjunction with the company's Consolidated Financial Statements and the Notes to the Consolidated Financial Statements included in this Form 10-K.
Executive Overview
Herman Miller’s mission statement is Inspiring Designs to Help People Do Great Things. At present, most of our customers come to us for furnishing interior environments in corporate offices, healthcare settings, higher education institutions, and residential spaces. Our primary products include furniture systems, seating, storage, freestanding furniture, healthcare environment products, casegoods, textiles, and related technologies and services.
Herman Miller’s mission statement is Inspiring Designs to Help People Do Great Things. At present, most of our customers come to us for furnishing interior environments in corporate offices, healthcare settings, higher education institutions, and residential spaces. Our primary products include furniture systems, seating, storage, freestanding furniture, healthcare environment products, casegoods, textiles, and related technologies and services.
More than 100 years of innovative business practices and a commitment to social responsibility have established Herman Miller as a recognized global company. A past recipient of the Smithsonian Institution's Cooper Hewitt National Design Award, Herman Miller designs can be found in the permanent collections of museums worldwide. Herman Miller maintains its listing in the Dow Jones Sustainability World Index as well as the Human Rights Campaign Foundation’s top rating in its annual Corporate Equality Index. The company trades on the NASDAQ Global Select Market under the symbol MLHR.
Herman Miller's products are sold internationally through wholly-owned subsidiaries or branches in various countries including the United Kingdom, Canada, France, Germany, Italy, Japan, Mexico, Australia, Singapore, China, Hong Kong, India, Brazil and the Netherlands. The company's products are offered elsewhere in the world primarily through independent dealerships or joint ventures with customers in over 100 countries.
The company is globally positioned in terms of manufacturing operations. In the United States, manufacturing operations are located in Michigan, Georgia, Wisconsin, and North Carolina. In Europe, its manufacturing presence is located within the United Kingdom. Manufacturing operations in Asia include facilities located in Dongguan and Ningbo, China and a new manufacturing facility in India opened this year. The company manufactures products using a system of lean manufacturing techniques collectively referred to as the Herman Miller Performance System (HMPS). Herman Miller strives to maintain efficiencies and cost savings by minimizing the amount of inventory on hand. Accordingly, production is order-driven with direct materials and components purchased as needed to meet demand. The standard lead time for the majority of our products is 10 to 20 days. These factors result in a high rate of inventory turns related to our manufactured inventories.
A key element of the company's manufacturing strategy is to limit fixed production costs by sourcing component parts from strategic suppliers. This strategy has allowed the company to increase the variable nature of our cost structure while retaining proprietary control over those production processes that we believe provide us a competitive advantage. As a result of this strategy, our manufacturing operations are largely assembly-based.
The business is comprised of various operating segments as defined by generally accepted accounting principles in the United States (U.S. GAAP). The operating segments are determined on the basis of how the company internally reports and evaluates financial information used to make operating decisions. The company has identified the following reportable segments:
|
•
|
North American Furniture Solutions
— Includes the operations associated with the design, manufacture, and sale of furniture products for work-related settings, including office, education, and healthcare environments, throughout the United States and Canada. The North American Furniture Solutions reportable segment is the aggregation of two operating segments. In addition, the company has determined that both operating segments within the North American Furniture Solutions reportable segment represent reporting units.
|
|
•
|
ELA Furniture Solution
s — ELA Furniture Solutions includes the operations associated with the design, manufacture, and sale of furniture products, primarily for work-related settings, in the EMEA, Latin America, and Asia-Pacific geographic regions.
|
|
•
|
Specialty
— Includes the operations associated with design, manufacture, and sale of high-craft furniture products and textiles including Geiger wood products, Maharam textiles, and Herman Miller Collection products.
|
|
•
|
Consumer
— Includes the operations associated with the sale of modern design furnishings and accessories to third party retail distributors, as well as direct to consumer sales through e-commerce, direct mailing catalogs, and DWR studios.
|
The company also reports a corporate category consisting primarily of unallocated corporate expenses including restructuring, impairment, acquisition-related costs, and other unallocated corporate costs.
-
17
-
Core Strengths
The company relies on the following core strengths in delivering workplace solutions to customers.
|
•
|
Portfolio of Leading Brands -
Herman Miller is a globally-recognized, authentic brand known for working with some of the most outstanding designers in the world. Within the industries in which the company operates, Herman Miller, DWR, Geiger, Maharam, POSH, Nemschoff and Colbrook Bosson Saunders ("CBS") are acknowledged as leading brands that inspire architects and designers to create their best design solutions. This portfolio has enabled Herman Miller to connect with new audiences, channels, geographies and product categories. Leveraging the company's brand equity across the lines of business is an important element of the company's business strategy.
|
|
•
|
Problem-Solving Design and Innovation
- The company is committed to developing research-based functionality and aesthetically innovative new products and has a history of doing so, in collaboration with a global network of leading independent designers. The company believes its skills and experience in matching problem-solving design with the workplace needs of customers provides the company with a competitive advantage in the marketplace. An important component of the company's business strategy is to actively pursue a program of new product research, design, and development. The company accomplishes this through the use of an internal research and engineering staff that engages with third party design resources generally compensated on a royalty basis.
|
|
•
|
Operational Excellence
- The company was among the first in our industry to embrace the concepts of lean manufacturing. HMPS provides the foundation for all of our manufacturing operations. The company is committed to continuously improving both product quality and production and operational efficiency. The company has extended this lean process work to its non-manufacturing processes as well as externally to our manufacturing supply chain and distribution channel. The company believes these concepts hold significant promise for further gains in reliability, quality and efficiency.
|
|
•
|
Leading Networks
- The company values relationships in all areas of the business. The company considers its network of innovative designers, owned and independent dealers, and suppliers to be among the most important competitive factors and vital to the long-term success of the business.
|
|
•
|
Multi-Channel Reach
- The company has built a unique, multi-channel distribution capability that it considers unique. Through contract furniture dealers, direct customer sales, retail studios, e-Commerce, catalogs and independent retailers, the company serves contract and residential customers across a range of channels and geographies.
|
Channels of Distribution
The company's products and services are offered to most of its customers under standard trade credit terms between 30 and 45 days and are sold through the following distribution channels.
|
•
|
Independent and Owned Contract Furniture Dealers
- Most of the company's product sales are made to a network of independently owned and operated contract furniture dealerships doing business in many countries around the world. These dealers purchase the company's products and distribute them to end customers. The company recognizes revenue on product sales through this channel once products are shipped and title passes to the dealer. Many of these dealers also offer furniture-related services, including product installation.
|
At
May 28, 2016
, the company owned
two
contract furniture dealerships, one of which has operations in multiple locations. The financial results of these owned dealers are included in our Consolidated Financial Statements. Product sales to these dealerships are eliminated as inter-company transactions from our consolidated financial results. The company recognizes revenue on these sales once products are shipped to the end customer and installation is substantially complete. The company believes independent ownership of contract furniture dealers is generally the best model for a financially strong distribution network. With this in mind, the company's strategy is to continue to pursue opportunities to transition the remaining owned dealerships to independent owners. Where possible, the goal is to involve local managers in these ownership transitions.
|
•
|
Direct Customer Sales
- The company also sells products and services directly to end customers without an intermediary (e.g. sales to the U.S. federal government). In most of these instances, the company contracts separately with a dealership or third-party installation company to provide sales-related services. The company recognizes revenue on these sales once products are shipped and installation is substantially complete.
|
|
•
|
DWR Retail Studios
- At the end of fiscal 2016, DWR had 29 retail studios and two outlet locations located in metropolitan areas throughout North America. Revenue on sales from these studios is recognized upon delivery to the end customer.
|
-
18
-
|
•
|
E-Commerce
- The company sells products through its online stores, in which products are available for sale via the company's website, hermanmiller.com as well as through the DWR online store, dwr.com. These sites complement our existing methods of distribution and extend the company's brand to new customers. The company recognizes revenue on these sales either upon shipment of the product, or for sales through the DWR online store, upon product delivery to the end customer.
|
|
•
|
DWR Direct-Mail Catalogs
- The company’s consumer business unit utilizes a direct-mail catalog program through its DWR subsidiary. A regular schedule of catalog mailings is maintained throughout the fiscal year and these serve as a key driver of sales across each of DWR’s channels, including retail studios and e-commerce websites. Revenue on sales transacted through this catalog program is recognized upon product delivery to the end customer.
|
|
•
|
Independent Retailers
- Certain products are sold to end customers through independent retail operations. Revenue is recognized on these sales once products are shipped and title passes to the independent retailer.
|
Challenges Ahead
Like all businesses, the company is faced with a host of challenges and risks. The company believes its core strengths and values, which provide the foundation for its strategic direction, have well prepared the company to respond to the inevitable challenges it will face in the future. While the company is confident in its direction, the company acknowledges the risks specific to the business and industry. Refer to Item 1A for discussion of certain of these risk factors. In particular, we continue to experience the negative impact of foreign currency translation and, as of the end of the year, increased pressures from discounting, particularly in the North America and ELA markets.
Avenues of Future Growth
In spite of the risks and challenges it faces, the company believes it is well positioned to successfully pursue its mission of inspiring designs to help people do great things. To find opportunities for growth, Herman Miller is always examining the ways in which the world is changing and evolving. This helps the company better meet the needs of its customers and ultimately, to exceed their expectations. The company has identified three areas of fundamental, social and technological change that are informing and influencing its business strategy.
|
•
|
Globalization & Demographics
— Demographic shifts in the global workforce are significantly changing how and where value creation happens. Not only has the millennial generation overtaken the majority representation of the workforce, but economies that once relied on industrial production are increasingly becoming driven by knowledge work.
|
|
•
|
Inherently Global & Seamlessly Digital
— The ubiquity of technology allows people to connect with other people, content, work, businesses, and ideas wherever and whenever they want. This means the way people work is changing, where people work is changing, and how people work with each other is changing.
|
|
•
|
The Era of Ideas
— With the ongoing optimization of industrial production and information sharing, the demand for more innovative business solutions increases. The global focus of work is shifting to the successful generation and deployment of new ideas. As creativity and idea generation drive greater value - people, not process, provide the distinguishing capability. In this shift, workplaces are fundamentally changing from standardized and process-driven designs to diverse places that harness human capability, creativity, and relationships.
|
Over the past several years, Herman Miller has deployed a strategy to grow the business by shifting its focus in four fundamental areas in response to these changes. Through these shifts the company believes it is positioned to take advantage of existing markets, explore growth opportunities in new markets with supportive demographics, increase demand by addressing unmet needs, and expand into areas that yield higher prospects for margins and profitability. The four fundamental shifts are described below:
|
•
|
From Product Centric to Solutions
— The first strategic shift is to move from a product centric focus to one based upon delivering broader solutions to customers. Herman Miller is retooling its core business to speak to customers with fresh insights, to spur new demand, and to change the game with unique solutions and services.
|
|
•
|
From North America Centric to Global
— The second shift in our strategy aims to transform the business into a truly global organization. Herman Miller has a solid existing customer base, but sees meaningful opportunity in emerging markets with supportive demographics. The company is positioning itself to take maximum advantage of these shifts.
|
|
•
|
From The Office to Everywhere
— The third fundamental strategic shift is moving from the office to everywhere. Herman Miller envisions continued leadership and viability in the contract furniture industry, but also sees distinct targeted opportunities through focused market segmentation. The company envisions a total offering for customers to enable “a lifestyle of purpose.”
|
-
19
-
|
•
|
From Industry brand to Industry + Consumer brand
— The fourth shift in strategy involves the company's ambition to expand the connection of its powerful brand more directly with the consumers of its products. With a legacy of decades of design leadership, Herman Miller is a brand that people desire and want to know. The company envisions a business that harnesses its brand vision to pull consumers to it.
|
This year the company has added one additional shift - product marketing to pull marketing - that it believes is required in order to reach the full velocity of its intended transformation. In other words, the company believes that this additional shift will put its strategy into
Overdrive
, which is what the strategy has been named.
Herman Miller intends to grow in targeted ways. First, the company will invest in areas that increase its existing markets across focused customer segments (such as healthcare, education, small and medium business, and consumer). Second, it will expand into emerging geographic markets that offer growth potential based upon their supportive demographics. Third, it will continue to invest in innovative products, which has been a hallmark of its success for many years. Finally, the company will grow through targeted acquisitions.
Industry Analysis
The Business and Institutional Furniture Manufacturer's Association (BIFMA) is the trade association for the North American contract furniture industry. The company monitors the trade statistics reported by BIFMA and considers them an indicator of industry-wide sales and order performance. BIFMA publishes statistical data for the contract segment and the office supply segment within the North American market. The contract segment of the industry relates primarily to products sold to large to mid-size corporations and installed via a network of dealers. The office supply segment relates primarily to products sold to smaller customers via wholesalers and retailers. The company participates, and is a leader in, the contract segment. Further, the company's diversification strategy lessens its dependence on the North American contract office furniture market.
The company analyzes BIFMA statistical information as a benchmark comparison against the performance of its contract business in North America and also to that of its competitors. The timing of large project-based business may affect comparisons to this data in any one period. Finally, BIFMA regularly provides its members with industry forecast information, which the company uses internally as one of several considerations in its short and long-range planning process.
After many years of compiling and reporting member production data for the U.S. market, BIFMA is revising its data collection process in an attempt to better reflect contract furniture production throughout North America, including products manufactured in Canada and Mexico. Prior to this change, products manufactured in Canada or Mexico and shipped to the U.S. were excluded from BIFMA’s estimate of industry shipments and orders. The new methodology is designed to provide a better reflection of the market as a whole, especially given the rise in competition based in Canada and Mexico as well as sourcing moves by the company's existing competitors. Additionally, BIFMA has revised its product definitions to better fit products specifically designed for the Healthcare and Education end markets. The net effect of this is that the estimated market size for the North American contract industry will increase substantially - resulting in a re-orientation of market share estimates across each industry participant. However, any BIFMA statistics that are mentioned throughout this document are based on the historical method of compiling the industry data and the company anticipates disclosure of BIFMA statistical data under the new method in the first quarter of fiscal 2017.
The company also monitors trade statistics reported by the U.S. Census Bureau, which reports monthly retail sales growth data across a number of retail categories, including Furniture and Home Furnishing Stores. This information provides a relative comparison to our Consumer reportable segment.
Looking forward, the general economic outlook for our industry in the North America is expected to be positive. BIFMA issued its most recent report in February 2016, which forecasts that the growth rate of office furniture orders will be 3.1 percent and 4.4 percent in calendar 2016 and 2017, respectively, while the growth rate of shipments will be 1.0 percent and 4.8 percent for calendar 2016 and 2017, respectively. This forecast of growth is based primarily on employment gains in the U.S., tempered by the current global economic uncertainty.
-
20
-
Discussion of Business Conditions
During fiscal 2016, we demonstrated further progress on our strategic and operational initiatives, evidenced by record annual net sales of $
2,264.9 million
. Fiscal 2016 net sales increased
5.7 percent
from the fiscal 2015 net sales of
$2,142.2 million
. The growth in net sales, combined with continued gross margin expansion and controlled operating expenses, drove earnings growth, as operating earnings increased
29.4 percent
in fiscal 2016 over the prior year. Diluted earnings per share increased to $
2.26
in fiscal 2016, as compared to $
1.62
in fiscal 2015. The company also announced an increase in its quarterly cash dividend to $0.17 per share, payable in October 2016. This change represents an increase of
15.3 percent
from the current dividend payout of $0.1475 per share.
The growth in sales and earnings during fiscal 2016 brought with it increased cash generation. As of the end of fiscal 2016, total cash and cash equivalents of $
84.9 million
represented an increase of $
21.2 million
from fiscal 2015. Cash flows from operations in the period were $
210.4 million
, which represented an increase of
25.5 percent
from fiscal 2015.
The North American segment contributed significantly to our growth in net sales, orders, and earnings during fiscal 2016. Net sales for the segment grew at a rate of 7.2 percent and orders increased by 8.1 percent as compared to fiscal 2015. Organic net sales growth for the year was 8.2 percent
(1)
and orders increased 9.0 percent, while operating earnings increased 21.4 percent to $152.0 million during fiscal 2016. We believe this improvement demonstrates the impact of our investments over the past year in new products, refreshed showrooms and a solutions-based selling approach that provides our customers with problem solving designs.
In spite of the negative impact of foreign currency translation, the ELA segment posted growth in net sales (0.7 percent) and operating earnings (36.3 percent) as compared to the prior year, while orders for the period decreased by 0.1 percent. On a constant currency basis relative to fiscal 2015, net sales growth for the year was
7.0 percent
(1)
and orders increased 6.2 percent. During fiscal 2016, a new manufacturing and distribution facility was opened in the United Kingdom, which has bolstered operational efficiency. Assembly operations were also launched in India, significantly expanding our ability to service customers in this growing market. Finally, the Asia-Pacific region has benefited from renewed momentum of the POSH brand, which delivered sales growth and improved profitability throughout the year.
Our Specialty segment also showed growth as compared to the prior year. Sales increased 5.4 percent compared to fiscal 2015, driven mainly by improved sales volumes related to Geiger wood products and the Herman Miller Collection. Operating earnings increased $2.9 million from fiscal 2015. Increased sales volumes, decreases in material costs and improved operational efficiencies had a favorable impact on operating earnings for the Specialty segment.
The Consumer segment saw an increase in net sales of $18.2 million in the current fiscal year as compared to fiscal 2015. An increase of $30.2 million was driven by the fact that 52 weeks of DWR results were included in our consolidated results for fiscal 2016 as compared to 44 weeks in fiscal 2015. Sales were adversely impacted primarily by the following factors:
|
•
|
Continued impact from closing smaller legacy DWR studio locations as we look to transition into larger format studios.
|
|
•
|
Interruptions in selling activity resulting from the implementation of a new Enterprise Resource Planning ("ERP") system at DWR, during the second quarter of fiscal 2016.
|
|
•
|
Continued impact from the deliberate reduction in the number of independent retail distributors within our legacy consumer wholesale business.
|
While the current year results for the Consumer segment did not meet our expectations, we believe the value drivers within the Consumer segment remain intact to drive future growth. These drivers include the transition of DWR studios to larger, more efficient formats, and increasing the breadth of the product portfolio, particularly in the area of exclusive product designs.
The economic backdrop of our businesses was mixed globally. North America continued to benefit from strong employment and encouraging construction and architectural billings data. Commodity costs, particularly that of steel, remained relatively low throughout fiscal 2016 though in recent months has been steadily increasing. Outside of North America, we are closely monitoring commodity-driven economies that are currently (or are expected to experience) slower growth in the future. In addition, growing uncertainty over the impact of a United Kingdom exit from the European Union is an area of concern for our business in that important market.
(1) Non-GAAP measurements; see accompanying reconciliations and explanations.
-
21
-
Reconciliation of Non-GAAP Financial Measures
This report contains references to Organic net sales, Adjusted operating earnings, Adjusted EBITDA and Adjusted earnings per share – diluted, all of which are non-GAAP financial measures (referred to collectively as the "Adjusted financial measures"). The Adjusted financial measures are calculated by excluding from Gross Margin, Operating expenses, Operating earnings and Earnings per share - diluted items that we believe are not indicative of our ongoing operating performance. Such items consist of the following:
This report contains references to Organic net sales, Adjusted operating earnings, Adjusted EBITDA and Adjusted earnings per share – diluted, all of which are non-GAAP financial measures (referred to collectively as the "Adjusted financial measures"). The Adjusted financial measures are calculated by excluding from Gross Margin, Operating expenses, Operating earnings and Earnings per share - diluted items that we believe are not indicative of our ongoing operating performance. Such items consist of the following:
|
•
|
Expenses associated with restructuring actions taken to adjust our cost structure to the current business climate
|
|
•
|
Expenses associated with acquisition-related inventory adjustments
|
|
•
|
Transaction expenses associated with recent acquisitions
|
|
•
|
Non-cash impairment expenses
|
|
•
|
Non-recurring gains related to the sale of property and dealers, and
|
|
•
|
Impact of non-recurring tax items
|
Adjusted EBITDA is calculated by excluding depreciation, amortization and other net income or expense from Adjusted Operating Earnings. Organic sales represents the change in Net sales, excluding currency translation effects and the impact of acquisitions. We present the adjusted financial measures because we consider them to be important supplemental measures of our performance and believe them to be useful in analyzing ongoing results from operations.
The Adjusted financial measures are not measurements of our financial performance under GAAP and should not be considered an alternative to Gross margin, Operating expenses, Operating earnings (loss) and Earnings (loss) per share
–
diluted under GAAP. The Adjusted financial measures have limitations as analytical tools and should not be considered in isolation or as a substitute for analysis of our results as reported under GAAP. Our presentation of the Adjusted financial measures should not be construed as an indication that our future results will be unaffected by unusual or infrequent items. We compensate for these limitations by providing prominence of our GAAP results and using the Adjusted financial measures only as a supplement.
The following table reconciles Net sales to Organic net sales for the years and reportable operating segments indicated.
|
Fiscal Year Ended
|
Fiscal Year Ended
|
|||||||||||||||||||||||||||||
|
May 28, 2016
|
May 30, 2015
|
|||||||||||||||||||||||||||||
|
North America
|
ELA
|
Specialty
|
Consumer
|
Total
|
North America
|
ELA
|
Specialty
|
Consumer
|
Total
|
|||||||||||||||||||||
|
Net Sales, as reported
|
$
|
1,331.8
|
|
$
|
412.6
|
|
$
|
231.8
|
|
$
|
288.7
|
|
$
|
2,264.9
|
|
$
|
1,241.9
|
|
$
|
409.9
|
|
$
|
219.9
|
|
$
|
270.5
|
|
$
|
2,142.2
|
|
|
% change from PY
|
7.2
|
%
|
0.7
|
%
|
5.4
|
%
|
6.7
|
%
|
5.7
|
%
|
|
|
||||||||||||||||||
|
Currency Translation Effects
(1)
|
12.5
|
|
26.1
|
|
0.6
|
|
0.8
|
|
40.0
|
|
—
|
|
—
|
|
—
|
|
—
|
|
—
|
|
||||||||||
|
Acquisition
|
—
|
|
—
|
|
—
|
|
(30.2
|
)
|
(30.2
|
)
|
—
|
|
—
|
|
—
|
|
—
|
|
—
|
|
||||||||||
|
Organic Net Sales
|
$
|
1,344.3
|
|
$
|
438.7
|
|
$
|
232.4
|
|
$
|
259.3
|
|
$
|
2,274.7
|
|
$
|
1,241.9
|
|
$
|
409.9
|
|
$
|
219.9
|
|
$
|
270.5
|
|
$
|
2,142.2
|
|
|
% change from PY
|
8.2
|
%
|
7.0
|
%
|
5.7
|
%
|
(4.1
|
)%
|
6.2
|
%
|
||||||||||||||||||||
-
22
-
|
Fiscal Year Ended
|
Fiscal Year Ended
|
|||||||||||||||||||||||||||||
|
May 30, 2015
|
May 31, 2014
|
|||||||||||||||||||||||||||||
|
North America
|
ELA
|
Specialty
|
Consumer
|
Total
|
North America
|
ELA
|
Specialty
|
Consumer
|
Total
|
|||||||||||||||||||||
|
Net Sales, as reported
|
$
|
1,241.9
|
|
$
|
409.9
|
|
$
|
219.9
|
|
$
|
270.5
|
|
$
|
2,142.2
|
|
$
|
1,216.3
|
|
$
|
392.2
|
|
$
|
205.8
|
|
$
|
67.7
|
|
$
|
1,882.0
|
|
|
% change from PY
|
2.1
|
%
|
4.5
|
%
|
6.9
|
%
|
299.6
|
%
|
13.8
|
%
|
||||||||||||||||||||
|
Dealer Divestitures
|
—
|
|
—
|
|
—
|
|
—
|
|
—
|
|
(12.1
|
)
|
—
|
|
—
|
|
—
|
|
(12.1
|
)
|
||||||||||
|
Currency Translation Effects
(1)
|
7.2
|
|
16.8
|
|
0.4
|
|
0.4
|
|
24.8
|
|
—
|
|
—
|
|
—
|
|
—
|
|
—
|
|
||||||||||
|
Acquisition
|
—
|
|
—
|
|
—
|
|
(194.3
|
)
|
(194.3
|
)
|
—
|
|
—
|
|
—
|
|
—
|
|
—
|
|
||||||||||
|
Organic Net Sales
|
$
|
1,249.1
|
|
$
|
426.7
|
|
$
|
220.3
|
|
$
|
76.6
|
|
$
|
1,972.7
|
|
$
|
1,204.2
|
|
$
|
392.2
|
|
$
|
205.8
|
|
$
|
67.7
|
|
$
|
1,869.9
|
|
|
% change from PY
|
3.7
|
%
|
8.8
|
%
|
7.0
|
%
|
13.1
|
%
|
5.5
|
%
|
||||||||||||||||||||
Financial Results
The following is a comparison of our annual results of operations and year-over-year percentage changes for the periods indicated.
The following is a comparison of our annual results of operations and year-over-year percentage changes for the periods indicated.
|
(Dollars In millions)
|
Fiscal 2016
|
% Change from 2015
|
Fiscal 2015
|
% Change from 2014
|
Fiscal 2014
|
||||||||||||
|
52 weeks
|
52 weeks
|
52 weeks
|
|||||||||||||||
|
Net sales
|
$
|
2,264.9
|
|
5.7
|
%
|
$
|
2,142.2
|
|
13.8
|
%
|
$
|
1,882.0
|
|
||||
|
Cost of sales
|
1,390.7
|
|
3.0
|
%
|
1,350.8
|
|
8.0
|
%
|
1,251.0
|
|
|||||||
|
Gross margin
|
874.2
|
|
10.5
|
%
|
791.4
|
|
25.4
|
%
|
631.0
|
|
|||||||
|
Operating expenses
|
662.7
|
|
5.5
|
%
|
628.0
|
|
(4.4
|
)%
|
656.7
|
|
|||||||
|
Operating earnings (loss)
|
211.5
|
|
29.4
|
%
|
163.4
|
|
735.8
|
%
|
(25.7
|
)
|
|||||||
|
Net other expenses
|
14.9
|
|
(18.1
|
)%
|
18.2
|
|
2.8
|
%
|
17.7
|
|
|||||||
|
Earnings (loss) before income taxes
|
196.6
|
|
35.4
|
%
|
145.2
|
|
434.6
|
%
|
(43.4
|
)
|
|||||||
|
Income tax expense (benefit)
|
59.5
|
|
26.1
|
%
|
47.2
|
|
322.6
|
%
|
(21.2
|
)
|
|||||||
|
Equity income (loss) from nonconsolidated affiliates, net of tax
|
0.4
|
|
300.0
|
%
|
0.1
|
|
—
|
%
|
0.1
|
|
|||||||
|
Net earnings (loss)
|
137.5
|
|
40.2
|
%
|
98.1
|
|
543.9
|
%
|
(22.1
|
)
|
|||||||
|
Net earnings attributable to noncontrolling interests
|
0.8
|
|
33.3
|
%
|
0.6
|
|
N/A
|
—
|
|
||||||||
|
Net earnings (loss) attributable to Herman Miller, Inc.
|
$
|
136.7
|
|
40.2
|
%
|
$
|
97.5
|
|
541.2
|
%
|
$
|
(22.1
|
)
|
||||
The following table presents, for the periods indicated, the components of the company's Consolidated Statements of Comprehensive Income as a percentage of net sales.
-
23
-
|
Fiscal 2016
|
Fiscal 2015
|
Fiscal 2014
|
||||||
|
Net sales
|
100.0
|
%
|
100.0
|
%
|
|
100.0
|
%
|
|
|
Cost of sales
|
61.4
|
|
63.1
|
|
|
66.5
|
|
|
|
Gross margin
|
38.6
|
|
36.9
|
|
|
33.5
|
|
|
|
Selling, general, and administrative expenses
|
25.9
|
|
25.4
|
|
|
30.0
|
|
|
|
Restructuring and impairment expenses
|
—
|
|
0.6
|
|
|
1.4
|
|
|
|
Design and research expenses
|
3.4
|
|
3.3
|
|
|
3.5
|
|
|
|
Total operating expenses
|
29.3
|
|
29.3
|
|
|
34.9
|
|
|
|
Operating earnings (loss)
|
9.3
|
|
7.6
|
|
|
(1.4
|
)
|
|
|
Net other expenses
|
0.7
|
|
0.8
|
|
|
0.9
|
|
|
|
Earnings (loss) before income taxes
|
8.7
|
|
6.8
|
|
|
(2.3
|
)
|
|
|
Income tax expense (benefit)
|
2.6
|
|
2.2
|
|
|
(1.1
|
)
|
|
|
Equity income (loss) from nonconsolidated affiliates, net of tax
|
—
|
|
—
|
|
—
|
|
||
|
Net earnings (loss)
|
6.1
|
|
4.6
|
|
|
(1.2
|
)
|
|
|
Net earnings attributable to noncontrolling interests
|
—
|
|
—
|
|
—
|
|
||
|
Net earnings (loss) attributable to Herman Miller, Inc.
|
6.0
|
|
4.6
|
|
(1.2
|
)
|
||
-
24
-
Net Sales, Orders, and Backlog -
Fiscal 2016
Compared to
Fiscal 2015

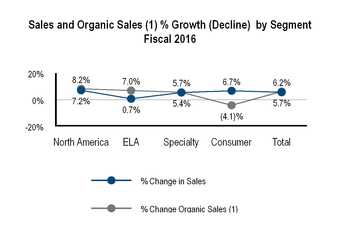
Consolidated net sales increased
$122.7 million
to
$2,264.9 million
from
$2,142.2 million
for the fiscal year ended
May 28, 2016
compared to the fiscal year ended
May 30, 2015
. The following items contributed to the change:
|
•
|
Increased sales volumes within the North American segment of approximately $108.0 million were driven by a combination of general market growth and company-specific actions taken to improve selling capacity, launch innovative products and refresh showrooms.
|
|
•
|
Increased sales volumes within the ELA segment of $30.4 million were driven by increases within the Asia region. The largest increases were due to larger project activity in Australia and China.
|
|
•
|
Incremental sales volume within the Consumer segment related to the acquisition of DWR, which increased sales by $30.2 million. This increase was due the fact that 52 weeks of DWR results were included in our consolidated results for fiscal 2016 as compared to 44 weeks in fiscal 2015.
|
|
•
|
Increased sales volumes within the Specialty segment of $10.9 million were driven principally by Geiger and the Herman Miller Collection.
|
|
•
|
Foreign currency translation had a negative impact on sales of $40.0 million.
|
Consolidated net trade orders for
fiscal 2016
totaled
$2,279.7 million
compared to
$2,146.5 million
in
fiscal 2015
, an increase of
6.2 percent
. Order rates began the year at an average pace of approximately $43 million per week for the first quarter and $46 million per week for the second quarter. For the third quarter, weekly order rates decreased to an average of approximately $39 million per week, reflecting typical seasonality in order pacing during that period of the fiscal year. The fourth quarter finished the year with average weekly order rates increasing to approximately $47 million. The overall impact of foreign currency changes for the fiscal year decreased net orders by approximately $38.7 million as compared to the prior year.
Our backlog of unfilled orders at the end of
fiscal 2016
totaled
$323.5 million
, a
0.4 percent
increase from the fiscal 2015 ending backlog of
$322.2 million
. At the end of fiscal 2016, the company completed the sale of its multi-location dealership in Australia. This dealer divestiture resulted in a reduction to the consolidated ending backlog of approximately $14 million.
BIFMA reported an estimated period-over-period increase in U.S. office furniture shipments of approximately 3.2 percent for the twelve-month period ended May 2016. By comparison, net sales increased for the company's domestic U.S. business by approximately 6.3 percent over the twelve months ended May 2016, reflecting the strong results within our North America segment noted above.
We also monitor trade statistics reported by the U.S. Census Bureau, which reports monthly retail sales growth data across a number of retail categories, including Furniture and Home Furnishing Stores. This information provides a relative comparison to our Consumer reportable segment, but is not intended to be an exact comparison. The average monthly year-over-year growth rate in sales for the Furniture and Home Furnishing Stores category for the twelve month period ended May 31, 2016, was approximately 4.9 percent. By comparison, net sales growth for the company's Consumer segment was approximately 6.7 percent, while that segment posted an Organic net sales decrease of
4.1 percent
(1)
.
(1) Non-GAAP measurements; see accompanying reconciliations and explanations.
-
25
-
Net Sales, Orders, and Backlog -
Fiscal 2015
Compared to
Fiscal 2014
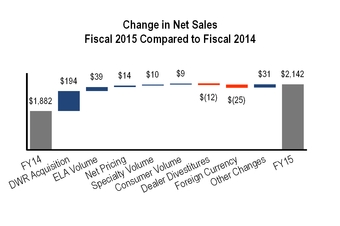
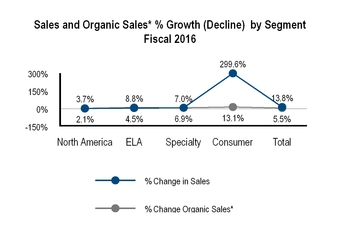
For the fiscal year ended May 30, 2015, consolidated net sales increased $260.2 million to $2,142.2 million from $1,882.0 million for the fiscal year ended May 31, 2014. The following items contributed to the change:
|
•
|
Incremental sales volumes within the Consumer segment related to the acquisition of DWR, which increased sales by $194.3 million.
|
|
•
|
Increased sales volumes within the ELA segment of $38.5 million due primarily to increases within the EMEA and Asia regions.
|
|
•
|
Foreign currency translation had a negative impact on sales of $24.8 million.
|
|
•
|
The remaining increase was driven by a combination of factors, including the timing of project completion and the conversion of existing backlog into sales within the North American business segment.
|
Consolidated net trade orders for fiscal 2015 totaled $2,146.5 million compared to $1,917.7 million in fiscal 2014, an increase of 11.9 percent. Order rates began the year at an average pace of approximately $40 million per week for the first quarter and $44 million per week for the second quarter. For the third quarter, weekly order rates decreased to an average of approximately $39 million per week. The fourth quarter finished the year with average weekly order rates increasing to approximately $43 million.
The weekly order pacing in the third quarter and the fourth quarter of fiscal 2015 was impacted by the price increase that was announced during the third quarter of fiscal 2015. This caused approximately $21 million of orders that otherwise would have been entered in the fourth quarter, to be entered in the third quarter. When adjusting for this impact, the weekly pacing of orders for the third quarter and fourth quarter was $37 million per week and $45 million per week, respectively. The overall impact of foreign currency changes for the fiscal year decreased net orders by approximately $24.1 million as compared to the prior year.
Our backlog of unfilled orders at the end of fiscal 2015 totaled $322.2 million, a 5.2 percent increase from the $306.4 million of backlog at the end of fiscal 2014.
BIFMA reported an estimated year-over-year increase in U.S. office furniture shipments of approximately 6.3 percent for the twelve-month period ended May 2015. By comparison, net sales increased for the company's domestic U.S. business by approximately 3.0 percent. The company believes that while comparisons to BIFMA are important, the company continues to pursue a strategy of revenue diversification that makes us less reliant on the drivers that impact BIFMA.
As reported by the U.S. Census Bureau, the average monthly year-over-year growth rate in sales for the Furniture and Home Furnishing Stores category for the twelve month period ended May 31, 2015, was approximately 4.0 percent. By comparison, net sales growth for the Consumer segment was approximately 299.6 percent, while Organic net sales growth for the Consumer reportable segment was
13.1 percent
(1)
.
(1) Non-GAAP measurements; see accompanying reconciliations and explanations.
Gross Margin -
Fiscal 2016
Compared to
Fiscal 2015
Consolidated gross margin for Fiscal 2016 was 38.6 percent , an increase of 170 basis points from the fiscal 2015 level. The following factors summarize the major drivers of the year-over-year improvement in gross margin percentage:
Consolidated gross margin for Fiscal 2016 was 38.6 percent , an increase of 170 basis points from the fiscal 2015 level. The following factors summarize the major drivers of the year-over-year improvement in gross margin percentage:
-
26
-
|
•
|
Lower commodity costs within the North American operating segment in the current fiscal year drove a favorable year-over-year margin impact of approximately 90 basis points.
|
|
•
|
A decrease in freight expenses, due primarily to lower fuel costs and improved leverage of fixed product distribution costs, drove a favorable impact to gross margin of approximately 40 basis points compared to fiscal 2015.
|
|
•
|
Inventory-related purchase accounting adjustments related to the acquisition of DWR unfavorably impacted gross margin in the prior year by approximately 30 basis points.
|
|
•
|
Improved production volume leverage at the company's West Michigan manufacturing facilities increased gross margin by approximately 30 basis points as compared to fiscal 2015.
|
|
•
|
We estimate that relative changes in foreign currency exchange rates had a negative impact on our consolidated gross margin of approximately 30 basis points relative to last fiscal year.
|
|
•
|
Improved operating efficiencies at certain international and domestic subsidiaries also provided a favorable impact to gross margin compared to last fiscal year.
|
Gross Margin -
Fiscal 2015
Compared to
Fiscal 2014
Consolidated gross margin for Fiscal 2015 was 36.9 percent , an increase of 340 basis points from the fiscal 2014 level. The following factors summarize the major drivers of the year-over-year change in gross margin percentage:
Consolidated gross margin for Fiscal 2015 was 36.9 percent , an increase of 340 basis points from the fiscal 2014 level. The following factors summarize the major drivers of the year-over-year change in gross margin percentage:
|
•
|
Charges related to the termination of the company's primary defined benefit pension plan led to a 240 basis point decrease in gross margin during fiscal 2014.
|
|
•
|
The benefit captured from price increases - net of incremental discounting, provided a 40 basis point improvement compared to fiscal 2014.
|
|
•
|
We estimate that relative changes in foreign currency exchange rates had a negative impact on our consolidated gross margin of approximately 30 basis points relative to fiscal 2014.
|
|
•
|
The remainder of the change in gross margin during fiscal 2015 as compared to fiscal 2014 was driven by improved production, product, and channel mix.
|
Operating Expenses -
Fiscal 2016
Compared to
Fiscal 2015
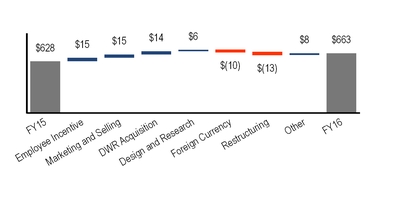
Operating expenses in fiscal 2016 were
$662.7 million
, or
29.3 percent
of net sales, which compares to
$628.0 million
, or
29.3 percent
of net sales in fiscal 2015. The following factors contributed to the change:
|
•
|
Employee incentive costs increased by $14.7 million relative to fiscal 2015. The increase reflects higher incentive compensation costs that are tied to increased earnings for the comparative periods.
|
|
•
|
Marketing and selling expenses increased $14.5 million relative to fiscal 2015. The increase resulted from new marketing initiatives, particularly within the Consumer segment, as well as increases in selling capacity and sales growth during fiscal 2016.
|
|
•
|
Fiscal 2016 included a full 52 weeks of DWR results whereas fiscal 2015 included only 44 weeks. This difference accounts for approximately $13.7 million of the year-over-year increase in consolidated operating expenses.
|
|
•
|
Design and research expenses increased $5.7 million in fiscal 2016 as compared to the prior year.
|
|
•
|
Year-over-year changes in currency exchange rates decreased operating expenses by an estimated
$10 million
.
|
|
•
|
Fiscal 2015 results reflected restructuring and impairment expenses of $12.7 million.
|
|
•
|
The remaining change relates to various contributing factors, including but not limited to higher costs for information technology initiatives, wage and benefit inflation, and general variability with higher net sales.
|
-
27
-
Restructuring and Impairment -
Fiscal 2016
Compared to
Fiscal 2015
There were
no
restructuring and impairment charges for fiscal 2016. By comparison, fiscal 2015 included restructuring and impairment expenses totaling $12.7 million, including
$1.9 million
related to targeted workforce reductions within the North American segment and
$10.8 million
in impairment expenses related to the impairment of the POSH trade name.
For the fiscal year ended May 28, 2016, restructuring liabilities of $0.4 million were included in "Other accrued liabilities" within the Consolidated Balance Sheet. See Note 17 of the Consolidated Financial Statements for additional information on restructuring and impairment expenses.
Operating Expenses -
Fiscal 2015
Compared to
Fiscal 2014
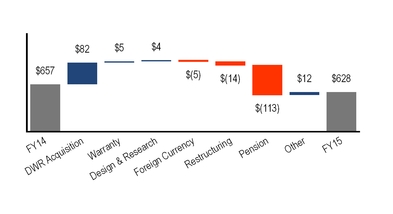
Operating expenses in fiscal 2015 were $628.0 million, or 29.3 percent of net sales, which compares to $656.7 million, or 34.9 percent of net sales in fiscal 2014. The following factors contributed to the change:
|
•
|
The acquisition of DWR contributed an additional $81.5 million of operating expenses in fiscal 2015 as compared to fiscal 2014.
|
|
•
|
Warranty expenses increased by approximately $4.8 million in fiscal 2015 as compared to the prior year. The increase in warranty expense was due to updating claims loss experience in warranty liability estimates, additional sales of new products, and an increase in customer specific claims as compared to the prior year.
|
|
•
|
Design and research expenses increased $4.3 million in fiscal 2015 as compared to the prior year.
|
|
•
|
Year-over-year changes in currency exchange rates decreased operating expenses by an estimated
$5 million
.
|
|
•
|
As compared to fiscal 2014, restructuring and impairment expenses decreased by $13.8 million.
|
|
•
|
The impact of pension termination expenses of $113.1 million that were recorded in fiscal 2014.
|
|
•
|
The remaining change was driven by net changes in various other operating expenses compared to the prior year period.
|
Restructuring and Impairment -
Fiscal 2015
Compared to
Fiscal 2014
Restructuring and impairment charges decreased $13.8 million from $26.5 million in fiscal 2014 to $
12.7 million
in fiscal 2015. During fiscal 2014, restructuring and impairment expenses included
$4.0 million
related to the impairment of property in Ningbo, China, $1.1 million related to restructuring actions taken to improve the efficiency of the North American sales and distribution channel and Geiger manufacturing operations and $21.4 million in impairment expenses related to the POSH and Nemschoff trade names.
For the fiscal year ended May 30, 2015, restructuring liabilities of $1.4 million were included in "Other accrued liabilities" within the Consolidated Balance Sheet. See Note 17 of the Consolidated Financial Statements for additional information on restructuring and impairment expenses.
Operating Earnings
In
fiscal 2016
, the company generated operating earnings of
$211.5 million
, an increase of $48.1 million from fiscal 2015 operating earnings of
$163.4 million
. Operating earnings of $163.4 million in fiscal 2015 represented a $189.1 million increase from fiscal 2014 operating loss of
$25.7 million
.
-
28
-
Other Expenses and Income
Net other expenses for
fiscal 2016
were
$14.9 million
, a decrease of $3.3 million compared to net other expenses in
fiscal 2015
of
$18.2 million
. Net other expenses in
fiscal 2014
totaled
$17.7 million
. The decrease in net other expenses in
fiscal 2016
was primarily related to a reduction in interest expense related to a decrease in long term debt. The reduction in long term debt resulted from the repayment of borrowings on the revolving line of credit. The increase in Net other expenses in fiscal 2015 as compared to fiscal 2014 was primarily related to an increase in currency loss as compared to fiscal 2014.
Income Taxes
The company's effective tax rate was 30.3 percent in fiscal 2016 , 32.6 percent in fiscal 2015, and 48.9 percent in fiscal 2014. The effective tax rate in fiscal 2016 was below the statutory rate of 35 percent, primarily due to the domestic U.S. manufacturing deduction as well as a significant amount of foreign earnings subject to tax at foreign rates below 35 percent.
The company's effective tax rate was 30.3 percent in fiscal 2016 , 32.6 percent in fiscal 2015, and 48.9 percent in fiscal 2014. The effective tax rate in fiscal 2016 was below the statutory rate of 35 percent, primarily due to the domestic U.S. manufacturing deduction as well as a significant amount of foreign earnings subject to tax at foreign rates below 35 percent.
The effective tax rate in fiscal 2015 was below the statutory rate of 35 percent, primarily due to the domestic U.S. manufacturing deduction and a $3.9 million tax benefit related to a foreign entity reorganization.
The effective tax rate in fiscal 2014 was above the statutory rate of 35 percent, primarily due to the domestic U.S. manufacturing deduction and a shift in the relative mix of income and loss between the taxing jurisdictions. This change in mix was driven primarily by legacy pension expenses recorded in that fiscal year.
For further information regarding income taxes, refer to Note 10 of the Consolidated Financial Statements.
Net Earnings (Loss); Earnings (Loss) per Share
In fiscal 2016 , fiscal 2015 , and fiscal 2014 , the company generated net earnings of $137.5 million , net earnings of $98.1 million and a net loss of $22.1 million , respectively. Diluted earnings per share were $2.26 and $1.62 for fiscal 2016 and fiscal 2015, respectively, while diluted loss per share was $0.37 in fiscal 2014 .
In fiscal 2016 , fiscal 2015 , and fiscal 2014 , the company generated net earnings of $137.5 million , net earnings of $98.1 million and a net loss of $22.1 million , respectively. Diluted earnings per share were $2.26 and $1.62 for fiscal 2016 and fiscal 2015, respectively, while diluted loss per share was $0.37 in fiscal 2014 .
Reportable Operating Segments
The business is comprised of various operating segments as defined by generally accepted accounting principles in the United States. These operating segments are determined on the basis of how the company internally reports and evaluates financial information used to make operating decisions. The company has identified the following reportable segments:
|
◦
|
North American Furniture Solutions
— Includes the operations associated with the design, manufacture, and sale of furniture products for work-related settings, including office, education, and healthcare environments, throughout the United States and Canada. The North American Furniture Solutions reportable segment is the aggregation of two operating segments. In addition, the company has determined that both operating segments within the North American Furniture Solutions reportable segment each represent reporting units.
|
|
◦
|
ELA Furniture Solutions
— Includes EMEA, Latin America, and Asia-Pacific operations associated with the design, manufacture and sale of furniture products, primarily for work-related settings.
|
|
◦
|
Specialty
— Includes operations associated with the design, manufacture, and sale of high-craft furniture products and textiles including Geiger wood products, Maharam textiles, and Herman Miller Collection products.
|
|
◦
|
Consumer
— Includes operations associated with the sale of modern design furnishings and accessories to third party retail distributors, as well as direct to consumer sales through e-commerce, direct mailing catalogs, and DWR retail studios.
|
The company also reports a corporate category consisting primarily of, as applicable, unallocated corporate expenses including restructuring, impairment, acquisition-related costs, and other unallocated corporate costs.
The charts below present the relative mix of net sales across each of the company's reportable segments. This is followed by a discussion of the company's results, by segment, for each reportable segment.
-
29
-
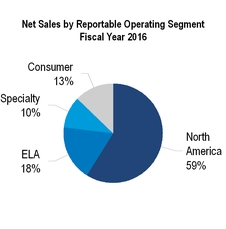
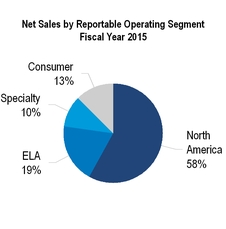
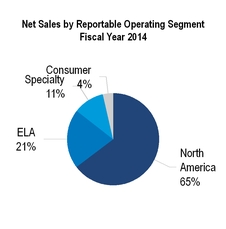
North American Furniture Solutions ("North America")
Fiscal 2016 Compared to Fiscal 2015
Net sales in the North American segment increased to
$1,331.8 million
in
fiscal 2016
, an increase of $89.9 million from
fiscal 2015
net sales of
$1,241.9 million
. Orders for fiscal 2016 totaled $1,336.1 million, an increase of $100.3 million from fiscal 2015. Operating earnings for North America in fiscal 2016 were
$152.0 million
, a $26.8 million increase from fiscal 2015.
|
•
|
Sales volumes within the North American segment increased by approximately
$108 million
. This was driven by a combination of general market growth and company-specific actions taken to improve selling capacity, launch innovative products, and refresh showrooms.
|
|
•
|
The impact of foreign currency translation decreased net sales by approximately
$13 million
.
|
|
•
|
Changes in pricing, net of incremental discounting, decreased fiscal 2016 net sales between $5 million and $7 million compared to the prior year.
|
|
•
|
Operating earnings increased mainly due to improvements in gross margin that were driven by increased sales volumes, improved production volume leverage, a decrease in commodity costs, and improved operational efficiency.
|
|
•
|
Higher incentive compensation expenses had an unfavorable impact on operating earnings of $18.6 million.
|
|
•
|
The impact of foreign currency changes decreased fiscal 2016 operating earnings for North America by approximately
$7 million
.
|
Fiscal 2015 Compared to Fiscal 2014
Net sales increased to $1,241.9 million in fiscal 2015, an increase of $25.6 million from fiscal 2014 net sales of $1,216.3 million. Operating earnings for North America in fiscal 2015 were $125.2 million, an increase of $152.2 million in fiscal 2014.
|
•
|
Dealer divestitures in fiscal 2014 had the impact of reducing net sales by approximately
$12 million
during fiscal 2015.
|
|
•
|
Foreign currency changes decreased fiscal 2015 net sales by approximately
$7 million
.
|
|
•
|
Changes in pricing, net of incremental discounting, increased fiscal 2015 net sales between $11 million and $13 million compared to the prior year.
|
|
•
|
Decreased sales volumes to the U.S. federal government drove a $4.4 million decrease in net sales as compared to fiscal 2014.
|
|
•
|
The rest of the increase in sales during fiscal 2015 was due to higher volumes, the timing of project completions, and the conversion of existing backlog into sales.
|
|
•
|
Non-recurring legacy pension expenses of $147.0 million decreased operating earnings during fiscal 2014. These costs related to the termination of the primary domestic defined benefit pension plans.
|
|
•
|
The remaining change in operating earnings was due to growth in gross margin that was driven by improvements in pricing, net of discounting, and improved product mix.
|
ELA Furniture Solutions (EMEA, Latin America, and Asia Pacific)
Fiscal 2016 Compared to Fiscal 2015
Net sales increased to $412.6 million in fiscal 2016, an increase of $2.7 million from fiscal 2015 net sales of $409.9 million. Orders for fiscal 2016 totaled $417.0 million, a decrease of $0.6 million from fiscal 2015. Operating earnings within ELA for fiscal 2016 were $35.3 million, a $9.4 million increase from fiscal 2015.
|
•
|
An increase in sales volumes within Australia, Mexico and China drove an increase in net sales of approximately
$31 million
.
|
-
30
-
|
•
|
Changes in pricing, net of incremental discounting, decreased fiscal 2016 net sales between $1 million and $3 million compared to the prior year.
|
|
•
|
The impact of foreign currency translation decreased net sales by approximately $26.1 million.
|
|
•
|
Gross margin improvements driven by increased sales volumes, manufacturing efficiency as well as decreased material and freight costs provided a favorable impact on operating earnings.
|
|
•
|
Nonrecurring gains related to the sale of a former manufacturing facility in the United Kingdom and the divestiture of the company’s dealership in Australia increased operating earnings by $6.1 million.
|
|
•
|
The impact of foreign currency changes decreased fiscal 2015 operating earnings for ELA by approximately
$7 million
.
|
Fiscal 2015 Compared to Fiscal 2014
Net sales increased 4.5 percent to
$409.9 million
in fiscal 2015 as compared to fiscal 2014. Operating earnings within ELA for fiscal 2015 were $25.9 million, a $2.8 million increase from fiscal 2014.
|
•
|
On a constant currency basis, net sales increased approximately
$35 million
during fiscal 2015 as compared to fiscal 2014, due to growth in sales volumes within the EMEA and Asia regions.
|
|
•
|
The impact of foreign currency changes decreased fiscal 2015 operating earnings for ELA by approximately
$9 million
.
|
|
•
|
Year-over-year, improved sales volumes in the EMEA and Asia regions along with the improved manufacturing efficiency at the company's United Kingdom and Asia manufacturing operations led to an increase in operating earnings.
|
Specialty
Fiscal 2016 Compared to Fiscal 2015
Net sales within the Specialty reportable segment increased to
$231.8 million
for fiscal 2016, an improvement of $11.9 million as compared to fiscal 2015. Orders for fiscal 2016 totaled $234.8 million, an increase of $13.4 million from fiscal 2015. Operating earnings within the Specialty reportable segment totaled
$16.4 million
for the year, an increase of $2.9 million from fiscal 2015.
|
•
|
Improved sales volumes drove an increase in net sales of $10.9 million, which was driven by increases within the Herman Miller Collection and Geiger subsidiary.
|
|
•
|
Changes in pricing, net of incremental discounting, increased fiscal 2015 net sales between $1 million and $3 million compared to the prior year.
|
|
•
|
Increased sales volumes and improved operational efficiencies had a favorable impact on operating earnings.
|
|
•
|
Higher incentive compensation expenses and increased marketing and selling costs had an unfavorable impact on operating earnings of $2.3 million and $1.9 million, respectively.
|
Fiscal 2015 Compared to Fiscal 2014
Net sales within the Specialty reportable segment were
$219.9 million
during fiscal 2015, an increase of $14.1 million compared to fiscal 2014. Orders for fiscal 2015 totaled
$221.4 million
, an increase of $13.2 million from fiscal 2014. Operating earnings within the Specialty reportable segment totaled
$13.5 million
for the year, an increase of $18.8 million from fiscal 2014.
|
•
|
Sales volumes increased mainly due to improved volumes of Geiger and Herman Miller Collection products.
|
|
•
|
Non-recurring legacy pension expenses of $12.2 million decreased operating earnings during fiscal 2014. These costs related to the termination of the primary domestic defined benefit pension plans.
|
|
•
|
Inventory-related purchase accounting adjustments from the Maharam acquisition decreased operating earnings by $1.4 million during fiscal 2014.
|
|
•
|
The remaining increase in operating earnings was driven by improved operating performance and leverage from both the Geiger and Maharam subsidiaries.
|
Consumer
Fiscal 2016 Compared to Fiscal 2015
Net sales for the Consumer reportable segment increased to $
288.7 million
in fiscal 2016, an increase of $18.2 million from fiscal 2015 net sales of $
270.5 million
. Orders for fiscal 2016 totaled $291.7 million, an increase of $20.0 million from fiscal 2015. Operating earnings within the Consumer segment were $
8.1 million
during fiscal 2016 as compared to operating earnings of $
14.7 million
in fiscal 2015.
|
•
|
The fiscal year ended May 30, 2015 included 44 weeks of DWR operations (as the acquisition of DWR was completed on July 28, 2014). Accordingly, approximately $30.2 million of the year-over-year net sales increase for this segment is due to this inclusion of DWR operations for the full twelve months of the current fiscal year.
|
|
•
|
Adjusted for the impact of this partial period consolidation during last fiscal year and the impact of foreign currency translation, which increased net sales by $0.8 million, net sales for the Consumer segment decreased $11.2 million as compared to fiscal
|
-
31
-
2015. This was driven by the closing of legacy DWR studios, selling activity interruptions from the implementation of a new ERP system at DWR and the rationalization of independent retail distributors.
|
•
|
The decrease in operating earnings was driven by a reduction in the gross margin percentage at DWR due to a shift in mix to lower margin channels, the impact of promotional activity related to shipping and certain period costs associated with an ERP implementation.
|
|
•
|
An increase in DWR operating expenses of $8.2 million decreased operating earnings. The increase in operating expenses was due to increased marketing investment, higher staffing levels and incremental occupancy costs that were driven by studio opening costs and double rent associated with new studio openings.
|
|
•
|
These factors were partially offset by inventory-related purchase accounting adjustments that reduced prior year operating earnings by approximately $7.8 million.
|
Fiscal 2015 Compared to Fiscal 2014
Net sales for the Consumer reportable segment increased to $270.5 million in fiscal 2015, an increase of $202.8 million from fiscal 2014 net sales of $67.7 million. Orders for fiscal 2015 totaled $271.7 million, an increase of $202.3 million from fiscal 2014. Operating earnings within the Consumer segment were $14.7 million during fiscal 2015 as compared to operating earnings of $9.9 million in fiscal 2014.
|
•
|
The acquisition of DWR was completed in the first quarter of fiscal 2015, which drove an increase in net sales of $194.3 million as compared to fiscal 2014.
|
|
•
|
The remaining change in sales was driven by increases in pricing and higher sales volumes within the company's legacy wholesale and e-commerce consumer business.
|
|
•
|
Decreased legacy pension expenses during fiscal 2015 increased operating earnings $5.2 million as compared to fiscal 2014.
|
|
•
|
Inventory-related adjustments associated with the DWR acquisition decreased fiscal 2015 operating earnings by $7.8 million.
|
|
•
|
The remaining change in operating earnings was driven by increased gross margins and operating earnings associated with the acquisition of DWR as well as higher sales volumes within the company's existing consumer wholesale and e-commerce business.
|
Liquidity and Capital Resources
The table below presents certain key cash flow and capital highlights for the fiscal years indicated.
|
Fiscal Year Ended
|
|||||||||||
|
(In millions)
|
2016
|
2015
|
2014
|
||||||||
|
Cash and cash equivalents, end of period
|
$
|
84.9
|
|
$
|
63.7
|
|
$
|
101.5
|
|
||
|
Marketable securities, end of period
|
$
|
7.5
|
|
$
|
5.7
|
|
$
|
11.1
|
|
||
|
Cash provided by operating activities
|
$
|
210.4
|
|
$
|
167.7
|
|
$
|
90.1
|
|
||
|
Cash used for investing activities
|
$
|
(80.8
|
)
|
$
|
(213.6
|
)
|
$
|
(48.2
|
)
|
||
|
Cash provided by (used for) financing activities
|
$
|
(106.5
|
)
|
$
|
6.8
|
|
$
|
(22.4
|
)
|
||
|
Pension and post-retirement benefit plan contributions
(1)
|
$
|
(1.2
|
)
|
$
|
1.4
|
|
$
|
(50.2
|
)
|
||
|
Capital expenditures
|
$
|
(85.1
|
)
|
$
|
(63.6
|
)
|
$
|
(40.8
|
)
|
||
|
Stock repurchased and retired
|
$
|
(14.1
|
)
|
$
|
(3.7
|
)
|
$
|
(12.7
|
)
|
||
|
Interest-bearing debt, end of period
|
$
|
221.9
|
|
$
|
289.8
|
|
$
|
250.0
|
|
||
|
Available unsecured credit facilities, end of period
(2) (3)
|
$
|
232.1
|
|
$
|
164.5
|
|
$
|
155.1
|
|
||
(1) Amount shown for fiscal 2014 includes $48.8 million due to the termination of the company's primary domestic defined benefit pension plan.
(2) Amounts shown are net of outstanding letters of credit, which are applied against the company's unsecured credit facility.
(3) During fiscal 2015, we renegotiated the unsecured revolving credit facility. Refer to Note 5 of the Consolidated Financial Statements for additional information.
Cash Flow — Operating Activities
Cash generated from operating activities in
fiscal 2016
totaled
$210.4 million
compared to $
167.7 million
generated in the prior year. This represents an increase of
$42.7 million
compared to
fiscal 2015
.
Changes in working capital balances resulted in a
$6.0 million
use of cash in the current fiscal year compared to a
$3.5 million
source of cash in the prior year. The use of cash related to changes in working capital balances in fiscal 2016 consisted primarily of an increase in trade receivables of $30.5 million, an increase in inventory of $6.0 million, and an increase to prepaid expenses of $11.7 million. This was partially offset by an increase in accrued compensation and benefits of $19.4 million, an increase to accounts payable of $8.7 million, and an increase to other accrued liabilities of $14.1 million.
-
32
-
During fiscal 2014 the company contributed $50.2 million to its employee pension and post-retirement plans. The majority of these contributions related to funding associated with the termination of the company’s primary domestic defined benefit pension plan. Collectively, these plan contributions reduced cash flows generated from operations in fiscal 2014. By comparison, company's contributions to these plans in fiscal 2015 totaled $1.2 million.
Changes in working capital balances resulted in a $3.5 million source of cash in fiscal 2015 as compared to a $21.2 million use of cash in fiscal 2014. The sources of cash related to changes in working capital balances in fiscal 2015 consisted primarily of a decrease in trade receivables of $7.8 million, an increase in accounts payable of $1.1 million and an increase in accrued liabilities of $6.1 million. This was partially offset by increases in inventory and prepaid expenses of $9.0 million and $2.5 million, respectively. Note that the change in working capital assets and liabilities excludes the impact of amounts acquired through business combinations.
Collections of accounts receivable remained strong throughout
fiscal 2016
, and the company's recorded accounts receivable allowances at the end of the year are believed to be adequate to cover the risk of potential bad debts. Allowances for non-collectible accounts receivable, as a percent of gross accounts receivable, totaled 2.2 percent, 2.0 percent and 1.9 percent at the end of fiscal years 2016, 2015, and 2014, respectively.
Cash Flow — Investing Activities
Capital expenditures totaled
$85.1 million
,
$63.6 million
and
$40.8 million
in
fiscal 2016
,
2015
, and
2014
, respectively. The increase in capital expenditures of $21.5 million from fiscal 2015 to fiscal 2016 was driven primarily by payments related to the construction of a new facility in the United Kingdom for the purpose of consolidating manufacturing and distribution activities, as well as capital expenditures associated with product development and the opening of new DWR retail studio locations.
Proceeds from the sale of property and dealers increased to
$10.7 million
for fiscal 2016 as compared to
$0.6 million
for fiscal 2015. This increase was driven mainly by net cash proceeds received from the sale of a former manufacturing facility in the United Kingdom for $4.8 million and the divestiture of the company’s remaining 75 percent equity stake in its dealership in Australia for $2.7 million.
Outstanding commitments for future capital purchases at the end of
fiscal 2016
were approximately
$14.0 million
. The company expects capital spending in fiscal 2017 to be between $80 million and $90 million. The capital spending will be allocated primarily to planned investments in product development and retail studio openings.
Included in the fiscal 2016, 2015 and 2014 investing activities are net cash outflows related to acquisitions. These amounts are summarized below:
|
(In millions)
|
2016
|
2015
|
2014
|
||||||||
|
George Nelson Bubble Lamp Product Line
|
$
|
3.6
|
|
||||||||
|
Design Within Reach (DWR)
|
$
|
154.0
|
|
||||||||
|
Certain Assets of Dongguan Sun Hing Steel Furniture Factory Ltd (DGSH)
|
$
|
6.7
|
|
||||||||
Our net marketable securities transactions for
fiscal 2016
yielded a $1.7 million use of cash. This compares to a $5.3 million source of cash and $0.3 million use of cash in
fiscal 2015
and
fiscal 2014
, respectively.
Cash Flow — Financing Activities
|
Fiscal Year Ended
|
|||||||||||
|
(In millions, except share and per share data)
|
2016
|
2015
|
2014
|
||||||||
|
Shares acquired
|
482,040
|
|
121,488
|
|
408,391
|
|
|||||
|
Cost of shares acquired
|
$
|
14.1
|
|
$
|
3.7
|
|
$
|
12.7
|
|
||
|
Shares issued
|
655,705
|
|
|
501,277
|
|
|
1,040,255
|
|
|||
|
Average cash received per share issued
|
$
|
13.97
|
|
|
$
|
15.48
|
|
|
$
|
20.00
|
|
|
Cash dividends paid
|
$
|
34.9
|
|
$
|
33.3
|
|
$
|
30.3
|
|
||
-
33
-
In
fiscal 2016
, cash used for financing activities was
$106.5 million
, as compared to cash provided by financing activities of
$6.8 million
in fiscal 2015. Cash outflows from net payments on the revolving credit facility were $68.0 million during fiscal 2016. By comparison, cash inflows from net borrowings on the revolving credit facility were $40.0 million during fiscal 2015.
Cash paid for the retirement of common stock was
$14.1 million
in the current year as compared to
$3.7 million
in the prior year. Additionally, in fiscal 2016 there was an increase in cash inflows from the issuance of shares related to stock-based compensation plans. The company received
$9.2 million
related to stock-based compensation plans in fiscal 2016 compared to
$7.8 million
in
fiscal 2015
.
Cash provided by financing activities was $6.8 million in fiscal 2015, as compared to cash used in financing activities of $22.4 million in fiscal 2014. Cash inflows from net borrowings on the revolving credit facility were $90.0 million during fiscal 2015. The company utilized a portion of these borrowings to pay off $50.0 million of Series A senior notes, which matured January 3, 2015.
Cash paid for the retirement of common stock was $3.7 million in fiscal 2015 as compared to $12.7 million in the prior year. Additionally, in fiscal 2015 there was a decrease in cash inflows from the issuance of shares related to stock-based compensation plans. The company received $7.8 million related to stock-based compensation plans in fiscal 2015 compared to $20.8 million in fiscal 2014.
Some minority shareholders in a subsidiary have the right, at certain times, to require the company to acquire a portion of their ownership interest in those entities at fair value. It is possible that within the next five years the company could be required to acquire this ownership interest. The fair value of this redeemable noncontrolling interest as of
May 28, 2016
was
$27.0 million
and is included within "Redeemable noncontrolling interests" on the Consolidated Balance Sheets.
Sources of Liquidity
In addition to cash flows from operating activities, the company has access to liquidity through credit facilities, cash and cash equivalents and short-term investments. These sources have been summarized below. For additional information, see Note 5 to the consolidated financial statements.
|
(In millions, )
|
2016
|
2015
|
|||||
|
Cash and cash equivalents
|
$
|
84.9
|
|
$
|
63.7
|
|
|
|
Marketable securities
|
$
|
7.5
|
|
$
|
5.7
|
|
|
|
Availability under revolving lines of credit
|
$
|
232.1
|
|
$
|
164.5
|
|
|
At the end of
fiscal 2016
, the company had cash and cash equivalents of
$84.9 million
, including foreign cash and cash equivalents of $67.6 million. In addition, the company had foreign marketable securities of
$7.5 million
. The foreign subsidiary holding the company's marketable securities is taxed as a U.S. taxpayer at the company's election; consequently, for tax purposes, all U.S tax impacts for this subsidiary have been recorded. The company's intent is to permanently reinvest the foreign cash amounts outside the U.S. The company's plans do not demonstrate a need to repatriate these balances to fund U.S. operations. During fiscal 2016, the company repatriated $0.7 million of foreign earnings. During fiscal years 2015 and 2014 the company did not repatriate any undistributed foreign earnings.
We believe cash on hand, cash generated from operations, and our borrowing capacity will provide adequate liquidity to fund near term and future business operations, capital needs, future dividends and share repurchases, subject to financing availability in the marketplace.
Contingencies
The company is involved in legal proceedings and litigation arising in the ordinary course of business. In the opinion of management, the outcome of such proceedings and litigation currently pending will not materially affect the company's Consolidated Financial Statements.
Basis of Presentation and Correction of Immaterial Error
The company's fiscal year ends on the Saturday closest to May 31. The fiscal years ended
May 28, 2016
,
May 30, 2015
, and
May 31, 2014
each contained 52 weeks of operations.
In the second quarter of fiscal 2016, the company made an adjustment to correct an immaterial error related to the accrual for product warranties. As a result of this correction, the company adjusted Accrued warranty, Other noncurrent assets (to capture the impact of adjusting deferred taxes), and Retained earnings by
$12.5 million
,
$4.7 million
, and
$7.8 million
, respectively. The adjustment impacts the Condensed Consolidated Balance Sheets as of
May 30, 2015
, the Condensed Consolidated Statement of Stockholders’ Equity as of
May 31, 2014
, Note 13 - Warranties, Guarantees, and Contingencies, and Note 14 - Operating Segments. This correction had no impact on earnings or cash flows.
-
34
-
Contractual Obligations
Contractual obligations associated with our ongoing business and financing activities will result in cash payments in future periods. The following table summarizes the amounts and estimated timing of these future cash payments. Further information regarding debt obligations can be found in Note 5 of the Consolidated Financial Statements. Additional information related to operating leases can be found in Note 6 of the Consolidated Financial Statements.
|
(In millions)
|
Payments due by fiscal year
|
||||||||||||||||||
|
Total
|
2017
|
2018-2019
|
2020-2021
|
Thereafter
|
|||||||||||||||
|
Long-term debt
|
221.9
|
|
—
|
|
149.9
|
|
72.0
|
|
—
|
|
|||||||||
|
Estimated interest on debt obligations
(1)
|
30.5
|
|
12.9
|
|
12.3
|
|
5.3
|
|
—
|
|
|||||||||
|
Operating leases
|
318.0
|
|
38.9
|
|
72.7
|
|
59.2
|
|
147.2
|
|
|||||||||
|
Purchase obligations
(2)
|
42.2
|
|
36.6
|
|
5.3
|
|
0.3
|
|
—
|
|
|||||||||
|
Pension plan funding
(3)
|
1.1
|
|
0.5
|
|
0.1
|
|
0.1
|
|
0.4
|
|
|||||||||
|
Stockholder dividends
(4)
|
8.8
|
|
8.8
|
|
—
|
|
—
|
|
—
|
|
|||||||||
|
Other
(5)
|
20.6
|
|
1.8
|
|
3.7
|
|
4.3
|
|
10.8
|
|
|||||||||
|
Total
|
$
|
643.1
|
|
|
$
|
99.5
|
|
|
$
|
244.0
|
|
|
$
|
141.2
|
|
|
$
|
158.4
|
|
(1) Estimated future interest payments on our outstanding debt obligations are based on interest rates as of
May 28, 2016
. Actual cash outflows may differ significantly due to changes in underlying interest rates and timing of principal payments.
(2) Purchase obligations consist of non-cancelable purchase orders and commitments for goods, services, and capital assets.
(3) Pension plan funding commitments are known for a 12-month period for those plans that are funded; unfunded pension and post-retirement plan funding amounts are equal to the estimated benefit payments. As of
May 28, 2016
, the total projected benefit obligation for our domestic and international employee pension benefit plans was $
105.4 million
.
(4) Represents the dividend payable as of
May 28, 2016
. Future dividend payments are not considered contractual obligations until declared.
(5) Other contractual obligations primarily represent long-term commitments related to deferred and supplemental employee compensation benefits, and other post-employment benefits.
Off-Balance Sheet Arrangements — Guarantees
We provide certain guarantees to third parties under various arrangements in the form of product warranties, loan guarantees, standby letters of credit, lease guarantees, performance bonds, and indemnification provisions. These arrangements are accounted for and disclosed in accordance with Accounting Standards Codification (ASC) Topic 460, "
Guarantees
" as described in Note 13 of the Consolidated Financial Statements.
Critical Accounting Policies and Estimates
Our goal is to report financial results clearly and understandably. We follow accounting principles generally accepted in the United States of America in preparing our Consolidated Financial Statements, which require us to make certain estimates and apply judgments that affect our financial position and results of operations. We continually review our accounting policies and financial information disclosures. These policies and disclosures are reviewed at least annually with the Audit Committee of the Board of Directors. Following is a summary of our more significant accounting policies that require the use of estimates and judgments in preparing the financial statements.
Revenue Recognition
As described in the “Executive Overview,” the majority of our products and services are sold through one of six channels: independent and owned contract furniture dealers, direct to end customers, DWR retail studios, e-commerce, DWR direct-mail catalogs and independent retailers. We recognize revenue on sales to independent dealers, licensees, and retailers once the product is shipped and title passes to the buyer. When we sell product directly to the end customer or through owned dealers or retail studios, we recognize revenue once the product and services are delivered and installation thereof is substantially complete.
Amounts recorded as net sales generally include any freight charged to customers, with the related freight expenses recognized within cost of sales. Items such as discounts off list price, rebates, and other sale-related marketing program expenses are recorded as reductions to net sales. We record accruals for rebates and other marketing programs, which require us to make estimates about future customer buying patterns
-
35
-
and market conditions. Customer sales that reach (or fail to reach) certain levels can affect the amount of such estimates and actual results could differ from our estimates.
Receivable Allowances
We base our allowances for receivables on known customer exposures, historical credit experience, and the specific identification of other potential problems, including the current economic climate. These methods are applied to all major receivables, including trade, lease, and notes receivable. In addition, we follow a policy that consistently applies reserve rates based on the outstanding accounts receivable and historical experience. Actual collections can differ from our historical experience and if economic or business conditions deteriorate significantly, adjustments to these reserves may be required.
The accounts receivable allowance totaled $4.7 million and $3.8 million at
May 28, 2016
and
May 30, 2015
, respectively. As a percentage of gross accounts receivable, these allowances totaled 2.2 percent and 2.0 percent for fiscal
2016
and fiscal
2015
, respectively. The year-over-year increase in the allowance is primarily due customer specific reserves.
Goodwill and Indefinite-lived Intangibles
The carrying value of goodwill and indefinite-lived intangible assets as of
May 28, 2016
and
May 30, 2015
, was
$390.5 million
and
$388.3 million
, respectively. Goodwill and indefinite-lived intangible assets are tested for impairment annually, or more frequently, if changes in circumstances or the occurrence of events suggest that impairment exists. The company performs the annual goodwill and indefinite-lived intangible assets impairment testing during the fourth quarter of the fiscal year.
The company completed the required annual goodwill impairment test in the fourth quarter of fiscal 2016, as of March 26, 2016, performing a combination of the qualitative assessment and the quantitative impairment test. For the reporting units that were tested under the qualitative assessment, the company determined that it was more likely than not that the goodwill of the reporting units were not impaired and thus, the two-step quantitative impairment test was unnecessary. For the reporting units that were tested under the quantitative impairment test, the company determined that the fair value of the reporting units exceeded the carrying amount and as such, the reporting units were not impaired and the second step of the impairment test was not necessary.
The test for impairment requires the company to make several estimates about fair value, most of which are based on projected future cash flows and market valuation multiples. We estimated the fair value of the reporting units using a discounted cash flow analysis and reconciled the sum of the fair values of the reporting units to total market capitalization of the company, plus a control premium. The control premium represents an estimate associated with obtaining control of the company in an acquisition. The discounted cash flow analysis used the present value of projected cash flows and a residual value.
The company employs a market-based approach in selecting the discount rates used in our analysis. The discount rates selected represent market rates of return equal to what the company believes a reasonable investor would expect to achieve on investments of similar size to the company's reporting units. The company believes the discount rates selected in the quantitative assessment are appropriate in that, in all cases, they meet or exceed the estimated weighted average cost of capital for our business as a whole. The results of the impairment test are sensitive to changes in the discount rates and changes in the discount rate may result in future impairment.
The company performs both qualitative and quantitative assessments to determine whether an indefinite-lived intangible asset is impaired. A qualitative assessment is performed first to determine whether it is more likely than not that an indefinite-lived intangible asset is impaired. If, after considering the totality of events and circumstances, an entity determines it is more likely than not that an indefinite-lived intangible asset is not impaired, then calculating the fair value of such asset is unnecessary. The quantitative impairment test, when necessary, is based on the relief from royalty method to determine the fair value of the indefinite-lived intangible assets, which is both a market-based approach and an income-based approach. The relief from royalty method focuses on the level of royalty payments that the user of an intangible asset would have to pay a third party for the use of the asset if it were not owned by the user. This method involves estimating theoretical future after tax royalty payments based on the company's forecasted revenues attributable to the trade names. These payments are then discounted to present value utilizing a discount rate that considers the after-corporate tax required rate of return applicable to the asset. The projected revenues reflect the best estimate of management for the trade names; however, actual revenues could differ from our estimates.
The discount rates selected represent market rates of return equal to what the company believes a reasonable investor would expect to achieve on investments of similar size and type to the indefinite-lived intangible asset being tested. The company believes the discount rates selected are appropriate in that, in all cases, they exceed the estimated weighted average cost of capital for our business as a whole. The results of the impairment test are sensitive to changes in the discount rates and changes in the discount rate may result in future impairment.
There was no impairment indicated on indefinite-lived intangible assets in fiscal 2016 as a result of our impairment testing. During fiscal 2015, the company recognized pre-tax asset impairment expenses totaling
$10.8 million
associated with the POSH trade name. Although profitability
-
36
-
associated with the POSH trade name increased as compared to fiscal 2014, forecasts developed during the fourth quarter of fiscal 2015 indicated that forecasts of revenue and profitability no longer supported the value of the trade name intangible asset.
In the fourth quarter of fiscal 2014, the company concluded that two trade names, Nemschoff and POSH, were impaired. The company recognized pre-tax asset impairment expenses totaling $21.4 million associated with the Nemschoff and POSH trade name intangibles for fiscal 2014. These impairment expenses were incurred due to the fact that the forecasted revenue and profitability for each business did not support the recorded fair value for the trade names.
Long-lived Assets
The company evaluates other long-lived assets and acquired business units for indicators of impairment when events or circumstances indicate that an impairment risk may be present. The judgments regarding the existence of impairment are based on market conditions, operational performance, and estimated future cash flows. If the carrying value of a long-lived asset is considered impaired, an impairment charge is recorded to adjust the asset to its estimated fair value.
Due to the acquisition of a manufacturing and distribution operation in Dongguan, China during fiscal 2014, the company decided not to pursue the construction of a new manufacturing and distribution facility on previously acquired property in Ningbo, China. The company evaluated the fair value of this property and recorded a pre-tax asset impairment of
$4.0 million
during the second quarter of fiscal 2014. During the third quarter of fiscal 2015, the company entered into an agreement for the sale of the property in Ningbo, China. Accordingly, an additional impairment was recorded to write down the land to its fair value, less estimated selling expenses, to an amount of $4.2 million. As the land meets the criteria to be designated as an asset held for sale, the value of the land has been classified as a current asset and included within "Other" on the Consolidated Balance Sheets for the period ended May 30, 2015. Subsequent to the end of fiscal 2015 the company completed the sale of the Ningbo property. See Note 17 to the Consolidated Financial Statements for additional information regarding this impairment charge.
Warranty Reserve
The company stands behind company products and the promises it makes to customers. From time to time, quality issues arise resulting in the need to incur costs to correct problems with products or services. The company has established warranty reserves for the various costs associated with these obligations. General warranty reserves are based on historical claims experience and periodically adjusted for business levels. Specific reserves are established once an issue is identified. The valuation of such reserves is based on the estimated costs to correct the problem. Actual costs may vary and may result in an adjustment to these reserves.
Inventory Reserves
Inventories are valued at the lower of cost or market. The inventories at our West Michigan manufacturing operations are valued using the last-in, first-out (LIFO) method, whereas inventories of certain other subsidiaries are valued using the first-in, first-out (FIFO) method. The company establishes reserves for excess and obsolete inventory, based on prevailing circumstances and judgment for consideration of current events, such as economic conditions that may affect inventory. The reserve required to record inventory at lower of cost or market may be adjusted in response to changing conditions.
Income Taxes
Deferred tax assets and liabilities are recognized for the expected future tax consequences attributable to differences between the financial statement carrying amounts of existing assets and liabilities, and their respective tax bases. Deferred tax assets and liabilities are measured using the enacted tax rates expected to apply to taxable income in the years in which those temporary differences are expected to reverse. In evaluating our ability to recover our deferred tax assets within the jurisdiction from which they arise, we consider all available positive and negative evidence. The assumptions about future taxable income require significant judgment and are consistent with the plans and estimates we are using to manage the underlying businesses.
See Note 10 of the Consolidated Financial Statements for information regarding the company's uncertain tax positions.
The company has net operating loss (NOL) carryforwards available in certain jurisdictions to reduce future taxable income. The company also has foreign tax credits available in certain jurisdictions to reduce future tax due. Future tax benefits for NOL carryforwards and foreign tax credits are recognized to the extent that realization of these benefits is considered more likely than not. This determination is based on the expectation that related operations will be sufficiently profitable or various tax planning strategies available to us will enable us to utilize the NOL carryforwards and/or foreign tax credits. When information becomes available that raises doubts about the realization of a deferred income tax asset, a valuation allowance is established.
Self-Insurance Reserves
-
37
-
With the assistance of independent actuaries, reserves are established for workers' compensation and general liability exposures. The reserves are established based on expected future claims for incurred losses. The company also establishes reserves for health, prescription drugs, and dental benefit exposures based on historical claims information along with certain assumptions about future trends. The methods and assumptions used to determine the liabilities are applied consistently, although actual claims experience can vary. The company also maintains insurance coverage for certain risk exposures through traditional, premium-based insurance policies. The company's health benefits retention level does not include an aggregate stop loss policy. The company's retention levels designated within significant insurance arrangements as of
May 28, 2016
, are as follows.
|
(In millions)
|
Retention Level (per occurrence)
|
|||
|
General liability and auto liability/physical damage
|
$
|
1.00
|
|
|
|
Workers' compensation and property
|
$
|
0.75
|
|
|
Pension and other Post-Retirement Benefits
The determination of the obligation and expense for pension and other post-retirement benefits depends on certain actuarial assumptions. Among the most significant of these assumptions are the discount rate and expected long-term rate of return on plan assets. We determine these assumptions as follows.
|
•
|
Discount Rate
— This assumption is established at the end of the fiscal year based on high-quality corporate bond yields. The company utilizes the services of an independent actuarial firm to assist in determining the rate. Future expected actuarially determined cash flows for the company's domestic pension, international pension and post-retirement medical plans are individually discounted at the spot rates under the Mercer Yield Curve to arrive at the plan’s obligations as of the measurement date.
|
Effective May 28, 2016, the company changed the method it uses to estimate the interest component of net periodic benefit cost for pension and other postretirement benefits. Historically, the company has estimated the interest cost component utilizing a single weighted-average discount rate derived from the yield curve used to measure the benefit obligation at the beginning of the period. The company has elected to utilize a full yield curve approach in the estimation of interest cost by applying the specific spot rates along the yield curve used in the determination of the benefit obligation to the relevant projected cash flows. The company has made this change to provide a more precise measurement of interest cost by improving the correlation between projected benefit cash flows to the corresponding spot yield curve rates. The company accounted for this change as a change in accounting estimate and accordingly will account for it prospectively. The company estimates the impact of this change on the consolidated earnings for fiscal 2017 will be a reduction of the interest cost component of net periodic benefit cost of approximately
$0.4 million
. For fiscal 2016, the use of the full yield curve approach did not impact how the company measured the total benefit obligations at year end or the annual net periodic benefit cost as any change in the interest cost component is completely offset by the actuarial gain or loss measured at year end, which is immediately recognized in the income statement. Accordingly, this change in estimate did not impact the Consolidated Statement of Comprehensive Income for the fiscal year ended May 28, 2016.
|
•
|
Expected Long-Term Rate of Return
—
The
company bases this assumption on our long-term assumed rates of return for equities and fixed income securities, weighted by the allocation of the invested assets of the pension plan. The company considers likely returns and risk factors specific to the various classes of investments and advice from independent actuaries in establishing this rate. Changes in the investment allocation of plan assets would impact this assumption. A shift to a higher relative percentage of fixed income securities, for example, would result in a lower assumed rate.
|
While this assumption represents the long-term market return expectation, actual asset returns can and do differ from year-to-year. Such differences give rise to actuarial gains and losses. In years where actual market returns are lower than the assumed rate, an actuarial loss is generated. Conversely, an actuarial gain results when actual market returns exceed the assumed rate in a given year. As of
May 28, 2016
, and
May 30, 2015
, the net actuarial loss associated with the employee pension and post-retirement benefit plans totaled approximately $39.4 million and $43.0 million, respectively.
Changes in the discount rate and return on assets can have a significant effect on the expense and obligations related to our pension plans. The company cannot accurately predict these changes in discount rates or investment returns and, therefore, cannot reasonably estimate whether adjustments to the expense or obligation in subsequent years will be significant. Both the May 28, 2016 pension funded status and 2017 expense are affected by year-end 2016 discount rate and expected return on assets assumptions. Any change to these assumptions will be specific to the time periods noted and may not be additive, so the impact of changing multiple factors simultaneously cannot be calculated by combining the individual sensitivities shown.
The effect of the indicated increase/(decrease) in discount rates and expected return on assets is shown below:
-
38
-
|
(In millions)
|
|||||||||||||
|
Assumption
|
1 Percent Change
|
2017 Expense
|
May 28, 2016 Obligation
|
||||||||||
|
U.S.
|
International
|
U.S.
|
International
|
||||||||||
|
Discount rate
|
+/- 1.0
|
—
|
|
$ (1.2) / 1.5
|
$ (0.4) / 0.5
|
$ (16.8) / 22.2
|
|||||||
|
Expected return on assets
|
+/- 1.0
|
—
|
|
$ (0.9) / 0.9
|
—
|
|
—
|
|
|||||
For purposes of determining annual net pension expense, the company uses a calculated method for determining the market-related value of plan assets. Under this method, the company recognizes the change in fair value of plan assets systematically over a five-year period. Accordingly, a portion of the net actuarial loss is deferred. As of
May 28, 2016
, the deferred net actuarial loss (i.e. the portion of the total net actuarial loss not subject to amortization) was $3.7 million.
Refer to Note 7 of the Consolidated Financial Statements for more information regarding costs and assumptions used for employee benefit plans.
Stock-Based Compensation
The company views stock-based compensation as a key component of total compensation for certain employees, non-employee directors and officers. The stock-based compensation programs include grants of restricted stock, restricted stock units, performance share units, employee stock purchases, and stock options. The company recognizes expense related to each of these share-based arrangements. The Black-Scholes option pricing model is used in estimating the fair value of stock options issued in connection with compensation programs. This pricing model requires the use of several input assumptions. Among the most significant of these assumptions are the expected volatility of the common stock price and the expected timing of future stock option exercises.
|
•
|
Expected Volatility
— This represents a measure, expressed as a percentage, of the expected fluctuation in the market price of the company's common stock. As a point of reference, a high volatility percentage would assume a wider expected range of market returns for a particular security. All other assumptions held constant, this would yield a higher stock option valuation than a calculation using a lower measure of volatility. In measuring the fair value of the majority of stock options issued during
fiscal 2016
, we utilized an expected volatility of
33 percent
. Options related to the Herman Miller Consumer Holdings (HMCH) Stock Option Plan are classified as a liability within the Consolidated Balance Sheets. As of May 28, 2016, an expected volatility of
35 percent
was used in the year end liability valuation.
|
|
•
|
Expected Term of Options
— This assumption represents the expected length of time between the grant date of a stock option and the date at which it is exercised (option life). The company assumed an average expected term of
4.0 years
in calculating the fair values of the majority of stock options issued during
fiscal 2016
. For the HMCH Stock Option Plan, we utilized an average expected term of
3.1 years
in the year end liability valuation.
|
Refer to Note 9 of the Consolidated Financial Statements for further discussion on our stock-based compensation plans.
Contingencies
In the ordinary course of business, the company encounters matters that raise the potential for contingent liabilities. In evaluating these matters for accounting treatment and disclosure, the company is required to apply judgment to determine the probability that a liability has been incurred. The company is also required to measure, if possible, the dollar value of such liabilities in determining whether or not recognition in our financial statements is required. This process involves the use of estimates which may differ from actual outcomes. Refer to Note 13 of the Consolidated Financial Statements for more information relating to contingencies.
New Accounting Standards
Refer to Note 1 of the Consolidated Financial Statements for information related to new accounting standards.
Forward Looking Statements
Certain statements in this filing are not historical facts but are “forward-looking statements” as defined under Section 27A of the Securities Act of 1933, as amended, and Section 21E of the Securities Exchange Act, as amended, that are based on management’s beliefs, assumptions, current expectations, estimates, and projections about the office furniture industry, the economy, and the company itself. Words like “anticipates,”
-
39
-
“believes,” “confident,” “estimates,” “expects,” “forecasts,” likely,” “plans,” “projects,” and “should,” variations of such words, and similar expressions identify such forward-looking statements. These statements do not guarantee future performance and involve certain risks, uncertainties, and assumptions that are difficult to predict with regard to timing, extent, likelihood, and degree of occurrence. These risks include, without limitation, the success of our growth strategy, employment and general economic conditions, the pace of economic recovery in the U.S., and in our International markets, the increase in white collar employment, the willingness of customers to undertake capital expenditures, the types of products purchased by customers, competitive-pricing pressures, the availability and pricing of raw materials, our reliance on a limited number of suppliers, our ability to expand globally given the risks associated with regulatory and legal compliance challenges and accompanying currency fluctuations, the ability to increase prices to absorb the additional costs of raw materials, the financial strength of our dealers and the financial strength of our customers, our ability to locate new DWR studios, negotiate favorable lease terms for new and existing locations and the implementation of our studio portfolio transformation, our ability to attract and retain key executives and other qualified employees, our ability to continue to make product innovations, the success of newly-introduced products, our ability to serve all of our markets, possible acquisitions, divestitures or alliances, the pace and level of government procurement, the outcome of pending litigation or governmental audits or investigations, political risk in the markets we serve, and other risks identified in our filings with the Securities and Exchange Commission. Therefore, actual results and outcomes may materially differ from what we express or forecast. Furthermore, Herman Miller, Inc. undertakes no obligation to update, amend or clarify forward-looking statements.
-
40
-
The company manufactures, markets, and sells its products throughout the world and, as a result, is subject to changing economic conditions, which could reduce the demand for its products.
Direct Material Costs
The company is exposed to risks arising from price changes for certain direct materials and assembly components used in its operations. The largest of such costs incurred by the company are for steel, plastics, textiles, wood particleboard, and aluminum components. The impact from changes in all commodity prices decreased the company's costs by approximately
$20 million
during
fiscal 2016
compared to the prior year. The impact from changes in commodity prices decreased the company's costs by approximately $0.4 million during
fiscal 2015
as compared to fiscal 2014.
The market prices for commodities will fluctuate over time and the company acknowledges that such changes are likely to impact its costs for key direct materials and assembly components. Consequently, it views the prospect of such changes as an outlook risk to the business.
Foreign Exchange Risk
The company primarily manufactures its products in the United States, United Kingdom, China and India. It also sources completed products and product components from outside the United States. The company's completed products are sold in numerous countries around the world. Sales in foreign countries as well as certain expenses related to those sales are transacted in currencies other than the company's reporting currency, the U.S. dollar. Accordingly, production costs and profit margins related to these sales are effected by the currency exchange relationship between the countries where the sales take place and the countries where the products are sourced or manufactured. These currency exchange relationships can also impact the company's competitive positions within these markets.
In the normal course of business, the company enters into contracts denominated in foreign currencies. The principal foreign currencies in which the company conducts its business are the British pound sterling, euro, Canadian dollar, Japanese yen, Mexican peso, Hong Kong dollar and Chinese renminbi. As of May 28, 2016, the company had outstanding, sixteen forward currency instruments designed to offset either net asset or net liability exposure that is denominated in non-functional currencies. One forward contract was placed to offset a 52.9 million Hong Kong dollar-denominated net asset exposure. Two forward contracts were placed to offset a 9.3 million euro-denominated net asset exposure. Five forward contracts were placed to offset a 13.6 million U.S. dollar-denominated net asset exposure. One forward contract was placed to offset a 6.6 million South African rand-denominated net asset exposure. One forward contract was placed to offset a 0.7 million Canadian dollar-denominated net asset exposure. One forward contract was placed to offset a 1.0 million euro-denominated net liability exposure. Five forward contracts were placed to offset a 13.1 million U.S.dollar-denominated net liability exposure.
As of
May 30, 2015
, the company had outstanding, sixteen forward currency instruments designed to offset either net asset or net liability exposure that is denominated in non-functional currencies. One forward contract was placed to offset a 19.0 million Hong Kong dollar-denominated net asset exposure. Two forward contracts were placed to offset a 10.3 million euro-denominated net asset exposure. Three forward contracts were placed to offset a 4.8 million U.S. dollar-denominated net asset exposure. One forward contract was placed to offset a 6.0 million South African rand-denominated net asset exposure. One forward contract was placed to offset a 0.8 million Canadian dollar-denominated net asset exposure. One forward contract was placed to offset a 0.4 million Australian dollar-denominated net asset exposure. One forward contract was placed to offset a 1.2 million euro-denominated net liability exposure. Six forward contracts were placed to offset a 27.9 million U.S.dollar-denominated net liability exposure.
A net loss of
$0.7 million
,
$2.1 million
and
$1.2 million
related to the cost of the foreign currency hedges and remeasuring all foreign currency transactions into the appropriate functional currency was included in net earnings for the years ended
May 28, 2016
,
May 30, 2015
and
May 31, 2014
, respectively. These amounts are included in “Other Expenses (Income)” in the Consolidated Statements of Comprehensive Income. Additionally, the cumulative effect of translating the balance sheet and income statement accounts from the functional currency into the United States dollar
increased
the accumulated comprehensive loss component of total stockholders' equity by $
8.8 million
as of the end of
fiscal 2016
and
increased
the accumulated comprehensive loss component of total stockholders' equity by $
9.7 million
as of the end of
fiscal 2015
. During fiscal 2014, the effect decreased the accumulated comprehensive income loss component of total stockholders' equity by
$2.9 million
.
-
41
-
Interest Rate Risk
The company maintains fixed-rate debt for which changes in interest rates generally affect fair market value but not earnings or cash flows. Expected cash outflows (notional amounts) over the next five years and thereafter related to debt instruments are as follows.
|
(In millions)
|
2017
|
2018
|
2019
|
2020
|
2021
|
Thereafter
|
Total
|
||||||||||||||||||||
|
Long-Term Debt:
|
|
|
|
|
|
|
|||||||||||||||||||||
|
Fixed rate
|
$
|
—
|
|
|
$
|
149.9
|
|
|
$
|
—
|
|
|
$
|
—
|
|
|
$
|
50.0
|
|
|
$
|
—
|
|
|
$
|
199.9
|
|
|
Weighted average interest rate = 6.31%
|
|||||||||||||||||||||||||||
|
Variable rate
|
|||||||||||||||||||||||||||
|
Weighted average interest rate = 1.28%
|
$
|
—
|
|
$
|
—
|
|
$
|
—
|
|
$
|
22.0
|
|
$
|
—
|
|
$
|
—
|
|
$
|
22.0
|
|
||||||
-
42
-
Herman Miller, Inc.
|
Fiscal Years Ended
|
|||||||||||
|
(In millions, except per share data)
|
May 28, 2016
|
May 30, 2015
|
May 31, 2014
|
||||||||
|
Net sales
|
$
|
2,264.9
|
|
|
$
|
2,142.2
|
|
|
$
|
1,882.0
|
|
|
Cost of sales
|
1,390.7
|
|
|
1,350.8
|
|
|
1,251.0
|
|
|||
|
Gross margin
|
874.2
|
|
|
791.4
|
|
|
631.0
|
|
|||
|
Operating expenses:
|
|||||||||||
|
Selling, general, and administrative
|
585.6
|
|
|
543.9
|
|
|
564.3
|
|
|||
|
Restructuring and impairment expenses
|
—
|
|
|
12.7
|
|
|
26.5
|
|
|||
|
Design and research
|
77.1
|
|
|
71.4
|
|
|
65.9
|
|
|||
|
Total operating expenses
|
662.7
|
|
|
628.0
|
|
|
656.7
|
|
|||
|
Operating earnings (loss)
|
211.5
|
|
163.4
|
|
(25.7
|
)
|
|||||
|
Other expenses (income):
|
|||||||||||
|
Interest expense
|
15.4
|
|
17.5
|
|
17.6
|
|
|||||
|
Interest and other investment income
|
(0.8
|
)
|
(0.6
|
)
|
(0.4
|
)
|
|||||
|
Other, net
|
0.3
|
|
1.3
|
|
0.5
|
|
|||||
|
Net other expenses
|
14.9
|
|
18.2
|
|
17.7
|
|
|||||
|
Earnings (loss) before income taxes
|
196.6
|
|
145.2
|
|
(43.4
|
)
|
|||||
|
Income tax expense (benefit)
|
59.5
|
|
|
47.2
|
|
|
(21.2
|
)
|
|||
|
Equity earnings from nonconsolidated affiliates, net of tax
|
0.4
|
|
0.1
|
|
0.1
|
|
|||||
|
Net earnings (loss)
|
137.5
|
|
|
98.1
|
|
|
(22.1
|
)
|
|||
|
Net earnings attributable to noncontrolling interests
|
0.8
|
|
0.6
|
|
—
|
|
|||||
|
Net earnings (loss) attributable to Herman Miller, Inc.
|
$
|
136.7
|
|
$
|
97.5
|
|
$
|
(22.1
|
)
|
||
|
|
|||||||||||
|
Earnings (loss) per share — basic
|
$
|
2.28
|
|
|
$
|
1.64
|
|
|
$
|
(0.37
|
)
|
|
Earnings (loss) per share — diluted
|
$
|
2.26
|
|
|
$
|
1.62
|
|
|
$
|
(0.37
|
)
|
|
Other comprehensive income (loss):
|
|||||||||||
|
Foreign currency translation adjustments (net of tax of ($0.3), $0.3, and $ - )
|
$
|
(8.8
|
)
|
$
|
(9.7
|
)
|
$
|
2.9
|
|
||
|
Pension and post-retirement liability adjustments (net of tax of ($1.4), $2.2 and $(50.9))
|
0.5
|
|
(8.6
|
)
|
83.5
|
|
|||||
|
Total other comprehensive income (loss)
|
(8.3
|
)
|
(18.3
|
)
|
86.4
|
|
|||||
|
Comprehensive income
|
129.2
|
|
79.8
|
|
64.3
|
|
|||||
|
Comprehensive income attributable to noncontrolling interests
|
0.8
|
|
0.6
|
|
—
|
|
|||||
|
Comprehensive income attributable to Herman Miller, Inc.
|
$
|
128.4
|
|
$
|
79.2
|
|
$
|
64.3
|
|
||
-
43
-
Herman Miller, Inc.
|
(In millions, except share and per share data)
|
May 28, 2016
|
May 30, 2015
|
|||||
|
Assets
|
|
||||||
|
Current Assets:
|
|||||||
|
Cash and cash equivalents
|
$
|
84.9
|
|
$
|
63.7
|
|
|
|
Marketable securities
|
7.5
|
|
5.7
|
|
|||
|
Accounts and notes receivable, less allowances of $4.7 in 2016 and $3.8 in 2015
|
211.0
|
|
189.6
|
|
|||
|
Inventories, net
|
128.2
|
|
129.6
|
|
|||
|
Deferred income taxes
|
—
|
|
32.0
|
|
|||
|
Prepaid taxes
|
20.4
|
|
10.0
|
|
|||
|
Other
|
28.5
|
|
32.9
|
|
|||
|
Total Current Assets
|
480.5
|
|
463.5
|
|
|||
|
|
|||||||
|
Property and Equipment:
|
|||||||
|
Land and improvements
|
24.1
|
|
21.4
|
|
|||
|
Buildings and improvements
|
205.7
|
|
188.9
|
|
|||
|
Machinery and equipment
|
645.3
|
|
610.1
|
|
|||
|
Construction in progress
|
53.9
|
|
48.2
|
|
|||
|
Gross Property and Equipment
|
929.0
|
|
868.6
|
|
|||
|
Less: Accumulated depreciation
|
(648.9
|
)
|
(619.1
|
)
|
|||
|
Net Property and Equipment
|
280.1
|
|
249.5
|
|
|||
|
Goodwill
|
305.3
|
|
303.1
|
|
|||
|
Indefinite-lived intangibles
|
85.2
|
|
85.2
|
|
|||
|
Other amortizable intangibles, net
|
50.8
|
|
52.3
|
|
|||
|
Other assets
|
33.3
|
|
39.1
|
|
|||
|
Total Assets
|
$
|
1,235.2
|
|
$
|
1,192.7
|
|
|
|
|
|||||||
|
Liabilities, Redeemable Noncontrolling Interests, and Stockholders' Equity
|
|||||||
|
Current Liabilities:
|
|||||||
|
Accounts payable
|
$
|
165.6
|
|
$
|
164.7
|
|
|
|
Accrued compensation and benefits
|
85.2
|
|
66.6
|
|
|||
|
Accrued warranty
|
43.9
|
|
39.3
|
|
|||
|
Unearned revenue
|
35.4
|
|
32.0
|
|
|||
|
Other accrued liabilities
|
59.9
|
|
60.8
|
|
|||
|
Total Current Liabilities
|
390.0
|
|
363.4
|
|
|||
|
|
|||||||
|
Long-term debt
|
221.9
|
|
289.8
|
|
|||
|
Pension and post-retirement benefits
|
25.8
|
|
27.8
|
|
|||
|
Other liabilities
|
45.8
|
|
61.0
|
|
|||
|
Total Liabilities
|
683.5
|
|
742.0
|
|
|||
|
Redeemable noncontrolling interests
|
27.0
|
|
30.4
|
|
|||
|
Stockholders' Equity:
|
|||||||
|
Preferred stock, no par value (10,000,000 shares authorized, none issued)
|
—
|
|
—
|
|
|||
|
Common stock, $0.20 par value (240,000,000 shares authorized, 59,868,276 and 59,694,611 shares issued and outstanding in 2016 and 2015, respectively)
|
12.0
|
|
11.9
|
|
|||
|
Additional paid-in capital
|
142.7
|
|
135.1
|
|
|||
|
Retained earnings
|
435.3
|
|
330.2
|
|
|||
|
Accumulated other comprehensive loss
|
(64.5
|
)
|
(56.2
|
)
|
|||
|
Key executive deferred compensation
|
(1.1
|
)
|
(1.2
|
)
|
|||
|
Herman Miller, Inc. Stockholders' Equity
|
524.4
|
|
419.8
|
|
|||
|
Noncontrolling interests
|
0.3
|
|
0.5
|
|
|||
|
Total Stockholders' Equity
|
524.7
|
|
|
420.3
|
|
||
|
Total Liabilities, Redeemable Noncontrolling Interests, and Stockholders' Equity
|
$
|
1,235.2
|
|
|
$
|
1,192.7
|
|
-
44
-
Herman Miller, Inc.
Consolidated Statements of Stockholders' Equity
|
Fiscal Years Ended
|
|||||||||||
|
May 28, 2016
|
May 30, 2015
|
May 31, 2014
|
|||||||||
|
Preferred Stock
|
|||||||||||
|
Balance at beginning of year and end of year
|
$
|
—
|
|
$
|
—
|
|
$
|
—
|
|
||
|
Common Stock
|
|||||||||||
|
Balance at beginning of year
|
$
|
11.9
|
|
$
|
11.9
|
|
$
|
11.7
|
|
||
|
Restricted stock units released
|
0.1
|
|
—
|
|
0.2
|
|
|||||
|
Balance at end of year
|
$
|
12.0
|
|
$
|
11.9
|
|
$
|
11.9
|
|
||
|
Additional Paid-in Capital
|
|||||||||||
|
Balance at beginning of year
|
$
|
135.1
|
|
$
|
122.4
|
|
$
|
102.9
|
|
||
|
Exercise of stock options
|
6.6
|
|
5.7
|
|
18.8
|
|
|||||
|
Repurchase and retirement of common stock
|
(14.1
|
)
|
(3.7
|
)
|
(12.7
|
)
|
|||||
|
Employee stock purchase plan
|
2.0
|
|
1.8
|
|
1.8
|
|
|||||
|
Stock grant compensation expense
|
—
|
|
0.1
|
|
0.2
|
|
|||||
|
Stock option compensation expense
|
1.9
|
|
1.2
|
|
2.3
|
|
|||||
|
Performance stock units compensation expense
|
6.5
|
|
3.3
|
|
3.0
|
|
|||||
|
Excess tax benefit for stock-based compensation
|
0.8
|
|
0.4
|
|
0.5
|
|
|||||
|
Restricted stock units released
|
3.4
|
|
4.0
|
|
5.4
|
|
|||||
|
Deferred compensation plan
|
(0.1
|
)
|
(0.5
|
)
|
(0.2
|
)
|
|||||
|
Directors' fees
|
0.6
|
|
0.4
|
|
0.4
|
|
|||||
|
Balance at end of year
|
$
|
142.7
|
|
$
|
135.1
|
|
$
|
122.4
|
|
||
|
Retained Earnings
|
|||||||||||
|
Balance at beginning of year
|
$
|
330.2
|
|
$
|
269.6
|
|
$
|
323.3
|
|
||
|
Net income attributable to Herman Miller, Inc.
|
136.7
|
|
97.5
|
|
(22.1
|
)
|
|||||
|
Dividends declared on common stock (per share - 2016: $0.59; 2015: $0.56; 2014: $0.53)
|
(35.6
|
)
|
(33.6
|
)
|
(31.6
|
)
|
|||||
|
Noncontrolling interests redemption value adjustment
|
4.0
|
|
(3.3
|
)
|
—
|
|
|||||
|
Balance at end year
|
$
|
435.3
|
|
$
|
330.2
|
|
$
|
269.6
|
|
||
|
Accumulated Other Comprehensive Loss
|
|||||||||||
|
Balance at beginning of year
|
$
|
(56.2
|
)
|
$
|
(37.9
|
)
|
$
|
(124.3
|
)
|
||
|
Other comprehensive income (loss)
|
(8.3
|
)
|
(18.3
|
)
|
86.4
|
|
|||||
|
Balance at end of year
|
$
|
(64.5
|
)
|
$
|
(56.2
|
)
|
$
|
(37.9
|
)
|
||
|
Key Executive Deferred Compensation
|
|||||||||||
|
Balance at beginning of year
|
$
|
(1.2
|
)
|
$
|
(1.7
|
)
|
$
|
(1.9
|
)
|
||
|
Deferred compensation plan
|
0.1
|
|
0.5
|
|
0.2
|
|
|||||
|
Balance at end of year
|
$
|
(1.1
|
)
|
$
|
(1.2
|
)
|
$
|
(1.7
|
)
|
||
|
Herman Miller, Inc. Stockholders' Equity
|
$
|
524.4
|
|
$
|
419.8
|
|
$
|
364.3
|
|
||
|
Noncontrolling Interests
|
|||||||||||
|
Balance at beginning of year
|
$
|
0.5
|
|
$
|
—
|
|
$
|
—
|
|
||
|
Initial origination of noncontrolling interests
|
—
|
|
6.0
|
|
—
|
|
|||||
|
Net income attributable to noncontrolling interests
|
0.3
|
|
0.1
|
|
—
|
|
|||||
|
Deconsolidation of entity with noncontrolling interests
|
(0.5
|
)
|
—
|
|
—
|
|
|||||
|
Stock-based compensation expense
|
—
|
|
0.2
|
|
—
|
|
|||||
|
Purchase of noncontrolling interests
|
—
|
|
(5.8
|
)
|
—
|
|
|||||
|
Balance at end of year
|
$
|
0.3
|
|
$
|
0.5
|
|
$
|
—
|
|
||
|
Total Stockholders' Equity
|
$
|
524.7
|
|
$
|
420.3
|
|
$
|
364.3
|
|
||
-
45
-
Herman Miller, Inc.
|
Fiscal Years Ended
|
|||||||||||
|
(In millions)
|
May 28, 2016
|
May 30, 2015
|
May 31, 2014
|
||||||||
|
Cash Flows from Operating Activities:
|
|
||||||||||
|
Net earnings (loss)
|
$
|
137.5
|
|
$
|
98.1
|
|
$
|
(22.1
|
)
|
||
|
Adjustments to reconcile net earnings (loss) to net cash provided by operating activities
|
72.9
|
|
69.6
|
|
112.2
|
|
|||||
|
Net Cash Provided by Operating Activities
|
210.4
|
|
167.7
|
|
90.1
|
|
|||||
|
|
|||||||||||
|
Cash Flows from Investing Activities:
|
|||||||||||
|
Marketable securities purchases
|
(7.8
|
)
|
—
|
|
(5.2
|
)
|
|||||
|
Marketable securities sales
|
6.1
|
|
5.3
|
|
4.9
|
|
|||||
|
Capital expenditures
|
(85.1
|
)
|
(63.6
|
)
|
(40.8
|
)
|
|||||
|
Proceeds from sales of property and dealers
|
10.7
|
|
0.6
|
|
1.3
|
|
|||||
|
Acquisitions, net of cash received
|
(3.6
|
)
|
(154.0
|
)
|
(6.7
|
)
|
|||||
|
Other, net
|
(1.1
|
)
|
(1.9
|
)
|
(1.7
|
)
|
|||||
|
Net Cash Used for Investing Activities
|
(80.8
|
)
|
(213.6
|
)
|
(48.2
|
)
|
|||||
|
|
|||||||||||
|
Cash Flows from Financing Activities:
|
|||||||||||
|
Repayments of long-term debt
|
—
|
|
(50.0
|
)
|
—
|
|
|||||
|
Proceeds from credit facility
|
800.8
|
|
796.7
|
|
—
|
|
|||||
|
Repayments of credit facility
|
(868.8
|
)
|
(706.7
|
)
|
—
|
|
|||||
|
Dividends paid
|
(34.9
|
)
|
(33.3
|
)
|
(30.3
|
)
|
|||||
|
Common stock issued
|
9.2
|
|
7.8
|
|
20.8
|
|
|||||
|
Common stock repurchased and retired
|
(14.1
|
)
|
(3.7
|
)
|
(12.7
|
)
|
|||||
|
Excess tax benefits from stock-based compensation
|
1.4
|
|
0.7
|
|
1.1
|
|
|||||
|
Payment of contingent consideration obligation
|
—
|
|
—
|
|
(1.3
|
)
|
|||||
|
Purchase of noncontrolling interests
|
—
|
|
(5.8
|
)
|
—
|
|
|||||
|
Other, net
|
(0.1
|
)
|
1.1
|
|
—
|
|
|||||
|
Net Cash Provided by (Used for) Financing Activities
|
(106.5
|
)
|
6.8
|
|
(22.4
|
)
|
|||||
|
Effect of exchange rate changes on cash and cash equivalents
|
(1.9
|
)
|
1.3
|
|
(0.7
|
)
|
|||||
|
Net Increase (Decrease) in Cash and Cash Equivalents
|
21.2
|
|
(37.8
|
)
|
18.8
|
|
|||||
|
Cash and cash equivalents, Beginning of Year
|
63.7
|
|
101.5
|
|
82.7
|
|
|||||
|
Cash and Cash Equivalents, End of Year
|
84.9
|
|
63.7
|
|
101.5
|
|
|||||
|
Other Cash Flow Information
|
|||||||||||
|
Interest paid
|
13.4
|
|
16.9
|
|
15.6
|
|
|||||
|
Income taxes paid, net of cash received
|
$
|
57.6
|
|
$
|
48.5
|
|
$
|
34.5
|
|
||
-
46
-
Notes to the Consolidated Financial Statements
Table of Contents
|
Page No.
|
||
|
Note 2 -
Acquisitions and Divestitures
|
||
|
Note 3 -
Inventories
|
||
|
Note 5 -
Long-Term Debt
|
||
|
Note 6 -
Operating Leases
|
||
|
Note 7 -
Employee Benefit Plans
|
||
|
Note 9 -
Stock-Based Compensation
|
||
|
Note 10 -
Income Taxes
|
||
|
Note 11 -
Fair Value of Financial Instruments
|
||
|
Note 14 -
Operating Segments
|
||
|
Note 15 -
Accumulated Other Comprehensive Loss
|
||
|
Note 16 -
Redeemable Noncontrolling Interests
|
||
|
|
Note 17 -
Restructuring and Impairment Activities
|
|
|
Note 18 -
Subsequent Event
|
||
|
Note 19 -
Quarterly Financial Data (Unaudited)
|
||
1. Significant Accounting and Reporting Policies
The following is a summary of significant accounting and reporting policies not reflected elsewhere in the accompanying financial statements.
Principles of Consolidation
The Consolidated Financial Statements include the accounts of Herman Miller, Inc. and its majority-owned domestic and foreign subsidiaries. The consolidated entities are collectively referred to as “the company.” All intercompany accounts and transactions have been eliminated in the Consolidated Financial Statements. Nonconsolidated affiliates (20-50 percent owned companies) are accounted for using the equity method.
Description of Business
The company researches, designs, manufactures, sells, and distributes interior furnishings, for use in various environments including office, healthcare, educational, and residential settings, and provides related services that support companies all over the world. The company's products are sold primarily through independent contract office furniture dealers as well as the following channels: owned contract office furniture dealers, direct customer sales, independent retailers, owned retail studios and the company's e-commerce platforms.
Fiscal Year
The company's fiscal year ends on the Saturday closest to May 31. The fiscal years ended
May 28, 2016
,
May 30, 2015
, and
May 31, 2014
each contain
52 weeks
.
Foreign Currency Translation
The functional currency for most of the foreign subsidiaries is their local currency. The cumulative effects of translating the balance sheet accounts from the functional currency into the United States dollar using fiscal year-end exchange rates and translating revenue and expense accounts using average exchange rates for the period is reflected as a component of “Accumulated other comprehensive loss” in the Consolidated Balance Sheets. The financial statement impact of
remeasuring all foreign currency transactions into the appropriate functional currency resulted in a
net loss of
$0.7 million
,
$2.1 million
, and
$1.2 million
for the fiscal years ended May 28, 2016, May 30, 2015, and May 31, 2014, respectively. These amounts are
included in “Other, net” in the Consolidated Statements of Comprehensive Income.
-
47
-
Cash Equivalents
The company holds cash equivalents as part of its cash management function. Cash equivalents include money market funds, time deposit investments, and treasury bills with original maturities of less than three months. The carrying value of cash equivalents, which approximates fair value, totaled
$7.5 million
an
d
$9.1 million
as of
May 28, 2016
and
May 30, 2015
, respectively. All cash equivalents
are high-credit quality financial instruments, and the amount of credit exposure to any one financial institution or instrument is limited.
Marketable Securities
The company maintains a portfolio of marketable securities primarily comprised of mutual funds. These investments are held by the company's wholly owned insurance captive and are considered “available-for-sale” securities. Accordingly, they have been recorded at fair value based on quoted market prices, with the resulting net unrealized holding gains or losses reflected net of tax as a component of “Accumulated other comprehensive loss” in the Consolidated Balance Sheets.
All marketable security transactions are recognized on the trade date. Realized gains and losses on disposal of available-for-sale investments are included in “Interest and other investment income” in the Consolidated Statements of Comprehensive Income. See Note 11 of the Consolidated Financial Statements for additional disclosures of marketable securities.
Accounts Receivable Allowances
Reserves for uncollectible accounts receivable balances are based on known customer exposures, historical credit experience, and the specific identification of other potentially uncollectible accounts. Balances are written off against the reserve once the company determines the probability of collection to be remote. The company generally does not require collateral or other security on trade accounts receivable.
Concentrations of Credit Risk
Our trade receivables are primarily due from independent dealers who, in turn, carry receivables from their customers. We monitor and manage the credit risk associated with individual dealers and direct customers where applicable. Dealers are responsible for assessing and assuming credit risk of their customers and may require their customers to provide deposits, letters of credit, or other credit enhancement measures. Some sales contracts are structured such that the customer payment or obligation is direct to us. In those cases, we may assume the credit risk. Whether from dealers or customers, our trade credit exposures are not concentrated with any particular entity.
Inventories
Inventories are valued at the lower of cost or market and include material, labor, and overhead. Inventory cost is determined using the last-in, first-out (LIFO) method at manufacturing facilities in Michigan, whereas inventories of the company's other locations are valued using the first-in, first-out (FIFO) method. The company establishes reserves for excess and obsolete inventory based on prevailing circumstances and judgment for consideration of current events, such as economic conditions, that may affect inventory. The reserve required to record inventory at lower of cost or market may be adjusted in response to changing conditions. Further information on the company's recorded inventory balances can be found in Note 3 of the Consolidated Financial Statements.
Property, Equipment, and Depreciation
Property and equipment are stated at cost. The cost is depreciated over the estimated useful lives of the assets using the straight-line method. Estimated useful lives range from
3
to
10
years for machinery and equipment and do not exceed
40 years
for buildings. Leasehold improvements are depreciated over the lesser of the lease term or the useful life of the asset. We capitalize certain costs incurred in connection with the development, testing, and installation of software for internal use. Software for internal use is included in property and equipment and is depreciated over an estimated useful life not exceeding
5 years
. Depreciation and amortization expense is included in the Consolidated Statements of Comprehensive Income in the "Cost of sales", "Selling, general and administrative", and "Design and research" line items.
As of the end of fiscal
2016
, outstanding commitments for future capital purchases approximated
$14.0 million
.
Goodwill and Indefinite-lived Intangible Assets
Goodwill is tested for impairment at the reporting unit level annually, or more frequently, when events or changes in circumstances indicate that the fair value of a reporting unit has more likely than not declined below its carrying value. A reporting unit is defined as an operating segment or one level below an operating segment. When testing goodwill for impairment, the company may first assess qualitative factors. If an initial qualitative assessment identifies that it is more likely than not that the carrying value of a reporting unit exceeds its estimated fair value, additional quantitative testing is performed. The company may also elect to skip the qualitative testing and proceed directly to the quantitative testing. If the quantitative testing indicates that goodwill is impaired, the carrying value of goodwill is written down to fair value.
To estimate the fair value of each reporting unit the company utilizes a weighting of the income method and the market method. The income method is based on a discounted future cash flow approach that uses a number of estimates, including revenue based on assumed growth
-
48
-
rates, estimated costs, and discount rates based on the reporting unit's weighted average cost of capital. Growth rates for each reporting unit are estimated based on internal estimates, historical data, and external sources. The growth estimates are also used in planning for our long-term and short-term business planning and forecasting. We test the reasonableness of the inputs and outcomes of our discounted cash flow analysis against comparable market data. The market method is based on financial multiples of companies comparable to each reporting unit and applies a control premium. The carrying value of each reporting unit represents the assignment of various assets and liabilities, excluding corporate assets and liabilities, such as cash, investments, and debt.
Intangible assets with indefinite useful lives are not subject to amortization and are evaluated annually for impairment, or more frequently, when events or changes in circumstances indicate that the fair value of an intangible asset may not be recoverable. The company utilizes the relief from royalty methodology to test for impairment. The primary assumptions for the relief from royalty method include revenue forecasts, royalty rates, and discount rates. The company measures and records an impairment loss for the excess of the carrying value of the asset over its fair value. The company's indefinite-lived intangible assets consist of certain trade names valued at approximately
$85.2 million
as of the end of both fiscal year
2016
and
2015
. These assets have indefinite useful lives.
The company recognized asset impairment expense totaling
$10.8 million
associated with the POSH trade name for the fiscal year 2015, which was recorded within the "Corporate" category within segment reporting. The POSH trade name asset is included within the ELA Furniture Solutions segment and as of the end of fiscal 2015, the carrying value was zero. During the fiscal year 2014, the company recorded impairment expenses of
$21.4 million
associated with the Nemschoff and POSH trade names. These impairment expenses are recorded in the "Restructuring and impairment expenses" line item within the Consolidated Statements of Comprehensive Income and are included in the "Corporate" category within the segment reporting. The trade name assets represent level 3 fair value measurements and these assets are recorded at fair value only if an impairment charge is recognized.
Goodwill and other indefinite-lived assets included in the Consolidated Balance Sheets consist of the following:
|
(In millions)
|
Goodwill
|
Indefinite-lived Intangible Assets
|
Total Goodwill and Indefinite-lived Intangible Assets
|
|||||||||
|
Balance, May 31, 2014
|
228.2
|
|
40.9
|
|
269.1
|
|
||||||
|
Foreign currency translation adjustments
|
(0.7
|
)
|
—
|
|
(0.7
|
)
|
||||||
|
DWR Acquisition
|
75.6
|
|
55.1
|
|
130.7
|
|
||||||
|
Impairment charges
|
—
|
|
(10.8
|
)
|
(10.8
|
)
|
||||||
|
Balance, May 30, 2015
|
$
|
303.1
|
|
$
|
85.2
|
|
$
|
388.3
|
|
|||
|
Foreign currency translation adjustments
|
(0.4
|
)
|
—
|
|
(0.4
|
)
|
||||||
|
Sale of owned dealer
|
(0.6
|
)
|
—
|
|
(0.6
|
)
|
||||||
|
Acquisition of George Nelson Bubble Lamp product line
|
3.2
|
|
—
|
|
3.2
|
|
||||||
|
Balance, May 28, 2016
|
305.3
|
|
85.2
|
|
390.5
|
|
||||||
Goodwill and indefinite-lived intangible assets stemming from the acquisition of Design Within Reach ("DWR") in fiscal 2015 and the George Nelson Bubble Lamp Product Line in fiscal 2016 are included within the Consumer reportable segment.
Long-Lived Assets
The company reviews other long-lived assets for impairment whenever events or changes in circumstances indicate that the carrying amount of an asset or an asset group may not be recoverable. Each impairment test is based on a comparison of the carrying amount of the asset or asset group to the future undiscounted net cash flows expected to be generated by the asset or asset group, or in some cases, by prices for similar assets. If such assets are considered to be impaired, the impairment amount to be recognized is the amount by which the carrying value of the assets exceeds their fair value.
Impairment expense of
$4.0 million
was recording during fiscal 2014 related to property in Ningbo, China. This was due to the acquisition of manufacturing-related assets, including a production facility and related equipment, in Dongguan, China, and as a result, the company decided not to pursue the construction of a new manufacturing and distribution facility on the previously acquired property in Ningbo. The company evaluated the fair value of this property and recorded an asset impairment equal to the excess of carrying value over fair value. This impairment charge was recorded in "Restructuring and impairment expenses", classified in the "Corporate" category for segment reporting purposes, and represents a level 3 fair value measurement.
-
49
-
During the third quarter of fiscal 2015, the company entered into an agreement for the sale of the property in Ningbo, China, and subsequent to the end of fiscal 2015, the company completed the sale of the Ningbo property for cash consideration of approximately
$4.2 million
.
Amortizable intangible assets within "Other amortizable intangibles, net" in the Consolidated Balance Sheets consist primarily of patents, trademarks, and customer relationships. The "customer relationships" intangible asset is comprised of relationships with customers and specifiers and networks and relationships with dealers and distributors. Refer to the following table for the combined gross carrying value and accumulated amortization for these amortizable intangibles.
|
May 28, 2016
|
|||||||||||||||
|
(In millions)
|
Patent and Trademarks
|
Customer Relationships
|
Other
|
Total
|
|||||||||||
|
Gross carrying value
|
$
|
19.8
|
|
$
|
55.7
|
|
$
|
7.5
|
|
$
|
83.0
|
|
|||
|
Accumulated amortization
|
12.3
|
|
15.9
|
|
4.0
|
|
32.2
|
|
|||||||
|
Net
|
$
|
7.5
|
|
$
|
39.8
|
|
$
|
3.5
|
|
$
|
50.8
|
|
|||
|
May 30, 2015
|
|||||||||||||||
|
Patent and Trademarks
|
Customer Relationships
|
Other
|
Total
|
||||||||||||
|
Gross carrying value
|
$
|
18.8
|
|
$
|
55.3
|
|
$
|
5.0
|
|
$
|
79.1
|
|
|||
|
Accumulated amortization
|
11.7
|
|
12.0
|
|
3.1
|
|
26.8
|
|
|||||||
|
Net
|
$
|
7.1
|
|
$
|
43.3
|
|
$
|
1.9
|
|
$
|
52.3
|
|
|||
The company amortizes these assets over their remaining useful lives using the straight-line method over periods ranging from
1.5 years
to
20 years
or on an accelerated basis to reflect the expected realization of the economic benefits. It is estimated that the weighted-average remaining useful life of patents and trademarks is approximately
5.5 years
and the weighted-average remaining useful life of customer relationships is
10 years
.
Estimated amortization expense on existing amortizable intangible assets as of
May 28, 2016
, for each of the succeeding five fiscal years is as follows:
|
(In millions)
|
|||
|
2017
|
$
|
6.3
|
|
|
2018
|
$
|
6.3
|
|
|
2019
|
$
|
5.7
|
|
|
2020
|
$
|
5.7
|
|
|
2021
|
$
|
5.7
|
|
Self-Insurance
The company is partially self-insured for general liability, workers' compensation, and certain employee health and dental benefits under insurance arrangements that provide for third-party coverage of claims exceeding the company's loss retention levels. The company's health benefit retention levels do not include an aggregate stop loss policy. The company's retention levels designated within significant insurance arrangements as of
May 28, 2016
, ar
e as follows:
|
(In millions)
|
Retention Level (per occurrence)
|
|||
|
General liability and auto liability/physical damage
|
$
|
1.00
|
|
|
|
Workers' compensation and property
|
$
|
0.75
|
|
|
The company accrues for its self-insurance arrangements based on actuarially-determined liabilities, which are recorded in “Other liabilities” in the Consolidated Balance Sheets. The value of the liability as of May 28, 2016 and May 30, 2015 was
$10.6 million
and
$9.5 million
, respectively. The actuarial valuations are based on historical information along with certain assumptions about future events. Changes in assumptions for such matters as legal actions, medical costs, and changes in actual experience could cause these estimates to change. The general and workers' compensation liabilities are managed through the company's wholly-owned insurance captive.
-
50
-
Redeemable Noncontrolling Interests
Certain minority shareholders in the company's subsidiary Herman Miller Consumer Holdings, Inc. have the right, at specified times over a period of five years, to require the company to acquire portions of their ownership interest in those entities at fair value. Their interests in these subsidiaries are classified outside permanent equity in the Consolidated Balance Sheets and are carried at the current estimated redemption amounts.
The redemption amounts have been estimated based on the fair value of the subsidiary, which was determined based on a weighting of the discounted cash flow and market methods. The discounted cash flow analysis used the present value of projected cash flows and a residual value. To determine the discount rate for the discounted cash flow method, a market-based approach was used to select the discount rates used. Market multiples for comparable companies were used for the market method of valuation. The fair value of the subsidiary is sensitive to changes in projected revenues and costs, the discount rate, and the forward multiples of the comparable companies.
Changes in the estimated redemption amounts of the noncontrolling interests, subject to put options, are reflected at each reporting period with a corresponding adjustment to Retained earnings. Future reductions in the carrying amounts are subject to a “floor” amount that is equal to the fair value of the redeemable noncontrolling interests at the time they were originally recorded. See Note 16 - Redeemable Noncontrolling Interests for additional information.
Research, Development, and Other Related Costs
Research, development, pre-production, and start-up costs are expensed as incurred. Research and development ("R&D") costs consist of expenditures incurred during the course of planned research and investigation aimed at discovery of new knowledge useful in developing new products or processes. R&D costs also include the significant enhancement of existing products or production processes and the implementation of such through design, testing of product alternatives, or construction of prototypes. R&D costs included in “Design and research” expense in the accompanying Consolidated Statements of Comprehensive Income are
$62.4 million
,
$56.7 million
, and
$53.9 million
, in fiscal
2016
,
2015
, and
2014
, respectively.
Royalty payments made to designers of the company's products as the products are sold are a variable cost based on product sales.
These expenses totaled
$14.7 million
,
$14.7 million
, and
$12.0 million
in fiscal years
2016
,
2015
, and
2014
respectively. They are included in "Design and research"
expense in the accompanying Consolidated Statements of Comprehensive Income
.
Customer Payments and Incentives
We offer various sales incentive programs to our customers, such as rebates and discounts. Programs such as rebates and discounts are adjustments to the selling price and are therefore characterized as a reduction to net sales.
Revenue Recognition
The company recognizes revenue on sales through its network of independent contract furniture dealers and independent retailers once the related product is shipped and title passes. In situations where products are sold through subsidiary dealers or directly to the end customer, revenue is recognized once the related product is shipped to the end customer and installation, if applicable, is substantially complete. Offers such as rebates and discounts are recorded as reductions to net sales. Unearned revenue occurs during the normal course of business due to advance payments from customers for future delivery of products and services.
In addition to independent retailers, the company also sells product through owned retail channels, including e-commerce and DWR retail studios. These sales may include provisions involving a right of return. The company reduces revenue for an estimate of potential future product returns related to current period product revenue. When developing the allowance for sales returns, the company considers historical returns and current economic trends.
Shipping and Handling Expenses
The company records shipping and handling related expenses under the caption “Cost of sales” in the Consolidated Statements of Comprehensive Income.
Cost of Sales
We include material, labor, and overhead in cost of sales. Included within these categories are items such as freight charges, warehousing costs, internal transfer costs, and other costs of our distribution network.
Selling, General, and Administrative
-
51
-
We include costs not directly related to the manufacturing of our products in the "Selling, general, and administrative" line item within the Consolidated Statements of Comprehensive Income. Included in these expenses are items such as compensation expense, rental expense, warranty expense, and travel and entertainment expense.
Income Taxes
Deferred tax assets and liabilities are recognized for the expected future tax consequences attributable to differences between the financial statement carrying amounts of existing assets and liabilities and their respective tax bases. Deferred tax assets and liabilities are measured using the enacted tax rates expected to apply to taxable income in the years in which those temporary differences are expected to reverse.
The company's annual effective tax rate is based on income, statutory tax rates, and tax planning strategies available in the various jurisdictions the company operates. Complex tax laws can be subject to different interpretations by the company and the respective government authorities. Significant judgment is required in evaluating tax positions and determining our tax expense. Tax positions are reviewed quarterly and tax assets and liabilities are adjusted as new information becomes available.
In evaluating the company's ability to recover deferred tax assets within the jurisdiction from which they arise, the company considers all positive and negative evidence. These assumptions require significant judgment about forecasts of future taxable income.
Stock-Based Compensation
The company has several stock-based compensation plans, which are described in Not
e 9 of the Consolidated Financial Statements. Our policy is to expense stock-based compensation using the fair-value based method of accounting for all awards granted.
Earnings per Share
Basic earnings per share (EPS) excludes the dilutive effect of common shares that could potentially be issued, due to the exercise of stock options or the vesting of restricted shares, and is computed by dividing net earnings by the weighted-average number of common shares outstanding for the period. Diluted EPS is computed by dividing net earnings by the sum of the weighted-averag
e number of shares outstanding, plus all dilutive shares
that could potentially be issued. The company also evaluates the impact on EPS of all participating securities under the two-class method.
Refer to Note 8 of the Consolidated Financial Statements fo
r further information regarding the computation of EPS.
Comprehensive Income
Comprehensive income consists of net earnings, foreign currency translation adjustments, unrealized holding gain (loss) on available-for-sale securities and pension liability adjustments.
Refer to Note 15 of the Consolidated Financial Statements fo
r further information regarding comprehensive income.
Use of Estimates in the Preparation of Financial Statements
The preparation of financial statements in conformity with accounting principles generally accepted in the United States requires management to make estimates and assumptions that affect the reported amounts of assets and liabilities and disclosure of contingent assets and liabilities at the date of the financial statements and the reported amounts of revenues and expenses during the reporting period. Actual results could differ from those estimates.
Fair Value
The company classifies and discloses its fair value measurements in one of the following three categories:
|
•
|
Level 1 — Financial instruments with unadjusted, quoted prices listed on active market exchanges.
|
|
•
|
Level 2 — Financial instruments lacking unadjusted, quoted prices from active market exchanges, including over-the-counter traded financial instruments. Financial instrument values are determined using prices for recently traded financial instruments with similar underlying terms and direct or indirect observational inputs, such as interest rates and yield curves at commonly quoted intervals.
|
|
•
|
Level 3 — Financial instruments not actively traded on a market exchange and there is little, if any, market activity. Values are determined using significant unobservable inputs or valuation techniques.
|
See Note 11 of the Consolidated Financial Statements for the required fair value disclosures.
Foreign Currency Forward Contracts Not Designated as Hedges
The company transacts business in various foreign currencies and has established a program that primarily utilizes foreign currency forward contracts to offset the risks associated with the effects of certain foreign currency exposures. Under this program, the company's strategy is to have increases or decreases in our foreign currency exposures offset by gains or losses on the foreign currency forward contracts to mitigate the risks and volatility associated with foreign currency transaction gains or losses. These foreign currency exposures typically arise from net liability or asset exposures in non-functional currencies on the balance sheets of our foreign subsidiaries. These foreign currency forward
-
52
-
contracts generally settle within
30 days
and are not used for trading purposes. These forward contracts are not designated as hedging instruments. Accordingly, we record the fair value of these contracts as of the end of the reporting period in the Consolidated Balance Sheets with changes in fair value recorded within the Consolidated Statements of Comprehensive Income. The balance sheet classification for the fair values of these forward contracts is to "Other" current assets for unrealized gains and to "Other accrued liabilities" for unrealized losses. The Consolidated Statements of Comprehensive Income classification for the fair values of these forward contracts is to "Other expenses (income): Other, net", for both realized and unrealized gains and losses.
The notional amounts of the forward contracts held to purchase and sell U.S. dollars in exchange for other major international currencies were
$64.3 million
and
$34.7 million
as of
May 28, 2016
and
May 30, 2015
, respectively. The notional amounts of the foreign currency forward contracts held to purchase and sell British pound sterling in exchange for other major international currencies were
£31.2 million
and
£18.0 million
as of
May 28, 2016
and
May 30, 2015
, respectively
. The company also has other forward contracts related to other currency pairs at varying notional amounts.
The effects of derivative instruments on the consolidated financial statements were as follows for the fiscal years ended
2016
and
2015
(amounts presented exclude any income tax effects):
Fair Value of Derivative Instruments in Consolidated Balance Sheets
|
(In millions)
|
Balance Sheet Location
|
May 28, 2016
|
May 30, 2015
|
||||||
|
Foreign currency forward contracts
|
Current Assets: Other
|
$
|
0.5
|
|
$
|
0.7
|
|
||
|
Foreign currency forward contracts
|
Current Liabilities: Other Accrued Liabilities
|
$
|
0.8
|
|
$
|
0.2
|
|
||
Effects of Derivative Instruments on Income
|
(In millions)
|
Fiscal Year
|
||||||||||||
|
Statement of Comprehensive Income Location
|
May 28, 2016
|
May 30, 2015
|
May 31, 2014
|
||||||||||
|
(Gain)/loss recognized on foreign currency forward contracts
|
Other expenses (income): Other, net
|
|
$
|
(0.7
|
)
|
$
|
(2.1
|
)
|
$
|
(0.1
|
)
|
||
New Accounting Standards
|
Recently Adopted Accounting Standards
|
||||||
|
Standard
|
Description
|
Date of Adoption
|
Effect on the Financial Statements or Other Significant Matters
|
|||
|
Balance Sheet Classification of Deferred Taxes
|
The standard requires that deferred tax liabilities and assets, as well as any related valuation allowance, be classified as non-current in a classified statement of financial position.
|
November 28, 2015
|
The company adopted the accounting standard prospectively beginning in the second quarter of fiscal 2016. As such, the prior period was not retrospectively adjusted. As of November 28, 2015 and forward, deferred tax liabilities and assets are presented as non-current.
|
|||
-
53
-
|
Recently Issued Accounting Standards Not Yet Adopted
|
||||||
|
Standard
|
Description
|
Effective Date
|
Effect on the Financial Statements or Other Significant Matters
|
|||
|
Simplifying the Measurement of Inventory
|
Under the updated standard, an entity should measure inventory that is measured using either the first-in, first-out ("FIFO") or average cost methods at the lower of cost and net realizable value. Net realizable value is the estimated selling price in the ordinary course of business, less reasonably predictable costs of completion, disposal, and transportation. The updated standard should be applied prospectively.
|
June 4, 2017
|
The company is currently evaluating the impact of adopting this guidance.
|
|||
|
Improvements to Employee Share-Based Payment Accounting
|
The standard simplifies several aspects of the accounting for share-based payment awards to employees, including the accounting for income taxes, forfeitures, statutory tax withholding requirements and classification in the statement of cash flows. Different adoption methodologies exist (retrospectively, modified-retrospectively, or prospectively) for the various different features of the standard being updated.
|
June 4, 2017
|
The company is currently evaluating the impact of adopting this guidance.
|
|||
|
Revenue from Contracts with Customers
|
The standard outlines a single comprehensive model for entities to use in accounting for revenue arising from contracts with customers and supersedes most current revenue recognition guidance, including industry-specific guidance. The core principle of the revenue model is that an entity should recognize revenue to depict the transfer of promised goods or services to customers in an amount that reflects the consideration to which the entity expects to be entitled in exchange for those goods or services. The standard is designed to create greater comparability for financial statement users across industries and jurisdictions and also requires enhanced disclosures. The standard allows for two adoption methods, a full retrospective or modified retrospective approach.
|
June 3, 2018
|
The company is currently evaluating the possible adoption methodologies and the implications of adoption on the consolidated financial statements.
|
|||
|
Financial Instruments - Overall: Recognition and Measurement of Financial Assets and Financial Liabilities
|
The standard provides guidance for the measurement, presentation and disclosure of financial assets and liabilities. The standard requires entities to measure equity investments that do not result in consolidation and are not accounted for under the equity method at fair value and recognize any change in fair value in net income. The standard does not permit early adoption and at adoption a cumulative-effect adjustment to beginning retained earnings should be recorded.
|
June 3, 2018
|
The company is currently evaluating the impact of adopting this guidance.
|
|||
|
Leases
|
Under the updated standard a lessee's rights and obligations under most leases, including existing and new arrangements, would be recognized as assets and liabilities, respectively, on the balance sheet. The standard must be adopted under a modified retrospective approach and early adoption is permitted.
|
June 2, 2019
|
The standard is expected to have a significant impact on our Consolidated Financial Statements, however the company is currently evaluating the impact.
|
|||
Correction of Immaterial Error
In the second quarter of fiscal 2016, the company made an adjustment to correct an immaterial error related to the accrual for product warranties. As a result of this correction, the company adjusted Accrued warranty, Other noncurrent assets (to capture the impact of adjusting deferred taxes), and Retained earnings by
$12.5 million
,
$4.7 million
, and
$7.8 million
, respectively. The adjustment impacts the Consolidated Balance Sheets as of May 30, 2015, the Consolidated Statement of Stockholders’ Equity as of May 31, 2014, Note 13 - Warranties, Guarantees, and Contingencies, and Note 14 - Operating Segments. This correction had no impact on earnings or cash flows.
2. Acquisitions and Divestitures
George Nelson Bubble Lamp Product Line Acquisition
On September 17, 2015, the company acquired certain assets associated with the George Nelson Bubble Lamp product line which together constituted the acquisition of a business. Consideration transferred to acquire the assets consisted of
$3.6 million
in cash transferred during the second quarter of fiscal 2016 and an additional component of performance-based contingent consideration with a fair value of
$2.7 million
as of the acquisition date.
-
54
-
The assets acquired included an exclusive manufacturing agreement and customer relationships with fair values of
$2.5 million
and
$0.6 million
, respectively, each having a useful life of
10 years
. The excess of the purchase consideration over the fair value of the net assets acquired was
$3.2 million
and recognized as goodwill within the Consumer reportable segment. The total amount of this goodwill is deductible for tax purposes and the impact on net sales and net earnings during the fiscal year was nominal. The company has finalized the purchase accounting for the acquisition of the George Nelson Bubble Lamp product line.
Design Within Reach Acquisition
On July 28, 2014, the company acquired the majority of the outstanding equity of Design Within Reach, Inc. ("DWR"), a Stamford, Connecticut based, leading North American marketer and seller of modern furniture, lighting, and accessories primarily serving consumers and design trade professionals. The acquisition of DWR advances the company's strategy of being both an industry brand and a consumer brand by expanding the company's reach into the consumer sector.
The company purchased an ownership interest in DWR equal to approximately
81 percent
for
$155.2 million
in cash. Subsequent to the initial transaction, the company acquired an additional
4 percent
of DWR stock from the remaining public shareholders for approximately
$5.8 million
in cash, all of which was paid during the first and second quarters of fiscal 2015. The remaining
15 percent
of DWR stock was contributed by DWR executives into the newly formed consumer business subsidiary and the company contributed the assets of the existing Herman Miller Consumer business. After these transactions, the redeemable noncontrolling interests in the newly formed subsidiary, known as Herman Miller Consumer Holdings, Inc. ("HMCH"), were approximately
7 percent
. The remaining HMCH shareholders have a put option to require the company to purchase their remaining interest over a
five years
period from the date of issuance of such shares. As a result, these noncontrolling interests are not included within Stockholders' Equity within the Condensed Consolidated Balance Sheets, but rather are included within Redeemable noncontrolling interests.
DWR acquisition-related expenses were
$2.2 million
during fiscal year 2015. These expenses included legal and professional services fees.
|
Assets Acquired and Liabilities Assumed on July 28, 2014
|
|||
|
(In millions)
|
Fair Value
|
||
|
Purchase price
|
$
|
155.2
|
|
|
Fair value of the assets acquired:
|
|||
|
Cash
|
1.2
|
|
|
|
Accounts receivable
|
2.2
|
|
|
|
Inventory
|
47.4
|
|
|
|
Current deferred tax asset
|
1.5
|
|
|
|
Other current assets
|
5.5
|
|
|
|
Goodwill
|
75.6
|
|
|
|
Other intangible assets
|
68.5
|
|
|
|
Property
|
32.0
|
|
|
|
Other long term assets
|
2.4
|
|
|
|
Total assets acquired
|
236.3
|
|
|
|
Fair value of liabilities assumed:
|
|||
|
Accounts payable
|
20.8
|
|
|
|
Accrued compensation and benefits
|
1.6
|
|
|
|
Other accrued liabilities
|
12.3
|
|
|
|
Long term deferred tax liability
|
14.5
|
|
|
|
Other long term liabilities
|
0.4
|
|
|
|
Total liabilities assumed
|
49.6
|
|
|
|
Redeemable noncontrolling interests
|
25.7
|
|
|
|
Noncontrolling interests
|
5.8
|
|
|
|
Net assets acquired
|
$
|
155.2
|
|
-
55
-
The goodwill stemming from the transaction in the amount of
$75.6 million
was recorded as "Goodwill" in the Condensed Consolidated Balance Sheets and allocated to the Consumer reportable segment. The goodwill recognized is attributable primarily to the assembled workforce and expected synergies from DWR and the total amount of this goodwill is not deductible for tax purposes.
Other intangible assets acquired as a result of the acquisition of DWR were valued at
$68.5 million
. These amounts are reflected in the values presented in the following table:
|
Intangible Assets Acquired from the DWR Acquisition
|
||||
|
(In millions)
|
Fair Value
|
Useful Life
|
||
|
Trade Names and Trademarks
|
$
|
55.1
|
|
Indefinite
|
|
Exclusive Distribution Agreements
|
0.2
|
|
1.5 years
|
|
|
Customer Relationships
|
12.0
|
|
10 - 16 years
|
|
|
Product Development Designs
|
1.2
|
|
7 years
|
|
|
Total Intangible Assets Acquired
|
$
|
68.5
|
|
|
3. Inventories
|
(In millions)
|
May 28, 2016
|
May 30, 2015
|
||||||
|
Finished goods and work in process
|
$
|
102.1
|
|
|
$
|
106.5
|
|
|
|
Raw materials
|
26.1
|
|
|
23.1
|
|
|||
|
Total
|
$
|
128.2
|
|
|
$
|
129.6
|
|
|
Inventories valued using LIFO amounted to
$22.8 million
and
$22.3 million
as of
May 28, 2016
and
May 30, 2015
, respect
ively. If all inventories had been valued using the first-in first-out method, inventories would have been
$140.4 million
and
$142.1 million
at
May 28, 2016
and
May 30, 2015
, respectively.
4. Investments in Nonconsolidated Affiliates
The company had an ownership interest in
four
nonconsolidated affiliates at
May 28, 2016
. Refer to the company's ownership percentages shown below:
|
Ownership Interest
|
May 28, 2016
|
May 30, 2015
|
|
Kvadrat Maharam Arabia DMCC
|
50.0%
|
50.0%
|
|
Kvadrat Maharam Pty Limited
|
50.0%
|
50.0%
|
|
Kvadrat Maharam Turkey JSC
|
50.0%
|
50.0%
|
|
Danskina B.V.
|
50.0%
|
50.0%
|
The Kvadrat Maharam nonconsolidated affiliates are distribution entities that are engaged in selling decorative upholstery, drapery, and wall covering products. Danskina B.V. is a manufacturer and distributor of designer rugs and floor covering products.
At
May 28, 2016
, the company's investment value in Kvadrat Maharam Pty was
$1.8 million
more than the company's proportionate share of the underlying net assets (
$1.9 million
more at
May 30, 2015
). This difference was driven by a step-up in fair value of the investment in Kvadrat Maharam Pty, stemming from the Maharam business combination. This amount is considered to be a permanent basis difference.
At
May 28, 2016
and
May 30, 2015
the company's investment value in Danskina B.V. was
$1.1 million
more than the company's proportionate share of the underlying net assets. This amount represents the difference in value between the capital contribution made to the joint venture by Maharam and the proportionate share of equity received. This amount is considered to be a permanent basis difference.
The company's investment in its nonconsolidated affiliates was
$4.2 million
at
May 28, 2016
and
$4.2 million
at
May 30, 2015
. The company's proportionate share of equity earnings from these companies was
$0.4 million
for the year ended
May 28, 2016
,
$0.1 million
for the year ended
May 30, 2015
and
$0.1 million
for the year ended
May 31, 2014
.
-
56
-
For the year ended
May 28, 2016
, sales to nonconsolidated affiliates were
$2.5 million
and purchases from nonconsolidated affiliates were
$0.9 million
. Receivables from nonconsolidated affiliates were
$0.4 million
and payables to nonconsolidated affiliates were
$0.1 million
as of
May 28, 2016
.
For the year ended
May 30, 2015
, sales to nonconsolidated affiliates were
$2.5 million
and purchases from nonconsolidated affiliates were
$0.5 million
. Receivables from nonconsolidated affiliates were
$0.4 million
and payables to nonconsolidated affiliates were
$0.1 million
as of
May 30, 2015
.
For the year ended
May 31, 2014
, sales to nonconsolidated affiliates were
$1.7 million
and purchases from nonconsolidated affiliates were
$0.4 million
.
Long-term debt consisted of the following obligations:
|
(In millions)
|
May 28, 2016
|
May 30, 2015
|
||||||
|
Series B senior notes, 6.42%, due January 3, 2018
|
$
|
149.9
|
|
|
$
|
149.8
|
|
|
|
Debt securities, 6.0%, due March 1, 2021
|
50.0
|
|
50.0
|
|
||||
|
Syndicated Revolving Line of Credit, due July 2019
|
22.0
|
|
90.0
|
|
||||
|
Total
|
$
|
221.9
|
|
|
$
|
289.8
|
|
|
On January 3, 2015,
$50.0 million
of the company’s Series A senior notes became due and payable. This debt was paid through the use of borrowings on the company’s revolving line of credit.
During the first quarter of fiscal 2015, the company entered into a third amendment and restatement of its syndicated revolving line of credit, which provides the company with up to
$250 million
in revolving variable interest borrowing capacity and includes an "accordion feature" allowing the company to increase, at its option and subject to the approval of the participating banks, the aggregate borrowing capacity of the facility by
$125 million
. The facility expires in July 2019 and outstanding borrowings bear interest at rates based on the prime rate, federal funds rate, LIBOR, or negotiated rates as outlined in the agreement. Interest is payable periodically throughout the period if borrowings are outstanding. As of May 28, 2016, the total debt outstanding related to borrowings against this facility was
$22.0 million
. Of the borrowings against this facility,
$18.0 million
has an interest rate of
1.28 percent
and the remaining
$4.0 million
has an interest rate of
1.29 percent
. These borrowings are included within Long-term debt in the Consolidated Balance Sheet. As of
May 28, 2016
, the total usage against the facility was
$30.7 million
, of which
$8.7 million
related to outstanding letters of credit. As of
May 30, 2015
, total usage against this facility was
$98.3 million
, of which
$8.3 million
related to outstanding letters of credit.
The company has access to foreign revolving lines of credit, in the amount of approximately
$12.8 million
, that can be used to meet working capital cash flow needs within Asia. As of
May 28, 2016
and
May 30, 2015
, there were
no
borrowings against these facilities.
Our senior notes and the unsecured senior revolving credit facility restrict, without prior consent, our borrowings, capital leases, and the sale of certain assets. In addition, we have agreed to maintain certain financial performance ratios, which include a maximum leverage ratio covenant, which is measured by the ratio of debt to trailing four quarter adjusted EBITDA (as defined in the credit agreement) and is required to be less than
3.5
:1, except that we may elect, under certain conditions, to increase the maximum Leverage Ratio to
4
:1 for four consecutive fiscal quarter end dates. The covenants also require a minimum interest coverage ratio, which is measured by the ratio of trailing four quarter EBITDA to trailing four quarter interest expense (as defined in the credit agreement) and is required to be greater than
4
:1. Adjusted EBITDA is generally defined in the credit agreement as EBITDA adjusted by certain items which include non-cash share-based compensation, non-recurring restructuring costs, legacy pension expenses and extraordinary ite
ms. At
May 28, 2016
and
May 30, 2015
, the company was in compliance with all of these restrictions and performance ratios.
Annual maturities of long-term debt for the five fiscal years subsequent to
May 28, 2016
, are as follows:
-
57
-
|
(In millions)
|
|||
|
2017
|
$
|
—
|
|
|
2018
|
$
|
149.9
|
|
|
2019
|
$
|
—
|
|
|
2020
|
$
|
22.0
|
|
|
2021
|
$
|
50.0
|
|
|
Thereafter
|
$
|
—
|
|
6. Operating Leases
The company leases real property and equipment under agreements that expire on various dates. Certain leases contain renewal provisions and generally require the company to pay utilities, insurance, taxes, and other operating expenses.
Future minimum rental payments required under operating leases that have non-cancelable lease terms as of
May 28, 2016
, are as follows:
|
(In millions)
|
|||
|
2017
|
$
|
38.9
|
|
|
2018
|
$
|
37.9
|
|
|
2019
|
$
|
34.8
|
|
|
2020
|
$
|
31.0
|
|
|
2021
|
$
|
28.2
|
|
|
Thereafter
|
$
|
147.2
|
|
Total rental expense charged to operations was
$45.6 million
,
$40.2 million
, and
$25.6 million
, in fiscal
2016
,
2015
, and
2014
, respectively. Substantially all such rental expense represented the minimum rental payments under operating leases.
7. Employee Benefit Plans
The company maintains retirement benefit plans for substantially all of its employees.
Pension Plans and Post-Retirement Medical Insurance
The company offers certain employees retirement benefits under domestic defined benefit p
lans. The
company provides healthcare benefits to employees who retired from service on or before a qualifying date in 1998. As of the qualifying date, the company discontinued offering post-retirement medical to future retirees. Benefits to qualifying retirees under this plan are based on the employee's years of service and age at the date of retirement. In addition to the domestic pension and retiree
healthcare plan, one of the
company's wholly owned foreign subsidiaries has a defined-benefit pension plan based upon an average final pay benefit calculation. The measurement date for the company's principal domestic and international pension plans, as well as its post-retirement medical plan, is the last day of the fiscal year.
During fiscal 2014, the company settled the remaining obligations associated with its primary domestic defined benefit pension plans. Plan participants received vested benefits from the plan assets by electing either a lump sum distribution, roll-over contribution to other 401(k) or individual retirement plans, or an annuity contract with a qualifying third-party provider. As a result of the settlement, the company was relieved of any further obligation. Pension settlement charges of
$158.2 million
, before tax, were recorded during fiscal year 2014. The settlement expenses included the pre-tax reclassifications of actuarial gains and losses from accumulated other comprehensive loss of
$137.7 million
, and cash contributions to the plan of
$48.8 million
, net of the outstanding pension plan liability prior to settlement. Cost of goods sold included
$49.3 million
of the settlement expense, while
$108.9 million
of the expense was included in operating expenses. After the settlement, the remaining pension assets of
$0.9 million
were transferred to the company's defined contribution 401(k) plan. The primary domestic defined-benefit plan included benefits determined by a cash balance calculation. Benefits under this plan were based upon an employee's years of service and earnings.
Benefit Obligations and Funded Status
The following table presents, for the fiscal years noted, a summary of the changes in the projected benefit obligation, plan assets and funded status of the company's domestic and international pension plans and post-retirement plan:
-
58
-
|
Pension Benefits
|
Post-Retirement Benefits
|
||||||||||||||||||||||
|
2016
|
2015
|
2016
|
2015
|
||||||||||||||||||||
|
(In millions)
|
Domestic
|
International
|
Domestic
|
International
|
|||||||||||||||||||
|
Change in benefit obligation:
|
|
|
|
|
|
||||||||||||||||||
|
Benefit obligation at beginning of year
|
$
|
1.1
|
|
|
$
|
112.0
|
|
|
$
|
1.1
|
|
|
$
|
105.4
|
|
|
$
|
7.7
|
|
|
$
|
7.5
|
|
|
Interest cost
|
—
|
|
|
3.8
|
|
|
—
|
|
|
4.3
|
|
|
0.2
|
|
|
0.2
|
|
||||||
|
Foreign exchange impact
|
—
|
|
(4.6
|
)
|
—
|
|
(9.8
|
)
|
—
|
|
—
|
|
|||||||||||
|
Actuarial (gain)/loss
|
—
|
|
(4.4
|
)
|
—
|
|
15.0
|
|
(1.3
|
)
|
0.8
|
|
|||||||||||
|
Benefits paid
|
(0.1
|
)
|
(2.4
|
)
|
—
|
|
(2.9
|
)
|
(0.7
|
)
|
(0.8
|
)
|
|||||||||||
|
Benefit obligation at end of year
|
$
|
1.0
|
|
|
$
|
104.4
|
|
|
$
|
1.1
|
|
|
$
|
112.0
|
|
|
$
|
5.9
|
|
|
$
|
7.7
|
|
|
Change in plan assets:
|
|||||||||||||||||||||||
|
Fair value of plan assets at beginning of year
|
$
|
—
|
|
|
$
|
92.0
|
|
|
$
|
—
|
|
|
$
|
94.8
|
|
|
$
|
—
|
|
|
$
|
—
|
|
|
Actual return on plan assets
|
—
|
|
(1.3
|
)
|
—
|
|
8.0
|
|
—
|
|
|
—
|
|
||||||||||
|
Foreign exchange impact
|
—
|
|
(3.7
|
)
|
—
|
|
(8.5
|
)
|
—
|
|
|
—
|
|
||||||||||
|
Employer contributions
|
0.1
|
|
0.4
|
|
—
|
|
0.6
|
|
0.7
|
|
|
0.8
|
|
||||||||||
|
Benefits paid
|
(0.1
|
)
|
(2.4
|
)
|
—
|
|
(2.9
|
)
|
(0.7
|
)
|
(0.8
|
)
|
|||||||||||
|
Fair value of plan assets at end of year
|
$
|
—
|
|
$
|
85.0
|
|
$
|
—
|
|
$
|
92.0
|
|
$
|
—
|
|
$
|
—
|
|
|||||
|
Funded status:
|
|||||||||||||||||||||||
|
Under funded status at end of year
|
$
|
(1.0
|
)
|
$
|
(19.4
|
)
|
$
|
(1.1
|
)
|
$
|
(20.0
|
)
|
$
|
(5.9
|
)
|
$
|
(7.7
|
)
|
|||||
|
Components of the amounts recognized in the Consolidated Balance Sheets:
|
|||||||||||||||||||||||
|
Current liabilities
|
$
|
(0.1
|
)
|
$
|
—
|
|
$
|
(0.1
|
)
|
$
|
—
|
|
$
|
(0.7
|
)
|
$
|
(0.9
|
)
|
|||||
|
Non-current liabilities
|
$
|
(0.9
|
)
|
$
|
(19.4
|
)
|
$
|
(1.0
|
)
|
$
|
(20.0
|
)
|
$
|
(5.2
|
)
|
$
|
(6.8
|
)
|
|||||
|
Components of the amounts recognized in accumulated other comprehensive loss before the effect of income taxes:
|
|||||||||||||||||||||||
|
Unrecognized net actuarial loss (gain)
|
$
|
0.3
|
|
$
|
39.3
|
|
$
|
0.3
|
|
$
|
41.6
|
|
$
|
(0.2
|
)
|
$
|
1.1
|
|
|||||
|
Unrecognized prior service cost (credit)
|
—
|
|
—
|
|
—
|
|
—
|
|
—
|
|
—
|
|
|||||||||||
|
Accumulated other comprehensive loss
|
$
|
0.3
|
|
$
|
39.3
|
|
$
|
0.3
|
|
$
|
41.6
|
|
$
|
(0.2
|
)
|
$
|
1.1
|
|
|||||
The accumulated benefit obligation for the company's domestic pension benefit plans tota
led
$1.0 million
as of the end of fiscal
2016
and
$1.1 million
as of the end of fiscal
2015
. For its international plans, the accumulated benefit obligation tota
led
$100.8 million
and
$108.9 million
as of fiscal 2016 and fiscal 2015, respectively.
The following table is a summary of the annual cost of the company's pension and post-retirement plans:
-
59
-
|
Components of Net Periodic Benefit Costs and Other Changes Recognized in Other Comprehensive Income:
|
|||||||||||||||||||||||
|
Pension Benefits
|
Post-Retirement Benefits
|
||||||||||||||||||||||
|
(In millions)
|
2016
|
2015
|
2014
|
2016
|
2015
|
2014
|
|||||||||||||||||
|
Domestic:
|
|
|
|
|
|
||||||||||||||||||
|
Interest cost
|
$
|
—
|
|
|
$
|
—
|
|
|
$
|
5.2
|
|
|
$
|
0.2
|
|
|
$
|
0.2
|
|
|
$
|
0.3
|
|
|
Expected return on plan assets
|
—
|
|
—
|
|
(3.6
|
)
|
—
|
|
—
|
|
—
|
|
|||||||||||
|
Net amortization
|
—
|
|
—
|
|
4.7
|
|
—
|
|
|
—
|
|
|
—
|
|
|||||||||
|
Settlement Loss
|
—
|
|
—
|
|
158.2
|
|
—
|
|
—
|
|
—
|
|
|||||||||||
|
Net periodic benefit cost
|
$
|
—
|
|
$
|
—
|
|
$
|
164.5
|
|
$
|
0.2
|
|
|
$
|
0.2
|
|
|
$
|
0.3
|
|
|||
|
International:
|
|||||||||||||||||||||||
|
Interest cost
|
$
|
3.8
|
|
$
|
4.3
|
|
$
|
4.2
|
|
||||||||||||||
|
Expected return on plan assets
|
(5.4
|
)
|
(5.5
|
)
|
(5.2
|
)
|
|||||||||||||||||
|
Net amortization
|
2.8
|
|
1.8
|
|
1.8
|
|
|
||||||||||||||||
|
Net periodic benefit cost
|
$
|
1.2
|
|
$
|
0.6
|
|
$
|
0.8
|
|
|
|||||||||||||
|
Other Changes in Plan Assets and Benefit Obligations Recognized in Other Comprehensive (Income):
|
|||||||||||||||
|
Pension Benefits
|
Post-Retirement Benefits
|
||||||||||||||
|
(In millions)
|
2016
|
2015
|
2016
|
2015
|
|||||||||||
|
Domestic:
|
|||||||||||||||
|
Net actuarial (gain) loss
|
$
|
—
|
|
$
|
—
|
|
$
|
(1.3
|
)
|
$
|
0.8
|
|
|||
|
Net amortization
|
—
|
|
—
|
|
—
|
|
—
|
|
|||||||
|
Total recognized in other comprehensive (income) loss
|
$
|
—
|
|
$
|
—
|
|
$
|
(1.3
|
)
|
$
|
0.8
|
|
|||
|
International:
|
|||||||||||||||
|
Net actuarial loss
|
$
|
2.2
|
|
$
|
11.8
|
|
|||||||||
|
Net amortization
|
(2.8
|
)
|
(1.8
|
)
|
|||||||||||
|
Total recognized in other comprehensive (income) loss
|
$
|
(0.6
|
)
|
$
|
10.0
|
|
|||||||||
The net actuarial loss, incl
uded in accumulated other comprehensive loss (pretax), expected to be recognized in net periodic benefit cost during fiscal 2017 is
$2.5 million
.
-
60
-
Actuarial Assumptions
The weighted-average actuarial assumptions used to determine the benefit obligation amounts and the net periodic benefit cost for the company's pension and post-retirement plans are as follows:
|
The weighted-average used in the determination of net periodic benefit cost:
|
|||||||||||
|
2016
|
2015
|
2014
|
|||||||||
|
(Percentages)
|
Domestic
|
International
|
Domestic
|
International
|
Domestic
|
International
|
|||||
|
Discount rate
|
3.41
|
|
3.50
|
|
3.44
|
|
4.40
|
|
3.43
|
|
4.40
|
|
Compensation increase rate
|
n/a
|
3.20
|
n/a
|
3.35
|
n/a
|
3.50
|
|||||
|
Expected return on plan assets
|
n/a
|
|
6.10
|
|
n/a
|
|
6.10
|
|
n/a
|
|
6.00
|
|
The weighted-average used in the determination of the projected benefit obligations:
|
|||||||||||
|
Discount rate
|
3.51
|
|
3.43
|
|
3.41
|
|
3.50
|
|
3.44
|
|
4.40
|
|
Compensation increase rate
|
n/a
|
|
2.95
|
|
n/a
|
|
3.20
|
|
n/a
|
|
3.35
|
Effective May 28, 2016, the company changed the method it uses to estimate the interest component of net periodic benefit cost for pension and other postretirement benefits. Historically, the company has estimated the interest cost component utilizing a single weighted-average discount rate derived from the yield curve used to measure the benefit obligation at the beginning of the period. The company has elected to utilize a full yield curve approach in the estimation of interest cost by applying the specific spot rates along the yield curve used in the determination of the benefit obligation to the relevant projected cash flows. The company has made this change to provide a more precise measurement of interest cost by improving the correlation between projected benefit cash flows to the corresponding spot yield curve rates. The company accounted for this change as a change in accounting estimate and accordingly will account for it prospectively. The company estimates the impact of this change on the consolidated earnings for fiscal 2017 will be a reduction of the interest cost component of net periodic benefit cost of approximately
$0.4 million
. For fiscal 2016, the use of the full yield curve approach did not impact how the company measured the total benefit obligations at year end or the annual net periodic benefit cost as any change in the interest cost component is completely offset by the actuarial gain or loss measured at year end, which is immediately recognized in the income statement. Accordingly, this change in estimate did not impact the Consolidated Statement of Comprehensive Income for the fiscal year ended May 28, 2016.
In calculating post-retirement benefit obligations for fiscal
2016
, a
7.9 percent
annual rate of increase in the per capita cost of covered healthcare benefits was assumed for 2016, decreasing gradually to
4.3 percent
by 2038 and remaining at that level thereafter. For purposes of calculating post-retirement benefit costs, a
7.1 percent
annual rate of increase in the per
capita cost of covered healthcare benefits was assumed for
2016
, decreasing gradually to
4.5 percent
by
2029 an
d remaining at that level thereafter.
Assumed health care cost-trend rates have a significant effect on the amounts reported for retiree health care costs. A one-percentage-point change in the assumed health care cost-trend rates would have the following effects:
|
(In millions)
|
1 Percent Increase
|
1 Percent Decrease
|
|||||
|
Effect on total fiscal 2016 service and interest cost components
|
$
|
—
|
|
$
|
—
|
|
|
|
Effect on post-retirement benefit obligation at May 28, 2016
|
$
|
0.2
|
|
|
$
|
(0.2
|
)
|
Plan Assets and Investment Strategies
The assets related to the company's primary domestic employee benefit plans were liquidated in connection with the plan termination that occurred during fiscal 2014. Accordingly, plan assets for the primary domestic employee benefit plans were
zero
as of the end of fiscal 2014.
The company's international employee benefit plan assets consist mainly of listed fixed income obligations and common/collective trusts. The company's primary objective for invested pension plan assets is to provide for sufficient long-term growth and liquidity to satisfy all of its benefit obligations over time. Accordingly, the company has developed an investment strategy that it believes maximizes the probability of meeting this overall objective. This strategy includes the development of a target investment allocation by asset category in order to provide guidelines for making investment decisions. This target allocation emphasizes the long-term characteristics of individual asset classes as well as the diversification among multiple asset classes. In developing its strategy, the company considered the need to balance the varying risks associated with each asset class with the long-term nature of its benefit obligations. The company's strategy moving forward will be to increase the level of fixed income investments as the funding status improves, thereby more closely matching the return on assets with the liabilities of the plans.
-
61
-
The company utilizes independent investment managers to assist with investment decisions within the overall guidelines of the investment strategy.
The target asset allocation at the end of fiscal 2016 and asset categories for the company's primary international pension plan for fiscal 2016 and 2015 is as follows:
|
Asset Category
|
Targeted Asset Allocation Percentage
|
Percentage of Plan Assets
at Year End
|
||||||||||
|
2016
|
2015
|
|||||||||||
|
Equities
|
—
|
—
|
2
|
|||||||||
|
Fixed Income
|
20
|
24
|
23
|
|||||||||
|
Common collective trusts
|
80
|
76
|
75
|
|||||||||
|
Total
|
100
|
100
|
||||||||||
|
(In millions)
|
International Plan as of May 31, 2016
|
|||||||||||
|
Asset Category
|
Level 1
|
Level 2
|
Total
|
|||||||||
|
Cash and cash equivalents
|
$
|
0.2
|
|
$
|
—
|
|
$
|
0.2
|
|
|||
|
Foreign government obligations
|
—
|
|
20.5
|
|
20.5
|
|
||||||
|
Common collective trusts-balanced
|
—
|
|
64.3
|
|
64.3
|
|
||||||
|
Total
|
$
|
0.2
|
|
$
|
84.8
|
|
$
|
85.0
|
|
|||
|
(In millions)
|
International Plan as of May 31, 2015
|
|||||||||||
|
Asset Category
|
Level 1
|
Level 2
|
Total
|
|||||||||
|
Cash and cash equivalents
|
$
|
1.8
|
|
|
|
$
|
1.8
|
|
||||
|
Foreign government obligations
|
—
|
|
21.3
|
|
21.3
|
|
||||||
|
Common collective trusts-balanced
|
|
|
68.9
|
|
68.9
|
|
||||||
|
Total
|
$
|
1.8
|
|
$
|
90.2
|
|
$
|
92.0
|
|
|||
Cash Flows
The company is reviewing whether any additional voluntary pension plan contributions will be made in the next year. Actual contributions will be dependent upon investment returns, changes in pension obligations, and other economic and regulatory factors. During fiscal 2016, the company made total cash contributions of
$1.2 million
to its benefit plans. In
fiscal 2015
, the company made total cash contributions of
$1.4 million
to its benefit plans.
The following represents a summary of the benefits expected to be paid by the plans in future fiscal years. These expected benefits were estimated based on the same actuarial valuation assumptions used to determine benefit obligations at
May 28, 2016
.
|
(In millions)
|
Pension Benefits Domestic
|
Pension Benefits International
|
Post-Retirement Benefits
|
||||||||
|
2017
|
$
|
0.1
|
|
|
$
|
2.5
|
|
|
$
|
0.7
|
|
|
2018
|
$
|
0.1
|
|
|
$
|
2.8
|
|
|
$
|
0.7
|
|
|
2019
|
$
|
0.1
|
|
|
$
|
2.6
|
|
|
$
|
0.7
|
|
|
2020
|
$
|
0.1
|
|
|
$
|
2.8
|
|
|
$
|
0.6
|
|
|
2021
|
$
|
0.1
|
|
|
$
|
3.5
|
|
|
$
|
0.6
|
|
|
2022-2026
|
$
|
0.3
|
|
|
$
|
18.7
|
|
|
$
|
2.1
|
|
Profit Sharing, 401(k) Plan, and Core Contribution
Substantially all of the company’s domestic employees are eligible to participate in a defined contribution retirement plan, primarily the Herman Miller, Inc. profit sharing and 401(k) plan. Employees under the Herman Miller, Inc. profit sharing plan are eligible to begin participating on their date of hire. The Profit Sharing plan provides for discretionary contributions for eligible participants, payable in the company's common stock, of not more than
6 percent
of employees' wages based on the company's financial performance. Under the Herman Miller, Inc. 401(k) plan the company matches
100 percent
of employee contributions to their 401(k) accounts up to
3 percent
of their pay. A core contribution of
4 percent
-
62
-
is also included for most participants of the plan. The company’s other defined contribution retirement plans may provide for matching contributions, non-elective contributions and discretionary contributions as declared by management.
The cost of the Herman Miller, Inc. profit sharing contribution during fiscal
2016
,
2015
, and
2014
was
$10.9 million
,
$4.8 million
and
$6.4 million
, respectively. The expense recorded for the company's 401(k) matching contributions and core contributions was approximately
$21.9 million
,
$20.8 million
, and
$20.3 million
in fiscal years
2016
,
2015
and
2014
, respectively.
8. Common Stock and Per Share Information
The following table reconciles the numerators and denominators used in the calculations of basic and diluted EPS for each of the last three fiscal years:
|
(In millions, except shares)
|
2016
|
2015
|
2014
|
||||||||
|
Numerator:
|
|
|
|||||||||
|
Numerator for both basic and diluted EPS, net earnings (loss)
|
$
|
136.7
|
|
|
$
|
97.5
|
|
|
$
|
(22.1
|
)
|
|
|
|||||||||||
|
Denominator:
|
|||||||||||
|
Denominator for basic EPS, weighted-average common shares outstanding
|
59,844,540
|
|
|
59,475,297
|
|
|
58,955,487
|
|
|||
|
Potentially dilutive shares resulting from stock plans
|
684,729
|
|
|
649,069
|
|
|
—
|
|
|||
|
Denominator for diluted EPS
|
60,529,269
|
|
|
60,124,366
|
|
|
58,955,487
|
|
|||
Equity awar
ds of
528,676 shares
,
715,685 shares
and
2,779,782 shares
of common stock were excluded from the denominator for the computation of diluted earnings per share for the fiscal years ended
May 28, 2016
,
May 30, 2015
, and
May 31, 2014
, respectively, because they were anti-dilutive. The company has certain share-based payment awards that meet the definition of participating securities. The company has evaluated the impact of all participating securities under the two-class method, noting there was
no
impact on EPS.
Common Stock
The company has a share repurchase plan authorized by the Board of Directors on September 28, 2007, which provided share repurchase authorization of
$300.0
million with no specified expiration date. During fiscal year 2016, 2015, and 2014, shares repurchased and retired totaled
482,040
,
121,488
and
408,391
shares respectively.
-
63
-
9. Stock-Based Compensation
The company utilizes equity-based compensation incentives as a component of its employee and non-employee director and officer compensation philosophy. Currently, these incentives consist principally of stock options, restricted stock, restricted stock units and performance share units. The company also offers a stock purchase plan for its domestic and certain international employees. The company issues shares in connection with its share-based compensation plans from authorized, but unissued, shares. At May 28, 2016 there were
3,991,307
shares authorized under the various stock-based compensation plans.
Valuation and Expense Information
The company measures the cost of employee services received in exchange for an award of equity instruments based on their grant-date fair market value. This cost is recognized over the requisite service period.
Certain of the company's equity-based compensation awards contain provisions that allow for continued vesting into retirement. Stock-based awards are considered fully vested for expense attribution purposes when the employee's retention of the award is no longer contingent on providing subsequent service.
The company classifies pre-tax stock-based compensation expense primarily within “Operating expenses” in the Consolidated Statements of Comprehensive Income. Pre-tax compensation expense and the related income tax benefit for all types of stock-based programs was as follows for the periods indicated:
|
(In millions)
|
May 28, 2016
|
May 30, 2015
|
May 31, 2014
|
|||||||||
|
Employee stock purchase program
|
$
|
0.3
|
|
$
|
0.3
|
|
$
|
0.3
|
|
|||
|
Stock option plans
|
1.9
|
|
2.6
|
|
2.3
|
|
||||||
|
Restricted stock grants
|
—
|
|
0.1
|
|
0.2
|
|
||||||
|
Restricted stock units
|
3.2
|
|
3.7
|
|
5.2
|
|
||||||
|
Performance share units
|
6.5
|
|
3.3
|
|
3.0
|
|
||||||
|
Total
|
$
|
11.9
|
|
$
|
10.0
|
|
$
|
11.0
|
|
|||
|
Tax benefit
|
$
|
4.3
|
|
$
|
3.6
|
|
$
|
4.0
|
|
|||
As of
May 28, 2016
, total pre-tax stock-based compensation cost not yet recognized related to non-vested awards was approximately
$9.7 million
. The weighted-average period over which this amount is expected to be recognized is
1.35
years.
The company estimated the fair value of employee stock options on the date of grant using the Black-Scholes model. In determining these values, the following weighted-average assumptions were used for the options granted during the fiscal years indicated.
|
2016
|
2015
|
2014
|
|||||||
|
Risk-free interest rates
(1)
|
1.51
|
%
|
|
1.46
|
%
|
|
1.62
|
%
|
|
|
Expected term of options
(2)
|
4.0 years
|
|
|
4.0 years
|
|
|
5.5 years
|
|
|
|
Expected volatility
(3)
|
33
|
%
|
|
36
|
%
|
|
46
|
%
|
|
|
Dividend yield
(4)
|
2.03
|
%
|
|
1.85
|
%
|
|
1.74
|
%
|
|
|
Weighted-average grant-date fair value of stock options:
|
|||||||||
|
Granted with exercise prices equal to the fair market value of the stock on the date of grant
|
6.73
|
|
7.74
|
|
10.68
|
|
|||
(1) Represents the U.S. Treasury yield over the same period as the expected option term.
(2) Represents the period of time that options granted are expected to be outstanding. Based on analysis of historical option exercise activity, the company has determined that all employee groups exhibit similar exercise and post-vesting termination behavior.
(3) Amount is determined based on analysis of historical price volatility of the company's common stock over a period equal to the expected term of the options.
(4) Represents the company's estimated cash dividend yield over the expected term of options.
-
64
-
Stock-based compensation expense recognized in the Consolidated Statements of Comprehensive Income, has been reduced for estimated forfeitures, as it is based on awards ultimately expected to vest. Forfeitures are estimated at the time of grant and revised, if necessary, in subsequent periods if actual forfeitures differ from those estimates. Forfeitures were estimated based on historical experience.
Employee Stock Purchase Program
Under the terms of the company's Employee Stock Purchase Plan,
4 million
shares of authorized common stock were reserved for purchase by plan participants at
85 percent
of the market price. Shares of common stock purchased under the employee stock purchase plan were
70,768
,
62,467
and
63,753
for the fiscal years ended 2016, 2015 and 2014 respectively.
Stock Option Plans
The company has stock option plans under which options to purchase the company's stock are granted to employees and non-employee directors at a price not less than the market price of the company's common stock on the date of grant. Under the current award program, all options become exercisable between
one
and
three years
from date of grant and expire
ten years
from date of grant. Most options are subject to graded vesting with the related compensation expense recognized on a straight-line basis over the requisite service period.
The following is a summary of the transactions under the company's stock option plans:
|
Shares Under Option
|
Weighted-Average Exercise Prices
|
Weighted-Average Remaining Contractual Term (Years)
|
Aggregate Intrinsic Value
(In millions)
|
||||||||||
|
Outstanding at May 30, 2015
|
1,302,623
|
|
$
|
26.05
|
|
4.0
|
$
|
4.7
|
|
||||
|
Granted at market
|
91,070
|
|
$
|
29.03
|
|
||||||||
|
Exercised
|
(288,470
|
)
|
$
|
23.15
|
|
||||||||
|
Forfeited or expired
|
(183,843
|
)
|
$
|
33.33
|
|
||||||||
|
Outstanding at May 28, 2016
|
921,380
|
|
$
|
25.80
|
|
|
4.2
|
|
5.5
|
|
|||
|
Ending vested + expected to vest
|
921,380
|
|
$
|
25.80
|
|
4.2
|
$
|
5.5
|
|
||||
|
Exercisable at end of period
|
764,060
|
|
$
|
25.06
|
|
3.3
|
$
|
5.1
|
|
||||
The total pre-tax intrinsic value of options exercised during fiscal
2016
,
2015
and
2014
was
$2.3 million
,
$2.4 million
, and
$6.2 million
, respectively. The aggregate intrinsic value in the preceding table represents the total pre-tax intrinsic value, based on the company's closing stock price as of the end of the period presented, which would have been received by the option holders had all option holders exercised in-the-money options as of that date. Total cash received during fiscal 2016 from the exercise of stock options was
$5.0 million
.
Restricted Stock Grants
The company periodically grants restricted common stock to certain key employees. Shares are granted in the name of the employee, who has all the rights of a shareholder, subject to certain restrictions on transferability and risk of forfeiture. The grants are subject to either cliff-based or graded vesting over a period not exceeding
five years
, and are subject to forfeiture if the employee ceases to be employed by the company for certain reasons. After the vesting period, the risk of forfeiture and restrictions on transferability lapse. The company recognizes the related compensation expense on a straight-line basis over the requisite service period. A summary of shares subject to restrictions are as follows:
|
2016
|
|||||||
|
Shares
|
Weighted Average Grant-Date Fair Value
|
||||||
|
Outstanding at May 30, 2015
|
50,323
|
|
|
$
|
20.80
|
|
|
|
Granted
|
—
|
|
$
|
—
|
|
||
|
Vested
|
(28,500
|
)
|
$
|
20.37
|
|
||
|
Forfeited
|
(1,000
|
)
|
$
|
21.71
|
|
||
|
Outstanding at May 28, 2016
|
20,823
|
|
|
$
|
21.35
|
|
|
-
65
-
The weighted-average remaining recognition period of the outstanding restricted stock grants at
May 28, 2016
, was
0.55
years. The fair value of the shares that vested during the twelve months ended
May 28, 2016
, was
$0.8 million
. There were no restricted stock grants granted during fiscal 2016, 2015 or 2014.
Restricted Stock Units
The company grants restricted stock units to certain key employees. This program provides that the actual number of restricted stock units awarded is based on the value of a portion of the participant's long-term incentive compensation divided by the fair value of the company's stock on the date of grant. In some years the awards have been partially tied to the company's financial performance for the year in which the grant was based. The awards generally cliff-vest after a
three
-year service period, with prorated vesting under certain circumstances and full or partial accelerated vesting upon retirement. Each restricted stock unit represents
one
equivalent share of the company's common stock to be awarded, free of restrictions, after the vesting period. Compensation expense related to these awards is recognized over the requisite service period, which includes any applicable performance period. Dividend equivalent awards are credited quarterly. The units do not entitle participants to the rights of stockholders of common stock, such as voting rights, until shares are issued after vesting.
The following is a summary of restricted stock unit transactions for the fiscal years indicated:
|
Share
Units
|
Weighted Average
Grant-Date
Fair Value
|
Aggregate Intrinsic Value in Millions
|
Weighted-Average
Remaining Contractual
Term (Years)
|
|||||||||
|
Outstanding at May 30, 2015
|
505,472
|
|
$
|
24.21
|
|
|
$
|
13.5
|
|
|
1.2
|
|
|
Granted
|
110,176
|
|
$
|
29.03
|
|
|
|
|||||
|
Forfeited
|
(17,321
|
)
|
$
|
27.09
|
|
|
|
|||||
|
Released
|
(220,466
|
)
|
$
|
19.97
|
|
|
|
|||||
|
Outstanding at May 28, 2016
|
377,861
|
|
$
|
27.83
|
|
|
$
|
12.0
|
|
|
1.4
|
|
|
Ending vested + expected to vest
|
377,861
|
|
27.83
|
|
|
$
|
10.8
|
|
|
1.4
|
||
The weighted-average remaining recognition period of the outstanding restricted stock units at
May 28, 2016
, was
1.09
years. The fair value of the share units that vested during the twelve months ended
May 28, 2016
, was
$6.4 million
. The weighted average grant-date fair value of restricted stock units granted during 2016, 2015, and 2014 was
$29.03
,
$30.38
, and
$28.55
respectively.
Performance Share Units
The company grants performance share units to certain key employees. The number of units initially awarded was based on the value of a portion of the participant's long-term incentive compensation, divided by the fair value of the company's common stock on the date of grant. Each unit represents
one
equivalent share of the company's common stock. The number of common shares ultimately issued in connection with these performance share units is determined based on the company's financial performance over the related
three
-year service period or the company's financial performance based on certain total shareholder return results as compared to a selected group of peer companies. Compensation expense is determined based on the grant-date fair value and the number of common shares projected to be issued, and is recognized over the requisite service period.
The following is a summary of performance share unit transactions for the fiscal years indicated:
|
Share
Units
|
Weighted Average Grant-Date Fair Value
|
Aggregate Intrinsic
Value in Millions
|
Weighted-Average
Remaining Contractual
Term (Years)
|
|||||||||
|
Outstanding at May 30, 2015
|
356,906
|
|
$
|
29.17
|
|
$
|
9.9
|
|
|
1.3
|
||
|
Granted
|
154,621
|
|
$
|
30.81
|
|
|
||||||
|
Forfeited
|
(21,988
|
)
|
$
|
20.64
|
|
|
||||||
|
Released
|
(55,825
|
)
|
$
|
17.10
|
|
|||||||
|
Outstanding at May 28, 2016
|
433,714
|
|
$
|
31.74
|
|
$
|
13.7
|
|
|
1.2
|
||
|
Ending vested + expected to vest
|
433,714
|
|
$
|
31.74
|
|
$
|
13.7
|
|
|
1.2
|
||
The weighted-average remaining recognition period of the outstanding performance share units at
May 28, 2016
, was
0.8
years. The fair value for shares that vested during the twelve months ended
May 28, 2016
, was
$1.6 million
. The weighted average grant-date fair value of performance share units granted during 2016, 2015, and 2014 was
$30.81
,
$32.71
, and
$31.66
respectively.
-
66
-
Herman Miller Consumer Holding Stock (HMCH) Option Plan
Certain employees were granted options to purchase stock of HMCH at a price not less than the market price of HMCH common stock on the date of grant. For the grants of options under the award program, options are potentially exercisable between
one year
and
five years
from date of grant and expire at the end of the window period that follows the fifth anniversary of the grant date. Vesting is based on the performance of HMCH over a period of
five years
. These options have been classified as liability awards as the holders have the right to put the underlying shares to the company immediately upon exercise. Given this, the awards are measured at fair value at the end of each reporting period and compensation expense is adjusted accordingly to reflect the fair value over the requisite service period. The company estimates the issuance date fair value of HMCH stock options on the date of grant using the Black-Scholes model. The expense for these awards was a benefit of
$0.3 million
during fiscal 2016 and the related liability for these awards was
$0.8 million
as of the end of fiscal 2016. The liability for the HMCH stock options is recorded within the Consolidated Balance Sheets within the "Other liabilities" line item.
The following weighted-average assumptions were used to value the liability associated with HMCH stock options as of May 28, 2016 and May 30, 2015.
|
2016
|
2015
|
||||||
|
Risk-free interest rates
(1)
|
1.07
|
%
|
0.99
|
%
|
|||
|
Expected term of options
(2)
|
3.1 years
|
|
3.2 years
|
|
|||
|
Expected volatility
(3)
|
35
|
%
|
35
|
%
|
|||
|
Dividend yield
|
not applicable
|
|
not applicable
|
|
|||
|
Strike price
|
$
|
24.39
|
|
24.39
|
|
||
|
Per share value
(4)
|
$
|
6.52
|
|
8.71
|
|
||
(1) Represents the U.S. Treasury yield over the same period as the expected option term.
(2) Represents the period of time that options granted are expected to be outstanding.
(3) Amount is determined based on analysis of historical price volatility of the common stock of peer companies over a period equal to the expected term of the options.
(4) Based on the Black-Scholes formula.
|
Shares Under Option
|
Weighted-Average Exercise Prices
|
Weighted-Average Remaining Contractual Term (Years)
|
Aggregate Intrinsic Value
(In millions)
|
||||||||||
|
Outstanding at May 30, 2015
|
504,669
|
|
$
|
23.92
|
|
|
4.2
|
$
|
2.1
|
|
|||
|
Granted
|
—
|
|
$
|
—
|
|
||||||||
|
Exercised
|
(4,293
|
)
|
$
|
6.12
|
|
||||||||
|
Forfeited
|
—
|
|
$
|
—
|
|
||||||||
|
Outstanding at May 28, 2016
|
500,376
|
|
$
|
24.07
|
|
3.2
|
$
|
0.4
|
|
||||
|
Exercisable at end of period
|
9,290
|
|
$
|
7.10
|
|
3.2
|
0.2
|
|
|||||
The total pre-tax intrinsic value of HMCH options exercised during fiscal
2016
was
$0.1 million
. The aggregate intrinsic value in the preceding table represents the total pre-tax intrinsic value, based on the HMCH market price, less the strike price, as of the end of the period presented, which would have been received by the option holders had all option holders exercised in-the-money options as of that date.
Deferred Compensation Plan
The Herman Miller, Inc. Executive Equalization Retirement Plan is a supplemental deferred compensation plan and was made available for salary deferrals and company contributions beginning in January 2008. The plan is available to a select group of management or highly compensated employees who are selected for participation by the Executive Compensation Committee of the Board of Directors. The plan allows participants to defer up to
50 percent
of their base salary and up to
100 percent
of their incentive cash bonus. Company contributions to the plan “mirror” the amounts the company would have contributed to the various qualified retirement plans had the employee's compensation not been above the IRS statutory ceiling (
$265,000
in
2016
). The company does not guarantee a rate of return for these funds. Instead, participants make investment elections for their deferrals and company contributions. Investment options are the same as those available under the Herman Miller Profit Sharing and 401(k) Plan, except for company stock, which is not an investment option under this plan.
In accordance with the terms of the Executive Equalization Plan, the salary and bonus deferrals and company contributions have been placed in a Rabbi trust. The assets in the Rabbi trust remain subject to the claims of creditors of the company and are not the property of the participant
-
67
-
and are, therefore, included as an asset on the company's Consolidated Balance Sheets within the "Other assets" line item. A liability of the same amount is recorded on the Consolidated Balance Sheets within the "Other liabilities" line item. Investment assets are classified as trading, and accordingly, realized and unrealized gains and losses are recognized within the company's Consolidated Statements of Comprehensive Income in the interest and other investment income line item. The associated changes to the liability are recorded as compensation expense within the "Selling, general and administrative" line item within the company's Consolidated Statements of Comprehensive Income. The net effect of any change to the asset and corresponding liability is offset and has no impact on the Consolidated Statements of Comprehensive Income.
Director Fees
Company directors may elect to receive their director fees in one or more of the following forms: cash, deferred compensation in the form of shares or other selected investment funds, unrestricted company stock at the market value at the date of election, or stock options that vest in
one year
and expire in
ten years
. The exercise price of the stock options granted may not be less than the market price of the company's common stock on the date of grant. Under the plan, the Board members received the following shares or options in the fiscal years indicated:
|
2016
|
2015
|
2014
|
|||||||
|
Shares of common stock
|
21,988
|
|
|
13,752
|
|
|
12,358
|
|
|
|
Shares through the deferred compensation program
|
3,118
|
|
|
—
|
|
|
2,317
|
|
|
10. Income Taxes
The components of earnings (loss) before income taxes are as follows:
|
(In millions)
|
2016
|
2015
|
2014
|
||||||||
|
Domestic
|
$
|
154.9
|
|
|
$
|
142.5
|
|
|
$
|
(45.1
|
)
|
|
Foreign
|
41.7
|
|
|
2.7
|
|
|
1.7
|
|
|||
|
Total
|
$
|
196.6
|
|
|
$
|
145.2
|
|
|
$
|
(43.4
|
)
|
The provision (benefit) for income taxes consists of the following:
|
(In millions)
|
2016
|
2015
|
2014
|
||||||||
|
Current: Domestic - Federal
|
$
|
36.4
|
|
|
$
|
43.6
|
|
|
$
|
22.2
|
|
|
Domestic - State
|
6.4
|
|
|
6.3
|
|
|
4.6
|
|
|||
|
Foreign
|
6.3
|
|
|
6.1
|
|
|
4.8
|
|
|||
|
49.1
|
|
|
56.0
|
|
|
31.6
|
|
||||
|
Deferred: Domestic - Federal
|
7.5
|
|
(5.9
|
)
|
(43.6
|
)
|
|||||
|
Domestic - State
|
0.2
|
|
(0.6
|
)
|
(5.6
|
)
|
|||||
|
Foreign
|
2.7
|
|
(2.3
|
)
|
(3.6
|
)
|
|||||
|
10.4
|
|
(8.8
|
)
|
(52.8
|
)
|
||||||
|
Total income tax provision
|
$
|
59.5
|
|
|
$
|
47.2
|
|
|
$
|
(21.2
|
)
|
The following table represents a reconciliation of income taxes at the United States statutory rate with the effective tax rate as follows:
-
68
-
|
(In millions)
|
2016
|
2015
|
2014
|
|||||||||
|
Income taxes computed at the United States Statutory rate of 35%
|
$
|
68.8
|
|
|
$
|
50.8
|
|
|
$
|
(15.2
|
)
|
|
|
Increase (decrease) in taxes resulting from:
|
||||||||||||
|
Change in unrecognized tax benefits
|
0.2
|
|
—
|
|
0.4
|
|
||||||
|
Foreign statutory rate differences
|
(4.3
|
)
|
(1.0
|
)
|
(0.9
|
)
|
||||||
|
Manufacturing deduction under the American Jobs Creation Act of 2004
|
(4.8
|
)
|
(4.8
|
)
|
(3.9
|
)
|
||||||
|
State taxes
|
5.2
|
|
4.2
|
|
(0.9
|
)
|
||||||
|
Tax on undistributed foreign earnings
|
—
|
|
(3.9
|
)
|
—
|
|
||||||
|
Sale of manufacturing facility in the United Kingdom
|
(1.6
|
)
|
—
|
|
—
|
|
||||||
|
Other, net
|
(4.0
|
)
|
1.9
|
|
(0.7
|
)
|
||||||
|
Income tax expense (benefit)
|
$
|
59.5
|
|
|
$
|
47.2
|
|
|
$
|
(21.2
|
)
|
|
|
Effective tax rate
|
30.3
|
%
|
32.6
|
%
|
48.9
|
%
|
||||||
The tax effects and types of temporary differences that give rise to significant components of the deferred tax assets and liabilities at
May 28, 2016
and
May 30, 2015
, are as follows:
|
(In millions)
|
2016
|
2015
|
||||||
|
Deferred tax assets:
|
|
|||||||
|
Compensation-related accruals
|
$
|
23.2
|
|
|
$
|
21.9
|
|
|
|
Accrued pension and post-retirement benefit obligations
|
9.2
|
|
|
11.0
|
|
|||
|
Deferred revenue
|
5.6
|
|
|
2.9
|
|
|||
|
Inventory related
|
3.8
|
|
|
6.4
|
|
|||
|
Reserves for uncollectible accounts and notes receivable
|
1.2
|
|
|
1.4
|
|
|||
|
Other reserves and accruals
|
3.0
|
|
3.6
|
|
||||
|
Warranty
|
15.7
|
|
|
14.0
|
|
|||
|
State and local tax net operating loss carryforwards and credits
|
5.7
|
|
|
5.7
|
|
|||
|
Federal net operating loss carryforward
|
7.1
|
|
|
12.2
|
|
|||
|
Foreign tax net operating loss carryforwards and credits
|
14.6
|
|
|
10.0
|
|
|||
|
Undistributed foreign earnings
|
—
|
|
4.5
|
|
||||
|
Other
|
4.7
|
|
|
4.4
|
|
|||
|
Subtotal
|
93.8
|
|
|
98.0
|
|
|||
|
Valuation allowance
|
(10.6
|
)
|
(11.1
|
)
|
||||
|
Total
|
$
|
83.2
|
|
$
|
86.9
|
|
||
|
|
||||||||
|
Deferred tax liabilities:
|
||||||||
|
Book basis in property in excess of tax basis
|
$
|
(24.8
|
)
|
$
|
(16.7
|
)
|
||
|
Intangible assets
|
(47.4
|
)
|
(44.5
|
)
|
||||
|
Other
|
(2.2
|
)
|
(3.6
|
)
|
||||
|
Total
|
$
|
(74.4
|
)
|
$
|
(64.8
|
)
|
||
The future tax benefits of net operating loss (NOL) carry-forwards and foreign tax credits are recognized to the extent that realization of these benefits is considered more likely than not. The company bases this determination on the expectation that related operations will be sufficiently profitable or various tax planning strategies will enable the company to utilize the NOL carry-forwards and/or foreign tax credits. To the extent that available evidence about the future raises doubt about the realization of these tax benefits, a valuation allowance is established.
At
May 28, 2016
, the company had state and local tax NOL carry-forwards of
$70.9 million
, the state tax benefit of which is
$5.2 million
, which have various expiration periods from
one
to
twenty-one
years. The company also had state credits with a state tax benefit of
$0.5 million
which expires in
4
to
six years
. For financial statement purposes, the NOL carry-forwards and state tax credits have been recognized as deferred tax assets, subject to a valuation allowance of
$2.1 million
.
At
May 28, 2016
, the company had federal NOL carry-forwards of
$20.4 million
, the tax benefit of which is
$7.1 million
, which expire in
12
to
13
years. For financial statement purposes, the NOL carry-forwards have been recognized as deferred tax assets.
-
69
-
At May 28, 2016, the company had federal deferred assets of
$1.5 million
, the tax benefit of which is
$0.5 million
, which is related to investments in various foreign joint ventures. For financial statement purposes, the assets have been recognized as deferred tax assets, subject to a valuation allowance of
$0.5 million
.
At
May 28, 2016
, the company had foreign net operating loss carry-forwards of
$49.2 million
, the tax benefit of which is
$10.9 million
, which have expiration periods from
seven
years to an unlimited term. The company also had foreign tax credits with a tax benefit of
$3.7 million
which expire in
one
to
eleven
years. For financial statement purposes, NOL carry-forwards and foreign tax credits have been recognized as deferred tax assets, subject to a valuation allowance of
$7.5 million
.
At
May 28, 2016
, the company had foreign deferred assets of
$2.7 million
, the tax benefit of which is
$0.5 million
, which is related to various deferred taxes in Hong Kong and buildings in the United Kingdom. For financial statement purposes, the assets have been recognized as deferred tax assets, subject to a valuation allowance of
$0.5 million
.
The company has not provided for United States income taxes on undistributed earnings of foreign subsidiaries totaling approximately
$117.2 million
. Recording deferred income taxes on these undistributed earnings is not required, because these earnings have been deemed to be indefinitely reinvested. These amounts would be subject to possible U.S. taxation only if remitted as dividends. The determination of the hypothetical amount of unrecognized deferred U.S. taxes on undistributed earnings of foreign entities is not practicable.
The components of the company's unrecognized tax benefits are as follows:
|
(In millions)
|
||||
|
Balance at May 31, 2014
|
$
|
1.8
|
|
|
|
Increases related to current year income tax positions
|
0.4
|
|
||
|
Increases related to prior year income tax positions
|
0.1
|
|
||
|
Decreases related to prior year income tax positions
|
(0.4
|
)
|
||
|
Decreases related to lapse of applicable statute of limitations
|
(0.1
|
)
|
||
|
Decreases related to settlements
|
—
|
|
||
|
Balance at May 30, 2015
|
1.8
|
|
||
|
Increases related to current year income tax positions
|
0.4
|
|
||
|
Increases related to prior year income tax positions
|
0.1
|
|
||
|
Decreases related to prior year income tax positions
|
(0.1
|
)
|
||
|
Decreases related to lapse of applicable statute of limitations
|
(0.1
|
)
|
||
|
Decreases related to settlements
|
(0.4
|
)
|
||
|
Balance at May 28, 2016
|
$
|
1.7
|
|
|
The company's effective tax rate would have been affected by the total amount of unrecognized tax benefits had this amount been recognized as a reduction to income tax expense.
The company recognizes interest and penalties related to unrecognized tax benefits through "Income tax expense (benefit)" in its Consolidated Statements of Comprehensive Income. Interest and penalties and the related liability, which are excluded from the table above, were as follows for the periods indicated:
|
(In millions)
|
May 28, 2016
|
May 30, 2015
|
May 31, 2014
|
||||||||
|
Interest and penalty expense (income)
|
$
|
(0.1
|
)
|
$
|
0.4
|
|
$
|
0.2
|
|
||
|
Liability for interest and penalties
|
$
|
0.7
|
|
$
|
0.9
|
|
|||||
The company is subject to periodic audits by domestic and foreign tax authorities. Currently, the company is undergoing routine periodic audits in both domestic and foreign tax jurisdictions. It is reasonably possible that the amounts of unrecognized tax benefits could change in the next 12 months as a result of new positions that may be taken on income tax returns, settlement of tax positions and the closing of statutes of limitation. It is not expected that any of the changes will be material to the company's Consolidated Statements of Comprehensive Income.
During the year, the company has closed the audit of fiscal year 2015 with the Internal Revenue Service under the Compliance Assurance Process (CAP). For the majority of the remaining tax jurisdictions, the company is no longer subject to state and local, or non-U.S. income tax examinations by tax authorities for fiscal years before 2013.
-
70
-
11. Fair Value of Financial Instruments
The company's financial instruments consist of cash equivalents, marketable securities, accounts and notes receivable, deferred compensation plan, accounts payable, debt, redeemable noncontrolling interests, and foreign currency exchange contracts. The company's financial instruments, other than long-term debt, are recorded at fair value. The carrying value and fair value of the company's long-term debt, including current maturities, is as follows for the periods indicated:
|
(In millions)
|
May 28, 2016
|
May 30, 2015
|
||||||
|
Carrying value
|
$
|
221.9
|
|
$
|
289.8
|
|
||
|
Fair value
|
$
|
241.7
|
|
$
|
315.1
|
|
||
The following describes the methods the company uses to estimate the fair value of financial assets and liabilities, of which there have been no significant changes in the current period:
Available-for-sale securities
— The company's available-for-sale marketable securities primarily include exchange traded and fixed income mutual funds, mortgage-backed debt securities, government obligations and corporate debt securities and are recorded at fair value using quoted prices for similar securities. During the third quarter of fiscal 2016, the company adjusted the investment portfolio from individual investments to mutual funds to more broadly diversify the asset base.
Foreign currency exchange contracts
— The company's foreign currency exchange contracts are valued using an approach based on foreign currency exchange rates obtained from active markets. The estimated fair value of forward currency exchange contracts is based on month-end spot rates as adjusted by current market-based activity.
Deferred compensation plan assets
— The company's deferred compensation plan assets primarily include domestic equity large cap and lifestyle mutual funds and are valued using quoted prices for similar securities.
The following tables set forth financial assets and liabilities measured at fair value in the Consolidated Balance Sheets and the respective pricing levels to which the fair value measurements are classified within the fair value hierarchy as of
May 28, 2016
and
May 30, 2015
:
|
(In millions)
|
Fair Value Measurements
|
||||||||||||
|
May 28, 2016
|
May 30, 2015
|
||||||||||||
|
Financial Assets
|
Quoted Prices With Other Observable Inputs (Level 2)
|
Management Estimates (Level 3)
|
Quoted Prices With Other Observable Inputs (Level 2)
|
Management Estimates (Level 3)
|
|||||||||
|
Available-for-sale securities:
|
|||||||||||||
|
Mutual funds - fixed income
|
$
|
6.4
|
|
$
|
—
|
|
$
|
—
|
|
$
|
—
|
|
|
|
Mutual funds - equity
|
0.7
|
|
—
|
|
—
|
|
—
|
|
|||||
|
Government obligations
|
0.4
|
|
—
|
|
4.4
|
|
—
|
|
|||||
|
Corporate debt securities
|
—
|
|
—
|
|
0.6
|
|
—
|
|
|||||
|
Asset-backed securities
|
—
|
|
—
|
|
0.2
|
|
—
|
|
|||||
|
Mortgage-backed securities
|
—
|
|
—
|
|
0.5
|
|
—
|
|
|||||
|
Foreign currency forward contracts
|
0.5
|
|
—
|
|
0.7
|
|
—
|
|
|||||
|
Deferred compensation plan
|
7.9
|
|
—
|
|
7.9
|
|
—
|
|
|||||
|
Total
|
$
|
15.9
|
|
$
|
—
|
|
$
|
14.3
|
|
$
|
—
|
|
|
|
Financial Liabilities
|
|||||||||||||
|
Foreign currency forward contracts
|
$
|
0.8
|
|
$
|
—
|
|
$
|
0.2
|
|
$
|
—
|
|
|
|
Contingent consideration
|
—
|
|
2.7
|
|
—
|
|
2.6
|
|
|||||
|
Total
|
$
|
0.8
|
|
$
|
2.7
|
|
$
|
0.2
|
|
$
|
2.6
|
|
|
-
71
-
The table below presents a reconciliation for liabilities measured at fair value using significant unobservable inputs (Level 3) (in millions):
|
(In millions)
|
||||||||
|
Contingent Consideration
|
May 28, 2016
|
May 30, 2015
|
||||||
|
Beginning balance
|
$
|
2.6
|
|
$
|
3.7
|
|
||
|
Net realized losses
|
—
|
|
1.1
|
|
||||
|
Foreign currency translation adjustments
|
(0.1
|
)
|
(0.4
|
)
|
||||
|
Settlements
|
(2.5
|
)
|
(1.8
|
)
|
||||
|
Purchases or additions
|
2.7
|
|
—
|
|
||||
|
Ending balance
|
$
|
2.7
|
|
$
|
2.6
|
|
||
The contingent consideration liabilities represent future payment obligations that relate to business and product line acquisitions. These payments are based on the future performance of the acquired businesses. The contingent consideration liabilities are valued using estimates based on discount rates that reflect the risk involved and the projected sales and earnings of the acquired businesses. The estimates are updated and the liabilities are adjusted to fair value on a quarterly basis.
The following is a summary of the carrying and market values of the company's marketable securities as of the dates indicated:
|
May 28, 2016
|
||||||||||||||||
|
(In millions)
|
Cost
|
Unrealized Gain
|
Unrealized Loss
|
Market Value
|
||||||||||||
|
Mutual funds - fixed income
|
$
|
6.4
|
|
$
|
—
|
|
$
|
—
|
|
$
|
6.4
|
|
||||
|
Mutual funds - equity
|
0.7
|
|
—
|
|
—
|
|
0.7
|
|
||||||||
|
Government obligations
|
0.4
|
|
—
|
|
—
|
|
0.4
|
|
||||||||
|
Total
|
$
|
7.5
|
|
|
$
|
—
|
|
|
$
|
—
|
|
$
|
7.5
|
|
||
|
May 30, 2015
|
||||||||||||||||
|
(In millions)
|
Cost
|
Unrealized Gain
|
Unrealized Loss
|
Market Value
|
|
|||||||||||
|
Asset-backed securities
|
$
|
0.2
|
|
|
$
|
—
|
|
|
$
|
—
|
|
|
$
|
0.2
|
|
|
|
Corporate debt securities
|
0.6
|
|
|
—
|
|
|
—
|
|
|
0.6
|
|
|||||
|
Government obligations
|
4.4
|
|
—
|
|
—
|
|
4.4
|
|
||||||||
|
Mortgage-backed securities
|
0.5
|
|
|
—
|
|
|
—
|
|
0.5
|
|
||||||
|
Total
|
$
|
5.7
|
|
|
$
|
—
|
|
|
$
|
—
|
|
$
|
5.7
|
|
||
Maturities of debt securities included in marketable securities as of
May 28, 2016
, are as follows:
|
(In millions)
|
Cost
|
Market
Value
|
||||||
|
Due within one year
|
$
|
0.4
|
|
$
|
0.4
|
|
||
|
Total
|
$
|
0.4
|
|
$
|
0.4
|
|
||
-
72
-
12. Supplemental Disclosures of Cash Flow Information
The following table presents the adjustments to reconcile net earnings to net cash provided by operating activities:
|
(In millions)
|
2016
|
2015
|
2014
|
|||||||||
|
Depreciation expense
|
$
|
47.0
|
|
$
|
44.2
|
|
|
$
|
37.8
|
|
||
|
Amortization expense
|
6.0
|
|
5.6
|
|
|
4.6
|
|
|||||
|
Provision for losses on accounts receivable and notes receivable
|
2.2
|
|
1.8
|
|
|
1.0
|
|
|||||
|
(Gain) Loss on sales of property and dealers
|
(5.8
|
)
|
—
|
|
(1.7
|
)
|
||||||
|
Deferred income tax expense (benefit)
|
10.4
|
|
(8.8
|
)
|
(52.8
|
)
|
||||||
|
Pension expense
|
1.4
|
|
0.8
|
|
115.4
|
|
||||||
|
Restructuring and impairment expenses
|
—
|
|
12.7
|
|
26.5
|
|
||||||
|
Stock-based compensation
|
11.9
|
|
10.0
|
|
11.0
|
|
||||||
|
Excess tax benefits from stock-based compensation
|
(1.4
|
)
|
(0.7
|
)
|
(1.1
|
)
|
||||||
|
Other changes in long-term liabilities
|
6.7
|
|
(1.2
|
)
|
(8.5
|
)
|
||||||
|
Other
|
0.5
|
|
1.7
|
|
1.2
|
|
||||||
|
Changes in current assets and liabilities:
|
||||||||||||
|
Accounts receivable
|
(30.5
|
)
|
7.8
|
|
(26.7
|
)
|
||||||
|
Inventories
|
(6.0
|
)
|
(9.0
|
)
|
(2.2
|
)
|
||||||
|
Prepaid expenses and other
|
(11.7
|
)
|
(2.5
|
)
|
(3.2
|
)
|
||||||
|
Accounts payable
|
8.7
|
|
1.1
|
|
2.6
|
|
||||||
|
Accrued liabilities
|
33.5
|
|
6.1
|
|
8.3
|
|
||||||
|
Total changes in current assets and liabilities
|
(6.0
|
)
|
3.5
|
|
(21.2
|
)
|
||||||
|
Total adjustments
|
$
|
72.9
|
|
$
|
69.6
|
|
|
$
|
112.2
|
|
||
13. Warranties, Guarantees, and Contingencies
Product Warranties
The company provides coverage to the end-user for parts and labor on products sold under its warranty policy and for other product-related matters. The standard length of warranty is
12 years
. However, this varies depending on the product classification. The company does not sell or otherwise issue warranties or warranty extensions as stand-alone products. Reserves have been established for various costs associated with the company's warranty program. General warranty reserves are based on historical claims experience and other currently available information and are periodically adjusted for business levels and other factors. Specific reserves are established once an issue is identified with the amounts for such reserves based on the estimated cost of correction. The beginning balances in the table below have been adjusted to reflect the immaterial error correction that is described in
Note 1 to t
he Consolidated Financial Statements.
Changes in the warranty reserve for the stated periods were as follows:
|
(In millions)
|
2016
|
2015
|
2014
|
|||||||||
|
Accrual balance, beginning
|
$
|
39.3
|
|
|
$
|
37.7
|
|
$
|
37.3
|
|
||
|
Accrual for warranty matters
|
25.5
|
|
|
25.0
|
|
20.2
|
|
|||||
|
Settlements
|
(20.9
|
)
|
(23.4
|
)
|
(19.8
|
)
|
||||||
|
Accrual balance, ending
|
$
|
43.9
|
|
|
$
|
39.3
|
|
$
|
37.7
|
|
||
Other Guarantees
The company is periodically required to provide performance bonds in order to conduct business with certain customers. These arrangements are common and generally have terms ranging between
one
and
three
years. The bonds are required to provide assurances to customers that the products and services they have purchased will be installed and/or provided properly and without damage to their facilities. The performance bonds are provided by various bonding agencies and the company is ultimately liable for claims that may occur against them. As of
May 28, 2016
, the company had a maximum financial exposure related to performance bonds of approximately
$8.2 million
. The company has no history of claims, nor is it aware of circumstances that would require it to perform under any
of these arrangements and believes that the resolution of
-
73
-
any claims that might arise in the future, either individually or in the aggregate, would not significantly affect the company's financial statements. Accordingly,
no
liability h
as been recorded as of
May 28, 2016
and
May 30, 2015
.
The company periodically enters into agreements in the normal course of business that may include indemnification clauses regarding patent or trademark infringement and service losses. Service losses represent all direct or consequential loss, liability, damages, costs, and expenses incurred by the customer or others resulting from services rendered by the company, the dealer, or certain sub-contractors, due to a proven negligent act. The company has no history of claims, nor is it aware of circumstances that would require it to perform under these arrangements and believes that the resolution of any claims that might arise in the future, either individually or in the aggregate, would not significantly affect the company's financial statements. Accordingly,
no
liability has been recorded as of
May 28, 2016
and
May 30, 2015
.
The company has entered into standby letter of credit arrangements for the purpose of protecting various insurance companies and lessors against default on insurance premium and lease payments. As of
May 28, 2016
, the company had a maximum financial exposure from these standby letters of credit of approximately
$8.7 million
, all of which is considered usage against the company's revolving credit facility. The company has no history of claims, nor is it aware of circumstances that would require it to perform under any of these arrangements and believes that the resolution of any claims that might arise in the future, either individually or in the aggregate, would not significantly affect the company's financial statements
. Accordingly,
no
liability
has been recorded as of
May 28, 2016
and
May 30, 2015
.
Contingencies
The company is also involved in legal proceedings and litigation arising in the ordinary course of business. In the opinion of management, the outcome of such proceedings and litigation currently pending will not materially affect the company's Consolidated Financial Statements.
As of the end of fiscal
2016
, outstanding commitments for future purchase obligations approximated
$42.2 million
.
14. Operating Segments
The company's reportable segments consist of North American Furniture Solutions, ELA ("EMEA, Latin America, and Asia Pacific") Furniture Solutions, Specialty, and Consumer. The North American Furniture Solutions reportable segment includes the operations associated with the design, manufacture, and sale of furniture products for work-related settings, including office, education, and healthcare environments, throughout the United States and Canada. ELA Furniture Solutions includes the operations associated with the design, manufacture, and sale of furniture products, primarily for work-related settings, in the EMEA, Latin America, and Asia-Pacific geographic regions. Specialty includes the operations associated with the design, manufacture, and sale of high-craft furniture products and textiles including Geiger wood products, Maharam textiles, and Herman Miller Collection products. The Consumer segment includes the operations associated with the sale of modern design furnishings and accessories to third party retail distributors, as well as direct to consumer sales through eCommerce and DWR studios. The company also reports a “Corporate” category consisting primarily of unallocated corporate expenses including restructuring, impairment, acquisition-related costs, and other unallocated corporate costs.
-
74
-
The performance of the operating segments is evaluated by the company's management using various financial measures. The following is a summary of certain key financial measures for the respective fiscal years indicated:
|
(In millions)
|
2016
|
2015
|
2014
|
|||||||||
|
Net Sales:
|
||||||||||||
|
North American Furniture Solutions
|
$
|
1,331.8
|
|
|
$
|
1,241.9
|
|
|
$
|
1,216.3
|
|
|
|
ELA Furniture Solutions
|
412.6
|
|
|
409.9
|
|
|
392.2
|
|
||||
|
Specialty
|
231.8
|
|
219.9
|
|
205.8
|
|
||||||
|
Consumer
|
288.7
|
|
270.5
|
|
67.7
|
|
||||||
|
Corporate
|
—
|
|
|
—
|
|
|
—
|
|
||||
|
Total
|
$
|
2,264.9
|
|
|
$
|
2,142.2
|
|
|
$
|
1,882.0
|
|
|
|
Depreciation and Amortization:
|
||||||||||||
|
North American Furniture Solutions
|
$
|
27.9
|
|
|
$
|
26.5
|
|
|
$
|
26.8
|
|
|
|
ELA Furniture Solutions
|
8.5
|
|
|
8.2
|
|
|
7.6
|
|
||||
|
Specialty
|
7.4
|
|
7.4
|
|
6.8
|
|
||||||
|
Consumer
|
8.6
|
|
7.3
|
|
1.2
|
|
||||||
|
Corporate
|
0.6
|
|
|
0.4
|
|
|
—
|
|
||||
|
Total
|
$
|
53.0
|
|
|
$
|
49.8
|
|
|
$
|
42.4
|
|
|
|
Operating Earnings (Losses):
|
||||||||||||
|
North American Furniture Solutions
|
$
|
152.0
|
|
|
$
|
125.2
|
|
|
$
|
(27.0
|
)
|
|
|
ELA Furniture Solutions
|
35.3
|
|
|
25.9
|
|
|
23.1
|
|
||||
|
Specialty
|
16.4
|
|
13.5
|
|
(5.3
|
)
|
||||||
|
Consumer
|
8.1
|
|
14.7
|
|
9.9
|
|
||||||
|
Corporate
|
(0.3
|
)
|
(15.9
|
)
|
(26.4
|
)
|
||||||
|
Total
|
$
|
211.5
|
|
|
$
|
163.4
|
|
|
$
|
(25.7
|
)
|
|
|
Capital Expenditures:
|
||||||||||||
|
North American Furniture Solutions
|
$
|
56.8
|
|
|
$
|
31.7
|
|
|
$
|
28.9
|
|
|
|
ELA Furniture Solutions
|
15.0
|
|
|
20.3
|
|
|
6.4
|
|
||||
|
Specialty
|
3.1
|
|
3.7
|
|
5.5
|
|
||||||
|
Consumer
|
10.2
|
|
7.9
|
|
—
|
|
||||||
|
Corporate
|
—
|
|
|
—
|
|
|
—
|
|
||||
|
Total
|
$
|
85.1
|
|
|
$
|
63.6
|
|
|
$
|
40.8
|
|
|
|
Total Assets:
|
||||||||||||
|
North American Furniture Solutions
|
$
|
531.7
|
|
|
$
|
504.5
|
|
|
$
|
461.5
|
|
|
|
ELA Furniture Solutions
|
218.4
|
|
|
235.4
|
|
|
244.8
|
|
||||
|
Specialty
|
147.3
|
|
151.6
|
|
157.7
|
|
||||||
|
Consumer
|
245.3
|
|
231.8
|
|
18.8
|
|
||||||
|
Corporate
|
92.5
|
|
|
69.4
|
|
|
112.6
|
|
||||
|
Total
|
$
|
1,235.2
|
|
|
$
|
1,192.7
|
|
|
$
|
995.4
|
|
|
|
Goodwill:
|
||||||||||||
|
North American Furniture Solutions
|
$
|
135.8
|
|
$
|
135.8
|
|
$
|
135.8
|
|
|||
|
ELA Furniture Solutions
|
40.9
|
|
41.9
|
|
42.6
|
|
||||||
|
Specialty
|
49.8
|
|
49.8
|
|
49.8
|
|
||||||
|
Consumer
|
78.8
|
|
75.6
|
|
—
|
|
||||||
|
Corporate
|
—
|
|
—
|
|
—
|
|
||||||
|
Total
|
$
|
305.3
|
|
$
|
303.1
|
|
$
|
228.2
|
|
|||
-
75
-
The accounting policies of the reportable operating segments are the same as those of the company. Additionally, the company employs a methodology for allocating corporate costs and assets with the underlying objective of this methodology being to allocate corporate costs according to the relative usage of the underlying resources and to allocate corporate assets according to the relative expected benefit. The majority of the allocations for corporate expenses are based on relative net sales. However, certain corporate costs, generally considered the result of isolated business decisions, are not subject to allocation and are evaluated separately from the rest of the regular ongoing business operations. For example, restructuring and impairment expenses that are reflected in operating earnings are allocated to the “Corporate” category. In addition, cash and cash equivalents and marketable securities are allocated to the “Corporate” category as the company views these as corporate assets.
The restructuring and asset impairment charges of
$12.7 million
and
$26.5 million
in fiscal 2015 and fiscal 2014, respectively, are discussed in Note 17 of the Consolidated Financial Statements and were allocated to the “Corporate” category.
The company's product offerings consist primarily of office furniture systems, seating, freestanding furniture, storage and casegoods. These product offerings are marketed, distributed, and managed primarily as a group of similar products on an overall portfolio basis. The following is a summary of net sales estimated by product category for the respective fiscal years indicated.
|
(In millions)
|
2016
|
2015
|
2014
|
|||||||||
|
Net Sales:
|
||||||||||||
|
Systems
|
$
|
656.8
|
|
|
$
|
563.4
|
|
|
$
|
571.6
|
|
|
|
Seating
|
855.5
|
|
|
805.5
|
|
|
658.2
|
|
||||
|
Freestanding and storage
|
456.9
|
|
|
484.1
|
|
|
386.4
|
|
||||
|
Other
(1)
|
295.7
|
|
|
289.2
|
|
|
265.8
|
|
||||
|
Total
|
$
|
2,264.9
|
|
|
$
|
2,142.2
|
|
|
$
|
1,882.0
|
|
|
(1) “Other” primarily consists of textiles or uncategorized product sales and service sales.
Sales by geographic area are based on the location of the customer. Long-lived assets consist of long-term assets of the company, excluding financial instruments, deferred tax assets, and long-term intangibles. The following is a summary of geographic information for the respective fiscal years indicated. Individual foreign country information is not provided as none of the individual foreign countries in which the company operates are considered material for separate disclosure based on quantitative and qualitative considerations.
|
(In millions)
|
2016
|
2015
|
2014
|
|||||||||
|
Net Sales:
|
||||||||||||
|
United States
|
$
|
1,757.0
|
|
|
$
|
1,640.6
|
|
|
$
|
1,406.3
|
|
|
|
International
|
507.9
|
|
|
501.6
|
|
|
475.7
|
|
||||
|
Total
|
$
|
2,264.9
|
|
|
$
|
2,142.2
|
|
|
$
|
1,882.0
|
|
|
|
(In millions)
|
2016
|
2015
|
2014
|
|||||||||
|
Long-lived assets:
|
||||||||||||
|
United States
|
$
|
254.8
|
|
|
$
|
224.2
|
|
|
$
|
177.0
|
|
|
|
International
|
48.1
|
|
|
53.8
|
|
|
35.4
|
|
||||
|
Total
|
$
|
302.9
|
|
|
$
|
278.0
|
|
|
$
|
212.4
|
|
|
The company estimates that no single dealer accounted for more than
5 percent
of the company's net sales in the fiscal year ended
May 28, 2016
. The company estimates that the largest single end-user customer, the U.S. federal government, accounted for
$88 million
,
$97 million
, and
$102 million
of the company's net sales in fiscal
2016
,
2015
, and
2014
, respectively. This represents approximately
4 percent
,
5 percent
and
5 percent
of the company's net sales in fiscal
2016
,
2015
, and
2014
, respectively.
Approximately
15.6 percent
of the company's employees are covered by collective bargaining agreements, most of whom are employees of its Nemschoff, Herman Miller Ningbo, and Herman Miller Dongguan subsidiaries.
-
76
-
15. Accumulated Other Comprehensive Loss
The following table provides an analysis of the changes in accumulated other comprehensive loss for the years ended
May 28, 2016
,
May 30, 2015
and
May 31, 2014
:
|
Year Ended
|
||||||||||||
|
(In millions)
|
May 28, 2016
|
May 30, 2015
|
May 31, 2014
|
|||||||||
|
Cumulative translation adjustments at beginning of period
|
$
|
(20.8
|
)
|
$
|
(11.1
|
)
|
$
|
(14.0
|
)
|
|||
|
Translation adjustments (net of tax of ($0.3), $0.3 and $ - )
|
(8.8
|
)
|
(9.7
|
)
|
2.9
|
|
||||||
|
Balance at end of period
|
(29.6
|
)
|
(20.8
|
)
|
(11.1
|
)
|
||||||
|
Pension and other post-retirement benefit plans at beginning of period
|
(35.4
|
)
|
(26.8
|
)
|
(110.3
|
)
|
||||||
|
Adjustments to pension and other post-retirement benefit plans (net of tax of ($0.7), $2.6 and $ - )
|
(2.0
|
)
|
(10.0
|
)
|
(3.1
|
)
|
||||||
|
Reclassification to earnings - cost of sales (net of tax of $ - , $ - , ($15.8))
|
—
|
|
—
|
|
27.6
|
|
||||||
|
Reclassification to earnings - operating expenses (net of tax of ($0.7), ($0.4), ($35.1))
|
2.5
|
|
1.4
|
|
59.0
|
|
||||||
|
Balance at end of period
|
(34.9
|
)
|
(35.4
|
)
|
(26.8
|
)
|
||||||
|
Total accumulated other comprehensive loss
|
$
|
(64.5
|
)
|
$
|
(56.2
|
)
|
$
|
(37.9
|
)
|
|||
16. Redeemable Noncontrolling Interests
Redeemable noncontrolling interests are reported on the Consolidated Balance Sheets in mezzanine equity in “Redeemable noncontrolling interests.” The company recognizes changes to the redemption value of redeemable noncontrolling interests as they occur and adjusts the carrying value to equal the redemption value at the end of each reporting period accordingly. The redemption amounts have been estimated based on the fair value of the subsidiary, determined based on a weighting of the discounted cash flow and market methods. This represents a level 3 fair value measurement.
Changes in the company’s Redeemable noncontrolling interests for the years ended
May 28, 2016
and
May 30, 2015
are as follows:
|
Year Ended
|
||||||||
|
(In millions)
|
May 28, 2016
|
May 30, 2015
|
||||||
|
Balance at beginning of period
|
$
|
30.4
|
|
$
|
—
|
|
||
|
Increase due to business combinations
|
—
|
|
25.7
|
|
||||
|
Net income attributable to redeemable noncontrolling interests
|
0.5
|
|
0.5
|
|
||||
|
Exercised options
|
—
|
|
0.7
|
|
||||
|
Redemption value adjustment
|
(4.0
|
)
|
3.3
|
|
||||
|
Other adjustments
|
0.1
|
|
0.2
|
|
||||
|
Balance at end of period
|
$
|
27.0
|
|
$
|
30.4
|
|
||
17. Restructuring and Impairment Activities
2015 Restructuring and Impairment Charges
The company recognized asset impairment expense totaling
$10.8 million
associated with the POSH trade name for the fiscal year 2015. Although profitability associated with the POSH trade name increased as compared to the prior year, forecasts developed during the fourth quarter of fiscal 2015 indicated that future revenue and profitability no longer supported the value of the trade name intangible asset.
The company also recognized restructuring expenses of
$1.9 million
during the third quarter of fiscal 2015 related to targeted workforce reductions within the North American segment. These actions resulted in the recognition of restructuring expenses related to severance and outplacement costs.
2014 Restructuring and Impairment Charges
The company recognized asset impairment expense totaling
$21.4 million
associated with the Nemschoff and POSH trade names for the fiscal year 2014. The company also recognized restructuring expense of
$1.1 million
during the third quarter of fiscal 2014. This restructuring
-
77
-
was related to actions taken to improve the efficiency of the North American sales and distribution channel and Geiger manufacturing operations. These actions focused primarily on targeted workforce reductions.
Due to the acquisition of a manufacturing and distribution operation in Dongguan, China in the second quarter of 2014, the company decided not to pursue the construction of a new manufacturing and distribution facility on property that it previously acquired in Ningbo, China. In connection with this decision, the company evaluated the fair value of this property and recorded an asset impairment of
$4.0 million
during the second quarter of fiscal 2014. This impairment charge was recorded to the "Restructuring and impairment expenses" line item within the Consolidated Statements of Comprehensive Income. The impairment charge is included within the "Corporate" category within the segment reporting.
These charges have been reflected separately as "Restructuring and impairment expenses" in the Consolidated Statements of Comprehensive Income and are included in the "Corporate" category within the segment reporting within Note 14 .
18. Subsequent Event
On June 3, 2016, the company entered into a strategic partnership with Naughtone Holdings Limited, a leader in soft seating products, stools, occasional and meeting tables. As part of this arrangement, the company acquired a noncontrolling equity interest in Naughtone Holdings Limited for
£8 million
(
$11.6 million
) in cash consideration.
19. Quarterly Financial Data (Unaudited)
Set forth below is a summary of the quarterly operating results on a consolidated basis for the years ended
May 28, 2016
,
May 30, 2015
, and
May 31, 2014
.
|
(In millions, except per share data)
|
First
Quarter
|
Second
Quarter
|
Third
Quarter
|
Fourth
Quarter
|
||||||||||||
|
2016
|
Net sales
|
$
|
565.4
|
|
|
$
|
580.4
|
|
$
|
536.5
|
|
$
|
582.6
|
|
||
|
Gross margin
|
216.8
|
|
|
224.4
|
|
207.8
|
|
225.2
|
|
|||||||
|
Net earnings attributable to Herman Miller, Inc.
(1)
|
33.5
|
|
|
34.7
|
|
27.9
|
|
40.7
|
|
|||||||
|
Earnings per share-basic
|
0.56
|
|
|
0.58
|
|
0.46
|
|
0.68
|
|
|||||||
|
Earnings per share-diluted
|
0.56
|
|
|
0.57
|
|
0.46
|
|
0.67
|
|
|||||||
|
2015
|
Net sales
|
$
|
509.7
|
|
|
$
|
565.4
|
|
|
$
|
516.4
|
|
$
|
550.7
|
|
|
|
Gross Margin
|
185.6
|
|
|
205.7
|
|
|
190.5
|
|
209.6
|
|
||||||
|
Net earnings attributable to Herman Miller, Inc.
(1)
|
25.2
|
|
|
27.8
|
|
|
21.0
|
|
23.4
|
|
||||||
|
Earnings per share-basic
|
0.43
|
|
|
0.47
|
|
|
0.35
|
|
0.39
|
|
||||||
|
Earnings per share-diluted
|
0.42
|
|
|
0.46
|
|
|
0.35
|
|
0.39
|
|
||||||
|
2014
|
Net sales
|
$
|
468.1
|
|
|
$
|
470.5
|
|
|
$
|
455.9
|
|
$
|
487.5
|
|
|
|
Gross margin
(1)
|
170.0
|
|
|
118.9
|
|
|
162.9
|
|
179.1
|
|
||||||
|
Net earnings (loss) attributable to Herman Miller, Inc.
|
22.5
|
|
|
(80.6
|
)
|
|
19.4
|
|
16.6
|
|
||||||
|
Earnings (loss) per share-basic
(1)
|
0.38
|
|
|
(1.37
|
)
|
|
0.33
|
|
0.28
|
|
||||||
|
Earnings (loss) per share-diluted
(1)
|
0.38
|
|
|
(1.37
|
)
|
|
0.33
|
|
0.28
|
|
||||||
(1) The sum of the quarters does not equal the annual balance reflected in the Consolidated Statements of Comprehensive Income due to rounding associated with the calculations on an individual quarter basis.
-
78
-
Management's Report on Internal Control over Financial Reporting
To the Board of Directors and Stockholders of Herman Miller, Inc.
Our management is responsible for establishing and maintaining adequate internal control over financial reporting, as defined in Exchange Act Rules 13a-15(f). The internal control over financial reporting at Herman Miller, Inc., is designed to provide reasonable assurance to our stakeholders that the financial statements of the company fairly represent its financial condition and results of operations.
Because of its inherent limitations, a system of internal control over financial reporting can provide only reasonable assurance and may not prevent or detect all misstatements. Further, because of changes in conditions, effectiveness of internal control over financial reporting may vary over time.
Under the supervision and with the participation of management, including our Chief Executive Officer and Chief Financial Officer, we conducted an assessment of the effectiveness of our internal control over financial reporting as of
May 28, 2016
, based on the original framework in
Internal Control — Integrated Framework (2013 Framework)
issued by the Committee of Sponsoring Organizations of the Treadway Commission. Based on this assessment, our management believes the company's internal control over financial reporting was effective as of
May 28, 2016
.
Ernst & Young LLP has issued an attestation report on the effectiveness of our internal control over financial reporting, which is included herein.
/s/ Brian C. Walker
Brian C. Walker
Chief Executive Officer
/s/ Jeffrey M. Stutz
Jeffrey M. Stutz
Chief Financial Officer
-
79
-
Report of Independent Registered Public Accounting Firm
To the Board of Directors and Stockholders of Herman Miller, Inc.
We have audited Herman Miller, Inc.’s internal control over financial reporting as of May 28, 2016, based on criteria established in Internal Control-Integrated Framework issued by the Committee of Sponsoring Organizations of the Treadway Commission (2013 framework) (the COSO criteria). Herman Miller, Inc.’s management is responsible for maintaining effective internal control over financial reporting, and for its assessment of the effectiveness of internal control over financial reporting included in the accompanying Management’s Report on Internal Control over Financial Reporting. Our responsibility is to express an opinion on the company’s internal control over financial reporting based on our audit.
We conducted our audit in accordance with the standards of the Public Company Accounting Oversight Board (United States). Those standards require that we plan and perform the audit to obtain reasonable assurance about whether effective internal control over financial reporting was maintained in all material respects. Our audit included obtaining an understanding of internal control over financial reporting, assessing the risk that a material weakness exists, testing and evaluating the design and operating effectiveness of internal control based on the assessed risk, and performing such other procedures as we considered necessary in the circumstances. We believe that our audit provides a reasonable basis for our opinion.
A company’s internal control over financial reporting is a process designed to provide reasonable assurance regarding the reliability of financial reporting and the preparation of financial statements for external purposes in accordance with generally accepted accounting principles. A company’s internal control over financial reporting includes those policies and procedures that (1) pertain to the maintenance of records that, in reasonable detail, accurately and fairly reflect the transactions and dispositions of the assets of the company; (2) provide reasonable assurance that transactions are recorded as necessary to permit preparation of financial statements in accordance with generally accepted accounting principles, and that receipts and expenditures of the company are being made only in accordance with authorizations of management and directors of the company; and (3) provide reasonable assurance regarding prevention or timely detection of unauthorized acquisition, use, or disposition of the company’s assets that could have a material effect on the financial statements.
Because of its inherent limitations, internal control over financial reporting may not prevent or detect misstatements. Also, projections of any evaluation of effectiveness to future periods are subject to the risk that controls may become inadequate because of changes in conditions, or that the degree of compliance with the policies or procedures may deteriorate.
In our opinion, Herman Miller, Inc. maintained, in all material respects, effective internal control over financial reporting as of
May 28, 2016
, based on the COSO criteria.
We also have audited, in accordance with the standards of the Public Company Accounting Oversight Board (United States), the fiscal 2016 consolidated financial statements of Herman Miller, Inc., and our report dated July 26, 2016 expressed an unqualified opinion thereon.
/s/ Ernst & Young LLP
Grand Rapids, Michigan
July 26, 2016
-
80
-
Report of Independent Registered Public Accounting Firm
To the Board of Directors and Stockholders of Herman Miller, Inc.
We have audited the accompanying consolidated balance sheets of Herman Miller, Inc. as of
May 28, 2016
and
May 30, 2015
, and the related consolidated statements of comprehensive income, stockholders' equity, and cash flows for each of the three fiscal years in the period ended
May 28, 2016
. These financial statements are the responsibility of the Company's management. Our responsibility is to express an opinion on these financial statements based on our audits.
We conducted our audits in accordance with the standards of the Public Company Accounting Oversight Board (United States). Those standards require that we plan and perform the audit to obtain reasonable assurance about whether the financial statements are free of material misstatement. An audit includes examining, on a test basis, evidence supporting the amounts and disclosures in the financial statements. An audit also includes assessing the accounting principles used and significant estimates made by management, as well as evaluating the overall financial statement presentation. We believe that our audits provide a reasonable basis for our opinion.
In our opinion, the financial statements referred to above present fairly, in all material respects, the consolidated financial position of Herman Miller, Inc. at
May 28, 2016
and
May 30, 2015
, and the consolidated results of its operations and its cash flows for each of the three years in the period ended
May 28, 2016
, in conformity with U.S. generally accepted accounting principles.
We also have audited, in accordance with the standards of the Public Company Accounting Oversight Board (United States), Herman Miller, Inc.'s internal control over financial reporting as of
May 28, 2016
, based on criteria established in Internal Control-Integrated Framework issued by the Committee of Sponsoring Organizations of the Treadway Commission (2013 framework) and our report dated July 26, 2016 expressed unqualified opinion thereon.
/s/ Ernst & Young LLP
Grand Rapids, Michigan
July 26, 2016
-
81
-
None
|
(a)
|
Disclosure Controls and Procedures.
Under the supervision and with the participation of management, the company's Chief Executive Officer and Chief Financial Officer have evaluated the effectiveness of the company's disclosure controls and procedures (as defined in Exchange Act Rules 13a-15(e) and 15d-15(e)) as of May 28, 2016 and have concluded that as of that date, the company's disclosure controls and procedures were effective.
|
|
(b)
|
Management's Annual Report on Internal Control Over Financial Reporting and Attestation Report of the Independent Registered Public Accounting Firm.
Refer to Item 8 for “Management's Report on Internal Control Over Financial Reporting.” The effectiveness of the company's internal control over financial reporting has been audited by Ernst and Young LLP, an independent registered accounting firm, as stated in its report included in Item 8.
|
|
(c)
|
Changes in Internal Control Over Financial Reporting.
There were no changes in the company's internal control over financial reporting during the fourth quarter ended May 28, 2016, that have materially affected, or are reasonably likely to materially affect, our internal control over financial reporting.
|
None
-
82
-
Directors, Executive Officers, Promoters and Control Persons
Information relating to directors and director nominees of the registrant is contained under the caption “Director and Executive Officer Information” in the company's definitive Proxy Statement, relating to the company's
2016
Annual Meeting of Stockholders, and the information within that section is incorporated by reference. Information relating to Executive Officers of the company is included in Part I hereof entitled “Executive Officers of the Registrant.”
Compliance with Section 16(a) of the Exchange Act
Information relating to compliance with Section 16(a) of the Exchange Act is contained under the caption “Section 16(a) Beneficial Ownership Reporting Compliance” in the company's definitive Proxy Statement, relating to the company's
2016
Annual Meeting of Stockholders, and the information within that section is incorporated by reference.
Code of Ethics
The company has adopted a Code of Conduct that serves as the code of ethics for the executive officers and senior financial officers and as the code of business conduct for all directors and employees of the registrant. This code is made available free of charge through the “Investors” section of the company's internet website at
www.hermanmiller.com
. Any amendments to, or waivers from, a provision of this code also will be posted to the company's internet website.
Corporate Governance
Information relating to the identification of the audit committee, audit committee financial expert, and director nomination procedures of the registrant is contained under the captions “Board Committees” and “Corporate Governance and Board Matters — Director Nominations” in the company's definitive Proxy Statement, relating to the company's
2016
Annual Meeting of Stockholders, and the information within these sections is incorporated by reference.
Information relating to management remuneration is contained under the captions “Compensation Discussion and Analysis,” “Summary Compensation Table,” “Grants of Plan-Based Awards,” “Outstanding Equity Awards at Fiscal Year-End,” “Option Exercises and Stock Vested,” “Pension Benefits,” “Nonqualified Deferred Compensation,” “Potential Payments Upon Termination, Death, Disability, Retirement or Change in Control,” “Director Compensation,” “Director Compensation Table,” and “Compensation Committee Interlocks and Insider Participation” in the company's definitive Proxy Statement, relating to the company's
2016
Annual Meeting of Stockholders, and the information within these sections is incorporated by reference. The information under the caption “Compensation Committee Report” is incorporated by reference, however, such information is not deemed filed with the Commission.
The sections entitled “Voting Securities and Principal Stockholders,” “Director and Executive Officer Information,” and “Equity Compensation Plan Information” in the definitive Proxy Statement, relating to the company's
2016
Annual Meeting of Stockholders, and the information within these sections is incorporated by reference.
Information concerning certain relationships and related transactions contained under the captions “Related Person Transactions,” and “Corporate Governance and Board Matters — Determination of Independence of Board Members” in the definitive Proxy Statement, relating to the company's
2016
Annual Meeting of Stockholders and the information within these sections is incorporated by reference.
Information concerning the payments to our principal accountants and the services provided by our principal accounting firm set forth under the caption “Disclosure of Fees Paid to Independent Auditors” in the Definitive Proxy Statement, relating to the company's
2016
Annual Meeting of Stockholders, and the information within that section is incorporated by reference.
-
83
-
|
(a)
|
The following documents are filed as a part of this report:
|
|||
|
1.
|
Financial Statements
|
|||
|
The following Consolidated Financial Statements of the company are included in this Form 10-K on the pages noted:
|
||||
|
Page Number in
this Form 10-K
|
||||
|
Consolidated Statements of Comprehensive Income
|
||||
|
Consolidated Balance Sheets
|
||||
|
Consolidated Statements of Stockholders' Equity
|
||||
|
Consolidated Statements of Cash Flows
|
||||
|
Notes to the Consolidated Financial Statements
|
||||
|
Management's Report on Internal Control over Financial Reporting
|
||||
|
Report of Independent Registered Public Accounting Firm on Internal Control Over Financial Reporting
|
||||
|
Report of Independent Registered Public Accounting Firm on Financial Statements
|
||||
|
2.
|
Financial Statement Schedule
|
|||
|
The following financial statement schedule and related Report of Independent Public Accountants on the Financial Statement Schedule are included in this Form 10-K on the pages noted:
|
||||
|
Page Number in
this Form 10-K
|
||||
|
Report of Independent Registered Public Accounting Firm on Financial Statement Schedule
|
||||
|
|
||||
|
Schedule II-
|
Valuation and Qualifying Accounts and Reserves for the Years Ended May 28, 2016, May 30, 2015, and May 31, 2014
|
|||
|
All other schedules required by Form 10-K Annual Report have been omitted because they were not applicable, included in the Notes to the Consolidated Financial Statements, or otherwise not required under instructions contained in Regulation S-X.
|
||||
|
3.
|
Exhibits
|
|||
|
Reference is made to the Exhibit Index which is included on pages 89-91.
|
||||
-
84
-
SIGNATURES
Pursuant to the requirements of Section 13 or 15(d) of the Securities Exchange Act of 1934, the Registrant has duly caused this report to be signed on its behalf by the undersigned, thereunto duly authorized.
|
HERMAN MILLER, INC.
|
||||||
|
/s/ Jeffrey M. Stutz
|
||||||
|
By
|
Jeffrey M. Stutz
Chief Financial Officer (Principal Accounting Officer and Duly Authorized Signatory for Registrant) |
|
||||
Date:
July 26, 2016
Pursuant to the requirements of the Securities Exchange Act of 1934, this report has been signed below on,
July 26, 2016
by the following persons on behalf of the Registrant in the capacities indicated. Each Director of the Registrant, whose signature appears below, hereby appoints Brian C. Walker as his attorney-in-fact, to sign in his or her name and on his or her behalf, as a Director of the Registrant, and to file with the Commission any and all amendments to this Report on Form 10-K.
-
85
-
|
/s/ Michael A. Volkema
|
/s/ Lisa Kro
|
|||
|
Michael A. Volkema
(Chairman of the Board)
|
Lisa Kro
(Director)
|
|||
|
/s/ David O. Ulrich
|
/s/ Mary Vermeer Andringa
|
|||
|
David O. Ulrich
(Director)
|
Mary Vermeer Andringa
(Director)
|
|||
|
/s/ Dorothy A. Terrell
|
/s/ John R. Hoke III
|
|||
|
Dorothy A. Terrell
(Director)
|
John R. Hoke III
(Director)
|
|||
|
/s/ David A. Brandon
|
/s/ J. Barry Griswell
|
|||
|
David A. Brandon
(Director)
|
J. Barry Griswell
(Director)
|
|||
|
/s/ Douglas D. French
|
/s/ Brian C. Walker
|
|||
|
Douglas D. French
(Director)
|
Brian C. Walker
(President, Chief Executive Officer, and Director)
|
|||
|
/s/ Heidi Manheimer
|
/s/ Jeffrey M. Stutz
|
|||
|
Heidi Manheimer
(Director) |
Jeffrey M. Stutz
(Chief Financial Officer and Principal Accounting Officer)
|
|||
|
/s/ Brenda Freeman
|
||||
|
Brenda Freeman (Director)
|
||||
-
86
-
Report of Independent Registered Public Accounting Firm
To the Board of Directors and Shareholders of Herman Miller, Inc.
We have audited the consolidated financial statements of Herman Miller, Inc. as of May 28, 2016 and May 30, 2015, and for each of the three years in the period ended May 28, 2016, and have issued our report thereon dated July 26, 2016 (included elsewhere in this Form 10K). Our audits also included the financial statement schedule listed in Item 15(a) of this Form 10-K. This schedule is the responsibility of the Company's management. Our responsibility is to express an opinion on this schedule based on our audits.
In our opinion, the financial statement schedule referred to above, when considered in relation to the basic financial statements taken as a whole, presents fairly in all material respects the information set forth therein.
/s/ Ernst & Young LLP
Grand Rapids, Michigan
July 26, 2016
-
87
-
SCHEDULE II — VALUATION AND QUALIFYING ACCOUNTS
(In millions)
|
Column A
|
Column B
|
Column C
|
Column D
|
Column E
|
|||||||||||
|
Description
|
Balance at beginning of period
|
Charges to expenses or net sales
|
Deductions
(3)
|
Balance at end of period
|
|||||||||||
|
Year ended May 28, 2016:
|
|
|
|||||||||||||
|
Accounts receivable allowances — uncollectible accounts
(1)
|
$
|
2.4
|
|
|
$
|
2.3
|
|
$
|
(1.3
|
)
|
$
|
3.4
|
|
||
|
|
|||||||||||||||
|
Accounts receivable allowances — credit memo
(2)
|
$
|
0.4
|
|
|
$
|
—
|
|
$
|
—
|
|
$
|
0.4
|
|
||
|
|
|||||||||||||||
|
Allowance for possible losses on notes receivable
|
$
|
1.0
|
|
|
$
|
(0.1
|
)
|
$
|
—
|
|
$
|
0.9
|
|
||
|
|
|||||||||||||||
|
Valuation allowance for deferred tax asset
|
$
|
11.1
|
|
|
$
|
(1.5
|
)
|
$
|
1.0
|
|
$
|
10.6
|
|
||
|
|
|||||||||||||||
|
Year ended May 30, 2015:
|
|
|
|||||||||||||
|
Accounts receivable allowances — uncollectible accounts
(1)
|
$
|
3.4
|
|
|
$
|
0.9
|
|
$
|
(1.9
|
)
|
$
|
2.4
|
|
||
|
|
|||||||||||||||
|
Accounts receivable allowances — credit memo
(2)
|
$
|
0.6
|
|
|
$
|
—
|
|
$
|
(0.2
|
)
|
$
|
0.4
|
|
||
|
|
|||||||||||||||
|
Allowance for possible losses on notes receivable
|
$
|
0.1
|
|
|
$
|
0.9
|
|
$
|
—
|
|
$
|
1.0
|
|
||
|
|
|||||||||||||||
|
Valuation allowance for deferred tax asset
|
$
|
8.5
|
|
|
$
|
(0.6
|
)
|
$
|
3.2
|
|
$
|
11.1
|
|
||
|
|
|||||||||||||||
|
Year ended May 31, 2014:
|
|||||||||||||||
|
Accounts receivable allowances — uncollectible accounts
(1)
|
$
|
3.9
|
|
|
$
|
1.0
|
|
$
|
(1.5
|
)
|
$
|
3.4
|
|
||
|
|
|||||||||||||||
|
Accounts receivable allowances — credit memo
(2)
|
$
|
0.5
|
|
|
$
|
0.1
|
|
$
|
—
|
|
$
|
0.6
|
|
||
|
|
|||||||||||||||
|
Allowance for possible losses on notes receivable
|
$
|
0.2
|
|
|
$
|
—
|
|
$
|
(0.1
|
)
|
$
|
0.1
|
|
||
|
|
|||||||||||||||
|
Valuation allowance for deferred tax asset
|
$
|
9.9
|
|
|
$
|
(1.8
|
)
|
$
|
0.4
|
|
$
|
8.5
|
|
||
(1) Activity under the “Charges to expense or net sales” column are recorded within selling, general and administrative expenses.
(2) Activity under the “Charges to expenses or net sales” column are recorded within net sales.
(3) Represents amounts written off, net of recoveries and other adjustments. Includes effects of foreign translation.
-
88
-
EXHIBIT INDEX
|
|
(3)
|
Articles of Incorporation and Bylaws
|
|
|
(a)
|
Restated Articles of Incorporation, dated October 4, 2013, is incorporated by reference from Exhibit 3(a) of Registrant's 2014 Form 10-K Annual Report.
|
||
|
(b)
|
Amended and Restated Bylaws, dated July 13, 2015, is incorporated by reference from Exhibit 3 of the Registrant's Form 8-K dated July 17, 2015.
|
||
|
|
(4)
|
Instruments Defining the Rights of Security Holders
|
|
|
(a)
|
Specimen copy of Herman Miller, Inc., common stock is incorporated by reference from Exhibit 4(a) of Registrant's 1981 Form 10-K Annual Report.
|
||
|
(b)
|
Other instruments which define the rights of holders of long-term debt individually represent debt of less than 10% of total assets. In accordance with item 601(b)(4)(iii)(A) of regulation S-K, the Registrant agrees to furnish to the Commission copies of such agreements upon request.
|
||
|
(c)
|
Dividend Reinvestment Plan for Shareholders of Herman Miller, Inc., dated January 6, 1997, is incorporated by reference from Exhibit 4(d) of the Registrant's 1997 Form 10-K Annual Report.
|
||
|
(d)
|
Third Amended and Restated Credit agreement dated as of July 21, 2014 among Herman Miller, Inc. and various lenders is incorporated by reference from 10.1 of the Registrant's Form 8-K dated July 22, 2014.
|
||
|
|
(10)
|
Material Contracts
|
|
|
(a)
|
Herman Miller, Inc. 2011 Long-Term Incentive Plan is incorporated by reference from Appendix I of the Registrant's Definitive Proxy Statement dated August 26, 2014, as amended, filed with the Commission as of August 26, 2014.
(1)
|
||
|
(b)
|
Herman Miller, Inc. Nonemployee Officer and Director Deferred Compensation Plan
(1)
|
||
|
(c)
|
Form of Change in Control Agreement of the Registrant, is incorporated by reference from Exhibit 10.1 of the Registrant's Form 10-K dated July 26, 2011.
|
||
|
(d)
|
Herman Miller, Inc. Executive Equalization Retirement Plan is incorporated by reference from Exhibit 10 (d) of the Registrant's Form 10-K dated July 28, 2015.
(1)
|
||
|
(e)
|
Herman Miller, Inc. Executive Incentive Cash Bonus Plan dated April 24, 2006 is incorporated by reference from Exhibit 10.5 of the Registrant's Form 10-Q Quarterly Report for the quarter ended September 3, 2011.
(1)
|
||
-
89
-
|
(f)
|
Form of Herman Miller, Inc., Long-Term Incentive Plan Stock Option Agreement.
(1)
|
||
|
(g)
|
Form of Herman Miller, Inc., Long-Term Incentive Restricted Stock Unit Award.
(1)
|
||
|
(h)
|
Form of Herman Miller, Inc., Long-Term Incentive Performance Stock Unit EBITDA Award is incorporated by reference from Exhibit 99.3 of the Registrant's Form 8-K dated July 23, 2012.
(1)
|
||
|
(i)
|
Second Amendment to the Herman Miller, Inc. 2011 Long-Term Incentive Plan.
(1)
|
||
|
(j)
|
Form of Herman Miller, Inc. 2011 Long-Term Incentive Plan Performance Share Unit Award.
(1)
|
||
|
(k)
|
Employment Agreement between John Edelman and Design Within Reach is incorporated by reference from Exhibit 10(b) of the Registrant's Form 10-Q dated October 8, 2014.
(1)
|
||
|
(l)
|
Employment Agreement between John McPhee and Design Within Reach is incorporated by reference from Exhibit 10(c) of the Registrant's Form 10-Q dated October 8, 2014.
(1)
|
||
|
(m)
|
Stockholders' Agreement between HM Springboard, Inc., Herman Miller, Inc., John Edelman, and John McPhee is incorporated by reference from Exhibit 10(d) of the Registrant's Form 10-Q dated October 8, 2014.
(1)(3)
|
||
|
(n)
|
HM Springboard, Inc. Stock Option Plan is incorporated by reference from Exhibit 10(e) of the Registrant's Form 10-Q dated October 8, 2014.
(1)(3)
|
||
|
(o)
|
Third Amendment to the Herman Miller, Inc. 2011 Long-Term Incentive Plan.
(1)
|
||
|
(p)
|
Form of Herman Miller, Inc. 2011 Long-Term Incentive Plan Conditional Stock Option Award is incorporated by reference from Exhibit 10 (p) of the Registrant's Form 10-K dated July 28, 2015.
(1)
|
||
|
(q)
|
Trust Under the Herman Miller, Inc. Nonemployee Officer and Director Compensation Plan.
(1)
|
||
|
|
(21)
|
Subsidiaries
|
|
|
(23)(a)
|
Consent of Independent Registered Public Accounting Firm
|
|
|
(24)
|
Power of Attorney (Included in Item 15)
|
|
|
(31)(a)
|
Certificate of the Chief Executive Officer of Herman Miller, Inc., pursuant to Section 302 of the Sarbanes-Oxley Act of 2002
|
|
|
(31)(b)
|
Certificate of the Chief Financial Officer of Herman Miller, Inc., pursuant to Section 302 of the Sarbanes-Oxley Act of 2002
|
|
|
(32)(a)
|
Certificate of the Chief Executive Officer of Herman Miller, Inc., pursuant to Section 906 of the Sarbanes-Oxley Act of 2002
|
-
90
-
|
|
(32)(b)
|
Certificate of the Chief Financial Officer of Herman Miller, Inc., pursuant to Section 906 of the Sarbanes-Oxley Act of 2002
|
|
|
101.INS
|
XBRL Instance Document
(2)
|
|
|
101.SCH
|
XBRL Taxonomy Extension Schema Document
(2)
|
|
|
101.CAL
|
XBRL Taxonomy Extension Calculation Linkbase Document
(2)
|
|
|
101.LAB
|
XBRL Taxonomy Extension Label Linkbase Document
(2)
|
|
|
101.PRE
|
XBRL Taxonomy Extension Presentation Linkbase Document
(2)
|
|
|
101.DEF
|
XBRL Taxonomy Extension Definition Linkbase Document
(2)
|
(1)
Denotes compensatory plan or arrangement.
(2)
In accordance with Regulation S-T, the XBRL-related information in Exhibit 101 shall be deemed “furnished” and not “filed” under sections 11 or 12 of the Securities Act of 1933 and/or under section 18 of the Securities and Exchange Act of 1934, and otherwise is not subject to liability under these sections.
(3)
Subsequent to the agreement, the legal name of the company was changed from HM Springboard, Inc. to Herman Miller Consumer Holdings, Inc.
-
91
-
TABLE OF CONTENTS
Part IItem 1 BusinessItem 1A Risk FactorsItem 1B Unresolved Staff CommentsItem 2 PropertiesItem 3 Legal ProceedingsItem 4 Mine Safety Disclosures - Not ApplicableItem 4 Mine Safety DisclosuresPart IIItem 5 Market For The Registrant's Common Equity, Related Stockholder Matters, and Issuer Purchases Of Equity SecuritiesItem 6 Selected Financial DataItem 7 Management's Discussion and Analysis Of Financial Condition and Results Of OperationsItem 7A Quantitative and Qualitative Disclosures About Market RiskItem 8 Financial Statements and Supplementary DataNote 1 To TItem 9 Changes in and Disagreements with Accountants on Accounting and Financial DisclosuresItem 9A Controls and ProceduresItem 9B Other InformationPart IIIItem 10 Directors, Executive Officers and Corporate GovernanceItem 11 Executive CompensationItem 12 Security Ownership Of Certain Beneficial Owners and Management and Related Stockholder MattersItem 13 Certain Relationships and Related Transactions, and Director IndependenceItem 14 Principal Accountant Fees and ServicesPart IVItem 15 Exhibits and Financial Statement Schedule