HERMAN MILLER INC
10-Ks and 10-Qs
|
|
|
|
|
|
|
|
|
|
|
|
|
|
|
|
|
|
|
|
|
|
|
|
|
|
|
|
|
|
|
|
|
|
|
|
|
|
|
|
|
|
|
|
|
|
|
|
|
|
|
|
|
|
|
|
UNITED STATES
SECURITIES AND EXCHANGE COMMISSION
Washington, DC 20549
FORM
10-Q
|
[ X ] QUARTERLY REPORT UNDER SECTION 13 OR 15 (d) OF THE SECURITIES EXCHANGE ACT OF 1934
|
|
[ _ ] TRANSITION REPORT PURSUANT TO SECTION 13 OR 15 (d) OF THE SECURITIES EXCHANGE ACT OF 1934
|
|
For Quarter Ended December 3, 2016
|
Commission File No. 001-15141
|
|
HERMAN MILLER, INC.
|
A Michigan Corporation
|
ID No. 38-0837640
|
|
|
855 East Main Avenue, Zeeland, MI 49464-0302
|
Phone (616) 654 3000
|
|
Indicate by check mark whether the registrant:
(1) has filed all reports required to be filed by Section 13 or 15(d) of the Securities Exchange Act of 1934 during the preceding 12 months, and (2) has been subject to such filing requirements for the past 90 days.
Yes [ X ] No [_]
Indicate by check mark whether the registrant has submitted electronically and posted on its corporate Web site, if any, every Interactive Data File required to be submitted and posted pursuant to Rule 405 of Regulation S-T during the preceding 12 months (or for such shorter period that the registrant was required to submit and post such files).
Yes [ X ] No [_]
Indicate by check mark whether the registrant is a large accelerated filer, an accelerated filer, a non-accelerated filer, or a smaller reporting company. See definition of “large accelerated filer,” “accelerated filer,” and “smaller reporting company” in Rule 12b-2 of the Exchange Act.
|
Large accelerated filer [ X ]
|
Accelerated filer [_]
|
Non-accelerated filer [_]
|
Smaller reporting company [_]
|
Indicate by check mark whether the registrant is a shell company (as defined in Rule 12b-2 of the Exchange Act).
Yes [_] No [ X ]
Common Stock Outstanding at
January 9, 2017
-
59,907,704
shares
Herman Miller, Inc. Form 10-Q
Table of Contents
|
|
|
Page No.
|
|
Part I — Financial Information
|
|
|
|
|
Item 1 Financial Statements (Unaudited)
|
|
|
|
Condensed Consolidated Statements of Comprehensive Income — Three and Six Months Ended December 3, 2016 and November 28, 2015
|
|
|
Condensed Consolidated Balance Sheets — December 3, 2016 and May 28, 2016
|
||
|
|
Condensed Consolidated Statements of Cash Flows — Six Months Ended December 3, 2016 and November 28, 2015
|
|
|
Condensed Consolidated Statements of Stockholders' Equity — Six Months Ended December 3, 2016 and November 28, 2015
|
||
|
|
Notes to Condensed Consolidated Financial Statements
|
|
|
Note 1 -
Basis of Presentation
|
||
|
Note 2 -
New Accounting Standards
|
||
|
Note 3 -
Acquisitions
|
||
|
Note 4 -
Inventories, net
|
||
|
Note 6 -
Employee Benefit Plans
|
||
|
Note 7 -
Earnings Per Share
|
||
|
Note 8 -
Stock-Based Compensation
|
||
|
Note 9 -
Income Taxes
|
||
|
Note 10 -
Fair Value Measurements
|
||
|
Note 11 -
Commitments and Contingencies
|
||
|
Note 12 -
Debt
|
||
|
Note 13 -
Accumulated Other Comprehensive Loss
|
||
|
Note 14 -
Redeemable Noncontrolling Interests
|
||
|
|
Note 15 -
Operating Segments
|
|
|
Note 16 -
Restructuring Activities
|
||
|
Note 17 -
Subsequent Events
|
||
|
|
Item 2 Management's Discussion and Analysis of Financial Condition and Results of Operations
|
|
|
|
Item 3 Quantitative and Qualitative Disclosures about Market Risk
|
|
|
|
Item 4 Controls and Procedures
|
|
|
Part II — Other Information
|
||
|
|
Item 1 Legal Proceedings
|
|
|
|
Item 1A Risk Factors
|
|
|
|
Item 2 Unregistered Sales of Equity Securities and Use of Proceeds
|
|
|
|
Item 3 Defaults upon Senior Securities
|
|
|
|
Item 4 Mine Safety Disclosures
|
|
|
|
Item 5 Other Information
|
|
|
|
Item 6 Exhibits
|
|
|
|
Signatures
|
|
2
Herman Miller, Inc.
(Dollars in millions, except per share data)
(Unaudited)
|
Three Months Ended
|
Six Months Ended
|
||||||||||||||
|
December 3, 2016
|
November 28, 2015
|
December 3, 2016
|
November 28, 2015
|
||||||||||||
|
Net sales
|
$
|
|
|
$
|
|
|
$
|
|
|
$
|
|
|
|||
|
Cost of sales
|
|
|
|
|
|
|
|
|
|||||||
|
Gross margin
|
|
|
|
|
|
|
|
|
|||||||
|
Operating expenses:
|
|||||||||||||||
|
Selling, general, and administrative
|
|
|
|
|
|
|
|
|
|||||||
|
Restructuring expenses
|
|
|
|
|
|
|
|
|
|||||||
|
Design and research
|
|
|
|
|
|
|
|
|
|||||||
|
Total operating expenses
|
|
|
|
|
|
|
|
|
|||||||
|
Operating earnings
|
|
|
|
|
|
|
|
|
|||||||
|
Other expenses:
|
|||||||||||||||
|
Interest expense
|
|
|
|
|
|
|
|
|
|||||||
|
Other, net
|
|
|
(
|
)
|
(
|
)
|
|
|
|||||||
|
Earnings before income taxes and equity income
|
|
|
|
|
|
|
|
|
|||||||
|
Income tax expense
|
|
|
|
|
|
|
|
|
|||||||
|
Equity income from nonconsolidated affiliates, net of tax
|
|
|
|
|
|
|
|
|
|||||||
|
Net earnings
|
|
|
|
|
|
|
|
|
|||||||
|
Net earnings (loss) attributable to noncontrolling interests
|
(
|
)
|
|
|
|
|
|
|
|||||||
|
Net earnings attributable to Herman Miller, Inc.
|
$
|
|
|
$
|
|
|
$
|
|
|
$
|
|
|
|||
|
Earnings per share — basic
|
$
|
|
|
$
|
|
|
$
|
|
|
$
|
|
|
|||
|
Earnings per share — diluted
|
$
|
|
|
$
|
|
|
$
|
|
|
$
|
|
|
|||
|
Dividends declared, per share
|
$
|
|
|
$
|
|
|
$
|
|
|
$
|
|
|
|||
|
Other comprehensive loss, net of tax
|
|||||||||||||||
|
Foreign currency translation adjustments
|
$
|
(
|
)
|
$
|
(
|
)
|
$
|
(
|
)
|
$
|
(
|
)
|
|||
|
Pension and other post-retirement plans
|
|
|
|
|
|
|
|
|
|||||||
|
Interest rate swap agreement
|
|
|
|
|
|
|
|
|
|||||||
|
Other comprehensive loss
|
(
|
)
|
(
|
)
|
(
|
)
|
(
|
)
|
|||||||
|
Comprehensive income
|
|
|
|
|
|
|
|
|
|||||||
|
Comprehensive income (loss) attributable to noncontrolling interests
|
(
|
)
|
|
|
|
|
|
|
|||||||
|
Comprehensive income attributable to Herman Miller, Inc.
|
$
|
|
|
$
|
|
|
$
|
|
|
$
|
|
|
|||
See accompanying notes to condensed consolidated financial statements.
3
Herman Miller, Inc.
(Dollars in millions, except per share data)
(Unaudited)
|
December 3, 2016
|
May 28, 2016
|
||||||
|
ASSETS
|
|||||||
|
Current Assets:
|
|||||||
|
Cash and cash equivalents
|
$
|
|
|
$
|
|
|
|
|
Marketable securities
|
|
|
|
|
|||
|
Accounts and notes receivable, net
|
|
|
|
|
|||
|
Inventories, net
|
|
|
|
|
|||
|
Prepaid expenses and other
|
|
|
|
|
|||
|
Total current assets
|
|
|
|
|
|||
|
Property and equipment, at cost
|
|
|
|
|
|||
|
Less — accumulated depreciation
|
(
|
)
|
(
|
)
|
|||
|
Net property and equipment
|
|
|
|
|
|||
|
Goodwill
|
|
|
|
|
|||
|
Indefinite-lived intangibles
|
|
|
|
|
|||
|
Other amortizable intangibles, net
|
|
|
|
|
|||
|
Other noncurrent assets
|
|
|
|
|
|||
|
Total Assets
|
$
|
|
|
$
|
|
|
|
|
LIABILITIES, REDEEMABLE NONCONTROLLING INTERESTS & STOCKHOLDERS' EQUITY
|
|||||||
|
Current Liabilities:
|
|||||||
|
Accounts payable
|
$
|
|
|
$
|
|
|
|
|
Accrued compensation and benefits
|
|
|
|
|
|||
|
Accrued warranty
|
|
|
|
|
|||
|
Other accrued liabilities
|
|
|
|
|
|||
|
Total current liabilities
|
|
|
|
|
|||
|
Long-term debt
|
|
|
|
|
|||
|
Pension and post-retirement benefits
|
|
|
|
|
|||
|
Other liabilities
|
|
|
|
|
|||
|
Total Liabilities
|
|
|
|
|
|||
|
Redeemable noncontrolling interests
|
|
|
|
|
|||
|
Stockholders' Equity:
|
|||||||
|
Preferred stock, no par value (10,000,000 shares authorized, none issued)
|
|
|
|
|
|||
|
Common stock, $0.20 par value (240,000,000 shares authorized, 59,899,365
and 59,868,276 shares issued and outstanding in 2017 and 2016, respectively)
|
|
|
|
|
|||
|
Additional paid-in capital
|
|
|
|
|
|||
|
Retained earnings
|
|
|
|
|
|||
|
Accumulated other comprehensive loss
|
(
|
)
|
(
|
)
|
|||
|
Key executive deferred compensation plans
|
(
|
)
|
(
|
)
|
|||
|
Herman Miller, Inc. Stockholders' Equity
|
|
|
|
|
|||
|
Noncontrolling Interests
|
|
|
|
|
|||
|
Total Stockholders' Equity
|
|
|
|
|
|||
|
Total Liabilities, Redeemable Noncontrolling Interests, and Stockholders' Equity
|
$
|
|
|
$
|
|
|
|
See accompanying notes to condensed consolidated financial statements.
4
Herman Miller, Inc.
(Dollars in millions)
(Unaudited)
|
|
Six Months Ended
|
||||||
|
December 3, 2016
|
|
November 28, 2015
|
|||||
|
Cash Flows from Operating Activities:
|
|
|
|
||||
|
Net earnings
|
$
|
|
|
$
|
|
|
|
|
Adjustments to reconcile net earnings to net cash provided by operating activities:
|
|||||||
|
Depreciation and amortization
|
|
|
|
|
|||
|
Stock-based compensation
|
|
|
|
|
|||
|
Excess tax benefits from stock-based compensation
|
(
|
)
|
(
|
)
|
|||
|
Pension and post-retirement expenses
|
|
|
|
|
|||
|
(Earnings) loss from nonconsolidated affiliates
|
(
|
)
|
|
|
|||
|
Deferred taxes
|
|
|
(
|
)
|
|||
|
Restructuring expenses
|
|
|
|
|
|||
|
Increase in current assets
|
(
|
)
|
(
|
)
|
|||
|
(Decrease) increase in current liabilities
|
(
|
)
|
|
|
|||
|
Increase in non-current liabilities
|
|
|
|
|
|||
|
Other, net
|
|
|
|
|
|||
|
Net Cash Provided by Operating Activities
|
|
|
|
|
|||
|
Cash Flows from Investing Activities:
|
|||||||
|
Proceeds from sales of property
|
|
|
|
|
|||
|
Acquisitions, net of cash received
|
|
|
(
|
)
|
|||
|
Equity investment in non-controlled entities
|
(
|
)
|
|
|
|||
|
Capital expenditures
|
(
|
)
|
(
|
)
|
|||
|
Payments of loans on cash surrender value of life insurance
|
(
|
)
|
|
|
|||
|
Other, net
|
(
|
)
|
|
|
|||
|
Net Cash Used in Investing Activities
|
(
|
)
|
(
|
)
|
|||
|
Cash Flows from Financing Activities:
|
|||||||
|
Dividends paid
|
(
|
)
|
(
|
)
|
|||
|
Proceeds from issuance of long-term debt
|
|
|
|
|
|||
|
Payments of long-term debt
|
(
|
)
|
(
|
)
|
|||
|
Payment of deferred financing costs
|
(
|
)
|
|
|
|||
|
Common stock issued
|
|
|
|
|
|||
|
Common stock repurchased and retired
|
(
|
)
|
(
|
)
|
|||
|
Excess tax benefits from stock-based compensation
|
|
|
|
|
|||
|
Purchase of redeemable noncontrolling interests
|
(
|
)
|
|
|
|||
|
Payment of contingent consideration
|
(
|
)
|
|
|
|||
|
Other, net
|
|
|
|
|
|||
|
Net Cash Provided by (Used in) Financing Activities
|
(
|
)
|
(
|
)
|
|||
|
Effect of Exchange Rate Changes on Cash and Cash Equivalents
|
|
|
(
|
)
|
|||
|
Net Decrease in Cash and Cash Equivalents
|
(
|
)
|
(
|
)
|
|||
|
Cash and Cash Equivalents, Beginning of Period
|
|
|
|
|
|||
|
Cash and Cash Equivalents, End of Period
|
$
|
|
|
$
|
|
|
|
See accompanying notes to condensed consolidated financial statements.
5
Herman Miller, Inc.
Condensed Consolidated Statements of Stockholders' Equity
(Dollars in millions)
(Unaudited)
|
Six Months Ended
|
|||||||
|
December 3, 2016
|
November 28, 2015
|
||||||
|
Preferred Stock
|
|||||||
|
Balance at beginning of year and end of period
|
$
|
|
|
$
|
|
|
|
|
Common Stock
|
|||||||
|
Balance at beginning of year
|
$
|
|
|
$
|
|
|
|
|
Restricted stock units released
|
|
|
|
|
|||
|
Balance at end of period
|
$
|
|
|
$
|
|
|
|
|
Additional Paid-in Capital
|
|||||||
|
Balance at beginning of year
|
$
|
|
|
$
|
|
|
|
|
Repurchase and retirement of common stock
|
(
|
)
|
(
|
)
|
|||
|
Exercise of stock options
|
|
|
|
|
|||
|
Stock-based compensation expense
|
|
|
|
|
|||
|
Excess tax benefit for stock-based compensation
|
(
|
)
|
|
|
|||
|
Restricted stock units released
|
|
|
|
|
|||
|
Employee stock purchase plan issuances
|
|
|
|
|
|||
|
Balance at end of period
|
$
|
|
|
$
|
|
|
|
|
Retained Earnings
|
|||||||
|
Balance at beginning of year
|
$
|
|
|
$
|
|
|
|
|
Net income attributable to Herman Miller, Inc.
|
|
|
|
|
|||
|
Dividends declared on common stock (per share - 2017: $0.340; 2016; $0.295)
|
(
|
)
|
(
|
)
|
|||
|
Noncontrolling interests redemption value adjustment
|
|
|
(
|
)
|
|||
|
Balance at end of period
|
$
|
|
|
$
|
|
|
|
|
Accumulated Other Comprehensive Loss
|
|||||||
|
Balance at beginning of year
|
$
|
(
|
)
|
$
|
(
|
)
|
|
|
Other comprehensive loss
|
(
|
)
|
(
|
)
|
|||
|
Balance at end of period
|
$
|
(
|
)
|
$
|
(
|
)
|
|
|
Key Executive Deferred Compensation
|
|||||||
|
Balance at beginning of year and end of period
|
$
|
(
|
)
|
$
|
(
|
)
|
|
|
Herman Miller, Inc. Stockholders' Equity
|
$
|
|
|
$
|
|
|
|
|
Noncontrolling Interests
|
|||||||
|
Balance at beginning of year
|
$
|
|
|
$
|
|
|
|
|
Net income attributable to noncontrolling interests
|
|
|
|
|
|||
|
Balance at end of period
|
$
|
|
|
$
|
|
|
|
|
Total Stockholders' Equity
|
$
|
|
|
$
|
|
|
|
6
Notes to Condensed Consolidated Financial Statements
Three and Six
Months Ended
December 3, 2016
(in millions)
1.
Basis of Presentation
The condensed consolidated financial statements have been prepared by Herman Miller, Inc. (“the company”) in accordance with accounting principles generally accepted in the United States of America ("U.S. GAAP") for interim financial information and with the instructions to Form 10-Q and Article 10 of Regulation S-X. Accordingly, they do not include all of the information and footnotes required by U.S. GAAP for complete financial statements. Management believes the disclosures made in this document are adequate with respect to interim reporting requirements.
The accompanying unaudited condensed consolidated financial statements, taken as a whole, contain all adjustments that are of a normal recurring nature necessary to present fairly the financial position of the company as of
December 3, 2016
. Operating results for the
three
and
six
months ended
December 3, 2016
, are not necessarily indicative of the results that may be expected for the year ending
June 3, 2017
. It is suggested that these condensed consolidated financial statements be read in conjunction with the financial statements and notes thereto included in the company's annual report on Form 10-K for the year ended
May 28, 2016
.
2.
Recently Issued Accounting Standards Not Yet Adopted
|
Standard
|
Description
|
Effective Date
|
Effect on the Financial Statements or Other Significant Matters
|
|||
|
Simplifying the Measurement of Inventory
|
Under the updated standard, an entity should measure inventory that is measured using either the first-in, first-out ("FIFO") or the average cost methods at the lower of cost and net realizable value. Net realizable value is the estimated selling price in the ordinary course of business, less reasonably predictable costs of completion, disposal, and transportation. The updated standard should be applied prospectively.
|
June 4, 2017
|
The company is currently evaluating the impact of adopting this guidance.
|
|||
|
Revenue from Contracts with Customers
|
The standard outlines a single comprehensive model for entities to use in accounting for revenue arising from contracts with customers and supersedes most current revenue recognition guidance, including industry-specific guidance. The core principle of the revenue model is that an entity should recognize revenue to depict the transfer of promised goods or services to customers in an amount that reflects the consideration to which the entity expects to be entitled in exchange for those goods or services. The standard is designed to create greater comparability for financial statement users across industries and jurisdictions and also requires enhanced disclosures. The standard allows for two adoption methods, a full retrospective or modified retrospective approach.
|
June 3, 2018
|
The company is currently evaluating the possible adoption methodologies and the implications of adoption on our consolidated financial statements.
|
|||
|
Statement of Cash Flows
|
The standard amends the guidance on the classification of certain cash receipts and payments in the statement of cash flows. The primary purpose of the standard is to reduce the diversity in practice by laying out consistent principles. The standard must be adopted under a modified retrospective approach and early adoption is permitted.
|
June 3, 2018
|
The company is currently evaluating the impact of adopting this guidance.
|
|||
|
Leases
|
Under the updated standard a lessee's rights and obligations under most leases, including existing and new arrangements, would be recognized as assets and liabilities, respectively, on the balance sheet. The standard must be adopted under a modified retrospective approach and early adoption is permitted.
|
June 2, 2019
|
The standard is expected to have a significant impact on our Consolidated Financial Statements; however, the company is currently evaluating the impact.
|
|||
7
3.
Acquisitions
Naughtone Holdings Limited
4.
Inventories, net
|
(In millions)
|
December 3, 2016
|
May 28, 2016
|
|||||
|
Finished goods
|
$
|
|
|
$
|
|
|
|
|
Raw materials
|
|
|
|
|
|||
|
Total
|
$
|
|
|
$
|
|
|
|
5.
Goodwill and Indefinite-lived Intangibles
|
(In millions)
|
Goodwill
|
Indefinite-lived Intangible Assets
|
Total Goodwill and Indefinite-lived Intangible Assets
|
||||||||
|
May 28, 2016
|
$
|
|
|
$
|
|
|
$
|
|
|
||
|
Foreign currency translation adjustments
|
(
|
)
|
|
|
(
|
)
|
|||||
|
December 3, 2016
|
$
|
|
|
$
|
|
|
$
|
|
|
||
6.
Employee Benefit Plans
The following table summarizes the components of net periodic benefit costs for the company's International defined benefit pension plan for the periods indicated:
|
Three Months Ended
|
Six Months Ended
|
||||||||||||||
|
(In millions)
|
December 3, 2016
|
November 28, 2015
|
December 3, 2016
|
November 28, 2015
|
|||||||||||
|
Service cost
|
$
|
|
|
$
|
|
|
$
|
|
|
$
|
|
|
|||
|
Interest cost
|
|
|
|
|
|
|
|
|
|||||||
|
Expected return on plan assets
|
(
|
)
|
(
|
)
|
(
|
)
|
(
|
)
|
|||||||
|
Net amortization loss
|
|
|
|
|
|
|
|
|
|||||||
|
Net periodic benefit cost
|
$
|
|
|
$
|
|
|
$
|
|
|
$
|
|
|
|||
8
7.
Earnings Per Share
|
Three Months Ended
|
Six Months Ended
|
||||||||||||||
|
December 3, 2016
|
November 28, 2015
|
December 3, 2016
|
November 28, 2015
|
||||||||||||
|
Numerators
:
|
|||||||||||||||
|
Numerator for both basic and diluted EPS, net earnings attributable to Herman Miller, Inc. - in millions
|
$
|
|
|
$
|
|
|
$
|
|
|
$
|
|
|
|||
|
Denominators
:
|
|||||||||||||||
|
Denominator for basic EPS, weighted-average common shares outstanding
|
|
|
|
|
|
|
|
|
|||||||
|
Potentially dilutive shares resulting from stock plans
|
|
|
|
|
|
|
|
|
|||||||
|
Denominator for diluted EPS
|
|
|
|
|
|
|
|
|
|||||||
|
Antidilutive equity awards not included in weighted-average common shares - diluted
|
|
|
|
|
|
|
|
|
|||||||
8.
Stock-Based Compensation
|
(In millions)
|
Three Months Ended
|
Six Months Ended
|
|||||||||||||
|
December 3, 2016
|
November 28, 2015
|
December 3, 2016
|
November 28, 2015
|
||||||||||||
|
Stock-based compensation expense
|
$
|
|
|
$
|
|
|
$
|
|
|
$
|
|
|
|||
|
Related income tax effect
|
|
|
|
|
|
|
|
|
|||||||
Stock-based compensation expense recognized in the Condensed Consolidated Statements of Comprehensive Income for the
three
and
six
month periods ended
December 3, 2016
and
November 28, 2015
has been reduced for estimated forfeitures, as it is based on awards ultimately expected to vest. Forfeitures are estimated at the time of grant and revised, if necessary, in subsequent periods if actual forfeitures differ. Forfeitures are estimated based on historical experience.
|
(Shares)
|
Six Months Ended
|
|||||
|
December 3, 2016
|
November 28, 2015
|
|||||
|
Stock Options
|
|
|
|
|
||
|
Restricted Stock Units
|
|
|
|
|
||
|
Performance Share Units
|
|
|
|
|
||
9.
Income Taxes
The company recognizes interest and penalties related to uncertain tax benefits through income tax expense in its Condensed Consolidated Statement of Comprehensive Income. Interest and penalties recognized in the company's Condensed Consolidated Statement of Comprehensive Income were
negligible
for the three and six month periods ended
December 3, 2016
and
November 28, 2015
, respectively.
The company's recorded liability for potential interest and penalties related to uncertain tax benefits was:
|
(In millions)
|
December 3, 2016
|
May 28, 2016
|
||||||
|
Liability for interest and penalties
|
$
|
|
|
$
|
|
|
||
|
Liability for uncertain tax positions, current
|
|
|
|
|
||||
9
The company is subject to periodic audits by domestic and foreign tax authorities. Currently, the company is undergoing routine periodic audits in both domestic and foreign tax jurisdictions. It is reasonably possible that the amounts of unrecognized tax benefits could change in the next twelve months as a result of the audits. Tax payments related to these audits, if any, are not expected to be material to the company's Condensed Consolidated Statements of Comprehensive Income.
10.
Fair Value Measurements
The company's financial instruments consist of cash equivalents, marketable securities, accounts and notes receivable, deferred compensation plan, accounts payable, debt, redeemable noncontrolling interests, interest rate swap and foreign currency exchange contracts. The company's financial instruments, other than long-term debt, are recorded at fair value.
The carrying value and fair value of the company's long-term debt, including current maturities, is as follows for the periods indicated:
|
(In millions)
|
December 3, 2016
|
May 28, 2016
|
||||||
|
Carrying value
|
$
|
|
|
$
|
|
|
||
|
Fair value
|
$
|
|
|
$
|
|
|
||
The following describes the methods the company uses to estimate the fair value of financial assets and liabilities, which have not significantly changed in the current period:
Available-for-sale securities
— The company's available-for-sale marketable securities primarily include equity and fixed income mutual funds and government obligations. These investments are recorded at fair value using quoted prices for similar securities.
Foreign currency exchange contracts
— The company's foreign currency exchange contracts are valued using an approach based on foreign currency exchange rates obtained from active markets. The estimated fair value of forward currency exchange contracts is based on month-end spot rates as adjusted by market-based current activity. These forward contracts are not designated as hedging instruments.
Interest rate swap agreement
— The company's interest rate swap agreement value is determined using a market approach based on rates obtained from active markets.
The interest rate swap agreement is designated as a cash flow hedging instrument.
Deferred compensation plan
— The company's deferred compensation plan primarily includes various domestic and international mutual funds that are recorded at fair value using quoted prices for similar securities.
|
(In millions)
|
Fair Value Measurements
|
||||||||||||
|
December 3, 2016
|
May 28, 2016
|
||||||||||||
|
Financial Assets
|
Quoted Prices with
Other Observable Inputs (Level 2)
|
Management Estimate (Level 3)
|
Quoted Prices with
Other Observable Inputs (Level 2) |
Management Estimate (Level 3)
|
|||||||||
|
Available-for-sale marketable securities:
|
|||||||||||||
|
Government obligations
|
$
|
|
|
$
|
|
|
$
|
|
|
$
|
|
|
|
|
Mutual funds - fixed income
|
|
|
|
|
|
|
|
|
|||||
|
Mutual funds - equity
|
|
|
|
|
|
|
|
|
|||||
|
Foreign currency forward contracts
|
|
|
|
|
|
|
|
|
|||||
|
Interest rate swap agreement
|
|
|
|
|
|
|
|
|
|||||
|
Deferred compensation plan
|
|
|
|
|
|
|
|
|
|||||
|
Total
|
$
|
|
|
$
|
|
|
$
|
|
|
$
|
|
|
|
|
Financial Liabilities
|
|||||||||||||
|
Foreign currency forward contracts
|
$
|
|
|
$
|
|
|
$
|
|
|
$
|
|
|
|
|
Contingent consideration
|
|
|
|
|
|
|
|
|
|||||
|
Total
|
$
|
|
|
$
|
|
|
$
|
|
|
$
|
|
|
|
10
|
Contingent Consideration
|
December 3, 2016
|
May 28, 2016
|
|||||
|
Beginning balance
|
$
|
|
|
$
|
|
|
|
|
Foreign currency translation adjustments
|
|
|
(
|
)
|
|||
|
Settlements
|
(
|
)
|
(
|
)
|
|||
|
Purchases or additions
|
|
|
|
|
|||
|
Ending balance
|
$
|
|
|
$
|
|
|
|
The contingent consideration liabilities represent future payment obligations that relate to business and product line acquisitions. These payments are based on the future performance of the acquired businesses. The contingent consideration liabilities are valued using estimates based on discount rates that reflect the risk involved and the projected sales and earnings of the acquired businesses. The estimates are updated and the liabilities are adjusted to fair value on a quarterly basis.
|
December 3, 2016
|
May 28, 2016
|
||||||||||||||||||||||||||||||
|
(In millions)
|
Cost
|
Unrealized
Gain
|
Unrealized
Loss
|
Market
Value
|
Cost
|
Unrealized
Gain |
Unrealized
Loss |
Market
Value |
|||||||||||||||||||||||
|
Government obligations
|
$
|
|
|
$
|
|
|
$
|
|
|
$
|
|
|
$
|
|
|
$
|
|
|
$
|
|
|
$
|
|
|
|||||||
|
Mutual funds - fixed income
|
|
|
|
|
|
|
|
|
|
|
|
|
|
|
|
|
|||||||||||||||
|
Mutual funds - equity
|
|
|
$
|
|
|
|
|
|
|
|
|
|
|
|
|
|
|
||||||||||||||
|
Total
|
$
|
|
|
$
|
|
|
$
|
|
|
$
|
|
|
$
|
|
|
$
|
|
|
$
|
|
|
$
|
|
|
|||||||
The company reviews its investment portfolio for any unrealized losses that would be deemed other-than-temporary and require the recognition of an impairment loss in earnings. If the cost of an investment exceeds its fair value, the company evaluates, among other factors, general market conditions, the duration and extent to which the fair value is less than its cost, the company's intent to hold the investment, and whether it is more likely than not that the company will be required to sell the investment before recovery of the cost basis. The company also considers the type of security, related industry and sector performance, and published investment ratings. Once a decline in fair value is determined to be other-than-temporary, an impairment charge is recorded and a new cost basis in the investment is established. If conditions within individual markets, industry segments, or macro-economic environments deteriorate, the company could incur future impairments.
The company views its available-for-sale portfolio as available for use in its current operations. Accordingly, the investments are recorded within Current Assets within the Condensed Consolidated Balance Sheets.
Derivative Instruments and Hedging Activities
In September, 2016, the company entered into an interest rate swap agreement. The interest rate swap is for an aggregate notional amount of
$
150.0
million
with a forward start date of January 3, 2018 and a termination date of January 3, 2028. As a result of the Swap Transaction, the company effectively will convert
$
150.0
million
of its outstanding indebtedness from a LIBOR-based floating interest rate plus applicable margin to a
1.949
percent
fixed interest rate plus applicable margin under the agreement as of the forward start date.
The company entered into the interest rate swap agreement to manage its exposure to interest changes and its overall cost of borrowing. The interest rate swap agreement was enacted by the company to exchange variable rate for fixed rate payments over the life of the agreement without the exchange of the underlying notional amounts. The notional amount of the interest rate swap agreement is used to measure interest to be paid or received and does not represent the amount of exposure to credit loss. The differential paid or received on the interest rate swap agreement is recognized as an adjustment to interest expense.
The interest rate swap was a designated cash flow hedge as of December 3, 2016. Since a designated derivative meets hedge accounting criteria, the fair value of the hedge is recorded in the Consolidated Statement of Stockholders’ Equity as a component of Accumulated other comprehensive loss, net of tax. The ineffective portion of the change in fair value of the derivative is immediately recognized in earnings. The interest rate swap agreement is assessed for hedge effectiveness on a quarterly basis.
As of December 3, 2016, the fair value of the company’s interest rate swap was
$
6.4
million
and was recorded within Other noncurrent assets within the Condensed Consolidated Balance Sheets. For the three and six month periods ended December 3, 2016, the gain recorded within
11
11.
Commitments and Contingencies
Product Warranties
The company provides coverage to the end-user for parts and labor on products sold under its warranty policy and for other product-related matters. The standard length of warranty is
twelve
years for the majority of products sold; however, this varies depending on the product classification. The company does not sell or otherwise issue warranties or warranty extensions as stand-alone products. Reserves have been established for the various costs associated with the company's warranty program and are included in the Condensed Consolidated Balance Sheets under “Accrued warranty.”
General warranty reserves are based on historical claims experience and other currently available information. These reserves are adjusted once an issue is identified and the actual cost of correction becomes known or can be estimated.
|
(In millions)
|
Three Months Ended
|
Six Months Ended
|
|||||||||||||
|
December 3, 2016
|
November 28, 2015
|
December 3, 2016
|
November 28, 2015
|
||||||||||||
|
Accrual Balance — beginning
|
$
|
|
|
$
|
|
|
$
|
|
|
$
|
|
|
|||
|
Accrual for product-related matters
|
|
|
|
|
|
|
|
|
|||||||
|
Settlements and adjustments
|
(
|
)
|
(
|
)
|
(
|
)
|
(
|
)
|
|||||||
|
Accrual Balance — ending
|
$
|
|
|
$
|
|
|
$
|
|
|
$
|
|
|
|||
Guarantees
The company is periodically required to provide performance bonds to do business with certain customers. These arrangements are common and generally have terms ranging between
one
and
three
years. The bonds are required to provide assurance to customers that the products and services they have purchased will be installed and/or provided properly and without damage to their facilities. The bonds are provided by various bonding agencies. However, the company is ultimately liable for claims that may occur against them. As of
December 3, 2016
, the company had a maximum financial exposure related to performance bonds totaling approximately
$
8.7
million
. The company has no history of claims, nor is it aware of circumstances that would require it to pay, under any of these arrangements. The company also believes that the resolution of any claims that might arise in the future, either individually or in the aggregate, would not materially affect the company's financial statements. Accordingly,
no
liability has been recorded in respect to these bonds as of either
December 3, 2016
or
May 28, 2016
.
The company has entered into standby letter of credit arrangements for purposes of protecting various insurance companies and lessors against default on insurance premium and lease payments. As of
December 3, 2016
, the company had a maximum financial exposure from these standby letters of credit totaling approximately
$
8.4
million
, all of which is considered usage against the company's revolving credit facility. The company has no history of claims, nor is it aware of circumstances that would require it to perform under any of these arrangements, and believes that the resolution of any claims that might arise in the future, either individually or in the aggregate, would not materially affect the company's financial statements. Accordingly,
no
liability has been recorded in respect of these arrangements as of
December 3, 2016
and
May 28, 2016
.
Contingencies
12.
Debt
|
(In millions)
|
December 3, 2016
|
May 28, 2016
|
|||||
|
Series B senior notes, due January 3, 2018
|
$
|
|
|
$
|
|
|
|
|
Debt securities, due March 1, 2021
|
|
|
|
|
|||
|
Syndicated revolving line of credit, due September 2021
|
|
|
|
|
|||
|
Total
|
$
|
|
|
$
|
|
|
|
On September 13, 2016, the company entered into a fourth amendment and restatement of its unsecured syndicated revolving line of credit which provides the company with up to
$
400
million
in revolving variable interest borrowing capacity and includes an "accordion feature" allowing the company to increase, at its option and subject to the approval of the participating banks, the aggregate borrowing capacity of the facility by up to
$
200
million
. The facility will expire in September 2021 and outstanding borrowings bear interest at rates based on the prime rate, federal funds rate, LIBOR, or negotiated rates as outlined in the agreement. Interest is payable periodically throughout the period if borrowings are outstanding.
12
13.
Accumulated Other Comprehensive Loss
|
(In millions)
|
Cumulative Translation Adjustments
|
Pension and Other Post-retirement Benefit Plans
|
Interest Rate Swap Agreement
|
Accumulated Other Comprehensive income
|
|||||||||||
|
Balance at May 28, 2016
|
$
|
(
|
)
|
$
|
(
|
)
|
$
|
|
|
$
|
(
|
)
|
|||
|
Current period other comprehensive income (loss)
|
(
|
)
|
|
|
|
|
(
|
)
|
|||||||
|
Tax (expense) benefit
|
|
|
|
|
(
|
)
|
(
|
)
|
|||||||
|
Balance at December 3, 2016
|
$
|
(
|
)
|
$
|
(
|
)
|
$
|
|
|
$
|
(
|
)
|
|||
The following table provides an analysis of the changes in accumulated other comprehensive loss for the
six
months ended
November 28, 2015
:
|
(In millions)
|
Cumulative Translation Adjustments
|
Pension and Other Post-retirement Benefit Plans
|
Interest Rate Swap Agreement
|
Accumulated Other Comprehensive income
|
|||||||||||
|
Balance at May 30, 2015
|
$
|
(
|
)
|
$
|
(
|
)
|
$
|
|
|
$
|
(
|
)
|
|||
|
Current period other comprehensive income (loss)
|
(
|
)
|
|
|
|
|
(
|
)
|
|||||||
|
Tax (expense) benefit
|
|
|
(
|
)
|
|
|
(
|
)
|
|||||||
|
Balance at November 28, 2015
|
$
|
(
|
)
|
$
|
(
|
)
|
$
|
|
|
$
|
(
|
)
|
|||
14.
Redeemable Noncontrolling Interests
Redeemable noncontrolling interests are reported on the Consolidated Balance Sheets in mezzanine equity in “Redeemable noncontrolling interests.” The company recognizes changes to the redemption value of redeemable noncontrolling interests as they occur and adjusts the carrying value to equal the redemption value at the end of each reporting period. The redemption amounts have been estimated based on the fair value of the subsidiary, determined based on a weighting of the discounted cash flow and market methods. This represents a level 3 fair value measurement.
|
Six Months Ended
|
||||||||
|
(In millions)
|
December 3, 2016
|
November 28, 2015
|
||||||
|
Beginning Balance
|
$
|
|
|
$
|
|
|
||
|
Purchase of redeemable noncontrolling interests
|
(
|
)
|
|
|
||||
|
Net income attributable to redeemable noncontrolling interests
|
|
|
|
|
||||
|
Redemption value adjustment
|
(
|
)
|
|
|
||||
|
Other adjustments
|
|
|
|
|
||||
|
Ending Balance
|
$
|
|
|
$
|
|
|
||
15.
Operating Segments
The company's reportable segments consist of North American Furniture Solutions, ELA ("EMEA, Latin America, and Asia Pacific") Furniture Solutions, Specialty, and Consumer. The North American Furniture Solutions reportable segment includes the operations associated with the design, manufacture, and sale of furniture products for work-related settings, including office, education, and healthcare environments, throughout the United States and Canada. ELA Furniture Solutions includes the operations associated with the design, manufacture, and sale of furniture products, primarily for work-related settings, in the EMEA, Latin America, and Asia-Pacific geographic regions. Specialty includes the operations
13
associated with the design, manufacture, and sale of high-craft furniture products and textiles including Geiger wood products, Maharam textiles, and Herman Miller Collection products. The Consumer segment includes the operations associated with the sale of modern design furnishings and accessories to third party retail distributors, as well as direct-to-consumer sales through eCommerce and DWR studios.
The company also reports a “Corporate” category consisting primarily of unallocated corporate expenses including restructuring, impairment, acquisition-related costs, and other unallocated corporate costs.
The accounting policies of the reportable operating segments are the same as those of the company. Additionally, the company employs a methodology for allocating corporate costs and assets with the underlying objective of this methodology being to allocate corporate costs according to the relative usage of the underlying resources and to allocate corporate assets according to the relative expected benefit. The company has determined that allocation based on relative net sales is appropriate. The majority of corporate costs are allocated to the operating segments. However, certain costs generally considered the result of isolated business decisions are not subject to allocation and are evaluated separately from the rest of the regular ongoing business operations. For example, restructuring charges that are reflected in operating earnings are allocated to the “Corporate” category.
The performance of the operating segments is evaluated by the company's management using various financial measures.
The following is a summary of certain key financial measures for the respective fiscal periods indicated.
|
Three Months Ended
|
Six Months Ended
|
||||||||||||||
|
(In millions)
|
December 3, 2016
|
November 28, 2015
|
December 3, 2016
|
November 28, 2015
|
|||||||||||
|
Net Sales:
|
|||||||||||||||
|
North American Furniture Solutions
|
$
|
|
|
$
|
|
|
$
|
|
|
$
|
|
|
|||
|
ELA Furniture Solutions
|
|
|
|
|
|
|
|
|
|||||||
|
Specialty
|
|
|
|
|
|
|
|
|
|||||||
|
Consumer
|
|
|
|
|
|
|
|
|
|||||||
|
Corporate
|
|
|
|
|
|
|
|
|
|||||||
|
Total
|
$
|
|
|
$
|
|
|
$
|
|
|
$
|
|
|
|||
|
Operating Earnings (Loss):
|
|||||||||||||||
|
North American Furniture Solutions
|
$
|
|
|
$
|
|
|
$
|
|
|
$
|
|
|
|||
|
ELA Furniture Solutions
|
|
|
|
|
|
|
|
|
|||||||
|
Specialty
|
|
|
|
|
|
|
|
|
|||||||
|
Consumer
|
|
|
|
|
|
|
|
|
|||||||
|
Corporate
|
|
|
(
|
)
|
|
|
(
|
)
|
|||||||
|
Total
|
$
|
|
|
$
|
|
|
$
|
|
|
$
|
|
|
|||
|
(In millions)
|
December 3, 2016
|
May 28, 2016
|
|||||
|
Total Assets:
|
|||||||
|
North American Furniture Solutions
|
$
|
|
|
$
|
|
|
|
|
ELA Furniture Solutions
|
|
|
|
|
|||
|
Specialty
|
|
|
|
|
|||
|
Consumer
|
|
|
|
|
|||
|
Corporate
|
|
|
|
|
|||
|
Total
|
$
|
|
|
$
|
|
|
|
14
17.
Subsequent Event
15
Three and Six
Months Ended
December 3, 2016
(in millions)
The following is management's discussion and analysis of certain significant factors that affected the company's financial condition, earnings and cash flows during the periods included in the accompanying condensed consolidated financial statements and should be read in conjunction with the company's Annual Report on Form 10-K for the fiscal year ended
May 28, 2016
. References to “Notes” are to the footnotes included in the accompanying condensed consolidated financial statements.
Discussion of Current Business Conditions
During the second quarter of fiscal 2017, the company reported net sales of
$577.5 million
and orders of
$575.9 million
, which were both below prior year levels. However, on an organic basis, which adjusts for the impact of foreign currency and dealer divestitures, net sales were
$581.9 million
(*)
, an increase of
1.1 percent
(*)
, while orders were
$578.6 million
(*)
, a decrease of
2.7 percent
(*)
as compared to the prior year.
Consolidated gross margin percentage for the current three month period was
37.7 percent
, which was 100 basis points lower than the prior year period. This decrease was caused principally by a relative reduction in net sales and gross profit from incremental price discounting and higher commodity costs.
Operating expenses in the second quarter totaled
$168.4 million
, which included $1.0 million of restructuring costs. This was $0.5 million less than the operating expenses reported in the comparative three month period last fiscal year. Reductions in operating expenses related to decreased employee incentive costs and the divestiture of the company's dealership in Australia and were partially offset by increases related to marketing initiatives, as well as
higher occupancy costs and incremental pre-opening expenses related to new DWR studios.
Diluted earnings per share of
$0.53
during the
second
quarter of fiscal 2017 was $0.04 per share less than the amount recorded in the prior year period. After adjusting for certain restructuring costs that were incurred during the current quarter, Adjusted diluted earnings per share of $0.54
(*)
per share were $0.03 per share less than the prior year amount.
The North American segment recorded net sales of
$329.5 million
and orders of
$338.3 million
during the second quarter of fiscal 2017, which represented a year-over-year decrease in sales of approximately
5.3 percent
and a decrease in orders of approximately
3.1 percent
. During the quarter, sales activity within the North American segment was adversely impacted by the competitive pricing environment, which led to a negative impact from incremental discounting. Relative to the prior year period, the second quarter of fiscal 2017 had a higher mix of projects that were greater than $1 million,
which was also a contributing factor to discount levels during the quarter as larger projects generally carry higher volume discounts.
The Consumer segment continued to show positive progress as net sales and orders increased by
7.7 percent
and
6.6 percent
, respectively. The increase in net sales and orders was driven by improved activity across several consumer selling channels, including e-commerce, studios and direct-mail catalogs. These improvements were driven by marketing investments, both digital and catalog, as well as new studio openings. As part of the ongoing expansion of the company's real estate footprint, this quarter saw the opening of the
first ever Herman Miller-branded retail store in North America, which is located inside the company's New York City flagship location. Additionally,
a new DWR studio in Paramus, New Jersey, was opened during the quarter and the company is under contract to open five additional DWR studios by the end of the fiscal year.
The ELA segment posted sales during the second quarter of fiscal 2017 of
$107.6 million
, representing growth of
6.9 percent
from the prior year period. On an organic basis, net sales increased
16.8 percent
(*)
relative to the comparative period. Orders for the ELA segment decreased
11.5 percent
, and on an organic basis, decreased
3.4 percent
as compared to the second quarter of last fiscal year. The improvement in sales was driven by increased demand in the Asia-Pacific and Latin America geographies. The decrease in orders
was primarily due to lower demand levels in the U.K. and Middle East tied to the current economic uncertainty in these regions.
Net sales within the company's Specialty segment increased from
$57.7 million
in the prior year to
$60.8 million
in the current three month period. The company's Specialty segment delivered broad-based net sales growth that was driven by increased sales volumes across all components of the Specialty segment, including the Herman Miller Collection, as well as the Geiger and Maharam subsidiaries. However, orders were down
11.1 percent
relative to same quarter last year. This decrease was driven partially by project timing as
the Specialty segment experienced strong order growth in the first quarter of this fiscal year. Additionally, the second quarter of last fiscal year posed a challenging comparison as year-over-year growth in orders for that period totaled 15.2 percent.
*Non-GAAP measurements; see accompanying reconciliations and explanations.
16
There are areas of challenge, both in the U.S. and abroad, within the macro-economic backdrop of the business.
The contentious political environment in Europe and the recent U.S. election have combined to increase volatility over the past several months. T
he company believes that certain key industry metrics are still positive, including service sector employment and non-residential construction activity, but that these positive factors are at odds with lower architectural billings and uneven order patterns. Furthermore, rising steel prices and continued challenges in the energy sector remain as headwinds to the company's growth in the U.S.
The remaining sections within Item 2 include additional analysis of our
six
months ended
December 3, 2016
, including discussion of significant variances compared to the prior year periods.
Reconciliation of Non-GAAP Financial Measures
This report contains references to Organic net sales and Adjusted earnings per share - diluted, which are non-GAAP financial measures. Organic net sales represents the change in Net sales, excluding the impact of dealer divestitures, currency translation effects, and the extra week of operations in the first quarter of fiscal 2017. Adjusted earnings per share - diluted represents the earnings per share - diluted, excluding the impact of restructuring expenses incurred during fiscal 2017. The company believes presenting Organic net sales and Adjusted earnings per share - diluted is useful for investors as it provides financial information on a more comparative basis for the periods presented. The first half of fiscal 2017 included 27 weeks of operations as compared to a 26-week period in the first half of fiscal 2016. The additional week is required periodically in order to more closely align Herman Miller’s fiscal year with the calendar months.
Organic net sales and Adjusted earnings per share - diluted are not measurements of our financial performance under GAAP and should not be considered as alternatives to the related GAAP measurement. These non-GAAP measurements have limitations as analytical tools and should not be considered in isolation or as a substitute for analysis of our results as reported under GAAP. Our presentation of non-GAAP measures should not be construed as an indication that our future results will be unaffected by unusual or infrequent items. We compensate for these limitations by providing prominence of our GAAP results and using the non-GAAP financial measures only as a supplement.
The following table reconciles Net sales to Organic net sales for the periods indicated.
|
Three Months Ended
|
Three Months Ended
|
|||||||||||||||||||||||||||||
|
12/3/16
|
11/28/15
|
|||||||||||||||||||||||||||||
|
North America
|
ELA
|
Specialty
|
Consumer
|
Total
|
North America
|
ELA
|
Specialty
|
Consumer
|
Total
|
|||||||||||||||||||||
|
Net Sales, as reported
|
$
|
329.5
|
|
$
|
107.6
|
|
$
|
60.8
|
|
$
|
79.6
|
|
$
|
577.5
|
|
$
|
348.1
|
|
$
|
100.7
|
|
$
|
57.7
|
|
$
|
73.9
|
|
$
|
580.4
|
|
|
% change from PY
|
(5.3
|
)%
|
6.9
|
%
|
5.4
|
%
|
7.7
|
%
|
(0.5
|
)%
|
|
|
|
|
|
|
|
|
|
|
||||||||||
|
Proforma Adjustments
|
||||||||||||||||||||||||||||||
|
Dealer Divestitures
|
—
|
|
—
|
|
—
|
|
—
|
|
—
|
|
—
|
|
(4.9
|
)
|
—
|
|
—
|
|
(4.9
|
)
|
||||||||||
|
Currency Translation Effects
(1)
|
0.1
|
|
4.3
|
|
—
|
|
—
|
|
4.4
|
|
—
|
|
—
|
|
—
|
|
—
|
|
—
|
|
||||||||||
|
Organic net sales
|
$
|
329.6
|
|
$
|
111.9
|
|
$
|
60.8
|
|
$
|
79.6
|
|
$
|
581.9
|
|
$
|
348.1
|
|
$
|
95.8
|
|
$
|
57.7
|
|
$
|
73.9
|
|
$
|
575.5
|
|
|
% change from PY
|
(5.3
|
)%
|
16.8
|
%
|
5.4
|
%
|
7.7
|
%
|
1.1
|
%
|
||||||||||||||||||||
|
Six Months Ended
|
Six Months Ended
|
|||||||||||||||||||||||||||||
|
12/3/16
|
11/28/15
|
|||||||||||||||||||||||||||||
|
North America
|
ELA
|
Specialty
|
Consumer
|
Total
|
North America
|
ELA
|
Specialty
|
Consumer
|
Total
|
|||||||||||||||||||||
|
Net Sales, as reported
|
$
|
694.6
|
|
$
|
204.9
|
|
$
|
121.6
|
|
$
|
155.0
|
|
$
|
1,176.1
|
|
$
|
686.2
|
|
$
|
203.2
|
|
$
|
115.5
|
|
$
|
140.9
|
|
$
|
1,145.8
|
|
|
% change from PY
|
1.2
|
%
|
0.8
|
%
|
5.3
|
%
|
10.0
|
%
|
2.6
|
%
|
||||||||||||||||||||
|
Proforma Adjustments
|
||||||||||||||||||||||||||||||
|
Dealer Divestitures
|
—
|
|
—
|
|
—
|
|
—
|
|
—
|
|
—
|
|
(13.7
|
)
|
—
|
|
—
|
|
(13.7
|
)
|
||||||||||
|
Currency Translation Effects
(1)
|
0.4
|
|
7.5
|
|
—
|
|
0.1
|
|
8.0
|
|
—
|
|
—
|
|
—
|
|
—
|
|
—
|
|
||||||||||
|
Impact of extra week in FY17
|
(22.7
|
)
|
(6.3
|
)
|
(3.3
|
)
|
(4.7
|
)
|
(37.0
|
)
|
—
|
|
—
|
|
—
|
|
—
|
|
—
|
|
||||||||||
|
Organic net sales
|
$
|
672.3
|
|
$
|
206.1
|
|
$
|
118.3
|
|
$
|
150.4
|
|
$
|
1,147.1
|
|
$
|
686.2
|
|
$
|
189.5
|
|
$
|
115.5
|
|
$
|
140.9
|
|
$
|
1,132.1
|
|
|
% change from PY
|
(2.0
|
)%
|
8.8
|
%
|
2.4
|
%
|
6.7
|
%
|
1.3
|
%
|
||||||||||||||||||||
|
(1)
Currency translation effects represent the estimated net impact of translating current period sales and orders using the average exchange rates applicable to the comparable prior year period
|
||||||||||||||||||||||||||||||
17
The following table reconciles Earnings per share - diluted to Adjusted earnings per share - diluted for the periods indicated.
|
Three Months Ended
|
Six Months Ended
|
|||||||||||
|
12/3/2016
|
11/28/2015
|
12/3/2016
|
11/28/2015
|
|||||||||
|
Earnings per Share - Diluted
|
$
|
0.53
|
|
$
|
0.57
|
|
$
|
1.13
|
|
$
|
1.13
|
|
|
Add: Restructuring expenses
|
0.01
|
|
—
|
|
0.01
|
|
—
|
|
||||
|
Adjusted Earnings per Share - Diluted
|
$
|
0.54
|
|
$
|
0.57
|
|
$
|
1.14
|
|
$
|
1.13
|
|
|
Weighted Average Shares Outstanding (used for Calculating Adjusted Earnings per Share) – Diluted
|
60,354,760
|
|
60,411,540
|
|
60,382,932
|
|
60,349,259
|
|
||||
Analysis of
Second
Quarter Results
The
six months ended
December 3, 2016
and
November 28, 2015
contained 27 and 26 weeks, respectively. The following table presents certain key highlights from the results of operations for the periods indicated.
|
(In millions, except per share data)
|
Three Months Ended
|
Six Months Ended
|
|||||||||||||||||||
|
December 3, 2016
|
November 28, 2015
|
Percent
Change
|
December 3, 2016
|
November 28, 2015
|
Percent
Change |
||||||||||||||||
|
Net sales
|
$
|
577.5
|
|
$
|
580.4
|
|
(0.5
|
)%
|
$
|
1,176.1
|
|
$
|
1,145.8
|
|
2.6
|
%
|
|||||
|
Cost of sales
|
359.5
|
|
356.0
|
|
1.0
|
%
|
728.1
|
|
704.6
|
|
3.3
|
%
|
|||||||||
|
Gross margin
|
218.0
|
|
224.4
|
|
(2.9
|
)%
|
448.0
|
|
441.2
|
|
1.5
|
%
|
|||||||||
|
Operating expenses
|
167.4
|
|
168.9
|
|
(0.9
|
)%
|
341.0
|
|
330.6
|
|
3.1
|
%
|
|||||||||
|
Restructuring expenses
|
1.0
|
|
—
|
|
n/a
|
|
1.0
|
|
—
|
|
n/a
|
|
|||||||||
|
Total operating expenses
|
168.4
|
|
168.9
|
|
(0.3
|
)%
|
342.0
|
|
330.6
|
|
3.4
|
%
|
|||||||||
|
Operating earnings
|
49.6
|
|
55.5
|
|
(10.6
|
)%
|
106.0
|
|
110.6
|
|
(4.2
|
)%
|
|||||||||
|
Other expenses, net
|
4.3
|
|
3.5
|
|
22.9
|
%
|
7.4
|
|
7.9
|
|
(6.3
|
)%
|
|||||||||
|
Earnings before income taxes and equity income
|
45.3
|
|
52.0
|
|
(12.9
|
)%
|
98.6
|
|
102.7
|
|
(4.0
|
)%
|
|||||||||
|
Income tax expense
|
14.5
|
|
17.2
|
|
(15.7
|
)%
|
31.6
|
|
34.2
|
|
(7.6
|
)%
|
|||||||||
|
Equity income from nonconsolidated affiliates, net of tax
|
0.8
|
|
0.1
|
|
700.0
|
%
|
1.1
|
|
0.2
|
|
450.0
|
%
|
|||||||||
|
Net earnings
|
$
|
31.6
|
|
$
|
34.9
|
|
(9.5
|
)%
|
$
|
68.1
|
|
$
|
68.7
|
|
(0.9
|
)%
|
|||||
|
Net (loss) earnings attributable to noncontrolling interests
|
(0.1
|
)
|
0.2
|
|
(150.0
|
)%
|
0.1
|
|
0.5
|
|
(80.0
|
)%
|
|||||||||
|
Net earnings attributable to Herman Miller, Inc.
|
$
|
31.7
|
|
$
|
34.7
|
|
(8.6
|
)%
|
$
|
68.0
|
|
$
|
68.2
|
|
(0.3
|
)%
|
|||||
|
Earnings per share — diluted
|
$
|
0.53
|
|
$
|
0.57
|
|
(7.0
|
)%
|
$
|
1.13
|
|
$
|
1.13
|
|
—
|
%
|
|||||
|
Orders
|
$
|
575.9
|
|
$
|
601.4
|
|
(4.2
|
)%
|
$
|
1,171.5
|
|
$
|
1,164.7
|
|
0.6
|
%
|
|||||
|
Backlog
|
$
|
318.9
|
|
$
|
341.1
|
|
(6.5
|
)%
|
|||||||||||||
18
The following table presents, for the periods indicated, select components of the company's Condensed Consolidated Statements of Comprehensive Income as a percentage of net sales.
|
Three Months Ended
|
Six Months Ended
|
||||||||||
|
December 3, 2016
|
November 28, 2015
|
December 3, 2016
|
November 28, 2015
|
||||||||
|
Net sales
|
100.0
|
%
|
100.0
|
%
|
100.0
|
%
|
100.0
|
%
|
|||
|
Cost of sales
|
62.3
|
|
61.3
|
|
61.9
|
|
61.5
|
|
|||
|
Gross margin
|
37.7
|
|
38.7
|
|
38.1
|
|
38.5
|
|
|||
|
Operating expenses
|
29.0
|
|
29.1
|
|
29.0
|
|
28.9
|
|
|||
|
Restructuring expenses
|
0.2
|
|
—
|
|
0.1
|
|
—
|
|
|||
|
Total operating expenses
|
29.2
|
|
29.1
|
|
29.1
|
|
28.9
|
|
|||
|
Operating earnings
|
8.6
|
|
9.6
|
|
9.0
|
|
9.7
|
|
|||
|
Other expenses, net
|
0.7
|
|
0.6
|
|
0.6
|
|
0.7
|
|
|||
|
Earnings before income taxes and equity income
|
7.8
|
|
9.0
|
|
8.4
|
|
9.0
|
|
|||
|
Income tax expense
|
2.5
|
|
3.0
|
|
2.7
|
|
3.0
|
|
|||
|
Equity income from nonconsolidated affiliates, net of tax
|
0.1
|
|
—
|
|
0.1
|
|
—
|
|
|||
|
Net earnings
|
5.5
|
|
6.0
|
|
5.8
|
|
6.0
|
|
|||
|
Net earnings attributable to noncontrolling interests
|
—
|
|
—
|
|
—
|
|
—
|
|
|||
|
Net earnings attributable to Herman Miller, Inc.
|
5.5
|
|
6.0
|
|
5.8
|
|
6.0
|
|
|||
Performance versus the Domestic Contract Furniture Industry
The Business and Institutional Furniture Manufacturer's Association (BIFMA) is the trade association for the North American contract furniture industry. The company monitors the trade statistics reported by BIFMA and considers them an indicator of industry-wide sales and order performance. BIFMA publishes statistical data for the contract segment and the office supply segment within the North American market. The contract segment of the industry relates primarily to products sold to large to mid-size corporations and installed via a network of dealers. The office supply segment relates primarily to products sold to smaller customers via wholesalers and retailers. The company participates, and is a leader in, the contract segment. Further, the company's diversification strategy lessens its dependence on the North American contract office furniture market.
The company analyzes BIFMA statistical information as a benchmark comparison against the performance of its contract business in North America and also to that of its competitors. The timing of large project-based business may affect comparisons to this data in any one period. Finally, BIFMA regularly provides its members with industry forecast information, which the company uses internally as one of several considerations in its short and long-range planning process.
After many years of compiling and reporting member production data for the U.S. market, BIFMA has revised its data collection process in an attempt to better reflect contract furniture production throughout North America, including products manufactured in Canada and Mexico. The BIFMA data collection process changed during the fourth quarter of the company's 2016 fiscal year. Prior to this change, products manufactured in Canada or Mexico and shipped to the U.S. were excluded from BIFMA’s estimate of industry shipments and orders. The new methodology was designed to provide a better reflection of the market as a whole, especially given the rise in competition based in Canada and Mexico as well as sourcing moves by the company's existing competitors. Additionally, BIFMA revised its product definitions to better fit products specifically designed for the Healthcare and Education end markets. The overall effect of these revisions is that the estimated market size for the North American contract industry increased substantially - resulting in a re-orientation of market share estimates across each industry participant. The BIFMA statistics that are mentioned throughout this document are based on the revised method of compiling the industry data.
While the sales and order data for our North American reportable segment provide a relative comparison to BIFMA, it is not intended to be an exact comparison. The data we report to BIFMA is consistent with the BIFMA definition of office furniture “consumption.” This definition differs slightly from the categorization we have presented in this report. Notwithstanding this difference, we believe our presentation provides the reader with a relevant comparison.
For the three month period ended
December 3, 2016
, the company's domestic United States shipments, as defined by BIFMA, decreased by 5.0 percent while the company's domestic orders decreased by 2.9 percent year-over-year. BIFMA reported an estimated year-over-year increase in shipments of 0.4 percent and an increase in orders of 0.9 percent for the comparable period.
19
Performance versus the Consumer Furnishings Sector
We also monitor trade statistics reported by the U.S. Census Bureau, which reports monthly retail sales growth data across a number of retail categories, including
Furniture and Home Furnishing Stores
. This information provides a relative comparison to our Consumer segment, but is not intended to be an exact comparison. The average monthly year-over-year growth rate in sales for the Furniture and Home Furnishing Stores category for the three month period ended
December 3, 2016
was approximately 4.1 percent. By comparison, net sales in our Consumer segment increased by approximately
7.7 percent
for the three months ended
December 3, 2016
.
20
Consolidated Sales
The following charts present graphically the primary drivers of the year-over-year change in net sales for the three and
six
-months ended
December 3, 2016
. The amounts presented in the bar graphs are expressed in millions and have been rounded to eliminate decimals.
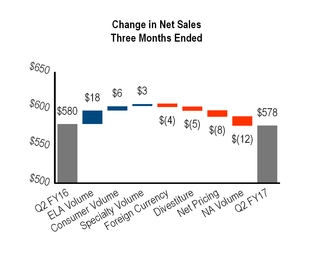
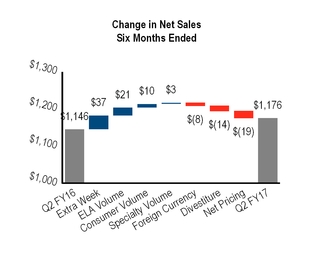
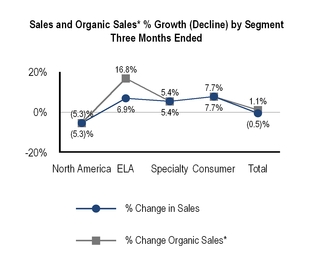
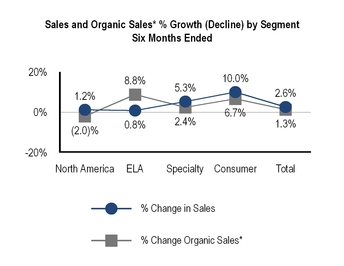
Consolidated net sales
decreased
$2.9 million
or
0.5 percent
for the
second
quarter of
fiscal 2017
compared to the
second
quarter of
fiscal 2016
. The following items led to the change:
|
•
|
Increased sales volumes within the ELA segment of approximately $17.5 million, which were driven primarily by growth in Asia and Latin America.
|
|
•
|
Increased sales volumes within the Consumer segment of approximately $5.7 million, which were due to increased sales improvements across several Consumer sales channels, including contract, e-commerce, studios and direct-mail catalogs.
|
|
•
|
The impact of the divestiture of the company's dealership in Australia during fiscal 2016 had the effect of reducing sales by approximately
$4.9 million
in the current
three
month period as compared to the same period of the prior fiscal year.
|
|
•
|
Incremental price discounting, decreased net sales in the second quarter of fiscal 2017 by approximately $8 million compared to the prior year.
|
|
•
|
Decreased sales volumes within the North American segment of $11.8 million, resulting from decreased demand within the company's core contract furniture business unit.
|
*Non-GAAP measurements; see accompanying reconciliations and explanations.
21
Consolidated net sales
increased
$30.3 million
or
2.6 percent
in the first half of
fiscal 2017
compared to the first half of
fiscal 2016
. The following items led to the change:
|
•
|
The
six
month period for fiscal 2017 had 27 weeks as compared to the same period of fiscal 2016, which had 26 weeks. The impact of this additional week increased net sales by approximately $37.0 million.
|
|
•
|
Increased sales volumes within the ELA segment of approximately $20.5 million, which were driven primarily by growth in Asia and Latin America.
|
|
•
|
Increased sales volumes within the Consumer segment of approximately $9.5 million, which were due to increased sales improvements across all Consumer sales channels, including contract, e-commerce, wholesale business to other retailers, studios and direct-mail catalogs.
|
|
•
|
The impact of the divestiture of the company's dealership in Australia during fiscal 2016 had the effect of reducing sales by approximately $13.7 million in the current
six
month period as compared to the same period of the prior fiscal year.
|
|
•
|
Incremental price discounting, decreased net sales in the second quarter of fiscal 2017 by approximately $19 million compared to the prior year.
|
Consolidated Gross Margin
Consolidated gross margin was
37.7 percent
for the
three
month period ending
December 3, 2016
as compared to
38.7 percent
for the same quarter of the prior fiscal year. The following factors summarize the major drivers of the year-over-year change in gross margin percentage:
|
•
|
Incremental price discounting reduced the company's consolidated gross margin by approximately 90 basis points relative to the same period of last fiscal year.
|
|
•
|
Higher commodity costs in the current fiscal year drove an unfavorable year-over-year margin impact of approximately 50 basis points.
|
|
•
|
A decrease in employee incentive costs increased our consolidated gross margin by 30 basis points relative to the three-month comparative period of last fiscal year. The decrease reflects lower employee incentive costs that are variable based on the achievement of planned earnings levels for the fiscal year.
|
|
•
|
Improved direct labor and overhead costs related to production volume leverage and lower benefits costs at the company's Geiger subsidiary drove an improvement of 10 basis points compared to the same period of last fiscal year.
|
Consolidated gross margin was
38.1 percent
for the
six
month period ending
December 3, 2016
as compared to
38.5 percent
for the same period of the prior year. The following factors summarize the major drivers of the year-over-year change in gross margin percentage:
|
•
|
Incremental price discounting reduced the company's consolidated gross margin by approximately 100 basis points relative to the same period of last fiscal year.
|
|
•
|
Operational improvements, a shift in product mix and cost savings initiatives at the company's West Michigan manufacturing facilities reduced direct material costs, driving an improvement in gross margin of 40 basis points compared to the prior year.
|
|
•
|
A decrease in employee incentive costs increased our consolidated gross margin by 30 basis points relative to the three-month comparative period of last fiscal year. The decrease reflects lower employee incentive costs that are variable based on the achievement of planned earnings levels for the fiscal year.
|
|
•
|
Higher commodity costs in the current fiscal year drove an unfavorable year-over-year margin impact of approximately 30 basis points.
|
|
•
|
Improved direct labor costs related to production volume leverage and lower benefits costs at the company's Geiger subsidiary drove an improvement of 10 basis points compared to the same period of last fiscal year.
|
22
Operating Expenses and Operating Earnings
The following chart presents graphically the primary drivers of the year-over-year change in operating expenses for the three and
six
-months ended
December 3, 2016
. The amounts presented in the bar graphs are expressed in millions and have been rounded to eliminate decimals.
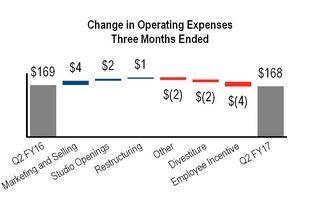
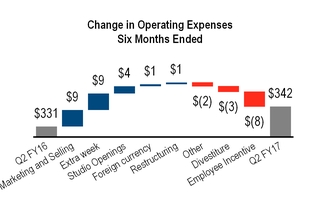
Consolidated operating expenses decreased
$0.5 million
or
0.3 percent
and increased
$11.4 million
or
3.4 percent
in the
second
quarter and first
six
months of
fiscal 2017
, respectively, compared to the prior year periods. The following factors contributed to the changes:
|
•
|
The impact of an extra week in fiscal 2017 increased operating expenses by approximately
$9 million
during the
six month period
.
|
|
•
|
Marketing and selling expenses increased
$3.5 million
and
$8.6 million
in the three and six month periods, respectively, relative to the same period of last fiscal year. The increase resulted from new marketing initiatives, particularly within the Consumer segment, as well as increases in selling capacity, during the comparative periods.
|
|
•
|
Incremental occupancy costs driven by studio openings of approximately $2 million and approximately $4 million for the three and six month comparative periods, respectively.
|
|
•
|
Employee incentive costs decreased by
$4.4 million
and
$8.0 million
for the three and six month comparative periods, respectively. The decrease reflects lower incentive compensation costs that are variable based on the achievement of planned earnings levels for the fiscal year.
|
|
•
|
The remainder of the change for the
three
and
six
month comparative periods was driven mainly by the divestiture of the company's dealership in Australia, offset by restructuring charges that were incurred in the second quarter of fiscal 2017 related to targeted workforce reductions.
|
Operating earnings for the three and
six
month periods ended
December 3, 2016
were
$49.6 million
or
8.6 percent
of sales and
106.0 million
or
9.0 percent
of sales, respectively. This compares to
$55.5 million
or
9.6 percent
of sales and
110.6 million
or
9.7 percent
of sales for the respective periods during last fiscal year.
Other Income/Expense and Income Taxes
During the
three months ended
December 3, 2016
, net other expense was
$4.3 million
, an increase of
$0.8 million
compared to the same period in the prior year. This increase in expense was driven by increased foreign currency losses as compared to the prior year. Net other expense of
$7.4 million
in the first
six
months of
fiscal 2017
decreased
$0.5 million
compared to the same period in the prior year. The decrease in net other expenses in fiscal 2017 as compared to fiscal 2016 was primarily related to higher investment income associated with the company's deferred compensation plan.
The effective tax rates for the
three
month periods ended
December 3, 2016
and
November 28, 2015
were
32.0 percent
and
33.0 percent
, respectively. The effective tax rates for the
six
month periods ended
December 3, 2016
and
November 28, 2015
were
32.0 percent
and
33.3 percent
, respectively. The company's United States federal statutory rate is 35 percent.
The decrease in the effective tax rate for the three month and six month periods ended
December 3, 2016
was a result of an increase in the mix of earnings in tax jurisdictions that have rates lower than the United States statutory rate along with the Protecting Americans from Tax Hikes (PATH) Act of 2015, which resulted in a permanent extension of the research and development credit, which had expired on December 31, 2014. The Act was effective in December 2015, hence the company recognized no benefit of this credit in the second quarter of last fiscal year. Rather, the impact of the permanent extension was recognized within the tax rate in the third quarter of last fiscal year and in subsequent quarters thereafter.
23
The effective tax rates for the
three
and
six
month periods ended
December 3, 2016
and
November 28, 2015
were lower than the United States statutory rate due to the manufacturing deduction under the American Jobs Creation Act of 2004 (“AJCA”) and the mix of earnings in taxing jurisdictions that have rates that are lower than the United States statutory rate. The effective tax rates for the
three
and
six
month periods ended
December 3, 2016
were also lower than the United States statutory rate due to the Protecting Americans from Tax Hikes ("PATH") Act of 2015, which resulted in a permanent extension of the research and development credit as described above.
Reportable Operating Segment Results
The business is comprised of various operating segments as defined by generally accepted accounting principles in the United States. These operating segments are determined on the basis of how the company internally reports and evaluates financial information used to make operating decisions. For external reporting purposes, the company has identified the following reportable segments:
|
•
|
North American Furniture Solutions
— Includes the operations associated with the design, manufacture, and sale of furniture products for work-related settings, including office, education, and healthcare environments, throughout the United States and Canada.
|
|
•
|
ELA Furniture Solutions
— Includes EMEA, Latin America, and Asia-Pacific operations associated with the design, manufacture and sale of furniture products, primarily for work-related settings.
|
|
•
|
Specialty
— Includes operations associated with the design, manufacture, and sale of high-craft furniture products and textiles including Geiger wood products, Maharam textiles, and Herman Miller Collection products.
|
|
•
|
Consumer
— Includes operations associated with the sale of modern design furnishings and accessories to third party retail distributors, as well as direct-to-consumer sales through eCommerce and DWR retail studios and outlets.
|
The charts below present the relative mix of net sales and operating earnings across the company's reportable segments during the
three
and
six
month period ended
December 3, 2016
. This is followed by a discussion of the company's results, by reportable segment.
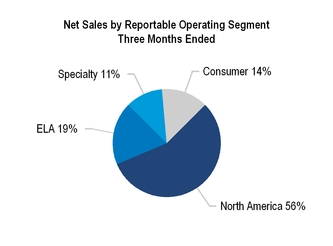
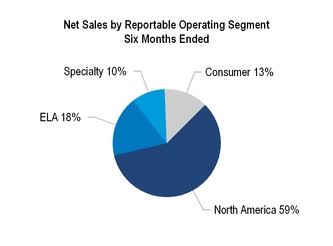
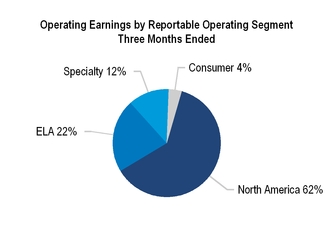
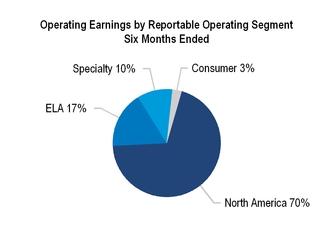
24
North American Furniture Solutions ("North America")
Three Months Ended
December 3, 2016
Net sales totaled
$329.5 million
for the
second
quarter of
fiscal 2017
,
a decrease
of
5.3 percent
from the
second
quarter of
fiscal 2016
. Orders totaled
$338.3 million
a decrease
of
3.1 percent
from the same period in the prior year. Operating earnings for the
second
quarter of fiscal 2017 were
$31.0 million
or
9.4 percent
of sales as compared to
$41.4 million
or
11.9 percent
of sales in the
second
quarter of
fiscal 2016
.
|
•
|
Sales volumes within the North American segment decreased by approximately $11.8 million. This was driven by decreased demand within the company's core contract furniture business unit.
|
|
•
|
Incremental price discounting in the current quarter, drove an estimated decrease in net sales of approximately $7 million.
|
|
•
|
Commodity price increases and incremental discounting drove a decrease in margins and operating earnings.
|
|
•
|
Operating expenses within the North American segment were lower than the prior year primarily as a result of decreased employee incentive costs.
|
Six Months Ended
December 3, 2016
Net sales totaled
$694.6 million
for the first
six
months of
fiscal 2017
,
an increase
of
1.2 percent
from the same period of the prior year. Orders totaled
$686.0 million
,
an increase
of
0.7 percent
from the same period in the prior year. Operating earnings for the first
six
months of
fiscal 2017
were
$74.2 million
or
10.7 percent
of sales as compared to
$82.2 million
or
12.0 percent
of sales in same period of the prior year.
|
•
|
The impact of the extra week increased net sales by $22.7 million and increased orders by $21.0 million in the first half of fiscal 2017 as compared to the same period in the prior year.
|
|
•
|
Incremental price discounting in the current six month period, drove an estimated decrease in net sales of approximately $15 million.
|
|
•
|
Commodity price increases and incremental discounting drove a decrease in margins and operating earnings.
|
|
•
|
Operating expenses within the North American segment were higher than the prior year primarily as a result of increased sales and marketing expenses, increased research and development expenses and the impact of the extra week of operations, partially offset by decreased employee incentive costs.
|
ELA Furniture Solutions ("ELA")
Three Months Ended
December 3, 2016
Net sales totaled
$107.6 million
for the
second
quarter of
fiscal 2017
,
an increase
of
6.9 percent
from the
second
quarter of
fiscal 2016
. Orders totaled
$99.7 million
,
a decrease
of
11.5 percent
from the same period in the prior year. Operating earnings for the
second
quarter of
fiscal 2017
were
$10.8 million
or
10.0 percent
of sales as compared to
$7.3 million
or
7.2 percent
of sales in the
second
quarter of
fiscal 2016
.
|
•
|
Sales volumes within the ELA segment increased by approximately $17.5 million. This increase was driven primarily by growth in Asia and Latin America.
|
|
•
|
The
second
quarter of
fiscal 2016
included the results of the company’s dealership in Australia that was divested in the fourth quarter of fiscal 2016. Accordingly, the year-over-year increase in sales volumes for the ELA segment was partially offset by a $4.9 million decrease in net sales due to the divestiture. The divestiture also decreased orders by $6.8 million year-over-year.
|
|
•
|
Foreign currency translation decreased net sales by approximately $4.3 million.
|
|
•
|
A year-over-year decrease in operating expenses was driven by reductions in marketing and selling, research and development, employee incentive costs and the divestiture of the company’s dealership in Australia.
|
Six Months Ended
December 3, 2016
Net sales totaled
$204.9 million
for the first
six
months of
fiscal 2017
,
an increase
of
0.8 percent
from the same period of the prior year. Orders totaled
$209.5 million
,
a decrease
of
5.2 percent
from the same period in the prior year. Operating earnings for the first
six
months of
fiscal 2017
were
$18.0 million
or
8.8 percent
of sales as compared to
$13.9 million
or
6.8 percent
of sales in same period of the prior year.
|
•
|
Sales volumes within the ELA segment increased by approximately $20.5 million. This increase was driven primarily by growth in Asia and Latin America.
|
|
•
|
The comparative six month period of
fiscal 2016
included the results of the company’s dealership in Australia that was divested in the fourth quarter of fiscal 2016. This offset the year-over-year increase in net sales by $13.7 million. The divestiture also decreased orders by $22.7 million year-over-year.
|
|
•
|
Foreign currency translation decreased net sales by approximately $7.5 million.
|
|
•
|
The impact of the extra week increased net sales by $6.3 million in the first half of fiscal 2017 as compared to the same period in the prior year.
|
|
•
|
A broad-based decrease in operating expenses was driven by reductions in marketing and selling, research and development, employee incentive costs, foreign currency translation and the divestiture of the company’s dealership in Australia.
|
25
Specialty
Three Months Ended
December 3, 2016
Net sales totaled
$60.8 million
for the
second
quarter of
fiscal 2017
,
an increase
of
5.4 percent
from the
second
quarter of
fiscal 2016
. Orders totaled
$54.5 million
,
a decrease
of
11.1 percent
from the same period in the prior year. Operating earnings for the
second
quarter of
fiscal 2017
were
$5.9 million
or
9.7 percent
of sales as compared to
$4.2 million
or
7.3 percent
of sales in the
second
quarter of
fiscal 2016
.
|
•
|
Sales volumes within the Specialty segment increased by approximately $3.1 million, driven primarily by the company's Geiger subsidiary and the Herman Miller Collection.
|
|
•
|
Improved direct labor costs related to production volume leverage and lower benefits costs resulted in increased operating earnings in the current three month period.
|
Six Months Ended
December 3, 2016
Net sales totaled
$121.6 million
for the first
six
months of
fiscal 2017
,
an increase
of
5.3 percent
from the same period of the prior year. Orders totaled
$121.6 million
,
an increase
of
1.6 percent
from the same period in the prior year. Operating earnings for the first
six
months of
fiscal 2017
were
$11.1 million
or
9.1 percent
of sales as compared to
$8.5 million
or
7.4 percent
of sales in same period of the prior year.
|
•
|
The impact of the extra week increased net sales by $3.3 million in the first half of fiscal 2017 as compared to the same period in the prior year.
|
|
•
|
Sales volumes within the Specialty segment increased by approximately $3.1 million, driven primarily by the company's Geiger subsidiary and the Herman Miller Collection.
|
|
•
|
Improved direct labor costs related to production volume leverage and lower benefits costs resulted in increased operating earnings in the current three month period.
|
Consumer
Three Months Ended
December 3, 2016
Net sales totaled
$79.6 million
for the
second
quarter of
fiscal 2017
,
an increase
of
7.7 percent
from the
second
quarter of
fiscal 2016
. Orders of
$83.4 million
increased
6.6 percent
from the same period in the prior year. Operating earnings for the
second
quarter of
fiscal 2017
were
$1.8 million
or
2.3 percent
of sales as compared to
$2.7 million
or
3.7 percent
of sales in the
second
quarter of
fiscal 2016
.
|
•
|
Increased sales volumes of approximately $5.7 million were due to improvements across several Consumer sales channels, including contract, e-commerce, studios and direct-mail catalogs.
|
|
•
|
Operating expenses within the Consumer segment were higher than the prior year primarily as a result of incremental occupancy costs driven by studio openings of approximately $2 million and increased employee incentive costs.
|
Six Months Ended
December 3, 2016
Net sales totaled
$155.0 million
for the first
six
months of
fiscal 2017
,
an increase
of
10.0 percent
from the same period of the prior year. Orders of
$154.4 million
increased
8.0 percent
from the same period in the prior year. Operating earnings for the first
six
months of
fiscal 2017
were
$2.6 million
or
1.7 percent
of sales as compared to
$6.5 million
or
4.6 percent
of sales in the
second
quarter of
fiscal 2016
.
|
•
|
Increased sales volumes of approximately $9.5 million were due to improvements across all Consumer sales channels, including e-commerce, wholesale business to other retailers, studios and direct-mail catalogs.
|
|
•
|
The impact of the extra week increased net sales by $4.7 million in the first half of fiscal 2017 as compared to the same period in the prior year.
|
|
•
|
Operating expenses within the Consumer segment were higher than the prior year primarily as a result of incremental occupancy costs driven by studio openings of approximately $4 million, increased employee incentive costs, increased sales and marketing expenses and the impact of the extra week of operations.
|
26
Financial Condition, Liquidity and Capital Resources
The table below presents certain key cash flow and capital highlights for the periods indicated.
|
(In millions)
|
Six Months Ended
|
||||||
|
December 3, 2016
|
November 28, 2015
|
||||||
|
Cash and cash equivalents, end of period
|
$
|
71.9
|
|
$
|
54.7
|
|
|
|
Marketable securities, end of period
|
7.8
|
|
5.4
|
|
|||
|
Cash provided by operating activities
|
94.4
|
|
73.2
|
|
|||
|
Cash used in investing activities
|
(77.3
|
)
|
(34.7
|
)
|
|||
|
Cash used in financing activities
|
(30.3
|
)
|
(47.3
|
)
|
|||
|
Capital expenditures
|
(46.7
|
)
|
(35.2
|
)
|
|||
|
Stock repurchased and retired
|
(12.1
|
)
|
(3.7
|
)
|
|||
|
Common stock issued
|
6.5
|
|
5.6
|
|
|||
|
Dividends paid
|
(19.0
|
)
|
(17.2
|
)
|
|||
|
Interest-bearing debt, end of period
|
219.6
|
|
256.8
|
|
|||
|
Available unsecured credit facility, end of period
(1)
|
$
|
371.9
|
|
$
|
184.4
|
|
|
(1)
Amounts shown are net of outstanding letters of credit of
$8.4 million
and $8.6 million as of
December 3, 2016
and
November 28, 2015
, respectively, which are applied against availability under the company's unsecured credit facility.
Cash Flows - Operating Activities
Six
Month Period Ended
December 3, 2016
Cash generated from operating activities was
$94.4 million
for the
six
month period ended
December 3, 2016
, as compared to
$73.2 million
in the same period of the prior year. During the current
six
month period, changes in working capital balances drove a
use
of cash totaling
$14.6 million
. The main factors driving this
use
of cash were
an increase
in inventory of
$22.1 million
and
a decrease
in accrued compensation and benefits of
$10.9 million
. Inventory increased due to new product launches and inventory stocking related to upcoming holiday sales within the Consumer segment. Accrued compensation and benefits decreased due to the annual payout of accrued bonus and profit sharing and due to lower employee incentive cost accruals as compared to the prior year. These factors more than offset drivers within working capital that increased cash, primarily
a decrease
in accounts and notes receivable of
$15.8 million
.
Six
Month Period Ended
November 28, 2015
Cash generated from operating activities was $73.2 million for the six month period ended November 28, 2015. This was due to changes in working capital balances that drove a use of cash totaling $31.2 million. The main factors driving this use of cash from working capital were an increase in accounts receivable of $32.0 million, an increase in inventory of $4.2 million, an increase in prepaid expenses of $6.0 million, and a decrease in accounts payable of $7.2 million. These factors more than offset drivers within working capital that increased cash, including an increase in accrued compensation and benefits of $7.1 million and an increase in accrued taxes of $5.2 million.
Cash Flows - Investing Activities
Investing activities in the first
six
months of
fiscal 2017
resulted in a net cash
outflow
of
$77.3 million
as compared to a net cash
outflow
of
$34.7 million
in the same period of the prior year. The largest contributor to the change in cash used in investing activities as compared to the prior year was the repayment of loans against the cash surrender value of life insurance in the amount of $15.3 million. The cash surrender value of the company-owned life insurance policies and the loans were previously recorded net within "Other noncurrent assets" within the Condensed Consolidated Balance Sheets. Additionally, equity investments in noncontrolled entities resulted in a cash outlay of
$14.5 million
during the first two quarters of fiscal 2017.
The company had cash outflows for the purchase of
$46.7 million
of capital assets in the first
six
months of fiscal 2017 as compared to
$35.2 million
during the first
six
months of the prior year. At the end of the
second
quarter of
fiscal 2017
, there were outstanding commitments for capital purchases of
$11.7 million
compared to
$11.4 million
at the corresponding date in the prior year. The company expects full-year capital purchases to be between $85.0 million and $95.0 million, which will be primarily related to investments in the company's facilities and equipment. This compares to full-year capital spending of $85.1 million in
fiscal 2016
.
27
Cash Flows - Financing Activities
Cash
outflows
from financing activities were
$30.3 million
for the first
six
months of
fiscal 2017
compared to cash
outflows
of
$47.3 million
during the same period of the prior year. Cash
outflows
from net
repayments
on our revolving credit facility were
$2.3 million
during the
six
-month period of
fiscal 2017
. By comparison, cash
outflows
from net
repayments
were
$33.0 million
during the same period of
fiscal 2016
. Cash outflows for dividend payments were
$19.0 million
and
$17.2 million
for the
six
month periods of
fiscal 2017
and
fiscal 2016
, respectively. Cash paid for the retirement of common stock was
$12.1 million
as compared to
$3.7 million
in the first six months of fiscal 2017 and 2016, respectively. Cash inflows for stock issuances related to employee benefit programs were
$6.5 million
and
$5.6 million
during the
six
month periods of
fiscal 2017
and
fiscal 2016
, respectively.
Some minority shareholders in a subsidiary have the right, at certain times, to require the company to acquire a portion of their ownership interest in those entities at fair value. During the six months ended
December 3, 2016
, the company purchased $1.5 million of minority ownership shares as compared to zero in the same period prior year. It is possible that within the next three years the company could be required to acquire the balance of this ownership interest. The fair value of this redeemable noncontrolling interest as of
December 3, 2016
was
$25.4 million
and is included within "Redeemable noncontrolling interests" on the Consolidated Balance Sheets.
Sources of Liquidity
In addition to cash flows from operating activities, the company has access to liquidity through credit facilities, cash and cash equivalents, and short-term investments. These sources have been summarized below. For additional information, refer to Note 12 to the condensed consolidated financial statements.
|
(In millions)
|
December 3, 2016
|
November 28, 2015
|
||||
|
Cash and cash equivalents
|
$
|
71.9
|
|
$
|
54.7
|
|
|
Marketable securities
|
7.8
|
|
5.4
|
|
||
|
Availability under syndicated revolving line of credit
|
$
|
371.9
|
|
$
|
184.4
|
|
At the end of the
second
quarter of
fiscal 2017
, the company had cash and cash equivalents of
$71.9 million
including
$68.9 million
of cash and cash equivalents held outside the United States. In addition, the company had marketable securities of
$7.8 million
held by one of its international subsidiaries. The subsidiary holding the company's marketable securities is taxed as a United States taxpayer at the company's election. Consequently, for tax purposes, all United States tax impacts for this subsidiary have been recorded. The company currently has no plans to repatriate cash from foreign subsidiaries during fiscal 2017.
The company has
$9.8 million
of cash held outside of the United States for which United States taxes have been recorded. The company's intent is to permanently reinvest the remainder of the cash outside of the United States. The company's plans do not indicate a need to repatriate these balances to fund United States operations.
The company believes cash on hand, cash generated from operations, and borrowing capacity will provide adequate liquidity to fund near term and foreseeable future business operations, capital needs, future dividends and share repurchases, subject to financing availability in the marketplace.
Contractual Obligations
Contractual obligations associated with ongoing business and financing activities will require cash payments in future periods. A table summarizing the amounts and estimated timing of these future cash payments as of May 30, 2016 was provided in the company's annual report on Form 10-K for the year ended
May 28, 2016
. There has been no material change in such obligations since that date.
Guarantees
The company provides certain guarantees to third parties under various arrangements in the form of product warranties, loan guarantees, standby letters of credit, lease guarantees, performance bonds and indemnification provisions. These arrangements are accounted for and disclosed in accordance with FASB ASC Topic 460,
Guarantees,
as described in Note 12 to the condensed consolidated financial statements.
Variable Interest Entities
On occasion, the company provides financial support to certain independent dealers in the form of term loans, lines of credit, and/or loan guarantees that may represent variable interests in such entities. As of
December 3, 2016
, the company was not considered to be the primary
28
beneficiary of any such dealer relationships under FASB ASC Topic 810,
Consolidation.
Accordingly, the company is not required to consolidate the financial statements of any of these entities as of
December 3, 2016
.
Contingencies
See Note 12 to the condensed consolidated financial statements.
Critical Accounting Policies
The company strives to report financial results clearly and understandably. The company follows accounting principles generally accepted in the United States in preparing its consolidated financial statements, which require certain estimates and judgments that affect the financial position and results of operations for the company. The company continually reviews the accounting policies and financial information disclosures. A summary of the more significant accounting policies that require the use of estimates and judgments in preparing the financial statements is provided in the company's annual report on Form 10-K for the year ended
May 28, 2016
. During the first
six
months of
fiscal 2017
, there were no material changes in the accounting policies and assumptions previously disclosed.
New Accounting Standards
See Note 2 to the condensed consolidated financial statements.
Safe Harbor Provisions
Certain statements in this filing are not historical facts but are “forward-looking statements” as defined under Section 27A of the Securities Act of 1933, as amended, and Section 21E of the Securities Exchange Act, as amended, that are based on management’s beliefs, assumptions, current expectations, estimates, and projections about the office furniture industry, the economy, and the company itself. Words like “anticipates,” “believes,” “confident,” “estimates,” “expects,” “forecasts,” likely,” “plans,” “projects,” and “should,” variations of such words, and similar expressions identify such forward-looking statements. These statements do not guarantee future performance and involve certain risks, uncertainties, and assumptions that are difficult to predict with regard to timing, extent, likelihood, and degree of occurrence. These risks include, without limitation, the success of our growth strategy, employment and general economic conditions, the pace of economic recovery in the U.S., and in our International markets, the increase in white collar employment, the willingness of customers to undertake capital expenditures, the types of products purchased by customers, competitive-pricing pressures, the availability and pricing of raw materials, our reliance on a limited number of suppliers, our ability to expand globally given the risks associated with regulatory and legal compliance challenges and accompanying currency fluctuations, the ability to increase prices to absorb the additional costs of raw materials, the financial strength of our dealers and the financial strength of our customers, our ability to locate new DWR studios, negotiate favorable lease terms for new and existing locations and the implementation of our studio portfolio transformation, our ability to attract and retain key executives and other qualified employees, our ability to continue to make product innovations, the success of newly-introduced products, our ability to serve all of our markets, possible acquisitions, divestitures or alliances, the pace and level of government procurement, the outcome of pending litigation or governmental audits or investigations, political risk in the markets we serve, and other risks identified in our filings with the Securities and Exchange Commission. Therefore, actual results and outcomes may materially differ from what we express or forecast. Furthermore, Herman Miller, Inc., undertakes no obligation to update, amend or clarify forward-looking statements.
29
The information concerning quantitative and qualitative disclosures about market risk contained in the company’s Annual Report on Form 10-K for its fiscal year ended
May 28, 2016
has not changed significantly. The nature of market risks from interest rates and commodity prices has not changed materially during the first
six
months of
fiscal 2017
.
Foreign Exchange Risk
The company manufactures its products in the United States, United Kingdom, China and India. The company also sources completed products and product components from both inside and outside the United States. The company's completed products are sold in numerous countries around the world. Sales in foreign countries as well as certain expenses related to those sales are transacted in currencies other than the company's reporting currency, the United States dollar. Accordingly, production costs and profit margins related to these sales are affected by the currency exchange relationship between the countries where the sales take place and the countries where the products are sourced or manufactured. These currency exchange relationships can also affect the company's competitive positions within these markets.
The principal foreign currencies in which the company conducts its business are the British pound sterling, European euro, Canadian dollar, Australian dollar, Japanese yen, Mexican peso, Brazilian real, Indian rupee, South African rand, Hong Kong dollar and Chinese renminbi. In the normal course of business, the company enters into forward foreign currency exchange swap contracts. Changes in the fair value of such contracts are reported in earnings in the period the value of the contract changes. The net gain or loss upon settlement and the change in fair value of outstanding contracts is recorded as a component of other expense (income), net.
Evaluation of Disclosure Controls and Procedures
Under the supervision and with the participation of management, including the company's Chief Executive Officer and Chief Financial Officer, management has evaluated the effectiveness of the company's disclosure controls and procedures (as defined in Exchange Act Rules 13a-15(e) and 15d-15(e)) as of
December 3, 2016
, and the company's Chief Executive Officer and Chief Financial officer have concluded that, as of that date, the company's disclosure controls and procedures are effective.
Changes in Internal Control Over Financial Reporting
There were no changes in the company's internal control over financial reporting (as defined in Exchange Act Rules 13a-15(f) and 15d-15(f)) during the quarterly period ended
December 3, 2016
, that have materially affected, or are reasonably likely to materially affect, the company's internal control over financial reporting.
Referred to in Note 12 of the condensed consolidated financial statements.
There have been no material changes in the company's risk factors from those set forth in the company's Annual Report on Form 10-K for the year ended
May 28, 2016
.
30
Issuer Purchases of Equity Securities
The following is a summary of share repurchase activity during the quarter ended
December 3, 2016
.
|
Period
|
(a) Total Number of Shares (or Units)
Purchased
|
(b) Average price Paid per Share or Unit
|
(c) Total Number of Shares (or Units) Purchased as Part of Publicly Announced Plans or Programs
|
(d) Maximum Number (or Approximate Dollar Value) of Shares (or Units) that may yet be Purchased Under the Plans or Programs (in millions)
|
|||||||||
|
9/4/16 - 10/1/16
|
20,188
|
|
$
|
31.80
|
|
20,188
|
|
$
|
124,496,153
|
|
|||
|
10/2/16 - 10/29/16
|
108,174
|
|
$
|
28.15
|
|
108,174
|
|
$
|
121,450,601
|
|
|||
|
10/30/16 - 12/3/16
|
43,103
|
|
$
|
28.18
|
|
43,103
|
|
$
|
120,235,900
|
|
|||
|
Total
|
171,465
|
|
171,465
|
|
|||||||||
No repurchase plans expired or were terminated during the
second
quarter of fiscal 2017, nor do any plans exist under which the company does not intend to make further purchases. The Board has the authority to terminate any further repurchases.
During the period covered by this report, the company did not sell any of its equity securities that were not registered under the Securities Act of 1933.
None
Not applicable
None
31
The following exhibits (listed by number corresponding to the Exhibit table as Item 601 in Regulation S-K) are filed with this Report:
|
Exhibit Number
|
Document
|
|
31.1
|
Certificate of the Chief Executive Officer pursuant to Section 302 of the Sarbanes-Oxley Act of 2002.
|
|
31.2
|
Certificate of the Chief Financial Officer pursuant to Section 302 of the Sarbanes-Oxley Act of 2002.
|
|
32.1
|
Certificate of the Chief Executive Officer pursuant to Section 906 of the Sarbanes-Oxley Act of 2002.
|
|
32.2
|
Certificate of the Chief Financial Officer pursuant to Section 906 of the Sarbanes-Oxley Act of 2002.
|
|
101.INS
|
The instance document does not appear in the interactive data file because its XBRL tags are embedded within the inline XBRL document.
|
|
101.SCH
|
XBRL Taxonomy Extension Schema Document
|
|
101.CAL
|
XBRL Taxonomy Extension Calculation Linkbase Document
|
|
101.LAB
|
XBRL Taxonomy Extension Label Linkbase Document
|
|
101.PRE
|
XBRL Taxonomy Extension Presentation Linkbase Document
|
|
101.DEF
|
XBRL Taxonomy Extension Definition Linkbase Document
|
32
SIGNATURES
Pursuant to the requirements of the Securities Exchange Act of 1934, the registrant has duly caused this report to be signed on its behalf by the undersigned hereto duly authorized.
HERMAN MILLER, INC.
|
January 11, 2017
|
/s/ Brian C. Walker
|
|||
|
Brian C. Walker
|
||||
|
Chief Executive Officer
|
||||
|
(Duly Authorized Signatory for Registrant)
|
||||
|
January 11, 2017
|
/s/ Jeffrey M. Stutz
|
|||
|
Jeffrey M. Stutz
|
||||
|
Chief Financial Officer
|
||||
|
(Duly Authorized Signatory for Registrant)
|
||||
33
TABLE OF CONTENTS
Item 2: Management's Discussion and Analysis Of Financial Condition and Results Of OperationsItem 3: Quantitative and Qualitative Disclosures About Market RiskItem 4: Controls and ProceduresPart II - Other InformationItem 1: Legal ProceedingsItem 1A: Risk FactorsItem 2: Unregistered Sales Of Equity Securities and Use Of ProceedsItem 3: Defaults Upon Senior SecuritiesItem 4: Mine Safety DisclosuresItem 5: Other InformationItem 6: Exhibits