MERIT MEDICAL SYSTEMS INC
10-Ks and 10-Qs
|
|
|
|
|
|
|
|
|
|
|
|
|
|
|
|
|
|
|
|
|
|
|
|
|
|
|
|
|
|
|
|
|
|
|
|
|
|
|
|
|
|
|
|
|
|
|
|
|
|
UNITED STATES
SECURITIES AND EXCHANGE COMMISSION
Washington, D.C. 20549
FORM 10-K
(Mark One)
|
x
|
Annual report pursuant to Section 13 or 15(d) of the Securities Exchange Act of 1934
|
|
for the fiscal year ended December 31, 2017
|
|
|
or
|
|
|
o
|
Transition report pursuant to Section 13 or 15(d) of the Securities Exchange Act of 1934.
|

MERIT MEDICAL SYSTEMS, INC.
(Exact name of registrant as specified in its charter)
|
Utah
|
|
0-18592
|
|
87-0447695
|
|
(State or other jurisdiction of incorporation or organization)
|
|
(Commission File No.)
|
|
(IRS Employer Identification No.)
|
1600 West Merit Parkway, South Jordan, Utah 84095
(Address of principal executive offices, including zip code)
Registrant’s telephone number, including area code:
(801) 253-1600
Securities registered pursuant to Section 12(b) of the Act:
Common Stock, No Par Value,
registered on the NASDAQ Global Select Market
Securities registered pursuant to Section 12(g) of the Act:
None
Indicate by check mark if the registrant is a well-known seasoned issuer, as defined in Rule 405 of the Securities Act. Yes
x
No
o
Indicate by check mark if the registrant is not required to file reports pursuant to Section 13 or Section 15(d) of the Act. Yes
o
No
x
Indicate by check mark whether the registrant (1) has filed all reports required to be filed by Section 13 or 15(d) of the Securities Exchange Act of 1934 during the preceding 12 months (or for such shorter period that the registrant was required to file such reports), and (2) has been subject to such filing requirements for the past 90 days. Yes
x
No
o
Indicate by check mark whether the registrant has submitted electronically and posted on its corporate web site, if any, every Interactive Data File required to be submitted and posted pursuant to Rule 405 of Regulation S-T (§ 229.405 of this chapter) during the preceding 12 months (or for such shorter period that the registrant was required to submit and post such files). Yes
x
No
o
Indicate by check mark if disclosure of delinquent filers pursuant to Item 405 of Regulation S-K is not contained herein, and will not be contained, to the best of the registrant’s knowledge, in definitive proxy or information statements incorporated by reference in Part III of this Form 10-K or any amendment to this Form 10-K.
x
Indicate by check mark whether the registrant is a large accelerated filer, an accelerated filer, a non-accelerated filer, a smaller reporting company or an emerging growth company. See the definitions of “large accelerated filer,” “accelerated filer,” “smaller reporting company” and "emerging growth company" in Rule 12b-2 of the Exchange Act.
|
Large Accelerated Filer
x
|
Accelerated Filer
o
|
Non-Accelerated Filer
o
(Do not check if a smaller reporting company)
|
Smaller Reporting Company
o
|
Emerging Growth Company
o
|
If an emerging growth company, indicate by check mark if the registrant has elected not to use the extended transition period for complying with any new or revised financial accounting standards provided pursuant to Section 13(a) of the Exchange Act.
o
Indicate by check mark whether the registrant is a shell company (as defined in Rule 12b-2 of the Exchange Act). Yes
o
No
x
The aggregate market value of the registrant’s common stock held by non-affiliates of the registrant, on June 30, 2017, which is the last day of the registrant’s most recently completed second fiscal quarter (based upon the closing sale price of the registrant’s common stock on the NASDAQ National Market System on June 30, 2017), was approximately $1,843,214,217. Shares of common stock held by each officer and director of the registrant and by each person who may be deemed to be an affiliate have been excluded.
As of February 23, 2018, the registrant had
50,266,889
shares of common stock outstanding.
DOCUMENTS INCORPORATED BY REFERENCE
Portions of the following document are incorporated by reference in Part III of this Report: the registrant’s definitive proxy statement relating to the Annual Meeting of Shareholders scheduled for May 24, 2018.
TABLE OF CONTENTS
|
|
|
||
|
|
|
||
|
|
|
||
|
|
|
||
Unless otherwise indicated in this report, “Merit,” “we,” “us,” “our,” and similar terms refer to Merit Medical Systems, Inc. and our consolidated subsidiaries.
DISCLOSURE REGARDING FORWARD-LOOKING STATEMENTS
This report includes “forward-looking statements” within the meaning of Section 27A of the Securities Act of 1933, as amended, and Section 21E of the Securities Exchange Act of 1934, as amended (the “Exchange Act”). All statements in this report, other than statements of historical fact, are “forward-looking statements” for purposes of these provisions, including any projections of earnings, revenues or other financial items, any statements of the plans and objectives of our management for future operations, any statements concerning proposed new products or services, any statements regarding the integration, development or commercialization of the business or any assets acquired from other parties, any statements regarding future economic conditions or performance, and any statements of assumptions underlying any of the foregoing. All forward-looking statements included in this report are made as of the date hereof and are based on information available to us as of such date. We assume no obligation to update any forward-looking statement. In some cases, forward-looking statements can be identified by the use of terminology such as “may,” “will,” “expects,” “plans,” “anticipates,” “intends,” “seeks,” “believes,” “estimates,” “potential,” “forecasts,” “continue,” or other forms of these words or similar words or expressions, or the negative thereof or other comparable terminology. Although we believe that the expectations reflected in the forward-looking statements contained herein are reasonable, there can be no assurance that such expectations or any of the forward-looking statements will prove to be correct, and actual results will likely differ, and could differ materially, from those projected or assumed in the forward-looking statements. Prospective investors are cautioned not to unduly rely on any such forward-looking statements.
Our future financial condition and results of operations, as well as any forward-looking statements, are subject to inherent risks and uncertainties, including the following:
|
•
|
risks relating to managing growth, particularly if accomplished through acquisitions, and the integration of acquired businesses;
|
|
•
|
risks relating to protecting our intellectual property;
|
|
•
|
claims by third parties that we infringe their intellectual property rights which could cause us to incur significant legal or licensing expenses and prevent us from selling our products;
|
|
•
|
greater scrutiny and regulation by governmental authorities, including risks relating to the subpoena we received in October 2016 from the U.S. Department of Justice seeking information on our marketing and promotional practices;
|
|
•
|
risks relating to physicians’ use of our products in unapproved circumstances;
|
|
•
|
FDA regulatory clearance processes and any failure to obtain and maintain required regulatory clearances and approvals;
|
|
•
|
disruption of our critical information systems or material breaches in the security of our systems;
|
|
•
|
failure to comply with export control laws, customs laws, domestic procurement laws, sanctions laws and other laws governing our operations in the U.S. and other countries, which could subject us to civil or criminal penalties, other remedial measures and legal expenses;
|
|
•
|
risks relating to significant adverse changes in, or our failure to comply, with governing regulations;
|
|
•
|
restrictions and limitations in our debt agreements and instruments, which could affect our ability to operate our business and our liquidity;
|
|
•
|
expending significant resources for research, development, testing and regulatory approval or clearance of our products under development and any failure to develop the products, any failure of the products to be effective or any failure to obtain approvals for commercial use;
|
|
•
|
violations of laws targeting fraud and abuse in the healthcare industry:
|
1
|
•
|
risks relating to healthcare reform legislation negatively affecting our financial results, business, operations or financial condition;
|
|
•
|
changes in the regulatory approval process and requirements in foreign countries, which could force us to incur additional expense or experience delays or uncertainties;
|
|
•
|
loss of key personnel;
|
|
•
|
product liability claims;
|
|
•
|
failure to report adverse medical events to the FDA, which may subject us to sanctions that may materially harm our business;
|
|
•
|
failure to maintain or establish sales capabilities on our own or through third parties, which may result in our inability to commercialize any of our products in countries where we lack direct sales and marketing capabilities;
|
|
•
|
the addressable market for our product groups being smaller than our estimates;
|
|
•
|
demands for price concessions resulting from consolidations in the healthcare industry, group purchasing organizations or public procurement policies;
|
|
•
|
our inability to compete in markets, particularly if there is a significant change in relevant practices or technology;
|
|
•
|
the effect of evolving U.S. and international laws and regulations regarding privacy and data protection;
|
|
•
|
fluctuations in foreign currency exchange rates negatively impacting our financial results;
|
|
•
|
termination or interruption of, or a failure to monitor, our supply relationships or increases in the price of our component parts, finished products, third-party services or raw materials, particularly petroleum-based products;
|
|
•
|
our inability to accurately forecast customer demand for our products or manage our inventory;
|
|
•
|
changes in international and national economic and industry conditions;
|
|
•
|
inability to generate sufficient cash flow to fund our debt obligations, capital expenditures, and ongoing operations;
|
|
•
|
risks relating to our revenues being derived from a few products and medical procedures;
|
|
•
|
volatility of the market price of our common stock;
|
|
•
|
risks relating to work stoppage, transportation interruptions, severe weather and natural disasters;
|
|
•
|
fluctuations in our effective tax rate adversely affecting our business, financial condition or results of operation;
|
|
•
|
limits on reimbursement imposed by governmental and other programs;
|
|
•
|
failure to comply with applicable environmental laws and regulations; and
|
|
•
|
other factors referenced in our press releases and in our reports filed with the Securities and Exchange Commission (the “SEC”).
|
All subsequent forward-looking statements attributable to us or persons acting on our behalf are expressly qualified in their entirety by these cautionary statements. Our actual results will likely differ, and may differ materially, from anticipated results. Financial estimates are subject to change and are not intended to be relied upon as predictions of future operating results, and we assume no obligation to update or disclose revisions to those estimates. If we do update or correct one or more forward-looking statements, investors and others should not conclude that we will make additional updates or corrections. Additional factors that may have a direct bearing on our operating results are described under Item 1A “Risk Factors” beginning on page 22.
2
DISCLOSURE REGARDING TRADEMARKS
This report includes trademarks, tradenames and service marks that are our property or the property of other third parties. Solely for convenience, such trademarks and tradenames sometimes appear without any “™” or “®” symbol. However, failure to include such symbols is not intended to suggest, in any way, that we will not assert our rights or the rights of any applicable licensor, to these trademarks and tradenames.
|
Item 1.
|
Business.
|
The Company
Merit Medical Systems, Inc. is a leading manufacturer and marketer of proprietary disposable medical devices used in interventional, diagnostic and therapeutic procedures, particularly in cardiology, radiology, oncology, critical care and endoscopy. We strive to be the most customer-focused company in healthcare. Each day we are determined to make a difference by understanding our customers’ needs and innovating and delivering a diverse range of products that improve the lives of people and communities throughout the world. We believe that long-term value is created for our customers, employees, shareholders, and communities when we focus outward and are determined to deliver an exceptional customer experience.
Merit Medical Systems, Inc. was founded in 1987 by Fred P. Lampropoulos, Kent W. Stanger, Darla Gill and William Padilla. Initially we focused our operations on injection and insert molding of plastics and electronic and sensor-based technologies. Our first product was a specialized control syringe used to inject contrast solution into a patient's arteries for a diagnostic cardiac procedure called an angiogram. Since that time, our sales and product lines have expanded substantially, both through internal research and development projects and through strategic acquisitions.
Our business strategy focuses on four target areas as follows:
|
•
|
enhancing growth and profitability through research and development, sales model optimization, cost discipline, and operational focus;
|
|
•
|
optimizing our operational capability through lean processes, cost effective environments and asset utilization;
|
|
•
|
targeting high-growth, high-return opportunities by understanding, innovating, and delivering in our core product groups; and
|
|
•
|
maintaining a highly disciplined, customer-focused enterprise guided by strong core values to globally address unmet or underserved healthcare needs.
|
We conduct our operations through a number of domestic and foreign subsidiaries.
Our principal offices are located at 1600 West Merit Parkway, South Jordan, Utah, 84095, and our telephone number is (801) 253-1600. See Item 2. “Properties.” We maintain an Internet website at www.merit.com.
Products
We design, develop, market, and manufacture, through our own operations and contract manufacturers, approximately 190 innovative medical products that offer a high level of quality, value and safety to our customers, as well as the patients they serve. Our products are used in the following clinical areas: diagnostic and interventional cardiology; interventional radiology; neurointerventional radiology; vascular, general and thoracic surgery; electrophysiology; cardiac rhythm management; interventional pulmonology; interventional nephrology; orthopaedic spine surgery; interventional oncology; pain management; outpatient access centers; intensive care; computed tomography; ultrasound; and interventional gastroenterology. During the year ended December 31, 2017, net sales generated by our top ten selling products accounted for approximately 37% of our total net sales. Sales of our inflation devices (including our Big60® device sold within our endoscopy segment and kits and packs which include inflation devices, but also include other products) accounted for approximately 11.4%, 12.7% and 14.0% of our net sales for the years ended December 31, 2017, 2016 and 2015, respectively.
The success of our products is enhanced by the extensive experience of our management team in the healthcare industry, our experienced direct sales force and distributors, our ability to provide custom procedural solutions such as kits, trays and
3
procedural packs at the request of our customers, and our dedication to offering facility-unique solutions in the markets we serve worldwide.
We offer products focused in five core product groups: peripheral intervention, cardiac intervention, interventional oncology and spine, cardiovascular and critical care, and endoscopy. A number of our products are marketed within multiple product groups; accordingly, we do not maintain separate measures of profitability by product group. Based on industry data and our internal market information, we estimate that the addressable market opportunities (in terms of annual net sales), that we are targeting with our current or newly released product portfolios, for each of our core product groups are as follows:
|
•
|
Peripheral Intervention: $2.3 billion (global)
|
|
•
|
Cardiac Intervention: $1.8 billion (global)
|
|
•
|
Cardiovascular and Critical Care: $3.4 billion (global)
|
|
•
|
Interventional Oncology and Spine: $1.4 billion (global)
|
|
•
|
Endoscopy: $496 million (U.S. domestic)
|
However, we operate in a competitive environment with many companies seeking to address the same market opportunities. Additionally, these opportunities may evolve significantly as a result of changes in customer preferences or the macroeconomic and regulatory environments in which we operate. For these and other reasons, we cannot guarantee the degree to which we will be able to realize increased net sales as a result of these, or any other, opportunities.
We currently conduct our business through two financial reporting segments: cardiovascular (which includes our peripheral intervention, cardiac intervention, interventional oncology and spine and cardiovascular and critical care product groups) and endoscopy. For information relating to our business segments, see Note 12 to our consolidated financial statements set forth in Item 8 of this report.
Peripheral Intervention
We strive to provide our customers, the healthcare providers, with superior products designed to alleviate patient suffering from peripheral vascular and non-vascular diseases. These technologies support the minimally invasive diagnosis and treatment of diseases in peripheral vessels and organs throughout the body excluding the heart. Our peripheral intervention product line is organized into product portfolios as follows: Access, Angiography, Intervention and Drainage & Biopsy products.
Peripheral Access Portfolio
We offer a broad line of devices used to gain and maintain vascular access. These products include access systems such as the micropuncture family kits consisting of the MAK™ (mini access kit), the S-MAK™ (stiff MAK) and the PAK™ (pedal access kit). Additionally, our extensive line of Prelude® sheath introducers and related products provide clinicians with smooth, convenient, and less traumatic access to the patient's vasculature. The Prelude® Short Sheath provides vascular access to dialysis grafts, along with our extensive line of micro access devices as previously described. We also offer a wide range of guide wires, diagnostic catheters, therapeutic infusion systems and safety products that can be used during dialysis-related procedures.
We have continued our strategic partnership with Bluegrass Vascular Technologies, and have continued the global distribution rights with respect to the Surfacer® Inside-Out® Access Catheter System. The Surfacer system, which received CE mark approval, is an innovative Inside-Out approach to restore access to the right internal jugular vein and to preserve treatment options in hemodialysis patients with occluded veins. Additionally, we believe the Surfacer system aligns with our existing peripheral access portfolio.
In 2017, we continued our focus on the HeRO® (Hemodialysis Reliable Outflow) Graft, a fully subcutaneous vascular access system, intended for use in maintaining long-term vascular access for chronic hemodialysis patients who have failing fistulas, grafts or are catheter dependent due to a central venous blockage. The Super HeRO® Adapter and its accompanying HeRO Ally™ Revision Kit are the newest addition to our growing HeRO family of dialysis devices. This technology offers surgeons the safety and efficiency of the original HeRO graft, but with more graft options to choose from, including early cannulation grafts, which can eliminate the need for a bridging catheter.
The CentrosFLO® Long-Term Hemodialysis Catheters anchor our chronic dialysis line. With its self-centering distal tip design, the CentrosFLO is designed to maintain long-term patency, as shown by retrospective and prospective studies published in 2016. We also offer the ProGuide® Chronic Dialysis Catheter, a “workhorse” catheter for chronic dialysis.
4
We offer peritoneal dialysis catheters, accessories and implantation kits as part of our dialysis access product line, including the Flex-Neck® and ExxTended™ Peritoneal Dialysis Catheters. Additionally, we have expanded our peritoneal dialysis portfolio to include an implantation system for an over-the-wire catheter placement technique familiar to interventionists.
Peripheral Angiography Portfolio
The diagnosis and treatment of peripheral arterial disease ("PAD") is paramount to ensuring appropriate patient care and helping patients achieve an enduring productive lifestyle. We offer an extensive portfolio of diagnostic and interventional products for the diagnosis and treatment of PAD and work closely with the physicians to develop new products to aid in the treatment of this disease.
We market a portfolio of hydrophilic and diagnostic guide wires for use in angiographic and interventional procedures in both the radiology and cardiology arena. Diagnostic guide wires are used to traverse the vascular anatomy and aid in placing catheters and other therapeutic devices to their target location. The Merit Laureate® Hydrophilic Guide Wire has a consistent, lubricious coating intended to promote advancement through the vasculature, provide support for crossing difficult lesions, and facilitate smooth catheter exchanges by minimizing friction. Our pre-coated InQwire® Diagnostic Guide Wires are lubricious and available in a wide range of configurations designed to assist physicians when navigating the peripheral vasculature and placement of devices.
In 2017, we added the high performance InQwire® Amplatz guide wires to our product line, providing our customers with a more supportive guide wire portfolio that aids in stability within the vasculature for enhanced navigation and device delivery through the most difficult anatomy.
Catheters play an important role in the diagnosis of peripheral disease. They carry contrast media which allows the blood vessels and any anomalies to be visualized in the imaging process. Our Performa® and Impress® Diagnostic Catheter products are designed to provide solutions for traversing difficult peripheral vasculature during diagnostic procedures. These catheters work in tandem with our guide wires to aid in the diagnosis of peripheral artery disease and can be used to facilitate transradial access, a procedure which uses the wrist artery as the access entry point for peripheral procedures rather than the more traditional femoral artery approach.
Peripheral Intervention Portfolio
We market an extensive line of products designed to treat blood clots that obstruct the flow of blood in arteries and veins. Our therapeutic thrombolytic infusion systems include the Fountain® Infusion System and the Mistique® Infusion Catheter. These catheters are used to treat thrombus, or blood clots, in the peripheral vessels of the body, as well as native dialysis fistula and synthetic grafts. We offer standard and low-profile ASAP® Aspiration Catheters, which offer clinicians two options for the safe and efficient removal of fresh, soft emboli and thrombi from vessels.
For crossing tight, difficult lesions, we market our line of Merit SureCross® Support Catheters. Our SureCross catheters offer trackability, pushability and visibility utilized by physicians to cross partial and total chronic occlusions in the peripheral arteries.
Our vascular retrieval devices are single-use products designed for foreign body manipulation and retrieval and can be used to retrieve inferior vena cava filters, reposition indwelling venous catheters, strip fibrin sheath formation, and assist in recanalization of both arterial and venous chronic occlusions. We enhanced our EN Snare® Endovascular Snare System with a new robust delivery catheter and peel-away insertion tool, which simplifies the snare deployment process and increase reliability during use.
For more than two decades, we have offered inflation devices designed to accurately measure pressures during balloon and stent deployment. We offer the basixTOUCH™ Inflation Device for one-handed preparation and priming for faster preparation time. Many procedures today require high pressures. For these procedures, we offer the basixTOUCH40™ Inflation Device. Its 40 ATM (standard atmosphere) pressure capacity allows inflation of high pressure interventional balloons. Additionally, the BasixCompak™ Inflation Device and the Blue Diamond™ Digital Inflation Device feature an angled gauge for better viewing.
We expanded our Advocate™ Peripheral Angioplasty Balloon product line in 2017 with the launch of our 0.035” platform. The Advocate™ Peripheral Angioplasty Balloon products are intended for balloon dilation or percutaneous transluminal angioplasty of the iliac, femoral, popliteal, infra-popliteal and renal arteries.
5
Peripheral Drainage & Biopsy Portfolio
We have a broad line of drainage access products. Our One-Step™ Drainage Catheter, Safety Paracentesis Procedure Tray and Thoracentesis and Paracentesis Set are designed to provide clinicians with safe, convenient and cost-effective methods for removing unwanted fluid accumulation. Our Valved One-Step™ Centesis Catheters are designed with an integrated self-sealing valve to minimize the risk of air entering the pleural space and to prevent fluid leakage during thoracentesis and paracentesis procedures.
The ReSolve® Locking Drainage Catheter offers a convenient locking mechanism that we believe enhances patient comfort. A range of catheter fixation devices are also available including the StayFIX® Fixation Device and the Revolution™ Catheter Securement Device, which were designed to save time, enhance patient comfort and improve cost-effectiveness. We provide a wide selection of accessories that complement our drainage catheters, including tubing sets and drainage bags. For non-vascular applications, the mini access kit (MAK-NV™) is designed for easy visualization and quick access into the drainage area. For enhanced visibility, the kit features an echo-enhanced needle and radiopaque marker tip on the introducer.
In January 2017, we launched the CorVocet™ Biopsy System for soft tissue biopsy procedures. This exciting new product is designed to cut a full-core of tissue, providing large specimens for pathological examination. Its sleek lines, light weight, and ergonomic grip help facilitate one-handed priming, positioning, and deployment, which is especially beneficial during image-guided procedures. Additionally, the CorVocet is the first full-core biopsy needle with a customizable throw length for precision clinician control.
In August 2017, we acquired proprietary bone and spine biopsy products from Laurane Medical S.A.S. ("Laurane"), headquartered in Sonchamp, France. We are selling these biopsy products exclusively to the existing customer base until we have transferred all of the manufacturing processes to our Irish manufacturing facility. We anticipate a full launch of the Laurane bone and spine biopsy products in the second quarter of 2018.
Cardiac Intervention
We manufacture and sell a variety of products designed to aid in the treatment of various cardiac conditions specific to interventional cardiology and electrophysiology including cardiac rhythm management and lead management.
Two key program drivers in cardiac intervention during 2017 were the Think Radial™ Program and Think Interventional
CRT™, which stands for cardiac resynchronization therapy. Think Radial is a global education program that provides clinicians with the training and tools to commence or further their practice of the transradial approach. The transradial approach uses the artery in the wrist as the entry point for either cardiac catheterization or peripheral procedures, rather than the more traditional femoral artery in the groin. In 2017, we hosted several Think Radial training courses at our facilities for interventional cardiologists and interventional radiologists from across the U.S., Europe and Canada.
The Think Interventional CRT therapy training program showcases a new interventional approach to implanting left ventricle leads. This approach utilizes new products and offers techniques to electrophysiologists who are relatively new to telescoping support catheters, subclavian vein venoplasty, and using snares to provide guidewire support. In 2017, our Think Interventional CRT training programs globally assisted with the training and education of electrophysiologists from across the U.S., Europe and Canada.
Our cardiac intervention product group is organized under product portfolios which include: Access, Angiography, Hemostasis, Intervention, and Electrophysiology.
Cardiac Access Portfolio
We offer a broad line of devices used to gain and maintain vascular access for cardiology procedures, including needles, scalpels, arm boards and sheath introducers. Our line of Prelude® Sheath Introducers is designed to provide clinicians with quick and convenient access to the patient's vasculature. The PreludeEASE™ Hydrophilic Sheath Introducer is our anchor product for radial access, designed to provide access to the radial artery while minimizing the potential for spasm with a hydrophilic coating that extends to the tip of the sheath.
To provide a more complete offering for radial access procedures, we offer the Rad Board® family of products. The Rad Board is designed to provide radiation protection to physicians, provide a larger work space for physicians and an area for patients to rest their arms during radial procedures.
6
Cardiac Angiography Portfolio
For angiography procedures, we market an array of diagnostic catheters including the Performa® line. We believe that these catheters offer physicians superior torque, high shaft strength for pushability and a large inner diameter for improved flow rates during a variety of angiographic procedures. Our MIV™ Radial Ventriculogram Pigtail Catheter addresses the difficulty in accessing the left ventricle from the radial artery, which occurs when using standard femoral approach catheters.
Cardiac Hemostasis Portfolio
Catheterization for diagnostic and interventional cardiology procedures generally takes one of two approaches, femoral or radial. We offer products to assist clinicians in obtaining and maintaining hemostasis following arterial catheterization by either approach. For hemostasis of the femoral artery, we offer the Safeguard® Pressure Assisted Device and for hemostasis of the radial artery, we now offer the PreludeSYNC
TM
hemostasis device, as well as our legacy Safeguard Radial
TM
device. These devices compete in a fast-growing segment within the interventional cardiology and radial compression markets. The PreludeSYNC was designed to address the market need for improved patient comfort and clinician use without compromising safety. To accomplish this, the device has a soft band with a secure hook and loop closure. To improve patient experience, the device comes packaged with creative, unique designs printed directly on the band, which is a first of its kind for our company. Additionally, we have recently provided the option to customize the bands for healthcare facilities. This can be with their logo or specific messaging, providing a personalized experience.
We have developed a broad line of clinically acclaimed hemostasis valves, MAP™ Merit Angioplasty Packs and angioplasty accessories. Hemostasis valves connect to catheters and allow passage of additional guide wires, balloon catheters and other devices into the vasculature, while reducing the amount of blood loss during the procedures. Our hemostasis valve line includes the Honor®, PhD™, AccessPLUS™, Access-9™, DoublePlay™, MBA™ and the Passage®.
Cardiac Intervention Portfolio
For more than two decades, we have offered an extensive line of inflation devices designed to accurately measure pressures during balloon and stent deployment. The basixTOUCH™ Inflation Syringe reduces preparation time through its single-handed preparation and priming features. The Blue Diamond™ Digital Inflation Device features an angled gauge for better viewing. Additionally, our IntelliSystem® and Monarch® Inflation Devices, as well as the BasixCOMPAK™ Inflation Syringe, offer clinicians a wide range of features and prices.
During coronary catheterization procedures, guiding catheters are used to gain access to the heart. Our line of Concierge® Guiding Catheters has an advanced braiding technology and proprietary polymer-blend shaft, which allow for an increased lumen size while maintaining exceptional support.
Pericardiocentesis is a procedure through which fluid is aspirated from the pericardial sac (the sac enveloping the heart). Our pericardiocentesis kit is designed as an organized, ready-to-use, convenient tray to assist the clinician in draining fluid quickly from the pericardial sac.
For angiography and angioplasty procedures we offer the Ostial PRO® Stent Positioning System, a medical-grade disposable guide wire system designed to provide consistent and precise stent implantation in aorto-ostial lesions during coronary or peripheral interventional procedures. Additional angiographic accessories include the Flow Control Switch™, an integrated, one-handed, single-channel switch designed with clinician and patient safety in mind.
Electrophysiology Portfolio
We offer innovative solutions to address lead implantation and therapeutic delivery in the rapidly-expanding cardiac rhythm management and electrophysiology markets.
Cardiac rhythm management (“CRM”) is the field of cardiac disease therapy that relates to the diagnosis and treatment of cardiac arrhythmias or the improper beating of the heart with pacemakers and implantable cardioverter defibrillators. Our CRM products include the Classic Sheath™, Prelude SNAP™, and Prelude SNAP™ Hydrophilic families of splittable hemostatic sheaths designed for the insertion of cardiac leads for pacemakers and implantable cardioverter defibrillators. We also offer the Worley™ Advanced LV Delivery System to aid in the insertion and implantation of left ventricular pacing leads, through the coronary sinus to the left lateral wall of the heart for heart failure patients. The Worley™ Advanced LV Delivery System has been shown to reduce lead implant failures, improve target lead location and reduce procedure times.
7
Electrophysiology is the study of diagnosing and treating abnormal electrical activities of the heart. Common electrophysiology procedures include diagnostic electrophysiology studies and therapeutic ablation procedures designed to treat arrhythmias. We offer the HeartSpan® Transseptal Needle, which is designed with a larger ergonomic handle, unique unibody needle design and optimal needle sharpness; the HeartSpan® Transseptal Sheath, which features an improved hemostasis valve for reduced blood loss and air embolism, smooth sheath to dilator transition for easier transseptal crossing, and reinforced stainless steel tubing for excellent torque response. In 2017 we updated this product line with new lengths and shapes to match market demands. Additionally, we launched a second generation HeartSpan® Steerable Sheath Introducer responding to user feedback with a variety of key features, most notably a neutral position indicator to help physicians with orientation.
Cardiovascular and Critical Care
Every year thousands of critical care patients experience Catheter Related Blood Stream Infections ("CRBSI"). CRBSI is one of the most frequent, costly, and mortal complications of central venous catheterization. In February 2017, we acquired the assets of Catheter Connections, Inc. to enhance our existing clinical safety product portfolio by providing a novel disinfectant cap, the DualCap® Disinfection and Protection System to minimize the potential of catheter associated infections. To complement the acquisition of
Catheter Connections, we also acquired critical care assets from Argon Medical Devices, Inc. ("Argon") to create a broad business line of products and solutions for cardiac and critical care patients. Combined with a robust pipeline of product development projects, we believe the cardiovascular and critical care business is positioned to provide innovative solutions to meet the needs of critical care patients and clinicians for years to come.
Infection Prevention & Safety
Medical errors are cited as the third leading cause of death in the USA, with approximately 250,000 preventable deaths occurring annually. Color-coded Medallion® Syringes along with the Pen and Label (PAL™) Medication Labeling System comply with patient safety initiatives from the Joint Commission to reduce medication delivery errors. Contaminated fluids and needle stick injuries may spread infectious diseases to clinical workers and providers. Our ShortStop
®
Temporary Sharps Holders protect clinicians from accidental needlesticks while our family of BackStop® Disposable Basins meet the Occupational Safety & Health Administration (OSHA) guidelines for contaminated fluids and waste.
The recent acquisition of the DualCap augments our foundation of safety products to further prevent contamination and infection of invasive vascular lines. Unlike other cleaning alternatives in the marketplace, the DualCap prevents alcohol from entering the blood stream of male luer connections while reducing the time required to disinfect needleless connectors.
Hemodynamic Monitoring
Blood pressure monitoring assists in determining proper patient treatment. We have an extensive portfolio of fluid management and monitoring devices, including the Meritrans® Disposable Pressure Transducer and the TRAM® Manifolds with Integral Transducers. The acquisition of certain critical care products from Argon expanded our patient monitoring portfolio by providing the Safedraw® Closed Arterial Blood Sampling Kits, thermodilution catheters, and DTXPlus® Disposable Pressure Transducers. The acquisition further bolstered our kits, packs, and procedure tray business by adding the Careflow® Central Venous Catheters, Arterial Catheters, and Introducer Sheaths.
Interventional Oncology and Spine
In June 2017, we received 513(f)(2) (de novo) classification from the U.S. Food and Drug Administration ("FDA") to expand indication for our Embosphere® Microspheres. The indication now includes prostatic artery embolization (“PAE”) for symptomatic benign prostatic hyperplasia. Embosphere is the first embolic agent to receive FDA clearance for prostatic artery embolization, providing a non-surgical treatment option for millions of men who suffer from benign prostatic hyperplasia.
Benign prostatic hyperplasia is an enlarged prostatic gland and can cause lower urinary tract symptoms in men. The PAE procedure is performed through an incision in the patient’s upper thigh or wrist, and may use Embosphere Microspheres to occlude the prostatic arteries, reducing their blood supply and causing the prostate to shrink and improve symptoms.
In July 2017, we acquired the assets of Osseon LLC ("Osseon"). The Osseon product line, Osseoflex®, compliments and rounds out our portfolio for the treatment of vertebral compression fractures ("VCF"). The Osseoflex products include access kits, steerable needles, steerable and straight balloons, bone cement, as well as cement mixing and delivery systems. Osseon’s steerable products fit well with our unique brand of directional devices that allow users to navigate and target specific spine anatomy.
8
Vertebral Compression Fractures Portfolio
VCFs occur when a vertebra cracks, fractures or collapses due to osteoporosis or cancer. VCFs can be extremely painful and have debilitating effects on a patient’s quality of life. Using our StabiliT
®
System, physicians treat VCFs by inserting small instruments through the skin into the fractured vertebra. Bone cement is injected through a hollow needle into the fractured bone. Our StabiliT® System is a comprehensive treatment system and includes access instruments, osteotomes, introducers, bone cement and corresponding mixing and delivery systems.
Ablation Portfolio
We offer our STAR™
Tumor Ablation System to cancer patients for the palliative treatment of painful metastatic tumors. Targeted radiofrequency ablation using the STAR System offers patients pain relief and improved quality of life in a minimally invasive treatment. This procedure requires an articulating radiofrequency, or RF, device to be placed through the skin into the vertebral body and inserted directly into the tumor to ablate the tumor. Thermocouples embedded in the RF device allow for constant monitoring of the temperature directly in the ablation zone, which is a key feature when performing ablations near vital structures like the spinal cord. The STAR system includes ablation instruments, introducers, osteotomes and our MetaSTAR
®
RF Generator.
Inflation Syringes
Our digital inflation devices, the IntelliSystem®, Monarch and Blue Diamond™ are used in discography, a technique used to determine whether a disc is the source of pain in patients with back or neck pain.
Oncology Portfolio
In the United States, we sell QuadraSphere
®
Microspheres for the treatment of hypervascularized tumors, including hepatoma, and arteriovenous malformations. Malignant hepatoma, also known as hepatocellular carcinoma, is a common cancer and the third leading cause of cancer deaths worldwide. QuadraSphere Microspheres are precisely calibrated and designed to offer controlled, targeted embolization, treating hepatocellular carcinoma by reducing or stopping the blood flow to the tumors.
In Europe, as well as Brazil, Russia, and in many other markets, excluding the U.S., we offer HepaSphere™ Microspheres for delivery of chemotherapy drugs in the treatment of primary and metastatic liver cancer.
Embolotherapy Portfolio
We offer Embosphere
®
Microspheres to treat hypervascularized tumors, including symptomatic uterine fibroids, embolization of the prostatic arteries for the treatment of symptomatic benign prostatic hyperplasia, and arteriovenous malformations in the United States as well as Europe and other international markets. Additionally, in certain markets outside of the U.S., we offer Embosphere Microspheres for hemostatic embolization.
We also offer polyvinyl alcohol particles, Bearing nsPVA
®
, globally for the treatment of hypervascularized tumors, including symptomatic uterine fibroids and vascular malformations.
Delivery Systems Portfolio
We manufacture a variety of microcatheters for the controlled and selective infusion of diagnostic, embolic, or therapeutic agents into vessels. The SwiftNINJA
®
steerable microcatheter articulates up to 180 degrees in opposing directions. This articulating feature allows physicians to treat diseases that in the past would have been too difficult to access due to challenging patient anatomies. We continue to offer our Merit Maestro
®
Microcatheter, which has a swan neck design that allows physicians to "seat" the catheter in the vessel. The SwiftNINJA and Maestro can be used for the controlled and selective infusion of diagnostic, embolic, or therapeutic materials into vessels. They are compatible with many key configurations of Embosphere, Quadrasphere, HepaSphere, Bearing nsPVA, and other competitive embolic products.
In 2017, we introduced the True Form
™
Reshapable Guide Wire which was designed with the ability to be shaped and reshaped multiple times for vessel cannulation.
True Form’s stainless steel core provides excellent support, its hydrophilic coating increases trackability through vessels, the flexible shaft easily navigates tortuous anatomy, and its shapeable tip retains shape during procedures. In August 2017, we began offering the Merit Maestro
®
Microcatheter and True Form Reshapable Guide Wire packaged together to make it more convenient for customers to order their microcatheters and guide wires.
9
Endoscopy
Our endoscopy division, Merit Endotek, integrates advanced non-vascular stent technology with balloon dilators, inflation devices, guide wires, procedure kits, and other devices that are used by endoscopists in interventional gastroenterology, interventional pulmonology, and thoracic and general surgery. Merit Endotek has a dedicated marketing and sales organization serving these growing markets.
Merit Endotek sells a variety of non-vascular stents, including AERO® and AERO DV® Fully Covered Tracheobronchial Stents. These covered, self-expanding nitinol stents are used by interventional pulmonologists and thoracic surgeons to treat strictures and fistulae in the airways, and to offer palliation to patients suffering from strictures caused by cancer. The AEROmini® fully covered bronchial stent was launched in 2015 and features a low-profile delivery system designed to provide additional flexibility, and aid in the accurate placement of stents in difficult airway anatomy.
Merit Endotek's esophageal stents, the Alimaxx-ES™ and the EndoMAXX® fully covered esophageal stents, are used by interventional gastroenterologists, otolaryngologists and thoracic surgeons to palliate symptoms associated with malignant tumors and strictures affecting the esophagus, as well as to treat concomitant tracheoesophageal fistulae.
Merit Endotek's biliary stent systems are marketed under the Alimaxx-B® brand name. Alimaxx-B stent systems are used by interventional gastroenterologists to palliate symptoms associated with malignant tumors affecting the bile duct.
Merit Endotek's esophageal balloon dilator, the Elation® Fixed Wire Balloon Dilator, was introduced late in 2015, and is intended for use in adult and adolescent populations to endoscopically dilate strictures of the esophagus. In 2016, we added a wire-guided balloon dilator, intended for use in the alimentary tract, to the Elation product line, and in 2017, the Elation Pulmonary Balloon Dilator was introduced to the market. All of these devices can be paired with Merit Endotek's BIG60® inflation device.
Merit Endotek's BIG60® Inflation Device is a 60-mL syringe and gauge designed to inflate and deflate non-vascular balloon dilators while monitoring and displaying inflation pressures up to 12 atmospheres. Merit Endotek also offers Endotek-labeled versions of the BasixCOMPAK™ and Monarch Inflation Device to customers in pulmonology, gastroenterology, and thoracic surgery.
For non-vascular procedures, we market the MAXXWIRE® guide wire, our line of specialty guide wires that have pulmonology and gastroenterology applications.
For endoscopy and bronchoscopy procedures, we offer a variety of kits and accessories, including the AEROSIZER® tracheobronchial stent sizing device, the Brighton® Bipolar Probe, the BiliQUICK™ Cholangiography Rapid Refill Continuous Injection Kit, the TIO™ Three-in-One combination oral airway, bite block and oxygen administration device, the Vaclok® Negative Pressure Syringe, and the convenient BAL (bronchoalveolar lavage) Convenience Kit™. In 2017, Endotek introduced the TWISTER™ PLUS rotatable retrieval device for use in both gastroenterology and interventional pulmonology.
Specialty Procedure Products
We provide coating services for medical tubes and wires under original equipment manufacturer (“OEM”) brands. We offer coated tubes and wires to customers on a spool or as further manufactured components like hypotubes, guide wire components, coated mandrels/stylets and coated needles. We operate a hypotube manufacturing facility in Galway, Ireland, which provides advanced laser cutting and ablation, passivation, cleaning and other hypotube manufacturing processes. Our Merit Hypotube
TM
is used as the catheter shaft in percutaneous transluminal coronary angioplasty and percutaneous transluminal angioplasty balloon catheters, as well as functional guide wires.
Customers and clinicians often have unique needs when performing procedures. We have a long history of manufacturing and selling syringes, stopcocks, high pressure tubing, safety solutions, and many more products used across the clinical care continuum. We work closely with customers to create standard and customized trays, packs, and kits to enable clinicians to more effectively perform clinical procedures. In October 2017, we acquired ITL Healthcare Pty. Ltd. ("ITL"), a custom procedure pack business located in Melbourne, Australia. The facility we acquired from ITL includes sterilization capabilities.
Our sensor division manufactures and sells microelectromechanical systems sensor components consisting of piezoresistive pressure sensors in various forms, including bare silicon die, die mounted on ceramic substrates, and fully calibrated components for numerous applications both inside and outside the healthcare industry.
10
Marketing and Sales
Target Market/Industry.
Our principal target markets are peripheral intervention, cardiac intervention, interventional oncology, critical care and endoscopy. Within these markets our products are used in the following clinical areas: diagnostic and interventional cardiology; interventional radiology; neurointerventional radiology; vascular, general and thoracic surgery; electrophysiology; cardiac rhythm management; interventional pulmonology; interventional nephrology; orthopaedic spine surgery; interventional oncology; pain management; outpatient access centers; intensive care; computed tomography; ultrasound; and interventional gastroenterology.
According to U.S. government statistics, cardiovascular disease continues to be a leading cause of death and a significant health problem in the United States.
Treatment options range from dietary changes to surgery, depending on the nature of the specific disease or disorder. Endovascular techniques, including angioplasty, stenting and endoluminal stent grafts, continue to represent important therapeutic options for the treatment of vascular disease. We derive a large percentage of our revenues from sales of products used during percutaneous diagnostic and interventional procedures such as angiography, angioplasty and stent placement, and we intend to pursue additional sales growth by building on our existing market position in both catheter technology and accessory products.
In addition to products used in the treatment of coronary and peripheral vascular disease and in electrophysiology, we continue our efforts to develop and distribute other devices used in our target markets. For example, we have developed and are distributing products used for percutaneous drainage. Prior to the widespread use of computed tomography or ultrasound imaging, surgery was necessary to drain internal fluid from body cavities and organs. Currently, percutaneous drainage is frequently prescribed as the treatment of choice for many types of fluid collections. Our family of drainage catheters and associated devices are used by physicians in interventional radiology, vascular surgery and cardiology catheter lab procedures.
Marketing Strategy.
As part of our product sales and marketing efforts, we attend major medical conventions throughout the world pertaining to our target markets and invest in market development including physician training, peer-to-peer education, and patient outreach. We work closely with major healthcare facilities and key opinion leader physicians involving our primary target markets in the areas of training, therapy awareness programs, clinical studies and ongoing research.
We also offer products to service the dialysis access market. These products are used in renal replacement therapies, including the treatment of acute renal failure, chronic renal failure and end-stage renal disease. Our hemodialysis access products include catheters and kits for interventional radiologists and interventional nephrologists. Our family of peritoneal dialysis products is designed to support specific implantation techniques for interventional radiologists, interventional nephrologists and laparoscopic surgeons. We also offer a variety of products for dialysis access interventions for these customers.
We believe the development of Merit Endotek and the move into the areas of interventional gastroenterology, pulmonology and thoracic surgery will open new opportunities to sell our existing products, such as inflation devices, syringes, centesis catheters and procedure kits to those markets, but will also provide opportunities to market additional products incorporating our non-vascular stent, balloon dilator and guide wire technologies.
In general, our target markets are characterized by rapid change resulting from technological advances and scientific discoveries. We plan to continue to develop and launch innovative products to support clinical trends and to address the increasing demands of these markets.
Product Development Strategy
. Our product development is focused on identifying and introducing a regular flow of profitable products that meet customer needs. To stay abreast of customer needs, we frequently seek suggestions from health care professionals working in the fields of medicine in which we offer or are developing products. Suggestions for new products and product improvements may also come from engineers, marketing, sales people, physicians and technicians who perform clinical procedures.
When we believe that a product suggestion demonstrates a sustainable competitive advantage, meets customer needs, fits strategically and technologically with our business and has a good potential financial return, we generally assemble a “project team” comprised of individuals from our sales, marketing, engineering, manufacturing, legal, and quality assurance departments. This team works to identify the customer requirements, integrate the design, compile necessary documentation and testing, and prepare the product for market introduction. We believe that one of our marketing strengths is our capacity to conceive, design, develop and introduce new products.
U.S. and International Sales.
Sales of our products in the U.S. accounted for approximately 58%, 61% and 61% of our net sales for the years ended December 31, 2017, 2016 and 2015, respectively. In the U.S., we have a dedicated, direct sales
11
organization primarily focused on selling to end-user physicians, hospitals and clinics, major buying groups and integrated healthcare networks.
Internationally, we employ sales representatives and contract with independent dealer organizations and custom procedure tray manufacturers to distribute our products worldwide, including territories in Europe, Africa, the Middle East, Asia, South and Central America, Oceania, and Canada. In 2017, our international sales grew approximately
32%
over our 2016 international sales, and accounted for approximately
42%
of our net sales. China represents our most significant international sales market with net sales of approximately
$73.4 million
,
$59.9 million
, and
$50.7 million
for the years ended
December 31, 2017
,
2016
and
2015
, respectively. With the recent and planned additions to our product lines, we believe our international sales will continue to increase.
Our largest non-U.S. market is China, which represented approximately
10%
of our net sales in 2017. We maintain a distribution center and administrative office in Beijing. We also have small sales offices in Shanghai, Guangzhou, and Hong Kong. We sell our products through more than 400 distributors in mainland China, who are responsible for reselling the products, primarily to hospitals. We employ sales personnel throughout China who work with our distributors to promote the clinical advantages of our products to clinicians and other decision makers at hospitals. Under this “modified direct” sales approach, our salespeople are involved with promoting the advantages of our products to clinicians and other customers, while the distributors handle sales transactions and address issues related to fulfillment and inventory management.
In Europe, the Middle East, and Africa, we have both corporate (i.e., direct) and modified corporate sales operations. Our corporate sales operations are active throughout Europe, including the largest markets of the UK, France, Germany, and Sweden.
Our direct sales personnel are principally engaged in each of our product groups. Marketing teams responsible for each product group operate clinical education programs, often directed by leading subject matter personnel, who provide technical instruction on techniques and therapies to physicians, nurses, and technologists. We are currently conducting education programs specific to radial access, spinal intervention, surgical grafts, and electrophysiology.
We require our international dealers to store products and sell directly to customers within defined sales territories. Each of our products must be approved for sale under the laws of the country in which it is sold. International dealers are responsible for compliance with applicable anti-bribery laws, such as the U.S. Foreign Corrupt Practices Act, as well as all applicable laws and regulations in their respective countries.
In 2016, we began conversions from distributor-based sales models to direct sales models in Australia and Canada. We now supply hundreds of healthcare providers directly in Australia and Canada from Merit-operated distribution centers in those countries. In May 2017, we terminated our distribution agreement with Sheen Man Co., Ltd. and Sugan Co, Ltd., (collectively "Sugan"), a Japanese medical device distributor, and acquired the customer list Sugan used in the distribution of many of our products in Japan. In connection with our acquisition of the critical care division of Argon, we have implemented a modified direct sales approach (similar to the approach we are pursuing in China) to market and sell the majority of our products in Japan. Our goal with conversion is to obtain improved product pricing and more direct access to the end users of our products within these sales channels.
We consider training to be a critical factor in the success of our sales force. Members of our sales force are trained by our clinical marketers, our staff professionals, consulting physicians, and senior field trainers in their respective territories.
OEM Sales.
Our global OEM division sells components and finished devices, including molded components, sub-assembled goods, custom kits and bulk non-sterile goods, to medical device manufacturers. These products may be combined with other components and products from other companies and sold under a Merit or third-party label. Products sold by our OEM division can be customized and enhanced to customer specifications, including packaging, labeling and a variety of physical modifications. Our OEM division serves customers with a staff of regional sales representatives based in the U.S., Europe and Asia, and a dedicated OEM Engineering and Customer Service Group.
Customers
We provide products to hospitals and clinic-based physicians, technicians and nurses. Hospitals and acute care facilities in the United States generally purchase our products through our direct sales force, distributors, OEM partners, or custom procedure tray manufacturers who assemble and combine our products in custom kits and packs. Outside the United States, hospitals and acute care facilities generally purchase our products through our direct sales force, or, in the absence of a sales force, through independent distributors or OEM partners.
12
In 2017, our U.S. sales force made sales accounting for approximately 42% of our net sales directly to U.S. hospitals and sales accounting for approximately six percent of our net sales through other channels, such as U.S. custom procedure tray manufacturers and distributors. We also sell products to other medical device companies through our U.S. OEM sales force, which accounted for approximately 10% of our 2017 net sales. The remaining
42%
of our 2017 net sales was attributable to sales made to international markets by our direct sales force, international distributors, and our OEM sales force. Sales to our largest customer accounted for approximately
two percent
of net sales during the year ended December 31, 2017.
Research and Development
Our research and development operations have been central to our historical growth, and we believe they will be critical to our continued growth. In 2017, our commitment to innovation led to the introduction of several new products, improvements to our existing products and expansion of our product lines, as well as enhancements and new equipment in our research and development facilities.
Our research and development expenses were approximately
$51.4 million
,
$45.2 million
, and
$40.8 million
in
2017
,
2016
, and
2015
, respectively.
We continue to develop new products and make improvements to our existing products utilizing many different sources. Our Chief Executive Officer and Executive Vice President of Global Research & Development, work closely with our sales and marketing teams to incorporate feedback from physicians and clinicians in the field, which can lead to innovative new products and improvements to our existing products.
Currently we have research and development facilities in:
|
•
|
Dallas, Texas
|
|
•
|
Galway, Ireland
|
|
•
|
Jackson Township, New Jersey
|
|
•
|
Malvern, Pennsylvania
|
|
•
|
Paris, France
|
|
•
|
Pearland, Texas
|
|
•
|
San Jose, California
|
|
•
|
Singapore
|
|
•
|
South Jordan, Utah
|
|
•
|
Tijuana, Mexico
|
|
•
|
Venlo, The Netherlands
|
|
•
|
West Jordan, Utah
|
Manufacturing
We manufacture many of our products utilizing our proprietary technology and our expertise in plastic injection and insert molding. We generally contract with third parties for the tooling of our molds, but we design and own most of our molds. We utilize our experience in injection and insert molding technologies in the manufacture of most of the custom components used in our products. We have received International Standards Organization (“ISO”) 13485:2003 certification for our facilities in Utah, Texas, Virginia, Pennsylvania, The Netherlands, Ireland, France, Singapore and Mexico. We have also received ISO 9001:2008 certification for our coatings facility in Venlo, The Netherlands and our Merit Sensor Systems, Inc. (“Merit Sensors”) facility in South Jordan, Utah. Merit Sensors develops and markets silicon pressure sensors and presently supplies a substantial portion of the sensors we utilize in our digital inflation devices and blood pressure sensors.
Given the specialization of our manufacturing personnel and processes in our Utah and Ireland facilities, we possess the capability to strategically shift the manufacture of more technologically advanced products to those facilities, and utilize the manufacturing capacity of our other facilities for more commoditized products. The actual determination of manufacturing location will be based upon multiple factors, including technological capabilities, market demand, acquisition and integration activities and economic and competitive conditions.
We currently produce and package all of our embolic products. Manufacturing of our embolic products includes the synthesis and processing of raw materials and third-party manufactured compounds.
13
We have packaging and manufacturing facilities located in Chester, Virginia; Galway, Ireland; Joinville, Brazil; Malvern, Pennsylvania; Melbourne, Australia; Paris, France; Pearland, Texas; Singapore; South Jordan and West Jordan, Utah; Tijuana, Mexico; and Venlo, The Netherlands. See Item 2. “Properties.”
We have distribution centers located in Auckland, New Zealand; Bangalore, India; Beijing and Hong Kong, China; Chester, Virginia; Joinville, Brazil; Maastricht, The Netherlands; Malvern, Pennsylvania; Melbourne, Australia; Toronto, Canada; Podolsk, Russia; Seoul, South Korea; South Jordan, Utah; Tijuana, Mexico; and Tokyo, Japan.
We believe that our variety of suppliers for raw materials and components necessary for the manufacture of our products, as well as our long-term relationships with such suppliers, promote stability in our manufacturing processes. Historically, we have not been materially affected by interruptions with such suppliers; however, we are experiencing a growing trend from suppliers of polymer resins to refuse to supply resin to medical device manufacturers or require that we assume additional risks due to the potential for product liability claims. There can be no assurance that we will not experience supply disruptions in the future. We seek to develop and have relationships with potential back-up suppliers for materials and components in the event of supply interruptions.
Competition
The medical products industry is highly competitive. Many of our competitors are much larger than us and have access to greater resources. We also compete with smaller companies that sell single or limited numbers of products in specific product lines or geographies. We compete globally in several market areas, including diagnostic and interventional cardiology; interventional radiology; neurointerventional radiology; vascular, general and thoracic surgery; electrophysiology; cardiac rhythm management; interventional pulmonology; interventional nephrology; orthopaedic spine surgery; interventional oncology; pain management; outpatient access centers; intensive care; computed tomography; ultrasound; and interventional gastroenterology.
The principal competitive factors in the markets in which our products are sold are quality, price, value, device features, customer service, breadth of line, and customer relationships. We believe our products have achieved market acceptance primarily due to the quality of materials and workmanship of our products, clinical outcomes, their innovative design, our willingness to customize our products to fit customer needs, and our prompt attention to customer requests. Our products are priced competitively, but generally not below prices for competing products. Some of our primary competitive strengths are our relative stability in the marketplace; a comprehensive, broad line of ancillary products; and our history of introducing a variety of new products and product line extensions to the market on a regular basis.
In the interventional cardiology and the radiology markets as well as the gastroenterology, endoscopy, general surgery, thoracic surgery and pulmonology markets, we compete with large international, multi-divisional medical supply companies such as Cordis Corporation (Cardinal Health); Boston Scientific Corporation; Medtronic; Abbott; Teleflex; Becton, Dickinson and Company (including the operations previously conducted by C.R. Bard) ("BD"); Cook Incorporated; Stryker Corporation ("Stryker"); 3M; ICU Medical and Terumo Corporation. Medium-size companies we compete with include B. Braun; Uresil; BTG; Olympus Medical; Edwards Lifesciences; Argon; CONMED; AngioDynamics; Medcomp and U.S. Endoscopy.
Based on available industry data, with respect to the number of procedures performed, we believe we are a leading provider of digital inflation technology in the world. In addition, we believe we are one of the market leaders in the United States for analog inflation devices. We believe we are a market leader in the United States for control syringes, waste-disposal systems, tubing and manifolds. We anticipate the recent and planned additions to our product lines will help us compete even more effectively in both the U.S. and international markets. There is no assurance that we will be able to maintain our existing competitive advantages or compete successfully in the future.
We derive a substantial majority of our revenues from sales of products used in diagnostic angiography, interventional cardiology and radiology procedures. We believe medical professionals are starting to use new interventional methods, procedures and devices, as well as drugs, for the treatment and prevention of cardiovascular disease. These new methods, procedures, devices and drugs may render some of our products obsolete or limit the markets for our products. However, with the advent of vascular stents and other procedures, we have experienced continued growth in sales of our products.
In the vertebral augmentation market, our main competitors are Medtronic and Stryker. Both Medtronic and Stryker offer products to treat vertebral compression fractures (including the CareFusion products Stryker acquired from BD, but only Medtronic offers products to treat metastatic spine tumors.
Within the field of uterine fibroid embolization ("UFE") and PAE, we believe we are a market share leader. Based on both research and clinical studies conducted on our product for UFE and PAE, we believe we offer physicians consistent and
14
predictable product performance, ease of use, targeted delivery, and durable vessel occlusion, and therefore satisfactory short- and long-term clinical outcomes validated by peer-reviewed publications, when compared to our competitors.
Our primary embolotherapy product has been Embosphere Microspheres. Currently, the primary products with which our microspheres and embolic particles compete are Beadblock® and DC Bead®, sold by BTG plc; Embozene™ and Contour® sold by Boston Scientific, Inc; PVA Foam Embolization Particles, sold by Cook Medical; HydroPearl®, sold by Terumo International Systems ("Terumo"); and Gelfoam®, sold by Pfizer Inc. Our principal competitors in UFE are BTG plc, Boston Scientific and Terumo, as well as companies selling or developing non-embolotherapy solutions to treat uterine fibroids.
Proprietary Rights and Litigation
We rely on a combination of patents, trade secrets, trademarks, copyrights and confidentiality agreements to protect our intellectual property. We have a number of U.S. and foreign-issued patents and pending patent applications, including patents and rights to patent applications acquired through strategic transactions, which relate to various aspects of our products and technology. The duration of our patents is determined by the laws of the country of issuance and, for the U.S., is typically 20 years from the date of filing of the patent. As of December 31, 2017, we owned or had a license to more than 1,000 U.S. and international patents and patent applications. Additionally, we hold exclusive and non-exclusive licenses to a variety of third-party technologies covered by patents and patent applications. In the aggregate, our intellectual property assets are critical to our business, but no single patent, trademark or other intellectual property asset is of material importance to our business.
The Merit® name and logo are trademarks in the U.S. and other countries. In addition to the Merit name and logo, we have used, registered or applied for registration of other specific trademarks and service marks to help distinguish our products, technologies and services from those of our competitors in the U.S. and foreign countries. See “Products” above. The duration of our trademark registrations varies from country to country; in the U.S. we generally can maintain our trademark rights and renew any trademark registrations for as long as the trademarks are in use. As of December 31, 2017, we owned over 300 U.S. and foreign trademark registrations and trademark applications.
There is substantial litigation regarding patents and other intellectual property rights in the medical device industry. At any given time, we may be involved as either a plaintiff or a defendant, as well as a counter-claimant or counter-defendant, in patent, trademark, and other intellectual property infringement actions. If a court rules against us in any intellectual property litigation we could be subject to significant liabilities, be forced to seek licenses from third parties, or be prevented from marketing certain products. In addition, intellectual property litigation is costly and may consume significant time of employees and management.
Regulation
U.S. Regulation.
The Food and Drug Administration (“FDA”) and other federal, state and local authorities regulate our products and product-related activities. Under the Federal Food, Drug, and Cosmetic Act (“FDCA”) and accompanying regulations, the FDA regulates the design, development, clinical trials, testing, manufacture, packaging, labeling, storage, distribution and promotion of medical devices. We believe our products and procedures are in material compliance with all applicable FDA regulations, but the regulations are subject to change. We cannot predict the effect, if any, that these changes may have on our business. In addition, if we experience regulatory problems with a product or manufacturer, we could become subject to fines, delays or suspensions of regulatory clearances, seizures or recalls of products, operating restrictions, and criminal prosecution. Such actions could have a material adverse effect on our business, financial condition or results of operations.
In October 2016, we received a subpoena from the U.S. Department of Justice seeking information on certain of our marketing and promotional practices. We are in the process of responding to the subpoena, which we anticipate will continue during 2018. The investigation is ongoing and at this time we are unable to predict its scope, duration or outcome. Investigations such as this may result in the imposition of, among other things, significant damages, injunctions, fines or civil or criminal claims or penalties against our company or individuals.
Overview of the FDA Regulation of Devices.
The FDCA establishes a risk-based classification system for medical devices and applies regulatory controls commensurate with the risk posed by a device:
|
•
|
Class I devices are those for which safety and effectiveness can be reasonably assured by adherence to the FDA’s general regulatory controls, which include compliance with the applicable portions of the FDA’s Quality System Regulations (QSRs), facility registration and product listing, reporting of certain adverse medical events and malfunctions, and compliance with the FDA’s restrictions against misbranding and adulteration. While most Class I devices are exempt
|
15
from the 510(k) premarket notification process (assuming they are within the limitations of the exemption), some Class I devices also require 510(k) clearance by the FDA.
|
•
|
Class II devices are subject to the FDA’s general controls, including the design control requirements of the QSRs, and any other special controls deemed necessary by the FDA to provide reasonable assurance of the safety and effectiveness of the device. While most Class II devices require premarket review and clearance by the FDA through the 510(k) premarket notification procedure, some Class II devices are exempt from the 510(k) premarket notification process (assuming they are within the limitations of the exemption).
|
|
•
|
Class III devices are those deemed by the FDA to pose the greatest risk, such as life-sustaining, life-supporting or implantable devices, or those devices deemed not substantially equivalent to a legally marketed predicate device. Class III devices include those devices for which the FDA has determined that general and special controls alone are insufficient to assure the safety and effectiveness of the device.
|
FDA Premarket Review.
In general, we cannot introduce a new medical device into the market until we obtain market clearance through a 510(k) premarket notification or approval through a premarket approval (“PMA”) application. Some devices, typically lower-risk devices, are subject to specific exemptions from premarket review. In addition, in limited cases, devices may come to the market through alternative procedures, such as a
de novo classification request or humanitarian device exemption.
To obtain 510(k) clearance, a device manufacturer must submit a premarket notification to the FDA demonstrating that the device is substantially equivalent to another legally marketed predicate device. A predicate device is a device that has been cleared through the 510(k) process; a device that was legally marketed prior to May 28, 1976; a device that has been down-classified by the FDA to Class I or Class II; or a device that the FDA has previously determined to be exempt from the 510(k) process. To be substantially equivalent, the notification must show that the new device has the same intended use and the same technology as the predicate device, or, if the new device has different technology, that the device is as safe and effective as the predicate device and does not raise different questions of safety and effectiveness. Performance testing is generally required to demonstrate substantial equivalence, and, for some devices, clinical data may be required. The standards and data requirements necessary for the clearance of a new device may be unclear or may be subject to change. In addition, the FDA may publish or adopt special controls it deems necessary to provide a reasonable assurance of the safety and effectiveness of a device, which might include standards for the testing and clearance of a new device. The 510(k) clearance procedure usually takes between three months and one year from the date a 510(k) notification is submitted, but it may take longer. The FDA may find that substantial equivalence has not been shown and, as a result, require additional clinical or non-clinical testing to support a 510(k) or require the submission of a de novo classification request or PMA application for the device.
A de novo classification is an alternate pathway to classify novel devices that are low to moderate risk but for which no substantially equivalent predicate device exists. Clearance of a de novo request generally takes six months to one year from the time of submission of the de novo request, although it can take longer.
A PMA application is required for Class III devices. The application must demonstrate that there is reasonable assurance that the device is safe and effective for its intended use based on valid scientific evidence. The PMA application process can be expensive, generally takes several years to complete and typically includes, among other things, human clinical trials, manufacturing facility inspection, bench tests and laboratory and animal studies, which can be costly to conduct. There is also a substantial “user fee” that must be paid to the FDA in connection with the submission of each PMA application. The FDA may determine that additional information, including clinical data, be submitted before a determination is made, which could significantly delay the introduction of new devices. If the FDA approves the PMA application, it may place restrictions on the device. If the FDA's evaluation of the PMA application is not favorable, the FDA may deny approval of the PMA application or issue a “not approvable” letter. The FDA may also require additional testing or clinical trials prior to approval or as a condition of approval.
If human clinical trials of a medical device are required for FDA clearance or approval and the device presents a significant risk, the sponsor of the trial must file an investigational device exemption (“IDE”) application with the FDA prior to commencing human clinical trials in the USA. Submission of an IDE application does not ensure that the FDA will issue the IDE. If the IDE application is approved, there can be no assurance the FDA will determine that the data derived from the trials support the safety and effectiveness of the device or warrant the continuation of clinical trials. An IDE supplement must be approved by the FDA before a sponsor or investigator may make a change to the investigational plan in such a way that may affect its scientific soundness, study indication or the rights, safety or welfare of human subjects. For clinical trials involving a device that does not present a significant risk, the sponsor is not required to obtain approval of an IDE, but the sponsor must obtain the review and approval of an institutional review board. Both significant risk and non-significant risk trials are subject to additional FDA regulations, including a requirement to obtain informed consent and reporting and recordkeeping requirements. We, the FDA, or the institutional review
16
board, may suspend a clinical trial at any time for various reasons, including a belief that the risks to study subjects outweigh the anticipated benefits.
The FDA clearance and approval processes for medical devices are expensive, uncertain and lengthy. There can be no assurance that we will be able to obtain necessary regulatory clearances or approvals for any product on a timely basis or at all. Delays in receipt of or failure to receive such clearances or approvals, the loss of previously received clearances or approvals, or the failure to comply with existing or future regulatory requirements could have a material adverse effect on our business, financial condition or results of operations. In addition, if the FDA discovers that an applicant has submitted false or misleading information, the FDA may refuse to review submissions until certain requirements are met pursuant to its Application Integrity Policy, which specifies procedures that the FDA personnel should follow to ensure the integrity of data and information in applications submitted for FDA review and approval.
We are currently conducting a clinical trial to obtain PMA approval from the FDA to claim the use of the QuadraSphere Microspheres with doxorubicin for the treatment of liver cancer in the United States. In order for us to obtain FDA approval to promote the use of QuadraSphere Microspheres for the purposes indicated in our clinical trial, we will need to complete the trial and submit positive clinical data to the FDA. If we cannot enroll study subjects in sufficient numbers to complete the necessary studies, if there is a disruption in the supply of materials for the trials or depending on other factors, we will likely not be able to complete the trial. Even if we complete the clinical trial, the FDA may require us to undertake additional testing, or the trial results may not be sufficient to obtain FDA approval for other reasons, including inconclusive or negative results of our trials or those conducted by our competitors or other third parties. If we do not obtain FDA approval of the product use claimed in a clinical trial, we will not be able to promote the subject product for the indicated treatment of the specific disease or condition in the United States. A clinical study involving the use of our EndoMAXX EVT Valved Esophageal Stent to relieve dysphagia in patients with malignant stricture of the esophagus was completed. As a result of the data obtained during the study, it was decided that we would not pursue a 510(k) clearance to promote the device.
Changes in Cleared or Approved Devices.
Certain modifications to our marketed devices, including certain manufacturing changes, product enhancements and product line extensions, require new 510(k) clearance or approval of a PMA supplement. For devices marketed under an approved PMA, we must submit a PMA supplement to the FDA for review and approval prior to making a change to the device that affects the safety or effectiveness of the device, including changes to the design, manufacturing or labeling of the device. Likewise, for 510(k)-cleared devices, we must obtain new FDA 510(k) clearance when there is a major change or modification in the intended use or indications for use or a change or modification of the device that could significantly affect the safety or effectiveness of the device. In some cases, clinical data may be required to support a PMA supplement or 510(k) premarket notification for a device modification. The FDA may determine that a modified device is not substantially equivalent to the marketed device or may require that additional information, including clinical data, be submitted before a determination is made, either of which could significantly delay the introduction of modified devices.
Quality System Requirements.
The FDCA requires us to comply with the Quality System Regulation (“QSR”) and various foreign regulations require compliance with ISO 13485 or national law requirements pertaining to all aspects of our product design and manufacturing processes, including requirements for packaging, labeling, record keeping, personnel training, supplier qualification, design controls, complaint handling, corrective and preventive actions and internal auditing. The FDA and foreign regulators enforce these requirements through periodic inspections of medical device manufacturers. These requirements are complex, technical and require substantial resources to remain compliant. Our failure or the failure of our suppliers to maintain compliance with these requirements could result in the shutdown of our manufacturing operations or the recall of our products, which would have a material adverse effect on our business. If one of our suppliers fails to maintain compliance with our quality requirements, we may have to qualify a new supplier and could experience manufacturing delays as a result. We also could be subject to injunctions, product seizures, or civil or criminal penalties.
Labeling and Promotion
.
Our labeling and promotional activities are also subject to scrutiny by the FDA and foreign regulators. Labeling includes not only the label on a device, but also includes any descriptive or informational literature that accompanies or is used to promote the device. Among other things, labeling violates the law if it is false or misleading in any respect or it fails to contain adequate directions for use. Moreover, product claims that are outside the approved or cleared labeling violate the FDCA and other applicable regulations. If the FDA determines that our promotional materials constitute promotion of an uncleared or unapproved use, or otherwise violate the FDCA, it could request that we modify our promotional materials or subject us to regulatory or enforcement actions, including the issuance of an untitled letter, a notice of violation, a warning letter, injunction, seizure, civil fines or criminal penalties. Allegations of off-label promotion can also result in enforcement action by federal, state, or foreign enforcement authorities and trigger significant civil or criminal penalties, including exclusion from the Medicare and Medicaid programs and liability under the False Claims Act, discussed further below.
17
Our product promotion is also subject to regulation by the Federal Trade Commission (the “FTC”), which has primary oversight of the advertising of unrestricted devices. The Federal Trade Commission Act prohibits unfair methods of competition and unfair or deceptive acts or practices in or affecting commerce, as well as unfair or deceptive practices such as the dissemination of any false or misleading advertisement pertaining to medical devices. FTC enforcement can result in orders requiring, among other things, limits on advertising, corrective advertising, consumer redress, rescission of contracts and such other relief as the FTC may deem necessary.
In addition, under the federal Lanham Act and similar state laws, competitors and others can initiate litigation relating to advertising claims.
Import Requirements.
To import a medical device into the United States, the importer must file an entry notice and bond with the United States Bureau of Customs and Border Protection (“CBP”). All devices are subject to FDA examination before release from the CBP. Any article that appears to be in violation of the FDCA may be refused admission and a notice of detention and hearing may be issued. If the FDA ultimately refuses admission, the CBP may issue a notice for redelivery and assess liquidated damages for up to three times the value of the lot. Additionally, the laws of the United States require imported articles to have their labels accurately marked with the appropriate country of origin, the violation of which may result in confiscation, fines and penalties.
Export Requirements.
Products for export from Europe or the United States are subject to foreign countries' import requirements and the exporting requirements of the FDA or European regulating bodies, as applicable. In particular, international sales of medical devices manufactured in the United States that are not approved or cleared by the FDA for use in the United States, or are banned or deviate from lawful performance standards, are subject to FDA export requirements and we may not be able to export such products.
Foreign countries often require, among other things, an FDA certificate for products for export, also called a Certificate to Foreign Government. To obtain this certificate from the FDA, the device manufacturer must apply to the FDA. The FDA certifies that the product has been granted clearance or approval in the United States and that the manufacturing facilities were in compliance with the QSR at the time of the last FDA inspection.
Additionally, the export of our products to certain countries is subject to restrictions due to trade and economic sanctions imposed by the United States, the European Union (the "EU") and other governments and organizations. The U.S. Departments of Justice, Commerce, State and Treasury and other federal agencies and authorities have a broad range of civil and criminal penalties they may seek to impose against corporations and individuals for violations of economic sanctions laws, export control laws, and other federal statutes and regulations, including those established by the Office of Foreign Assets Control (“OFAC”). Under these laws and regulations, as well as other export control laws, customs laws, sanctions laws and other laws governing our operations, various government agencies may require export licenses and may seek to impose modifications to business practices, including cessation of business activities in sanctioned countries or with sanctioned persons or entities.
Additional Post-market Requirements
. Medical device manufacturers are also subject to other post-market requirements, including product listing and establishment regulations, compliance with the FDA’s requirements for unique device identifiers, reports of corrections and removals and other requirements. Medical Device Reporting (“MDR”) requirements of the FDA, vigilance reporting requirements under the European Medical Devices Directive and similar regulations in other foreign markets, require manufacturers to report to the FDA or an equivalent foreign regulatory body any incident in which their device may have caused or contributed to a death or serious injury, or has malfunctioned in a way that would likely cause or contribute to a death or serious injury if the malfunction of the device or a similar device were to recur. Our obligation to report under the MDR regulations is triggered on the date on which we become aware of an adverse event and the nature of the event. If we fail to comply with our MDR reporting obligations, the FDA could issue warning letters or untitled letters, take administrative actions, commence criminal prosecution, impose civil monetary penalties, revoke our device clearances, seize our products, or delay the clearance of our future products.
The FDA regularly inspects companies to determine compliance with the QSRs and other post-market requirements. Failure to comply with statutory requirements and the FDA’s regulations can result in an FDA Form 483 (which is issued by the FDA at the conclusion of an inspection when an investigator has observed any conditions that may constitute violations), public warning letters, monetary penalties against a company or its officers and employees, suspension or withdrawal of regulatory approvals, operating restrictions, total or partial suspension of production, injunctions, product recalls, product detentions, refusal to provide export certificates, seizure of products and criminal prosecution.
Foreign Regulations.
Medical device laws and regulations are also in effect in many countries outside of the United States. These laws and regulations vary significantly from country to country and range from comprehensive device approval
18
requirements for some or all of our medical device products to more basic requests for product data or certification. The number, scope, complexity, and cost of these requirements are increasing.
Foreign regulatory approval processes for medical devices are expensive, uncertain and lengthy. There can be no assurance that we will be able to obtain necessary regulatory approvals for any product on a timely basis or at all. Delays in receipt of or failure to receive such approvals, the loss of previously received approvals, or the failure to comply with existing or future regulatory requirements could have a material adverse effect on our business, financial condition or results of operations.
The regulatory framework for medical devices in the European Economic Area underwent a significant revision in 2017, which has introduced new regulatory requirements to obtain CE Mark approval. The new Medical Device Regulations (“MDR”) include a three-year transition period which is scheduled to end in 2020. The MDR includes increasingly stringent requirements in multiple areas, such as pre-market clinical evidence (some of which are now in effect), review of high-risk devices, labeling and post-market surveillance. Under the MDR, pre-market clinical data will now be required to obtain CE Mark approval for high-risk, new and modified medical devices. We believe these new requirements have the potential to be expensive and time-consuming to implement and maintain and could have a material adverse effect on our business.
Reimbursement.
Our products are generally used in medical procedures that are covered and reimbursed by governmental payers, such as Medicare, and/or private health plans. In general, these third-party payers cover a medical device and/or related procedure only when the payer determines that healthcare outcomes are supported by medical evidence and the device or procedure is medically necessary for the diagnosis or treatment of the patient’s illness or injury. Even if a device has received clearance or approval for
marketing by the FDA, there is no certainty that third-party payers will cover and reimburse for the cost of the device and related procedures. Because of increasing cost-containment pressures, some private payers in the U.S. and government payers in foreign countries may also condition payment on the cost-effectiveness of the device or procedure. Even if coverage is available, third-party payers may place restrictions on the circumstances in which they provide coverage or may offer reimbursement that is not sufficient to cover the cost of our products. If healthcare providers such as hospitals and physicians cannot obtain adequate coverage and reimbursement for our products or the procedures in which they are used, this may affect demand for our products and our business, financial condition, results of operations, or cash flows could suffer a material adverse impact.
Patient Protection and Affordable Care Act.
The Patient Protection and Affordable Care Act (“Affordable Care Act”) has changed the way healthcare in the United States is financed by both governmental and private insurers and has significantly affected the medical device industry. This law contains a number of provisions, including provisions governing enrollment in federal healthcare programs, reimbursement changes, the increased funding of comparative effectiveness research for use in healthcare decision-making, and enhancements to fraud and abuse requirements and enforcement, that we believe affect existing government healthcare programs and result in the development of new programs. The Affordable Care Act imposed on medical device manufacturers a 2.3% excise tax on U.S. sales of certain medical devices, which adversely affected our gross profit and earnings for our marketed products in 2015. The U.S. Congress suspended the excise tax for the 2016 and 2017 tax years and recently extended the suspension until January 1, 2020. We cannot predict whether any new action will be taken and whether the suspension will continue past 2020. If the excise tax is not repealed or further suspended, it will likely adversely impact our future results of operations.
Additionally, the long-term viability of the Affordable Care Act, and its impact on our business and results of operations, remains uncertain. For instance, in December 2017, the United States enacted the Tax Cuts and Jobs Act, which, among other things, eliminated the tax penalty for not obtaining health coverage (beginning in 2019). Additionally, members of the U.S. Congress have suggested other changes that may impact individual insurance marketplaces. These and other legislative and executive initiatives may significantly change the scope and impact of the Affordable Care Act and, in turn, the medical device industry. See Note 5 of the notes to our consolidated financial statements for further information on the Tax Cuts and Jobs Act.
The U.S. Physician Payment Sunshine Act, and similar state laws, also include annual reporting and disclosure requirements for device manufacturers aimed at increasing the transparency of the interactions between device manufacturers and healthcare providers. Reports submitted under these new requirements are placed in a public database. Other jurisdictions outside the United States have also begun adopting similar physician transparency laws. In addition to the burden of establishing processes for compliance, if we fail to provide these reports, or if the reports we provide are not accurate, we could be subject to significant penalties.
Anti-Corruption Laws.
Anti-bribery and anti-corruption laws are in place in the United States and in many jurisdictions throughout the world. In the United States, the Foreign Corrupt Practices Act (the "FCPA") prohibits corruptly offering, paying, or promising to pay anything of value to foreign officials for the purpose of obtaining or maintaining business. Anti-bribery laws present particular challenges in the medical device industry because in many countries including China, hospitals are state-owned or operated by the government, and doctors and other hospital employees are considered foreign government officials. The FCPA
19
also requires that we maintain fair and accurate books and records and devise and maintain an adequate system of internal accounting controls. Among other requirements to implement compliance, we are required to train our U.S. and international employees, and to train and monitor foreign third parties with whom we contract,
e.g
., distributors, to ensure compliance with these anti-corruption laws. Failing to comply with the FCPA or any other anti-corruption law could result in fines, penalties or other adverse consequences.
In addition,
t
he Chinese government has also sponsored anti-corruption campaigns from time to time, which could have a chilling effect on any future marketing efforts by us to new hospital customers. There have been recent occurrences in which certain hospitals have denied access to sales representatives from medical device companies because the hospitals wanted to avoid the perception of corruption. If this attitude becomes widespread among our potential customers, our ability to promote our products to hospitals may be adversely affected.
As we expand our operations in China and other jurisdictions internationally, we will need to increase the scope of our compliance programs to address the risks relating to the potential for violations of the FCPA and other anti-bribery and anti-corruption laws. Our compliance programs will need to include policies addressing not only the FCPA, but also the provisions of a variety of anti-bribery and anti-corruption laws in multiple foreign jurisdictions, including China, provisions relating to books and records that apply to us as a public company, and include effective training for our personnel and relevant third-parties.
Anti-Kickback Statutes.
The federal healthcare Anti-Kickback Statute prohibits persons from, among other things, knowingly and willfully offering or paying remuneration, directly or indirectly, to a person to induce the purchase, order, lease, or recommendation of a good or service for which payment may be made in whole or part under a federal healthcare program such as Medicare or Medicaid, unless the arrangement fits within one of several statutory exemptions or regulatory “safe harbors.” The definition of remuneration has been broadly interpreted to include anything of value, including, for example, gifts, discounts, the furnishing of supplies or equipment, credit arrangements, payments of cash and waivers of payments. Violations can result in significant penalties, imprisonment and exclusion from Medicare, Medicaid and other federal healthcare programs. Exclusion of a manufacturer would preclude any federal healthcare program from paying for the manufacturer’s products. In addition, kickback arrangements can provide the basis for an action under the False Claims Act, which is discussed in more detail below. A party’s failure to fully satisfy a regulatory “safe harbor” provision may result in increased scrutiny by government enforcement authorities.
Government officials have recently increased enforcement efforts on the sales and marketing activities of pharmaceutical, medical device and other healthcare companies, and recently have brought cases against individuals or entities that allegedly offered unlawful inducements to potential or existing customers to procure their business. Settlements of these government cases have involved significant fines and penalties and, in some instances, criminal pleas.
In addition to the Anti-Kickback Statute, many states have their own anti-kickback laws. Often, these laws closely follow the language of the federal law, although they do not always have the same exceptions or safe harbors. In some states, these anti-kickback laws apply with respect to all payers, including commercial health insurance companies.
False Claims Laws.
The False Claims Act prohibits any person from knowingly presenting, or causing to be presented, a false claim for payment to the federal government or knowingly making, or causing to be made, a false statement to get a false claim paid. Manufacturers can be held liable under false claims laws, even if they do not submit claims to the government, if they are found to have caused submission of false claims. Under the Affordable Care Act, a violation of the Anti-Kickback Statute is deemed to be a violation of the False Claims Act. The False Claims Act also includes whistleblower provisions that allow private citizens to bring suit against an entity or individual on behalf of the United States and to recover a portion of any monetary recovery. Many of the recent, highly publicized settlements in the healthcare industry relating to sales and marketing practices have been cases brought under the False Claims Act. Most states also have adopted statutes or regulations similar to the federal laws, which apply to items and services reimbursed under Medicaid and other state programs. Sanctions under the Federal Claims Act and state laws may include civil monetary penalties, exclusion of a manufacturer's products from reimbursement under government programs, criminal fines and imprisonment.
Labor Standards Laws
. We are also subject to corporate social responsibility (“CSR”) laws and regulations which require us to monitor the labor standards in our supply chain, including the California Transparency in Supply Chains Act, the UK Modern Slavery Act, and U.S. Federal Acquisition Regulations regarding Combating Trafficking in Persons. These CSR laws and regulations may impose additional processes and supplier management systems and have led certain key customers to impose additional requirements on medical device companies, including audits, as a prerequisite to selling products to such customers, which could result in increased costs for our products, the termination or suspension of certain suppliers, and reductions in our margins and profitability.
Privacy and Security.
The Health Insurance Portability and Accountability Act of 1996 (“HIPAA”), the Health Information Technology for Economic and Clinical Health Act (the “HITECH Act”), and accompanying rules, require certain
20
entities, referred to as "covered entities" (including most healthcare providers and health plans), to comply with established standards, including standards regarding the privacy and security of protected health information (“PHI”). HIPAA further requires that covered entities enter into agreements meeting certain regulatory requirements with their “Business Associates,” as such term is defined by HIPAA, which, among other things, obligate the Business Associates to safeguard the covered entity's PHI against improper use and disclosure. In addition, a Business Associate may face significant statutory and contractual liability if the Business Associate breaches the agreement or causes the covered entity to fail to comply with HIPAA. Additionally, many state laws regulate the use and disclosure of health information and require notification in the event of breach of such information.
Although we do not believe we are a “covered entity” under HIPAA and do not meet the definition of “Business Associate, we are committed to maintaining the security and privacy of patients’ health information and believe that we meet the expectations of the HIPAA rules in all material respects. However, to the extent we become subject to HIPAA, whether through a change in our business model or an enforcement action brought by the U.S. government, we would be directly subject to a broader range of requirements under HIPAA, HITECH, the rules issued thereunder and their respective civil and criminal penalties.
The EU has recently adopted a comprehensive overhaul of its data protection regime from the current national legislative approach to a single EU privacy regulation, the General Data Protection Regulation (“GDPR”), which applies as of May 25, 2018. The GDPR extends the scope of the EU data protection law to all companies processing personal data in the context of the activities of an establishment of a controller or a processor in the EU, regardless of whether the processing takes place in the EU or not. In addition, it applies to the processing of personal data of data subjects who are in the EU by a controller or processor not established in the EU, where the processing activities are related to: (a) the offering of goods or services, irrespective of whether a payment of the data subject is required, to such data subjects in the EU; or (b) the monitoring of their behavior as far as their behavior takes place within the EU. The GDPR provides for a harmonization of the data protection regulations throughout the EU. It imposes a strict data protection compliance regime with severe penalties of up to the greater of 4% of worldwide turnover or €20 million and includes new rights such as the “portability” of personal data. Although the GDPR will apply across the EU without a need for local implementing legislation, it contains a number of opener clauses enabling the EU member states to provide for additional legislation. In addition, local data protection authorities will still have the ability to interpret the GDPR, which has the potential to create inconsistencies on a country-by-country basis. We are evaluating the rule and its requirements and are implementing changes to our business practices to comply with the GDPR.
We post on our websites our privacy policies and practices regarding the collection, use and disclosure of user data. Any failure, or perceived failure, by us to comply with our posted privacy policies or with any applicable regulatory requirements or orders, or privacy, data protection, information security or consumer protection-related privacy laws and regulations in one or more jurisdictions, could result in proceedings or actions against us by governmental entities or others, including class action privacy litigation in certain jurisdictions, subject us to significant fines, penalties, judgments and negative publicity, require us to change our business practices, increase the costs and complexity of compliance, and adversely affect our business. Data protection, privacy and information security have become the subject of increasing public, media and legislative concern. If our customers were to reduce their use of our products and services as a result of these concerns, our business could be materially harmed. As noted above, we are also subject to the possibility of security and privacy breaches, which themselves may result in a violation of these privacy laws.
Environmental, Health and Safety Regulations.
We are subject to various federal, state, local and foreign laws and regulations relating to the protection of the environment, as well as public and employee health and safety. In the course of our business, we are involved in the handling, storage and disposal of certain chemicals. The laws and regulations applicable to our operations include provisions that regulate the release or discharge of hazardous or other regulated materials into the environment. These environmental laws and regulations may impose “strict liability,” rendering a person liable without regard to negligence or fault on the part of such person. Such environmental laws and regulations may expose us to liability for the conduct of, or conditions caused by, others, or for acts that were in non-compliance with all applicable laws at the time the acts were performed. Failure to comply with applicable environmental laws could have a material adverse effect on our business. Our operations are also subject to various laws and regulations relating to occupational health and safety. We maintain safety, training and maintenance programs as part of our ongoing efforts to ensure compliance with applicable laws and regulations. Compliance with applicable health and safety laws and regulations has required and continues to require expenditures. Environmental, health and safety legislation and regulations change frequently. Changes in those regulations could have a material adverse effect on our business, operations or financial condition.
Seasonality
Our worldwide sales have not historically reflected a significant degree of seasonality; however, customer purchases have historically been lower during the third quarter of the year, as compared to other quarters. This reflects, among other factors, lower demand during summer months in countries in the northern hemisphere.
21
Employees
As of December 31, 2017, we employed 4,876 people. None of our U.S. employees are subject to collective bargaining agreements; however, certain of our European employees are subject to such agreements. We believe our employee relations are generally good. Although our European employees will likely continue to be subject to collective organizing and bargaining activities, we do not expect such activities to materially affect our future operations.
Recent Developments
On February 14, 2018, we completed the acquisition of two product lines from BD pursuant to the terms of an asset purchase agreement, dated as of November 15, 2017 (the “BD Agreement”). The acquisition occurred in connection with BD’s acquisition of C.R. Bard, Inc. (“Bard”). The purchase price for the acquired product lines and related assets was $100.1 million, subject to adjustment for fluctuations in the value of transferred inventory. We financed the acquisition through borrowings under our existing credit facility.
Under the BD Agreement, we acquired soft tissue core needle biopsy products under the trade names of Achieve® Programmable Automatic Biopsy System, Temno® Biopsy System, and Tru-Cut® Biopsy Needles (which were previously sold by BD) as well as the Aspira® Pleural Effusion Drainage Kits and the Aspira® Peritoneal Drainage System (which were previously sold by Bard).
Available Information
We file annual, quarterly and current reports and other information with the SEC. These materials can be inspected and copied at the SEC’s Public Reference Room at 100 F Street, NE, Washington, D.C. 20549. Copies of these materials may also be obtained by mail at prescribed rates from the SEC’s Public Reference Room at the above address. Information about the Public Reference Room can be obtained by calling the SEC at 1-800-SEC-0330. The SEC also maintains an Internet site that contains reports, proxy and information statements, and other information regarding issuers that file electronically with the SEC. The address of the SEC’s Internet website is www.sec.gov.
We make available, free of charge, on our Internet website, located at www.merit.com, our most recent Annual Report on Form 10-K, our most recent Quarterly Reports on Form 10-Q, any Current Reports on Form 8-K filed since our most recent Annual Report on Form 10-K, and any amendments to such reports as soon as reasonably practicable following the electronic filing of such report with the SEC. In addition, we provide electronic or paper copies of such filings free of charge upon request.
Financial Information About Foreign and Domestic Sales
For financial information relating to our foreign and domestic sales see Note 12 to our consolidated financial statements set forth in Item 8 of this report.
|
Item 1A.
|
Risk Factors.
|
Our business, operations and financial condition are subject to certain risks and uncertainties. Should one or more of these risks or uncertainties materialize, or should any underlying assumptions prove incorrect, our actual results will vary, and may vary materially, from those anticipated, estimated, projected or expected. Among the key factors that may have a direct bearing on our business, operations or financial condition are the factors identified below:
We may be unable to successfully manage growth, particularly if accomplished through acquisitions, and the integration of acquired businesses may present significant challenges that could harm our operations.
Successful implementation of our business strategy will require that we effectively manage any associated growth. To manage growth effectively, our management will need to continue to implement changes in certain aspects of our business, to improve our information systems, infrastructure and operations to respond to increased demand, to attract and retain qualified personnel, and to develop, train, and manage an increasing number of management-level and other employees. Growth could place an increasing strain on our management, financial, product design, marketing, distribution and other resources, and we could experience operating difficulties. Any failure to manage growth effectively could have a material adverse effect on our business, operations or financial condition.
22
Over the past several years, we completed a series of significant acquisitions. As we grow through acquisitions, we face the additional challenges of integrating the operations, culture, information management systems and other characteristics of the acquired entity with our own.
Efforts to integrate future acquisitions may be hampered by delays, the loss of certain employees, suppliers or customers, proceedings resulting from employment terminations, culture clashes, unbudgeted costs, and other issues, which may occur at levels that are more severe or prolonged than anticipated.
We have incurred, and will likely continue to incur, significant expenses in connection with negotiating and consummating various acquisition transactions, and we may inherit significant liabilities in connection with prospective acquisitions, including
regulatory, infringement, product liability, discrimination or other legal claims or issues
. In addition, we may not realize competitive advantages, synergies or other benefits anticipated in connection with any such acquisition. If we do not adequately identify targets for, or manage issues related to, our future acquisitions, such acquisitions may have an adverse effect on our business, operations or financial condition.
We may not be able to effectively protect our intellectual property, which could harm our business and financial condition.
Our ability to remain competitive is dependent, in part, upon our ability to protect our intellectual property rights and prevent other companies from using our intellectual property. We seek to protect our intellectual property rights through a combination of confidentiality and license agreements, and through patent, trademark, copyright and trade secret laws. However, all these measures afford only limited protection and may be challenged, invalidated, or circumvented by third parties. Additionally, these measures may not prevent competitors from duplicating our products or gaining access to our proprietary information and technology. Third parties may copy all or portions of our products or otherwise use our intellectual property without authorization, and we may not be able to prevent the unauthorized disclosure or use of our technical knowledge or trade secrets by consultants, vendors, former employees and current employees, despite the existence of nondisclosure and confidentiality agreements and other contractual restrictions, all of which could have an adverse effect on our business, operations, or financial condition.
Third parties may also develop similar or superior technology independently or by designing around our patents. In addition, the laws of some foreign countries do not offer the same level of protection for our intellectual property as the laws of the U.S. Further, no assurances can be given that any patent application we have filed or will file will result in a patent being issued, or that any existing or future patents will afford adequate or meaningful protection against competitors or against similar technologies. All of our patents will eventually expire and some of our patents, including patents protecting significant elements of our technology, will expire within the next several years.
Filing, prosecuting and defending our intellectual property in all countries throughout the world may be prohibitively expensive. Litigation may be necessary in the future to enforce our intellectual property rights, protect our trade secrets or to determine the validity and scope of proprietary rights claimed by others. Any such lawsuits that we might initiate could be expensive, take significant time and divert management's attention from our business. Litigation also puts our patents at risk of being invalidated or interpreted narrowly. Additionally, we may provoke third parties to assert claims against us. Moreover, the legal systems of certain countries, particularly certain developing countries, do not favor the aggressive enforcement of patent and other intellectual property protection, which makes it difficult to stop infringement. We may not prevail in any lawsuits that we initiate and the damages or other remedies awarded, if any, may not be commercially valuable.
Third parties claiming that we infringe their intellectual property rights could cause us to incur significant legal or licensing expenses and prevent us from selling our products.
Our commercial success will depend in part on not infringing or violating the intellectual property rights of others. From time to time, third parties may claim that we have infringed their intellectual property rights, including claims regarding patents, copyrights, trademarks, and trade secrets. We may not be aware of whether our products do or will infringe existing or future patents or the intellectual property rights of others. Because of constant technological change in the medical device industry in which we compete, the extensive patent coverage of existing technologies, and the rapid rate of issuance of new patents, it is possible that the number of these claims may grow. In addition, former employers of our former, current, or future employees may assert claims that such employees have improperly disclosed to us the confidential or proprietary information of these former employers. Any such claim, with or without merit, could result in costly litigation, distract management from day-to-day operations and harm our brand or reputation, which in turn could harm our business or results of operations. If we are not successful in defending such claims, we could be required to stop selling, delay shipments of, or redesign, our products, discontinue the use of related trademarks, technologies or designs, pay monetary amounts as damages, enter into royalty or licensing arrangements or satisfy indemnification obligations that we have with some of our customers. Royalty or licensing arrangements that we may seek in such circumstances may not be available to us on commercially reasonable terms or at all and we may not be able to redesign applicable products in a way to avoid infringing the intellectual property rights of others. We have made and expect to continue making significant expenditures to investigate, defend and settle claims related to the use of technology and intellectual property rights as part of our strategy to manage this risk.
23
The medical device industry is experiencing greater scrutiny and regulation by governmental authorities. Moreover, in October 2016, we received a subpoena from the U.S. Department of Justice seeking information on our marketing and promotional practices. If governmental authorities determine that we have violated laws or regulations, including in respect of our marketing or promotional practices, our company or our employees may be subject to various penalties, including civil or criminal penalties.
Our medical devices and business activities are subject to rigorous regulation by the FDA and other federal, state and foreign governmental authorities. These authorities and members of Congress have been increasing their scrutiny of the medical device industry. In recent years, the U.S. Congress, Department of Justice, the Office of Inspector General of the Department of Health and Human Services and the Department of Defense have issued subpoenas and other requests for information to medical device manufacturers, primarily related to financial arrangements with healthcare providers, regulatory compliance and product promotional practices. If we fail to comply with applicable regulatory requirements, we may be subjected to a wide variety of sanctions and enforcement actions, including warning letters that require corrective action, injunctions, product seizures or recalls, suspension of product manufacturing, revocation of approvals, exclusion from participation in government healthcare programs, civil fines and criminal penalties.
In October 2016, we received a subpoena from the U.S. Department of Justice seeking information on certain of our marketing and promotional practices. Although we are in the process of responding to the subpoena, we may not be able to resolve this matter, or similar matters that may arise in the future, without our company or employees incurring significant fines, penalties, or other adverse civil or criminal consequences. Even if we are successful in resolving the pending matter without such consequences, we have incurred, and anticipate that we will continue to incur, substantial costs in connection with the matter. The pending matter, or other governmental proceedings, could significantly impact our reputation and divert management’s attention and resources from growing our business, which in turn could harm our business, results of operations, financial condition and ability to obtain financing on reasonable terms or at all.
We anticipate that government authorities will continue to scrutinize our industry closely, and that additional regulation by government authorities may increase compliance costs, exposure to litigation and other adverse effects on our operations.
Use of our products in unapproved circumstances could expose us to liabilities.
The marketing approvals from the FDA and other regulators of certain of our products are, or are expected to be, limited to specific uses. We are prohibited from marketing or promoting any unapproved use of our product. However, physicians may use these products in ways or circumstances other than those strictly within the scope of the regulatory approval. The use of our products for unauthorized purposes could arise from our sales personnel or distributors violating our policies by providing information or recommendations about such unauthorized uses. Consequently, claims may be asserted by the FDA or other enforcement agencies that we are not in compliance with applicable laws or regulations or have improperly promoted our products for uncleared or unapproved uses. The FDA or such other agencies could require a recall of products or allege that our promotional activities misbrand or adulterate our products or violate other legal requirements, which could result in investigations, prosecutions, fines or other civil or criminal actions.
The FDA regulatory clearance process is expensive, time-consuming and uncertain, and the failure to obtain and maintain required regulatory clearances and approvals could prevent us from commercializing our products.
Before we can introduce a new device or a new use of or a claim for a cleared device in the United States, we must generally obtain market clearance from the FDA through the 510(k) premarket notification process or through a PMA application, unless an exemption for lower-risk devices or an alternative procedure, such as a de novo classification request or a humanitarian device exemption, applies. The FDA clearance and approval processes for medical devices are expensive, uncertain and time-consuming.
If human clinical trials of a medical device are required for FDA clearance or approval and the device presents a significant risk, the sponsor of the trial must file an IDE application with the FDA prior to commencing such trials in the U.S. Submission of an IDE application does not ensure that the FDA will issue the IDE. If the IDE application is approved, there can be no assurance the FDA will determine that the data derived from the trials support the safety and effectiveness of the device or warrant the continuation of clinical trials. For clinical trials involving a device that does not present a significant risk, the sponsor is not required to obtain approval of an IDE, but the sponsor must obtain the review and approval of an institutional review board. Both significant risk and non-significant risk trials are subject to additional FDA regulations, including a requirement to obtain informed consent and reporting and recordkeeping requirements. We, the FDA, or the institutional review board, may suspend a clinical trial at any time for various reasons, including a belief that the risks to study subjects outweigh the anticipated benefits.
24
We are also required to seek FDA clearance for certain manufacturing changes, product enhancements and product line extensions, which may require new 510(k) clearance or approval of a PMA supplement. For devices marketed under an approved PMA, we must submit a PMA supplement to the FDA for review and approval prior to making a change to the device that affects the safety or effectiveness of the device, including changes to the design, manufacturing or labeling of the device. Likewise, for 510(k)-cleared devices, we must obtain new FDA 510(k) clearance when there is a major change or modification in the intended use or indications for use or a change or modification of the device that could significantly affect the safety or effectiveness of the device. In some cases, clinical data may be required to support a PMA supplement or 510(k) premarket notification for a device modification.
The FDA requires every manufacturer to make the determination regarding the need for a new 510(k) submission or a PMA supplement in the first instance, but the FDA may review the manufacturer’s decisions not to seek a new 510(k) or PMA supplement. We may make changes to our cleared products without seeking additional clearances or approvals if we believe such clearances or approvals are not necessary. However, the FDA may disagree and determine that such a modified device is not substantially equivalent to the marketed device or may require additional information, including clinical data, to be submitted before a determination is made, in which case we may be required to delay the introduction and marketing of our modified products, redesign our products, conduct clinical trials to support any modifications and pay significant regulatory fines or penalties. In addition, the FDA may not approve or clear our products for the indications that are necessary or desirable for successful commercialization.
There is no assurance that we will be able to obtain the necessary regulatory clearances or approvals for any product on a timely basis or at all. Further, the FDA may change its clearance and approval policies, adopt additional regulations or revise existing regulations, or take other actions which may prevent or delay approval or clearance of our products under development or impact our ability to modify our currently cleared products on a timely basis. Delays in receipt of, or failure to obtain, regulatory clearances for any product enhancements or new products we develop would result in delayed or no realization of revenue from such product enhancements or new products and in substantial additional costs, which could decrease our profitability.
In addition, we are required to continue to comply with applicable FDA and other regulatory requirements once we have obtained clearance for a product. We cannot assure you that we will successfully maintain the clearances we have received or may receive in the future. In addition, our existing clearances can be revoked if any issues arise that bring into question our products’ safety or effectiveness. The loss of previously received clearances or approvals, or the failure to comply with existing or future regulatory requirements could also have a material adverse effect on our business.
We rely on the proper function, availability and security of information technology systems to operate our business and a material disruption of critical information systems or a material breach in the security of our systems may adversely affect our business and customer relationships.
We rely on information technology systems (including technology from third party providers) to process, transmit, and store electronic information in our day-to-day operations, including sensitive personal information and proprietary or confidential information. We also rely on our technology infrastructure, among other functions, to interact with customers and suppliers, fulfill orders and bill, collect and make payments, ship products, provide support to customers, fulfill contractual obligations and otherwise conduct business. Our internal information technology systems, as well as those systems maintained by third-party providers, may be subjected to computer viruses or other malicious codes, unauthorized access attempts, and cyber-attacks, any of which could result in data leaks or otherwise compromise our confidential or proprietary information and disrupt our operations. Cyber-attacks are becoming more sophisticated and frequent, and there can be no assurance that our protective measures will prevent security breaches that could have a significant impact on our business, reputation and financial results, particularly attacks that result in our intellectual property and other confidential information being accessed or stolen. Cyber-attacks could also result in unauthorized access to our systems and products, including personal information of individuals, which could also result in actions by regulatory bodies or civil litigation. If we fail to monitor, maintain or protect our information technology systems and data integrity effectively or fail to anticipate, plan for or manage significant disruptions to these systems, we could, among other things, lose customers, be subject to fraud, breach our agreements with or duties toward customers, physicians, other health care professionals and employees, be subject to regulatory sanctions or penalties, incur expenses or lose revenues or suffer other adverse consequences. Unauthorized tampering, adulteration or interference with our products may also create issues with product functionality that could result in a loss of data, risk to patient safety, and product recalls or field actions. Any of these events could have a material adverse effect on our business, operations or financial condition.
We are subject to export control laws, customs laws, sanctions laws and other laws governing our operations in the U.S. and other countries. If we fail to comply with these laws, we could be subject to civil or criminal penalties, other remedial measures and legal expenses, which could adversely affect our business, results of operations and financial condition.
25
Our global operations expose us to trade and economic sanctions and other restrictions imposed by the United States, the EU and other governments and organizations. The U.S. Departments of Justice, Commerce, State and Treasury and other federal agencies and authorities have a broad range of civil and criminal penalties they may seek to impose against corporations and individuals for violations of economic sanctions laws, export control laws, and other federal statutes and regulations, including those established by the Office of Foreign Asset Control. Under these laws and regulations, as well as other export control laws, customs laws, sanctions laws and other laws governing our operations, various government agencies may require export licenses, may seek to impose modifications to business practices, including cessation of business activities in sanctioned countries or with sanctioned persons or entities and modifications to compliance programs, which may increase compliance costs, and may subject us to fines, penalties and other sanctions. A violation of these laws or regulations could adversely impact our business, results of operations and financial condition.
A significant adverse change in, or failure to comply with, governing regulations could adversely affect our business, operations or financial condition.
We have extensive global operations, which necessitate that we seek various regulatory approvals for our products in the jurisdictions where our products are sold. Different regulatory requirements for product approvals and our need to comply with different regulatory regimes could impact our business.
Substantially all of our products are “devices,” as defined in the FDCA, and the manufacture, distribution, record keeping, labeling and advertisement of substantially all of our products are subject to regulation by the FDA in the United States and equivalent regulatory agencies in various foreign countries in which our products are manufactured, distributed, labeled, offered or sold. Further, we are subject to regular review and periodic inspections at our facilities with respect to compliance with the FDCA, QSR, ISO standards and similar requirements of foreign countries, which may cover, among others, the procedures and documentation of the design, testing, production, control, quality assurance, labeling, packaging, sterilization, storage and shipment of medical devices. Costs to comply with regulations, including, for instance, regulations for medical devices enacted by the EU in May 2017 and effective in 2020, and costs associated with remediation can be significant. Additionally, failure to comply with such requirements, or later discovery of previously unknown problems with our products or our third-party manufacturers’ manufacturing processes, including any failure to take satisfactory corrective action in response to an adverse QSR inspection, could result in total or partial suspension of production or distribution, a regulatory agency’s refusal to grant pending or future clearances or approvals for our products, withdrawal or suspension of regulatory clearances or approvals, clinical holds, warning letters or untitled letters or refusal to permit the import or export of our products.
The agreements and instruments governing our debt contain restrictions and limitations that could significantly affect our ability to operate our business, as well as significantly affect our liquidity.
We have entered into a Second Amended and Restated Credit Agreement with Wells Fargo Bank, National Association, as administrative agent, swingline lender and a lender, Wells Fargo Securities, LLC, as sole lead arranger and sole bookrunner and the lenders who are or may become party thereto, which was amended on September 28, 2016, March 20, 2017 and December 13, 2017 (as amended, the "Second Amended Credit Agreement"). The Second Amended Credit Agreement contains a number of significant covenants that could adversely affect our ability to operate our business, our liquidity or our results of operations. These covenants restrict, among other things, our incurrence of indebtedness, creation of liens or pledges on our assets, mergers or similar combinations or liquidations, asset dispositions, repurchases or redemptions of equity interests or debt, issuances of equity, payment of dividends and certain distributions and entry into related party transactions.
We have pledged substantially all of our assets as collateral for the Second Amended Credit Agreement. Our breach of any covenant in the Second Amended Credit Agreement, not otherwise cured, waived or amended, could result in a default under that agreement and could trigger acceleration of the underlying obligations. Any default under the Second Amended Credit Agreement could adversely affect our ability to service our debt and to fund our planned capital expenditures and ongoing operations. The administrative agent and lenders under the Second Amended Credit Agreement have available to them the remedies typically available to lenders and secured parties, including the ability to foreclose on the collateral we have pledged. Any default under the Second Amended Credit Agreement would at a minimum harm our ability to service our debt and to fund our prospective capital expenditures and ongoing operations. It could lead to an acceleration of indebtedness and foreclosure on our assets.
As currently amended, the Second Amended Credit Agreement provides for potential borrowings of up to $525.0 million. Such increased borrowing limits may make it more difficult for us to comply with leverage ratios and other restrictive covenants in the Second Amended Credit Agreement. We may also have less cash available for operations and investments in our business, as we will be required to use additional cash to satisfy the minimum payment obligations associated with this increased indebtedness.
26
We will be required to expend significant resources for research, development, testing and regulatory approval or clearance of our products under development and these products may not be developed successfully or approved for commercial use.
Most of our products under development will require significant additional research, development, engineering and, in some cases, preclinical and clinical testing, as well as regulatory approval or clearance and a commitment of significant additional resources prior to their commercialization. It is possible that our products may not:
|
•
|
be developed successfully;
|
|
•
|
be proven safe or effective in clinical trials;
|
|
•
|
offer therapeutic or other improvements over current treatments and products;
|
|
•
|
meet applicable regulatory standards or receive regulatory approvals or clearances;
|
|
•
|
be capable of production in commercial quantities at acceptable costs and in compliance with regulatory requirements;
|
|
•
|
be successfully marketed; or
|
|
•
|
be covered by private or public insurers.
|
We are currently conducting one clinical trial in an effort to obtain approval from the FDA that would enable us to expand our efforts to commercialize the QuadraSphere Microspheres. EU regulations do not currently require such applications for these classes of medical device. In order for us to obtain FDA approval to promote the use of QuadraSphere Microspheres for the purposes indicated in our clinical trial, we will need to complete the trial and submit positive clinical data to the FDA. If we cannot enroll study subjects in sufficient numbers to complete the necessary study, if there is a disruption in the supply of materials for the trial or if any other factors preclude us from completing the trial in a timely manner, we will likely not be able to complete the trial. Even if we complete the clinical trial, the FDA may require us to undertake additional testing, or the trial results may not be sufficient to obtain FDA approval for other reasons, including inconclusive or negative results of our trials or those conducted by our competitors or other third parties. Any clinical trials we undertake in the future will likely be subject to these and similar risks. If we do not obtain FDA approval or clearance of the product use claimed in a clinical trial, we will not be able to promote the subject product for the indicated treatment of the specific disease or condition in the United States.
We are subject to laws targeting fraud and abuse in the healthcare industry, the violation of which could adversely affect our business or financial results.
Our operations are subject to various state and federal laws targeting fraud and abuse in the healthcare industry, including the federal Anti-Kickback Statute and other anti-kickback laws, which prohibit any person from knowingly and willfully offering, paying, soliciting or receiving remuneration, directly or indirectly, to induce or reward either the referral of an individual, or the furnishing or arranging for an item or service, for which payment may be made under federal healthcare programs, such as the Medicare and Medicaid programs. Violations of these fraud and abuse-related laws are punishable by criminal or civil sanctions, including substantial fines, imprisonment and exclusion from participation in healthcare programs such as Medicare and Medicaid, any of which could harm our business or financial results.
We are also subject to the FCPA, the U.K. Bribery Act, and similar anti-bribery laws in non-U.S. jurisdictions. These laws generally prohibit companies and their intermediaries from illegally offering things of value to any individual for the purpose of obtaining or retaining business. As we continue to expand our business activities internationally, compliance with the FCPA and other anti-bribery laws presents greater challenges to our operations. If our employees or agents violate the provisions of the FCPA or other anti-bribery laws, we may incur fines or penalties, which could have a material adverse effect on our operating results or financial condition.
Healthcare reform legislation has negatively affected our financial results and may have a material adverse effect on our business, operations or financial condition.
The Affordable Care Act was enacted into law in March 2010, and most of the core pieces of the Affordable Care Act are now in effect. Certain other provisions of the legislation are not yet effective. There are many programs and requirements for which the details have not yet been fully established or consequences not fully understood, and it is unclear what the full impact
27
of the legislation will be. The law imposes on medical device manufacturers a 2.3% excise tax on U.S. sales of certain medical devices. Although this tax has been suspended until January 1, 2020, during the year ended December 31, 2015 we incurred $4.3 million related to this tax, which reduced our gross profit by 0.8%. We cannot predict whether the suspension will be continued beyond January 1, 2020. If the excise tax is not repealed or further suspended, it will likely adversely impact our future results of operations. In addition, the costs of compliance with the Affordable Care Act’s reporting and disclosure requirements, frequently identified as the Sunshine Act, with regard to payments or other transfers of value made to healthcare providers may have a material, negative impact on our results of operations and our cash flows.
Additionally, the long-term viability of the Affordable Care Act, and its impact on our business and results of operations, remains uncertain. For instance, in December 2017, the United States enacted the Tax Cuts and Jobs Act, which, among other things, eliminated the tax penalty for not obtaining health coverage (beginning in 2019). Additionally, members of the U.S. Congress have suggested other changes that may impact individual insurance marketplaces. These and other legislative and executive initiatives may significantly change the scope and impact of the Affordable Care Act and, in turn, the medical device industry.
We are subject to the regulations of our medical devices in foreign countries in which we sell our products and we will be required to expend significant resources for obtaining regulatory approval or clearance of our products and there may be delays and uncertainty in obtaining regulatory approval.
To be able to sell our products in foreign countries, we must obtain regulatory approvals and comply with the regulations of those countries. These regulations, including the requirements for approvals and the time required for regulatory review, vary from country-to-country.
The EU requires that manufacturers of medical devices obtain the right to affix the CE mark, for compliance with the Medical Device Directive (93/42/EEC), as amended, to medical devices before selling them in member countries of the EU. The CE mark is an international symbol of adherence to quality assurance standards and compliance with applicable European medical device directives. In order to obtain the authorization to affix the CE mark to products, a manufacturer must obtain certification that its processes and products meet certain European quality standards.
In April 2017, the EU adopted the Medical Device Regulation to replace the Medical Device Directive (93/42/EEC), as amended. The Medical Device Regulation will apply after a three-year transition period and imposes stricter requirements for the marketing and sale of medical devices and grants Notified Bodies increased post-market surveillance authority.
Complying with and obtaining regulatory approval in foreign countries have caused or may cause us to experience more uncertainty, risk, expense and delay in commercializing products in certain foreign jurisdictions, which could affect our ability to obtain approvals for our products in those jurisdictions and adversely impact our net sales, market share and operating profits from our international operations.
We are dependent upon key personnel.
Our success is dependent on key management personnel, including Fred P. Lampropoulos, our Chairman of the Board, President and Chief Executive Officer. Mr. Lampropoulos is not subject to any agreement prohibiting his departure, and we do not maintain key man life insurance on his life. The loss of Mr. Lampropoulos, or of certain other key management personnel, could have a materially adverse effect on our business and operations. Our success also depends on, among other factors, the successful recruitment and retention of key operating, manufacturing, sales and other personnel.
Our products may be subject to product liability claims.
Our products are used in connection with invasive procedures and in other medical contexts that entail an inherent risk of product liability claims. If medical personnel or their patients suffer injury or death in connection with the use of our products, whether as a result of a failure of our products to function as designed, an inappropriate design, inadequate disclosure of product-related risks or information, improper use, or for any other reason, we could be subject to lawsuits seeking significant compensatory and punitive damages. Product liability claims may be brought by individuals or by groups seeking to represent a class. We have previously faced claims by patients claiming injuries from our products. To date, these claims have not resulted in material harm to our operations or financial condition. The outcome of this type of personal injury litigation is difficult to assess or quantify. We maintain product liability insurance; however, there is no assurance that this coverage will be sufficient to satisfy any claim made against us. Moreover, any product liability claim brought against us could result in significant costs, divert our management’s attention from other business matters or operations, increase our product liability insurance rates, or prevent us from securing insurance coverage in the future. As a result, any lawsuit seeking significant monetary damages may have a material adverse effect on our business, operations or financial condition.
28
In addition, the occurrence of such an event or claim could result in a recall of products from the market or a safety alert relating to such products. Such a recall could result in significant costs, reduce our revenue, divert management's attention from our business, and harm our reputation.
Our products may cause or contribute to adverse medical events that we are required to report to the FDA, and if we fail to do so, we may be subject to sanctions that may materially harm our business.
Our products are subject to medical device reporting regulations, which require us to report to the FDA any incident in which our products may have caused or contributed to a death or serious injury, or in which our products malfunctioned and, if the malfunction were to recur, it could likely cause or contribute to a death or serious injury. Our obligation to report under the medical device reporting regulations is triggered on the date on which we become aware of an adverse event and the nature of the event. We may fail to report adverse events of which we become aware within the prescribed timeframe. We may also fail to recognize that we have become aware of a reportable adverse event, especially if it is not reported to us as an adverse event or if it is an adverse event that is unexpected or if the product characteristic that caused the adverse event is removed in time from our products. If we fail to comply with our medical device reporting obligations, the FDA could issue warning letters or untitled letters, take administrative actions, commence criminal prosecution, impose civil monetary penalties, revoke our device clearances, demand or initiate a product recall, seize our products, or delay the clearance of our future products.
We generally offer a limited warranty for the return of product due to defects in quality and workmanship. We attempt to estimate our potential liability for future product returns and establish reserves on our financial statements in amounts that we believe will be sufficient to address our warranty obligations; however, our actual liability for product returns may significantly exceed the amount of our reserves. If we underestimate our potential liability for future product returns, or if unanticipated events result in returns that exceed our historical experience, our financial condition and operating results could be materially harmed.
We lack direct sales and marketing capabilities in many countries, and are wholly dependent on our distributors for the commercialization of our products in these countries. If we are unable to maintain or establish sales capabilities on our own or through third parties, we may not be able to commercialize any of our products in those countries.
We have no or limited direct sales or marketing capabilities in some of the regions and countries in which our products are sold, including, among others, China, Japan, Russia and India. We have entered into distribution agreements with third parties to market and sell our products in those countries in which we do not have a direct sales force and in those countries in which we utilize a "modified direct" sales approach. If we are unable to maintain or enter into such distribution arrangements on acceptable terms, or at all, we may not be able to successfully commercialize our products in certain countries. Moreover, to the extent that we enter into distribution arrangements with other companies, our revenues, if any, will depend on the terms of any such arrangements and the efforts of others. These efforts may turn out not to be sufficient and our third-party distributors may not effectively sell our products. In addition, although our contract terms require our distributors to comply with all applicable laws regarding the sale of our products, including anti-competition, anti-corruption, anti-money laundering and sanctions laws, we may not be able to ensure proper compliance. If our distributors fail to effectively market and sell our products in full compliance with applicable laws, our results of operations and business could be impacted.
Our employees, independent contractors, consultants, manufacturers and distributors may engage in misconduct or other improper activities, including noncompliance with regulatory standards and requirements.
We are exposed to the risk that our employees, independent contractors, consultants, manufacturers and distributors may engage in fraudulent conduct or other illegal activity. Misconduct by these parties could include intentional, reckless or negligent conduct or disclosure of unauthorized activities to us that violates healthcare laws and regulations of the FDA and other federal, state and international authorities, manufacturing standards, and laws that require the true, complete and accurate reporting of financial information or data. We have adopted a code of business conduct and ethics, and a global anti-corruption policy, but it is not always possible to identify and deter misconduct, and the precautions we take to detect and prevent this activity may not be effective in controlling unknown or unmanaged risks or losses or in protecting us from governmental investigations or other actions or lawsuits stemming from a failure to be in compliance with such laws or regulations. If any such actions are instituted against us, and we are not successful in defending ourselves or asserting our rights, those actions could have a significant impact on our business, including the imposition of significant civil, criminal and administrative penalties.
The size of the market for our product groups has not been established with precision and may be smaller than we estimate.
Our estimates of the annual total addressable market for our cardiac intervention, peripheral intervention, interventional oncology and spine, and cardiovascular and critical care and endoscopy product groups are based on a number of internal and
29
third-party estimates, including published industry data. While we believe these factors have historically provided and may continue to provide us with effective tools in estimating the total market for our products, these estimates may not be correct and the conditions supporting our estimates may change at any time, thereby reducing the predictive accuracy of the underlying factors we consider in our analysis. As a result, our estimates of the annual total addressable market for our products may prove to be incorrect. If the actual number of patients who would benefit from our products and the annual total addressable market for our products is smaller than we have estimated, our sales growth may be impaired and our business adversely impacted. Even if the markets are as large as projected, there is no assurance that our market share or aggregate sales will increase as a result of the size of addressable markets.
Consolidation in the healthcare industry, group purchasing organizations or public procurement policies could lead to demands for price concessions, which may harm our ability to sell our products at prices necessary to support our current business strategies.
Healthcare costs have risen significantly over the past decade, which has resulted in or led to numerous cost reform initiatives by legislators, regulators and third-party payers. Cost reform has triggered a consolidation trend in the healthcare industry to aggregate purchasing power, which may create more requests for pricing concessions in the future. Additionally, group purchasing organizations, independent delivery networks, public procurement policies and large single accounts may continue to use their market power to consolidate purchasing decisions for hospitals and healthcare service providers. We expect that market demand, government regulation, third-party coverage and reimbursement policies and societal pressures will continue to change the healthcare industry worldwide, resulting in further business consolidations and alliances among our customers, which may exert further downward pressure on the prices of our products.
We may be unable to compete in our markets, particularly if there is a significant change in relevant practices or technology.
The markets in which our products compete are highly competitive. We face competition from many companies which are larger, better established, have greater financial, technical and other resources and possess a greater market presence than we do. Such resources and market presence may enable our competitors to more effectively market competing products or to market competing products at reduced prices in order to gain market share.
In addition, our ability to compete successfully is dependent, in part, upon our response to changes in technology and upon our efforts to develop and market new products which achieve significant market acceptance. Competing companies with substantially greater resources than us are actively engaged in research and development of new methods, treatments, drugs, and procedures to treat or prevent cardiovascular disease that could limit the market for our products and eventually make some of our products obsolete. A reduction in the demand for a significant number of our products, or a few key products, could have a material adverse effect on our business, operations or financial condition.
Our business is subject to complex and evolving U.S. and international laws and regulation regarding privacy and data protection. Many of these laws and regulations are subject to change and uncertain interpretation and could result in claims, changes to our business practices, penalties, increased cost of operations, or declines in user growth or engagement, or otherwise harm our business.
The U.S. and many other countries in which we conduct our operations have adopted laws and regulations protecting certain data, including medical and personal data, and requiring data holders and controllers to implement administrative, logical and technical controls and procedures. In addition, regulatory authorities around the world are considering a number of additional proposals concerning data protection. These laws and regulations have been, and may continue to be, inconsistent with each other, requiring different approaches in different jurisdictions. In addition, the interpretation and application of medical and personal data protection laws in the U.S., Europe, China and elsewhere are often uncertain and in flux. It is possible that these laws may be interpreted and applied in a manner that is inconsistent with our data practices. These legislative and regulatory proposals, if adopted, and such interpretations could, in addition to the possibility of fines, result in an order requiring that we change our data practices, which could have an adverse effect on our business and results of operations. Complying with these various laws could cause us to incur substantial costs or require us to change our business practices in a manner adverse to our business.
Recent legal developments in Europe have created compliance uncertainty regarding certain transfers of personal data from the European Union (“EU”) to the United States and other non-EU jurisdictions. For example, the GDPR, scheduled to come into application in the EU on May 25, 2018, will apply to all of our activities conducted from an establishment in the EU or related to products and services that we offer to EU users. The GDPR will create a range of new compliance obligations, which could cause us to change our business practices, and will significantly increase financial penalties for noncompliance (including possible fines of up to 4% of global annual turnover for the preceding financial year or €20 million (whichever is higher) for the most serious infringements).
30
Fluctuations in foreign currency exchange rates may negatively impact our financial results.
As our operations have grown outside the United States, we have also become increasingly subject to market risk relating to foreign currency. Those fluctuations could have a negative impact on our margins and financial results. During 2017, 2016 and 2015, the exchange rate between all applicable foreign currencies and the U.S. Dollar resulted in an increase in net sales of approximately $0.6 million, a decrease of approximately $4.9 million and a decrease of approximately $11.3 million, respectively.
For the year ended December 31, 2017, approximately $215.8 million, or 29.7%, of our net sales were denominated in foreign currencies, with our Euro-denominated sales representing our largest single currency risk. If the rate of exchange between foreign currencies declines against the U.S. Dollar, we may not be able to increase the prices we charge our customers for products whose prices are denominated in those respective foreign currencies. Furthermore, we may be unable or elect not to enter into hedging transactions which could mitigate the effect of declining exchange rates. As a result, if the rate of exchange between foreign currencies declines against the U.S. Dollar, our financial results may be negatively impacted.
Termination or interruption of, or a failure to monitor, our supply relationships and increases in the price of our component parts, finished products, third-party services or raw materials, particularly petroleum-based products, could have an adverse effect on our business, operations or financial condition.
We rely on raw materials, component parts, finished products and third-party services in connection with our business. For example, substantially all of our products are sterilized by only a few different entities. Additionally, many of our products have components that are manufactured using resins, plastics and other petroleum-based materials which are available from a limited number of suppliers. We are experiencing a growing trend among suppliers of polymer resins to refuse to supply resin to the medical device manufacturers or to require such manufacturers to assume additional risks due to the potential for product liability claims. Additionally, there is no assurance that crude oil supplies will be uninterrupted or that petroleum-based manufacturing materials will be available for purchase in the future. Any interruption to the supply of polymers or petroleum-based resins could have an adverse effect on our ability to produce, or on the cost to produce, our products.
The availability and price of these materials is affected by a variety of factors beyond our control, including the willingness of suppliers to sell into the medical device industry, changes in supply and demand, general economic conditions, labor costs, fuel-related transportation costs, competition, import duties, tariffs, currency exchange rates and political uncertainty around the world. Our suppliers may pass some of their cost increases on to us, and if such increased costs are sustained or increase further, our suppliers may pass further cost increases on to us. In addition to the effect on resin prices, transportation costs generally increase based on the effect of higher crude oil prices, and these increased transportation costs may be passed on to us.
We are also subject to CSR laws and regulations which require us to monitor the labor standards in our supply chain, including the California Transparency in Supply Chains Act, the UK Modern Slavery Act, and U.S. Federal Acquisition Regulations regarding Combating Trafficking in Persons. These CSR labor laws and regulations may impose additional processes and supplier management systems and have led certain key customers to impose additional requirements on medical device companies, including audits, as a prerequisite to selling products to such customers, which could result in increased costs for our products, the termination or suspension of certain suppliers, and reductions in our margins and profitability.
Our ability to recover such increased costs may depend upon our ability to raise prices on our products. Due to the highly competitive nature of the healthcare industry and the cost-containment efforts of our customers and third-party payers, we may be unable to pass along cost increases through higher prices. If we are unable to fully recover these costs through price increases or offset these increases through cost reductions or we experience terminations or interruption of our relationships with our suppliers we could experience lower margins and profitability, and our results of operations, financial condition and cash flows could be materially harmed.
We may be unable to accurately forecast customer demand for our products and manage our inventory.
To ensure adequate supply, we must forecast our inventory needs and place orders with our suppliers based on estimates of future demand for particular products. Our ability to accurately forecast demand for our products could be negatively affected by many factors, including our failure to accurately manage our expansion strategy and customer acceptance of new products, product introductions by our competitors, an increase or decrease in customer demand for our products or for products of our competitors, unanticipated changes in general market conditions or regulatory matters and weakening of economic conditions or consumer confidence in future economic conditions. Inventory levels in excess of customer demand may result in inventory write-downs or write-offs, which would impact our gross margin. Conversely, if we underestimate customer demand for our products,
31
our manufacturing facilities may not be able to deliver products to meet our order requirements, which could damage our reputation and customer relationships.
International and national economic and industry conditions constantly change, and could harm our business and results of operations.
Our business and our results of operation are affected by many changing economic, industry and other conditions beyond our control, including, for instance, potential changes to the economic relationship between the United States and Mexico, China, and other countries in which we operate as a result of the new U.S. administration, and other changes and developments that we cannot anticipate, each of which could harm our business and results of operations. Actual or potential changes in international, national, regional and local economic, business and financial conditions, including recession, inflation and trade protection measures, may negatively affect consumer preferences, perceptions, spending patterns or demographic trends, any of which could harm our business or results of operations. Our customers may experience financial difficulties or be unable to borrow money to fund their operations, which may harm their ability or decision to purchase or pay for our products. Disruptions in the credit markets have previously resulted, and could again result, in volatility, decreased liquidity, widening of credit spreads, and reduced availability of financing. There can be no assurance that future financing will be available to us on acceptable terms, if at all. An inability to obtain necessary additional financing on acceptable terms may have an adverse impact on us and on our ability to implement our business plan.
In particular, the new U.S. Administration has called for and may introduce substantial changes to fiscal, healthcare, trade and tax policies and legislation, which may include comprehensive tax reform and changes to existing trade agreements, including, but not limited to, the North American Free Trade Agreement (“NAFTA”). Such changes may have a significant impact on our operations and financial results. In particular, the potential enactment of tariffs on goods imported into the U.S., including but not limited to, goods imported from Mexico where we manufacture many of our products that we sell internationally, could adversely affect our gross profit margins. If enacted, any legislation by the U.S. federal government that restricts trade, such as tariffs, trade barriers, and other protectionist or retaliatory measures taken by governments in Europe, Asia, and other regions, could adversely impact our ability to sell products and services internationally. We cannot predict the impact, if any, of these changes to our business. If economic conditions worsen or fail to improve, changes in legislation impact the relationship between the U.S. and Mexico and other countries in which we operate or the continuity of NAFTA and other trade agreements, or new legislation is passed related to the healthcare system, fiscal or tax policies, customer demand may not materialize to the levels we require to achieve our anticipated financial results, which could have a material adverse effect on our business, financial condition, results of operations, or cash flows.
On June 23, 2016, the United Kingdom held a referendum in which voters approved an exit from the EU, commonly referred to as “Brexit”. As a result of the referendum, negotiations are under way to determine the future terms of the United Kingdom’s relationship with the EU, including the terms of trade. As it stands, the United Kingdom will depart the EU on March 30, 2019 but the terms of its withdrawal and the nature of its future relationship with the EU are still being decided. In December 2017, EU leaders announced an agreement to begin the next phase of negotiations, with talks on a transition period after March 2019 to begin in early 2018 and discussions on the future UK-EU relationship, including trade and security, to begin in March 2018. It is possible that there will be greater restrictions on the movement of goods and people between the United Kingdom and the EU countries and increased regulatory complexities, which could affect our ability to sell products in certain EU countries and in the United Kingdom. Brexit could adversely affect European and worldwide economic and market conditions and could further contribute to instability in global financial and foreign exchange markets, including volatility in the value of the British pound and Euro, to which we have significant exposure. In addition, other European countries may seek to conduct referenda with respect to continuing membership with the EU. The uncertainties surrounding Brexit are such that we do not know to what extent such changes will impact our business.
The above developments, and others that we cannot anticipate, could adversely affect our business, operations and financial results.
We depend on generating sufficient cash flow to fund our debt obligations, capital expenditures, and ongoing operations.
We are dependent on our cash on hand and free cash flow to fund our debt obligations, capital expenditures and ongoing operations. Our ability to service our debt and to fund our planned capital expenditures and ongoing operations will depend on our ability to continue to generate cash flow. If we are unable to generate sufficient cash flow or we are unable to access additional liquidity sources, we may not be able to service or repay our debt, operate our business, respond to competitive challenges, or fund our other liquidity and capital needs.
A significant portion of our revenues is derived from a few products and medical procedures.
32
A significant portion of our revenues is attributable to sales of our inflation devices. During the year ended December 31, 2017, sales of our inflation devices (including our Big60® device sold within our endoscopy segment and kits and packs which include inflation devices, but also include other products) accounted for approximately 11.4% of our net sales. Any material decline in market demand, or change in OEM supplier preference, for our inflation devices could have an adverse effect on our business, operations or financial condition.
In addition, the products that have accounted for a majority of our historical revenues are designed for use in connection with a few related medical procedures, including angioplasty, stent placement procedures, and spinal procedures. If subsequent developments in medical technology or drug therapy make such procedures obsolete, or alter the methodology of such procedures so as to eliminate the usefulness of our products, we may experience a material decrease in demand for our products and experience deteriorating financial performance.
The market price of our common stock has been, and may continue to be, volatile.
The market price of our common stock has at times been, and may in the future be, volatile for various reasons, including those discussed in these risks factors, which could have a material adverse effect on our business, operations or financial condition. Other events that could cause volatility in our stock, include without limitation, variances in our financial results; analysts’ and other projections or recommendations regarding our common stock specifically or medical technology stocks generally; any restatement of our financial statements or any investigation of us by the SEC, the FDA or another regulatory authority; or a decline, or rise, of stock prices in the capital markets generally.
We are subject to work stoppage, transportation, severe weather, natural disasters and related risks.
We manufacture products at various locations in the United States and foreign countries and sell our products worldwide. We depend on third-party transportation companies to deliver supplies necessary to manufacture our products from vendors to our various facilities and to move our products to customers, operating divisions, and other subsidiaries located worldwide. Our manufacturing operations, and the operations of the transportation companies on which we depend, may be harmed by natural disasters or significant human events, such as a war, civil unrest, terrorist attack, riot, strike, slowdown, or similar events. Any disruption in our manufacturing or transportation could materially harm our ability to meet customer demands or our operations.
Furthermore, our manufacturing operations could be affected by many other factors beyond our control, including severe weather conditions and natural disasters, including hurricanes, earthquakes and tornadoes. These conditions could cause substantial damage to our facilities, interrupt our production and disrupt our ability to deliver products to our customers.
Fluctuations in our effective tax rate may adversely affect our business, financial condition or results of operation.
We are subject to taxation in numerous countries, states and other jurisdictions. Our effective tax rate is derived from a combination of applicable tax rates in the various countries, states and other jurisdictions in which we operate. In preparing our financial statements, we estimate the amount of tax that will become payable in each of these jurisdictions. Our effective tax rate may, however, differ from the estimated amount due to numerous factors, including a change in the mix of our profitability from country to country and changes in tax laws. Relevant authorities may also disagree with tax positions we have taken and assess further taxes. On December 22, 2017, the U.S. government enacted comprehensive federal tax legislation commonly referred to as the Tax Cuts and Jobs Act of 2017 (“TCJA”). The TCJA makes changes to the corporate tax rate, business-related deductions and taxation of foreign earnings, among others, that will generally be effective for taxable years beginning after December 31, 2017. These changes could have a material impact on the value of our U.S. deferred tax assets, result in significant one-time charges in the current or future taxable years and increase our future U.S. tax expense. We continue to evaluate the TCJA and its requirements, as well as its application to our business and its impact on our effective tax rate. At this stage, it is unclear how many U.S. states will incorporate these federal law changes, or portions thereof, into their tax codes. The implementation by us of new practices and processes designed to comply with, and benefit from, the TCJA and its rules and regulations could require us to make substantial changes to our business practices, allocate additional resources, and increase our costs, which could negatively affect our business, results of operations and financial condition. In addition, further changes in the tax laws of foreign jurisdictions could arise, including as a result of recommendations issued by the Organisation for Economic Cooperation and Development, or the OECD, which could, if implemented, result in substantial changes to numerous long-standing tax positions and principles. These contemplated changes, to the extent adopted by OECD members or other countries, could increase tax uncertainty and may adversely affect our provision for income taxes. Any of these factors could cause us to experience an effective tax rate significantly different from previous periods or our current expectations, which could have an adverse effect on our business, financial condition or results of operation.
33
Limits on reimbursement imposed by governmental and other programs may adversely affect our business and results of operation.
We sell our products to hospitals and other healthcare providers around the world that typically receive reimbursement for the services provided to patients from third-party payers such as government programs (e.g., Medicare and Medicaid in the U.S.) and private insurance programs. The ability of our customers to obtain appropriate reimbursement for the cost of our products from governmental and private third-party payers is critical to our business. Limits on reimbursement imposed by such programs may adversely affect the ability of hospitals and others to purchase our products, which could adversely affect our business and results of operations.
Third-party payers, whether foreign or domestic, or governmental or commercial, are developing increasingly sophisticated methods of controlling healthcare costs. In general, a third-party payer covers a medical procedure only when the plan administrator is satisfied that the product or procedure is reasonable and necessary to the patient’s treatment; however, the cost-effectiveness of the treatment may also be a condition. In addition, in the United States, no uniform policy of coverage and reimbursement for procedures using our products exists among third-party payers. Therefore, coverage and reimbursement for procedures using our products can differ significantly from payer to payer. In addition, payers continually review new and existing technologies for possible coverage and can, without notice, deny or reverse coverage or alter pre-authorization requirements for new or existing products and procedures. We cannot provide assurance that we will be successful in any efforts we may potentially undertake to reverse such non-coverage decisions. If we are not successful in reversing non-coverage policies, or if third-party payers that currently cover or reimburse certain procedures reverse or limit their coverage of such procedures in the future, or if other third-party payers issue similar policies, our business could be adversely impacted.
Further, we believe that future coverage and reimbursement may be subject to increased restrictions, such as additional preauthorization requirements, both in the United States and in international markets. Third-party coverage and reimbursement for procedures using our products or any of our products in development for which we may receive regulatory approval may not be available or adequate in either the United States or international markets, which could have an adverse impact on our business.
Our failure to comply with applicable environmental laws and regulations could affect our business, operations or financial condition.
We manufacture and assemble certain products that require the use of hazardous materials that are subject to various national, federal, state and local laws and regulations governing the protection of the environment, health and safety. While the cost of compliance with such laws and regulations has not had a material adverse effect on our results of operations historically, compliance with future regulations may require additional capital investments. Additionally, because we use hazardous and other regulated materials in our manufacturing processes, we are subject to certain risks of future liabilities, lawsuits and claims resulting from any substances we manufacture, dispose of or release. Any accidental release may have an adverse effect on our business, operations or financial condition. We cannot predict what additional environmental, health and safety legislation or regulations will be enacted or become effective in the future or how existing or future laws or regulations will be administered or interpreted with respect to our operations, capital expenditures, results of operations or competitive position. Compliance with more stringent laws or regulations or adverse changes in the interpretation of existing laws or regulations by government agencies could have a material adverse effect on our business, operations or financial condition, and could require substantial expenditures.
|
Item 1B.
|
Unresolved Staff Comments.
|
None.
|
Item 2.
|
Properties.
|
Our world headquarters is located in South Jordan, Utah, with our principal office for European operations located in Galway, Ireland. We also support our European operations from a European distribution and customer service facility located in Maastricht, The Netherlands. In addition, we lease office space in Bangalore, India; Beijing, Hong Kong, GuangZhou and Shanghai, China; Buccinasco, Italy; Dubai, UAE; Melbourne, Australia; Moscow, Russia; Toronto, Canada; Rockland, Massachusetts; São Paulo, Brazil; Selangor, Malaysia; Seoul, Republic of Korea; Tokyo, Japan; and Versailles, France. Our principal manufacturing and packaging facilities are located in Chester, Virginia; Galway, Ireland; Joinville, Brazil; Malvern, Pennsylvania; Melbourne, Australia; Paris, France; Pearland, Texas; Singapore; South Jordan and West Jordan, Utah; Tijuana, Mexico; and Venlo, The Netherlands. Our research and development activities are conducted principally at facilities located in South Jordan and West Jordan, Utah; Pearland and Dallas, Texas; Malvern, Pennsylvania; Jackson Township, New Jersey; San Jose, California; Galway, Ireland; Paris, France; Singapore; and Venlo, The Netherlands.
34
The following is a summary of the approximate square footage of our facilities as of December 31, 2017:
|
Owned
|
Leased
|
Total
|
||||||
|
U.S.
|
552,207
|
|
492,473
|
|
1,044,680
|
|
||
|
International
|
344,181
|
|
554,907
|
|
899,088
|
|
||
|
Total
|
896,388
|
|
1,047,380
|
|
1,943,768
|
|
||
Operations associated with our cardiology segments utilize all of our facilities, while our operations associated with our endoscopy segment are conducted primarily from our facilities located in South Jordan, Utah and Pearland and Dallas, Texas.
In connection with our acquisition of the Argon critical care division in January 2017, we acquired a manufacturing and warehouse facility in Singapore and an office in Tokyo, Japan. The Singapore facility, which totals approximately 68,000 square feet, is located on property leased from a Singapore governmental agency. The Singapore land lease is scheduled to expire on August 30, 2019. The Argon Tokyo office is approximately 2,600 square feet and the lease expired on November 22, 2017 and was not renewed.
In connection with our acquisition of ITL Healthcare Pty. Ltd. ("ITL") in October 2017, we acquired a lease to a packaging facility located in Melbourne, Australia totaling approximately 52,000 square feet.
We believe our existing and proposed facilities will generally be adequate for our present and future anticipated levels of operations.
|
Item 3.
|
Legal Proceedings.
|
In the ordinary course of business, we are involved in various claims and litigation matters. These claims and litigation matters may include actions involving product liability, intellectual property, contract disputes, and employment or other matters that are significant to our business. Based upon our review of currently available information, we do not believe that any such actions are likely to be, individually or in the aggregate, materially adverse to our business, financial condition, results of operations or liquidity.
In October 2016, we received a subpoena from the U.S. Department of Justice seeking information on certain of our marketing and promotional practices. We are in the process of responding to the subpoena, which we anticipate will continue during 2018. We have incurred, and anticipate that we will continue to incur, substantial costs in connection with the matter. The investigation is ongoing and at this stage we are unable to predict its scope, duration or outcome. Investigations such as this may result in the imposition of, among other things, significant damages, injunctions, fines or civil or criminal claims or penalties against our company or individuals.
In the event of unexpected further developments, it is possible that the ultimate resolution of any of the foregoing matters, or other similar matters, if resolved in a manner unfavorable to us, may be materially adverse to our business, financial condition, results of operations or liquidity. Legal costs for these matters, such as outside counsel fees and expenses, are charged to expense in the period incurred.
|
Item 4.
|
Mine Safety Disclosures.
|
The disclosure required by this item is not applicable.
35
|
Item 5.
|
Market for Registrant’s Common Equity, Related Stockholder Matters and Issuer Purchases of Equity Securities.
|
Market Price for the Common Stock
Our Common Stock is traded on the NASDAQ Global Select Market under the symbol “MMSI.” The following table sets forth high and low sale prices for the Common Stock for the periods indicated.
|
For the year ended December 31, 2017
|
High
|
Low
|
||||||
|
First Quarter
|
$
|
31.70
|
|
$
|
24.23
|
|
||
|
Second Quarter
|
$
|
38.55
|
|
$
|
28.00
|
|
||
|
Third Quarter
|
$
|
42.60
|
|
$
|
36.25
|
|
||
|
Fourth Quarter
|
$
|
45.90
|
|
$
|
36.21
|
|
||
|
For the year ended December 31, 2016
|
High
|
Low
|
||||||
|
First Quarter
|
$
|
19.49
|
|
$
|
15.47
|
|
||
|
Second Quarter
|
$
|
20.59
|
|
$
|
17.94
|
|
||
|
Third Quarter
|
$
|
25.08
|
|
$
|
19.61
|
|
||
|
Fourth Quarter
|
$
|
26.85
|
|
$
|
20.70
|
|
||
As of February 23, 2018, the number of shares of Common Stock outstanding was
50,266,889
held by approximately 115 shareholders of record, not including shareholders whose shares are held in securities position listings.
Dividends
We have never declared or paid cash dividends on the Common Stock. We presently intend to retain any future earnings for use in our business and, therefore, do not anticipate paying any dividends on the Common Stock in the foreseeable future. In addition, (i) cash held by our subsidiary in China is subject to local laws and regulations that require government approval for the transfer of such funds to entities located outside of China (which may prevent such funds from being used to pay dividends), and (ii) our Second Amended Credit Agreement contains covenants prohibiting the declaration and distribution of a cash dividend at any time prior to the termination of the Second Amended Credit Agreement.
36
Performance
The following graph compares the performance of the Common Stock with the performance of the NASDAQ Stock Market (U.S. Companies) and NASDAQ Stocks (SIC 3840-3849 U.S. Companies - Surgical, Medical and Dental Instruments and Supplies) for a five-year period by measuring the changes in Common Stock prices from December 31, 2012 to December 31, 2017.
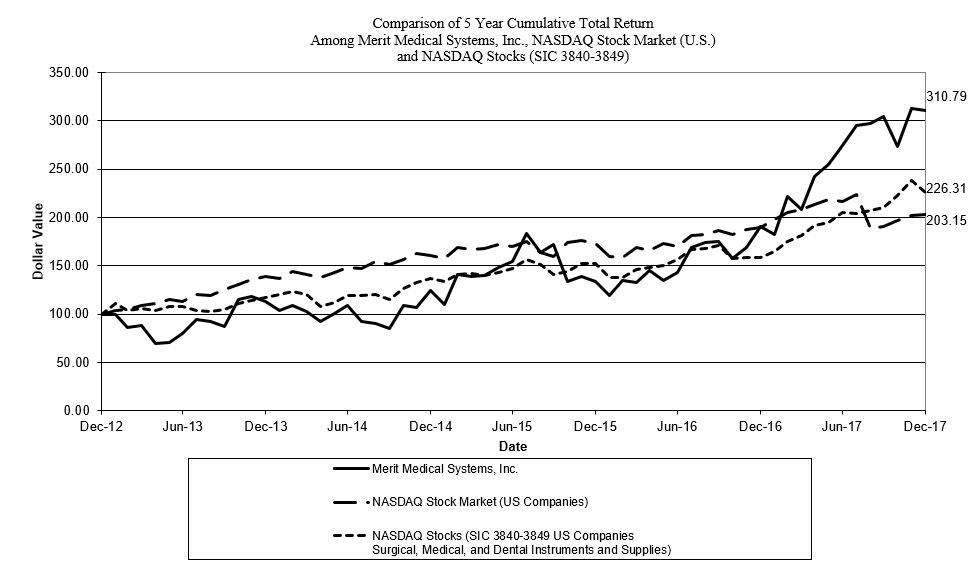
|
|
12/2012
|
12/2013
|
12/2014
|
12/2015
|
12/2016
|
12/2017
|
|||||||||||||||||
|
Merit Medical Systems, Inc.
|
$
|
100
|
|
$
|
113
|
|
$
|
125
|
|
$
|
134
|
|
$
|
191
|
|
$
|
311
|
|
|||||
|
NASDAQ Stock Market (U.S. Companies)
|
100
|
|
139
|
|
161
|
|
173
|
|
190
|
|
203
|
|
|||||||||||
|
NASDAQ Stocks (SIC 3840-3849 U.S. Companies)
|
100
|
|
117
|
|
137
|
|
153
|
|
159
|
|
226
|
|
|||||||||||
The stock performance graph assumes for comparison that the value of the Common Stock and of each index was $100 on December 31, 2012 and that all dividends were reinvested. Past performance is not necessarily an indicator of future results.
|
NOTE:
|
Performance graph data is complete through last fiscal year. Performance graph with peer group uses peer group only performance (excludes only Merit). Peer group indices use beginning of period market capitalization weighting. Index Data: Calculated (or Derived) based from CRSP NASDAQ Stock Market (US Companies), Center for Research in Security Prices (CRSP®), Graduate School of Business, The University of Chicago. Copyright 2018. Used with permission. All rights reserved.
|
37
Securities Authorized for Issuance Under Equity Compensation Plans
The following table contains information regarding our equity compensation plans as of
December 31, 2017
(in thousands, except weighted-average price):
|
|
Number of
securities to be
issued upon
exercise of
outstanding
options, warrants
and rights
|
Weighted-average
exercise price of
outstanding options,
warrants and rights
|
Number of securities
remaining available for
future issuance under
equity compensation plans
(excluding securities
reflected in column (a))
|
||||||
|
Plan category
|
(a)
|
(b)
|
(c)
|
||||||
|
Equity compensation Plans approved by security holders
|
3,623 (1),(3)
|
$
|
20.40
|
|
619 (2),(3)
|
||||
(1) Consists of 3,622,834 shares of Common Stock subject to the options granted under the Merit Medical Systems, Inc. 2006 Long-Term Incentive Plan.
(2) Consists of 126,863 shares available to be issued under the Merit Medical Systems, Inc. Non-Qualified Employee Stock Purchase Plan and 492,292 shares available to be issued under the Merit Medical Systems, Inc. 2006 Long-Term Incentive Plan.
(3) See Note 11 to our consolidated financial statements set forth in Item 8 of this report for additional information regarding these plans.
38
|
Item 6.
|
Selected Financial Data (in thousands, except per share amounts).
|
|
|
2017
|
2016
|
2015
|
2014
|
2013
|
||||||||||||||
|
OPERATING DATA:
|
|
|
|
|
|
|
|||||||||||||
|
Net Sales
|
$
|
727,852
|
|
$
|
603,838
|
|
$
|
542,149
|
|
$
|
509,689
|
|
$
|
449,049
|
|
||||
|
Cost of Sales
|
401,599
|
|
338,813
|
|
306,368
|
|
284,467
|
|
254,682
|
|
|||||||||
|
Gross Profit
|
326,253
|
|
265,025
|
|
235,781
|
|
225,222
|
|
194,367
|
|
|||||||||
|
Operating Expenses:
|
|
|
|
|
|||||||||||||||
|
Selling, general, and administrative
|
229,134
|
|
184,398
|
|
156,348
|
|
147,894
|
|
128,642
|
|
|||||||||
|
Research and development
|
51,403
|
|
45,229
|
|
40,810
|
|
36,632
|
|
33,886
|
|
|||||||||
|
Intangible asset impairment charge
|
809
|
|
—
|
|
—
|
|
1,102
|
|
8,089
|
|
|||||||||
|
Contingent consideration expense (benefit)
|
(298
|
)
|
61
|
|
80
|
|
(572
|
)
|
(4,094
|
)
|
|||||||||
|
Acquired in-process research and development
|
12,136
|
|
461
|
|
1,000
|
|
—
|
|
—
|
|
|||||||||
|
Total operating expenses
|
293,184
|
|
230,149
|
|
198,238
|
|
185,056
|
|
166,523
|
|
|||||||||
|
Income from Operations
|
33,069
|
|
34,876
|
|
37,543
|
|
40,166
|
|
27,844
|
|
|||||||||
|
|
|
||||||||||||||||||
|
Other Income (Expense):
|
|
|
|
|
|||||||||||||||
|
Interest income
|
381
|
|
81
|
|
272
|
|
217
|
|
255
|
|
|||||||||
|
Interest expense
|
(7,736
|
)
|
(8,798
|
)
|
(6,229
|
)
|
(8,829
|
)
|
(8,044
|
)
|
|||||||||
|
Bargain purchase gain
|
11,039
|
|
—
|
|
—
|
|
—
|
|
—
|
|
|||||||||
|
Other income (expense)
|
(872
|
)
|
(773
|
)
|
(386
|
)
|
18
|
|
(216
|
)
|
|||||||||
|
Other income (expense)—net
|
2,812
|
|
(9,490
|
)
|
(6,343
|
)
|
(8,594
|
)
|
(8,005
|
)
|
|||||||||
|
|
|
||||||||||||||||||
|
Income Before Income Taxes
|
35,881
|
|
25,386
|
|
31,200
|
|
31,572
|
|
19,839
|
|
|||||||||
|
|
|
||||||||||||||||||
|
Income Tax Expense
|
8,358
|
|
5,265
|
|
7,398
|
|
8,598
|
|
3,269
|
|
|||||||||
|
Net Income
|
$
|
27,523
|
|
$
|
20,121
|
|
$
|
23,802
|
|
$
|
22,974
|
|
$
|
16,570
|
|
||||
|
|
|
||||||||||||||||||
|
Earnings Per Common Share:
|
|
|
|
|
|||||||||||||||
|
Diluted
|
$
|
0.55
|
|
$
|
0.45
|
|
$
|
0.53
|
|
$
|
0.53
|
|
$
|
0.39
|
|
||||
|
Average Common Shares:
|
|
|
|
|
|||||||||||||||
|
Diluted
|
50,101
|
|
44,862
|
|
44,511
|
|
43,409
|
|
42,884
|
|
|||||||||
|
BALANCE SHEET DATA:
|
|
|
|
|
|||||||||||||||
|
Working capital
|
$
|
200,501
|
|
$
|
155,092
|
|
$
|
116,093
|
|
$
|
116,910
|
|
$
|
110,321
|
|
||||
|
Total assets
|
1,111,811
|
|
942,803
|
|
778,728
|
|
747,165
|
|
728,283
|
|
|||||||||
|
Long-term debt, less current portion
|
259,013
|
|
314,373
|
|
197,593
|
|
214,490
|
|
238,854
|
|
|||||||||
|
Stockholders’ equity
|
676,334
|
|
498,189
|
|
466,103
|
|
435,259
|
|
405,706
|
|
|||||||||
39
|
Item 7.
|
Management’s Discussion and Analysis of Financial Condition and Results of Operations.
|
The following discussion and analysis of our financial condition and results of operations should be read in conjunction with the Consolidated Financial Statements and related Notes thereto, which are included in Item 8 of this report.
Overview
We design, develop, manufacture and market single-use medical products for interventional and diagnostic procedures. For financial reporting purposes, we report our operations in two operating segments: cardiovascular and endoscopy. Our cardiovascular segment consists of cardiology and radiology devices, which assist in diagnosing and treating coronary arterial disease, peripheral vascular disease and other non-vascular diseases and includes embolotherapeutic, cardiac rhythm management, electrophysiology, critical care and interventional oncology and spine devices. Our endoscopy segment consists of gastroenterology and pulmonology devices which assist in the palliative treatment of expanding esophageal, tracheobronchial and biliary strictures caused by malignant tumors. Within those two operating segments, we offer products focused in five core product groups: peripheral intervention, cardiac intervention, interventional oncology and spine, cardiovascular and critical care and endoscopy.
For the year ended December 31,
2017
, we reported sales of approximately
$727.9 million
, up approximately
$124.0 million
or
20.5%
, over
2016
sales of approximately
$603.8 million
.
Gross profit as a percentage of sales increased to
44.8%
for the year ended December 31,
2017
as compared to
43.9%
for the year ended December 31,
2016
.
Net income for the year ended December 31,
2017
was approximately
$27.5 million
, or
$0.55
per share, as compared to
$20.1 million
, or
$0.45
per share, for the year ended December 31,
2016
.
We continue to focus our efforts on expanding our presence in foreign markets, particularly Europe, Middle East and Africa ("EMEA"), China, Southeast Asia, Japan, Australia and Brazil, in an effort to expand our market opportunities. These efforts have increased our selling, general and administrative expenses, but we believe over time they will help us improve our profitability. Our international sales growth was strong for the year ended December 31,
2017
. In
2017
, international sales were approximately
$307.1 million
, or
42%
of our net sales, up
32%
from
2016
.
We believe the following new products will help us continue our growth objectives in 2018:
|
•
|
Achieve® Automatic Biopsy System
|
|
•
|
Temno® Soft Tissue Biopsy System
|
|
•
|
Tru-Cut® Biopsy Device
|
|
•
|
CorVocet™ Biopsy System
|
|
•
|
Aspira® Pleural Effusion Drainage System
|
|
•
|
Aspira® Peritoneal Drainage System
|
|
•
|
SwiftNINJA® Steerable Microcatheter
|
|
•
|
Elation® GI & Pulmonary Balloons
|
|
•
|
TWISTER® PLUS Rotatable Retrieval Device
|
|
•
|
Prelude IDeal™ Hydrophilic Sheath Introduer
|
|
•
|
Prelude SYNC™ Radial Compression Device
|
|
•
|
Prelude Choice™ Hemostasis Valve Adapter
|
|
•
|
HeRO® Graft
|
|
•
|
Super HeRO®
|
|
•
|
True Form™ Guide Wires
|
|
•
|
Heartspan® Transseptal Sheath
|
|
•
|
Amplatz Guide Wires
|
|
•
|
Critical care products acquired from Argon
|
|
•
|
DualCap® disinfection and protection products acquired from Catheter Connections
|
|
•
|
QuadraSphere® Q2 Microsphere
|
We believe these new products will strengthen our product portfolio and help us achieve greater market penetration, which, if successful, is expected to drive top-line growth.
We anticipate that our business will be impacted in 2018 by the following trends, each resulting from the development of our business model, as well as changes in the business and regulatory environment in which we operate:
40
|
•
|
We anticipate continued international expansion through the transition from a distributor-based sales model to a modified direct sales model, which is already in place in a number of markets, including China. We believe this transition will improve revenue growth opportunities by providing us with greater control over the sales channel and improving gross margins, as we move from a wholesale channel to a retail channel. On the other hand, the transition may result in increased costs, primarily as a result of increased compensation expenses for existing and new sales personnel.
|
|
•
|
We also anticipate we will continue to expand product registrations of existing products and introduce new products in new and emerging markets, in an effort to increase the breadth of our product portfolio offered in international markets, thereby supporting revenue growth and margin expansion. Improvement in gross margin remains a key priority for management, through the management of product mix, continued improvement of operational performance and continued new product introductions. However, any reversal in the aforementioned trends could have a negative impact on our future revenue and gross margin.
|
|
•
|
Our revenue growth has been driven by, and we expect our revenue to continue to increase in the future as a result of, the introduction of new products, continued international expansion, and increased physician awareness of our products, among other factors. Any reversal in these trends could have a negative impact on our future revenue. In addition, we have continuously expanded our sales and marketing infrastructure to help us drive and support revenue growth and we intend to continue this expansion.
|
|
•
|
Our revenue may fluctuate, from quarter to quarter, as well as within each quarter, due to a variety of factors, including the seasonality of demand for our products, foreign exchange fluctuations, the timing of new product introductions, competitor product introductions, associated physician evaluations and competitor pricing changes.
|
|
•
|
Our gross margin has been, and we expect it will continue to be, affected by a variety of factors, including product sales mix, geographic sales mix and prices, launch of new products, the impact of distributor relationships and our focus on expanding to a modified direct sales model, production volumes, manufacturing costs and product yields, and the implementation of cost-reduction strategies. As we continue to expand through acquisitions, the acquisitions may be gross margin dilutive. Our gross margins could be negatively affected to the extent that the products acquired have gross margins that differ from ours. For example, the gross margin for the critical care products we acquired from Argon during 2017 is less than our current gross margin. However, improvement in gross margin remains a key priority for management, through the control of product mix, continued improvement of operational performance and continued introductions of new product.
|
|
•
|
The integration of recently completed acquisitions may increase our operating expenses, and it may take time to realize expected revenue from acquisitions. While we expect to integrate our acquired businesses successfully, the expected synergies may not materialize.
|
|
•
|
We continue to experience a variety of financial risks including changes in foreign currency exchange rates, especially when our acquisitions increase the proportion of our revenue from international sales; risks associated with our variable floating rate borrowings, which could negatively affect us in an increasing interest rate environment; and the potentially substantial changes to fiscal, healthcare, trade and tax policies and legislation, which may include comprehensive tax reform and changes to existing trade agreements, including, but not limited to, NAFTA, as well as healthcare reform, including the potential repeal of certain provisions of the Affordable Care Act.
|
|
•
|
On December 22, 2017, the U.S. government enacted the TCJA, which makes changes to the corporate tax rate, business-related deductions and taxation of foreign earnings, among others, that will generally be effective for taxable years beginning after December 31, 2017. We continue to evaluate the TCJA requirements, as well as its applications to our business operations.
|
Our management utilizes a range of financial and non-financial key performance indicators to manage our business. The financial indicators we use include ratio of revenue to market growth, product mix, gross margin improvement, operating expense leverage, net income growth, working capital and cash flow metrics, capital allocation and return on investment. The non-financial indicators we use include various quality system and operational utilization metrics.
41
Results of Operations
The following table sets forth certain operational data as a percentage of sales for the years indicated:
|
|
2017
|
2016
|
2015
|
||
|
Net sales
|
100%
|
100%
|
100%
|
||
|
Gross profit
|
44.8
|
43.9
|
43.5
|
||
|
Selling, general and administrative expenses
|
31.5
|
30.5
|
28.8
|
||
|
Research and development expenses
|
7.1
|
7.5
|
7.5
|
||
|
Intangible asset impairment charges
|
0.1
|
—
|
—
|
||
|
Contingent consideration expense (benefit)
|
—
|
—
|
—
|
||
|
Acquired in-process research and development expenses
|
1.7
|
0.1
|
0.2
|
||
|
Income from operations
|
4.5
|
5.8
|
6.9
|
||
|
Income before income taxes
|
4.9
|
4.2
|
5.8
|
||
|
Net income
|
3.8
|
3.3
|
4.4
|
||
Listed below are the sales by product category within each business segment for the years ended
December 31, 2017
,
2016
and
2015
(in thousands):
|
|
% Change
|
2017
|
% Change
|
2016
|
% Change
|
2015
|
|||||||||||
|
Cardiovascular
|
|
|
|
|
|
|
|||||||||||
|
Stand-alone devices
|
44%
|
$
|
275,431
|
|
23%
|
$
|
191,148
|
|
8%
|
$
|
155,414
|
|
|||||
|
Custom kits and procedure trays
|
6%
|
126,114
|
|
2%
|
119,226
|
|
5%
|
116,368
|
|
||||||||
|
Inflation devices
|
8%
|
79,875
|
|
1%
|
73,916
|
|
1%
|
73,373
|
|
||||||||
|
Catheters
|
13%
|
127,747
|
|
17%
|
113,367
|
|
11%
|
96,833
|
|
||||||||
|
Embolization devices
|
8%
|
49,532
|
|
2%
|
46,035
|
|
3%
|
45,025
|
|
||||||||
|
CRM/EP
|
15%
|
41,914
|
|
8%
|
36,459
|
|
3%
|
33,902
|
|
||||||||
|
Total
|
21%
|
700,613
|
|
11%
|
580,151
|
|
6%
|
520,915
|
|
||||||||
|
Endoscopy
|
|
|
|
|
|||||||||||||
|
Endoscopy devices
|
15%
|
27,239
|
|
12%
|
23,687
|
|
18%
|
21,234
|
|
||||||||
|
Total
|
21%
|
$
|
727,852
|
|
11%
|
$
|
603,838
|
|
6%
|
$
|
542,149
|
|
|||||
Note: Certain product categories for 2016 have been adjusted from prior disclosure to reflect changes in product classifications to be consistent with updates in the management of our product portfolios in 2017.
Cardiovascular Sales.
Our cardiovascular sales for the year ended
December 31, 2017
were approximately
$700.6 million
, up
20.8%
, when compared to the corresponding period for
2016
of approximately
$580.2 million
. Sales for the year ended
December 31, 2017
were favorably affected by increased sales of (a) our stand-alone devices (particularly our Map™, Medallion, wires, and HeRO® Graft products, as well as new sales from our acquisitions of the DFINE, Argon critical care division and Catheter Connections product lines) of approximately
$84.3 million
, up
44.1%
; (b) catheters (particularly our SwiftNINJA® product line, Concierge® Guiding Catheters, Prelude® radial sheath product line, and our Maestro® microcatheters) of approximately
$14.4 million
, up
12.7%
; and (c) our custom kits and procedure trays of approximately
$6.9 million
, up
5.8%
, which includes sales from our acquisition of ITL.
Our cardiovascular sales for the year ended
December 31, 2016
were approximately
$580.2 million
, up
11.4%
, when compared to the corresponding period for
2015
of approximately
$520.9 million
. Sales for the year ended
December 31, 2016
were favorably affected by increased sales of (a) our stand-alone devices (particularly our infusion bag, Map™, and Ensnare® products, as well as new sales from our acquisitions of the Hero Graft device and the DFINE product line) of approximately
$35.7 million
, up
23.0%
; (b) catheters (particularly our Impress® product line, Performa® vessel sizing catheters, and our Maestro® microcatheters) of approximately
$16.5 million
, up
17.1%
; and (c) our custom kits and procedure trays of approximately
$2.9 million
, up
2.5%
.
42
Sales by our European direct sales force are subject to foreign currency exchange rate fluctuations between the natural currency of a foreign country and the U.S. Dollar. Foreign currency exchange rate fluctuations increased sales 0.1% in
2017
compared to 2016 and decreased sales 0.8% in 2016 compared to 2015. New products and market share gains in our existing product lines were additional sources of revenue growth.
Endoscopy Sales.
Our endoscopy sales for the year ended
December 31, 2017
were approximately
$27.2 million
, up
15.0%
, when compared to sales in
2016
of approximately
$23.7 million
. This increase was primarily related to an increase in sales of our EndoMAXX™ fully covered esophageal stent and our Elation® balloon dilator. Our endoscopy sales for the year ended
December 31, 2016
were approximately
$23.7 million
, up
11.6%
, when compared to sales in the corresponding period of
2015
of approximately
$21.2 million
. This increase was primarily related to an increase in sales of our EndoMAXX™ fully covered esophageal stent, as well as the introduction of our Elation® balloon dilator.
International Sales
. International sales for the year ended December 31,
2017
were approximately
$307.1 million
, or
42%
of net sales, up
32%
from the same period in 2016. International sales for the year ended December 31, 2016 were approximately
$233.5 million
, or
39%
of net sales, up
9%
from the same period in 2015. The increase in our international sales during 2017 was primarily related to a year-over-year sales increase in China of approximately
$13.4 million
, or
22.4%
, the acquisition of the critical care division of Argon and sales in new modified direct markets in South Korea, Japan and India, as well as continued growth in direct markets added in 2016, namely Canada, Australia and Russia. The increase in our international sales during 2016 was primarily related to a year-over-year sales increase in China of approximately
$9.2 million
, or
18.2%
, as well as sales in the new direct markets in Canada, Australia, and Russia.
Gross Profit
. Our gross profit as a percentage of sales was
44.8%
,
43.9%
, and
43.5%
in
2017
,
2016
and
2015
, respectively. The increase in gross margin for
2017
, as compared to
2016
, was primarily related to changes in product mix and increased efficiencies gained from our operations team. The increase in gross margin for 2016, as compared to 2015 was primarily related to our increased focus on higher margin products and the suspension of the medical device tax in the United States, which was partially offset by increased amortization as part of the DFINE acquisition.
Selling, General and Administrative Expenses
. Our selling, general and administrative expenses increased approximately
$44.7 million
, or
24.3%
, in 2017 compared to 2016 and
$28.1 million
, or
17.9%
, in 2016 compared to 2015. Selling, general and administrative expenses as a percentage of sales were
31.5%
,
30.5%
, and
28.8%
in
2017
,
2016
and
2015
, respectively.
The increase in selling, general, and administrative expenses for the year ended December 31, 2017 compared to the year ended December 31, 2016 was primarily related to legal expenses of approximately $12.6 million incurred in responding to the pending subpoena from the U.S. Department of Justice, $6.6 million of acquisition and integration-related costs, increased headcount, increased amortization, and foreign market expansion.
The increase in selling, general, and administrative expenses for the year ended December 31, 2016 compared to the year ended December 31, 2015 was primarily related to headcount additions, $1.0 million of expenses incurred in responding to an inquiry from the U.S. Department of Justice, $4.5 million of acquisition and integration-related costs and $10.3 million of severance costs primarily related to the DFINE acquisition, which were partially offset by a decrease in our foreign-currency-based expenses of approximately $1.6 million due to fluctuations in the exchange rates between the U.S. Dollar and various foreign currencies.
Research and Development Expenses
. Research and development ("R&D") expenses increased by
$6.2 million
or
13.7%
to approximately
$51.4 million
in
2017
, compared to approximately
$45.2 million
in
2016
. The increase in R&D expenses for the year ended December 31, 2017 was largely due to hiring additional research and development personnel to support various new core and acquired product developments. Research and development expenses increased by
10.8%
to approximately
$45.2 million
in
2016
, compared to approximately
$40.8 million
in
2015
. The increase in R&D expenses for the year ended December 31, 2016 was largely due to hiring of additional research and development personnel to support various new product developments. Our research and development expenses as a percentage of sales were
7.1%
,
7.5%
and
7.5%
for 2017, 2016, and 2015, respectively. We have a pipeline of new products, and we believe that we have an effective level of capabilities and expertise to continue the flow of new, internally developed products into the foreseeable future with average gross margins that are higher than our historical gross margins.
In addition, during the years ended
December 31, 2017
,
2016
and 2015 we incurred in-process research and development charges of approximately
$12.1 million
,
$0.5 million
and
$1.0 million
, respectively. The increase in our in-process research and development charges for the year ended December 31, 2017 was primarily driven by the acquisition
43
of IntelliMedical and its intellectual property rights associated with a steerable guidewire system as discussed in Note 2 of the notes to our consolidated financial statements.
Our operating profits by business segment for the years ended
December 31, 2017
,
2016
and
2015
were as follows (in thousands):
|
|
2017
|
2016
|
2015
|
||||||||
|
Operating Income
(1)
|
|
|
|
|
|||||||
|
Cardiovascular
|
$
|
24,819
|
|
$
|
30,053
|
|
$
|
34,052
|
|
||
|
Endoscopy
|
8,250
|
|
4,823
|
|
3,491
|
|
|||||
|
Total operating income
|
$
|
33,069
|
|
$
|
34,876
|
|
$
|
37,543
|
|
||
(1) Operating income has been adjusted from earlier reported amounts in 2016 to reflect changes in product classifications between our operating segments, which were made to be consistent with updates in the management of our product portfolios in 2017.
Cardiovascular Operating Income.
Our cardiovascular operating income for the year ended
December 31, 2017
was approximately
$24.8 million
, compared to operating income of approximately
$30.1 million
for the year ended
December 31, 2016
. This decrease in cardiovascular operating income was primarily related to legal expenses of approximately $12.6 million incurred in responding to the pending subpoena from the U.S. Department of Justice, $6.6 million of acquisition and integration-related costs, increased headcount, increased amortization, and foreign market expansion. Our cardiovascular operating income for the year ended
December 31, 2016
was approximately
$30.1 million
, compared to operating income of approximately
$34.1 million
for the year ended
December 31, 2015
. This decrease was primarily related to headcount additions, $1.0 million of expenses incurred in responding to an inquiry from the U.S. Department of Justice, $4.5 million of acquisition and integration-related costs and $10.3 million of severance costs primarily related to the DFINE acquisition, which were partially offset by a decrease in our foreign-currency-based expenses of approximately $1.6 million due to fluctuations in the exchange rates between the U.S. Dollar and various foreign currencies.
Endoscopy Operating Income.
Our endoscopy operating income for the year ended
December 31, 2017
was approximately
$8.3 million
, compared to approximately
$4.8 million
for the year ended
December 31, 2016
. This increase was primarily the result of higher sales, improved gross margins, and lower SG&A expenses as a percentage of sales. Our endoscopy operating income for the year ended
December 31, 2016
was approximately
$4.8 million
, compared to approximately
$3.5 million
for the year ended
December 31, 2015
. This increase was primarily the result of higher sales, improved gross margins, and lower SG&A expenses as a percentage of sales, partially offset by increased R&D expenses as a percentage of sales.
Effective Tax Rate.
Our effective income tax rate for
2017
,
2016
and
2015
was
23.3%
,
20.7%
, and
23.7%
, respectively. On December 22, 2017, the U.S. government enacted the TCJA, which significantly revises the U.S. corporate tax by, among other things, lowering the corporate tax rates and imposing a one-time repatriation tax on deemed repatriated earnings of foreign subsidiaries (“transition tax”). The increase in the effective income tax rate for 2017 compared to 2016 was primarily the result of increased tax expense due to the transition tax, partially offset by the favorable impact of the reduced tax rate on our net deferred tax liabilities. The decrease in the effective tax rate for 2016 compared to 2015 was due primarily to a higher mix of earnings from our foreign operations, primarily Ireland where the statutory rate is 12.5% compared to the U.S. federal rate of 35%.
Other Income (Expense).
Our other income (expense) for the years ended
December 31, 2017
,
2016
and
2015
was approximately
$2.8 million
,
$(9.5) million
, and
$(6.3) million
, respectively. The change in other income (expense) for
2017
over
2016
was principally the result of a gain on bargain purchase related to the acquisition of the Argon critical care division of approximately
$11.0 million
. The increase in other expense for
2016
over
2015
was principally the result of increased interest expense related to higher debt balances as a result of our acquisition of DFINE, as well as losses on fluctuations in foreign exchange rates.
Net Income.
Our net income for
2017
,
2016
and
2015
was approximately
$27.5 million
,
$20.1 million
, and
$23.8 million
, respectively. The increase in net income for
2017
, when compared to
2016
, was primarily due to increased sales, gross margin improvement and the gain on bargain purchase of approximately
$11.0 million
related to the acquisition of the Argon critical care division, which was partially offset by the acquired in-process research and development expenses of approximately $12.1 million attributable to the IntelliMedical acquisition, approximately $12.6 million of legal expenses incurred in responding to the pending subpoena from the U.S. Department of Justice, and approximately $6.6 million of acquisition and integration-related costs. The decrease in net income for
2016
, when compared to
2015
, was primarily due
44
to acquisition and severance costs, as well as increased interest expense related to higher debt balances related to the DFINE acquisition, which were partially offset by a higher gross margin percentage and a lower effective tax rate.
Total Assets.
Total assets utilized in our cardiovascular segment were approximately
$1.10 billion
as of
December 31, 2017
, compared to approximately
$932.9 million
as of
December 31, 2016
and approximately
$768.0 million
as of December 31, 2015. Total assets utilized in our endoscopy segment were approximately
$8.0 million
as of
December 31, 2017
, compared to approximately
$9.9 million
as of
December 31, 2016
and approximately
$10.8 million
as of December 31, 2015.
Off-Balance Sheet Arrangements.
We do not have any off-balance sheet arrangements that have had, or are reasonably likely in the future to have, an effect on our financial condition, results of operations, liquidity, capital expenditures or capital resources.
Liquidity and Capital Resources
Capital Commitments and Contractual Obligations
The following table summarizes our capital commitments and contractual obligations as of
December 31, 2017
, as well as the future periods in which such payments are currently anticipated to become due:
|
|
Payment due by period (in thousands)
|
|||||||||||||||||||
|
Contractual Obligations
|
Total
|
Less than 1 Year
|
1-3 Years
|
4-5 Years
|
After 5 Years
|
|||||||||||||||
|
Long-term debt
|
$
|
278,959
|
|
$
|
19,459
|
|
$
|
32,500
|
|
$
|
227,000
|
|
$
|
—
|
|
|||||
|
Interest on long-term debt
(1)
|
38,846
|
|
10,783
|
|
22,043
|
|
6,020
|
|
—
|
|
||||||||||
|
Operating leases
|
104,043
|
|
12,293
|
|
20,544
|
|
13,995
|
|
57,211
|
|
||||||||||
|
Royalty obligations
|
3,728
|
|
284
|
|
774
|
|
605
|
|
2,065
|
|
||||||||||
|
Total contractual cash
|
$
|
425,576
|
|
$
|
42,819
|
|
$
|
75,861
|
|
$
|
247,620
|
|
$
|
59,276
|
|
|||||
(1)
Interest payments on our variable long-term debt were forecasted using the LIBOR forward curves plus a base of 1.25% based on the terms of our Second Amended Credit Agreement. Interest payments on a portion of our long-term debt were forecasted using a fixed rate of 2.365% as a result of our interest rate swap (see Note 8 to our consolidated financial statements set forth in Item 8 of this report).
As of
December 31, 2017
, we had approximately
$11.0 million
of contingent consideration liabilities,
$2.7 million
of unrecognized tax positions, and
$11.2 million
of deferred compensation payable that have been recognized as liabilities that have not been included in the contractual obligations table due to uncertainty as to when such amounts may be settled.
Additional information regarding our capital commitments and contractual obligations, including royalty payments, is contained in Notes 7 and 9 to our consolidated financial statements set forth in Item 8 below.
Cash Flows
At December 31,
2017
and
2016
, we had cash and cash equivalents of approximately
$32.3 million
and
$19.2 million
respectively, of which approximately $30.4 million and $18.4 million, respectively, were held by foreign subsidiaries. The TCJA one-time repatriation tax liability effectively taxes the undistributed earnings previously deferred from U.S. income taxes. The Company has not provided for foreign withholding tax on the undistributed earnings from our non-U.S. subsidiaries because such earnings are considered to be indefinitely reinvested. The cash held by our foreign subsidiaries for indefinite reinvestment is used to fund the operating activities of our foreign subsidiaries and for further investment in foreign operations.
In addition, cash held by our subsidiary in China is subject to local laws and regulations that require government approval for the transfer of such funds to entities located outside of China. As of
December 31, 2017
and
2016
, we had cash and cash equivalents of approximately $13.1 million and $9.5 million, respectively, held by our subsidiary in China.
Cash flows provided by operating activities.
Cash provided by operating activities during the years ended December 31,
2017
and
2016
was primarily the result of net income excluding non-cash items, offset by shifts in working capital. Our working capital as of December 31,
2017
,
2016
and
2015
was approximately
$200.5 million
,
$155.1 million
and
$116.1 million
, respectively. The increase in working capital as of December 31,
2017
compared to December 31,
2016
was primarily the result of increases in cash, trade receivables and inventories, which were partially offset by an increase in accrued expenses and the current portion of long-term debt. The increase in working capital as of December 31, 2016 compared to December 31, 2015 was primarily the result of increases in cash, trade receivables and inventories, as well as a decrease in trade payables,
45
which were partially offset by an increase in accrued expenses. As of December 31,
2017
and
2016
, we had a current ratio of
2.73
to 1 and
2.76
to 1, respectively.
During the year ended December 31,
2017
, our inventory balance increased approximately
$34.6 million
, from approximately
$120.7 million
as of December 31,
2016
to approximately
$155.3 million
as of December 31,
2017
. The increase in the inventory balance was due to several factors, including acquisitions, increased sales, and the opening of new modified direct sales markets in South Korea, India, and Japan. During the year ended December 31, 2016, our inventory balance increased approximately $14.7 million, from approximately
$106.0 million
at December 31, 2015 to approximately
$120.7 million
at December 31,
2016
. The increase in the inventory balance was due to several factors, including increased sales, the acquisition of DFINE and the opening of new direct-sales markets in Canada, Australia, and Russia. The trailing twelve month inventory turns for the period ended December 31,
2017
was 2.91, compared to 2.99 for the twelve-month period ended December 31,
2016
.
Cash flows provided by (used in) financing activities.
Cash provided by financing activities for the year ended December 31,
2017
was approximately
$96.5 million
compared to approximately
$121.1 million
for the year ended December 31,
2016
, a decrease of approximately
$24.6 million
. The decrease in net cash provided from financing activities was primarily the result of a decrease in the proceeds from the issuance of long-term debt, which was partially offset by our public equity offering of
5,175,000
shares of common stock from which we received net proceeds of approximately
$136.6 million
, which is net of approximately
$8.8 million
in underwriting discounts and commissions and approximately
$816,000
in other direct cost incurred and paid by us in connection with this equity offering.
Cash provided by financing activities for the year ended December 31, 2016 was approximately
$121.1 million
, compared to cash used in financing actives of approximately
$(10.2) million
for the year ended December 31, 2015, a change of approximately $131.3 million. This change was primarily the result of increased debt financing related to acquisitions, principally our acquisitions of DFINE and the HeRO Graft device and other related assets, as well as reduced proceeds from the issuance of common stock, during the year ended December 31, 2016, compared to the year ended December 31, 2015.
The Second Amended Credit Agreement provides for a term loan of
$150 million
and a revolving credit commitment up to an aggregate amount of
$375 million
, which includes a reserve of
$25 million
to make swingline loans from time to time. The term loan is payable in quarterly installments in the amounts provided in the Second Amended Credit Agreement until the maturity date of July 6, 2021, at which time the term and revolving credit loans, together with accrued interest thereon, will be due and payable. At any time prior to the maturity date, we may repay any amounts owing under all revolving credit loans, term loans, and all swingline loans in whole or in part, subject to certain minimum thresholds, without premium or penalty, other than breakage costs.
Revolving credit loans denominated in dollars and term loans made under the Second Amended Credit Agreement bear interest, at our election, at either a Base Rate or Eurocurrency Base Rate (as such terms are defined in the Second Amended Credit Agreement) plus the applicable margin, which increases as our Consolidated Total Leverage Ratio (as defined in the Second Amended Credit Agreement) increases. Revolving credit loans denominated in an Alternative Currency (as defined in the Second Amended Credit Agreement) bear interest at the Eurocurrency rate plus the applicable margin. Swingline loans bear interest at the base rate plus the applicable margin. Upon an event of default, the interest rate may be increased by
2.0%
. The revolving credit commitment will also carry a commitment fee of
0.15%
to
0.40%
per annum on the unused portion.
The Second Amended Credit Agreement is collateralized by substantially all our assets. The Second Amended Credit Agreement contains covenants, representations and warranties and other terms customary for loans of this nature. The Second Amended Credit Agreement requires that we maintain certain financial covenants, as follows:
46
|
Covenant Requirement
|
|||
|
Consolidated Total Leverage Ratio (1)
|
|||
|
July 1, 2017 through December 31, 2017
|
3.75 to 1.0
|
||
|
January 1, 2018 through March 31, 2018
|
3.5 to 1.0
|
||
|
April 1, 2018 and thereafter
|
3.25 to 1.0
|
||
|
Consolidated EBITDA (2)
|
1.25 to 1.0
|
||
|
Consolidated Net Income (3)
|
$—
|
||
|
Facility Capital Expenditures (4)
|
$30 million
|
||
|
(1)
|
Maximum Consolidated Total Leverage Ratio (as defined in the Second Amended Credit Agreement) as of any fiscal quarter end.
|
||
|
(2)
|
Minimum ratio of Consolidated EBITDA (as defined in the Second Amended Credit Agreement and adjusted for certain expenditures) to Consolidated Fixed Charges (as defined in the Second Amended Credit Agreement) for any period of four consecutive fiscal quarters.
|
||
|
(3)
|
Minimum level of Consolidated Net Income (as defined in the Second Amended Credit Agreement) for certain periods, and subject to certain adjustments.
|
||
|
(4)
|
Maximum level of the aggregate amount of all Facility Capital Expenditures (as defined in the Second Amended Credit Agreement) in any fiscal year.
|
||
Additionally, the Second Amended Credit Agreement contains customary events of default and affirmative and negative covenants for transactions of this type. As of
December 31, 2017
, we believe we were in compliance with all covenants set forth in the Second Amended Credit Agreement.
As of
December 31, 2017
, we had outstanding borrowings of approximately
$272.0 million
under the Second Amended Credit Agreement, with available borrowings of approximately
$188.0 million
, based on the leverage ratio required pursuant to the Second Amended Credit Agreement. Our interest rate as of
December 31, 2017
was a fixed rate of
2.68%
on
$175.0 million
as a result of an interest rate swap (see Note 8) and a variable floating rate of
2.82%
on
$97.0 million
. Our interest rate as of
December 31, 2016
was a fixed rate of
3.12%
on
$45.0 million
and
2.98%
on
$130.0 million
as a result of interest rate swaps, and a variable floating rate of
2.77%
on approximately
$150.0 million
.
Cash flows used in investing activities.
Our cash flow used in investing activities for the year ended December 31,
2017
was approximately
$146.8 million
compared to approximately
$159.1 million
for the year ended December 31,
2016
, a decrease of approximately
$12.3 million
. This decrease was primarily a result of a decrease of approximately
$19.6 million
in net cash paid for acquisitions during the year ended December 31, 2017, compared to the year ended December 31, 2016 (see Note 2), partially offset by a
$5.8 million
increase in capital expenditures for property and equipment.
Our cash flow used in investing activities for the year ended December 31, 2016 was approximately
$159.1 million
, compared to approximately
$62.0 million
for the year ended December 31, 2015, an increase of approximately $97.1 million. This increase was primarily a result of more cash paid for acquisitions during the year ended December 31, 2016, compared to the year ended December 31, 2015, principally the cash paid in the acquisitions of DFINE and the HeRO Graft device (see Note 2 of the notes to our consolidated financial statements).
Capital expenditures for property and equipment were approximately
$38.6 million
,
$32.8 million
, and
$51.0 million
for the years ended December 31,
2017
,
2016
and
2015
, respectively. Historically, we have incurred significant expenses in connection with facility construction, production automation, product development and the introduction of new products. We anticipate that we will spend approximately $50 to $55 million in 2018 for buildings, property and equipment.
We currently believe that our existing cash balances, anticipated future cash flows from operations and borrowings under the Second Amended Credit Agreement will be adequate to fund our current and currently planned future operations for the next twelve months and the foreseeable future. In the event we pursue and complete significant transactions or acquisitions in the future, additional funds will likely be required to meet our strategic needs, which may require us to raise additional funds in the debt or equity markets.
Critical Accounting Policies and Estimates
The SEC has requested that all registrants address their most critical accounting policies. The SEC has indicated that a “critical accounting policy” is one which is both important to the representation of the registrant’s financial condition and results
47
and requires management’s most difficult, subjective or complex judgments, often as a result of the need to make estimates about the effect of matters that are inherently uncertain. We base our estimates on past experience and on various other assumptions our management believes to be reasonable under the circumstances, the results of which form the basis for making judgments about carrying values of assets and liabilities that are not readily apparent from other sources. Actual results will differ, and may differ materially from these estimates under different assumptions or conditions. Additionally, changes in accounting estimates could occur in the future from period to period. Our management has discussed the development and selection of our most critical financial estimates with the audit committee of our Board of Directors. The following paragraphs identify our most critical accounting policies:
Inventory Obsolescence.
Our management reviews on a quarterly basis inventory quantities on hand for unmarketable and/or slow-moving products that may expire prior to being sold. This review includes quantities on hand for both raw materials and finished goods. Based on this review, we provide adjustments for any slow-moving finished good products or raw materials that we believe will expire prior to being sold or used to produce a finished good and any products that are unmarketable. This review of inventory quantities for unmarketable and/or slow moving products is based on forecasted product demand prior to expiration lives.
Forecasted unit demand is derived from our historical experience of product sales and production raw material usage. If market conditions become less favorable than those projected by our management, additional inventory write-downs may be required. During the years ended
December 31, 2017
,
2016
and
2015
, we recorded obsolescence expense of approximately $6.1 million, $3.9 million, and $2.8 million, respectively, and wrote off approximately $2.9 million, $2.8 million, and $2.5 million, respectively. Based on this historical trend, we believe that our inventory balances as of
December 31, 2017
have been accurately adjusted for any unmarketable and/or slow moving products that may expire prior to being sold.
Allowance for Doubtful Accounts.
A majority of our receivables are with hospitals which, over our history, have demonstrated favorable collection rates. Therefore, we have experienced relatively minimal bad debts from hospital customers. In limited circumstances, we have written off bad debts as the result of the termination of our business relationships with foreign distributors. The most significant write-offs over our history have come from U.S. and international distributors, as well as from U.S. custom procedure tray manufacturers who bundle our products in surgical trays.
We maintain allowances for doubtful accounts relating to estimated losses resulting from the inability of our customers to make required payments. These allowances are based upon historical experience and a review of individual customer balances. If the financial condition of our customers were to deteriorate, resulting in an impairment of their ability to make payments, additional allowances may be required.
Stock-Based Compensation.
We measure stock-based compensation cost at the grant date based on the value of the award and recognize the cost as an expense over the term of the vesting period. Judgment is required in estimating the fair value of share-based awards granted and their expected forfeiture rate. If actual results differ significantly from these estimates, stock-based compensation expense and our results of operations could be materially impacted.
Income Taxes.
Under our accounting policies, we initially recognize a tax position in our financial statements when it becomes more likely than not that the position will be sustained upon examination by the tax authorities. Such tax positions are initially and subsequently measured as the largest amount of tax positions that has a greater than 50% likelihood of being realized upon ultimate settlement with the tax authorities assuming full knowledge of the position and all relevant facts. Although we believe our provisions for unrecognized tax positions are reasonable, we can make no assurance that the final tax outcome of these matters will not be different from that which we have reflected in our income tax provisions and accruals. The tax law is subject to varied interpretations, and we have taken positions related to certain matters where the law is subject to interpretation. Such differences could have a material impact on our income tax provisions and operating results in the period(s) in which we make such determination.
Valuation of Goodwill, Intangible Assets and Contingent Consideration.
We allocate any excess purchase price over the fair value of the net tangible and identifiable intangible assets acquired in a business combination to goodwill. We test our goodwill balances for impairment as of July 1 of each year, or whenever impairment indicators arise. We utilize several reporting units in evaluating goodwill for impairment. We assess the estimated fair value of reporting units using a combination of a guideline public company market-based approach and a discounted cash flow income-based approach. If the carrying amount of a reporting unit exceeds the fair value of the reporting unit, an impairment charge is recognized in an amount equal to the excess of the carrying amount of the reporting unit goodwill over the implied fair value of that goodwill. This analysis requires significant judgment, including estimation of future cash flows and the length of time they will occur, which is based on internal forecasts, and a determination of a discount rate based on our weighted average cost of capital. During our annual test of goodwill balances in
48
2017
, which was completed during the third quarter of
2017
, we determined that the fair value of each reporting unit with goodwill exceeded the carrying amount by a significant amount.
We evaluate the recoverability of intangible assets subject to amortization whenever events or changes in circumstances indicate that an asset's carrying amount may not be recoverable. This analysis requires similar significant judgments as those discussed above regarding goodwill, except that undiscounted cash flows are compared to the carrying amount of intangible assets to determine if impairment exists. In-process technology intangible assets, which are not subject to amortization until projects reach commercialization, are assessed for impairment at least annually and more frequently if events occur that would indicate a potential reduction in the fair value of the assets below their carrying value. During the fourth quarter of 2017, we compared the carrying value of the amortizing intangible assets acquired in our July 2015 acquisition of certain assets from Distal Access, LLC to the undiscounted cash flows expected to result from the asset group and determined that the carrying amount was not recoverable. We then determined the fair value of the amortizing assets related to the Distal Access acquisition based on estimated future cash flows discounted back to their present value using a discount rate that reflects the risk profiles of the underlying activities. Some of the factors that influenced our estimated cash flows were slower than anticipated sales growth in the products acquired from our Distal Access acquisition and uncertainty about future sales growth. The excess of the carrying value compared to the fair value was recognized as an intangible asset impairment charge. We recorded an impairment charge for Distal Access of approximately
$809,000
.
Contingent consideration is an obligation by the buyer to transfer additional assets or equity interests to the former owner upon reaching certain performance targets. Certain of our business combinations involve the potential for the payment of future contingent consideration, generally based on a percentage of future product sales or upon attaining specified future revenue milestones. In connection with a business combination, any contingent consideration is recorded on the acquisition date based upon the consideration expected to be transferred in the future. We utilize a discounted cash flow method, which includes a probability factor for milestone payments, in valuing the contingent consideration liability. We re-measure the estimated liability each quarter and record changes in the estimated fair value through operating expense in our consolidated statements of income. Significant increases or decreases in our estimates could result in changes to the estimated fair value of our contingent consideration liability, as the result of changes in the timing and amount of revenue estimates, as well as changes in the discount rate or periods.
49
|
Item 7A.
|
Quantitative and Qualitative Disclosures About Market Risk.
|
Our principal market risk relates to changes in the value of the Euro (EUR), Chinese Yuan Renminbi (CNY), and British Pound (GBP) relative to the value of the U.S. Dollar (USD). We also have a limited market risk relating to the Hong Kong Dollar (HKD), Mexican Peso (MXN), Australian Dollar (AUD), Canadian Dollar (CAD), Brazilian Real (BRL), Swiss Franc (CHF), Swedish Krona (SEK), Danish Krone (DKK), South Korean Won (KRW), and Japanese Yen (JPY), among others. Our consolidated financial statements are denominated in, and our principal currency is, the U.S. Dollar. For the year ended December 31, 2017, a portion of our net sales (approximately $215.8 million, representing approximately 29.7% of our aggregate net sales), was attributable to sales that were denominated in foreign currencies. All other international sales were denominated in U.S. Dollars. Our Euro-denominated revenue represents our largest single currency risk. However, our Euro-denominated expenses associated with our European operations (manufacturing sites, a distribution facility and sales representatives) provide a natural hedge. Accordingly, changes in the Euro, and in particular a strengthening of the U.S. Dollar against the Euro, will positively affect our operating income. A strengthening U.S. dollar against the Euro of 10% would increase operating income by approximately $3.2 million dollars. Conversely, a weakening U.S. dollar against the Euro of 10% would decrease operating income by approximately $3.9 million dollars. A strengthening U.S. dollar against the Chinese Renminbi of 10% would decrease operating income by approximately $5.2 million dollars. Conversely, a weakening U.S. dollar against the Chinese Renminbi of 10% would increase operating income by approximately $6.3 million dollars. During the year ended December 31, 2017, exchange rate fluctuations of foreign currencies against the U.S. Dollar resulted in an increase in our gross revenues of approximately $0.6 million, or 0.1%, primarily as a result of favorable impacts due to sales denominated in EUR and BRL, partially offset by unfavorable impacts due to sales denominated in CNY. During the year ended December 31, 2017, exchange rate fluctuations of foreign currencies against the U.S. Dollar also resulted in a decrease in gross margin of approximately $0.4 million, or 0.1% (or approximately 10 basis points in gross margin percentage), primarily as a result of unfavorable impacts from EUR fluctuations related to manufacturing costs from our facilities in Europe denominated in EUR, partially offset by favorable impacts due to MXN fluctuations on our manufacturing costs from our facility in Tijuana, Mexico denominated in MXN.
We forecast our net exposure in various receivables and payables to fluctuations in value of various currencies, and we enter into foreign currency forward contracts to mitigate that exposure. As of
December 31, 2017
, we had entered into the following foreign currency forward contracts (which were not designated as hedging instruments) related to those balance sheet accounts (amounts in thousands and in local currencies):
|
Currency
|
Symbol
|
Forward Notional Amount
|
|
|
Australian Dollar
|
AUD
|
5,600
|
|
|
Brazilian Real
|
BRL
|
8,500
|
|
|
Canadian Dollar
|
CAD
|
2,076
|
|
|
Swiss Franc
|
CHF
|
242
|
|
|
Chinese Renminbi
|
CNY
|
22,990
|
|
|
Danish Krone
|
DKK
|
1,881
|
|
|
Euro
|
EUR
|
23,333
|
|
|
British Pound
|
GBP
|
1,868
|
|
|
Hong Kong Dollar
|
HKD
|
11,000
|
|
|
Japanese Yen
|
JPY
|
178,500
|
|
|
Korean Won
|
KRW
|
1,800,000
|
|
|
Mexican Peso
|
MXN
|
17,540
|
|
|
Swedish Krona
|
SEK
|
4,775
|
|
|
Singapore Dollar
|
SGD
|
5,023
|
|
We also forecast our net exposure related to sales and expenses denominated in foreign currencies. As of December 31, 2017, we had entered into foreign currency forward contracts, which qualified as cash flow hedges, with the following notional amounts (in thousands and in local currencies):
50
|
Currency
|
Symbol
|
Forward Notional Amount
|
|
|
Canadian Dollar
|
CAD
|
2,310
|
|
|
Swiss Franc
|
CHF
|
1,375
|
|
|
Chinese Renminbi
|
CNY
|
45,000
|
|
|
Danish Krone
|
DKK
|
14,470
|
|
|
Euro
|
EUR
|
9,165
|
|
|
British Pound
|
GBP
|
3,625
|
|
|
Mexican Peso
|
MXN
|
95,075
|
|
|
Swedish Krona
|
SEK
|
16,330
|
|
See Note 8 to our consolidated financial statements for a discussion of our foreign currency forward contracts.
As discussed in Note 7 to our consolidated financial statements set forth in Item 8 of this report, as of
December 31, 2017
, we had outstanding borrowings of approximately
$272 million
under the Second Amended Credit Agreement. Accordingly, our earnings and after-tax cash flow are affected by changes in interest rates. On August 5, 2016, we entered into a pay-fixed, receive-variable interest rate swap with Wells Fargo, which as of December 31, 2017 had a notional amount of
$175 million
, to fix the one-month LIBOR rate at
1.12%
. The interest rate swap is scheduled to expire on July 6, 2021. These instruments are intended to reduce our exposure to interest rate fluctuations and were not entered into for speculative purposes. Excluding the amount that is subject to a fixed rate under the interest rate swap and assuming the current level of borrowings remained the same, it is estimated that our interest expense and income before income taxes would change by approximately
$1.0 million
annually for each one percentage point change in the average interest rate under these borrowings.
In the event of an adverse change in interest rates, our management would likely take actions to mitigate our exposure. However, due to the uncertainty of the actions that would be taken and their possible effects, additional analysis is not possible at this time. Further, such analysis would not consider the effects of the change in the level of overall economic activity that could exist in such an environment.
51
|
Item 8.
|
Financial Statements and Supplementary Data.
|
REPORT OF INDEPENDENT REGISTERED PUBLIC ACCOUNTING FIRM
To the Board of Directors and Stockholders of Merit Medical Systems, Inc.:
Opinion on the Financial Statements
We have audited the accompanying consolidated balance sheets of Merit Medical Systems, Inc. and subsidiaries (the “Company”) as of
December 31, 2017
and
2016
, the related consolidated statements of income, comprehensive income, stockholders’ equity, and cash flows for each of the three years in the period ended
December 31, 2017
, and the related notes and the schedule listed in the Index at Item 15 (collectively referred to as the “financial statements”). In our opinion, the financial statements present fairly, in all material respects, the financial position of the Company as of December 31, 2017 and 2016, and the results of its operations and its cash flows for each of the three years in the period ended December 31, 2017, in conformity with accounting principles generally accepted in the United States of America.
We have also audited, in accordance with the standards of the Public Company Accounting Oversight Board (United States) (PCAOB), the Company’s internal control over financial reporting as of December 31, 2017, based on the criteria established in
Internal Control-Integrated Framework (2013)
issued by the Committee of Sponsoring Organizations of the Treadway Commission and our report dated March 1, 2018, expressed an unqualified opinion on the Company’s internal control over financial reporting.
Basis for Opinion
These financial statements are the responsibility of the Company’s management. Our responsibility is to express an opinion on the Company’s financial statements based on our audits. We are a public accounting firm registered with the PCAOB and are required to be independent with respect to the Company in accordance with the U.S. federal securities laws and the applicable rules and regulations of the Securities and Exchange Commission and the PCAOB.
We conducted our audits in accordance with the standards of the PCAOB. Those standards require that we plan and perform the audit to obtain reasonable assurance about whether the financial statements are free of material misstatement, whether due to error or fraud. Our audits included performing procedures to assess the risks of material misstatement of the financial statements, whether due to error or fraud, and performing procedures that respond to those risks. Such procedures included examining, on a test basis, evidence regarding the amounts and disclosures in the financial statements. Our audits also included evaluating the accounting principles used and significant estimates made by management, as well as evaluating the overall presentation of the financial statements. We believe that our audits provide a reasonable basis for our opinion.
|
/s/ DELOITTE & TOUCHE LLP
|
|
|
|
|
|
Salt Lake City, Utah
|
|
|
March 1, 2018
|
|
|
We have served as the Company's auditor since 1988.
|
|
52
|
MERIT MEDICAL SYSTEMS, INC. AND SUBSIDIARIES
DECEMBER 31, 2017 AND 2016
(In thousands)
|
|||||||
|
|
2017
|
2016
|
|||||
|
ASSETS
|
|||||||
|
CURRENT ASSETS:
|
|||||||
|
Cash and cash equivalents
|
$
|
32,336
|
|
$
|
19,171
|
|
|
|
Trade receivables — net of allowance for uncollectible accounts — 2017 — $1,769 and 2016 — $1,587
|
105,536
|
|
80,521
|
|
|||
|
Other receivables
|
9,429
|
|
5,643
|
|
|||
|
Inventories
|
155,288
|
|
120,695
|
|
|||
|
Prepaid expenses and other assets
|
9,096
|
|
6,226
|
|
|||
|
Prepaid income taxes
|
3,225
|
|
2,525
|
|
|||
|
Deferred income tax assets
|
—
|
|
8,219
|
|
|||
|
Income tax refund receivables
|
1,211
|
|
423
|
|
|||
|
Total current assets
|
316,121
|
|
243,423
|
|
|||
|
PROPERTY AND EQUIPMENT:
|
|||||||
|
Land and land improvements
|
19,877
|
|
19,379
|
|
|||
|
Buildings
|
147,356
|
|
139,119
|
|
|||
|
Manufacturing equipment
|
197,651
|
|
178,110
|
|
|||
|
Furniture and fixtures
|
49,528
|
|
43,433
|
|
|||
|
Leasehold improvements
|
31,161
|
|
30,413
|
|
|||
|
Construction-in-progress
|
32,896
|
|
28,180
|
|
|||
|
Total property and equipment
|
478,469
|
|
438,634
|
|
|||
|
Less accumulated depreciation
|
(185,649
|
)
|
(162,061
|
)
|
|||
|
Property and equipment — net
|
292,820
|
|
276,573
|
|
|||
|
OTHER ASSETS:
|
|||||||
|
Intangible assets:
|
|||||||
|
Developed technology — net of accumulated amortization — 2017 — $72,420 and 2016 — $52,843
|
167,771
|
|
135,358
|
|
|||
|
Other — net of accumulated amortization — 2017 — $38,127 and 2016 — $30,048
|
59,553
|
|
47,339
|
|
|||
|
Goodwill
|
238,147
|
|
211,927
|
|
|||
|
Deferred income tax assets
|
2,359
|
|
171
|
|
|||
|
Other assets
|
35,040
|
|
28,012
|
|
|||
|
Total other assets
|
502,870
|
|
422,807
|
|
|||
|
TOTAL
|
$
|
1,111,811
|
|
$
|
942,803
|
|
|
|
See notes to consolidated financial statements.
|
(continued)
|
|
|||||
53
|
MERIT MEDICAL SYSTEMS, INC. AND SUBSIDIARIES
CONSOLIDATED BALANCE SHEETS
DECEMBER 31, 2017 AND 2016
(In thousands)
|
|||||||
|
|
2017
|
2016
|
|||||
|
LIABILITIES AND STOCKHOLDERS’ EQUITY
|
|||||||
|
CURRENT LIABILITIES:
|
|||||||
|
Trade payables
|
$
|
34,931
|
|
$
|
30,619
|
|
|
|
Accrued expenses
|
58,932
|
|
45,519
|
|
|||
|
Current portion of long-term debt
|
19,459
|
|
10,000
|
|
|||
|
Income taxes payable
|
2,298
|
|
2,193
|
|
|||
|
Total current liabilities
|
115,620
|
|
88,331
|
|
|||
|
LONG-TERM DEBT
|
259,013
|
|
314,373
|
|
|||
|
DEFERRED INCOME TAX LIABILITIES
|
23,289
|
|
25,981
|
|
|||
|
LONG-TERM INCOME TAXES PAYABLE
|
4,846
|
|
—
|
|
|||
|
LIABILITIES RELATED TO UNRECOGNIZED TAX BENEFITS
|
2,746
|
|
438
|
|
|||
|
DEFERRED COMPENSATION PAYABLE
|
11,181
|
|
9,211
|
|
|||
|
DEFERRED CREDITS
|
2,403
|
|
2,550
|
|
|||
|
OTHER LONG-TERM OBLIGATIONS
|
16,379
|
|
3,730
|
|
|||
|
Total liabilities
|
435,477
|
|
444,614
|
|
|||
|
COMMITMENTS AND CONTINGENCIES (Notes 2, 7, 8, and 9)
|
|
|
|
|
|||
|
STOCKHOLDERS’ EQUITY:
|
|||||||
|
Preferred stock — 5,000 shares authorized as of December 31, 2017 and 2016; no shares issued
|
—
|
|
—
|
|
|||
|
Common stock, no par value; shares authorized — 2017 and 2016 - 100,000; issued and outstanding as of December 31, 2017 - 50,248 and December 31, 2016 - 44,645
|
353,392
|
|
206,186
|
|
|||
|
Retained earnings
|
321,408
|
|
293,885
|
|
|||
|
Accumulated other comprehensive income (loss)
|
1,534
|
|
(1,882
|
)
|
|||
|
Total stockholders’ equity
|
676,334
|
|
498,189
|
|
|||
|
TOTAL
|
$
|
1,111,811
|
|
$
|
942,803
|
|
|
|
See notes to consolidated financial statements.
|
(concluded)
|
|
|||||
54
|
MERIT MEDICAL SYSTEMS, INC. AND SUBSIDIARIES
YEARS ENDED DECEMBER 31, 2017, 2016 AND 2015
(In thousands, except per share amounts)
|
|||||||||||
|
|
2017
|
2016
|
2015
|
||||||||
|
NET SALES
|
$
|
727,852
|
|
$
|
603,838
|
|
$
|
542,149
|
|
||
|
COST OF SALES
|
401,599
|
|
338,813
|
|
306,368
|
|
|||||
|
GROSS PROFIT
|
326,253
|
|
265,025
|
|
235,781
|
|
|||||
|
OPERATING EXPENSES:
|
|
|
|||||||||
|
Selling, general and administrative
|
229,134
|
|
184,398
|
|
156,348
|
|
|||||
|
Research and development
|
51,403
|
|
45,229
|
|
40,810
|
|
|||||
|
Intangible asset impairment charges
|
809
|
|
—
|
|
—
|
|
|||||
|
Contingent consideration expense (benefit)
|
(298
|
)
|
61
|
|
80
|
|
|||||
|
Acquired in-process research and development
|
12,136
|
|
461
|
|
1,000
|
|
|||||
|
Total operating expenses
|
293,184
|
|
230,149
|
|
198,238
|
|
|||||
|
INCOME FROM OPERATIONS
|
33,069
|
|
34,876
|
|
37,543
|
|
|||||
|
OTHER INCOME (EXPENSE):
|
|
|
|||||||||
|
Interest income
|
381
|
|
81
|
|
272
|
|
|||||
|
Interest expense
|
(7,736
|
)
|
(8,798
|
)
|
(6,229
|
)
|
|||||
|
Gain on bargain purchase
|
11,039
|
|
—
|
|
—
|
|
|||||
|
Other income (expense) - net
|
(872
|
)
|
(773
|
)
|
(386
|
)
|
|||||
|
Other income (expense) — net
|
2,812
|
|
(9,490
|
)
|
(6,343
|
)
|
|||||
|
INCOME BEFORE INCOME TAXES
|
35,881
|
|
25,386
|
|
31,200
|
|
|||||
|
INCOME TAX EXPENSE
|
8,358
|
|
5,265
|
|
7,398
|
|
|||||
|
NET INCOME
|
$
|
27,523
|
|
$
|
20,121
|
|
$
|
23,802
|
|
||
|
EARNINGS PER COMMON SHARE:
|
|
|
|||||||||
|
Basic
|
$
|
0.56
|
|
$
|
0.45
|
|
$
|
0.54
|
|
||
|
Diluted
|
$
|
0.55
|
|
$
|
0.45
|
|
$
|
0.53
|
|
||
|
AVERAGE COMMON SHARES:
|
|||||||||||
|
Basic
|
48,805
|
|
44,408
|
|
44,036
|
|
|||||
|
Diluted
|
50,101
|
|
44,862
|
|
44,511
|
|
|||||
See notes to consolidated financial statements.
55
MERIT MEDICAL SYSTEMS, INC. AND SUBSIDIARIES
CONSOLIDATED STATEMENTS OF COMPREHENSIVE INCOME
YEARS ENDED DECEMBER 31, 2017, 2016 AND 2015
(In thousands)
|
2017
|
2016
|
2015
|
|||||||||
|
Net income
|
$
|
27,523
|
|
$
|
20,121
|
|
$
|
23,802
|
|
||
|
Other comprehensive income (loss):
|
|||||||||||
|
Cash flow hedges
|
901
|
|
4,784
|
|
(571
|
)
|
|||||
|
Less income tax benefit (expense)
|
(350
|
)
|
(1,861
|
)
|
222
|
|
|||||
|
Foreign currency translation adjustment
|
3,117
|
|
878
|
|
(3,037
|
)
|
|||||
|
Less income tax benefit (expense)
|
(252
|
)
|
(196
|
)
|
311
|
|
|||||
|
Total other comprehensive income (loss)
|
3,416
|
|
3,605
|
|
(3,075
|
)
|
|||||
|
Total comprehensive income
|
$
|
30,939
|
|
$
|
23,726
|
|
$
|
20,727
|
|
||
See notes to consolidated financial statements.
56
|
MERIT MEDICAL SYSTEMS, INC. AND SUBSIDIARIES
CONSOLIDATED STATEMENTS OF STOCKHOLDERS’ EQUITY
YEARS ENDED DECEMBER 31, 2017, 2016 AND 2015
(In thousands)
|
||||||||||||||||||
|
|
|
|
|
|
Accumulated Other
|
|||||||||||||
|
|
|
Common Stock
|
Retained
|
Comprehensive
|
||||||||||||||
|
|
Total
|
Shares
|
Amount
|
Earnings
|
Income (Loss)
|
|||||||||||||
|
BALANCE — January 1, 2015
|
$
|
435,259
|
|
43,614
|
|
$
|
187,709
|
|
$
|
249,962
|
|
$
|
(2,412
|
)
|
||||
|
|
|
|||||||||||||||||
|
Net income
|
23,802
|
|
|
|
|
|
23,802
|
|
|
|
||||||||
|
Other comprehensive loss
|
(3,075
|
)
|
|
|
|
|
|
|
(3,075
|
)
|
||||||||
|
Excess tax benefits from stock-based compensation
|
2,124
|
|
|
|
2,124
|
|
|
|
|
|
||||||||
|
Stock-based compensation expense
|
2,243
|
|
|
|
2,243
|
|
|
|
|
|
||||||||
|
Options exercised
|
10,029
|
|
858
|
|
10,029
|
|
|
|
|
|
||||||||
|
Issuance of common stock under Employee Stock Purchase Plans
|
441
|
|
23
|
|
441
|
|
|
|
|
|
||||||||
|
Shares surrendered in exchange for payment of payroll tax liabilities
|
(918
|
)
|
(43
|
)
|
(918
|
)
|
||||||||||||
|
Shares surrendered in exchange for exercise of stock options
|
(3,802
|
)
|
(185
|
)
|
(3,802
|
)
|
||||||||||||
|
BALANCE — December 31, 2015
|
466,103
|
|
44,267
|
|
197,826
|
|
273,764
|
|
(5,487
|
)
|
||||||||
|
Net income
|
20,121
|
|
|
|
|
|
20,121
|
|
|
|
||||||||
|
Other comprehensive income
|
3,605
|
|
|
|
|
|
|
|
3,605
|
|
||||||||
|
Excess tax benefits from stock-based compensation
|
669
|
|
|
|
669
|
|
|
|
|
|
||||||||
|
Stock-based compensation expense
|
2,506
|
|
|
|
2,506
|
|
|
|
|
|
||||||||
|
Options exercised
|
4,923
|
|
362
|
|
4,923
|
|
||||||||||||
|
Issuance of common stock under Employee Stock Purchase Plans
|
694
|
|
34
|
|
694
|
|
|
|
|
|
||||||||
|
Shares surrendered in exchange for payment of payroll tax liabilities
|
(86
|
)
|
(4
|
)
|
(86
|
)
|
||||||||||||
|
Shares surrendered in exchange for exercise of stock options
|
(346
|
)
|
(14
|
)
|
(346
|
)
|
|
|
|
|
||||||||
|
BALANCE — December 31, 2016
|
498,189
|
|
44,645
|
|
206,186
|
|
293,885
|
|
(1,882
|
)
|
||||||||
|
Net income
|
27,523
|
|
27,523
|
|
||||||||||||||
|
Other comprehensive income
|
3,416
|
|
3,416
|
|
||||||||||||||
|
Stock-based compensation expense
|
4,075
|
|
4,075
|
|
||||||||||||||
|
Options exercised
|
5,689
|
|
404
|
|
5,689
|
|
||||||||||||
|
Issuance of common stock under Employee Stock Purchase Plans
|
836
|
|
24
|
|
836
|
|
||||||||||||
|
Issuance of common stock, net of offering costs
|
136,606
|
|
5,175
|
|
136,606
|
|
||||||||||||
|
BALANCE — December 31, 2017
|
$
|
676,334
|
|
50,248
|
|
$
|
353,392
|
|
$
|
321,408
|
|
$
|
1,534
|
|
||||
See notes to consolidated financial statements.
57
|
MERIT MEDICAL SYSTEMS, INC. AND SUBSIDIARIES
YEARS ENDED DECEMBER 31, 2017, 2016 AND 2015
(In thousands)
|
|||||||||||
|
2017
|
2016
|
2015
|
|||||||||
|
CASH FLOWS FROM OPERATING ACTIVITIES:
|
|
|
|||||||||
|
Net income
|
$
|
27,523
|
|
$
|
20,121
|
|
$
|
23,802
|
|
||
|
Adjustments to reconcile net income to net cash provided by operating activities:
|
|
|
|||||||||
|
Depreciation and amortization
|
53,582
|
|
43,755
|
|
37,425
|
|
|||||
|
Gain on bargain purchase
|
(11,039
|
)
|
—
|
|
—
|
|
|||||
|
Losses (gains) on sales and/or abandonment of property and equipment
|
427
|
|
530
|
|
(23
|
)
|
|||||
|
Write-off of patents and intangible assets
|
988
|
|
101
|
|
141
|
|
|||||
|
Acquired in-process research and development
|
12,136
|
|
461
|
|
1,000
|
|
|||||
|
Amortization of deferred credits
|
(147
|
)
|
(170
|
)
|
(171
|
)
|
|||||
|
Amortization of long-term debt issuance costs
|
685
|
|
952
|
|
987
|
|
|||||
|
Deferred income taxes
|
(1,304
|
)
|
(962
|
)
|
3,450
|
|
|||||
|
Excess tax benefits from stock-based compensation
|
—
|
|
(669
|
)
|
(2,124
|
)
|
|||||
|
Stock-based compensation expense
|
4,075
|
|
2,506
|
|
2,243
|
|
|||||
|
Changes in operating assets and liabilities, net of effects from acquisitions:
|
|||||||||||
|
Trade receivables
|
(12,844
|
)
|
(6,816
|
)
|
(5,872
|
)
|
|||||
|
Other receivables
|
(3,557
|
)
|
1,161
|
|
335
|
|
|||||
|
Inventories
|
(17,834
|
)
|
(3,656
|
)
|
(13,113
|
)
|
|||||
|
Prepaid expenses and other current assets
|
(1,236
|
)
|
271
|
|
(696
|
)
|
|||||
|
Prepaid income taxes
|
(611
|
)
|
404
|
|
(1,788
|
)
|
|||||
|
Income tax refund receivables
|
(588
|
)
|
406
|
|
(784
|
)
|
|||||
|
Other assets
|
(3,735
|
)
|
(3,763
|
)
|
(362
|
)
|
|||||
|
Trade payables
|
417
|
|
(6,835
|
)
|
14,766
|
|
|||||
|
Accrued expenses
|
6,461
|
|
3,242
|
|
5,873
|
|
|||||
|
Income taxes payable
|
21
|
|
1,451
|
|
2,199
|
|
|||||
|
Long-term income taxes payable
|
4,846
|
|
—
|
|
—
|
|
|||||
|
Liabilities related to unrecognized tax benefits
|
(19
|
)
|
597
|
|
536
|
|
|||||
|
Deferred compensation payable
|
1,970
|
|
712
|
|
(135
|
)
|
|||||
|
Other long-term obligations
|
2,510
|
|
(200
|
)
|
1,769
|
|
|||||
|
Total adjustments
|
35,204
|
|
33,478
|
|
45,656
|
|
|||||
|
Net cash provided by operating activities
|
62,727
|
|
53,599
|
|
69,458
|
|
|||||
|
CASH FLOWS FROM INVESTING ACTIVITIES:
|
|
|
|||||||||
|
Capital expenditures for:
|
|
|
|||||||||
|
Property and equipment
|
(38,623
|
)
|
(32,837
|
)
|
(50,959
|
)
|
|||||
|
Intangible assets
|
(2,577
|
)
|
(2,217
|
)
|
(1,956
|
)
|
|||||
|
Proceeds from sale-leaseback transactions
|
—
|
|
—
|
|
2,017
|
|
|||||
|
Proceeds from sale of cost method investment
|
—
|
|
1,089
|
|
—
|
|
|||||
|
Proceeds from the sale of property and equipment
|
21
|
|
19
|
|
1,247
|
|
|||||
|
Cash paid in acquisitions, net of cash acquired
|
(105,582
|
)
|
(125,161
|
)
|
(12,368
|
)
|
|||||
|
Net cash used in investing activities
|
(146,761
|
)
|
(159,107
|
)
|
(62,019
|
)
|
|||||
|
See notes to consolidated financial statements.
|
(continued)
|
|
|||||||||
58
|
MERIT MEDICAL SYSTEMS, INC. AND SUBSIDIARIES
CONSOLIDATED STATEMENTS OF CASH FLOWS
YEARS ENDED DECEMBER 31, 2017, 2016 AND 2015
(In thousands)
|
|||||||||||
|
2017
|
2016
|
2015
|
|||||||||
|
CASH FLOWS FROM FINANCING ACTIVITIES:
|
|
|
|||||||||
|
Proceeds from issuance of common stock
|
$
|
143,810
|
|
$
|
5,271
|
|
$
|
6,668
|
|
||
|
Offering costs
|
(816
|
)
|
—
|
|
—
|
|
|||||
|
Proceeds from issuance of long-term debt
|
197,214
|
|
219,505
|
|
152,375
|
|
|||||
|
Payments on long-term debt
|
(243,214
|
)
|
(102,098
|
)
|
(169,272
|
)
|
|||||
|
Excess tax benefits from stock-based compensation
|
—
|
|
669
|
|
2,124
|
|
|||||
|
Long-term debt issuance costs
|
(416
|
)
|
(1,948
|
)
|
—
|
|
|||||
|
Contingent payments related to acquisitions
|
(61
|
)
|
(218
|
)
|
(1,212
|
)
|
|||||
|
Payment of taxes related to an exchange of common stock
|
—
|
|
(86
|
)
|
(918
|
)
|
|||||
|
Net cash provided by (used in) financing activities
|
96,517
|
|
121,095
|
|
(10,235
|
)
|
|||||
|
EFFECT OF EXCHANGE RATES ON CASH
|
682
|
|
(593
|
)
|
(382
|
)
|
|||||
|
NET INCREASE (DECREASE) IN CASH AND CASH EQUIVALENTS
|
13,165
|
|
14,994
|
|
(3,178
|
)
|
|||||
|
CASH AND CASH EQUIVALENTS:
|
|
|
|||||||||
|
Beginning of year
|
19,171
|
|
4,177
|
|
7,355
|
|
|||||
|
End of year
|
$
|
32,336
|
|
$
|
19,171
|
|
$
|
4,177
|
|
||
|
SUPPLEMENTAL DISCLOSURES OF CASH FLOW INFORMATION
|
|||||||||||
|
Cash paid during the year for:
|
|||||||||||
|
Interest (net of capitalized interest of $513, $460 and $325, respectively)
|
$
|
7,707
|
|
$
|
8,872
|
|
$
|
6,273
|
|
||
|
Income taxes
|
$
|
6,049
|
|
$
|
2,318
|
|
$
|
3,409
|
|
||
|
SUPPLEMENTAL DISCLOSURES OF NON-CASH INVESTING AND FINANCING ACTIVITIES
|
|
|
|||||||||
|
Property and equipment purchases in accounts payable
|
$
|
1,992
|
|
$
|
2,398
|
|
$
|
3,199
|
|
||
|
Cost method investment converted to intangible asset in acquisition in lieu of additional cash payment
|
$
|
—
|
|
$
|
—
|
|
$
|
1,010
|
|
||
|
Contingent receivable in exchange for sale of cost method investment
|
$
|
—
|
|
$
|
711
|
|
$
|
—
|
|
||
|
Receivable for issuance of common stock associated with option exercises
|
$
|
137
|
|
$
|
—
|
|
$
|
—
|
|
||
|
Acquisition purchases in accrued expenses and other long-term obligations
|
$
|
10,488
|
|
$
|
—
|
|
$
|
1,300
|
|
||
|
Merit common stock surrendered (0, 14 and 185 shares, respectively) in exchange for exercise of stock options
|
$
|
—
|
|
$
|
346
|
|
$
|
3,802
|
|
||
|
See notes to consolidated financial statements.
|
(concluded)
|
|
|||||||||
59
MERIT MEDICAL SYSTEMS, INC. AND SUBSIDIARIES
NOTES TO CONSOLIDATED FINANCIAL STATEMENTS
YEARS ENDED DECEMBER 31, 2017, 2016 and 2015
1. ORGANIZATION AND SUMMARY OF SIGNIFICANT ACCOUNTING POLICIES
Organization
. Merit Medical Systems, Inc. (“Merit,” “we,” or “us”) designs, develops, manufactures and markets single-use medical products for interventional and diagnostic procedures. For financial reporting purposes, we report our operations in
two
operating segments: cardiovascular and endoscopy. Our cardiovascular segment consists of cardiology and radiology medical device products which assist in diagnosing and treating coronary artery disease, peripheral vascular disease and other non-vascular diseases and includes embolotherapeutic, cardiac rhythm management, electrophysiology, critical care, and interventional oncology and spine devices. Our endoscopy segment consists of gastroenterology and pulmonology devices which assist in the palliative treatment of expanding esophageal, tracheobronchial and biliary strictures caused by malignant tumors. Within those
two
operating segments, we offer products focused in
five
core product groups: peripheral intervention, cardiac intervention, interventional oncology and spine, cardiovascular and critical care, and endoscopy.
We manufacture our products in plants located in the United States, Mexico, The Netherlands, Ireland, France, Brazil, Australia, and Singapore. We export sales to dealers and have direct or modified direct sales forces in the United States, Canada, Western Europe, Australia, Brazil, Russia, Japan, China, Malaysia, South Korea, UAE and India (see Note 12). Our consolidated financial statements have been prepared in accordance with accounting principles generally accepted in the United States of America. The following is a summary of the more significant of such policies.
Use of Estimates in Preparing Financial Statements
. The preparation of financial statements in conformity with accounting principles generally accepted in the United States of America ("U.S. GAAP") requires management to make estimates and assumptions that affect the reported amounts of assets and liabilities and disclosure of contingent assets and liabilities at the date of the financial statements and the reported amounts of revenues and expenses during the reporting period. Actual results could differ from those estimates.
Reclassifications
. Certain prior period amounts were reclassified to conform to the current period presentation. The consolidated balance sheet previously presented employee receivables and advances from employees which are now presented as components of other receivables and accrued expenses, respectively. The reclassifications provide a more concise financial statement presentation and additional information is disclosed in the notes if material.
Principles of Consolidation
. The consolidated financial statements include our wholly owned subsidiaries. Intercompany balances and transactions have been eliminated.
Cash and Cash Equivalents
.
For purposes of the statements of cash flows, we consider interest bearing deposits with an original maturity date of three months or less to be cash equivalents.
Receivables
.
Trade accounts receivable are recorded at the net invoice value and are not interest bearing. An allowance for uncollectible accounts receivable is recorded based on our historical bad debt experience and on management’s evaluation of our ability to collect individual outstanding balances. Once collection efforts have been exhausted and a receivable is deemed to be uncollectible, such balance is charged against the allowance for uncollectible accounts.
Inventories
. We value our inventories at the lower of cost, determined on a first-in, first-out method, or net realizable value. Net realizable value is the estimated selling price in the ordinary course of business, less reasonably predictable costs of completion, disposal, and transportation. Inventory costs include material, labor and manufacturing overhead. We review inventories on hand at least quarterly and record provisions for estimated excess, slow moving and obsolete inventory, as well as inventory with a carrying value in excess of net realizable value. The regular and systematic inventory valuation reviews include a current assessment of future product demand, historical experience and product expiration.
Goodwill and Intangible Assets
.
We test goodwill balances for impairment on an annual basis as of July 1 or whenever impairment indicators arise. We utilize several reporting units in evaluating goodwill for impairment. We assess the estimated fair value of reporting units using a combination of a guideline public company market-based approach and a discounted cash flow income-based approach. If the carrying amount of a reporting unit exceeds the fair value of the reporting unit, an impairment charge is recognized in an amount equal to the excess of the carrying amount of the reporting unit goodwill over the implied fair value of that goodwill.
60
Finite-lived intangible assets including developed technology, customer lists, distribution agreements, license agreements, trademarks, covenants not to compete and patents are subject to amortization. Intangible assets are amortized over their estimated useful life on a straight-line basis, except for customer lists, which are generally amortized on an accelerated basis. Estimated useful lives are determined considering the period the assets are expected to contribute to future cash flows. We evaluate the recoverability of our finite-lived intangible assets periodically and take into account events or circumstances that warrant revised estimates of useful lives or that indicate impairment exists.
In-process technology intangible assets, which are not subject to amortization until projects reach commercialization, are assessed for impairment at least annually and more frequently if events occur that would indicate a potential reduction in the fair value of the assets below their carrying value. An impairment charge would be recognized to the extent the carrying amount of the in-process technology exceeded its fair value.
Long-Lived Assets
. We periodically review the carrying amount of our depreciable long-lived assets for impairment. An asset is considered impaired when estimated future cash flows are less than the carrying amount of the asset. In the event the carrying amount of such asset is not considered recoverable, the asset is adjusted to its fair value. Fair value is generally determined based on discounted future cash flow.
Property and Equipment
. Property and equipment is stated at the historical cost of construction or purchase. Construction costs include interest costs capitalized during construction. Maintenance and repairs of property and equipment are charged to operations as incurred. Leasehold improvements are amortized over the lesser of the base term of the lease or estimated life of the leasehold improvements. Construction-in-process consists of new buildings and various production equipment being constructed internally and externally. Assets in construction-in-process will commence depreciating once the asset has been placed in service. Depreciation is computed using the straight-line method over estimated useful lives as follows:
|
Buildings
|
40 years
|
||
|
Manufacturing equipment
|
4
|
-
|
20 years
|
|
Furniture and fixtures
|
3
|
-
|
20 years
|
|
Land improvements
|
10
|
-
|
20 years
|
|
Leasehold improvements
|
4
|
-
|
25 years
|
Depreciation expense related to property and equipment for the years ended
December 31, 2017
,
2016
and
2015
was approximately
$26.8 million
,
$24.5 million
, and
$22.6 million
, respectively.
Deferred Compensation
. We have a deferred compensation plan that permits certain management employees to defer a portion of their salary until the future. We established a Rabbi trust to finance obligations under the plan with corporate-owned variable life insurance contracts. The cash surrender value totaled approximately
$11.7 million
and
$9.9 million
at
December 31, 2017
and
2016
, respectively, which is included in other assets in our consolidated balance sheets. We have recorded a deferred compensation payable of approximately
$11.2 million
and
$9.2 million
at
December 31, 2017
and
2016
, respectively, to reflect the liability to our employees under this plan.
Other Assets
.
Other assets consist of our deferred compensation plan cash surrender value discussed above, unamortized issuance costs on revolving debt, investments in privately-held companies accounted for at cost, a long-term income tax refund receivable, deposits related to various leases, and the long-term assets related to derivatives.
Deferred Credits
. Deferred credits consist of grant money received from the Irish government. Grant money is received for a percentage of expenditures on eligible property and equipment, specific research and development projects and costs of hiring and training employees. Amounts related to the acquisition of property and equipment are amortized as a reduction of depreciation expense over the lives of the corresponding property and equipment.
Revenue Recognition
.
We sell our single-use disposable medical products through a direct sales force in the U.S. and through OEM relationships, custom procedure tray manufacturers and a combination of direct sales force and independent distributors in international markets. Revenues from these customers are recognized when all of the following have occurred: (i) persuasive evidence of an arrangement exists, (ii) delivery has occurred or services have been rendered, (iii) the price is fixed or determinable and (iv) the ability to collect is reasonably assured. These criteria are generally satisfied at the time of shipment when risk of loss and title passes to the customer. We have certain written agreements with group purchasing organizations to sell our products to participating hospitals. These agreements have destination shipping terms which require us to defer the recognition of a sale until the product has arrived at the participating hospitals. We reserve for sales returns, including returns related to defective products, as a reduction in net sales, based on our historical experience. We also offer sales rebates and discounts to purchasing
61
groups. These reserves are recorded as a reduction in net sales and are not considered material to our consolidated statements of income for the years ended
December 31, 2017
,
2016
and
2015
. In addition, we invoice our customers for taxes assessed by governmental authorities such as sales tax and value added taxes. We present these taxes on a net basis.
As noted further below, we do not expect our reported revenue to be affected materially in any period due to the adoption of Accounting Standards Codification ("ASC") Topic 606 because: (1) we expect to identify similar performance obligations under ASC Topic 606 as compared with deliverables and separate units of account previously identified; (2) we have determined the transaction price to be consistent; and (3) we record revenue at the same point in time, upon shipment or delivery under both ASC Topic 605 and ASC Topic 606, as applicable under the terms of the contract with the customer. Additionally, we do not expect the accounting for fulfillment costs or costs incurred to obtain a contract to be affected materially in any period due to the adoption of Topic 606.
Shipping and Handling
. We bill our customers for shipping and handling charges, which are included in net sales for the applicable period, and the corresponding shipping and handling expense is reported in cost of sales.
Cost of Sales
. We include product costs (i.e. material, direct labor and overhead costs), shipping and handling expense, product royalty expense, developed technology amortization expense, production-related depreciation expense and product license agreement expense in cost of sales.
Research and Development
. Research and development costs are expensed as incurred.
Income Taxes
. Under our accounting policies, we initially recognize a tax position in our financial statements when it becomes more likely than not that the position will be sustained upon examination by the tax authorities. Such tax positions are initially and subsequently measured as the largest amount of tax positions that has a greater than 50% likelihood of being realized upon ultimate settlement with the tax authorities assuming full knowledge of the position and all relevant facts. Although we believe our provisions for unrecognized tax positions are reasonable, we can make no assurance that the final tax outcome of these matters will not be different from that which we have reflected in our income tax provisions and accruals. The tax law is subject to varied interpretations, and we have taken positions related to certain matters where the law is subject to interpretation. Such differences could have a material impact on our income tax provisions and operating results in the period(s) in which we make such determination.
Earnings per Common Share
. Net income per common share is computed by both the basic method, which uses the weighted average number of our common shares outstanding, and the diluted method, which includes the dilutive common shares from stock options and warrants, as calculated using the treasury stock method.
Fair Value Measurements
.
The fair value of a financial instrument is the amount that could be received upon the sale of an asset or paid to transfer a liability in an orderly transaction between market participants at the measurement date. Financial assets are marked to bid prices and financial liabilities are marked to offer prices. Fair value measurements do not include transaction costs. A fair value hierarchy is used to prioritize the quality and reliability of the information used to determine fair values. Categorization within the fair value hierarchy is based on the lowest level of input that is significant to the fair value measurement. The fair value hierarchy is defined in the following three categories:
Level 1: Quoted market prices in active markets for identical assets or liabilities.
Level 2: Observable market-based inputs or inputs that are corroborated by market data.
Level 3: Unobservable inputs that are not corroborated by market data.
Stock-Based Compensation
.
We recognize the fair value compensation cost relating to share-based payment transactions in accordance with ASC 718,
Compensation — Stock Compensation
. Under the provisions of ASC 718, share-based compensation cost is measured at the grant date, based on the fair value of the award, and is recognized over the employee’s requisite service period, which is generally the vesting period. The fair value of our stock options is estimated using a Black-Scholes option valuation model. Stock-based compensation expense for the years ended
December 31, 2017
,
2016
and
2015
was approximately
$4.1 million
,
$2.5 million
and
$2.2 million
, respectively.
Concentration of Credit Risk
. Financial instruments that potentially subject us to concentrations of credit risk consist primarily of cash and cash equivalents and accounts receivable. We provide credit, in the normal course of business, primarily to hospitals and independent third-party custom procedure tray manufacturers and distributors. We perform ongoing credit evaluations of our customers and maintain allowances for potential credit losses. Sales to our single largest customer accounted for approximately
2%
,
3%
, and
3%
of net sales for the years ended
December 31, 2017
,
2016
and
2015
, respectively.
62
Foreign Currency
. The financial statements of our foreign subsidiaries are measured using local currencies as the functional currency, with the exception of our subsidiaries in Ireland and Mexico, which each use the U.S. Dollar as its functional currency. Assets and liabilities are translated into U.S. Dollars at year-end rates of exchange and results of operations are translated at average rates for the year. Gains and losses resulting from these translations are included in accumulated other comprehensive income (loss) as a separate component of stockholders’ equity. Foreign currency transactions denominated in a currency other than the entity’s functional currency are included in determining net income for the period.
Derivatives
.
We use forward contracts to mitigate our exposure to volatility in foreign exchange rates, and we use interest rate swaps to hedge changes in the benchmark interest rate related to our Second Amended Credit Agreement described in Note 7. All derivatives are recognized in the consolidated balance sheets at fair value. Classification of each hedging instrument is based upon whether the maturity of the instrument is less than or greater than 12 months. We do not purchase or hold derivative financial instruments for speculative or trading purposes (see Note 8).
Accumulated Other Comprehensive Income (Loss)
. As of
December 31, 2017
, accumulated other comprehensive income included approximately
$3.5 million
(net of tax of
$(2.2) million
) related to cash flow hedges and
$(1.9) million
(net of tax of
$0
) related to foreign currency translation. As of
December 31, 2016
, accumulated other comprehensive loss included approximately
$2.9 million
(net of tax of
$(1.9) million
) related to cash flow hedges and
$(4.8) million
(net of tax of
$318,000
) related to foreign currency translation.
New Financial Accounting Standards
.
Recently Adopted
In January 2017, the Financial Accounting Standards Board (the “FASB”) issued Accounting Standards Update (“ASU”) No. 2017-04,
Intangibles - Goodwill and Other (Topic 350): Simplifying the Test for Goodwill Impairment
, which eliminates the requirement to determine the fair value of individual assets and liabilities of a reporting unit to measure goodwill impairment. Under these amendments, goodwill impairment testing will be performed by comparing the fair value of the reporting unit with its carrying amount and recognizing an impairment charge for the amount by which the carrying amount exceeds the reporting unit’s fair value. We adopted ASU 2017-04 effective January 1, 2017 on a prospective basis, and it did not have a material impact on our consolidated financial statements for the year ended December 31, 2017.
In January 2017, the FASB issued ASU No. 2017-01,
Business Combinations (Topic 805): Clarifying the Definition of a Business
, which provides guidance to assist entities with evaluating when a set of transferred assets and activities is a business and provides a screen to determine when a set is not a business. Under the new guidance, when substantially all the fair value of gross assets acquired (or disposed of) is concentrated in a single identifiable asset, or group of similar assets, the assets acquired would not represent a business. Also, to be considered a business, an acquisition would have to include an input and a substantive process that together significantly contribute to the ability to produce outputs. We adopted ASU 2017-01 effective January 1, 2017 on a prospective basis. The implementation of ASU 2017-01 did not have a material impact on our consolidated financial statements for the year ended December 31, 2017.
In March 2016, the FASB issued ASU No. 2016-09,
Compensation - Stock Compensation (Topic 718): Improvements to Employee Share-Based Payment Accounting
, which requires companies to record excess tax benefits and deficiencies in income rather than the current requirement to record them through equity. ASU 2016-09 also allows companies the option to recognize forfeitures of share-based awards when they occur rather than the previous requirement to make an estimate upon the grant of the awards. We adopted ASU 2016-09 effective January 1, 2017 on a prospective basis and, as such, no prior periods were adjusted. In accordance with the new standard and prospectively since the date we adopted ASU 2016-09, excess tax benefits from stock-based compensation are reported as an income tax benefit in our consolidated statements of income (see Note 5).
In November 2015, the FASB issued ASU No. 2015-17,
Income Taxes (Topic 740): Balance Sheet Classification of Deferred Taxes
, which requires all deferred tax assets and deferred tax liabilities to be presented as noncurrent within a classified balance sheet. We adopted ASU 2015-17 effective January 1, 2017 on a prospective basis and did not reclassify presentation of prior year balances. The adoption of this standard did not have a material impact on our consolidated financial statements for the year ended December 31, 2017.
In July 2015, the FASB issued ASU No. 2015-11,
Simplifying the Measurement of Inventory
, which requires that inventory be measured at the lower of cost or net realizable value. Net realizable value is the estimated selling price in the ordinary course of business, less reasonably predictable costs of completion, disposal, and transportation. Inventory measured using last-in, first-out or the retail inventory method are excluded from the scope of ASU 2015-11, which is effective for fiscal years beginning after
63
December 15, 2016, and interim periods within those fiscal years. The implementation of ASU 2015-11 did not have a material impact on our consolidated financial statements for the year ended December 31, 2017.
Not Yet Adopted
In February 2018, the FASB issued ASU 2018-02,
Income Statement-Reporting Comprehensive Income (Topic 220): Reclassification of Certain Tax Effects from Accumulated Other Comprehensive Income,
which allows a reclassification from accumulated other comprehensive income to retained earnings for stranded tax effects resulting from the Tax Cuts and Jobs Act enacted in December 2017. ASU 2018-02 is effective for fiscal years beginning after December 15, 2018, and interim periods within those fiscal years. Early adoption is permitted. We do not believe that the adoption of ASU 2018-02 will have a material impact on our consolidated financial statements.
In August 2017, the FASB issued ASU 2017-12,
Derivatives and Hedging (Topic 815): Targeted Improvements to Accounting for Hedging Activities
, which expands and refines hedge accounting for both financial and non-financial risk components, aligns the recognition and presentation of the effects of hedging instruments and hedge items in the financial statements, and includes certain targeted improvements to ease the application of current guidance related to the assessment of hedge effectiveness. ASU 2017-12 is effective for fiscal years beginning after December 15, 2018, and interim periods within those fiscal years. Early adoption is permitted. We are currently evaluating the anticipated impact of adopting ASU 2017-12 on our consolidated financial statements.
In October 2016, the FASB issued ASU No. 2016-16,
Income Taxes (Topic 740): Intra-Entity Transfers of Assets Other than Inventory
, which requires the recognition of the income tax consequences of an intra-entity transfer of an asset, other than inventory, when the transfer occurs. ASU 2016-16 became effective for us as of January 1, 2018. We do not believe that the adoption of ASU 2016-16 will have a material impact on our consolidated financial statements.
In August 2016, the FASB issued ASU No. 2016-15,
Statement of Cash Flows (Topic 230): Classification of Certain Cash Receipts and Cash Payments
, which addresses eight specific cash flow issues with the objective of reducing the existing diversity in practice in how certain cash receipts and cash payments are presented and classified in the statement of cash flows. ASU 2016-15 became effective for us on January 1, 2018. We do not believe that the adoption of ASU 2016-15 will have a material impact on our consolidated financial statements.
In February 2016, the FASB issued ASU No. 2016-02,
Leases
, which eliminates the current tests for lease classification under U.S. GAAP and requires lessees to recognize the right-of-use assets and related lease liabilities on the balance sheet for all leases greater than one year in duration. ASU 2016-02 is effective for fiscal years beginning after December 15, 2018, including interim periods within those fiscal years. Early adoption of ASU 2016-02 is permitted. ASU 2016-02 provides that lessees (for capital and operating leases) and lessors (for sales-type, direct financing, and operating leases) must apply a modified retrospective transition approach for leases existing at, or entered into after, the beginning of the earliest comparative period presented in the financial statements. The modified retrospective approach would not require any transition accounting for leases that expired before the earliest comparative period presented. Lessees and lessors may not apply a full retrospective transition approach. We are assessing the impact that ASU 2016-02 is anticipated to have on our consolidated financial statements. We currently expect that most of our operating lease commitments will be subject to the new standard and recognized as lease liabilities and right-of-use assets upon our adoption of ASU 2016-02.
In January 2016, the FASB issued ASU No. 2016-01,
Financial Instruments - Overall: Recognition and Measurement of Financial Assets and Financial Liabilities
, which amends the guidance regarding the classification and measurement of financial instruments. Changes to the current guidance primarily affect the accounting for equity investments, financial liabilities under the fair value option, and the presentation and disclosure requirements for financial instruments. In addition, ASU 2016-01 clarifies guidance related to the valuation allowance assessment when recognizing deferred tax assets resulting from unrealized losses on available-for-sale debt securities. ASU 2016-01 became effective for us on January 1, 2018. Upon adoption of ASU 2016-01, an entity should apply the amendments by means of a cumulative-effect adjustment to the balance sheet at the beginning of the first reporting period in which the guidance is effective. We do not presently believe the application of ASU 2016-01 will have a material impact on our financial statements.
In May 2014, the FASB issued ASU No. 2014-09,
Revenue from Contracts with Customers (Topic 606)
, to update the financial reporting requirements for revenue recognition. Topic 606 outlines a single comprehensive model for entities to use in accounting for revenue arising from contracts with customers and supersedes most current revenue recognition guidance, including industry-specific guidance. The guidance is based on the principle that an entity should recognize revenue to depict the transfer of goods or services to customers in an amount that reflects the consideration to which the entity expects to be entitled in exchange for those goods or services. The guidance also requires additional disclosure about the nature, amount, timing and uncertainty of
64
revenue and cash flows arising from customer contracts, including significant judgments and changes in judgments and assets recognized from costs incurred to fulfill a contract. This guidance became effective for us beginning on January 1, 2018, and entities have the option of using either a full retrospective or a modified retrospective approach for the adoption of the new standard. We adopted this standard using the modified retrospective approach on January 1, 2018.
In preparation for adoption of the standard, we have implemented internal controls and completed our impact assessment of implementing this guidance. We have evaluated each of the five steps in Topic 606, which are as follows: 1) Identify the contract with the customer; 2) Identify the performance obligations in the contract; 3) Determine the transaction price; 4) Allocate the transaction price to the performance obligations; and 5) Recognize revenue when (or as) performance obligations are satisfied.
We do not expect reported revenue to be affected materially in any period due to the adoption of ASC Topic 606 because: (1) we expect to identify similar performance obligations under ASC Topic 606 as compared with deliverables and separate units of account previously identified; (2) we have determined the transaction price to be consistent; and (3) we record revenue at the same point in time, upon shipment or delivery under both ASC Topic 605 and ASC Topic 606, as applicable under the terms of the contract with the customer. Additionally, we do not expect the accounting for fulfillment costs or costs incurred to obtain a contract to be affected materially in any period due to the adoption of Topic 606.
There are also certain considerations related to accounting policies, business processes and internal control over financial reporting that are associated with implementing Topic 606. We have evaluated our policies, processes, and control framework for revenue recognition, and identified and implemented the changes needed in response to the new guidance.
Lastly, disclosure requirements under the new guidance in Topic 606 have been significantly expanded in comparison to the disclosure requirements under the current guidance, including disclosures related to disaggregation of revenue into appropriate categories, performance obligations, the judgments made in revenue recognition determinations, adjustments to revenue which relate to activities from previous quarters or years, any significant reversals of revenue, and costs to obtain or fulfill contracts. We have designed and implemented the appropriate controls over gathering and reporting the information as required under Topic 606, in order to support the expanded disclosure requirements.
All other issued and not yet effective accounting standards are not relevant to our financial statements.
2. ACQUISITIONS
On October 2, 2017 we acquired a custom procedure pack business located in Melbourne, Australia from ITL Healthcare Pty Ltd. ("ITL"), for an aggregate purchase price of
$11.3 million
. We accounted for this acquisition as a business combination. The following table summarizes the aggregate purchase price allocated to the assets acquired from ITL (in thousands):
|
Assets Acquired
|
||||
|
Trade receivables
|
$
|
1,287
|
|
|
|
Other receivables
|
56
|
|
||
|
Inventories
|
1,808
|
|
||
|
Prepaid expenses and other assets
|
65
|
|
||
|
Property and equipment
|
1,053
|
|
||
|
Intangibles
|
||||
|
Customer lists
|
5,940
|
|
||
|
Goodwill
|
3,740
|
|
||
|
Total assets acquired
|
13,949
|
|
||
|
Liabilities Assumed
|
||||
|
Trade payables
|
(216
|
)
|
||
|
Accrued expenses
|
(542
|
)
|
||
|
Deferred tax liabilities
|
(1,901
|
)
|
||
|
Total liabilities assumed
|
(2,659
|
)
|
||
|
Total net assets acquired
|
$
|
11,290
|
|
|
65
We are amortizing the customer list on an accelerated basis over
seven years
. Acquisition-related costs associated with the ITL acquisition, which are included in selling, general and administrative expenses in the accompanying consolidated statements of income, were not material. The results of operations related to this acquisition have been included in our cardiovascular segment since the acquisition date. During the year ended
December 31, 2017
, our net sales of ITL products were approximately
$3.3 million
. It is not practical to separately report the earnings related to the ITL acquisition, as we cannot split out sales costs related solely to the products we acquired from ITL, principally because our sales representatives sell multiple products (including the products we acquired from ITL) in our cardiovascular business segment.
On September 1, 2017, we acquired intellectual property rights associated with a steerable guidewire system from IntelliMedical Technologies Pty. Ltd. ("IntelliMedical"). We made an initial payment of approximately
$11.9 million
in September 2017, and we are obligated to pay up to an additional
A$15.0 million
(Australian dollars) if certain milestones set forth in the share purchase agreement with IntelliMedical are achieved. We are also required to pay royalties equal to
6%
of net sales, commencing upon the first commercial sale of the product and throughout the term of the applicable patents. We accounted for this transaction as an asset purchase. The initial payment has been included in the accompanying consolidated statements of income as acquired in-process research and development expense for the year ended
December 31, 2017
, because both technological feasibility of the underlying research and development project had not yet been reached and such technology had no identified future alternative use as of the date of acquisition.
On August 4, 2017 we acquired from Laurane Medical S.A.S. ("Laurane") and its shareholders inventories and the intellectual property rights associated with certain manual bone biopsy devices, manual bone marrow needles and muscle biopsy kits for an aggregate purchase price of
$16.5 million
. We also recorded a contingent consideration liability of
$5.5 million
related to royalties potentially payable to Laurane's shareholders pursuant to the terms of an intellectual property purchase agreement. We accounted for this acquisition as a business combination. The following table summarizes the aggregate purchase price (including contingent royalty payment liabilities) allocated to the assets acquired from Laurane (in thousands):
|
Net Assets Acquired
|
||||
|
Inventories
|
$
|
594
|
|
|
|
Intangibles
|
||||
|
Developed technology
|
14,920
|
|
||
|
Customer list
|
120
|
|
||
|
Goodwill
|
6,366
|
|
||
|
Total net assets acquired
|
$
|
22,000
|
|
|
We are amortizing the developed technology intangible asset over
12 years
and the customer list on an accelerated basis over
one year
. The total weighted-average amortization period for these acquired intangible assets is
11.9 years
. The sales and results of operations related to the acquisition have been included in our cardiovascular segment since the acquisition date and were not material. Acquisition-related costs associated with the Laurane acquisition, which are included in selling, general and administrative expenses in the accompanying consolidated statements of income, were not material.
On July 3, 2017, we acquired from Osseon LLC (“Osseon”) substantially all the assets related to Osseon’s vertebral augmentation products. We accounted for this acquisition as a business combination. The purchase price for the assets was approximately
$6.8 million
. Acquisition-related costs associated with the Osseon acquisition, which are included in selling, general and administrative expenses in the accompanying consolidated statements of income, were not material. The results of operations related to this acquisition have been included in our cardiovascular segment since the acquisition date. During the year ended
December 31, 2017
, our net sales of Osseon products were approximately
$942,000
. It is not practical to separately report the earnings related to the Osseon acquisition, as we cannot split out sales costs related solely to the products we acquired from Osseon, principally because our sales representatives sell multiple products (including the products we acquired from Osseon) in our cardiovascular business segment. The following table summarizes the preliminary purchase price allocated to the net assets acquired (in thousands):
66
|
Net Assets Acquired
|
||||
|
Inventories
|
$
|
979
|
|
|
|
Property and equipment
|
58
|
|
||
|
Intangibles
|
||||
|
Developed technology
|
5,400
|
|
||
|
Customer list
|
200
|
|
||
|
Goodwill
|
203
|
|
||
|
Total net assets acquired
|
$
|
6,840
|
|
|
We are amortizing the developed technology intangible asset over
nine years
and customer lists on an accelerated basis over
eight years
. The total weighted-average amortization period for these acquired intangible assets is approximately
9.0 years
.
On July 1, 2017, we entered into an exclusive license agreement with Pleuratech ApS ("Pleuratech") to acquire the rights to manufacture and sell the KatGuide
TM
chest tube insertion tool. As of
December 31, 2017
, we had paid
$2.0 million
in connection with this agreement. We are obligated to pay an additional
$5.0 million
if certain milestones set forth in the license agreement are met. We are also required to pay royalties equal to
6%
of net sales throughout the term of the license agreement. We accounted for this transaction as an asset purchase. We recorded the amount paid upon closing as a license agreement intangible asset, which we intend to amortize over
15 years
.
On June 16, 2017, we acquired from Lazarus Medical Technologies, LLC the patent rights and other intellectual property related to the Repositionable Chest Tube
TM
and related devices. As of
December 31, 2017
, we had paid
$570,000
in connection with this agreement. We are also obligated to pay an additional
$750,000
if certain milestones set forth in the purchase agreement are met. We are also required to pay royalties equal to
6%
of net sales throughout the term of the purchase agreement. We accounted for this transaction as an asset purchase. We recorded the amount paid upon closing as a license agreement intangible asset, which we intend to amortize over
15 years
.
On May 23, 2017, we paid
$2.5 million
to acquire
182,000
shares of preferred stock of Fusion Medical, Inc. ("Fusion"), a developer of medical devices designed primarily for clot removal. The shares of preferred stock we acquired, which represent an ownership interest of approximately
19.5%
, have been accounted for as an equity method investment of
$2.5 million
reflected within other assets in the accompanying consolidated balance sheets because we may be deemed to exercise significant influence over the operations of Fusion.
On May 19, 2017, we terminated our distribution agreement with Sheen Man Co., Ltd. and Sugan Co, Ltd., ("Sugan"), a Japanese medical device distributor and entered into a business purchase agreement, distribution agreement and a supply agreement with Sugan. Pursuant to these agreements, we acquired the customer list Sugan used in the distribution of our products in Japan. The purchase price is recorded as a customer list intangible asset of approximately
$1.2 million
. We intend to amortize the customer list intangible asset on an accelerated basis over
five years
. In addition, we granted to Sugan the right to continue to distribute a limited number of our products, related to fluid administration, through December 31, 2021 and to manufacture and sell to Sugan certain contrast injector products during a term of
four
years, subject to extensions.
On May 1, 2017, we entered into an agreement and plan of merger with Vascular Access Technologies, Inc. ("VAT"), pursuant to which we acquired the SAFECVAD™ device. We accounted for this acquisition as a business combination. The purchase price for the business was
$5.0 million
. We also recorded
$4.9 million
of contingent consideration related to royalties potentially payable to VAT pursuant to the merger agreement. The following table summarizes the preliminary purchase price allocated to the net assets acquired and liabilities assumed (in thousands):
67
|
Preliminary Allocation
|
Adjustments
(1)
|
Revised Allocation
|
||||||||||
|
Net Assets Acquired
|
||||||||||||
|
Intangibles
|
||||||||||||
|
Developed technology
|
$
|
7,800
|
|
$
|
—
|
|
$
|
7,800
|
|
|||
|
In-process technology
|
850
|
|
70
|
|
920
|
|
||||||
|
Goodwill
|
4,323
|
|
(42
|
)
|
4,281
|
|
||||||
|
Deferred tax liabilities
|
(3,073
|
)
|
(28
|
)
|
(3,101
|
)
|
||||||
|
Total net assets acquired
|
$
|
9,900
|
|
$
|
—
|
|
$
|
9,900
|
|
|||
|
(1)
|
Under U.S. GAAP, measurement period adjustments are recognized on a prospective basis in the period of change, instead of restating prior periods. There was no impact to reported earnings in connection with these measurement period adjustments for the periods presented. Amounts represent adjustments to the preliminary purchase price allocation first presented in our Quarterly Report on Form 10-Q for the quarter ended June 30, 2017 resulting from our ongoing activities, including reassessment of the assets acquired and liabilities assumed, with respect to finalizing our purchase price allocation for this acquisition.
|
|||||||||||
We are amortizing the developed technology intangible asset over
15 years
. The sales and results of operations related to the acquisition have been included in our cardiovascular segment since the acquisition date and were not material. Acquisition-related costs associated with the VAT acquisition, which are included in selling, general and administrative expenses in the accompanying consolidated statements of income, were not material.
On January 31, 2017, we acquired Argon’s critical care division, including a manufacturing facility in Singapore, the related commercial operations in Europe and Japan, and certain inventories and intellectual property rights within the United States. We made an initial payment of approximately
$10.9 million
and received a subsequent reduction to the purchase price of approximately
$797,000
related to a working capital adjustment according to the terms of the purchase agreement. We accounted for the acquisition as a business combination.
Acquisition-related costs associated with the acquisition of the Argon critical care division during the year ended
December 31, 2017
, which are included in selling, general and administrative expenses in the accompanying consolidated statements of income, were approximately
$2.6 million
. The results of operations related to this acquisition have been included in our cardiovascular segment since the acquisition date. During the year ended
December 31, 2017
, our net sales of the Argon critical care products were approximately
$41.2 million
. It is not practical to separately report the earnings related to the Argon critical care acquisition, as we cannot split out sales costs related solely to the products we acquired from Argon, principally because our sales representatives sell multiple products (including the products we acquired from Argon) in our cardiovascular business segment.
The assets and liabilities in the purchase price allocation for the Argon critical care acquisition are stated at fair value based on estimates of fair value using available information and making assumptions our management believes are reasonable. The following table summarizes the preliminary purchase price allocated to the net tangible and intangible assets acquired and liabilities assumed (in thousands), adjusted as of
December 31, 2017
:
68
|
Preliminary Allocation
|
Adjustments
(2)
|
Revised Allocation
|
||||||||||
|
Assets Acquired
|
||||||||||||
|
Cash and cash equivalents
|
$
|
1,436
|
|
$
|
—
|
|
$
|
1,436
|
|
|||
|
Trade receivables
|
8,351
|
|
—
|
|
8,351
|
|
||||||
|
Inventories
|
12,217
|
|
(995
|
)
|
11,222
|
|
||||||
|
Prepaid expenses and other assets
|
1,275
|
|
—
|
|
1,275
|
|
||||||
|
Income tax refund receivable
|
—
|
|
165
|
|
165
|
|
||||||
|
Property and equipment
|
2,667
|
|
(348
|
)
|
2,319
|
|
||||||
|
Deferred tax assets
|
184
|
|
18
|
|
202
|
|
||||||
|
Intangibles
|
||||||||||||
|
Developed technology
|
2,600
|
|
(400
|
)
|
2,200
|
|
||||||
|
Customer lists
|
1,300
|
|
200
|
|
1,500
|
|
||||||
|
Trademarks
|
1,500
|
|
(600
|
)
|
900
|
|
||||||
|
Total assets acquired
|
31,530
|
|
(1,960
|
)
|
29,570
|
|
||||||
|
Liabilities Assumed
|
||||||||||||
|
Trade payables
|
(2,306
|
)
|
(108
|
)
|
(2,414
|
)
|
||||||
|
Accrued expenses
|
(5,083
|
)
|
—
|
|
(5,083
|
)
|
||||||
|
Income taxes payable
|
(2
|
)
|
2
|
|
—
|
|
||||||
|
Deferred income tax liabilities
|
(999
|
)
|
65
|
|
(934
|
)
|
||||||
|
Total liabilities assumed
|
(8,390
|
)
|
(41
|
)
|
(8,431
|
)
|
||||||
|
Total net assets acquired
|
23,140
|
|
(2,001
|
)
|
21,139
|
|
||||||
|
Gain on bargain purchase
(1)
|
(12,243
|
)
|
1,204
|
|
(11,039
|
)
|
||||||
|
Total purchase price
|
$
|
10,897
|
|
$
|
(797
|
)
|
$
|
10,100
|
|
|||
|
(1)
|
The total fair value of the net assets acquired from Argon exceeded the purchase price, resulting in a gain on bargain purchase which was recorded within other income (expense) in our consolidated statements of income, and includes a negative adjustment of $1.2 million since the bargain purchase gain was first presented in our Quarterly Report on Form 10-Q for the quarter ended March 31, 2017. We believe the reason for the gain on bargain purchase was a result of the divestiture of a non-strategic, slow-growth critical care business for Argon. It is our understanding that the divestiture allows Argon to focus on its higher growth interventional portfolio.
|
|||||||||||
|
(2)
|
Under U.S. GAAP, measurement period adjustments are recognized on a prospective basis in the period of change, instead of restating prior periods. There was no impact to reported earnings in connection with these measurement period adjustments for the periods presented. Amounts represent adjustments to the preliminary purchase price allocation first presented in our March 31, 2017 Form 10-Q resulting from our ongoing activities, including reassessment of the assets acquired and liabilities assumed, with respect to finalizing our purchase price allocation for this acquisition.
|
|||||||||||
With respect to the Argon critical care assets, we are amortizing developed technology over
seven years
and customer lists on an accelerated basis over
five years
. While U.S. trademarks can be renewed indefinitely, we currently estimate that we will generate cash flow from the acquired trademarks for a period of
five years
from the acquisition date. The total weighted-average amortization period for these acquired intangible assets is
6.0 years
.
On January 31, 2017, we acquired substantially all the assets, including intellectual property covered by approximately
40
patents and pending applications, and assumed certain liabilities, of Catheter Connections, Inc. (“Catheter Connections”), in exchange for payment of
$38.0 million
. Catheter Connections, based in Salt Lake City, Utah, developed and marketed the DualCap® System, an innovative family of disinfecting products designed to protect patients from intravenous infections resulting from infusion therapy. We accounted for this acquisition as a business combination.
Acquisition-related costs associated with the Catheter Connections acquisition during the year ended
December 31, 2017
, which are included in selling, general and administrative expenses in the accompanying consolidated statements of income, were approximately
$482,000
. The results of operations related to this acquisition have been included in our cardiovascular segment since the acquisition date. During the year ended
December 31, 2017
, our net sales of the products acquired from Catheter Connections were approximately
$10.0 million
. It is not practical to separately report the earnings related to the products acquired from Catheter Connections, as we cannot split out sales costs related solely to those products, principally because our sales
69
representatives sell multiple products (including the DualCap System) in the cardiovascular business segment. The purchase price was preliminarily allocated as follows (in thousands):
|
Preliminary Allocation
|
Adjustments
(1)
|
Revised Allocation
|
||||||||||
|
Assets Acquired
|
||||||||||||
|
Trade receivables
|
$
|
952
|
|
$
|
6
|
|
$
|
958
|
|
|||
|
Inventories
|
2,244
|
|
(87
|
)
|
2,157
|
|
||||||
|
Prepaid expenses and other assets
|
181
|
|
(96
|
)
|
85
|
|
||||||
|
Property and equipment
|
1,472
|
|
—
|
|
1,472
|
|
||||||
|
Intangibles
|
||||||||||||
|
Developed technology
|
22,900
|
|
(1,800
|
)
|
21,100
|
|
||||||
|
Customer lists
|
100
|
|
600
|
|
700
|
|
||||||
|
Trademarks
|
2,900
|
|
—
|
|
2,900
|
|
||||||
|
Goodwill
|
7,612
|
|
1,377
|
|
8,989
|
|
||||||
|
Total assets acquired
|
38,361
|
|
—
|
|
38,361
|
|
||||||
|
Liabilities Assumed
|
||||||||||||
|
Trade payables
|
(338
|
)
|
—
|
|
(338
|
)
|
||||||
|
Accrued expenses
|
(23
|
)
|
—
|
|
(23
|
)
|
||||||
|
Total liabilities assumed
|
(361
|
)
|
—
|
|
(361
|
)
|
||||||
|
Net assets acquired
|
$
|
38,000
|
|
$
|
—
|
|
$
|
38,000
|
|
|||
|
(1)
|
Under U.S. GAAP, measurement period adjustments are recognized on a prospective basis in the period of change, instead of restating prior periods. There was no impact to reported earnings in connection with these measurement period adjustments for the periods presented. Amounts represent adjustments to the preliminary purchase price first presented in our Quarterly Report on Form 10-Q for the Quarter Ended March 31, 2017, resulting from activities with respect to finalizing our purchase price allocation for this acquisition. The larger adjustments primarily relate to the valuation of the acquired intangible assets.
|
|||||||||||
We are amortizing the Catheter Connections developed technology asset over
12 years
, the related trademarks over
10 years
, and the associated customer list over
eight years
. We have estimated the weighted average life of the intangible Catheter Connections assets acquired to be approximately
11.7 years
.
On December 19, 2016, we paid
$5.0 million
for
1,251,878
shares of common stock and a distribution agreement with Bluegrass Vascular Technologies, Inc. ("Bluegrass"). The common stock, which represents an ownership interest of approximately
19.5%
, has been accounted for as a cost method investment of
$4.0 million
reflected within other assets in the accompanying consolidated balance sheets because we are not able to exercise significant influence over the operations of Bluegrass. The distribution agreement intangible asset was valued at
$1.0 million
and will be amortized over a period of
three years
.
On July 6, 2016, we acquired all of the issued and outstanding shares of DFINE Inc. ("DFINE"). The DFINE acquisition added a line of vertebral augmentation products for the treatment of vertebral compression fractures ("VCF") as well as medical devices used to treat metastatic spine tumors. We made an initial payment of
$97.5 million
to certain DFINE stockholders on July 6, 2016 and paid approximately
$578,000
related to a net working capital adjustment subject to review by Merit and the preferred stockholders of DFINE. We accounted for the acquisition as a business combination. In the three-month period ended December 31, 2016, we negotiated the final net working capital adjustment resulting in a reduction to the purchase price of approximately
$1.1 million
. As a result, we recorded measurement period adjustments to reduce inventories by approximately
$89,000
, reduce property and equipment by approximately
$109,000
, reduce goodwill by approximately
$1.2 million
, reduce accrued expenses by approximately
$407,000
and increase the associated deferred tax liabilities by approximately
$113,000
. Under U.S. GAAP, measurement period adjustments are recognized on a prospective basis in the period of change, instead of restating prior periods. There was no impact to reported earnings in connection with these measurement period adjustments.
Acquisition-related costs during the year ended December 31, 2016, which are included in selling, general, and administrative expenses in the accompanying consolidated statements of income, were approximately
$1.6 million
. The results of operations related to this acquisition have been included in our cardiovascular segment since the acquisition date. During the years ended December 31, 2017 and 2016, our net sales of DFINE products were approximately
$27.0 million
and
$13.5 million
, respectively. It is not practical to separately report the earnings related to the DFINE acquisition, as we cannot split out sales costs related to
70
DFINE products, principally because our sales representatives are selling multiple products (including DFINE products) in the cardiovascular business segment.
The purchase price was allocated to the net tangible and intangible assets acquired and liabilities assumed, based on estimated fair values, as follows (in thousands):
|
Assets Acquired
|
|||
|
Trade receivables
|
$
|
4,054
|
|
|
Other receivables
|
6
|
|
|
|
Inventories
|
8,585
|
|
|
|
Prepaid expenses
|
630
|
|
|
|
Property and equipment
|
1,630
|
|
|
|
Other long-term assets
|
145
|
|
|
|
Intangibles
|
|||
|
Developed technology
|
67,600
|
|
|
|
Customer lists
|
2,400
|
|
|
|
Trademarks
|
4,400
|
|
|
|
Goodwill
|
24,818
|
|
|
|
Total assets acquired
|
114,268
|
|
|
|
Liabilities Assumed
|
|||
|
Trade payables
|
(1,790
|
)
|
|
|
Accrued expenses
|
(5,298
|
)
|
|
|
Deferred income tax liabilities - current
|
(701
|
)
|
|
|
Deferred income tax liabilities - noncurrent
|
(10,844
|
)
|
|
|
Total liabilities assumed
|
(18,633
|
)
|
|
|
Net assets acquired, net of cash received of $1,327
|
$
|
95,635
|
|
The gross amount of trade receivables we acquired in the acquisition was approximately
$4.3 million
, of which approximately
$224,000
was expected to be uncollectible or returned. With respect to the DFINE assets, we are amortizing developed technology over
15 years
and customer lists on an accelerated basis over
nine
years. While U.S. trademarks can be renewed indefinitely, we currently estimate that we will generate cash flow from the acquired trademarks for a period of
15 years
from the acquisition date. The total weighted-average amortization period for these acquired intangible assets is
14.8 years
.
On February 4, 2016, we purchased the HeRO® Graft device and other related assets from CryoLife, Inc., a developer of medical devices based in Kennesaw, Georgia ("CryoLife"). The HeRO Graft is a fully subcutaneous vascular access system intended for use in maintaining long-term vascular access for chronic hemodialysis patients who have failing fistulas, grafts or are catheter dependent due to a central venous blockage. The purchase price was
$18.5 million
, which was paid in full during 2016. We accounted for this acquisition as a business combination. The purchase price was allocated as follows (in thousands):
|
Assets Acquired
|
|||
|
Inventories
|
$
|
2,455
|
|
|
Property and equipment
|
290
|
|
|
|
Intangibles
|
|||
|
Developed technology
|
12,100
|
|
|
|
Trademarks
|
700
|
|
|
|
Customers Lists
|
400
|
|
|
|
Goodwill
|
2,555
|
|
|
|
Total assets acquired
|
$
|
18,500
|
|
We are amortizing the developed HeRO Graft technology asset over
10 years
, the related trademarks over
5.5
years, and the associated customer lists over
12
years. We have estimated the weighted average life of the intangible HeRO Graft assets acquired
71
to be approximately
9.8
years. Acquisition-related costs related to the HeRO Graft device and other related assets during the year ended December 31, 2016, which are included in selling, general and administrative expenses in the accompanying consolidated statements of income, were not material. The results of operations related to this acquisition have been included in our cardiovascular segment since the acquisition date. During the years ended December 31, 2017 and 2016, our net sales of the products acquired from CryoLife were approximately
$8.6 million
and
$7.1 million
, respectively. It is not practical to separately report the earnings related to the products acquired from CryoLife, as we cannot split out sales costs related to those products, principally because our sales representatives are selling multiple products (including the HeRO Graft device) in the cardiovascular business segment.
During 2016, we paid approximately
$3.0 million
for
3,000,000
preferred limited liability company units of Cagent Vascular, LLC, a medical device company ("Cagent"), which represents a current ownership interest of approximately
18.1%
and has been accounted for as a cost method investment reflected within other assets in the accompanying consolidated balance sheets because we are not able to exercise significant influence over the operations of Cagent.
On December 4, 2015, we entered into a license agreement with ArraVasc Limited, an Irish medical device company, for the right to manufacture and sell certain percutaneous transluminal angioplasty balloon catheter products. As of December 31, 2016, we had paid
$2 million
in connection with the agreement. During the year ended December 31, 2017, we paid an additional
$500,000
. There are no additional payments due under this agreement. We accounted for the transaction as an asset purchase and are amortizing the license agreement intangible asset over a period of
12 years
.
On September 29, 2015, we entered into a license agreement with Blockade Medical, LLC, a Delaware limited liability company ("Blockade"), for rights to manufacture, market and sell a set of endovascular embolization products. As part of the agreement, we paid
$1.7 million
during the year ended December 31, 2015 and, in lieu of any additional payment, we converted the cost method investment in Blockade of
$1.0 million
we had previously recorded, toward the purchase price of the license. We recorded
$2.7 million
to a license agreement intangible asset, which we intend to amortize over
10 years
.
On August 19, 2015, we purchased
116,279
shares of Series A Preferred Stock of Xablecath, Inc., a Delaware corporation ("Xablecath"), for an aggregate price of approximately
$300,000
. During the three months ended December 31, 2017, we paid
$247,500
for
656,848
shares of Series B Preferred Stock of Xablecath. Our ownership interest in Xablecath is approximately
15.9%
and is accounted for as a cost-method investment reflected within other assets in the accompanying consolidated balance sheets. Xablecath is developing an over-the-wire crossing catheter.
On July 17, 2015, we entered into an asset purchase agreement with LeMaitre Vascular, Inc., a Delaware corporation ("LeMaitre"), for rights to the Unballoon® non-occlusive modeling catheter. We accounted for the transaction as an asset purchase. The full purchase price of
$400,000
was paid as of December 31, 2015, and the purchase price was recorded as a developed technology intangible asset, which we are amortizing over a period of
10 years
.
On July 14, 2015, we entered into an asset purchase agreement with Quellent, LLC, a California limited liability company ("Quellent"), for superabsorbent pad technology. The purchase price for the asset was
$1.0 million
, payable in two installments. We accounted for this acquisition as a business combination. The first payment of
$500,000
was paid as of December 31, 2015, and the second payment of
$500,000
was recorded as an accrued liability as of December 31, 2015 and paid in the first quarter of 2016. We also recorded
$270,000
of contingent consideration related to royalties payable to Quellent pursuant to the asset purchase agreement. The sales and results of operations related to this acquisition have been included in our cardiovascular segment since the acquisition date and were not material. The purchase price was allocated as follows:
$1.21 million
to a developed technology intangible asset and
$60,000
to goodwill. We are amortizing the developed technology intangible asset over
13 years
.
On July 1, 2015, we entered into an agreement with Catch Medical, LLC, a Utah limited liability company ("Catch Medical"), to purchase rights to a steerable snare. We expensed the full purchase price of
$1.0 million
to in-process research and development during the year ended December 31, 2015, because the initial costs of in-process research and development acquired in this asset purchase do not have an alternative future use. These costs include payments incurred prior to regulatory approval in connection with acquired research and development projects that provide rights to develop, manufacture, market and sell products. As of
December 31, 2017
, we have paid cash of
$600,000
, have a current liability recorded in accrued expenses of
$200,000
for the payment that will be due in less than a year and have a long-term obligation of
$200,000
recorded for the payments that will be due in over a year.
On July 1, 2015, we entered into a license agreement with Distal Access, LLC, a Utah limited liability company ("Distal"), for guidewire controller technology. We made a payment of
$3.5 million
upon the closing of the agreement during the year ended December 31, 2015. We accounted for this acquisition as an asset purchase. We recorded the purchase price to a license agreement intangible asset of
$3.5 million
, which we are amortizing over a period of
six years
.
72
On March 26, 2015, we entered into an asset purchase agreement with Teleflex Incorporated, a Delaware corporation ("Teleflex"). We accounted for the transaction as an asset purchase. During the year ended December 31, 2015, we paid
$400,000
to acquire the asset, which we recorded as a customer list intangible asset. We paid an additional
$400,000
in the year-ended December 31, 2016, which was recorded to the customer list intangible asset, because Teleflex met certain obligations under the agreement. There are no additional payments due under this agreement. We are amortizing the asset over a period of
five years
.
The following table summarizes our consolidated results of operations for the years ended December 31, 2017, 2016 and 2015, as well as unaudited pro forma consolidated results of operations as though the DFINE acquisition had occurred on January 1, 2015 and the acquisition of the Argon critical care division had occurred on January 1, 2016 (in thousands, except per common share amounts):
|
2017
|
2016
|
2015
|
|||||||||||||||||||||
|
As Reported
|
Pro Forma
|
As Reported
|
Pro Forma
|
As Reported
|
Pro Forma
|
||||||||||||||||||
|
Net sales
|
$
|
727,852
|
|
$
|
730,612
|
|
$
|
603,838
|
|
$
|
664,366
|
|
$
|
542,149
|
|
$
|
575,541
|
|
|||||
|
Net income
|
27,523
|
|
17,419
|
|
20,121
|
|
23,068
|
|
23,802
|
|
3,135
|
|
|||||||||||
|
Earnings per common share:
|
|||||||||||||||||||||||
|
Basic
|
$
|
0.56
|
|
$
|
0.36
|
|
$
|
0.45
|
|
$
|
0.52
|
|
$
|
0.54
|
|
$
|
0.07
|
|
|||||
|
Diluted
|
$
|
0.55
|
|
$
|
0.35
|
|
$
|
0.45
|
|
$
|
0.51
|
|
$
|
0.53
|
|
$
|
0.07
|
|
|||||
The unaudited pro forma information set forth above is for informational purposes only and includes adjustments related to the
step-up of acquired inventories, amortization expense of acquired intangible assets, interest expense on long-term debt and changes in the timing of the recognition of the gain on bargain purchase. The pro forma information should not be considered indicative of actual results that would have been achieved if the DFINE acquisition had occurred on January 1, 2015 and the acquisition of the Argon critical care division had occurred on January 1, 2016, or results that may be obtained in any future period. The proforma consolidated results of operations do not include the ITL, Laurane, Osseon, VAT, Catheter Connections, HeRO Graft or Quellent acquisitions as we do not deem the pro forma effect of these transactions to be material.
The goodwill arising from the acquisitions discussed above consists largely of the synergies and economies of scale we hope to achieve from combining the acquired assets and operations with our historical operations (see Note 4). The goodwill recognized from certain acquisitions is expected to be deductible for income tax purposes.
73
3. INVENTORIES
Inventories at
December 31, 2017
and
2016
, consisted of the following (in thousands):
|
|
2017
|
2016
|
|||||
|
Finished goods
|
$
|
86,555
|
|
$
|
63,852
|
|
|
|
Work-in-process
|
12,799
|
|
11,008
|
|
|||
|
Raw materials
|
55,934
|
|
45,835
|
|
|||
|
Total
|
$
|
155,288
|
|
$
|
120,695
|
|
|
4. GOODWILL AND INTANGIBLE ASSETS
The changes in the carrying amount of goodwill for the years ended
December 31, 2017
and
2016
, are as follows (in thousands):
|
|
2017
|
2016
|
|||||
|
Goodwill balance at January 1
|
$
|
211,927
|
|
$
|
184,472
|
|
|
|
Effect of foreign exchange
|
2,641
|
|
82
|
|
|||
|
Additions as the result of acquisitions
|
23,579
|
|
27,373
|
|
|||
|
Goodwill balance at December 31
|
$
|
238,147
|
|
$
|
211,927
|
|
|
As of
December 31, 2017
, we had recorded
$8.3 million
of accumulated goodwill impairment charges. All of the goodwill balance as of
December 31, 2017
and
2016
, is related to our cardiovascular segment.
Other intangible assets at
December 31, 2017
and
2016
, consisted of the following (in thousands):
|
|
2017
|
||||||||||
|
Gross Carrying
Amount
|
Accumulated
Amortization
|
Net Carrying
Amount
|
|||||||||
|
Patents
|
$
|
16,528
|
|
$
|
(3,737
|
)
|
$
|
12,791
|
|
||
|
Distribution agreements
|
7,262
|
|
(4,686
|
)
|
2,576
|
|
|||||
|
License agreements
|
23,783
|
|
(5,568
|
)
|
18,215
|
|
|||||
|
Trademarks
|
16,224
|
|
(4,686
|
)
|
11,538
|
|
|||||
|
Covenants not to compete
|
1,028
|
|
(968
|
)
|
60
|
|
|||||
|
Customer lists
|
31,935
|
|
(18,482
|
)
|
13,453
|
|
|||||
|
In-process technology
|
920
|
|
—
|
|
920
|
|
|||||
|
Total
|
$
|
97,680
|
|
$
|
(38,127
|
)
|
$
|
59,553
|
|
||
|
|
2016
|
||||||||||
|
Gross Carrying
Amount
|
Accumulated
Amortization
|
Net Carrying
Amount
|
|||||||||
|
Patents
|
$
|
14,130
|
|
$
|
(3,165
|
)
|
$
|
10,965
|
|
||
|
Distribution agreements
|
6,626
|
|
(3,527
|
)
|
3,099
|
|
|||||
|
License agreements
|
20,695
|
|
(3,422
|
)
|
17,273
|
|
|||||
|
Trademarks
|
12,380
|
|
(3,330
|
)
|
9,050
|
|
|||||
|
Covenants not to compete
|
1,028
|
|
(936
|
)
|
92
|
|
|||||
|
Customer lists
|
22,261
|
|
(15,401
|
)
|
6,860
|
|
|||||
|
Royalty agreements
|
267
|
|
(267
|
)
|
—
|
|
|||||
|
Total
|
$
|
77,387
|
|
$
|
(30,048
|
)
|
$
|
47,339
|
|
||
74
Aggregate amortization expense for the years ended
December 31, 2017
,
2016
and
2015
was approximately
$26.8 million
,
$19.3 million
and
$14.8 million
, respectively.
We evaluate long-lived assets, including amortizing intangible assets, for impairment whenever events or changes in circumstances indicate that their carrying amounts may not be recoverable. We perform the impairment analysis at the asset group for which the lowest level of identifiable cash flows are largely independent of the cash flows of other assets and liabilities. During the fourth quarter of 2017, we compared the carrying value of the amortizing intangible assets acquired in our July 2015 acquisition of certain assets from Distal Access, LLC, all of which pertained to our cardiovascular segment, to the undiscounted cash flows expected to result from the asset group and determined that the carrying amount was not recoverable. We then determined the fair value of the amortizing assets related to the Distal Access acquisition based on estimated future cash flows discounted back to their present value using a discount rate that reflects the risk profiles of the underlying activities. Some of the factors that influenced our estimated cash flows were slower than anticipated sales growth in the products acquired from our Distal Access acquisition and uncertainty about future sales growth. The excess of the carrying value compared to the fair value was recognized as an intangible asset impairment charge. We recorded an impairment charge for Distal Access of approximately
$809,000
. We did
no
t record any impairment charges during the years ended December 31, 2016 and 2015.
Estimated amortization expense for the developed technology and other intangible assets for the next five years consists of the following as of
December 31, 2017
(in thousands):
|
Year Ending December 31
|
|
||
|
2018
|
$
|
30,413
|
|
|
2019
|
29,787
|
|
|
|
2020
|
28,373
|
|
|
|
2021
|
21,001
|
|
|
|
2022
|
19,396
|
|
|
5. INCOME TAXES
On December 22, 2017, U.S. federal tax legislation, commonly referred to as the Tax Cuts and Jobs Act (“TCJA”) was signed into law. Significant provisions that have impacted (and will in the future impact) our effective tax rate include the reduction in the corporate tax rate from 35% to 21%, effective in 2018; a one-time deemed repatriation (“transition tax”) on earnings of certain foreign subsidiaries that were previously tax deferred; and new taxes on certain foreign sourced earnings. At December 31, 2017, we had not completed our accounting for the tax effects of the TCJA; however, in certain cases, as described below, we have made reasonable estimates of the effects on our existing deferred tax balances and impact of the one-time transition tax. In accordance with SEC Staff Accounting Bulletin 118 (“SAB 118”), income tax effects of the TCJA may be refined upon obtaining, preparing, and/or analyzing additional information during the measurement period and such changes could be material. During the measurement period, provisional amounts may also be adjusted for the effects, if any, of interpretative guidance issued after December 31, 2017, by U.S. regulatory and standard-setting bodies. For the items for which we were able to determine a reasonable estimate, we recognized the following provisional impacts.
|
•
|
The reduction in the U.S. corporate tax rate resulted in a net tax benefit of approximately
$8.4 million
related to the revaluation of our U.S. net deferred tax liability. We are still analyzing certain aspects of the TCJA and refining our calculations, which could potentially affect the measurement of these balances or potentially give rise to new deferred tax amounts.
|
|
•
|
The transition tax resulted in a one-time tax expense of approximately
$10.6 million
. We have not yet completed our calculation of the total post-1986 foreign earnings and profits (“E&P”) for our foreign subsidiaries as E&P will not be finalized until the federal income tax return is filed.
|
The tax expense recognized represents our best estimate of the impact of the TCJA. During 2018, we will continue to refine the calculations related to both provisional amounts as we gain a more thorough understanding of the tax law and certain aspects of the TCJA are clarified by U.S. tax, regulatory, and standard-setting authorities.
For tax years beginning after December 31, 2017, the TCJA introduces new provisions of U.S. taxation of certain Global Intangible Low-Tax Income (“GILTI”). Due to its complexity and a current lack of guidance as to how to calculate the tax, we are not yet able to determine a reasonable estimate for the impact of the incremental tax liability. The FASB provided guidance that companies should make an accounting policy election to either treat taxes on GILTI as period costs or use the deferred method.
75
When additional analysis is complete and further guidance is available, we will make a policy election for how GILTI will be recorded.
Our non-U.S. earnings are currently considered as indefinitely reinvested overseas. Previously, any repatriation by way of a dividend may have been subject to both U.S. federal and state income taxes, as adjusted for any non-U.S. tax credits. Such dividends should not be subject to U.S. federal tax under the TCJA. We are still analyzing how the TCJA impacts our existing accounting position to indefinitely reinvest foreign earnings, and we have yet to determine whether we plan to change our position. We will record the tax effects of any change to our existing assertion in the period that we complete our analysis and make such a change. If such earnings were to be distributed, any foreign withholding taxes could be material.
For the years ended
December 31, 2017
,
2016
and
2015
, income before income taxes is broken out between U.S. and foreign-sourced operations and consisted of the following (in thousands):
|
|
2017
|
2016
|
2015
|
||||||||
|
Domestic
|
$
|
14,531
|
|
$
|
6,174
|
|
$
|
9,470
|
|
||
|
Foreign
|
21,350
|
|
19,212
|
|
21,730
|
|
|||||
|
Total
|
$
|
35,881
|
|
$
|
25,386
|
|
$
|
31,200
|
|
||
The components of the provision for income taxes for the years ended
December 31, 2017
,
2016
and
2015
, consisted of the following (in thousands):
|
|
2017
|
2016
|
2015
|
||||||||
|
Current expense (benefit):
|
|
|
|
|
|
|
|||||
|
Federal
|
$
|
3,849
|
|
$
|
1,933
|
|
$
|
(17
|
)
|
||
|
State
|
645
|
|
492
|
|
747
|
|
|||||
|
Foreign
|
5,168
|
|
3,802
|
|
3,218
|
|
|||||
|
Total current expense
|
9,662
|
|
6,227
|
|
3,948
|
|
|||||
|
Deferred expense (benefit):
|
|
|
|
|
|
|
|||||
|
Federal
|
(314
|
)
|
(144
|
)
|
3,250
|
|
|||||
|
State
|
(216
|
)
|
(195
|
)
|
294
|
|
|||||
|
Foreign
|
(774
|
)
|
(623
|
)
|
(94
|
)
|
|||||
|
Total deferred (benefit) expense
|
(1,304
|
)
|
(962
|
)
|
3,450
|
|
|||||
|
Total income tax expense
|
$
|
8,358
|
|
$
|
5,265
|
|
$
|
7,398
|
|
||
The difference between the income tax expense reported and amounts computed by applying the statutory federal rate of
35.0%
to pretax income for the years ended
December 31, 2017
,
2016
and
2015
, consisted of the following (in thousands):
76
|
|
2017
|
2016
|
2015
|
||||||||
|
Computed federal income tax expense at statutory rate of 35%
|
$
|
12,559
|
|
$
|
8,885
|
|
$
|
10,920
|
|
||
|
State income taxes
|
279
|
|
193
|
|
698
|
|
|||||
|
Tax credits
|
(1,377
|
)
|
(1,164
|
)
|
(1,019
|
)
|
|||||
|
Production activity deduction
|
—
|
|
(53
|
)
|
—
|
|
|||||
|
Foreign tax rate differential
|
(3,329
|
)
|
(3,717
|
)
|
(3,564
|
)
|
|||||
|
Uncertain tax positions
|
(19
|
)
|
597
|
|
536
|
|
|||||
|
Deferred compensation insurance assets
|
(479
|
)
|
(307
|
)
|
182
|
|
|||||
|
Transaction-related expenses
|
90
|
|
274
|
|
—
|
|
|||||
|
U.S. transition tax
|
10,612
|
|
—
|
|
—
|
|
|||||
|
TCJA remeasurement of deferred taxes
|
(8,383
|
)
|
—
|
|
—
|
|
|||||
|
Share-based payments
|
(2,264
|
)
|
—
|
|
—
|
|
|||||
|
Bargain purchase gain
|
(1,570
|
)
|
—
|
|
—
|
|
|||||
|
In-process research and development
|
1,486
|
|
—
|
|
—
|
|
|||||
|
Other — including the effect of graduated rates
|
753
|
|
557
|
|
(355
|
)
|
|||||
|
Total income tax expense
|
$
|
8,358
|
|
$
|
5,265
|
|
$
|
7,398
|
|
||
Deferred income tax assets and liabilities at
December 31, 2017
and
2016
, consisted of the following temporary differences and carry-forward items (in thousands):
|
|
2017
|
2016
|
|||||
|
Deferred income tax assets:
|
|
|
|||||
|
Allowance for uncollectible accounts receivable
|
$
|
467
|
|
$
|
645
|
|
|
|
Accrued compensation expense
|
5,154
|
|
6,203
|
|
|||
|
Inventory differences
|
2,505
|
|
1,065
|
|
|||
|
Net operating loss carryforwards
|
15,741
|
|
27,742
|
|
|||
|
Deferred revenue
|
58
|
|
73
|
|
|||
|
Stock-based compensation expense
|
2,281
|
|
2,738
|
|
|||
|
Federal research and development credit carryforward
|
—
|
|
3,524
|
|
|||
|
Foreign tax credits
|
—
|
|
364
|
|
|||
|
Other
|
8,986
|
|
6,984
|
|
|||
|
Total deferred income tax assets
|
35,192
|
|
49,338
|
|
|||
|
Deferred income tax liabilities:
|
|
|
|
|
|||
|
Prepaid expenses
|
(930
|
)
|
(782
|
)
|
|||
|
Property and equipment
|
(20,352
|
)
|
(25,108
|
)
|
|||
|
Intangible assets
|
(28,588
|
)
|
(35,773
|
)
|
|||
|
Other
|
(1,830
|
)
|
(1,480
|
)
|
|||
|
Total deferred income tax liabilities
|
(51,700
|
)
|
(63,143
|
)
|
|||
|
Valuation allowance
|
(4,422
|
)
|
(3,786
|
)
|
|||
|
Net deferred income tax assets (liabilities)
|
$
|
(20,930
|
)
|
$
|
(17,591
|
)
|
|
|
|
|
|
|
||||
|
Reported as:
|
|||||||
|
Deferred income tax assets - Current
|
$
|
—
|
|
$
|
8,219
|
|
|
|
Deferred income tax assets - Long-term
|
2,359
|
|
171
|
|
|||
|
Deferred income tax liabilities - Long-term
|
(23,289
|
)
|
(25,981
|
)
|
|||
|
Net deferred income tax liabilities
|
$
|
(20,930
|
)
|
$
|
(17,591
|
)
|
|
The long-term deferred income tax balances are not netted as they represent deferred amounts applicable to different taxing jurisdictions. Deferred income tax balances reflect the temporary differences between the carrying amounts of assets and liabilities and their tax basis and are stated at enacted tax rates expected to be in effect when taxes are actually paid or recovered. The valuation allowance is primarily related to state credit carryforwards, non-US net operating loss carryforwards, and capital
77
loss carryforwards for which we believe it is more likely than not that the deferred tax assets will not be realized. The valuation allowance increased by approximately
$636,000
,
$1.8 million
, and
$378,000
during the years ended
December 31, 2017
,
2016
and
2015
, respectively.
As of
December 31, 2017
and
2016
, we had U.S federal net operating loss carryforwards of approximately
$67.9 million
and
$76.4 million
, respectively, which were generated by Vascular Access Technologies, Inc., DFINE, Inc., and Biosphere Medical, Inc. prior to our acquisition of these companies. Vascular Access Technologies, Inc. was acquired on May 1, 2017. These net operating loss carryforwards, which expire at various dates through 2035, are subject to an annual limitation under Internal Revenue Code Section 382. We anticipate that we will utilize the net operating loss carryforwards over the next
18
years. We utilized a total of approximately
$9.1 million
and
$6.2 million
in U.S. federal net operating loss carryforwards during the years ended
December 31, 2017
and
2016
, respectively.
As of
December 31, 2017
, we had approximately
$5.4 million
of non-U.S. net operating loss carryforwards, of which approximately
$4.9 million
have no expiration date and approximately
$526,000
expire at various dates through 2027. As of
December 31, 2016
, we had
$3.0 million
of non-U.S. net operating loss carryforwards, which have no expiration date. Non-U.S. net operating loss carryforwards utilized during the years ended
December 31, 2017
and
2016
were not material.
We are subject to income taxes in the United States and numerous foreign jurisdictions. Significant judgment is required in determining our worldwide provision for income taxes and recording the related assets and liabilities. In the ordinary course of our business, there are many transactions and calculations where the ultimate tax determination is uncertain. In our opinion, we have made adequate provisions for income taxes for all years subject to audit. We are no longer subject to U.S. federal, state, and local income tax examinations by tax authorities for years before 2014. In foreign jurisdictions, we are no longer subject to income tax examinations for years before 2011.
Although we believe our estimates are reasonable, the final outcomes of these matters may be different from those which we have reflected in our historical income tax provisions and accruals. Such differences could have a material effect on our income tax provision and operating results in the period in which we make such determination.
The total liability for unrecognized tax benefits at
December 31, 2017
, including interest and penalties, was approximately
$3.1 million
, of which approximately
$2.7 million
would favorably impact our effective tax rate if recognized. The total liability for uncertain tax benefits, as presented on our consolidated balance sheets, has been reduced by approximately
$307,000
related to certain liabilities for unrecognized tax benefits, which, if realized, would reduce the transition tax under the TCJA by approximately
$307,000
. The total liability for unrecognized tax benefits at
December 31, 2016
, including interest and penalties, was approximately
$2.8 million
, of which approximately
$2.8 million
would favorably impact our effective tax rate if recognized. Approximately
$2.3 million
of the total liability at
December 31, 2016
was presented as a reduction to non-current deferred income tax assets on our consolidated balance sheet. As of
December 31, 2017
and
2016
, we had accrued approximately
$304,000
and
$216,000
respectively, in total interest and penalties related to unrecognized tax benefits. We account for interest and penalties for unrecognized tax benefits as part of our income tax provision. During the years ended
December 31, 2017
,
2016
and
2015
we added interest and penalties of approximately
$88,000
,
$30,000
and
$6,000
, respectively, to our liability for unrecognized tax benefits. It is reasonably possible that within the next 12 months the total liability for unrecognized tax benefits may change, net of potential decreases due to the expiration of statutes of limitation, up to
$500,000
.
A reconciliation of the beginning and ending amount of liabilities associated with uncertain tax benefits for the years ended
December 31, 2017
,
2016
and
2015
, consisted of the following (in thousands):
|
Tabular Roll-forward
|
2017
|
2016
|
2015
|
|||||||||
|
Unrecognized tax benefits, opening balance
|
$
|
2,549
|
|
$
|
1,982
|
|
$
|
1,736
|
|
|||
|
Gross increases in tax positions taken in a prior year
|
80
|
|
77
|
|
187
|
|
||||||
|
Gross increases in tax positions taken in the current year
|
403
|
|
856
|
|
763
|
|
||||||
|
Lapse of applicable statute of limitations
|
(283
|
)
|
(366
|
)
|
(704
|
)
|
||||||
|
Unrecognized tax benefits, ending balance
|
$
|
2,749
|
|
$
|
2,549
|
|
$
|
1,982
|
|
|||
The tabular roll-forward ending balance does not include interest and penalties related to unrecognized tax benefits.
6. ACCRUED EXPENSES
Accrued expenses at
December 31, 2017
and
2016
, consisted of the following (in thousands):
78
|
|
2017
|
2016
|
|||||
|
Payroll and related liabilities
|
$
|
30,225
|
|
$
|
24,429
|
|
|
|
Advances from employees
|
796
|
|
572
|
|
|||
|
Other accrued expenses
|
27,911
|
|
20,518
|
|
|||
|
Total
|
$
|
58,932
|
|
$
|
45,519
|
|
|
Principal balances outstanding under our long-term debt obligations as of
December 31, 2017
and
2016
, consisted of the following (in thousands):
|
2017
|
2016
|
||||||
|
2016 Term loan
|
$
|
85,000
|
|
$
|
145,000
|
|
|
|
2016 Revolving credit loans
|
187,000
|
|
180,000
|
|
|||
|
2017 Debt facility
|
6,959
|
|
—
|
|
|||
|
Less unamortized debt issuance costs
|
(487
|
)
|
(627
|
)
|
|||
|
Total long-term debt
|
278,472
|
|
324,373
|
|
|||
|
Less current portion
|
19,459
|
|
10,000
|
|
|||
|
Long-term portion
|
$
|
259,013
|
|
$
|
314,373
|
|
|
2017 Debt Facility
On February 23, 2017, we entered into a loan agreement with HSBC Bank USA, National Association ("HSBC Bank") whereby HSBC Bank agreed to provide us with a loan in the amount of approximately
$7.0 million
. The loan matures on February 1, 2018, with an extension available at our option, subject to certain conditions. The loan agreement bears interest at the three-month London Inter-Bank Offered Rate (“LIBOR”) plus
1.0%
, which resets quarterly. The loan is secured by assets equal to the currently outstanding loan balance. The loan contains covenants, representations and warranties and other terms customary for loans of this nature. As of
December 31, 2017
, our interest rate on the loan was a variable rate of
2.38%
.
2016 Term Loan and Revolving Credit Loans
On July 6, 2016, we entered into a Second Amended and Restated Credit Agreement (as amended to date, the “Second Amended Credit Agreement”), with Wells Fargo Bank, National Association, as administrative agent, swingline lender and a lender, and Wells Fargo Securities, LLC, as sole lead arranger and sole bookrunner. In addition to Wells Fargo Bank, National Association, Bank of America, N.A., U.S. Bank, National Association, and HSBC Bank USA, National Association, are parties to the Second Amended Credit Agreement as lenders. The Second Amended Credit Agreement amends and restates in its entirety our previously outstanding Amended and Restated Credit Agreement and all amendments thereto. The Second Amended Credit Agreement was amended on September 28, 2016 to allow for a new revolving credit loan to our wholly-owned subsidiary, on March 20, 2017 to allow flexibility in how we apply net proceeds received from equity issuances to prepay outstanding indebtedness, and on December 13, 2017 to increase the revolving credit commitment by
$100 million
up to
$375 million
.
The Second Amended Credit Agreement provides for a term loan of
$150 million
and a revolving credit commitment up to an aggregate amount of
$375 million
, which includes a reserve of
$25 million
to make swingline loans from time to time. The term loan is payable in quarterly installments in the amounts provided in the Second Amended Credit Agreement until the maturity date of July 6, 2021, at which time the term and revolving credit loans, together with accrued interest thereon, will be due and payable. At any time prior to the maturity date, we may repay any amounts owing under all revolving credit loans, term loans, and all swingline loans in whole or in part, subject to certain minimum thresholds, without premium or penalty, other than breakage costs.
Revolving credit loans denominated in dollars and term loans made under the Second Amended Credit Agreement bear interest, at our election, at either a Base Rate or Eurocurrency Base Rate (as such terms are defined in the Second Amended Credit Agreement) plus the applicable margin, which increases as our Consolidated Total Leverage Ratio (as defined in the Second Amended Credit Agreement) increases. Revolving credit loans denominated in an Alternative Currency (as defined in the Second Amended Credit Agreement) bear interest at the Eurocurrency rate plus the applicable margin. Swingline loans bear interest at the base rate plus the applicable margin. Upon an event of default, the interest rate may be increased by
2.0%
. The revolving credit commitment will also carry a commitment fee of
0.15%
to
0.40%
per annum on the unused portion.
79
The Second Amended Credit Agreement is collateralized by substantially all our assets. The Second Amended Credit Agreement contains covenants, representations and warranties and other terms customary for loans of this nature. The Second Amended Credit Agreement requires that we maintain certain financial covenants, as follows:
|
Covenant Requirement
|
|||
|
Consolidated Total Leverage Ratio (1)
|
|||
|
July 1, 2017 through December 31, 2017
|
3.75 to 1.0
|
||
|
January 1, 2018 through March 31, 2018
|
3.5 to 1.0
|
||
|
April 1, 2018 and thereafter
|
3.25 to 1.0
|
||
|
Consolidated EBITDA (2)
|
1.25 to 1.0
|
||
|
Consolidated Net Income (3)
|
$—
|
||
|
Facility Capital Expenditures (4)
|
$30 million
|
||
|
(1)
|
Maximum Consolidated Total Leverage Ratio (as defined in the Second Amended Credit Agreement) as of any fiscal quarter end.
|
||
|
(2)
|
Minimum ratio of Consolidated EBITDA (as defined in the Second Amended Credit Agreement and adjusted for certain expenditures) to Consolidated Fixed Charges (as defined in the Second Amended Credit Agreement) for any period of four consecutive fiscal quarters.
|
||
|
(3)
|
Minimum level of Consolidated Net Income (as defined in the Second Amended Credit Agreement) for certain periods, and subject to certain adjustments.
|
||
|
(4)
|
Maximum level of the aggregate amount of all Facility Capital Expenditures (as defined in the Second Amended Credit Agreement) in any fiscal year.
|
||
Additionally, the Second Amended Credit Agreement contains customary events of default and affirmative and negative covenants for transactions of this type. As of
December 31, 2017
, we believe we were in compliance with all covenants set forth in the Second Amended Credit Agreement.
Future Payments
Future minimum principal payments on our long-term debt as of
December 31, 2017
, are as follows (in thousands):
|
Years Ending
|
Future Minimum
|
|||
|
December 31
|
Principal Payments
|
|||
|
2018
|
$
|
19,459
|
|
|
|
2019
|
15,000
|
|
||
|
2020
|
17,500
|
|
||
|
2021
|
227,000
|
|
||
|
Total future minimum principal payments
|
$
|
278,959
|
|
|
As of
December 31, 2017
, we had outstanding borrowings of approximately
$272.0 million
under the Second Amended Credit Agreement, with available borrowings of approximately
$188.0 million
, based on the leverage ratio required pursuant to the Second Amended Credit Agreement. Our interest rate as of
December 31, 2017
was a fixed rate of
2.68%
on
$175.0 million
as a result an interest rate swap (see Note 8) and a variable floating rate of
2.82%
on
$97.0 million
. Our interest rate as of
December 31, 2016
was a fixed rate of
2.98%
on
$130.0 million
and
3.12%
on
$45.0 million
as a result of an interest rate swaps, and a variable floating rate of
2.77%
on approximately
$150.0 million
.
8. DERIVATIVES
General.
Our earnings and cash flows are subject to fluctuations due to changes in interest rates and foreign currency exchange rates, and we seek to mitigate a portion of these risks by entering into derivative contracts. The derivatives we use are interest rate swaps and foreign currency forward contracts. We recognize derivatives as either assets or liabilities at fair value in the accompanying consolidated balance sheets, regardless of whether or not hedge accounting is applied. We report cash flows arising from our hedging instruments consistent with the classification of cash flows from the underlying hedged items. Accordingly, cash flows associated with our derivative programs are classified as operating activities in the accompanying consolidated statements of cash flows.
80
We formally document, designate and assess the effectiveness of transactions that receive hedge accounting initially and on an ongoing basis. Changes in the fair value of derivatives that qualify for hedge accounting treatment are recorded, net of applicable taxes, in accumulated other comprehensive income (loss), a component of stockholders’ equity in the accompanying consolidated balance sheets. For the ineffective portions of qualifying hedges, the change in fair value is recorded through earnings in the period of change. Changes in the fair value of derivatives not designated as hedging instruments are recorded in earnings throughout the term of the derivative.
Interest Rate Risk.
A portion of our debt bears interest at variable interest rates and, therefore, we are subject to variability in the cash paid for interest expense. In order to mitigate a portion of this risk, we use a hedging strategy to reduce the variability of cash flows in the interest payments associated with a portion of the variable-rate debt outstanding under our Second Amended Credit Agreement that is solely due to changes in the benchmark interest rate.
Derivatives Designated as Cash Flow Hedges
On December 19, 2012, we entered into a pay-fixed, receive-variable interest rate swap having an initial notional amount of
$150 million
with Wells Fargo to fix the one-month LIBOR rate at
0.98%
. The interest rate swap expired on December 19, 2017. The variable portion of the interest rate swap was tied to the one-month LIBOR rate (the benchmark interest rate). The interest rates under both the interest rate swap and the underlying debt reset, the swap was settled with the counterparty, and interest was paid, on a monthly basis. The notional amount of the interest rate swap was reduced quarterly by
50%
of the minimum principal payment due under the terms of our Second Amended Credit Agreement.
On August 5, 2016, we entered into a pay-fixed, receive-variable interest rate swap having an initial notional amount of
$42.5 million
with Wells Fargo to fix the one-month LIBOR rate at
1.12%
. The variable portion of the interest rate swap is tied to the one-month LIBOR rate (the benchmark interest rate). On a monthly basis, the interest rates under both the interest rate swap and the underlying debt reset, the swap is settled with the counterparty, and interest is paid. The notional amount of the interest rate swap increased quarterly by an amount equal to the decrease of the hedge entered into on December 19, 2012, up to the amount of
$175.0 million
, which was reached upon expiration of the other swap on December 19, 2017. The interest rate swap is scheduled to expire on July 6, 2021.
At
December 31, 2017
and
2016
, our interest rate swaps qualified as cash flow hedges. The fair value of our interest rate swap at
December 31, 2017
was an asset of approximately
$5.7 million
, which was partially offset by approximately
$1.5 million
in deferred taxes. The fair value of our interest rate swaps at
December 31, 2016
was an asset of approximately
$5.0 million
, which was offset by approximately
$1.9 million
in deferred taxes.
Foreign Currency Risk
. We operate on a global basis and are exposed to the risk that our financial condition, results of operations, and cash flows could be adversely affected by changes in foreign currency exchange rates. To reduce the potential effects of foreign currency exchange rate movements on net earnings, we enter into derivative financial instruments in the form of foreign currency exchange forward contracts with major financial institutions. Our policy is to enter into foreign currency derivative contracts with maturities of up to
two
years. We are primarily exposed to foreign currency exchange rate risk with respect to transactions and balances denominated in Euros, British Pounds, Chinese Renminbi, Mexican Pesos, Brazilian Reals, Australian Dollars, Hong Kong Dollars, Swiss Francs, Swedish Krona, Canadian Dollars, Danish Krone, Japanese Yen, Korea Won, and Singapore Dollars. We do not use derivative financial instruments for trading or speculative purposes. We are not subject to any credit risk contingent features related to our derivative contracts, and counterparty risk is managed by allocating derivative contracts among several major financial institutions.
Derivatives Designated as Cash Flow Hedges
For derivative instruments that are designated and qualify as cash flow hedges, the effective portion of the gain or loss on the derivative instrument is reported as a component of other comprehensive income (loss) and reclassified into earnings in the same line item associated with the forecasted transaction and in the same period or periods during which the hedged transaction affects earnings. The remaining gain or loss on the derivative instrument in excess of the cumulative change in the present value of future cash flows of the hedged item, if any (i.e., the ineffective portion) or hedge components excluded from the assessment of effectiveness, are recognized in earnings during the current period. We entered into forward contracts on various foreign currencies to manage the risk associated with forecasted exchange rates which impact revenues, cost of sales, and operating expenses in various international markets. The objective of the hedges is to reduce the variability of cash flows associated with the forecasted purchase or sale of the associated foreign currencies.
81
We enter into approximately
100
cash flow foreign currency hedges every month. As of December 31, 2017, we had entered into foreign currency forward contracts, which qualified as cash flow hedges, with the following notional amounts (in thousands and in local currencies):
|
Currency
|
Symbol
|
Forward Notional Amount
|
|
|
Canadian Dollar
|
CAD
|
2,310
|
|
|
Swiss Franc
|
CHF
|
1,375
|
|
|
Chinese Renminbi
|
CNY
|
45,000
|
|
|
Danish Krone
|
DKK
|
14,470
|
|
|
Euro
|
EUR
|
9,165
|
|
|
British Pound
|
GBP
|
3,625
|
|
|
Mexican Peso
|
MXN
|
95,075
|
|
|
Swedish Krona
|
SEK
|
16,330
|
|
Derivatives Not Designated as Cash Flow Hedges
We forecast our net exposure in various receivables and payables to fluctuations in the value of various currencies, and we enter into foreign currency forward contracts to mitigate that exposure. We enter into approximately
20
foreign currency fair value hedges every month. As of
December 31, 2017
, we had entered into foreign currency forward contracts related to those balance sheet accounts with the following notional amounts (in thousands and in local currencies):
|
Currency
|
Symbol
|
Forward Notional Amount
|
|
|
Australian Dollar
|
AUD
|
5,600
|
|
|
Brazilian Real
|
BRL
|
8,500
|
|
|
Canadian Dollar
|
CAD
|
2,076
|
|
|
Swiss Franc
|
CHF
|
242
|
|
|
Chinese Renminbi
|
CNY
|
22,990
|
|
|
Danish Krone
|
DKK
|
1,881
|
|
|
Euro
|
EUR
|
23,333
|
|
|
British Pound
|
GBP
|
1,868
|
|
|
Hong Kong Dollar
|
HKD
|
11,000
|
|
|
Japanese Yen
|
JPY
|
178,500
|
|
|
Korean Won
|
KRW
|
1,800,000
|
|
|
Mexican Peso
|
MXN
|
17,540
|
|
|
Swedish Krona
|
SEK
|
4,775
|
|
|
Singapore Dollar
|
SGD
|
5,023
|
|
Balance Sheet Presentation of Derivatives.
As of December 31, 2017 and 2016, all derivatives, both those designated as hedging instruments and those that were not designated as hedging instruments, were recorded gross at fair value on our consolidated balance sheets. We are not subject to any master netting agreements.
82
The fair value of derivative instruments on a gross basis is as follows (in thousands):
|
Fair Value
|
||||||||||
|
Balance Sheet Location
|
December 31, 2017
|
December 31, 2016
|
||||||||
|
Derivatives designated as hedging instruments
|
||||||||||
|
Assets
|
||||||||||
|
Interest rates swaps
|
Other assets (long-term)
|
$
|
5,749
|
|
$
|
4,991
|
|
|||
|
Foreign currency forward contracts
|
Prepaid expenses and other assets
|
363
|
|
116
|
|
|||||
|
Foreign currency forward contracts
|
Other assets (long-term)
|
35
|
|
18
|
|
|||||
|
Liabilities
|
||||||||||
|
Foreign currency forward contracts
|
Accrued expenses
|
(468
|
)
|
(275
|
)
|
|||||
|
Foreign currency forward contracts
|
Other long-term obligations
|
(82
|
)
|
(18
|
)
|
|||||
|
Derivatives not designated as hedging instruments
|
||||||||||
|
Assets
|
||||||||||
|
Foreign currency forward contracts
|
Prepaid expenses and other assets
|
$
|
223
|
|
$
|
220
|
|
|||
|
Liabilities
|
||||||||||
|
Foreign currency forward contracts
|
Accrued expenses
|
(841
|
)
|
(171
|
)
|
|||||
Income Statement Presentation of Derivatives
Derivatives Designated as Cash Flow Hedges
Derivative instruments designated as cash flow hedges had the following effects, before income taxes, on other comprehensive income and net earnings in our consolidated statements of earnings, consolidated statements of comprehensive income and consolidated balance sheets (in thousands):
|
Amount of Gain/(Loss) recognized in OCI
|
Amount of Gain/(Loss) reclassified from AOCI
|
|||||||||||||||
|
Year ended December 31,
|
Year ended December 31,
|
|||||||||||||||
|
2017
|
2016
|
2015
|
2017
|
2016
|
2015
|
|||||||||||
|
Derivative instrument
|
Location in statements of income
|
|||||||||||||||
|
Interest rate swaps
|
$853
|
$
|
4,989
|
|
$
|
(571
|
)
|
Interest Expense
|
$95
|
(718
|
)
|
(1,103
|
)
|
|||
|
Foreign currency forward contracts
|
491
|
|
(205
|
)
|
—
|
|
Revenue
|
(277
|
)
|
21
|
|
—
|
|
|||
|
Cost of goods sold
|
625
|
|
(26
|
)
|
—
|
|
||||||||||
The net amount recognized in earnings during the years ended December 31, 2017, 2016 and 2015 due to ineffectiveness and amounts excluded from the assessment of hedge effectiveness were not significant.
As of December 31, 2017, approximately
$44,000
, or
$33,000
after taxes, was expected to be reclassified from accumulated other comprehensive income to earnings in revenue and cost of sales over the succeeding twelve months. As of December 31, 2017, approximately $
1.1 million
, or
$840,000
after taxes, was expected to be reclassified from accumulated other comprehensive income to earnings in interest expense over the succeeding twelve months.
Derivatives Not Designated as Hedging Instruments
The following gains/(losses) from these derivative instruments were recognized in our consolidated statements of income for the years presented (in thousands):
|
Year ended December 31,
|
|||||||||||
|
2017
|
2016
|
2015
|
|||||||||
|
Derivative Instrument
|
Location in statements of income
|
||||||||||
|
Foreign currency forward contracts
|
Other expense
|
$
|
(4,746
|
)
|
$
|
69
|
|
$
|
(302
|
)
|
|
See Note 15 for more information about our derivatives.
83
9. COMMITMENTS AND CONTINGENCIES
We are obligated under non-terminable operating leases for manufacturing facilities, finished good distribution, office space and equipment. Total rental expense on these operating leases and on our manufacturing and office building for the years ended
December 31, 2017
,
2016
and
2015
, approximated
$13.6 million
,
$11.4 million
and
$10.7 million
, respectively.
The future minimum lease payments for operating leases as of
December 31, 2017
, consisted of the following (in thousands):
|
Years Ending
|
Operating
|
|||
|
December 31
|
Leases
|
|||
|
|
|
|
||
|
2018
|
$
|
12,293
|
|
|
|
2019
|
11,237
|
|
||
|
2020
|
9,307
|
|
||
|
2021
|
7,527
|
|
||
|
2022
|
6,468
|
|
||
|
Thereafter
|
57,211
|
|
||
|
|
|
|
||
|
Total minimum lease payments
|
$
|
104,043
|
|
|
Sale-Leaseback
.
During the year ended December 31, 2015, we entered into sale and leaseback transactions to finance certain production equipment for
$2.0 million
. We did not enter into any new sale and leaseback transactions during the years ended December 31, 2017 and 2016. The lease agreements from the sale and leaseback transactions are accounted for as operating leases. Under the terms of the lease agreements, we have agreed to operate and maintain the equipment. The lease term of the agreements is
seven
years.
Irish Government Development Agency Grants
. As of
December 31, 2017
, we had entered into several grant agreements with the Irish Government Development Agency. Grants related to the acquisition of property and equipment purchased in Ireland are amortized as a reduction to depreciation expense over lives corresponding to the depreciable lives of such property and equipment. The balance of deferred credits related to such grants as of
December 31, 2017
and
2016
, was approximately
$2.4 million
and
$2.5 million
, respectively. During the years ended
December 31, 2017
,
2016
and
2015
, approximately
$147,000
,
$170,000
and
$171,000
, respectively, of the deferred credit was amortized as a reduction of operating expenses.
We have committed to repay the Irish government for grants received if we cease production in Ireland prior to the expiration of the grant liability period. The grant liability period is usually between
five
and
eight years
from the last claim made on a grant. As of
December 31, 2017
, the total amount of grants that could be subject to refund was approximately
$3.0 million
, and the remaining grant liability period was
one
year. Our management does not currently believe we will have to repay any of these grant monies, as we have no current intention of ceasing operations in Ireland.
Royalties
. As of December 31, 2017, we had entered into several agreements to license or acquire rights to certain intellectual property which require us to make royalty payments during the term of the agreements generally based on a percentage of sales. Total royalty expense during the years ended
December 31, 2017
,
2016
and
2015
, approximated
$4.4 million
,
$3.2 million
and
$2.7 million
, respectively. See Note 2 for discussion of future royalty commitments related to acquisitions.
Litigation
. In the ordinary course of business, we are involved in various claims and litigation matters. These claims and litigation matters may include actions involving product liability, intellectual property, contract disputes, and employment or other matters that are significant to our business. Based upon our review of currently available information, we do not believe that any such actions are likely to be, individually or in the aggregate, materially adverse to our business, financial condition, results of operations or liquidity.
In October 2016, we received a subpoena from the U.S. Department of Justice seeking information on certain of our marketing and promotional practices. We are in the process of responding to the subpoena, which we anticipate will continue during 2018. We have incurred, and anticipate that we will continue to incur, substantial costs in connection with the matter. The investigation is ongoing and at this stage we are unable to predict its scope, duration or outcome. Investigations such as this may result in the imposition of, among other things, significant damages, injunctions, fines or civil or criminal claims or penalties against our company or individuals.
84
In the event of unexpected further developments, it is possible that the ultimate resolution of any of the foregoing matters, or other similar matters, if resolved in a manner unfavorable to us, may be materially adverse to our business, financial condition, results of operations or liquidity. Legal costs for these matters, such as outside counsel fees and expenses, are charged to expense in the period incurred.
10. EARNINGS PER COMMON SHARE (EPS)
The computation of weighted average shares outstanding and the basic and diluted earnings per common share for the following periods consisted of the following (in thousands, except per share amounts):
|
Net
Income
|
Shares
|
Per Share
Amount
|
||||||||
|
Year ended December 31, 2017:
|
|
|
|
|
|
|
||||
|
Basic EPS
|
$
|
27,523
|
|
48,805
|
|
$
|
0.56
|
|
||
|
Effect of dilutive stock options and warrants
|
|
|
1,296
|
|
|
|
||||
|
Diluted EPS
|
$
|
27,523
|
|
50,101
|
|
$
|
0.55
|
|
||
|
Year ended December 31, 2016:
|
|
|
|
|
|
|
||||
|
Basic EPS
|
$
|
20,121
|
|
44,408
|
|
$
|
0.45
|
|
||
|
Effect of dilutive stock options and warrants
|
|
|
454
|
|
|
|
||||
|
Diluted EPS
|
$
|
20,121
|
|
44,862
|
|
$
|
0.45
|
|
||
|
Year ended December 31, 2015:
|
|
|
|
|
|
|
||||
|
Basic EPS
|
$
|
23,802
|
|
44,036
|
|
$
|
0.54
|
|
||
|
Effect of dilutive stock options and warrants
|
|
|
475
|
|
|
|
||||
|
Diluted EPS
|
$
|
23,802
|
|
44,511
|
|
$
|
0.53
|
|
||
For the years ended
December 31, 2017
,
2016
and
2015
, approximately
381,000
,
727,000
and
423,000
, respectively, of stock options were not included in the computation of diluted earnings per share because their effect would have been anti-dilutive.
85
11. EMPLOYEE STOCK PURCHASE PLAN, STOCK OPTIONS AND WARRANTS.
Our stock-based compensation primarily consists of the following plans:
2006 Long-Term Incentive Plan
. In May 2006, our Board of Directors adopted and our shareholders approved, the Merit Medical Systems, Inc. 2006 Long-Term Incentive Plan (the “2006 Incentive Plan”). The 2006 Incentive Plan provides for the granting of stock options, stock appreciation rights, restricted stock, stock units (including restricted stock units) and performance awards. Options may be granted to directors, officers, outside consultants and key employees and may be granted upon such terms and such conditions as the Compensation Committee of our Board of Directors determines. Options will typically vest on an annual basis over a
three
to
five
-year life (or
one
year if performance based) with a contractual life of
seven
years. As of
December 31, 2017
, a total of
492,292
shares remained available to be issued under the 2006 Incentive Plan.
Employee Stock Purchase Plan
. We have a non-qualified Employee Stock Purchase Plan (“ESPP”), which has an expiration date of June 30, 2026. As of
December 31, 2017
, the total number of shares of Common Stock that remained available to be issued under our non-qualified plan was
126,863
shares. ESPP participants purchase shares on a quarterly basis at a price equal to
95%
of the market price of the Common Stock at the end of the applicable offering period.
Stock-Based Compensation Expense
. The stock-based compensation expense before income tax expense for the years ended
December 31, 2017
,
2016
and
2015
, consisted of the following (in thousands):
|
|
2017
|
2016
|
2015
|
||||||||
|
Cost of goods sold
|
$
|
632
|
|
$
|
472
|
|
$
|
398
|
|
||
|
Research and development
|
376
|
|
184
|
|
122
|
|
|||||
|
Selling, general, and administrative
|
3,067
|
|
1,850
|
|
1,723
|
|
|||||
|
Stock-based compensation expense before taxes
|
$
|
4,075
|
|
$
|
2,506
|
|
$
|
2,243
|
|
||
We recognize stock-based compensation expense (net of a forfeiture rate) for those awards which are expected to vest on a straight-line basis over the requisite service period. We estimate the forfeiture rate based on our historical experience and expectations about future forfeitures. As of
December 31, 2017
, the total remaining unrecognized compensation cost related to non-vested stock options, net of expected forfeitures, was approximately
$15.1 million
and is expected to be recognized over a weighted average period of
3.46
years.
In applying the Black-Scholes methodology to the option grants, the fair value of our stock-based awards granted were estimated using the following assumptions for the periods indicated below:
|
|
2017
|
2016
|
2015
|
||||||||
|
Risk-free interest rate
|
1.77%
|
-
|
1.83%
|
1.15%
|
-
|
1.40%
|
1.53%
|
-
|
1.66%
|
||
|
Expected option life
|
5.0 years
|
5.0 years
|
5.0 years
|
||||||||
|
Expected dividend yield
|
—%
|
—%
|
—%
|
||||||||
|
Expected price volatility
|
33.81%
|
-
|
34.07%
|
34.28%
|
-
|
37.06%
|
33.72%
|
-
|
35.11%
|
||
The average risk-free interest rate is determined using the U.S. Treasury rate in effect as of the date of grant, based on the expected term of the stock option. We determine the expected term of the stock options using the historical exercise behavior of employees. The expected price volatility was determined using a weighted average of daily historical volatility of our stock price over the corresponding expected option life and implied volatility based on recent trends of the daily historical volatility. For options with a vesting period, compensation expense is recognized on a straight-line basis over the service period, which corresponds to the vesting period. Compensation expense is recognized immediately for options that are fully vested on the date of grant. During the years ended
December 31, 2017
,
2016
and
2015
, approximately
1.3 million
,
880,000
and
618,000
stock-based compensation grants were made, respectively, for a total fair value of approximately
$12.4 million
,
$5.2 million
and
$3.7 million
, net of estimated forfeitures, respectively.
The table below presents information related to stock option activity for the years ended
December 31, 2017
,
2016
and
2015
(in thousands):
|
|
2017
|
2016
|
2015
|
||||||||
|
Total intrinsic value of stock options exercised
|
$
|
9,264
|
|
$
|
3,648
|
|
$
|
7,548
|
|
||
|
Cash received from stock option exercises
|
5,552
|
|
4,577
|
|
6,227
|
|
|||||
|
Excess tax benefit from the exercise of stock options
|
2,264
|
|
669
|
|
2,124
|
|
|||||
86
Changes in stock options for the year ended
December 31, 2017
, consisted of the following (shares and intrinsic value in thousands):
|
Number
of Shares
|
Weighted Average
Exercise Price
|
Remaining Contractual
Term (in years)
|
Intrinsic
Value
|
|||||||||
|
Beginning balance
|
2,817
|
|
$
|
15.32
|
|
|
|
|
||||
|
Granted
|
1,297
|
|
29.31
|
|
|
|
|
|||||
|
Exercised
|
(404
|
)
|
14.02
|
|
|
|
|
|||||
|
Forfeited/expired
|
(87
|
)
|
18.79
|
|
|
|
|
|||||
|
Outstanding at December 31
|
3,623
|
|
20.40
|
|
4.57 years
|
$
|
82,615
|
|
||||
|
Exercisable
|
1,110
|
|
14.35
|
|
2.55 years
|
32,019
|
|
|||||
|
Ending vested and expected to vest
|
3,484
|
|
20.23
|
|
4.52 years
|
80,052
|
|
|||||
The weighted average grant-date fair value of options granted during the years ended
December 31, 2017
,
2016
and
2015
was
$9.57
,
$5.94
and
$5.98
, respectively.
The following table summarizes information about stock options outstanding at
December 31, 2017
(shares in thousands):
|
|
Options Outstanding
|
Options Exercisable
|
||||||||||||||
|
Range of Exercise
|
Number Outstanding
|
Weighted Average Remaining Contractual Life (in years)
|
Weighted Average Exercise Price
|
Number Exercisable
|
Weighted Average Exercise Price
|
|||||||||||
|
$9.95
|
-
|
$13.75
|
925
|
2.17 years
|
$
|
12.65
|
|
713
|
$
|
12.84
|
|
|||||
|
$13.77
|
-
|
$17.27
|
991
|
4.38 years
|
$
|
16.18
|
|
294
|
$
|
15.96
|
|
|||||
|
$18.80
|
-
|
$22.00
|
425
|
5.00 years
|
$
|
20.14
|
|
103
|
$
|
20.18
|
|
|||||
|
$28.20
|
-
|
$38.35
|
1,282
|
6.30 years
|
$
|
29.33
|
|
0
|
$
|
—
|
|
|||||
|
$9.95
|
-
|
$38.35
|
3,623
|
|
|
|
1,110
|
|
|
|||||||
12. SEGMENT REPORTING AND FOREIGN OPERATIONS
We report our operations in
two
operating segments: cardiovascular and endoscopy. Our cardiovascular segment consists of cardiology and radiology medical device products which assist in diagnosing and treating coronary artery disease, peripheral vascular disease and other non-vascular diseases and includes embolotherapeutic, cardiac rhythm management ("CRM"), electrophysiology ("EP"), critical care and interventional oncology and spine devices. Our endoscopy segment consists of gastroenterology and pulmonology medical device products which assist in the palliative treatment of expanding esophageal, tracheobronchial and biliary strictures caused by malignant tumors. We evaluate the performance of our operating segments based on operating income (loss). Listed below are the sales by business segment for the years ended
December 31, 2017
,
2016
and
2015
(in thousands):
|
|
% Change
|
2017
|
% Change
|
2016*
|
% Change
|
2015
|
|||||||||||
|
Cardiovascular
|
|
|
|
|
|
|
|
|
|
||||||||
|
Stand-alone devices
|
44%
|
$
|
275,431
|
|
23%
|
$
|
191,148
|
|
8%
|
$
|
155,414
|
|
|||||
|
Custom kits and procedure trays
|
6%
|
126,114
|
|
2%
|
119,226
|
|
5%
|
116,368
|
|
||||||||
|
Inflation devices
|
8%
|
79,875
|
|
1%
|
73,916
|
|
1%
|
73,373
|
|
||||||||
|
Catheters
|
13%
|
127,747
|
|
17%
|
113,367
|
|
11%
|
96,833
|
|
||||||||
|
Embolization devices
|
8%
|
49,532
|
|
2%
|
46,035
|
|
3%
|
45,025
|
|
||||||||
|
CRM/EP
|
15%
|
41,914
|
|
8%
|
36,459
|
|
3%
|
33,902
|
|
||||||||
|
Total
|
21%
|
700,613
|
|
11%
|
580,151
|
|
6%
|
520,915
|
|
||||||||
|
Endoscopy
|
|
|
|
|
|
|
|
|
|
||||||||
|
Endoscopy devices
|
15%
|
27,239
|
|
12%
|
23,687
|
|
18%
|
21,234
|
|
||||||||
|
Total
|
21%
|
$
|
727,852
|
|
11%
|
$
|
603,838
|
|
6%
|
$
|
542,149
|
|
|||||
* Certain product categories for 2016 have been adjusted from prior disclosure to reflect changes in product classifications to be consistent with updates in the management of our product portfolios in 2017.
87
During the years ended
December 31, 2017
,
2016
and
2015
, we had international sales of approximately
$307.1 million
,
$233.5 million
and
$214.0 million
, respectively, or approximately
42%
,
39%
and
39%
, respectively, of net sales, primarily in China, Japan, Germany, France, the United Kingdom and Russia. China represents our most significant international sales market with sales of approximately
$73.4 million
,
$59.9 million
, and
$50.7 million
for the years ended
December 31, 2017
,
2016
and
2015
, respectively. International sales are attributed based on location of the customer receiving the product.
Our long-lived assets by geographic area at
December 31, 2017
,
2016
and
2015
, consisted of the following (in thousands):
|
|
2017
|
2016
|
2015
|
||||||||
|
United States
|
$
|
202,504
|
|
$
|
194,715
|
|
$
|
186,389
|
|
||
|
Ireland
|
45,671
|
|
47,337
|
|
48,896
|
|
|||||
|
Other foreign countries
|
44,645
|
|
34,521
|
|
32,493
|
|
|||||
|
Total
|
$
|
292,820
|
|
$
|
276,573
|
|
$
|
267,778
|
|
||
Financial information relating to our reportable operating segments and reconciliations to the consolidated totals for the years ended
December 31, 2017
,
2016
and
2015
, are as follows (in thousands):
|
|
2017
|
2016
|
2015
|
||||||||
|
Net Sales
(1)
|
|
|
|
|
|
|
|||||
|
Cardiovascular
|
$
|
700,613
|
|
$
|
580,151
|
|
$
|
520,915
|
|
||
|
Endoscopy
|
27,239
|
|
23,687
|
|
21,234
|
|
|||||
|
Total net sales
|
727,852
|
|
603,838
|
|
542,149
|
|
|||||
|
Operating expenses
|
|
|
|
|
|
|
|||||
|
Cardiovascular
|
281,095
|
|
218,659
|
|
187,492
|
|
|||||
|
Endoscopy
|
12,089
|
|
11,490
|
|
10,746
|
|
|||||
|
Total operating expenses
|
293,184
|
|
230,149
|
|
198,238
|
|
|||||
|
Operating income (loss)
(1)
|
|
|
|
|
|
|
|||||
|
Cardiovascular
|
24,819
|
|
30,053
|
|
34,052
|
|
|||||
|
Endoscopy
|
8,250
|
|
4,823
|
|
3,491
|
|
|||||
|
Total operating income
|
33,069
|
|
34,876
|
|
37,543
|
|
|||||
|
Total other expense - net
|
2,812
|
|
(9,490
|
)
|
(6,343
|
)
|
|||||
|
Income tax expense
|
8,358
|
|
5,265
|
|
7,398
|
|
|||||
|
Net income
|
$
|
27,523
|
|
$
|
20,121
|
|
$
|
23,802
|
|
||
(1) Sales and operating income have been adjusted from prior disclosure to reflect changes in product classifications between our operating segments, which were made to be consistent with updates in the management of our product portfolios in 2017.
Total assets by business segment at
December 31, 2017
,
2016
and
2015
, consisted of the following (in thousands):
|
|
2017
|
2016
|
2015
|
||||||||
|
Cardiovascular
|
$
|
1,103,806
|
|
$
|
932,927
|
|
$
|
767,952
|
|
||
|
Endoscopy
|
8,005
|
|
9,876
|
|
10,776
|
|
|||||
|
Total
|
$
|
1,111,811
|
|
$
|
942,803
|
|
$
|
778,728
|
|
||
Total depreciation and amortization by business segment for the years ended
December 31, 2017
,
2016
, and
2015
consisted of the following (in thousands):
88
|
|
2017
|
2016
|
2015
|
||||||||
|
Cardiovascular
|
$
|
52,700
|
|
$
|
42,806
|
|
$
|
36,474
|
|
||
|
Endoscopy
|
882
|
|
949
|
|
951
|
|
|||||
|
Total
|
$
|
53,582
|
|
$
|
43,755
|
|
$
|
37,425
|
|
||
Total capital expenditures for property and equipment by business segment for the years ended
December 31, 2017
,
2016
and
2015
consisted of the following (in thousands):
|
|
2017
|
2016
|
2015
|
||||||||
|
Cardiovascular
|
$
|
38,437
|
|
$
|
32,613
|
|
$
|
50,927
|
|
||
|
Endoscopy
|
186
|
|
224
|
|
32
|
|
|||||
|
Total
|
$
|
38,623
|
|
$
|
32,837
|
|
$
|
50,959
|
|
||
13. EMPLOYEE BENEFIT PLANS
We have a contributory 401(k) savings and profit sharing plan (the “Plan”) covering all U.S. full-time employees who are at least
18
years of age. The Plan has a
90
-day minimum service requirement. We may contribute, at our discretion, matching contributions based on the employees’ compensation. Contributions we made to the Plan for the years ended
December 31, 2017
,
2016
and
2015
, totaled approximately
$2.4 million
,
$2.3 million
and
$2.0 million
, respectively.
We also have defined contribution plans covering some of our foreign employees. We contribute between
2%
and
32%
of the employee’s compensation for certain foreign non-management employees, and between
2%
and
32%
of the employee’s compensation for certain foreign management employees. Contributions made to these plans for the years ended
December 31, 2017
,
2016
and
2015
, totaled approximately
$2.3 million
,
$1.1 million
and
$893,000
, respectively.
14. QUARTERLY RESULTS OF OPERATIONS (UNAUDITED)
Quarterly data for the years ended
December 31, 2017
and
2016
consisted of the following (in thousands, except per share amounts):
|
|
Quarter Ended
|
||||||||||||||
|
|
March 31
|
June 30
|
September 30
|
December 31
|
|||||||||||
|
2017
|
|
|
|
|
|
|
|
|
|||||||
|
Net sales
|
$
|
171,069
|
|
$
|
186,549
|
|
$
|
179,337
|
|
$
|
190,897
|
|
|||
|
Gross profit
|
75,942
|
|
84,141
|
|
80,514
|
|
85,656
|
|
|||||||
|
Income from operations
|
5,609
|
|
13,362
|
|
879
|
|
13,219
|
|
|||||||
|
Income tax expense
|
690
|
|
1,830
|
|
1,364
|
|
4,474
|
|
|||||||
|
Net income (loss)
|
14,803
|
|
9,483
|
|
(3,569
|
)
|
6,806
|
|
|||||||
|
Basic earnings per common share
|
0.33
|
|
0.19
|
|
(0.07
|
)
|
0.14
|
|
|||||||
|
Diluted earnings per common share
|
0.32
|
|
0.19
|
|
(0.07
|
)
|
0.13
|
|
|||||||
|
2016
|
|
|
|
|
|
|
|
|
|||||||
|
Net sales
|
$
|
138,077
|
|
$
|
151,071
|
|
$
|
156,975
|
|
$
|
157,715
|
|
|||
|
Gross profit
|
60,100
|
|
66,854
|
|
67,815
|
|
70,256
|
|
|||||||
|
Income from operations
|
7,706
|
|
11,581
|
|
2,987
|
|
12,602
|
|
|||||||
|
Income tax expense (benefit)
|
1,555
|
|
2,572
|
|
(978
|
)
|
2,116
|
|
|||||||
|
Net income
|
4,351
|
|
7,290
|
|
973
|
|
7,507
|
|
|||||||
|
Basic earnings per common share
|
0.10
|
|
0.16
|
|
0.02
|
|
0.17
|
|
|||||||
|
Diluted earnings per common share
|
0.10
|
|
0.16
|
|
0.02
|
|
0.17
|
|
|||||||
Basic and diluted earnings per share are computed independently for each of the quarters presented. Therefore, the sum of the quarterly amounts may not equal the total computed for the year.
89
15. FAIR VALUE MEASUREMENTS
Our financial assets and (liabilities) carried at fair value measured on a recurring basis as of
December 31, 2017
and
2016
, consisted of the following (in thousands):
|
|
Fair Value Measurements Using
|
|||||||||||||||
|
|
Total Fair
|
Quoted prices in
|
Significant other
|
Significant
|
||||||||||||
|
|
Value at
|
active markets
|
observable inputs
|
unobservable inputs
|
||||||||||||
|
Description
|
December 31, 2017
|
(Level 1)
|
(Level 2)
|
(Level 3)
|
||||||||||||
|
Interest rate contracts (1)
|
$
|
5,749
|
|
$
|
—
|
|
$
|
5,749
|
|
$
|
—
|
|
||||
|
Foreign currency contract assets, current and long-term (2)
|
$
|
621
|
|
$
|
—
|
|
$
|
621
|
|
$
|
—
|
|
||||
|
Foreign currency contract liabilities, current and long-term (3)
|
$
|
(1,391
|
)
|
$
|
—
|
|
$
|
(1,391
|
)
|
$
|
—
|
|
||||
|
|
Fair Value Measurements Using
|
|||||||||||||||
|
|
Total Fair
|
Quoted prices in
|
Significant other
|
Significant
|
||||||||||||
|
|
Value at
|
active markets
|
observable inputs
|
unobservable inputs
|
||||||||||||
|
Description
|
December 31, 2016
|
(Level 1)
|
(Level 2)
|
(Level 3)
|
||||||||||||
|
Interest rate contracts (1)
|
$
|
4,991
|
|
$
|
—
|
|
$
|
4,991
|
|
$
|
—
|
|
||||
|
Foreign currency contract assets, current and long-term (2)
|
$
|
354
|
|
$
|
—
|
|
$
|
354
|
|
$
|
—
|
|
||||
|
Foreign currency contract liabilities, current and long-term (3)
|
$
|
(464
|
)
|
$
|
—
|
|
$
|
(464
|
)
|
$
|
—
|
|
||||
(1) The fair value of the interest rate contracts is determined using Level 2 fair value inputs and is recorded as other assets or other long-term obligations in the consolidated balance sheets.
(2) The fair value of the foreign currency contract assets (including those designated as hedging instruments and those not designated as hedging instruments) is determined using Level 2 fair value inputs and is recorded as prepaid and other assets or other long-term assets in the consolidated balance sheets.
(3) The fair value of the foreign currency contract liabilities (including those designated as hedging instruments and those not designated as hedging instruments) is determined using Level 2 fair value inputs and is recorded as accrued expenses or other long-term obligations in the consolidated balance sheets.
Certain of our business combinations involve the potential for the payment of future contingent consideration, generally based on a percentage of future product sales or upon attaining specified future revenue milestones. See Note 2 for further information regarding these acquisitions. The contingent consideration liability is re-measured at the estimated fair value at each reporting period with the change in fair value recognized within operating expenses in the accompanying consolidated statements of income. We measure the initial liability and re-measure the liability on a recurring basis using Level 3 inputs as defined under authoritative guidance for fair value measurements. Changes in the fair value of our contingent consideration liability during the years ended
December 31, 2017
and
2016
, consisted of the following (in thousands):
|
2017
|
2016
|
||||||
|
Beginning balance
|
$
|
683
|
|
$
|
1,024
|
|
|
|
Contingent consideration liability recorded as the result of acquisitions (see Note 2)
|
10,400
|
|
—
|
|
|||
|
Fair value adjustments recorded to income during the period
|
(66
|
)
|
(123
|
)
|
|||
|
Contingent payments made
|
(61
|
)
|
(218
|
)
|
|||
|
Ending balance
|
$
|
10,956
|
|
$
|
683
|
|
|
As of
December 31, 2017
, approximately
$10.7 million
was included in other long-term obligations and approximately
$289,000
was included in accrued expenses in our consolidated balance sheet. As of
December 31, 2016
, approximately
$595,000
was included in other long-term obligations and
$88,000
was included in accrued expenses in our consolidated balance sheet. The cash paid to settle the contingent consideration liability recognized at fair value as of the acquisition date (including measurement-period adjustments) has been reflected as a cash outflow from financing activities in the accompanying consolidated statements of cash flows.
90
During the year ended December 31, 2016, we sold a cost method investment for cash and for the right to receive additional payments based on various contingent milestones. We determined the fair value of the contingent payments using Level 3 inputs defined under authoritative guidance for fair value measurements, and we recorded a contingent receivable asset, which as of
December 31, 2017
and
2016
had a value of approximately
$760,000
and
$528,000
, respectively. We record any changes in fair value to operating expenses as part of our cardiovascular segment in our consolidated statements of income. During the year ended
December 31, 2017
, we recorded a gain on the contingent receivable of approximately
$232,000
. During the year ended December 31, 2016, we recorded a loss on the contingent receivable of approximately
$184,000
. As of
December 31, 2017
, approximately
$319,000
was included in other long-term assets and approximately
$441,000
was included in other receivables as a current asset in our consolidated balance sheet. During the year ended December 31,
2016
, approximately
$367,000
was included in other long-term assets and approximately
$161,000
was included in other receivables as a current asset in our consolidated balance sheet.
The recurring Level 3 measurement of our contingent consideration liability and contingent receivable includes the following significant unobservable inputs at
December 31, 2017
and
2016
(amounts in thousands):
|
Contingent consideration asset or liability
|
Fair value at December 31, 2017
|
Valuation technique
|
Unobservable inputs
|
Range
|
||||||
|
Revenue-based payments
|
$
|
10,956
|
|
Discounted cash flow
|
Discount rate
|
9.9% - 15%
|
||||
|
contingent liability
|
Probability of milestone payment
|
100%
|
||||||||
|
Projected year of payments
|
2018-2037
|
|||||||||
|
Contingent receivable
|
$
|
760
|
|
Discounted cash flow
|
Discount rate
|
10%
|
||||
|
asset
|
Probability of milestone payment
|
75%
|
||||||||
|
Projected year of payments
|
2018-2019
|
|||||||||
|
Contingent consideration asset or liability
|
Fair value at December 31, 2016
|
Valuation technique
|
Unobservable inputs
|
Range
|
||||||
|
Revenue-based payments
|
$
|
683
|
|
Discounted cash flow
|
Discount rate
|
9.9% - 15%
|
||||
|
contingent liability
|
Probability of milestone payment
|
100%
|
||||||||
|
Projected year of payments
|
2017-2028
|
|||||||||
|
Contingent receivable
|
$
|
528
|
|
Discounted cash flow
|
Discount rate
|
10%
|
||||
|
asset
|
Probability of milestone payment
|
57%
|
||||||||
|
Projected year of payments
|
2017-2019
|
|||||||||
The contingent consideration liability and contingent receivable are re-measured to fair value each reporting period using projected revenues, discount rates, probabilities of payment, and projected payment dates. Projected contingent payment amounts are discounted back to the current period using a discounted cash flow model. Projected revenues are based on our most recent internal operational budgets and long-range strategic plans. An increase (decrease) in either the discount rate or the time to payment, in isolation, may result in a significantly lower (higher) fair value measurement. A decrease in the probability of any milestone payment may result in lower fair value measurements. Our determination of the fair value of the contingent consideration liability and contingent receivable could change in future periods based upon our ongoing evaluation of these significant unobservable inputs. We intend to record any such change in fair value to operating expenses in our consolidated statements of income.
During the years ended
December 31, 2017
,
2016
and
2015
, we had losses of approximately
$988,000
,
$101,000
, and
$141,000
, respectively, related to the measurement of non-financial assets at fair value on a nonrecurring basis subsequent to their initial recognition (see Note 4).
The carrying amount of cash and cash equivalents, receivables, and trade payables approximate fair value because of the immediate, short-term maturity of these financial instruments. The carrying amount of long-term debt approximates fair value, as determined by borrowing rates estimated to be available to us for debt with similar terms and conditions. The fair value of assets and liabilities whose carrying value approximates fair value is determined using Level 2 inputs, with the exception of cash and cash equivalents, which are Level 1 inputs.
91
16. ISSUANCE OF COMMON STOCK
On March 28, 2017, we closed a public offering of
5,175,000
shares of common stock and received proceeds of approximately
$136.6 million
, which is net of approximately
$8.8 million
in underwriting discounts and commissions and approximately
$816,000
in other direct cost incurred and paid by us in connection with this equity offering. The net proceeds from the offering were used primarily to repay outstanding indebtedness under our Second Amended Credit Agreement (including our term loan and revolving credit loans).
17. SUBSEQUENT EVENTS
We evaluate events occurring after the date of our accompanying consolidated balance sheets for potential recognition or disclosure in our financial statements. We did not identify any material subsequent events requiring adjustment to our accompanying consolidated financial statements (recognized subsequent events). We have also evaluated whether any subsequent events have occurred after the date of our accompanying consolidated balance sheets to the time of filing of this report that would require disclosure in the consolidated financial statements. We note the following event below.
On February 14, 2018, we completed the acquisition of two product lines from BD. Pursuant to the terms of the BD Agreement, we paid BD the purchase consideration of approximately
$100.1 million
in cash. The purchased assets constitute the soft tissue core needle biopsy products under the trade names of Achieve™ Programmable Automatic Biopsy System, Temno™ Biopsy System, and Tru-Cut™ Biopsy Needles previously sold by BD as well as the Aspira® Pleural Effusion Drainage Kits and the Aspira® Peritoneal Drainage System previously sold by C.R. Bard, Inc. We are currently evaluating the accounting treatment of this purchase, as well as performing the valuation of assets acquired and the related purchase price allocation.
92
Supplementary Financial Data
The supplementary financial information required by Item 302 of Regulation S-K is contained in Note 14 to our consolidated financial statements set forth above.
Item 9.
Changes in and Disagreements with Accountants on Accounting and Financial Disclosure.
None.
|
Item 9A.
|
Controls and Procedures.
|
EVALUATION OF DISCLOSURE CONTROLS AND PROCEDURES
Under the supervision and with the participation of our management, including our principal executive officer and principal financial officer, we conducted an evaluation of the design and operation of our disclosure controls and procedures, as such term is defined under Rule 13a-15(e) promulgated under the Securities Exchange Act of 1934 ("Exchange Act"), as of
December 31, 2017
. Based on this evaluation, our principal executive officer and principal financial officer concluded that as of
December 31, 2017
, our disclosure controls and procedures were effective, at a reasonable assurance level, to ensure that information we are required to disclose in the reports we file or submit under the Exchange Act is (a) recorded, processed, summarized and reported, within the time periods specified in the SEC's rules and forms and is (b) accumulated and communicated to our management, including our principal executive officer and principal financial officer, as appropriate to allow timely decisions regarding required disclosure.
MANAGEMENT'S REPORT ON INTERNAL CONTROL OVER FINANCIAL REPORTING
Our management is responsible for establishing and maintaining adequate internal control over financial reporting as defined in Rules 13a-15(f) and 15d-15(f) under the Securities Exchange Act of 1934, as amended. Our internal control over financial reporting is a process designed to provide reasonable assurance regarding the reliability of financial reporting and the preparation of financial statements for external purposes in accordance with accounting principles generally accepted in the United States of America.
Our management assessed the effectiveness of our internal control over financial reporting as of
December 31, 2017
. In making this assessment, our management used the criteria set forth by the Committee of Sponsoring Organizations of the Treadway Commission ("COSO") in
Internal Control-Integrated Framework (2013)
. However, as permitted by SEC guidance, we have excluded the critical care assets acquired from Argon and the operations of ITL from management's assessment of internal control over financial reporting as of December 31, 2017. ITL and the assets we acquired from Argon constituted approximately 1.9% of our total assets as of December 31, 2017 (excluding approximately $11.3 million of goodwill and intangible assets, which were integrated into our systems and control environment). Additionally, the operations of ITL and the assets we acquired from Argon contributed 2.6% of our 2017 net sales, and resulted in a net pre-tax loss in 2017 of approximately $304,000 (excluding approximately $599,000 of amortization of intangible assets, which was integrated into our systems and control environment).
Based on the criteria discussed above and our management’s assessment, our management concluded that, as of
December 31, 2017
, our internal control over financial reporting was effective.
CHANGES IN INTERNAL CONTROL OVER FINANCIAL REPORTING
Except as set forth below, during the quarter ended
December 31, 2017
, there were no changes in our internal control over financial reporting that materially affected, or are reasonably likely to materially affect, our internal control over financial reporting (as defined in Exchange Act Rules 13a-15(f) and 15d-15(f) under the Securities Exchange Act of 1934).
On January 31, 2017, we completed our acquisition of the critical care business of Argon, and on October 2, 2017, we completed our acquisition of ITL. We are currently integrating the policies, processes, employees, technology and operations of ITL and the critical care division of Argon. Management does not currently expect a material change to our internal controls over financial reporting as we fully integrate ITL and the critical care division of Argon into our operations.
Our independent registered public accountants have also issued an audit report on our internal control over financial reporting. Their report appears below.
93
REPORT OF INDEPENDENT REGISTERED PUBLIC ACCOUNTING FIRM
To the Board of Directors and Shareholders of Merit Medical Systems, Inc.
Opinion on Internal Control over Financial Reporting
We have audited the internal control over financial reporting of Merit Medical Systems, Inc. and subsidiaries (the “Company”) as of December 31, 2017, based on criteria established in
Internal Control-Integrated Framework (2013)
issued by the Committee of Sponsoring Organizations of the Treadway Commission (COSO). In our opinion, the Company maintained, in all material respects, effective internal control over financial reporting as of December 31, 2017, based on criteria established in
Internal Control-Integrated Frame Work (2013)
issued by COSO.
We have also audited, in accordance with the standards of the Public Company Accounting Oversight Board (United States) (PCAOB), the consolidated financial statements as of and for the year ended December 31, 2017 of the Company and our report dated March 1, 2018, expressed an unqualified opinion on those financial statements.
As described in Management’s Report on Internal Control over Financial Reporting, management excluded ITL and the critical care division of Argon from its assessment of internal control over financial reporting, which were acquired on January 31, 2017 and October 2, 2017, respectively, and whose financial statements constitute approximately 1.9% of total assets as of December 31, 2017 (excluding approximately $11.3 million of goodwill and intangible assets), 2.6% of 2017 net sales, and resulted in a net pre-tax loss in 2017 of approximately $304,000 (excluding approximately $599,000 of amortization of intangible assets) of the consolidated financial statement amounts as of and for the year ended December 31, 2017. Accordingly, our audit did not include the internal control over financial reporting at ITL and the critical care division of Argon.
Basis for Opinion
The Company’s management is responsible for maintaining effective internal control over financial reporting and for its assessment of the effectiveness of internal control over financial reporting, included in the accompanying Management’s Report on Internal Control over Financial Reporting. Our responsibility is to express an opinion on the Company’s internal control over financial reporting based on our audit. We are a public accounting firm registered with the PCAOB and are required to be independent with respect to the Company in accordance with the U.S. federal securities laws and the applicable rules and regulations of the Securities and Exchange Commission and the PCAOB.
We conducted our audit in accordance with the standards of the PCAOB. Those standards require that we plan and perform the audit to obtain reasonable assurance about whether effective internal control over financial reporting was maintained in all material respects. Our audit included obtaining an understanding of internal control over financial reporting, assessing the risk that a material weakness exists, testing and evaluating the design and operating effectiveness of internal control based on the assessed risk, and performing such other procedures as we considered necessary in the circumstances. We believe that our audit provides a reasonable basis for our opinion.
Definition and Limitations of Internal Control over Financial Reporting
A company's internal control over financial reporting is a process designed to provide reasonable assurance regarding the reliability of financial reporting and the preparation of financial statements for external purposes in accordance with generally accepted accounting principles. A company's internal control over financial reporting includes those policies and procedures that (1) pertain to the maintenance of records that, in reasonable detail, accurately and fairly reflect the transactions and dispositions of the assets of the company; (2) provide reasonable assurance that transactions are recorded as necessary to permit preparation of financial statements in accordance with generally accepted accounting principles, and that receipts and expenditures of the company are being made only in accordance with authorizations of management and directors of the company; and (3) provide reasonable assurance regarding prevention or timely detection of unauthorized acquisition, use, or disposition of the company's assets that could have a material effect on the financial statements.
Because of its inherent limitations, internal control over financial reporting may not prevent or detect misstatements. Also, projections of any evaluation of the effectiveness to future periods are subject to the risk that controls may become inadequate because of changes in conditions, or that the degree of compliance with the policies or procedures may deteriorate.
/s/ DELOITTE & TOUCHE LLP
Salt Lake City, Utah
March 1, 2018
94
|
Item 9B.
|
Other Information.
|
None.
Items 10, 11, 12, 13 and 14.
The information required by these items is incorporated by reference to our definitive proxy statement relating to our Annual Meeting of Shareholders scheduled for May 24, 2018. We anticipate that our definitive proxy statement will be filed with the SEC not later than 120 days after
December 31, 2017
, pursuant to Regulation 14A of the Securities Exchange Act of 1934, as amended.
|
Item 15.
|
Exhibits and Financial Statement Schedules.
|
(a) Documents filed as part of this Report:
(1)
Financial Statements
. The following consolidated financial statements and the notes thereto, and the Reports of Independent Registered Public Accounting Firm are incorporated by reference as provided in Item 8 and Item 9A of this report:
(2)
Financial Statement Schedule.
—
Schedule II - Valuation and qualifying accounts
Years Ended
December 31, 2017
,
2016
and
2015
(In thousands)
|
Description
|
Balance at
Beginning of Year |
Additions Charged to
Costs and Expenses (a) |
Deduction (b)
|
Balance at
End of Year |
||||||||
|
ALLOWANCE FOR UNCOLLECTIBLE ACCOUNTS:
|
|
|
|
|
||||||||
|
2015
|
(893
|
)
|
(607
|
)
|
203
|
|
(1,297
|
)
|
||||
|
2016
|
(1,297
|
)
|
(612
|
)
|
322
|
|
(1,587
|
)
|
||||
|
2017
|
(1,587
|
)
|
(1,012
|
)
|
830
|
|
(1,769
|
)
|
||||
(a) We record a bad debt provision based upon historical experience and a review of individual customer balances.
(b) When an individual customer balance becomes impaired and is deemed uncollectible, a deduction is made against the allowance for uncollectible accounts.
95
Years Ended
December 31, 2017
,
2016
and
2015
(In thousands)
|
Description
|
Balance at
Beginning of Year |
Additions Charged to
Costs and Expenses (c) |
Deduction
|
Balance at
End of Year |
||||||||
|
TAX VALUATION ALLOWANCE:
|
|
|
|
|
|
|
|
|
||||
|
2015
|
(1,603
|
)
|
(378
|
)
|
—
|
|
(1,981
|
)
|
||||
|
2016
|
(1,981
|
)
|
(1,805
|
)
|
—
|
|
(3,786
|
)
|
||||
|
2017
|
(3,786
|
)
|
(636
|
)
|
—
|
|
(4,422
|
)
|
||||
(c) We record a valuation allowance against a deferred tax asset when it is determined that it is more likely than not that the deferred tax asset will not be realized.
96
(b) Exhibits:
The following exhibits required by Item 601 of Regulation S-K are filed herewith or have been filed previously with the SEC as indicated below:
|
|
|
Description
|
|
1.1
|
|
|
|
2.1
|
||
|
2.2
|
||
|
23
|
||
|
3.1
|
||
|
3.2
|
||
|
4.1
|
|
|
|
10.1
|
|
|
|
10.2
|
|
|
|
10.3
|
|
|
|
10.4
|
|
|
|
10.5
|
|
|
|
10.6
|
|
|
|
10.7
|
|
|
|
10.8
|
|
|
|
10.9
|
||
|
10.10
|
||
|
10.11
|
||
|
10.12
|
||
|
10.13
|
||
|
10.14
|
||
97
|
10.15
|
||
|
10.16
|
||
|
10.17
|
||
|
10.18
|
||
|
10.19
|
||
|
10.20
|
||
|
10.21
|
||
|
10.22
|
||
|
10.23
|
||
|
10.24
|
||
|
10.25
|
|
|
|
10.26
|
|
|
|
10.27
|
|
|
|
10.28
|
|
|
|
10.29
|
|
|
|
10.30
|
||
|
21
|
||
|
23.1
|
||
|
31.1
|
||
|
31.2
|
||
|
32.1
|
||
|
32.2
|
||
|
101
|
The following materials from the Merit Medical Systems, Inc. Annual Report on Form 10-K for the fiscal year ended December 31, 2017, formatted in Extensible Business Reporting Language (XBRL): (i) the Consolidated Statements of Operations, (ii) Consolidated Balance Sheets, (iii) Consolidated Statements of Comprehensive Income (iv) Consolidated Statements of Stockholders' Equity, (v) Consolidated Statements of Cash Flows, and (vi) related notes.
|
|
* These exhibits are incorporated herein by reference.
† Indicates management contract or compensatory plan or arrangement.
98
(c) Schedules:
None
99
|
Item 16.
|
Form 10-K Summary.
|
None.
100
SIGNATURES
Pursuant to the requirements of Section 13 or 15(d) of the Securities Exchange Act of 1934, the Registrant has duly caused this Annual Report on Form 10-K to be signed on its behalf by the undersigned, thereunto duly authorized, on
March 1, 2018
.
|
|
MERIT MEDICAL SYSTEMS, INC.
|
||
|
|
|
||
|
|
|
||
|
|
By:
|
/s/ FRED P. LAMPROPOULOS
|
|
|
|
|
|
Fred P. Lampropoulos, President and
|
|
|
|
|
Chief Executive Officer
|
ADDITIONAL SIGNATURES
Pursuant to the requirements of the Securities Exchange Act of 1934, as amended, this Annual Report on form 10-K has been signed below by the following persons in the capacities indicated on
March 1, 2018
.
|
Signature
|
Capacity in Which Signed
|
|
|
|
|
|
|
/s/: FRED P. LAMPROPOULOS
|
President, Chief Executive Officer and Director
|
|
|
Fred P. Lampropoulos
|
(Principal executive officer)
|
|
|
|
|
|
|
/s/: BERNARD J. BIRKETT
|
Chief Financial Officer, Secretary and Treasurer
|
|
|
Bernard J. Birkett
|
(Principal financial and accounting officer)
|
|
|
|
|
|
|
/s/: A. SCOTT ANDERSON
|
Director
|
|
|
A. Scott Anderson
|
|
|
|
|
|
|
|
/s/: THOMAS J. GUNDERSON
|
Director
|
|
|
Thomas J. Gunderson
|
|
|
|
/s/: NOLAN E. KARRAS
|
Director
|
|
|
Nolan E. Karras
|
|
|
|
/s/: DAVID M. LIU
|
Director
|
|
|
David M. Liu
|
||
|
/s/: FRANKLIN J. MILLER
|
Director
|
|
|
Franklin J. Miller
|
|
|
|
/s/: F. ANN MILLNER
|
Director
|
|
|
F. Ann Millner
|
||
|
/s/: KENT W. STANGER
|
Director
|
|
|
Kent W. Stanger
|
||
|
/s/: MICHAEL E. STILLABOWER
|
Director
|
|
|
Michael E. Stillabower
|
||
101
TABLE OF CONTENTS
Part IItem 1. BusinessItem 1A. Risk FactorsItem 1B. Unresolved Staff CommentsItem 2. PropertiesItem 3. Legal ProceedingsItem 4. Mine Safety DisclosuresPart IIItem 5. Market For Registrant S Common Equity, Related Stockholder Matters and Issuer Purchases Of Equity SecuritiesItem 6. Selected Financial Data (in Thousands, Except Per Share Amounts)Item 7. Management S Discussion and Analysis Of Financial Condition and Results Of OperationsItem 7A. Quantitative and Qualitative Disclosures About Market RiskItem 8. Financial Statements and Supplementary DataItem 9. Changes in and Disagreements with Accountants on Accounting and Financial DisclosureItem 9A. Controls and ProceduresItem 9B. Other InformationPart IIIPart IVItem 15. Exhibits and Financial Statement SchedulesItem 16. Form 10-k Summary