UNITED
STATES
SECURITIES AND
EXCHANGE COMMISSION
Washington, D.C.
20549
FORM
10-Q
(Mark
One)
☒
Quarterly Report Pursuant to
Section 13 or 15(d) of the Securities Exchange Act of
1934
For the Quarterly
Period Ended March 31, 2021
☐
Transition Report Pursuant to
Section 13 or 15(d) of the Securities Exchange Act of
1934
For the
transition period from
to
Commission File
Number: 001-39070
MONOPAR
THERAPEUTICS INC.
(Exact name of
registrant as specified in its charter)
|
DELAWARE
|
|
32-0463781
|
|
(State or other
jurisdiction of
incorporation or
organization)
|
|
(I.R.S.
employer
identification
number)
|
|
1000 Skokie
Blvd., Suite 350, Wilmette, IL
|
|
60091
|
|
(Address of
principal executive offices)
|
|
(zip
code)
|
(847) 388-0349
(Registrant’s
telephone number, including area code)
Securities
registered pursuant to Section 12(b) of the Act:
|
Title of each
class
|
|
Trading
Symbol(s)
|
|
Name of each
exchange on which registered
|
|
Common Stock,
$0.001 par value
|
|
MNPR
|
|
The Nasdaq Stock
Market LLC
(Nasdaq Capital
Market)
|
Securities
registered pursuant to Section 12(g) of the Act:
None
Indicate by check mark whether the
registrant (1) has filed all reports required to be filed by
Section 13 or 15(d) of the Securities Exchange Act of 1934 during
the preceding 12 months (or for such shorter period that the
registrant was required to file such reports), and (2) has been
subject to such filing requirements for the past 90 days.
Yes ☒ No ☐
Indicate by check mark whether the
registrant has submitted electronically every Interactive Data File
required to be submitted pursuant to Rule 405 of Regulation S-T
(§ 232.405 of this chapter) during the preceding 12 months (or
for such shorter period that the registrant was required to submit
such files). Yes ☒
No ☐
Indicate by check mark whether the
registrant is a large accelerated filer, an accelerated filer, a
non-accelerated filer, a smaller reporting company, or an emerging
growth company. See the definitions of “large accelerated
filer,” “accelerated filer,” “smaller
reporting company” and “emerging growth company”
in Rule 12b-2 of the Exchange Act.
|
Large accelerated filer
|
☐
|
|
Accelerated filer
|
☐
|
|
Non-accelerated filer
|
☒
|
|
Smaller reporting
company
|
☒
|
|
|
|
|
Emerging growth company
|
☒
|
If an emerging growth company,
indicate by check mark if the registrant has elected not to use the
extended transition period for complying with any new or revised
financial accounting standards provided pursuant to Section 13(a)
of the Exchange Act. ☒
Indicate by check mark whether the
registrant is a shell company (as defined in Rule 12b-2 of the
Act). Yes ☐
No ☒
The number of shares outstanding
with respect to each of the classes of our common stock, as of
April 30, 2021, is set forth below:
|
Class
|
|
Number of shares
outstanding
|
|
|
Common Stock, par value $0.001 per
share
|
|
12,569,933
|
|
|
|
|
|
|
MONOPAR
THERAPEUTICS INC.
TABLE OF
CONTENTS
|
Part I
|
|
|
|
FINANCIAL INFORMATION
|
|
Page
|
|
|
|
|
|
|
|
|
|
|
|
Item 1.
|
|
|
3
|
|
|
|
|
|
|
|
3
|
|
|
|
|
|
|
|
4
|
|
|
|
|
|
|
|
5
|
|
|
|
|
|
|
|
7
|
|
|
|
|
|
|
|
8
|
|
|
|
|
Item 2.
|
|
|
20
|
|
|
|
|
Item 4.
|
|
|
33
|
|
|
|
|
|
|
|
|
|
|
Part II
|
|
|
|
OTHER INFORMATION
|
|
|
|
|
|
Item 1A.
|
|
|
34
|
|
|
|
|
Item 6.
|
|
|
35
|
|
|
|
|
|
|
|
|
|
|
|
|
|
|
|
|
|
|
|
|
|
|
|
36
|
|
|
|
|
|
|
|
|
|
Forward-Looking
Statements
This Quarterly Report on Form 10-Q
contains “forward-looking statements” within the
meaning of Section 27A of the Securities Act of 1933, as amended
(the “Act”) and Section 21E of the Securities Exchange
Act of 1934, as amended. All statements other than statements of
historical facts included in this Quarterly Report on Form 10-Q are
forward-looking statements. The words “hopes,”
“believes,” “anticipates,”
“plans,” “seeks,” “estimates,”
“projects,” “expects,”
“intends,” “may,” “could,”
“should,” “would,” “will,”
“continue,” and similar expressions are intended to
identify forward-looking statements. The following uncertainties
and factors, among others, could affect future performance and
cause actual results to differ materially from those matters
expressed in or implied by forward-looking statements:
●
our ability to
raise sufficient funds in the next 12 months in order for us to
complete the Phase 3 portion of our Validive Phase 2b/3 clinical
trial and if required complete a smaller second confirmatory Phase
3 clinical trial, to continue the clinical development of
camsirubicin beyond the dose escalation run-in clinical trial, to
support further development of potential radio-immuno-therapeutics
to treat severe COVID-19 (patients with SARS-CoV-2 infection), to
support further development of MNPR-101 and related compounds and
generally to support our current and any future product candidates
through completion of clinical trials, approval processes and, if
applicable, commercialization
;
●
our ability to find a suitable pharmaceutical
partner to further our development efforts, if we are unable to
raise sufficient additional financing;
●
risks and uncertainties associated with our
research and development activities, including our clinical
trials;
●
estimated timeframes for our clinical trials and
regulatory reviews for approval to market products;
●
plans to research, develop, gain approval and
commercialize our current and future product
candidates;
●
the rate of market acceptance and the
competitive clinical efficacy and safety of any products for which
we receive marketing approval;
●
the difficulties of commercialization, marketing
and product manufacturing and overall strategy;
●
uncertainties of intellectual property position
and strategy;
●
delivering strong future financial
performance;
●
our ability to attract and retain key
personnel;
●
the risks inherent in our estimates regarding
expenses, capital requirements and the availability of additional
financing;
●
the impact of government laws and regulations
including increased governmental control of
healthcare;
●
the uncertain impact of the COVID-19 pandemic on
our ability to advance our clinical programs and raise additional
financing; and
●
uncertainty of financial and operational
projections.
Although we believe that the
expectations reflected in such forward-looking statements are
appropriate, we can give no assurance that such expectations will
be realized. Cautionary statements are disclosed in this Quarterly
Report on Form 10-Q. All subsequent written and oral
forward-looking statements attributable to us or persons acting on
our behalf are expressly qualified in their entirety by the
cautionary statements. We undertake no obligation to update any
statements made in this Quarterly Report on Form 10-Q or elsewhere,
including without limitation any forward-looking statements, except
as required by law.
Any
forward-looking statements in this
Quarterly Report on Form 10-Q reflect our current views with
respect to future events or to our future financial performance and
involve known and unknown risks, uncertainties and other factors
that may cause our actual results, performance or achievements to
be materially different from any future results, performance or
achievements expressed or implied by these
forward-looking statements.
Information that is based on estimates, forecasts, projections,
market research or similar methodologies is inherently subject to
uncertainties and actual events or circumstances may differ
materially from events and circumstances reflected in this
information.
1
Risks Associated
With Our Business
Our business is
subject to numerous risks and uncertainties, including those
highlighted in “Item 1A - Risk Factors” of our Annual
Report on Form 10-K filed with the Securities and Exchange
Commission on March 25, 2021. These risks include, among others,
the following:
●
We are a clinical stage
biopharmaceutical company with a history of financial losses. We
expect to continue to incur significant losses for the foreseeable
future and may never achieve or maintain cash self-sufficiency or
profitability, which could result in a decline in the market value
of our common stock.
●
Funds raised to-date are
not sufficient to 1) complete our Validive Phase 2b/3 ("VOICE")
clinical program, including, if required, completing a smaller
second Phase 3 confirmatory clinical trial; 2) continue the
clinical development of camsirubicin beyond the dose escalation
run-in clinical trial; or 3) to support continued development of
MNPR-101 and related compounds. If we are unable to raise enough
funds in the next 12 months from the sale of our common stock or
other financing efforts, we will have to consider strategic options
such as out-licensing Validive or other product candidates,
entering into a clinical or commercial partnership, or terminating
one or more programs. There can be no assurance that we can find a
suitable partner on satisfactory terms
.
●
We have a limited operating
history, no revenues from operations, and are dependent upon
raising capital to continue our drug development
programs.
●
We do not have and may
never have any approved products on the market. Our business is
highly dependent upon receiving approvals from various U.S. and
international governmental agencies and will be severely harmed if
we are not granted approval to manufacture and sell our product
candidates.
●
Our clinical trials may not
yield sufficiently conclusive results for regulatory agencies to
approve the use of our products, which will adversely affect our
financial condition.
●
If we experience delays or
difficulties in the enrollment of subjects in clinical trials, our
receipt of necessary regulatory approvals will be delayed or
prevented, which will materially delay our program schedules and
adversely affect our financial condition.
●
We rely on third parties to
conduct our drug product manufacturing, non-clinical studies, and
our clinical trials. If these third parties do not or cannot
successfully carry out their contractual duties or meet expected
deadlines or performance goals, the initiation or conduct of our
clinical trials may be delayed and we may be unable to obtain
regulatory approval for, or commercialize, our current product
candidates or any future products, and our financial condition will
be adversely affected.
●
We face significant
competition from other biotechnology and pharmaceutical companies,
in targeted medical indications, and our operating results will
suffer if we fail to compete effectively. Competition and
technological change may make our product candidates obsolete or
non-competitive.
●
The termination of
third-party licenses will adversely affect our rights to important
compounds or technologies.
●
If we and our third-party
licensors do not obtain and preserve protection for our respective
intellectual property rights, our competitors may be able to
develop competing drugs, which will adversely affect our financial
condition.
●
If we lose key management
leadership, and/or scientific personnel, and if we cannot recruit
qualified employees or other significant personnel for future
personnel requirements, we may experience program delays and
increased compensation and operational costs, and our business will
be materially disrupted.
●
The COVID-19 pandemic could
have a substantial negative impact on our business, financial
condition, operating results, stock price and ability raise
additional funds.
2
PART
I
F
INANCIAL INFORMATION
Item 1. Financial
Statements
Monopar
Therapeutics Inc.
Condensed
Consolidated
Balance
Sheets
(Unaudited)
|
|
March 31,
2021
|
December 31,
2020*
|
|
Assets
|
|
|
|
Current
assets:
|
|
|
|
Cash and cash
equivalents
|
$
25,723,113
|
$
16,737,109
|
|
Other current
assets
|
114,569
|
62,690
|
|
Total current
assets
|
25,837,682
|
16,799,799
|
|
|
|
|
|
Other non-current
assets
|
68,858
|
68,858
|
|
Total
assets
|
$
25,906,540
|
$
16,868,657
|
|
Liabilities and Stockholders'
Equity
|
|
|
|
Current
liabilities:
|
|
|
|
Accounts payable,
accrued expenses and other current liabilities
|
$
806,272
|
$
1,176,666
|
|
Total current
liabilities and total liabilities
|
806,272
|
1,176,666
|
|
|
|
|
|
Commitments and
contingencies (Note 6)
|
|
|
|
Stockholders’
equity:
|
|
|
|
Common stock, par value
of $0.001 per share, 40,000,000 shares authorized, 12,569,933 and
11,453,465 shares issued and outstanding at March 31, 2021 and
December 31, 2020, respectively
|
12,570
|
11,453
|
|
Additional paid-in
capital
|
59,161,975
|
47,873,570
|
|
Accumulated other
comprehensive loss
|
(5,099
)
|
(7,873
)
|
|
Accumulated
deficit
|
(34,069,178
)
|
(32,185,159
)
|
|
Total stockholders'
equity
|
25,100,268
|
15,691,991
|
|
Total liabilities and
stockholders' equity
|
$
25,906,540
|
$
16,868,657
|
* Derived from the Company’s
audited consolidated financial statements.
The accompanying notes are an
integral
part of these condensed consolidated
financial statements.
3
Monopar
Therapeutics Inc.
C
ondensed Consolidated
Statements of
Operations and Comprehensive Loss
(Unaudited)
|
|
For the Three Months Ended
March 31,
|
|
|
|
2021
|
2020
|
|
Operating
expenses:
|
|
|
|
Research and
development
|
$
1,206,779
|
$
344,407
|
|
General and
administrative
|
687,936
|
791,607
|
|
Total operating
expenses
|
1,894,715
|
1,136,014
|
|
Loss from
operations
|
(1,894,715
)
|
(1,136,014
)
|
|
Other
income:
|
|
|
|
Interest
income
|
10,696
|
45,137
|
|
Net
loss
|
(1,884,019
)
|
(1,090,877
)
|
|
Other comprehensive
income (loss):
|
|
|
|
Foreign currency
translation gain (loss)
|
2,774
|
(4,041
)
|
|
Comprehensive
loss
|
$
(1,881,245
)
|
$
(1,094,918
)
|
|
Net loss per
share:
|
|
|
|
Basic and
diluted
|
$
(0.16
)
|
$
(0.10
)
|
|
Weighted average shares
outstanding:
|
|
|
|
Basic and
diluted
|
12,139,422
|
10,608,199
|
The accompanying notes are an
integral
part of these condensed consolidated
financial statements.
4
M
onopar Therapeutics Inc.
Condensed
Consolidated Statements of Stockholders’ Equity
Three Months
Ended March 31, 2020
(Unaudited)
|
|
Common Stock
|
|
|
|
|
|
|
|
Shares
|
Amount
|
Additional Paid-in Capital
|
Accumulated Other
Comprehensive Loss
|
Accumulated
Deficit
|
Total Stockholders'
Equity
|
|
Balance at January 1,
2020
|
10,587,632
|
$
10,587
|
$
38,508,825
|
$
(10,970
)
|
$
(25,880,586
)
|
$
12,627,856
|
|
Issuance of common stock under a Capital on
Demand
TM
Sales Agreement with JonesTrading Institutional Services LLC, net
in commissions and fees of $16,284
|
33,903
|
34
|
526,109
|
—
|
—
|
526,143
|
|
Issuance of common stock to non-employee
directors pursuant to vested restricted stock units
|
1,288
|
1
|
(1
)
|
—
|
—
|
—
|
|
Stock-based compensation (non-cash)
|
—
|
—
|
338,497
|
—
|
—
|
338,497
|
|
Offering costs
|
—
|
—
|
(2,161
)
|
—
|
|
(2,161
)
|
|
Net loss
|
—
|
—
|
—
|
—
|
(1,090,877
)
|
(1,090,877
)
|
|
Accumulated other comprehensive
loss
|
—
|
—
|
—
|
(4,041
)
|
—
|
(4,041
)
|
|
Balance at March 31,
2020
|
10,622,823
|
$
10,622
|
$
39,371,269
|
$
(15,011
)
|
$
(26,971,463
)
|
$
12,395,417
|
The accompanying notes are an
integral part of these condensed consolidated financial
statements.
5
Monopar
Therapeutics Inc.
Condensed
Consolidated Statements of Stockholders’ Equity
Three Months
Ended March 31, 2021
(Unaudited)
|
|
Common Stock
|
|
|
|
|
|
|
|
Shares
|
Amount
|
Additional Paid-in Capital
|
Accumulated Other
Comprehensive Loss
|
Accumulated
Deficit
|
Total Stockholders'
Equity
|
|
Balance at January 1,
2021
|
11,453,465
|
$
11,453
|
$
47,873,570
|
$
(7,873
)
|
$
(32,185,159
)
|
$
15,691,991
|
|
Issuance of common stock under a Capital on
Demand
TM
Sales Agreement with JonesTrading Institutional Services LLC, net
of commissions and fees of $338,153
|
1,104,047
|
1,104
|
10,924,208
|
—
|
—
|
10,925,312
|
|
Issuance of common stock to non-employee
directors pursuant to vested restricted stock units
|
3,004
|
3
|
(3
)
|
—
|
—
|
—
|
|
Issuance of common stock to employees pursuant
to vested restricted stock units, net of taxes
|
6,504
|
7
|
(21,507
)
|
—
|
—
|
(21,500
)
|
|
Issuance of common stock upon exercise of stock
options
|
2,913
|
3
|
17,475
|
—
|
—
|
17,478
|
|
Stock-based compensation (non-cash)
|
—
|
—
|
368,232
|
—
|
—
|
368,232
|
|
Net loss
|
—
|
—
|
—
|
—
|
(1,884,019
)
|
(1,884,019
)
|
|
Accumulated other comprehensive
income
|
—
|
—
|
—
|
2,774
|
—
|
2,774
|
|
Balance at March 31,
2021
|
12,569,933
|
$
12,570
|
$
59,161,975
|
$
(5,099
)
|
$
(34,069,178
)
|
$
25,100,268
|
The accompanying notes are an
integral part of these condensed consolidated financial
statements.
6
Monopar
Therapeutics Inc.
C
ondensed Consolidated
Statements of
Cash Flows
(Unaudited)
|
|
For the Three Months Ended
March 31,
|
|
|
|
2021
|
2020
|
|
Cash
flows from operating activities:
|
|
|
|
Net loss
|
$
(1,884,019
)
|
$
(1,090,877
)
|
|
Adjustments to reconcile
net loss to net cash used in operating activities:
|
|
|
|
Stock-based compensation
expense (non-cash)
|
368,232
|
338,497
|
|
Changes in operating assets
and liabilities, net
|
|
|
|
Other current
assets
|
(51,879
)
|
(42,084
)
|
|
Accounts payable,
accrued expenses and other current liabilities
|
(370,394
)
|
(331,106
)
|
|
Net cash used in
operating activities
|
(1,938,060
)
|
(1,125,570
)
|
|
Cash
flows from financing activities:
|
|
|
|
Cash proceeds from the
sales of common stock under a Capital on Demand
TM
Sales Agreement
with JonesTrading Institutional Services LLC, net of commissions,
fees and offering costs of $338,153 and $34,384 for the three
months ended March 31, 2021 and March 31, 2020,
respectively
|
10,925,312
|
508,044
|
|
Taxes paid related to
net share settlement of vested restricted stock units
|
(21,500
)
|
—
|
|
Cash proceeds from the
issuance of stock upon exercise of stock options
|
17,478
|
—
|
|
Net cash provided by
financing activities
|
10,921,290
|
508,044
|
|
Effect of exchange
rates
|
2,774
|
(4,041
)
|
|
Net increase (decrease)
in cash and cash equivalents
|
8,986,004
|
(621,567
)
|
|
Cash
and cash equivalents at beginning of period
|
16,737,109
|
13,213,929
|
|
Cash
and cash equivalents at end of period
|
$
25,723,113
|
$
12,592,362
|
The accompanying notes are an
integral
part of these condensed consolidated
financial statements.
7
MONOPAR
THERAPEUTICS INC.
N
OTES TO CONDENSED CONSOLIDATED FINANCIAL
STATEMENTS
March 31,
2021
Note
1 - Nature of Business and Liquidity
Nature of
Business
Monopar Therapeutics Inc.
(“Monopar” or the “Company”) is a
clinical-stage biopharmaceutical company primarily focused on
developing proprietary therapeutics designed to extend life or
improve quality of life for cancer patients. Monopar currently has
three compounds in development: 1) Validive
®
(clonidine
mucobuccal tablet; clonidine MBT), a Phase 2b/3 clinical stage,
first-in-class mucoadhesive buccal tablet for the prevention of
radiation induced severe oral mucositis (“SOM”) in
oropharyngeal cancer patients; 2) camsirubicin (generic name for
MNPR-201, GPX-150; 5-imino-13-deoxydoxorubicin), a clinical stage
topoisomerase II-alpha selective novel analog of doxorubicin
engineered specifically to retain anticancer activity while
minimizing toxic effects on the heart; and 3) a preclinical stage
uPAR targeted antibody, MNPR-101 and related compounds, for
advanced cancers and severe COVID-19.
Liquidity
The Company has incurred an
accumulated deficit of approximately $34.1 million as of March 31,
2021. To date, the Company has primarily funded its operations with
the net proceeds from the Company’s initial public offering
of its common stock on Nasdaq, sales of its common stock in the
public market under a Capital on Demand
TM
Sales Agreement,
private placements of convertible preferred stock and of common
stock and cash provided in the camsirubicin asset purchase
transaction. Management estimates that currently available cash
will provide sufficient funds to enable the Company to meet its
planned obligations at least through June 2022. The Company’s
ability to fund its future operations, including the clinical
development of Validive and camsirubicin, is dependent upon its
ability to execute its business strategy, to obtain additional
funding and/or to execute collaborative research agreements. There
can be no certainty that future financing or collaborative research
agreements will occur at a time needed to maintain operations, if
at all.
In December 2019, a novel strain of
coronavirus (“COVID-19”) surfaced in China and spread
to essentially all of the remaining world. By March 2020 COVID-19
was designated a global pandemic, resulting in government-mandated
travel restrictions and temporary shutdowns or limitations of
non-essential businesses in many states in the U.S. The Company is
able to remain open but has allowed its employees to work from
home, if required by local authorities. In response to the current
COVID-19 pandemic and its effects on clinical trials, Monopar has
modified the original adaptive design Phase 3 clinical trial for
its lead product candidate, Validive, to be a Phase 2b/3 clinical
trial (“VOICE”) to better fit the types of trials which
can enroll patients in the current environment. This modification
allowed the Company to activate the VOICE clinical trial without
requiring near-term financing. To complete the VOICE clinical
program, including, if required, completing a smaller second Phase
3 confirmatory clinical trial, Monopar will require additional
funding in the millions or tens of millions of dollars (depending
on if the Company has consummated a collaboration or partnership or
neither for Validive), which it is planning to pursue in the next
12 months. Due to many uncertainties, the Company is unable to
estimate the pandemic’s financial impact or duration at this
time, or its potential impact on the Company’s current
clinical trials including the pandemic’s effect on drug
candidate manufacturing, shipping, patient recruitment at clinical
sites and regulatory agencies around the globe.
Note 2 -
Significant Accounting Policies
Basis of
Presentation
These condensed consolidated
financial statements include the financial results of Monopar
Therapeutics Inc., its wholly-owned French subsidiary, Monopar
Therapeutics, SARL, and its wholly-owned Australian subsidiary,
Monopar Therapeutics Australia Pty Ltd and have been prepared in
accordance with accounting principles generally accepted in the
U.S. (“GAAP”) and include all disclosures required by
GAAP for financial reporting. All intercompany accounts have been
eliminated. The principal accounting policies applied in the
preparation of these condensed consolidated financial statements
are set out below and have been consistently applied in all periods
presented. The Company has been primarily involved in performing
research activities, developing product candidates, and raising
capital to support and expand these activities.
8
MONOPAR
THERAPEUTICS INC.
NOTES TO
CONDENSED CONSOLIDATED FINANCIAL STATEMENTS
March 31,
2021
The accompanying unaudited condensed
consolidated financial statements contain all normal, recurring
adjustments necessary to present fairly the Company’s
condensed consolidated financial position as of March 31, 2021, and
the Company’s condensed consolidated results of operations
and comprehensive loss and the Company’s condensed
consolidated cash flows for the three months ended March 31, 2021
and 2020.
The condensed consolidated results
of operations and comprehensive loss and condensed consolidated
cash flows for the periods presented are not necessarily indicative
of the consolidated results of operations or cash flows which may
be reported for the remainder of 2021 or for any future
period. Certain information and footnote disclosures normally
included in financial statements prepared in accordance with GAAP
have been condensed or omitted. The accompanying unaudited
interim condensed consolidated financial statements should be read
in conjunction with the audited financial statements and notes
thereto for the year ended December 31, 2020, included in the
Company’s Annual Report on Form 10-K filed with the U.S.
Securities and Exchange Commission (the “SEC”) on March
25, 2021.
Functional
Currency
The Company's consolidated
functional currency is the U.S. Dollar. The Company's Australian
subsidiary and French subsidiary use the Australian Dollar and
European Euro, respectively, as their functional currency. At each
quarter-end, each foreign subsidiary's balance sheets are
translated into U.S. Dollars based upon the quarter-end exchange
rate, while their statements of operations and comprehensive loss
and statements of cash flows are translated into U.S. Dollars based
upon an average exchange rate during the period.
Comprehensive
Loss
Comprehensive loss represents net
loss plus any gains or losses not reported in the condensed
consolidated statements of operations and comprehensive loss, such
as foreign currency translations gains and losses that are
typically reflected on the Company’s condensed consolidated
statements of stockholders’ equity.
Use of
Estimates
The preparation of financial
statements in conformity with GAAP requires management to make
estimates and assumptions that affect the reported amounts of
assets and liabilities, disclosure of contingent assets and
liabilities, and reported amounts of expenses in the condensed
consolidated financial statements and accompanying notes. Actual
results could differ from those estimates.
Going
Concern Assessment
The Company applies Accounting
Standards Codification 205-40 (“ASC 205-40”),
Disclosure of Uncertainties about
an Entity’s Ability to Continue as a Going Concern
,
which the Financial Accounting Standards Board (“FASB”)
issued to provide guidance on determining when and how reporting
companies must disclose going concern uncertainties in their
financial statements. ASC 205-40 requires management to perform
interim and annual assessments of an entity’s ability to
continue as a going concern within one year of the date of issuance
of the entity’s financial statements (or within one year
after the date on which the financial statements are available to
be issued, when applicable). Further, a company must provide
certain disclosures if there is “substantial doubt about the
entity’s ability to continue as a going concern.” In
April 2021, the Company analyzed its cash requirements through June
2022 and has determined that, based upon the Company’s
current available cash, the Company has no substantial doubt about
its ability to continue as a going concern.
9
MONOPAR
THERAPEUTICS INC.
NOTES TO
CONDENSED CONSOLIDATED FINANCIAL STATEMENTS
March 31,
2021
Cash
Equivalents
The Company considers all highly
liquid investments purchased with a maturity of 90 days or less on
the date of purchase to be cash equivalents. Cash equivalents as of
March 31, 2021 and December 31, 2020 consisted of one money market
account.
Deferred
Offering Costs
Deferred offering costs represent
legal, auditing, travel and filing fees related to fundraising
efforts that have not yet been concluded.
Prepaid
Expenses
Prepayments are expenditures for
goods or services before the goods are used or the services are
received and are charged to operations as the benefits are
realized. Prepaid expenses may include payments to development
collaborators in excess of actual expenses incurred by the
collaborator, measured at the end of each reporting period.
Prepayments also include insurance premiums, dues and subscriptions
and software costs of $10,000 or more per year that are expensed
monthly over the life of the contract, which is typically one year.
Prepaid expenses are reflected on the Company’s condensed
consolidated balance sheets as other current assets.
Concentration
of Credit Risk
Financial instruments that
potentially subject the Company to concentration of credit risk
consist of cash and cash equivalents. The Company maintains cash
and cash equivalents at two reputable financial institutions. As of
March 31, 2021, the balance at one financial institution was in
excess of the $250,000 Federal Deposit Insurance Corporation
(“FDIC”) insurable limit. The Company has not
experienced any losses on its deposits since inception and
management believes the Company is not exposed to significant risks
with respect to these financial institutions.
Fair
Value of Financial Instruments
For financial instruments consisting
of cash and cash equivalents, accounts payable, accrued expenses,
and other current liabilities, the carrying amounts are reasonable
estimates of fair value due to their relatively short
maturities.
The Company adopted ASC 820,
Fair Value Measurements and
Disclosures,
as amended, which addresses the measurement of
the fair value of financial assets and financial liabilities. Under
this standard, fair value is defined as the price that would be
received to sell an asset or paid to transfer a liability (i.e.,
the “exit price”) in an orderly transaction between
market participants at the measurement date.
The standard establishes a hierarchy
for inputs used in measuring fair value that maximizes the use of
observable inputs and minimizes the use of unobservable inputs by
requiring that the most observable inputs be used when available.
Observable inputs reflect assumptions market participants would use
in pricing an asset or liability based on market data obtained from
independent sources. Unobservable inputs reflect a reporting
entity’s pricing an asset or liability developed based on the
best information available under the circumstances. The fair value
hierarchy consists of the following three levels:
Level 1
- instrument valuations are
obtained from real-time quotes for transactions in active exchange
markets involving identical assets.
Level 2
- instrument valuations are
obtained from readily available pricing sources for comparable
instruments.
Level 3
- instrument valuations are
obtained without observable market values and require a high-level
of judgment to determine the fair value.
10
MONOPAR
THERAPEUTICS INC.
NOTES TO
CONDENSED CONSOLIDATED FINANCIAL STATEMENTS
March 31,
2021
Determining which category an asset
or liability falls within the hierarchy requires significant
judgment. The Company evaluates its hierarchy disclosures each
reporting period. There were no transfers between Level 1, 2 or 3
of the fair value hierarchy during the three months ended March 31,
2021 and 2020. The following table presents the assets and
liabilities recorded that are reported at fair value on our
condensed consolidated balance sheets on a recurring basis. No
values were recorded in Level 2 or Level 3 at March 31, 2021 and
December 31, 2020.
Assets
and Liabilities Measured at Fair Value on a Recurring
Basis
|
March 31, 2021
|
|
Level
1
|
Total
|
|
Assets
|
|
|
|
|
Cash
equivalents
(1)
|
|
$
25,430,341
|
$
25,430,341
|
|
Total
|
|
$
25,430,341
|
$
25,430,341
|
|
December 31,
2020
|
|
Level
1
|
Total
|
|
Assets
|
|
|
|
|
Cash
equivalents
(1)
|
|
$
16,605,682
|
$
16,605,682
|
|
Total
|
|
$
16,605,682
|
$
16,605,682
|
(1)
Cash equivalents represent the fair value of the
Company’s investment in a money market account.
Net Loss
per Share
Net loss per share for the three
months ended March 31, 2021 and 2020 is calculated by dividing net
loss by the weighted-average shares of common stock outstanding
during the period. Diluted net loss per share for the three months
ended March 31, 2021 and 2020 is calculated by dividing net loss by
the weighted-average shares of the sum of a) weighted average
common stock outstanding (12,139,422 and 10,608,199 shares for the
three months ended March 31, 2021 and 2020, respectively) and b)
potentially dilutive shares of common stock (such as stock options
and restricted stock units) outstanding during the period. As of
March 31, 2021 and 2020, potentially dilutive securities included
stock-based awards to purchase up to 1,600,215 and 1,337,007 shares
of the Company’s common stock, respectively. For the three
months ended March 31, 2021 and 2020, potentially dilutive
securities are excluded from the computation of fully diluted net
loss per share as their effect is anti-dilutive.
Research
and Development Expenses
Research and development
(“R&D”) costs are expensed as incurred. Major
components of R&D expenses include salaries and benefits paid
to the Company’s R&D staff, fees paid to consultants and
to the entities that conduct certain R&D activities on the
Company’s behalf and materials and supplies which are used in
R&D activities during the reporting period.
11
MONOPAR
THERAPEUTICS INC.
NOTES TO
CONDENSED CONSOLIDATED FINANCIAL STATEMENTS
March 31,
2021
Clinical
Trial Expense
The Company accrues and expenses the
costs for clinical trial activities performed by third parties
based upon estimates of the percentage of work completed over the
life of the individual study in accordance with agreements
established with contract research organizations, service
providers, and clinical trial sites. The Company determines the
estimates through discussions with internal clinical personnel and
external service providers as to progress or stage of completion of
trials or services and the agreed upon fee to be paid for such
services. Costs of setting up clinical trial sites for
participation in the trials are expensed immediately as R&D
expenses. Clinical trial site costs related to patient screening
and enrollment are accrued as patients are screened/entered into
the trial.
Collaborative
Agreements
The Company and its collaborative
partners are active participants in collaborative agreements and
all parties would be exposed to significant risks and rewards
depending on the technical and commercial success of the
activities. Contractual payments to the other parties in
collaboration agreements and costs incurred by the Company when the
Company is deemed to be the principal participant for a given
transaction are recognized on a gross basis in R&D expenses.
Royalties and license payments are recorded as earned.
During the three months ended March
31, 2021 and 2020, no milestones were met and no royalties were
earned, therefore, the Company did not pay or accrue/expense any
license or royalty payments.
Licensing
Agreements
The Company has various agreements
licensing technology utilized in the development of its product or
technology programs. The licenses contain success milestone
obligations and royalties on future sales. During the three months
ended March 31, 2021 and 2020, no milestones were met and no
royalties were earned, therefore, the Company did not pay or
accrue/expense any license or royalty payments under any of its
license agreements.
Patent
Costs
The Company expenses costs relating
to issued patents and patent applications, including costs relating
to legal, renewal and application fees, as a component of general
and administrative expenses in its condensed consolidated
statements of operations and comprehensive loss.
Income
Taxes
On December 16, 2015, the Company
began using an asset and liability approach for accounting for
deferred income taxes, which requires recognition of deferred
income tax assets and liabilities for the expected future tax
consequences of events that have been recognized in its financial
statements but have not been reflected in its taxable income.
Estimates and judgments are required in the calculation of certain
tax liabilities and in the determination of the recoverability of
certain deferred income tax assets, which arise from temporary
differences and carryforwards. Deferred income tax assets and
liabilities are measured using the currently enacted tax rates
that apply to taxable income in effect for the years in which those
tax assets and liabilities are expected to be realized or
settled.
12
MONOPAR
THERAPEUTICS INC.
NOTES TO
CONDENSED CONSOLIDATED FINANCIAL STATEMENTS
March 31,
2021
The Company regularly assesses the
likelihood that its deferred income tax assets will be realized
from recoverable income taxes or recovered from future taxable
income. To the extent that the Company believes any amounts are not
“more likely than not” to be realized, the Company
records a valuation allowance to reduce the deferred income tax
assets. In the event the Company determines that all or part of the
net deferred tax assets are not realizable in the future, an
adjustment to the valuation allowance would be charged to earnings
in the period such determination is made. Similarly, if the Company
subsequently determines deferred income tax assets that were
previously determined to be unrealizable are now realizable, the
respective valuation allowance would be reversed, resulting in an
adjustment to earnings in the period such determination is
made.
Internal Revenue Code Sections 382
and 383 (“Sections 382 and 383”) limit the use of net
operating loss (“NOL”) carryforwards and R&D
credits, after an ownership change. To date, the Company has not
conducted a Section 382 or 383 study, however, because the Company
will continue to raise significant amounts of equity in the coming
years, the Company expects that Sections 382 and 383 will limit the
Company’s usage of NOLs and R&D credits in the
future.
ASC 740,
Income Taxes
, requires that the tax
benefit of net operating losses, temporary differences, and credit
carryforwards be recorded as an asset to the extent that management
assesses that realization is "more likely than not." Realization of
the future tax benefits is dependent on the Company's ability to
generate sufficient taxable income within the carryforward period.
The Company has reviewed the positive and negative evidence
relating to the realizability of the deferred tax assets and has
concluded that the deferred tax assets are not “more likely
than not” to be realized. As a result, the Company recorded a
full valuation allowance as of March 31, 2021 and December 31,
2020. U.S. Federal R&D tax credits from 2016 to 2019 were
utilized to reduce payroll taxes in future periods and were
recorded as other current assets for amounts anticipated to be
received within 12 months and other non-current assets for amounts
anticipated to be received beyond 12 months on the Company’s
condensed consolidated balance sheets. The Company intends to
maintain the valuation allowance until sufficient evidence exists
to support its reversal. The Company regularly reviews its tax
positions. For a tax benefit to be recognized, the related tax
position must be “more likely than not” to be sustained
upon examination. Any amount recognized is generally the largest
benefit that is “more likely than not” to be realized
upon settlement. The Company’s policy is to recognize
interest and penalties related to income tax matters as an income
tax expense. For the three months ended March 31, 2021 and 2020,
the Company did not have any interest or penalties associated with
unrecognized tax benefits.
The Company is subject to U.S.
Federal, Illinois and California income taxes. In addition, the
Company is subject to local tax laws of France and Australia. Tax
regulations within each jurisdiction are subject to the
interpretation of the related tax laws and regulations and require
significant judgment to apply. The Company was incorporated on
December 16, 2015 and is subject to U.S. Federal, state and local
tax examinations by tax authorities for the tax years 2015 through
2020. The Company does not anticipate significant changes to its
current uncertain tax positions through March 31, 2021. The Company
plans on filing its U.S. Federal and state tax returns for the year
ended December 31, 2020 prior to the extended filing deadlines in
all jurisdictions.
Stock-Based
Compensation
The Company accounts for stock-based
compensation arrangements with employees, non-employee directors
and consultants using a fair value method, which requires the
recognition of compensation expense for costs related to all
stock-based awards, including stock option and restricted stock
unit (“RSU”) grants. The fair value method requires the
Company to estimate the fair value of stock-based payment awards on
the date of grant using an option pricing model or the closing
stock price on the date of grant in the case of RSUs.
13
MONOPAR
THERAPEUTICS INC.
NOTES TO
CONDENSED CONSOLIDATED FINANCIAL STATEMENTS
March 31,
2021
Stock-based compensation expense for
awards granted to employees, non-employee directors and consultants
are based on the fair value of the underlying instrument calculated
using the Black-Scholes option-pricing model on the date of grant
for stock options and using the closing stock price on the date of
grant for RSUs and recognized as expense on a straight-line basis
over the requisite service period, which is the vesting period.
Determining the appropriate fair value model and related
assumptions requires judgment, including estimating the future
stock price volatility, forfeiture rates and expected terms. The
expected volatility rates are estimated based on the actual
volatility of comparable public companies over recent historical
periods of the same length as the expected term. The Company
selected these companies based on reasonably comparable
characteristics, including market capitalization, stage of
corporate development and with historical share price information
sufficient to meet the expected term (life) of the stock-based
awards. The expected term for options granted to date is estimated
using the simplified method. Forfeitures are estimated at the time
of grant and revised, if necessary, in subsequent periods if actual
forfeitures differ from those estimates. The Company has not paid
dividends and does not anticipate paying a cash dividend in the
future vesting period and, accordingly, uses an expected dividend
yield of zero. The risk-free interest rate is based on the rate of
U.S. Treasury securities with maturities consistent with the
estimated expected term of the awards.
Note 3 - Capital
Stock
Holders of the common stock are
entitled to receive such dividends as may be declared by the Board
of Directors out of funds legally available therefor. Upon
dissolution and liquidation of the Company, holders of the common
stock are entitled to a ratable share of the net assets of the
Company remaining after payments to creditors of the Company. The
holders of shares of common stock are entitled to one vote per
share for the election of each director nominated to the Board and
one vote per share on all other matters submitted to a vote of
stockholders.
The Company’s amended and
restated certificate of incorporation authorizes the Company to
issue 40,000,000 shares of common stock with a par value of $0.001
per share.
Sales of Common Stock
On January 13, 2020, the Company
entered into a Capital on Demand™ Sales Agreement with
JonesTrading, as sales agent, pursuant to which Monopar may offer
and sell (at its discretion), from time to time, through or to
JonesTrading shares of Monopar’s common stock, having an
aggregate offering price of up to $19.7 million. Pursuant to this
agreement, during the three months ended March 31, 2020, the
Company sold 33,903 shares of its common stock at an average gross
price per share of $16.00 for net proceeds of $508,043 after fees,
commissions and offering costs of $34,384. Also pursuant to this
agreement, during the three months ended March 31, 2021, the
Company sold 1,104,047 shares of its common stock at an average
gross price per share of $10.20 for net proceeds of $10,925,311
after fees and commissions of $338,153. In aggregate pursuant to
this agreement, the Company sold 1,964,724 shares of its common
stock at an average gross price per share of $10.02 for net
proceeds of $19,100,602, after fees and commissions of
$591,188.
As of March 31, 2021, the Company
had 12,569,933 shares of common stock issued and
outstanding.
Note 4 - Stock
Incentive Plan
In April 2016, the Company’s
Board of Directors and stockholders representing a majority of the
Company’s outstanding stock at that time, approved the
Monopar Therapeutics Inc. 2016 Stock Incentive Plan, as amended
(the “Plan”), allowing the Company to grant up to an
aggregate 700,000 shares of stock-based awards in the form of stock
options, restricted stock units, stock appreciation rights and
other stock-based awards to employees, non-employee directors and
consultants. In October 2017, the Company’s Board of
Directors voted to increase the stock award pool to 1,600,000
shares of common stock, which subsequently was approved by the
Company’s stockholders. In April 2020, the Company’s
Board of Directors voted to increase the stock award pool to
3,100,000 (and increase of 1,500,000 shares of common stock), which
was approved by the Company’s stockholders in June
2020.
14
MONOPAR
THERAPEUTICS INC.
NOTES TO
CONDENSED CONSOLIDATED FINANCIAL STATEMENTS
March 31,
2021
During the three months ended March
31, 2021, the Company’s Plan Administrator Committee (with
regards to non-officer employees and consultants) and the
Company’s Compensation Committee, as ratified by the Board of
Directors (in the case of executive officers and non-employee
directors) granted to executive officers, non-officer employees,
consultants and non-employee directors aggregate stock options for
the purchase of 196,476 shares of the Company’s common stock
with exercise prices ranging from $5.76 to $9.67 which vest from
one year to four years. All stock option grants have a 10-year
term. In addition, an aggregate 124,374 restricted stock units were
granted to executive officers, non-officer employees and
non-employee directors which vest over one to four
years.
Under the Plan, the per share
exercise price for the shares to be issued upon exercise of an
option shall be determined by the Plan Administrator, except that
the per share exercise price shall be no less than 100% of the fair
market value per share on the grant date. Fair market value is the
Company’s closing price on Nasdaq. Stock options generally
expire after 10 years.
Stock option activity under the Plan
was as follows:
|
|
Options
Outstanding
|
|
|
|
Number of
Shares Subject to Options
|
Weighted-Average Exercise
Price
|
|
Balances at January 1,
2020
|
1,087,463
|
$
2.94
|
|
Granted
|
174,357
|
14.08
|
|
Forfeited
|
(3,243
)
|
8.47
|
|
Balances at December 31,
2020
|
1,258,577
|
4.47
|
|
Granted
(1)
|
196,476
|
6.93
|
|
Forfeited
(2)
|
(3,344
)
|
17.25
|
|
Exercised
|
(2,913
)
|
6.00
|
|
Balances at March 31,
2021
|
1,448,796
|
4.77
|
(1)
196,476 options vest as follows: options to
purchase 168,704 shares of the Company’s common stock vest
6/48ths on the six-month anniversary of grant date and 1/48th per
month thereafter; options to purchase 17,772 shares of the
Company’s common stock vest quarterly over one year; and
options to purchase 10,000 shares of the Company’s common
stock vest monthly over one year. Exercise prices range from $5.76
to $9.67 per share.
(2)
Forfeited
options represent unvested shares and vested, expired shares
related to employee terminations.
A summary of
options outstanding as of March 31, 2021 is shown
below:
|
Exercise
Prices
|
|
Number of Shares
Subject to Options Outstanding
|
|
Weighted-Average
Remaining Contractual Term in Years
|
|
Number of Shares
Subject to Options Fully Vested and Exercisable
|
|
Weighted-Average
Remaining Contractual Term in Years
|
|
$0.001-$5.00
|
|
557,420
|
|
5.47
|
|
555,670
|
|
5.46
|
|
$5.01-$10.00
|
|
732,519
|
|
7.98
|
|
400,390
|
|
7.28
|
|
$10.01-$15.00
|
|
146,732
|
|
8.84
|
|
74,428
|
|
8.84
|
|
$15.01-$20.00
|
|
12,125
|
|
8.09
|
|
8,583
|
|
7.81
|
|
|
|
1,448,796
|
|
|
|
1,039,071
|
|
|
15
MONOPAR
THERAPEUTICS INC.
NOTES TO
CONDENSED CONSOLIDATED FINANCIAL STATEMENTS
March 31,
2021
Restricted stock unit activity under
the Plan was as follows:
|
|
Restricted
Stock Units
|
Weighted-Average Grant Date
Fair Value per Unit
|
|
Unvested balance at January
1, 2020
|
—
|
$
—
|
|
Granted
|
45,722
|
12.93
|
|
Vested
|
(5,156
)
|
12.93
|
|
Forfeited
|
(500
)
|
12.93
|
|
Unvested balance at January
1, 2021
|
40,066
|
12.93
|
|
Granted
|
124,374
|
6.81
|
|
Vested
|
(13,021
)
|
11.52
|
|
Unvested Balance at March 31,
2021
|
151,419
|
8.02
|
During the three months ended March
31, 2021 and 2020, the Company recognized $246,343 and $220,765 of
employee and non-employee director stock-based compensation expense
as general and administrative expenses, respectively, and $111,589
and $100,171 as research and development expenses, respectively.
The stock-based compensation expense is allocated on a departmental
basis, based on the classification of the stock-based award holder.
No income tax benefits have been recognized in the condensed
consolidated statements of operations and comprehensive loss for
stock-based compensation arrangements.
The Company recognizes as an expense
the fair value of options granted to persons (currently
consultants) who are neither employees nor non-employee directors.
Stock-based compensation expense for consultants which were
recorded as research and development expense for the three months
ended March 31, 2021 and 2020 was $10,300 and $17,561,
respectively.
The fair value of options granted
from inception to March 31, 2021 was based on the Black-Scholes
option-pricing model assuming the following factors: 4.7 to 6.2
years expected term, 55% to 85% volatility, 0.4% to 2.9% risk free
interest rate and zero dividends. The expected term for options
granted to date was estimated using the simplified method. There
were 196,476 and 163,357 stock options granted during the three
months ended March 31, 2021 and 2020, respectively. For the three
months ended March 31, 2021 and 2020, the weighted-average grant
date fair value was $4.90 and $9.34 per share, respectively. For
the three months ended March 31, 2021 and 2020 the fair value of
shares vested was $0.3 million and $0.2 million, respectively. At
March 31, 2021, the aggregate intrinsic value of outstanding stock
options was approximately $3.6 million of which approximately $3.5
million was vested and approximately $0.1 million is expected to
vest (representing options to purchase 409,725 shares of the
Company’s common stock expected to vest), and the
weighted-average exercise price in aggregate was $4.77 which
includes $3.49 for fully vested stock options and $8.01 for stock
options expected to vest. At March 31, 2021, unamortized unvested
balance of stock-based compensation was $3.2 million, to be
amortized over 3.0 years.
16
MONOPAR
THERAPEUTICS INC.
NOTES TO
CONDENSED CONSOLIDATED FINANCIAL STATEMENTS
March 31,
2021
Note 5 - Related
Party Transactions
As of March 31, 2021, Tactic Pharma,
LLC (“Tactic Pharma”), the Company’s initial
investor, beneficially owned 34.0% of Monopar’s common stock
and during the three months ended March 31, 2021, there were no
transactions between Tactic Pharma and Monopar.
None of the related parties
discussed below received compensation other than market-rate
salary, market-rate stock-based compensation and benefits and
performance-based bonus or in the case of non-employee directors,
market-rate Board fees and market-rate stock-based compensation.
The Company considers the following individuals as related parties:
Three of the Company’s board members were also Managing
Members of Tactic Pharma as of March 31, 2021. Chandler D. Robinson
is the Company’s Co-Founder, Chief Executive Officer, common
stockholder, Managing Member of Tactic Pharma, former Manager of
the predecessor LLC, Manager of CDR Pharma, LLC and Board member of
Monopar as a C Corporation. Andrew P. Mazar is the Company’s
Co-Founder, Executive Vice President of Research and Development,
Chief Scientific Officer, common stockholder, Managing Member of
Tactic Pharma, former Manager of the predecessor LLC and Board
member of Monopar as a C Corporation. Michael Brown is a Managing
Member of Tactic Pharma (as of February 1, 2019 with no voting
power as it relates to Monopar), a previous managing member of
Monopar as an LLC, common stockholder and Board member of Monopar
as a C Corporation.
Note 6 –
Commitments and Contingencies
License,
Development and Collaboration Agreements
Onxeo
S.A.
In June 2016, the Company executed
an option and license agreement with Onxeo S.A.
(“Onxeo”), a public French company, which gave Monopar
the exclusive option to license (on a world-wide exclusive basis)
Validive to pursue treating severe oral mucositis in patients
undergoing chemoradiation treatment for head and neck cancers. The
pre-negotiated Onxeo license agreement for Validive as part of the
option agreement includes clinical, regulatory, developmental and
sales milestones that could reach up to $108 million if the Company
achieves all milestones, and escalating royalties on net sales from
5% to 10%. On September 8, 2017, the Company exercised the license
option, and therefore paid Onxeo the $1 million fee under the
option and license agreement.
Under the agreement, the Company is
required to pay royalties to Onxeo on a product-by-product and
country-by-country basis until the later of (1) the date when a
given product is no longer within the scope of a patent claim in
the country of sale or manufacture, (2) the expiry of any extended
exclusivity period in the relevant country (such as orphan drug
exclusivity, pediatric exclusivity, new chemical entity
exclusivity, or other exclusivity granted beyond the expiry of the
relevant patent), or (3) a specific time period after the first
commercial sale of the product in such country. In most countries,
including the U.S., the patent term is generally 20 years from the
earliest claimed filing date of a non-provisional patent
application in the applicable country, not taking into
consideration any potential patent term adjustment that may be
filed in the future or any regulatory extensions that may be
obtained. The royalty termination provision pursuant to (3)
described above is shorter than 20 years and is the least likely
cause of termination of royalty payments.
17
MONOPAR
THERAPEUTICS INC.
NOTES TO
CONDENSED CONSOLIDATED FINANCIAL STATEMENTS
March 31,
2021
The Onxeo license agreement does not
have a pre-determined term, but expires on a product-by-product and
country-by-country basis; that is, the agreement expires with
respect to a given product in a given country whenever the
Company’s royalty payment obligations with respect to such
product have expired. The agreement may also be terminated early
for cause if either the Company or Onxeo materially breach the
agreement, or if either the Company or Onxeo become insolvent. The
Company may also choose to terminate the agreement, either in its
entirety or as to a certain product and a certain country, by
providing Onxeo with advance notice.
The Company is internally developing
Validive and has activated clinical sites and began dosing for its
VOICE clinical trial, which, if successful, may allow the Company
to apply for marketing approval within the next several years. The
Company will need to raise significant funds or enter into a
collaboration partnership to support the further development,
including potential commercialization of Validive. As of March 31,
2021, the Company had not reached any of the pre-specified
milestones and has not been required to pay Onxeo any funds under
this license agreement other than the $1 million one-time license
fee.
Grupo
Español de Investigación en Sarcomas
(“GEIS”)
In
June 2019, the Company executed a clinical collaboration agreement
with GEIS for the development of camsirubicin in patients with
advanced soft tissue sarcoma (“ASTS”). Following
completion of the dose escalation run-in clinical trial in the U.S.
(or another country) that Monopar currently anticipates initiating
in the second half of 2021, the Company continues to expect that
GEIS will sponsor and lead a multi-country, randomized, open-label
Phase 2 clinical trial to evaluate camsirubicin head-to-head
against the current first-line treatment for ASTS, doxorubicin. The
Company will provide study drug and supplemental financial support
for the clinical trial averaging approximately $2 million to $3
million per year. During the three months ended March 31, 2021, the
Company incurred $0.3 million in expenses under the GEIS agreement
and other clinical-related expenses including clinical material
manufacturing and database management expenses in support of
GEIS’s Phase 2 camsirubicin clinical trial. During the three
months ended March 31, 2020, the Company provided a nominal amount
of financial support and incurred a nominal amount of drug
manufacturing costs under the GEIS agreement. The Company can
terminate the agreement by providing GEIS with advance notice, and
without affecting the Company’s rights and ownership to any
intellectual property or clinical data.
XOMA
Ltd.
The intellectual property rights
contributed by Tactic Pharma to the Company included the
non-exclusive license agreement with XOMA Ltd. for the humanization
technology used in the development of MNPR-101. Pursuant to such
license agreement, the Company is obligated to pay XOMA Ltd.
clinical, regulatory and sales milestones for MNPR-101 that could
reach up to $14.925 million if the Company achieves all milestones.
The agreement does not require the payment of sales royalties.
There can be no assurance that the Company will reach any
milestones under the XOMA agreement. As of March 31, 2021, the
Company had not reached any milestones and has not been required to
pay XOMA Ltd. any funds under this license agreement.
18
MONOPAR
THERAPEUTICS INC.
NOTES TO
CONDENSED CONSOLIDATED FINANCIAL STATEMENTS
March 31,
2021
Operating
Leases
The Company is currently leasing
office space for its executive headquarters at 1000 Skokie Blvd.,
in the Village of Wilmette, Illinois for $4,487 per month on a
month-to-month basis.
During the three months ended March
31, 2021 and 2020, the Company recognized operating lease expenses
of $13,462 and $13,483, respectively.
Legal
Contingencies
The Company may be subject to claims
and assessments from time to time in the ordinary course of
business. No claims have been asserted to date.
Indemnification
In the normal course of business,
the Company enters into contracts and agreements that contain a
variety of representations and warranties and provide for general
indemnification. The Company’s exposure under these
agreements is unknown because it involves claims that may be made
against the Company in the future, but that have not yet been made.
To date, the Company has not paid any claims nor been required to
defend any action related to its indemnification obligations.
However, the Company may record charges in the future as a result
of future claims against these indemnification
obligations.
In accordance with its second
amended and restated certificate of incorporation, amended and
restated bylaws and the indemnification agreements entered into
with each officer and non-employee director, the Company has
indemnification obligations to its officers and non-employee
directors for certain events or occurrences, subject to certain
limits, while they are serving at the Company’s request in
such capacities. There have been no claims to date.
19
I
tem 2.
Management's Discussion and
Analysis of Financial Condition and Results of
Operations.
You should read the following
discussion and analysis of our financial condition and results of
operations together with our condensed consolidated financial
statements and related notes contained in this Quarterly Report on
Form 10-Q. Some of the information contained in this discussion and
analysis or set forth elsewhere in this Quarterly Report on Form
10-Q, including information with respect to our plans and strategy
for our business and related financing activities, includes
forward-looking statements that involve risks and
uncertainties.
Overview
We are a clinical stage biopharmaceutical
company primarily focused on developing proprietary therapeutics
designed to extend life or improve quality of life for cancer
patients. We are building a drug development pipeline through the
licensing and acquisition of therapeutics in late preclinical and
clinical development stages. We leverage our scientific and
clinical experience to help reduce the risk of and accelerate the
clinical development of our drug product candidates.
Under our Capital on Demand
TM
Sales Agreement
with JonesTrading Institutional Services, LLC
(“JonesTrading”), through March 31, 2021, we have sold
1,964,724 shares of our common stock at an average gross price of
$10.02 per share for net proceeds of $19,100,602, after fees and
commissions of $591,188.
In February
2021, we announced the first patient dosed in our Phase 2b/3 VOICE
trial of Validive
®
for the
prevention of CRT-induced se
v
ere
o
ral
mucositis in pat
i
ents with
oropharyngeal
c
anc
e
r
(“VOICE”).
Given the COVID-19 pandemic and its effects on clinical trials, we
have adjusted our clinical development plans accordingly to fit
what is feasible in the current environment. We have simplified the
design of the previously planned Phase 3 clinical trial for our
lead product candidate, Validive, to a seamless, adaptive Phase
2b/3 clinical trial design (our VOICE trial) that will allow us to
minimize touch points with patients and sites. This trial design
will allow us to immediately advance to the Phase 3 portion of the
trial if supported by the interim data at the end of the Phase 2b
portion of the trial. To complete the VOICE clinical program,
including, if required, completing a smaller second Phase 3
confirmatory clinical trial, we will require additional funding in
the millions or tens of millions of dollars (depending on if we
have consummated a collaboration or partnership or neither for
Validive), which we are planning to pursue within the next 12
months.
In June 2019, we
executed a clinical collaboration agreement with Grupo Español
de Investigación en Sarcomas (“GEIS”) for the
development of camsirubicin in patients with advanced soft tissue
sarcoma (“ASTS”). Based on our current inability to
gain regulatory approval to initiate the camsirubicin Phase 2
clinical trial in Spain, we are evaluating alternatives to move the
dose escalation run-in clinical trial forward outside of Spain. We
believe that we will be able to initiate the run-in clinical trial
in the second half of 2021 in the U.S. or another country.
Following completion of the run-in clinical trial, we continue to
expect that GEIS will sponsor and lead a multi-country, randomized,
open-label Phase 2 clinical trial to evaluate camsirubicin
head-to-head against the current first-line treatment for ASTS,
doxorubicin. We believe we have funds sufficient to obtain topline
results from the dose escalation “run-in” clinical
trial. Additional funding will be required to support further
development beyond the run-in clinical trial.
Pursuant to our 50/50 collaboration development agreement with
NorthStar Medical Radioisotopes, LLC (“NorthStar”) to
develop potential Radio-Immuno-Therapeutics (“RITs”) to
treat severe COVID-19 (patients with SARS-CoV-2 infection), we have
coupled MNPR-101 to therapeutic radioisotopes supplied by
NorthStar. The resulting conjugates are designed to be highly
selective agents that have the potential to kill aberrantly
activated cytokine-producing immune cells. By eradicating these
cells with a uPAR-targeted RIT (“uPRIT”), the goal is
to spare healthy cells while quickly reducing the cytokine storm
and its harmful systemic effects. Through April 30, 2021, we have
incurred immaterial expense related to the NorthStar collaboration,
while partnering with several key companies and institutions to
further the collaboration’s development efforts. These
collaborators include: IsoTherapeutics Group, LLC, which generated
the uPRIT candidates; Aragen Bioscience Inc., which screened the
uPRIT candidates through preclinical biochemical testing; and Texas
Lung Injury Institute / University of Texas Health Science Center
at Tyler, which plans to perform preclinical testing and, if
successful, clinical testing.
In
February 2021, we announced the publication of a peer-reviewed
study in the
European Journal of
Cancer
which reported the potential utility of MNPR-101
conjugates as uPAR imaging agents to improve surgical outcomes in
bladder cancer and for surveillance post-resection. This
publication builds on previous studies using conjugates of MNPR-101
and its mouse analog, ATN-658, for the optical imaging of oral and
colon cancer.
In March
2021, we announced the publication of a peer-reviewed
study titled “
Engineered
Antibody Fragment against the Urokinase Plasminogen Activator for
Fast Delineation of Triple-Negative Breast Cancer by Positron
Emission Tomography
.” Urokinase plasminogen
activator (“uPA”) is an established biomarker in
current breast cancer clinical practice guidelines and its presence
is used to select appropriate drug treatment. This study
demonstrates the potential to identify breast cancers with uPA
overexpression and monitor uPA activity during treatment using
positron emission tomography or PET imaging along with our uPA
antibody fragment radiotracer. We have a panel of proprietary
antibodies and antibody fragments to uPA and its receptor uPAR
(such as MNPR-101).
20
Recent
Patent Updates
A series of
patents were recently issued for Validive (clonidine HCl mucobuccal
tablet). These patents, including U.S. Patent No. 10,675,271,
provide claims covering “Clonidine and/or clonidine
derivatives for use in the prevention and/or treatment of adverse
side effects of chemotherapy”. These patents expand the
potential use of Validive in cancer patients, beyond the earlier
allowed claims for the prevention of oral mucositis in patients
receiving CRT. Specifically, they provide protection for the
potential ability of Validive to prevent or treat common
chemotherapy-associated side effects such as asthenia and fatigue
and would provide protection should we determine in the future to
conduct additional Validive development activities related to
adverse side effects of chemotherapy beyond oropharyngeal
cancer.
In addition, the
U.S. Patent and Trademark Office (“USPTO”) recently
issued U.S. patent No. 10,450,340 covering compositions of matter
(2-pyrrilino camsirubicin) for a novel family of camsirubicin
analogs. This patent, which expands our camsirubicin intellectual
property portfolio, is expected to expire in 2038, not including
any patent term extensions. The patent broadens our camsirubicin
portfolio and creates a pipeline that has been designed to retain
the potentially favorable non-cardiotoxic chemical backbone of
camsirubicin and the potent broad-spectrum antitumor activity of
doxorubicin. Further, preclinical evidence suggests that this new
family of 2-pyrrilino camsirubicin analogs could be active in
doxorubicin-resistant tumor cells which may enable use in cancer
types beyond those possible with camsirubicin.
Our
Product Pipeline
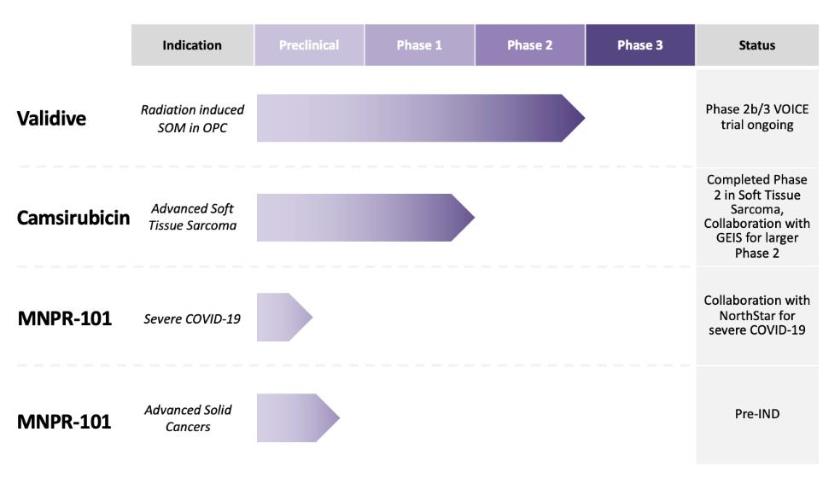
Our Product
Candidates
Validive
(clonidine mucobuccal tablet; clonidine MBT)
Validive
is a mucobuccal tablet (MBT) formulation of clonidine. The MBT
formulation was developed to enhance oral mucosal drug delivery and
provide high salivary concentrations of the active ingredient while
minimizing systemic absorption. The Validive tablet is tasteless
and self-administered once daily by affixing it to the outside of
the upper gum where it dissolves slowly over the period of several
hours, resulting in the extended release of clonidine into the oral
cavity and oropharynx, the site of severe oral mucositis
(“SOM”) following chemoradiation treatment
(“CRT”) for OPC. Validive therapy is designed to begin
on the first day of CRT and continue daily through the last day of
CRT.
SOM is the
painful and debilitating inflammation and ulceration of the mucous
membranes lining the oral cavity and oropharynx in response to
chemoradiation therapy. The majority of patients receiving CRT to
treat their OPC develop SOM, which is one of the most common and
devastating side effects of treatment in this indication. We
believe Validive has the potential to address several critical
elements that affect SOM patients, including:
21
Reduction in the incidence of SOM.
SOM
can increase the risk of acute and chronic comorbidities, including
dysphagia, trismus and lung complications, which are often
irreversible and lead to increased hospitalization and the need for
additional interventions. In a Phase 2 clinical trial, the OPC
patient cohort treated with Validive 100 µg demonstrated a
reduction in the absolute incidence of SOM compared to placebo of
26.3% (incidence rate of 65.2% in placebo, 45.0% in Validive 50
µg group, 38.9% in Validive 100 µg group). A reduced
incidence of SOM in OPC patients may lower the risk of acute and
chronic comorbidities, improve clinical outcomes and quality of
life.
Delay in the time to onset of SOM.
SOM
can cause cancer treatment delay and/or discontinuation, which may
impact overall survival outcomes. In the Phase 2 clinical trial,
OPC patients had a time to onset of SOM of 37 days in the placebo
cohort; 45-day time to onset of SOM in the Validive 50 µg
cohort; and median was not reached in the Validive 100 µg
group as fewer than half of the patients developed SOM. Prolonging
time to onset of SOM may lead to fewer missed CRT treatments,
resulting in improved overall survival outcomes.
Decrease in the duration of SOM.
Longer
duration of SOM leads to a higher risk of the need for parenteral
nutrition and lower quality of life. SOM patients experience
difficulty or inability to drink and/or eat, and difficulty in
swallowing often results in malnourishment and feeding tube
intervention. The Phase 2 clinical trial data demonstrated a
15.5-day reduction (by 37.8%) in the duration of SOM for patients
treated with Validive 100 µg (41 day median duration with
placebo, 34 days with the Validive 50 µg group, and 25.5 days
for the Validive 100 µg group) in patients that developed SOM.
Median duration across all patients, inclusive of both those that
did and did not develop SOM, was 17 days in the placebo group and 0
days in each of the Validive 50 ug and 100 µg groups. Reduced
duration of SOM may result in lower risk of malnourishment and
feeding tube intervention, and fewer treatment
terminations/delays.
In
September 2017, we exercised an option to license Validive from
Onxeo S.A., the company that had developed Validive through its
Phase 2 clinical trial. In this completed Phase 2 clinical trial,
Validive demonstrated clinically meaningful and dose-dependent
efficacy signals within the 64-patient OPC population randomized to
placebo. Additionally, patients in the Validive cohorts in the
Phase 2 clinical trial demonstrated a safety profile similar to
that of placebo. While not designed by us, Onxeo’s promising
preclinical studies and Phase 2 clinical trial have informed the
design and conduct of what we believe will be an effective Phase
2b/3 (VOICE) clinical trial.
SOM
typically arises in the immune tissue at the back of the tongue and
throat, which comprise the oropharynx, and consists of acute severe
tissue damage and pain that prevents patients from swallowing,
eating and drinking. Validive stimulates the alpha-2 adrenergic
receptor (alpha-2AR) on macrophages (white blood cells present in
the immune tissues of the oropharynx) suppressing pro-inflammatory
cytokine expression. Validive exerts its effects locally in the
oral cavity and oropharynx over a prolonged period of time through
its unique MBT formulation. Patients who develop SOM are also at
increased risk of developing late-onset toxicities, including
trismus (jaw, neck, and throat spasms), dysphagia (disruption of a
patient’s ability to eat and drink due to difficulty in
swallowing), and lung complications, which are often irreversible
and lead to increased hospitalization and the need for further
interventions sometimes years after completion of CRT. We believe
that a reduction in the incidence and duration of SOM by Validive
will have the potential to reduce treatment discontinuation and/or
treatment delays potentially leading to improved survival outcomes,
and reducing or eliminating long-term morbidities resulting from
CRT.
The OPC
target population for Validive is the most rapidly growing segment
of head and neck cancer (“HNC”) patients, estimated to
exceed 40,000 new cases annually of OPC in the U.S alone. The
growth in OPC is driven by the increasing prevalence of oral human
papilloma virus (“HPV”) infections in the U.S. and
around the world. Despite the availability of a
pediatric/adolescent HPV vaccine, the rate of OPC incidence in
adults is not anticipated to be materially reduced for decades due
to low adoption of the vaccine to date. As a result, the incidence
of HPV-driven OPC is projected to increase for many years to come
and will continue to support a clinical need for Validive for the
prevention of CRT-induced SOM in patients with OPC since CRT is the
standard of care treatment, and we do not anticipate this changing
for years to come.
A
pre-Phase 3 meeting with the FDA was held, and based on the meeting
discussion a Phase 3 clinical protocol and accompanying statistical
analysis plan (“SAP”) was submitted to the FDA for
review and comments. We have also received protocol assistance and
advice on our Phase 3 protocol and SAP from the European Medicines
Agency Committee on Human Medicinal Products (EMA/CHMP/SAWP). Based
on comments and guidance provided by FDA and EMA, and our analysis
of the current COVID-19 pandemic and its effects on clinical
trials, we have modified our original adaptive design Phase 3
clinical trial to be a seamless Phase 2b/3 (VOICE) clinical trial
to better fit the current clinical research environment. The
primary endpoint, absolute incidence of SOM, remains the same, but
the overall design of the trial has been simplified and the touch
points with the healthcare system have been minimized. We have now
initiated clinical trial sites and commenced dosing in the Phase 2b
portion of our VOICE trial. We anticipate the interim completion of
Phase 2b portion of the VOICE trial will be reached in the first
half of 2022, and the Phase 3 enrollment will be completed in the
first quarter of 2023. We will need to raise additional funding or
find a suitable pharmaceutical partner to complete the VOICE
clinical program including, if required, completion of a smaller
second Phase 3 confirmatory clinical trial. Validive has been
granted fast track designation in the U.S., orphan drug designation
in the EU, and has global intellectual property patent protection
through mid-2029 not accounting for possible
extensions.
22
Camsirubicin
(5-imino-13-deoxydoxorubicin; formerly MNPR-201,
GPX-150)
Camsirubicin is a proprietary doxorubicin analog. Doxorubicin
is widely used to treat adult and pediatric solid and blood
(hematologic) cancers, including soft tissue sarcomas, breast,
gastric, ovarian and bladder cancers, leukemias and lymphomas.
Despite clinical studies demonstrating the anti-cancer benefit of
higher cumulative doses of doxorubicin, the clinical efficacy of
doxorubicin has historically been limited by the risk of patients
developing irreversible, potentially life-threatening
cardiotoxicity at these higher cumulative doses of drug. For
example, several clinical studies completed in the 1990s
demonstrated that concurrent doxorubicin (60 mg/m
2
, 8 cycles) and
paclitaxel gave a 94% overall response rate in patients with
metastatic breast cancer but led to 18% of these patients
developing congestive heart failure. Reduction of doxorubicin to
4-6 cycles of treatment decreased the incidence of congestive heart
failure, but also reduced response rates to 45-55%. In a clinical
study looking at dose response, sarcoma patients on the high dose
(75 mg/m
2
)
doxorubicin had a response rate of 37% compared to just 18% in the
low dose (45 mg/m
2
) doxorubicin group.
With the cumulative dose restriction on doxorubicin, the median
progression free survival for ASTS patients is approximately 6
months, with median overall survival of 12-15 months. There is a
significant unmet opportunity to develop a replacement for
doxorubicin that can be dosed higher and for longer.
Camsirubicin has been engineered specifically to retain the
anticancer activity of doxorubicin while minimizing the toxic
effects on the heart. Similar to doxorubicin, the antitumor effects
of camsirubicin are mediated through the stabilization of the
topoisomerase II complex after a DNA strand break and DNA
intercalation leading to tumor cell apoptosis (cell death).
Inhibiting the topoisomerase II-alpha isoform is desired for the
anti-cancer effect, while inhibiting the topoisomerase II-beta
isoform has been demonstrated to mediate, at least in part, the
cardiotoxicity associated with doxorubicin. Camsirubicin is more
selective than doxorubicin for inhibiting topoisomerase II-alpha
versus topoisomerase II-beta. This selectivity may at least partly
explain the minimal cardiotoxicity that has been observed for
camsirubicin in preclinical and clinical studies to date. We
believe these attributes provide a strong rationale to develop
camsirubicin without restriction on cumulative dose, in a broad
spectrum of cancer types.
A Phase 2
clinical trial for camsirubicin has been completed in patients with
ASTS. In this study, 52.6% of patients evaluable for tumor
progression demonstrated clinical benefit (partial response or
stable disease), which was proportional to dose and consistently
observed at higher cumulative doses of camsirubicin (>1000
mg/m2). Camsirubicin was very well tolerated in this study and
underscored the ability to potentially administer camsirubicin
without restriction of cumulative dose in patients with ASTS.
Although doxorubicin has been the standard of care treatment for
over 40 years for patients with ASTS, doxorubicin is limited to a
lifetime cumulative dose maximum of 450 mg/m2. This means that even
if a patient is responding, they are pulled off of doxorubicin
treatment once this cumulative dose has been reached. Thus, there
is a significant unmet opportunity to develop a replacement for
doxorubicin that retains anti-cancer activity while reducing or
eliminating the risk for irreversible heart damage.
Based on
encouraging clinical results to date, we plan to continue the
development of camsirubicin as first-line treatment in patients
with ASTS, where the current first-line treatment is doxorubicin.
The aim is to administer camsirubicin without restricting
cumulative dose, thereby potentially improving efficacy beyond that
of doxorubicin by continuing to treat patients who are responding
to treatment.
In June 2019, we executed a
clinical collaboration agreement with GEIS for the development of
camsirubicin in patients with ASTS. GEIS is an internationally
renowned non-profit organization focused on the research,
development and management of clinical trials for sarcoma that has
worked with many of the leading biotech and global pharmaceutical
companies. Based on our current inability to gain regulatory
approval to initiate the camsirubicin Phase 2 clinical trial in
Spain, we are evaluating alternatives to move the dose escalation
run-in clinical trial forward outside of Spain. We believe that we
will be able to initiate the run-in clinical trial in the second
half of 2021 in the U.S. or another country. Following completion
of the run-in clinical trial, we continue to expect that GEIS will
sponsor and lead a multi-country, randomized, open-label Phase 2
clinical trial to evaluate camsirubicin head-to-head against the
current first-line treatment for ASTS, doxorubicin. We believe we
have funds sufficient to obtain topline results from the run-in
clinical trial. Additional funding will be required to support
further development beyond the run-in clinical trial. Camsirubicin
has been granted orphan drug designation for the treatment of soft
tissue sarcoma in the U.S. and the EU.
23
MNPR-101
(formerly huATN-658)
MNPR-101
is a novel, preclinical stage drug candidate. It is a
first-in-class humanized monoclonal antibody to the urokinase
plasminogen activator receptor (“uPAR”), a
well-credentialed cancer therapeutic target. uPAR is a protein
receptor that resides on the cell surface and is overexpressed in
many deadly cancers, but has little to no expression in healthy
tissue; several Phase 1 imaging studies utilizing a peptide against
uPAR in advanced cancer patients show that uPAR is detected
selectively in the tumor.
In normal
cells, uPAR is transiently expressed as part of a highly regulated
process required for the breakdown of the extracellular matrix
during normal tissue remodeling. In cancer, however, uPAR is
constitutively overexpressed by the tumor cell, and the uPAR
extracellular matrix degrading function is hijacked by the tumor to
support tissue invasion, metastasis, and angiogenesis. uPAR
expression is important to tumor cell survival, and uPAR expression
increases in high grade and metastatic disease.
MNPR-101
has demonstrated significant antitumor activity in numerous
preclinical models of tumor growth, both as a monotherapy and in
combination with other therapeutics and is being advanced toward an
IND. Based on the selective expression of uPAR in numerous tumor
types, we anticipate MNPR-101 will be well-tolerated and amenable
to a variety of combination treatment approaches in the
clinic.
uPRIT
as a Potential Therapeutic for Severe COVID-19
MNPR-101
is also being developed for the treatment of severe COVID-19 and
other respiratory diseases. We have entered into a collaboration
development agreement with NorthStar to develop potential uPRITs to
treat severe COVID-19. This collaboration combines
NorthStar’s expertise in the innovative production, supply,
and distribution of important medical radioisotopes with our
expertise in therapeutic drug development. We have coupled MNPR-101
with a therapeutic radioisotope in collaboration with NorthStar and
IsoTherapeutics Group, LLC, which have generated the MNPR-101
conjugates capable of binding radioactive isotopes. uPAR seems to
be selectively expressed on aberrantly activated immune cells. In
response to coronavirus (SARS-CoV2) infection, these rogue immune
cells produce pro-inflammatory cytokines that can cause runaway
inflammation throughout the body, commonly referred to as a
“cytokine storm.” It is this systemic
hyper-inflammatory state that is thought to be largely responsible
for the severe lung injury and further multiple organ damage that
contributes to poor outcomes and death in patients with severe
COVID-19.
In
collaboration with NorthStar, we have filed a provisional patent
application entitled “Precision Radioimmunotherapeutic
Targeting of the Urokinase Plasminogen Activator Receptor (uPAR)
for Treatment of Severe COVID-19 Disease” with the USPTO.
This application covers novel compositions and uses of cytotoxic
radioisotopes attached to antibodies that bind to uPAR, thereby
creating precision targeted radiotherapeutics, also known as
uPRITs, for the treatment of severe COVID-19 and other respiratory
diseases. Advanced COVID-19 patients frequently develop severe,
life-threatening, pulmonary inflammation as a result of a viral
induced cytokine storm. The development of this cytokine storm is
associated with a high rate of mortality in severe COVID-19
patients, even when oxygen support and mechanical ventilation are
utilized. uPRITs have been designed with the goal of selectively
eradicating the aberrantly activated immune cells responsible for
causing cytokine storm and its harmful systemic effects. The
co-inventors of the provisional patent application are James
Harvey, Chief Scientific Officer of NorthStar, and Andrew P. Mazar,
our Chief Scientific Officer. In addition to NorthStar and the
IsoTherapeutics Group, LLC, which generated the uPRIT candidates,
we have entered into collaborations with: Aragen Bioscience Inc.,
which screened the uPRIT candidates through preclinical biochemical
testing; and Texas Lung Injury Institute / University of Texas
Health Science Center at Tyler, which plans to perform preclinical
testing and, if successful, clinical testing.
MNPR-101
as a Potential Imaging Agent
Using
MNPR-101, a multimodal imaging probe was developed and tested
in vivo
in human bladder
cancer models. A publication in the
European Journal of Cancer
(Baart et
al. 2021) reported that high expression of uPAR in bladder cancer
is localized at the tumor periphery, suggesting that using a
fluorescent-conjugated MNPR-101 probe might allow surgeons to
better visualize the borders of the tumor, potentially resulting in
more complete tumor resection and thereby minimizing relapse.
Similar approaches have been utilized successfully in the resection
of other tumor types, such as breast cancer.
Bladder
cancer is often treated with transurethral resection to remove
cancerous tissue; however, recurrence can occur in up to 78% of
patients within 5 years. Up to 40% of recurrent cases develop
muscle invasive disease, which has a poor prognosis and requires
complete removal of the bladder. Many patients with muscle-invasive
bladder cancer go on to develop and succumb to metastatic
disease.
uPA and
its receptor uPAR work together to drive aggressive tumor invasion,
leading to metastasis, morbidity, and mortality in breast and other
cancers. However, uPA is difficult to measure and currently
requires a substantial amount of fresh frozen tissue. In a recent
peer-reviewed publication, our antibody fragment (ATN-291
F(ab’)2) conjugated to a copper radiotracer enabled rapid PET
visualization of tumors with uPA overexpression in a human breast
cancer model in mice. PET imaging may expand the current
application of uPA as a breast cancer biomarker and enable the
monitoring of tumor uPA expression during treatment. The
publication demonstrates, and we may further research, the
potential utility of our uPA antibody fragments as imaging agents
in models of breast cancer.
24
Our
Strategy
Our
management team has extensive experience in developing therapeutics
through regulatory approval and commercialization. In aggregate,
companies they co-founded have achieved four drug approvals in the
U.S. and the EU, successfully sold an asset developed by management
which is currently in Phase 3 clinical trials, and completed the
sale of a biopharmaceutical company for over $800 million in cash.
Understanding the preclinical, clinical, regulatory and commercial
development processes and hurdles are key factors in successful
drug development and the expertise demonstrated by our management
team across all of these areas increases the probability of success
in advancing the product candidates in our product pipeline. We
continue to add experienced management to our clinical team and
have teamed up with a serial med-tech entrepreneur to develop our
potential imaging and diagnostics capabilities. Our strategic goal
is to acquire, develop and commercialize promising oncology product
candidates that address important unmet medical needs of cancer
patients. The six key elements of our strategy to achieve this goal
are to:
●
Leverage data generated from the Phase 2
Validive clinical trial to position us effectively for a successful
VOICE clinical program for Validive for SOM in OPC.
In the
Phase 2 clinical trial the absolute incidence of SOM in OPC
patients was reduced by 26.3%, the time to onset was delayed, and
the duration of disease in patients that developed SOM was
decreased by 15.5 days in the Validive 100 µg cohort versus
placebo. In addition to the data from the Phase 2 clinical trial,
we believe the guidance from our key opinion leaders
(“KOLs”) as well as from the FDA and EMA, and our own
internal clinical trial design expertise, position us well for an
effective VOICE clinical trial program.
●
Obtain FDA approval of Validive and maximize
the commercial potential of Validive in the U.S. and the EU,
seeking partnerships outside these markets.
If the VOICE
clinical program of Validive is successful and FDA approval is
obtained, we currently intend to commercialize Validive in the U.S.
and the EU ourselves, which may include establishing our own
specialty sales force and seeking partnerships outside of these
territories for regulatory approval and drug sales and
distribution.
●
Advance the clinical development of
camsirubicin, by pursuing indications where doxorubicin has
demonstrated efficacy.
ASTS will be the first indication,
which will allow camsirubicin to go head-to-head against
doxorubicin, the current first-line treatment. In this indication,
camsirubicin previously demonstrated clinical benefit (stable
disease or partial response) in 52.6% of patients evaluable for
tumor progression in a single-arm Phase 2 study. Clinical benefit
was proportional to dose and consistently observed at higher
cumulative doses of camsirubicin (>1000 mg/m2). Camsirubicin was
very well tolerated in this Phase 2 study and underscored the
ability to potentially administer camsirubicin without restriction
as to cumulative dose (doxorubicin is limited to 450 mg/m2
cumulative dose due to heart toxicity).
●
Continue the development of MNPR-101 and
related molecules as therapeutic, diagnostic and imaging
agents.
We plan to continue the development of MNPR-101 for
diagnostic and therapeutic use in severe COVID-19 and in
cancer.
●
Expand our drug development pipeline through
advancing current assets, in-licensing, and acquisition of oncology
product candidates.
The 2-pyrrilino camsirubicin analogs
represent proprietary compositions of matter that retain the
non-cardiotoxic backbone of camsirubicin but may have features in
terms of antitumor activity and mechanism that distinguish this
family of compounds from camsirubicin. We plan to continue the
expansion of our drug development pipeline through acquiring or
in-licensing additional oncology product candidates, particularly
those that leverage existing scientific and clinical data that
helps reduce the risks of the next steps in clinical
development.
●
Utilize the expertise and prior experience of
our team in the areas of asset acquisition, drug development and
commercialization to establish ourselves as a leading
biopharmaceutical company.
Our senior executive team has
relevant experience in biopharmaceutical in-licensing and
acquisitions as well as developing product candidates through
approval and commercialization. In aggregate, our team has
co-founded BioMarin Pharmaceutical (Nasdaq: BMRN), Raptor
Pharmaceuticals ($800 million sale to Horizon Pharma), and Tactic
Pharma, LLC (“Tactic Pharma”) (sale of lead asset,
choline tetrathiomolybdate, which was ultimately acquired by
Alexion in June 2018 for $764 million; Alexion is currently in the
process of being acquired by AstraZeneca).
25
Revenues
We are an
emerging growth company. We have no approved drugs and have not
generated any revenues. To date, we have engaged in acquiring or
in-licensing pharmaceutical drug product candidates, entering into
collaboration agreements for testing and clinical development of
our drug product candidates and providing the infrastructure to
support the clinical development of our drug product candidates. We
do not anticipate commercial revenues from operations until we
complete testing and development of one of our drug product
candidates and obtain marketing approval or we sell, enter into a
collaborative marketing arrangement, or out-license one of our drug
product candidates to another party. See “Liquidity and
Capital Resources”.
Recently Issued
and Adopted Accounting Pronouncements
During the
three months ended March 31, 2021, there were no relevant recently
issued accounting pronouncements that would impact our financial
position and our condensed consolidated results of operations and
comprehensive loss.
Critical
Accounting Policies and Use of Estimates
While our
significant accounting policies are described in more detail in
Note 2 of our condensed consolidated financial statements included
elsewhere in this Quarterly Report on Form 10-Q, we believe the
following accounting policies to be critical to the judgments and
estimates used in the preparation of our condensed consolidated
financial statements.
Clinical Trials
Expense
We accrue
and expense the costs for clinical trial activities performed by
third parties based upon estimates of the percentage of work
completed over the life of the individual study in accordance with
agreements established with contract research organizations,
service providers, and clinical trial sites. We determine the
estimates through discussions with internal clinical personnel and
external service providers as to progress or stage of completion of
trials or services and the agreed upon fee to be paid for such
services. Costs of setting up clinical trial sites for
participation in the trials are expensed immediately as R&D
expenses. Clinical trial site costs related to patient screening
and enrollment are accrued as patients are screened/entered into
the trial.
Stock-Based
Compensation
We account
for stock-based compensation arrangements with employees,
non-employee directors and consultants using a fair value method,
which requires the recognition of compensation expense for costs
related to all stock-based awards, including stock option grants
and restricted stock units (“RSUs”). The fair value
method requires us to estimate the fair value of stock-based
payment awards on the date of grant using an option pricing model
or the closing stock price on the date of grant in the case of
RSUs.
Stock-based compensation costs for stock awards granted to our
employees, non-employee directors and consultants are based on the
fair value of the underlying instruments calculated using the
Black-Scholes option-pricing model on the date of grant for stock
options and using the closing stock price on the date of grant for
RSUs and recognized as expense on a straight-line basis over the
requisite service period, which is the vesting period. Determining
the appropriate fair value model and related assumptions requires
judgment, including selecting methods for estimating the
Company’s future stock price volatility, forfeiture rates and
expected term. The expected volatility rates are estimated based on
the actual volatility of comparable public companies over recent
historical periods of the same length as the expected term. We
generally selected these companies based on reasonably comparable
characteristics, including market capitalization, risk profiles,
stage of corporate development and with historical share price
information sufficient to meet the expected term of the stock-based
awards. The expected term for stock options granted during the
three months ended March 31, 2021 and 2020 was estimated using the
simplified method. Forfeitures are estimated at the time of grant
and revised, if necessary, in subsequent periods if actual
forfeitures differ from those estimates. We have not paid dividends
and do not anticipate paying a cash dividend in future vesting
periods and, accordingly, use an expected dividend yield of zero.
The risk-free interest rate is based on the rate of U.S. Treasury
securities with maturities consistent with the estimated expected
term of the awards.
26
Results of
Operations
Comparison of the Three Months Ended March 31, 2021 and
2020
The
following table summarizes the results of our operations for the
three months ended March 31, 2021 and 2020:
|
|
Three Months
Ended March 31,
|
|
|
|
|
(Unaudited)
|
|
|
|
(in thousands)
|
2021
|
2020
|
Variance
|
|
Research and
development expenses
|
$
1,207
|
$
344
|
$
863
|
|
General and
administrative expenses
|
688
|
792
|
(104
)
|
|
Total
operating expenses
|
1,895
|
1,136
|
759
|
|
Operating loss
|
(1,895
)
|
(1,136
)
|
(759
)
|
|
Interest
income
|
11
|
45
|
(34
)
|
|
Net
loss
|
$
(1,884
)
|
$
(1,091
)
|
$
(793
)
|
Research and Development Expenses
Research
and Development (“R&D”) expenses for the three
months ended March 31, 2021 were approximately $1,207,000, compared
to approximately $344,000 for the three months ended March 31,
2020. This represents an increase of approximately $863,000
primarily attributed to increases in expenses of $308,000 for the
planning of the GEIS-sponsored camsirubicin Phase 2 clinical trial
including manufacturing, $274,000 due to annual R&D personnel
salary increases, annual (non-cash) equity grants, salaries and
benefits of new R&D personnel and theappropriate partial
allocation of the CEO's salary and benefits to R&D expenses due
to significant efforts related to the start-up of clinical trial
activities, $239,000 for increases in Validive clinical trial
expense and manufacturing-related costs and $42,000 in net
increases to other R&D expenses.
General
and Administrative Expenses
General
and administrative (“G&A”) expenses for the three
months ended March 31, 2021 were approximately $688,000, compared
to approximately $792,000 for the three months ended March 31,
2020. This represents a decrease of approximately $104,000
primarily attributed to a net decrease in G&A salaries and
benefits partially due to the increased allocation of the CEO's
salary and benefits out of G&A expense to R&D expenses due
to the increased commitment of CEO time to clinical trial
activities.
27
Interest
Income
Interest
income for the three months ended March 31, 2021 decreased by
approximately $34,000 versus the three months ended March 31, 2020
due to a significant decrease in bank interest rates partially
offset by an increase in bank balances resulting from funds raised
in our Capital on Demand
TM
Sales
Agreement with JonesTrading during the three months ended March 31,
2021.
Liquidity and
Capital Resources
Sources of Liquidity
We have
incurred losses and cumulative negative cash flows from operations
since our inception in December 2014 resulting in an accumulated
deficit of approximately $34.1 million as of March 31, 2021. We
anticipate that we will continue to incur losses for the
foreseeable future. We expect that our R&D and G&A expenses
will increase to enable the execution of our strategic plan. As a
result, we anticipate that we will seek to raise additional capital
within the next 12 months to fund our future operations. We will
seek to obtain needed capital through a combination of equity
offerings, debt financings, strategic collaborations and grant
funding. To date, we have funded our operations through net
proceeds from the initial public offering of our common stock, net
proceeds from sales under our Capital on Demand
TM
Sales Agreement,
private placements of our preferred and common stock, and the net
receipt of funds related to the acquisition of camsirubicin. We
anticipate that the currently available funds as of April 30, 2021,
will fund our planned operations at least through June 30,
2022.
We invest
our cash equivalents in a money market account.
Cash Flows
The
following table provides information regarding our cash flows for
the three months ended March 31, 2021 and 2020.
|
|
Three Months
Ended March 31,
|
|
|
|
|
(Unaudited)
|
|
|
|
(in
thousands)
|
2021
|
2020
|
Variance
|
|
Net cash used in
operating activities
|
$
(1,938
)
|
$
(1,126
)
|
$
(812
)
|
|
Net cash provided by
financing activities
|
10,921
|
508
|
10,413
|
|
Effect of exchange
rates on cash and cash equivalents
|
3
|
(4
)
|
7
|
|
Net increase (decrease)
in cash and cash equivalents
|
$
8,986
|
$
(622
)
|
$
9,608
|
During the
three months ended March 31, 2021 we had net cash inflow of
approximately $8,986,000, compared to net cash outflow of $622,000
during three months ended March 31, 2020, an increase of
approximately $9,608,000.
Cash Flow Used in
Operating Activities
The
increase of approximately $812,000 in cash flow used in operating
activities during the three months ended March 31, 2021 compared to
the three months ended March 31, 2020, was primarily a result of
increased R&D cash operating expenses partially offset by a
decrease in G&A cash operating expenses.
Cash Flow Used in
Investing Activities
There was
no cash flow used in investing activities for the three months
ended March 31, 2021 and 2020.
Cash Flow
Provided by (Used in) Financing Activities
The
increase in cash flow provided by financing activities during the
three months ended March 31, 2021 compared to the three months
ended March 31, 2020 of approximately $10,413,000 was primarily due
to the increase of net proceeds from sales of our common stock
under our Capital on Demand
TM
Sales Agreement
with JonesTrading.
28
Future Funding
Requirements
To date,
we have not generated any revenue from product sales. We do not
know when, or if, we will generate any revenue from product sales.
We do not expect to generate any revenue from product sales unless
and until we obtain regulatory approval of and commercialize any of
our current or future drug product candidates or we out-license or
sell a drug product candidate to another party. At the same time,
we expect our expenses to increase in connection with our ongoing
development activities, particularly as we continue the research,
development, future preclinical studies and clinical trials of, and
seek regulatory approval for, our current and future drug product
candidates. If we obtain regulatory approval of any of our current
or future drug product candidates, we will need substantial
additional funding for commercialization requirements and our
continuing drug product development operations.
As a
company, we have not completed development through marketing
approvals of any therapeutic products. We expect to continue to
incur significant increases in expenses and increasing operating
losses for the foreseeable future. We anticipate that our expenses
will increase substantially as we:
●
advance the clinical
development and execute the regulatory strategy for
Validive;
●
advance the clinical
development and execute the regulatory strategy for
camsirubicin;
●
continue the
preclinical activities and potentially enter clinical development
of MNPR-101 (and related compounds) for severe COVID-19 and/or
other indications;
●
acquire and/or
license additional pipeline drug product candidates and pursue the
future preclinical and/or clinical development of such drug product
candidates;
●
seek regulatory
approvals for any of our current and future drug product candidates
that successfully complete registration clinical
trials;
●
establish or
purchase the services of a sales, marketing and distribution
infrastructure to commercialize any products for which we may
obtain marketing approval;
●
develop our
manufacturing/quality capabilities or establish a reliable, high
quality supply chain sufficient to support our clinical
requirements and to provide sufficient capacity to launch and grow
the sales of any product for which we obtain marketing approval;
and
●
add or contract for
required operational, financial and management information systems
and capabilities and other specialized expert personnel to support
our drug product candidate development and planned
commercialization efforts.
We
anticipate that the funds available as of April 30, 2021, will fund
our operations at least through June 2022. We have based this
estimate on assumptions that may prove to be wrong, and we could
use our available capital resources sooner than we currently
expect. Because of the numerous risks and uncertainties associated
with the development and commercialization of our drug product
candidates, and the extent to which we enter into collaborations
with third parties to participate in the development and
commercialization of our drug product candidates, we are unable to
accurately estimate with high reliability the amounts and timing
required for increased capital outlays and operating expenditures
associated with our current and anticipated drug product candidate
development programs.
29
Our future
capital requirements will depend on many factors,
including:
●
the progress of clinical development and
regulatory interactions and approvals of Validive;
●
the progress of clinical development and
regulatory interactions and approvals of camsirubicin;
●
the progress of preclinical and clinical
development of MNPR-101 (and related compounds) including
activities through our collaboration with NorthStar;
●
the number and characteristics of other drug
product candidates that we may license, acquire or otherwise
pursue;
●
the scope, progress, timing, cost and results of
research, preclinical development and clinical trials of future
drug product candidates;
●
the costs, timing and outcomes of seeking and
obtaining and maintaining FDA and international regulatory
approvals;
●
the costs associated with manufacturing/quality
requirements and establishing or contracting for sales, marketing
and distribution capabilities;
●
our ability to maintain, expand and defend the
scope of our intellectual property portfolio, including the amount
and timing of any payments we may be required to make in connection
with the licensing, filing, defense and enforcement of any patents
or other intellectual property rights;
●
our need and ability to hire or contract for
additional management, administrative, scientific, medical, sales
and marketing, and manufacturing/quality and other specialized
personnel or external expertise;
●
the effect and timing of entry of competing
products or new therapies that may limit market penetration or
prevent the introduction of our drug product candidates or reduce
the commercial potential of our product portfolio;
●
our need to implement additional required
internal systems and infrastructure; and
●
the economic and other terms, timing and success
of our existing collaboration and licensing arrangements and any
collaboration, licensing or other arrangements into which we may
enter in the future, including the timing of receipt of or payment
to or from others of any milestone or royalty payments under these
arrangements.
●
clinical research services and clinical site
fees for our VOICE clinical program, including, if required,
completing a smaller second Phase 3 confirmatory clinical
trial;
●
process development, manufacturing costs and
clinical database management of camsirubicin in connection with the
dose escalation run-in clinical trial;
●
supporting the NorthStar collaboration;
and
●
employee compensation and consulting fees to
support our product candidate programs including Validive,
camsirubicin and MNPR-101 and related compounds.
We have activated clinical trial
sites and commenced dosing in our VOICE clinical trial. In order to
complete the VOICE clinical program, including, if required,
completing a smaller second Phase 3 confirmatory clinical trial, we
will require additional funding in the millions or tens of millions
of dollars (depending on if we have consummated a collaboration or
partnership or neither for Validive), or find a suitable
pharmaceutical partner, both of which we are planning to pursue
within the next 12 months. There can be no assurance that any such
events will occur. We intend to continue evaluating drug product
candidates for the purpose of growing our pipeline. Identifying and
securing high-quality compounds usually takes time and related
expenses; however, our spending could be significantly accelerated
in 2021 and onward if additional drug product candidates are
acquired and enter clinical development. In this event, we may be
required to expand our management team, and pay higher contract
manufacturing costs, contract research organization fees, other
clinical development costs and insurance costs that are not
currently projected. The anticipated operating cost increases in
2021 and onward are expected to be primarily driven by the funding
of our VOICE clinical program, support of the camsirubicin clinical
program and development of MNPR-101 and related compounds. Beyond
our need to raise additional funding in the coming 12 months to
complete the VOICE clinical program, we will also need significant
additional funding thereafter in order to commercialize Validive if
approved for marketing, support of the camsirubicin clinical
program, to support our collaboration with NorthStar, and further
development of MNPR-101 and related compounds, and generally to
support our current and any future product candidates through
completion of trials, approval processes and, if applicable,
commercialization.
30
Until we
can generate a sufficient amount of product revenue to finance our
cash requirements, we expect to finance our future cash needs
primarily through a combination of equity offerings, debt
financings, strategic collaborations and grant funding. To the
extent that we raise additional capital through the sale of equity
or convertible debt securities, the ownership interest of our
current stockholders will be diluted, and the terms of these
securities may include liquidation or other preferences that
adversely affect our current stockholders’ rights. Debt
financing, if available, may involve agreements that include
covenants limiting or restricting our ability to take specific
actions, such as incurring additional debt, making capital
expenditures or declaring dividends. If we raise additional funds
through marketing and distribution arrangements or other
collaborations, strategic alliances or licensing arrangements with
other parties, we likely will have to relinquish valuable rights to
our technologies, future revenue streams, research programs or drug
product candidates or grant licenses on terms that may not be
favorable to us, which will reduce our future returns and affect
our future operating flexibility. If we are unable to raise
additional funds through equity or debt financings when needed, we
may be required to delay, limit, reduce or terminate our pipeline
product development or commercialization efforts or grant rights to
others to develop and market drug product candidates that we would
otherwise prefer to develop and market ourselves.
Contractual
Obligations and Commitments
License,
Development and Collaboration
Agreements
Onxeo
S.A.
In June 2016, we
executed an agreement with Onxeo S.A., a French public company,
which gave us the exclusive option to license (on a world-wide
exclusive basis) Validive (clonidine mucobuccal tablet; clonidine
MBT a mucoadhesive tablet of clonidine based on the Lauriad
mucoadhesive technology). The agreement includes clinical,
regulatory, developmental and sales milestones that could reach up
to $108 million if we achieve all milestones, and escalating
royalties from 5% to 10% on net sales. In September 2017, we
exercised the option to license Validive from Onxeo for $1 million,
but as of April 30, 2021, we have not been required to pay Onxeo
any other funds under the agreement. We anticipate the need to
raise significant funds to support the completion of clinical
development and marketing approval of Validive.
Under the
agreement, we are required to pay royalties to Onxeo on a
product-by-product and country-by-country basis until the later of
(1) the date when a given product is no longer within the scope of
a patent claim in the country of sale or manufacture, (2) the
expiry of any extended exclusivity period in the relevant country
(such as orphan drug exclusivity, pediatric exclusivity, new
chemical entity exclusivity, or other exclusivity granted beyond
the expiry of the relevant patent), or (3) a specific time period
after the first commercial sale of the product in such country. In
most countries, including the U.S., the patent term is generally 20
years from the earliest claimed filing date of a non-provisional
patent application in the applicable country, not taking into
consideration any potential patent term adjustment that may be
filed in the future or any regulatory extensions that may be
obtained. The royalty termination provision pursuant to (3)
described above is shorter than 20 years and is the least likely
cause of termination of royalty payments.
The Onxeo
license agreement does not have a pre-determined term, but expires
on a product-by-product and country-by-country basis; that is, the
agreement expires with respect to a given product in a given
country whenever our royalty payment obligations with respect to
such product have expired. The agreement may also be terminated
early for cause if either we or Onxeo materially breach the
agreement, or if either we or Onxeo become insolvent. We may also
choose to terminate the agreement, either in its entirety or as to
a certain product and a certain country, by providing Onxeo with
advance notice.
Grupo
Español de Investigación en Sarcomas
(“GEIS”)
In June 2019, we executed a clinical
collaboration with GEIS for the development of camsirubicin in
patients with advanced soft tissue sarcoma (“ASTS”).
Following completion of the dose escalation run-in clinical trial
in the U.S. (or another country) that we currently anticipate
initiating in the second half of 2021, we continue to expect that
GEIS will sponsor and lead a multi-country, randomized, open-label
Phase 2 clinical trial to evaluate camsirubicin head-to-head
against the current first-line treatment for ASTS, doxorubicin. We
will provide study drug and supplemental financial support for the
clinical trial averaging approximately $2 million to $3 million per
year. During the three months ended March 31, 2021, we incurred
$0.3 million in expenses under the GEIS agreement and other
clinical-related expenses including clinical material manufacturing
and database management expenses in support of GEIS’s Phase 2
camsirubicin clinical trial. During the three months ended March
31, 2020, we provided a nominal amount of financial support and
incurred a nominal amount of drug manufacturing costs under GEIS
agreement. We can terminate the agreement by providing GEIS with
advance notice, and without affecting the Company’s rights
and ownership to any intellectual property or clinical
data.
31
XOMA
Ltd.
Pursuant
to a non-exclusive license agreement with XOMA Ltd. for the
humanization technology used in the development of MNPR-101, we are
obligated to pay XOMA Ltd. clinical, regulatory and sales
milestones which could reach up to $14.925 million if we achieve
all milestones for MNPR-101. The agreement does not require the
payment of sales royalties. There can be no assurance that we will
achieve any milestones. As of April 30, 2021, we had not reached
any milestones and had not been required to pay XOMA Ltd. any funds
under this license agreement.
Service
Providers
In the
normal course of business, we contract with service providers to
assist in the performance of R&D, including drug product
manufacturing, process development, clinical development, and
G&A including financial strategy, audit, tax and legal support.
We can elect to discontinue the work under these agreements at any
time. We could also enter into collaborative research and
development, contract research, manufacturing and supplier
agreements in the future, which may require upfront payments and/or
long-term commitments of cash.
Office
Lease
We are
currently leasing office space in the Village of Wilmette, Illinois
for $4,487 per month on a month-to-month basis, and we anticipate
that we will lease additional space in the future as we hire
additional personnel.
Legal
Contingencies
We are
currently not, and to date have never been, a party to any adverse
material legal proceedings.
Indemnification
In the
normal course of business, we enter into contracts and agreements
that contain a variety of representations and warranties and
provide for general indemnification. Our exposure under these
agreements is unknown because it involves claims that may be made
against us in the future, but that have not yet been made. To date,
we have not paid any claims or been required to defend any action
related to our indemnification obligations. However, we may record
charges in the future as a result of these indemnification
obligations.
In
accordance with our Second Amended and Restated Certificate of
Incorporation, Amended and Restated Bylaws and the indemnification
agreements entered into with each officer and non-employee
director, we have indemnification obligations to our officers and
non-employee directors for certain events or occurrences, subject
to certain limits, while they are serving at our request in such
capacity. There have been no claims to date.
Off-Balance Sheet
Arrangements
To date,
we have not had any off-balance sheet arrangements, as defined
under the SEC rules.
32
I
tem 4. Controls and Procedures
Our Chief
Executive Officer and Chief Financial Officer have provided
certifications filed as Exhibits 31.1 and 32.1, and 31.2,
respectively. Such certifications should be read in conjunction
with the information contained in this Item 4 for a more complete
understanding of the matters covered by those
certifications.
(a) Disclosure
Controls and Procedures
We carried
out an evaluation, under the supervision and with the participation
of our management, including our Chief Executive Officer and Chief
Financial Officer, of the effectiveness of our disclosure controls
and procedures as of March 31, 2021, pursuant to Rules 13a15(e) and
15d15(e) under the Exchange Act. Based on that evaluation, our
Chief Executive Officer and Chief Financial Officer have concluded
that our disclosure controls and procedures, as of such date, were
effective.
(b) Changes in
Internal Control over Financial Reporting
We have
concluded that the condensed consolidated financial statements and
other financial information included in this Quarterly Report on
Form 10-Q fairly present in all material respects our financial
condition, results of operations and comprehensive loss and cash
flows as of, and for, the periods presented.
There have
been no changes in our internal control over financial reporting
during the three months ended March 31, 2021 that have materially
affected, or are reasonably likely to materially affect, our
internal control over financial reporting.
33
PART II. OTHER
INFORMATION
I
tem 1A. Risk Factors
There have
been no material changes in information regarding our risk factors
as described in Item 1A of our Annual Report on Form 10-K as filed
with the SEC on March 25, 2021.
34
I
tem 6. Exhibits
The following exhibits are filed as
part of this Quarterly Report on Form 10-Q.
|
Exhibit
|
|
Document
|
|
Incorporated by
Reference From:
|
|
31.1
|
|
|
Filed herewith
|
|
|
31.2
|
|
|
Filed herewith
|
|
|
32.1
|
|
|
Filed herewith
|
|
|
101.INS
|
|
XBRL Instance Document
|
|
|
|
101.SCH
|
|
XBRL Taxonomy Extension
Schema
|
|
|
|
101.CAL
|
|
XBRL Taxonomy Extension Calculation
Linkbase
|
|
|
|
101.DEF
|
|
XBRL Taxonomy Extension Definition
Linkbase
|
|
|
|
101.LAB
|
|
XBRL Taxonomy Extension Label
Linkbase
|
|
|
|
101.PRE
|
|
XBRL Taxonomy Extension Presentation
Linkbase
|
|
|
.
35
S
IGNATURES
Pursuant
to the requirements of the Securities Exchange Act of 1934, the
registrant has duly caused this report to be signed on its behalf
by the undersigned, thereunto duly authorized.
|
|
MONOPAR THERAPEUTICS
INC
|
|
|
|
|
|
|
|
|
Dated:
May 13, 2021
|
By:
|
/s/
Chandler D. Robinson
|
|
|
|
|
Name:
Chandler D. Robinson
|
|
|
|
|
Title:
Chief Executive Officer and
Director
(Principal Executive
Officer)
|
|
|
|
MONOPAR THERAPEUTICS
INC
|
|
|
|
|
|
|
|
|
Dated:
May 13, 2021
|
By:
|
/s/
Kim
R. Tsuchimoto
|
|
|
|
|
Name:
Kim
R. Tsuchimoto
|
|
|
|
|
Title:
Chief
Financial
Officer
(Principal
Financial
Officer)
|
|
TABLE OF CONTENTS
Part IItem 1. Financial StatementsNote 1 - Nature Of Business and LiquidityNote 2 - Significant Accounting PoliciesNote 3 - Capital StockNote 4 - Stock Incentive PlanNote 5 - Related Party TransactionsNote 6 Commitments and ContingenciesItem 2. Management's Discussion and Analysis Of Financial Condition and Results Of OperationsItem 4. Controls and ProceduresPart II. Other InformationItem 1A. Risk FactorsItem 6. Exhibits